Hydration forces: Observations, explanations, expectations, questions
26
BIochimlca ¢t Biorlrysica Acta, 988 (19159) 351-3'76 351 ~¢r BBAR£V 85355 Hydration forces between phospholipid bilayers R.P. Rand t and V.A. Pars~gian 2 t Department of Biological S¢ience,,r, Brock Unim~rsity, St Catha~nes, Omario (Canada) and 7 D~,qT/NIDDIC, Nc~ionoJln~tt~tea o[ Health, Bcthcada, M D (U.S.A. ) (Received 21 September 1988) Contents I. Introduction ............................................................. 352 II. Measuring hydration repulsion ................................................ 352 A. Osmotic stress (OS) medx~ ................................................ 352 B. Surface force apparatus ................................................... 354 C. Pipette aspiration ....................................................... 355 I!1. Maximum hydration and smacmral dimensions of muhilayers .......................... 3~ IV. Forces between bilaycrs ..................................................... 358 V. Hydration fn~ cncqff ...................................................... 359 Vl. Mc~rcd bilay~r adl,~o, ~.,~ .............................................. ~o Vii. Hydration of duu'ged phospholipids ............................................ 361 Vlll. Amplification of bilay~ repulsion by undulatory fluctuations .......................... 362 IX. The vapor psessure paradox .................................................. 364 X. Interaction l:~*lwecn oppositely curved bi]~ym" surfa~s: v~ucle interaction and deformatioa ..... 365 XI. Hydration in other sy~,lems ................................................... 366 XII. Theoretical questions ....................................................... 367 XIII. Hydration attraction? ....................................................... 368 XIV. Conclusions ............................................................. 369 xv. Appendix ............................................................... 37O A. M~uzm8 bilay~r d~'kness and sq~ra~oa ..................................... 3'70 Acknowkdl~ments ............................................................. 374 Refercnc~ ................................................................... 375 Abbrcviatiom: Polar gn~p~: PF., phospha~ty~hanolamine; PC, ptmsphatidylcholinc; PS, phoqphmidylmln~, DO, dilpdac~yl; MO. mono- plactosyL -Me, monomelhylatcd; -(Me) z, dimethylat~l. Hydrocarbon cAauu: DL dilau~l; DM, dismym~oyl; DP, dil~lmi~yl; ~ dis41eamyl:PO, pMmitoylolcoyl; SO, staroyloicoyl; 130, dioicoyl; DA, diln~hinoyl; DD, didod~l ~'~ linked. Pwwk-~/~" elm PC, PC extra~wl from h~m ~; ~ PEG PE produced by transpho~phatidylatinll PE onto ellsPC chains; Chol, ~ ; PC-16-22, F~mitoylmachimoylPC; DAG, diacyl#ycerol. Oak, r ab~wema~ons: SFA, surface foe~ aplparatus: O~ mmmic sm~ss; PEO, aikyipe4y(oxyethyleme). Cotrmpomdm~e; I~P. Rand, Dcpartn~,nl of Biololli~l ~ Brock Univc~ty, St. Catluurine~ Omuu'io, Canada L2S 3AI. 0304-4157/89/S03.50 @ 1989 ~ Science Publishers B.V. (Biomedical Divis~n)
Transcript of Hydration forces: Observations, explanations, expectations, questions

BIochimlca ¢t Biorlrysica Acta, 988 (19159) 351-3'76 351 ~ ¢ r
BBAR£V 85355
Hydration forces between phospholipid bilayers R.P. Rand t and V.A. Pars~gian 2
t Department of Biological S¢ience,,r, Brock Unim~rsity, St Catha~nes, Omario (Canada) and 7 D~,qT/NIDDIC, Nc~ionoJ ln~tt~tea o[ Health, Bcthcada, M D (U.S.A. )
(Received 21 September 1988)
C o n t e n t s
I. Introduction . . . . . . . . . . . . . . . . . . . . . . . . . . . . . . . . . . . . . . . . . . . . . . . . . . . . . . . . . . . . . 352
II. Measuring hydration repulsion . . . . . . . . . . . . . . . . . . . . . . . . . . . . . . . . . . . . . . . . . . . . . . . . 352 A. Osmotic stress (OS) medx~ . . . . . . . . . . . . . . . . . . . . . . . . . . . . . . . . . . . . . . . . . . . . . . . . 352 B. Surface force apparatus . . . . . . . . . . . . . . . . . . . . . . . . . . . . . . . . . . . . . . . . . . . . . . . . . . . 354 C. Pipette aspiration . . . . . . . . . . . . . . . . . . . . . . . . . . . . . . . . . . . . . . . . . . . . . . . . . . . . . . . 355
I!1. Maximum hydration and smacmral dimensions of muhilayers . . . . . . . . . . . . . . . . . . . . . . . . . . 3 ~
IV. Forces between bilaycrs . . . . . . . . . . . . . . . . . . . . . . . . . . . . . . . . . . . . . . . . . . . . . . . . . . . . . 358
V. Hydration fn~ cncqff ...................................................... 359
Vl. M c ~ r c d bilay~r ad l ,~o, ~ . , ~ . . . . . . . . . . . . . . . . . . . . . . . . . . . . . . . . . . . . . . . . . . . . . . ~ o
Vi i . Hydration of duu'ged phospholipids . . . . . . . . . . . . . . . . . . . . . . . . . . . . . . . . . . . . . . . . . . . . 361
Vlll. Amplification of bilay~ repulsion by undulatory fluctuations . . . . . . . . . . . . . . . . . . . . . . . . . . 362
IX. The vapor psessure paradox . . . . . . . . . . . . . . . . . . . . . . . . . . . . . . . . . . . . . . . . . . . . . . . . . . 364
X. Interaction l:~*lwecn oppositely curved bi]~ym" surfa~s: v~ucle interaction and deformatioa . . . . . 365
XI. Hydration in other sy~,lems . . . . . . . . . . . . . . . . . . . . . . . . . . . . . . . . . . . . . . . . . . . . . . . . . . . 366
XII. Theoretical questions . . . . . . . . . . . . . . . . . . . . . . . . . . . . . . . . . . . . . . . . . . . . . . . . . . . . . . . 367
XIII. Hydration attraction? . . . . . . . . . . . . . . . . . . . . . . . . . . . . . . . . . . . . . . . . . . . . . . . . . . . . . . . 368
XIV. Conclusions . . . . . . . . . . . . . . . . . . . . . . . . . . . . . . . . . . . . . . . . . . . . . . . . . . . . . . . . . . . . . 369
xv . Appendix . . . . . . . . . . . . . . . . . . . . . . . . . . . . . . . . . . . . . . . . . . . . . . . . . . . . . . . . . . . . . . . 37O A. M ~ u z m 8 bilay~r d~'kness and sq~ra~oa . . . . . . . . . . . . . . . . . . . . . . . . . . . . . . . . . . . . . 3'70
Acknowkdl~ments . . . . . . . . . . . . . . . . . . . . . . . . . . . . . . . . . . . . . . . . . . . . . . . . . . . . . . . . . . . . . 374
Refercnc~ . . . . . . . . . . . . . . . . . . . . . . . . . . . . . . . . . . . . . . . . . . . . . . . . . . . . . . . . . . . . . . . . . . . 375
Abbrcviatiom: Polar gn~p~: PF., phospha~ty~hanolamine; PC, ptmsphatidylcholinc; PS, phoqphmidylmln~, DO, dilpdac~yl; MO. mono- plactosyL -Me, monomelhylatcd; -(Me) z, dimethylat~l. Hydrocarbon cAauu: D L dilau~l; DM, dismym~oyl; DP, dil~lmi~yl; ~ dis41eamyl: PO, pMmitoylolcoyl; SO, staroyloicoyl; 130, dioicoyl; DA, diln~hinoyl; DD, d i d o d ~ l ~ ' ~ linked. P w w k - ~ / ~ " elm PC, PC extra~wl from h~m ~ ; ~ PEG PE produced by transpho~phatidylatinll PE onto ellsPC chains; Chol, ~ ; PC-16-22, F~mitoylmachimoylPC; DAG, diacyl#ycerol. Oak, r ab~wema~ons: SFA, surface foe~ aplparatus: O ~ mmmic sm~ss; PEO, aikyipe4y(oxyethyleme).
Cotrmpomdm~e; I~P. Rand, Dcpartn~,nl of Biololli~l ~ Brock Univc~ty, St. Catluurine~ Omuu'io, Canada L2S 3AI.
0304-4157/89/S03.50 @ 1989 ~ Science Publishers B.V. (Biomedical Divis~n)

352
I. Introduction
In retrospect, perhaps, *hydration forces' shouldn't have been surprising. After all, the defining principl~ of an amphiphile is to combine strongly polar and non- polar drives within the same molecule. The pbospho- lipids that me, t,'~ their hydrocarbon tails to create bi- layers are faced with a phalanx of polar groups that must hold onto the solvent into which they would otherwise dissolve. The tenacity of holding this water, then, is part of a natural tension in amphipilic aggre- gates, a balance between the high energy of a hydro- carbon/water interface and the energy lowering ad- sorption of solvent. But why a force that extends ten or twenty AngstrOms and prevents the aggregates from making molecular contact? Most probes of water near bilayer surfaces indicate little perturbation beyond the first hydration layer. The answer appears to be in the very size of the membrane, the fact that the displace- ment of a bilayer entails the displacement of hundreds or thousands of water molecules. Even the tiniest en- ergetic perturbation per water molecule is multiplied by hundreds or thousands to be an important energy on the scale of the bilayer membrane (Fig. 1).
So 'hydration forces', now known to dominate the interaction of most or all phospholipid membranes as they approach contact, remained unrecognized until relative!y recent times. There were clear experimental signs, the restrained drainage of water from soap films independent of the ionic strength [1], the structural disjoining forces between polar surfaces [2-5] and the thickening of phospholipid bilayers resisting contact in multilayers undergoing dehydration [6-8]. But only dur- ing the past decade or so have these forces been sys- tep-.atically characterized in terms of their exponential decay, been compared with other operative forces such as van der Waals, electrostatic double layer and steric interactions, and been examined in terms of the molecu- lar features of the bilayer surface that regulate them. Even now these interactions are just beginning to be utilized in analyses of membrane fusion and theories of phospholipid polymorphism.
This review comes at a time when phospholipid bilayer interactions are enjoying increasing attention
2::x3
Fig. 1. The hierarchy of lipid aggregation and assembly into bilayers; the short-ranga driving force of hydrocarbon aggregation to form bilaycrs covered with polar 8xoups: the assembly of bilaycrs into muhilayer arrays whose spacing reflects long-range intedamellar
forces
from many laboratories. It is a time of healthy debate and careful examination of assumptions that go into various methods of measurement, a time when a great amount of data is being collected and many new ques- tions are being posed before old questions are answered. We begin with a summary of various direct methods of force or energy measurement and then attempt to sum- marize the large body of experimental results in order then to allow comparison of material properties as well as methods of measurement. We next describe the ways in which hydration fot'ces combine with other interac- tions occurring at 10-30 lmgstrt~m separations and the ways these forces are expected to act in situations other than those in which they were measured, in phenomena such as in unilamellar vesicle interaction and bilayer phase transitions. In this way we hope to stimulate systematic work and further examination of outstanding questions relating these important forces to the micro- scopic prope~ies of phospholipid assemblies.
II. Measuring hyd~ion gepulsion
We will combine results from three complementary methods of force or energy measurement, osmotic stress, the surface force apparatus and pipette aspiration (Fi& 2).
Since each of these techniques provides direct mea- sures of some quantities and is limited by inference of extrapolation for estimating others, the best strategy is to use all three to the extent possible. Apparent con. tradictions in results do occur, however, and their reso- lution can be instructive.
I1-4. Osmotic stress (OS) method
The osmotic stress method of measuring interbilayer forces in multilamellar systems as well as between mac- romolecules in ordered assemblies has been reviewed recently in detail [12]. It is shown schematically in Fig. 2. The water in a multilayer array is brought to thermo- dynamic equilibrium with a second phase of known water activity. This equilibration can be achieved either by subjecting the multilayer to a polymer solution of osmotic pressure P whose large solutes cannot penetrate between bilayers; or the multilayer is physically squeezed under a pressure P in a chamber with a semi-permeable membrane to allow exchange with a reservoir of pure water; or the multilayer is brousht to equilibrium with a vapor of known relative humidity (P/Po) to create an effective osmotic pressure (kT/vw)ln (Po/P), where k - Boltzmann's constant, T is the absolute temperature and v,~ the partial molar volume of water. The chemical potential of the water with which the lipid is equi- librated, whether varied osmotically, by mechanical means or through the vapor phase, gives the net repul- sive .nressure P between bilavers. X-ray diffraction of

353
/•-ray diffraction .--e. d
1 1 | ~ ( Yl'J I --" -'~ water activity
,,..,) P
P vs interbilayer distance
11" dw
SF& method
--4" F S p ~ 3
adhesion energy and
bilayer compressibility
ni,,anllt amnlmlln n ~Nlhed
Fig. 2. Three ways of meaLsunng forces between bilayen. Osmotic stress (OS) gives the ckh~lnnlion or ¢k~lvalion free energy of ther- modymm~ally we, B.dt.fmed plmepimfpid phas~ equilibrated with water at different activities; the sU~t~z] comcq~zzc~ of solvent removal are usually monitored by X-ray diffraction [9-12 l. The sutt~ fog~ appatatt~ (SFA) h deggned to measme attractive and gpulgve intergtiom between chined cylinders of m~ coated with lipid bil|~,5 and i ~ in different solutions [13.14]. Pipette L~pigatim (PA) ~ ¢merlks of tdhe~ve contact between large unilamdlar bi~yer vesk.ks in solutkm, as wdl as bilayer strt, nSth or
comptl~bility under latenl d e f m t i o a [lS-18 I.
that equilibrated phase gives the repeat distance d of the lipid pins water layers, often to better than ~mgstri~m accuracy. The method is not limited to lamellar phases and has been applied recently also to inverted hexago- nal phases, for example, see Ref. 19. The mnount of water per lipid molecule, dV,, removed under pressure P, yields the work of dehydration, p/tv,, which is a change in the chemical free energy of the iipids. This work is independent of any model of hydration and of any assumptions about the structure of the phospho- lipid phase. Given the many ways of applying osmoUc stress, it is possible to bring structures to virtually complete dehydration at pressures corresponding to over 1000 atmosphere, or logt0P> 9 when pressures are measured in dynes/cm 2. Attractive forces cannot be measured directly, but are inferred from the point of balance between repulsive and attractive forces.
The assignment of a measured work of dehydration to a force or energy of interaction between bilayers or to a work of rearranging the bilayers requires dissection
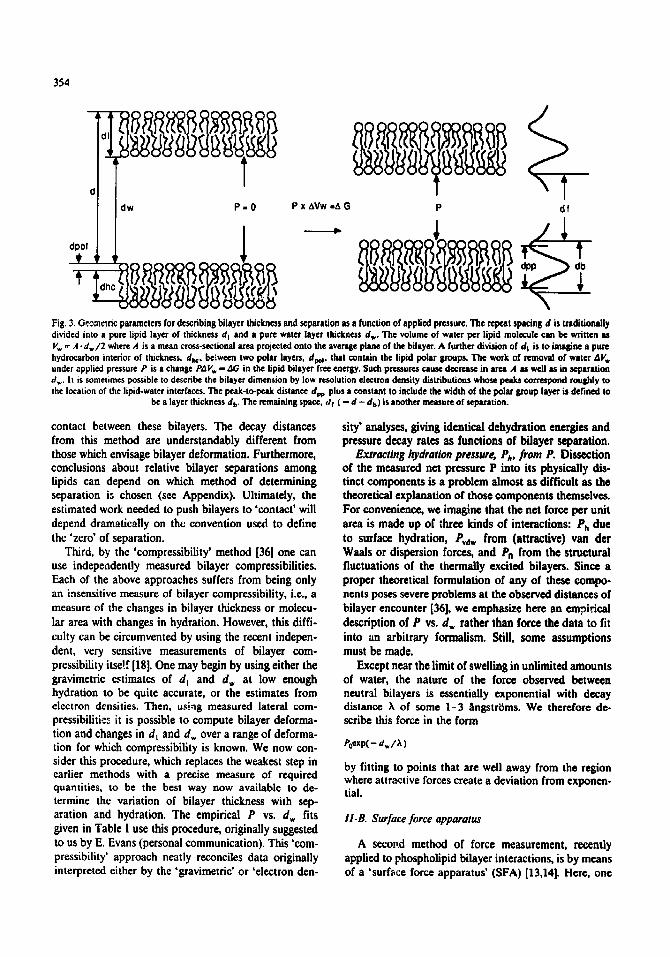
of the measured repeat distance d into a bilayer thick- ness d, and separation d . . I t also requires recognit ion of the pressure P as both a lateral and an inter-bilayer stress [11].
if bilayers were incompressible, then changes in re- peat spacing d would equal changes in bilayer sep- aration d , . A force vs. distance relation could auto- matically be constructed from measured pressure P vs. repeat spacin 8 d reduced by a constant bilayer thick- ness d,. But bilayers are laterally compressible [15,20-23]. The same isotropic osmotic stress that pushes bilayers together also acts to defor~ them laterally |1],24]. There is a predicted decrease in cross-sectional area A and bilayer thickness dj. Consequently, esti- mates of these structural changes are requL.'~ in order to estimate bilayer separation d,, (Fig. 3).
In the Appendix we describe more fully three ways of gauging the bilayer thickness but they are sum- marized as follows.
First. the 8ravimetric traditional procedure of Luz- zati divides the repeat spacing d into a lipid layer thickness d t that contains all the fipid and none of the water plus a water layer d,, that contains only water [6]. This division requires a knowledge of specific volumes of the lipid molecules and their parts and of the inter- vening water. A compendium of these is given in the Appendix. The procedure is to measure repeat spacing d as a function of the known lipid/water ratios in gravimetrically prepared samples. As long as the repeat spacing d is monotonically increasing with the volume of water V,, per lipid molecule, one can convert the d spacing obtained under osmotic stress into a bilayer separation d,, for that d spacing in the gravimetrically prepared sample. The procedure works well except near limiting, or saturating, amounts of water where dight changes in d with added water make an accurate de- termination of water content difficult. While this ap- proach provides clear evidence of bilayer deformation, it circumvents the difficult issue of interracial structure.
Second, the 'electron density' profile determined from low-resolution X-ray diffraction analysis can be used as an estimate of bilayer thickness. A comparative study [25] showed differenccs between thicknes,u:s measured this way and by the gravimetric method. Similar dif- ferences have been found by others [26]. In an analysis of 15 /ingstrikn resolution electron density maps as a function of mnmtic stress, Mclntosh and Simon [27] have concluded that that there is essentially negligible bilayer deformation. However, low resolution requires assumptions about the structure of the interface and that the bilayer thickness should be taken as the dis- tance between two electron density maxima correspond- ing to the center of the polar groups plus a 5 |mgstr~cn width on each side of the bilayer to include the (hy- drated) headgroup. Their estimates of hydration eneq~ rcfer then to dehydration to the point of outermost
354
P x AVw =A G p d f
Fig. 3, Geometric parameters for describing bilayer thickne~ and separation as a function of applied pressure. The repeat spacing d is traditionally divided into a pure lipid layer of thickn~,s d I and a pure water layer thiclm~s d.,. The volume of water per fipid molecule cam be written as V. ~ A .dw/2 where A is a mean cro~s-sectional area projected onto the average plane of the bilayer. A further division of d t is to imagine a pure hydrocarbon interior of tl~ckness, d,~. between two polar layers, d,,e,, that contain the lipid polar grottps. The work of removal of water At',. under applied pressure P is a change PAV. - AG in the fipid bilayer free energy. Su¢h pre~ures cause decrease in area A as well as in separation d w. It is sometimes possible to dec~:ribe the bilayer dimension by low resolution electron density distribuliotns whose peaks correspond rmlghly to the location of the lipid-warer interfaces. The peak-to-gw.ak distance d o plus a constant to include the width of the polar group layer is defined to
be a layer thickness db. The remaining space, df ( - d - d b ) i$ another ~ u f c of separation.
contact between these bilayers. The decay distances from this method are understandably different from those which envisage bilayer deformation. Furthermore, conclusions about relative brayer separations among lipids can depend on which method of determining separation i: chosen (see Appendix). Ultimately, the estimated work needed to push bilayers to 'contact' will depend dramatically on the convention used to define the 'zero' of separation.
Third, by the 'compressibility' method [36] one can use independently measured bilayer compressibilities. Each of the above approaches suffers from being only an insensitive measure of bilayer compressibility, i.e., a measure of the changes in bilayer thickness or molecu- lar area with changes in hydration. However, this diffi- culty can be circumvented by using the recent indepen- dent, very sensitive measurements of bilayer com- pressibility itse!f [18]. One may begin by using either the gravimetric ~timates of d~ and d , at low enough hydration to be quite accurate, or the estimates from electron densities. Then, using measured lateral com- pressibilitie~ it is possible to compute bilayer deforma- tion and changes in dt and d , over a range of deforma- tion for which compressibility is known. We now con- sider this procedure, which replaces the weakest step in earlier methods with a precise measure of required quantities, to be the best way now available to de- termine the variation of bilayer thickness with sep- aration and hydration. The empirical P vs. d . fits given in Table I use this procedure, originally suggested to us by E. Evans (personal communication). This 'com- pressibility' approach neatly reconciles data originally interpreted either by the "gravimetric' or 'electron den-
sity' analyses, giving identical dehydration energies and pressure decay rates as functions of bilayer separation.
Extracting hydration pressure P,, from P. Dissection of the measured net pressure P into its physically dis- tinct components is a problem almost as difficult as the theoretical explanation of those components themselves. For convenience, we imagine that the net force per unit area is made up of three kinds of interactions: Ph due to surface hydration, Pvd. from (attractive) van der Waals or dispersion forces, and Pn from the structural fluctuations of the thermally excited bilayers. Since a proper theoretical formulation of any of these compo- nents poses severe problems at the observed distances of bilayer encounter [36], we emphasize here an empi.rical description of P vs. d . rather than force the data to fit into an arbitrary formalism. Still, some assumptions must be made.
Except near the limit of swelling in unlimited amounts of water, the nature of the force observed between neutral bilayers is essentially exponential with decay distance ~ of some 1-3 ~ngstrt~ms. We therefore de- scribe this force in the form
Poexp(- d. / ~ )
by fitting to points that are well away from the region where attractive forces create a deviation from exponen- tial.
II-R Surface force apparatus
A secoi~.d method of force measurement, recently applied to phospholipid bilayer interactions, is by means of a 'surfece force apparatus' (SFA) [13,14]. Here, one

force bogwlon force between crossed cylindrloal ~ SOhere ar~ plan~, F$;). surfaces, Fc
m u l t l l | v | t e
psfallel curved surface _-.~_parallel plane (PO) Int~a~ons Infera~oqs
~ Elm - Fsi~2~Pt
I the position of zero force / enemy minimum
suffices
Fill. 4. Forces betwt~n cresol cylinden, compaged to ~ between parsifal ~ , f ~ of fig same material. By the l)erjaSuin appfoxima-
the force b¢Itwcca gtmaed gylindg~ ~ is equivalent to that between s sphere and p/she F,t; it cmgespomh to the enel~ Esw betwom pmralld surfaces when their ~ l i o ~ d. is much less than tl~ r ~ m of cunmure R. The relation betweea tbpm is £ ~ - F~,/2¢R. The scpmafion at the point of force b ~ (og minimum q ) bctwam long-rang0 *ttl'&¢tiOl~ ~ shorter ~ gepulsion will Mwsys ~ at ulsalks- sepamtiot~ for opp~tdy curved smfiggs than fc~ pmdkl surfape~ ~ , the equititmum ~p~zation
between oppmitely curved surfaces is independent of their
coats lipids, either by adsorptio,, from suspension [28] or by passage through monolayers [291 onto mica sheets glued down onto cylindrical surfaces. One measures the distance between the crossed cylinders by means of interference fringes that are set up between the silvered backs of the mica sheets. Forces between the surfaces of the crossed cylinders are read from the deflection of a cantilever spring system of variable tension that can be moved to bring the surfaces to a given separation. Repulsive forces are seen as a continuous deflection away from contact and ate limited only by the onset of deformation of the mica surface. Attractive forces ate seen either from the position of a jump into 'contact" as surfaces ate brought together with springs of different thickness, or from the position of a jump away from a spontaneously assumed minimum energy position. Rela- tive changes in position can be measured to accuracy of 1 ~gstrGm. The 'zero' of separation is computed by subtracting from the measured distance of contact be-
355
tween haht.bilayers in air and subtracting again the thickness of a bilayer based on the estimated phospho- lipid volume and the lipid cmss-sectionai area of the source monolayer.
Two important difference~ between this method and applying osmotic stress to spontaneously forming mul- tilayers are (I) the immobilization of the bilayers that comes from attachment to the mica surface and (2) the cylindrical versus patailel geongtry. To c~'rect for the geometry, the mica surface ~ t s routinely as- sume the validity of a transformation* accordin$ to Derjaguin {301 the fo t~ between crossed ~lindcrs of equal radius R is the same as the force, F~, between a sphere of radius R and a plane flat surface. Further, tiffs force Fsp iS equivalent to the energy £pp between plane parallel surfaces of the same material. Specifi. ca , y,
f~ = F,p/2,d~
For this reason, forces F~, measured with the SFA are routinely plotted as F~/R and ate therefore im- plicitly related to the Energy rather than the Force between patalld surfaces.
The position of a spontaneously assumed minimum ener~ (zero force) position between bilayers in the multilayer system will occur at a greater separation than that seen as a point of force balance in the mica cylinder system (see Fig. 4). So, to compare forces measured on multilayers with those between crossed cylinders it is necessary either to differentiate the cylin- der-cylinder forces or to integrate multilayer forces from a hypothetical infmity {32].
The observation [31] that mica surfaces will bend at Fw/R =, 10 dyne/era allows one to estimate an upper limit on the equivalent pressure between planar surfaces to which the SFA method can be used. We can say that an exponential pressure P of decay rate ~ c~m'esponds to an energy. AP=£pp with a maximum value= 10/29 = dyne/era. Then for A = 2 P,, typical of phos- pholipid hydzation repulsion, the maximum pressure will be P = 10' dyne/era 2,
Given all these differences in technique it is pleasing to see the good agreement between estimatcs of hydra- tion forces from the two techniques [32] as will be described below.
II-C. Pipette aspiration
Evans [15-18] has developed a procedure, schemati- cally shown in Fig. 2, for manipulating vesicles aspirated into the ends of pipettes in order to determine mechani- cal properties of isolated vesicles and contact energies of adhering vesicles. On an isolated vesicle, one mea- sures the tongue length inside the pipette as a function of applied suction pressure AP. At frst, small pressures

356
have a large effect on the tongue length, because of the removal of bends and folds: then the bilayer becomes taut with the subsequent length/pressure relation re- flecting the bilayer area elasticity. We follow Evans' terminology in referring to the modulus of this elasticity as a 'compressibility'.
For bilayer adhesion measurements, ~wo vesicles are drawn taut and brought to contact on the ends of approximately coaxial pipettes. Measured diameters and tongue lengths are used to determine bilayer area. Then, keeping both pipettes fixed and maintaining tension on one vesicle, tension is relaxed on the other allowing it to spread over its taut neighbor. Measurement of the di- ameter of the contact area together with monitored pressure and tongue length allows determination of contact angle and lateral tension in the bilayer. These then combine using Young's equation to give the ad- hesive contact energy, Groin, as described below. These are used as a standard to compare with energies derived from the integrated force curves from the osmotic and SFA techniques.
I!1. Maximm hydration and sDw:tmal dimensions ol flptd multtlayers
The most unassuming measure of the strength of hydration of bilayers is the amount of water multibi- layers imbibe from excess solution. Whether determined from the simpler gravimetric method or further refined by adjusting for compressibility makes little difference to the measured volume of water per lipid molecule (compare Tables I and VII). Polar group identify, polar group methylation, the ~hyslcal state nr the hydro- carbon chain, chain heterogeneity and mixLn~ of lipid species, all appear to affect total hydration. We have grouped the entries in Table I to facilitate recognition of these factors without intending to obfuscate other comparisons that might occur to the reader. This is not a comerehensiv¢ list of lipids that have been studied, but is culled from the more recent of an extensive literature of phospholipid phase diagrams selected to highlight the major differences in maximum hydration of neutral lipids or charged lipids in high ionic strength. Also we have used the preferred compressibility-ad- justed values where available, otherwise the gravimetric values. Still, it is worth noting that there is little dif- ference between qualitative comparisons using the gravimetric and those using compressibility derivations. l'his updates an earlier review of phospholipid hydra- tion [33].
In order to make comparisons among lipids which differ in the size of their polar group, the maximum volume of water per molecule, Vwo, has been normalized to V,o/PE, a volume of water per polar group mass equal to that of PE. One will note that differences in the amount of water usually correlate with comparable dif-
ferences in maximum bilayer separation in excess water dwo"
The most striking factor that increases maximum hydration is 'eaethylation of the polar grou~ layer. This is summarized in FI~. 5 where maximum hydration Vw,,/PE is plotted as it varies with the number of methyl groups per I00 ,~2 of polar group surface. The dramatic effect of methylation is seen among the follow- ing factors which affect maximum hydration.
Hydration of lipids with d~fferent polar groups. In the comparisons of the homogeneous synthetic lipid the PEs, DOPS, SOPC and DGDAG, the methylated species hydrate nearly twice as much as the other lipids. As a class, phosphatidylcholines (PCs) hydrate more than PEs even though there is a wide range of sorption within each class. Compare, for example, palmitoy- loleoylPE (POPE) with stearoylolcoylPC (SOPC) whose hydrocarbon chains differ by only a -CH2-CH 2- link in one chain. Their cross-sectional areas A o ,rifler by less than 15~o, bilayer thickness clio by less than 3q[, yet the volumes taken up and bilayer separatioas differ by more than a factor of two.
Dioleoylphosphatidylserine (DOPS), a charged lipid, put in 0.8 M NaC! to screen out electrostatic repulsion, and digalactosyldiacylglycerol (DGDAG), a neutral species, swell only as much as POPE. However, the swelfing of melted chain PCs, egg and dilanryi at room temperature, dimyristoyl at 27°C and dipalmitoyl at 50 o C, are much like SOPC. To us the higher hydration suggests the action of polar group methylation, the defining difference between the PCs and their unmeth. ylated sisters.
Polar group methylation. In the methylation of e88 PEt to eg 8 PC, large but disproportionate increases in hydration results with each methylation. Beginning with egg PEt, a PE created by Eeplacement of :he polar groups of e88 pC, then creating singly (e88 PEt-Me) and doubly (e88 PEt-Me2) methylated derivatives, one may systeh~atically examine the effect of methylation alone. A single methylatlon results in a 28q[ increase in hydra- tion, while successive methylations give 7~ then 16~ increa~s for the fully methylated PC. This is also seen with the successive methylations of DOPE [39] and DMPE (not shown in Table 1) [40]. (see also gels. 46 and 47.)
Methylated Iiptds added to bilayers. These last effects of methylation hold also when the methylation of the polar layer is varied by mixing, in the bilayer, methyl- ated and unmethylated species, either SOPC and POPE, shown here, or egg PC and egg PE [41]. Fig. 5 shows a remarkable parallel between these mixed bilayers and the methylated series just described.
These studies of the systematic methylation of bi. layers show that there is a disproportionate effect of the first methyl groups. A single methylation of the PE polar group results in a large increase in hydration, with

357
TABLE I
Parameters
Repeat spacings of htmellar lattices in excess water, d o, are directly measured. Water content expfetted its dry wright frlgtiolk C 0, CfO~ggtioM] areas, A o, and ~layer ~parafion, d ,e , again in excess water, are derived either by the 8rtvimelric method m. where mmmic stress data have been measured, by the new 'compre~bility" method (scg text and Appendix) USin S Ihe compre~ibility K (dy~/cm) either directly memmed og inferred. Volume of water per I',l~d molecule, V,~ - Aod,,e/2. For comparison amon 8 different species, this volume has been renonmlfized as V,m/PE, the volume of water per ma~ of PE headgwup. Hydration force paran~ters, Po and X. are fitted to data in the high ~ t~ion where log P vs. sepan~n is • sltai&ht line. The G,~ n (er&/cm 2) are absolute values of negative quant!~i'~: :g,e~, e~mates are ba~d on extrapolation of exponentially decayil~ P to separation d,o *;th the a.~ump'.ion of a van der Waa]s attraction vs. expoQential h~lratio~ ~ Data without • r e t e r ~ number are our unpublhhed results.
d o c o A o d~ d,,o V,,o t ' .~ / g A los Po G., . ReL (/~) (/~2) (,i~) (/~) (~ ) PE (dyne/ (,/~) (dyne/ err/
DDPE 45.8 0.72 55 32.5 13.3 365 365 M DAPE 57.3 0.79 58 47.3 10 290 290 DLPE 46.1 270 270 35 POPE (30eC) 53.2 0.79 56.6 41.8 11.4 323 323 233 0.8 1)..5 0.14 36 DOPS (0.8 M) 53.5 0.74 70 39.6 13.9 485 361 SOPC (30 6 C) 64.6 0.63 64.3 40.6 24 771 667 200 2.0 10.5 0.02 36 DGDG 53.2 0.73 79.8 38.8 14.4 $74 328 200 1.7 10.3 0.2d 37
POPE/SOPC 19/1 S4.5 36 9 / I ~6.4 0.74 57.3 41.7 14.7 421 415 233 1.3 11.2 0.09 36 4 / I 59.5 36 2/1 61.2 0.68 58.5 41.5 19.7 576 559 222 2.1 10.0 0.~ 36 3/2 63.3 36 1/1 63.8 36
DGDG/SOi~ 45/$5 57.2 0.6g 72.8 38.9 18.3 666 467 2~0 1.8 10.6 0.18
DGDG/POPE l /1 54 0.72 70.2 38.9 15.1 530 385 216 1.7 10.3 0.23
DOPE/DOPC 3/! 58 0.67 63.8 38.6 19.4 619 597 200 !.8 10.2 0.03
qmPE 52.9 0.64 72.1 33.8 19.1 690 690 200 1.3 12,$ 0.14 38
DOPE ( -2 °C) 52 0.70 65 37 15 487 487 39 DOPE-Me ( -2 °C) 61 0.63 62 39 22 682 648 39 DOPE,.(Me) a ( -2°C) 62 0.60 66 38 7.5 825 747 39 DOPC (-20C) 61 0.,59 70 36 24 840 727 39
¢IgPEt 52 0.72 65 37.4 14.6 474 474 200 1.1 12,3 0.20 36 ql~Et-Me ~1.8 0.66 60.7 40.8 21 637 605 200 1.8 10,3 0.01 36 elgPEt-(Me)~ 63.1 0.64 62.6 40.4 22.7 713 646 200 !.8 10.4 0.01 36
61.9 0.60 69.5 37 24.9 866 749 145 2.1 10.6 0.03 36
PC 16-22 63.5 0.60 69.3 38.3 25.2 873 758 145 2.1 10.1 0.01
eUI~/CHOL !/1 65.5 0.64 95.6 42 23.5 1126 929 1000 1.1 13.8 0.003 38 DPi~/CHOL 1/1 66 0.65 87.9 43.1 22.9 1005 8"/2 600 1.5 11.5 0.01 38 eS$1~/DAG-12.5 63 0.58 81.2 36.6 26.4 1070 829 145 2.4 10.4 0.05 42
DLPC 59 0.54 64 31.6 27.4 877 761 145 2.0 10.6 0.0l 38 DMPC (27°C) 62.2 0.57 61.7 35.7 26.5 816 708 145 2.2 10.5 0.02 38 DPI~ (50 o C) 67 0.54 68.1 33.9 31.1 ! 059 919 145 2.1 11 0.01 38 DOPC 64 0.56 72.1 35.9 28.1 1013 862 145 2.1 10.6 0.01 38 DPIPC (25 °C) 63.8 0.74 48.6 47.1 16.7 405 351 1000 1.2 12.3 0.03 38 DSlPC 67.3 0.71 $1.6 47.7 19.6 ~ 431 1000 1.3 12.9 0.15 38 DPPC/(~ol 8/1 80 0.64 47.5 50.8 29.2 694 602 I 0fl0 2.0 10.7 0.004 38
smal le r increases o n success ive m e t hy l a t i ons .
S O P C / P O P E mixtures 2 / 3 hydrate to the same extent
as pure SOPC. Thcsc disportionate effects suggest that
beyond bringing their complement of water to these mixtur¢~, lipids with methyl groups induce a structural
change in PE bilayers that result in further hydration.

358
Vw/PE s0e-
(A 31 ~ ' 4QO. N •
a ~
200 .
o
• N N D
• n~lhylat4t~ OOPE
0 molhytated E ~ PE
It ~ l ; o p ¢ mixNro6
, - , . , • ~ |
1 2 3 4 s MoltO0 A 2
Fig. 5. The uptake of water by multiltyers under zero osmotic stress ~m'elates strongly with the density of polar surface methyl groups. Thc correlation seems to hold wh-ther n,etby!~ are n r e l y bound to polar groups (squires) or are e.dded by mixing methylated (SOl)C) and unmethylamd (POPE) spe~es (X symbols). Pure DDPE and DLPE, as well as • non-methylated DOPS in solutions of Idi~ salt concentration, hydrate in the same low range as DOPE and POPE. DOPE dim from Ref. 39, POPE data from ReL 34 the data for the
remainder are from Ref. 36.
We suggest later in the text that this change is a disruption of hydrogen bonding that appears as an attractive force between (PE) bilayers [36].
Chm'n melting and heterotffneity. There are differences in hydration that appear to reflect effects of the hydro- carbon chains. Gel phase lipids hydrate less than their melted counterparts; DPPC-25°C < DPPC-50°C. Among the PEs, hydration increases with chain hetero- geneity and degree of polyunsaturation; POPE < egg PEt < egg PE. Between SOPC and DOPC, SOPC with one unsaturated bond seems to hydrate less than DOPC which has two.
Other kinds o/l ipid mixtures. These show dispro- portionate degrees of hydration, not easy to correlate to polar group structure. Comparisons of the pro- portionate calculated values with observed values of Vwo/PE for the 1/1 mixtures of DGDG/POPE, DGDG/SOPC, and SOPC/POPE are shown in Table II.
Addition of ~zon-polar iipids to bilayers. Cholesterol or diacyiglycerol (DAG), which can be considered to act as lateral spacers between poler groups, cause large in- creases in water uptake per polar group mass. Thus, cholesterol added to DPPC at low levels, so that most of the hydrocarbon chains are still in the gel state, results in a large increase in hydration [43]. Addition to the e~tent of disordering the chains at room tempera- :ure ~,ives hydration levels equal to that of the melted slate. Equimolar levels of cholesterol [38] or 12 mol~
TABLE li 1/1 mixtures o f l ip ids V~o/PE - proporticmate/obscrved
POPE SOPC DGDG
323 495/651 326/38~ POPE 667 497/46"/ SOFC
328 DGDG
DAG [42] added to e88 i 'C results in hydration levels somewhat larger than pure egg PC. To pressures of 10 I dyne/cm 2, Mclntosh et at. [44] report little effect in pressure vs. separation for e88 PCs to which cholesterol has been added up to 1:1 molar ratios. Given the lateral dilution of polar groups by cholesterol [45], this again shows i n c r ~ hydration normalized per polar
group.
IV. Forces between l ip id bilsyers
Even to choose the mathematical form for describing pressure versus separation, one must be aware of at least four different kinds of interaction expected to occur between bilayers: the hydration force due to perturbations of water by the polar surface, van der Waeds attraction that limits multilayer hydration, repul- sion due to thermal undulations of the whole bilayer, and possibly steric interactions of polar groups whose conformations are confined by an approaching surface. In the sense that these all involve a positive or negative work to remove water between bilayers, they are all 'hydration forces' of some kind. The challenge is to estimate the relative contribution of each to the total energy. Each of these interactions will be considered in more detail below. The problem with any empirical description is to decide how to fit an experimental curve that can be fit with a min imum of parameters, with a set of postulated interactions that involve many more. Little can be learned using more than the minimum required parameters.
We emphasize here a minimum parameter descrip- tion of the measured force curves. Plots of pressure as Io 8 P vs. separation d , (Figs. 6-9) all sugsest ex- ponential decay of repulsive forces at hish pressures, then a drop to a limiting separation, dwo. A minimum description of the exponential part is given by
O
IogP 7 an 0
(dynes/cm 2 ) o
6 " I I
D
O
5 0 10
(A) Fig. 6. Comparison of pressure vs. separation for POPE (open squares) and SOPC (solid squares) both at 30°C. Note the difference in range and slope (ct. Table I). Both lipids undergo phase transitions at
pressures above tbo~ shown here.
Ik %
i
20 30

log P
(dyn~,,cm ~ )
10"
9'
8'
7-
6"
S-
4
- 2 •
N •
| , .
lO 2 0 3 0 dw (A)
Fig 7 Pressure vs distance measured for egg PEt and its methylated derivatives ( x ) egg PEt; (open square) sins],/ (square with dot) doubly and (solid square) fully methylated. The greatest change is
cau..q~ by the tint nu:thylafion.
359
9
8
tog P 7 '
(dynesJcm 2 )
t %
"" %le
Jt = ~ 5 • °o
4 i IIw ' " ! ' i
0 1 0 2 0 3 0 4 0 dw (A)
F i g . 8. E f f e c t of c h a i n m ~ d t i n S o n h y d r a t i o n rwl~Uhion . D P P C a t 5 0 " C
(open squares) and at 25°C (solid squares). The .500C data ate l i m i t e d t o Io 8 P S 7 . o n c e f u r t h e r d e h y d r a t i o n ~ ~ a c y l c h a i n
freezing.
Whether we fit to the full curve using this exponen- tial plus an attractive van der Waals potential to enforce the 'hydration minimum' at d,o, or we fit an exponen- tial to the upper part alone, there is no qualitative effect on the extracted X and Po- These parameters do give, respectively, a 8ood comparative measure of the range of the repulsive force as well as the strength it is expected to reach at a given separation. From ~ese one can extrapolate the energy per unit area (or per mole- cole) that is encountered when two bilayers approach. What remains is to determine the contribution of each separate underlying force with an aim to understa"ding its physical origin [36].
Decay constants, X, do correlate in a systematic way with polar 8tonP identity and state of the hydrocarbon chain. Again, using compressibility-adjusted estimates (Table !), statistical tests of the decay lengths [36] show that with a probability of > 98~, these decay lengths are in the sequence
POPE < egg PEt - elB PE < elB PEt-Me - elB PEt-Mez - ¢8g PC
- SOPC.
One sees that all the PEs (POPE, egg PE, e88 PEt) have }, values of 0.8-1.3 ~ngstri~ts, a range that includes decay rates for the two frozen-chain PCs (DPPC-25°C and DSPC). Decay constants fog the melted chain PCs, with the exception of egg PC/cholesterol ! : l , are 1.5-2.4 ~mgstr~ms. X for DGDG is somewhat closer to those for PCs.
As with total hydration V,,o, when compared within related lipid species, there is a striking effect of methyl- ation on A (Fig. 7, Table 1). A single methylation changes the value from 1.1 ~mgstr&ms for egg PEt to 1.8 ~kngstrtSms for the monomethyl e88 PEt-Me and the dimethyi e88 PEt-Me2 compared to 2.1 for the full methylated e88 PC. And a 9 :1 POPE/SOPC mixture shows a ~, of 1.3 tngstr6ms compared to 2.1 lngstrt~ms for a 2:1 mixtme. Chain melting (FIB. 8) and increased
chain heteroseneity (Fig. 9) increase bilayer hydration, seen in terms of force curves, just as they do in terms of maximum water absorption.
V. Hydration free em.qD,
I t is important to rccof, n ~ that the dehydrat ion measurements made under osmotic stress are in fact a direct measure of the free energy of the lipids as a function of the arr, ount of water. Because lipid phase transitions usually involve significant changes in water content, these mea~red free energies can be a useful source of information in examining the phospholipid- water phase diagram and in testing various models of phase transitions. Guklbrand et al. [48] were the first to recognize this possibility in a model of the gel to liquid crystal transition. Leibler and Goldstein have recently developed an order parameter formalism to include hydration enerB.:es in this same tranQion [49]. Cevc and co-workers have performed practical and imaginative
IogP
(clynes/crn 2 )
S
a we s 7 o
a 0
6 B o 0
S
4 . - ,
8 1 0 12
• 4 w
• - , - , - ,
14 16 18 2 0
dw (A)
Fig. 9. Comp~son of (orc~ I~tv~-n biiay~rs with k T ~ d (PE) polar Stoups bet diKa'mt hydrocarbon ~ (opm squat) s~- • ¢dc POPE, (solid =IMP) natural en PIE. (squint ~th dot) a d e r i v a t i v e • B P E t m a d e b y ~ l l d y l a t i o n o f e l l PC. C l U l ~
heterogen~ty and deip~ or" polytmmtwztion incmu~ the tmckncy of Pe hydn,~. [3ft.

360
measurements of the temperature and entropy of this same tran~h!on ~ a function of water cut, tent 150.51]. Since we behevc that this kind of analysis is just the beginning of many possible uses of dehydration/phase transition dat~ we have codified b~te data on bilayer dehydration in terms of osmotic st,-ess vs. water volume paramc~,ers [36]. The enormous energies of bilayer dehy- dration may he appreciated by examining one case, e.g. egg PC, where forces have been measured virtually to zero water. Taking A Po as a measure of the integrated work, one sees (Table i) that at a pressure of 10' dyne/era z. for example, dehydration hgs involved a work of some 20 erg/cm z, and that for bilayers ap- proaching zero-water contact this energy can grow to the order of 100 erg/en~. Translated into chemical units, this amounts to 2-10 kcal/mol (8.4--42 kJ/mol). These energies are of the maiptitude known for oil.water of vapor/liquid contact.
Vl. M e e a e l H tye r t l t e d o n ener lks
Phospholipid hydration, preventing anhydrous con- tact. is an important factor affecting the strength of adhesion between electrically neutral bilayers. For this reason, the measured strength of adhesion between bi- layers can be a useful inverse indicator of the strength of bilayer hydration. The pipette aspiration method provides the most direct measure of the energy (nega- tive) per unit area, Gmo of spontaneous interaction between bilayers. The me~.~ured contact angk, 0. and applied bilayer tension T in the bilayer give. by Young's equation [76].
G,,,,, - 2T(cos / - I)
One can combine this Gin, n with an estimate of average bilayer separation d,,, measured by X-ray dif- fraction. This combination allows one to test various models for bilayer attraction forces and to correlate strength of adhesion with hydration force measurements [18.37].
The osmotic stress measurement alone allows a sec- ond estimate of contact energy, but it relies on an extrapolation of the exponential repulsive force
~ e x ~ - d . l X )
to the position, d,~. where this force is equal and opposite to a longer range attraclive force. For example, if one assumes the distance dependence of van der Waals attraction in its simplest form, one has [10]
F,~. - , I , /(6w,t. ~)
TABLE Ill
Bttoyo-MOe. admire e.m~ez ~ t . ~ by tknv ma&~db.
Osmotic strm (OS) eatrapolstions umme • simple l / d ~ v t n deT WaAds attractiou. Apeemem of all three melhods i~ exceiknt for diplscto~kl~lgl~¢erol but not for PEt or i ~ t O~mod¢ strm (OS) tnd pipette aEpiration (PA) mexsurements 8re on un~ff,6¢~xl films. Undulations of these films mi8ht explain some of the d i f f ~ from susface force apperatus (SFA) measurements for the PCs 8rid PEs. but mint of these diffeunges are nm understood. (Sotage n r J ' m ate in square btlgkctt. OS vtlua ave from Table I.) Tempcntttn¢ it takgn to be at 2.50C mlkss s~tUM ~ G~a Utbulated ~ 81m01ute values of neptive quantities (alt/cm 2).
~pid SF& PA OS
esgl~ 0.0l DLPC 0.1 (22"C~ (52) O.Ot-O.OlS 11~ 0.0l (25 "~ SOlE 0.012 ' It8) 0.02 ( D e n ") DMPC 0.02 ( ~ ' C ) DPPC 0.15 (21°C)($3) 0.03 (2.5" C) DPPE 0.80 (Ljl) (53) POPE 0.12-0.15 (La)ll8 j 0.14
DGIX3 0.29 (53) 0,2.~ 1371 0.24 MGDG 0.48 (29)
• Wh~ a~oumin I for undulation t ~ pggsgat in the OS attd pcmibly in the PA tad absent in the SFA bihJygn, 0.012 ¢qVcm z becomes 0.0165 eqt/gm 2 (E. Evans, penmud ¢enmMskation).
as indicated from SFA measurements [29,.~2,.53]. Then, integrating these two forces from infinity, one infers
G,.. (d,.) - F. ,~td. .) .((d. . /2)- A)
At d ~ ,
F.4.,( d . . ) - PoexP( - d . o / A )
so that
G.,,(d. .) - ( ( d . . / 2 ) - ) . ) - Po eq,( - d./X)
which can be evaluated from meumed P0, d ~ and A. As long as the attractive force is oir much Ionf~r
range than the repulsive one, the e s ~ r of nuqpfitude of G.m extracted by this procedure is not very se t . r i ve to the form of attraction. For exJunple, if one include3 the finite bilayer thickness or even subdis~les the bilayer in to regions of different polarizability [10], estimates of G,,~ will not be qualitatively affected.
The force F o at the position of maximum attraction where two phosphelipid-conted mica surfaces jump to- gether in the SFA fives yet a third way to measure G,.,, [52,531. By thz Derjquin approximation (see Fig. 4 and related text).
6 . ~ - Fo/ 2,~R
In Table III we have compared estimates h'om these three methods. What is puzzling is the much greater estimate of Gr~ n from the coated mica surface measure-

36]
merits compared to those between unsupported bilayers. In any case, all these minima are < ! erg/cm ~. rela- tively weak on the scale of oil/water or vapor/liquid interfacial energies.
VII. H y d m i m d d u q ~ l idunpbtildd I d i o m
Bc~lusc of the hiBh pressures prod1~c~ by combined hydration and electrostatic double layer forces, hydra- tion interactions between charged phospholipids are. no: ~ways easy to see, With the OS method, it is necessary to apply hil~1 stress and So to small spacinBs, especially in solutions of low salt concentration, in order to ob- serve deviation from pure electrostatic repulsion. Often, such pressures cannot be attained with the SFA before thene is bending of the supporting mica surfaces. For example, measurements of forces between di- stcaroylphoslphalidylllyccfoi (DSPO) in NaCI solutions, usin8 the surface force apparatus, w~re limited to sep- 8rations srater dun 20 ~ a SCl~Uration too
and at pressures too low to observe hydration repu~m~ pq.
I t is worth considerin$ wlmrc one should see a transi- tion fro~ dectrostati¢ double-layer*dominated i'~
to • r~im~ of hydration fo~c dominance (Fib i0).
Consider. for simplicity, on electrostatic repulsion between pmi i ld surfaces, scpmlted by • distance d, of the form
• % , ( 4 ) = / ' , , p p ( - d / X , )
whe~ Pm ~ o11 surface chars¢ and the decay
I0 I°OpP o]
( d y m ~ ~ ~ 6
/ SFA ~ ,0
FUR ol (dyno$/cm)
',0 20 o (A)
FqF i(9. Diff, cuhy o4' d~1~tin~ h)~Jratk~ fo~a~ I~t~,:¢n dwlcd bila)~s. The sum o( tie dectrc~tt~: .nd h~lrat~e ~
equi,,~k~u. ~l,q Ix*1~ ~aual ~limlm ~ radi*~ R: F~I~Z- 2.Eee Mmre Am. is the ~ l~i~ee~ p i 'dd ~rfsc~. Parlm~em reed s ~ ro~ hyd~t~e rtputsme ~ zo dut betwe~ PEa, A - I A. Po" IOOZ @,me/cruz: and f~ d~ ~ ~ b~m'. m,d~ ,,, that P~. - P,~, st 12 ~ ,,i~ Deb~ Icqm o4' I0 A. Lines we ",..~ c~r n:Siom ~ zo ~lo~c win, P,. md ~o dw mrtace fo~ a 4 p l ~ n t l FJ~, ~ilJu~ ddommti~ Nc~ tl~ sldll in ~ IZ~bm, ot swi,cJ~r fron dm'w0mmic dou~ I s ~ m h~kadon fo,~ (inows). ~ ~ omit ~uibmim, o( mldkdasmy ilu~m**
distance ~ is the Debye*Huckel decay length. Add to this a hydration repulsion of the form
P~,d( d ) " Poezp( - d / X )
Between para l le l surfaces, then there will he a transi- tion from electrostatic to hydration forms around a posit ion dp where these two quan t i t i ~ ~ o | compara- ble ma~p~itude,
P~,¢xp( - dp/X e ) - P~"Xp( - dp/X )
or
dp - (q x. x , ) / ( x , - X) ) - Iab( / 'o /P. )
This separation dp wil l typically he ~ than the maximum disumcc assumed by ncmnd bilay~rs of com. parable hydrat i~ ceazd,=L-y.
Between oppo~tdy curved surfaces, such as the crossed mica cyl inde~ dds transition will occur at a separation d c whqwe the intcKraled energWz. X , P ~ ( d ) and AP~,d(d) arc oompasab~ That is
so that
~, - (( X. A, ) / ( x . - X )) . le(( A / o ) / ( A , P , . ) )
- dp -fIX.A. I/IA. - A)l.le4 A./A )
The effect of oppmit© cunmt.~ is to shift in toward contact the place where hydration fo~es "take off . Except for solutions o l very hish (i.e., molar) salt con. amlrations, A~ ~, A, and dds slul'1 is zqpprox.
d~ - dp - X .~ ( A . / A )
This is some 3 to 8 hydration decay knnqphs in solutions of 100 1o I mM iom~ streqph, respectivdy, T I ~ ~ seals a :on.triviM dilTcrc::c= in lhe sutss required to observe hydratioa forc~ Ix'Iwecn o p p ~ l d y curved surfaces, as illustrated in FiE. !0.
A1thoolL5 hydmion repulsioa bc, twem cherl l~ hi. layers hans n~ ~ as ~ cxsmimM u that hetw~-n neutral bi]syen, ~ is c ]a r cvkkmce of an extra non-¢lecu'o,~ ~ . Early mamemcn~ of e88 I ~ / q ~ PC sml enSthngyte P l / q g PC mixtures under ormmlic stress in zes"o-slilt solutions showed an extra repulsion at small sepmmtions 1111411 ~ tak(flll tO indicate hydration rq)~dsk~ [34]. The d~111ioas from ~cctro~tstic 8tpulsion at $ lind i0 moi5 P ~ or PI aln1~t exactly followed the curve for pm~ q~ PC at the sant~ separltiogts. ~ very Jl~Bh forces e s ~ t ~ r e d with pure ~ at doa~ scpBrBt~t mr~ sina~Br to tJlo, e seen with eSS PC h~lrst icL but • pundy dectfomtic explanation cannot be ruled out (J.N. lu lca iKhvih, pe~omd commum~tio~

362
~ P
(dynes/cm ~)
7 m l l
O0 6 ;
o O
5
4 • i
H ) 2 0
"." , .
• , • , • , • ,
30 40 SO 60
o~ (A) Fig. II. lnterbilayer pressure between PS bilayen as it varies with separation in ((3) 1.0 M NaCI, (11) 0.4 M NaCI. For 0.4 M NaCI. the sudden onset of a repulsion at about 20 ~ gives a much steeper slope
than expected from electrostatic decay.
Evidence of an extra, non-electrostatic force is much less ambiguous in measurements on pure egg PG and egg phosphatidylserine (egg PS), in 0.01 to 1.0 M uni- valent salt solutions [55]. Both materials showed the sudden onset of a repulsion at some 20 ,;mgstr45ms separation, of a much steeper slope than expected from electrostatic decay, and apparently unscreened even by high salt concentrations (Fig. 11).
In retrospect, these data suggest a non-electrostatic double layer repulsion more like that between egg PE bilayers than between egg PC bilayers. In fact, we have recently found that DOPS in 0.8 M NaCI swells like egg PE, a repulsion that becomes important at an about 14 ~ngstrtm separation and varies with the approx. 1-2 tngstrgm decay rate of egg PE. The opportunity exists for further measurement in these and related systems.
We have recently measured forces between bilayers of the non-phospholipid, dihexadecyldimethylamine acetate (DHDAA) in 5-500 mM acetate solutions. In 5 mM acetate solutions, for example, there is a clear break away from electrostatic double layer repulsion at an 11 ~ngstr~m separation and at a pressure of 6.10 e dyn/cm 2. Below this separation there appears to be an exponential repulsion much like that of POPE. The integral of this force curve corresponds nicely with what one sees with the SFA [56] where, between curved surfaces, there is primarily electrostatic interaction with no break down to a separation of 5 ~ngstr~ms. This comparison illustrates well the implications of the shift inward of the hydration take-off point for oppositely curved surfaces relative to parallel surfaces.
Qualitatively, different kinds of interaction occur between acidic phospholipid bilayers exposed to diva- lent cation solutions. The many studies of such systems show that the interactions are strong enough to break through the hydration barrier and allow very close contact. Much use has been made of this in attempts to model membrane fusion. An example of such a remarkable change occurs in PS bilayers exposed to Ca 2+ ions. Even at micromolar Ca 2+ concentrations,
these bilayers precipitate to virtually anhydrous contact often with crystallization of hydrocarbon chains [57-59]. By comparing the binding constant of Ca 2 ÷ to the outer surface of multilayers [60] with the strength of binding between bilayers [58], we estimate an energy of contact on the order of 100 erg/cm 2 in these Ca2+-coUapsed PS multilayers, quite enough to completely overcome hydration repulsion. (Method of Parsegian and Rand [61] updated with the binding constants of Feigenson [58].) The fact that this precipitate contains no detecta- ble water argues against an attractive force based on ionic fluctuations [62,63] and suggests, rather, the kind of dehydration characteristic of insoluble ionic crystals.
Vii. Aml~lflea/ian of bllayer repulsion by undulatory fluctuations
For some time, since the pioneering work of Helfrich [64] on steric repulsion between lipids, there has been the sense of a dilemma in deciding whether lipid bilayers repelled because of actual forces between them or be- cause of collisions that occurred when they experienced normal thermal undulations. It appears now [65,66] that there is no dilemma. Bilayers do undulate. These undu- lations are suppressed by long.range interactions rather than the hard collisions originally imagined. And the loss of undulatory entropy, suppressed by membrane repulsion, is an important pan of bilayer packing en- ergy.
There appear to be two limiting regimes: one where bilayers are so close that undulations are effectively suppressed and bilayers interact only through the un- derlying or direct interbilayer repulsive force; another where bilayers are sufficiently far apart that forces between them are weak enough and of relatively short enough range for them to repel as predicted by the original Helfnch model [67]. In between, there is a coupling of steric undulatory and underlying or bare interactions that results in behavior different from either taken alone.
To clarify the relative strength of bending undulatory and direct interaction forces, it is worth ex~,minin 8 the form of the undulatory fluctuation force, Pn, in a regime where the underlying interaction is dominated by a single exponentially decaying force
Poexp(-d./~)
In that case
Pn" ( ~kT/32~) (~o/B~, ) exp( - J . /2 X))
(To derive this result, see Ref. 66. Introduce Eqn. 18 or 19 into Eqn. 16 or into the derivative of Eqn. 14 of that paper.) Here, B is the bilayer bending modulus (usually about 25 kT ) and >, and Po are the decay rate and coefficient of the underlying repulsion. For dis-

363
tances, dw, much bigger than ~, this fluctuation compo- nent will dominate to give a force that decays half as fast as the underlyin 8 force. It is possible at these larger distanc~ to infer the actual bilayer-bilayer interaction only through a theoretical construct that takes the un- dulatory force into account.
It is instructive to compute the point of crossover between the dominance of a direct exponential force
Po exp( - d . / )~ )
and the undulatory fluctuation force. Set
Po exp( - d . /X) - (.kT/32X)~/(( Po/aX ) cxp{ - d . /2x ))
For X - 2 hngstrihms, P0" 10t° dyne/cm2, B = 25 k T
= 10-tzerg, equality is satisfied for dw ~, 17 &ngstrihms. Below this distance, one would not expect appreciable contributions from fluctuations. At greater distances, one may see expanded exponential decay due m fluctuations.
Indeed, recent measurements of forces between parallel DNA double-helical linear polyelectrulyte~ [68] show precisely this halving of the decay rate. In salt solutions of low concentration, but at separations much greater than the Debye length, forces vary with half the classical Debye decay rate. In very high salt concentra- tions, where charge interactions are screened, there is an exponentially va~ng hydration force at separations less than 10 An~gtrihms and arz extended region of half the decay rate at greater separations. Simultaneous mea- surement of molecular motion indicated by progressive broadening of the X-my reflections, confirms that the region of extended decay corresponds to a regime of steadily increasing molecular motion.
In general, the interplay of direct forces and undula- tory fluctuation forces will not always result in cleanly visible behavior of one or the other type. Between phospholipid bilayers which enjoy undulatory freedom near the position of force balance between van der Waals attraction and hydration rcpuhion, the action of fluctuations seems to be to amplify hydration repulsion near the limit of swelling. Fluctuations shift the force balance outward [66].
Fortunately, it is possible to compare experimentally measured forces between bilayers undulating within a muitilayer array with those between bilayers immobi- lized onto rigid mica cylinders, where undulations are presumably impossible. Fig. 12 shows the force vs. distance between bilaycrs on crossed mica cylinders, differentiated :o give the equivalent force per molecule Fret (shaded band), together with measurements of re- pulsion between bilayers in a multilayer array, also as a force per molecule (points). Both data sets are for PCs with melted hydrocarbon chains, it is clear that in a region of stron$ repulsion the two show similar foff, es
r..-.- ,. w
10" -
i
t I 10-,o ~-
I
0
#t# #
T>T¢
10 15 20 25 30
Fig. 12. C o m ~ of forges ~ between bila~rs in a nmhi- layeT (O) ruing mmmic sums aad betweea bila~Nm immobilized onto Ihe crmsed mica ,~finders of the mr'face fore alUm'aim (shaded band). The data points ate foe DLPC at 28°C whege hydrocarbon chains are mehed em:ept at hilgh im~ame (O). Data from Rd . 38. The SPA curves are fog a set of mdled chain PCs [32.52]. The dmhed line is the mzdeflyin$ in ta lHla~r f o r e aim subttKtion of undulatot7 fluctuation frames in the taultilayer ~ e m [661- Anows indicate limiting spacin S at zero force. T I~ plo¢ shows (a) the expamive power of undulatory scerk fluctuatiom in the regime of ~mdl ~ r e * (lower third of I-qpwe}. (b) the mppfe~,cm of these fluctuatlot~ at higbc~r p~dxtre~ (c) the remalkable aggeem~t SFA and OS melnure- meats once oee takes account of the difference in appargnt zero of
separatinn. ( F a i$ fogce per motec~e. Fog detaih lee Itef. 32.)
with oaly a small horizontal shift due probably to differences in Gte defined *zero' of separation. But at low pressures there is a distinct divergence between the two data sets; the limiting spacin$ of the mnltilayers is considerably greater than that between adsorbed bi- layers. If, thoush, one subtracts undulatory entropic contributions from these data using the theory of Evans and Parsesian [66], one obtains the dashed line that is remarkably parallel to the fixed-bilayer shaded band of the SFA measurements [32].
This comparison actually teaches us at least two things. First, undulations act to enhance the hydration force giving it a greater apparent range. Second. at higher pressures undulations are effectively suppressed, svggestin8 that one can use mea,~remcnts in this range to estimate the uadedyin 8 hydration force.
There are cases where fluctuations probably always dominate the repulsion of weakly hydrating bilayers such as the case of the non-ionic aikylpoly(oxyethylene) (PEO) surfactants. Tiddy and coworkers have used c.on- trolled vapor pressure to measure forces t~ctween bi- layers of compounds of various hydrocarbon and eth- yleneoxide lengths. Tiddy et aL [69,70] arg. t~e that the polyethylene oxide chain polar groups are extended and probably hydrate with only one layer of water, and

364
within their residence space form • PEO/water m~sh. Melted bilayers separate to greater extents than when they are frozen. Melted bilayers of the shorter chain compounds swell appreciably more than the Ionser chain species, which are presumably less flexible, and achieve separations greater than the maximum length of the fully extended amphiphile molecule. There is good tea. son theft to think that tJlJe~ JoDg $p~1185 OCCUr from undulatory fluctations confined by collision between the hydrated polar relions of facing bilayers [69,701.
I~. The v~o~ pro•we pmdox
Widely recosaized amonl; phospholipid physical chemists, and even more widely i p m e d among those who prepare 5pids for laboratory study, is the fact that lipids exposed to a water vapor of 100~$ humidity will not take up as much water as will the same sample put into contact with liquid water (Refs. 41, 71, "/2, compare to Table I). Typically. for example" • phosphatidyl- choline muldJayer will imbibe some 4 3 - 3 5 % ( w / w )
w•t~ from the pure liquid but only some 305~ from • water-*saturated' vapor [~2,72]. What is ~ t sample rquilibrated against liquid will actually live up water to • 100% r.h. vapor and t h ~ reversibly re~6n water from • liquid when given an opportunity to do so. (Rand, R.P., unpublished gesuJts: Gruner, $. and Templar, R., personal communk:ation).
Worse. a charged phospholipid, e.8., pho~'hatidyl- serine [?i] thai will swell indefinitely to isolated bilayers in liquid water [~$] will actually stop swgllin| in vapor at • water content far Jess than that taken up by phosphatldyleholine under similar conditions [?I]. The limit of swell•n8 of multilaye~ on solid substrates (Ref. ?3 and Gruner, $. and Templar. R.. uupublish~, ge- suits) seems to resembk that of lipids in vapors.
What is Igoin$ on? Isn't the activity of a 100% r.h. vapor :.".¢ ~ang as that of the 5quid water with which it is supposed to he in equilibrium? One's first thousht is that perhaps, because of sSKht thermal 8nidient~ the vapor activity is somewhat less than that of its rnoth~ liquid. Consider the osmotic stress /7 equivalent of • vapor of relative humidity P/Po.
~ I - - ( iT/r )in( P/Po).
where v is the 30 A~ volume otr a water molecule and ( k T / v - 1.4- 10 ~ dyne/c• ~. Fm p near Po, we may write P / P o " I - A and
n - ( k T / r ) , , ~ - (I.4. I0~ ),~.
An osmotic pressure cf I0 ~ dynes/,-'n~, en~.:gh to • hOve I /3 to I / 2 the water from • :nultilay~. is liven when A = 0.0007~, or the relative humidity i~ more than 99.9~. which co~.*Id come from • 0.01"C dip in the
- 0 s : * :
$ 1
; rv , t , , .#w
1 ! I i !
i l ,
.¢x) ar
, f ~ t ~ e s ¢ , , 4 ,
• e • o
~g
,% • e
J
o .
F'qt. I). Molar rzdo (wa~/lipid) and bila~r zqwmion for qlPC bile~mrs plot*ed as functioa ol p re ln ~ low diHmt ~,ays: (i) omme4ic ~mra, d)l~/cmz: (ii) ~ p o ~ Is,,. edllive io l~k water:. (i~) eqvivalem ndat~,e hvidity: (iv) lemperauNe ia-
rdath~ hum6Gity amd m, mmlc t4nno,
temperature: See F'i& I ) for the great effects that small chaniws in relativ~ humkGty, resultin8 from tiny tem- pa~lU~ nucmasm~, can ha~
Temperalure fluctuations ~ l l explain the escape of water from bila>~rs in liquid to vapor. I~ t thermal fluctuations do nm explain the obmvtt ion dmt water is Io,t to a vapor maintained at I10% relative hunddity. In b%tt exper i l l~t liqltl~i'-mtUftt4NI ~ f WAS c00kd i)efofe Ix~i blown at a hydrated samlde (Gnus, .5., penmud communL-.ation).
A soo~n-,d ,,~usibiSty thqa~ore is that thg agtiott of a vapor/multilayg.T or solid/muldlayqw interfacg is to supprexs the bilayer ,.mdulatiam that enhance hydration or electrostatic n q ~ Quantitative c e m l u of water loss in vapor with the ~ shih in equi- 55rium spacing usinil the model of Evans and 1661 mWats dmt, comidednS p r e m t ~ one can account for about one half of the e4bsem~ effect via this explanation.
Otter po~blc e x p h u ~ misht ~ the re- stminin$ cffc~ts of hash surface tensiom. The naults of Safinya el al. 174] on planar 5pid films stretched over • hole and exposed to vapor show that the 8~xnetry of the overall multiht~r is not critical.
The inability of charged lipids to swdl in vapor SUB•eats to us that the ~ is at the ,~t'y least • practical problem. One knows that charged lipids must repel. I f this swelling is u~,wittintly pt~rented, • him. d l in l probicm is certainly evident. On I)gcparml slun- ples in vapor, one should be suitably aware that, under these conditions, l ip i~ will no~ Io to full hydration.

~ 5
X. Inu~mctt~ ~ W p o ~ c ~ e d t~h~ev i . f sces : vedde i e m c d m i d d d o m s d m
Vet~ ohm one must know the inlerac.tion between b i l a ~ that age in the forth Og vesicles c~r curved surfac~ We ~ heg¢ that the form of interac- tion will depend on whether the curved surf, ces are parallel to each odleg of whether Ihty curve •w•y from Cagh Other (hlv~ the opp~ut¢ cuf~l iu~) as t111~ t~ces- smrfly do in vesk:le-ves~k and vaicle-pbne interac- tions. It b also clear that the forces encountered are IItOnll enOUlll to d~ionn iniemclinl bibyca~, to n:smlin I I ~ unduhltioi~ or to f l luen nlighborinll vlsiclel, h is ~ v = to ~ how h~Iratk~ rqmb~n and the adheskm ~ r l ~ , G,,,,. between pandl~ surfac~ at • pmidon ot force balance, show up in the interaction betwem curved surfaces. These p h e ~ g n a 5ave been examined n g o m u ~ by E. Evans and co-woOers 116-iS~0-~?.~4L
As deala~bed ibove.. • oonveslu~at • p ~ m m t i o t t d~J~ to D=~min 130) ~ one to tmadom forces mea. lawed between potalld plamur Llyess (pp) to in taac l ic~ I s p l ~ ~ ~ ~aicks (u l m q l l l ~ a l voiclel Mid flat lay¢is (sp). ~ oossed cylinden o i nldiui R oi betwlm a s p ~ ol radiui R and a plasW,, tbe foece l i is fdated Iothe I £e~ by
Bmmm two ~ the tnmdom is
i1 i i l i l u l Ih l t Ih i l icint d o ol l i l o nl'i icier ~ ~ is die same between two
• I p ~ and i Ilal l l y l i , o l belwml t ~ ~ c y ~ and is qui l t i n d q ~ i o i r a d i R. lmlh~r, this de between q ) p o i d y ~ surfaces will alwa)~ be apect~d to occur al a smdl=r ~pa ra~n d~an b e t ~ l~ra l ld m : fac~ (cf. Fi l . 4, £~, - 0 al • smaller Kpazatioo tlum whu~ Fro, - 0.) The intengtion between s u r t ~ ~ i c h curve away fn)m each o(heg b • mm of ilklividllaJ int¢iIctJolls at d i f fe l~ t l¢t i l t r l l io l~ 111 th~ Dcgjaluin ~ t i o n somg pmls of tl~ surfac~ may fcd nit *tmgtion, ~me ~ Th= ~ ranllg f o t ~ will be f i l l ove~ • i ~ l C r anm o l dg surfac= than the tg l~VC. It wil l ha~ • i w o p o ~ l ~ l a ~ 'say' in
the final imi t ioa ol fmce b ~ (Fo~ an i11usua6oa o( the nmdt of mixed •tlraCUv= and ~'lPUl- sire d¢cu~mtic double lay=r ro~=s betw=~n and • ~ mutminalion c~ Ibc mx'umcy o# the
i i p p l ~ l i m l for such i n i m l i c t l l ~ I¢1. ?~,) But l l ~ s a n c o m l m l i ~ ol atmgtion and r~l~l- sk )n will c t i l te • t o ~ to d~orm • carved surface. One must d i ~ o l l i sudace de fo l~b i l i l y in any pmbkm involvin~ c u r ~ ~ r f , m .
What can one say at i l~ level of vesicles of 200 Snl~trOm radius? First, b~w¢cn n l id ~hcn~ compan:d to pazallcl layers, there will be an inward fluff in the position of force b t t l ~ between Io~|-rlnse attraction and sho~-ranse repulsion. Second. sino: v¢~ck.~ are in fact not r~d. they roll flatten to create regions of planar adh~ion having the ~ 1 ~ , G~.. peg unit an~ described above.
Rigzd sp&rrcs For simplicity, consider a r e p u l . ~ force of the form
P - Poexp4 - d / A ) and attraction of the vats der Wmlb fot'm F,~ - - ( A J 6 w d l ) . (Here we use d as the dis. tance between the sud'aga. By virtue of the a~aumption of rilpidity, one ilptot¢~ any action oar undulatory rcpitl- ~on.) The cogrespondinl; eneqgy between two planar surfaces expenc~ing t h ~ foec~ is
Et.e - X P~'tlp~ - el l ) , l - 4 , / t i 2 w4 ~ )
- ( A . P I - I d l 2 i , F , , i .
Sketch~ of forgg and ~ per umt ax~ for i)pical p~'angters (Fill. 14) show the inward shift in zCgO-fOYCC la~ition for Epbe~ ~r cylindew from that for parallel pt, l ~
Since the fo~:= I ~ sphcn~ lots as the radius R, the depth of tl~ ¢aterl~ minimum for intesactinl MPhef~ is propomo~ll Io ~ radiu~ By F . = lrR Emp. the e n ~ of inienlclion be1~'n two ~ is repre- s¢nted •~
£. - ( X~qo.p( - d/At - A~/ll2~4 l i ra
- It X: I '1 - ( 4 ~ I 2 t • F, } ~
|llCl t i t dig S l f l l i l # l gncfa~ po~liOll of two sphcn= i$ at x lepllgation ~ tl~lln th l l of two parlll¢i plan~ nwam thai t b e ~ IXtm o~ the ~4h¢~es arc acluII~ beinl ~ IO a tq~ration ~ lhey (Fill. 14). The s h n u l l a ~ lur lc tmn and repultton on diff¢~m parts o( • vesicle c i l i t c • i o ~ that can be rd~ed by vesicle deformation.
The stn:~ (it hydration ~ and even ~galk v•n d~r Wauds atmgtion is such that vil lually any curved bilay~ ~rfm.~ must dtq'om to soaw e~lent when in a d h ~ e com0ct 175], IJtcrM tomon T wilton rig biiayer ~rfac¢ ~ q, aJem the drive to o ra te • fLattc~=d aure.a o( gontact o( adl~sivc c~esl~. G . . . in such a way as to satisfy Young's Eqn. and 1o make • cemtact anise • (F'qg. 15L
cml - I ¢' I G.~! - 1/2#)
For ~mlall contact anlks ~ t - I - lP~/2 and
I l - - G . . ( - l i t ~

366
The area of flattening ~RZO 2= ~rR2Gmi,(-)/T, the fractional area of flattening is
~ r R Z G n ~ ( - ) / ( T 4 ~'R2 ) " Groin( - ) / 4 T
and the energy of interaction over this flattened area is
• "R2G~. ( - ) z / y .
The factor of ]0 difference in G,~, between PE and PC leads to a factor of 100 difference in the contact energy between deformable vesicles. For example, con- sider an Rffi200 ~ vesicle under tension T - 1
E~;sX 10 I/" 1 •
0 ,
0.06 8
0.02 fpp x 10 -4
0.00
- 0 . 0 2 t.i~
4 " -40
2 . ,
-20 , Fss x 10 e
-10
-3 - , , - , - . . , - 1 0 1 0 2 0 3 0 4 0 5 0 6 0
#
%p= 0
FiB. 14. Simultancot.~ atUactson and repulsion between risid spheres occurs at a minimum energy position which is less than that of force balance Fpp = 0 between parallel planes of the same material. (a) Spheres at separation corresponding to maximum attraction; (b) spheres at their minimum energy separation (where ( £ ~ - 0). Small arrows shuw conflicting repulsive and attractive pre~ures creating a
torque on curved surfaces.
f cos Y
S 6 min
2Y cos ~I = 2T+ Gm;n (-)
Fig. 15. The balance of line tension ~ and attractive energy G ~ . ( - ) to create a deformed region of p h o ~ o l i p i d reticle interacdm. Gram ( - ) between neutral phospbolipich is usually pictured as a bal- ance I~tween van der Waals attraction and hyd~tion repubion. Despite the tension developed, there may be some repulsion also from undulatory fluctuations. Between some phmpholipids the~ may also be hydration attraction or H-bonding g r o s s a water layer due to
complementary surface polar grOUl~.
dyne/era. The adhesive interaction for G M , - - 0 . 0 1 erg/cm 2 will be only 1/5 of the thermal energy k T - 4.2.10-14err"
But for Gmt,- -0.1 the interaction energy will be some 20 kT.
Depending on tension, the contact energy will often be dominated by Gmin • area of contact.
Other contributions, such as the residual attraction between non-flattened areas and the work of deforma- tion will very often be small by comparison. When vesicles are deformable, as is usually the case with phospholipids, their interaction is more characteristic of forces between parallel planes than between curved surfaces. It is puzzling to us why most mod¢is of vesicular aggregation neglect this important feature of interaction.
XI. Hydration in other systems
It was our purpose in this review to collect informa- tion strictly on phospholipid bilayer hydration, informa- tion that has become available from different experi- mental methods. It would be wrong, though, not to mention for reference what is being learned in other systems.
All modern studies of solvation and hydration follow the major achievements of Derjasuin and his school. It was these people who built and desi$ned the first suc-

3 ~
cessful surface force apparatus, developed much of the physical theory of long-range forces, and recognized the importance of the 'structural component of the dis- joining force' (for which read "solvation' or 'hydration" repulsion). This work is the subject of a book and several recent reviews [2-5].
The swelling of clays, by the action of both electro- static and hydration forces has been recognized for several decades. Early work examining layer spacings as a function of vapor pressure [77] showed multiple spac- ings that gave a first indication of discrete layering of water on hard smooth surfaces. Studies during the past two decades, particularly those of Low and collabora- tors (e.g., Ref. 78 from which references to the very large amount of earlier literature may be traced) have shown exponentially varying forces measured by osmotic stress. Closely related to these are the now extensive studies between mica surfaces using the surface force apparatus and reviewed recently by lsraelachvili who is the principal designer of the present form of the ap- paratus [79]. In particular, measurements by Pashiey, Israelachvili and coworkers have found that mica-mica interactions are often oscillatory with an oscillation period correspondin 8 to the dimensions of intervening solvent. We take it to be signlfw, ant that usciHatory forces have not been seen between bilayers or between macromoleeules in solution; the smoothness and hard- ne~ of the mica or clay surface probably ~eates a different perturbation of solvent than is effected by the relatively flexible IFonPS that make up most lipids and large molecules. Pashley has also found many instances of 3-10 Jkngrtrtgm exponential decay which is interpre- ted as due to 'secondary' hydration of ions adsorbed to the mica surface [80,81]. Correlation with the clay swell- ing measurements is good, once account is taken of differences in definition of the "zero' contact distance.
We have already men~oncd the osmotic stress mea- surements of forces between DNA molecules [68,82|; one should mention as well similar force determinations on polysaccharides [831. We note again the work on oxyethylene surfactants that seem to be dominated by undulatory repulsions between hydrated bilayers [69,'/0] and our recent mcasu~en~nts with charged dibexade- cyldimethylamine acetate~ that show strong exponen- tially growing forces at less than 11 llng.stribms sep- aration much as some synthetic phosphatidykthanola- mines. The surface hydration of such bilayers has been well recognized by Ninlmm and Evans and collabura- tots for the many ways in which it influences lipid polymorphism [U,S~].
We have written elsewhere of the relevance of hydra- tion repulsion to bilayer fusion processes [86,87]. Forces measured between natural nerve myelin strongly resem- ble those seen between phospholipids although the cell surface is likely to be a far more complicated structure [88]. We will forego the temptation here to list the many
0iological phenomena that may relate to the hydration properties of molecular and membrane surfaces.
There have been several reports of a long-range "hydrophobic' attraction detected in the SFA between mica surfaces coated with monolayers whose hydro- carbon chains face out onto the w~ter region (e.g., Refs. 89 and 90 and references thereiLt). This force has been detected to some 900 ~ 8 s t r t ~ s separation and shows exponential decay rates up to 160 lngslr~nas [90]. Re- cent observations and arguments suggest the improb- ability of a solvent-mediated force of this range [90].
Much effort has been spent to develop a satisfactory theory of hydration. In lipid systems, difficulties are compounded by the several phenomena affectir$ surface hydration. Bilayer undulation, lateral compres.:.bility and deformation, polar group packing and rearrange- merit, all no doubt contribute to the wide range of for~e decay rates and works of dehydration that emerge in the comparisons presented here and debated in the current literature.
Why 'hydration" at all?. Essentially because of the work encountered in brlngin$ t o g ~ neutral bilayers in distilled water or low salt buffers. Added salt scents to make relatively little difference except at molar con- centrations [9t]. Charged bilayers do interact in ways that suggest salt-screened electrostatic double layers, but only at distam:es greater than where strong forces are encountered between neutral bilayers. At shorter distances (~ 20 L n ~ ) charged bilayer repuhion usually resembles that between neutral phospbulipid bilayers [55].
So, at the root level, a 'hydration' or 'dehydration" force implies a work of removal of water from hetwegn membrane or molecular surfaces. One could include in that work any steric forces of polar groups or of entire undulating bilayers, specific arrangements of polar groups that enable attraction as well as repulsion, and actual adsorption of water to the membrane polar groups. It is not clear when any of these factors stands out so clearly as to be distinctly identified. What is clear, though, is that it has not been possible to rational- ize measured forces with any theory that neglects the structure of the intervening solvent.
For simplicity we still favor the approach originally proposed by Marcelja and coworkers [92]. A polar surface will perturb aquenus solvent just next to it; and the propagation of this perturbation by solvent-solvent interactions mediates a force that extends, with a solvent-characteristic length, over many solvent layers. The strength of interaction was seen as a function of the perturbing strength of the surface, while its exponential decay was a charaett'Tislic of the intervening solvent. The original formulation spoke in terms of an order

368
parameter of undetermined type. Gruen and Marcelja [93,94} emphasized the importance of water polariza- tion, while later studies by Kjellander and Marcelja [95] examined the possibility of H-bond rearrangement within the water solvent or of the coordination of water molecules. The formulation of Ruckenstein and Schiby [96] emphasized the importance of surface polarization and water dipole interactions.
Cevc and coworkers [97,98] have argued for recobqi- lion of a hydration potential, a measure of th," p~l~.~:- ing or hydrating power of polar groups, rather than ~ fixed value for the operative order parameter at the hydrating surface. This idea of a potential has been developed into an effective surface polarity, a function of polar group ionization, methylation or other surface parameters, that is responsible for reorganizing boundary water [99.100]. It has been possible to create a self-consistent model allowing a near-quantitative ex- planation of a large body of data on phase transitions [101,50]. Much of this material has been reviewed re- cently in some detail [99]. Simon and Mclntosh [102] have argued recently that the surface potential, mea- sured across phospholipid monolayers in presumed equilibrium with free multilayers, is the organizing potential that would fit into the Cevc et al. formalism. Since dipole potentials can be inferred from bilayer transport measurements, it seems worthwhile investigat- ing this claim by direct comparison.
Kornyshev et al. [103] use a continuum dielextric formalism with a non-local response to rationali~e the decay of hydration forces. In recent work, they have succeeded in coupling solvent correlation length with the lattice constant of interacting surfaces. The result is a net decay length that can be different for different surfaces interacting across the same solvent material [104]. Quite recently, Attard and Batchelor [105] have proposed a model that recognizes the progressive ent- ropy loss (or enthalpy gain) of the surface-perturbed water H-bond network. Decay lengths reflect surface boundary conditions as well as solvent lattice lengths to allow some variation in decay rate. This approach em- phasizes the non-electrostatic nature of the solvent parameter that mediates h3dration forces.
Indeed, the continuous i - 3 &ngstr6m range of mea- sured decay rates for forces between phospholipid bi- layers suggests that a single-decay picture is either inad- equate or results from being combined with other forces. Forces decaying exponentially with approx. 3 ~mgstrOm decay constants have been seen much n~ore consistently between linear polyelectrolytes [82]. Perhaps in these systems they can be more fruitfully analyzed theoreti- cally.
Computer simulations of H-bonding water near polar surfaces [95] do not show the kind of extended decay of perturbation expected from the original Marceija for- malism or presumably from later H-bond models. But
this may be due simply to the fact that these simula- tions are accurate to some 0.5 kcal/mol of solvent (e.g., Ref. 106) while the perturbations of water that seem to be important are as small as approx. I cal/mol (Fig. 13). Indeed, the essence of these forces, and the reason they were not expected from probes of water itself, is that they come from virtually indetectable perturbations of solvent summed over large numbers of water mole- cules. One can obtain some idea of the difficulty of m~elling hydration forces by looking at the force distance curve in chemical rather than physical units. The right hand scale in Fig. 13 shows the applied osmotic stress in units of small calories. It is im- mediately clear that the pressures over which forces are observed correspond to perturbations that are less than thermal energy ( ~ 600 cal/mol) on most of the inter- venin8 water molecules.
Mclntosh and coworkers have suggested from data on eggPC that there is an additional upward break in the pressure vs. spacing curve that is due to steric repulsion between bilayers that have less than approx. 10 water molecules per PC [107l. Such an upward break is not seen in the PC data processed as we have done here. Its appearance depends heavily on the defmition of bilayer thickness. Should one expect interactions between hydrated polar species to be separable into hydration and steric components when the polar group conformations will always involve their associated water?. Or does hydration repulsion combine both such interactions inasmuch as one expects continuously in- creased polar group restrictions from the very first steps of dehydration?
XIII. Hydration attraction?
in their review of structure in ordered phospbolipid phases, Hauser [10g] made clear the intricate pattern of hydrogen bonds among the phospholipid polar groups and their hydrating waters. These patterns are expected among phospholipids, such as certain PEs that take up relatively little water compared to l ~ s or to charged species [109,110]. Can the 8teat strength of adhesion in these systems (Table I) be explained solely in terms of weakened hydration repulsion to allow a relatively strong van der Waals attraction? Or can solvent restruc- turing, thought to cause repulsion between hydrating surfaces, also mediate attraction between laterally ordered surfaces?
As noted above, multilayers of PE as a class tend to imbibe less water than PCs. Still, there is a larger range in the amount of uptake, natural PEs with heteroge- neous chains, such as eggPE, swell the most. Remarka- bly even one methylation or the addition of methylated species to a bilayer will lead to sudden swelling of the multilayer lattice (Fig. 5). if one relies only on average properties of the bilayer surface, it is hard to see how a

369
generalized hydration repulsion and van der Waals force cause such different results with chemically similar surfaces.
However, the same Marcelja order-parameter formu- lation that describes hydration repulsion between like surfaces will also predict attraction between surfaces of opposite polarizing tendencies. Indeed, this formalism ha,~ been applied to the long-range attraction observed between DNA double helices. There, a characteristic 3 ~mgstrOm exponentially decaying repulsion, much more cleanly defined than that seen among lipids, which becomes a 1.5 ]~ decay when DNA binds certam poly- valent cations. The shift in decay length is characteristic of the Marcelja model rederived for ordered heteroge- neot, s surfaces.
We have suggested elsewhere [35l that the same kind ~f combined hydration repulsion and attraction might explain the shortened decay rate of repulsion between poorly swelfing PEs such as POPE and that a solvent-structure-mediated attraction might explain the anomalously high attraction seen in these cases [36,52].
One should also be aware of a growing fiterature on attractive forces that will occur between surfaces of mutually orienting dipoles. Several models have recently appeared [112-114] using classical electrostatics to for- mulate a dipolar fluctuation force appropriate to polar zwitterions attached near a dielectric interface.
XlV. Condmkxu
In a broad sense, any exertion to remove water is a form of hydration (or dehydration) force. One has grown accustomed to using 'hydration force' for that part of the exertion due to perturbation of water structure by the membrane or molecular surface. From this perspec- tive it is p .uz~l/ng why neutral bilayers will repel at an approx. 20 A separation. But membrane undulation, polar group steric factors, electrostatic forces, and even van der Waah attraction might also contribute to the effort of dehydration. The real problem is to determine the distinguishing features, relative importance and in- terplay of these factors in what we have empirically called 'hydration forces'. A solution to the problem is impeded by many experimental uncertainties intrinsic to the structural disorder of most phospholipid fiquid crystalline systems.
in phospholipid crystals where such disorder does not exist, X-ray crystallographic determinations show an intricate arrangement of polar groups with pnsitive and negative charges neatly matched between facing bilayers, an intricate set of hydrogen bonds amo,g lipid zwittedons and the few included water molecules (sceo for example, Refs. 108 and 115). But most lipid species under most aqueous conditions do not form such dehy- drated crystals. Apparently these precise arrangements of polar groups do not occur with such low energy as to
create a significant driving force for crystal formation: a pre-existing order in the rest of the bilayer seems to he necessary. In fact most systems are driven to hydrate.
The simplest measure of hydration, maximum water uptake by neutral phospholipidso shows that disruptions of bilayer order - from double bonds in the hydro- carbon chain, from heterogeneity of chain type, from chain melting, from bulky methyl groups on polar amines - all seem to increase the uptake of water, to drive bilayers from crystalline arrangements. Thee is kind of synergy in this drive. Disorder in the lipid causes water uptake by disrupted polar groups that concomitantly loosens bilayer structure. We find it re- markable that the equivalent molar concentration of zwitterions, even at full bilayer swelfing, is far greater than the saturating solution concentration of these same polar groups existing as pure unattached solutes. But when they are attached to non-polar hydrocarbon chains, these closely packed polar groups virtually never precipitate into crystalfine ordered arrays. The natural tension between the hydrophilic and hydrophobic parts keeps the polar groups themselves poised between pre- cipitation and dissolution.
However, to go further, to describe the physical forces that swell the space between bilayers, one must rely heavily on definitions of bilayer thickness and separation. Difficulties are especially severe at low levels of hydration. Just as there is no mathematically ideal interface to define the progressive change from lipid to water regions, so there is no way to state boundaries without some idealiTation or ancillary ~ t i o n . The progressive work of hydration, a pressure times a change in volume, is thermodynamically well-defined. Molecu- lar dimensions are not. Different definitions - construc- tions based on very low resolution electron density maps with additional assumptions from models, or defi- nitions based primmily on the wate. :o lipid mass - lead to different comparative hydration strengths and even different features of the pressure vs. distance c u r v e s .
One such qualitative difference in feature has evoked the proposal of molecular steric interactions of polar groups. These are su~cstcd by an upward break in the pressure vs. separation at leu than 10 lnptr0ms sew aration. But such a break is far more evident from low resolution electron density construction than from a mass average construction which so far suggests hardly any break at all. Clearly this region of high mmotic stress and very limited hydration merits far more sttidy using both forms of data analysis, If this thermody- namic-structur-,d work could be coupled with better probes of changes in polar group order - by neutron diffraction or by nuclear magnetic resonance, or per. haps by more precise analysis of thermal transitions - then the action of polar group steric forces would be more systematically understood.

370
At greater separations between bilayers, where polar group crowding between bilayers is no longer expected, there is still a question of how much of the observed hydration repulsion is due to straight affinity of water for the polar interface and to what extent that ~-derly- ing force is enhanced by forces of membrarl~ un~,la- tion. If means could be devised to monitor membrane disorder, as has been possible for forces between poly- electrolytes, then one would have a dearer idea of the magnitude of the underlying hydration itself.
in any event, there are questions about the molecular basis of hydration, zbout the mechanism by which water ~,iil be perturbed some layers from the surface. And of all the possible c,~ntributions to total hydration - do differences in total water uptake reflect differences in mechanisms of attraction between different kinds of polar layers? Or are there simply differences in strengths of repulsion with broadly similar van der Waals attrac- tive forces.'? Does the presence of a net electrostatic charge that can drive bilayers to inde.mitely large sep- aration also affect surface-bound water to change surface hydration forces? Does the exclusion of solutes (small sugars or large polymers) that are unable to compete for water near the bilayer interface create thermodynami- cally different conditions for bilayer stability?
XV. Appendix
XV-A. Measuring bilayer thickness and separation
We describe the steps in determining bilayer thick- heSS and separation and, from osmotic stress, the inter- bilayer force.
(1) Fig. 16 shows an example of the relation between the experimentally measured X-ray repeat spacing of the spontaneously formed multilammelar structure, d, and the weight percent lipid, c, in the samples de- termined by gravimetricaily adding water to SOPC.
(2) On the basis of the densities of lipid and of water, c can be converted to the volume of water per lipid molecule Vw, the volume fraction of lipid in the same 0, and the area A available per lipid molecule on one plane perpendicular to the axis of the lamellar repeat.
0 = I/(I +(I - c).v,/c.~g)
A -- 2.]OZa. M.t,i/O.d.No
V , f ( t -O) .A .d /2
MWj is ".he molecular weight of the lipid, N O is Avogadro's number and v I and K~ are the partial specific volumes of water and phospholipid, respectively.
These structural parameters are independent of the distribution of the water and lipid within the lamdlar
7o] Oren (A2) 60
50
70'
GO" d
50'
a: 40"
30"
20' d~,
10'
0.1
i i o
• • dp wql0
d l l
o n
e
o
o
o
• | • I - , . , - •
0'.2 0.3 0.4 0.5 0.6 0.7
1-¢ (wt. froct~on water) Fig. 16. Structural panurgters of the lameHar phase framed by SOPC as they vary with water content and determined by X-ray diffraction. (m) d, Itmellar repeat spacing; (G) d t, bilayer ~dclu~ks dc~rmln¢(I ~avimetrically; ([3) dw, biltyer sepmtion; (O) area available per molecule on a plane lgq~'ndicultr to the dim:tion of Itmeiltr ~u i l .
repeat distance d, i.e., are model independent. They are dependent, however, on a good knowledge of the partial specific volumes of the lipid. We have listed in Table IV the values used for the indicated lipids. These are taken from, and are consistent with the measurements and derivations from a number of references listed in Table IV).
Interesting observations emerge from these data. (a) v I for CH z chains in bilayers are 1.05 cm3/g if
frozen and 1.17 if melted, and for hydrocarbon solu- tions are 1.07 and 1.29, respectively. This suggests that when constrained to bilayers the melted hydrocarbon chains have a lower partial volume than when free in solution.
(b) The lower value for melted chains in bilayers is required to give sensible polar group partial volumes. For example, from the measured value for DAG, 1.07, if v~ - 1.17, v~ - 0.745, comparable to the published value of 0.793 for glycerol. This correlation also requires that the C---O groups to be included in the polar group molecular weight.
(c) White et at. [731 have shown that the global partial specific volume of phospholipids does not change over the range of dehydration used to study interbilayer

371
TABLE IV Parffal spt~ific volumes for lipids and their parts (cm3/g) (Refi. in brackets)
Liquid paraffin 1.291116.118] Melted Ig 1.17 [1171 Melted he. t~, PE !.i"/[117] Crsjslidline hc 0.998 l i t7 I, i.07 DiS] C~stalline hc PC 1.05 li18], 1.008, 1.006 Gly-Pc + C - O 0.668 [117]. 0.758 [122]. 0.713 DOi~.
0.768 DPPCm, 0.751 DPPCI Serine-P 0.6601119 I 2.A..ir.>c~k..w3_~ 0.640 [1201 Gly,~rol 0.'/93 [11610.745 DAG. Gly- oE O,Sg~ I11610.67 DMPE. [1161 DP[=C, DMPC. DSPC (gel) 0.94[117 ] DP~ (,l~ o ~ !.01}5 [I 17] ~, lPc (3o" c3 o.ge 1117] DSCP O$ ° C) 1.02 [11'7] DOPC (20 • C) 0.990 DMPE 0.96 11211 DAG 1.07 Synlhelic PEs 0.96-1.021341
forces. This lends credence to the structural parameters and their changes derived using the Luzzati formalism.
Table V provides molecular weights, partial volumes and compre~bilities used to calculate the structural parameters of the lamellar phases of phospholipids.
(3) To pr _o,:~! to define bilayer thickness and sep- aration, assumptions are required about the distribution of water and lipid within the repeat distance d of the multilamellar phase. We describe three methods of doing this.
Using the L,,~ati method, which assumes that the fipid and water pack into completely separate layers containing all and only the single component, d can be partitioned into a layer of lipid of thickness dm(= e . d ) and a layer of water of thickness d . ( = d - dl). Further, a knowledge of the molecular weights and densities of the hydrocarbon and polar parts of the lipid molecule (see Table V) allows the bilayer itself to be divided into hydrocarbon, d~( - e ~ . e . d), and polar group layer, d p ( " d I - dl~ ), thickne:3,~es where
Oil c -- ~[~k- P'kl(~[~gl. tpl)
and MW k is the molecular weight of the hydrocarbon portion of the lipid molecule and i,~ is the partial specific volume of that hydtoratrbon.
Table VII provides the structural parameters and degrees of maximum hydration using this gravimettic method.
An alternative definition of bilayer thickness is used by Mclntosh and Simon [271 and makes use of the elecuon density distribution of the bilayer~ shown schematically in Fig. 3. To the peak-to-peak distance across bilayen, assumed to represent the distance be-
,L. r:
%
%,,
~2 54 56 58 60 62 64 66
' ' d,o 7'8o dso 370
/w per rnolec. le (~3)
Fig. 17. Net integbilayeg ~ r e . P. fo¢ SOPC. is it varies either with water content. V.,, the volume of water peg lipid moleguk or with
hunell~ repeat dtumce, d.
tween polar group phosphates or some fixed position near them, these authogs add an estimated polar group thickness. These alternate approaches make a consider. able difference in the way one estimates the distribution of water around the polar groups, and therefore of bilayer separation and definition of bilayer contact Such differences are illustrated in Table V! for the fully hydrated lamellar phase and for the lamellar phase und,, amder~*.¢ stress. The different definition of bi- layer thickness leads natmatly to the difference in ab- solute values of bilayer separation. However, what is striking is the opposite conclusion one obtains regard- ing the relative bilayer separations under moderate stress. Mclntosh aad Simon would conclude that gel DPPC bilayers are further apart than e n PC bilayers, we would conclude the oppo~te.
Each of these methods ruing X-ray dimensions suffers from too low a structural resolution to define bilayer thickness and separation adequately, and how, conse- quently, they change with dehydration. The latter is important in detenninin$ the hydration force parame- tegs described beklw. Con.u~nently, to determine the
9.
c 7,
c~6, o ..J
%
5 , '~ 0 10 30
ill
cZ,)
Fig. 18. Net interbila1~r p~ssore, P, fix SOP(::, as it varies with inted)iIay~ sepera~a, d,., determined gravimetrically.

372
TABLE V
Molecular weights of the total lipid (MW). its hydrocarbon (MW,,) and of polar (MWt) parts/lipid specific volume (•, cmJ/g), and specific volume of the hydrocarbon port of iAe molecule (v~¢); bilaycr compressibility. K. and b#Tayer thickness, dl. at the osmotic stress of log P .* 7 used to calculate the slructwal parameter$ according to the formula described
MW MW k MWp • v~ K d, at log P - 7
DHDAA POPE 712 433 269 i 1.17 233 42.0 at 7.04 DOPS 832 4/1 361 ] 1.17 SOPC 786 4"/5 311 l 1.17 200 41.2 at 7.08 DGDAG 933 462 471 ] 1.17 200 39.1
POPE/SOPC 9/1 715 444 271 1 1.17 9/! 719 446 273 1 !.17 233 42.0 at 7.06 4/1 729 449 277 1 1.17 2/I 731 454 277 I 1.17 222 41.9 at 7.03 3/2 741 455 286 I 1.17 1/! 749 459 290 I 1.17
DGDAG/SOI~ 45/55 852 469 384 1 1.17 200 39.3 at 7.06 DGDAG/POPE i/I 822 452 370 1 1.17 216 39.2 at 7.05 DOPE/DOPC 3/i 750 471 279 0.99 1.17 200 39
egg PE 733 464 269 I 1.17 200 34.1 at 7.01 Egg PEt 733 464 269 I 1.17 200 37.7 Egg PEt-Me 747 464 283 1 1.17 200 41.3 at 7.03 Egg PEt-Me 2 761 464 297 i 1.17 200 40.8 at 6.99 Eg8 PC 775 464 311 ! 1.17 145 37.7 at 7.03 PC 16-22 800 490 310 I 1.17 145 39
E88 PC/Chol 1/i 1177 851 326 i.03 1.]2 10G0 42.1 DPPC/Chol ! / i 1120 810 310 1.02 1.12 600 43.3 Egg PC/DAG-12.5 787 455 332 I 1.17 14S 37.3
DLPC 621 311 310 0.98 1.17 145 32.2 DMPC-27 677 367 310 0.98 1.17 145 36.4 DPPC-50 733 423 310 I.(X)5 1.17 145 36.7 DOPC 787 471 316 0.99 1.17 145 36.6 DPPC-25 733 423 310 0.94 1.05 tO00 47.2 DSPC 789 473 316 0.94 |.05 10O0 47.8 DPPC/Chol 8/1 772 462 310 0.94 1.05 1000 50.9
changes in lamellar phase dimensions, the indepen- dently measured bilaycr compressibility modulus, K [18], should be applied to the bilayer thicknesses mea- sured by X-ray diffraction. This is illustrated for the gravimetric data using the following procedure, but it could just as well I,c applied to the dimensions derived using electron density profiles.
(4) Fig,. 17 shows the experimentally determined re- lation between the net interbilayer pressure, P, and the repeat spacing, d, of the resultant lameilar phase, again for SOPC. The linear part of the curve can be described by
P - .Do exp( - d/A~)
By reference to the gravimetric data the repeat spac- ing, d, can be translated into the volume of water per
lipid molecule and the relation between P and V, (also shown in Fig. 17) can described by
e - J'o ext~ - v,,/~, )
By reference to the gravimetric data the repeat spac- i n s d, can also be partitioned as described above and again the linear part of the curve described by
P - Po exp( - d . / A # . )
The parameters for these three experimentally de- termincd exponentials for many lipids are shown in Table VIll.
(5) The structural parameters d t and d , for the osmotic stress data which make use of the indepen- dently measured compressibility of the bilayers have then been derived in the following way. First, the bi-

TABLE Vl
st log P - O at Io¢3 P - 7
d d I d . d d! d,,
EsgF~ M and S" 63.2 47.8 15.4 56 49.5 6.5 R and P b 61.9 37 24.9 56 38.5 17.5
DPPC M ~ S 63.3 51.9 11.7 60.5 52 8.5 g and P 63.8 47.1 16.7 60.5 48 12.5
M and S. Mclntosh and Simon; R and P. Rand and Parsegian.
373
layer thickness, die at log P * - 7 is chosen , s ince the water c~ntent is known accurate ly and the compress ib i l - ity o f the bilayer, K , is in the l inear range. Second, the compressibi l i ty modu lus , K d y n e / c m , measured by Evans and N e e d h a m [18] is used to calculate bi layer thickness, dt , and separat ion, d , , - d - d t , for all t he osmot ic s t ress exper imenta l po in t s where log P < 8. T h e
actual va]ues o f dl* a n d K used for a variety o f l ipids are shown in Table V.
K is the fractional change in area for a change in bi layer tension, T, a n d is equal 1o A ? ' / , ~ A / A o.
TABLE VII
Structural parwneters of the/ulb, ky~attd lamtllar pltases m dt~ntcl m tA~s apper~x and d e t e ~ t c l ~p~mttrically
d o Co ,40 dr= d,~ dho dfo F,~ V=o/PE
DDPE 45.8 DAPE $7.3 DLPE 46.1 POPE 53.2 DOPS 53.5 SOPC 64.4 DGDG 53.2
POPE/SOPC 9/1 54.5 9/1 56.4 4/1 59.9 2/1 61.2 3/'2 63.3 1/I 63.8
DOPE 52 DOPE-Me 61 DOPE-Meq 62 DOI~ 61
DGDAG/SOI~ 45/55 57.2
DGDAG/POPE 1/1 54
DOPE/DOPC 3/1 58
F-4111 PE 5Z9 PEt 52
F418 PEt.Me 61.8 E£8 PEt-Me2 63.1 E88 PC 61.9 PC 1622 63.5
F418 PC/Chef 1/1 65.5 DPPC/C'hel ! /1 66 E88 PC/DAG-IZ5 63 DLPC 59 DMPC-27 62.2 DPPC.50 67 DOPC 64 DPPC-25 63.8 DSPC 67.3 DPPC/Chel 8/ I 8O
0.72 55 32.5 13.3 365 365 0.79 58 47.3 10 290 290
270 0.78 56 41.3 1 !.7 30.1 ! !.2 328 328 0.74 70 39.6 13.9 26.2 13.4 485 361 0.60 66 39 26 27.6 !1.4 8~8 742 0.73 80 38.6 14.6 224 16.2 5S6 335
0.76 38 41.2 13.3 29.9 11.3 383 380 0.73 58 41.2 15.2 29.9 11.3 441 435 0.69 58 41.3 18.6 29.8 11.5 543 527 0.68 59 41.3 19.9 30.0 1 !.3 585 568 0.6.5 60 41.1 22.2 29.5 11.6 66.5 625 0.64 61 40.8 23 29.3 11.5 702 651
0.70 65 37 1~ 487 487 0.63 62 39 22 682 648 0.60 66 38 25 825 747 0.59 70 36 24 8,40 727
0.68 73 38.9 18.3 25. ! 13.8 665 466
0.72 70 38.9 15.1 25.0 13.9 530 385
0.65 66 ~7.7 20.3 28.0 9.7 671 647
0.61 75 32.3 20.5 23.9 8.4 766 766 0.70 66 36.5 15.5 27.0 9.5 517 517 0.60 67 37.1 24.7 27.0 10.1 827 786 0.58 70 36.3 26.8 25.9 10.4 938 1150 0.57 74 35.1 26.8 24.6 10.5 992 0.59 71 37.5 26 26.9 10.6 920 798
0.62 96 40.3 25.2 31.7 8.6 1210 0.57 97 37.7 28.3 29.9 7.8 1365 i184 0.54 87 34.2 28.8 24.1 10.1 1253 9"71 0.51 69 30 29 17.9 12.1 996 ~ 4 0..56 6.5 34.5 27.7 22.3 12.2 903 7114 0.51 71 34.2 32.8 23.0 ! 1.2 1168 1014 0.50 82 32 32 22.6 9.4 1312 ! ! 17 0.69 52 44.2 19.6 28.5 15.7 513 445 0.68 55 45.5 21.8 30.5 15.0 596 50'7 0.56 54 45 35 30.1 14.9 9d5 820

374
TABLE ViII
Expmlemial hydration force parameters describing the btlayer repulsive force using (a) log P vs. ~ (b) log P vs. V,,, (c) log P us. dw grauimetric and (d) log P VS. d w compressibility :7~djusted
Lipid Gray. (d) Gray. (vol) Gray. (d,) Comp. (d,)
,~d log Po ~ log Po ~,~,. Io8 Po ~,, log Po POPE 0.64 17.64 24.9 12.05 0.84 12.37 0.82 12.49 DOPS SOP(: 1.55 23.19 81.9 9.8 2.29 10.14 1.98 10.51 DGDG i.38 23.35 73.6 10.03 1.76 10.13 1.67 10.27
POPE/SOPC 19/I 9/I 0.94 32.12 36.8 11.04 !.24 ! 1.24 1.26 11.16 4/I 2/! !.6 22.29 65.8 9.84 2.09 10.06 2.08 10.03 3/2 I / l
DC.DG/SOPC 45/$S 1.36 24.46 68.9 10.54 1.81 10.72 1.84 10.6 DGDG/POPE 1/i 1.25 25.23 61.1 10.33 1.64 10.55 1.72 10.3 DOPE/DOPC 3/I 1.48 22.36 70 9.56 2.09 9.75 1.'/8 10.19
egg PE 0.73 37.26 85.1 10.09 2.06 10.58 1.32 12.45 egg PEt 0.68 39.41 78.9 9.24 2.0g 9.65 1.08 12.3 egg PEt-Me 1.36 24.48 78.9 9.21 2.33 9.46 1.76 10.28 egg PEt-Me2 1.47 23.35 85.1 9.33 2.38 9.65 1.83 10.36 egg PC (RP) * 1.4 24.15 98.6 9.51 2.65 9.76 2.07 10.58 (MS) b 2.0 PC 16-22 1.74 20.58 98.6 9.27 2.~3 9.58 2.1 10.09
egg PC/Chol i/1 1.07 30.94 72.3 11.97 1.40 12.6 1.08 13.8 DPPC/Chol ! / ! 1.45 24.83 180.8 8.72 3.20 9.19 1.53 11.54 egg PC/DAG-12.5 1.87 20 160.7 9.18 3.17 9.62 2.37 t0.37
DLPC !.6 20.4 96.4 g.56 2.60 9.72 2.04 10.56 DMPC-27 1.96 18.92 90.4 9.52 2.60 9.94 2.16 10.49 DPPC-.~0 1.98 19.4 103.3 9.78 2.55 10.38 2.13 11 DOPC 1.63 21.61 120.6 9.25 2.90 9.6 2.11 10.63 DPPC-25 (RP) 1.04 32.3~ 53.6 9.63 2.00 9.83 1.07 12.3 (MS) 1.4
DSPC 1.19 30.67 66.8 9.79 2.29 10.17 1.26 12.93 DPPC/Chol 8/1 1.98 21.93 88.6 8.9 3.00 9.4/ 2 10.74
' Values calculated according to the method of Rand and Parse~. *' Values calculated according to the method of Mclntosh and Simon.
For osmotic stress, changes from P* to P cause changes in lateral tension d T - - ( P - P * ) . ~ . The fractional change in area A A / A o = - d d t / d ~ •, ( d~ - d t ) / d ~ for constant lipid molecular volume. Hence d l / d ( = 1 + ( P - P * / K ) . dw and, since d = dj + dw then d , / d ( w ( K + ( P - P * ) . d ) / ( K + ( P - P * ) . d ( ) froln which can be derived from the new d and P, the new dt and other structural parameters.
We have shown that the derived parameters are independent of the chosen osmotic pressure for log P* < 7.5.
Fig. 18 shows the relation between log P and d~ derived this way. As a descriptor of the data, the linear part of the log P vs dw curves is then best fitted to e = Po e x p ( - d , J X c ) . These are shown in Table VIII for a number of lipid species.
By extrapolating to low stress, the limiting value of d I, and, therefrom, all the structural parameters describ- ing the lamellar phase in excess water, can be de- termined. They are within error of the 8ravimetricaily derived data. Since they come from the preferred method for deliving |amellar phase dimensions and hydration force parameters, these results are shown in Table lI.
Acknowledgements
One of the unexpected pleasures of working on this s,~bject is our interaction with many people who have now become drawn to it and whose studies figured so strongly in the work cited here. We would esp~ial ly like to thank the following for their help and comments while preparia~ this review; Gregor Cevc, Sol Gruner,

375
Roger Horn, Tom Mclntosh, Sid Simon and Gordon Tiddy. This work could not have been done without the expert support of Nola Fuller and the financial backing, for R.P.R., of the Natural Sciences and Enginecnng Research Council of Canada.
R d m
1 Chmie. J.S., Goodman. J.F. and Symons. P.C. (1967) Nature 216. 1203-1204.
2 Churaev, N.V. and Derjasuin. B.V. (1985) J. Coll. Inted. Sci. 103. 542-553.
3 Barclay, L.M. and OttewilL R.H. (1970) Spec. Discuss. Faraday Sec. 1, 138-147.
4 De~asuin, B.V. amd Churaev, N.V. (1986) in Fluid Interracial Pheaomena (Croxtoa, C.A., cd.), pp. 663-738, John Wik'y & Son& Chichmmr.
5 [ ~ a ~ f l , B.V., ChufIcV, N.V. ~ld Miller. V.M. (1987) Surface Forc~ Conmlumts Bureau, New York.
6 Luu.ati. V. a4nd Hu.uoe. F. (1962) J. Cell. Biol. 12, 207-219. 7 Small. D.M. and Bourlp~ M. (1966) Mol. Crystals 1,541-$61. 8 Ptrsegi~, V.A. 0967) J. Theor. Biol. 15, ./0-74. 9 lzYc, vz.. D.M., Rand, P..P. and Pmsc6ian. V.A. (1976) Nature
259, 601-603. I0 LeNeveu, D.M.. RamlL R.P.. Parsegian, V.A. aad GinsdL D.
(1977) Biophys. J. 18, 2~-230. I1 Parsellan, V.A., Fuller, N.L and Rand, R.P. (1979) Proc. Natl.
Acad. Sci. USA 76. 2Z'd)-2./54. 12 P ~ , V.A., Rand, R.P., Fuller, N.L. and Rau, D.C. (1986)
Method, ~ . 127, 400-416. 13 Is:aelar,,h~i5. J.N. and Adams, G.E. (1978) J. CheM. So¢. Faraday
Trims 1, 74, 975-1001. 14 Isrtdachvi5, J. aad MmlrL J. (1986) Methods E . n ~ L 127,
353-360. 15 Kwok, R. and Evam, E. (1981) Biophys. J. 35, 637-65Z 16 Evans, E.A. (1980) Bioph~m. J. 31,425--432. 17 Evans, E. and Metcalfe, M. (1984) Biophys. J. 46, 423-425. 18 Evans, F.. and Needlmm, D. (1957) J. Phys. Chem. 91.4219-4228. 19 Grunt, S.M.. Pm'sqian, V.A. and Rmut, R.P. (1986) Discuss.
Chem. Soc. 81, 29-37. 20 Evans, E.A. and Needham, D. (1%7) in PhDics of Amphiphil
laye~ (Mmmi~, J~ ~ D. and Boccank N, ed~), pp. 1"/8-198, SlxinSef-Vedal. ~rlin.
21 Evans, E. and Kwok, It. (1982) Biochemistry 21, 4874-4879. 22 Evans, E. mul Necdha~ D. (1986) Faraday Discuss. Chem. SOc.
81, 267-280. 23 ~ V. (19611) in Biololical ~ (Chapman, D., ed.),
pp. 71-123, Academ~ Press, New York. 24 Evans, LA. and Skdak, R. (1980) in Mechanics and Thennody-
nam~ of Biomembrmes. CRC ~ Boca P.atou, 25 Jmnimk~ MJ., Small, D.M. and Shipley, G.G. (1979) J. Biol.
Chem, 254, 6068-0078. 26 Lewi~ B.A. aad Engelman, D.M. (1983) Mol. Biol. 166, 211-217. 27 Mc la t~ . TJ. and Simon. S.A. (1986) Bincbendst-,'y 25,
40.58-4(X~6. 28 Horn, R. (1984) Biochin~ Binphys. Acta 778, 224-228. 29 Marra, J. (19~5) J. CoIL lnterf. Sci. 107, 446-45& 30 Dcrjqp~ B.V. (1934) Kolloid-Z. 69, 155. 31 Marra, J. (1986) Biophys, J. 50. 81~-8D. 32 Horn, R.G.0 Imdachvili, J.N., Marr~ J., Panellian, V.A. and
Rsnd, R.P. (1988) Bi~hys. J. 54, 118.5-1187. 33 Raa~ R.P. (1981) Annu. Rev. Biolphys. Biocns. 10, 277-314. 34 ~ J.M, Cevc. G, Kaye. R.D. and Martin, D. (1984)
Biochen~u~ 23, 2634-2644.
",5 Se~don. J.M. Harin~ K. and Marsh, D. (1983) J. Biol. Chem. 258. 3850-38H.
36 Rand, R.P.. Fuller, N.L.. Parsegiau, V.A. and Rau. D.C. (1989} Biochemistns'. in press.
37 Rcf. deleted. 3g Lis. LJ.. McAlis;er. M., Fuller. N.L.. Rand, R.P. and Parsegian.
V.A. (1982} Biopl~s. J. 37, 6~7-666. 39 Gmner. S.M.. "rate, M.W.. Kirk. G.L. So. P.T.C., Turner, D.C.,
Keanc, D.T., Tileock. C.P$. and Cullls. P.R. 0988) Biochemi.qv/ 27, 2853-2866.
40 Cevc. G. (1988) BeT Bumeajadl~hafl Phys. Chem.. in pn~. 41 Jendrasiak. G.L and Meadibi~ J.C. (1976) Binchim. Biophys.
Acta 42d. 149-158. 42 Das, S. and Raad, R.P. (1986) Biochem~ty 7.5. 2882-2889. 43 Rand, R.P., Panqlia~ V.A., Hemy. J.A.C, Lb, I I . and McAlis-
ter, M. (1980) Can. J. Biechem. 58, ~9-96& 44 Mclntosh, T.J~ Masid. A.D. tad Simon. S.A. (1988) Biochem-
istv/28. 17-25. 45 Rand, R.P. and Luzza~ V. 0968} Diophys. J. 8, 12.5-137. 46 Vaughan, DJ. and Keou~ K.M. (1974) FEBS Leu. 47, 158-161. 47 Mulukutla, S. and Shipley, G.G. (19S4) Biochemistry 23.
2514-2519. 48 Gukibran<L L, Joa.tum. B. sad Weaner,Atom, H. (1982) J. Coll.
InL Sci. 89, 532-541. 49 Goldstein. I1LE. lad L4nbk~r, (1988) S. Phys. Rcv. Loll 16.
2113-216 50 Cove, G. and M4un~ D. (1985) Biophys. J. 47° 21o31. 51 Cev¢, G., Seddo~ J.M. and Marsh, D. (1986) Discuss. Chem.
Soc. 81.179-189. 52 Mm~ J. aad Istadachvili. J.N. (1985) Biochemistry 24,
4608-4618. 53 Manu, $. (1988) J. CoIL latcrf. ScL 109, 11-20. 54 Cowley. A.C.. Fuller. N.L. Rand, R.P. aad Panelljan. V.A.
(1978) Bioclmnbt~ 17, 31693168. 55 Loosk'y-Millmaa, M.E., ~ R.P. md ~ , V.A. (1982)
Binph~ J. 4o. 22t -252. 56 Paddey, R.M~ McGuilpa. P.M.. Niah4u~ S.W., Brady. J. and
Evans, D.F. (1906) J. Phys. Chem. 90. 1637-1642. 57 Ponh, A., NewtcL C., PmSbom, w. aad ~ D.
(1979) ~ 18, 780-790. 58 Feigenson, G.W. (1986) ~ 25. 5819-5825. 59 Flmin¢ K.I. a~l F_',m~'m_ " ~ G.W. (1987) Bi(xbanblry 26,
1757-1768. 60 Eise~bers, M, Gmudfi. 1"., Rkcio, T. aad M c L ~ i n , S. (1979)
l~ocl~,mistry 18, 5213--5223. 61 fanqian, VJh. ~ Rand, R.P. (1983) Ann. N.Y. Acad. Sci. 416,
1-12. 62 Guldbrand, L. ~ L Weauenuun, H. mid Lins~ P.
(1984) J. Chem. Phy~ 80° 2221-22211. 63 Kjdland~, B. a~l Man:alia. S. (19~) Chem. Scdi~ 25. l 12-1t6. 64 Hdfrich, W. (1978) Z Natm'lrmsch. 33a, 305-315. 65 Somette, D. md ~ , N. (1985) J. Chem. phys, 45, 265. 66 Evans, E. and ~ V.A. (1989) Prec. NaO. Acad. Sci. 83,
7132-7136. 67 Sufinya, C.R., Roox. D.. Smith. G.S., ~ S.IC. Dimon, P,
Clark, N.A. and IkUocq, A.M. (1986) Phys. Rev. Lett. 57, 2718-2721.
68 Podgorn~ R., Rau, D.C. and ~ V.A. (1988) MacTomole- cules 22, 1780-17~.
69 CarvelL M, 1.14dl, D.G, Lyle, !.(3. and Tkldy, GJ. (19~) Fara- day ~ Chem. Sec. 81, 223-237.
70 Adam. C.G.. Dunlat, LA., Low~, M.R. and T, ddy, GJ.T. (1984) J. Chem. SOc. Faraday Tram. I 80, 789-001.
71 J ~ , G.L and Hasty, J.H. (1974) Biochim. Biophys. Acla 33"/. 79-91.
72 Torb~ J. and Wilkin~ M.H.F. (1976) J. ~ . Biol.. 62, 447-458.

376
73 White, S.H., Jacobs, .~E. and ,~ng, G.I. (1987) Biophys. J. 52, 663 -666.
74 Smith, G.S., Safinya, C.R., Roux, D. and Clark, N. (1987) Mol. Crystals and Liquid Crystals 144, 235-255.
75 Barouch, E..Malijevic, E. and Parsegian. V.A. (1986) J. Chem. Society 82. 2801-2809.
76 Evans, F-..A. and Parsegian, V.A. (1983) Ann. N.Y. Acld. Sci. 416, 13-33.
77 Bradley, W.F., Grim, R.F.. and Clark, G.L. (1937) 7-.. lCdist. 97, 216.
78 Viani, B.E, Low, P.F. and Roth, C.B. (1982) J. Coll. into|. S~i. 96, 229-244.
79 Israelachvill, J.N. (1987) Acc. Chem. Res. 20, 415-421. 80 Pashley, R.M. (1981) J. Coll. Inter[ Sci. 80, 153-162. 81 Pashley, ILM. (1981) J. Coll. lmerf. Sci. 83, 531. 82 Ran, D.C., Lee, B.K. and Parsegian, V.A. (1984) Proc. Natl.
Acad. Sci. USA 81, 2621-262.5. 83 Ran, D.C. and Parsegian, V.A. (1987) Biophys. J. 51, 503. 84 Evans. D.F. (1988) Lanl~oir 4, 3-12. 85 Evans, D.F. and Ninhsm, B.W. (1986) J. phys. Chem. 90, 226. 86 Rand, R.P. and Parsegian, V.A. 91986) Annu. Rev. Physiol. 48,
201-212. 87 Parseglan" V.A. and Rand, R.P. (1989) in Cellular Membrane
Fusion. (Wilschm, J. and Hoeckstra, D., eds.), Max'col Ddtker, New York.
88 Rand, FLP., Fuller, N.L. and Us, LJ. (1979) Nature 279, 258-260. 89 Israclschvili, J. and Ptshk'y, R. (1982) Nature (London) 300, 341. 90 Christenson. H.K. and Claes.u3n, P.M. 91988) Science 239,
390-392. 91 Afza], S., Tesler, WJ., Blessins, S.K., Collins, S.K. and Lis, LJ.
(1984) J. Coll. Int. Sci. 97, 303-307. 92 Marcelja, S. and 17atdic, N. (1976) Chem. phys. Lett. 42, 129-130. 93 Gruen, D.W.R. and Marcelja, S. (1983) J. Chem. SOC. Trans.
Faraday il 79, 211-223. 94 Gruen, D.WJ. and Marcelja, S. (1983) J. Chem. So:. Trans.
Faraday I1 79, 2.2.5-242. 95 Kjellander, R. and Marcelja, S. (1985) Chem. phys. Lett. 120,
393-396. 96 Schiby, D. and Ruckanstein, E. (1983) Chem. Phys. Lert. 95,
435-438.
97 Cevc. G.0 Podsomlk, R. and Zeks, B. (1982) Chem. Phys. Lett. 91,193-196.
98 Cevc, G. (1985) Chem. Scfip;a 25, %-I07. 99 Cevc, G. and Marsh, D. (1987) Phospholipid Bilayers- Physical
Pnnciples and Models. John Wiley and ~ns , New York. 100 C, eve, G. (1989) J. Phys. (submitted). 101 Cevc, O. (1987) Biochemistry 26, 6305-6310. 102 Simon S.A., Mclntosb, J. and Mal~l, A.D. (1988) J. Colloid
Interface Sci. 126, 74-83. 103 Kornyshev. A.A. (1985) Chem. Scripts 25, 63-66. 104 Dzhlvlkhldze, P.G., Komyshev, A.A. and Levadny. V.G. (lq88)
II Nuovo Cimento 10, 627-652. 105 Afford, P. and Batchelor, M.T. (1988) Chem. Phys. Left. 149,
206-211. 106 Jotgensen" W.L., Gao, J. and Ravinolum, C. (1985) J. Phys.
Chem. 89, 3470-3473. 107 Mclntosh, TJ., Magid, A.D. and Simon, S.A. (1988) Biochem-
htry 26, 7325-7332. 108 Hauser, H,, Pasher, I., Pearson, R.H. an~ Sundcll, S. (1981)
Biochim. Biophys. Acta 650, 21-51. 109 Kolbcr, M.A. and Hayne~ D.H. (1979) J.Mcmbr. Biol. 48, 95-114. 110 Melntosh, TJ. and Simon, S.A. (1986) Biochemislry 25,
4948-4952. 111 Parsesian" V.A., Rand, R.P. and Rau, D.C. (1985) Chem. Scripta
25, 28-31. 112 Kjellander, R. (1984) J. Chem. Soc. Faraday Trans. I! 80, 1323. 113 Podl;ornik, R. (1988)J. ~ . Soc. Faraday Trans. II 84, 61 !-631. 114 Attmd, P., Mitchell, DJ. and Ninlmm, B. (1988) Biophys. J. 53,
457-460. 115 Small, D.M. (1986} The Physical Chemistry of Lipids. Handbook
of lipid Research. Plenum Press, New York. 116 Handbc)ok of Physics and Chemituy (1967) 47, c75. !17 Nagle, J.F. and Wilkinson, D.A. (1978) Biophys. J. 23, 159-175. !!8 Templin, P.R. (1956) Ind. Enlinocnn B Chem. 48, !~4-161. 119 Putkey, E. and Sundmdingan, M. (1970) Acta. Cryst B. 26,
782-789. 120 Kntut, J. (1961) Acts Cryst. 14, !146-1152. 121 Wilkinson, D.A. and Nqlle, J.F. (1981) Biochemisu.y 20,187-192. 122 Abrahamsson, S. and Pascher, !. (!g~6) Acla Cryst. 21, 79-87.