Beas River Basin - Kullu District - Department of Environment ...
199
-
Upload
khangminh22 -
Category
Documents
-
view
1 -
download
0
Transcript of Beas River Basin - Kullu District - Department of Environment ...
A Village Level Climate Change Vulnerability Analysis and Indicative Adaptation Plan Framework
Beas River Basin – District Kullu Himachal Pradesh
i

ii
eq[; ea=h fgekpy izns’k
t; jke Bkdqj
lUns'k
tyok;q ifjorZu izHkko lkjh nqfu;ka esa eglwl fd, tk jgs gSa] blls fodkl’khy ns’kksa esa jg jgs xjhc vkSj gkf’k, ij th jgs yksx T;knk izHkkfor gSaA orZeku esa igys ls T;knk ekSle lEcU/kh nq?kZVuk,a gks jgh gSaA tcfd cgqr ls tho tUrq o ouLifr iztkfr;ka foyqIr gksus ds dxkj ij gSaA tyok;q ifjorZu vc ,d lPpkbZ ds :Ik esa ge yksxksa ds lkeus vk pqdk gSA ekSle ds pdz esa vkdfLed ifjorZu gekjs thou dks] gekjh vkthfodk dks] gekjh vFkZO;oLFkrk dks vO;ofLFkr djus dh {kerk j[krk gS vr% ;g vko’;d gS fd ge ;kstukc) rjhds ls bl laHkkfor [krjs ls eqdkcyk djus ds fy, vius vki dks rS;kj djsaA fgeky;h {ks= ds fge[k.M cgqr rsth ls fi?ky jgs gSaA gekjs jkT; dh ty fo|qr ifj;kstuk,a] i;ZVu] d`f"k] ckxokuh bR;kfn iwjh rjg ls tyok;q ij fuHkZj djrh gSA gekjk ifjos’k xzkeh.k gS vr% pqukSfr;ksa dk {ks= dkQh cM+k gSA gekjs vkfFkZd fodkl ds fy, ;g ije~ vko’;d gS fd ge tyok;q ifjorZu ds vuqdwyu ds izfr iwjh ltxrk ds lkFk dk;Z djsaA esjh ljdkj izns’k ds gj fdlku ,oa oxZ ds izfr cgqr laosnu’khyrk ds lkFk dk;Z djus ds fy, izfrc) gSA gekjh ikap cM+h ufn;ka u dsoy izns’k vfirq iwjs mRrj Hkkjr esa jg jgs yxHkx 20 djksM+ yksxksa dh vkthfodk dks lqfuf’pr djrh gSaA gekjk iz;kl gS fd u dsoy jkT; vfirq leLr mRrjh Hkkjr ds izfr ge vius nkf;Ro dk fuoZgu djsaA eq>s [kq’kh gS fd fgekpy izns’k jkT; i;kZoj.k] foKku ,oa izkS|ksfxdh foHkkx bl fn’kk esa iz;Ru’khy gS rFkk tyok;q ifjorZu vuqdwyu ds fy, iapk;r Lrj ij dk;Z djus esa iz;kljr gSA eSa i;kZoj.k foHkkx ds vf/kdkfj;ksa rFkk oSKkfudksa dks bl ckr ds fy, c/kkbZ nsrk gwa fd mUgksaus O;kl unh ?kkVh esa ftyk dqYyw ds fy, iapk;r Lrj ij tyok;q ifjorZu laosnu’khyrk ij v/;;u dj tyok;q ifjorZu vuqdwyu ds fy, uhfrxr :ijs[kk rS;kj dh gSA eq>s vk’kk gS fd ;g ;kstuk iapk;r ,oa xzkeh.k fodkl esa ehy dk iRFkj lkfcr gksxh rFkk gekjs laosnu’khy {ks=ksa esa lrr~ fodkl lqfuf’pr djsxhA
¼t; jke Bkdqj½
iii

iv
Addl. Chief Secretary (Env.,S&T) to theGovernment of Himachal Pradesh
Manisha Nanda, IASMESSAGE
In today’s global scenario, climate change is inescapable reality which is both a challenge and opportunity for the sustainable development which poses significant threat in Himalayan region which is vulnerable due to its fragile ecology and stress due to disastrous prone topography.
The impact of the warming world has impacted every facet of social and economic progress. Developing countries’ vulnerability is higher and critical due to variation in various society and eco-system. Our Himalayan region being fragile and precarious require multi-pronged and comprehensive scientific approach to tackle this.
During the last three decades most weather stations in Himachal Pradesh have reported increasing trend of temperature and as a result the rainfall as well as snowfall are becoming erratic. The snowfall days particularly in Shimla are showing the decreasing trend. The glaciers in Himalayan regions are direct indicator of climate change. The rate of retreat of glaciers especially in two Basins have been fast since 1962 and the area in snow cover has also changed between October and June.
Earlier occurrence of spring seasonal events and later occurrence of autumn seasonal events in plants and animals; lengthening of breeding seasons; northwards and uphill movement of many plant and animal species, but the migration rate of many species is insufficient to keep pace with the speed of climate change; establishment of warm-adapted alien plant species; many habitats of our hill species are potentially threatened by climate change over their natural range in Himalayas.
We need to prepare comprehensively to tackle the impacts of climate change. An exercise carried out by the Department of Environment, Science and Technology (DEST) during year 2011 has highlighted the vulnerability of the state due to climate change at block level. This further insisted upon for making actions on the ground to analyse and adopt more scientific, empirical approach with micro watershed level assessments.
The Vulnerability Assessment is a first step in a scientific, systematic process of preparing for the adaptation planning and accordingly implementation of the actions. I am very happy to learn that A Village Level Climate Change Vulnerability Analysis and Indicative Adaptation Plan Framework Beas River Basin – District Kullu Himachal Pradesh has been prepared.
This report is presented as a part of Beas River basin and will guide the field level functionary through a simplified understanding of climate risks, vulnerability to climate change and actions to cope with the impact of climate change by connecting adaptation, mitigation and sustainable development, regional climate change strategies, climate change adaptation and disaster risk reduction, climate financing, sustainability. It includes an analysis of observed and projected climate change over Kullu region at Panchayat level, and the socio-economic impacts of extreme weather events in Beas Basin. I am sure that this will facilitate the planning process in forestry, terrestrial ecosystems and biodiversity, water resources sectors, settlements, human health, energy.I am proud to be part of “Team Environment” headed by our Illustrious Chief Minister who has been practically associated with rural agrarian economy and the speed with which as a policy maker need to adopt and adapt the required steps to achieve the balanced sustainable development.
I sincerely acknowledge and complement the members of the DEST for their efforts in preparing this report.
(Manisha Nanda)
v

vi
Director-cum-Special Secretary (Env.,S&T) Himachal Pradesh
D.C. Rana, HAS
FOREWORD
The severity of climate change impacts is observable and devastating at the local level, especially among the poor and ethnic people settled in the marginal and ecologically fragile areas, because of their least adaptive capacities and resilience. Thus, it is crucial to understand the local climatic risks, vulnerabilities and adaptive capacities to develop appropriate coping and adaptation strategies. However, the reliable climate data and information are not available at local level because of few meteorological stations. It is very difficult to assess and analyze the climate vulnerabilities and impacts, needs and priorities of the communities at micro level.
Himalayan region is quite vulnerable regions to climate change amongst all regions. Located in Indian Himalayan Region, State of Himachal Pradesh is in particular very sensitive to climate change and its environment health, is important to maintain water cycles and various ecosystem services for more than 200 million people down the line. But due to the impacts of climate change on this mountain landscape, these services are under tremendous threat. A comprehensive State Strategy and Action Plan on Climate Change have been prepared for Himachal Pradesh.
Climate Change Vulnerability is generally explained by the characteristics and contexts of the system or community that are susceptible to the risks and hazards based on the socio-economic, physical and environmental conditions. It has been widely discussed, debated and negotiated in the national, regional and international levels, but few concrete and realistic actions are taking place at the ground to respond to the negative consequences faced by the communities.
Micro watershed approach is useful in assessing various impacts and develop mitigation plans effectively. There are five river basins in the State contributing to Indus & Ganges river basins. These five river basins are Beas, Satluj, Yamuna, Ravi & Chenab. Small Watershed to river basin scale using Hydrological modelling to simulate the quality & quantity of surface and ground water, to predict the environmental impact of land use management practices & climate change could be effective tool in asserting the impact and develop the adaptation plans at local level.
I am really pleased to say that an attempt has been made to analyse the climate change vulnerability at very micro level- at village level as represented by this report, and I am hopeful that it shall herald a beginning in micro level planning. We hope that this vulnerability assessment through hydrological modelling process would lead to institutionalization of climate change adaptation planning process in Himachal Pradesh at micro level – Panchayat level and would meet the challenges of future climate impacts effectively.
(D. C. Rana)
vii

viii
ContentsDescription Page Nos. 1 Introduction 12 Beas River Basin: District Kullu 5-22
2.1 Beas River Basin - Profile 72.2 Kullu District: At a Glance 82.3 Socio-economic and Physical Aspect of Kullu District 102.4 Administrative Setup 102.5 Geographical Profile & Location 112.6 Geology 112.7 Minerals 122.8 Agro Climatic features 132.9 River System 162.10 Climate 162.11 Forest 172.12 Biodiversity 182.13 Agriculture & Horticulture 192.14 Animal Husbandry 21
3 Blocks of District Kullu falling in Beas River Basin 23-343.1 Profile: Development Block – Naggar 263.2 Profile: Development Block – Kullu 303.3 Profile: Development Block – Banjar 32
4 Climate Change: District Kullu 35-444.1 Precipitation and Temperature Change 384.2 A1B Projections 404.3 Aerosol/ Studies 404.4 Climate Change Vulnerability Assessments 41
5 Climate Change Hazard Scenarios: District Kullu 45-565.1 Climate Change Induced Natural Hazards 475.2 Water Resources 495.3 Snow & Glaciers 505.4 Agriculture & Horticulture 525.5 Forest and Biodiversity 54
6 Climate Change Vulnerability Assessment - Conceptual framework
57-60
7 Methodology adopted for Vulnerability Assessment 61-737.1 Data collection & arrangements 63
ix
7.2 Mapping & Data Projection 657.3 Hydrological Modelling 657.4 Climate Change Vulnerability 717.5 Climate Change Adaptation Framework 73
8 Hydrological Modelling Outputs 75-968.1 Open Source Interface Management (QGIS & QSWAT) 778.2 Datasets/Model Inputs (Spatial & Temporal) 788.3 Watershed Delineation & SWAT Model Run 838.4 Hydrological Model Results & Conclusions 85
9 Climate Change Vulnerability Assessment Analysis 97-1489.1 Identification of indicators 999.2 Exposure 1009.3 Exposure Indicators 1059.4 Composite exposure 1089.5 Sensitivity indicators 1149.6 Composite sensitivity 1199.7 Adaptive capacity indicators 1259.8 Composite adaptive capacity 1339.9 Composite vulnerability 138
10 Analysis Report - Conclusions 149-17411 Bibliography 175-17812 Appendices 179-187
Appendix-1 Questionnaire 181Appendix-2 Hydrological Modelling (SWAT Model Inputs) Soft copy Inside CDAppendix-3 Hydrological Modelling (SWAT Model Outputs) Soft copy Inside CD
x
1 Introduction
Climate Change Vulnerability Assessment Report 1

Climate Change Vulnerability Assessment Report 2
1. Introduction
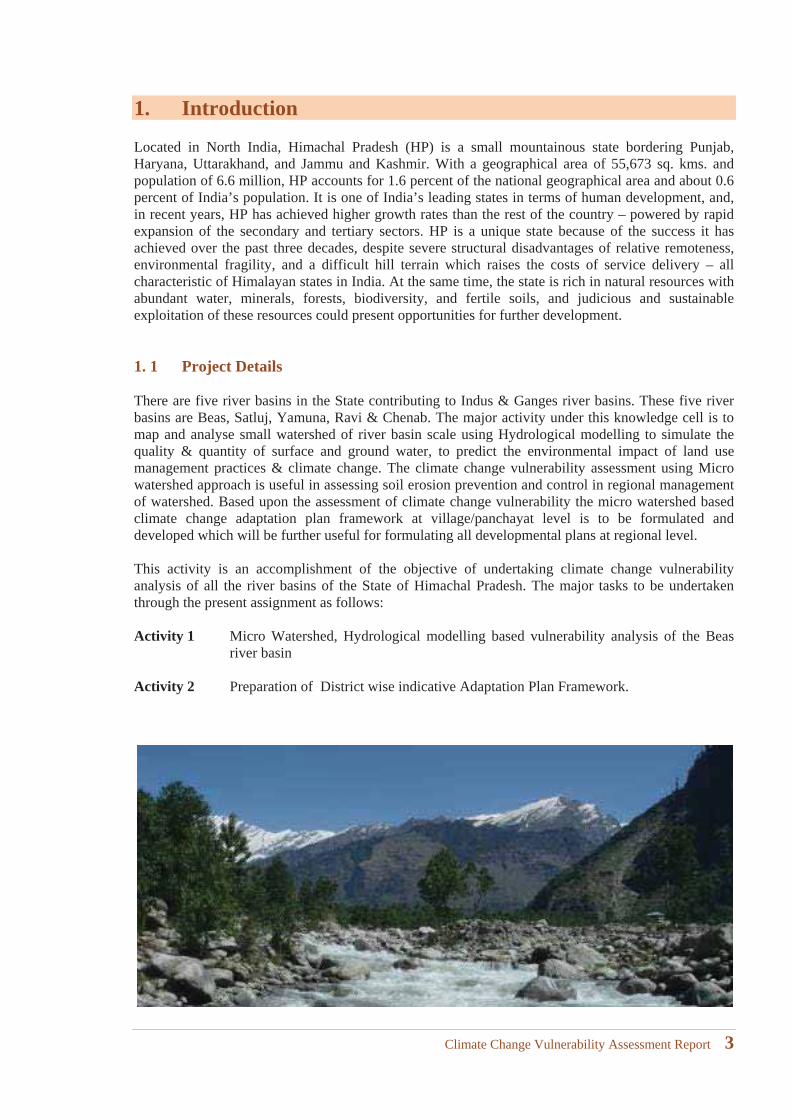
Located in North India, Himachal Pradesh (HP) is a small mountainous state bordering Punjab, Haryana, Uttarakhand, and Jammu and Kashmir. With a geographical area of 55,673 sq. kms. and population of 6.6 million, HP accounts for 1.6 percent of the national geographical area and about 0.6 percent of India’s population. It is one of India’s leading states in terms of human development, and, in recent years, HP has achieved higher growth rates than the rest of the country – powered by rapid expansion of the secondary and tertiary sectors. HP is a unique state because of the success it has achieved over the past three decades, despite severe structural disadvantages of relative remoteness, environmental fragility, and a difficult hill terrain which raises the costs of service delivery – all characteristic of Himalayan states in India. At the same time, the state is rich in natural resources with abundant water, minerals, forests, biodiversity, and fertile soils, and judicious and sustainable exploitation of these resources could present opportunities for further development.
1. 1 Project Details
There are five river basins in the State contributing to Indus & Ganges river basins. These five river basins are Beas, Satluj, Yamuna, Ravi & Chenab. The major activity under this knowledge cell is to map and analyse small watershed of river basin scale using Hydrological modelling to simulate the quality & quantity of surface and ground water, to predict the environmental impact of land use management practices & climate change. The climate change vulnerability assessment using Micro watershed approach is useful in assessing soil erosion prevention and control in regional management of watershed. Based upon the assessment of climate change vulnerability the micro watershed based climate change adaptation plan framework at village/panchayat level is to be formulated and developed which will be further useful for formulating all developmental plans at regional level.
This activity is an accomplishment of the objective of undertaking climate change vulnerability analysis of all the river basins of the State of Himachal Pradesh. The major tasks to be undertaken through the present assignment as follows:
Activity 1 Micro Watershed, Hydrological modelling based vulnerability analysis of the Beas river basin
Activity 2 Preparation of District wise indicative Adaptation Plan Framework.
Climate Change Vulnerability Assessment Report 3

Climate Change Vulnerability Assessment Report 4
2 Beas River Basin: District Kullu
Climate Change Vulnerability Assessment Report 5

Climate Change Vulnerability Assessment Report 6
2. Beas River Basin: District Kullu
2.1 Beas River Basin - Profile
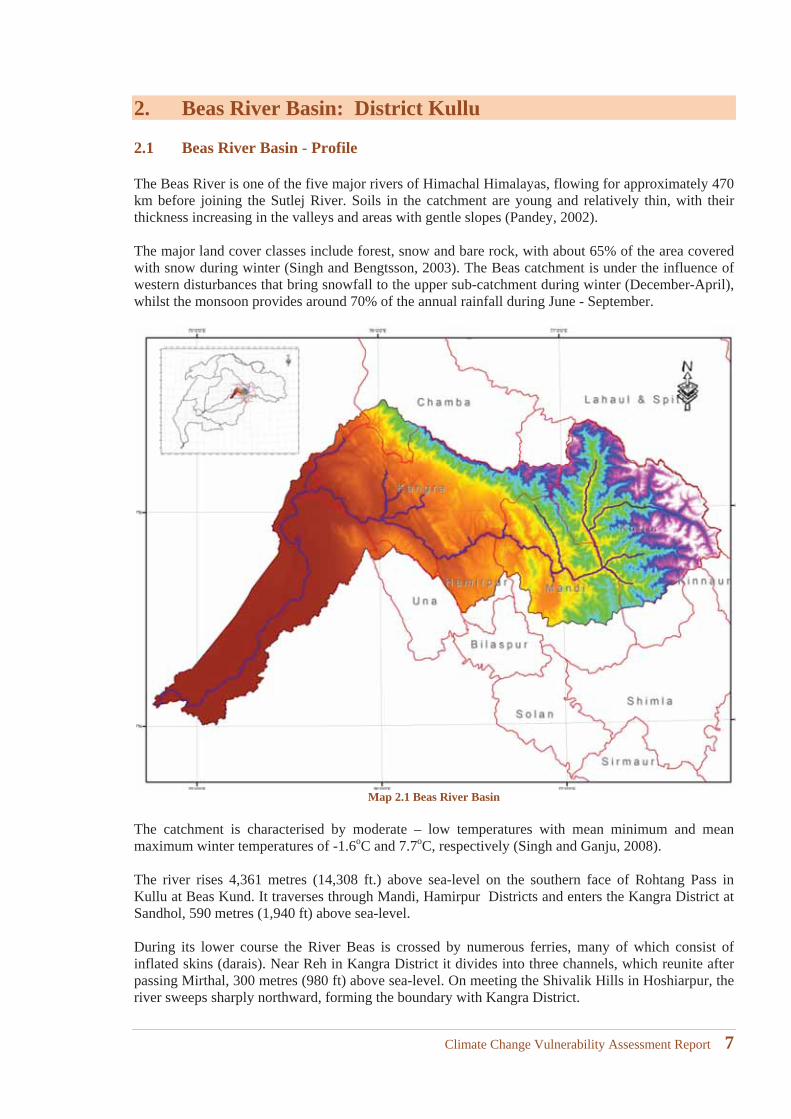
The Beas River is one of the five major rivers of Himachal Himalayas, flowing for approximately 470 km before joining the Sutlej River. Soils in the catchment are young and relatively thin, with their thickness increasing in the valleys and areas with gentle slopes (Pandey, 2002).
The major land cover classes include forest, snow and bare rock, with about 65% of the area covered with snow during winter (Singh and Bengtsson, 2003). The Beas catchment is under the influence of western disturbances that bring snowfall to the upper sub-catchment during winter (December-April), whilst the monsoon provides around 70% of the annual rainfall during June - September.
Map 2.1 Beas River Basin
The catchment is characterised by moderate – low temperatures with mean minimum and mean maximum winter temperatures of -1.6oC and 7.7oC, respectively (Singh and Ganju, 2008).
The river rises 4,361 metres (14,308 ft.) above sea-level on the southern face of Rohtang Pass in Kullu at Beas Kund. It traverses through Mandi, Hamirpur Districts and enters the Kangra District at Sandhol, 590 metres (1,940 ft) above sea-level.
During its lower course the River Beas is crossed by numerous ferries, many of which consist of inflated skins (darais). Near Reh in Kangra District it divides into three channels, which reunite after passing Mirthal, 300 metres (980 ft) above sea-level. On meeting the Shivalik Hills in Hoshiarpur, the river sweeps sharply northward, forming the boundary with Kangra District.
Climate Change Vulnerability Assessment Report 7
Then bending round the base of the Shivalik Hills, it takes the southerly direction, separating the districts of Gurdaspur and Hoshiapur. After touching the Jalandhar district for a short distance, the river forms the boundary between Amritsar and Kapurthala.
Finally the River Beas joins the river Sutlej at the south-western boundary of Kapurthala district of Punjab after a total course of 470 kilometres (290 miles). The chief tributaries are Bain, Banganga, Luni and Uhal. The Sutlej continues into Pakistani Punjab and joins the Chenab River at Uch near Bahawalpur to form the Panjnad River; the latter in turn joins the Indus River at Mithankot.
The total catchment area of the Beas River Basin is about 20,303 km2. However, the catchment area, upstream of the Pong reservoir, is around 12,560 km2. The catchment areas of the river covers 4 districts i.e. Kullu, Mandi, Hamirpur & Kangra.
The climate change vulnerability assessment study will cover district Kullu out of four districts:
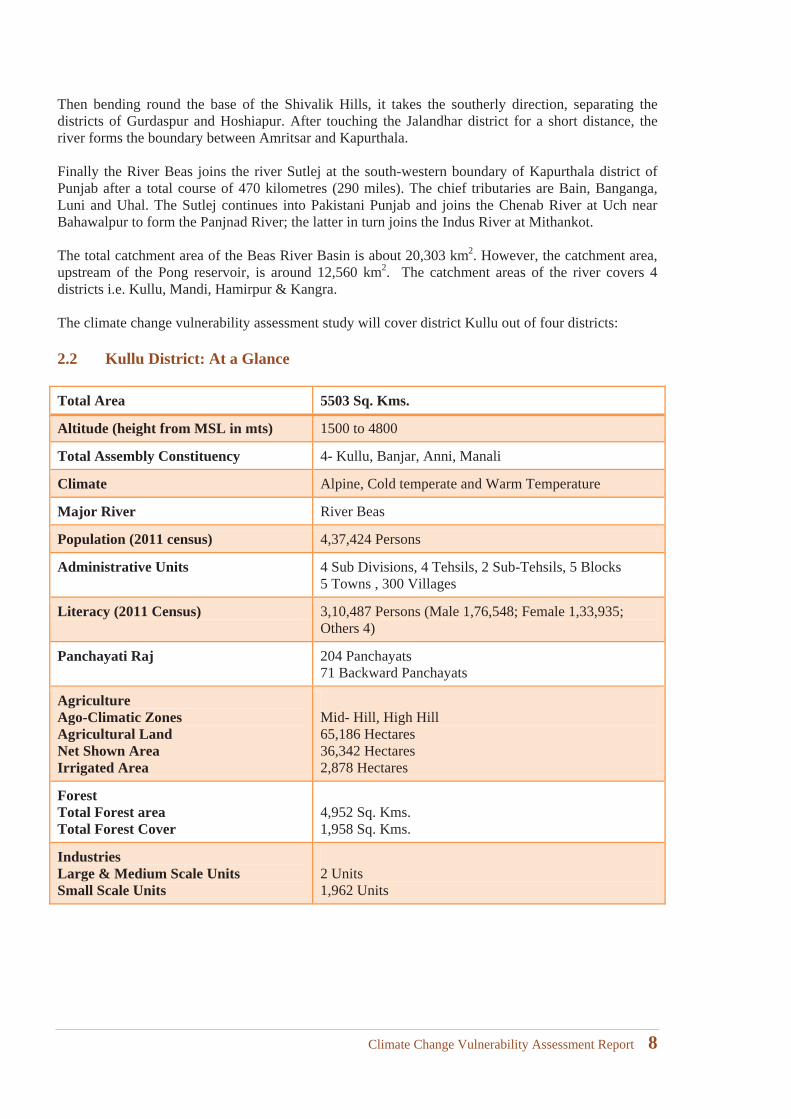
2.2 Kullu District: At a Glance
Total Area 5503 Sq. Kms.
Altitude (height from MSL in mts) 1500 to 4800
Total Assembly Constituency 4- Kullu, Banjar, Anni, Manali
Climate Alpine, Cold temperate and Warm Temperature
Major River River Beas
Population (2011 census) 4,37,424 Persons
Administrative Units 4 Sub Divisions, 4 Tehsils, 2 Sub-Tehsils, 5 Blocks 5 Towns , 300 Villages
Literacy (2011 Census) 3,10,487 Persons (Male 1,76,548; Female 1,33,935; Others 4)
Panchayati Raj 204 Panchayats 71 Backward Panchayats
AgricultureAgo-Climatic ZonesAgricultural Land Net Shown Area Irrigated Area
Mid- Hill, High Hill65,186 Hectares36,342 Hectares2,878 Hectares
ForestTotal Forest area Total Forest Cover
4,952 Sq. Kms.1,958 Sq. Kms.
IndustriesLarge & Medium Scale UnitsSmall Scale Units
2 Units1,962 Units
Climate Change Vulnerability Assessment Report 8
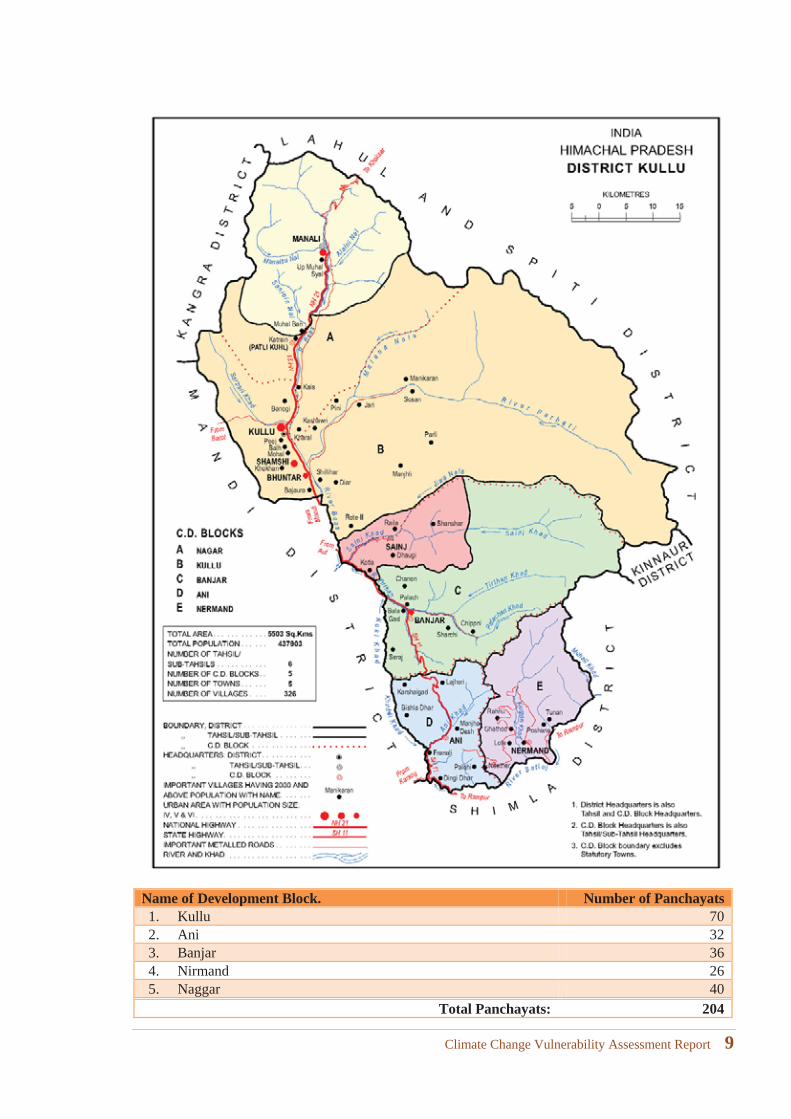
Name of Development Block. Number of Panchayats1. Kullu 702. Ani 323. Banjar 364. Nirmand 265. Naggar 40
Total Panchayats: 204
Climate Change Vulnerability Assessment Report 9
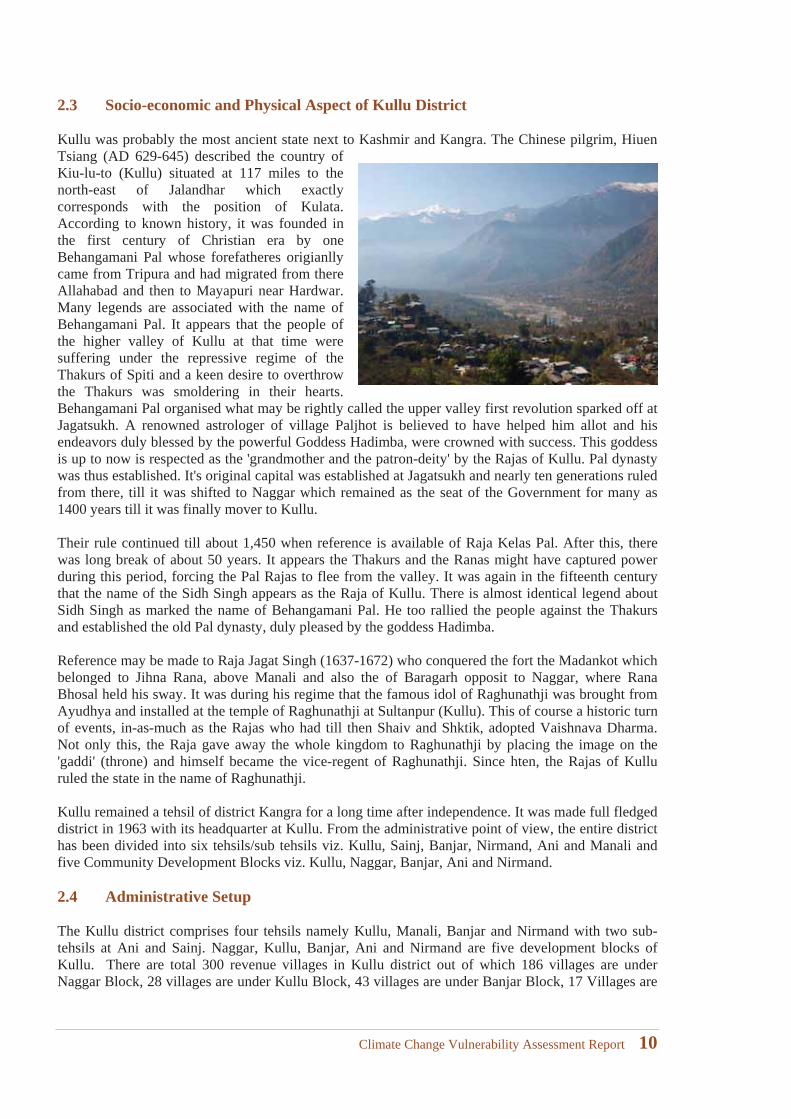
2.3 Socio-economic and Physical Aspect of Kullu District
Kullu was probably the most ancient state next to Kashmir and Kangra. The Chinese pilgrim, Hiuen Tsiang (AD 629-645) described the country of Kiu-lu-to (Kullu) situated at 117 miles to the north-east of Jalandhar which exactly corresponds with the position of Kulata. According to known history, it was founded in the first century of Christian era by one Behangamani Pal whose forefatheres origianlly came from Tripura and had migrated from there Allahabad and then to Mayapuri near Hardwar. Many legends are associated with the name of Behangamani Pal. It appears that the people of the higher valley of Kullu at that time were suffering under the repressive regime of the Thakurs of Spiti and a keen desire to overthrow the Thakurs was smoldering in their hearts. Behangamani Pal organised what may be rightly called the upper valley first revolution sparked off at Jagatsukh. A renowned astrologer of village Paljhot is believed to have helped him allot and his endeavors duly blessed by the powerful Goddess Hadimba, were crowned with success. This goddess is up to now is respected as the 'grandmother and the patron-deity' by the Rajas of Kullu. Pal dynasty was thus established. It's original capital was established at Jagatsukh and nearly ten generations ruled from there, till it was shifted to Naggar which remained as the seat of the Government for many as 1400 years till it was finally mover to Kullu.
Their rule continued till about 1,450 when reference is available of Raja Kelas Pal. After this, there was long break of about 50 years. It appears the Thakurs and the Ranas might have captured power during this period, forcing the Pal Rajas to flee from the valley. It was again in the fifteenth century that the name of the Sidh Singh appears as the Raja of Kullu. There is almost identical legend about Sidh Singh as marked the name of Behangamani Pal. He too rallied the people against the Thakurs and established the old Pal dynasty, duly pleased by the goddess Hadimba.
Reference may be made to Raja Jagat Singh (1637-1672) who conquered the fort the Madankot which belonged to Jihna Rana, above Manali and also the of Baragarh opposit to Naggar, where Rana Bhosal held his sway. It was during his regime that the famous idol of Raghunathji was brought from Ayudhya and installed at the temple of Raghunathji at Sultanpur (Kullu). This of course a historic turn of events, in-as-much as the Rajas who had till then Shaiv and Shktik, adopted Vaishnava Dharma. Not only this, the Raja gave away the whole kingdom to Raghunathji by placing the image on the'gaddi' (throne) and himself became the vice-regent of Raghunathji. Since hten, the Rajas of Kullu ruled the state in the name of Raghunathji.
Kullu remained a tehsil of district Kangra for a long time after independence. It was made full fledged district in 1963 with its headquarter at Kullu. From the administrative point of view, the entire district has been divided into six tehsils/sub tehsils viz. Kullu, Sainj, Banjar, Nirmand, Ani and Manali and five Community Development Blocks viz. Kullu, Naggar, Banjar, Ani and Nirmand.
2.4 Administrative Setup
The Kullu district comprises four tehsils namely Kullu, Manali, Banjar and Nirmand with two sub-tehsils at Ani and Sainj. Naggar, Kullu, Banjar, Ani and Nirmand are five development blocks of Kullu. There are total 300 revenue villages in Kullu district out of which 186 villages are under Naggar Block, 28 villages are under Kullu Block, 43 villages are under Banjar Block, 17 Villages are
Climate Change Vulnerability Assessment Report 10
under Anni Block and 26 villages are under Nirmand Block. Kullu Manali, Bhuntar, Shamshi and Banjar are the major towns.
2.5 Geographical Profile & Location
Kullu district is located in the northern part of Himachal Pradesh. Between 31.58 degree north latitude and 77.64 degree east longitude. On the north and north east, it is bounded by Lahaul Spiti and Kangra district. On the east and south east by Kinnaur and Shimla districts and in the south by Mandi district. The total geographical area of the district is 5503 Sq. Kms. and its population as per the census of 2011 is 4,37,474 persons.
The district of Kullu forms a transitional zone between the Lesser and Greater Himalayas and presents a typical rugged mountainous terrain. The district has high mountains, rivers, rivulets and valleys. Kullu district has an average elevation of 1,278 m or 4,193 ft). It lies on the bank of Beas River. A major tributary, Sarvari, leads to the less explored and steeper Lug-valley on the west. Beyond the ridge lies Manikaran valley, along the Parvati river which joins Beas at sangam in Bhuntar. On the South of Kullu lie the town of Bhuntar, Out (leading to Anni, Banjar and Siraj Valley) and Mandi (in Mandi district). Historically Kullu was accessible from Shimla via Siraj valley or through passes on the west leading to Jogindernagar and onto Kangra. To the north lies the famous town of Manali, which through the Rohtang pass leads onto the Lahaul and Spiti Valley. Once can see an enormous change in the climate as one climbs up the windward side of the ranges to proceed to the leeward and much drier plateaus to the north of Manali.
2.6 Geology
The rock types found in the district are phyllite, slate, quartzite lime stone, schists and granites and have been classified on the basis of their physical characters and mode and period of formation. These are named either on rock types or after local names where these were first studied. These groups are central gneiss, Kullu formation, Banjar formation and tourmaline granites. Central gneiss presumably the oldest rocks made over 1,500 million years old and comprised various types of gnessic rocks within layers of quartizite, granites and pegmatites. The largi formation contains thick layers of grey dolomite and pink limestone besides slate phyllite and quartizite. The tourmaline granites are inferred to occur as intrusive and are the probable source of high radio activity in the area where many hot water springs have occurred in this area. On the basis of physiography, climate, soil cover, geology and natural vegetation, the district has been divided into 5 sub-micro regions which are given as below:
Kullu Valley: The valley mainly spreads on the both banks of Beas river and also on the lower parts of its major tributaries like Parvati and Tirthan rivers. It covers maximum parts of Manali, Kullu tahsils and Sainj sub-tahsil and a small part of Banjar tahsil. This region is surrounded by Kullu forests from almost all corners. Mandi district forms its south-western limit. This valley is mainly formed by Beas river and is narrow in the north and becomes more wider in Kullu and in the central and southern parts of Manali tahsils whereas the parts of this valley falling in Sainj sub-tahsil and Banjar tahsil are undulating. This region in the district is comparatively plain and fertile and the elevation varies from 1,089 metres and 2,980 metres above the mean sea level. Slope rises gradually as one moves away from the river banks and these slopes are densely covered with apple orchards. Most of the area of this region falls below 2,000 metres. The Beas rises in the Pir Panjal range near Rohtang pass and it enters the region near Rohla from the north. This river flows through central part of the region and flows towards southern direction upto Aut. The Tirthan river, after meeting with the Koki and Sainj khads join the Beas river from south and then the combined course flows towards west. Major tributary of the Beas river in this region is the Parvati river which also receives the water of Malana Nalla and Tos Nalla and joins then Beas on its left Bank near Bhuntar town. Other minor tributaries are Manalsu, Solang, Phojal, Debar, Sanjoin, Siriv Nalls and Sarwari Khad on the right side and Chaki, Pakhnoj, Duhangan, Aliaini and Hurla Nalls on the left side. The climate of this
Climate Change Vulnerability Assessment Report 11
valley is warm during summers and cool during winters. Upper areas of this valley receives snow fall during the month of December and January. Snow clad peaks look very beautiful. The geology of this region is mainly composed of middle proterozoic formations. The northern fringe of this region contains Granites(unclassified), while south-eastern part has sholi – Deoban and Largi groups and Rampur- Banjar formations. Soil of this region are mainly covered with orthents – ochrepts (58) while in the northern extreme, it contains Udalfs (20) type of soil. Higher slopes of this region are covered with mixed vegetation mainly of Deodars. This valley in the state, with its natural charm and grandeur is famous for the scenic beauty beyond expression.
Kullu Greater Himalaya: This region comprises the crest of greater Himalaya which passes through north and eastern Kullu district. It covers eastern parts of Kullu and Manali tahsils,north-eastern tip of Sainj Sub-tahsil and northern, eastern and south-eastern parts of Banjar tahsil. This region is surrounded by Lahul & Spiti district from north to east, by Shimla district and Satluj basin from south and by Kullu forests from west. Its south-eastern boundary is formed by Kinnaur district. This region is very rugged and mountainous and also has many Dhars. Some of the important Dhars are Ali Ratni Dhar (5,269 metres), Ghodil Dhar (4,220 metres), Sirkhand Dhar (5,159 metres) and Dharing Dhar (4,183 metres). Elevation in this region varies between 4,012 metres and 6,632 metres above the mean sea level. Pin Parvati Pass (5,319 metres) is an important physical feature in this region and is situated on the boundary line between Kullu and Lahul & Spiti districts in the east. The region contains many glaciers viz. Dudhon glacier, Parvati glacier, Tichu glacier, Sara Umga glacier and Dibi ka glacier on the north and north-eastern parts. Parvati river which originates from the Parvati glacier, is the major tributary of the Beas river in this region. Another tributary Tirthan river also takes birth in the region from Sirkhand Dhar. The climate of this region is severe and dry. The main geological structure of this region is Granites (unclassified), Haimanta group and Jutogh group and central gneiss. The region is covered by udalfs (20), orthents-ochrepts(58) and glaciers and snow cap (103) types of soils. The region has no vegetation cover. This region covers a huge unmeasured and uninhabited area due to its rugged terrain and unfavourable climatic conditions.
Pir Panjal: This region is situated in the extreme northern and north western parts of the district and occupying only a small part of Manali tahsil. It makes its boundary with Kangra district in the west, Lahul & spiti district in the north and east and Kullu forests in the south while Kullu Greater Himalaya touches it from the south-east direction. The region is characterized with high snow covered mountains, glaciers and passes. The altitude of this region varies between 3,685 metres and 5,932 metres above the mean sea level. Maximum height of 5,932 metres in this region is attained by Hanuman Tibba which is situated on the boundary line between Kullu and Kangra districts in the west. Rohtang pass(3,978 metres) is situated in the northern part, is one of the major Physical feature of this region besides other passes viz., Thanod,Taintu Ka Jot (4,996 metres) and Hamta Jot(4,268 metres). This region contains many Dhars. Some of these are Beas Kunder Dhar, Shiti Dhar,Kara Dhar,Rohan Dhar and Satbehui Dhar. Western part of this region is comparatively higher in elevation than eastern part. Beas River which is the main river of Kullu district, originates in the Pir Panjal range from Beas Rishi spring near Rohtang pass and flows towards south. The geological structure of this region is mainly formed by granites (unclassified) formations and it has Udalfs (20) type of soil cover which is high base status of humid regions. The region is without vegetation cover. This region covers very small unmeasured area of the district and is un-inhabited due to its tough and rugged terrain and climatic conditions. The only motorable road is border road which connects this region as well as district with Lahul & Spiti district. Rohtang pass in this region is a place of tourist interest as the crest of this pass affords a wide spread panorama of mountain scenery.
2.7 Minerals
The district does not possess minerals of commercial significance and reserve of a few minerals is found in the parts of district but their mining is not economically viable. The following minerals are found in the district which is used locally:
Climate Change Vulnerability Assessment Report 12
Minerals DescriptionBeryl White and blueish coloured crystals of beryl are found in Saraouga valley and
north-east of Dando Dee Thack in the Parvati valley. Beryl is the source of beryllium and its transparent green variety emerald is a precious gem stone.
Building Stone The area abounds in variety such as quartizite and granite. A Number of slate quarries producing roofing slate for local use which are located in the rocks of the central gneiss Kullu and Banjar formations.
Kyanite It is a silicate of aluminium and is used for refractory bricks. The mineral occurs at a number of places in Parvati valley. It is found in the form of blue blades and associated with central genesis formations.
Copper Occurrence of copper ore is reported from Chashikni, Jhari, Maol, Saon and Satgahr but deposit of copper ore is not in large quantity
Lime-stone Limestone is the main raw material for cement. It occurs in the Larji formation in southern parts of Kullu valley and also in the Garsha saiji valleys. Limestone found in this district is yet to be exploited for commercial use as no cement plant has been set-up in the district or nearby area.
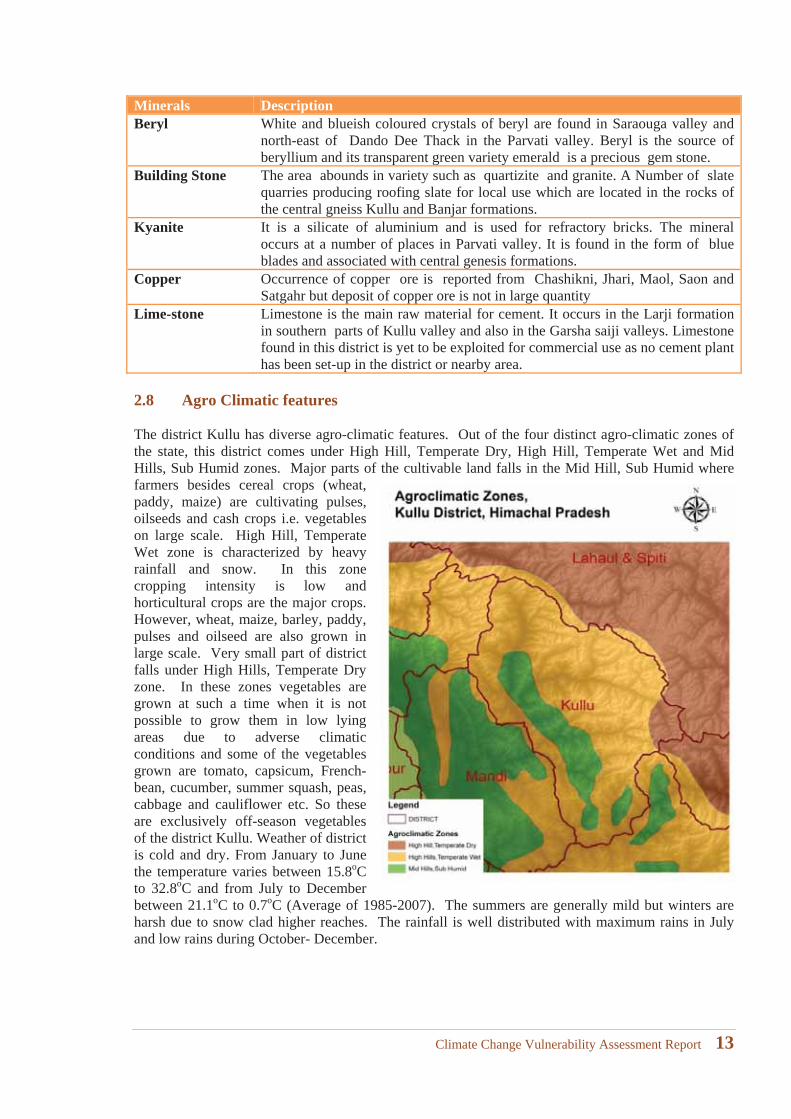
2.8 Agro Climatic features
The district Kullu has diverse agro-climatic features. Out of the four distinct agro-climatic zones of the state, this district comes under High Hill, Temperate Dry, High Hill, Temperate Wet and Mid Hills, Sub Humid zones. Major parts of the cultivable land falls in the Mid Hill, Sub Humid where farmers besides cereal crops (wheat, paddy, maize) are cultivating pulses, oilseeds and cash crops i.e. vegetables on large scale. High Hill, Temperate Wet zone is characterized by heavy rainfall and snow. In this zone cropping intensity is low and horticultural crops are the major crops.However, wheat, maize, barley, paddy, pulses and oilseed are also grown in large scale. Very small part of district falls under High Hills, Temperate Dry zone. In these zones vegetables are grown at such a time when it is not possible to grow them in low lying areas due to adverse climatic conditions and some of the vegetables grown are tomato, capsicum, French-bean, cucumber, summer squash, peas, cabbage and cauliflower etc. So these are exclusively off-season vegetables of the district Kullu. Weather of district is cold and dry. From January to June the temperature varies between 15.8oCto 32.8oC and from July to December between 21.1oC to 0.7oC (Average of 1985-2007). The summers are generally mild but winters are harsh due to snow clad higher reaches. The rainfall is well distributed with maximum rains in July and low rains during October- December.
Climate Change Vulnerability Assessment Report 13
Agro-climatic Zone & major agro-ecological conditions
S. No Agro-climatic Zone Characteristics1. Mid-hill sub-humid zone The elevation of this zone varies from 651 to 1800m amsl.
Soil texture varies from loam to clay loam and soils are deficient in N & P with poor water & nutrient holding capacity. Soils are acidic in reaction. The average rainfall is about 1500mm. In this zone, wheat, paddy, maize, seed potato, pulses and oilseeds are the main crops Stone and citrus fruits occupy considerable area. Forest and pastures are also important in this zone.
2. High-hills temperate wet zone
The elevation of this zone lies above 1800m amsl. The soils are shallow in depth, acidic in reaction, silt loam to loam in texture and deficient in N & P. Terrace farming is practiced. Soil erosion, low fertility and inadequate water management are main problems of this zone. The main crops are wheat, maize, paddy, barley, pulses and oilseeds. Mostly rainfed farming is practiced. The average rainfall is about 1000mm. This zone is suitable for raising off-season vegetable and seed production of temperate vegetable, Apple, other temperate fruits and nuts are important horticultural crops.
S. No Agro ecological condition Characteristics1. Valley areas This includes the valley areas having elevation ranging
from 651 to 1300m amsl in all the five development blocks. The average annual rainfall is about 1000mm. Soils are Entisol and Inceptisol with gentle slopping topography. The net cultivated area under this AES is about 12.7 thousand ha (35.05%) with partial irrigation facilities. Main sources of irrigation are flow and lift irrigation schemes. Vegetables, cereal and fruit based cropping systems are predominant in this AES. The net cultivated area is spread over approximately 54.3, 11.8, 11.8, 11.8 and 10.3% in Kullu, Naggar, Banjar, Nirmand and Ani blocks, respectively.
2. Mid-hill mild temperate areas
Area of this AES also spreads through the five blocks of the districts. The elevation of this AES ranges from 651 to 1300m amsl having annual rainfall of about 1540mm. The soil are Entisol, Inceptisol and Mollisol. Topography is hilly terrain. The net cultivated area is about 16.02 thousand ha (44.23%) with meager irrigation facilities. Cereal, pulse, fruits and vegetable based cropping systems are predominantly in practice in this AES. The net cultivated area is spread over approximately 19.2, 16.7, 20.6, 18.5 and 24.7% in Kullu, Naggar, Banjar, Nirmand and Ani blocks, respectively.
3. High-hill temperate areas Area of this AES too spreads in all the five blocks of the district with elevation ranging from 1300 to 1800 m amsl. Average rainfall is about 1078 mm and soil types are Alfisol and Inceptisol. Topography is hilly terrain having net cultivated area of approximately 6.0 thousand ha (16.58 %) with inadequate irrigation facilities. Fruits, off-season vegetables, pulses and traditional mountain crops
Climate Change Vulnerability Assessment Report 14
S. No Agro ecological condition Characteristicsare predominant. The net cultivated area under this AES is spread over approximately 41.3, 25.0, 15.1, 13.3 and 5.3% in Kullu, Naggar, Banjar, Nirmand and Ani.
4. High hill wet temperate areas
This AES also extends in all the five blocks with elevation above 1800 m amsl with medium shallow soil. Topography is hilly terrain with net cultivated area of approximately 1.5 thousand ha (4.14%). Heavy snowfall with one growing season is characteristic feature in some of areas in this AES. Mountain traditional crops, pulses, cereals, fruits and vegetables are grown by the peasants. The net cultivated area under this AES is spread over approximately 33.3, 21.0, 12.3 and 13.3% in Kullu, Naggar, Banjar and Nirmand blocks, respectively.
S. No Soil type Characteristics Area in ha 1. Entisols & Inceptisols
(Valley Areas)Entisolsl: Soil has no diagnostic pedogenic horizons. They may be found in virtually any climate on very recent geomorphic surfaces. Inceptisols: Soils that are usually moist with pedogenic horizons of alteration of parent materials but not of illuviation. Generally, the direction of soil development is not yet evident from the marks left by various soil- forming processes or the marks are too weak to classify in another order
12.7 thousand hectare
2. Entisols, Inceptisols and Mollisols(Mid-hill mild temperate Areas)
Entisolsl: Soil has no diagnostic pedogenic horizons. They may be found in virtually any climate on very recent geomorphic surfaces. Inceptisols: Soils that are usually moist
with pedogenic horizons of alteration of parent materials but not of illuviation. Generally, the direction of soil development is not yet evident from the marks left by various soil- forming processes or the marks are too weak to classify in another order.Mollisols: Soils with nearly black, organic– rich surface horizons and high supply of bases. They have mollic epipedons and base saturation greater than 50% in any cambic or argillic horizon.
16.4 thousand hectare
3. Alfisols & Inceptisols(High-hill temperate areas)
Alfisols: Soil with gray to brown surface horizons, medium to high supply of bases, and B horizons of alluvial clay accumulation. These soils form mostly under forest or savanna vegetation in climates with slight to pronounced seasonal moisture deficit.Inceptisols: Soils that are usually moist
6.0 thousand hectare
Climate Change Vulnerability Assessment Report 15
S. No Soil type Characteristics Area in ha with pedogenic horizons of alteration of parent materials but not of illuviation. Generally, the direction of soil development is not yet evident from the marks left by various soil- forming processes or the marks are too weak to classify in another order.
4. Medium shallow (High hill wet temperate areas)
- 1.5 thousand hectare
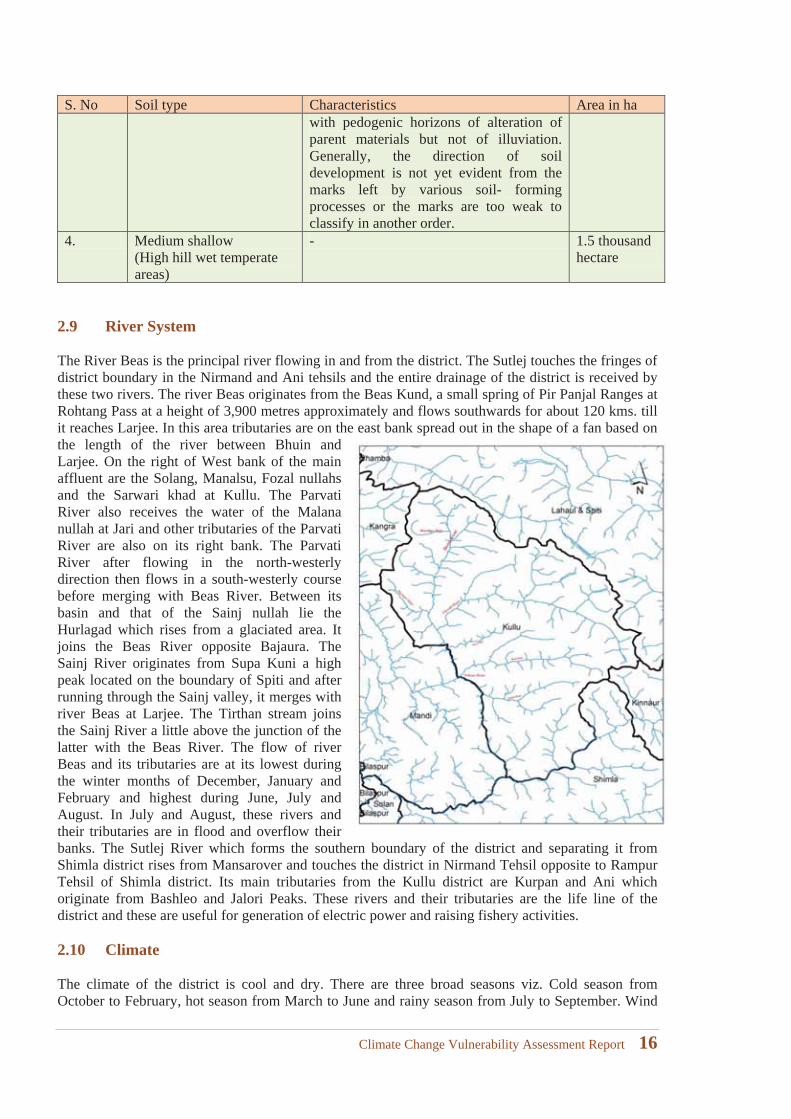
2.9 River System
The River Beas is the principal river flowing in and from the district. The Sutlej touches the fringes of district boundary in the Nirmand and Ani tehsils and the entire drainage of the district is received by these two rivers. The river Beas originates from the Beas Kund, a small spring of Pir Panjal Ranges at Rohtang Pass at a height of 3,900 metres approximately and flows southwards for about 120 kms. till it reaches Larjee. In this area tributaries are on the east bank spread out in the shape of a fan based on the length of the river between Bhuin and Larjee. On the right of West bank of the main affluent are the Solang, Manalsu, Fozal nullahs and the Sarwari khad at Kullu. The Parvati River also receives the water of the Malana nullah at Jari and other tributaries of the ParvatiRiver are also on its right bank. The Parvati River after flowing in the north-westerly direction then flows in a south-westerly course before merging with Beas River. Between its basin and that of the Sainj nullah lie the Hurlagad which rises from a glaciated area. It joins the Beas River opposite Bajaura. The Sainj River originates from Supa Kuni a high peak located on the boundary of Spiti and after running through the Sainj valley, it merges with river Beas at Larjee. The Tirthan stream joins the Sainj River a little above the junction of the latter with the Beas River. The flow of river Beas and its tributaries are at its lowest during the winter months of December, January and February and highest during June, July and August. In July and August, these rivers and their tributaries are in flood and overflow their banks. The Sutlej River which forms the southern boundary of the district and separating it from Shimla district rises from Mansarover and touches the district in Nirmand Tehsil opposite to Rampur Tehsil of Shimla district. Its main tributaries from the Kullu district are Kurpan and Ani which originate from Bashleo and Jalori Peaks. These rivers and their tributaries are the life line of the district and these are useful for generation of electric power and raising fishery activities.
2.10 Climate
The climate of the district is cool and dry. There are three broad seasons viz. Cold season from October to February, hot season from March to June and rainy season from July to September. Wind
Climate Change Vulnerability Assessment Report 16
characteristics depend upon season, as it is hot during the months of May and June and coldest in the months of December and January.
Snowfall generally occurs in December and January at higher hills and most of the regions are cut off from the district headquarters since the mountain passes are closed. The district receives moderate rainfall and bulk of it is received during the months of July, August, December and January. August is the wettest month throughout the district. There are three rainfall recording stations in the district. These stations are Kullu, Banjar and Tinder. During the monsoon period, the land becomes fresh and green and the small water channels in the hills begin to swell.
The climate in Kullu is predominantly cold during winter and moderately cool during summer. The temperatures range from 4 °C (39 °F) to 26 °C (79 °F) over the year. The average temperature during summer is between 10 °C (50 °F) and 26 °C (79 °C (5 °F) and 12 °C (54 °F) in the winter.
Climate data for Kullu (1971–2000)Month Jan Feb Mar Apr May Jun Jul Aug Sep Oct Nov Dec Year
Record high °C 19.5 23.5 27.0 30.0 35.0 33.2 32.6 30.6 29.2 30.0 25.6 21.5 35.0
Avg. high °C (°F) 10.6 11.6 15.9 21.9 24.9 27.2 25.9 25.4 25.0 22.5 18.4 13.7 20.4
Avg. low °C (°F) 2.3 5.8 8.5 12.4 15.4 14.9 11.2 5.5 1.5 6.5
Record low °C (°F) 1.0 4.4 7.4 7.0 3.0
Avg. rainfall mm 108.4 133.5 202.3 108.0 78.9 88.0 215.1 221.7 100.4 52.3 43.0 59.5 1,411.1
Average rainy days 6.6 8.2 9.3 6.2 5.7 7.3 14.7 15.0 8.5 3.4 2.8 3.5 80.1
Source: India Meteorological Department (record high and low up to 2010)
Monthly precipitation varies between 31 mm (1.2 in) in November and 217 mm (8.5 in) in July. On average, some 45 mm (1.8 in) of precipitation is received during winter and spring months, increasing to some 115 mm (4.5 in) in summer as the monsoon approaches. The average total annual precipitation is 1,363 mm (53.7 in). Manali experiences snowfall predominantly between December and beginning of March. The month of January is when it is usually the highest.
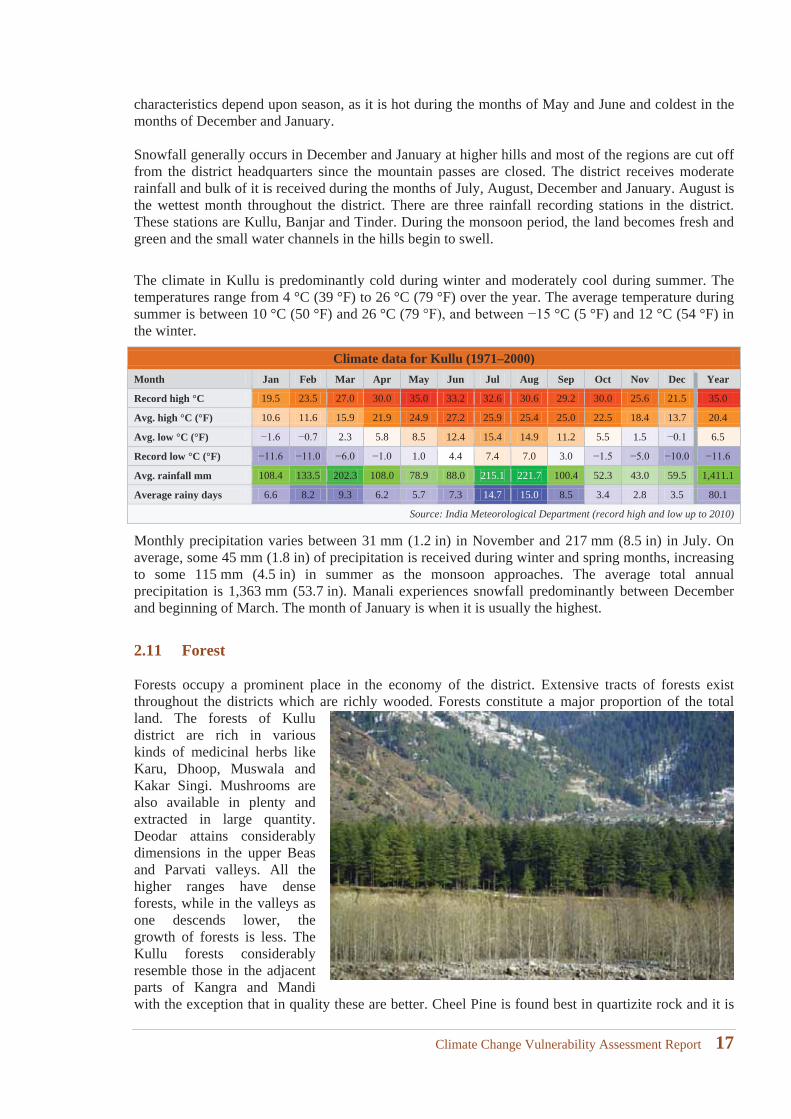
2.11 Forest
Forests occupy a prominent place in the economy of the district. Extensive tracts of forests exist throughout the districts which are richly wooded. Forests constitute a major proportion of the total land. The forests of Kullu district are rich in various kinds of medicinal herbs like Karu, Dhoop, Muswala and Kakar Singi. Mushrooms are also available in plenty and extracted in large quantity. Deodar attains considerably dimensions in the upper Beas and Parvati valleys. All the higher ranges have dense forests, while in the valleys as one descends lower, the growth of forests is less. The Kullu forests considerably resemble those in the adjacent parts of Kangra and Mandi with the exception that in quality these are better. Cheel Pine is found best in quartizite rock and it is
Climate Change Vulnerability Assessment Report 17
available in the Parvati and Tirthan valleys. Wild olive and mulberry are found on lower levels. Extensive forests of common Himalayan oak are found largely in the Hurla valley above 2,400 metres elevation. Spruce and silver fir forests also exist.
The oak, spruce and silver fir trees attain a height of about 61 metres. Hazal, Hornbeam, Yew and Bird Cherry are also found. Birch, Moru, Ban and Rhododendron are found in greater quantity along with willows, Ash, Wild, Apple and Juniper. Tree growth is replaced by Alpine pastures ascending to the limit of vegetation and snow line. These grazing grounds are used for grazing sheep and goats during the summer and also by the ponies where the slope is not too steep. There are many shrubs and plants which provide food, medicines and dyes. Wild strawberry, raspberry and barberry are also found.
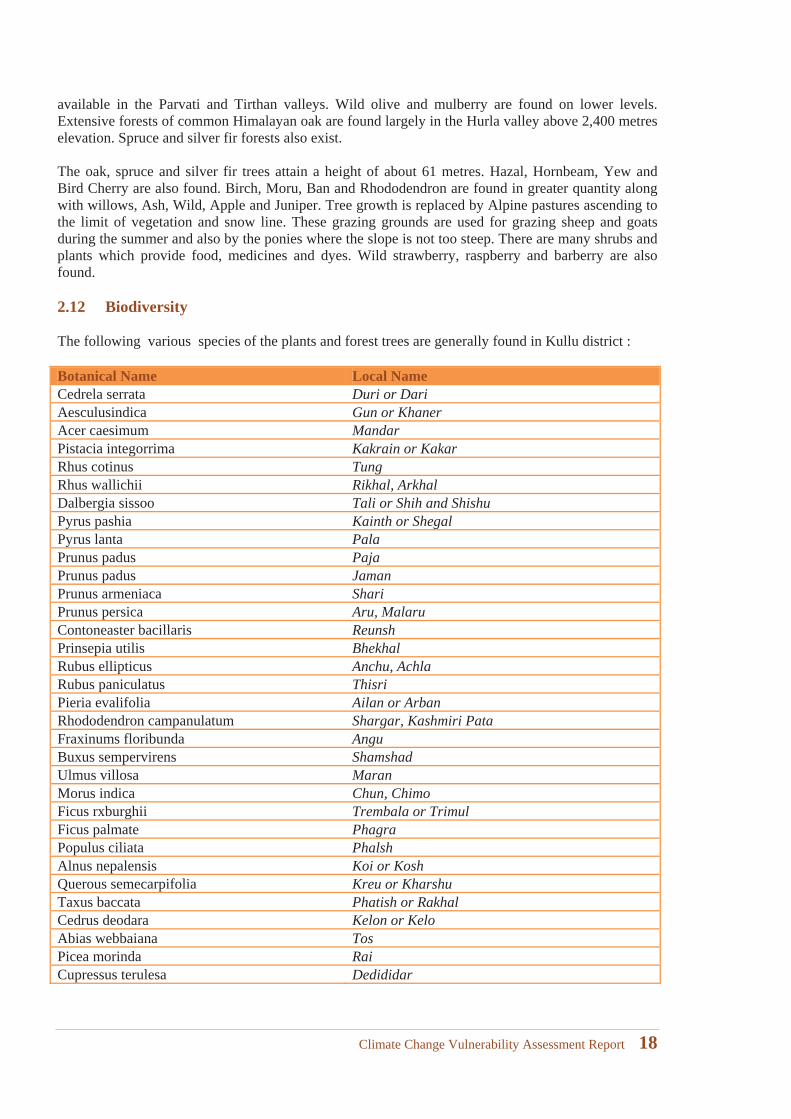
2.12 Biodiversity
The following various species of the plants and forest trees are generally found in Kullu district :
Botanical Name Local NameCedrela serrata Duri or DariAesculusindica Gun or KhanerAcer caesimum MandarPistacia integorrima Kakrain or KakarRhus cotinus TungRhus wallichii Rikhal, ArkhalDalbergia sissoo Tali or Shih and ShishuPyrus pashia Kainth or ShegalPyrus lanta PalaPrunus padus PajaPrunus padus JamanPrunus armeniaca ShariPrunus persica Aru, MalaruContoneaster bacillaris ReunshPrinsepia utilis BhekhalRubus ellipticus Anchu, AchlaRubus paniculatus ThisriPieria evalifolia Ailan or ArbanRhododendron campanulatum Shargar, Kashmiri PataFraxinums floribunda AnguBuxus sempervirens ShamshadUlmus villosa MaranMorus indica Chun, ChimoFicus rxburghii Trembala or TrimulFicus palmate PhagraPopulus ciliata PhalshAlnus nepalensis Koi or KoshQuerous semecarpifolia Kreu or KharshuTaxus baccata Phatish or RakhalCedrus deodara Kelon or KeloAbias webbaiana TosPicea morinda RaiCupressus terulesa Dedididar
Climate Change Vulnerability Assessment Report 18
The district provides habitation and sustenance for numerous fauna. The mountains, forests and streams, abundant food, shelter and water and large stretches of uninhabited and comparatively inaccessible area provide favourable condition for sheltering many kinds of wild life.
Brown and black bear, the spotted and white leopard, musk deer, wild cat, flying squirrel, hyaena, wild pig, jackal, fox and marton are found in the district. The climatic conditions prevailing in the district are most favourable for their regeneration game birds.. Hill pheasant and monal are found inthe higher ranges. The white crested pheasant, koklas and the cheer, red jungle fowl, black and wood partridge, chukor are very common in lower hills. Snipe, wood cock and teal are also found. In winter the snow pheasant and snow partridge are also found along with the wild duck and geese. Eagles, vultures, kites and hawks inhabit the upper fastnesses and occasional specimens have been secured by bird fanciers. Due to considerable pressure on the forests and reckless felling of trees many places have been denuded resulting in the fast disappearance of wild animals and birds.
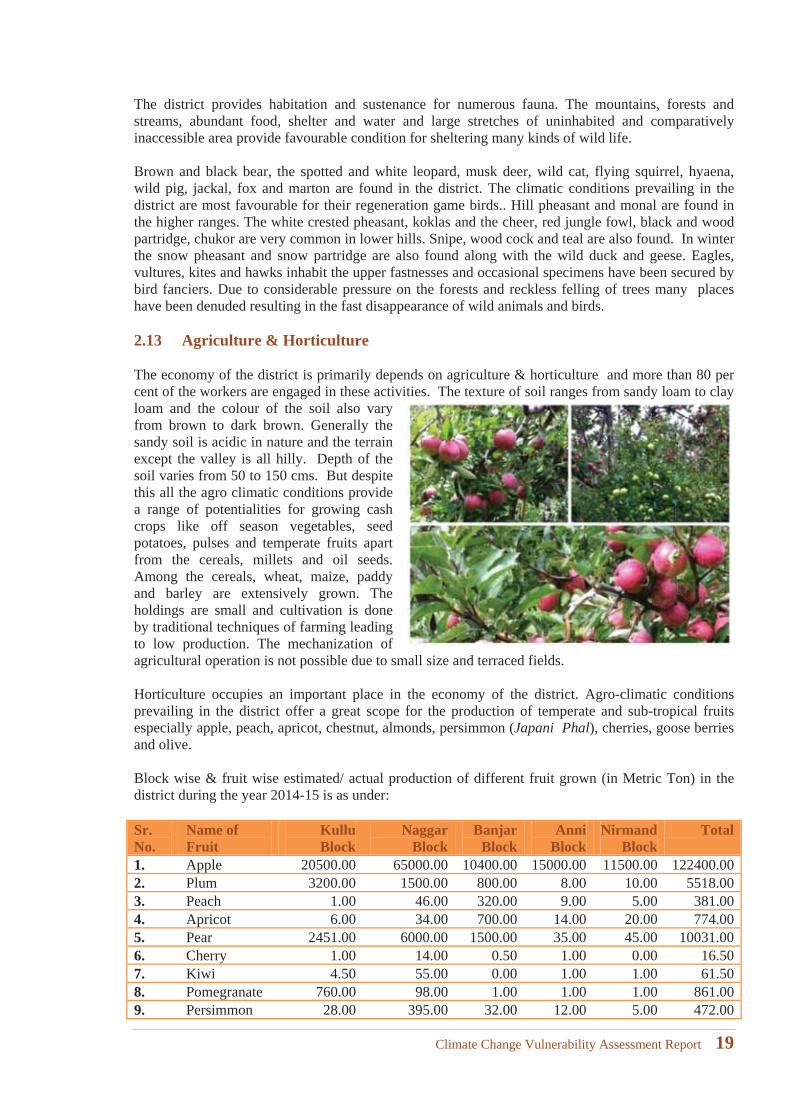
2.13 Agriculture & Horticulture
The economy of the district is primarily depends on agriculture & horticulture and more than 80 per cent of the workers are engaged in these activities. The texture of soil ranges from sandy loam to clay loam and the colour of the soil also vary from brown to dark brown. Generally the sandy soil is acidic in nature and the terrain except the valley is all hilly. Depth of the soil varies from 50 to 150 cms. But despite this all the agro climatic conditions provide a range of potentialities for growing cash crops like off season vegetables, seed potatoes, pulses and temperate fruits apart from the cereals, millets and oil seeds. Among the cereals, wheat, maize, paddy and barley are extensively grown. The holdings are small and cultivation is done by traditional techniques of farming leading to low production. The mechanization of agricultural operation is not possible due to small size and terraced fields.
Horticulture occupies an important place in the economy of the district. Agro-climatic conditions prevailing in the district offer a great scope for the production of temperate and sub-tropical fruits especially apple, peach, apricot, chestnut, almonds, persimmon (Japani Phal), cherries, goose berries and olive.
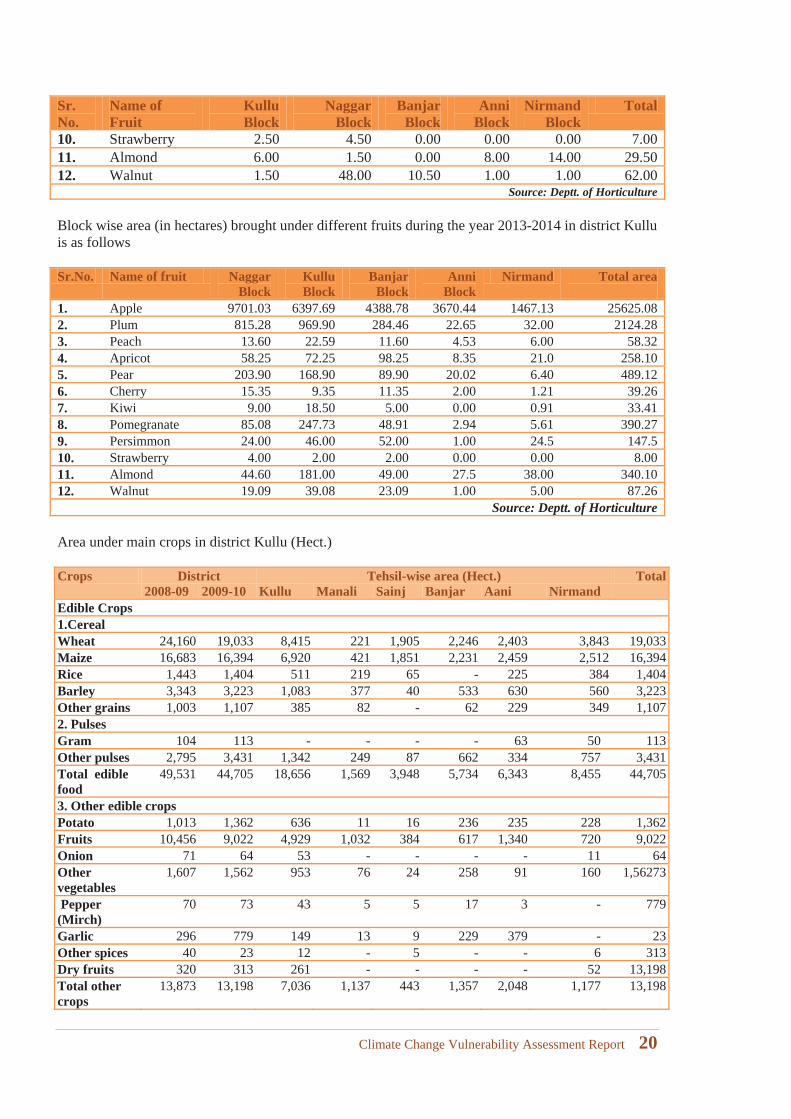
Block wise & fruit wise estimated/ actual production of different fruit grown (in Metric Ton) in the district during the year 2014-15 is as under:
Sr. No.
Name of Fruit
Kullu Block
Naggar Block
BanjarBlock
AnniBlock
NirmandBlock
Total
1. Apple 20500.00 65000.00 10400.00 15000.00 11500.00 122400.002. Plum 3200.00 1500.00 800.00 8.00 10.00 5518.003. Peach 1.00 46.00 320.00 9.00 5.00 381.004. Apricot 6.00 34.00 700.00 14.00 20.00 774.005. Pear 2451.00 6000.00 1500.00 35.00 45.00 10031.006. Cherry 1.00 14.00 0.50 1.00 0.00 16.507. Kiwi 4.50 55.00 0.00 1.00 1.00 61.508. Pomegranate 760.00 98.00 1.00 1.00 1.00 861.009. Persimmon 28.00 395.00 32.00 12.00 5.00 472.00
Climate Change Vulnerability Assessment Report 19
Sr. No.
Name of Fruit
Kullu Block
Naggar Block
BanjarBlock
AnniBlock
NirmandBlock
Total
10. Strawberry 2.50 4.50 0.00 0.00 0.00 7.0011. Almond 6.00 1.50 0.00 8.00 14.00 29.5012. Walnut 1.50 48.00 10.50 1.00 1.00 62.00
Source: Deptt. of Horticulture
Block wise area (in hectares) brought under different fruits during the year 2013-2014 in district Kullu is as follows
Sr.No. Name of fruit NaggarBlock
KulluBlock
BanjarBlock
AnniBlock
Nirmand Total area
1. Apple 9701.03 6397.69 4388.78 3670.44 1467.13 25625.082. Plum 815.28 969.90 284.46 22.65 32.00 2124.283. Peach 13.60 22.59 11.60 4.53 6.00 58.324. Apricot 58.25 72.25 98.25 8.35 21.0 258.105. Pear 203.90 168.90 89.90 20.02 6.40 489.126. Cherry 15.35 9.35 11.35 2.00 1.21 39.267. Kiwi 9.00 18.50 5.00 0.00 0.91 33.418. Pomegranate 85.08 247.73 48.91 2.94 5.61 390.279. Persimmon 24.00 46.00 52.00 1.00 24.5 147.510. Strawberry 4.00 2.00 2.00 0.00 0.00 8.0011. Almond 44.60 181.00 49.00 27.5 38.00 340.1012. Walnut 19.09 39.08 23.09 1.00 5.00 87.26
Source: Deptt. of Horticulture
Area under main crops in district Kullu (Hect.)
Crops District Tehsil-wise area (Hect.) Total2008-09 2009-10 Kullu Manali Sainj Banjar Aani Nirmand
Edible Crops 1.CerealWheat 24,160 19,033 8,415 221 1,905 2,246 2,403 3,843 19,033Maize 16,683 16,394 6,920 421 1,851 2,231 2,459 2,512 16,394Rice 1,443 1,404 511 219 65 - 225 384 1,404Barley 3,343 3,223 1,083 377 40 533 630 560 3,223Other grains 1,003 1,107 385 82 - 62 229 349 1,1072. PulsesGram 104 113 - - - - 63 50 113Other pulses 2,795 3,431 1,342 249 87 662 334 757 3,431Total edible food
49,531 44,705 18,656 1,569 3,948 5,734 6,343 8,455 44,705
3. Other edible cropsPotato 1,013 1,362 636 11 16 236 235 228 1,362Fruits 10,456 9,022 4,929 1,032 384 617 1,340 720 9,022Onion 71 64 53 - - - - 11 64Other vegetables
1,607 1,562 953 76 24 258 91 160 1,56273
Pepper (Mirch)
70 73 43 5 5 17 3 - 779
Garlic 296 779 149 13 9 229 379 - 23Other spices 40 23 12 - 5 - - 6 313Dry fruits 320 313 261 - - - - 52 13,198Total other crops
13,873 13,198 7,036 1,137 443 1,357 2,048 1,177 13,198
Climate Change Vulnerability Assessment Report 20
Crops District Tehsil-wise area (Hect.) Total2008-09 2009-10 Kullu Manali Sainj Banjar Aani Nirmand
Total edible food and other crops
63,404 57,903 25,692 2,706 4,391 7,091 8,391 9,632 57,903
Non Edible crops /Non food cropsEdible
Groundnut and Sesame seed
42 34 - - - - 2 32 34
Non edible Sarson
739 529 450 38 9 12 - 20 529
Soya bean 4 11 6 - 5 - - - 11Tobacco 2 - - - - - - - -Cotton & other fiber crop
- - - - - - - - -
5. Fodder Crops
65 63 63 - - - - - 63
Total non food crops
852 637 519 38 14 12 2 52 637
Total edible & non edible crops
64,256 58,540 26,211 2,744 4,405 7,103 8,393 9,684 58,540
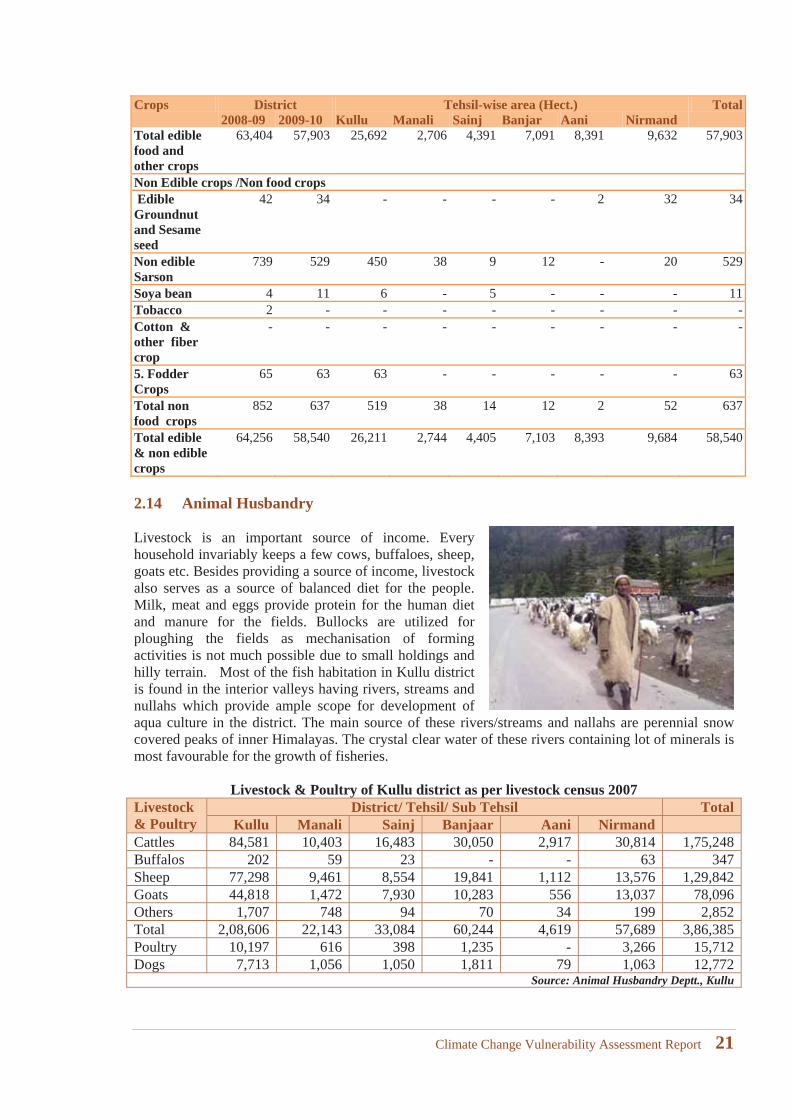
2.14 Animal Husbandry
Livestock is an important source of income. Every household invariably keeps a few cows, buffaloes, sheep, goats etc. Besides providing a source of income, livestock also serves as a source of balanced diet for the people. Milk, meat and eggs provide protein for the human diet and manure for the fields. Bullocks are utilized for ploughing the fields as mechanisation of forming activities is not much possible due to small holdings and hilly terrain. Most of the fish habitation in Kullu district is found in the interior valleys having rivers, streams and nullahs which provide ample scope for development of aqua culture in the district. The main source of these rivers/streams and nallahs are perennial snow covered peaks of inner Himalayas. The crystal clear water of these rivers containing lot of minerals is most favourable for the growth of fisheries.
Livestock & Poultry of Kullu district as per livestock census 2007Livestock& Poultry
District/ Tehsil/ Sub Tehsil TotalKullu Manali Sainj Banjaar Aani Nirmand
Cattles 84,581 10,403 16,483 30,050 2,917 30,814 1,75,248Buffalos 202 59 23 - - 63 347Sheep 77,298 9,461 8,554 19,841 1,112 13,576 1,29,842Goats 44,818 1,472 7,930 10,283 556 13,037 78,096Others 1,707 748 94 70 34 199 2,852Total 2,08,606 22,143 33,084 60,244 4,619 57,689 3,86,385Poultry 10,197 616 398 1,235 - 3,266 15,712Dogs 7,713 1,056 1,050 1,811 79 1,063 12,772
Source: Animal Husbandry Deptt., Kullu
Climate Change Vulnerability Assessment Report 21

Climate Change Vulnerability Assessment Report 22
3 Blocks Profile falling in Beas River Basin: District Kullu
Climate Change Vulnerability Assessment Report 23

Climate Change Vulnerability Assessment Report 24
3. Blocks Profile falling in Beas River Basin: District Kullu
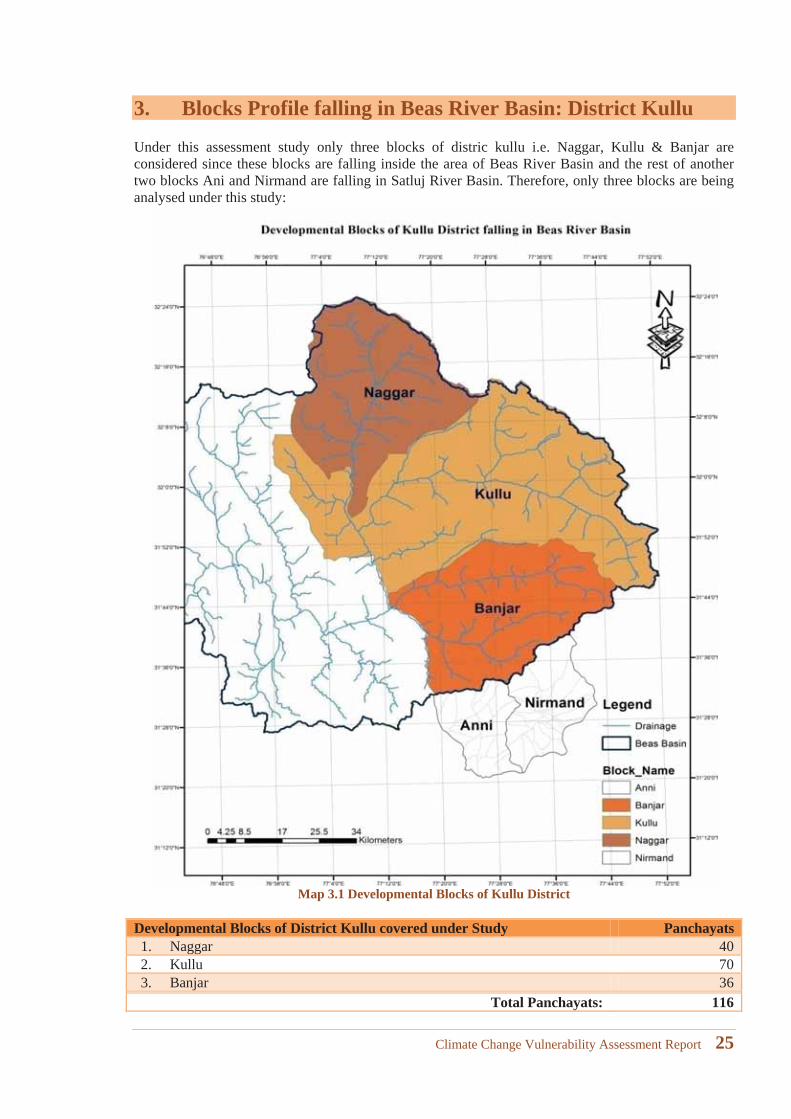
Under this assessment study only three blocks of distric kullu i.e. Naggar, Kullu & Banjar areconsidered since these blocks are falling inside the area of Beas River Basin and the rest of another two blocks Ani and Nirmand are falling in Satluj River Basin. Therefore, only three blocks are being analysed under this study:
Map 3.1 Developmental Blocks of Kullu District
Developmental Blocks of District Kullu covered under Study Panchayats1. Naggar 402. Kullu 703. Banjar 36
Total Panchayats: 116
Climate Change Vulnerability Assessment Report 25
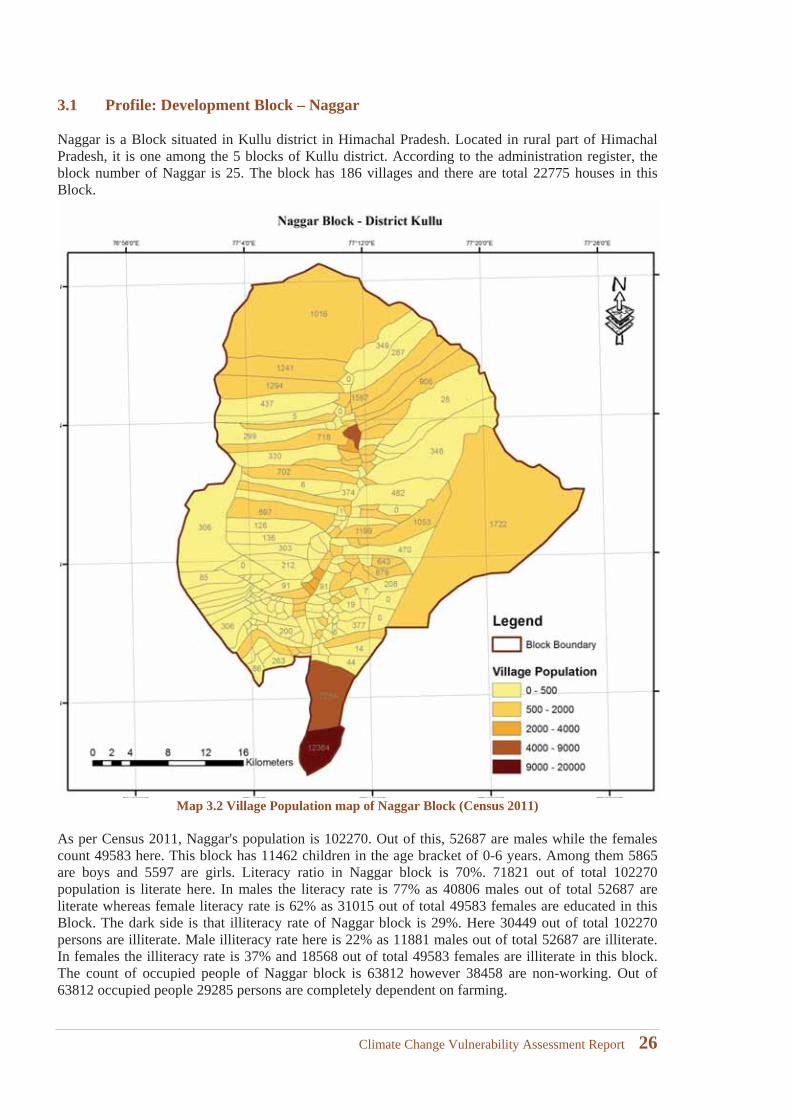
3.1 Profile: Development Block – Naggar
Naggar is a Block situated in Kullu district in Himachal Pradesh. Located in rural part of Himachal Pradesh, it is one among the 5 blocks of Kullu district. According to the administration register, the block number of Naggar is 25. The block has 186 villages and there are total 22775 houses in this Block.
Map 3.2 Village Population map of Naggar Block (Census 2011)
As per Census 2011, Naggar's population is 102270. Out of this, 52687 are males while the females count 49583 here. This block has 11462 children in the age bracket of 0-6 years. Among them 5865 are boys and 5597 are girls. Literacy ratio in Naggar block is 70%. 71821 out of total 102270 population is literate here. In males the literacy rate is 77% as 40806 males out of total 52687 are literate whereas female literacy rate is 62% as 31015 out of total 49583 females are educated in this Block. The dark side is that illiteracy rate of Naggar block is 29%. Here 30449 out of total 102270 persons are illiterate. Male illiteracy rate here is 22% as 11881 males out of total 52687 are illiterate. In females the illiteracy rate is 37% and 18568 out of total 49583 females are illiterate in this block.The count of occupied people of Naggar block is 63812 however 38458 are non-working. Out of 63812 occupied people 29285 persons are completely dependent on farming.
Climate Change Vulnerability Assessment Report 26
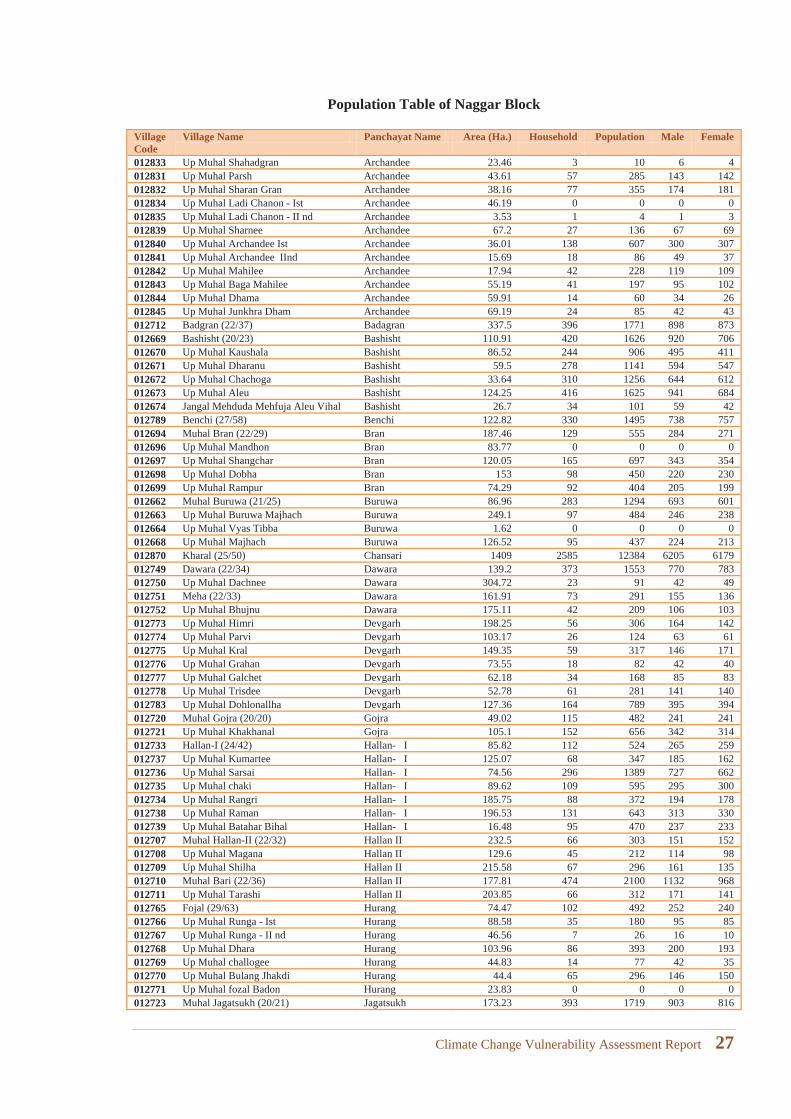
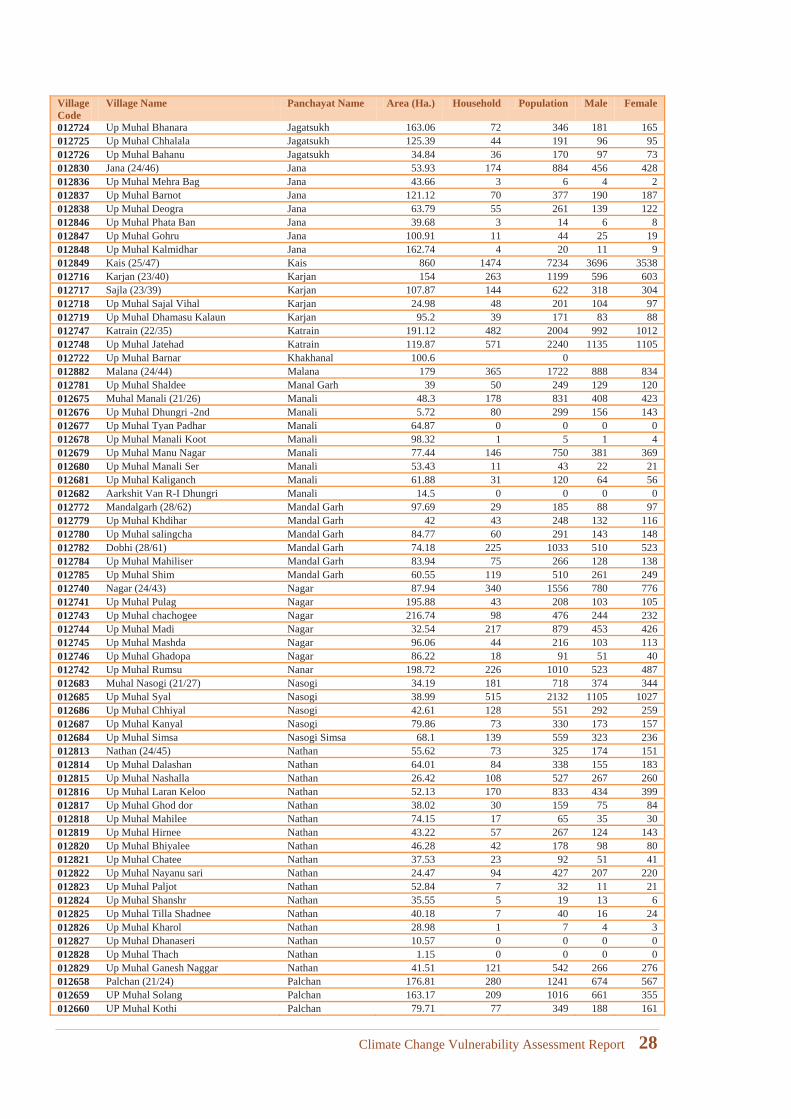
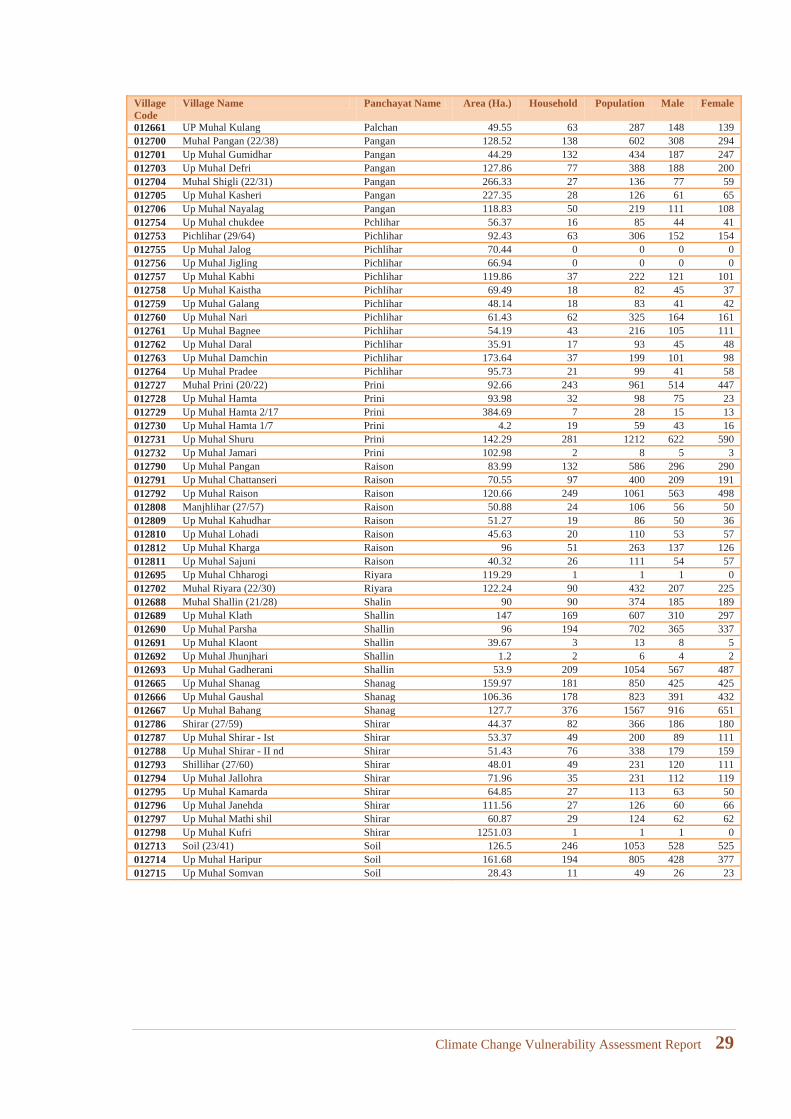
Population Table of Naggar Block
Village Code
Village Name Panchayat Name Area (Ha.) Household Population Male Female
012833 Up Muhal Shahadgran Archandee 23.46 3 10 6 4012831 Up Muhal Parsh Archandee 43.61 57 285 143 142012832 Up Muhal Sharan Gran Archandee 38.16 77 355 174 181012834 Up Muhal Ladi Chanon - Ist Archandee 46.19 0 0 0 0012835 Up Muhal Ladi Chanon - II nd Archandee 3.53 1 4 1 3012839 Up Muhal Sharnee Archandee 67.2 27 136 67 69012840 Up Muhal Archandee Ist Archandee 36.01 138 607 300 307012841 Up Muhal Archandee IInd Archandee 15.69 18 86 49 37012842 Up Muhal Mahilee Archandee 17.94 42 228 119 109012843 Up Muhal Baga Mahilee Archandee 55.19 41 197 95 102012844 Up Muhal Dhama Archandee 59.91 14 60 34 26012845 Up Muhal Junkhra Dham Archandee 69.19 24 85 42 43012712 Badgran (22/37) Badagran 337.5 396 1771 898 873012669 Bashisht (20/23) Bashisht 110.91 420 1626 920 706012670 Up Muhal Kaushala Bashisht 86.52 244 906 495 411012671 Up Muhal Dharanu Bashisht 59.5 278 1141 594 547012672 Up Muhal Chachoga Bashisht 33.64 310 1256 644 612012673 Up Muhal Aleu Bashisht 124.25 416 1625 941 684012674 Jangal Mehduda Mehfuja Aleu Vihal Bashisht 26.7 34 101 59 42012789 Benchi (27/58) Benchi 122.82 330 1495 738 757012694 Muhal Bran (22/29) Bran 187.46 129 555 284 271012696 Up Muhal Mandhon Bran 83.77 0 0 0 0012697 Up Muhal Shangchar Bran 120.05 165 697 343 354012698 Up Muhal Dobha Bran 153 98 450 220 230012699 Up Muhal Rampur Bran 74.29 92 404 205 199012662 Muhal Buruwa (21/25) Buruwa 86.96 283 1294 693 601012663 Up Muhal Buruwa Majhach Buruwa 249.1 97 484 246 238012664 Up Muhal Vyas Tibba Buruwa 1.62 0 0 0 0012668 Up Muhal Majhach Buruwa 126.52 95 437 224 213012870 Kharal (25/50) Chansari 1409 2585 12384 6205 6179012749 Dawara (22/34) Dawara 139.2 373 1553 770 783012750 Up Muhal Dachnee Dawara 304.72 23 91 42 49012751 Meha (22/33) Dawara 161.91 73 291 155 136012752 Up Muhal Bhujnu Dawara 175.11 42 209 106 103012773 Up Muhal Himri Devgarh 198.25 56 306 164 142012774 Up Muhal Parvi Devgarh 103.17 26 124 63 61012775 Up Muhal Kral Devgarh 149.35 59 317 146 171012776 Up Muhal Grahan Devgarh 73.55 18 82 42 40012777 Up Muhal Galchet Devgarh 62.18 34 168 85 83012778 Up Muhal Trisdee Devgarh 52.78 61 281 141 140012783 Up Muhal Dohlonallha Devgarh 127.36 164 789 395 394012720 Muhal Gojra (20/20) Gojra 49.02 115 482 241 241012721 Up Muhal Khakhanal Gojra 105.1 152 656 342 314012733 Hallan-I (24/42) Hallan- I 85.82 112 524 265 259012737 Up Muhal Kumartee Hallan- I 125.07 68 347 185 162012736 Up Muhal Sarsai Hallan- I 74.56 296 1389 727 662012735 Up Muhal chaki Hallan- I 89.62 109 595 295 300012734 Up Muhal Rangri Hallan- I 185.75 88 372 194 178012738 Up Muhal Raman Hallan- I 196.53 131 643 313 330012739 Up Muhal Batahar Bihal Hallan- I 16.48 95 470 237 233012707 Muhal Hallan-II (22/32) Hallan II 232.5 66 303 151 152012708 Up Muhal Magana Hallan II 129.6 45 212 114 98012709 Up Muhal Shilha Hallan II 215.58 67 296 161 135012710 Muhal Bari (22/36) Hallan II 177.81 474 2100 1132 968012711 Up Muhal Tarashi Hallan II 203.85 66 312 171 141012765 Fojal (29/63) Hurang 74.47 102 492 252 240012766 Up Muhal Runga - Ist Hurang 88.58 35 180 95 85012767 Up Muhal Runga - II nd Hurang 46.56 7 26 16 10012768 Up Muhal Dhara Hurang 103.96 86 393 200 193012769 Up Muhal challogee Hurang 44.83 14 77 42 35012770 Up Muhal Bulang Jhakdi Hurang 44.4 65 296 146 150012771 Up Muhal fozal Badon Hurang 23.83 0 0 0 0012723 Muhal Jagatsukh (20/21) Jagatsukh 173.23 393 1719 903 816
Climate Change Vulnerability Assessment Report 27
Village Code
Village Name Panchayat Name Area (Ha.) Household Population Male Female
012724 Up Muhal Bhanara Jagatsukh 163.06 72 346 181 165012725 Up Muhal Chhalala Jagatsukh 125.39 44 191 96 95012726 Up Muhal Bahanu Jagatsukh 34.84 36 170 97 73012830 Jana (24/46) Jana 53.93 174 884 456 428012836 Up Muhal Mehra Bag Jana 43.66 3 6 4 2012837 Up Muhal Barnot Jana 121.12 70 377 190 187012838 Up Muhal Deogra Jana 63.79 55 261 139 122012846 Up Muhal Phata Ban Jana 39.68 3 14 6 8012847 Up Muhal Gohru Jana 100.91 11 44 25 19012848 Up Muhal Kalmidhar Jana 162.74 4 20 11 9012849 Kais (25/47) Kais 860 1474 7234 3696 3538012716 Karjan (23/40) Karjan 154 263 1199 596 603012717 Sajla (23/39) Karjan 107.87 144 622 318 304012718 Up Muhal Sajal Vihal Karjan 24.98 48 201 104 97012719 Up Muhal Dhamasu Kalaun Karjan 95.2 39 171 83 88012747 Katrain (22/35) Katrain 191.12 482 2004 992 1012012748 Up Muhal Jatehad Katrain 119.87 571 2240 1135 1105012722 Up Muhal Barnar Khakhanal 100.6 0012882 Malana (24/44) Malana 179 365 1722 888 834012781 Up Muhal Shaldee Manal Garh 39 50 249 129 120012675 Muhal Manali (21/26) Manali 48.3 178 831 408 423012676 Up Muhal Dhungri -2nd Manali 5.72 80 299 156 143012677 Up Muhal Tyan Padhar Manali 64.87 0 0 0 0012678 Up Muhal Manali Koot Manali 98.32 1 5 1 4012679 Up Muhal Manu Nagar Manali 77.44 146 750 381 369012680 Up Muhal Manali Ser Manali 53.43 11 43 22 21012681 Up Muhal Kaliganch Manali 61.88 31 120 64 56012682 Aarkshit Van R-I Dhungri Manali 14.5 0 0 0 0012772 Mandalgarh (28/62) Mandal Garh 97.69 29 185 88 97012779 Up Muhal Khdihar Mandal Garh 42 43 248 132 116012780 Up Muhal salingcha Mandal Garh 84.77 60 291 143 148012782 Dobhi (28/61) Mandal Garh 74.18 225 1033 510 523012784 Up Muhal Mahiliser Mandal Garh 83.94 75 266 128 138012785 Up Muhal Shim Mandal Garh 60.55 119 510 261 249012740 Nagar (24/43) Nagar 87.94 340 1556 780 776012741 Up Muhal Pulag Nagar 195.88 43 208 103 105012743 Up Muhal chachogee Nagar 216.74 98 476 244 232012744 Up Muhal Madi Nagar 32.54 217 879 453 426012745 Up Muhal Mashda Nagar 96.06 44 216 103 113012746 Up Muhal Ghadopa Nagar 86.22 18 91 51 40012742 Up Muhal Rumsu Nanar 198.72 226 1010 523 487012683 Muhal Nasogi (21/27) Nasogi 34.19 181 718 374 344012685 Up Muhal Syal Nasogi 38.99 515 2132 1105 1027012686 Up Muhal Chhiyal Nasogi 42.61 128 551 292 259012687 Up Muhal Kanyal Nasogi 79.86 73 330 173 157012684 Up Muhal Simsa Nasogi Simsa 68.1 139 559 323 236012813 Nathan (24/45) Nathan 55.62 73 325 174 151012814 Up Muhal Dalashan Nathan 64.01 84 338 155 183012815 Up Muhal Nashalla Nathan 26.42 108 527 267 260012816 Up Muhal Laran Keloo Nathan 52.13 170 833 434 399012817 Up Muhal Ghod dor Nathan 38.02 30 159 75 84012818 Up Muhal Mahilee Nathan 74.15 17 65 35 30012819 Up Muhal Hirnee Nathan 43.22 57 267 124 143012820 Up Muhal Bhiyalee Nathan 46.28 42 178 98 80012821 Up Muhal Chatee Nathan 37.53 23 92 51 41012822 Up Muhal Nayanu sari Nathan 24.47 94 427 207 220012823 Up Muhal Paljot Nathan 52.84 7 32 11 21012824 Up Muhal Shanshr Nathan 35.55 5 19 13 6012825 Up Muhal Tilla Shadnee Nathan 40.18 7 40 16 24012826 Up Muhal Kharol Nathan 28.98 1 7 4 3012827 Up Muhal Dhanaseri Nathan 10.57 0 0 0 0012828 Up Muhal Thach Nathan 1.15 0 0 0 0012829 Up Muhal Ganesh Naggar Nathan 41.51 121 542 266 276012658 Palchan (21/24) Palchan 176.81 280 1241 674 567012659 UP Muhal Solang Palchan 163.17 209 1016 661 355012660 UP Muhal Kothi Palchan 79.71 77 349 188 161
Climate Change Vulnerability Assessment Report 28
Village Code
Village Name Panchayat Name Area (Ha.) Household Population Male Female
012661 UP Muhal Kulang Palchan 49.55 63 287 148 139012700 Muhal Pangan (22/38) Pangan 128.52 138 602 308 294012701 Up Muhal Gumidhar Pangan 44.29 132 434 187 247012703 Up Muhal Defri Pangan 127.86 77 388 188 200012704 Muhal Shigli (22/31) Pangan 266.33 27 136 77 59012705 Up Muhal Kasheri Pangan 227.35 28 126 61 65012706 Up Muhal Nayalag Pangan 118.83 50 219 111 108012754 Up Muhal chukdee Pchlihar 56.37 16 85 44 41012753 Pichlihar (29/64) Pichlihar 92.43 63 306 152 154012755 Up Muhal Jalog Pichlihar 70.44 0 0 0 0012756 Up Muhal Jigling Pichlihar 66.94 0 0 0 0012757 Up Muhal Kabhi Pichlihar 119.86 37 222 121 101012758 Up Muhal Kaistha Pichlihar 69.49 18 82 45 37012759 Up Muhal Galang Pichlihar 48.14 18 83 41 42012760 Up Muhal Nari Pichlihar 61.43 62 325 164 161012761 Up Muhal Bagnee Pichlihar 54.19 43 216 105 111012762 Up Muhal Daral Pichlihar 35.91 17 93 45 48012763 Up Muhal Damchin Pichlihar 173.64 37 199 101 98012764 Up Muhal Pradee Pichlihar 95.73 21 99 41 58012727 Muhal Prini (20/22) Prini 92.66 243 961 514 447012728 Up Muhal Hamta Prini 93.98 32 98 75 23012729 Up Muhal Hamta 2/17 Prini 384.69 7 28 15 13012730 Up Muhal Hamta 1/7 Prini 4.2 19 59 43 16012731 Up Muhal Shuru Prini 142.29 281 1212 622 590012732 Up Muhal Jamari Prini 102.98 2 8 5 3012790 Up Muhal Pangan Raison 83.99 132 586 296 290012791 Up Muhal Chattanseri Raison 70.55 97 400 209 191012792 Up Muhal Raison Raison 120.66 249 1061 563 498012808 Manjhlihar (27/57) Raison 50.88 24 106 56 50012809 Up Muhal Kahudhar Raison 51.27 19 86 50 36012810 Up Muhal Lohadi Raison 45.63 20 110 53 57012812 Up Muhal Kharga Raison 96 51 263 137 126012811 Up Muhal Sajuni Raison 40.32 26 111 54 57012695 Up Muhal Chharogi Riyara 119.29 1 1 1 0012702 Muhal Riyara (22/30) Riyara 122.24 90 432 207 225012688 Muhal Shallin (21/28) Shalin 90 90 374 185 189012689 Up Muhal Klath Shallin 147 169 607 310 297012690 Up Muhal Parsha Shallin 96 194 702 365 337012691 Up Muhal Klaont Shallin 39.67 3 13 8 5012692 Up Muhal Jhunjhari Shallin 1.2 2 6 4 2012693 Up Muhal Gadherani Shallin 53.9 209 1054 567 487012665 Up Muhal Shanag Shanag 159.97 181 850 425 425012666 Up Muhal Gaushal Shanag 106.36 178 823 391 432012667 Up Muhal Bahang Shanag 127.7 376 1567 916 651012786 Shirar (27/59) Shirar 44.37 82 366 186 180012787 Up Muhal Shirar - Ist Shirar 53.37 49 200 89 111012788 Up Muhal Shirar - II nd Shirar 51.43 76 338 179 159012793 Shillihar (27/60) Shirar 48.01 49 231 120 111012794 Up Muhal Jallohra Shirar 71.96 35 231 112 119012795 Up Muhal Kamarda Shirar 64.85 27 113 63 50012796 Up Muhal Janehda Shirar 111.56 27 126 60 66012797 Up Muhal Mathi shil Shirar 60.87 29 124 62 62012798 Up Muhal Kufri Shirar 1251.03 1 1 1 0012713 Soil (23/41) Soil 126.5 246 1053 528 525012714 Up Muhal Haripur Soil 161.68 194 805 428 377012715 Up Muhal Somvan Soil 28.43 11 49 26 23
Climate Change Vulnerability Assessment Report 29
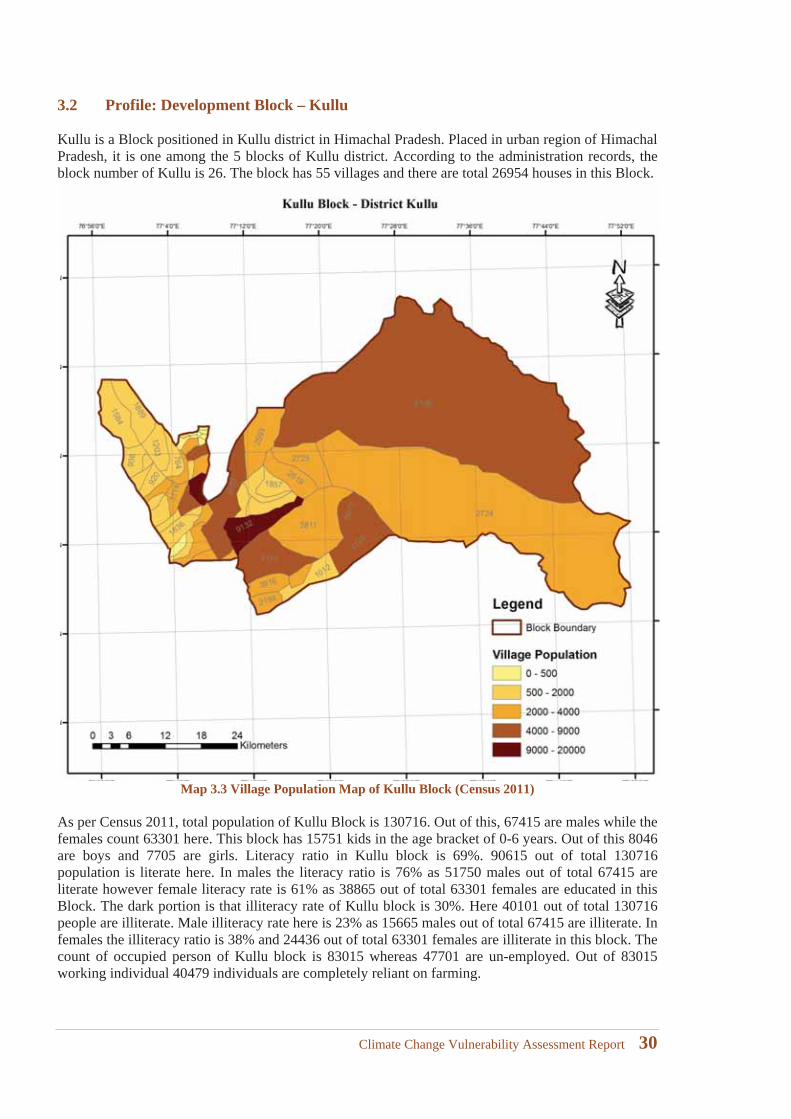
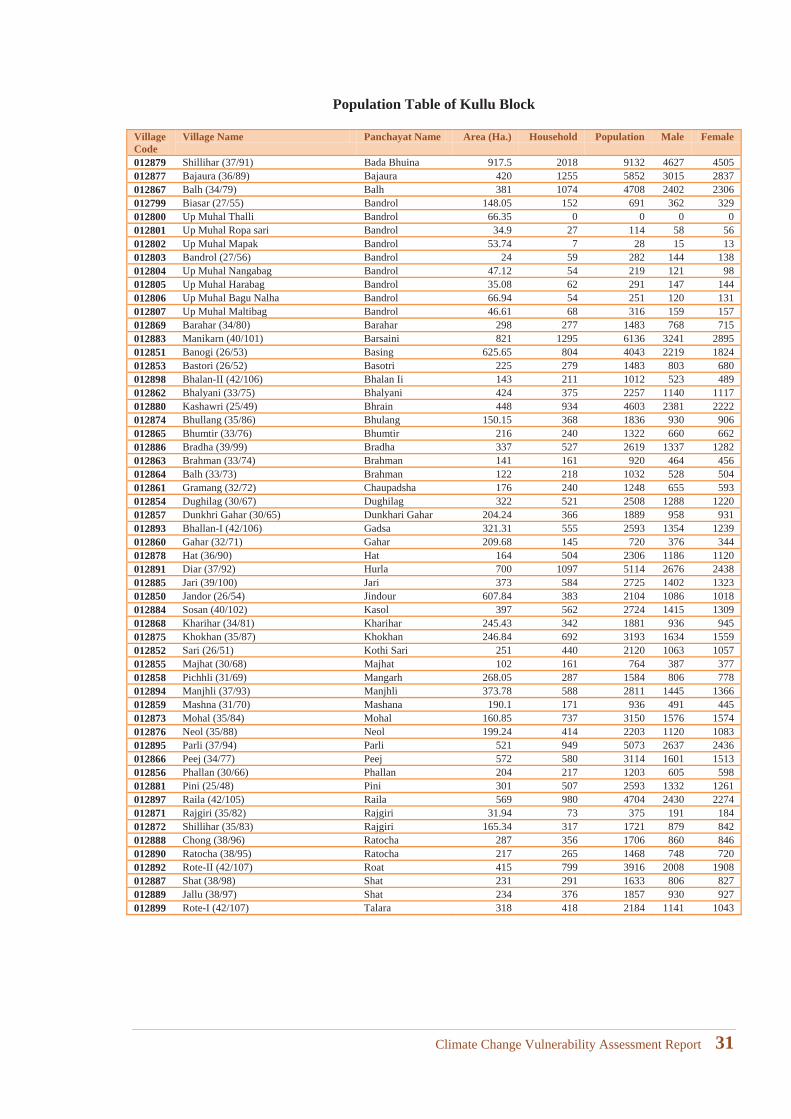
3.2 Profile: Development Block – Kullu
Kullu is a Block positioned in Kullu district in Himachal Pradesh. Placed in urban region of Himachal Pradesh, it is one among the 5 blocks of Kullu district. According to the administration records, the block number of Kullu is 26. The block has 55 villages and there are total 26954 houses in this Block.
Map 3.3 Village Population Map of Kullu Block (Census 2011)
As per Census 2011, total population of Kullu Block is 130716. Out of this, 67415 are males while the females count 63301 here. This block has 15751 kids in the age bracket of 0-6 years. Out of this 8046 are boys and 7705 are girls. Literacy ratio in Kullu block is 69%. 90615 out of total 130716 population is literate here. In males the literacy ratio is 76% as 51750 males out of total 67415 are literate however female literacy rate is 61% as 38865 out of total 63301 females are educated in this Block. The dark portion is that illiteracy rate of Kullu block is 30%. Here 40101 out of total 130716 people are illiterate. Male illiteracy rate here is 23% as 15665 males out of total 67415 are illiterate. In females the illiteracy ratio is 38% and 24436 out of total 63301 females are illiterate in this block. The count of occupied person of Kullu block is 83015 whereas 47701 are un-employed. Out of 83015 working individual 40479 individuals are completely reliant on farming.
Climate Change Vulnerability Assessment Report 30
Population Table of Kullu Block
Village Code
Village Name Panchayat Name Area (Ha.) Household Population Male Female
012879 Shillihar (37/91) Bada Bhuina 917.5 2018 9132 4627 4505012877 Bajaura (36/89) Bajaura 420 1255 5852 3015 2837012867 Balh (34/79) Balh 381 1074 4708 2402 2306012799 Biasar (27/55) Bandrol 148.05 152 691 362 329012800 Up Muhal Thalli Bandrol 66.35 0 0 0 0012801 Up Muhal Ropa sari Bandrol 34.9 27 114 58 56012802 Up Muhal Mapak Bandrol 53.74 7 28 15 13012803 Bandrol (27/56) Bandrol 24 59 282 144 138012804 Up Muhal Nangabag Bandrol 47.12 54 219 121 98012805 Up Muhal Harabag Bandrol 35.08 62 291 147 144012806 Up Muhal Bagu Nalha Bandrol 66.94 54 251 120 131012807 Up Muhal Maltibag Bandrol 46.61 68 316 159 157012869 Barahar (34/80) Barahar 298 277 1483 768 715012883 Manikarn (40/101) Barsaini 821 1295 6136 3241 2895012851 Banogi (26/53) Basing 625.65 804 4043 2219 1824012853 Bastori (26/52) Basotri 225 279 1483 803 680012898 Bhalan-II (42/106) Bhalan Ii 143 211 1012 523 489012862 Bhalyani (33/75) Bhalyani 424 375 2257 1140 1117012880 Kashawri (25/49) Bhrain 448 934 4603 2381 2222012874 Bhullang (35/86) Bhulang 150.15 368 1836 930 906012865 Bhumtir (33/76) Bhumtir 216 240 1322 660 662012886 Bradha (39/99) Bradha 337 527 2619 1337 1282012863 Brahman (33/74) Brahman 141 161 920 464 456012864 Balh (33/73) Brahman 122 218 1032 528 504012861 Gramang (32/72) Chaupadsha 176 240 1248 655 593012854 Dughilag (30/67) Dughilag 322 521 2508 1288 1220012857 Dunkhri Gahar (30/65) Dunkhari Gahar 204.24 366 1889 958 931012893 Bhallan-I (42/106) Gadsa 321.31 555 2593 1354 1239012860 Gahar (32/71) Gahar 209.68 145 720 376 344012878 Hat (36/90) Hat 164 504 2306 1186 1120012891 Diar (37/92) Hurla 700 1097 5114 2676 2438012885 Jari (39/100) Jari 373 584 2725 1402 1323012850 Jandor (26/54) Jindour 607.84 383 2104 1086 1018012884 Sosan (40/102) Kasol 397 562 2724 1415 1309012868 Kharihar (34/81) Kharihar 245.43 342 1881 936 945012875 Khokhan (35/87) Khokhan 246.84 692 3193 1634 1559012852 Sari (26/51) Kothi Sari 251 440 2120 1063 1057012855 Majhat (30/68) Majhat 102 161 764 387 377012858 Pichhli (31/69) Mangarh 268.05 287 1584 806 778012894 Manjhli (37/93) Manjhli 373.78 588 2811 1445 1366012859 Mashna (31/70) Mashana 190.1 171 936 491 445012873 Mohal (35/84) Mohal 160.85 737 3150 1576 1574012876 Neol (35/88) Neol 199.24 414 2203 1120 1083012895 Parli (37/94) Parli 521 949 5073 2637 2436012866 Peej (34/77) Peej 572 580 3114 1601 1513012856 Phallan (30/66) Phallan 204 217 1203 605 598012881 Pini (25/48) Pini 301 507 2593 1332 1261012897 Raila (42/105) Raila 569 980 4704 2430 2274012871 Rajgiri (35/82) Rajgiri 31.94 73 375 191 184012872 Shillihar (35/83) Rajgiri 165.34 317 1721 879 842012888 Chong (38/96) Ratocha 287 356 1706 860 846012890 Ratocha (38/95) Ratocha 217 265 1468 748 720012892 Rote-II (42/107) Roat 415 799 3916 2008 1908012887 Shat (38/98) Shat 231 291 1633 806 827012889 Jallu (38/97) Shat 234 376 1857 930 927012899 Rote-I (42/107) Talara 318 418 2184 1141 1043
Climate Change Vulnerability Assessment Report 31
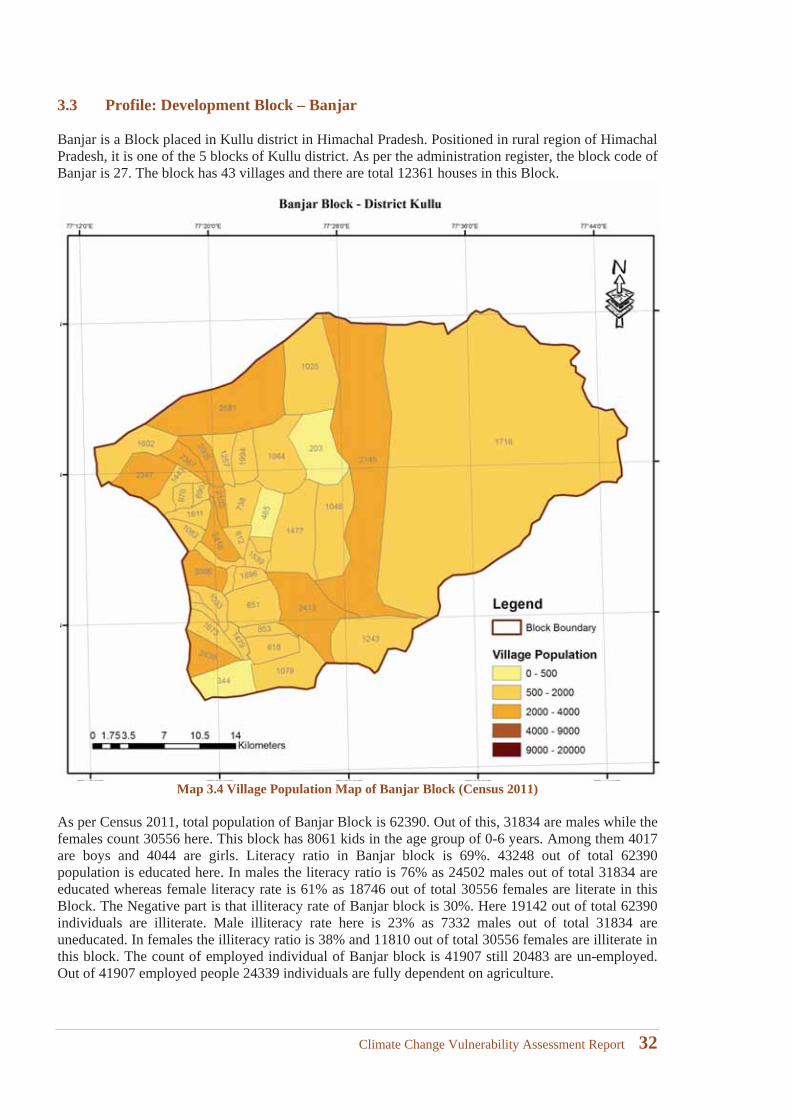
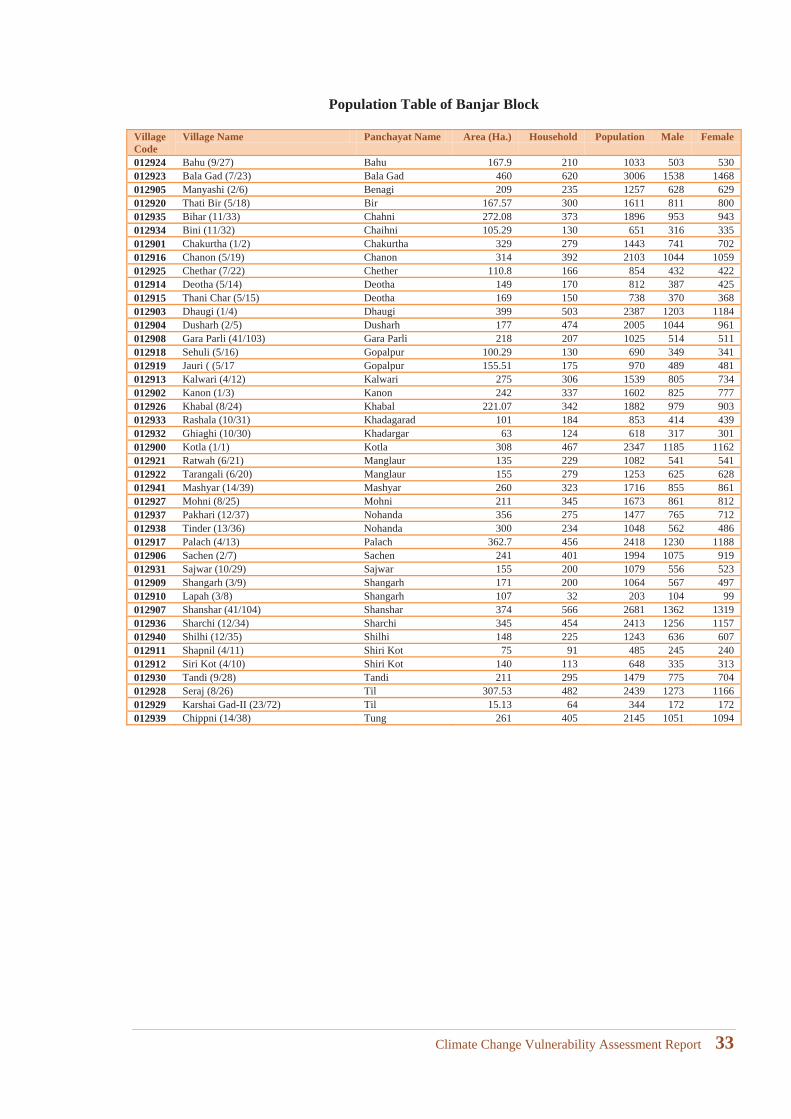
3.3 Profile: Development Block – Banjar
Banjar is a Block placed in Kullu district in Himachal Pradesh. Positioned in rural region of Himachal Pradesh, it is one of the 5 blocks of Kullu district. As per the administration register, the block code of Banjar is 27. The block has 43 villages and there are total 12361 houses in this Block.
Map 3.4 Village Population Map of Banjar Block (Census 2011)
As per Census 2011, total population of Banjar Block is 62390. Out of this, 31834 are males while the females count 30556 here. This block has 8061 kids in the age group of 0-6 years. Among them 4017 are boys and 4044 are girls. Literacy ratio in Banjar block is 69%. 43248 out of total 62390 population is educated here. In males the literacy ratio is 76% as 24502 males out of total 31834 are educated whereas female literacy rate is 61% as 18746 out of total 30556 females are literate in this Block. The Negative part is that illiteracy rate of Banjar block is 30%. Here 19142 out of total 62390 individuals are illiterate. Male illiteracy rate here is 23% as 7332 males out of total 31834 are uneducated. In females the illiteracy ratio is 38% and 11810 out of total 30556 females are illiterate in this block. The count of employed individual of Banjar block is 41907 still 20483 are un-employed. Out of 41907 employed people 24339 individuals are fully dependent on agriculture.
Climate Change Vulnerability Assessment Report 32
Population Table of Banjar Block
Village Code
Village Name Panchayat Name Area (Ha.) Household Population Male Female
012924 Bahu (9/27) Bahu 167.9 210 1033 503 530012923 Bala Gad (7/23) Bala Gad 460 620 3006 1538 1468012905 Manyashi (2/6) Benagi 209 235 1257 628 629012920 Thati Bir (5/18) Bir 167.57 300 1611 811 800012935 Bihar (11/33) Chahni 272.08 373 1896 953 943012934 Bini (11/32) Chaihni 105.29 130 651 316 335012901 Chakurtha (1/2) Chakurtha 329 279 1443 741 702012916 Chanon (5/19) Chanon 314 392 2103 1044 1059012925 Chethar (7/22) Chether 110.8 166 854 432 422012914 Deotha (5/14) Deotha 149 170 812 387 425012915 Thani Char (5/15) Deotha 169 150 738 370 368012903 Dhaugi (1/4) Dhaugi 399 503 2387 1203 1184012904 Dusharh (2/5) Dusharh 177 474 2005 1044 961012908 Gara Parli (41/103) Gara Parli 218 207 1025 514 511012918 Sehuli (5/16) Gopalpur 100.29 130 690 349 341012919 Jauri ( (5/17 Gopalpur 155.51 175 970 489 481012913 Kalwari (4/12) Kalwari 275 306 1539 805 734012902 Kanon (1/3) Kanon 242 337 1602 825 777012926 Khabal (8/24) Khabal 221.07 342 1882 979 903012933 Rashala (10/31) Khadagarad 101 184 853 414 439012932 Ghiaghi (10/30) Khadargar 63 124 618 317 301012900 Kotla (1/1) Kotla 308 467 2347 1185 1162012921 Ratwah (6/21) Manglaur 135 229 1082 541 541012922 Tarangali (6/20) Manglaur 155 279 1253 625 628012941 Mashyar (14/39) Mashyar 260 323 1716 855 861012927 Mohni (8/25) Mohni 211 345 1673 861 812012937 Pakhari (12/37) Nohanda 356 275 1477 765 712012938 Tinder (13/36) Nohanda 300 234 1048 562 486012917 Palach (4/13) Palach 362.7 456 2418 1230 1188012906 Sachen (2/7) Sachen 241 401 1994 1075 919012931 Sajwar (10/29) Sajwar 155 200 1079 556 523012909 Shangarh (3/9) Shangarh 171 200 1064 567 497012910 Lapah (3/8) Shangarh 107 32 203 104 99012907 Shanshar (41/104) Shanshar 374 566 2681 1362 1319012936 Sharchi (12/34) Sharchi 345 454 2413 1256 1157012940 Shilhi (12/35) Shilhi 148 225 1243 636 607012911 Shapnil (4/11) Shiri Kot 75 91 485 245 240012912 Siri Kot (4/10) Shiri Kot 140 113 648 335 313012930 Tandi (9/28) Tandi 211 295 1479 775 704012928 Seraj (8/26) Til 307.53 482 2439 1273 1166012929 Karshai Gad-II (23/72) Til 15.13 64 344 172 172012939 Chippni (14/38) Tung 261 405 2145 1051 1094
Climate Change Vulnerability Assessment Report 33

Climate Change Vulnerability Assessment Report 34
4 Climate Change: District Kullu
Climate Change Vulnerability Assessment Report 35

Climate Change Vulnerability Assessment Report 36
4 Climate Change: District KulluAs per the references available, climate change is reality as far as farmers in Himachal Pradesh areconcerned and more particularly farmers in Kullu valley are the worst affected. Failure of large number of crops and decline in apple production due to rising temperature and reducing chilling hours during the last two decades have affected more than 80% peoples livelihood dependent onagricultural pursuits. Following points indicates vulnerability of Kullu district to the changing climate.
(i) Kullu valley is witnessing unusual congestion of multiple economic processes happening simultaneously.
(ii) Dwindling population of honeybees in wild fauna, a cause of concern to apple production.(iii) Dependence of 92% of cultivated area on rains for its water requirements as only 7.92%
of the net cultivated area is under irrigation. (iv) Dependence of large percentage of rural population on forests, agriculture and horticulture
based livelihood. (v) Agriculture is the main occupation of around three quarter of the total rural population and
apple cultivation/ production is the major source of income. (vi) The Beas River is the life line of the district on which the entire economic growth and
livelihood about 90% people depends.(vii) Indicators of warming trend of Himalayas have become perceptible, visible and measureable
and have forced farmers to abandon one set of crops and adopt new ones as it has become unprofitable to grow apples in lower parts of the valley.
(viii) Himalayan glaciers and alpine grasslands two most sensitive hot spots identified and indicated at national level are having sizable presence in the Kullu valley.
(ix) 37% of the geographical area of the district lies in high sensitive seismic zone –V.(x) Kullu valley is a part of Himalayan Geothermal Province (HPG) and a number of hot water
spring are located here.
The manifestation of the climate change in Kullu valley has been noticed as below:
The observations made by independent studies indicates that in the recent years temperature has risen in the Kullu valley more than anywhere else. The scenario for the valley would be very severe as indicated by future projections made based on regional climate model of the Hadley Centre (HaDRM3). The projection for Kullu indicates a rise of more than 2.47oc temperature accompanied by substantial decline in precipitation during critical months.In consequence to the rising temperature and windward disposition glacier retreat in the valley has been observed to be more than anywhere else. Number of moraine dammed and glacial lakes formation posing GLOF threat is also relatively higher in comparison to other river basins.Decrease in rainfall and particularly in winter precipitation coupled with rising winter temperature has affected the apple belt more than in other valleys. The shift in apple belt is also more perceptible than in other parts of the State.The valley has maximum concentration of eco sensitive areas such as wildlife sanctuaries and an important Great National Park. The studies available so for indicate maximum shift in vegetation species recorded in the valley. Increasing anthropogenic stress on account of undesirable interference from power projects and tourism. The Kullu valley has the largest number of mega power projects under implementation.Increasing frequency of weather related hazards such as cloud bursts and flash floods. Exponential increase in the ecological foot prints of tourist towns such as Manali surpassing the carrying capacity. Identification of Kullu district for implementing water challenges by the technology mission war for water.Adverse impact on the livelihood of marginal farmers and increasing threat to social harmony in otherwise exclusive and contended society
Climate Change Vulnerability Assessment Report 37
Fast rate of glacier melting and increasing frequency of natural disasters such as floods, flash-floods, and cloud burst etc. Shifting agriculture and horticulture areas is also threatening the cultural harmony changing social milieu.
In view of the fact that a large number of mega project such as construction of Rohtang tunnel is about to complete and projects for harnessing power potential worth 5500 MW are in the pipeline it would be imperative that a rigorous assessment of the situation made for understanding the sociological, biological, geophysical and livelihood implications of changing climate and a adaptation strategy is put in place for coping with the situation. The impact of change in weather components such as rainfall and temperature even on large number of crops and vegetable that are grown in the valley have been noticed. Significant impact on cauliflower and cabbage has been successfully documented. Over all one can conclude that the climate change is today’s reality and need corrective measures.
4.1 Precipitation and Temperature Change
Kullu district receives heavy rainfall during the monsoon season from July to August. Heaviest rainfall occurs at Kothi near Manali while lowest occurs near Pulga in Parbati valley. The analysis of 15 years of average monthly rainfall for the basin indicate that maximum rainfall occurs during July and August and minimum rainfall occurs during October-January. There are rainguage stations that are located at different altitude locations they are at Bhunter (1080 m), Manali (1926m), Sainj (1348 m), Larji (995 m) & Bajaura (1000 m).
The studies to assess the impact of climate change on the behaviour of precipitation and temperature has been attempted at regional level by various researchers using long term data studies carried out by Bhutiyani et. al. (2009) for assessing the precipitation variations in the north western Himalayas using available instrumental records for the period from 1866-2006 observed significant decreasing trend in monsoon precipitation and increasing trend in annual temperature. The warming was observed to be more during the winter season. Negative relationship between mean winter air temperature and the decreasing snow fall on the wind word side of the Pir Panjal Himalayan range was also noticed. The study concluded that in the last century overall rise in air temperature in the northwest Himalayan region was as high as 1.6 degree C. Decrease of snowfall and reduction in effective duration of winter was also observed in Pir Panjal Himalayan ranges (Bhutiyani et. al 2009)
The study carried out by Sontakke et. Al. (2005) using quantitative subjective approach carried out analysis of rainfall fluctuation over 49 physiographic sub division provinces in the country made following observations for the Punjab Himalayan of which H.P is the part:
1) Winter rainfall shows decreasing trend.2) Summer rainfall shows increasing trend.3) Summer monsoon rainfall shows decreasing trend. 4) Post monsoon rainfall shows no trend. 5) June rainfall reflects decreasing trend. 6) July rainfall shows decreasing trend. 7) August rain fall shows decreasing trend. 8) September rain fall shows decreasing trend.
The observation made by Shekhar et. al. after analyzing the data from 18 high altitude observatories of SASE made startling inferences on the temperature variations. He observed that over Western Himalayas:
Second (November-April) mean, maximum and minimum temperature have increased by about 2oC, 2oC and 1oC in the last two decades.
Climate Change Vulnerability Assessment Report 38
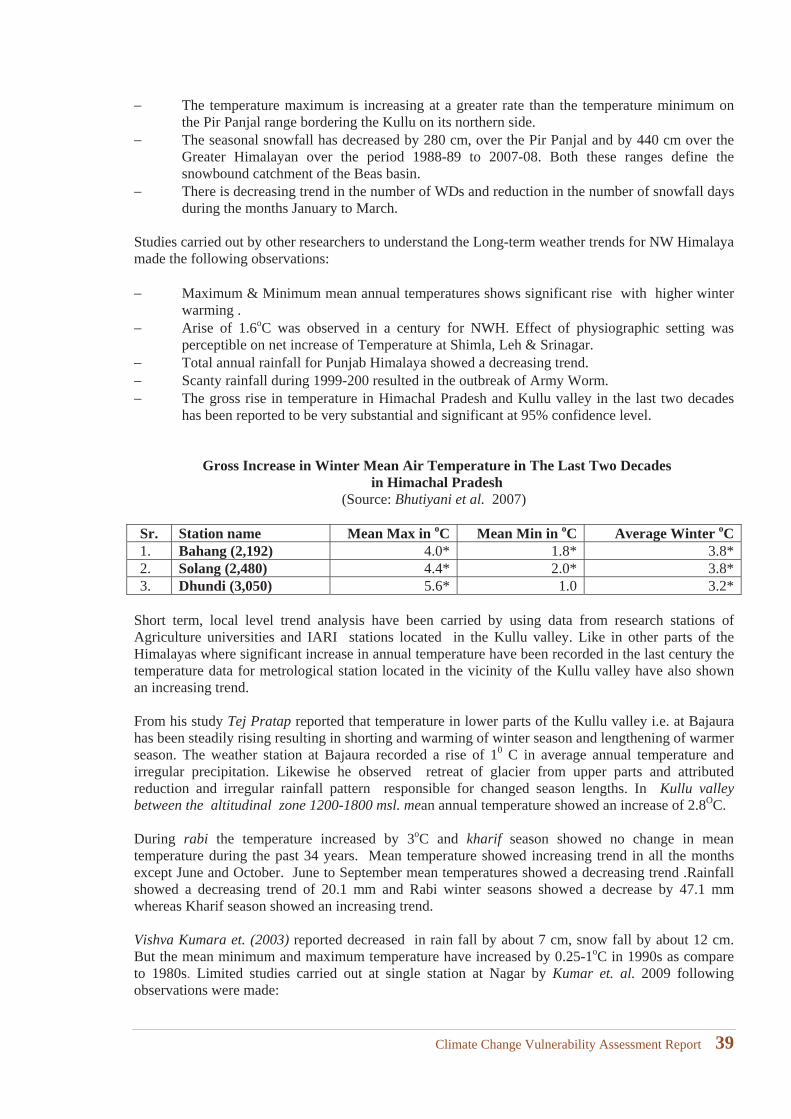
The temperature maximum is increasing at a greater rate than the temperature minimum on the Pir Panjal range bordering the Kullu on its northern side. The seasonal snowfall has decreased by 280 cm, over the Pir Panjal and by 440 cm over the Greater Himalayan over the period 1988-89 to 2007-08. Both these ranges define the snowbound catchment of the Beas basin.There is decreasing trend in the number of WDs and reduction in the number of snowfall days during the months January to March.
Studies carried out by other researchers to understand the Long-term weather trends for NW Himalaya made the following observations:
Maximum & Minimum mean annual temperatures shows significant rise with higher winter warming .Arise of 1.6oC was observed in a century for NWH. Effect of physiographic setting was perceptible on net increase of Temperature at Shimla, Leh & Srinagar.Total annual rainfall for Punjab Himalaya showed a decreasing trend.Scanty rainfall during 1999-200 resulted in the outbreak of Army Worm.The gross rise in temperature in Himachal Pradesh and Kullu valley in the last two decades has been reported to be very substantial and significant at 95% confidence level.
Gross Increase in Winter Mean Air Temperature in The Last Two Decades in Himachal Pradesh
(Source: Bhutiyani et al. 2007)
Sr. Station name Mean Max in oC Mean Min in oC Average Winter oC1. Bahang (2,192) 4.0* 1.8* 3.8* 2. Solang (2,480) 4.4* 2.0* 3.8* 3. Dhundi (3,050) 5.6* 1.0 3.2*
Short term, local level trend analysis have been carried by using data from research stations of Agriculture universities and IARI stations located in the Kullu valley. Like in other parts of the Himalayas where significant increase in annual temperature have been recorded in the last century the temperature data for metrological station located in the vicinity of the Kullu valley have also shown an increasing trend.
From his study Tej Pratap reported that temperature in lower parts of the Kullu valley i.e. at Bajaura has been steadily rising resulting in shorting and warming of winter season and lengthening of warmer season. The weather station at Bajaura recorded a rise of 10 C in average annual temperature and irregular precipitation. Likewise he observed retreat of glacier from upper parts and attributed reduction and irregular rainfall pattern responsible for changed season lengths. In Kullu valley between the altitudinal zone 1200-1800 msl. mean annual temperature showed an increase of 2.8OC.
During rabi the temperature increased by 3oC and kharif season showed no change in mean temperature during the past 34 years. Mean temperature showed increasing trend in all the months except June and October. June to September mean temperatures showed a decreasing trend .Rainfall showed a decreasing trend of 20.1 mm and Rabi winter seasons showed a decrease by 47.1 mm whereas Kharif season showed an increasing trend.
Vishva Kumara et. (2003) reported decreased in rain fall by about 7 cm, snow fall by about 12 cm. But the mean minimum and maximum temperature have increased by 0.25-1oC in 1990s as compare to 1980s. Limited studies carried out at single station at Nagar by Kumar et. al. 2009 following observations were made:
Climate Change Vulnerability Assessment Report 39
Very slight increase in annual snow accompanied by late snow fall in some years.Increasing trend of annual precipitation. In comparing to the period 1963-72 there was 5.22 mm more rainfall per annum during the period 1995-2004. In the month of April alone an increase of 1.81 cm was observed but in the month of May the rainfall exhibited a declining trend and June accounts for 1.79 cm rise in annual rainfall. The rainfall pattern also reflected delayed onset of autumn.The average minimum temperature showed an increase during 1962-2004 for all the months. The highest increase in monthly minimum temperature was recorded for the month of July (2.3oC) and for the month of Dec. (0.89oC). The study reported that average minimum temperature had gone up by (1.520C). Similarly, mean maximum temperature for all the months except Feb & June showed an increasing trend. The highest increase was observed for the month of April (2.37oC) from 1963-72 to 1995-2004.Climate data recorded at Naggar in Kullu valley showed an increase in both minimum (0.35oC) and maximum temperature (1.1oC) and decline in average annual rainfall in the 9th
decade. Decrease of nearly 9.01 cm in annual average rainfall in the second half of the century.
4.2 A1B Projections
The only attempt made pertaining to the state of Himachal Pradesh is part of NATCOM assessment by YS Parmar University Nauni Solan. This study has made the following projections for district Kullu.
Increase in maximum and minimum temperature will be by 2.77oC and 2.17oC with a seasonal average of 2.47oC The increase in winter will be higher. The district will have increased rainfall except in January April and June months The rain will be less by 5.70% in Jan. 8.57% in April and 2.3% in JuneThe temperatures are projected to rise by 1.84oC in Aug and by 3.55oC in NovThe winter months will be warmer by 2.773 oC to 3.55 oC compared to summer when it may remain between 1.54 oC to 2.04 oC.
Trend of snow-fall at different altitudes in Himachal Pradesh (Source: Bhutiyani et al. 2007)
S. No. Snowfall depthStation Time Period Time Period
1. Bhang (-) (1974-2005) (-)* (1991-2005) 2. Solang (-) (1982-2005) (-)* (1991-2005) 3. Dhundi (-) (1989-2005) (-) (1991-2005)
(+), Increasing (-), decreasing trend, * Significant at 95% confidence level.
Bhutiyani et. al. (2007, 2009) after analyzing the data from stations of SASE located in Himachal & J&K observed as follows:
Glaciers in the Himalaya owe their origins and persistence to precipitation brought by the Indian monsoon system (ISM) which forms a part of larger Asian Monsoon System (AMS). It is evident from the above account that like in other parts of Himalayas the data for Beas basin is very sparse and highly inadequate.
4.3 Aerosol/ Studies
Apart from rising temperature, decreasing precipitation and increasing GHG the other factor that has been attributed to be driving the mass balance losses of the glaciers is the atmospheric brown clouds (Ramanathan et. al. 2007). China and India have been termed as global hotspots for black carbon. Using unmanned aircraft based measurements on the amount of sunlight absorbed by black carbon
Climate Change Vulnerability Assessment Report 40
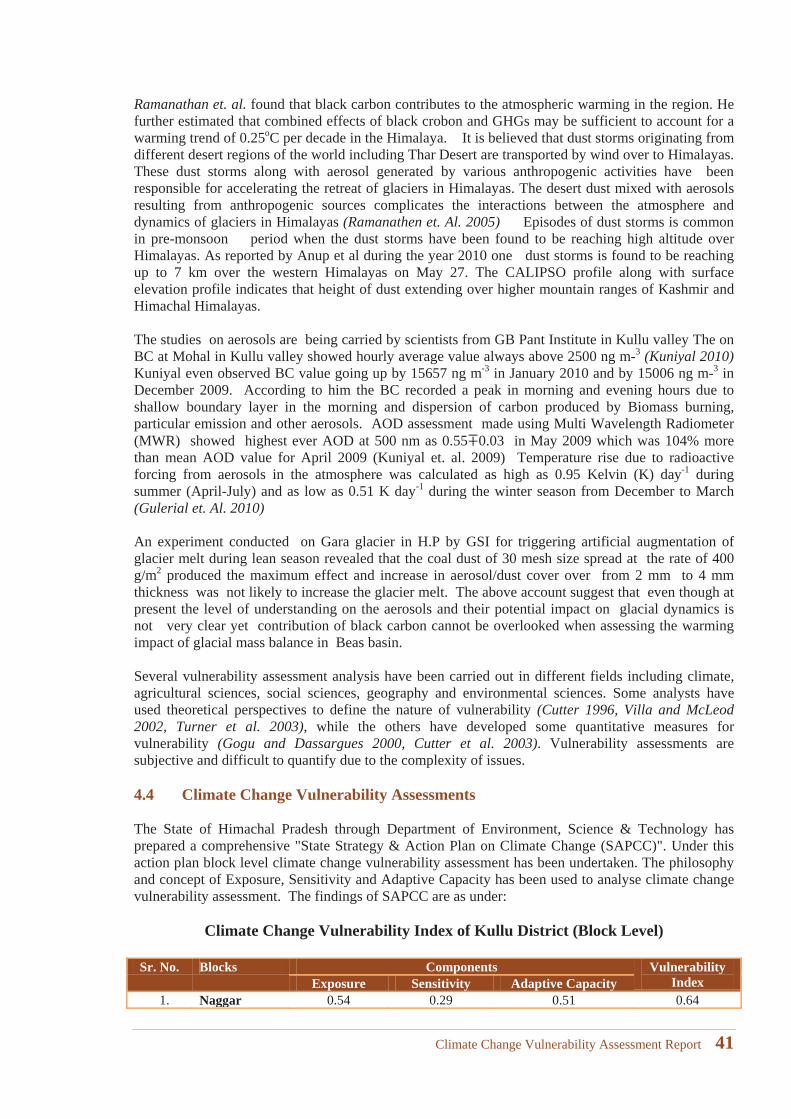
Ramanathan et. al. found that black carbon contributes to the atmospheric warming in the region. He further estimated that combined effects of black crobon and GHGs may be sufficient to account for a warming trend of 0.25oC per decade in the Himalaya. It is believed that dust storms originating from different desert regions of the world including Thar Desert are transported by wind over to Himalayas. These dust storms along with aerosol generated by various anthropogenic activities have been responsible for accelerating the retreat of glaciers in Himalayas. The desert dust mixed with aerosols resulting from anthropogenic sources complicates the interactions between the atmosphere and dynamics of glaciers in Himalayas (Ramanathen et. Al. 2005) Episodes of dust storms is common in pre-monsoon period when the dust storms have been found to be reaching high altitude over Himalayas. As reported by Anup et al during the year 2010 one dust storms is found to be reaching up to 7 km over the western Himalayas on May 27. The CALIPSO profile along with surface elevation profile indicates that height of dust extending over higher mountain ranges of Kashmir and Himachal Himalayas.
The studies on aerosols are being carried by scientists from GB Pant Institute in Kullu valley The on BC at Mohal in Kullu valley showed hourly average value always above 2500 ng m-3 (Kuniyal 2010)Kuniyal even observed BC value going up by 15657 ng m-3 in January 2010 and by 15006 ng m-3 in December 2009. According to him the BC recorded a peak in morning and evening hours due to shallow boundary layer in the morning and dispersion of carbon produced by Biomass burning, particular emission and other aerosols. AOD assessment made using Multi Wavelength Radiometer (MWR) showed highest ever AOD at 500 nm as 0.55 0.03 in May 2009 which was 104% more than mean AOD value for April 2009 (Kuniyal et. al. 2009) Temperature rise due to radioactive forcing from aerosols in the atmosphere was calculated as high as 0.95 Kelvin (K) day-1 during summer (April-July) and as low as 0.51 K day-1 during the winter season from December to March (Gulerial et. Al. 2010)
An experiment conducted on Gara glacier in H.P by GSI for triggering artificial augmentation of glacier melt during lean season revealed that the coal dust of 30 mesh size spread at the rate of 400 g/m2 produced the maximum effect and increase in aerosol/dust cover over from 2 mm to 4 mm thickness was not likely to increase the glacier melt. The above account suggest that even though at present the level of understanding on the aerosols and their potential impact on glacial dynamics is not very clear yet contribution of black carbon cannot be overlooked when assessing the warming impact of glacial mass balance in Beas basin.
Several vulnerability assessment analysis have been carried out in different fields including climate, agricultural sciences, social sciences, geography and environmental sciences. Some analysts have used theoretical perspectives to define the nature of vulnerability (Cutter 1996, Villa and McLeod 2002, Turner et al. 2003), while the others have developed some quantitative measures for vulnerability (Gogu and Dassargues 2000, Cutter et al. 2003). Vulnerability assessments are subjective and difficult to quantify due to the complexity of issues.
4.4 Climate Change Vulnerability Assessments
The State of Himachal Pradesh through Department of Environment, Science & Technology has prepared a comprehensive "State Strategy & Action Plan on Climate Change (SAPCC)". Under this action plan block level climate change vulnerability assessment has been undertaken. The philosophy and concept of Exposure, Sensitivity and Adaptive Capacity has been used to analyse climate change vulnerability assessment. The findings of SAPCC are as under:
Climate Change Vulnerability Index of Kullu District (Block Level)
Sr. No. Blocks Components Vulnerability Index Exposure Sensitivity Adaptive Capacity
1. Naggar 0.54 0.29 0.51 0.64
Climate Change Vulnerability Assessment Report 41
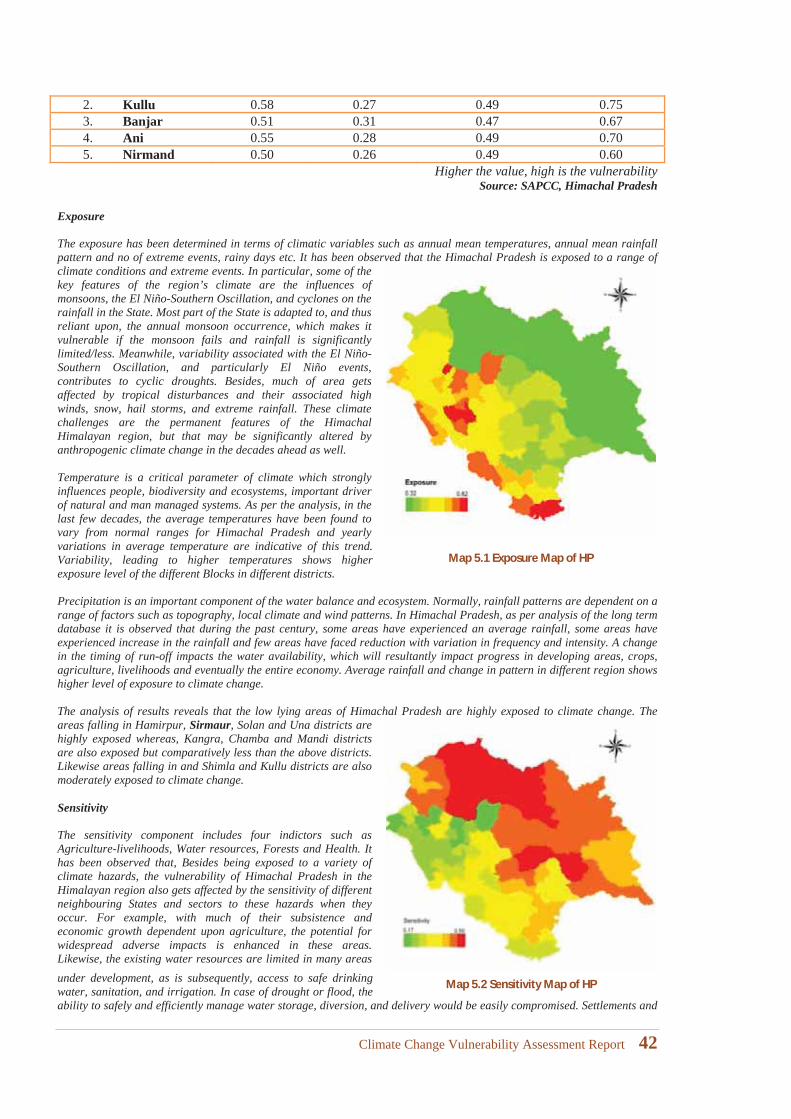
2. Kullu 0.58 0.27 0.49 0.753. Banjar 0.51 0.31 0.47 0.674. Ani 0.55 0.28 0.49 0.705. Nirmand 0.50 0.26 0.49 0.60
Higher the value, high is the vulnerabilitySource: SAPCC, Himachal Pradesh
Exposure
The exposure has been determined in terms of climatic variables such as annual mean temperatures, annual mean rainfall pattern and no of extreme events, rainy days etc. It has been observed that the Himachal Pradesh is exposed to a range of climate conditions and extreme events. In particular, some of the key features of the region’s climate are the influences of monsoons, the El Niño-Southern Oscillation, and cyclones on the rainfall in the State. Most part of the State is adapted to, and thus reliant upon, the annual monsoon occurrence, which makes it vulnerable if the monsoon fails and rainfall is significantly limited/less. Meanwhile, variability associated with the El Niño-Southern Oscillation, and particularly El Niño events, contributes to cyclic droughts. Besides, much of area gets affected by tropical disturbances and their associated high winds, snow, hail storms, and extreme rainfall. These climate challenges are the permanent features of the Himachal Himalayan region, but that may be significantly altered by anthropogenic climate change in the decades ahead as well.
Temperature is a critical parameter of climate which strongly influences people, biodiversity and ecosystems, important driver of natural and man managed systems. As per the analysis, in the last few decades, the average temperatures have been found to vary from normal ranges for Himachal Pradesh and yearly variations in average temperature are indicative of this trend. Variability, leading to higher temperatures shows higher exposure level of the different Blocks in different districts.
Precipitation is an important component of the water balance and ecosystem. Normally, rainfall patterns are dependent on a range of factors such as topography, local climate and wind patterns. In Himachal Pradesh, as per analysis of the long term database it is observed that during the past century, some areas have experienced an average rainfall, some areas have experienced increase in the rainfall and few areas have faced reduction with variation in frequency and intensity. A change in the timing of run-off impacts the water availability, which will resultantly impact progress in developing areas, crops, agriculture, livelihoods and eventually the entire economy. Average rainfall and change in pattern in different region shows higher level of exposure to climate change.
The analysis of results reveals that the low lying areas of Himachal Pradesh are highly exposed to climate change. The areas falling in Hamirpur, Sirmaur, Solan and Una districts are highly exposed whereas, Kangra, Chamba and Mandi districts are also exposed but comparatively less than the above districts. Likewise areas falling in and Shimla and Kullu districts are also moderately exposed to climate change.
Sensitivity
The sensitivity component includes four indictors such as Agriculture-livelihoods, Water resources, Forests and Health. It has been observed that, Besides being exposed to a variety of climate hazards, the vulnerability of Himachal Pradesh in the Himalayan region also gets affected by the sensitivity of different neighbouring States and sectors to these hazards when they occur. For example, with much of their subsistence and economic growth dependent upon agriculture, the potential for widespread adverse impacts is enhanced in these areas. Likewise, the existing water resources are limited in many areas under development, as is subsequently, access to safe drinking water, sanitation, and irrigation. In case of drought or flood, the ability to safely and efficiently manage water storage, diversion, and delivery would be easily compromised. Settlements and
Map 5.1 Exposure Map of HP
Map 5.2 Sensitivity Map of HP
Climate Change Vulnerability Assessment Report 42
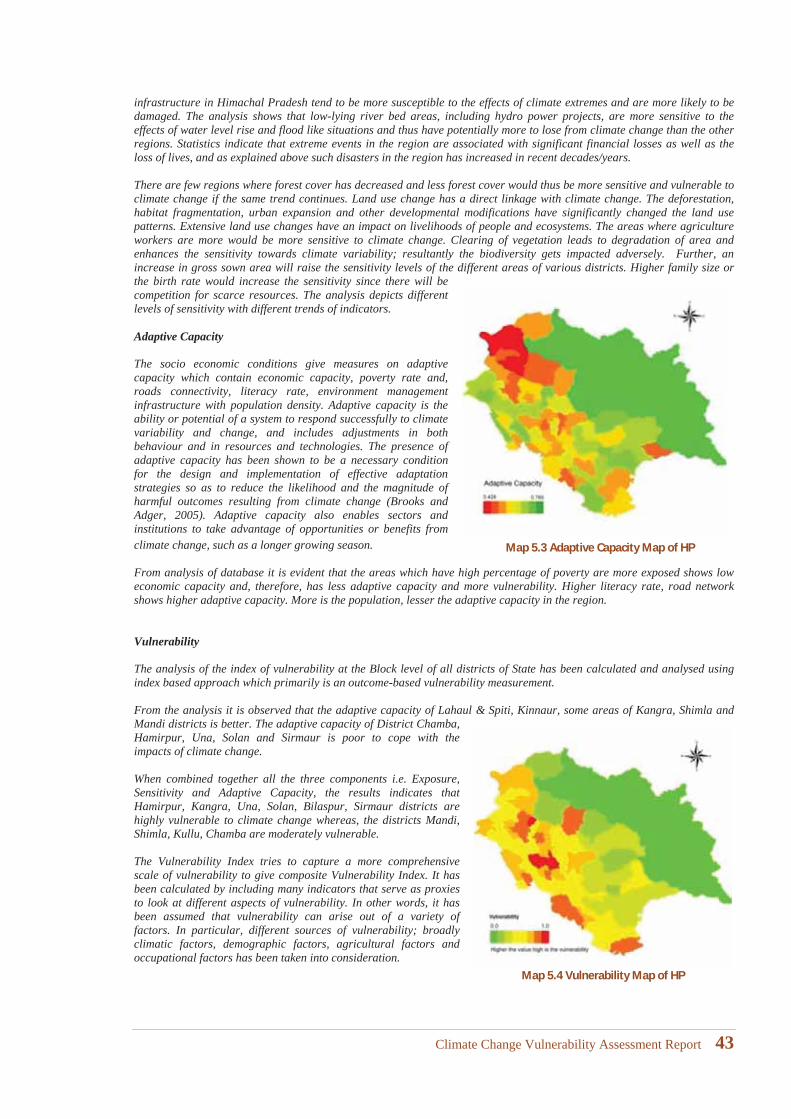
infrastructure in Himachal Pradesh tend to be more susceptible to the effects of climate extremes and are more likely to be damaged. The analysis shows that low-lying river bed areas, including hydro power projects, are more sensitive to the effects of water level rise and flood like situations and thus have potentially more to lose from climate change than the other regions. Statistics indicate that extreme events in the region are associated with significant financial losses as well as the loss of lives, and as explained above such disasters in the region has increased in recent decades/years.
There are few regions where forest cover has decreased and less forest cover would thus be more sensitive and vulnerable to climate change if the same trend continues. Land use change has a direct linkage with climate change. The deforestation, habitat fragmentation, urban expansion and other developmental modifications have significantly changed the land use patterns. Extensive land use changes have an impact on livelihoods of people and ecosystems. The areas where agriculture workers are more would be more sensitive to climate change. Clearing of vegetation leads to degradation of area and enhances the sensitivity towards climate variability; resultantly the biodiversity gets impacted adversely. Further, an increase in gross sown area will raise the sensitivity levels of the different areas of various districts. Higher family size or the birth rate would increase the sensitivity since there will be competition for scarce resources. The analysis depicts different levels of sensitivity with different trends of indicators.
Adaptive Capacity
The socio economic conditions give measures on adaptive capacity which contain economic capacity, poverty rate and, roads connectivity, literacy rate, environment management infrastructure with population density. Adaptive capacity is the ability or potential of a system to respond successfully to climate variability and change, and includes adjustments in both behaviour and in resources and technologies. The presence of adaptive capacity has been shown to be a necessary condition for the design and implementation of effective adaptation strategies so as to reduce the likelihood and the magnitude of harmful outcomes resulting from climate change (Brooks and Adger, 2005). Adaptive capacity also enables sectors and institutions to take advantage of opportunities or benefits from climate change, such as a longer growing season.
From analysis of database it is evident that the areas which have high percentage of poverty are more exposed shows low economic capacity and, therefore, has less adaptive capacity and more vulnerability. Higher literacy rate, road network shows higher adaptive capacity. More is the population, lesser the adaptive capacity in the region.
Vulnerability
The analysis of the index of vulnerability at the Block level of all districts of State has been calculated and analysed using index based approach which primarily is an outcome-based vulnerability measurement.
From the analysis it is observed that the adaptive capacity of Lahaul & Spiti, Kinnaur, some areas of Kangra, Shimla and Mandi districts is better. The adaptive capacity of District Chamba, Hamirpur, Una, Solan and Sirmaur is poor to cope with the impacts of climate change.
When combined together all the three components i.e. Exposure, Sensitivity and Adaptive Capacity, the results indicates that Hamirpur, Kangra, Una, Solan, Bilaspur, Sirmaur districts are highly vulnerable to climate change whereas, the districts Mandi, Shimla, Kullu, Chamba are moderately vulnerable.
The Vulnerability Index tries to capture a more comprehensive scale of vulnerability to give composite Vulnerability Index. It has been calculated by including many indicators that serve as proxies to look at different aspects of vulnerability. In other words, it has been assumed that vulnerability can arise out of a variety of factors. In particular, different sources of vulnerability; broadly climatic factors, demographic factors, agricultural factors and occupational factors has been taken into consideration.
Map 5.3 Adaptive Capacity Map of HP
Map 5.4 Vulnerability Map of HP
Climate Change Vulnerability Assessment Report 43
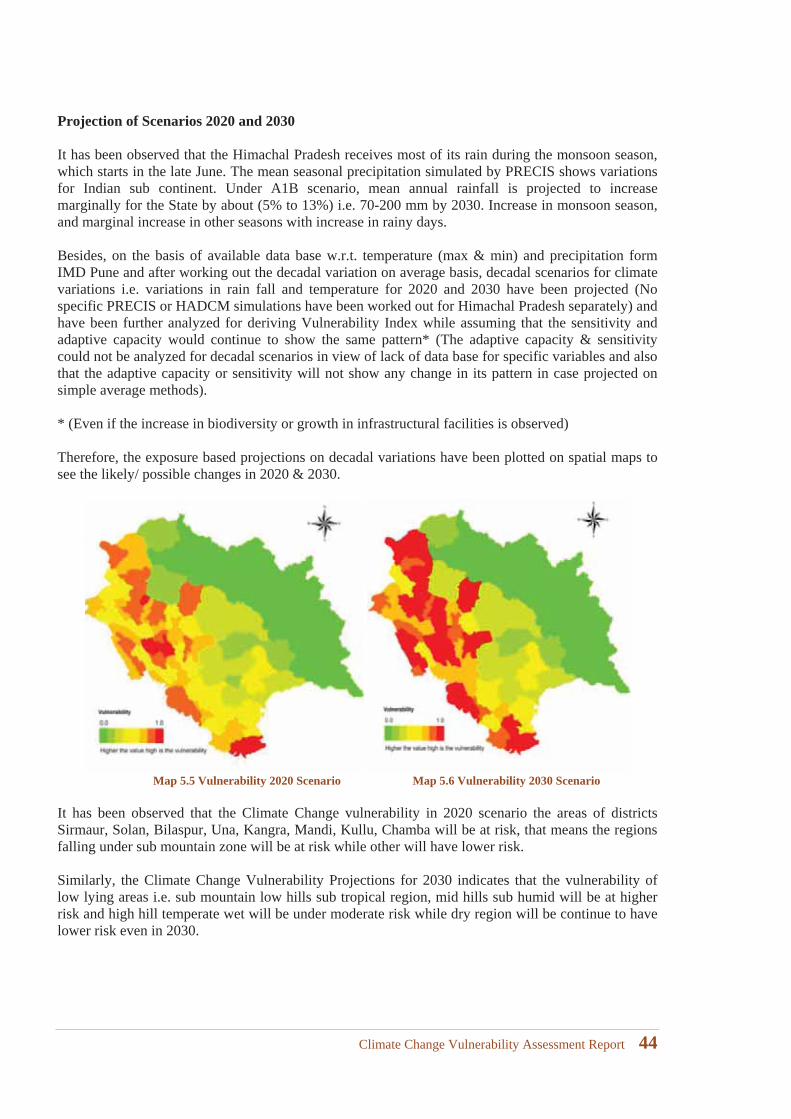
Projection of Scenarios 2020 and 2030
It has been observed that the Himachal Pradesh receives most of its rain during the monsoon season, which starts in the late June. The mean seasonal precipitation simulated by PRECIS shows variations for Indian sub continent. Under A1B scenario, mean annual rainfall is projected to increase marginally for the State by about (5% to 13%) i.e. 70-200 mm by 2030. Increase in monsoon season, and marginal increase in other seasons with increase in rainy days.
Besides, on the basis of available data base w.r.t. temperature (max & min) and precipitation form IMD Pune and after working out the decadal variation on average basis, decadal scenarios for climate variations i.e. variations in rain fall and temperature for 2020 and 2030 have been projected (No specific PRECIS or HADCM simulations have been worked out for Himachal Pradesh separately) and have been further analyzed for deriving Vulnerability Index while assuming that the sensitivity and adaptive capacity would continue to show the same pattern* (The adaptive capacity & sensitivity could not be analyzed for decadal scenarios in view of lack of data base for specific variables and also that the adaptive capacity or sensitivity will not show any change in its pattern in case projected onsimple average methods).
* (Even if the increase in biodiversity or growth in infrastructural facilities is observed)
Therefore, the exposure based projections on decadal variations have been plotted on spatial maps to see the likely/ possible changes in 2020 & 2030.
Map 5.5 Vulnerability 2020 Scenario Map 5.6 Vulnerability 2030 Scenario
It has been observed that the Climate Change vulnerability in 2020 scenario the areas of districts Sirmaur, Solan, Bilaspur, Una, Kangra, Mandi, Kullu, Chamba will be at risk, that means the regions falling under sub mountain zone will be at risk while other will have lower risk.
Similarly, the Climate Change Vulnerability Projections for 2030 indicates that the vulnerability of low lying areas i.e. sub mountain low hills sub tropical region, mid hills sub humid will be at higher risk and high hill temperate wet will be under moderate risk while dry region will be continue to have lower risk even in 2030.
Climate Change Vulnerability Assessment Report 44
5 Climate Change Hazard Scenarios: District Kullu
Climate Change Vulnerability Assessment Report 45

Climate Change Vulnerability Assessment Report 46
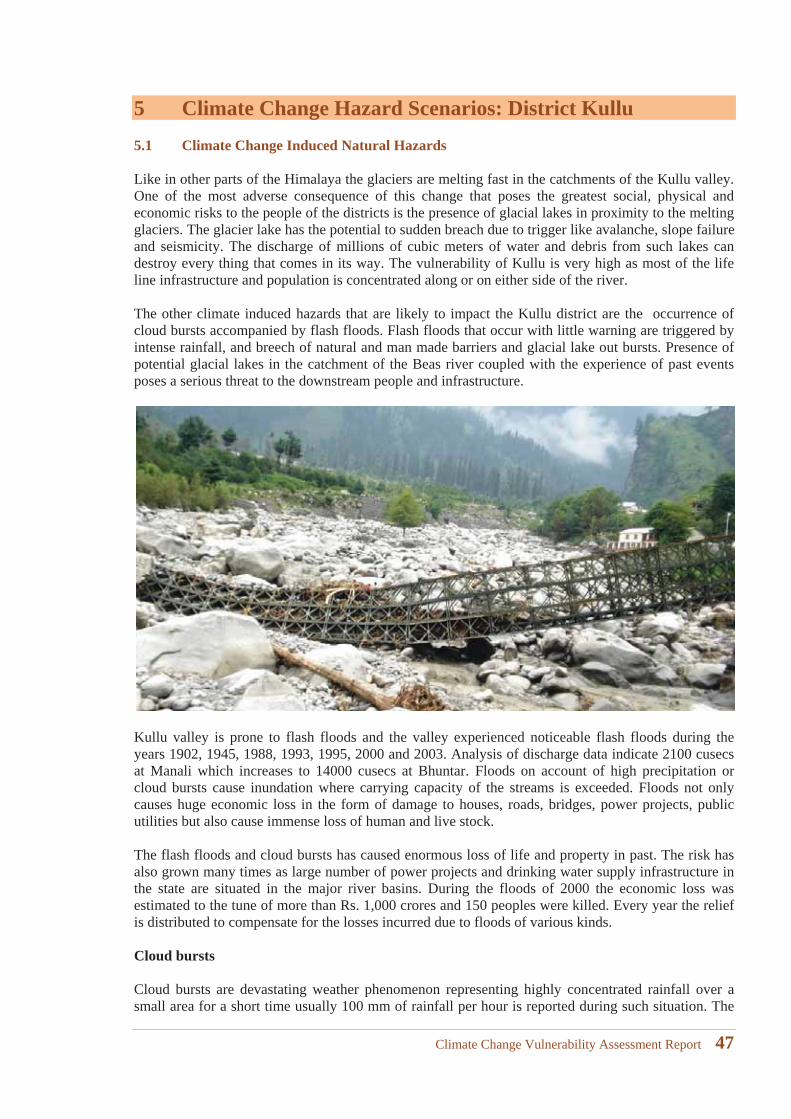
5 Climate Change Hazard Scenarios: District Kullu5.1 Climate Change Induced Natural Hazards
Like in other parts of the Himalaya the glaciers are melting fast in the catchments of the Kullu valley. One of the most adverse consequence of this change that poses the greatest social, physical and economic risks to the people of the districts is the presence of glacial lakes in proximity to the melting glaciers. The glacier lake has the potential to sudden breach due to trigger like avalanche, slope failure and seismicity. The discharge of millions of cubic meters of water and debris from such lakes can destroy every thing that comes in its way. The vulnerability of Kullu is very high as most of the life line infrastructure and population is concentrated along or on either side of the river.
The other climate induced hazards that are likely to impact the Kullu district are the occurrence of cloud bursts accompanied by flash floods. Flash floods that occur with little warning are triggered by intense rainfall, and breech of natural and man made barriers and glacial lake out bursts. Presence of potential glacial lakes in the catchment of the Beas river coupled with the experience of past events poses a serious threat to the downstream people and infrastructure.
Kullu valley is prone to flash floods and the valley experienced noticeable flash floods during the years 1902, 1945, 1988, 1993, 1995, 2000 and 2003. Analysis of discharge data indicate 2100 cusecs at Manali which increases to 14000 cusecs at Bhuntar. Floods on account of high precipitation or cloud bursts cause inundation where carrying capacity of the streams is exceeded. Floods not only causes huge economic loss in the form of damage to houses, roads, bridges, power projects, public utilities but also cause immense loss of human and live stock.
The flash floods and cloud bursts has caused enormous loss of life and property in past. The risk has also grown many times as large number of power projects and drinking water supply infrastructure in the state are situated in the major river basins. During the floods of 2000 the economic loss was estimated to the tune of more than Rs. 1,000 crores and 150 peoples were killed. Every year the relief is distributed to compensate for the losses incurred due to floods of various kinds.
Cloud bursts
Cloud bursts are devastating weather phenomenon representing highly concentrated rainfall over a small area for a short time usually 100 mm of rainfall per hour is reported during such situation. The
Climate Change Vulnerability Assessment Report 47
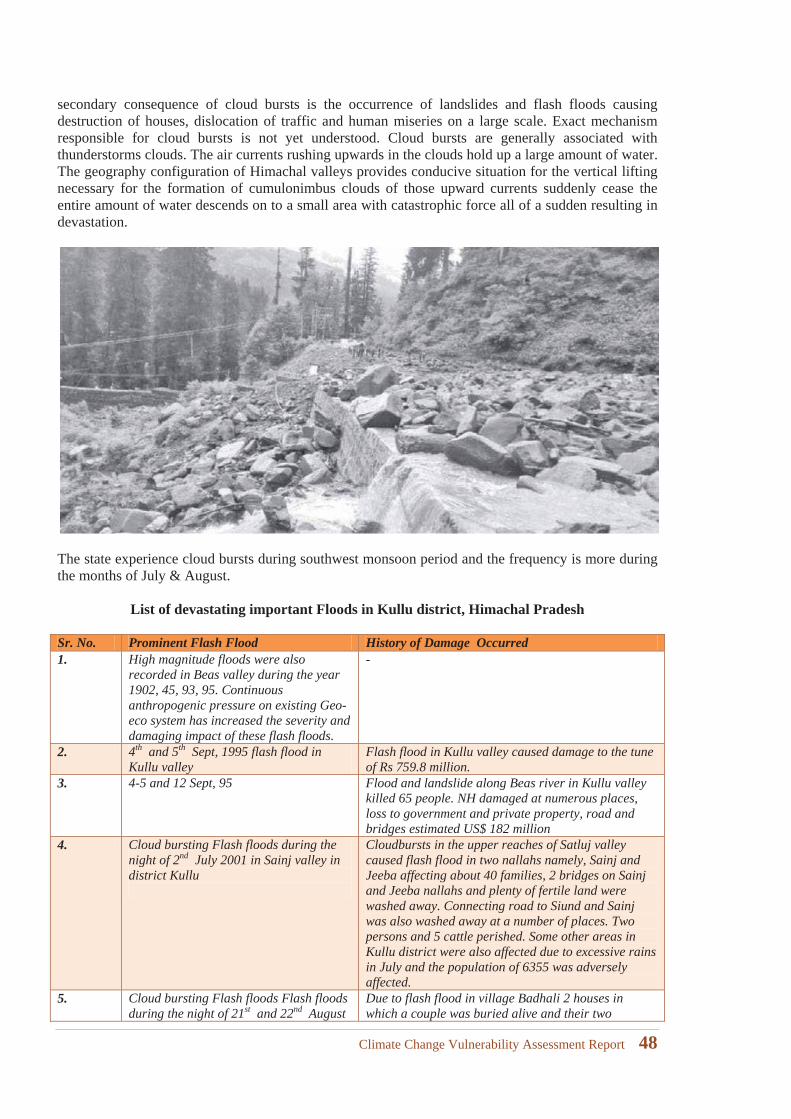
secondary consequence of cloud bursts is the occurrence of landslides and flash floods causing destruction of houses, dislocation of traffic and human miseries on a large scale. Exact mechanism responsible for cloud bursts is not yet understood. Cloud bursts are generally associated with thunderstorms clouds. The air currents rushing upwards in the clouds hold up a large amount of water. The geography configuration of Himachal valleys provides conducive situation for the vertical lifting necessary for the formation of cumulonimbus clouds of those upward currents suddenly cease the entire amount of water descends on to a small area with catastrophic force all of a sudden resulting in devastation.
The state experience cloud bursts during southwest monsoon period and the frequency is more during the months of July & August.
List of devastating important Floods in Kullu district, Himachal Pradesh
Sr. No. Prominent Flash Flood History of Damage Occurred1. High magnitude floods were also
recorded in Beas valley during the year 1902, 45, 93, 95. Continuous anthropogenic pressure on existing Geo-eco system has increased the severity and damaging impact of these flash floods.
-
2. 4th and 5th Sept, 1995 flash flood in Kullu valley
Flash flood in Kullu valley caused damage to the tune of Rs 759.8 million.
3. 4-5 and 12 Sept, 95 Flood and landslide along Beas river in Kullu valley killed 65 people. NH damaged at numerous places, loss to government and private property, road and bridges estimated US$ 182 million
4. Cloud bursting Flash floods during thenight of 2nd July 2001 in Sainj valley in district Kullu
Cloudbursts in the upper reaches of Satluj valley caused flash flood in two nallahs namely, Sainj and Jeeba affecting about 40 families, 2 bridges on Sainj and Jeeba nallahs and plenty of fertile land were washed away. Connecting road to Siund and Sainj was also washed away at a number of places. Two persons and 5 cattle perished. Some other areas in Kullu district were also affected due to excessive rains in July and the population of 6355 was adversely affected.
5. Cloud bursting Flash floods Flash floods during the night of 21st and 22nd August
Due to flash flood in village Badhali 2 houses in which a couple was buried alive and their two
Climate Change Vulnerability Assessment Report 48
2001, cloudburst in Ani Sub Division of Kullu district occurred
children were injured. In village Sarli 7 people lost their lives, 15 houses were washed away besides the loss of 12 cows, 18 oxen and 40 sheep and about 115 bighas of agriculture and horticulture land was washed away.
6. Flash floods induced by cloudburst in Gharsa valley on 16th July 2003 in Kullu district
21 people lost their lives, 21 people suffered major injuries and 9 are still missing
7. Flash floods in Kangni Nalla near Solang in Kullu district on 7th August 2003
30 people lost their lives, 19 injured, 9 people lost their lives due to landslide near Bhang nalla
(Source: Bhandari, 1988; Sah et al, 1996; Sah and Mazari 1998; Sah and Bist, 1988; Paul et al, 2000, Revenue Department, Govt. Of Himachal Pradesh)
5.2 Water Resources
It has been observed that climate change will affect the water balance, run off and recharge characteristics of the river systems. The water volumes stored in glaciers and snow cover are very likely to decline affecting a river flows during summer and autumn. It is also anticipated that resistance of many eco-systems is likely to exceed by an unprecedented combination of climate change and associated climate change drivers.
One of the negative consequence of the rising temperature will be the reduction in solid precipitation, depletion in snow cover and shrinking the size of glaciers. In the long run this will influence very seriously the discharge of rivers when water will be required the most in summer months. The decline in stream flow will trigger multiple impacts, affecting irrigation, agriculture, drinking water and energy sectors the most.
The Beas River a tributary of Indus is the lifeline of Kullu valley and all major activities revolves around this river. Originating from Beas Kund near Rohtang Pass at an altitude of 3978 m it traverse the Kullu district before joining the Pandoh reservoir. The major perennial tributaries of the Beas river in the Kullu districts includes the Parbati, Tirthan, Sainj in the east Solang, Manalsu, Fozal in the west.
All the tributaries joining the main channel from the northern & eastern side are fed by snow and glaciers. The river Beas run through Kullu valley flanked on either side by apple orchards on terraces that contribute 22% to the total production in the State. Assessment on snow and glacier melt contribution to the Beas river at Pandoh was recently carried out by Kumer et. al. (2010). It was observed that of the total catchment above Pandoh (5278 km) 45% area remain under snow cover during winter season and about 15% remain under permanent snow and glaciers.
The perennial character to the Beas basin is the result of melting of snow and monsoonal rainfall including the base flows. The variation of discharge over the 15 years of runoff data indicates high discharge during the month of July-September and minimum during January and February. Flow data analysis for the same period suggest that the contribution to the flow during pre-monsoon period (April-June) is mainly due to snow and glacier melt runoff. Whereas the contribution for the monsoon season (July-September) is primarily due to rains.
Using water balance approach Kumar et. al. observed that snow melt contribution to the Beas River varied from 30% to 40% except in 1997 when it was only 11%. This study concluded that average snow and glacier melt runoff contributions to the flow of the Beas River at Pandoh was 35%. This contribution is substantial when compared to the average contribution of Himalayan river which is 25 to 30%. From their study of Hydrological sensitivity of a large Himalayan Basin to climate change Pratap et. al. (2004) reported that the impact of climate is more perennial on seasonal rather than annual water availability. Hence it would be highly imperative to understand the over all impact of
Climate Change Vulnerability Assessment Report 49
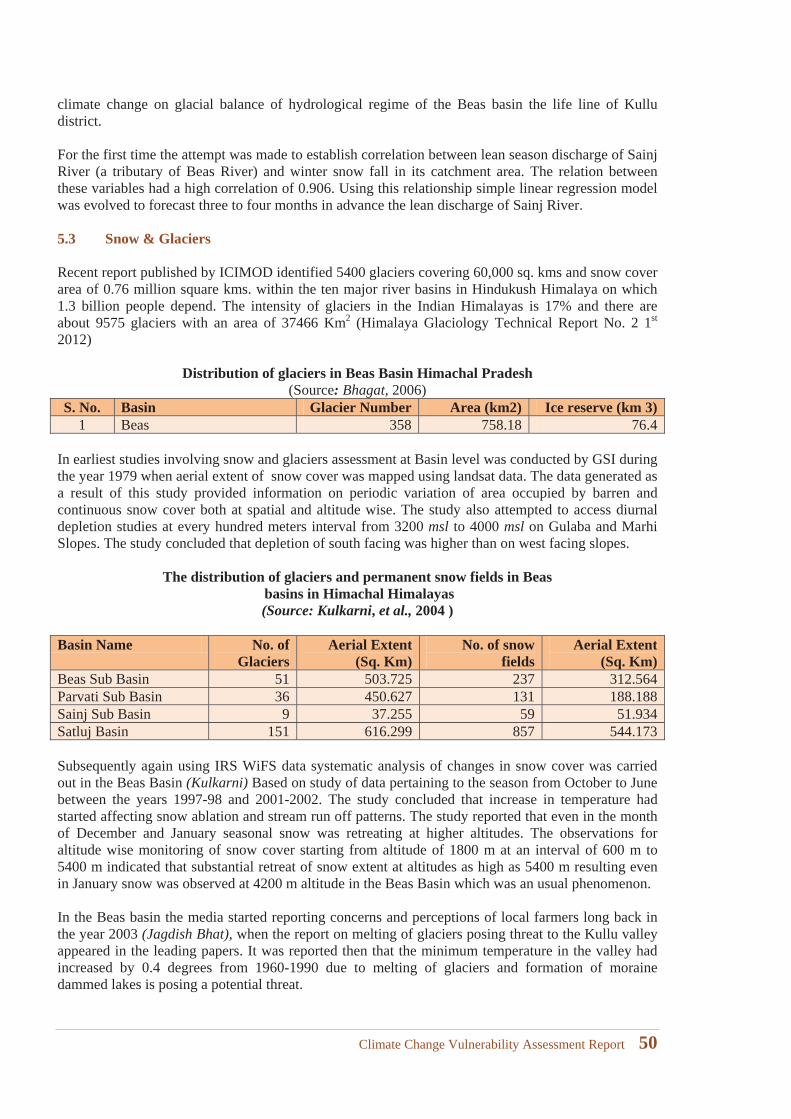
climate change on glacial balance of hydrological regime of the Beas basin the life line of Kullu district.
For the first time the attempt was made to establish correlation between lean season discharge of Sainj River (a tributary of Beas River) and winter snow fall in its catchment area. The relation between these variables had a high correlation of 0.906. Using this relationship simple linear regression model was evolved to forecast three to four months in advance the lean discharge of Sainj River.
5.3 Snow & Glaciers
Recent report published by ICIMOD identified 5400 glaciers covering 60,000 sq. kms and snow cover area of 0.76 million square kms. within the ten major river basins in Hindukush Himalaya on which 1.3 billion people depend. The intensity of glaciers in the Indian Himalayas is 17% and there are about 9575 glaciers with an area of 37466 Km2 (Himalaya Glaciology Technical Report No. 2 1st
2012)
Distribution of glaciers in Beas Basin Himachal Pradesh(Source: Bhagat, 2006)
S. No. Basin Glacier Number Area (km2) Ice reserve (km 3) 1 Beas 358 758.18 76.4
In earliest studies involving snow and glaciers assessment at Basin level was conducted by GSI during the year 1979 when aerial extent of snow cover was mapped using landsat data. The data generated as a result of this study provided information on periodic variation of area occupied by barren and continuous snow cover both at spatial and altitude wise. The study also attempted to access diurnal depletion studies at every hundred meters interval from 3200 msl to 4000 msl on Gulaba and Marhi Slopes. The study concluded that depletion of south facing was higher than on west facing slopes.
The distribution of glaciers and permanent snow fields in Beasbasins in Himachal Himalayas(Source: Kulkarni, et al., 2004 )
Basin Name No. of Glaciers
Aerial Extent (Sq. Km)
No. of snow fields
Aerial Extent (Sq. Km)
Beas Sub Basin 51 503.725 237 312.564 Parvati Sub Basin 36 450.627 131 188.188 Sainj Sub Basin 9 37.255 59 51.934 Satluj Basin 151 616.299 857 544.173
Subsequently again using IRS WiFS data systematic analysis of changes in snow cover was carried out in the Beas Basin (Kulkarni) Based on study of data pertaining to the season from October to June between the years 1997-98 and 2001-2002. The study concluded that increase in temperature had started affecting snow ablation and stream run off patterns. The study reported that even in the month of December and January seasonal snow was retreating at higher altitudes. The observations for altitude wise monitoring of snow cover starting from altitude of 1800 m at an interval of 600 m to 5400 m indicated that substantial retreat of snow extent at altitudes as high as 5400 m resulting even in January snow was observed at 4200 m altitude in the Beas Basin which was an usual phenomenon.
In the Beas basin the media started reporting concerns and perceptions of local farmers long back in the year 2003 (Jagdish Bhat), when the report on melting of glaciers posing threat to the Kullu valley appeared in the leading papers. It was reported then that the minimum temperature in the valley had increased by 0.4 degrees from 1960-1990 due to melting of glaciers and formation of moraine dammed lakes is posing a potential threat.
Climate Change Vulnerability Assessment Report 50
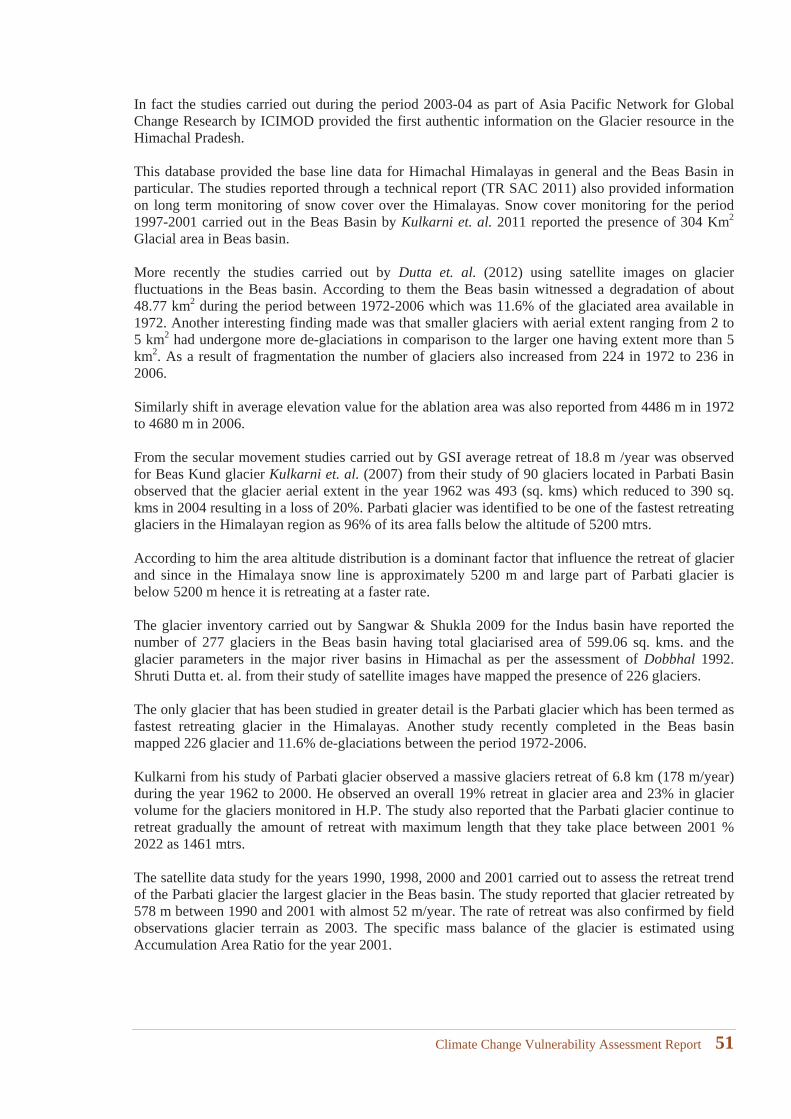
In fact the studies carried out during the period 2003-04 as part of Asia Pacific Network for Global Change Research by ICIMOD provided the first authentic information on the Glacier resource in the Himachal Pradesh.
This database provided the base line data for Himachal Himalayas in general and the Beas Basin in particular. The studies reported through a technical report (TR SAC 2011) also provided information on long term monitoring of snow cover over the Himalayas. Snow cover monitoring for the period 1997-2001 carried out in the Beas Basin by Kulkarni et. al. 2011 reported the presence of 304 Km2
Glacial area in Beas basin.
More recently the studies carried out by Dutta et. al. (2012) using satellite images on glacier fluctuations in the Beas basin. According to them the Beas basin witnessed a degradation of about 48.77 km2 during the period between 1972-2006 which was 11.6% of the glaciated area available in 1972. Another interesting finding made was that smaller glaciers with aerial extent ranging from 2 to 5 km2 had undergone more de-glaciations in comparison to the larger one having extent more than 5 km2. As a result of fragmentation the number of glaciers also increased from 224 in 1972 to 236 in 2006.
Similarly shift in average elevation value for the ablation area was also reported from 4486 m in 1972 to 4680 m in 2006.
From the secular movement studies carried out by GSI average retreat of 18.8 m /year was observed for Beas Kund glacier Kulkarni et. al. (2007) from their study of 90 glaciers located in Parbati Basin observed that the glacier aerial extent in the year 1962 was 493 (sq. kms) which reduced to 390 sq. kms in 2004 resulting in a loss of 20%. Parbati glacier was identified to be one of the fastest retreating glaciers in the Himalayan region as 96% of its area falls below the altitude of 5200 mtrs.
According to him the area altitude distribution is a dominant factor that influence the retreat of glacier and since in the Himalaya snow line is approximately 5200 m and large part of Parbati glacier is below 5200 m hence it is retreating at a faster rate.
The glacier inventory carried out by Sangwar & Shukla 2009 for the Indus basin have reported the number of 277 glaciers in the Beas basin having total glaciarised area of 599.06 sq. kms. and the glacier parameters in the major river basins in Himachal as per the assessment of Dobbhal 1992. Shruti Dutta et. al. from their study of satellite images have mapped the presence of 226 glaciers.
The only glacier that has been studied in greater detail is the Parbati glacier which has been termed as fastest retreating glacier in the Himalayas. Another study recently completed in the Beas basin mapped 226 glacier and 11.6% de-glaciations between the period 1972-2006.
Kulkarni from his study of Parbati glacier observed a massive glaciers retreat of 6.8 km (178 m/year) during the year 1962 to 2000. He observed an overall 19% retreat in glacier area and 23% in glacier volume for the glaciers monitored in H.P. The study also reported that the Parbati glacier continue to retreat gradually the amount of retreat with maximum length that they take place between 2001 % 2022 as 1461 mtrs.
The satellite data study for the years 1990, 1998, 2000 and 2001 carried out to assess the retreat trend of the Parbati glacier the largest glacier in the Beas basin. The study reported that glacier retreated by 578 m between 1990 and 2001 with almost 52 m/year. The rate of retreat was also confirmed by field observations glacier terrain as 2003. The specific mass balance of the glacier is estimated using Accumulation Area Ratio for the year 2001.
Climate Change Vulnerability Assessment Report 51
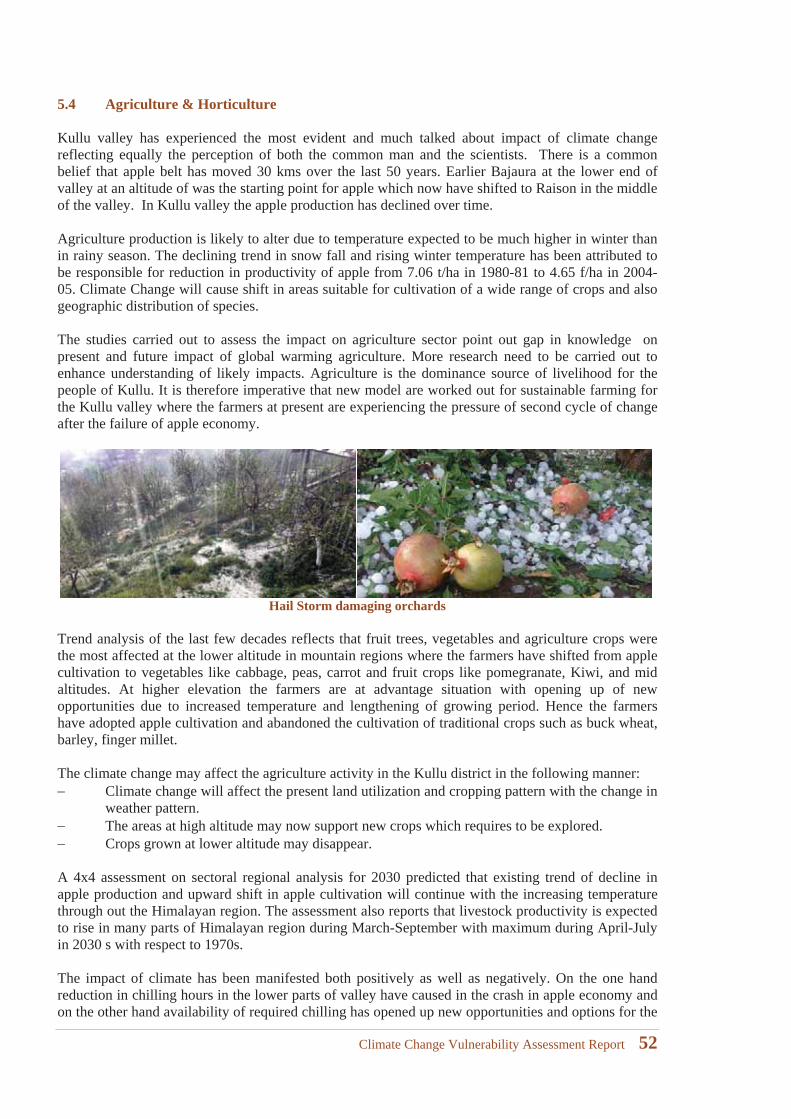
5.4 Agriculture & Horticulture
Kullu valley has experienced the most evident and much talked about impact of climate change reflecting equally the perception of both the common man and the scientists. There is a common belief that apple belt has moved 30 kms over the last 50 years. Earlier Bajaura at the lower end of valley at an altitude of was the starting point for apple which now have shifted to Raison in the middle of the valley. In Kullu valley the apple production has declined over time.
Agriculture production is likely to alter due to temperature expected to be much higher in winter than in rainy season. The declining trend in snow fall and rising winter temperature has been attributed to be responsible for reduction in productivity of apple from 7.06 t/ha in 1980-81 to 4.65 f/ha in 2004-05. Climate Change will cause shift in areas suitable for cultivation of a wide range of crops and also geographic distribution of species.
The studies carried out to assess the impact on agriculture sector point out gap in knowledge on present and future impact of global warming agriculture. More research need to be carried out to enhance understanding of likely impacts. Agriculture is the dominance source of livelihood for the people of Kullu. It is therefore imperative that new model are worked out for sustainable farming for the Kullu valley where the farmers at present are experiencing the pressure of second cycle of change after the failure of apple economy.
Hail Storm damaging orchards
Trend analysis of the last few decades reflects that fruit trees, vegetables and agriculture crops were the most affected at the lower altitude in mountain regions where the farmers have shifted from apple cultivation to vegetables like cabbage, peas, carrot and fruit crops like pomegranate, Kiwi, and mid altitudes. At higher elevation the farmers are at advantage situation with opening up of new opportunities due to increased temperature and lengthening of growing period. Hence the farmers have adopted apple cultivation and abandoned the cultivation of traditional crops such as buck wheat, barley, finger millet.
The climate change may affect the agriculture activity in the Kullu district in the following manner:Climate change will affect the present land utilization and cropping pattern with the change in weather pattern.The areas at high altitude may now support new crops which requires to be explored.Crops grown at lower altitude may disappear.
A 4x4 assessment on sectoral regional analysis for 2030 predicted that existing trend of decline in apple production and upward shift in apple cultivation will continue with the increasing temperature through out the Himalayan region. The assessment also reports that livestock productivity is expected to rise in many parts of Himalayan region during March-September with maximum during April-July in 2030 s with respect to 1970s.
The impact of climate has been manifested both positively as well as negatively. On the one hand reduction in chilling hours in the lower parts of valley have caused in the crash in apple economy and on the other hand availability of required chilling has opened up new opportunities and options for the
Climate Change Vulnerability Assessment Report 52
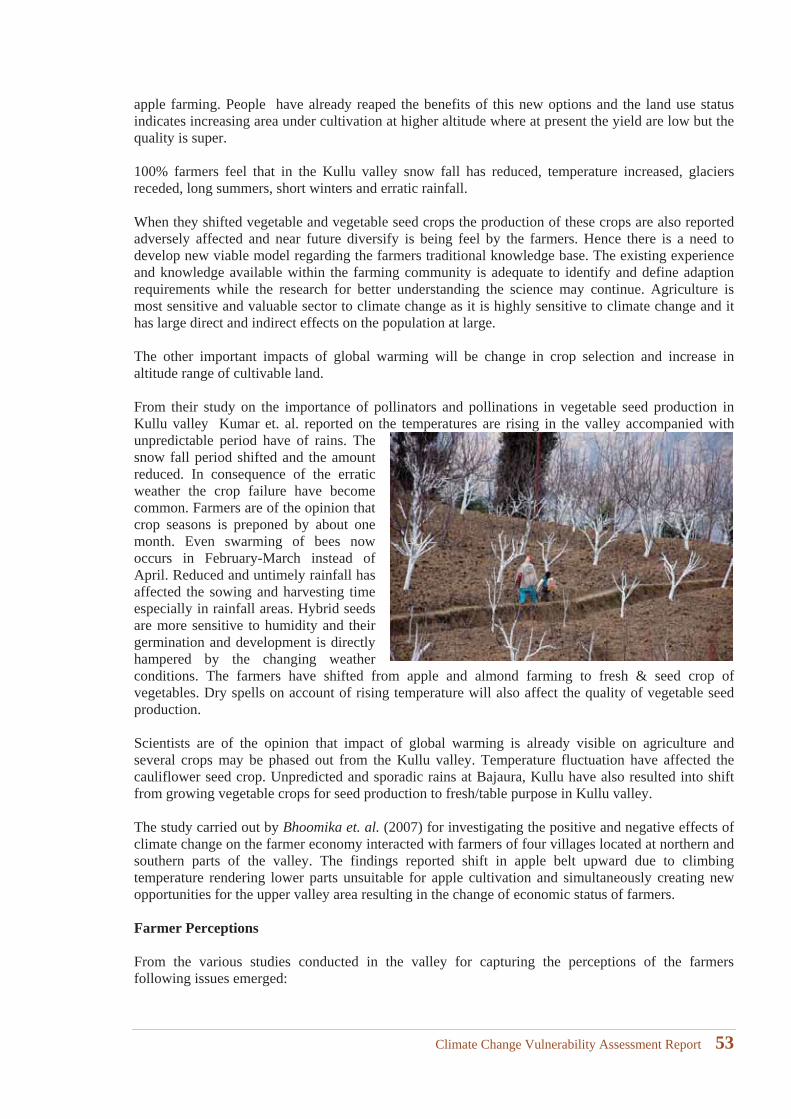
apple farming. People have already reaped the benefits of this new options and the land use status indicates increasing area under cultivation at higher altitude where at present the yield are low but the quality is super.
100% farmers feel that in the Kullu valley snow fall has reduced, temperature increased, glaciers receded, long summers, short winters and erratic rainfall.
When they shifted vegetable and vegetable seed crops the production of these crops are also reported adversely affected and near future diversify is being feel by the farmers. Hence there is a need to develop new viable model regarding the farmers traditional knowledge base. The existing experience and knowledge available within the farming community is adequate to identify and define adaption requirements while the research for better understanding the science may continue. Agriculture is most sensitive and valuable sector to climate change as it is highly sensitive to climate change and it has large direct and indirect effects on the population at large.
The other important impacts of global warming will be change in crop selection and increase in altitude range of cultivable land.
From their study on the importance of pollinators and pollinations in vegetable seed production in Kullu valley Kumar et. al. reported on the temperatures are rising in the valley accompanied with unpredictable period have of rains. The snow fall period shifted and the amount reduced. In consequence of the erratic weather the crop failure have become common. Farmers are of the opinion that crop seasons is preponed by about one month. Even swarming of bees now occurs in February-March instead of April. Reduced and untimely rainfall has affected the sowing and harvesting time especially in rainfall areas. Hybrid seeds are more sensitive to humidity and their germination and development is directly hampered by the changing weather conditions. The farmers have shifted from apple and almond farming to fresh & seed crop of vegetables. Dry spells on account of rising temperature will also affect the quality of vegetable seed production.
Scientists are of the opinion that impact of global warming is already visible on agriculture and several crops may be phased out from the Kullu valley. Temperature fluctuation have affected the cauliflower seed crop. Unpredicted and sporadic rains at Bajaura, Kullu have also resulted into shift from growing vegetable crops for seed production to fresh/table purpose in Kullu valley.
The study carried out by Bhoomika et. al. (2007) for investigating the positive and negative effects of climate change on the farmer economy interacted with farmers of four villages located at northern and southern parts of the valley. The findings reported shift in apple belt upward due to climbing temperature rendering lower parts unsuitable for apple cultivation and simultaneously creating new opportunities for the upper valley area resulting in the change of economic status of farmers.
Farmer Perceptions
From the various studies conducted in the valley for capturing the perceptions of the farmers following issues emerged:
Climate Change Vulnerability Assessment Report 53
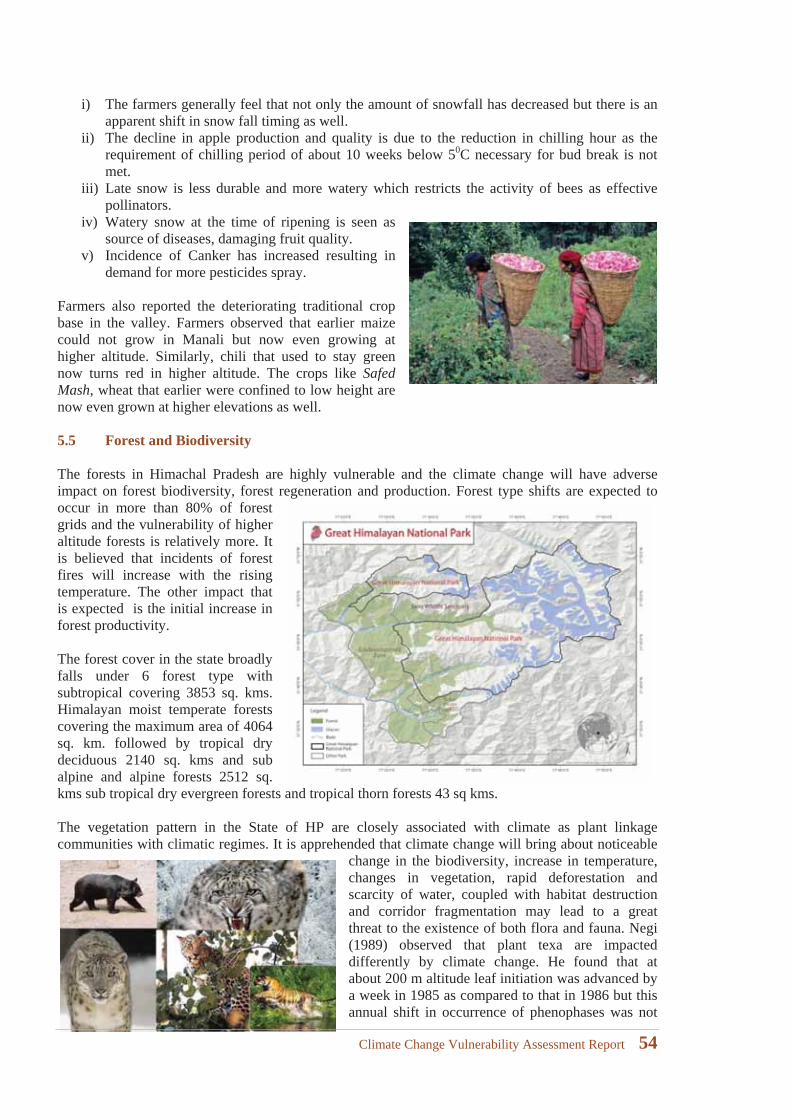
i) The farmers generally feel that not only the amount of snowfall has decreased but there is an apparent shift in snow fall timing as well.
ii) The decline in apple production and quality is due to the reduction in chilling hour as the requirement of chilling period of about 10 weeks below 50C necessary for bud break is not met.
iii) Late snow is less durable and more watery which restricts the activity of bees as effective pollinators.
iv) Watery snow at the time of ripening is seen as source of diseases, damaging fruit quality.
v) Incidence of Canker has increased resulting in demand for more pesticides spray.
Farmers also reported the deteriorating traditional crop base in the valley. Farmers observed that earlier maize could not grow in Manali but now even growing at higher altitude. Similarly, chili that used to stay green now turns red in higher altitude. The crops like Safed Mash, wheat that earlier were confined to low height arenow even grown at higher elevations as well.
5.5 Forest and Biodiversity
The forests in Himachal Pradesh are highly vulnerable and the climate change will have adverse impact on forest biodiversity, forest regeneration and production. Forest type shifts are expected to occur in more than 80% of forest grids and the vulnerability of higher altitude forests is relatively more. It is believed that incidents of forest fires will increase with the rising temperature. The other impact that is expected is the initial increase in forest productivity.
The forest cover in the state broadly falls under 6 forest type with subtropical covering 3853 sq. kms. Himalayan moist temperate forests covering the maximum area of 4064 sq. km. followed by tropical dry deciduous 2140 sq. kms and sub alpine and alpine forests 2512 sq. kms sub tropical dry evergreen forests and tropical thorn forests 43 sq kms.
The vegetation pattern in the State of HP are closely associated with climate as plant linkage communities with climatic regimes. It is apprehended that climate change will bring about noticeable
change in the biodiversity, increase in temperature, changes in vegetation, rapid deforestation and scarcity of water, coupled with habitat destruction and corridor fragmentation may lead to a great threat to the existence of both flora and fauna. Negi (1989) observed that plant texa are impacted differently by climate change. He found that at about 200 m altitude leaf initiation was advanced by a week in 1985 as compared to that in 1986 but this annual shift in occurrence of phenophases was not
Climate Change Vulnerability Assessment Report 54
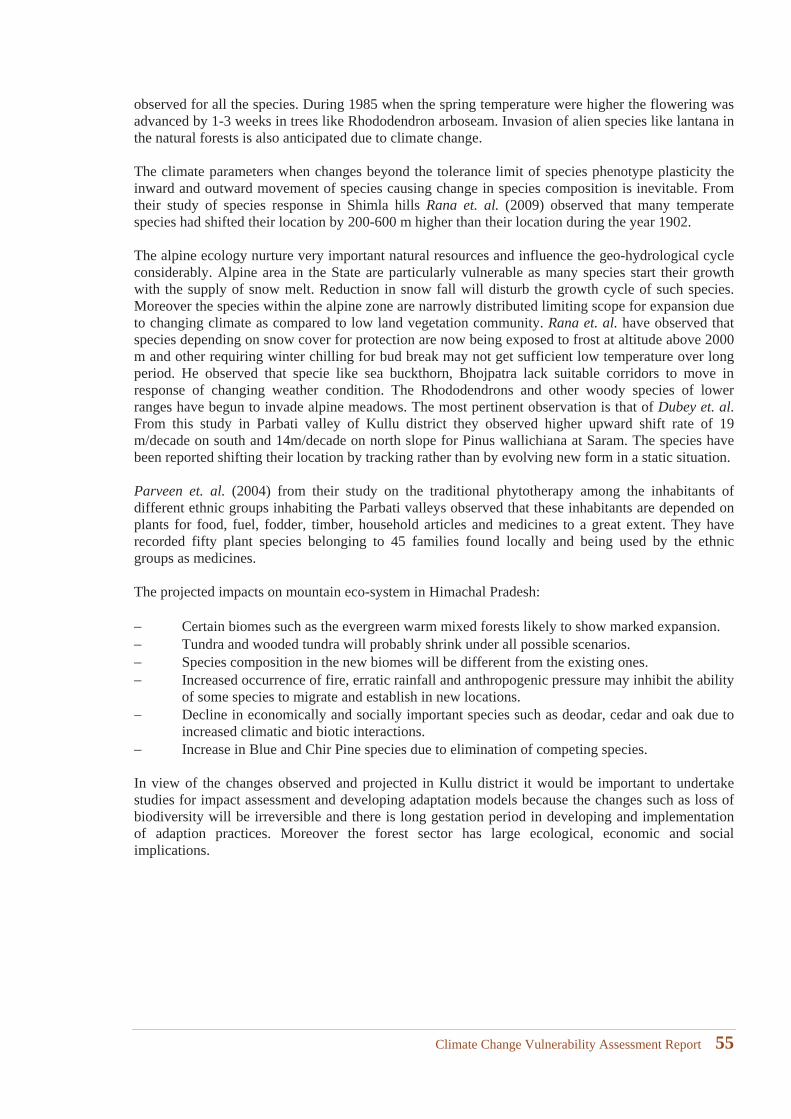
observed for all the species. During 1985 when the spring temperature were higher the flowering was advanced by 1-3 weeks in trees like Rhododendron arboseam. Invasion of alien species like lantana in the natural forests is also anticipated due to climate change.
The climate parameters when changes beyond the tolerance limit of species phenotype plasticity the inward and outward movement of species causing change in species composition is inevitable. From their study of species response in Shimla hills Rana et. al. (2009) observed that many temperate species had shifted their location by 200-600 m higher than their location during the year 1902.
The alpine ecology nurture very important natural resources and influence the geo-hydrological cycle considerably. Alpine area in the State are particularly vulnerable as many species start their growth with the supply of snow melt. Reduction in snow fall will disturb the growth cycle of such species. Moreover the species within the alpine zone are narrowly distributed limiting scope for expansion due to changing climate as compared to low land vegetation community. Rana et. al. have observed that species depending on snow cover for protection are now being exposed to frost at altitude above 2000 m and other requiring winter chilling for bud break may not get sufficient low temperature over long period. He observed that specie like sea buckthorn, Bhojpatra lack suitable corridors to move in response of changing weather condition. The Rhododendrons and other woody species of lower ranges have begun to invade alpine meadows. The most pertinent observation is that of Dubey et. al.From this study in Parbati valley of Kullu district they observed higher upward shift rate of 19 m/decade on south and 14m/decade on north slope for Pinus wallichiana at Saram. The species have been reported shifting their location by tracking rather than by evolving new form in a static situation.
Parveen et. al. (2004) from their study on the traditional phytotherapy among the inhabitants of different ethnic groups inhabiting the Parbati valleys observed that these inhabitants are depended on plants for food, fuel, fodder, timber, household articles and medicines to a great extent. They have recorded fifty plant species belonging to 45 families found locally and being used by the ethnic groups as medicines.
The projected impacts on mountain eco-system in Himachal Pradesh:
Certain biomes such as the evergreen warm mixed forests likely to show marked expansion. Tundra and wooded tundra will probably shrink under all possible scenarios.Species composition in the new biomes will be different from the existing ones.Increased occurrence of fire, erratic rainfall and anthropogenic pressure may inhibit the ability of some species to migrate and establish in new locations.Decline in economically and socially important species such as deodar, cedar and oak due to increased climatic and biotic interactions.Increase in Blue and Chir Pine species due to elimination of competing species.
In view of the changes observed and projected in Kullu district it would be important to undertake studies for impact assessment and developing adaptation models because the changes such as loss of biodiversity will be irreversible and there is long gestation period in developing and implementation of adaption practices. Moreover the forest sector has large ecological, economic and social implications.
Climate Change Vulnerability Assessment Report 55

Climate Change Vulnerability Assessment Report 56
6 Climate Change Vulnerability Assessment - Conceptual framework
Climate Change Vulnerability Assessment Report 57

Climate Change Vulnerability Assessment Report 58
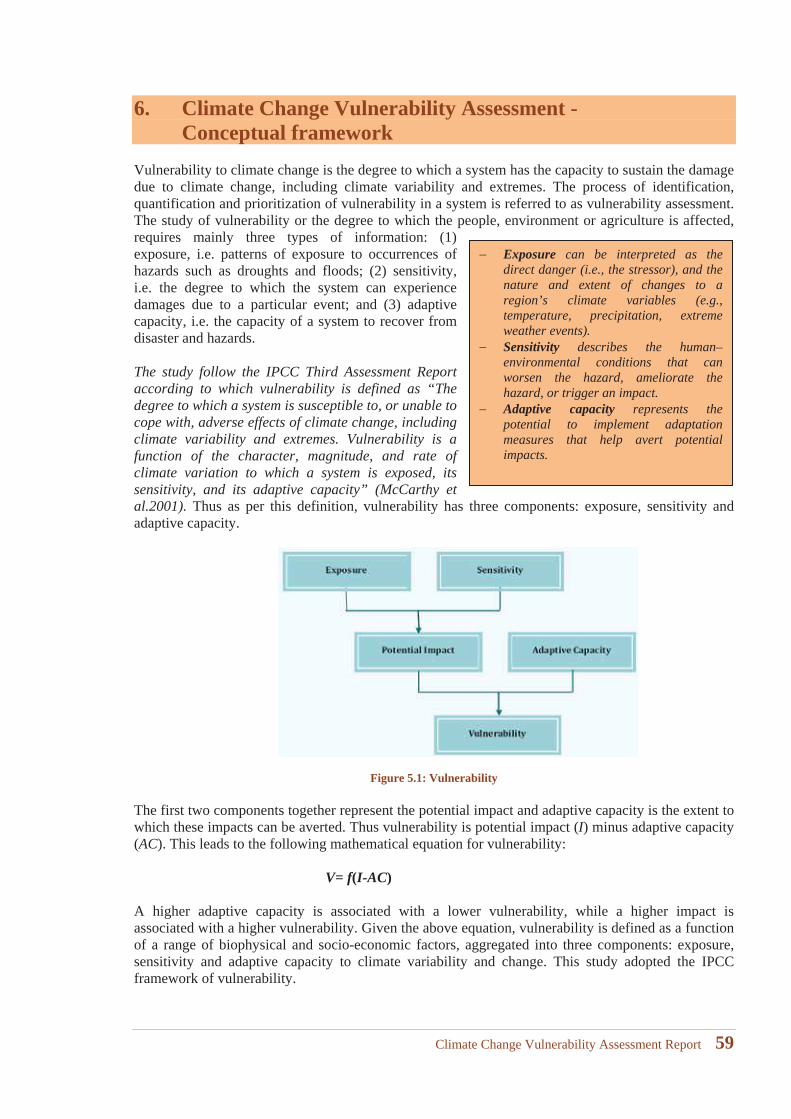
6. Climate Change Vulnerability Assessment -Conceptual framework
Vulnerability to climate change is the degree to which a system has the capacity to sustain the damage due to climate change, including climate variability and extremes. The process of identification, quantification and prioritization of vulnerability in a system is referred to as vulnerability assessment. The study of vulnerability or the degree to which the people, environment or agriculture is affected, requires mainly three types of information: (1) exposure, i.e. patterns of exposure to occurrences of hazards such as droughts and floods; (2) sensitivity, i.e. the degree to which the system can experience damages due to a particular event; and (3) adaptive capacity, i.e. the capacity of a system to recover from disaster and hazards.
The study follow the IPCC Third Assessment Report according to which vulnerability is defined as “The degree to which a system is susceptible to, or unable to cope with, adverse effects of climate change, including climate variability and extremes. Vulnerability is a function of the character, magnitude, and rate of climate variation to which a system is exposed, its sensitivity, and its adaptive capacity” (McCarthy et al.2001). Thus as per this definition, vulnerability has three components: exposure, sensitivity and adaptive capacity.
Figure 5.1: Vulnerability
The first two components together represent the potential impact and adaptive capacity is the extent to which these impacts can be averted. Thus vulnerability is potential impact (I) minus adaptive capacity (AC). This leads to the following mathematical equation for vulnerability:
V= f(I-AC)
A higher adaptive capacity is associated with a lower vulnerability, while a higher impact is associated with a higher vulnerability. Given the above equation, vulnerability is defined as a function of a range of biophysical and socio-economic factors, aggregated into three components: exposure, sensitivity and adaptive capacity to climate variability and change. This study adopted the IPCC framework of vulnerability.
Exposure can be interpreted as the direct danger (i.e., the stressor), and the nature and extent of changes to a region’s climate variables (e.g., temperature, precipitation, extreme weather events).Sensitivity describes the human–environmental conditions that canworsen the hazard, ameliorate the hazard, or trigger an impact.Adaptive capacity represents the potential to implement adaptation measures that help avert potential impacts.
Climate Change Vulnerability Assessment Report 59
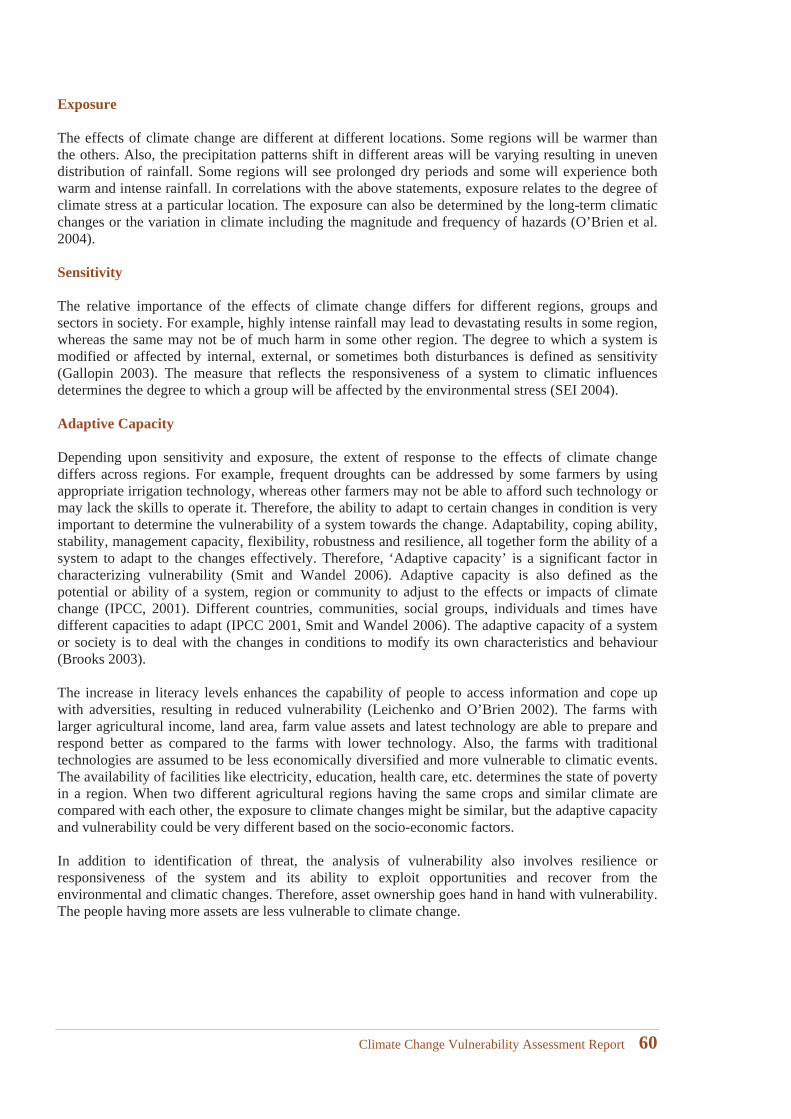
Exposure
The effects of climate change are different at different locations. Some regions will be warmer than the others. Also, the precipitation patterns shift in different areas will be varying resulting in uneven distribution of rainfall. Some regions will see prolonged dry periods and some will experience both warm and intense rainfall. In correlations with the above statements, exposure relates to the degree of climate stress at a particular location. The exposure can also be determined by the long-term climatic changes or the variation in climate including the magnitude and frequency of hazards (O’Brien et al. 2004).
Sensitivity
The relative importance of the effects of climate change differs for different regions, groups and sectors in society. For example, highly intense rainfall may lead to devastating results in some region, whereas the same may not be of much harm in some other region. The degree to which a system is modified or affected by internal, external, or sometimes both disturbances is defined as sensitivity (Gallopin 2003). The measure that reflects the responsiveness of a system to climatic influences determines the degree to which a group will be affected by the environmental stress (SEI 2004).
Adaptive Capacity
Depending upon sensitivity and exposure, the extent of response to the effects of climate changediffers across regions. For example, frequent droughts can be addressed by some farmers by using appropriate irrigation technology, whereas other farmers may not be able to afford such technology or may lack the skills to operate it. Therefore, the ability to adapt to certain changes in condition is very important to determine the vulnerability of a system towards the change. Adaptability, coping ability, stability, management capacity, flexibility, robustness and resilience, all together form the ability of a system to adapt to the changes effectively. Therefore, ‘Adaptive capacity’ is a significant factor in characterizing vulnerability (Smit and Wandel 2006). Adaptive capacity is also defined as the potential or ability of a system, region or community to adjust to the effects or impacts of climate change (IPCC, 2001). Different countries, communities, social groups, individuals and times have different capacities to adapt (IPCC 2001, Smit and Wandel 2006). The adaptive capacity of a system or society is to deal with the changes in conditions to modify its own characteristics and behaviour (Brooks 2003).
The increase in literacy levels enhances the capability of people to access information and cope up with adversities, resulting in reduced vulnerability (Leichenko and O’Brien 2002). The farms with larger agricultural income, land area, farm value assets and latest technology are able to prepare and respond better as compared to the farms with lower technology. Also, the farms with traditional technologies are assumed to be less economically diversified and more vulnerable to climatic events. The availability of facilities like electricity, education, health care, etc. determines the state of poverty in a region. When two different agricultural regions having the same crops and similar climate are compared with each other, the exposure to climate changes might be similar, but the adaptive capacity and vulnerability could be very different based on the socio-economic factors.
In addition to identification of threat, the analysis of vulnerability also involves resilience or responsiveness of the system and its ability to exploit opportunities and recover from the environmental and climatic changes. Therefore, asset ownership goes hand in hand with vulnerability. The people having more assets are less vulnerable to climate change.
Climate Change Vulnerability Assessment Report 60

7 Methodology Adopted for Vulnerability Assessment
Climate Change Vulnerability Assessment Report 61

Climate Change Vulnerability Assessment Report 62
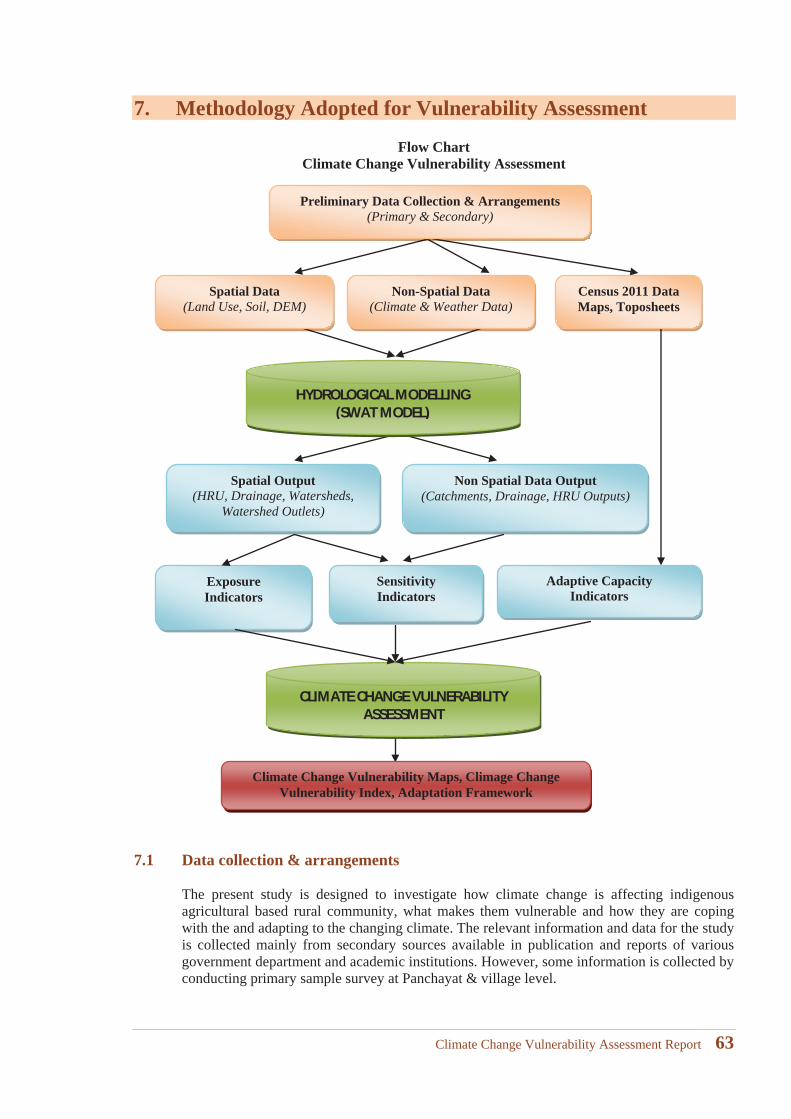
7. Methodology Adopted for Vulnerability Assessment
Flow Chart Climate Change Vulnerability Assessment
7.1 Data collection & arrangements
The present study is designed to investigate how climate change is affecting indigenous agricultural based rural community, what makes them vulnerable and how they are coping with the and adapting to the changing climate. The relevant information and data for the study is collected mainly from secondary sources available in publication and reports of various government department and academic institutions. However, some information is collected by conducting primary sample survey at Panchayat & village level.
Preliminary Data Collection & Arrangements(Primary & Secondary)
Spatial Data (Land Use, Soil, DEM)
Non-Spatial Data (Climate & Weather Data)
Spatial Output (HRU, Drainage, Watersheds,
Watershed Outlets)
Non Spatial Data Output(Catchments, Drainage, HRU Outputs)
HYDROLOGICAL MODELLING (SWAT MODEL)
CLIMATE CHANGE VULNERABILITY ASSESSMENT
ExposureIndicators
SensitivityIndicators
Adaptive CapacityIndicators
Census 2011 DataMaps, Toposheets
Climate Change Vulnerability Maps, Climage Change Vulnerability Index, Adaptation Framework
Climate Change Vulnerability Assessment Report 63
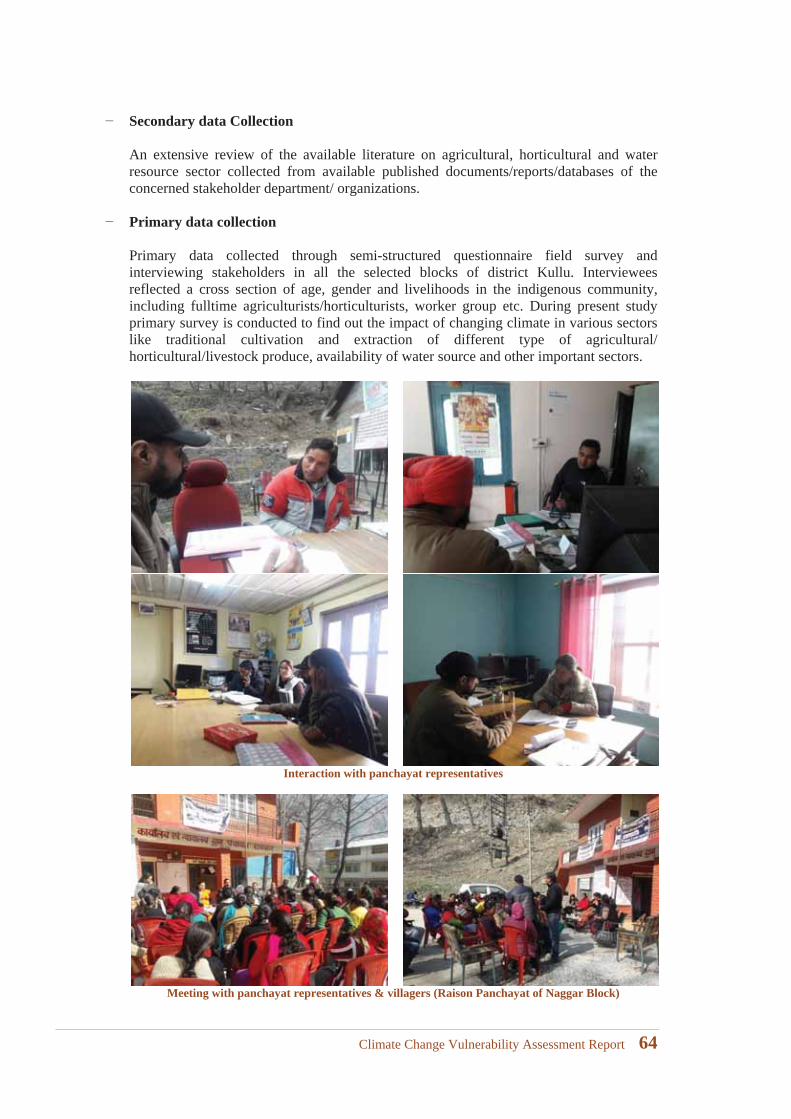
Secondary data Collection
An extensive review of the available literature on agricultural, horticultural and water resource sector collected from available published documents/reports/databases of the concerned stakeholder department/ organizations.
Primary data collection
Primary data collected through semi-structured questionnaire field survey and interviewing stakeholders in all the selected blocks of district Kullu. Interviewees reflected a cross section of age, gender and livelihoods in the indigenous community, including fulltime agriculturists/horticulturists, worker group etc. During present study primary survey is conducted to find out the impact of changing climate in various sectors like traditional cultivation and extraction of different type of agricultural/ horticultural/livestock produce, availability of water source and other important sectors.
Interaction with panchayat representatives
Meeting with panchayat representatives & villagers (Raison Panchayat of Naggar Block)
Climate Change Vulnerability Assessment Report 64
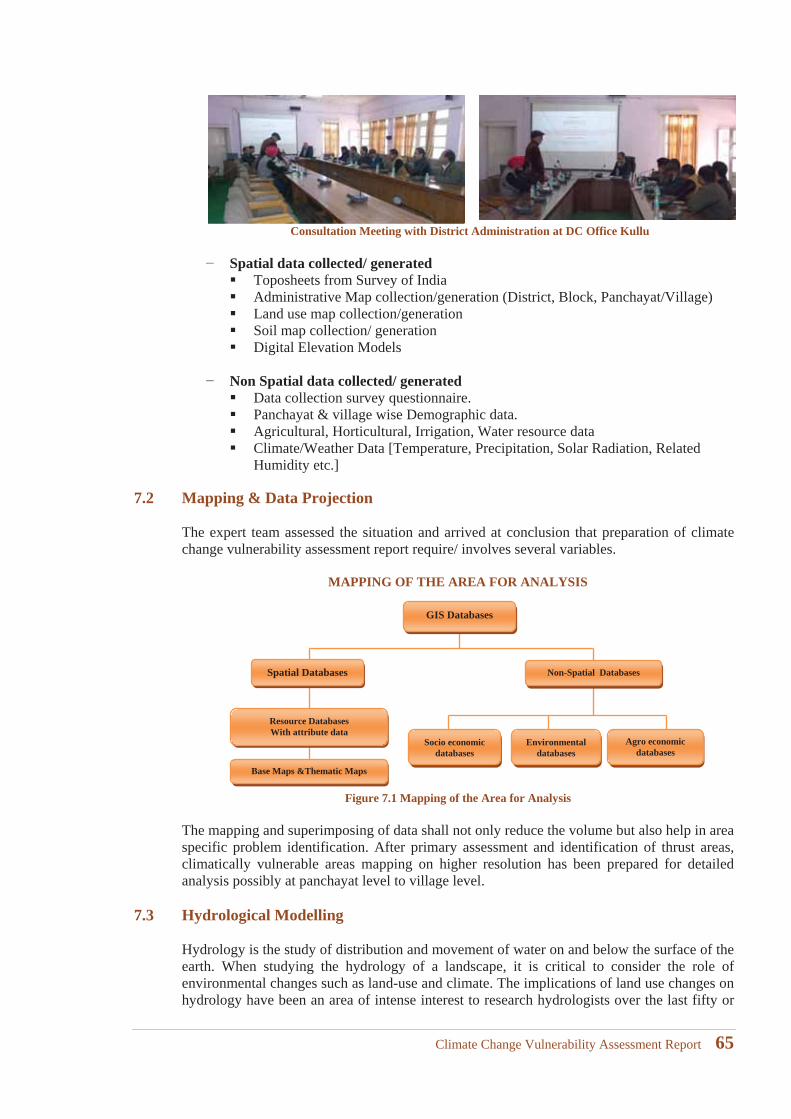
Consultation Meeting with District Administration at DC Office Kullu
Spatial data collected/ generatedToposheets from Survey of IndiaAdministrative Map collection/generation (District, Block, Panchayat/Village)Land use map collection/generationSoil map collection/ generationDigital Elevation Models
Non Spatial data collected/ generated Data collection survey questionnaire.Panchayat & village wise Demographic data.Agricultural, Horticultural, Irrigation, Water resource data Climate/Weather Data [Temperature, Precipitation, Solar Radiation, Related Humidity etc.]
7.2 Mapping & Data Projection
The expert team assessed the situation and arrived at conclusion that preparation of climate change vulnerability assessment report require/ involves several variables.
MAPPING OF THE AREA FOR ANALYSIS
Figure 7.1 Mapping of the Area for Analysis
The mapping and superimposing of data shall not only reduce the volume but also help in area specific problem identification. After primary assessment and identification of thrust areas, climatically vulnerable areas mapping on higher resolution has been prepared for detailed analysis possibly at panchayat level to village level.
7.3 Hydrological Modelling
Hydrology is the study of distribution and movement of water on and below the surface of the earth. When studying the hydrology of a landscape, it is critical to consider the role of environmental changes such as land-use and climate. The implications of land use changes on hydrology have been an area of intense interest to research hydrologists over the last fifty or
GIS Databases
Spatial Databases Non-Spatial Databases
Resource DatabasesWith attribute data
Socio economic databases
Environmental databases
Agro economic databases
Base Maps &Thematic Maps
Climate Change Vulnerability Assessment Report 65
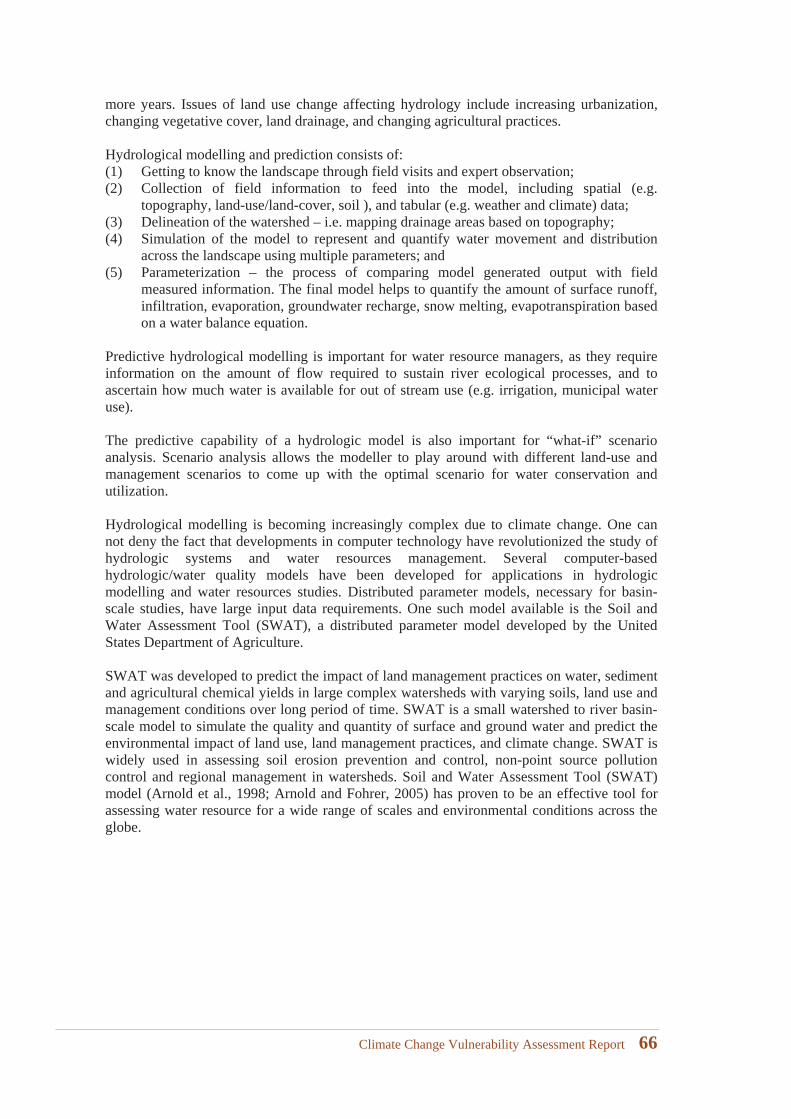
more years. Issues of land use change affecting hydrology include increasing urbanization, changing vegetative cover, land drainage, and changing agricultural practices.
Hydrological modelling and prediction consists of: (1) Getting to know the landscape through field visits and expert observation; (2) Collection of field information to feed into the model, including spatial (e.g.
topography, land-use/land-cover, soil ), and tabular (e.g. weather and climate) data; (3) Delineation of the watershed – i.e. mapping drainage areas based on topography; (4) Simulation of the model to represent and quantify water movement and distribution
across the landscape using multiple parameters; and (5) Parameterization – the process of comparing model generated output with field
measured information. The final model helps to quantify the amount of surface runoff, infiltration, evaporation, groundwater recharge, snow melting, evapotranspiration based on a water balance equation.
Predictive hydrological modelling is important for water resource managers, as they require information on the amount of flow required to sustain river ecological processes, and to ascertain how much water is available for out of stream use (e.g. irrigation, municipal water use).
The predictive capability of a hydrologic model is also important for “what-if” scenario analysis. Scenario analysis allows the modeller to play around with different land-use and management scenarios to come up with the optimal scenario for water conservation and utilization.
Hydrological modelling is becoming increasingly complex due to climate change. One can not deny the fact that developments in computer technology have revolutionized the study of hydrologic systems and water resources management. Several computer-based hydrologic/water quality models have been developed for applications in hydrologic modelling and water resources studies. Distributed parameter models, necessary for basin-scale studies, have large input data requirements. One such model available is the Soil and Water Assessment Tool (SWAT), a distributed parameter model developed by the United States Department of Agriculture.
SWAT was developed to predict the impact of land management practices on water, sediment and agricultural chemical yields in large complex watersheds with varying soils, land use and management conditions over long period of time. SWAT is a small watershed to river basin-scale model to simulate the quality and quantity of surface and ground water and predict the environmental impact of land use, land management practices, and climate change. SWAT is widely used in assessing soil erosion prevention and control, non-point source pollution control and regional management in watersheds. Soil and Water Assessment Tool (SWAT) model (Arnold et al., 1998; Arnold and Fohrer, 2005) has proven to be an effective tool for assessing water resource for a wide range of scales and environmental conditions across the globe.
Climate Change Vulnerability Assessment Report 66
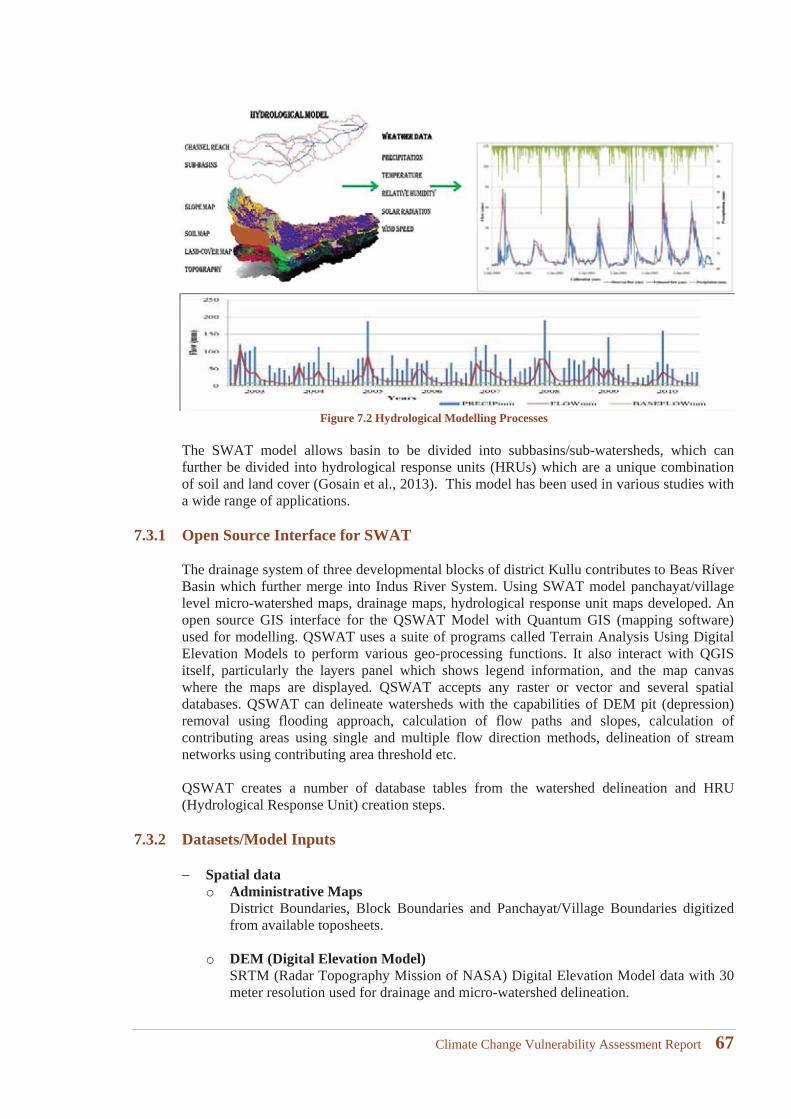
Figure 7.2 Hydrological Modelling Processes
The SWAT model allows basin to be divided into subbasins/sub-watersheds, which can further be divided into hydrological response units (HRUs) which are a unique combination of soil and land cover (Gosain et al., 2013). This model has been used in various studies with a wide range of applications.
7.3.1 Open Source Interface for SWAT
The drainage system of three developmental blocks of district Kullu contributes to Beas River Basin which further merge into Indus River System. Using SWAT model panchayat/villagelevel micro-watershed maps, drainage maps, hydrological response unit maps developed. An open source GIS interface for the QSWAT Model with Quantum GIS (mapping software) used for modelling. QSWAT uses a suite of programs called Terrain Analysis Using Digital Elevation Models to perform various geo-processing functions. It also interact with QGIS itself, particularly the layers panel which shows legend information, and the map canvas where the maps are displayed. QSWAT accepts any raster or vector and several spatial databases. QSWAT can delineate watersheds with the capabilities of DEM pit (depression) removal using flooding approach, calculation of flow paths and slopes, calculation of contributing areas using single and multiple flow direction methods, delineation of stream networks using contributing area threshold etc.
QSWAT creates a number of database tables from the watershed delineation and HRU (Hydrological Response Unit) creation steps.
7.3.2 Datasets/Model Inputs
Spatial datao Administrative Maps
District Boundaries, Block Boundaries and Panchayat/Village Boundaries digitized from available toposheets.
o DEM (Digital Elevation Model)SRTM (Radar Topography Mission of NASA) Digital Elevation Model data with 30 meter resolution used for drainage and micro-watershed delineation.
Climate Change Vulnerability Assessment Report 67
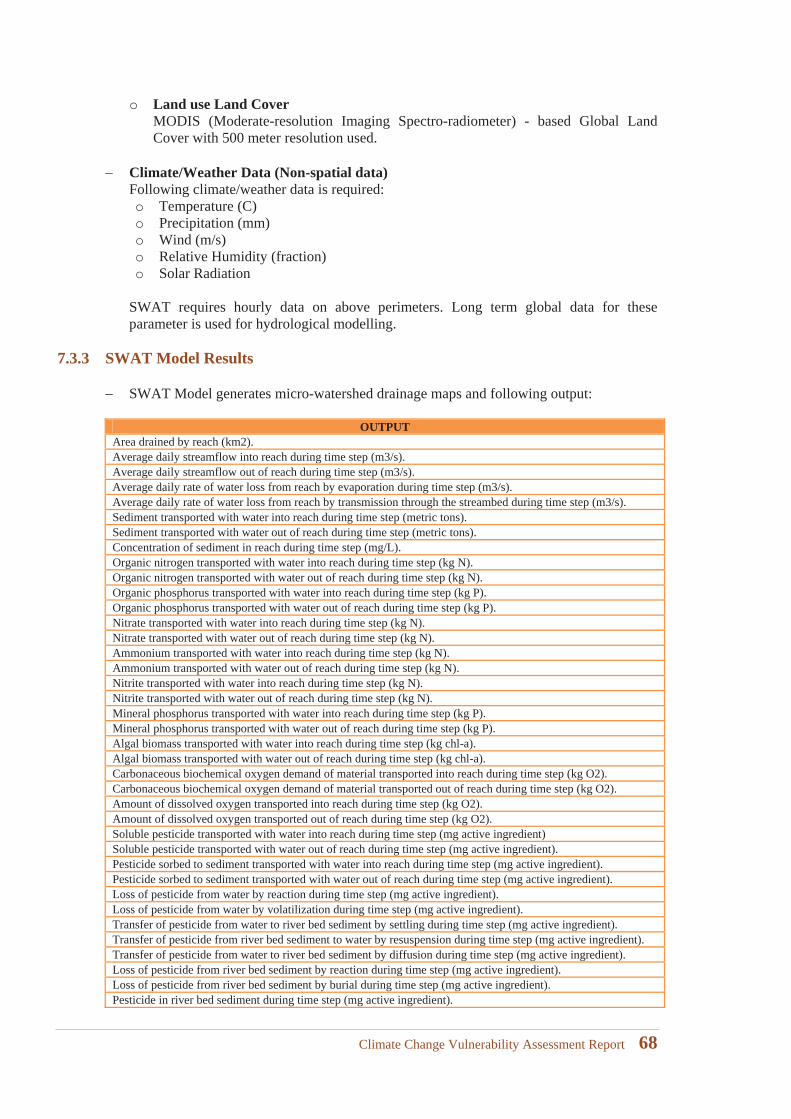
o Land use Land CoverMODIS (Moderate-resolution Imaging Spectro-radiometer) - based Global Land Cover with 500 meter resolution used.
Climate/Weather Data (Non-spatial data)Following climate/weather data is required:o Temperature (C)o Precipitation (mm)o Wind (m/s)o Relative Humidity (fraction)o Solar Radiation
SWAT requires hourly data on above perimeters. Long term global data for these parameter is used for hydrological modelling.
7.3.3 SWAT Model Results
SWAT Model generates micro-watershed drainage maps and following output:
OUTPUTArea drained by reach (km2).Average daily streamflow into reach during time step (m3/s).Average daily streamflow out of reach during time step (m3/s).Average daily rate of water loss from reach by evaporation during time step (m3/s).Average daily rate of water loss from reach by transmission through the streambed during time step (m3/s).Sediment transported with water into reach during time step (metric tons).Sediment transported with water out of reach during time step (metric tons).Concentration of sediment in reach during time step (mg/L).Organic nitrogen transported with water into reach during time step (kg N).Organic nitrogen transported with water out of reach during time step (kg N).Organic phosphorus transported with water into reach during time step (kg P).Organic phosphorus transported with water out of reach during time step (kg P).Nitrate transported with water into reach during time step (kg N).Nitrate transported with water out of reach during time step (kg N).Ammonium transported with water into reach during time step (kg N).Ammonium transported with water out of reach during time step (kg N).Nitrite transported with water into reach during time step (kg N).Nitrite transported with water out of reach during time step (kg N).Mineral phosphorus transported with water into reach during time step (kg P).Mineral phosphorus transported with water out of reach during time step (kg P).Algal biomass transported with water into reach during time step (kg chl-a).Algal biomass transported with water out of reach during time step (kg chl-a).Carbonaceous biochemical oxygen demand of material transported into reach during time step (kg O2).Carbonaceous biochemical oxygen demand of material transported out of reach during time step (kg O2).Amount of dissolved oxygen transported into reach during time step (kg O2).Amount of dissolved oxygen transported out of reach during time step (kg O2).Soluble pesticide transported with water into reach during time step (mg active ingredient)Soluble pesticide transported with water out of reach during time step (mg active ingredient).Pesticide sorbed to sediment transported with water into reach during time step (mg active ingredient).Pesticide sorbed to sediment transported with water out of reach during time step (mg active ingredient).Loss of pesticide from water by reaction during time step (mg active ingredient).Loss of pesticide from water by volatilization during time step (mg active ingredient).Transfer of pesticide from water to river bed sediment by settling during time step (mg active ingredient).Transfer of pesticide from river bed sediment to water by resuspension during time step (mg active ingredient).Transfer of pesticide from water to river bed sediment by diffusion during time step (mg active ingredient).Loss of pesticide from river bed sediment by reaction during time step (mg active ingredient).Loss of pesticide from river bed sediment by burial during time step (mg active ingredient).Pesticide in river bed sediment during time step (mg active ingredient).
Climate Change Vulnerability Assessment Report 68
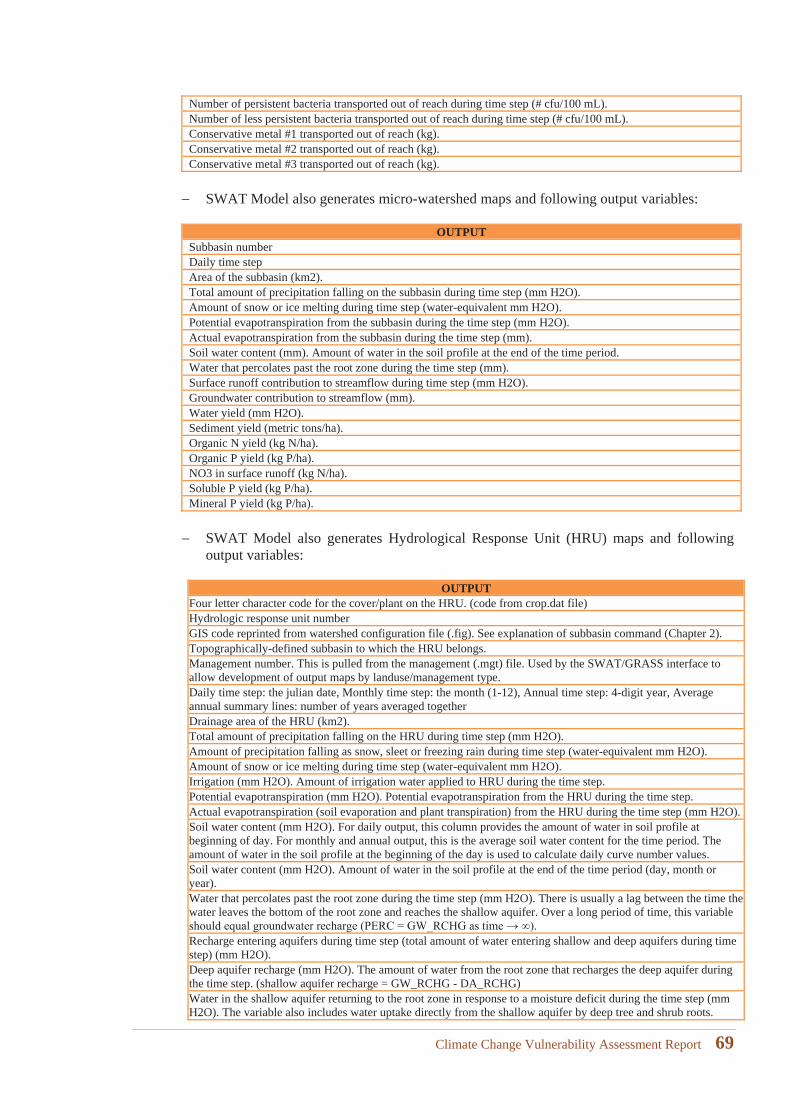
Number of persistent bacteria transported out of reach during time step (# cfu/100 mL).Number of less persistent bacteria transported out of reach during time step (# cfu/100 mL).Conservative metal #1 transported out of reach (kg).Conservative metal #2 transported out of reach (kg).Conservative metal #3 transported out of reach (kg).
SWAT Model also generates micro-watershed maps and following output variables:
OUTPUTSubbasin numberDaily time stepArea of the subbasin (km2).Total amount of precipitation falling on the subbasin during time step (mm H2O).Amount of snow or ice melting during time step (water-equivalent mm H2O).Potential evapotranspiration from the subbasin during the time step (mm H2O).Actual evapotranspiration from the subbasin during the time step (mm).Soil water content (mm). Amount of water in the soil profile at the end of the time period.Water that percolates past the root zone during the time step (mm). Surface runoff contribution to streamflow during time step (mm H2O).Groundwater contribution to streamflow (mm). Water yield (mm H2O). Sediment yield (metric tons/ha). Organic N yield (kg N/ha). Organic P yield (kg P/ha). NO3 in surface runoff (kg N/ha). Soluble P yield (kg P/ha). Mineral P yield (kg P/ha).
SWAT Model also generates Hydrological Response Unit (HRU) maps and following output variables:
OUTPUTFour letter character code for the cover/plant on the HRU. (code from crop.dat file)Hydrologic response unit numberGIS code reprinted from watershed configuration file (.fig). See explanation of subbasin command (Chapter 2).Topographically-defined subbasin to which the HRU belongs.Management number. This is pulled from the management (.mgt) file. Used by the SWAT/GRASS interface to allow development of output maps by landuse/management type.Daily time step: the julian date, Monthly time step: the month (1-12), Annual time step: 4-digit year, Average annual summary lines: number of years averaged togetherDrainage area of the HRU (km2).Total amount of precipitation falling on the HRU during time step (mm H2O).Amount of precipitation falling as snow, sleet or freezing rain during time step (water-equivalent mm H2O).Amount of snow or ice melting during time step (water-equivalent mm H2O).Irrigation (mm H2O). Amount of irrigation water applied to HRU during the time step.Potential evapotranspiration (mm H2O). Potential evapotranspiration from the HRU during the time step.Actual evapotranspiration (soil evaporation and plant transpiration) from the HRU during the time step (mm H2O).Soil water content (mm H2O). For daily output, this column provides the amount of water in soil profile at beginning of day. For monthly and annual output, this is the average soil water content for the time period. The amount of water in the soil profile at the beginning of the day is used to calculate daily curve number values.Soil water content (mm H2O). Amount of water in the soil profile at the end of the time period (day, month or year).Water that percolates past the root zone during the time step (mm H2O). There is usually a lag between the time the water leaves the bottom of the root zone and reaches the shallow aquifer. Over a long period of time, this variable
Recharge entering aquifers during time step (total amount of water entering shallow and deep aquifers during time step) (mm H2O).Deep aquifer recharge (mm H2O). The amount of water from the root zone that recharges the deep aquifer during the time step. (shallow aquifer recharge = GW_RCHG - DA_RCHG)Water in the shallow aquifer returning to the root zone in response to a moisture deficit during the time step (mm H2O). The variable also includes water uptake directly from the shallow aquifer by deep tree and shrub roots.
Climate Change Vulnerability Assessment Report 69
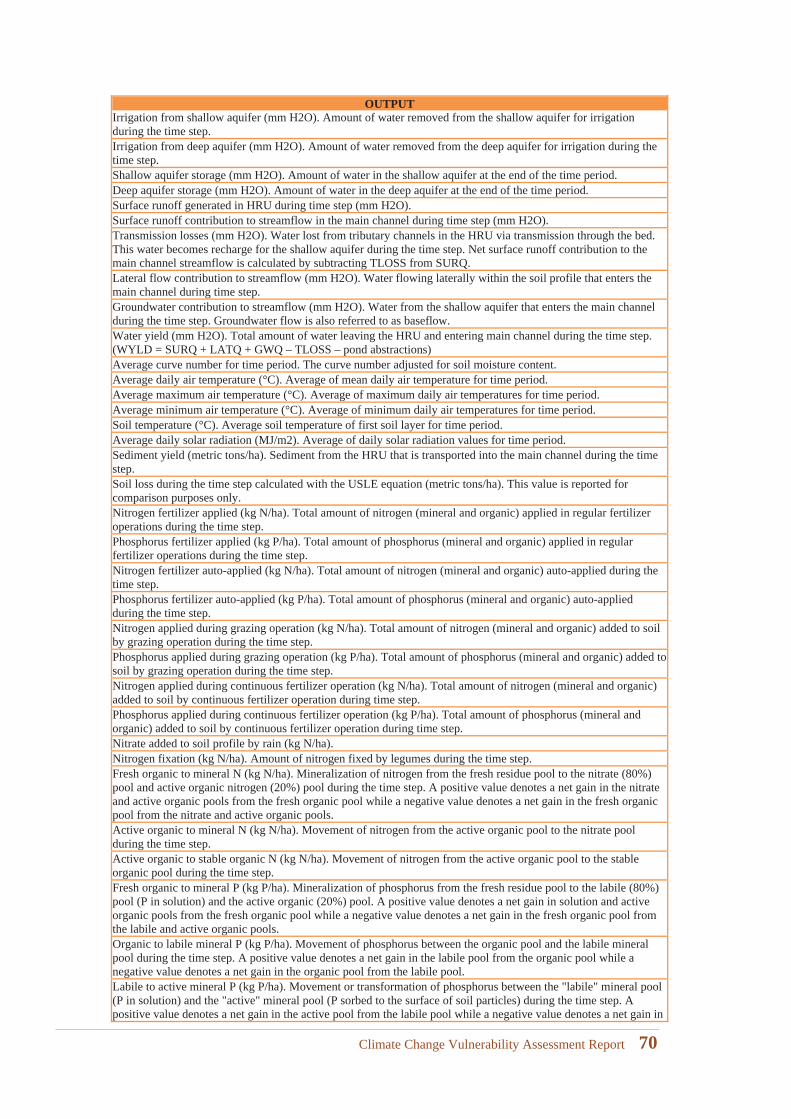
OUTPUTIrrigation from shallow aquifer (mm H2O). Amount of water removed from the shallow aquifer for irrigation during the time step.Irrigation from deep aquifer (mm H2O). Amount of water removed from the deep aquifer for irrigation during the time step.Shallow aquifer storage (mm H2O). Amount of water in the shallow aquifer at the end of the time period.Deep aquifer storage (mm H2O). Amount of water in the deep aquifer at the end of the time period.Surface runoff generated in HRU during time step (mm H2O).Surface runoff contribution to streamflow in the main channel during time step (mm H2O).Transmission losses (mm H2O). Water lost from tributary channels in the HRU via transmission through the bed. This water becomes recharge for the shallow aquifer during the time step. Net surface runoff contribution to the main channel streamflow is calculated by subtracting TLOSS from SURQ.Lateral flow contribution to streamflow (mm H2O). Water flowing laterally within the soil profile that enters the main channel during time step.Groundwater contribution to streamflow (mm H2O). Water from the shallow aquifer that enters the main channel during the time step. Groundwater flow is also referred to as baseflow.Water yield (mm H2O). Total amount of water leaving the HRU and entering main channel during the time step. (WYLD = SURQ + LATQ + GWQ – TLOSS – pond abstractions)Average curve number for time period. The curve number adjusted for soil moisture content.Average daily air temperature (°C). Average of mean daily air temperature for time period.Average maximum air temperature (°C). Average of maximum daily air temperatures for time period.Average minimum air temperature (°C). Average of minimum daily air temperatures for time period.Soil temperature (°C). Average soil temperature of first soil layer for time period.Average daily solar radiation (MJ/m2). Average of daily solar radiation values for time period.Sediment yield (metric tons/ha). Sediment from the HRU that is transported into the main channel during the time step.Soil loss during the time step calculated with the USLE equation (metric tons/ha). This value is reported for comparison purposes only.Nitrogen fertilizer applied (kg N/ha). Total amount of nitrogen (mineral and organic) applied in regular fertilizer operations during the time step.Phosphorus fertilizer applied (kg P/ha). Total amount of phosphorus (mineral and organic) applied in regular fertilizer operations during the time step.Nitrogen fertilizer auto-applied (kg N/ha). Total amount of nitrogen (mineral and organic) auto-applied during the time step.Phosphorus fertilizer auto-applied (kg P/ha). Total amount of phosphorus (mineral and organic) auto-applied during the time step.Nitrogen applied during grazing operation (kg N/ha). Total amount of nitrogen (mineral and organic) added to soil by grazing operation during the time step.Phosphorus applied during grazing operation (kg P/ha). Total amount of phosphorus (mineral and organic) added to soil by grazing operation during the time step.Nitrogen applied during continuous fertilizer operation (kg N/ha). Total amount of nitrogen (mineral and organic) added to soil by continuous fertilizer operation during time step.Phosphorus applied during continuous fertilizer operation (kg P/ha). Total amount of phosphorus (mineral and organic) added to soil by continuous fertilizer operation during time step.Nitrate added to soil profile by rain (kg N/ha).Nitrogen fixation (kg N/ha). Amount of nitrogen fixed by legumes during the time step.Fresh organic to mineral N (kg N/ha). Mineralization of nitrogen from the fresh residue pool to the nitrate (80%) pool and active organic nitrogen (20%) pool during the time step. A positive value denotes a net gain in the nitrate and active organic pools from the fresh organic pool while a negative value denotes a net gain in the fresh organic pool from the nitrate and active organic pools.Active organic to mineral N (kg N/ha). Movement of nitrogen from the active organic pool to the nitrate pool during the time step.Active organic to stable organic N (kg N/ha). Movement of nitrogen from the active organic pool to the stable organic pool during the time step.Fresh organic to mineral P (kg P/ha). Mineralization of phosphorus from the fresh residue pool to the labile (80%) pool (P in solution) and the active organic (20%) pool. A positive value denotes a net gain in solution and active organic pools from the fresh organic pool while a negative value denotes a net gain in the fresh organic pool from the labile and active organic pools.Organic to labile mineral P (kg P/ha). Movement of phosphorus between the organic pool and the labile mineral pool during the time step. A positive value denotes a net gain in the labile pool from the organic pool while a negative value denotes a net gain in the organic pool from the labile pool.Labile to active mineral P (kg P/ha). Movement or transformation of phosphorus between the "labile" mineral pool (P in solution) and the "active" mineral pool (P sorbed to the surface of soil particles) during the time step. A positive value denotes a net gain in the active pool from the labile pool while a negative value denotes a net gain in
Climate Change Vulnerability Assessment Report 70
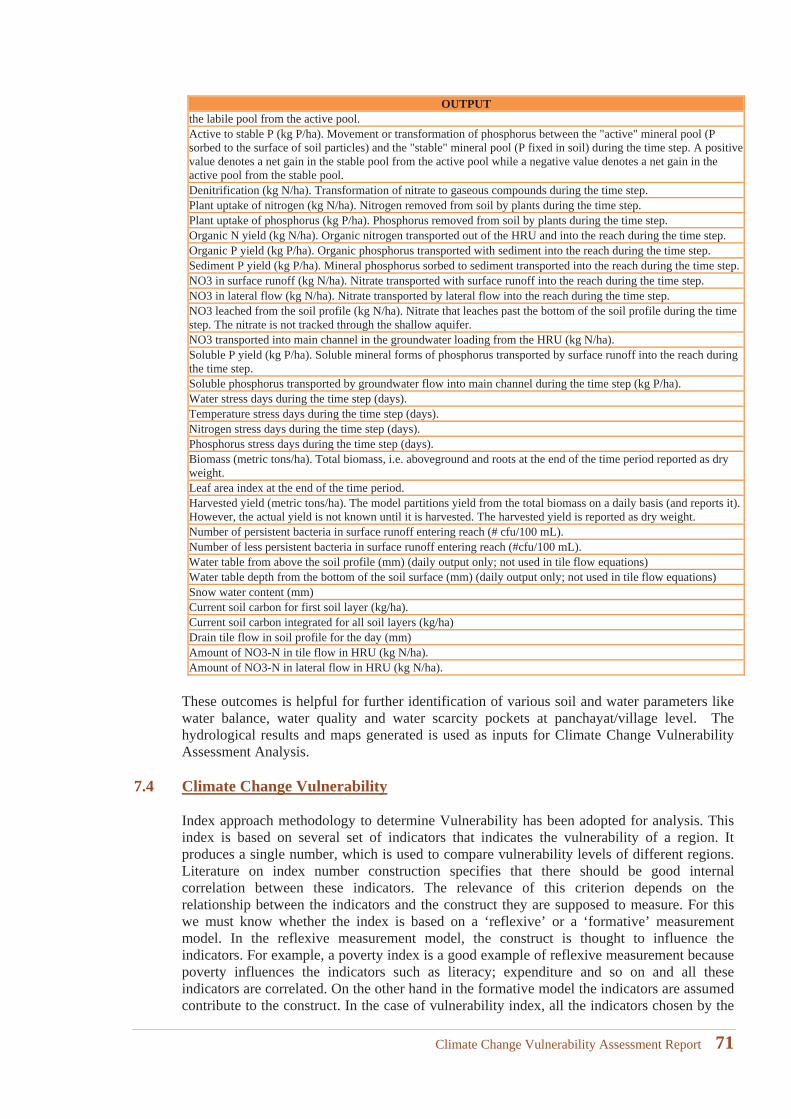
OUTPUTthe labile pool from the active pool.Active to stable P (kg P/ha). Movement or transformation of phosphorus between the "active" mineral pool (P sorbed to the surface of soil particles) and the "stable" mineral pool (P fixed in soil) during the time step. A positive value denotes a net gain in the stable pool from the active pool while a negative value denotes a net gain in the active pool from the stable pool.Denitrification (kg N/ha). Transformation of nitrate to gaseous compounds during the time step.Plant uptake of nitrogen (kg N/ha). Nitrogen removed from soil by plants during the time step.Plant uptake of phosphorus (kg P/ha). Phosphorus removed from soil by plants during the time step.Organic N yield (kg N/ha). Organic nitrogen transported out of the HRU and into the reach during the time step.Organic P yield (kg P/ha). Organic phosphorus transported with sediment into the reach during the time step.Sediment P yield (kg P/ha). Mineral phosphorus sorbed to sediment transported into the reach during the time step.NO3 in surface runoff (kg N/ha). Nitrate transported with surface runoff into the reach during the time step.NO3 in lateral flow (kg N/ha). Nitrate transported by lateral flow into the reach during the time step.NO3 leached from the soil profile (kg N/ha). Nitrate that leaches past the bottom of the soil profile during the time step. The nitrate is not tracked through the shallow aquifer.NO3 transported into main channel in the groundwater loading from the HRU (kg N/ha).Soluble P yield (kg P/ha). Soluble mineral forms of phosphorus transported by surface runoff into the reach during the time step.Soluble phosphorus transported by groundwater flow into main channel during the time step (kg P/ha).Water stress days during the time step (days).Temperature stress days during the time step (days).Nitrogen stress days during the time step (days).Phosphorus stress days during the time step (days).Biomass (metric tons/ha). Total biomass, i.e. aboveground and roots at the end of the time period reported as dry weight.Leaf area index at the end of the time period.Harvested yield (metric tons/ha). The model partitions yield from the total biomass on a daily basis (and reports it). However, the actual yield is not known until it is harvested. The harvested yield is reported as dry weight.Number of persistent bacteria in surface runoff entering reach (# cfu/100 mL).Number of less persistent bacteria in surface runoff entering reach (#cfu/100 mL).Water table from above the soil profile (mm) (daily output only; not used in tile flow equations)Water table depth from the bottom of the soil surface (mm) (daily output only; not used in tile flow equations)Snow water content (mm)Current soil carbon for first soil layer (kg/ha).Current soil carbon integrated for all soil layers (kg/ha)Drain tile flow in soil profile for the day (mm)Amount of NO3-N in tile flow in HRU (kg N/ha).Amount of NO3-N in lateral flow in HRU (kg N/ha).
These outcomes is helpful for further identification of various soil and water parameters like water balance, water quality and water scarcity pockets at panchayat/village level. The hydrological results and maps generated is used as inputs for Climate Change Vulnerability Assessment Analysis.
7.4 Climate Change Vulnerability
Index approach methodology to determine Vulnerability has been adopted for analysis. This index is based on several set of indicators that indicates the vulnerability of a region. It produces a single number, which is used to compare vulnerability levels of different regions. Literature on index number construction specifies that there should be good internal correlation between these indicators. The relevance of this criterion depends on the relationship between the indicators and the construct they are supposed to measure. For this we must know whether the index is based on a ‘reflexive’ or a ‘formative’ measurement model. In the reflexive measurement model, the construct is thought to influence the indicators. For example, a poverty index is a good example of reflexive measurement because poverty influences the indicators such as literacy; expenditure and so on and all these indicators are correlated. On the other hand in the formative model the indicators are assumed contribute to the construct. In the case of vulnerability index, all the indicators chosen by the
Climate Change Vulnerability Assessment Report 71
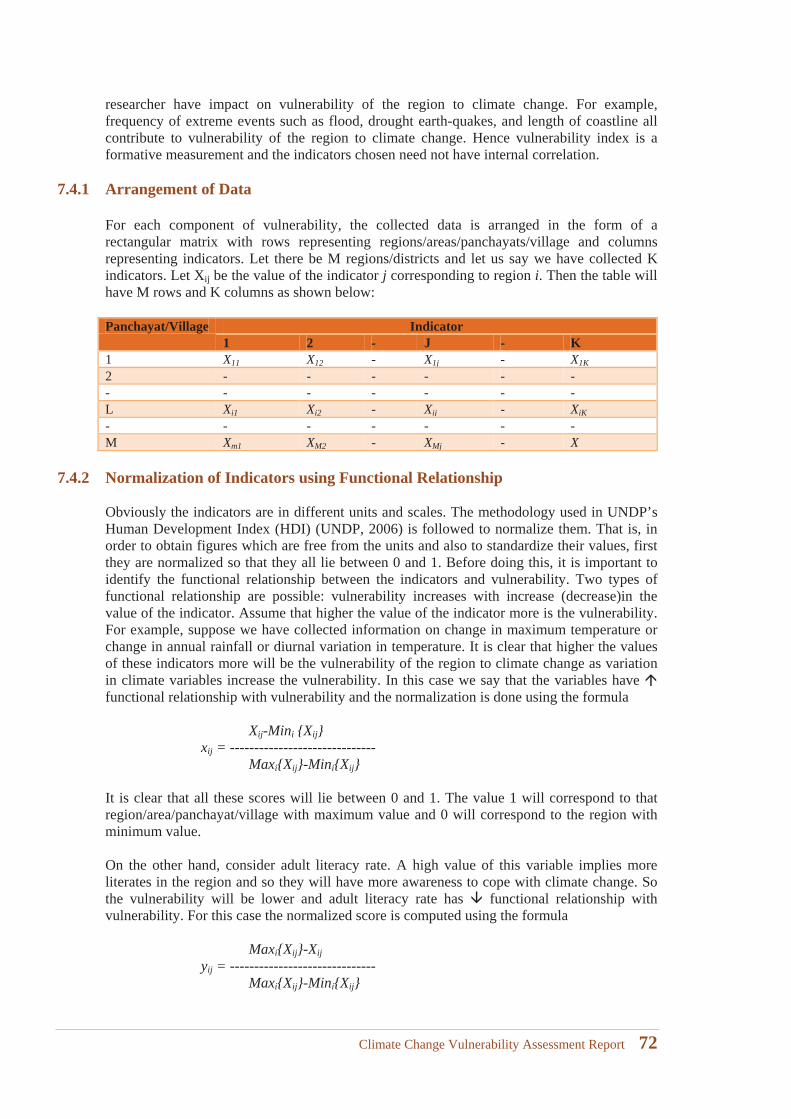
researcher have impact on vulnerability of the region to climate change. For example, frequency of extreme events such as flood, drought earth-quakes, and length of coastline all contribute to vulnerability of the region to climate change. Hence vulnerability index is a formative measurement and the indicators chosen need not have internal correlation.
7.4.1 Arrangement of Data
For each component of vulnerability, the collected data is arranged in the form of a rectangular matrix with rows representing regions/areas/panchayats/village and columns representing indicators. Let there be M regions/districts and let us say we have collected K indicators. Let Xij be the value of the indicator j corresponding to region i. Then the table will have M rows and K columns as shown below:
Panchayat/Village Indicator1 2 - J - K
1 X11 X12 - X1j - X1K
2 - - - - - -- - - - - - -L Xi1 Xi2 - Xij - XiK
- - - - - - -M Xm1 XM2 - XMj - X
7.4.2 Normalization of Indicators using Functional Relationship
Obviously the indicators are in different units and scales. The methodology used in UNDP’s Human Development Index (HDI) (UNDP, 2006) is followed to normalize them. That is, in order to obtain figures which are free from the units and also to standardize their values, first they are normalized so that they all lie between 0 and 1. Before doing this, it is important to identify the functional relationship between the indicators and vulnerability. Two types of functional relationship are possible: vulnerability increases with increase (decrease)in the value of the indicator. Assume that higher the value of the indicator more is the vulnerability. For example, suppose we have collected information on change in maximum temperature or change in annual rainfall or diurnal variation in temperature. It is clear that higher the values of these indicators more will be the vulnerability of the region to climate change as variation in climate variables increase the vulnerability. In this case we say that the variables have functional relationship with vulnerability and the normalization is done using the formula
Xij-Mini {Xij}xij = ------------------------------
Maxi{Xij}-Mini{Xij}
It is clear that all these scores will lie between 0 and 1. The value 1 will correspond to that region/area/panchayat/village with maximum value and 0 will correspond to the region with minimum value.
On the other hand, consider adult literacy rate. A high value of this variable implies more literates in the region and so they will have more awareness to cope with climate change. So the vulnerability will be lower and adult literacy rate has functional relationship with vulnerability. For this case the normalized score is computed using the formula
Maxi{Xij}-Xijyij = ------------------------------
Maxi{Xij}-Mini{Xij}
Climate Change Vulnerability Assessment Report 72
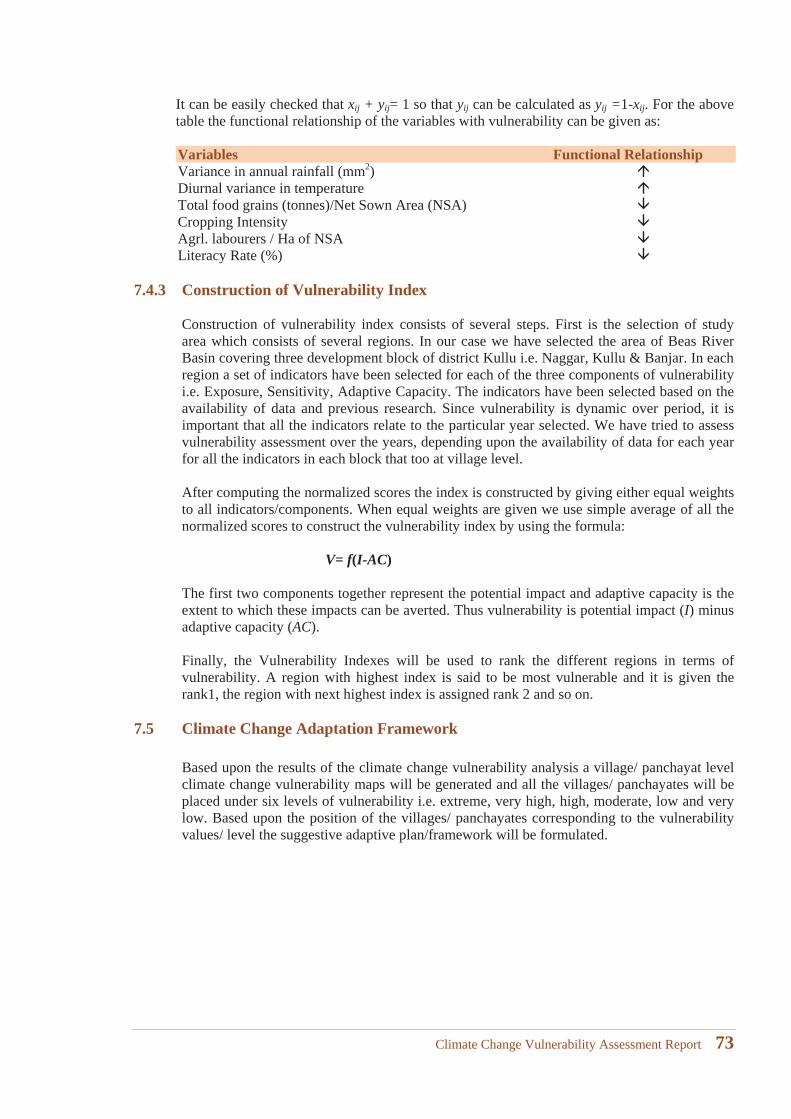
It can be easily checked that xij + yij= 1 so that yij can be calculated as yij =1-xij. For the above table the functional relationship of the variables with vulnerability can be given as:
Variables Functional RelationshipVariance in annual rainfall (mm2)Diurnal variance in temperatureTotal food grains (tonnes)/Net Sown Area (NSA)Cropping IntensityAgrl. labourers / Ha of NSALiteracy Rate (%)
7.4.3 Construction of Vulnerability Index
Construction of vulnerability index consists of several steps. First is the selection of study area which consists of several regions. In our case we have selected the area of Beas River Basin covering three development block of district Kullu i.e. Naggar, Kullu & Banjar. In each region a set of indicators have been selected for each of the three components of vulnerability i.e. Exposure, Sensitivity, Adaptive Capacity. The indicators have been selected based on the availability of data and previous research. Since vulnerability is dynamic over period, it is important that all the indicators relate to the particular year selected. We have tried to assess vulnerability assessment over the years, depending upon the availability of data for each year for all the indicators in each block that too at village level.
After computing the normalized scores the index is constructed by giving either equal weights to all indicators/components. When equal weights are given we use simple average of all the normalized scores to construct the vulnerability index by using the formula:
V= f(I-AC)
The first two components together represent the potential impact and adaptive capacity is the extent to which these impacts can be averted. Thus vulnerability is potential impact (I) minus adaptive capacity (AC).
Finally, the Vulnerability Indexes will be used to rank the different regions in terms of vulnerability. A region with highest index is said to be most vulnerable and it is given the rank1, the region with next highest index is assigned rank 2 and so on.
7.5 Climate Change Adaptation Framework
Based upon the results of the climate change vulnerability analysis a village/ panchayat level climate change vulnerability maps will be generated and all the villages/ panchayates will be placed under six levels of vulnerability i.e. extreme, very high, high, moderate, low and very low. Based upon the position of the villages/ panchayates corresponding to the vulnerability values/ level the suggestive adaptive plan/framework will be formulated.
Climate Change Vulnerability Assessment Report 73

Climate Change Vulnerability Assessment Report 74
8 Hydrological Modelling Outputs
Climate Change Vulnerability Assessment Report 75

Climate Change Vulnerability Assessment Report 76
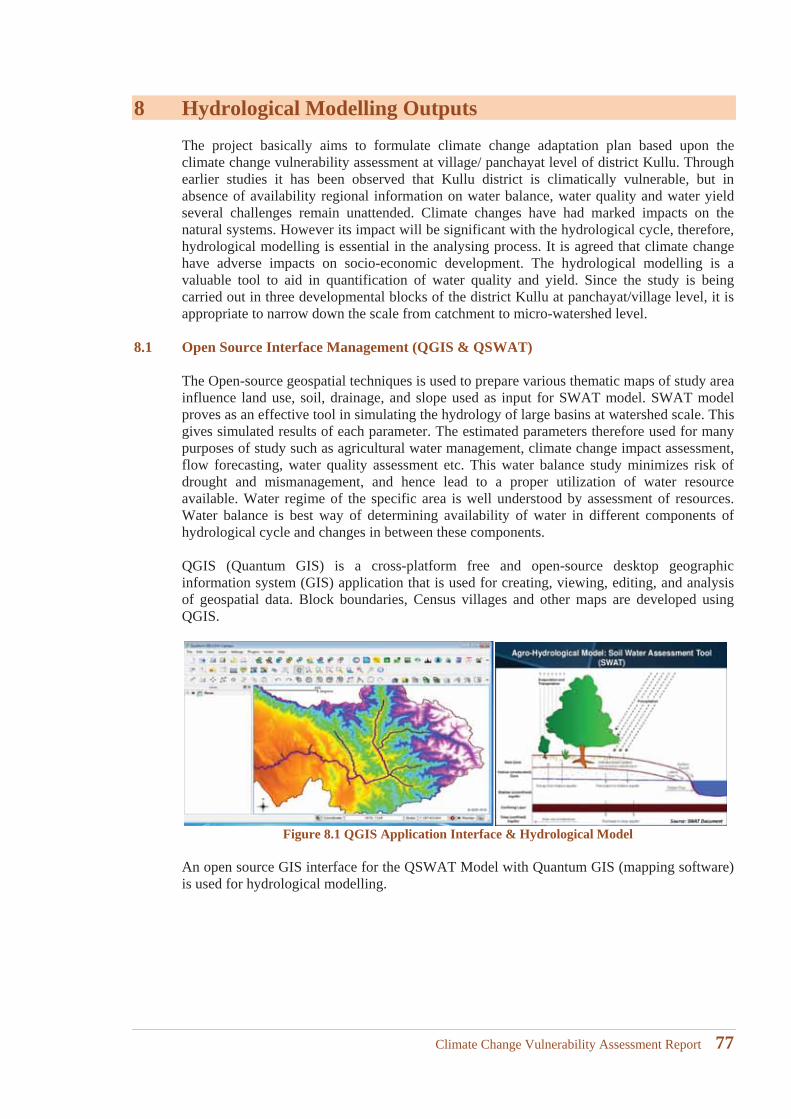
8 Hydrological Modelling OutputsThe project basically aims to formulate climate change adaptation plan based upon the climate change vulnerability assessment at village/ panchayat level of district Kullu. Through earlier studies it has been observed that Kullu district is climatically vulnerable, but in absence of availability regional information on water balance, water quality and water yield several challenges remain unattended. Climate changes have had marked impacts on the natural systems. However its impact will be significant with the hydrological cycle, therefore, hydrological modelling is essential in the analysing process. It is agreed that climate change have adverse impacts on socio-economic development. The hydrological modelling is a valuable tool to aid in quantification of water quality and yield. Since the study is being carried out in three developmental blocks of the district Kullu at panchayat/village level, it is appropriate to narrow down the scale from catchment to micro-watershed level.
8.1 Open Source Interface Management (QGIS & QSWAT)
The Open-source geospatial techniques is used to prepare various thematic maps of study area influence land use, soil, drainage, and slope used as input for SWAT model. SWAT model proves as an effective tool in simulating the hydrology of large basins at watershed scale. This gives simulated results of each parameter. The estimated parameters therefore used for many purposes of study such as agricultural water management, climate change impact assessment, flow forecasting, water quality assessment etc. This water balance study minimizes risk of drought and mismanagement, and hence lead to a proper utilization of water resource available. Water regime of the specific area is well understood by assessment of resources. Water balance is best way of determining availability of water in different components of hydrological cycle and changes in between these components.
QGIS (Quantum GIS) is a cross-platform free and open-source desktop geographic information system (GIS) application that is used for creating, viewing, editing, and analysis of geospatial data. Block boundaries, Census villages and other maps are developed using QGIS.
Figure 8.1 QGIS Application Interface & Hydrological Model
An open source GIS interface for the QSWAT Model with Quantum GIS (mapping software) is used for hydrological modelling.
Climate Change Vulnerability Assessment Report 77
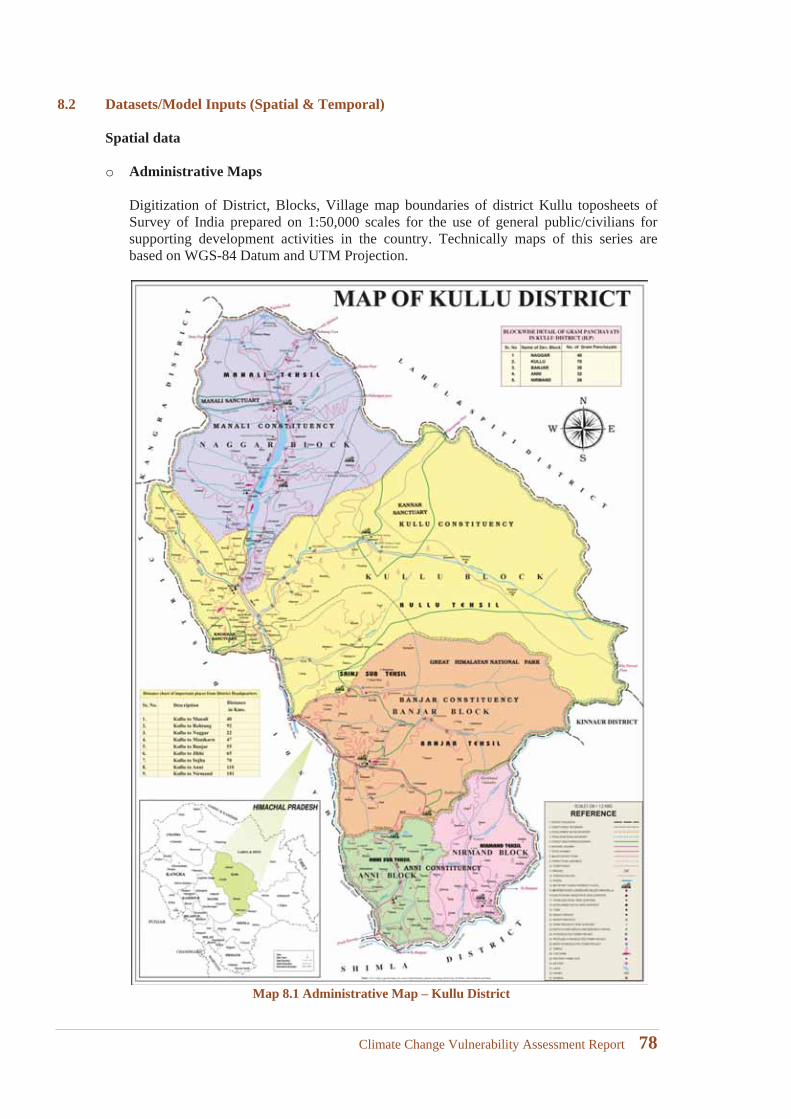
8.2 Datasets/Model Inputs (Spatial & Temporal)
Spatial data
o Administrative Maps
Digitization of District, Blocks, Village map boundaries of district Kullu toposheets of Survey of India prepared on 1:50,000 scales for the use of general public/civilians for supporting development activities in the country. Technically maps of this series are based on WGS-84 Datum and UTM Projection.
Map 8.1 Administrative Map – Kullu District
Climate Change Vulnerability Assessment Report 78
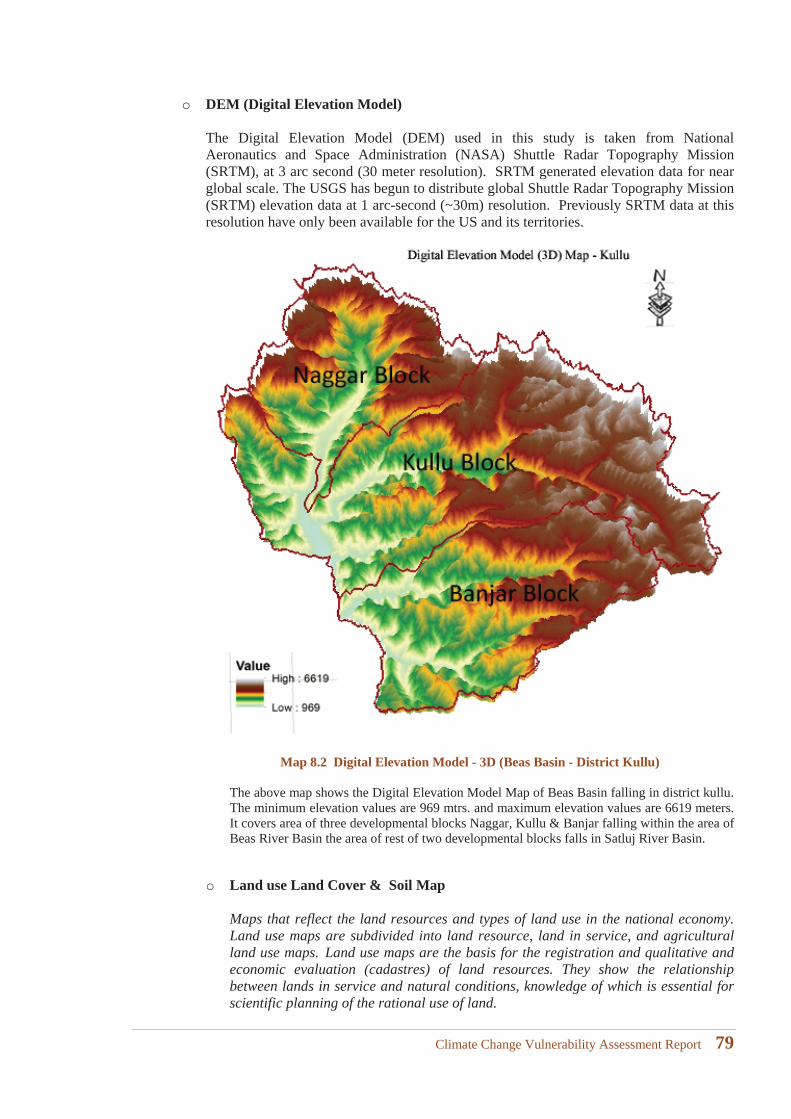
o DEM (Digital Elevation Model)
The Digital Elevation Model (DEM) used in this study is taken from National Aeronautics and Space Administration (NASA) Shuttle Radar Topography Mission (SRTM), at 3 arc second (30 meter resolution). SRTM generated elevation data for near global scale. The USGS has begun to distribute global Shuttle Radar Topography Mission (SRTM) elevation data at 1 arc-second (~30m) resolution. Previously SRTM data at this resolution have only been available for the US and its territories.
Map 8.2 Digital Elevation Model - 3D (Beas Basin - District Kullu)
The above map shows the Digital Elevation Model Map of Beas Basin falling in district kullu. The minimum elevation values are 969 mtrs. and maximum elevation values are 6619 meters. It covers area of three developmental blocks Naggar, Kullu & Banjar falling within the area of Beas River Basin the area of rest of two developmental blocks falls in Satluj River Basin.
o Land use Land Cover & Soil Map
Maps that reflect the land resources and types of land use in the national economy. Land use maps are subdivided into land resource, land in service, and agricultural land use maps. Land use maps are the basis for the registration and qualitative and economic evaluation (cadastres) of land resources. They show the relationship between lands in service and natural conditions, knowledge of which is essential for scientific planning of the rational use of land.
Climate Change Vulnerability Assessment Report 79
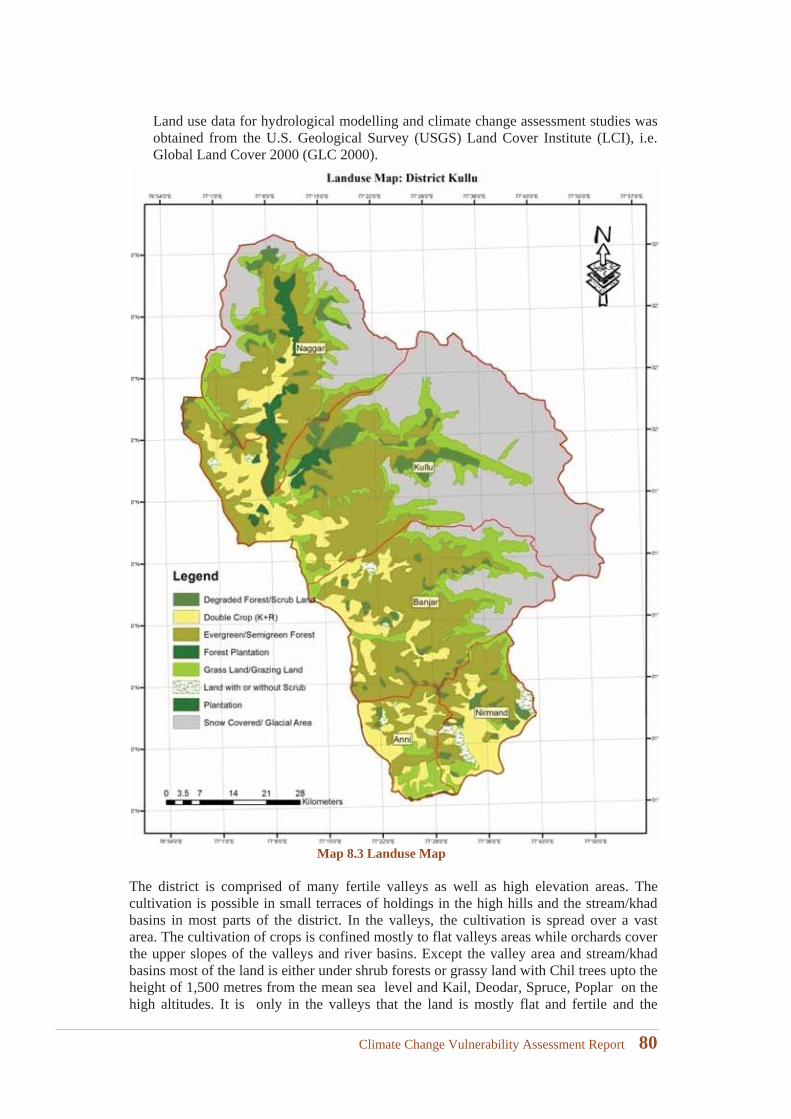
Land use data for hydrological modelling and climate change assessment studies was obtained from the U.S. Geological Survey (USGS) Land Cover Institute (LCI), i.e. Global Land Cover 2000 (GLC 2000).
Map 8.3 Landuse Map
The district is comprised of many fertile valleys as well as high elevation areas. The cultivation is possible in small terraces of holdings in the high hills and the stream/khad basins in most parts of the district. In the valleys, the cultivation is spread over a vast area. The cultivation of crops is confined mostly to flat valleys areas while orchards cover the upper slopes of the valleys and river basins. Except the valley area and stream/khad basins most of the land is either under shrub forests or grassy land with Chil trees upto the height of 1,500 metres from the mean sea level and Kail, Deodar, Spruce, Poplar on the high altitudes. It is only in the valleys that the land is mostly flat and fertile and the
Climate Change Vulnerability Assessment Report 80
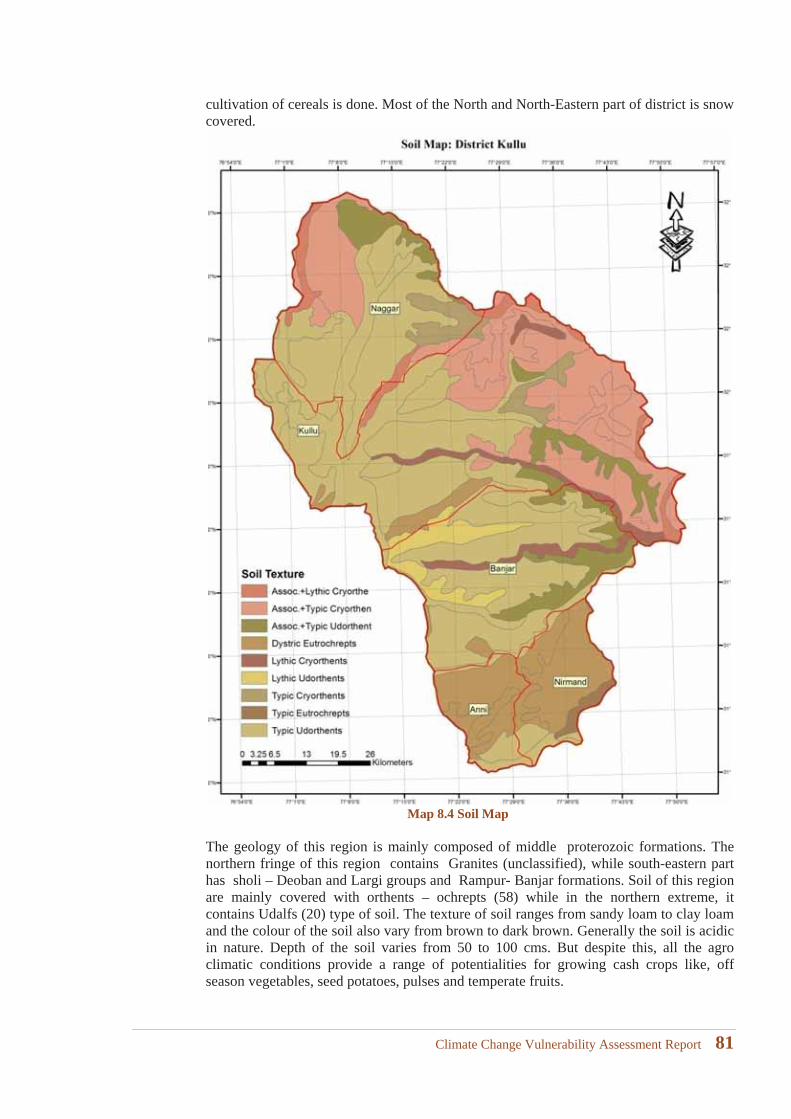
cultivation of cereals is done. Most of the North and North-Eastern part of district is snow covered.
Map 8.4 Soil Map
The geology of this region is mainly composed of middle proterozoic formations. The northern fringe of this region contains Granites (unclassified), while south-eastern part has sholi – Deoban and Largi groups and Rampur- Banjar formations. Soil of this region are mainly covered with orthents – ochrepts (58) while in the northern extreme, it contains Udalfs (20) type of soil. The texture of soil ranges from sandy loam to clay loam and the colour of the soil also vary from brown to dark brown. Generally the soil is acidic in nature. Depth of the soil varies from 50 to 100 cms. But despite this, all the agro climatic conditions provide a range of potentialities for growing cash crops like, offseason vegetables, seed potatoes, pulses and temperate fruits.
Climate Change Vulnerability Assessment Report 81
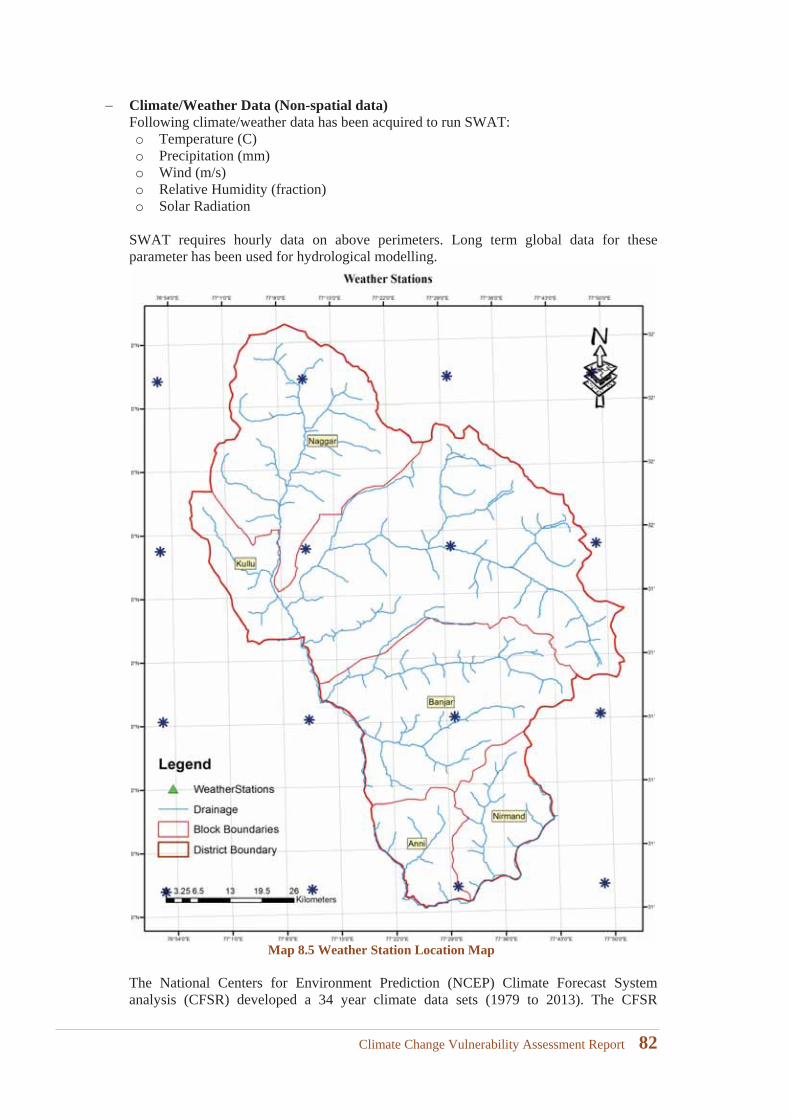
Climate/Weather Data (Non-spatial data)Following climate/weather data has been acquired to run SWAT:o Temperature (C)o Precipitation (mm)o Wind (m/s)o Relative Humidity (fraction)o Solar Radiation
SWAT requires hourly data on above perimeters. Long term global data for these parameter has been used for hydrological modelling.
Map 8.5 Weather Station Location Map
The National Centers for Environment Prediction (NCEP) Climate Forecast System analysis (CFSR) developed a 34 year climate data sets (1979 to 2013). The CFSR
Climate Change Vulnerability Assessment Report 82
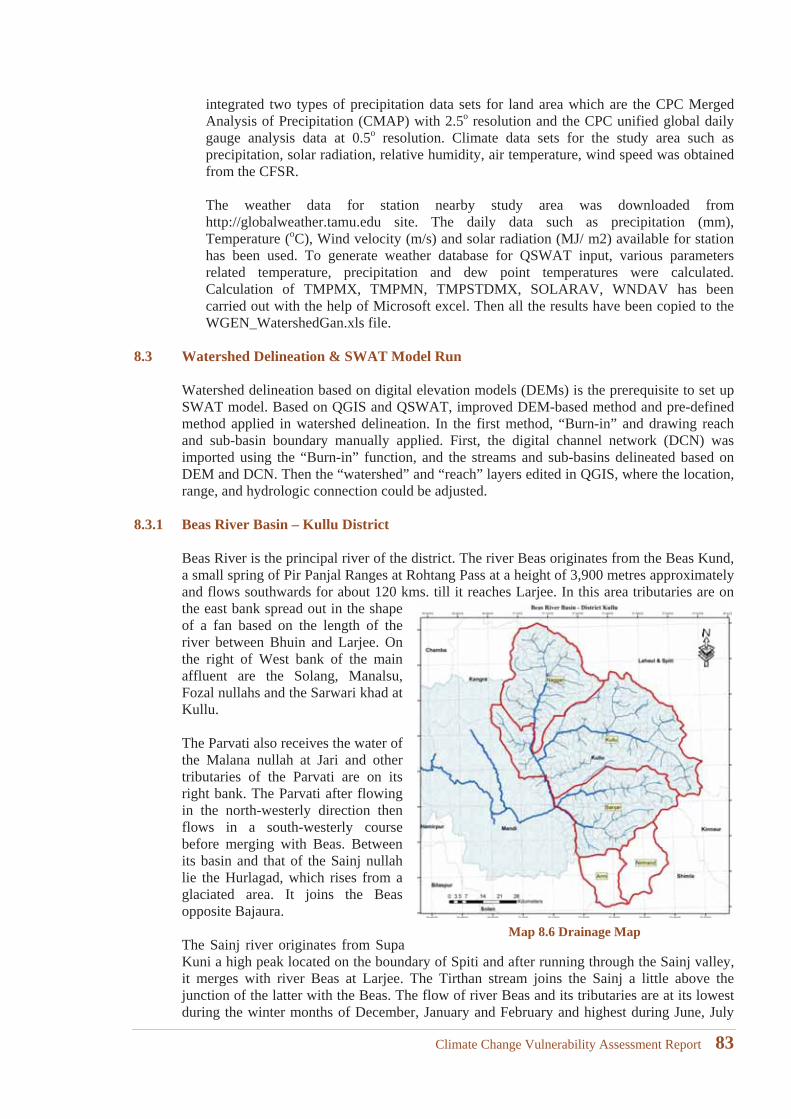
integrated two types of precipitation data sets for land area which are the CPC Merged Analysis of Precipitation (CMAP) with 2.5o resolution and the CPC unified global daily gauge analysis data at 0.5o resolution. Climate data sets for the study area such as precipitation, solar radiation, relative humidity, air temperature, wind speed was obtained from the CFSR.
The weather data for station nearby study area was downloaded from http://globalweather.tamu.edu site. The daily data such as precipitation (mm), Temperature (oC), Wind velocity (m/s) and solar radiation (MJ/ m2) available for station has been used. To generate weather database for QSWAT input, various parameters related temperature, precipitation and dew point temperatures were calculated. Calculation of TMPMX, TMPMN, TMPSTDMX, SOLARAV, WNDAV has been carried out with the help of Microsoft excel. Then all the results have been copied to the WGEN_WatershedGan.xls file.
8.3 Watershed Delineation & SWAT Model Run
Watershed delineation based on digital elevation models (DEMs) is the prerequisite to set up SWAT model. Based on QGIS and QSWAT, improved DEM-based method and pre-defined method applied in watershed delineation. In the first method, “Burn-in” and drawing reach and sub-basin boundary manually applied. First, the digital channel network (DCN) was imported using the “Burn-in” function, and the streams and sub-basins delineated based on DEM and DCN. Then the “watershed” and “reach” layers edited in QGIS, where the location, range, and hydrologic connection could be adjusted.
8.3.1 Beas River Basin – Kullu District
Beas River is the principal river of the district. The river Beas originates from the Beas Kund, a small spring of Pir Panjal Ranges at Rohtang Pass at a height of 3,900 metres approximately and flows southwards for about 120 kms. till it reaches Larjee. In this area tributaries are on the east bank spread out in the shape of a fan based on the length of the river between Bhuin and Larjee. On the right of West bank of the main affluent are the Solang, Manalsu, Fozal nullahs and the Sarwari khad at Kullu.
The Parvati also receives the water of the Malana nullah at Jari and other tributaries of the Parvati are on its right bank. The Parvati after flowing in the north-westerly direction then flows in a south-westerly course before merging with Beas. Between its basin and that of the Sainj nullah lie the Hurlagad, which rises from a glaciated area. It joins the Beas opposite Bajaura.
The Sainj river originates from Supa Kuni a high peak located on the boundary of Spiti and after running through the Sainj valley, it merges with river Beas at Larjee. The Tirthan stream joins the Sainj a little above the junction of the latter with the Beas. The flow of river Beas and its tributaries are at its lowest during the winter months of December, January and February and highest during June, July
Map 8.6 Drainage Map
Climate Change Vulnerability Assessment Report 83
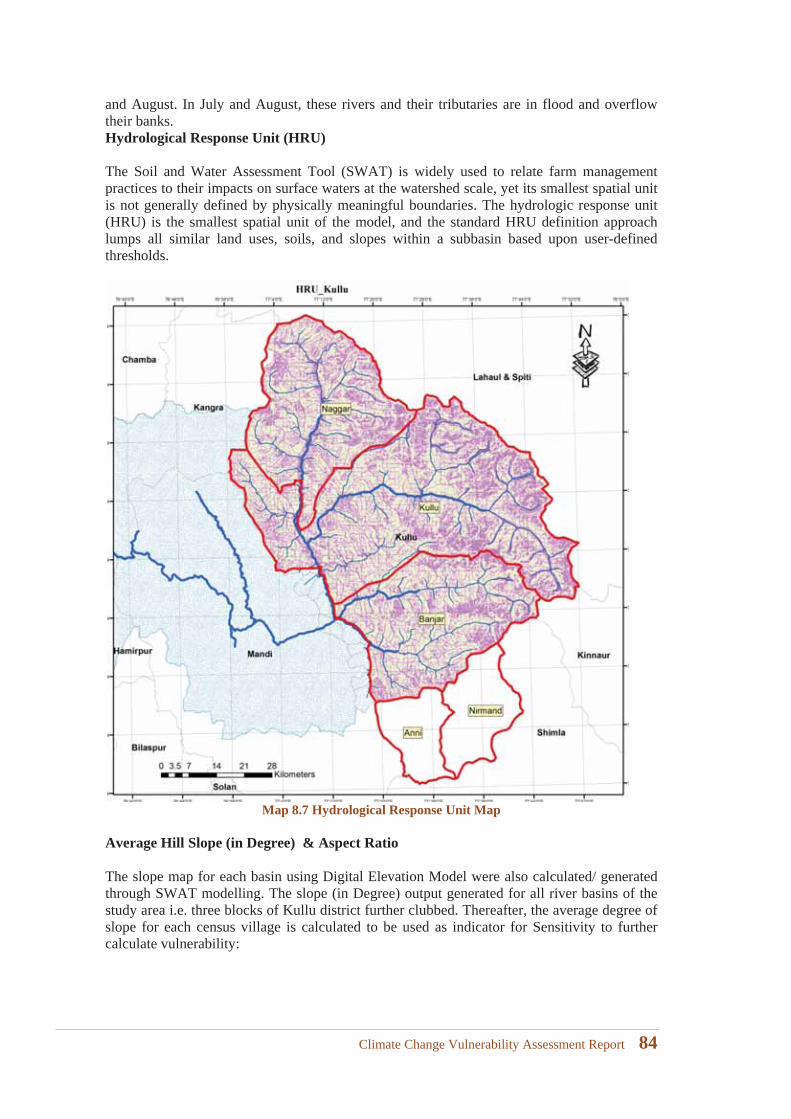
and August. In July and August, these rivers and their tributaries are in flood and overflow their banks. Hydrological Response Unit (HRU)
The Soil and Water Assessment Tool (SWAT) is widely used to relate farm management practices to their impacts on surface waters at the watershed scale, yet its smallest spatial unit is not generally defined by physically meaningful boundaries. The hydrologic response unit (HRU) is the smallest spatial unit of the model, and the standard HRU definition approach lumps all similar land uses, soils, and slopes within a subbasin based upon user-defined thresholds.
Map 8.7 Hydrological Response Unit Map
Average Hill Slope (in Degree) & Aspect Ratio
The slope map for each basin using Digital Elevation Model were also calculated/ generated through SWAT modelling. The slope (in Degree) output generated for all river basins of the study area i.e. three blocks of Kullu district further clubbed. Thereafter, the average degree of slope for each census village is calculated to be used as indicator for Sensitivity to further calculate vulnerability:
Climate Change Vulnerability Assessment Report 84
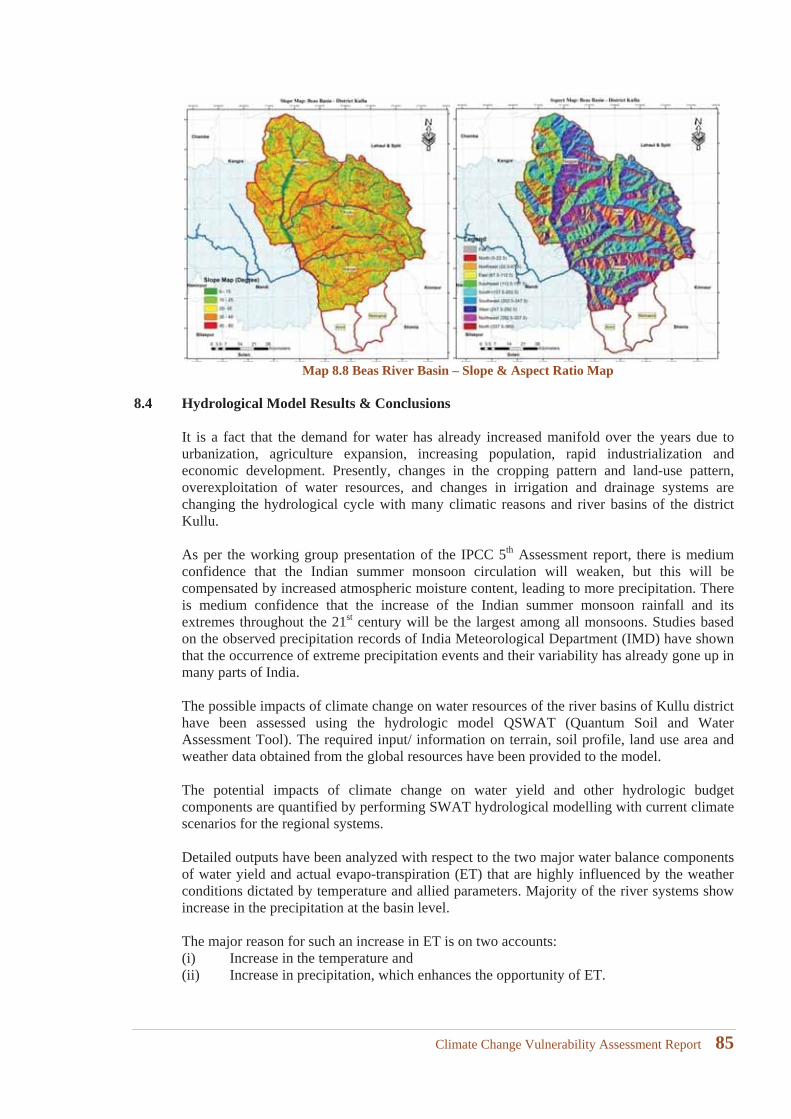
Map 8.8 Beas River Basin – Slope & Aspect Ratio Map
8.4 Hydrological Model Results & Conclusions
It is a fact that the demand for water has already increased manifold over the years due to urbanization, agriculture expansion, increasing population, rapid industrialization and economic development. Presently, changes in the cropping pattern and land-use pattern, overexploitation of water resources, and changes in irrigation and drainage systems are changing the hydrological cycle with many climatic reasons and river basins of the district Kullu.
As per the working group presentation of the IPCC 5th Assessment report, there is medium confidence that the Indian summer monsoon circulation will weaken, but this will becompensated by increased atmospheric moisture content, leading to more precipitation. There is medium confidence that the increase of the Indian summer monsoon rainfall and its extremes throughout the 21st century will be the largest among all monsoons. Studies based on the observed precipitation records of India Meteorological Department (IMD) have shown that the occurrence of extreme precipitation events and their variability has already gone up in many parts of India.
The possible impacts of climate change on water resources of the river basins of Kullu district have been assessed using the hydrologic model QSWAT (Quantum Soil and Water Assessment Tool). The required input/ information on terrain, soil profile, land use area and weather data obtained from the global resources have been provided to the model.
The potential impacts of climate change on water yield and other hydrologic budget components are quantified by performing SWAT hydrological modelling with current climate scenarios for the regional systems.
Detailed outputs have been analyzed with respect to the two major water balance components of water yield and actual evapo-transpiration (ET) that are highly influenced by the weather conditions dictated by temperature and allied parameters. Majority of the river systems show increase in the precipitation at the basin level.
The major reason for such an increase in ET is on two accounts:(i) Increase in the temperature and(ii) Increase in precipitation, which enhances the opportunity of ET.
Climate Change Vulnerability Assessment Report 85

Evapo-transpiration is a very important component of water balance with respect to the biomass and agricultural activities. The potential evapo-transpiration is driven by the weather conditions, but the actual evapo-transpiration is also dependent on the moisture conditions prevalent under the weather conditions (assuming that the land-use and soil characteristics are not changing). The outcome of actual evapo-transpiration has been obtained after the continuous simulation on daily basis for all the sub-basins of various river systems by using QSWAT model.
The implications of changes in precipitation have also been quantified in the form of resulting water yields through the SWAT modelling exercise. The response of water yield is dependent on a combination of factors such as terrain, land use, soil type, and weather conditions. It may be observed that in the case of river systems of district Kullu, there is an improvement in the average water yield this is because of melting of snow glaciers due to increase in average temperature.
After delineating the basin-wise watershed map using QSWAT taking Digital Elevation Model (DEM) as input data, the additional required inputs i.e. soil map, land use map and weather data for the period of 34 years (1979-2013) is provided to SWAT model. After running the model the watershed wise maps & results/output on following parameters are generated:
Output generated on each monitoring point of the watershed drainage
S.NO. VARIABLE DEFINITION1 RCH Reach number.2 GIS GIS number reprinted from watershed configuration (.fig) file.3 MON Daily time step: the julian date, Monthly time step: the month (1-12), Annual
time step: 4-digit year, Average annual summary lines: number of years averaged together
4 AREA Area drained by reach (km2).5 FLOW_IN Average daily streamflow into reach during time step (m3/s).6 FLOW_OUT Average daily streamflow out of reach during time step (m3/s).7 EVAP Average daily rate of water loss from reach by evaporation during time step
(m3/s).8 TLOSS Average daily rate of water loss from reach by transmission through the
streambed during time step (m3/s).9 SED_IN Sediment transported with water into reach during time step (metric tons).10 SED_OUT Sediment transported with water out of reach during time step (metric tons).11 SEDCONC Concentration of sediment in reach during time step (mg/L).12 ORGN_IN Organic nitrogen transported with water into reach during time step (kg N).13 ORGN_OUT Organic nitrogen transported with water out of reach during time step (kg N).14 ORGP_IN Organic phosphorus transported with water into reach during time step (kg P).15 ORGP_OUT Organic phosphorus transported with water out of reach during time step (kg P).16 NO3_IN Nitrate transported with water into reach during time step (kg N).17 NO3_OUT Nitrate transported with water out of reach during time step (kg N).18 NH4_IN Ammonium transported with water into reach during time step (kg N).19 NH4_OUT Ammonium transported with water out of reach during time step (kg N).20 NO2_IN Nitrite transported with water into reach during time step (kg N).21 NO2_OUT Nitrite transported with water out of reach during time step (kg N).22 MINP_IN Mineral phosphorus transported with water into reach during time step (kg P).23 MINP_OUT Mineral phosphorus transported with water out of reach during time step (kg P).24 ALGAE_IN Algal biomass transported with water into reach during time step (kg chl-a).25 ALGAE_OUT Algal biomass transported with water out of reach during time step (kg chl-a).26 CBOD_IN Carbonaceous biochemical oxygen demand of material transported into reach
during time step (kg O2).27 CBOD_OUT Carbonaceous biochemical oxygen demand of material transported out of reach
during time step (kg O2).28 DISOX_IN Amount of dissolved oxygen transported into reach during time step (kg O2).29 DISOX_OUT Amount of dissolved oxygen transported out of reach during time step (kg O2).
Climate Change Vulnerability Assessment Report 86
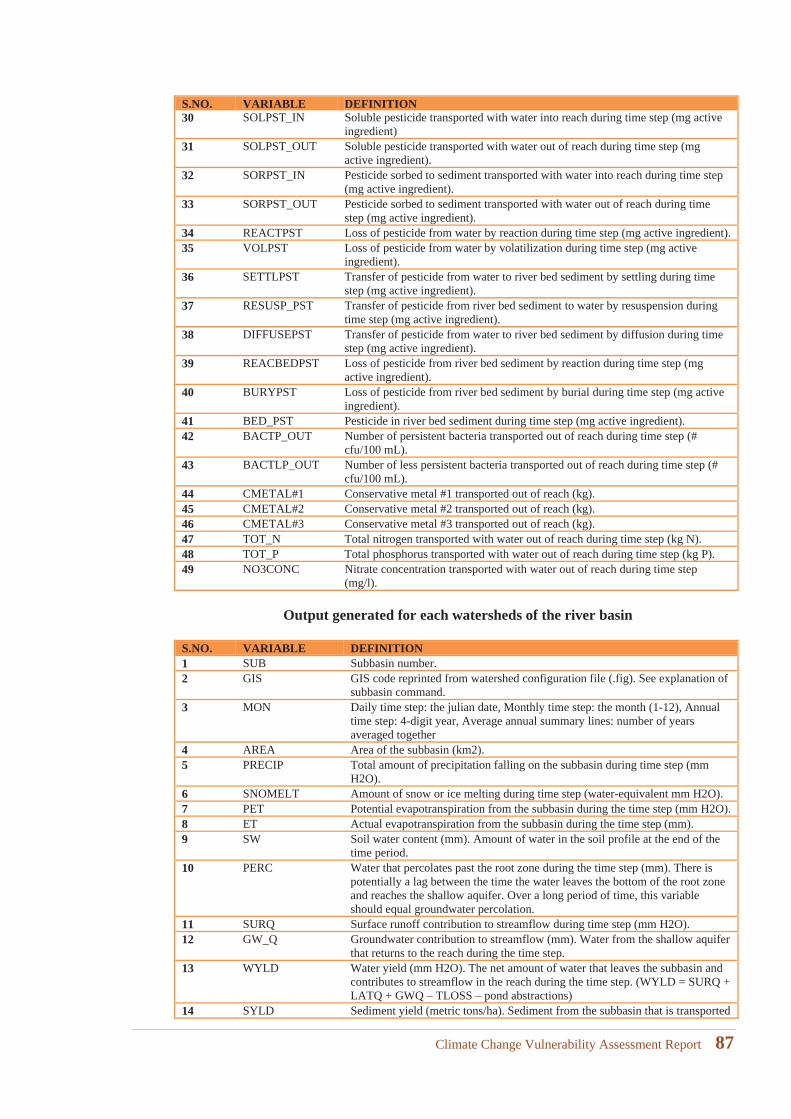
S.NO. VARIABLE DEFINITION30 SOLPST_IN Soluble pesticide transported with water into reach during time step (mg active
ingredient)31 SOLPST_OUT Soluble pesticide transported with water out of reach during time step (mg
active ingredient).32 SORPST_IN Pesticide sorbed to sediment transported with water into reach during time step
(mg active ingredient).33 SORPST_OUT Pesticide sorbed to sediment transported with water out of reach during time
step (mg active ingredient).34 REACTPST Loss of pesticide from water by reaction during time step (mg active ingredient).35 VOLPST Loss of pesticide from water by volatilization during time step (mg active
ingredient).36 SETTLPST Transfer of pesticide from water to river bed sediment by settling during time
step (mg active ingredient).37 RESUSP_PST Transfer of pesticide from river bed sediment to water by resuspension during
time step (mg active ingredient).38 DIFFUSEPST Transfer of pesticide from water to river bed sediment by diffusion during time
step (mg active ingredient).39 REACBEDPST Loss of pesticide from river bed sediment by reaction during time step (mg
active ingredient).40 BURYPST Loss of pesticide from river bed sediment by burial during time step (mg active
ingredient).41 BED_PST Pesticide in river bed sediment during time step (mg active ingredient).42 BACTP_OUT Number of persistent bacteria transported out of reach during time step (#
cfu/100 mL).43 BACTLP_OUT Number of less persistent bacteria transported out of reach during time step (#
cfu/100 mL).44 CMETAL#1 Conservative metal #1 transported out of reach (kg).45 CMETAL#2 Conservative metal #2 transported out of reach (kg).46 CMETAL#3 Conservative metal #3 transported out of reach (kg).47 TOT_N Total nitrogen transported with water out of reach during time step (kg N).48 TOT_P Total phosphorus transported with water out of reach during time step (kg P).49 NO3CONC Nitrate concentration transported with water out of reach during time step
(mg/l).
Output generated for each watersheds of the river basin
S.NO. VARIABLE DEFINITION1 SUB Subbasin number.2 GIS GIS code reprinted from watershed configuration file (.fig). See explanation of
subbasin command.3 MON Daily time step: the julian date, Monthly time step: the month (1-12), Annual
time step: 4-digit year, Average annual summary lines: number of years averaged together
4 AREA Area of the subbasin (km2).5 PRECIP Total amount of precipitation falling on the subbasin during time step (mm
H2O).6 SNOMELT Amount of snow or ice melting during time step (water-equivalent mm H2O).7 PET Potential evapotranspiration from the subbasin during the time step (mm H2O).8 ET Actual evapotranspiration from the subbasin during the time step (mm).9 SW Soil water content (mm). Amount of water in the soil profile at the end of the
time period.10 PERC Water that percolates past the root zone during the time step (mm). There is
potentially a lag between the time the water leaves the bottom of the root zone and reaches the shallow aquifer. Over a long period of time, this variable should equal groundwater percolation.
11 SURQ Surface runoff contribution to streamflow during time step (mm H2O).12 GW_Q Groundwater contribution to streamflow (mm). Water from the shallow aquifer
that returns to the reach during the time step.13 WYLD Water yield (mm H2O). The net amount of water that leaves the subbasin and
contributes to streamflow in the reach during the time step. (WYLD = SURQ + LATQ + GWQ – TLOSS – pond abstractions)
14 SYLD Sediment yield (metric tons/ha). Sediment from the subbasin that is transported
Climate Change Vulnerability Assessment Report 87
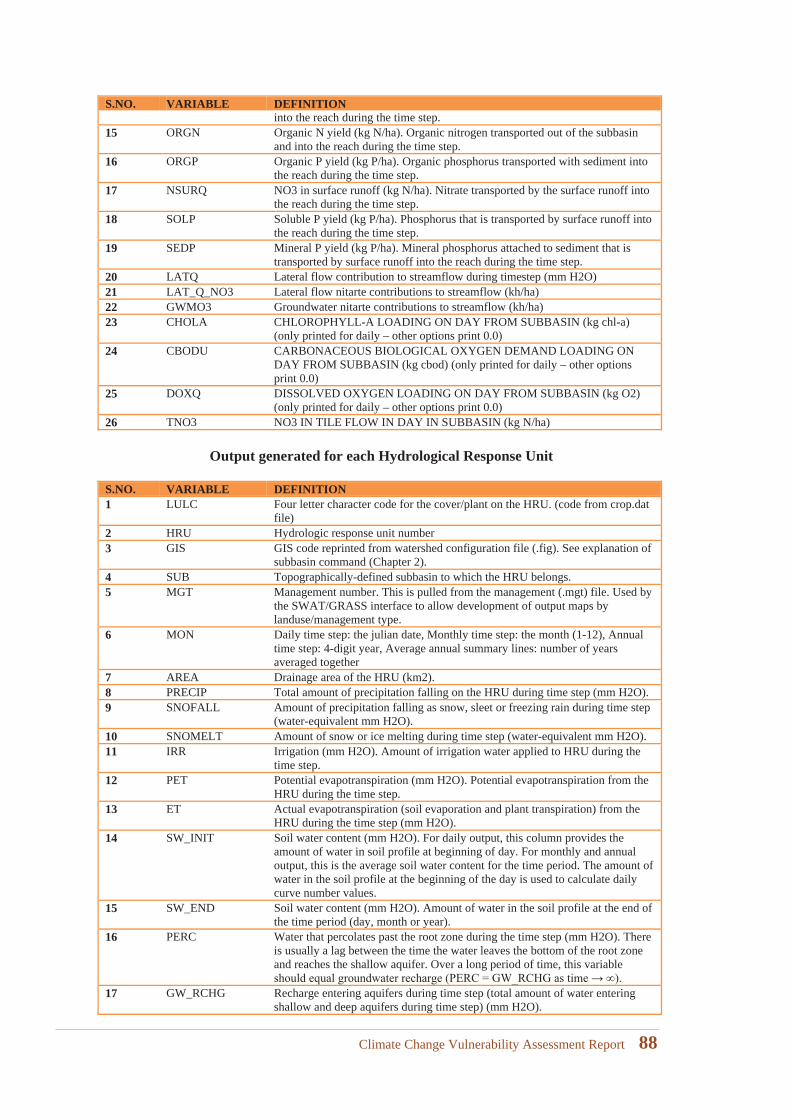
S.NO. VARIABLE DEFINITIONinto the reach during the time step.
15 ORGN Organic N yield (kg N/ha). Organic nitrogen transported out of the subbasin and into the reach during the time step.
16 ORGP Organic P yield (kg P/ha). Organic phosphorus transported with sediment into the reach during the time step.
17 NSURQ NO3 in surface runoff (kg N/ha). Nitrate transported by the surface runoff into the reach during the time step.
18 SOLP Soluble P yield (kg P/ha). Phosphorus that is transported by surface runoff into the reach during the time step.
19 SEDP Mineral P yield (kg P/ha). Mineral phosphorus attached to sediment that is transported by surface runoff into the reach during the time step.
20 LATQ Lateral flow contribution to streamflow during timestep (mm H2O)21 LAT_Q_NO3 Lateral flow nitarte contributions to streamflow (kh/ha)22 GWMO3 Groundwater nitarte contributions to streamflow (kh/ha)23 CHOLA CHLOROPHYLL-A LOADING ON DAY FROM SUBBASIN (kg chl-a)
(only printed for daily – other options print 0.0)24 CBODU CARBONACEOUS BIOLOGICAL OXYGEN DEMAND LOADING ON
DAY FROM SUBBASIN (kg cbod) (only printed for daily – other options print 0.0)
25 DOXQ DISSOLVED OXYGEN LOADING ON DAY FROM SUBBASIN (kg O2) (only printed for daily – other options print 0.0)
26 TNO3 NO3 IN TILE FLOW IN DAY IN SUBBASIN (kg N/ha)
Output generated for each Hydrological Response Unit
S.NO. VARIABLE DEFINITION1 LULC Four letter character code for the cover/plant on the HRU. (code from crop.dat
file)2 HRU Hydrologic response unit number3 GIS GIS code reprinted from watershed configuration file (.fig). See explanation of
subbasin command (Chapter 2).4 SUB Topographically-defined subbasin to which the HRU belongs.5 MGT Management number. This is pulled from the management (.mgt) file. Used by
the SWAT/GRASS interface to allow development of output maps by landuse/management type.
6 MON Daily time step: the julian date, Monthly time step: the month (1-12), Annual time step: 4-digit year, Average annual summary lines: number of years averaged together
7 AREA Drainage area of the HRU (km2).8 PRECIP Total amount of precipitation falling on the HRU during time step (mm H2O).9 SNOFALL Amount of precipitation falling as snow, sleet or freezing rain during time step
(water-equivalent mm H2O).10 SNOMELT Amount of snow or ice melting during time step (water-equivalent mm H2O).11 IRR Irrigation (mm H2O). Amount of irrigation water applied to HRU during the
time step.12 PET Potential evapotranspiration (mm H2O). Potential evapotranspiration from the
HRU during the time step.13 ET Actual evapotranspiration (soil evaporation and plant transpiration) from the
HRU during the time step (mm H2O).14 SW_INIT Soil water content (mm H2O). For daily output, this column provides the
amount of water in soil profile at beginning of day. For monthly and annual output, this is the average soil water content for the time period. The amount of water in the soil profile at the beginning of the day is used to calculate daily curve number values.
15 SW_END Soil water content (mm H2O). Amount of water in the soil profile at the end of the time period (day, month or year).
16 PERC Water that percolates past the root zone during the time step (mm H2O). There is usually a lag between the time the water leaves the bottom of the root zone and reaches the shallow aquifer. Over a long period of time, this variable
17 GW_RCHG Recharge entering aquifers during time step (total amount of water entering shallow and deep aquifers during time step) (mm H2O).
Climate Change Vulnerability Assessment Report 88
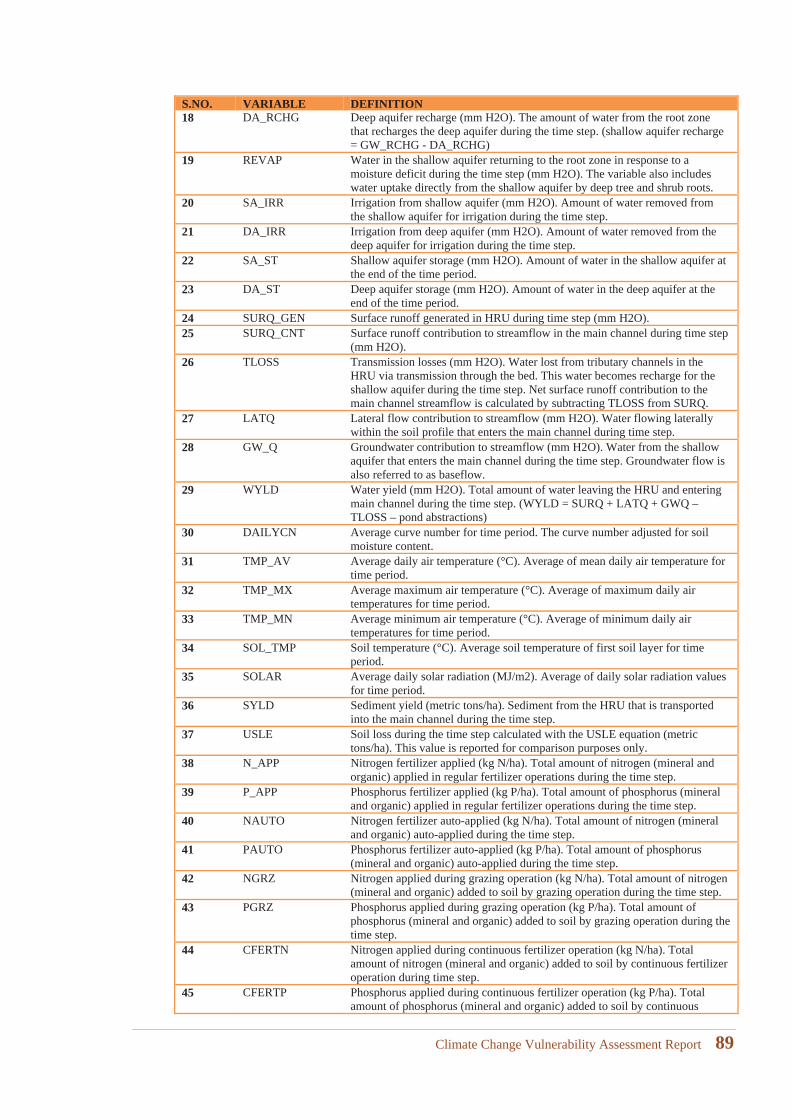
S.NO. VARIABLE DEFINITION18 DA_RCHG Deep aquifer recharge (mm H2O). The amount of water from the root zone
that recharges the deep aquifer during the time step. (shallow aquifer recharge = GW_RCHG - DA_RCHG)
19 REVAP Water in the shallow aquifer returning to the root zone in response to a moisture deficit during the time step (mm H2O). The variable also includes water uptake directly from the shallow aquifer by deep tree and shrub roots.
20 SA_IRR Irrigation from shallow aquifer (mm H2O). Amount of water removed from the shallow aquifer for irrigation during the time step.
21 DA_IRR Irrigation from deep aquifer (mm H2O). Amount of water removed from the deep aquifer for irrigation during the time step.
22 SA_ST Shallow aquifer storage (mm H2O). Amount of water in the shallow aquifer at the end of the time period.
23 DA_ST Deep aquifer storage (mm H2O). Amount of water in the deep aquifer at the end of the time period.
24 SURQ_GEN Surface runoff generated in HRU during time step (mm H2O).25 SURQ_CNT Surface runoff contribution to streamflow in the main channel during time step
(mm H2O).26 TLOSS Transmission losses (mm H2O). Water lost from tributary channels in the
HRU via transmission through the bed. This water becomes recharge for the shallow aquifer during the time step. Net surface runoff contribution to the main channel streamflow is calculated by subtracting TLOSS from SURQ.
27 LATQ Lateral flow contribution to streamflow (mm H2O). Water flowing laterally within the soil profile that enters the main channel during time step.
28 GW_Q Groundwater contribution to streamflow (mm H2O). Water from the shallow aquifer that enters the main channel during the time step. Groundwater flow is also referred to as baseflow.
29 WYLD Water yield (mm H2O). Total amount of water leaving the HRU and entering main channel during the time step. (WYLD = SURQ + LATQ + GWQ –TLOSS – pond abstractions)
30 DAILYCN Average curve number for time period. The curve number adjusted for soil moisture content.
31 TMP_AV Average daily air temperature (°C). Average of mean daily air temperature for time period.
32 TMP_MX Average maximum air temperature (°C). Average of maximum daily air temperatures for time period.
33 TMP_MN Average minimum air temperature (°C). Average of minimum daily air temperatures for time period.
34 SOL_TMP Soil temperature (°C). Average soil temperature of first soil layer for time period.
35 SOLAR Average daily solar radiation (MJ/m2). Average of daily solar radiation values for time period.
36 SYLD Sediment yield (metric tons/ha). Sediment from the HRU that is transported into the main channel during the time step.
37 USLE Soil loss during the time step calculated with the USLE equation (metric tons/ha). This value is reported for comparison purposes only.
38 N_APP Nitrogen fertilizer applied (kg N/ha). Total amount of nitrogen (mineral and organic) applied in regular fertilizer operations during the time step.
39 P_APP Phosphorus fertilizer applied (kg P/ha). Total amount of phosphorus (mineral and organic) applied in regular fertilizer operations during the time step.
40 NAUTO Nitrogen fertilizer auto-applied (kg N/ha). Total amount of nitrogen (mineral and organic) auto-applied during the time step.
41 PAUTO Phosphorus fertilizer auto-applied (kg P/ha). Total amount of phosphorus (mineral and organic) auto-applied during the time step.
42 NGRZ Nitrogen applied during grazing operation (kg N/ha). Total amount of nitrogen (mineral and organic) added to soil by grazing operation during the time step.
43 PGRZ Phosphorus applied during grazing operation (kg P/ha). Total amount of phosphorus (mineral and organic) added to soil by grazing operation during the time step.
44 CFERTN Nitrogen applied during continuous fertilizer operation (kg N/ha). Total amount of nitrogen (mineral and organic) added to soil by continuous fertilizer operation during time step.
45 CFERTP Phosphorus applied during continuous fertilizer operation (kg P/ha). Totalamount of phosphorus (mineral and organic) added to soil by continuous
Climate Change Vulnerability Assessment Report 89
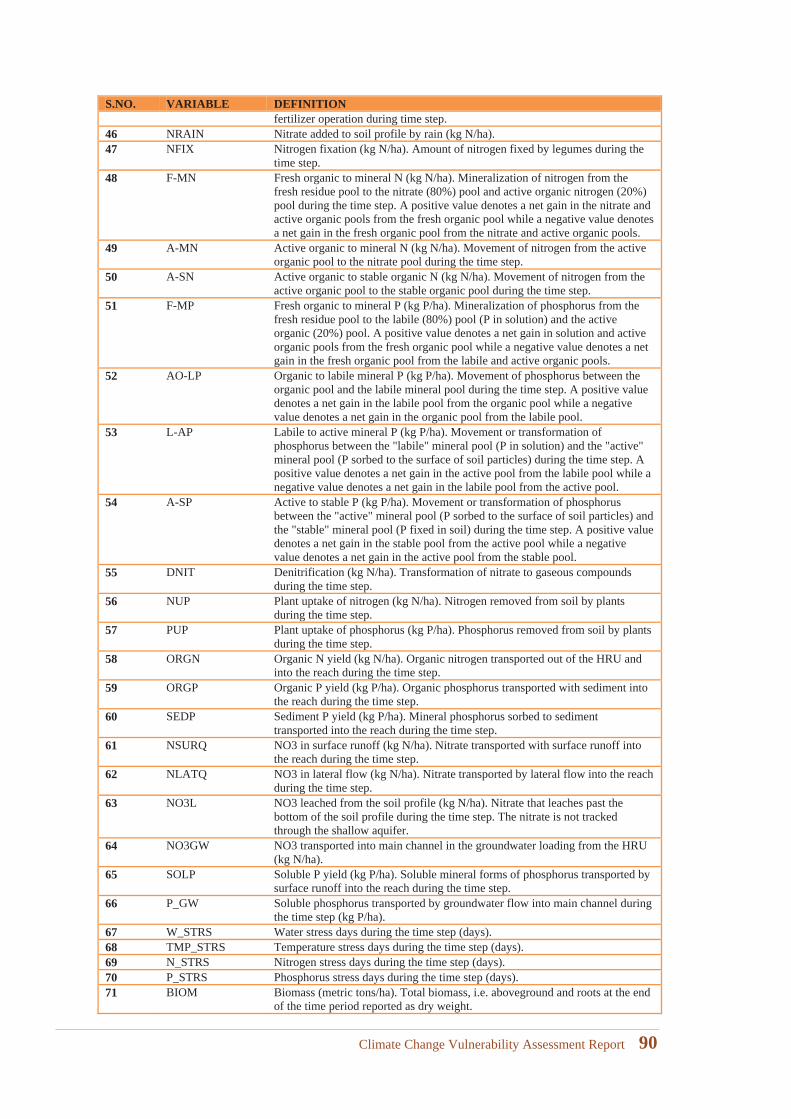
S.NO. VARIABLE DEFINITIONfertilizer operation during time step.
46 NRAIN Nitrate added to soil profile by rain (kg N/ha).47 NFIX Nitrogen fixation (kg N/ha). Amount of nitrogen fixed by legumes during the
time step.48 F-MN Fresh organic to mineral N (kg N/ha). Mineralization of nitrogen from the
fresh residue pool to the nitrate (80%) pool and active organic nitrogen (20%) pool during the time step. A positive value denotes a net gain in the nitrate and active organic pools from the fresh organic pool while a negative value denotes a net gain in the fresh organic pool from the nitrate and active organic pools.
49 A-MN Active organic to mineral N (kg N/ha). Movement of nitrogen from the active organic pool to the nitrate pool during the time step.
50 A-SN Active organic to stable organic N (kg N/ha). Movement of nitrogen from the active organic pool to the stable organic pool during the time step.
51 F-MP Fresh organic to mineral P (kg P/ha). Mineralization of phosphorus from the fresh residue pool to the labile (80%) pool (P in solution) and the active organic (20%) pool. A positive value denotes a net gain in solution and active organic pools from the fresh organic pool while a negative value denotes a net gain in the fresh organic pool from the labile and active organic pools.
52 AO-LP Organic to labile mineral P (kg P/ha). Movement of phosphorus between the organic pool and the labile mineral pool during the time step. A positive value denotes a net gain in the labile pool from the organic pool while a negative value denotes a net gain in the organic pool from the labile pool.
53 L-AP Labile to active mineral P (kg P/ha). Movement or transformation of phosphorus between the "labile" mineral pool (P in solution) and the "active" mineral pool (P sorbed to the surface of soil particles) during the time step. A positive value denotes a net gain in the active pool from the labile pool while a negative value denotes a net gain in the labile pool from the active pool.
54 A-SP Active to stable P (kg P/ha). Movement or transformation of phosphorus between the "active" mineral pool (P sorbed to the surface of soil particles) and the "stable" mineral pool (P fixed in soil) during the time step. A positive value denotes a net gain in the stable pool from the active pool while a negative value denotes a net gain in the active pool from the stable pool.
55 DNIT Denitrification (kg N/ha). Transformation of nitrate to gaseous compounds during the time step.
56 NUP Plant uptake of nitrogen (kg N/ha). Nitrogen removed from soil by plants during the time step.
57 PUP Plant uptake of phosphorus (kg P/ha). Phosphorus removed from soil by plants during the time step.
58 ORGN Organic N yield (kg N/ha). Organic nitrogen transported out of the HRU and into the reach during the time step.
59 ORGP Organic P yield (kg P/ha). Organic phosphorus transported with sediment into the reach during the time step.
60 SEDP Sediment P yield (kg P/ha). Mineral phosphorus sorbed to sediment transported into the reach during the time step.
61 NSURQ NO3 in surface runoff (kg N/ha). Nitrate transported with surface runoff into the reach during the time step.
62 NLATQ NO3 in lateral flow (kg N/ha). Nitrate transported by lateral flow into the reach during the time step.
63 NO3L NO3 leached from the soil profile (kg N/ha). Nitrate that leaches past the bottom of the soil profile during the time step. The nitrate is not tracked through the shallow aquifer.
64 NO3GW NO3 transported into main channel in the groundwater loading from the HRU (kg N/ha).
65 SOLP Soluble P yield (kg P/ha). Soluble mineral forms of phosphorus transported by surface runoff into the reach during the time step.
66 P_GW Soluble phosphorus transported by groundwater flow into main channel during the time step (kg P/ha).
67 W_STRS Water stress days during the time step (days).68 TMP_STRS Temperature stress days during the time step (days).69 N_STRS Nitrogen stress days during the time step (days).70 P_STRS Phosphorus stress days during the time step (days).71 BIOM Biomass (metric tons/ha). Total biomass, i.e. aboveground and roots at the end
of the time period reported as dry weight.
Climate Change Vulnerability Assessment Report 90
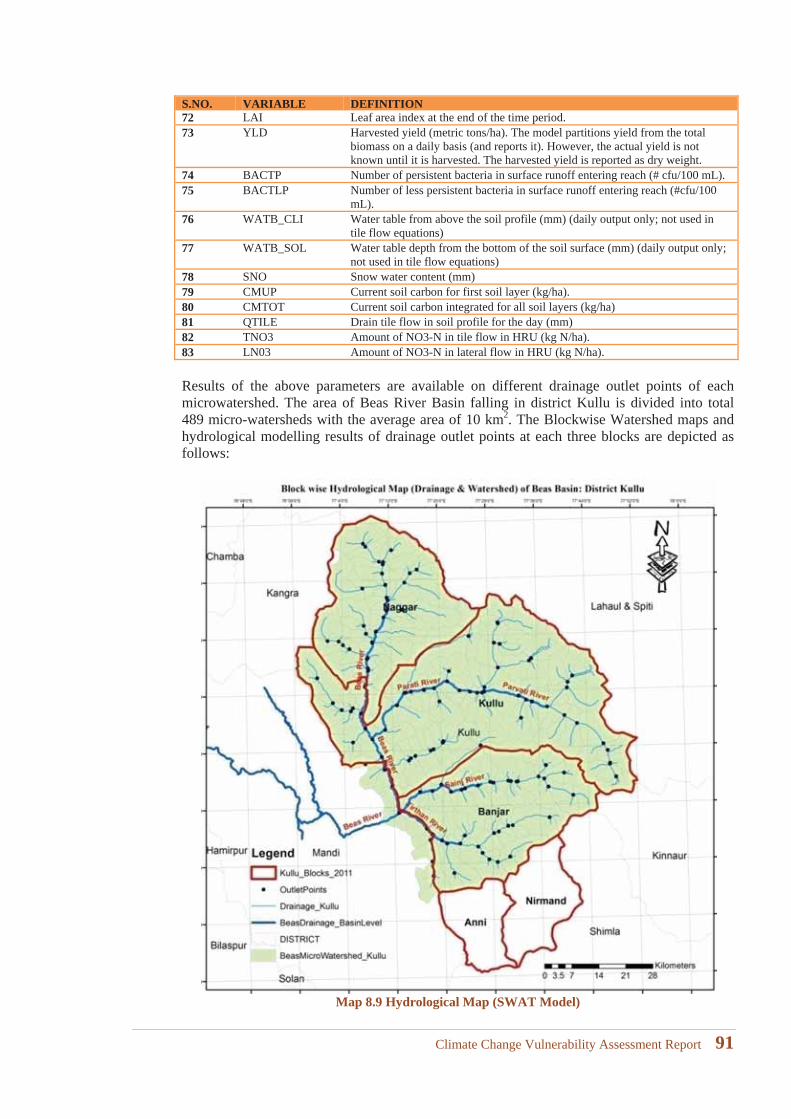
S.NO. VARIABLE DEFINITION72 LAI Leaf area index at the end of the time period.73 YLD Harvested yield (metric tons/ha). The model partitions yield from the total
biomass on a daily basis (and reports it). However, the actual yield is not known until it is harvested. The harvested yield is reported as dry weight.
74 BACTP Number of persistent bacteria in surface runoff entering reach (# cfu/100 mL).75 BACTLP Number of less persistent bacteria in surface runoff entering reach (#cfu/100
mL).76 WATB_CLI Water table from above the soil profile (mm) (daily output only; not used in
tile flow equations)77 WATB_SOL Water table depth from the bottom of the soil surface (mm) (daily output only;
not used in tile flow equations)78 SNO Snow water content (mm)79 CMUP Current soil carbon for first soil layer (kg/ha).80 CMTOT Current soil carbon integrated for all soil layers (kg/ha)81 QTILE Drain tile flow in soil profile for the day (mm)82 TNO3 Amount of NO3-N in tile flow in HRU (kg N/ha).83 LN03 Amount of NO3-N in lateral flow in HRU (kg N/ha).
Results of the above parameters are available on different drainage outlet points of each microwatershed. The area of Beas River Basin falling in district Kullu is divided into total 489 micro-watersheds with the average area of 10 km2. The Blockwise Watershed maps and hydrological modelling results of drainage outlet points at each three blocks are depicted as follows:
Map 8.9 Hydrological Map (SWAT Model)
Climate Change Vulnerability Assessment Report 91
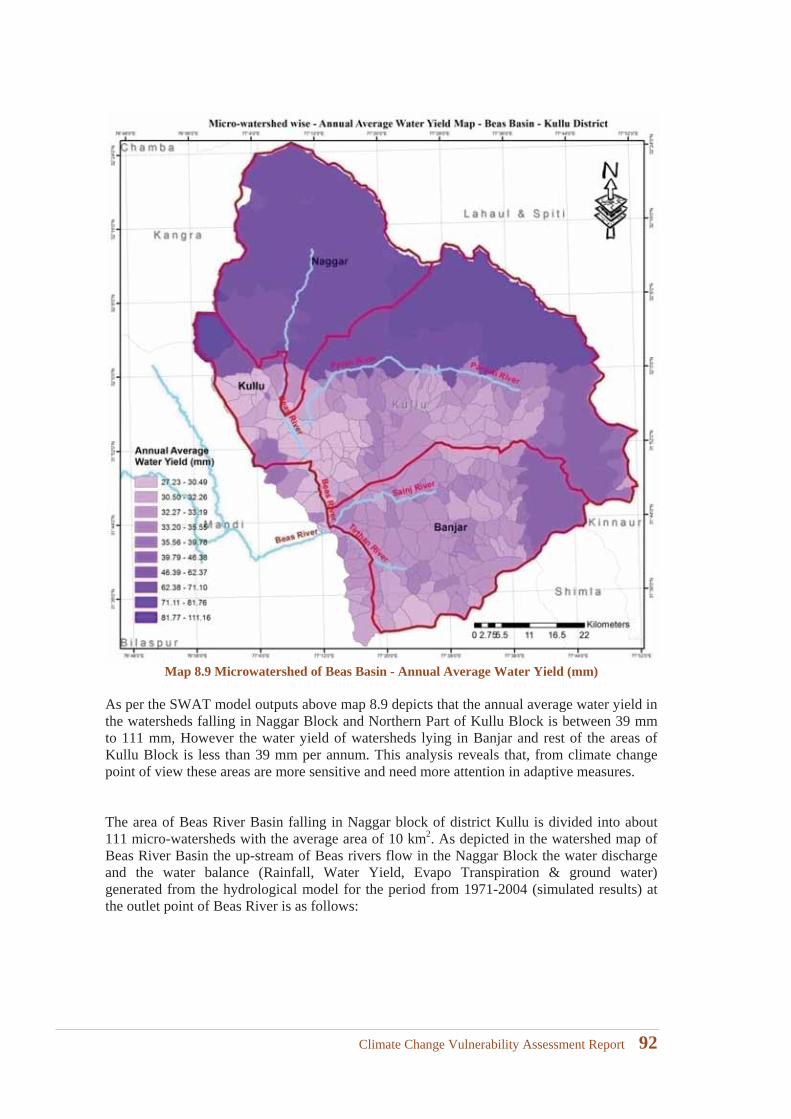
Map 8.9 Microwatershed of Beas Basin - Annual Average Water Yield (mm)
As per the SWAT model outputs above map 8.9 depicts that the annual average water yield in the watersheds falling in Naggar Block and Northern Part of Kullu Block is between 39 mm to 111 mm, However the water yield of watersheds lying in Banjar and rest of the areas of Kullu Block is less than 39 mm per annum. This analysis reveals that, from climate change point of view these areas are more sensitive and need more attention in adaptive measures.
The area of Beas River Basin falling in Naggar block of district Kullu is divided into about111 micro-watersheds with the average area of 10 km2. As depicted in the watershed map of Beas River Basin the up-stream of Beas rivers flow in the Naggar Block the water discharge and the water balance (Rainfall, Water Yield, Evapo Transpiration & ground water) generated from the hydrological model for the period from 1971-2004 (simulated results) at the outlet point of Beas River is as follows:
Climate Change Vulnerability Assessment Report 92
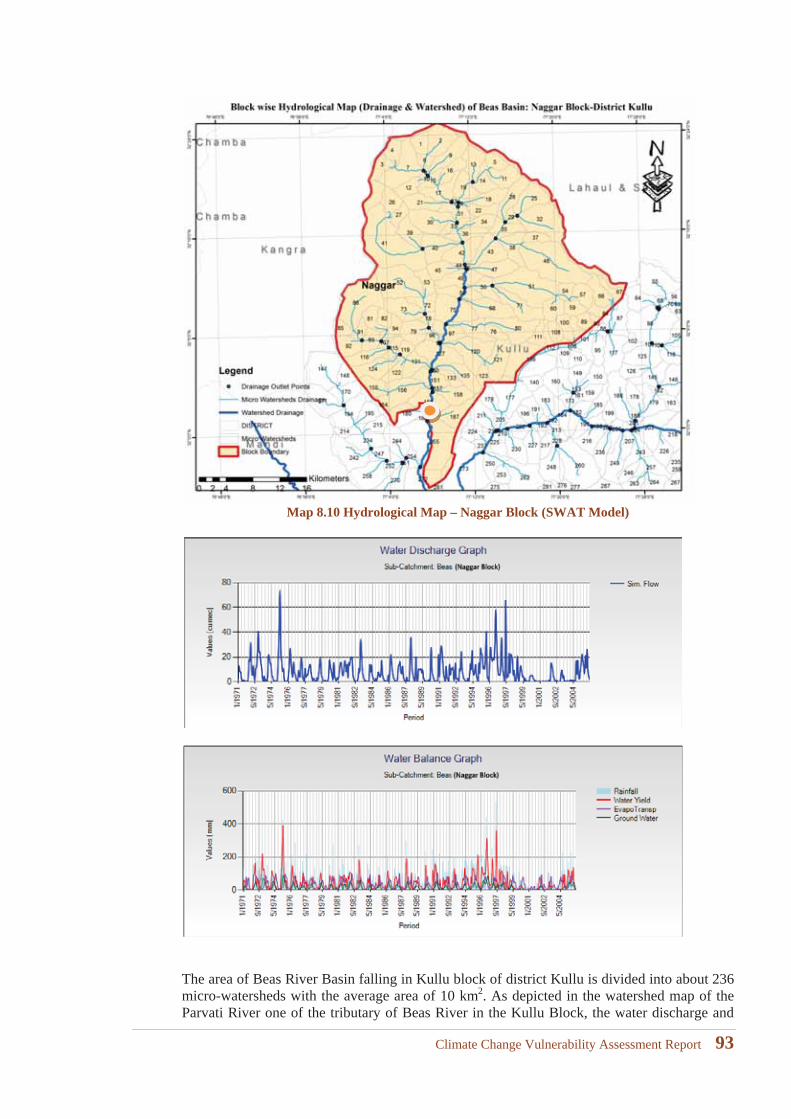
Map 8.10 Hydrological Map – Naggar Block (SWAT Model)
The area of Beas River Basin falling in Kullu block of district Kullu is divided into about 236micro-watersheds with the average area of 10 km2. As depicted in the watershed map of the Parvati River one of the tributary of Beas River in the Kullu Block, the water discharge and
Climate Change Vulnerability Assessment Report 93
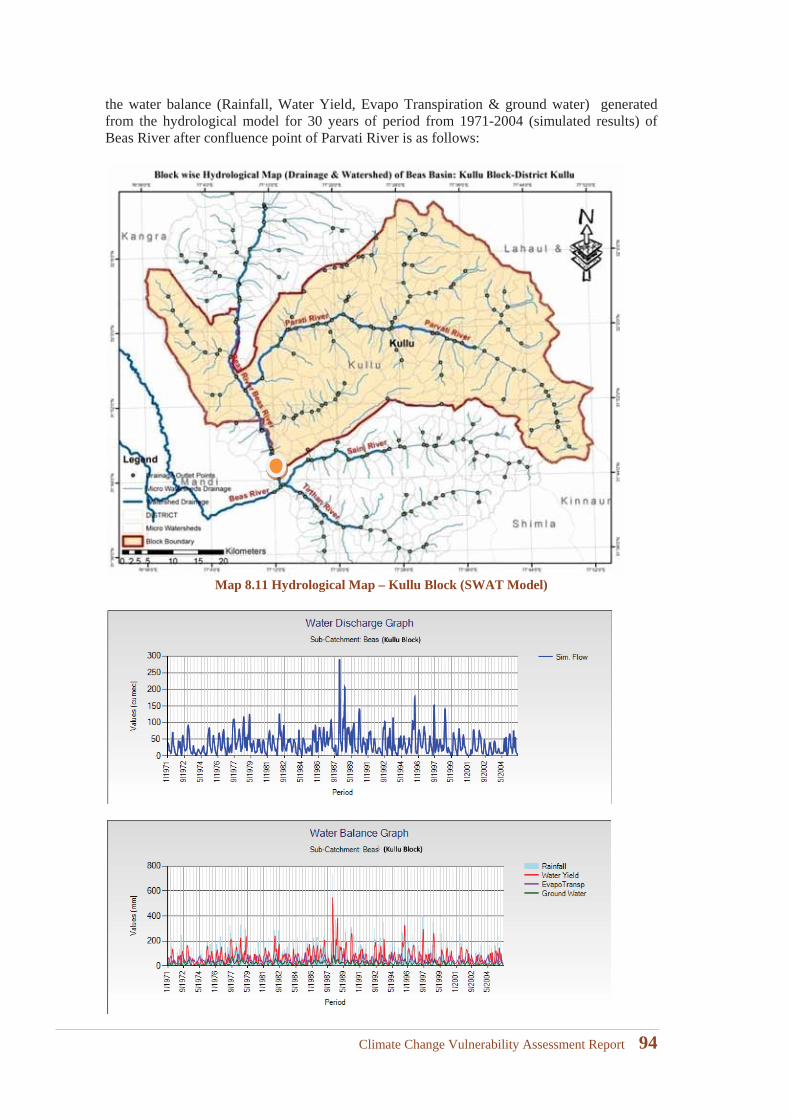
the water balance (Rainfall, Water Yield, Evapo Transpiration & ground water) generated from the hydrological model for 30 years of period from 1971-2004 (simulated results) of Beas River after confluence point of Parvati River is as follows:
Map 8.11 Hydrological Map – Kullu Block (SWAT Model)
Climate Change Vulnerability Assessment Report 94
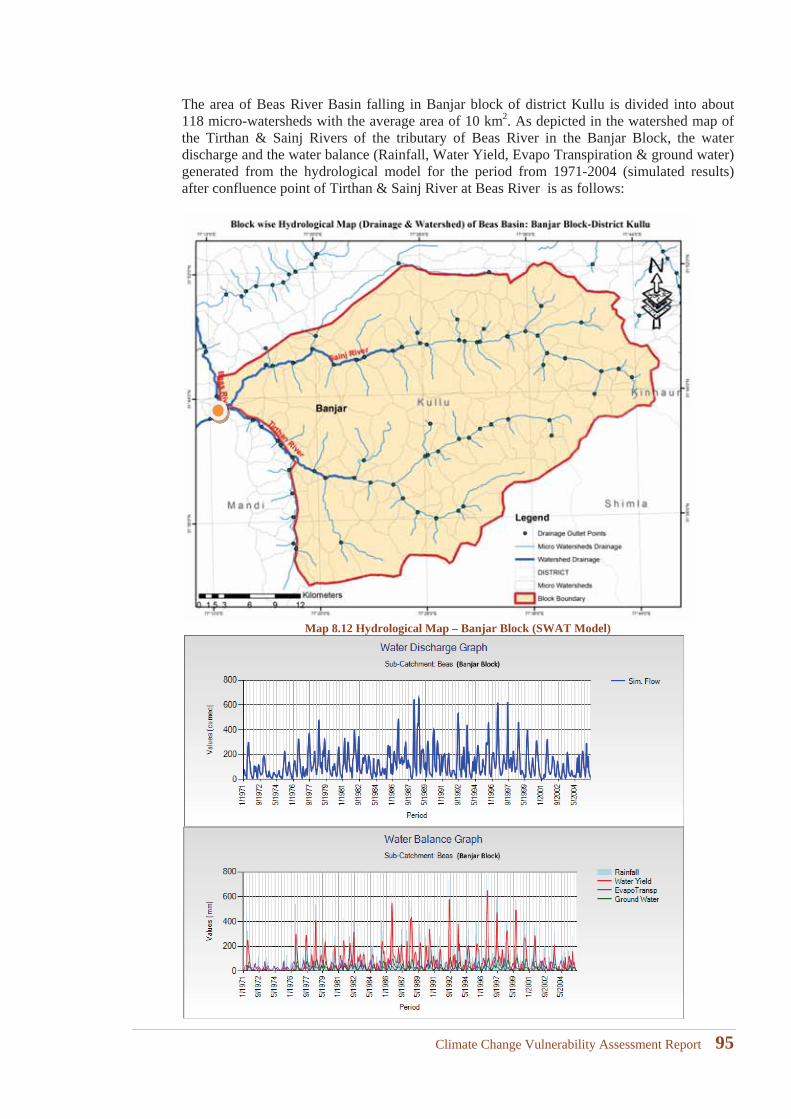
The area of Beas River Basin falling in Banjar block of district Kullu is divided into about118 micro-watersheds with the average area of 10 km2. As depicted in the watershed map of the Tirthan & Sainj Rivers of the tributary of Beas River in the Banjar Block, the water discharge and the water balance (Rainfall, Water Yield, Evapo Transpiration & ground water) generated from the hydrological model for the period from 1971-2004 (simulated results)after confluence point of Tirthan & Sainj River at Beas River is as follows:
Map 8.12 Hydrological Map – Banjar Block (SWAT Model)
Climate Change Vulnerability Assessment Report 95
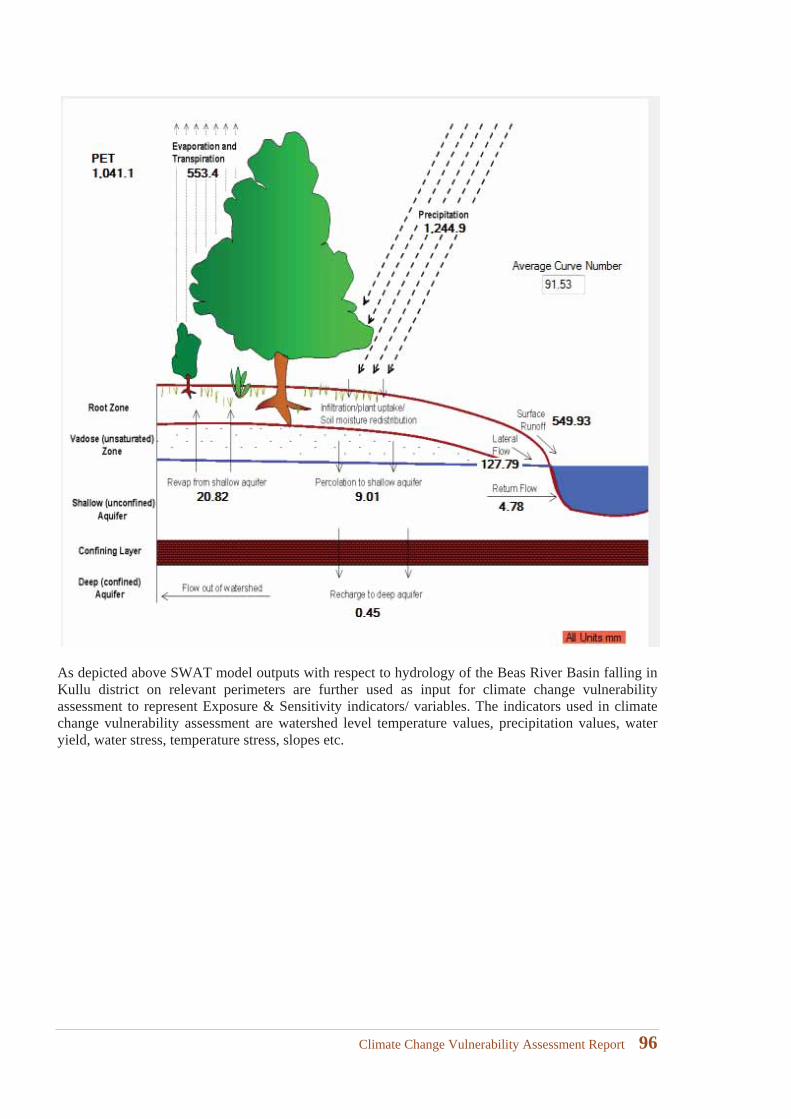
As depicted above SWAT model outputs with respect to hydrology of the Beas River Basin falling in Kullu district on relevant perimeters are further used as input for climate change vulnerability assessment to represent Exposure & Sensitivity indicators/ variables. The indicators used in climate change vulnerability assessment are watershed level temperature values, precipitation values, water yield, water stress, temperature stress, slopes etc.
Climate Change Vulnerability Assessment Report 96

9 Climate Change Vulnerability Assessment Analysis: District Kullu
Climate Change Vulnerability Assessment Report 97

Climate Change Vulnerability Assessment Report 98
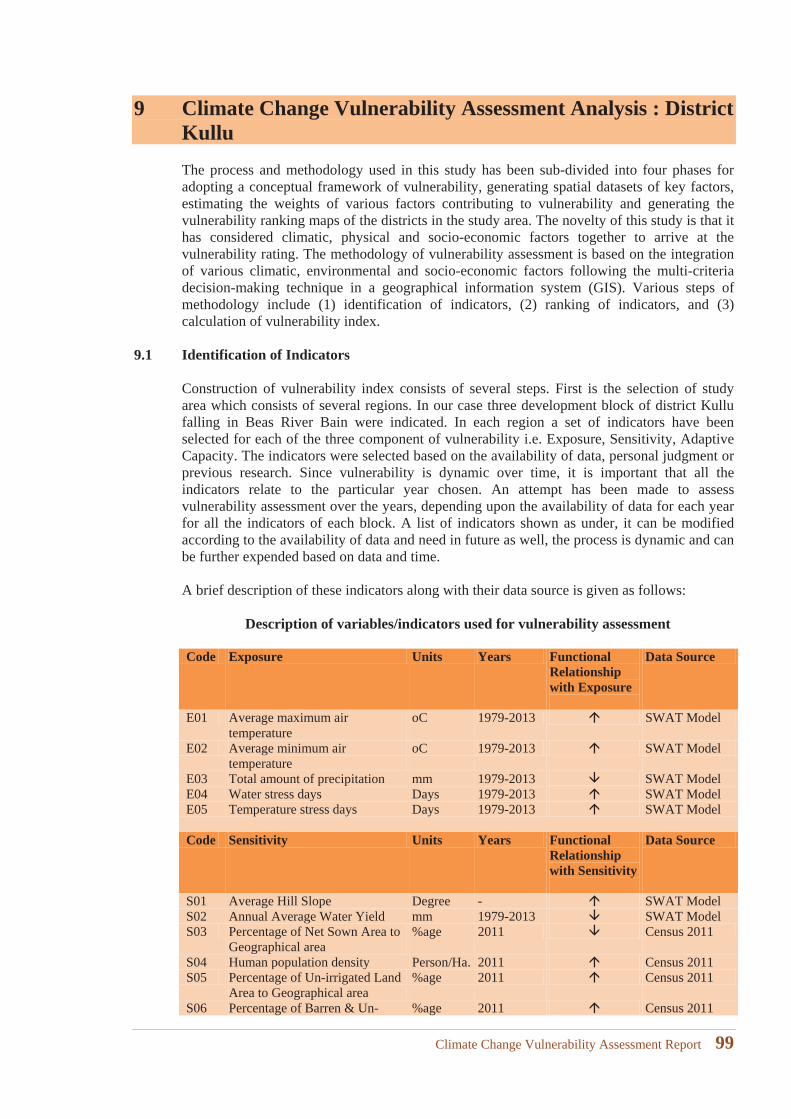
9 Climate Change Vulnerability Assessment Analysis : District KulluThe process and methodology used in this study has been sub-divided into four phases foradopting a conceptual framework of vulnerability, generating spatial datasets of key factors, estimating the weights of various factors contributing to vulnerability and generating the vulnerability ranking maps of the districts in the study area. The novelty of this study is that it has considered climatic, physical and socio-economic factors together to arrive at the vulnerability rating. The methodology of vulnerability assessment is based on the integration of various climatic, environmental and socio-economic factors following the multi-criteria decision-making technique in a geographical information system (GIS). Various steps of methodology include (1) identification of indicators, (2) ranking of indicators, and (3) calculation of vulnerability index.
9.1 Identification of Indicators
Construction of vulnerability index consists of several steps. First is the selection of study area which consists of several regions. In our case three development block of district Kullu falling in Beas River Bain were indicated. In each region a set of indicators have beenselected for each of the three component of vulnerability i.e. Exposure, Sensitivity, Adaptive Capacity. The indicators were selected based on the availability of data, personal judgment or previous research. Since vulnerability is dynamic over time, it is important that all the indicators relate to the particular year chosen. An attempt has been made to assessvulnerability assessment over the years, depending upon the availability of data for each year for all the indicators of each block. A list of indicators shown as under, it can be modified according to the availability of data and need in future as well, the process is dynamic and can be further expended based on data and time.
A brief description of these indicators along with their data source is given as follows:
Description of variables/indicators used for vulnerability assessment
Code Exposure Units Years Functional Relationship with Exposure
Data Source
E01 Average maximum air temperature
oC 1979-2013 SWAT Model
E02 Average minimum air temperature
oC 1979-2013 SWAT Model
E03 Total amount of precipitation mm 1979-2013 SWAT Model E04 Water stress days Days 1979-2013 SWAT Model E05 Temperature stress days Days 1979-2013 SWAT Model
Code Sensitivity Units Years Functional Relationship with Sensitivity
Data Source
S01 Average Hill Slope Degree - SWAT ModelS02 Annual Average Water Yield mm 1979-2013 SWAT ModelS03 Percentage of Net Sown Area to
Geographical area%age 2011 Census 2011
S04 Human population density Person/Ha. 2011 Census 2011S05 Percentage of Un-irrigated Land
Area to Geographical area%age 2011 Census 2011
S06 Percentage of Barren & Un- %age 2011 Census 2011
Climate Change Vulnerability Assessment Report 99
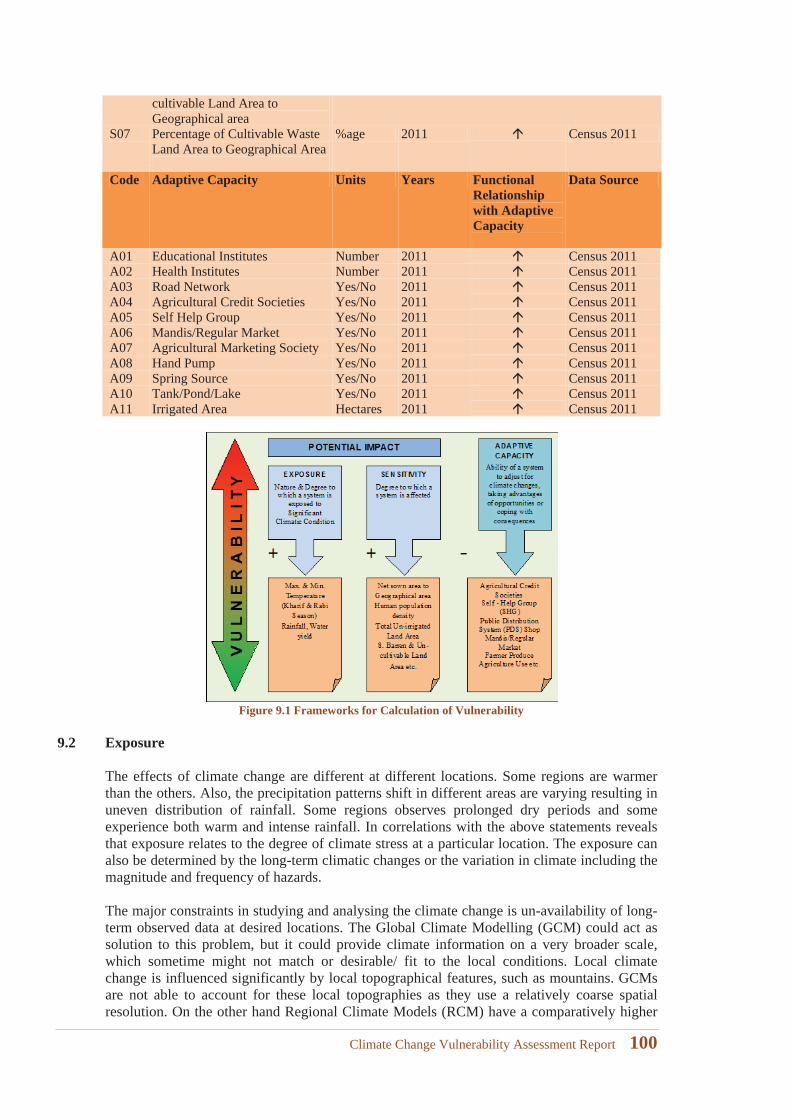
cultivable Land Area to Geographical area
S07 Percentage of Cultivable Waste Land Area to Geographical Area
%age 2011 Census 2011
Code Adaptive Capacity Units Years Functional Relationship with Adaptive Capacity
Data Source
A01 Educational Institutes Number 2011 Census 2011A02 Health Institutes Number 2011 Census 2011A03 Road Network Yes/No 2011 Census 2011A04 Agricultural Credit Societies Yes/No 2011 Census 2011A05 Self Help Group Yes/No 2011 Census 2011A06 Mandis/Regular Market Yes/No 2011 Census 2011A07 Agricultural Marketing Society Yes/No 2011 Census 2011A08 Hand Pump Yes/No 2011 Census 2011A09 Spring Source Yes/No 2011 Census 2011A10 Tank/Pond/Lake Yes/No 2011 Census 2011A11 Irrigated Area Hectares 2011 Census 2011
Figure 9.1 Frameworks for Calculation of Vulnerability
9.2 Exposure
The effects of climate change are different at different locations. Some regions are warmer than the others. Also, the precipitation patterns shift in different areas are varying resulting in uneven distribution of rainfall. Some regions observes prolonged dry periods and some experience both warm and intense rainfall. In correlations with the above statements reveals that exposure relates to the degree of climate stress at a particular location. The exposure can also be determined by the long-term climatic changes or the variation in climate including the magnitude and frequency of hazards.
The major constraints in studying and analysing the climate change is un-availability of long-term observed data at desired locations. The Global Climate Modelling (GCM) could act assolution to this problem, but it could provide climate information on a very broader scale, which sometime might not match or desirable/ fit to the local conditions. Local climate change is influenced significantly by local topographical features, such as mountains. GCMs are not able to account for these local topographies as they use a relatively coarse spatial resolution. On the other hand Regional Climate Models (RCM) have a comparatively higher
Climate Change Vulnerability Assessment Report 100
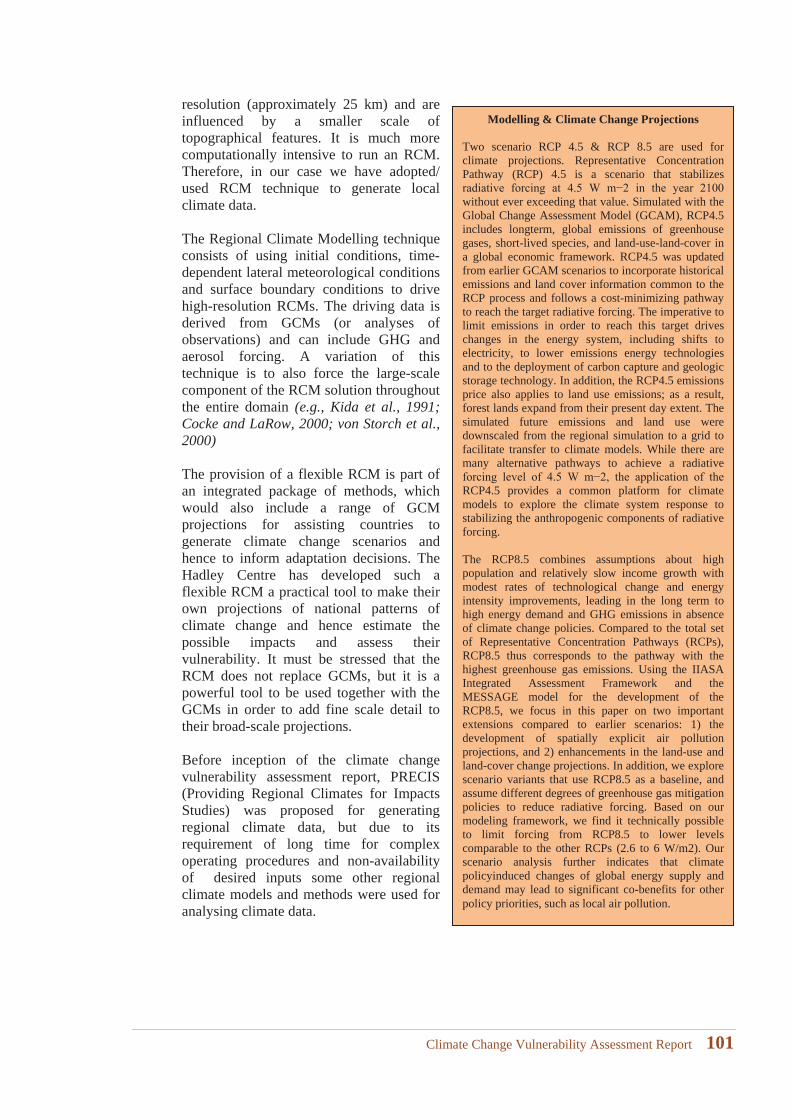
resolution (approximately 25 km) and are influenced by a smaller scale of topographical features. It is much more computationally intensive to run an RCM.Therefore, in our case we have adopted/used RCM technique to generate local climate data.
The Regional Climate Modelling technique consists of using initial conditions, time-dependent lateral meteorological conditions and surface boundary conditions to drive high-resolution RCMs. The driving data is derived from GCMs (or analyses of observations) and can include GHG and aerosol forcing. A variation of this technique is to also force the large-scale component of the RCM solution throughout the entire domain (e.g., Kida et al., 1991; Cocke and LaRow, 2000; von Storch et al., 2000)
The provision of a flexible RCM is part of an integrated package of methods, which would also include a range of GCM projections for assisting countries to generate climate change scenarios and hence to inform adaptation decisions. The Hadley Centre has developed such a flexible RCM a practical tool to make their own projections of national patterns of climate change and hence estimate the possible impacts and assess their vulnerability. It must be stressed that the RCM does not replace GCMs, but it is a powerful tool to be used together with the GCMs in order to add fine scale detail to their broad-scale projections.
Before inception of the climate change vulnerability assessment report, PRECIS (Providing Regional Climates for Impacts Studies) was proposed for generatingregional climate data, but due to its requirement of long time for complex operating procedures and non-availability of desired inputs some other regional climate models and methods were used for analysing climate data.
Modelling & Climate Change Projections
Two scenario RCP 4.5 & RCP 8.5 are used for climate projections. Representative Concentration Pathway (RCP) 4.5 is a scenario that stabilizes
without ever exceeding that value. Simulated with the Global Change Assessment Model (GCAM), RCP4.5 includes longterm, global emissions of greenhouse gases, short-lived species, and land-use-land-cover in a global economic framework. RCP4.5 was updated from earlier GCAM scenarios to incorporate historical emissions and land cover information common to the RCP process and follows a cost-minimizing pathway to reach the target radiative forcing. The imperative to limit emissions in order to reach this target drives changes in the energy system, including shifts to electricity, to lower emissions energy technologies and to the deployment of carbon capture and geologic storage technology. In addition, the RCP4.5 emissions price also applies to land use emissions; as a result, forest lands expand from their present day extent. The simulated future emissions and land use were downscaled from the regional simulation to a grid to facilitate transfer to climate models. While there are many alternative pathways to achieve a radiative
RCP4.5 provides a common platform for climate models to explore the climate system response to stabilizing the anthropogenic components of radiative forcing.
The RCP8.5 combines assumptions about high population and relatively slow income growth with modest rates of technological change and energy intensity improvements, leading in the long term to high energy demand and GHG emissions in absence of climate change policies. Compared to the total set of Representative Concentration Pathways (RCPs), RCP8.5 thus corresponds to the pathway with the highest greenhouse gas emissions. Using the IIASA Integrated Assessment Framework and the MESSAGE model for the development of the RCP8.5, we focus in this paper on two important extensions compared to earlier scenarios: 1) the development of spatially explicit air pollution projections, and 2) enhancements in the land-use and land-cover change projections. In addition, we explore scenario variants that use RCP8.5 as a baseline, and assume different degrees of greenhouse gas mitigation policies to reduce radiative forcing. Based on our modeling framework, we find it technically possible to limit forcing from RCP8.5 to lower levels comparable to the other RCPs (2.6 to 6 W/m2). Our scenario analysis further indicates that climate policyinduced changes of global energy supply and demand may lead to significant co-benefits for other policy priorities, such as local air pollution.
Climate Change Vulnerability Assessment Report 101
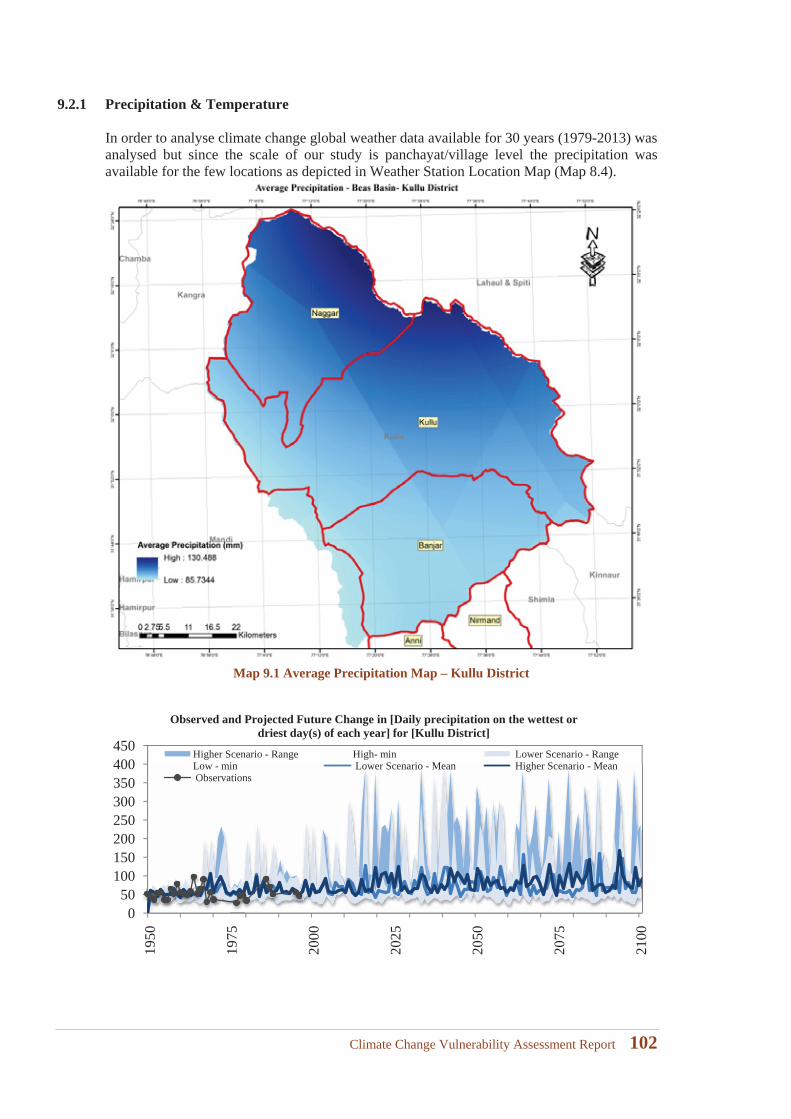
9.2.1 Precipitation & Temperature
In order to analyse climate change global weather data available for 30 years (1979-2013) was analysed but since the scale of our study is panchayat/village level the precipitation was available for the few locations as depicted in Weather Station Location Map (Map 8.4).
Map 9.1 Average Precipitation Map – Kullu District
050
100150200250300350400450
1950
1975
2000
2025
2050
2075
2100
Observed and Projected Future Change in [Daily precipitation on the wettest or driest day(s) of each year] for [Kullu District]
Higher Scenario - Range High- min Lower Scenario - RangeLow - min Lower Scenario - Mean Higher Scenario - MeanObservations
Climate Change Vulnerability Assessment Report 102
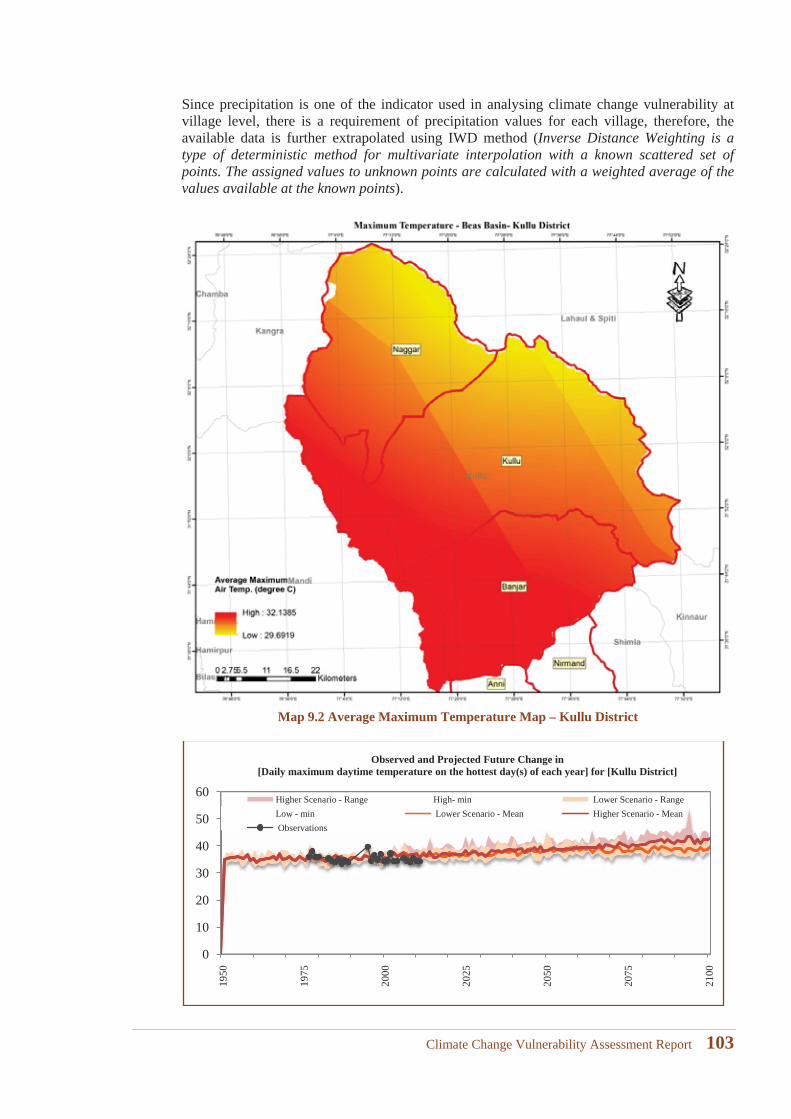
Since precipitation is one of the indicator used in analysing climate change vulnerability at village level, there is a requirement of precipitation values for each village, therefore, the available data is further extrapolated using IWD method (Inverse Distance Weighting is a type of deterministic method for multivariate interpolation with a known scattered set of points. The assigned values to unknown points are calculated with a weighted average of the values available at the known points).
Map 9.2 Average Maximum Temperature Map – Kullu District
0
10
20
30
40
50
60
1950
1975
2000
2025
2050
2075
2100
Observed and Projected Future Change in [Daily maximum daytime temperature on the hottest day(s) of each year] for [Kullu District]
Higher Scenario - Range High- min Lower Scenario - RangeLow - min Lower Scenario - Mean Higher Scenario - MeanObservations
Climate Change Vulnerability Assessment Report 103
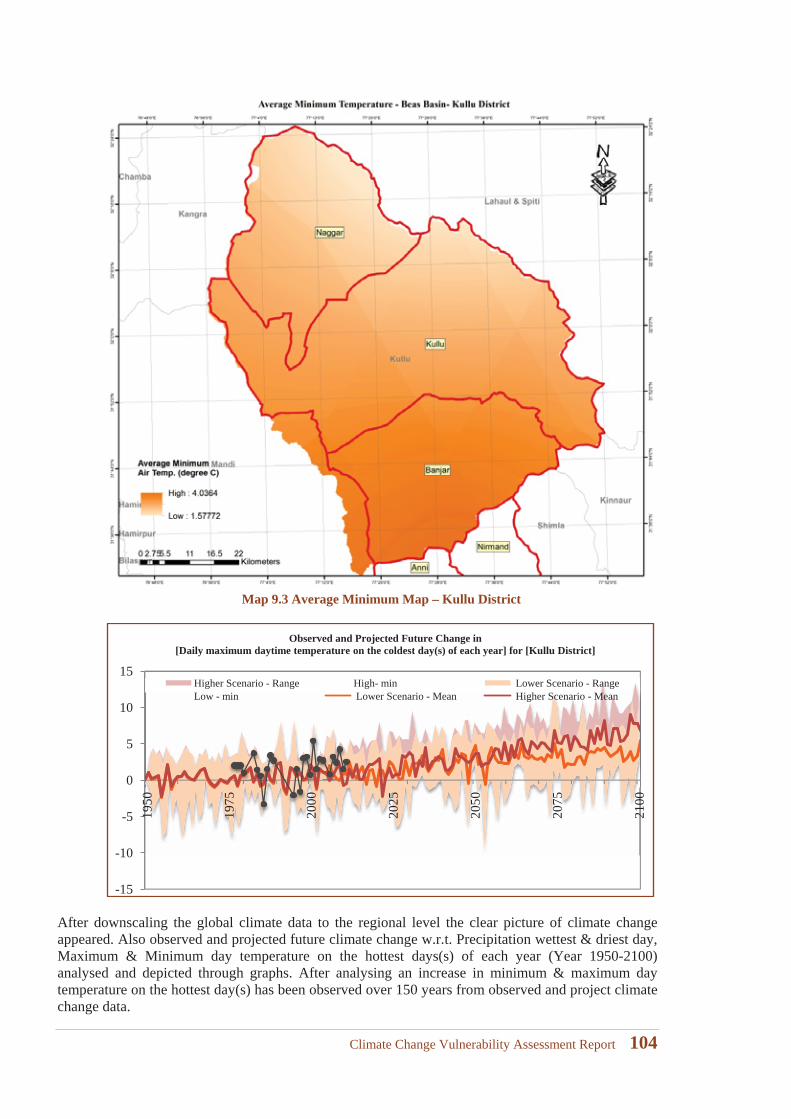
Map 9.3 Average Minimum Map – Kullu District
After downscaling the global climate data to the regional level the clear picture of climate change appeared. Also observed and projected future climate change w.r.t. Precipitation wettest & driest day, Maximum & Minimum day temperature on the hottest days(s) of each year (Year 1950-2100) analysed and depicted through graphs. After analysing an increase in minimum & maximum day temperature on the hottest day(s) has been observed over 150 years from observed and project climate change data.
-15
-10
-5
0
5
10
15
1950
1975
2000
2025
2050
2075
2100
Observed and Projected Future Change in [Daily maximum daytime temperature on the coldest day(s) of each year] for [Kullu District]
Higher Scenario - Range High- min Lower Scenario - RangeLow - min Lower Scenario - Mean Higher Scenario - Mean
Climate Change Vulnerability Assessment Report 104
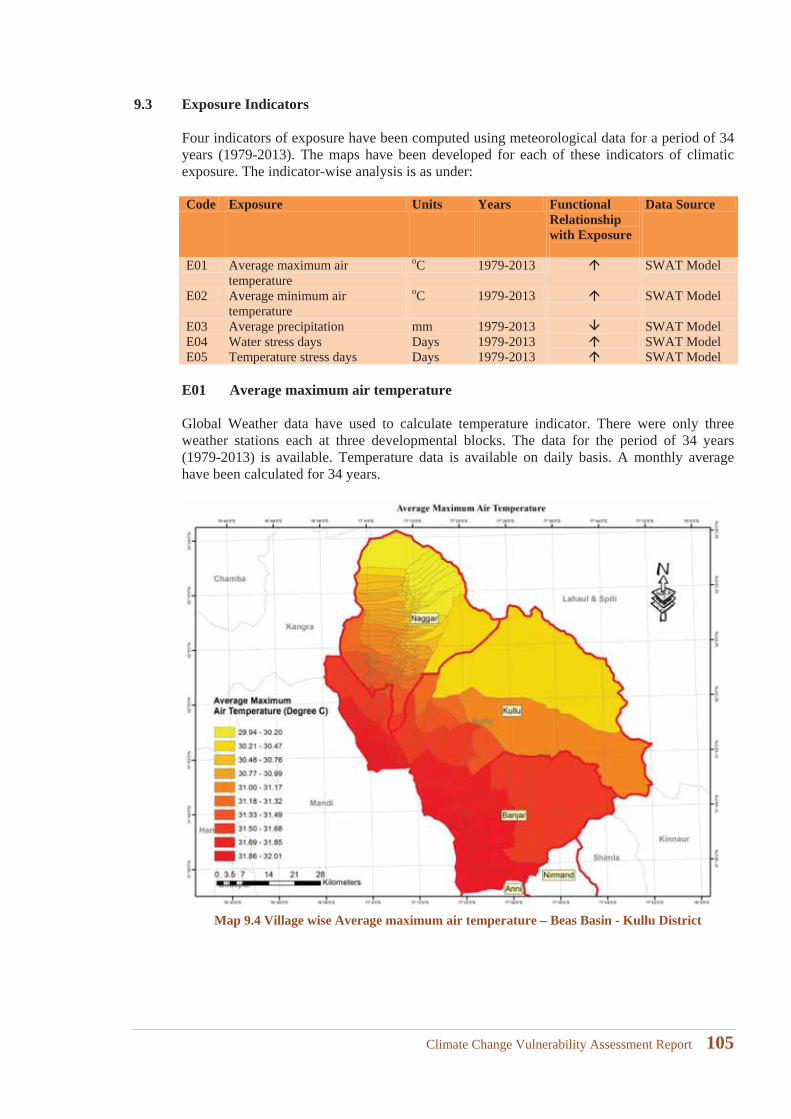
9.3 Exposure Indicators
Four indicators of exposure have been computed using meteorological data for a period of 34years (1979-2013). The maps have been developed for each of these indicators of climatic exposure. The indicator-wise analysis is as under:
Code Exposure Units Years Functional Relationship with Exposure
Data Source
E01 Average maximum air temperature
oC 1979-2013 SWAT Model
E02 Average minimum air temperature
oC 1979-2013 SWAT Model
E03 Average precipitation mm 1979-2013 SWAT Model E04 Water stress days Days 1979-2013 SWAT Model E05 Temperature stress days Days 1979-2013 SWAT Model
E01 Average maximum air temperature
Global Weather data have used to calculate temperature indicator. There were only three weather stations each at three developmental blocks. The data for the period of 34 years (1979-2013) is available. Temperature data is available on daily basis. A monthly average have been calculated for 34 years.
Map 9.4 Village wise Average maximum air temperature – Beas Basin - Kullu District
Climate Change Vulnerability Assessment Report 105
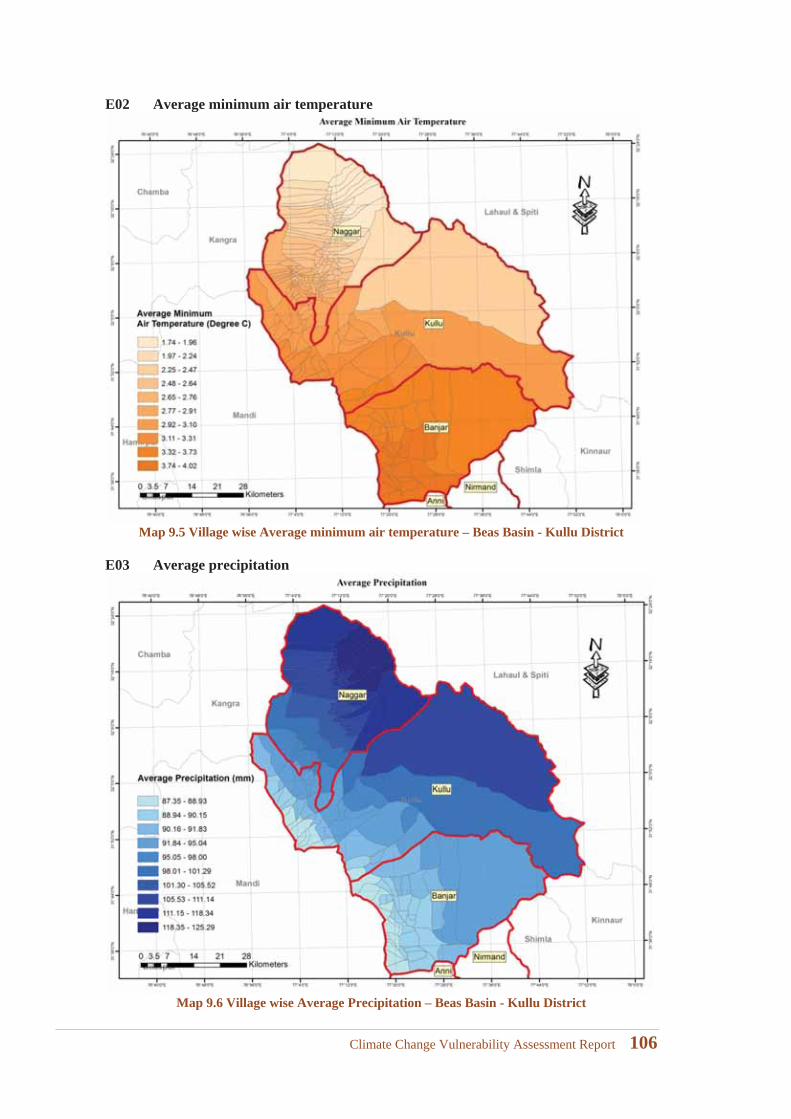
E02 Average minimum air temperature
Map 9.5 Village wise Average minimum air temperature – Beas Basin - Kullu District
E03 Average precipitation
Map 9.6 Village wise Average Precipitation – Beas Basin - Kullu District
Climate Change Vulnerability Assessment Report 106
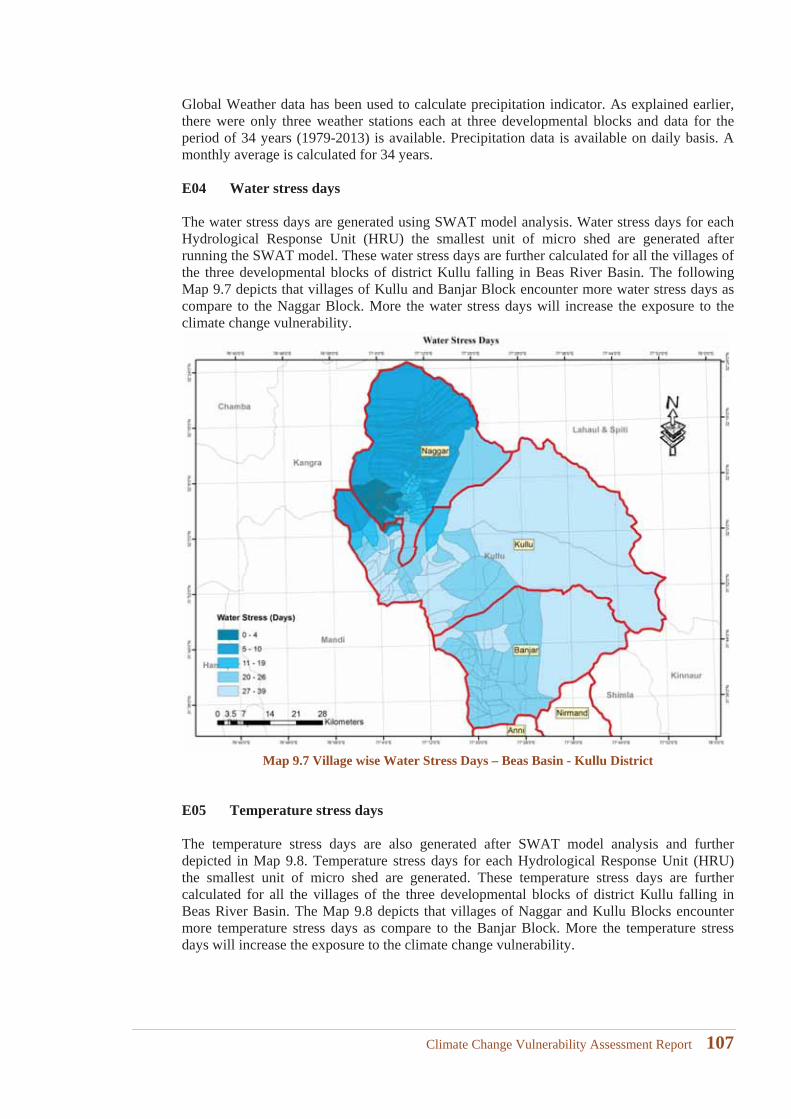
Global Weather data has been used to calculate precipitation indicator. As explained earlier,there were only three weather stations each at three developmental blocks and data for the period of 34 years (1979-2013) is available. Precipitation data is available on daily basis. A monthly average is calculated for 34 years.
E04 Water stress days
The water stress days are generated using SWAT model analysis. Water stress days for each Hydrological Response Unit (HRU) the smallest unit of micro shed are generated after running the SWAT model. These water stress days are further calculated for all the villages of the three developmental blocks of district Kullu falling in Beas River Basin. The following Map 9.7 depicts that villages of Kullu and Banjar Block encounter more water stress days as compare to the Naggar Block. More the water stress days will increase the exposure to the climate change vulnerability.
Map 9.7 Village wise Water Stress Days – Beas Basin - Kullu District
E05 Temperature stress days
The temperature stress days are also generated after SWAT model analysis and further depicted in Map 9.8. Temperature stress days for each Hydrological Response Unit (HRU) the smallest unit of micro shed are generated. These temperature stress days are further calculated for all the villages of the three developmental blocks of district Kullu falling in Beas River Basin. The Map 9.8 depicts that villages of Naggar and Kullu Blocks encounter more temperature stress days as compare to the Banjar Block. More the temperature stress days will increase the exposure to the climate change vulnerability.
Climate Change Vulnerability Assessment Report 107
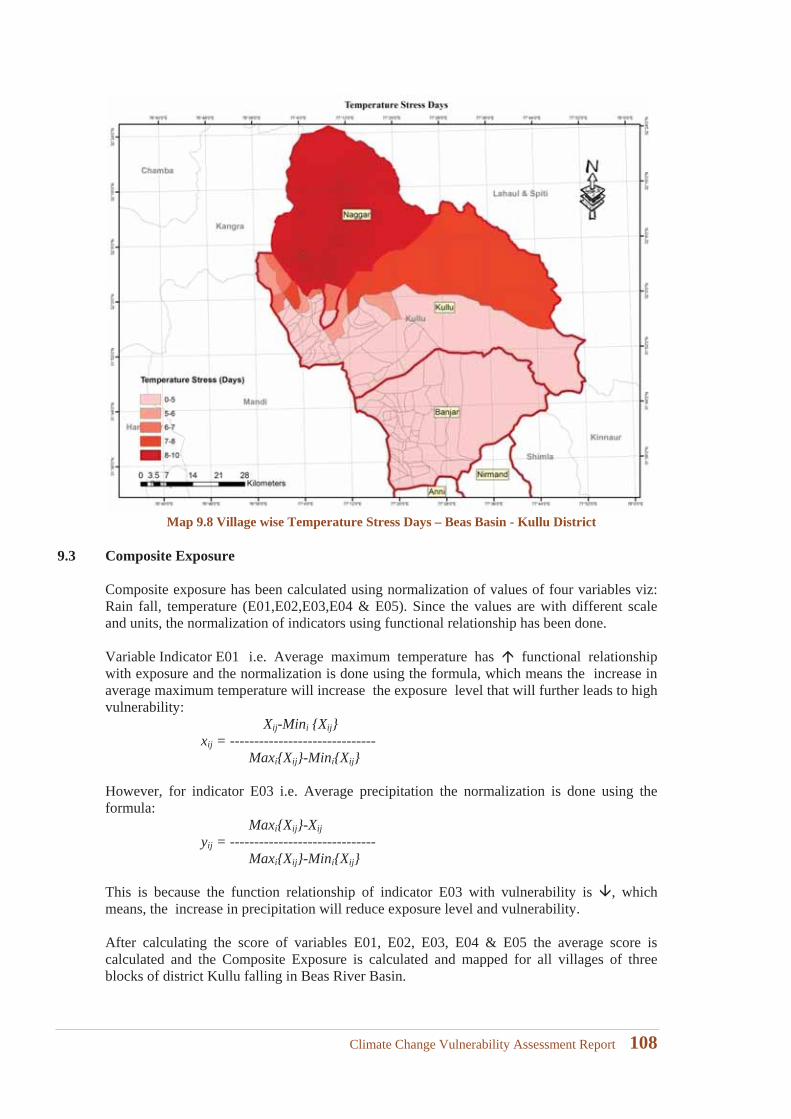
Map 9.8 Village wise Temperature Stress Days – Beas Basin - Kullu District 9.3 Composite Exposure
Composite exposure has been calculated using normalization of values of four variables viz: Rain fall, temperature (E01,E02,E03,E04 & E05). Since the values are with different scale and units, the normalization of indicators using functional relationship has been done.
Variable Indicator E01 i.e. Average maximum temperature has functional relationship with exposure and the normalization is done using the formula, which means the increase in average maximum temperature will increase the exposure level that will further leads to high vulnerability:
Xij-Mini {Xij}xij = ------------------------------
Maxi{Xij}-Mini{Xij}
However, for indicator E03 i.e. Average precipitation the normalization is done using the formula:
Maxi{Xij}-Xijyij = ------------------------------
Maxi{Xij}-Mini{Xij}
This is because the function relationship of indicator E03 with vulnerability is , which means, the increase in precipitation will reduce exposure level and vulnerability.
After calculating the score of variables E01, E02, E03, E04 & E05 the average score is calculated and the Composite Exposure is calculated and mapped for all villages of three blocks of district Kullu falling in Beas River Basin.
Climate Change Vulnerability Assessment Report 108
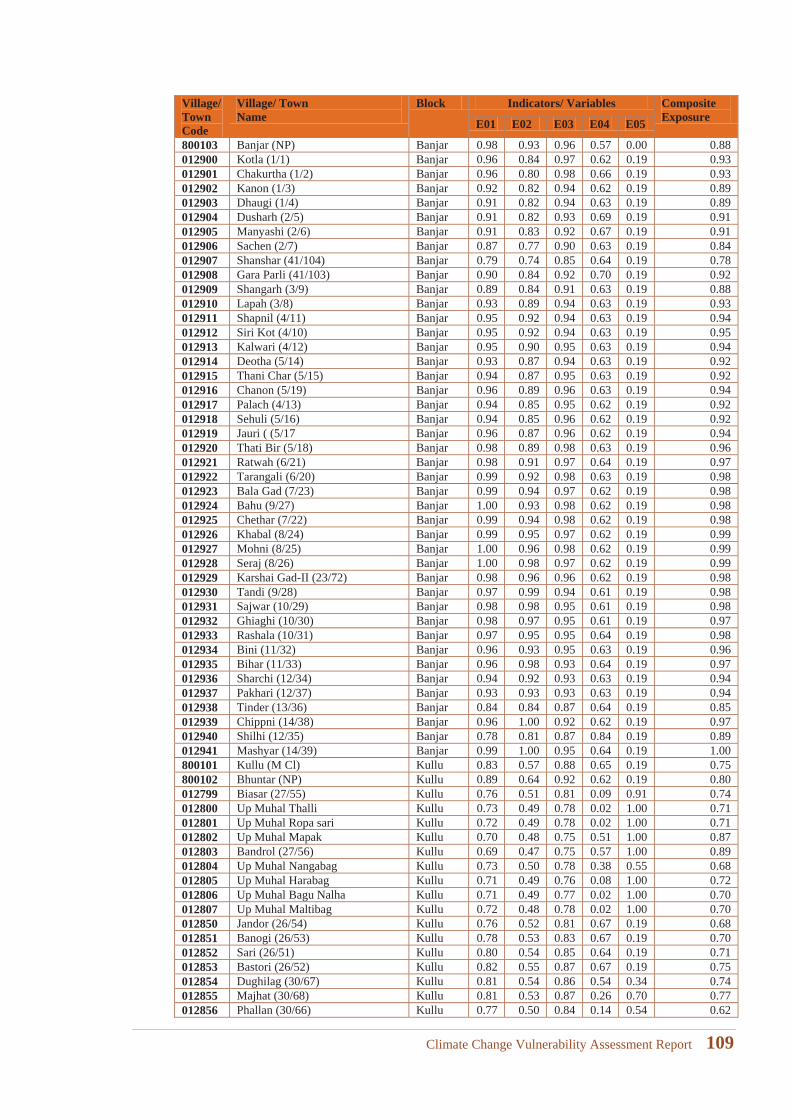
Village/TownCode
Village/ TownName
Block Indicators/ Variables Composite ExposureE01 E02 E03 E04 E05
800103 Banjar (NP) Banjar 0.98 0.93 0.96 0.57 0.00 0.88012900 Kotla (1/1) Banjar 0.96 0.84 0.97 0.62 0.19 0.93012901 Chakurtha (1/2) Banjar 0.96 0.80 0.98 0.66 0.19 0.93012902 Kanon (1/3) Banjar 0.92 0.82 0.94 0.62 0.19 0.89012903 Dhaugi (1/4) Banjar 0.91 0.82 0.94 0.63 0.19 0.89012904 Dusharh (2/5) Banjar 0.91 0.82 0.93 0.69 0.19 0.91012905 Manyashi (2/6) Banjar 0.91 0.83 0.92 0.67 0.19 0.91012906 Sachen (2/7) Banjar 0.87 0.77 0.90 0.63 0.19 0.84012907 Shanshar (41/104) Banjar 0.79 0.74 0.85 0.64 0.19 0.78012908 Gara Parli (41/103) Banjar 0.90 0.84 0.92 0.70 0.19 0.92012909 Shangarh (3/9) Banjar 0.89 0.84 0.91 0.63 0.19 0.88012910 Lapah (3/8) Banjar 0.93 0.89 0.94 0.63 0.19 0.93012911 Shapnil (4/11) Banjar 0.95 0.92 0.94 0.63 0.19 0.94012912 Siri Kot (4/10) Banjar 0.95 0.92 0.94 0.63 0.19 0.95012913 Kalwari (4/12) Banjar 0.95 0.90 0.95 0.63 0.19 0.94012914 Deotha (5/14) Banjar 0.93 0.87 0.94 0.63 0.19 0.92012915 Thani Char (5/15) Banjar 0.94 0.87 0.95 0.63 0.19 0.92012916 Chanon (5/19) Banjar 0.96 0.89 0.96 0.63 0.19 0.94012917 Palach (4/13) Banjar 0.94 0.85 0.95 0.62 0.19 0.92012918 Sehuli (5/16) Banjar 0.94 0.85 0.96 0.62 0.19 0.92012919 Jauri ( (5/17 Banjar 0.96 0.87 0.96 0.62 0.19 0.94012920 Thati Bir (5/18) Banjar 0.98 0.89 0.98 0.63 0.19 0.96012921 Ratwah (6/21) Banjar 0.98 0.91 0.97 0.64 0.19 0.97012922 Tarangali (6/20) Banjar 0.99 0.92 0.98 0.63 0.19 0.98012923 Bala Gad (7/23) Banjar 0.99 0.94 0.97 0.62 0.19 0.98012924 Bahu (9/27) Banjar 1.00 0.93 0.98 0.62 0.19 0.98012925 Chethar (7/22) Banjar 0.99 0.94 0.98 0.62 0.19 0.98012926 Khabal (8/24) Banjar 0.99 0.95 0.97 0.62 0.19 0.99012927 Mohni (8/25) Banjar 1.00 0.96 0.98 0.62 0.19 0.99012928 Seraj (8/26) Banjar 1.00 0.98 0.97 0.62 0.19 0.99012929 Karshai Gad-II (23/72) Banjar 0.98 0.96 0.96 0.62 0.19 0.98012930 Tandi (9/28) Banjar 0.97 0.99 0.94 0.61 0.19 0.98012931 Sajwar (10/29) Banjar 0.98 0.98 0.95 0.61 0.19 0.98012932 Ghiaghi (10/30) Banjar 0.98 0.97 0.95 0.61 0.19 0.97012933 Rashala (10/31) Banjar 0.97 0.95 0.95 0.64 0.19 0.98012934 Bini (11/32) Banjar 0.96 0.93 0.95 0.63 0.19 0.96012935 Bihar (11/33) Banjar 0.96 0.98 0.93 0.64 0.19 0.97012936 Sharchi (12/34) Banjar 0.94 0.92 0.93 0.63 0.19 0.94012937 Pakhari (12/37) Banjar 0.93 0.93 0.93 0.63 0.19 0.94012938 Tinder (13/36) Banjar 0.84 0.84 0.87 0.64 0.19 0.85012939 Chippni (14/38) Banjar 0.96 1.00 0.92 0.62 0.19 0.97012940 Shilhi (12/35) Banjar 0.78 0.81 0.87 0.84 0.19 0.89012941 Mashyar (14/39) Banjar 0.99 1.00 0.95 0.64 0.19 1.00800101 Kullu (M Cl) Kullu 0.83 0.57 0.88 0.65 0.19 0.75800102 Bhuntar (NP) Kullu 0.89 0.64 0.92 0.62 0.19 0.80012799 Biasar (27/55) Kullu 0.76 0.51 0.81 0.09 0.91 0.74012800 Up Muhal Thalli Kullu 0.73 0.49 0.78 0.02 1.00 0.71012801 Up Muhal Ropa sari Kullu 0.72 0.49 0.78 0.02 1.00 0.71012802 Up Muhal Mapak Kullu 0.70 0.48 0.75 0.51 1.00 0.87012803 Bandrol (27/56) Kullu 0.69 0.47 0.75 0.57 1.00 0.89012804 Up Muhal Nangabag Kullu 0.73 0.50 0.78 0.38 0.55 0.68012805 Up Muhal Harabag Kullu 0.71 0.49 0.76 0.08 1.00 0.72012806 Up Muhal Bagu Nalha Kullu 0.71 0.49 0.77 0.02 1.00 0.70012807 Up Muhal Maltibag Kullu 0.72 0.48 0.78 0.02 1.00 0.70012850 Jandor (26/54) Kullu 0.76 0.52 0.81 0.67 0.19 0.68012851 Banogi (26/53) Kullu 0.78 0.53 0.83 0.67 0.19 0.70012852 Sari (26/51) Kullu 0.80 0.54 0.85 0.64 0.19 0.71012853 Bastori (26/52) Kullu 0.82 0.55 0.87 0.67 0.19 0.75012854 Dughilag (30/67) Kullu 0.81 0.54 0.86 0.54 0.34 0.74012855 Majhat (30/68) Kullu 0.81 0.53 0.87 0.26 0.70 0.77012856 Phallan (30/66) Kullu 0.77 0.50 0.84 0.14 0.54 0.62
Climate Change Vulnerability Assessment Report 109
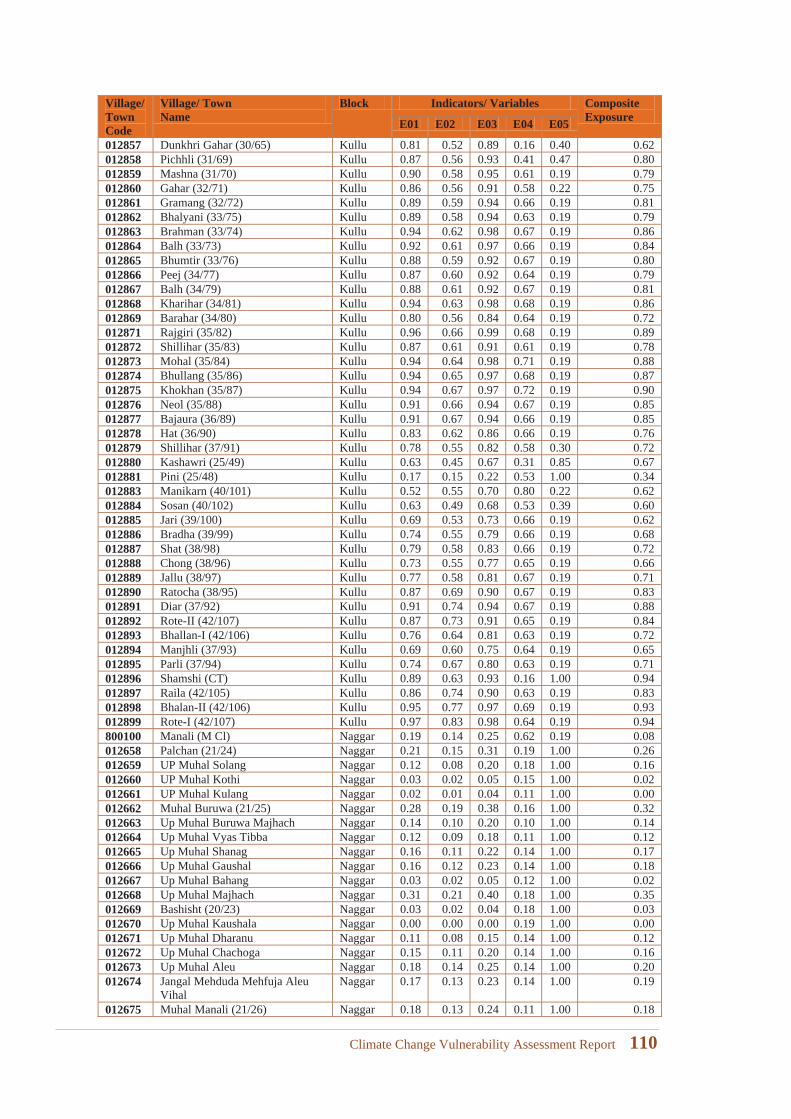
Village/TownCode
Village/ TownName
Block Indicators/ Variables Composite ExposureE01 E02 E03 E04 E05
012857 Dunkhri Gahar (30/65) Kullu 0.81 0.52 0.89 0.16 0.40 0.62012858 Pichhli (31/69) Kullu 0.87 0.56 0.93 0.41 0.47 0.80012859 Mashna (31/70) Kullu 0.90 0.58 0.95 0.61 0.19 0.79012860 Gahar (32/71) Kullu 0.86 0.56 0.91 0.58 0.22 0.75012861 Gramang (32/72) Kullu 0.89 0.59 0.94 0.66 0.19 0.81012862 Bhalyani (33/75) Kullu 0.89 0.58 0.94 0.63 0.19 0.79012863 Brahman (33/74) Kullu 0.94 0.62 0.98 0.67 0.19 0.86012864 Balh (33/73) Kullu 0.92 0.61 0.97 0.66 0.19 0.84012865 Bhumtir (33/76) Kullu 0.88 0.59 0.92 0.67 0.19 0.80012866 Peej (34/77) Kullu 0.87 0.60 0.92 0.64 0.19 0.79012867 Balh (34/79) Kullu 0.88 0.61 0.92 0.67 0.19 0.81012868 Kharihar (34/81) Kullu 0.94 0.63 0.98 0.68 0.19 0.86012869 Barahar (34/80) Kullu 0.80 0.56 0.84 0.64 0.19 0.72012871 Rajgiri (35/82) Kullu 0.96 0.66 0.99 0.68 0.19 0.89012872 Shillihar (35/83) Kullu 0.87 0.61 0.91 0.61 0.19 0.78012873 Mohal (35/84) Kullu 0.94 0.64 0.98 0.71 0.19 0.88012874 Bhullang (35/86) Kullu 0.94 0.65 0.97 0.68 0.19 0.87012875 Khokhan (35/87) Kullu 0.94 0.67 0.97 0.72 0.19 0.90012876 Neol (35/88) Kullu 0.91 0.66 0.94 0.67 0.19 0.85012877 Bajaura (36/89) Kullu 0.91 0.67 0.94 0.66 0.19 0.85012878 Hat (36/90) Kullu 0.83 0.62 0.86 0.66 0.19 0.76012879 Shillihar (37/91) Kullu 0.78 0.55 0.82 0.58 0.30 0.72012880 Kashawri (25/49) Kullu 0.63 0.45 0.67 0.31 0.85 0.67012881 Pini (25/48) Kullu 0.17 0.15 0.22 0.53 1.00 0.34012883 Manikarn (40/101) Kullu 0.52 0.55 0.70 0.80 0.22 0.62012884 Sosan (40/102) Kullu 0.63 0.49 0.68 0.53 0.39 0.60012885 Jari (39/100) Kullu 0.69 0.53 0.73 0.66 0.19 0.62012886 Bradha (39/99) Kullu 0.74 0.55 0.79 0.66 0.19 0.68012887 Shat (38/98) Kullu 0.79 0.58 0.83 0.66 0.19 0.72012888 Chong (38/96) Kullu 0.73 0.55 0.77 0.65 0.19 0.66012889 Jallu (38/97) Kullu 0.77 0.58 0.81 0.67 0.19 0.71012890 Ratocha (38/95) Kullu 0.87 0.69 0.90 0.67 0.19 0.83012891 Diar (37/92) Kullu 0.91 0.74 0.94 0.67 0.19 0.88012892 Rote-II (42/107) Kullu 0.87 0.73 0.91 0.65 0.19 0.84012893 Bhallan-I (42/106) Kullu 0.76 0.64 0.81 0.63 0.19 0.72012894 Manjhli (37/93) Kullu 0.69 0.60 0.75 0.64 0.19 0.65012895 Parli (37/94) Kullu 0.74 0.67 0.80 0.63 0.19 0.71012896 Shamshi (CT) Kullu 0.89 0.63 0.93 0.16 1.00 0.94012897 Raila (42/105) Kullu 0.86 0.74 0.90 0.63 0.19 0.83012898 Bhalan-II (42/106) Kullu 0.95 0.77 0.97 0.69 0.19 0.93012899 Rote-I (42/107) Kullu 0.97 0.83 0.98 0.64 0.19 0.94800100 Manali (M Cl) Naggar 0.19 0.14 0.25 0.62 0.19 0.08012658 Palchan (21/24) Naggar 0.21 0.15 0.31 0.19 1.00 0.26012659 UP Muhal Solang Naggar 0.12 0.08 0.20 0.18 1.00 0.16012660 UP Muhal Kothi Naggar 0.03 0.02 0.05 0.15 1.00 0.02012661 UP Muhal Kulang Naggar 0.02 0.01 0.04 0.11 1.00 0.00012662 Muhal Buruwa (21/25) Naggar 0.28 0.19 0.38 0.16 1.00 0.32012663 Up Muhal Buruwa Majhach Naggar 0.14 0.10 0.20 0.10 1.00 0.14012664 Up Muhal Vyas Tibba Naggar 0.12 0.09 0.18 0.11 1.00 0.12012665 Up Muhal Shanag Naggar 0.16 0.11 0.22 0.14 1.00 0.17012666 Up Muhal Gaushal Naggar 0.16 0.12 0.23 0.14 1.00 0.18012667 Up Muhal Bahang Naggar 0.03 0.02 0.05 0.12 1.00 0.02012668 Up Muhal Majhach Naggar 0.31 0.21 0.40 0.18 1.00 0.35012669 Bashisht (20/23) Naggar 0.03 0.02 0.04 0.18 1.00 0.03012670 Up Muhal Kaushala Naggar 0.00 0.00 0.00 0.19 1.00 0.00012671 Up Muhal Dharanu Naggar 0.11 0.08 0.15 0.14 1.00 0.12012672 Up Muhal Chachoga Naggar 0.15 0.11 0.20 0.14 1.00 0.16012673 Up Muhal Aleu Naggar 0.18 0.14 0.25 0.14 1.00 0.20012674 Jangal Mehduda Mehfuja Aleu
VihalNaggar 0.17 0.13 0.23 0.14 1.00 0.19
012675 Muhal Manali (21/26) Naggar 0.18 0.13 0.24 0.11 1.00 0.18
Climate Change Vulnerability Assessment Report 110
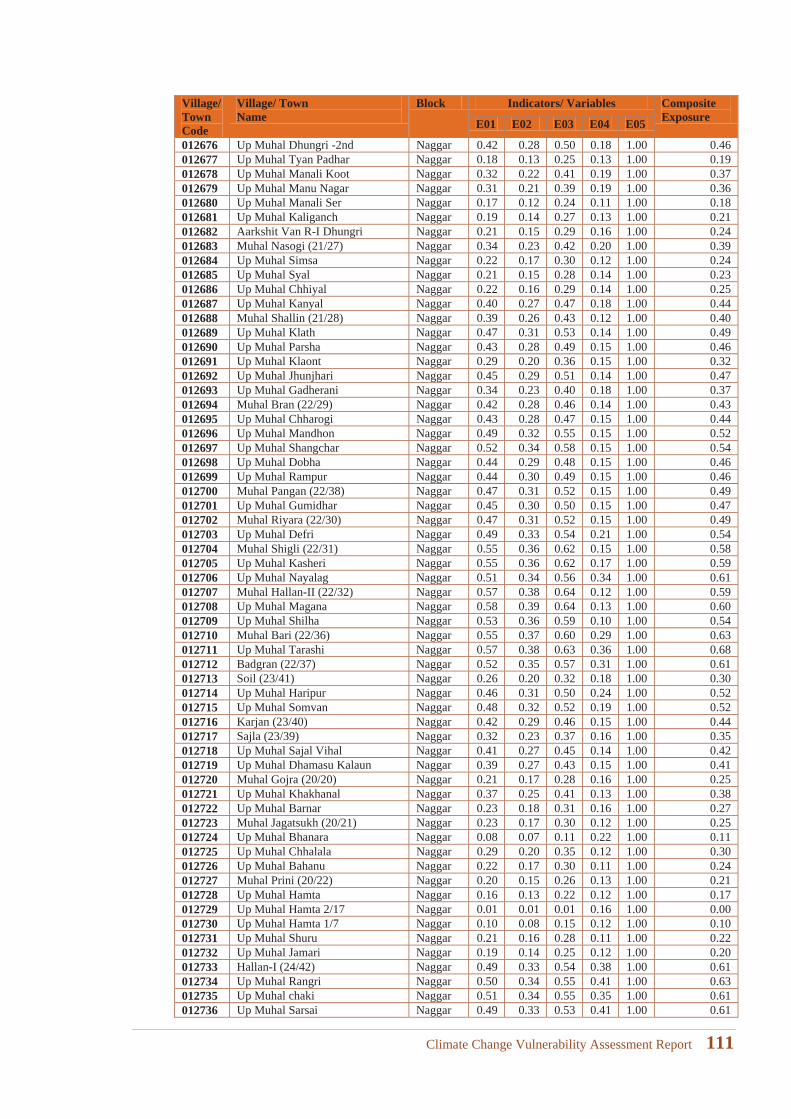
Village/TownCode
Village/ TownName
Block Indicators/ Variables Composite ExposureE01 E02 E03 E04 E05
012676 Up Muhal Dhungri -2nd Naggar 0.42 0.28 0.50 0.18 1.00 0.46012677 Up Muhal Tyan Padhar Naggar 0.18 0.13 0.25 0.13 1.00 0.19012678 Up Muhal Manali Koot Naggar 0.32 0.22 0.41 0.19 1.00 0.37012679 Up Muhal Manu Nagar Naggar 0.31 0.21 0.39 0.19 1.00 0.36012680 Up Muhal Manali Ser Naggar 0.17 0.12 0.24 0.11 1.00 0.18012681 Up Muhal Kaliganch Naggar 0.19 0.14 0.27 0.13 1.00 0.21012682 Aarkshit Van R-I Dhungri Naggar 0.21 0.15 0.29 0.16 1.00 0.24012683 Muhal Nasogi (21/27) Naggar 0.34 0.23 0.42 0.20 1.00 0.39012684 Up Muhal Simsa Naggar 0.22 0.17 0.30 0.12 1.00 0.24012685 Up Muhal Syal Naggar 0.21 0.15 0.28 0.14 1.00 0.23012686 Up Muhal Chhiyal Naggar 0.22 0.16 0.29 0.14 1.00 0.25012687 Up Muhal Kanyal Naggar 0.40 0.27 0.47 0.18 1.00 0.44012688 Muhal Shallin (21/28) Naggar 0.39 0.26 0.43 0.12 1.00 0.40012689 Up Muhal Klath Naggar 0.47 0.31 0.53 0.14 1.00 0.49012690 Up Muhal Parsha Naggar 0.43 0.28 0.49 0.15 1.00 0.46012691 Up Muhal Klaont Naggar 0.29 0.20 0.36 0.15 1.00 0.32012692 Up Muhal Jhunjhari Naggar 0.45 0.29 0.51 0.14 1.00 0.47012693 Up Muhal Gadherani Naggar 0.34 0.23 0.40 0.18 1.00 0.37012694 Muhal Bran (22/29) Naggar 0.42 0.28 0.46 0.14 1.00 0.43012695 Up Muhal Chharogi Naggar 0.43 0.28 0.47 0.15 1.00 0.44012696 Up Muhal Mandhon Naggar 0.49 0.32 0.55 0.15 1.00 0.52012697 Up Muhal Shangchar Naggar 0.52 0.34 0.58 0.15 1.00 0.54012698 Up Muhal Dobha Naggar 0.44 0.29 0.48 0.15 1.00 0.46012699 Up Muhal Rampur Naggar 0.44 0.30 0.49 0.15 1.00 0.46012700 Muhal Pangan (22/38) Naggar 0.47 0.31 0.52 0.15 1.00 0.49012701 Up Muhal Gumidhar Naggar 0.45 0.30 0.50 0.15 1.00 0.47012702 Muhal Riyara (22/30) Naggar 0.47 0.31 0.52 0.15 1.00 0.49012703 Up Muhal Defri Naggar 0.49 0.33 0.54 0.21 1.00 0.54012704 Muhal Shigli (22/31) Naggar 0.55 0.36 0.62 0.15 1.00 0.58012705 Up Muhal Kasheri Naggar 0.55 0.36 0.62 0.17 1.00 0.59012706 Up Muhal Nayalag Naggar 0.51 0.34 0.56 0.34 1.00 0.61012707 Muhal Hallan-II (22/32) Naggar 0.57 0.38 0.64 0.12 1.00 0.59012708 Up Muhal Magana Naggar 0.58 0.39 0.64 0.13 1.00 0.60012709 Up Muhal Shilha Naggar 0.53 0.36 0.59 0.10 1.00 0.54012710 Muhal Bari (22/36) Naggar 0.55 0.37 0.60 0.29 1.00 0.63012711 Up Muhal Tarashi Naggar 0.57 0.38 0.63 0.36 1.00 0.68012712 Badgran (22/37) Naggar 0.52 0.35 0.57 0.31 1.00 0.61012713 Soil (23/41) Naggar 0.26 0.20 0.32 0.18 1.00 0.30012714 Up Muhal Haripur Naggar 0.46 0.31 0.50 0.24 1.00 0.52012715 Up Muhal Somvan Naggar 0.48 0.32 0.52 0.19 1.00 0.52012716 Karjan (23/40) Naggar 0.42 0.29 0.46 0.15 1.00 0.44012717 Sajla (23/39) Naggar 0.32 0.23 0.37 0.16 1.00 0.35012718 Up Muhal Sajal Vihal Naggar 0.41 0.27 0.45 0.14 1.00 0.42012719 Up Muhal Dhamasu Kalaun Naggar 0.39 0.27 0.43 0.15 1.00 0.41012720 Muhal Gojra (20/20) Naggar 0.21 0.17 0.28 0.16 1.00 0.25012721 Up Muhal Khakhanal Naggar 0.37 0.25 0.41 0.13 1.00 0.38012722 Up Muhal Barnar Naggar 0.23 0.18 0.31 0.16 1.00 0.27012723 Muhal Jagatsukh (20/21) Naggar 0.23 0.17 0.30 0.12 1.00 0.25012724 Up Muhal Bhanara Naggar 0.08 0.07 0.11 0.22 1.00 0.11012725 Up Muhal Chhalala Naggar 0.29 0.20 0.35 0.12 1.00 0.30012726 Up Muhal Bahanu Naggar 0.22 0.17 0.30 0.11 1.00 0.24012727 Muhal Prini (20/22) Naggar 0.20 0.15 0.26 0.13 1.00 0.21012728 Up Muhal Hamta Naggar 0.16 0.13 0.22 0.12 1.00 0.17012729 Up Muhal Hamta 2/17 Naggar 0.01 0.01 0.01 0.16 1.00 0.00012730 Up Muhal Hamta 1/7 Naggar 0.10 0.08 0.15 0.12 1.00 0.10012731 Up Muhal Shuru Naggar 0.21 0.16 0.28 0.11 1.00 0.22012732 Up Muhal Jamari Naggar 0.19 0.14 0.25 0.12 1.00 0.20012733 Hallan-I (24/42) Naggar 0.49 0.33 0.54 0.38 1.00 0.61012734 Up Muhal Rangri Naggar 0.50 0.34 0.55 0.41 1.00 0.63012735 Up Muhal chaki Naggar 0.51 0.34 0.55 0.35 1.00 0.61012736 Up Muhal Sarsai Naggar 0.49 0.33 0.53 0.41 1.00 0.61
Climate Change Vulnerability Assessment Report 111
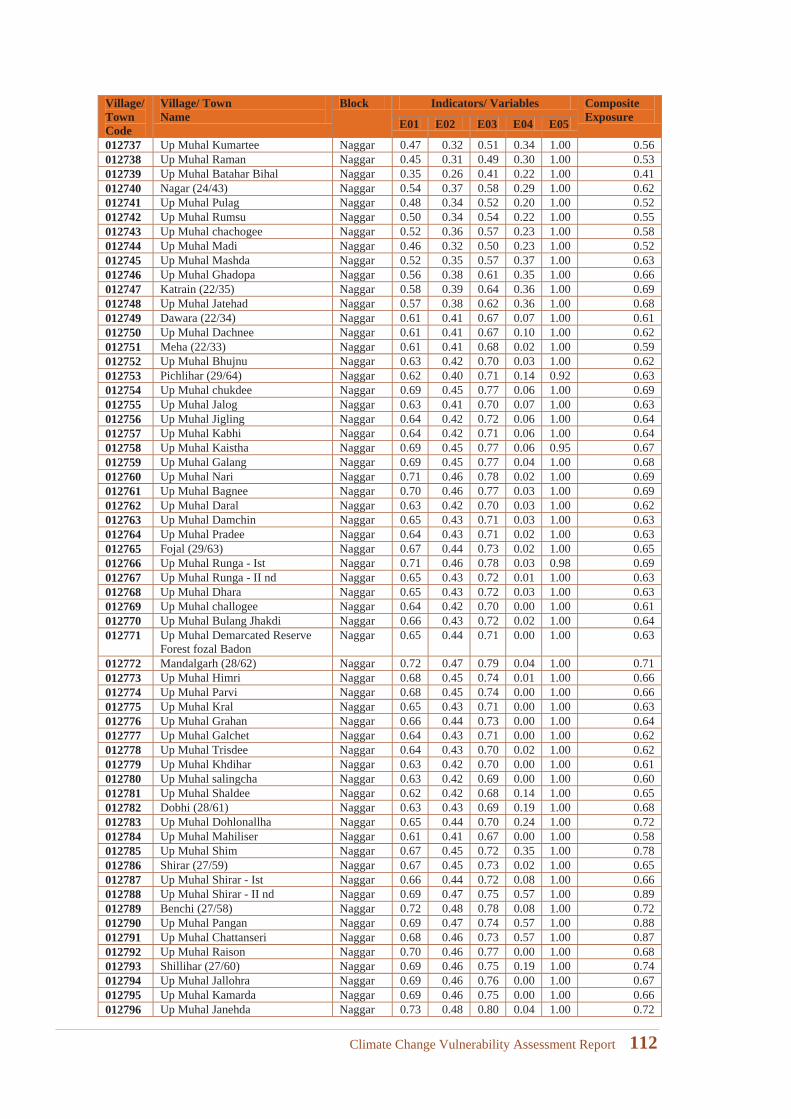
Village/TownCode
Village/ TownName
Block Indicators/ Variables Composite ExposureE01 E02 E03 E04 E05
012737 Up Muhal Kumartee Naggar 0.47 0.32 0.51 0.34 1.00 0.56012738 Up Muhal Raman Naggar 0.45 0.31 0.49 0.30 1.00 0.53012739 Up Muhal Batahar Bihal Naggar 0.35 0.26 0.41 0.22 1.00 0.41012740 Nagar (24/43) Naggar 0.54 0.37 0.58 0.29 1.00 0.62012741 Up Muhal Pulag Naggar 0.48 0.34 0.52 0.20 1.00 0.52012742 Up Muhal Rumsu Naggar 0.50 0.34 0.54 0.22 1.00 0.55012743 Up Muhal chachogee Naggar 0.52 0.36 0.57 0.23 1.00 0.58012744 Up Muhal Madi Naggar 0.46 0.32 0.50 0.23 1.00 0.52012745 Up Muhal Mashda Naggar 0.52 0.35 0.57 0.37 1.00 0.63012746 Up Muhal Ghadopa Naggar 0.56 0.38 0.61 0.35 1.00 0.66012747 Katrain (22/35) Naggar 0.58 0.39 0.64 0.36 1.00 0.69012748 Up Muhal Jatehad Naggar 0.57 0.38 0.62 0.36 1.00 0.68012749 Dawara (22/34) Naggar 0.61 0.41 0.67 0.07 1.00 0.61012750 Up Muhal Dachnee Naggar 0.61 0.41 0.67 0.10 1.00 0.62012751 Meha (22/33) Naggar 0.61 0.41 0.68 0.02 1.00 0.59012752 Up Muhal Bhujnu Naggar 0.63 0.42 0.70 0.03 1.00 0.62012753 Pichlihar (29/64) Naggar 0.62 0.40 0.71 0.14 0.92 0.63012754 Up Muhal chukdee Naggar 0.69 0.45 0.77 0.06 1.00 0.69012755 Up Muhal Jalog Naggar 0.63 0.41 0.70 0.07 1.00 0.63012756 Up Muhal Jigling Naggar 0.64 0.42 0.72 0.06 1.00 0.64012757 Up Muhal Kabhi Naggar 0.64 0.42 0.71 0.06 1.00 0.64012758 Up Muhal Kaistha Naggar 0.69 0.45 0.77 0.06 0.95 0.67012759 Up Muhal Galang Naggar 0.69 0.45 0.77 0.04 1.00 0.68012760 Up Muhal Nari Naggar 0.71 0.46 0.78 0.02 1.00 0.69012761 Up Muhal Bagnee Naggar 0.70 0.46 0.77 0.03 1.00 0.69012762 Up Muhal Daral Naggar 0.63 0.42 0.70 0.03 1.00 0.62012763 Up Muhal Damchin Naggar 0.65 0.43 0.71 0.03 1.00 0.63012764 Up Muhal Pradee Naggar 0.64 0.43 0.71 0.02 1.00 0.63012765 Fojal (29/63) Naggar 0.67 0.44 0.73 0.02 1.00 0.65012766 Up Muhal Runga - Ist Naggar 0.71 0.46 0.78 0.03 0.98 0.69012767 Up Muhal Runga - II nd Naggar 0.65 0.43 0.72 0.01 1.00 0.63012768 Up Muhal Dhara Naggar 0.65 0.43 0.72 0.03 1.00 0.63012769 Up Muhal challogee Naggar 0.64 0.42 0.70 0.00 1.00 0.61012770 Up Muhal Bulang Jhakdi Naggar 0.66 0.43 0.72 0.02 1.00 0.64012771 Up Muhal Demarcated Reserve
Forest fozal BadonNaggar 0.65 0.44 0.71 0.00 1.00 0.63
012772 Mandalgarh (28/62) Naggar 0.72 0.47 0.79 0.04 1.00 0.71012773 Up Muhal Himri Naggar 0.68 0.45 0.74 0.01 1.00 0.66012774 Up Muhal Parvi Naggar 0.68 0.45 0.74 0.00 1.00 0.66012775 Up Muhal Kral Naggar 0.65 0.43 0.71 0.00 1.00 0.63012776 Up Muhal Grahan Naggar 0.66 0.44 0.73 0.00 1.00 0.64012777 Up Muhal Galchet Naggar 0.64 0.43 0.71 0.00 1.00 0.62012778 Up Muhal Trisdee Naggar 0.64 0.43 0.70 0.02 1.00 0.62012779 Up Muhal Khdihar Naggar 0.63 0.42 0.70 0.00 1.00 0.61012780 Up Muhal salingcha Naggar 0.63 0.42 0.69 0.00 1.00 0.60012781 Up Muhal Shaldee Naggar 0.62 0.42 0.68 0.14 1.00 0.65012782 Dobhi (28/61) Naggar 0.63 0.43 0.69 0.19 1.00 0.68012783 Up Muhal Dohlonallha Naggar 0.65 0.44 0.70 0.24 1.00 0.72012784 Up Muhal Mahiliser Naggar 0.61 0.41 0.67 0.00 1.00 0.58012785 Up Muhal Shim Naggar 0.67 0.45 0.72 0.35 1.00 0.78012786 Shirar (27/59) Naggar 0.67 0.45 0.73 0.02 1.00 0.65012787 Up Muhal Shirar - Ist Naggar 0.66 0.44 0.72 0.08 1.00 0.66012788 Up Muhal Shirar - II nd Naggar 0.69 0.47 0.75 0.57 1.00 0.89012789 Benchi (27/58) Naggar 0.72 0.48 0.78 0.08 1.00 0.72012790 Up Muhal Pangan Naggar 0.69 0.47 0.74 0.57 1.00 0.88012791 Up Muhal Chattanseri Naggar 0.68 0.46 0.73 0.57 1.00 0.87012792 Up Muhal Raison Naggar 0.70 0.46 0.77 0.00 1.00 0.68012793 Shillihar (27/60) Naggar 0.69 0.46 0.75 0.19 1.00 0.74012794 Up Muhal Jallohra Naggar 0.69 0.46 0.76 0.00 1.00 0.67012795 Up Muhal Kamarda Naggar 0.69 0.46 0.75 0.00 1.00 0.66012796 Up Muhal Janehda Naggar 0.73 0.48 0.80 0.04 1.00 0.72
Climate Change Vulnerability Assessment Report 112
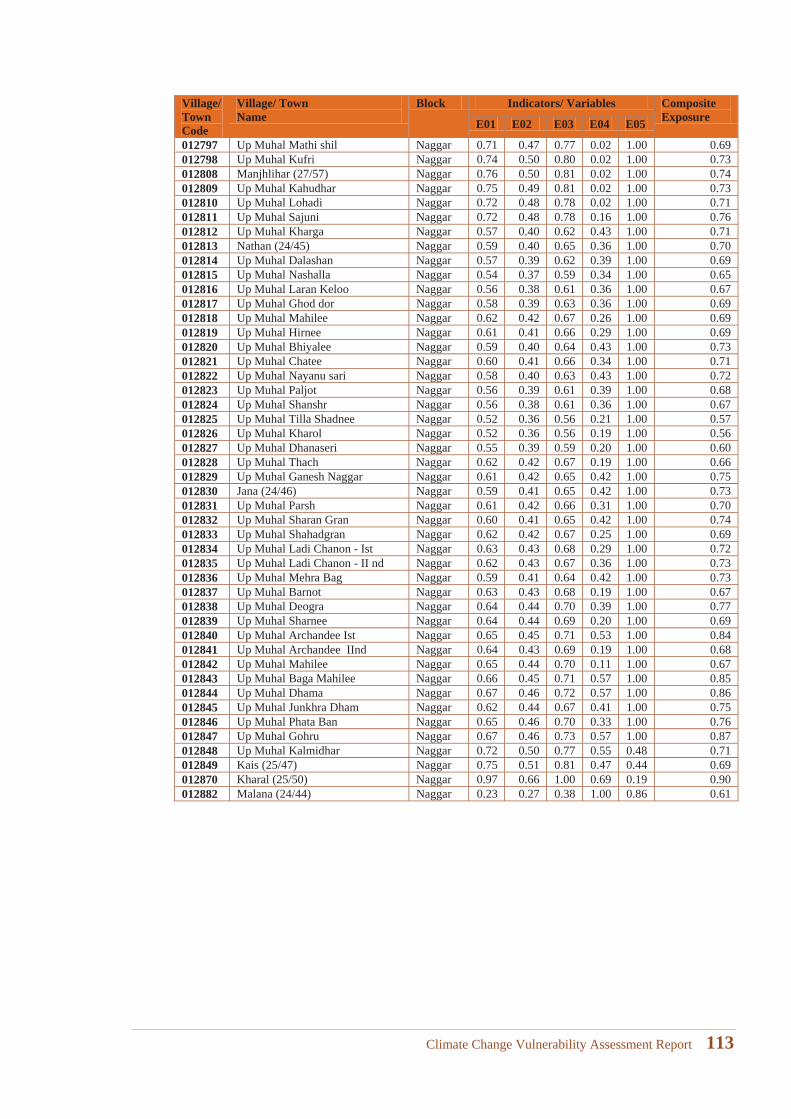
Village/TownCode
Village/ TownName
Block Indicators/ Variables Composite ExposureE01 E02 E03 E04 E05
012797 Up Muhal Mathi shil Naggar 0.71 0.47 0.77 0.02 1.00 0.69012798 Up Muhal Kufri Naggar 0.74 0.50 0.80 0.02 1.00 0.73012808 Manjhlihar (27/57) Naggar 0.76 0.50 0.81 0.02 1.00 0.74012809 Up Muhal Kahudhar Naggar 0.75 0.49 0.81 0.02 1.00 0.73012810 Up Muhal Lohadi Naggar 0.72 0.48 0.78 0.02 1.00 0.71012811 Up Muhal Sajuni Naggar 0.72 0.48 0.78 0.16 1.00 0.76012812 Up Muhal Kharga Naggar 0.57 0.40 0.62 0.43 1.00 0.71012813 Nathan (24/45) Naggar 0.59 0.40 0.65 0.36 1.00 0.70012814 Up Muhal Dalashan Naggar 0.57 0.39 0.62 0.39 1.00 0.69012815 Up Muhal Nashalla Naggar 0.54 0.37 0.59 0.34 1.00 0.65012816 Up Muhal Laran Keloo Naggar 0.56 0.38 0.61 0.36 1.00 0.67012817 Up Muhal Ghod dor Naggar 0.58 0.39 0.63 0.36 1.00 0.69012818 Up Muhal Mahilee Naggar 0.62 0.42 0.67 0.26 1.00 0.69012819 Up Muhal Hirnee Naggar 0.61 0.41 0.66 0.29 1.00 0.69012820 Up Muhal Bhiyalee Naggar 0.59 0.40 0.64 0.43 1.00 0.73012821 Up Muhal Chatee Naggar 0.60 0.41 0.66 0.34 1.00 0.71012822 Up Muhal Nayanu sari Naggar 0.58 0.40 0.63 0.43 1.00 0.72012823 Up Muhal Paljot Naggar 0.56 0.39 0.61 0.39 1.00 0.68012824 Up Muhal Shanshr Naggar 0.56 0.38 0.61 0.36 1.00 0.67012825 Up Muhal Tilla Shadnee Naggar 0.52 0.36 0.56 0.21 1.00 0.57012826 Up Muhal Kharol Naggar 0.52 0.36 0.56 0.19 1.00 0.56012827 Up Muhal Dhanaseri Naggar 0.55 0.39 0.59 0.20 1.00 0.60012828 Up Muhal Thach Naggar 0.62 0.42 0.67 0.19 1.00 0.66012829 Up Muhal Ganesh Naggar Naggar 0.61 0.42 0.65 0.42 1.00 0.75012830 Jana (24/46) Naggar 0.59 0.41 0.65 0.42 1.00 0.73012831 Up Muhal Parsh Naggar 0.61 0.42 0.66 0.31 1.00 0.70012832 Up Muhal Sharan Gran Naggar 0.60 0.41 0.65 0.42 1.00 0.74012833 Up Muhal Shahadgran Naggar 0.62 0.42 0.67 0.25 1.00 0.69012834 Up Muhal Ladi Chanon - Ist Naggar 0.63 0.43 0.68 0.29 1.00 0.72012835 Up Muhal Ladi Chanon - II nd Naggar 0.62 0.43 0.67 0.36 1.00 0.73012836 Up Muhal Mehra Bag Naggar 0.59 0.41 0.64 0.42 1.00 0.73012837 Up Muhal Barnot Naggar 0.63 0.43 0.68 0.19 1.00 0.67012838 Up Muhal Deogra Naggar 0.64 0.44 0.70 0.39 1.00 0.77012839 Up Muhal Sharnee Naggar 0.64 0.44 0.69 0.20 1.00 0.69012840 Up Muhal Archandee Ist Naggar 0.65 0.45 0.71 0.53 1.00 0.84012841 Up Muhal Archandee IInd Naggar 0.64 0.43 0.69 0.19 1.00 0.68012842 Up Muhal Mahilee Naggar 0.65 0.44 0.70 0.11 1.00 0.67012843 Up Muhal Baga Mahilee Naggar 0.66 0.45 0.71 0.57 1.00 0.85012844 Up Muhal Dhama Naggar 0.67 0.46 0.72 0.57 1.00 0.86012845 Up Muhal Junkhra Dham Naggar 0.62 0.44 0.67 0.41 1.00 0.75012846 Up Muhal Phata Ban Naggar 0.65 0.46 0.70 0.33 1.00 0.76012847 Up Muhal Gohru Naggar 0.67 0.46 0.73 0.57 1.00 0.87012848 Up Muhal Kalmidhar Naggar 0.72 0.50 0.77 0.55 0.48 0.71012849 Kais (25/47) Naggar 0.75 0.51 0.81 0.47 0.44 0.69012870 Kharal (25/50) Naggar 0.97 0.66 1.00 0.69 0.19 0.90012882 Malana (24/44) Naggar 0.23 0.27 0.38 1.00 0.86 0.61
Climate Change Vulnerability Assessment Report 113
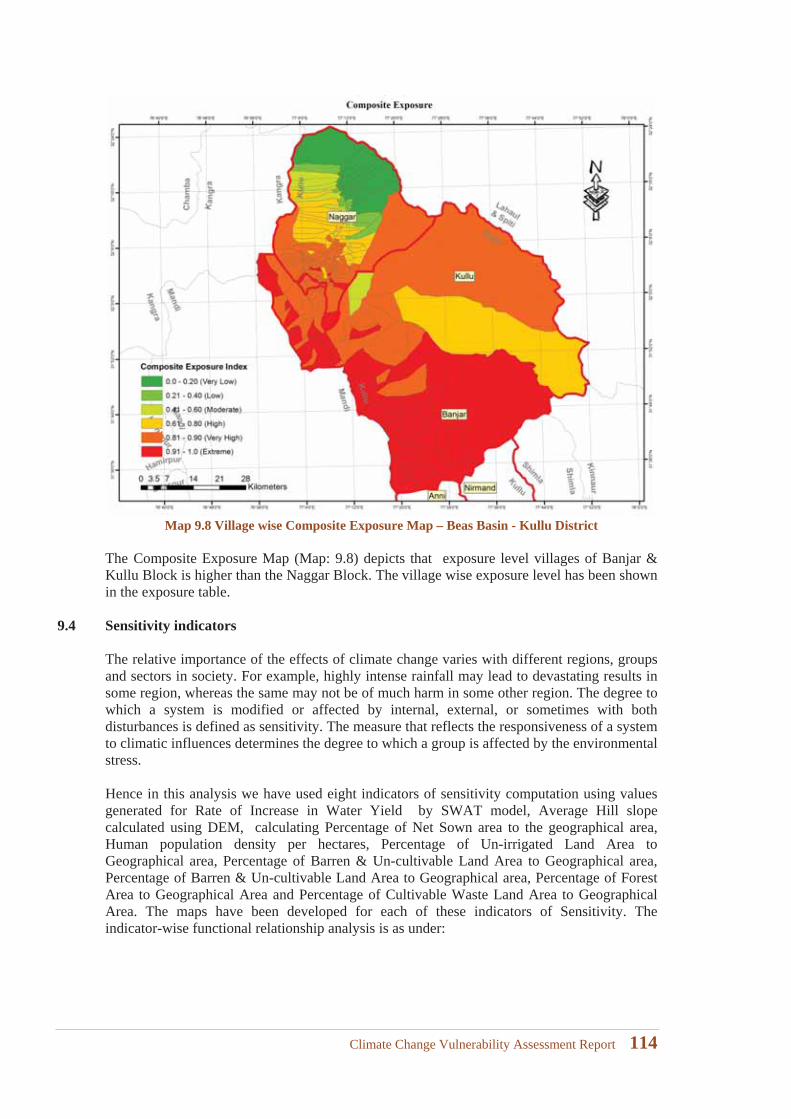
Map 9.8 Village wise Composite Exposure Map – Beas Basin - Kullu District
The Composite Exposure Map (Map: 9.8) depicts that exposure level villages of Banjar & Kullu Block is higher than the Naggar Block. The village wise exposure level has been shown in the exposure table.
9.4 Sensitivity indicators
The relative importance of the effects of climate change varies with different regions, groups and sectors in society. For example, highly intense rainfall may lead to devastating results in some region, whereas the same may not be of much harm in some other region. The degree to which a system is modified or affected by internal, external, or sometimes with both disturbances is defined as sensitivity. The measure that reflects the responsiveness of a system to climatic influences determines the degree to which a group is affected by the environmental stress.
Hence in this analysis we have used eight indicators of sensitivity computation using valuesgenerated for Rate of Increase in Water Yield by SWAT model, Average Hill slope calculated using DEM, calculating Percentage of Net Sown area to the geographical area, Human population density per hectares, Percentage of Un-irrigated Land Area to Geographical area, Percentage of Barren & Un-cultivable Land Area to Geographical area, Percentage of Barren & Un-cultivable Land Area to Geographical area, Percentage of Forest Area to Geographical Area and Percentage of Cultivable Waste Land Area to Geographical Area. The maps have been developed for each of these indicators of Sensitivity. The indicator-wise functional relationship analysis is as under:
Climate Change Vulnerability Assessment Report 114
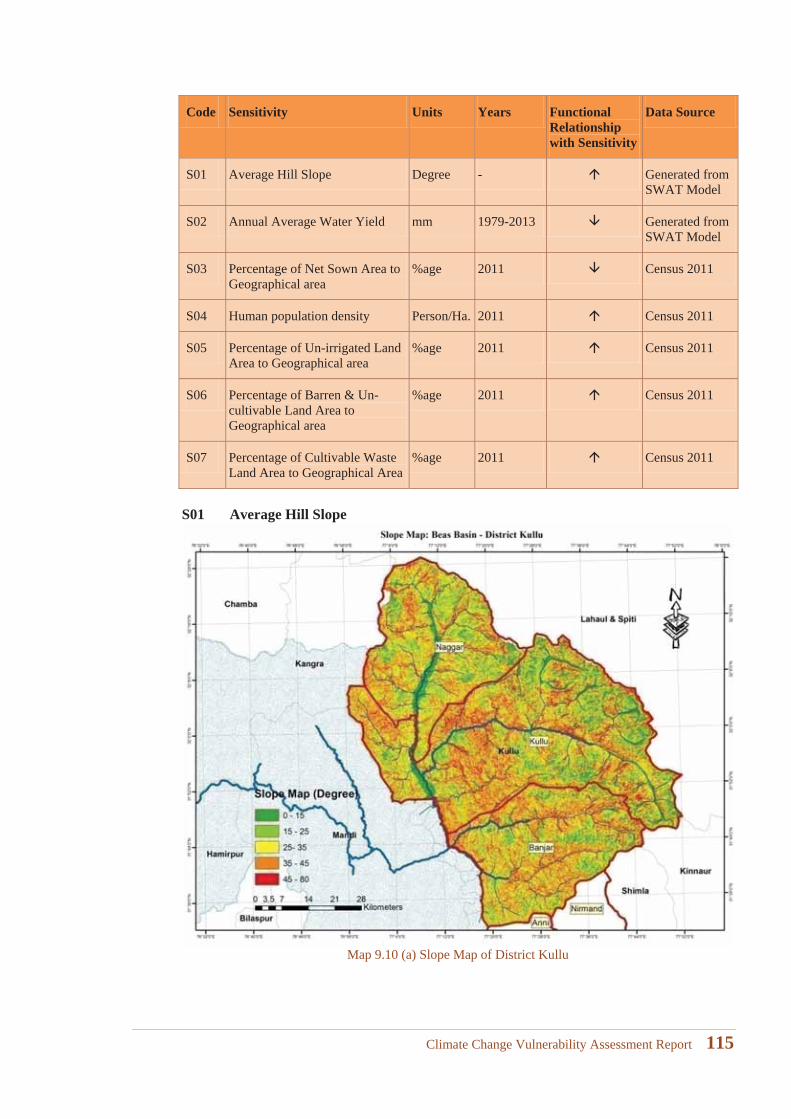
Code Sensitivity Units Years Functional Relationship with Sensitivity
Data Source
S01 Average Hill Slope Degree - Generated from SWAT Model
S02 Annual Average Water Yield mm 1979-2013 Generated from SWAT Model
S03 Percentage of Net Sown Area to Geographical area
%age 2011 Census 2011
S04 Human population density Person/Ha. 2011 Census 2011
S05 Percentage of Un-irrigated Land Area to Geographical area
%age 2011 Census 2011
S06 Percentage of Barren & Un-cultivable Land Area to Geographical area
%age 2011 Census 2011
S07 Percentage of Cultivable Waste Land Area to Geographical Area
%age 2011 Census 2011
S01 Average Hill Slope
Map 9.10 (a) Slope Map of District Kullu
Climate Change Vulnerability Assessment Report 115
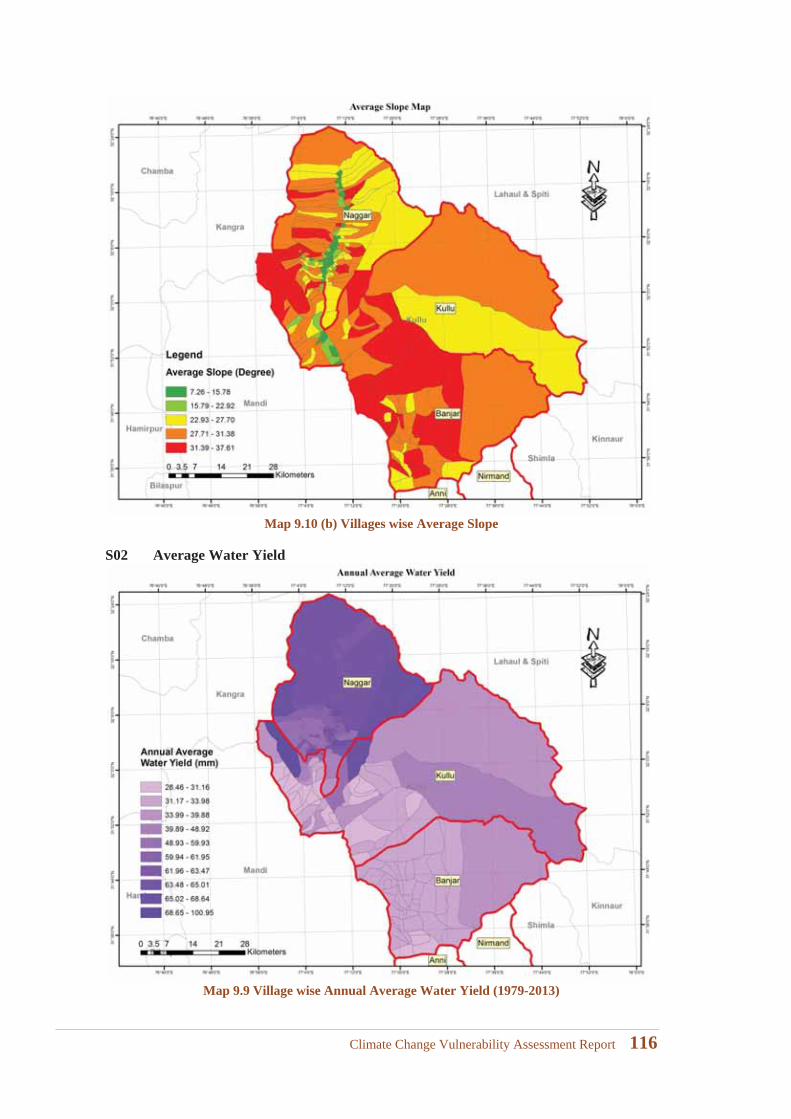
Map 9.10 (b) Villages wise Average Slope
S02 Average Water Yield
Map 9.9 Village wise Annual Average Water Yield (1979-2013)
Climate Change Vulnerability Assessment Report 116
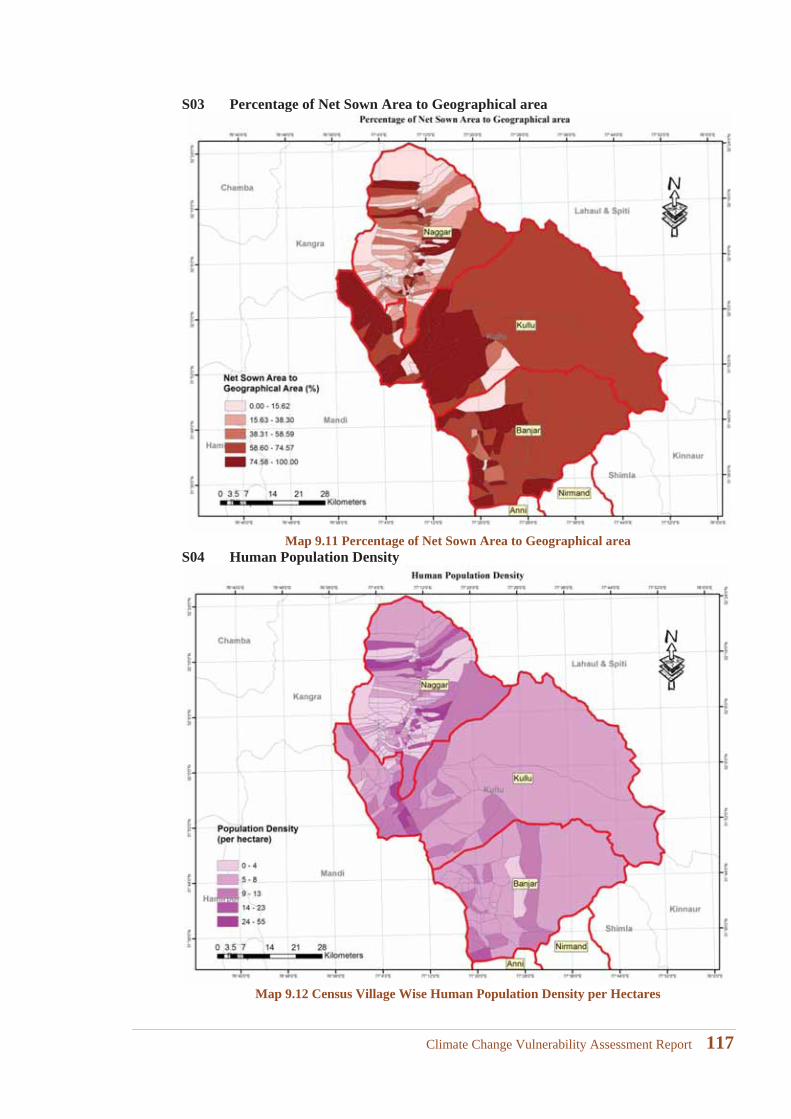
S03 Percentage of Net Sown Area to Geographical area
Map 9.11 Percentage of Net Sown Area to Geographical areaS04 Human Population Density
Map 9.12 Census Village Wise Human Population Density per Hectares
Climate Change Vulnerability Assessment Report 117
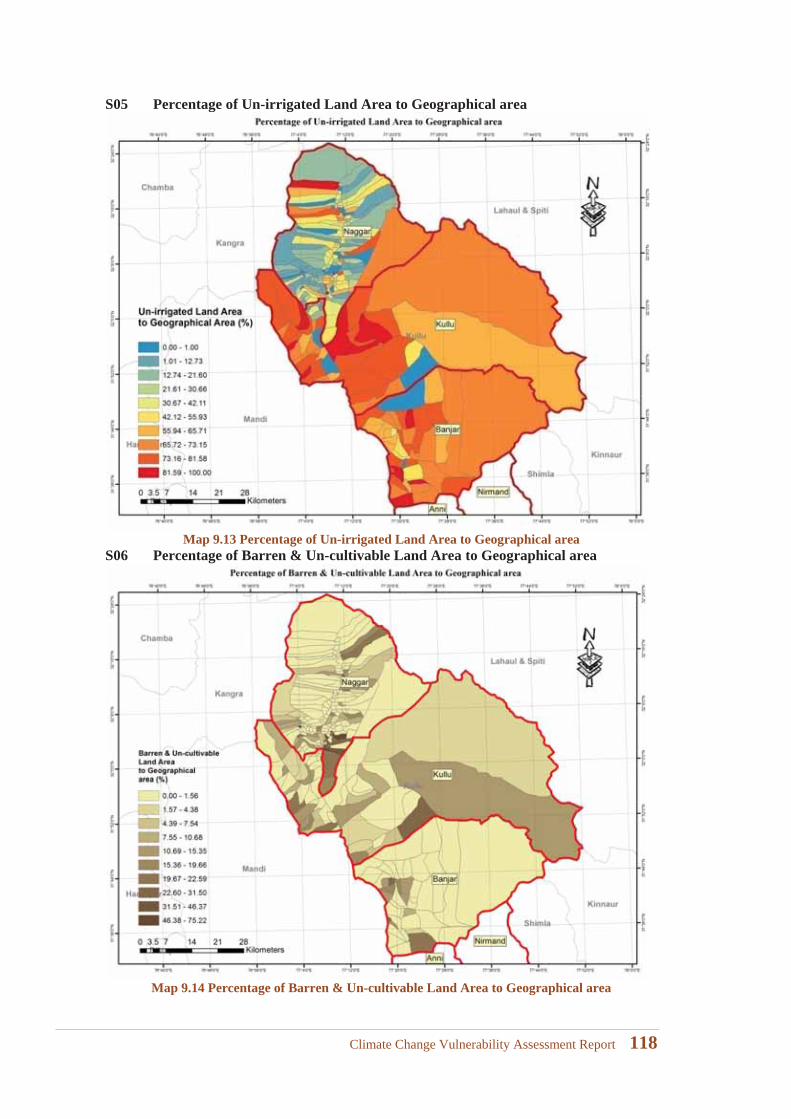
S05 Percentage of Un-irrigated Land Area to Geographical area
Map 9.13 Percentage of Un-irrigated Land Area to Geographical areaS06 Percentage of Barren & Un-cultivable Land Area to Geographical area
Map 9.14 Percentage of Barren & Un-cultivable Land Area to Geographical area
Climate Change Vulnerability Assessment Report 118
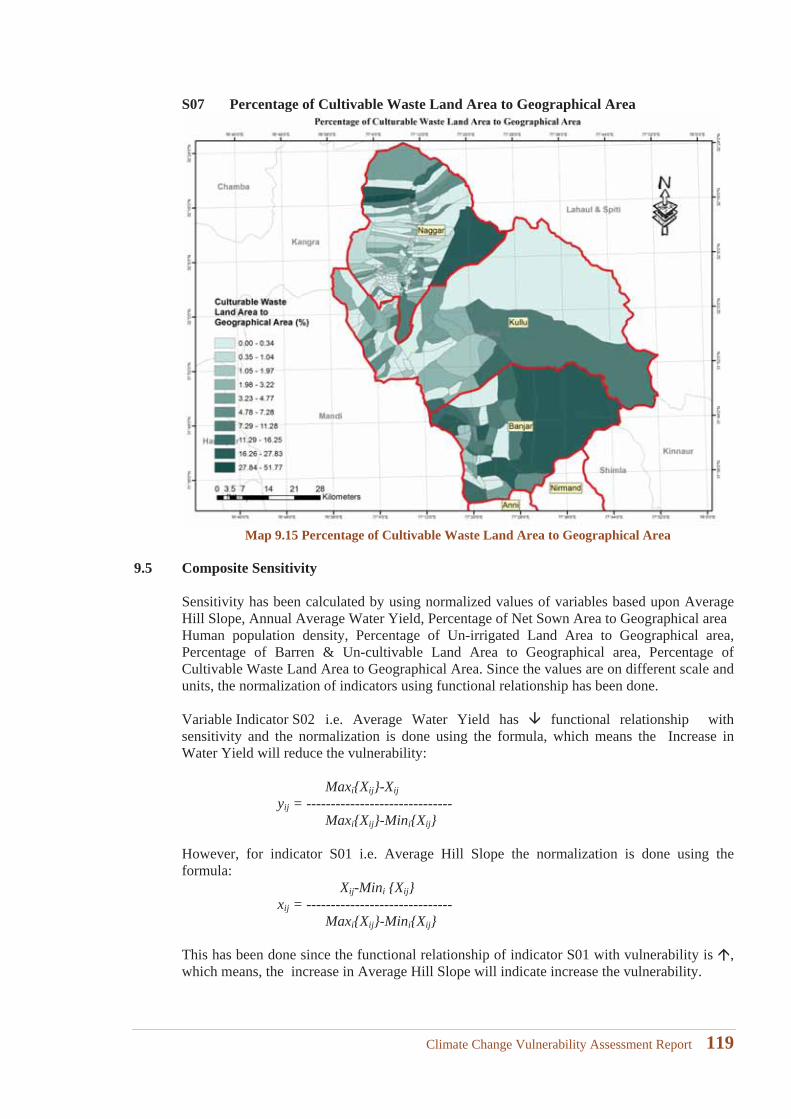
S07 Percentage of Cultivable Waste Land Area to Geographical Area
Map 9.15 Percentage of Cultivable Waste Land Area to Geographical Area
9.5 Composite Sensitivity
Sensitivity has been calculated by using normalized values of variables based upon Average Hill Slope, Annual Average Water Yield, Percentage of Net Sown Area to Geographical areaHuman population density, Percentage of Un-irrigated Land Area to Geographical area,Percentage of Barren & Un-cultivable Land Area to Geographical area, Percentage of Cultivable Waste Land Area to Geographical Area. Since the values are on different scale and units, the normalization of indicators using functional relationship has been done.
Variable Indicator S02 i.e. Average Water Yield has functional relationship with sensitivity and the normalization is done using the formula, which means the Increase in Water Yield will reduce the vulnerability:
Maxi{Xij}-Xijyij = ------------------------------
Maxi{Xij}-Mini{Xij}
However, for indicator S01 i.e. Average Hill Slope the normalization is done using the formula:
Xij-Mini {Xij}xij = ------------------------------
Maxi{Xij}-Mini{Xij}
This has been done since the functional relationship of indicator S01 with vulnerability is ,which means, the increase in Average Hill Slope will indicate increase the vulnerability.
Climate Change Vulnerability Assessment Report 119
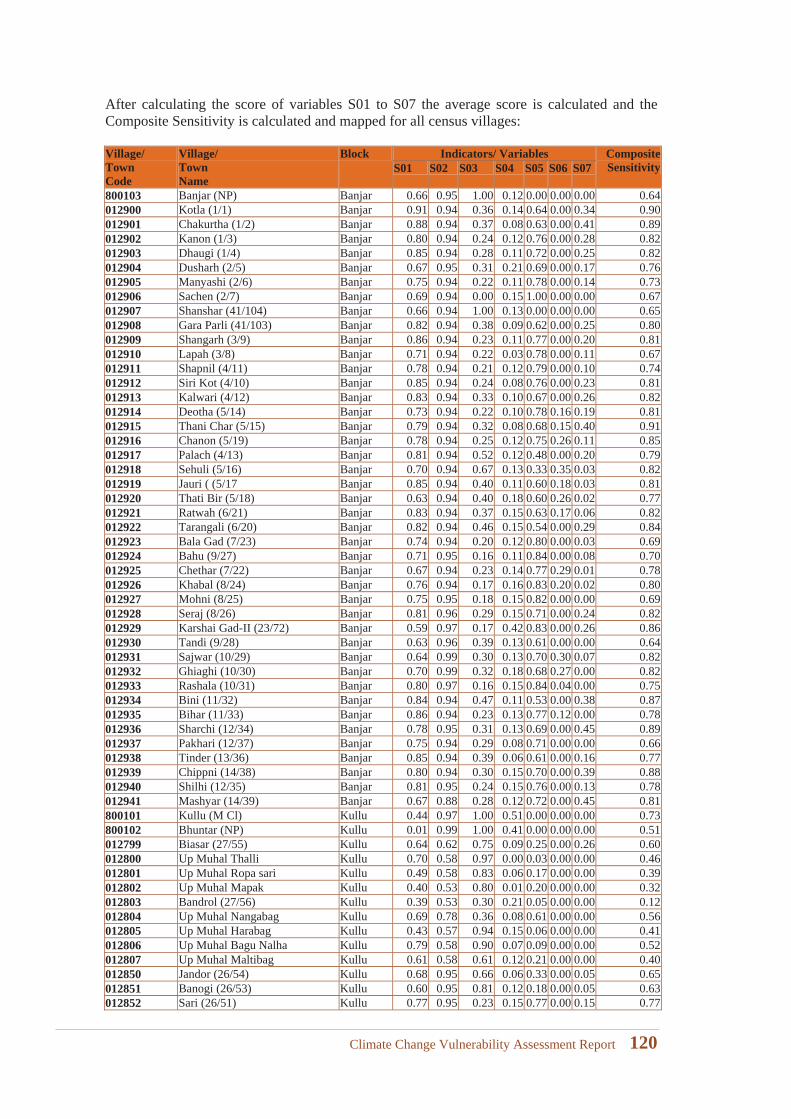
After calculating the score of variables S01 to S07 the average score is calculated and the Composite Sensitivity is calculated and mapped for all census villages:
Village/TownCode
Village/TownName
Block Indicators/ Variables Composite SensitivityS01 S02 S03 S04 S05 S06 S07
800103 Banjar (NP) Banjar 0.66 0.95 1.00 0.12 0.00 0.00 0.00 0.64012900 Kotla (1/1) Banjar 0.91 0.94 0.36 0.14 0.64 0.00 0.34 0.90012901 Chakurtha (1/2) Banjar 0.88 0.94 0.37 0.08 0.63 0.00 0.41 0.89012902 Kanon (1/3) Banjar 0.80 0.94 0.24 0.12 0.76 0.00 0.28 0.82012903 Dhaugi (1/4) Banjar 0.85 0.94 0.28 0.11 0.72 0.00 0.25 0.82012904 Dusharh (2/5) Banjar 0.67 0.95 0.31 0.21 0.69 0.00 0.17 0.76012905 Manyashi (2/6) Banjar 0.75 0.94 0.22 0.11 0.78 0.00 0.14 0.73012906 Sachen (2/7) Banjar 0.69 0.94 0.00 0.15 1.00 0.00 0.00 0.67012907 Shanshar (41/104) Banjar 0.66 0.94 1.00 0.13 0.00 0.00 0.00 0.65012908 Gara Parli (41/103) Banjar 0.82 0.94 0.38 0.09 0.62 0.00 0.25 0.80012909 Shangarh (3/9) Banjar 0.86 0.94 0.23 0.11 0.77 0.00 0.20 0.81012910 Lapah (3/8) Banjar 0.71 0.94 0.22 0.03 0.78 0.00 0.11 0.67012911 Shapnil (4/11) Banjar 0.78 0.94 0.21 0.12 0.79 0.00 0.10 0.74012912 Siri Kot (4/10) Banjar 0.85 0.94 0.24 0.08 0.76 0.00 0.23 0.81012913 Kalwari (4/12) Banjar 0.83 0.94 0.33 0.10 0.67 0.00 0.26 0.82012914 Deotha (5/14) Banjar 0.73 0.94 0.22 0.10 0.78 0.16 0.19 0.81012915 Thani Char (5/15) Banjar 0.79 0.94 0.32 0.08 0.68 0.15 0.40 0.91012916 Chanon (5/19) Banjar 0.78 0.94 0.25 0.12 0.75 0.26 0.11 0.85012917 Palach (4/13) Banjar 0.81 0.94 0.52 0.12 0.48 0.00 0.20 0.79012918 Sehuli (5/16) Banjar 0.70 0.94 0.67 0.13 0.33 0.35 0.03 0.82012919 Jauri ( (5/17 Banjar 0.85 0.94 0.40 0.11 0.60 0.18 0.03 0.81012920 Thati Bir (5/18) Banjar 0.63 0.94 0.40 0.18 0.60 0.26 0.02 0.77012921 Ratwah (6/21) Banjar 0.83 0.94 0.37 0.15 0.63 0.17 0.06 0.82012922 Tarangali (6/20) Banjar 0.82 0.94 0.46 0.15 0.54 0.00 0.29 0.84012923 Bala Gad (7/23) Banjar 0.74 0.94 0.20 0.12 0.80 0.00 0.03 0.69012924 Bahu (9/27) Banjar 0.71 0.95 0.16 0.11 0.84 0.00 0.08 0.70012925 Chethar (7/22) Banjar 0.67 0.94 0.23 0.14 0.77 0.29 0.01 0.78012926 Khabal (8/24) Banjar 0.76 0.94 0.17 0.16 0.83 0.20 0.02 0.80012927 Mohni (8/25) Banjar 0.75 0.95 0.18 0.15 0.82 0.00 0.00 0.69012928 Seraj (8/26) Banjar 0.81 0.96 0.29 0.15 0.71 0.00 0.24 0.82012929 Karshai Gad-II (23/72) Banjar 0.59 0.97 0.17 0.42 0.83 0.00 0.26 0.86012930 Tandi (9/28) Banjar 0.63 0.96 0.39 0.13 0.61 0.00 0.00 0.64012931 Sajwar (10/29) Banjar 0.64 0.99 0.30 0.13 0.70 0.30 0.07 0.82012932 Ghiaghi (10/30) Banjar 0.70 0.99 0.32 0.18 0.68 0.27 0.00 0.82012933 Rashala (10/31) Banjar 0.80 0.97 0.16 0.15 0.84 0.04 0.00 0.75012934 Bini (11/32) Banjar 0.84 0.94 0.47 0.11 0.53 0.00 0.38 0.87012935 Bihar (11/33) Banjar 0.86 0.94 0.23 0.13 0.77 0.12 0.00 0.78012936 Sharchi (12/34) Banjar 0.78 0.95 0.31 0.13 0.69 0.00 0.45 0.89012937 Pakhari (12/37) Banjar 0.75 0.94 0.29 0.08 0.71 0.00 0.00 0.66012938 Tinder (13/36) Banjar 0.85 0.94 0.39 0.06 0.61 0.00 0.16 0.77012939 Chippni (14/38) Banjar 0.80 0.94 0.30 0.15 0.70 0.00 0.39 0.88012940 Shilhi (12/35) Banjar 0.81 0.95 0.24 0.15 0.76 0.00 0.13 0.78012941 Mashyar (14/39) Banjar 0.67 0.88 0.28 0.12 0.72 0.00 0.45 0.81800101 Kullu (M Cl) Kullu 0.44 0.97 1.00 0.51 0.00 0.00 0.00 0.73800102 Bhuntar (NP) Kullu 0.01 0.99 1.00 0.41 0.00 0.00 0.00 0.51012799 Biasar (27/55) Kullu 0.64 0.62 0.75 0.09 0.25 0.00 0.26 0.60012800 Up Muhal Thalli Kullu 0.70 0.58 0.97 0.00 0.03 0.00 0.00 0.46012801 Up Muhal Ropa sari Kullu 0.49 0.58 0.83 0.06 0.17 0.00 0.00 0.39012802 Up Muhal Mapak Kullu 0.40 0.53 0.80 0.01 0.20 0.00 0.00 0.32012803 Bandrol (27/56) Kullu 0.39 0.53 0.30 0.21 0.05 0.00 0.00 0.12012804 Up Muhal Nangabag Kullu 0.69 0.78 0.36 0.08 0.61 0.00 0.00 0.56012805 Up Muhal Harabag Kullu 0.43 0.57 0.94 0.15 0.06 0.00 0.00 0.41012806 Up Muhal Bagu Nalha Kullu 0.79 0.58 0.90 0.07 0.09 0.00 0.00 0.52012807 Up Muhal Maltibag Kullu 0.61 0.58 0.61 0.12 0.21 0.00 0.00 0.40012850 Jandor (26/54) Kullu 0.68 0.95 0.66 0.06 0.33 0.00 0.05 0.65012851 Banogi (26/53) Kullu 0.60 0.95 0.81 0.12 0.18 0.00 0.05 0.63012852 Sari (26/51) Kullu 0.77 0.95 0.23 0.15 0.77 0.00 0.15 0.77
Climate Change Vulnerability Assessment Report 120
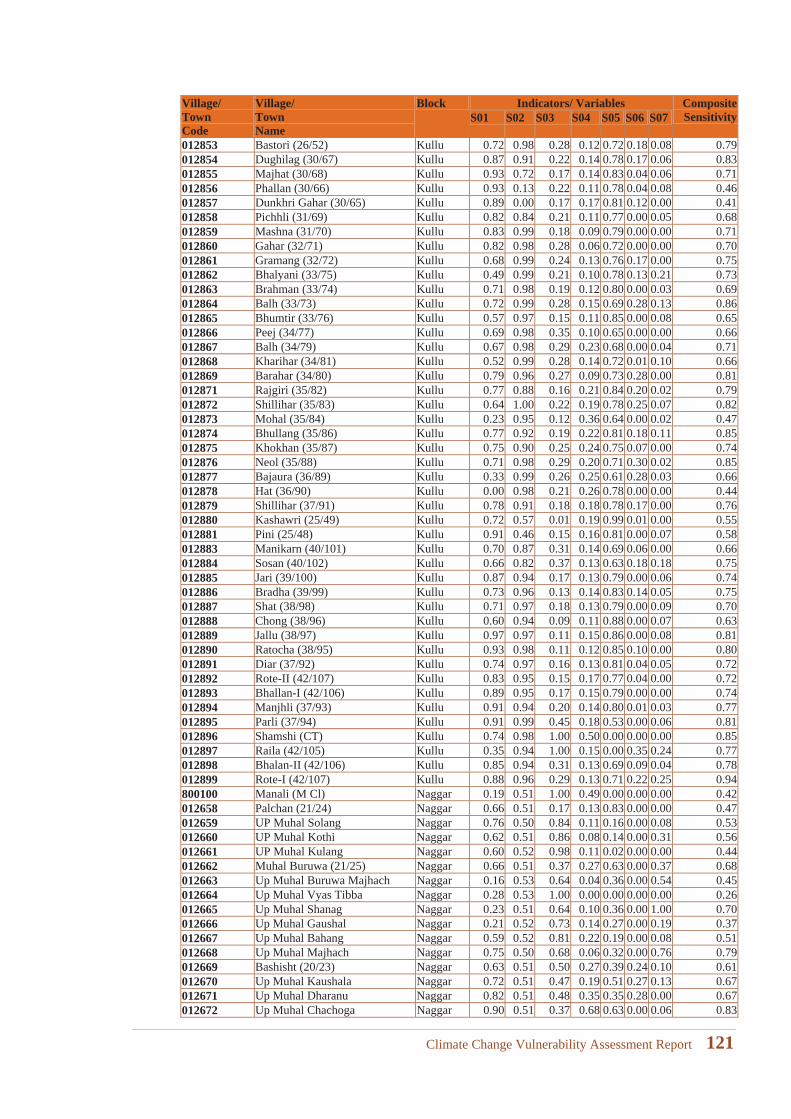
Village/TownCode
Village/TownName
Block Indicators/ Variables Composite SensitivityS01 S02 S03 S04 S05 S06 S07
012853 Bastori (26/52) Kullu 0.72 0.98 0.28 0.12 0.72 0.18 0.08 0.79012854 Dughilag (30/67) Kullu 0.87 0.91 0.22 0.14 0.78 0.17 0.06 0.83012855 Majhat (30/68) Kullu 0.93 0.72 0.17 0.14 0.83 0.04 0.06 0.71012856 Phallan (30/66) Kullu 0.93 0.13 0.22 0.11 0.78 0.04 0.08 0.46012857 Dunkhri Gahar (30/65) Kullu 0.89 0.00 0.17 0.17 0.81 0.12 0.00 0.41012858 Pichhli (31/69) Kullu 0.82 0.84 0.21 0.11 0.77 0.00 0.05 0.68012859 Mashna (31/70) Kullu 0.83 0.99 0.18 0.09 0.79 0.00 0.00 0.71012860 Gahar (32/71) Kullu 0.82 0.98 0.28 0.06 0.72 0.00 0.00 0.70012861 Gramang (32/72) Kullu 0.68 0.99 0.24 0.13 0.76 0.17 0.00 0.75012862 Bhalyani (33/75) Kullu 0.49 0.99 0.21 0.10 0.78 0.13 0.21 0.73012863 Brahman (33/74) Kullu 0.71 0.98 0.19 0.12 0.80 0.00 0.03 0.69012864 Balh (33/73) Kullu 0.72 0.99 0.28 0.15 0.69 0.28 0.13 0.86012865 Bhumtir (33/76) Kullu 0.57 0.97 0.15 0.11 0.85 0.00 0.08 0.65012866 Peej (34/77) Kullu 0.69 0.98 0.35 0.10 0.65 0.00 0.00 0.66012867 Balh (34/79) Kullu 0.67 0.98 0.29 0.23 0.68 0.00 0.04 0.71012868 Kharihar (34/81) Kullu 0.52 0.99 0.28 0.14 0.72 0.01 0.10 0.66012869 Barahar (34/80) Kullu 0.79 0.96 0.27 0.09 0.73 0.28 0.00 0.81012871 Rajgiri (35/82) Kullu 0.77 0.88 0.16 0.21 0.84 0.20 0.02 0.79012872 Shillihar (35/83) Kullu 0.64 1.00 0.22 0.19 0.78 0.25 0.07 0.82012873 Mohal (35/84) Kullu 0.23 0.95 0.12 0.36 0.64 0.00 0.02 0.47012874 Bhullang (35/86) Kullu 0.77 0.92 0.19 0.22 0.81 0.18 0.11 0.85012875 Khokhan (35/87) Kullu 0.75 0.90 0.25 0.24 0.75 0.07 0.00 0.74012876 Neol (35/88) Kullu 0.71 0.98 0.29 0.20 0.71 0.30 0.02 0.85012877 Bajaura (36/89) Kullu 0.33 0.99 0.26 0.25 0.61 0.28 0.03 0.66012878 Hat (36/90) Kullu 0.00 0.98 0.21 0.26 0.78 0.00 0.00 0.44012879 Shillihar (37/91) Kullu 0.78 0.91 0.18 0.18 0.78 0.17 0.00 0.76012880 Kashawri (25/49) Kullu 0.72 0.57 0.01 0.19 0.99 0.01 0.00 0.55012881 Pini (25/48) Kullu 0.91 0.46 0.15 0.16 0.81 0.00 0.07 0.58012883 Manikarn (40/101) Kullu 0.70 0.87 0.31 0.14 0.69 0.06 0.00 0.66012884 Sosan (40/102) Kullu 0.66 0.82 0.37 0.13 0.63 0.18 0.18 0.75012885 Jari (39/100) Kullu 0.87 0.94 0.17 0.13 0.79 0.00 0.06 0.74012886 Bradha (39/99) Kullu 0.73 0.96 0.13 0.14 0.83 0.14 0.05 0.75012887 Shat (38/98) Kullu 0.71 0.97 0.18 0.13 0.79 0.00 0.09 0.70012888 Chong (38/96) Kullu 0.60 0.94 0.09 0.11 0.88 0.00 0.07 0.63012889 Jallu (38/97) Kullu 0.97 0.97 0.11 0.15 0.86 0.00 0.08 0.81012890 Ratocha (38/95) Kullu 0.93 0.98 0.11 0.12 0.85 0.10 0.00 0.80012891 Diar (37/92) Kullu 0.74 0.97 0.16 0.13 0.81 0.04 0.05 0.72012892 Rote-II (42/107) Kullu 0.83 0.95 0.15 0.17 0.77 0.04 0.00 0.72012893 Bhallan-I (42/106) Kullu 0.89 0.95 0.17 0.15 0.79 0.00 0.00 0.74012894 Manjhli (37/93) Kullu 0.91 0.94 0.20 0.14 0.80 0.01 0.03 0.77012895 Parli (37/94) Kullu 0.91 0.99 0.45 0.18 0.53 0.00 0.06 0.81012896 Shamshi (CT) Kullu 0.74 0.98 1.00 0.50 0.00 0.00 0.00 0.85012897 Raila (42/105) Kullu 0.35 0.94 1.00 0.15 0.00 0.35 0.24 0.77012898 Bhalan-II (42/106) Kullu 0.85 0.94 0.31 0.13 0.69 0.09 0.04 0.78012899 Rote-I (42/107) Kullu 0.88 0.96 0.29 0.13 0.71 0.22 0.25 0.94800100 Manali (M Cl) Naggar 0.19 0.51 1.00 0.49 0.00 0.00 0.00 0.42012658 Palchan (21/24) Naggar 0.66 0.51 0.17 0.13 0.83 0.00 0.00 0.47012659 UP Muhal Solang Naggar 0.76 0.50 0.84 0.11 0.16 0.00 0.08 0.53012660 UP Muhal Kothi Naggar 0.62 0.51 0.86 0.08 0.14 0.00 0.31 0.56012661 UP Muhal Kulang Naggar 0.60 0.52 0.98 0.11 0.02 0.00 0.00 0.44012662 Muhal Buruwa (21/25) Naggar 0.66 0.51 0.37 0.27 0.63 0.00 0.37 0.68012663 Up Muhal Buruwa Majhach Naggar 0.16 0.53 0.64 0.04 0.36 0.00 0.54 0.45012664 Up Muhal Vyas Tibba Naggar 0.28 0.53 1.00 0.00 0.00 0.00 0.00 0.26012665 Up Muhal Shanag Naggar 0.23 0.51 0.64 0.10 0.36 0.00 1.00 0.70012666 Up Muhal Gaushal Naggar 0.21 0.52 0.73 0.14 0.27 0.00 0.19 0.37012667 Up Muhal Bahang Naggar 0.59 0.52 0.81 0.22 0.19 0.00 0.08 0.51012668 Up Muhal Majhach Naggar 0.75 0.50 0.68 0.06 0.32 0.00 0.76 0.79012669 Bashisht (20/23) Naggar 0.63 0.51 0.50 0.27 0.39 0.24 0.10 0.61012670 Up Muhal Kaushala Naggar 0.72 0.51 0.47 0.19 0.51 0.27 0.13 0.67012671 Up Muhal Dharanu Naggar 0.82 0.51 0.48 0.35 0.35 0.28 0.00 0.67012672 Up Muhal Chachoga Naggar 0.90 0.51 0.37 0.68 0.63 0.00 0.06 0.83
Climate Change Vulnerability Assessment Report 121
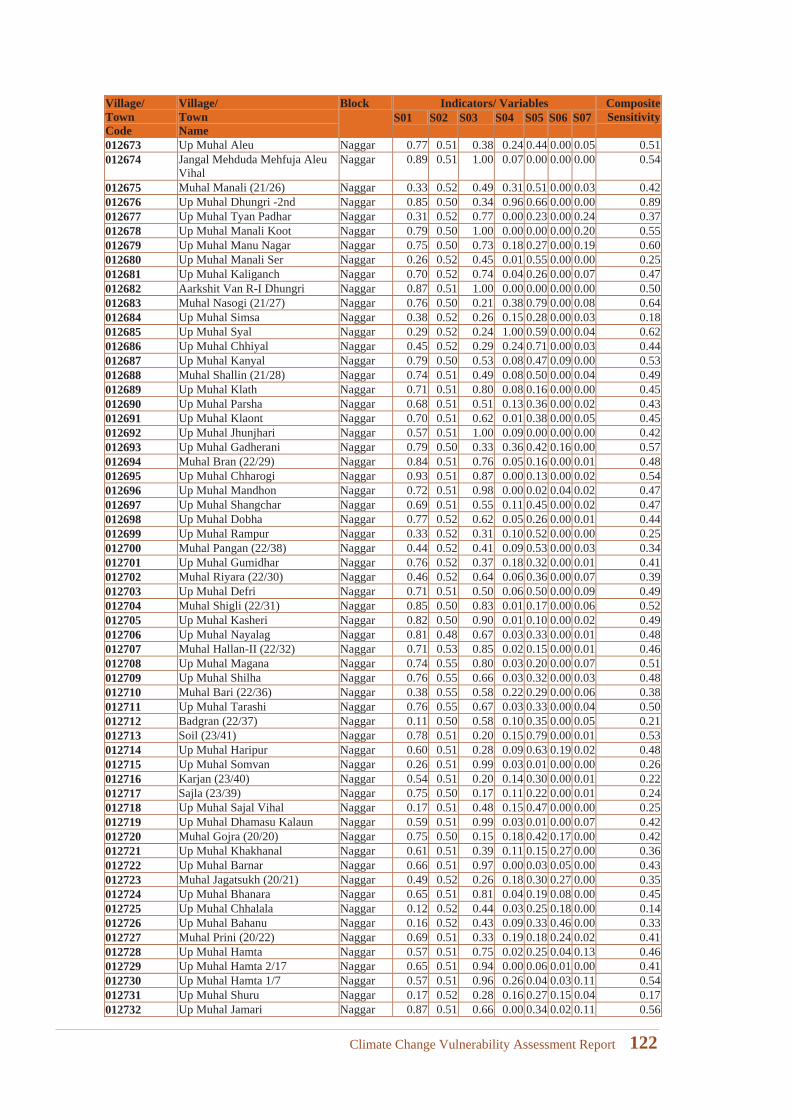
Village/TownCode
Village/TownName
Block Indicators/ Variables Composite SensitivityS01 S02 S03 S04 S05 S06 S07
012673 Up Muhal Aleu Naggar 0.77 0.51 0.38 0.24 0.44 0.00 0.05 0.51012674 Jangal Mehduda Mehfuja Aleu
VihalNaggar 0.89 0.51 1.00 0.07 0.00 0.00 0.00 0.54
012675 Muhal Manali (21/26) Naggar 0.33 0.52 0.49 0.31 0.51 0.00 0.03 0.42012676 Up Muhal Dhungri -2nd Naggar 0.85 0.50 0.34 0.96 0.66 0.00 0.00 0.89012677 Up Muhal Tyan Padhar Naggar 0.31 0.52 0.77 0.00 0.23 0.00 0.24 0.37012678 Up Muhal Manali Koot Naggar 0.79 0.50 1.00 0.00 0.00 0.00 0.20 0.55012679 Up Muhal Manu Nagar Naggar 0.75 0.50 0.73 0.18 0.27 0.00 0.19 0.60012680 Up Muhal Manali Ser Naggar 0.26 0.52 0.45 0.01 0.55 0.00 0.00 0.25012681 Up Muhal Kaliganch Naggar 0.70 0.52 0.74 0.04 0.26 0.00 0.07 0.47012682 Aarkshit Van R-I Dhungri Naggar 0.87 0.51 1.00 0.00 0.00 0.00 0.00 0.50012683 Muhal Nasogi (21/27) Naggar 0.76 0.50 0.21 0.38 0.79 0.00 0.08 0.64012684 Up Muhal Simsa Naggar 0.38 0.52 0.26 0.15 0.28 0.00 0.03 0.18012685 Up Muhal Syal Naggar 0.29 0.52 0.24 1.00 0.59 0.00 0.04 0.62012686 Up Muhal Chhiyal Naggar 0.45 0.52 0.29 0.24 0.71 0.00 0.03 0.44012687 Up Muhal Kanyal Naggar 0.79 0.50 0.53 0.08 0.47 0.09 0.00 0.53012688 Muhal Shallin (21/28) Naggar 0.74 0.51 0.49 0.08 0.50 0.00 0.04 0.49012689 Up Muhal Klath Naggar 0.71 0.51 0.80 0.08 0.16 0.00 0.00 0.45012690 Up Muhal Parsha Naggar 0.68 0.51 0.51 0.13 0.36 0.00 0.02 0.43012691 Up Muhal Klaont Naggar 0.70 0.51 0.62 0.01 0.38 0.00 0.05 0.45012692 Up Muhal Jhunjhari Naggar 0.57 0.51 1.00 0.09 0.00 0.00 0.00 0.42012693 Up Muhal Gadherani Naggar 0.79 0.50 0.33 0.36 0.42 0.16 0.00 0.57012694 Muhal Bran (22/29) Naggar 0.84 0.51 0.76 0.05 0.16 0.00 0.01 0.48012695 Up Muhal Chharogi Naggar 0.93 0.51 0.87 0.00 0.13 0.00 0.02 0.54012696 Up Muhal Mandhon Naggar 0.72 0.51 0.98 0.00 0.02 0.04 0.02 0.47012697 Up Muhal Shangchar Naggar 0.69 0.51 0.55 0.11 0.45 0.00 0.02 0.47012698 Up Muhal Dobha Naggar 0.77 0.52 0.62 0.05 0.26 0.00 0.01 0.44012699 Up Muhal Rampur Naggar 0.33 0.52 0.31 0.10 0.52 0.00 0.00 0.25012700 Muhal Pangan (22/38) Naggar 0.44 0.52 0.41 0.09 0.53 0.00 0.03 0.34012701 Up Muhal Gumidhar Naggar 0.76 0.52 0.37 0.18 0.32 0.00 0.01 0.41012702 Muhal Riyara (22/30) Naggar 0.46 0.52 0.64 0.06 0.36 0.00 0.07 0.39012703 Up Muhal Defri Naggar 0.71 0.51 0.50 0.06 0.50 0.00 0.09 0.49012704 Muhal Shigli (22/31) Naggar 0.85 0.50 0.83 0.01 0.17 0.00 0.06 0.52012705 Up Muhal Kasheri Naggar 0.82 0.50 0.90 0.01 0.10 0.00 0.02 0.49012706 Up Muhal Nayalag Naggar 0.81 0.48 0.67 0.03 0.33 0.00 0.01 0.48012707 Muhal Hallan-II (22/32) Naggar 0.71 0.53 0.85 0.02 0.15 0.00 0.01 0.46012708 Up Muhal Magana Naggar 0.74 0.55 0.80 0.03 0.20 0.00 0.07 0.51012709 Up Muhal Shilha Naggar 0.76 0.55 0.66 0.03 0.32 0.00 0.03 0.48012710 Muhal Bari (22/36) Naggar 0.38 0.55 0.58 0.22 0.29 0.00 0.06 0.38012711 Up Muhal Tarashi Naggar 0.76 0.55 0.67 0.03 0.33 0.00 0.04 0.50012712 Badgran (22/37) Naggar 0.11 0.50 0.58 0.10 0.35 0.00 0.05 0.21012713 Soil (23/41) Naggar 0.78 0.51 0.20 0.15 0.79 0.00 0.01 0.53012714 Up Muhal Haripur Naggar 0.60 0.51 0.28 0.09 0.63 0.19 0.02 0.48012715 Up Muhal Somvan Naggar 0.26 0.51 0.99 0.03 0.01 0.00 0.00 0.26012716 Karjan (23/40) Naggar 0.54 0.51 0.20 0.14 0.30 0.00 0.01 0.22012717 Sajla (23/39) Naggar 0.75 0.50 0.17 0.11 0.22 0.00 0.01 0.24012718 Up Muhal Sajal Vihal Naggar 0.17 0.51 0.48 0.15 0.47 0.00 0.00 0.25012719 Up Muhal Dhamasu Kalaun Naggar 0.59 0.51 0.99 0.03 0.01 0.00 0.07 0.42012720 Muhal Gojra (20/20) Naggar 0.75 0.50 0.15 0.18 0.42 0.17 0.00 0.42012721 Up Muhal Khakhanal Naggar 0.61 0.51 0.39 0.11 0.15 0.27 0.00 0.36012722 Up Muhal Barnar Naggar 0.66 0.51 0.97 0.00 0.03 0.05 0.00 0.43012723 Muhal Jagatsukh (20/21) Naggar 0.49 0.52 0.26 0.18 0.30 0.27 0.00 0.35012724 Up Muhal Bhanara Naggar 0.65 0.51 0.81 0.04 0.19 0.08 0.00 0.45012725 Up Muhal Chhalala Naggar 0.12 0.52 0.44 0.03 0.25 0.18 0.00 0.14012726 Up Muhal Bahanu Naggar 0.16 0.52 0.43 0.09 0.33 0.46 0.00 0.33012727 Muhal Prini (20/22) Naggar 0.69 0.51 0.33 0.19 0.18 0.24 0.02 0.41012728 Up Muhal Hamta Naggar 0.57 0.51 0.75 0.02 0.25 0.04 0.13 0.46012729 Up Muhal Hamta 2/17 Naggar 0.65 0.51 0.94 0.00 0.06 0.01 0.00 0.41012730 Up Muhal Hamta 1/7 Naggar 0.57 0.51 0.96 0.26 0.04 0.03 0.11 0.54012731 Up Muhal Shuru Naggar 0.17 0.52 0.28 0.16 0.27 0.15 0.04 0.17012732 Up Muhal Jamari Naggar 0.87 0.51 0.66 0.00 0.34 0.02 0.11 0.56
Climate Change Vulnerability Assessment Report 122
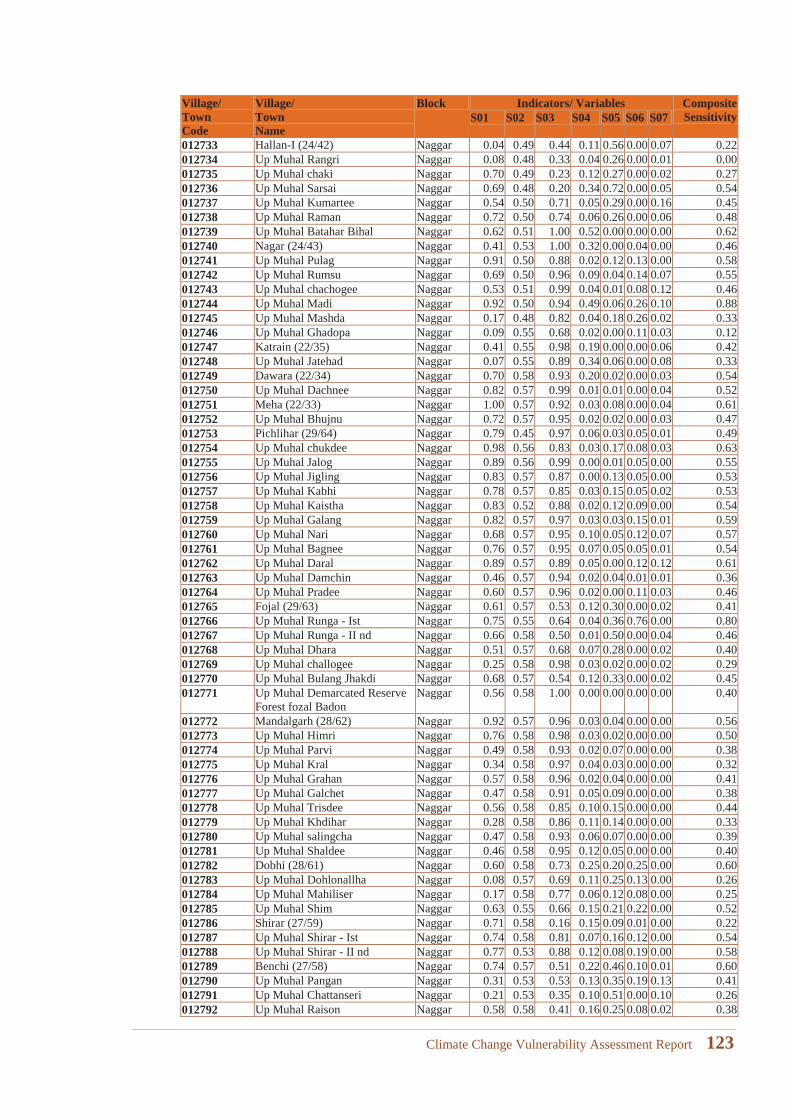
Village/TownCode
Village/TownName
Block Indicators/ Variables Composite SensitivityS01 S02 S03 S04 S05 S06 S07
012733 Hallan-I (24/42) Naggar 0.04 0.49 0.44 0.11 0.56 0.00 0.07 0.22012734 Up Muhal Rangri Naggar 0.08 0.48 0.33 0.04 0.26 0.00 0.01 0.00012735 Up Muhal chaki Naggar 0.70 0.49 0.23 0.12 0.27 0.00 0.02 0.27012736 Up Muhal Sarsai Naggar 0.69 0.48 0.20 0.34 0.72 0.00 0.05 0.54012737 Up Muhal Kumartee Naggar 0.54 0.50 0.71 0.05 0.29 0.00 0.16 0.45012738 Up Muhal Raman Naggar 0.72 0.50 0.74 0.06 0.26 0.00 0.06 0.48012739 Up Muhal Batahar Bihal Naggar 0.62 0.51 1.00 0.52 0.00 0.00 0.00 0.62012740 Nagar (24/43) Naggar 0.41 0.53 1.00 0.32 0.00 0.04 0.00 0.46012741 Up Muhal Pulag Naggar 0.91 0.50 0.88 0.02 0.12 0.13 0.00 0.58012742 Up Muhal Rumsu Naggar 0.69 0.50 0.96 0.09 0.04 0.14 0.07 0.55012743 Up Muhal chachogee Naggar 0.53 0.51 0.99 0.04 0.01 0.08 0.12 0.46012744 Up Muhal Madi Naggar 0.92 0.50 0.94 0.49 0.06 0.26 0.10 0.88012745 Up Muhal Mashda Naggar 0.17 0.48 0.82 0.04 0.18 0.26 0.02 0.33012746 Up Muhal Ghadopa Naggar 0.09 0.55 0.68 0.02 0.00 0.11 0.03 0.12012747 Katrain (22/35) Naggar 0.41 0.55 0.98 0.19 0.00 0.00 0.06 0.42012748 Up Muhal Jatehad Naggar 0.07 0.55 0.89 0.34 0.06 0.00 0.08 0.33012749 Dawara (22/34) Naggar 0.70 0.58 0.93 0.20 0.02 0.00 0.03 0.54012750 Up Muhal Dachnee Naggar 0.82 0.57 0.99 0.01 0.01 0.00 0.04 0.52012751 Meha (22/33) Naggar 1.00 0.57 0.92 0.03 0.08 0.00 0.04 0.61012752 Up Muhal Bhujnu Naggar 0.72 0.57 0.95 0.02 0.02 0.00 0.03 0.47012753 Pichlihar (29/64) Naggar 0.79 0.45 0.97 0.06 0.03 0.05 0.01 0.49012754 Up Muhal chukdee Naggar 0.98 0.56 0.83 0.03 0.17 0.08 0.03 0.63012755 Up Muhal Jalog Naggar 0.89 0.56 0.99 0.00 0.01 0.05 0.00 0.55012756 Up Muhal Jigling Naggar 0.83 0.57 0.87 0.00 0.13 0.05 0.00 0.53012757 Up Muhal Kabhi Naggar 0.78 0.57 0.85 0.03 0.15 0.05 0.02 0.53012758 Up Muhal Kaistha Naggar 0.83 0.52 0.88 0.02 0.12 0.09 0.00 0.54012759 Up Muhal Galang Naggar 0.82 0.57 0.97 0.03 0.03 0.15 0.01 0.59012760 Up Muhal Nari Naggar 0.68 0.57 0.95 0.10 0.05 0.12 0.07 0.57012761 Up Muhal Bagnee Naggar 0.76 0.57 0.95 0.07 0.05 0.05 0.01 0.54012762 Up Muhal Daral Naggar 0.89 0.57 0.89 0.05 0.00 0.12 0.12 0.61012763 Up Muhal Damchin Naggar 0.46 0.57 0.94 0.02 0.04 0.01 0.01 0.36012764 Up Muhal Pradee Naggar 0.60 0.57 0.96 0.02 0.00 0.11 0.03 0.46012765 Fojal (29/63) Naggar 0.61 0.57 0.53 0.12 0.30 0.00 0.02 0.41012766 Up Muhal Runga - Ist Naggar 0.75 0.55 0.64 0.04 0.36 0.76 0.00 0.80012767 Up Muhal Runga - II nd Naggar 0.66 0.58 0.50 0.01 0.50 0.00 0.04 0.46012768 Up Muhal Dhara Naggar 0.51 0.57 0.68 0.07 0.28 0.00 0.02 0.40012769 Up Muhal challogee Naggar 0.25 0.58 0.98 0.03 0.02 0.00 0.02 0.29012770 Up Muhal Bulang Jhakdi Naggar 0.68 0.57 0.54 0.12 0.33 0.00 0.02 0.45012771 Up Muhal Demarcated Reserve
Forest fozal BadonNaggar 0.56 0.58 1.00 0.00 0.00 0.00 0.00 0.40
012772 Mandalgarh (28/62) Naggar 0.92 0.57 0.96 0.03 0.04 0.00 0.00 0.56012773 Up Muhal Himri Naggar 0.76 0.58 0.98 0.03 0.02 0.00 0.00 0.50012774 Up Muhal Parvi Naggar 0.49 0.58 0.93 0.02 0.07 0.00 0.00 0.38012775 Up Muhal Kral Naggar 0.34 0.58 0.97 0.04 0.03 0.00 0.00 0.32012776 Up Muhal Grahan Naggar 0.57 0.58 0.96 0.02 0.04 0.00 0.00 0.41012777 Up Muhal Galchet Naggar 0.47 0.58 0.91 0.05 0.09 0.00 0.00 0.38012778 Up Muhal Trisdee Naggar 0.56 0.58 0.85 0.10 0.15 0.00 0.00 0.44012779 Up Muhal Khdihar Naggar 0.28 0.58 0.86 0.11 0.14 0.00 0.00 0.33012780 Up Muhal salingcha Naggar 0.47 0.58 0.93 0.06 0.07 0.00 0.00 0.39012781 Up Muhal Shaldee Naggar 0.46 0.58 0.95 0.12 0.05 0.00 0.00 0.40012782 Dobhi (28/61) Naggar 0.60 0.58 0.73 0.25 0.20 0.25 0.00 0.60012783 Up Muhal Dohlonallha Naggar 0.08 0.57 0.69 0.11 0.25 0.13 0.00 0.26012784 Up Muhal Mahiliser Naggar 0.17 0.58 0.77 0.06 0.12 0.08 0.00 0.25012785 Up Muhal Shim Naggar 0.63 0.55 0.66 0.15 0.21 0.22 0.00 0.52012786 Shirar (27/59) Naggar 0.71 0.58 0.16 0.15 0.09 0.01 0.00 0.22012787 Up Muhal Shirar - Ist Naggar 0.74 0.58 0.81 0.07 0.16 0.12 0.00 0.54012788 Up Muhal Shirar - II nd Naggar 0.77 0.53 0.88 0.12 0.08 0.19 0.00 0.58012789 Benchi (27/58) Naggar 0.74 0.57 0.51 0.22 0.46 0.10 0.01 0.60012790 Up Muhal Pangan Naggar 0.31 0.53 0.53 0.13 0.35 0.19 0.13 0.41012791 Up Muhal Chattanseri Naggar 0.21 0.53 0.35 0.10 0.51 0.00 0.10 0.26012792 Up Muhal Raison Naggar 0.58 0.58 0.41 0.16 0.25 0.08 0.02 0.38
Climate Change Vulnerability Assessment Report 123
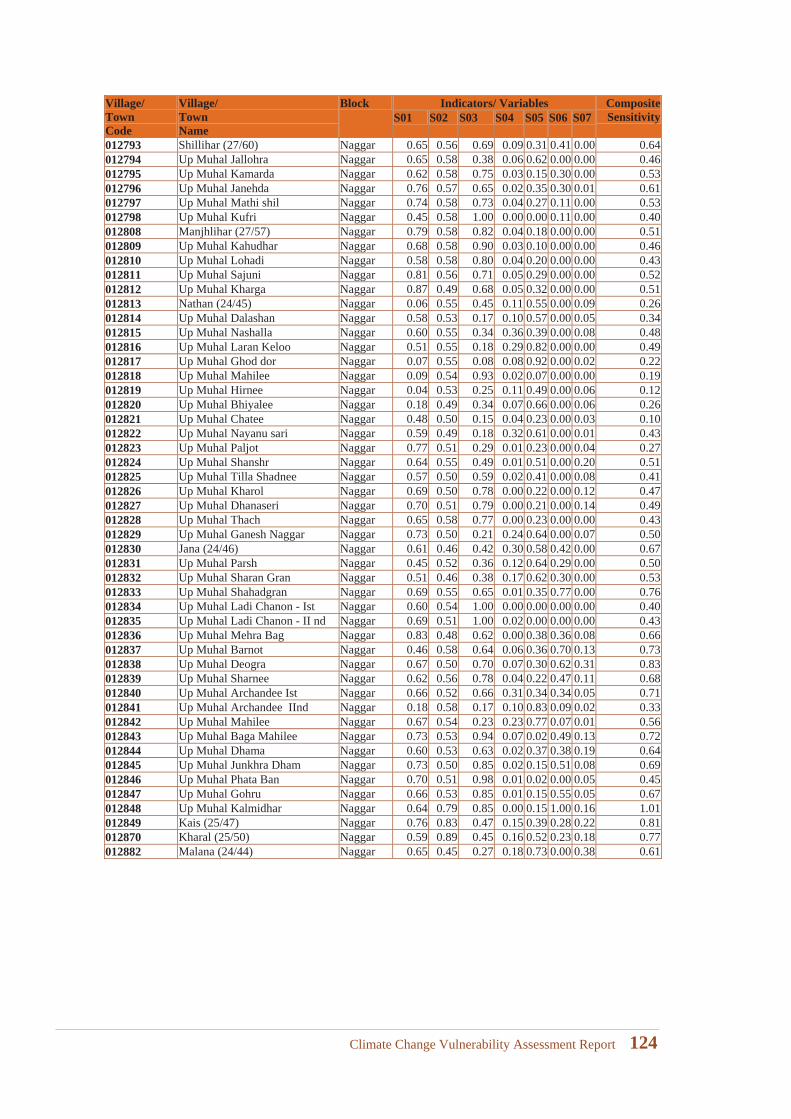
Village/TownCode
Village/TownName
Block Indicators/ Variables Composite SensitivityS01 S02 S03 S04 S05 S06 S07
012793 Shillihar (27/60) Naggar 0.65 0.56 0.69 0.09 0.31 0.41 0.00 0.64012794 Up Muhal Jallohra Naggar 0.65 0.58 0.38 0.06 0.62 0.00 0.00 0.46012795 Up Muhal Kamarda Naggar 0.62 0.58 0.75 0.03 0.15 0.30 0.00 0.53012796 Up Muhal Janehda Naggar 0.76 0.57 0.65 0.02 0.35 0.30 0.01 0.61012797 Up Muhal Mathi shil Naggar 0.74 0.58 0.73 0.04 0.27 0.11 0.00 0.53012798 Up Muhal Kufri Naggar 0.45 0.58 1.00 0.00 0.00 0.11 0.00 0.40012808 Manjhlihar (27/57) Naggar 0.79 0.58 0.82 0.04 0.18 0.00 0.00 0.51012809 Up Muhal Kahudhar Naggar 0.68 0.58 0.90 0.03 0.10 0.00 0.00 0.46012810 Up Muhal Lohadi Naggar 0.58 0.58 0.80 0.04 0.20 0.00 0.00 0.43012811 Up Muhal Sajuni Naggar 0.81 0.56 0.71 0.05 0.29 0.00 0.00 0.52012812 Up Muhal Kharga Naggar 0.87 0.49 0.68 0.05 0.32 0.00 0.00 0.51012813 Nathan (24/45) Naggar 0.06 0.55 0.45 0.11 0.55 0.00 0.09 0.26012814 Up Muhal Dalashan Naggar 0.58 0.53 0.17 0.10 0.57 0.00 0.05 0.34012815 Up Muhal Nashalla Naggar 0.60 0.55 0.34 0.36 0.39 0.00 0.08 0.48012816 Up Muhal Laran Keloo Naggar 0.51 0.55 0.18 0.29 0.82 0.00 0.00 0.49012817 Up Muhal Ghod dor Naggar 0.07 0.55 0.08 0.08 0.92 0.00 0.02 0.22012818 Up Muhal Mahilee Naggar 0.09 0.54 0.93 0.02 0.07 0.00 0.00 0.19012819 Up Muhal Hirnee Naggar 0.04 0.53 0.25 0.11 0.49 0.00 0.06 0.12012820 Up Muhal Bhiyalee Naggar 0.18 0.49 0.34 0.07 0.66 0.00 0.06 0.26012821 Up Muhal Chatee Naggar 0.48 0.50 0.15 0.04 0.23 0.00 0.03 0.10012822 Up Muhal Nayanu sari Naggar 0.59 0.49 0.18 0.32 0.61 0.00 0.01 0.43012823 Up Muhal Paljot Naggar 0.77 0.51 0.29 0.01 0.23 0.00 0.04 0.27012824 Up Muhal Shanshr Naggar 0.64 0.55 0.49 0.01 0.51 0.00 0.20 0.51012825 Up Muhal Tilla Shadnee Naggar 0.57 0.50 0.59 0.02 0.41 0.00 0.08 0.41012826 Up Muhal Kharol Naggar 0.69 0.50 0.78 0.00 0.22 0.00 0.12 0.47012827 Up Muhal Dhanaseri Naggar 0.70 0.51 0.79 0.00 0.21 0.00 0.14 0.49012828 Up Muhal Thach Naggar 0.65 0.58 0.77 0.00 0.23 0.00 0.00 0.43012829 Up Muhal Ganesh Naggar Naggar 0.73 0.50 0.21 0.24 0.64 0.00 0.07 0.50012830 Jana (24/46) Naggar 0.61 0.46 0.42 0.30 0.58 0.42 0.00 0.67012831 Up Muhal Parsh Naggar 0.45 0.52 0.36 0.12 0.64 0.29 0.00 0.50012832 Up Muhal Sharan Gran Naggar 0.51 0.46 0.38 0.17 0.62 0.30 0.00 0.53012833 Up Muhal Shahadgran Naggar 0.69 0.55 0.65 0.01 0.35 0.77 0.00 0.76012834 Up Muhal Ladi Chanon - Ist Naggar 0.60 0.54 1.00 0.00 0.00 0.00 0.00 0.40012835 Up Muhal Ladi Chanon - II nd Naggar 0.69 0.51 1.00 0.02 0.00 0.00 0.00 0.43012836 Up Muhal Mehra Bag Naggar 0.83 0.48 0.62 0.00 0.38 0.36 0.08 0.66012837 Up Muhal Barnot Naggar 0.46 0.58 0.64 0.06 0.36 0.70 0.13 0.73012838 Up Muhal Deogra Naggar 0.67 0.50 0.70 0.07 0.30 0.62 0.31 0.83012839 Up Muhal Sharnee Naggar 0.62 0.56 0.78 0.04 0.22 0.47 0.11 0.68012840 Up Muhal Archandee Ist Naggar 0.66 0.52 0.66 0.31 0.34 0.34 0.05 0.71012841 Up Muhal Archandee IInd Naggar 0.18 0.58 0.17 0.10 0.83 0.09 0.02 0.33012842 Up Muhal Mahilee Naggar 0.67 0.54 0.23 0.23 0.77 0.07 0.01 0.56012843 Up Muhal Baga Mahilee Naggar 0.73 0.53 0.94 0.07 0.02 0.49 0.13 0.72012844 Up Muhal Dhama Naggar 0.60 0.53 0.63 0.02 0.37 0.38 0.19 0.64012845 Up Muhal Junkhra Dham Naggar 0.73 0.50 0.85 0.02 0.15 0.51 0.08 0.69012846 Up Muhal Phata Ban Naggar 0.70 0.51 0.98 0.01 0.02 0.00 0.05 0.45012847 Up Muhal Gohru Naggar 0.66 0.53 0.85 0.01 0.15 0.55 0.05 0.67012848 Up Muhal Kalmidhar Naggar 0.64 0.79 0.85 0.00 0.15 1.00 0.16 1.01012849 Kais (25/47) Naggar 0.76 0.83 0.47 0.15 0.39 0.28 0.22 0.81012870 Kharal (25/50) Naggar 0.59 0.89 0.45 0.16 0.52 0.23 0.18 0.77012882 Malana (24/44) Naggar 0.65 0.45 0.27 0.18 0.73 0.00 0.38 0.61
Climate Change Vulnerability Assessment Report 124
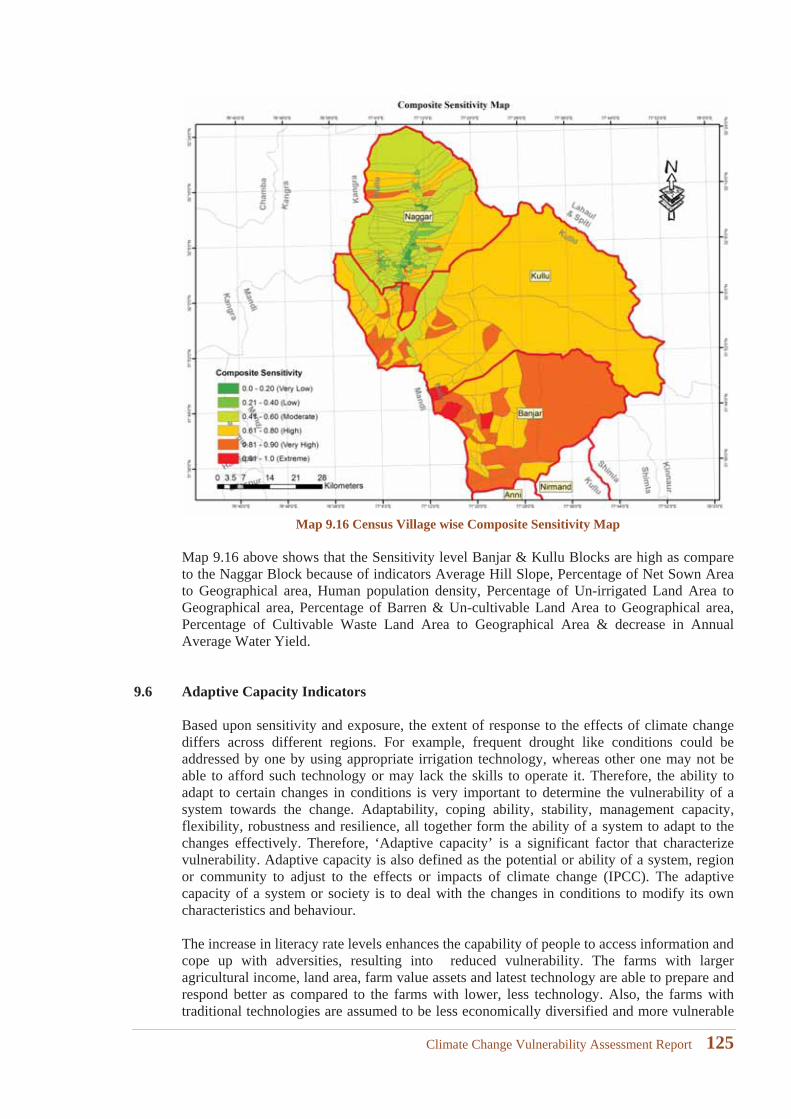
Map 9.16 Census Village wise Composite Sensitivity Map
Map 9.16 above shows that the Sensitivity level Banjar & Kullu Blocks are high as compare to the Naggar Block because of indicators Average Hill Slope, Percentage of Net Sown Area to Geographical area, Human population density, Percentage of Un-irrigated Land Area to Geographical area, Percentage of Barren & Un-cultivable Land Area to Geographical area,Percentage of Cultivable Waste Land Area to Geographical Area & decrease in Annual Average Water Yield.
9.6 Adaptive Capacity Indicators
Based upon sensitivity and exposure, the extent of response to the effects of climate change differs across different regions. For example, frequent drought like conditions could be addressed by one by using appropriate irrigation technology, whereas other one may not be able to afford such technology or may lack the skills to operate it. Therefore, the ability to adapt to certain changes in conditions is very important to determine the vulnerability of a system towards the change. Adaptability, coping ability, stability, management capacity, flexibility, robustness and resilience, all together form the ability of a system to adapt to the changes effectively. Therefore, ‘Adaptive capacity’ is a significant factor that characterizevulnerability. Adaptive capacity is also defined as the potential or ability of a system, region or community to adjust to the effects or impacts of climate change (IPCC). The adaptivecapacity of a system or society is to deal with the changes in conditions to modify its own characteristics and behaviour.
The increase in literacy rate levels enhances the capability of people to access information and cope up with adversities, resulting into reduced vulnerability. The farms with larger agricultural income, land area, farm value assets and latest technology are able to prepare and respond better as compared to the farms with lower, less technology. Also, the farms with traditional technologies are assumed to be less economically diversified and more vulnerable
Climate Change Vulnerability Assessment Report 125
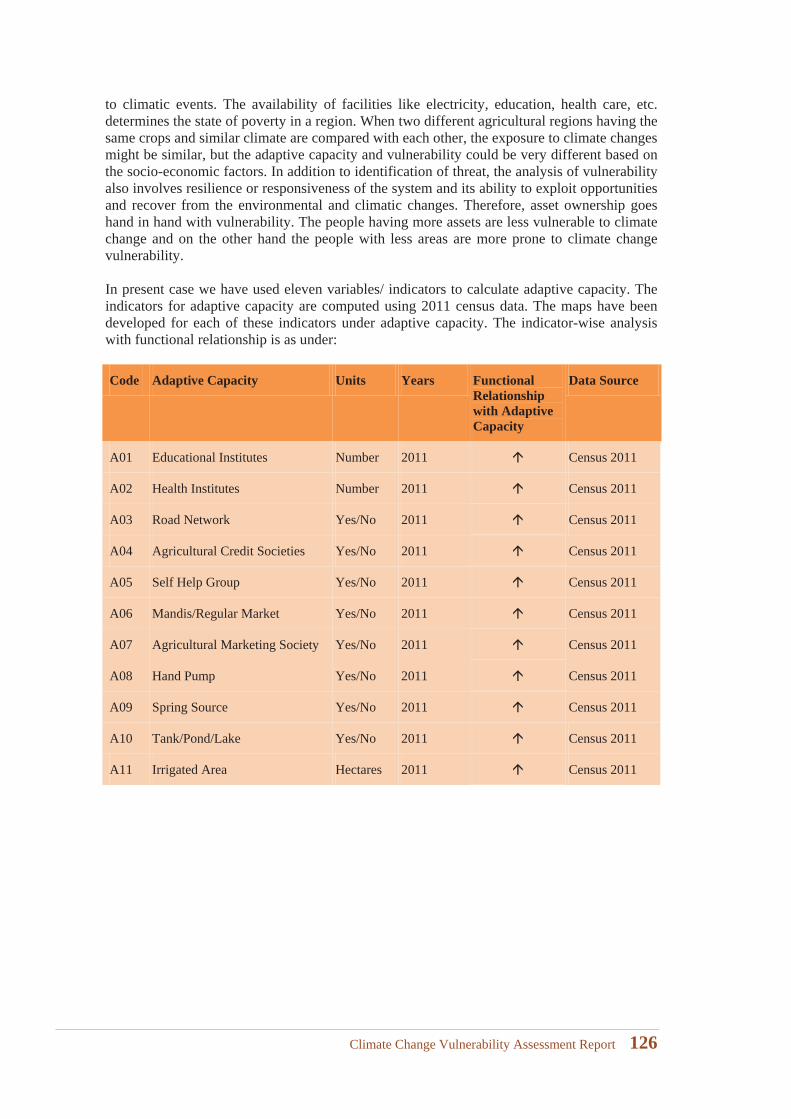
to climatic events. The availability of facilities like electricity, education, health care, etc. determines the state of poverty in a region. When two different agricultural regions having the same crops and similar climate are compared with each other, the exposure to climate changes might be similar, but the adaptive capacity and vulnerability could be very different based on the socio-economic factors. In addition to identification of threat, the analysis of vulnerability also involves resilience or responsiveness of the system and its ability to exploit opportunitiesand recover from the environmental and climatic changes. Therefore, asset ownership goes hand in hand with vulnerability. The people having more assets are less vulnerable to climate change and on the other hand the people with less areas are more prone to climate change vulnerability.
In present case we have used eleven variables/ indicators to calculate adaptive capacity. The indicators for adaptive capacity are computed using 2011 census data. The maps have beendeveloped for each of these indicators under adaptive capacity. The indicator-wise analysis with functional relationship is as under:
Code Adaptive Capacity Units Years Functional Relationship with Adaptive Capacity
Data Source
A01 Educational Institutes Number 2011 Census 2011
A02 Health Institutes Number 2011 Census 2011
A03 Road Network Yes/No 2011 Census 2011
A04 Agricultural Credit Societies Yes/No 2011 Census 2011
A05 Self Help Group Yes/No 2011 Census 2011
A06 Mandis/Regular Market Yes/No 2011 Census 2011
A07 Agricultural Marketing Society Yes/No 2011 Census 2011
A08 Hand Pump Yes/No 2011 Census 2011
A09 Spring Source Yes/No 2011 Census 2011
A10 Tank/Pond/Lake Yes/No 2011 Census 2011
A11 Irrigated Area Hectares 2011 Census 2011
Climate Change Vulnerability Assessment Report 126
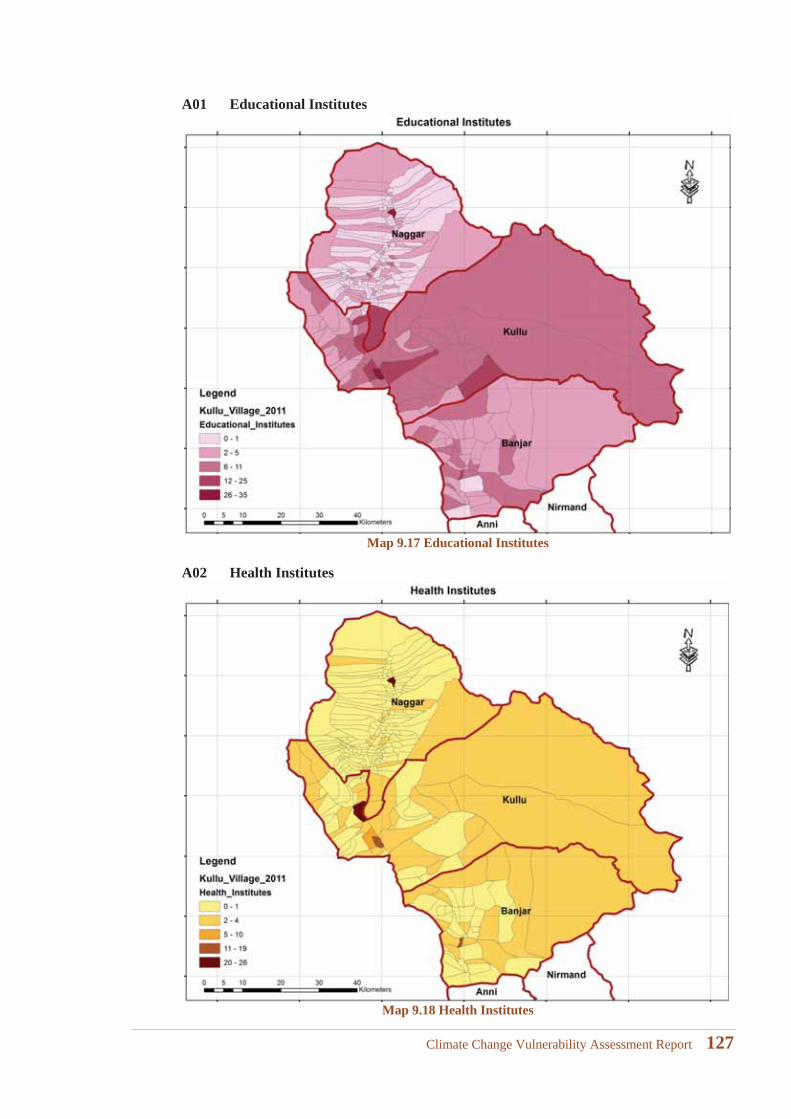
A01 Educational Institutes
Map 9.17 Educational Institutes
A02 Health Institutes
Map 9.18 Health Institutes
Climate Change Vulnerability Assessment Report 127
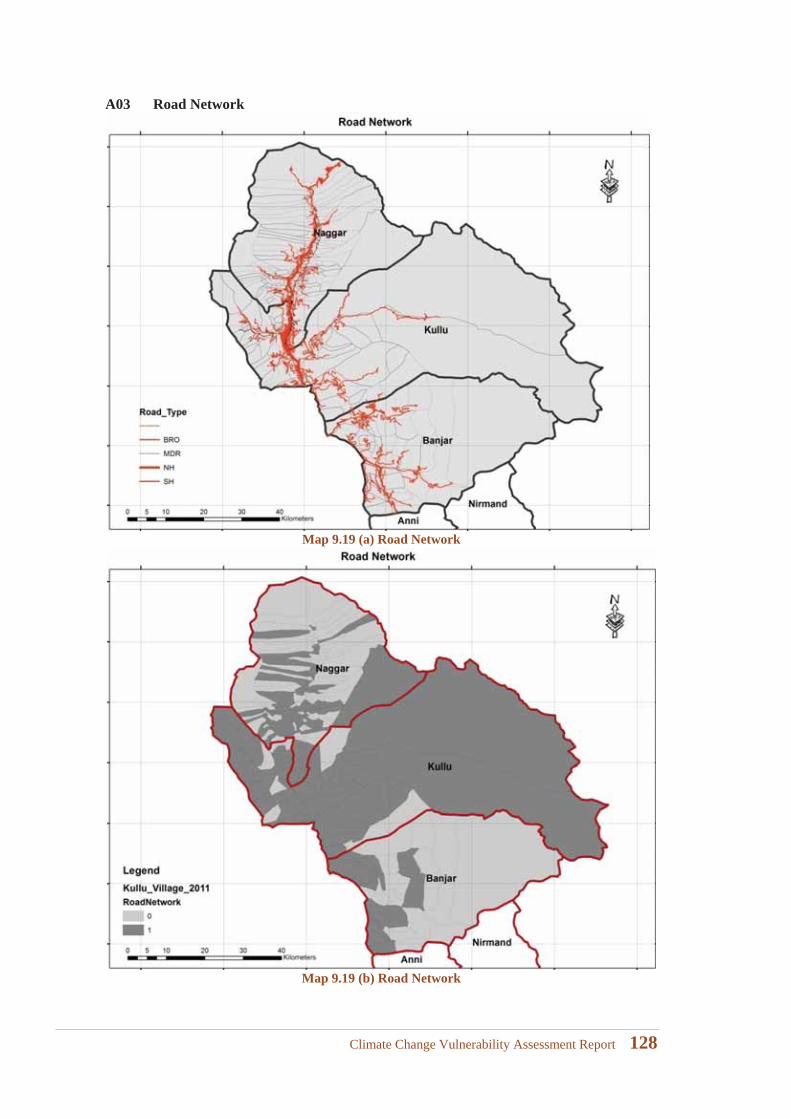
A03 Road Network
Map 9.19 (a) Road Network
Map 9.19 (b) Road Network
Climate Change Vulnerability Assessment Report 128
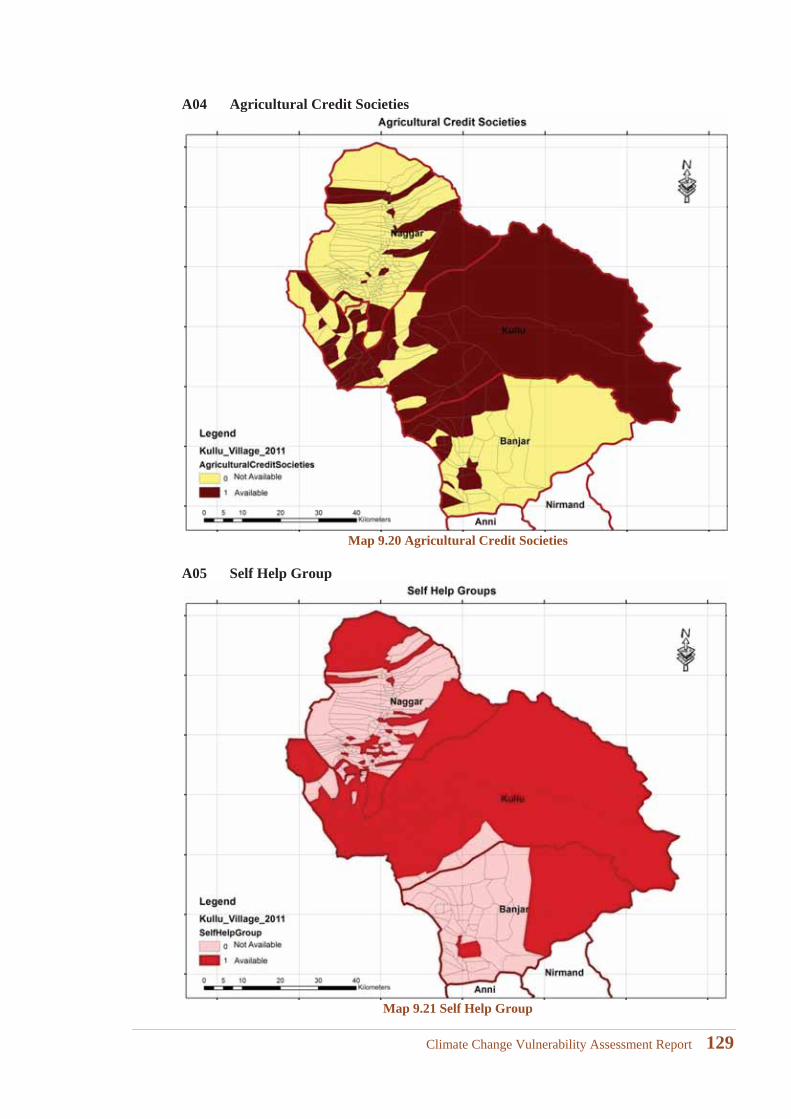
A04 Agricultural Credit Societies
Map 9.20 Agricultural Credit Societies
A05 Self Help Group
Map 9.21 Self Help Group
Climate Change Vulnerability Assessment Report 129
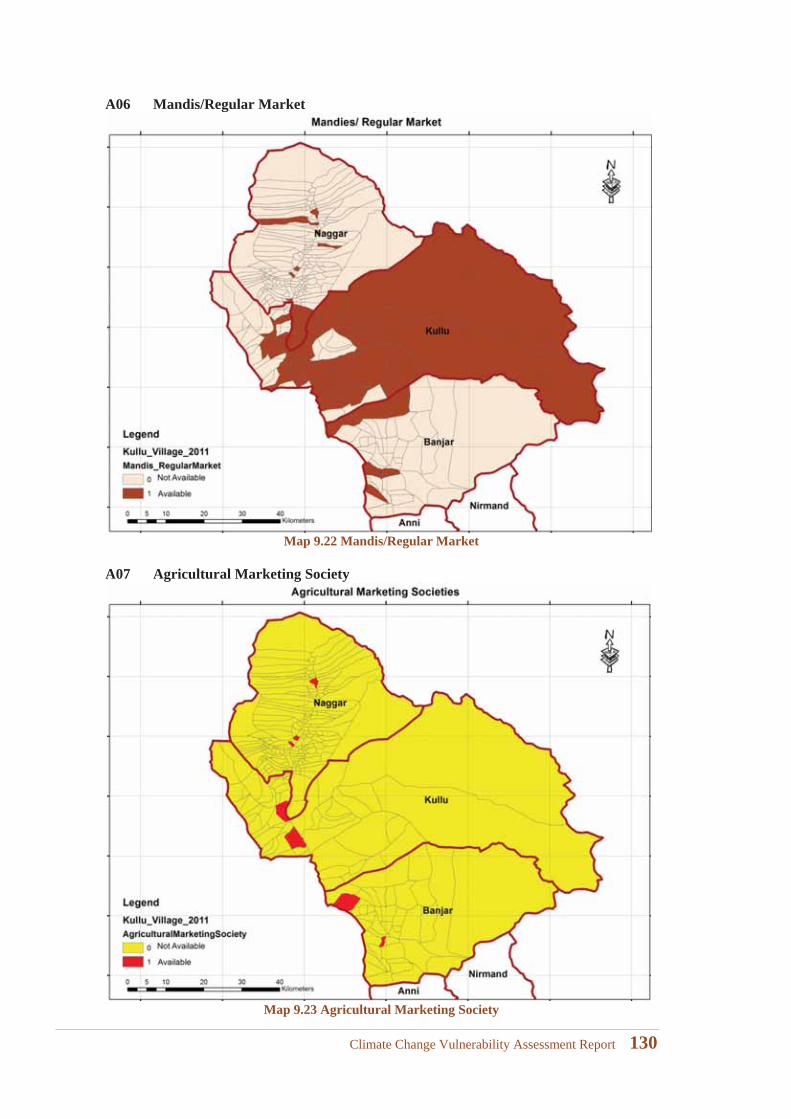
A06 Mandis/Regular Market
Map 9.22 Mandis/Regular Market
A07 Agricultural Marketing Society
Map 9.23 Agricultural Marketing Society
Climate Change Vulnerability Assessment Report 130
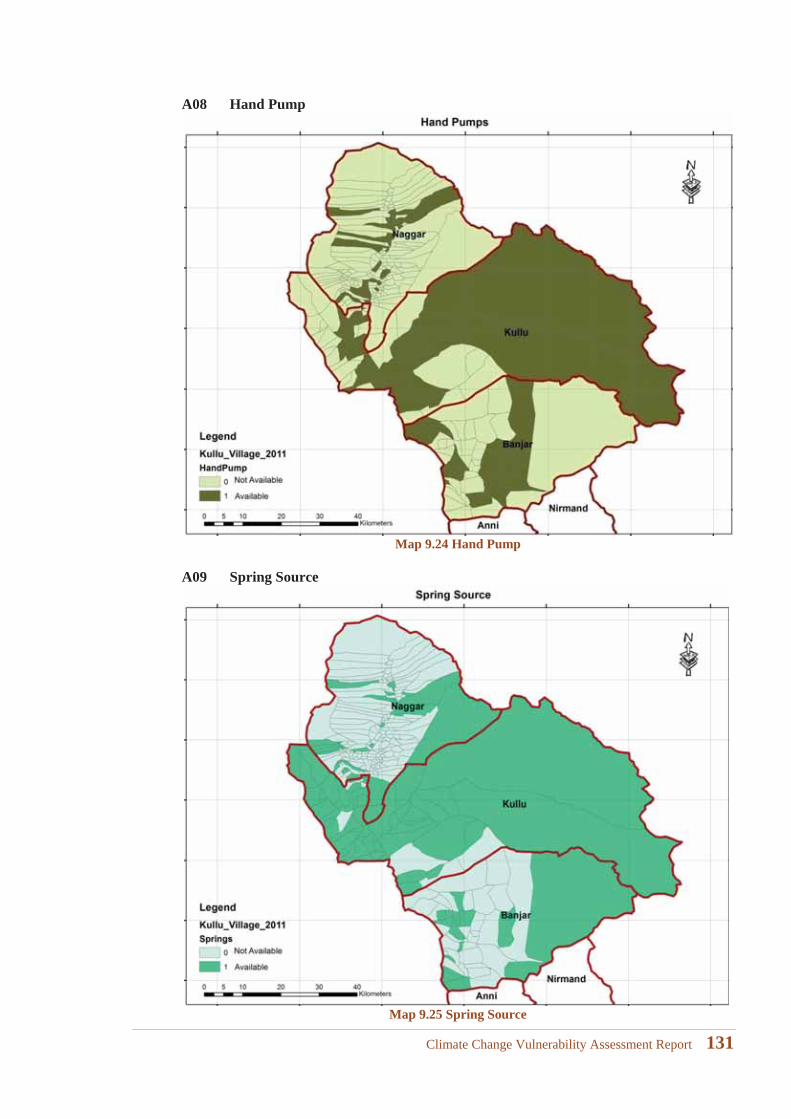
A08 Hand Pump
Map 9.24 Hand Pump
A09 Spring Source
Map 9.25 Spring Source
Climate Change Vulnerability Assessment Report 131
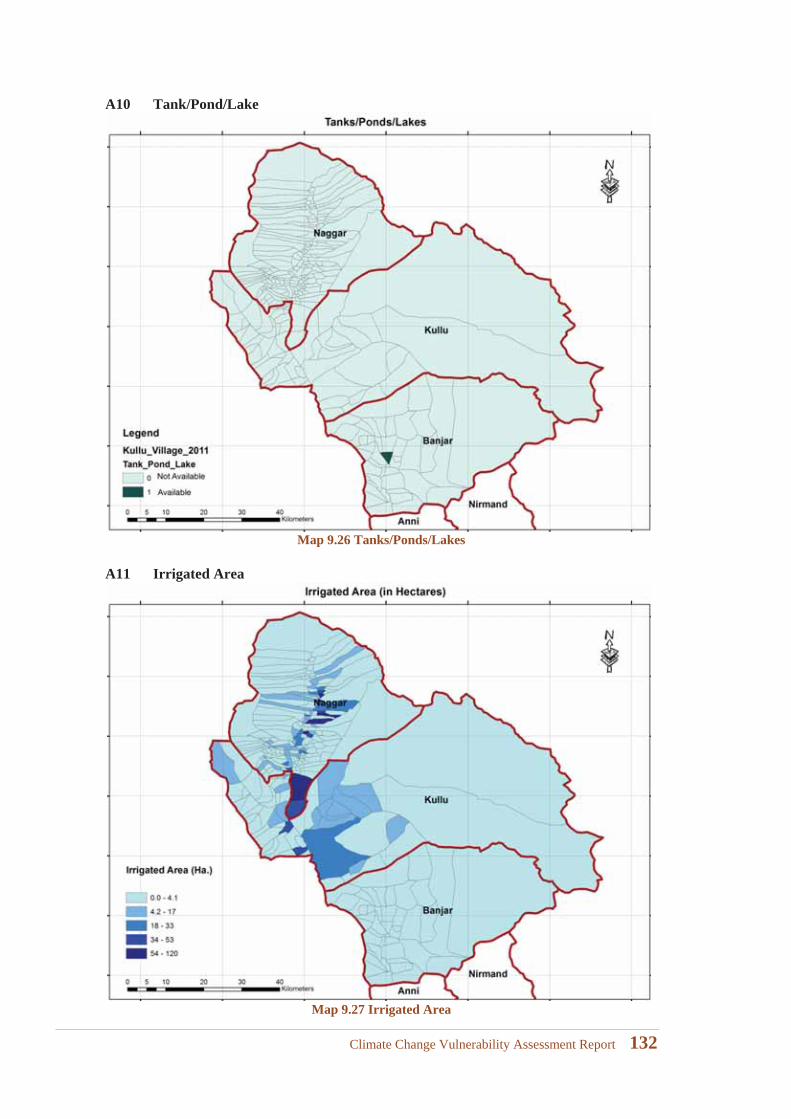
A10 Tank/Pond/Lake
Map 9.26 Tanks/Ponds/Lakes
A11 Irrigated Area
Map 9.27 Irrigated Area
Climate Change Vulnerability Assessment Report 132
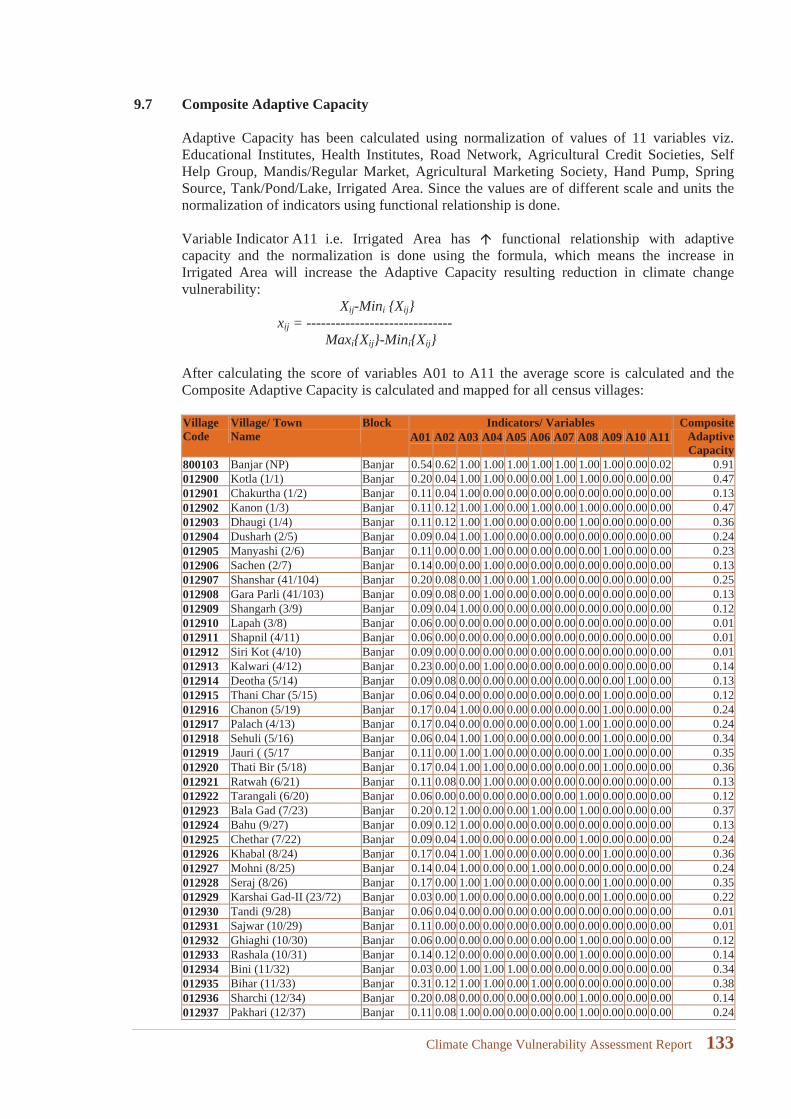
9.7 Composite Adaptive Capacity
Adaptive Capacity has been calculated using normalization of values of 11 variables viz. Educational Institutes, Health Institutes, Road Network, Agricultural Credit Societies, Self Help Group, Mandis/Regular Market, Agricultural Marketing Society, Hand Pump, Spring Source, Tank/Pond/Lake, Irrigated Area. Since the values are of different scale and units the normalization of indicators using functional relationship is done.
Variable Indicator A11 i.e. Irrigated Area has functional relationship with adaptive capacity and the normalization is done using the formula, which means the increase in Irrigated Area will increase the Adaptive Capacity resulting reduction in climate changevulnerability:
Xij-Mini {Xij}xij = ------------------------------
Maxi{Xij}-Mini{Xij}
After calculating the score of variables A01 to A11 the average score is calculated and the Composite Adaptive Capacity is calculated and mapped for all census villages:
VillageCode
Village/ TownName
Block Indicators/ Variables CompositeAdaptiveCapacity
A01 A02 A03 A04 A05 A06 A07 A08 A09 A10 A11
800103 Banjar (NP) Banjar 0.54 0.62 1.00 1.00 1.00 1.00 1.00 1.00 1.00 0.00 0.02 0.91012900 Kotla (1/1) Banjar 0.20 0.04 1.00 1.00 0.00 0.00 1.00 1.00 0.00 0.00 0.00 0.47012901 Chakurtha (1/2) Banjar 0.11 0.04 1.00 0.00 0.00 0.00 0.00 0.00 0.00 0.00 0.00 0.13012902 Kanon (1/3) Banjar 0.11 0.12 1.00 1.00 0.00 1.00 0.00 1.00 0.00 0.00 0.00 0.47012903 Dhaugi (1/4) Banjar 0.11 0.12 1.00 1.00 0.00 0.00 0.00 1.00 0.00 0.00 0.00 0.36012904 Dusharh (2/5) Banjar 0.09 0.04 1.00 1.00 0.00 0.00 0.00 0.00 0.00 0.00 0.00 0.24012905 Manyashi (2/6) Banjar 0.11 0.00 0.00 1.00 0.00 0.00 0.00 0.00 1.00 0.00 0.00 0.23012906 Sachen (2/7) Banjar 0.14 0.00 0.00 1.00 0.00 0.00 0.00 0.00 0.00 0.00 0.00 0.13012907 Shanshar (41/104) Banjar 0.20 0.08 0.00 1.00 0.00 1.00 0.00 0.00 0.00 0.00 0.00 0.25012908 Gara Parli (41/103) Banjar 0.09 0.08 0.00 1.00 0.00 0.00 0.00 0.00 0.00 0.00 0.00 0.13012909 Shangarh (3/9) Banjar 0.09 0.04 1.00 0.00 0.00 0.00 0.00 0.00 0.00 0.00 0.00 0.12012910 Lapah (3/8) Banjar 0.06 0.00 0.00 0.00 0.00 0.00 0.00 0.00 0.00 0.00 0.00 0.01012911 Shapnil (4/11) Banjar 0.06 0.00 0.00 0.00 0.00 0.00 0.00 0.00 0.00 0.00 0.00 0.01012912 Siri Kot (4/10) Banjar 0.09 0.00 0.00 0.00 0.00 0.00 0.00 0.00 0.00 0.00 0.00 0.01012913 Kalwari (4/12) Banjar 0.23 0.00 0.00 1.00 0.00 0.00 0.00 0.00 0.00 0.00 0.00 0.14012914 Deotha (5/14) Banjar 0.09 0.08 0.00 0.00 0.00 0.00 0.00 0.00 0.00 1.00 0.00 0.13012915 Thani Char (5/15) Banjar 0.06 0.04 0.00 0.00 0.00 0.00 0.00 0.00 1.00 0.00 0.00 0.12012916 Chanon (5/19) Banjar 0.17 0.04 1.00 0.00 0.00 0.00 0.00 0.00 1.00 0.00 0.00 0.24012917 Palach (4/13) Banjar 0.17 0.04 0.00 0.00 0.00 0.00 0.00 1.00 1.00 0.00 0.00 0.24012918 Sehuli (5/16) Banjar 0.06 0.04 1.00 1.00 0.00 0.00 0.00 0.00 1.00 0.00 0.00 0.34012919 Jauri ( (5/17 Banjar 0.11 0.00 1.00 1.00 0.00 0.00 0.00 0.00 1.00 0.00 0.00 0.35012920 Thati Bir (5/18) Banjar 0.17 0.04 1.00 1.00 0.00 0.00 0.00 0.00 1.00 0.00 0.00 0.36012921 Ratwah (6/21) Banjar 0.11 0.08 0.00 1.00 0.00 0.00 0.00 0.00 0.00 0.00 0.00 0.13012922 Tarangali (6/20) Banjar 0.06 0.00 0.00 0.00 0.00 0.00 0.00 1.00 0.00 0.00 0.00 0.12012923 Bala Gad (7/23) Banjar 0.20 0.12 1.00 0.00 0.00 1.00 0.00 1.00 0.00 0.00 0.00 0.37012924 Bahu (9/27) Banjar 0.09 0.12 1.00 0.00 0.00 0.00 0.00 0.00 0.00 0.00 0.00 0.13012925 Chethar (7/22) Banjar 0.09 0.04 1.00 0.00 0.00 0.00 0.00 1.00 0.00 0.00 0.00 0.24012926 Khabal (8/24) Banjar 0.17 0.04 1.00 1.00 0.00 0.00 0.00 0.00 1.00 0.00 0.00 0.36012927 Mohni (8/25) Banjar 0.14 0.04 1.00 0.00 0.00 1.00 0.00 0.00 0.00 0.00 0.00 0.24012928 Seraj (8/26) Banjar 0.17 0.00 1.00 1.00 0.00 0.00 0.00 0.00 1.00 0.00 0.00 0.35012929 Karshai Gad-II (23/72) Banjar 0.03 0.00 1.00 0.00 0.00 0.00 0.00 0.00 1.00 0.00 0.00 0.22012930 Tandi (9/28) Banjar 0.06 0.04 0.00 0.00 0.00 0.00 0.00 0.00 0.00 0.00 0.00 0.01012931 Sajwar (10/29) Banjar 0.11 0.00 0.00 0.00 0.00 0.00 0.00 0.00 0.00 0.00 0.00 0.01012932 Ghiaghi (10/30) Banjar 0.06 0.00 0.00 0.00 0.00 0.00 0.00 1.00 0.00 0.00 0.00 0.12012933 Rashala (10/31) Banjar 0.14 0.12 0.00 0.00 0.00 0.00 0.00 1.00 0.00 0.00 0.00 0.14012934 Bini (11/32) Banjar 0.03 0.00 1.00 1.00 1.00 0.00 0.00 0.00 0.00 0.00 0.00 0.34012935 Bihar (11/33) Banjar 0.31 0.12 1.00 1.00 0.00 1.00 0.00 0.00 0.00 0.00 0.00 0.38012936 Sharchi (12/34) Banjar 0.20 0.08 0.00 0.00 0.00 0.00 0.00 1.00 0.00 0.00 0.00 0.14012937 Pakhari (12/37) Banjar 0.11 0.08 1.00 0.00 0.00 0.00 0.00 1.00 0.00 0.00 0.00 0.24
Climate Change Vulnerability Assessment Report 133
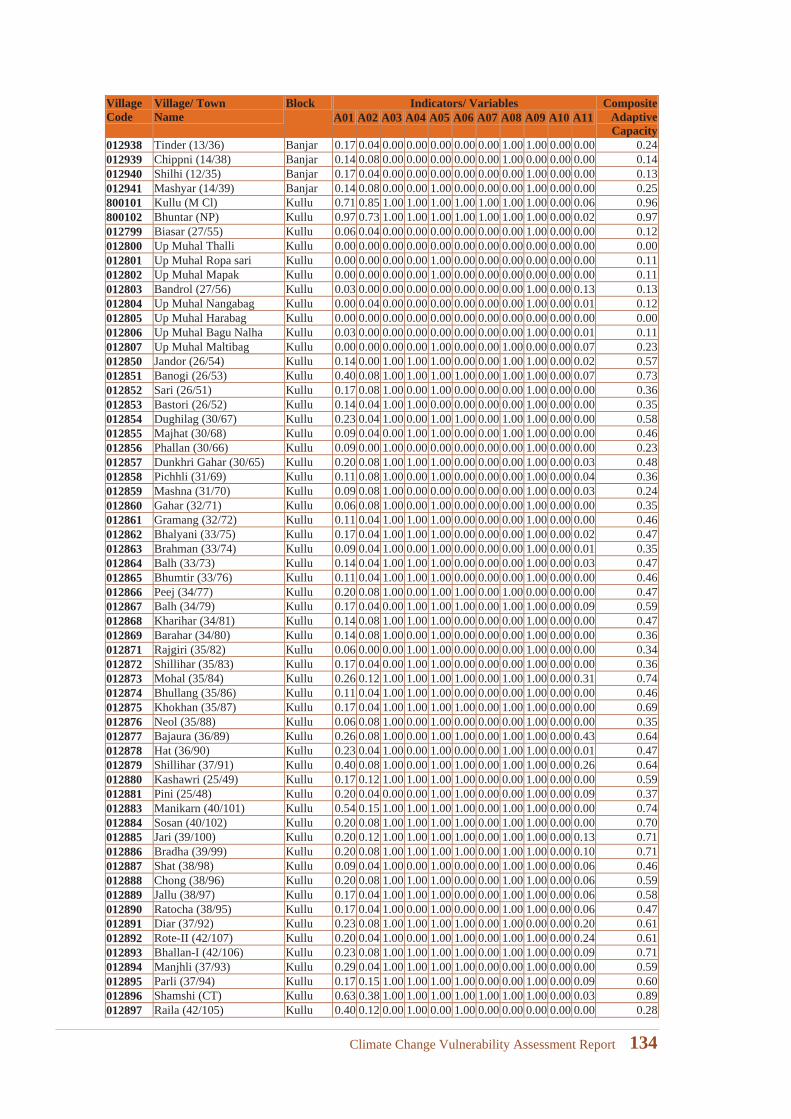
VillageCode
Village/ TownName
Block Indicators/ Variables CompositeAdaptiveCapacity
A01 A02 A03 A04 A05 A06 A07 A08 A09 A10 A11
012938 Tinder (13/36) Banjar 0.17 0.04 0.00 0.00 0.00 0.00 0.00 1.00 1.00 0.00 0.00 0.24012939 Chippni (14/38) Banjar 0.14 0.08 0.00 0.00 0.00 0.00 0.00 1.00 0.00 0.00 0.00 0.14012940 Shilhi (12/35) Banjar 0.17 0.04 0.00 0.00 0.00 0.00 0.00 0.00 1.00 0.00 0.00 0.13012941 Mashyar (14/39) Banjar 0.14 0.08 0.00 0.00 1.00 0.00 0.00 0.00 1.00 0.00 0.00 0.25800101 Kullu (M Cl) Kullu 0.71 0.85 1.00 1.00 1.00 1.00 1.00 1.00 1.00 0.00 0.06 0.96800102 Bhuntar (NP) Kullu 0.97 0.73 1.00 1.00 1.00 1.00 1.00 1.00 1.00 0.00 0.02 0.97012799 Biasar (27/55) Kullu 0.06 0.04 0.00 0.00 0.00 0.00 0.00 0.00 1.00 0.00 0.00 0.12012800 Up Muhal Thalli Kullu 0.00 0.00 0.00 0.00 0.00 0.00 0.00 0.00 0.00 0.00 0.00 0.00012801 Up Muhal Ropa sari Kullu 0.00 0.00 0.00 0.00 1.00 0.00 0.00 0.00 0.00 0.00 0.00 0.11012802 Up Muhal Mapak Kullu 0.00 0.00 0.00 0.00 1.00 0.00 0.00 0.00 0.00 0.00 0.00 0.11012803 Bandrol (27/56) Kullu 0.03 0.00 0.00 0.00 0.00 0.00 0.00 0.00 1.00 0.00 0.13 0.13012804 Up Muhal Nangabag Kullu 0.00 0.04 0.00 0.00 0.00 0.00 0.00 0.00 1.00 0.00 0.01 0.12012805 Up Muhal Harabag Kullu 0.00 0.00 0.00 0.00 0.00 0.00 0.00 0.00 0.00 0.00 0.00 0.00012806 Up Muhal Bagu Nalha Kullu 0.03 0.00 0.00 0.00 0.00 0.00 0.00 0.00 1.00 0.00 0.01 0.11012807 Up Muhal Maltibag Kullu 0.00 0.00 0.00 0.00 1.00 0.00 0.00 1.00 0.00 0.00 0.07 0.23012850 Jandor (26/54) Kullu 0.14 0.00 1.00 1.00 1.00 0.00 0.00 1.00 1.00 0.00 0.02 0.57012851 Banogi (26/53) Kullu 0.40 0.08 1.00 1.00 1.00 1.00 0.00 1.00 1.00 0.00 0.07 0.73012852 Sari (26/51) Kullu 0.17 0.08 1.00 0.00 1.00 0.00 0.00 0.00 1.00 0.00 0.00 0.36012853 Bastori (26/52) Kullu 0.14 0.04 1.00 1.00 0.00 0.00 0.00 0.00 1.00 0.00 0.00 0.35012854 Dughilag (30/67) Kullu 0.23 0.04 1.00 0.00 1.00 1.00 0.00 1.00 1.00 0.00 0.00 0.58012855 Majhat (30/68) Kullu 0.09 0.04 0.00 1.00 1.00 0.00 0.00 1.00 1.00 0.00 0.00 0.46012856 Phallan (30/66) Kullu 0.09 0.00 1.00 0.00 0.00 0.00 0.00 0.00 1.00 0.00 0.00 0.23012857 Dunkhri Gahar (30/65) Kullu 0.20 0.08 1.00 1.00 1.00 0.00 0.00 0.00 1.00 0.00 0.03 0.48012858 Pichhli (31/69) Kullu 0.11 0.08 1.00 0.00 1.00 0.00 0.00 0.00 1.00 0.00 0.04 0.36012859 Mashna (31/70) Kullu 0.09 0.08 1.00 0.00 0.00 0.00 0.00 0.00 1.00 0.00 0.03 0.24012860 Gahar (32/71) Kullu 0.06 0.08 1.00 0.00 1.00 0.00 0.00 0.00 1.00 0.00 0.00 0.35012861 Gramang (32/72) Kullu 0.11 0.04 1.00 1.00 1.00 0.00 0.00 0.00 1.00 0.00 0.00 0.46012862 Bhalyani (33/75) Kullu 0.17 0.04 1.00 1.00 1.00 0.00 0.00 0.00 1.00 0.00 0.02 0.47012863 Brahman (33/74) Kullu 0.09 0.04 1.00 0.00 1.00 0.00 0.00 0.00 1.00 0.00 0.01 0.35012864 Balh (33/73) Kullu 0.14 0.04 1.00 1.00 1.00 0.00 0.00 0.00 1.00 0.00 0.03 0.47012865 Bhumtir (33/76) Kullu 0.11 0.04 1.00 1.00 1.00 0.00 0.00 0.00 1.00 0.00 0.00 0.46012866 Peej (34/77) Kullu 0.20 0.08 1.00 0.00 1.00 1.00 0.00 1.00 0.00 0.00 0.00 0.47012867 Balh (34/79) Kullu 0.17 0.04 0.00 1.00 1.00 1.00 0.00 1.00 1.00 0.00 0.09 0.59012868 Kharihar (34/81) Kullu 0.14 0.08 1.00 1.00 1.00 0.00 0.00 0.00 1.00 0.00 0.00 0.47012869 Barahar (34/80) Kullu 0.14 0.08 1.00 0.00 1.00 0.00 0.00 0.00 1.00 0.00 0.00 0.36012871 Rajgiri (35/82) Kullu 0.06 0.00 0.00 1.00 1.00 0.00 0.00 0.00 1.00 0.00 0.00 0.34012872 Shillihar (35/83) Kullu 0.17 0.04 0.00 1.00 1.00 0.00 0.00 0.00 1.00 0.00 0.00 0.36012873 Mohal (35/84) Kullu 0.26 0.12 1.00 1.00 1.00 1.00 0.00 1.00 1.00 0.00 0.31 0.74012874 Bhullang (35/86) Kullu 0.11 0.04 1.00 1.00 1.00 0.00 0.00 0.00 1.00 0.00 0.00 0.46012875 Khokhan (35/87) Kullu 0.17 0.04 1.00 1.00 1.00 1.00 0.00 1.00 1.00 0.00 0.00 0.69012876 Neol (35/88) Kullu 0.06 0.08 1.00 0.00 1.00 0.00 0.00 0.00 1.00 0.00 0.00 0.35012877 Bajaura (36/89) Kullu 0.26 0.08 1.00 0.00 1.00 1.00 0.00 1.00 1.00 0.00 0.43 0.64012878 Hat (36/90) Kullu 0.23 0.04 1.00 0.00 1.00 0.00 0.00 1.00 1.00 0.00 0.01 0.47012879 Shillihar (37/91) Kullu 0.40 0.08 1.00 0.00 1.00 1.00 0.00 1.00 1.00 0.00 0.26 0.64012880 Kashawri (25/49) Kullu 0.17 0.12 1.00 1.00 1.00 1.00 0.00 0.00 1.00 0.00 0.00 0.59012881 Pini (25/48) Kullu 0.20 0.04 0.00 0.00 1.00 1.00 0.00 0.00 1.00 0.00 0.09 0.37012883 Manikarn (40/101) Kullu 0.54 0.15 1.00 1.00 1.00 1.00 0.00 1.00 1.00 0.00 0.00 0.74012884 Sosan (40/102) Kullu 0.20 0.08 1.00 1.00 1.00 1.00 0.00 1.00 1.00 0.00 0.00 0.70012885 Jari (39/100) Kullu 0.20 0.12 1.00 1.00 1.00 1.00 0.00 1.00 1.00 0.00 0.13 0.71012886 Bradha (39/99) Kullu 0.20 0.08 1.00 1.00 1.00 1.00 0.00 1.00 1.00 0.00 0.10 0.71012887 Shat (38/98) Kullu 0.09 0.04 1.00 0.00 1.00 0.00 0.00 1.00 1.00 0.00 0.06 0.46012888 Chong (38/96) Kullu 0.20 0.08 1.00 1.00 1.00 0.00 0.00 1.00 1.00 0.00 0.06 0.59012889 Jallu (38/97) Kullu 0.17 0.04 1.00 1.00 1.00 0.00 0.00 1.00 1.00 0.00 0.06 0.58012890 Ratocha (38/95) Kullu 0.17 0.04 1.00 0.00 1.00 0.00 0.00 1.00 1.00 0.00 0.06 0.47012891 Diar (37/92) Kullu 0.23 0.08 1.00 1.00 1.00 1.00 0.00 1.00 0.00 0.00 0.20 0.61012892 Rote-II (42/107) Kullu 0.20 0.04 1.00 0.00 1.00 1.00 0.00 1.00 1.00 0.00 0.24 0.61012893 Bhallan-I (42/106) Kullu 0.23 0.08 1.00 1.00 1.00 1.00 0.00 1.00 1.00 0.00 0.09 0.71012894 Manjhli (37/93) Kullu 0.29 0.04 1.00 1.00 1.00 1.00 0.00 0.00 1.00 0.00 0.00 0.59012895 Parli (37/94) Kullu 0.17 0.15 1.00 1.00 1.00 1.00 0.00 0.00 1.00 0.00 0.09 0.60012896 Shamshi (CT) Kullu 0.63 0.38 1.00 1.00 1.00 1.00 1.00 1.00 1.00 0.00 0.03 0.89012897 Raila (42/105) Kullu 0.40 0.12 0.00 1.00 0.00 1.00 0.00 0.00 0.00 0.00 0.00 0.28
Climate Change Vulnerability Assessment Report 134
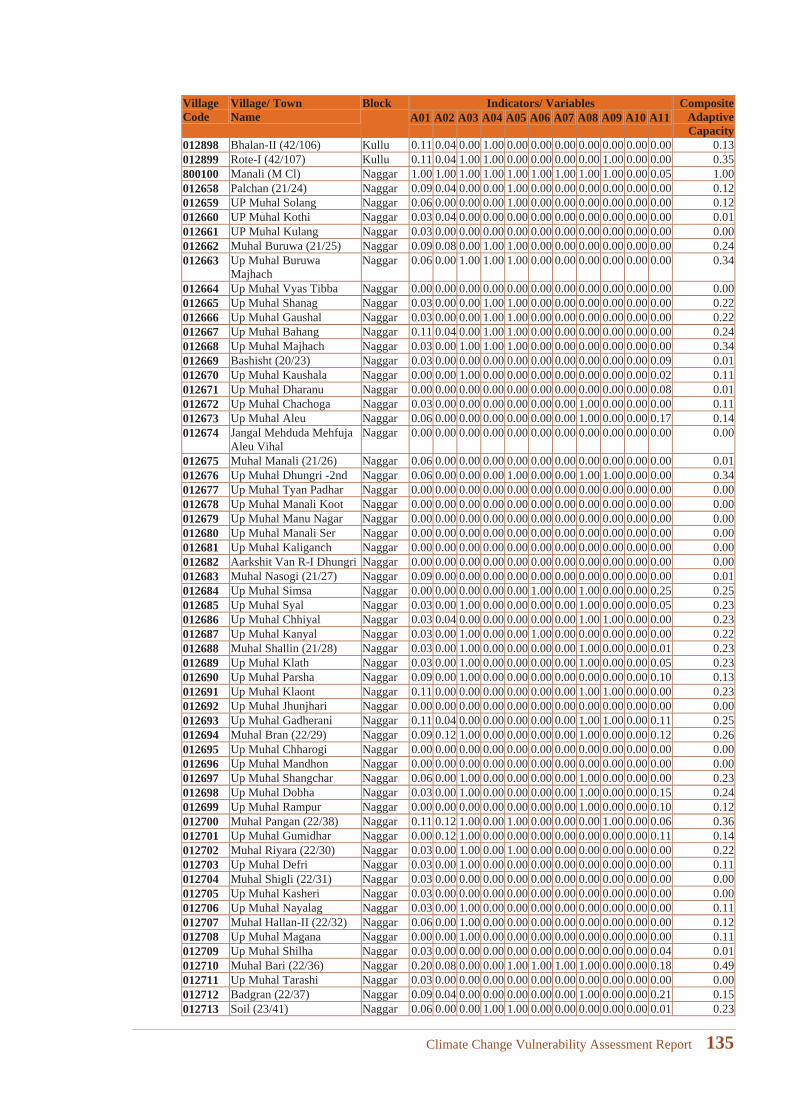
VillageCode
Village/ TownName
Block Indicators/ Variables CompositeAdaptiveCapacity
A01 A02 A03 A04 A05 A06 A07 A08 A09 A10 A11
012898 Bhalan-II (42/106) Kullu 0.11 0.04 0.00 1.00 0.00 0.00 0.00 0.00 0.00 0.00 0.00 0.13012899 Rote-I (42/107) Kullu 0.11 0.04 1.00 1.00 0.00 0.00 0.00 0.00 1.00 0.00 0.00 0.35800100 Manali (M Cl) Naggar 1.00 1.00 1.00 1.00 1.00 1.00 1.00 1.00 1.00 0.00 0.05 1.00012658 Palchan (21/24) Naggar 0.09 0.04 0.00 0.00 1.00 0.00 0.00 0.00 0.00 0.00 0.00 0.12012659 UP Muhal Solang Naggar 0.06 0.00 0.00 0.00 1.00 0.00 0.00 0.00 0.00 0.00 0.00 0.12012660 UP Muhal Kothi Naggar 0.03 0.04 0.00 0.00 0.00 0.00 0.00 0.00 0.00 0.00 0.00 0.01012661 UP Muhal Kulang Naggar 0.03 0.00 0.00 0.00 0.00 0.00 0.00 0.00 0.00 0.00 0.00 0.00012662 Muhal Buruwa (21/25) Naggar 0.09 0.08 0.00 1.00 1.00 0.00 0.00 0.00 0.00 0.00 0.00 0.24012663 Up Muhal Buruwa
Majhach Naggar 0.06 0.00 1.00 1.00 1.00 0.00 0.00 0.00 0.00 0.00 0.00 0.34
012664 Up Muhal Vyas Tibba Naggar 0.00 0.00 0.00 0.00 0.00 0.00 0.00 0.00 0.00 0.00 0.00 0.00012665 Up Muhal Shanag Naggar 0.03 0.00 0.00 1.00 1.00 0.00 0.00 0.00 0.00 0.00 0.00 0.22012666 Up Muhal Gaushal Naggar 0.03 0.00 0.00 1.00 1.00 0.00 0.00 0.00 0.00 0.00 0.00 0.22012667 Up Muhal Bahang Naggar 0.11 0.04 0.00 1.00 1.00 0.00 0.00 0.00 0.00 0.00 0.00 0.24012668 Up Muhal Majhach Naggar 0.03 0.00 1.00 1.00 1.00 0.00 0.00 0.00 0.00 0.00 0.00 0.34012669 Bashisht (20/23) Naggar 0.03 0.00 0.00 0.00 0.00 0.00 0.00 0.00 0.00 0.00 0.09 0.01012670 Up Muhal Kaushala Naggar 0.00 0.00 1.00 0.00 0.00 0.00 0.00 0.00 0.00 0.00 0.02 0.11012671 Up Muhal Dharanu Naggar 0.00 0.00 0.00 0.00 0.00 0.00 0.00 0.00 0.00 0.00 0.08 0.01012672 Up Muhal Chachoga Naggar 0.03 0.00 0.00 0.00 0.00 0.00 0.00 1.00 0.00 0.00 0.00 0.11012673 Up Muhal Aleu Naggar 0.06 0.00 0.00 0.00 0.00 0.00 0.00 1.00 0.00 0.00 0.17 0.14012674 Jangal Mehduda Mehfuja
Aleu VihalNaggar 0.00 0.00 0.00 0.00 0.00 0.00 0.00 0.00 0.00 0.00 0.00 0.00
012675 Muhal Manali (21/26) Naggar 0.06 0.00 0.00 0.00 0.00 0.00 0.00 0.00 0.00 0.00 0.00 0.01012676 Up Muhal Dhungri -2nd Naggar 0.06 0.00 0.00 0.00 1.00 0.00 0.00 1.00 1.00 0.00 0.00 0.34012677 Up Muhal Tyan Padhar Naggar 0.00 0.00 0.00 0.00 0.00 0.00 0.00 0.00 0.00 0.00 0.00 0.00012678 Up Muhal Manali Koot Naggar 0.00 0.00 0.00 0.00 0.00 0.00 0.00 0.00 0.00 0.00 0.00 0.00012679 Up Muhal Manu Nagar Naggar 0.00 0.00 0.00 0.00 0.00 0.00 0.00 0.00 0.00 0.00 0.00 0.00012680 Up Muhal Manali Ser Naggar 0.00 0.00 0.00 0.00 0.00 0.00 0.00 0.00 0.00 0.00 0.00 0.00012681 Up Muhal Kaliganch Naggar 0.00 0.00 0.00 0.00 0.00 0.00 0.00 0.00 0.00 0.00 0.00 0.00012682 Aarkshit Van R-I Dhungri Naggar 0.00 0.00 0.00 0.00 0.00 0.00 0.00 0.00 0.00 0.00 0.00 0.00012683 Muhal Nasogi (21/27) Naggar 0.09 0.00 0.00 0.00 0.00 0.00 0.00 0.00 0.00 0.00 0.00 0.01012684 Up Muhal Simsa Naggar 0.00 0.00 0.00 0.00 0.00 1.00 0.00 1.00 0.00 0.00 0.25 0.25012685 Up Muhal Syal Naggar 0.03 0.00 1.00 0.00 0.00 0.00 0.00 1.00 0.00 0.00 0.05 0.23012686 Up Muhal Chhiyal Naggar 0.03 0.04 0.00 0.00 0.00 0.00 0.00 1.00 1.00 0.00 0.00 0.23012687 Up Muhal Kanyal Naggar 0.03 0.00 1.00 0.00 0.00 1.00 0.00 0.00 0.00 0.00 0.00 0.22012688 Muhal Shallin (21/28) Naggar 0.03 0.00 1.00 0.00 0.00 0.00 0.00 1.00 0.00 0.00 0.01 0.23012689 Up Muhal Klath Naggar 0.03 0.00 1.00 0.00 0.00 0.00 0.00 1.00 0.00 0.00 0.05 0.23012690 Up Muhal Parsha Naggar 0.09 0.00 1.00 0.00 0.00 0.00 0.00 0.00 0.00 0.00 0.10 0.13012691 Up Muhal Klaont Naggar 0.11 0.00 0.00 0.00 0.00 0.00 0.00 1.00 1.00 0.00 0.00 0.23012692 Up Muhal Jhunjhari Naggar 0.00 0.00 0.00 0.00 0.00 0.00 0.00 0.00 0.00 0.00 0.00 0.00012693 Up Muhal Gadherani Naggar 0.11 0.04 0.00 0.00 0.00 0.00 0.00 1.00 1.00 0.00 0.11 0.25012694 Muhal Bran (22/29) Naggar 0.09 0.12 1.00 0.00 0.00 0.00 0.00 1.00 0.00 0.00 0.12 0.26012695 Up Muhal Chharogi Naggar 0.00 0.00 0.00 0.00 0.00 0.00 0.00 0.00 0.00 0.00 0.00 0.00012696 Up Muhal Mandhon Naggar 0.00 0.00 0.00 0.00 0.00 0.00 0.00 0.00 0.00 0.00 0.00 0.00012697 Up Muhal Shangchar Naggar 0.06 0.00 1.00 0.00 0.00 0.00 0.00 1.00 0.00 0.00 0.00 0.23012698 Up Muhal Dobha Naggar 0.03 0.00 1.00 0.00 0.00 0.00 0.00 1.00 0.00 0.00 0.15 0.24012699 Up Muhal Rampur Naggar 0.00 0.00 0.00 0.00 0.00 0.00 0.00 1.00 0.00 0.00 0.10 0.12012700 Muhal Pangan (22/38) Naggar 0.11 0.12 1.00 0.00 1.00 0.00 0.00 0.00 1.00 0.00 0.06 0.36012701 Up Muhal Gumidhar Naggar 0.00 0.12 1.00 0.00 0.00 0.00 0.00 0.00 0.00 0.00 0.11 0.14012702 Muhal Riyara (22/30) Naggar 0.03 0.00 1.00 0.00 1.00 0.00 0.00 0.00 0.00 0.00 0.00 0.22012703 Up Muhal Defri Naggar 0.03 0.00 1.00 0.00 0.00 0.00 0.00 0.00 0.00 0.00 0.00 0.11012704 Muhal Shigli (22/31) Naggar 0.03 0.00 0.00 0.00 0.00 0.00 0.00 0.00 0.00 0.00 0.00 0.00012705 Up Muhal Kasheri Naggar 0.03 0.00 0.00 0.00 0.00 0.00 0.00 0.00 0.00 0.00 0.00 0.00012706 Up Muhal Nayalag Naggar 0.03 0.00 1.00 0.00 0.00 0.00 0.00 0.00 0.00 0.00 0.00 0.11012707 Muhal Hallan-II (22/32) Naggar 0.06 0.00 1.00 0.00 0.00 0.00 0.00 0.00 0.00 0.00 0.00 0.12012708 Up Muhal Magana Naggar 0.00 0.00 1.00 0.00 0.00 0.00 0.00 0.00 0.00 0.00 0.00 0.11012709 Up Muhal Shilha Naggar 0.03 0.00 0.00 0.00 0.00 0.00 0.00 0.00 0.00 0.00 0.04 0.01012710 Muhal Bari (22/36) Naggar 0.20 0.08 0.00 0.00 1.00 1.00 1.00 1.00 0.00 0.00 0.18 0.49012711 Up Muhal Tarashi Naggar 0.03 0.00 0.00 0.00 0.00 0.00 0.00 0.00 0.00 0.00 0.00 0.00012712 Badgran (22/37) Naggar 0.09 0.04 0.00 0.00 0.00 0.00 0.00 1.00 0.00 0.00 0.21 0.15012713 Soil (23/41) Naggar 0.06 0.00 0.00 1.00 1.00 0.00 0.00 0.00 0.00 0.00 0.01 0.23
Climate Change Vulnerability Assessment Report 135
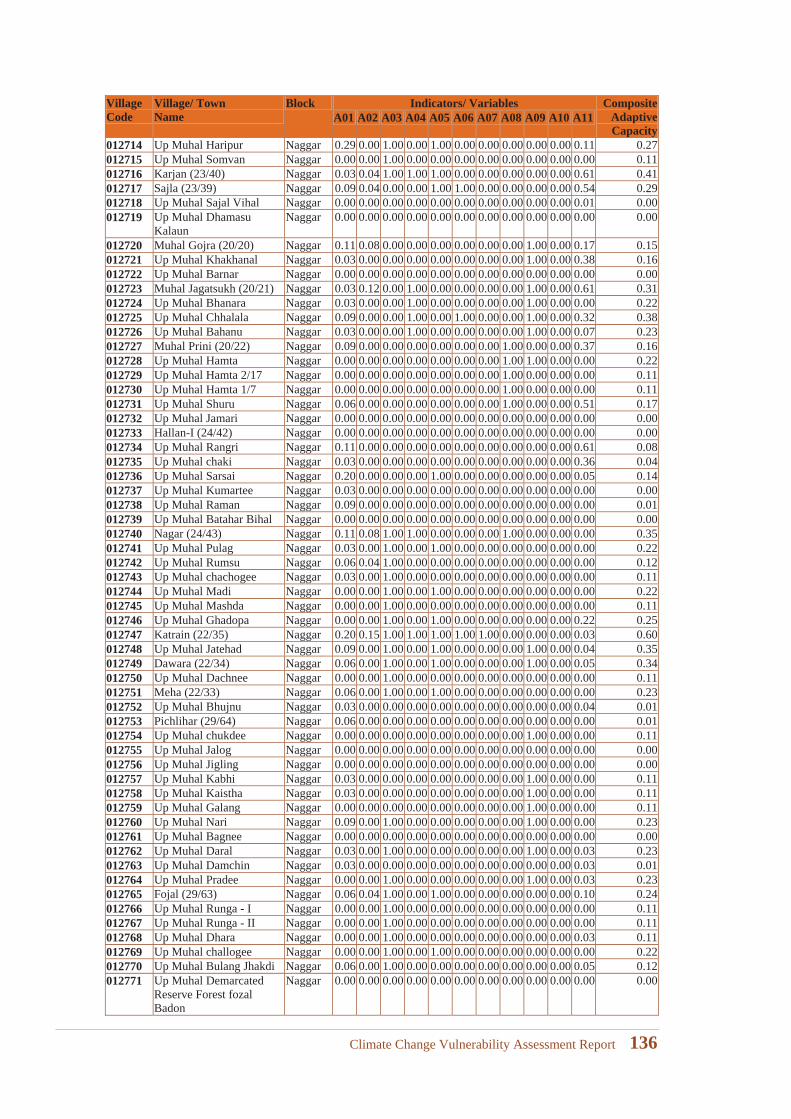
VillageCode
Village/ TownName
Block Indicators/ Variables CompositeAdaptiveCapacity
A01 A02 A03 A04 A05 A06 A07 A08 A09 A10 A11
012714 Up Muhal Haripur Naggar 0.29 0.00 1.00 0.00 1.00 0.00 0.00 0.00 0.00 0.00 0.11 0.27012715 Up Muhal Somvan Naggar 0.00 0.00 1.00 0.00 0.00 0.00 0.00 0.00 0.00 0.00 0.00 0.11012716 Karjan (23/40) Naggar 0.03 0.04 1.00 1.00 1.00 0.00 0.00 0.00 0.00 0.00 0.61 0.41012717 Sajla (23/39) Naggar 0.09 0.04 0.00 0.00 1.00 1.00 0.00 0.00 0.00 0.00 0.54 0.29012718 Up Muhal Sajal Vihal Naggar 0.00 0.00 0.00 0.00 0.00 0.00 0.00 0.00 0.00 0.00 0.01 0.00012719 Up Muhal Dhamasu
KalaunNaggar 0.00 0.00 0.00 0.00 0.00 0.00 0.00 0.00 0.00 0.00 0.00 0.00
012720 Muhal Gojra (20/20) Naggar 0.11 0.08 0.00 0.00 0.00 0.00 0.00 0.00 1.00 0.00 0.17 0.15012721 Up Muhal Khakhanal Naggar 0.03 0.00 0.00 0.00 0.00 0.00 0.00 0.00 1.00 0.00 0.38 0.16012722 Up Muhal Barnar Naggar 0.00 0.00 0.00 0.00 0.00 0.00 0.00 0.00 0.00 0.00 0.00 0.00012723 Muhal Jagatsukh (20/21) Naggar 0.03 0.12 0.00 1.00 0.00 0.00 0.00 0.00 1.00 0.00 0.61 0.31012724 Up Muhal Bhanara Naggar 0.03 0.00 0.00 1.00 0.00 0.00 0.00 0.00 1.00 0.00 0.00 0.22012725 Up Muhal Chhalala Naggar 0.09 0.00 0.00 1.00 0.00 1.00 0.00 0.00 1.00 0.00 0.32 0.38012726 Up Muhal Bahanu Naggar 0.03 0.00 0.00 1.00 0.00 0.00 0.00 0.00 1.00 0.00 0.07 0.23012727 Muhal Prini (20/22) Naggar 0.09 0.00 0.00 0.00 0.00 0.00 0.00 1.00 0.00 0.00 0.37 0.16012728 Up Muhal Hamta Naggar 0.00 0.00 0.00 0.00 0.00 0.00 0.00 1.00 1.00 0.00 0.00 0.22012729 Up Muhal Hamta 2/17 Naggar 0.00 0.00 0.00 0.00 0.00 0.00 0.00 1.00 0.00 0.00 0.00 0.11012730 Up Muhal Hamta 1/7 Naggar 0.00 0.00 0.00 0.00 0.00 0.00 0.00 1.00 0.00 0.00 0.00 0.11012731 Up Muhal Shuru Naggar 0.06 0.00 0.00 0.00 0.00 0.00 0.00 1.00 0.00 0.00 0.51 0.17012732 Up Muhal Jamari Naggar 0.00 0.00 0.00 0.00 0.00 0.00 0.00 0.00 0.00 0.00 0.00 0.00012733 Hallan-I (24/42) Naggar 0.00 0.00 0.00 0.00 0.00 0.00 0.00 0.00 0.00 0.00 0.00 0.00012734 Up Muhal Rangri Naggar 0.11 0.00 0.00 0.00 0.00 0.00 0.00 0.00 0.00 0.00 0.61 0.08012735 Up Muhal chaki Naggar 0.03 0.00 0.00 0.00 0.00 0.00 0.00 0.00 0.00 0.00 0.36 0.04012736 Up Muhal Sarsai Naggar 0.20 0.00 0.00 0.00 1.00 0.00 0.00 0.00 0.00 0.00 0.05 0.14012737 Up Muhal Kumartee Naggar 0.03 0.00 0.00 0.00 0.00 0.00 0.00 0.00 0.00 0.00 0.00 0.00012738 Up Muhal Raman Naggar 0.09 0.00 0.00 0.00 0.00 0.00 0.00 0.00 0.00 0.00 0.00 0.01012739 Up Muhal Batahar Bihal Naggar 0.00 0.00 0.00 0.00 0.00 0.00 0.00 0.00 0.00 0.00 0.00 0.00012740 Nagar (24/43) Naggar 0.11 0.08 1.00 1.00 0.00 0.00 0.00 1.00 0.00 0.00 0.00 0.35012741 Up Muhal Pulag Naggar 0.03 0.00 1.00 0.00 1.00 0.00 0.00 0.00 0.00 0.00 0.00 0.22012742 Up Muhal Rumsu Naggar 0.06 0.04 1.00 0.00 0.00 0.00 0.00 0.00 0.00 0.00 0.00 0.12012743 Up Muhal chachogee Naggar 0.03 0.00 1.00 0.00 0.00 0.00 0.00 0.00 0.00 0.00 0.00 0.11012744 Up Muhal Madi Naggar 0.00 0.00 1.00 0.00 1.00 0.00 0.00 0.00 0.00 0.00 0.00 0.22012745 Up Muhal Mashda Naggar 0.00 0.00 1.00 0.00 0.00 0.00 0.00 0.00 0.00 0.00 0.00 0.11012746 Up Muhal Ghadopa Naggar 0.00 0.00 1.00 0.00 1.00 0.00 0.00 0.00 0.00 0.00 0.22 0.25012747 Katrain (22/35) Naggar 0.20 0.15 1.00 1.00 1.00 1.00 1.00 0.00 0.00 0.00 0.03 0.60012748 Up Muhal Jatehad Naggar 0.09 0.00 1.00 0.00 1.00 0.00 0.00 0.00 1.00 0.00 0.04 0.35012749 Dawara (22/34) Naggar 0.06 0.00 1.00 0.00 1.00 0.00 0.00 0.00 1.00 0.00 0.05 0.34012750 Up Muhal Dachnee Naggar 0.00 0.00 1.00 0.00 0.00 0.00 0.00 0.00 0.00 0.00 0.00 0.11012751 Meha (22/33) Naggar 0.06 0.00 1.00 0.00 1.00 0.00 0.00 0.00 0.00 0.00 0.00 0.23012752 Up Muhal Bhujnu Naggar 0.03 0.00 0.00 0.00 0.00 0.00 0.00 0.00 0.00 0.00 0.04 0.01012753 Pichlihar (29/64) Naggar 0.06 0.00 0.00 0.00 0.00 0.00 0.00 0.00 0.00 0.00 0.00 0.01012754 Up Muhal chukdee Naggar 0.00 0.00 0.00 0.00 0.00 0.00 0.00 0.00 1.00 0.00 0.00 0.11012755 Up Muhal Jalog Naggar 0.00 0.00 0.00 0.00 0.00 0.00 0.00 0.00 0.00 0.00 0.00 0.00012756 Up Muhal Jigling Naggar 0.00 0.00 0.00 0.00 0.00 0.00 0.00 0.00 0.00 0.00 0.00 0.00012757 Up Muhal Kabhi Naggar 0.03 0.00 0.00 0.00 0.00 0.00 0.00 0.00 1.00 0.00 0.00 0.11012758 Up Muhal Kaistha Naggar 0.03 0.00 0.00 0.00 0.00 0.00 0.00 0.00 1.00 0.00 0.00 0.11012759 Up Muhal Galang Naggar 0.00 0.00 0.00 0.00 0.00 0.00 0.00 0.00 1.00 0.00 0.00 0.11012760 Up Muhal Nari Naggar 0.09 0.00 1.00 0.00 0.00 0.00 0.00 0.00 1.00 0.00 0.00 0.23012761 Up Muhal Bagnee Naggar 0.00 0.00 0.00 0.00 0.00 0.00 0.00 0.00 0.00 0.00 0.00 0.00012762 Up Muhal Daral Naggar 0.03 0.00 1.00 0.00 0.00 0.00 0.00 0.00 1.00 0.00 0.03 0.23012763 Up Muhal Damchin Naggar 0.03 0.00 0.00 0.00 0.00 0.00 0.00 0.00 0.00 0.00 0.03 0.01012764 Up Muhal Pradee Naggar 0.00 0.00 1.00 0.00 0.00 0.00 0.00 0.00 1.00 0.00 0.03 0.23012765 Fojal (29/63) Naggar 0.06 0.04 1.00 0.00 1.00 0.00 0.00 0.00 0.00 0.00 0.10 0.24012766 Up Muhal Runga - I Naggar 0.00 0.00 1.00 0.00 0.00 0.00 0.00 0.00 0.00 0.00 0.00 0.11012767 Up Muhal Runga - II Naggar 0.00 0.00 1.00 0.00 0.00 0.00 0.00 0.00 0.00 0.00 0.00 0.11012768 Up Muhal Dhara Naggar 0.00 0.00 1.00 0.00 0.00 0.00 0.00 0.00 0.00 0.00 0.03 0.11012769 Up Muhal challogee Naggar 0.00 0.00 1.00 0.00 1.00 0.00 0.00 0.00 0.00 0.00 0.00 0.22012770 Up Muhal Bulang Jhakdi Naggar 0.06 0.00 1.00 0.00 0.00 0.00 0.00 0.00 0.00 0.00 0.05 0.12012771 Up Muhal Demarcated
Reserve Forest fozal Badon
Naggar 0.00 0.00 0.00 0.00 0.00 0.00 0.00 0.00 0.00 0.00 0.00 0.00
Climate Change Vulnerability Assessment Report 136
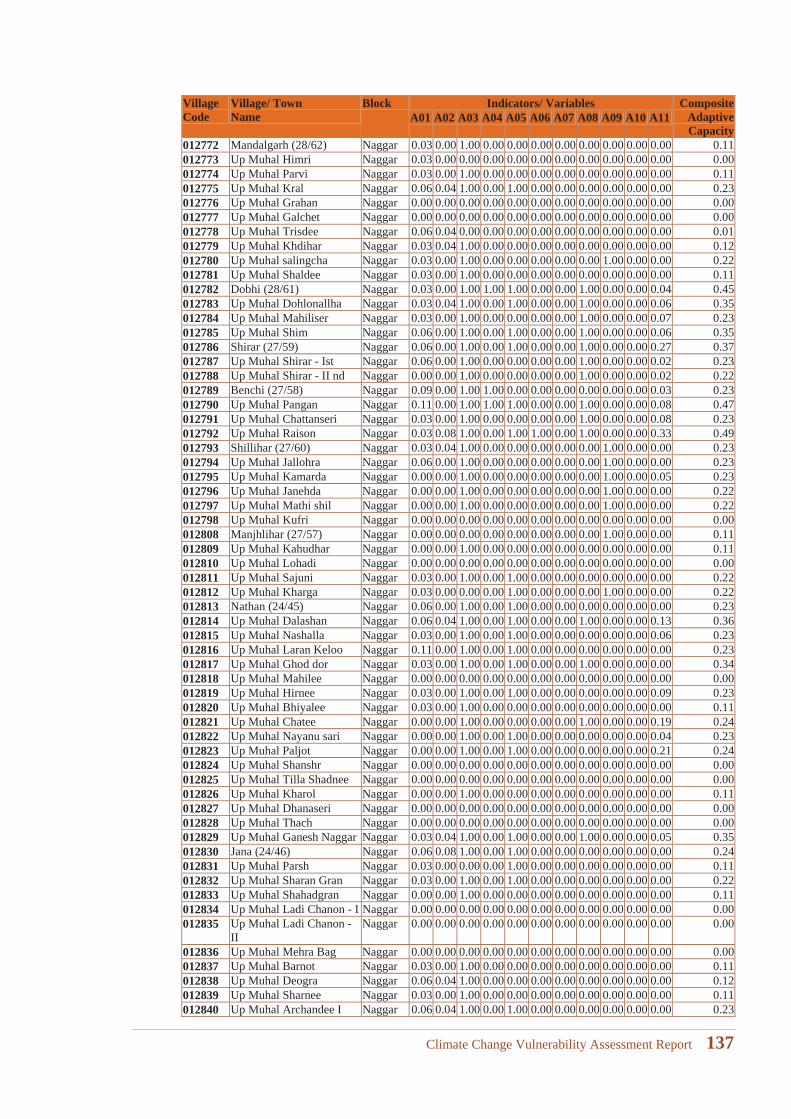
VillageCode
Village/ TownName
Block Indicators/ Variables CompositeAdaptiveCapacity
A01 A02 A03 A04 A05 A06 A07 A08 A09 A10 A11
012772 Mandalgarh (28/62) Naggar 0.03 0.00 1.00 0.00 0.00 0.00 0.00 0.00 0.00 0.00 0.00 0.11012773 Up Muhal Himri Naggar 0.03 0.00 0.00 0.00 0.00 0.00 0.00 0.00 0.00 0.00 0.00 0.00012774 Up Muhal Parvi Naggar 0.03 0.00 1.00 0.00 0.00 0.00 0.00 0.00 0.00 0.00 0.00 0.11012775 Up Muhal Kral Naggar 0.06 0.04 1.00 0.00 1.00 0.00 0.00 0.00 0.00 0.00 0.00 0.23012776 Up Muhal Grahan Naggar 0.00 0.00 0.00 0.00 0.00 0.00 0.00 0.00 0.00 0.00 0.00 0.00012777 Up Muhal Galchet Naggar 0.00 0.00 0.00 0.00 0.00 0.00 0.00 0.00 0.00 0.00 0.00 0.00012778 Up Muhal Trisdee Naggar 0.06 0.04 0.00 0.00 0.00 0.00 0.00 0.00 0.00 0.00 0.00 0.01012779 Up Muhal Khdihar Naggar 0.03 0.04 1.00 0.00 0.00 0.00 0.00 0.00 0.00 0.00 0.00 0.12012780 Up Muhal salingcha Naggar 0.03 0.00 1.00 0.00 0.00 0.00 0.00 0.00 1.00 0.00 0.00 0.22012781 Up Muhal Shaldee Naggar 0.03 0.00 1.00 0.00 0.00 0.00 0.00 0.00 0.00 0.00 0.00 0.11012782 Dobhi (28/61) Naggar 0.03 0.00 1.00 1.00 1.00 0.00 0.00 1.00 0.00 0.00 0.04 0.45012783 Up Muhal Dohlonallha Naggar 0.03 0.04 1.00 0.00 1.00 0.00 0.00 1.00 0.00 0.00 0.06 0.35012784 Up Muhal Mahiliser Naggar 0.03 0.00 1.00 0.00 0.00 0.00 0.00 1.00 0.00 0.00 0.07 0.23012785 Up Muhal Shim Naggar 0.06 0.00 1.00 0.00 1.00 0.00 0.00 1.00 0.00 0.00 0.06 0.35012786 Shirar (27/59) Naggar 0.06 0.00 1.00 0.00 1.00 0.00 0.00 1.00 0.00 0.00 0.27 0.37012787 Up Muhal Shirar - Ist Naggar 0.06 0.00 1.00 0.00 0.00 0.00 0.00 1.00 0.00 0.00 0.02 0.23012788 Up Muhal Shirar - II nd Naggar 0.00 0.00 1.00 0.00 0.00 0.00 0.00 1.00 0.00 0.00 0.02 0.22012789 Benchi (27/58) Naggar 0.09 0.00 1.00 1.00 0.00 0.00 0.00 0.00 0.00 0.00 0.03 0.23012790 Up Muhal Pangan Naggar 0.11 0.00 1.00 1.00 1.00 0.00 0.00 1.00 0.00 0.00 0.08 0.47012791 Up Muhal Chattanseri Naggar 0.03 0.00 1.00 0.00 0.00 0.00 0.00 1.00 0.00 0.00 0.08 0.23012792 Up Muhal Raison Naggar 0.03 0.08 1.00 0.00 1.00 1.00 0.00 1.00 0.00 0.00 0.33 0.49012793 Shillihar (27/60) Naggar 0.03 0.04 1.00 0.00 0.00 0.00 0.00 0.00 1.00 0.00 0.00 0.23012794 Up Muhal Jallohra Naggar 0.06 0.00 1.00 0.00 0.00 0.00 0.00 0.00 1.00 0.00 0.00 0.23012795 Up Muhal Kamarda Naggar 0.00 0.00 1.00 0.00 0.00 0.00 0.00 0.00 1.00 0.00 0.05 0.23012796 Up Muhal Janehda Naggar 0.00 0.00 1.00 0.00 0.00 0.00 0.00 0.00 1.00 0.00 0.00 0.22012797 Up Muhal Mathi shil Naggar 0.00 0.00 1.00 0.00 0.00 0.00 0.00 0.00 1.00 0.00 0.00 0.22012798 Up Muhal Kufri Naggar 0.00 0.00 0.00 0.00 0.00 0.00 0.00 0.00 0.00 0.00 0.00 0.00012808 Manjhlihar (27/57) Naggar 0.00 0.00 0.00 0.00 0.00 0.00 0.00 0.00 1.00 0.00 0.00 0.11012809 Up Muhal Kahudhar Naggar 0.00 0.00 1.00 0.00 0.00 0.00 0.00 0.00 0.00 0.00 0.00 0.11012810 Up Muhal Lohadi Naggar 0.00 0.00 0.00 0.00 0.00 0.00 0.00 0.00 0.00 0.00 0.00 0.00012811 Up Muhal Sajuni Naggar 0.03 0.00 1.00 0.00 1.00 0.00 0.00 0.00 0.00 0.00 0.00 0.22012812 Up Muhal Kharga Naggar 0.03 0.00 0.00 0.00 1.00 0.00 0.00 0.00 1.00 0.00 0.00 0.22012813 Nathan (24/45) Naggar 0.06 0.00 1.00 0.00 1.00 0.00 0.00 0.00 0.00 0.00 0.00 0.23012814 Up Muhal Dalashan Naggar 0.06 0.04 1.00 0.00 1.00 0.00 0.00 1.00 0.00 0.00 0.13 0.36012815 Up Muhal Nashalla Naggar 0.03 0.00 1.00 0.00 1.00 0.00 0.00 0.00 0.00 0.00 0.06 0.23012816 Up Muhal Laran Keloo Naggar 0.11 0.00 1.00 0.00 1.00 0.00 0.00 0.00 0.00 0.00 0.00 0.23012817 Up Muhal Ghod dor Naggar 0.03 0.00 1.00 0.00 1.00 0.00 0.00 1.00 0.00 0.00 0.00 0.34012818 Up Muhal Mahilee Naggar 0.00 0.00 0.00 0.00 0.00 0.00 0.00 0.00 0.00 0.00 0.00 0.00012819 Up Muhal Hirnee Naggar 0.03 0.00 1.00 0.00 1.00 0.00 0.00 0.00 0.00 0.00 0.09 0.23012820 Up Muhal Bhiyalee Naggar 0.03 0.00 1.00 0.00 0.00 0.00 0.00 0.00 0.00 0.00 0.00 0.11012821 Up Muhal Chatee Naggar 0.00 0.00 1.00 0.00 0.00 0.00 0.00 1.00 0.00 0.00 0.19 0.24012822 Up Muhal Nayanu sari Naggar 0.00 0.00 1.00 0.00 1.00 0.00 0.00 0.00 0.00 0.00 0.04 0.23012823 Up Muhal Paljot Naggar 0.00 0.00 1.00 0.00 1.00 0.00 0.00 0.00 0.00 0.00 0.21 0.24012824 Up Muhal Shanshr Naggar 0.00 0.00 0.00 0.00 0.00 0.00 0.00 0.00 0.00 0.00 0.00 0.00012825 Up Muhal Tilla Shadnee Naggar 0.00 0.00 0.00 0.00 0.00 0.00 0.00 0.00 0.00 0.00 0.00 0.00012826 Up Muhal Kharol Naggar 0.00 0.00 1.00 0.00 0.00 0.00 0.00 0.00 0.00 0.00 0.00 0.11012827 Up Muhal Dhanaseri Naggar 0.00 0.00 0.00 0.00 0.00 0.00 0.00 0.00 0.00 0.00 0.00 0.00012828 Up Muhal Thach Naggar 0.00 0.00 0.00 0.00 0.00 0.00 0.00 0.00 0.00 0.00 0.00 0.00012829 Up Muhal Ganesh Naggar Naggar 0.03 0.04 1.00 0.00 1.00 0.00 0.00 1.00 0.00 0.00 0.05 0.35012830 Jana (24/46) Naggar 0.06 0.08 1.00 0.00 1.00 0.00 0.00 0.00 0.00 0.00 0.00 0.24012831 Up Muhal Parsh Naggar 0.03 0.00 0.00 0.00 1.00 0.00 0.00 0.00 0.00 0.00 0.00 0.11012832 Up Muhal Sharan Gran Naggar 0.03 0.00 1.00 0.00 1.00 0.00 0.00 0.00 0.00 0.00 0.00 0.22012833 Up Muhal Shahadgran Naggar 0.00 0.00 1.00 0.00 0.00 0.00 0.00 0.00 0.00 0.00 0.00 0.11012834 Up Muhal Ladi Chanon - I Naggar 0.00 0.00 0.00 0.00 0.00 0.00 0.00 0.00 0.00 0.00 0.00 0.00012835 Up Muhal Ladi Chanon -
IINaggar 0.00 0.00 0.00 0.00 0.00 0.00 0.00 0.00 0.00 0.00 0.00 0.00
012836 Up Muhal Mehra Bag Naggar 0.00 0.00 0.00 0.00 0.00 0.00 0.00 0.00 0.00 0.00 0.00 0.00012837 Up Muhal Barnot Naggar 0.03 0.00 1.00 0.00 0.00 0.00 0.00 0.00 0.00 0.00 0.00 0.11012838 Up Muhal Deogra Naggar 0.06 0.04 1.00 0.00 0.00 0.00 0.00 0.00 0.00 0.00 0.00 0.12012839 Up Muhal Sharnee Naggar 0.03 0.00 1.00 0.00 0.00 0.00 0.00 0.00 0.00 0.00 0.00 0.11012840 Up Muhal Archandee I Naggar 0.06 0.04 1.00 0.00 1.00 0.00 0.00 0.00 0.00 0.00 0.00 0.23
Climate Change Vulnerability Assessment Report 137
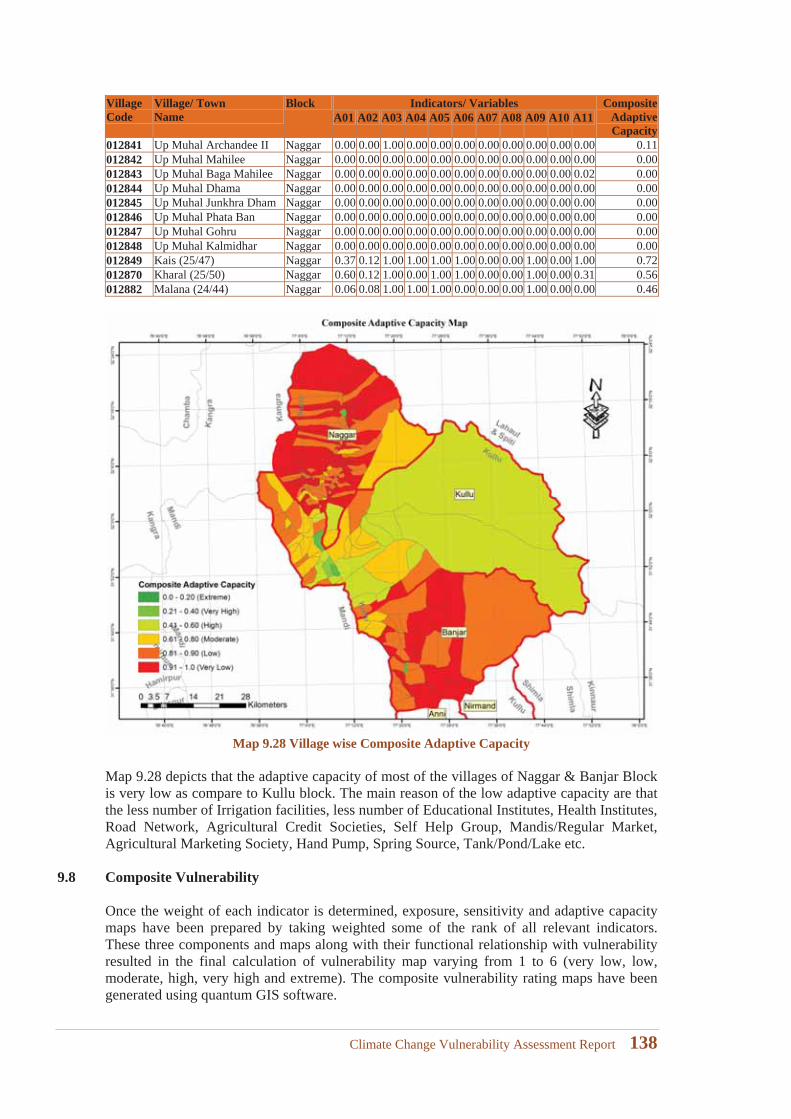
VillageCode
Village/ TownName
Block Indicators/ Variables CompositeAdaptiveCapacity
A01 A02 A03 A04 A05 A06 A07 A08 A09 A10 A11
012841 Up Muhal Archandee II Naggar 0.00 0.00 1.00 0.00 0.00 0.00 0.00 0.00 0.00 0.00 0.00 0.11012842 Up Muhal Mahilee Naggar 0.00 0.00 0.00 0.00 0.00 0.00 0.00 0.00 0.00 0.00 0.00 0.00012843 Up Muhal Baga Mahilee Naggar 0.00 0.00 0.00 0.00 0.00 0.00 0.00 0.00 0.00 0.00 0.02 0.00012844 Up Muhal Dhama Naggar 0.00 0.00 0.00 0.00 0.00 0.00 0.00 0.00 0.00 0.00 0.00 0.00012845 Up Muhal Junkhra Dham Naggar 0.00 0.00 0.00 0.00 0.00 0.00 0.00 0.00 0.00 0.00 0.00 0.00012846 Up Muhal Phata Ban Naggar 0.00 0.00 0.00 0.00 0.00 0.00 0.00 0.00 0.00 0.00 0.00 0.00012847 Up Muhal Gohru Naggar 0.00 0.00 0.00 0.00 0.00 0.00 0.00 0.00 0.00 0.00 0.00 0.00012848 Up Muhal Kalmidhar Naggar 0.00 0.00 0.00 0.00 0.00 0.00 0.00 0.00 0.00 0.00 0.00 0.00012849 Kais (25/47) Naggar 0.37 0.12 1.00 1.00 1.00 1.00 0.00 0.00 1.00 0.00 1.00 0.72012870 Kharal (25/50) Naggar 0.60 0.12 1.00 0.00 1.00 1.00 0.00 0.00 1.00 0.00 0.31 0.56012882 Malana (24/44) Naggar 0.06 0.08 1.00 1.00 1.00 0.00 0.00 0.00 1.00 0.00 0.00 0.46
Map 9.28 Village wise Composite Adaptive Capacity
Map 9.28 depicts that the adaptive capacity of most of the villages of Naggar & Banjar Block is very low as compare to Kullu block. The main reason of the low adaptive capacity are that the less number of Irrigation facilities, less number of Educational Institutes, Health Institutes,Road Network, Agricultural Credit Societies, Self Help Group, Mandis/Regular Market,Agricultural Marketing Society, Hand Pump, Spring Source, Tank/Pond/Lake etc.
9.8 Composite Vulnerability
Once the weight of each indicator is determined, exposure, sensitivity and adaptive capacity maps have been prepared by taking weighted some of the rank of all relevant indicators. These three components and maps along with their functional relationship with vulnerability resulted in the final calculation of vulnerability map varying from 1 to 6 (very low, low, moderate, high, very high and extreme). The composite vulnerability rating maps have beengenerated using quantum GIS software.
Climate Change Vulnerability Assessment Report 138
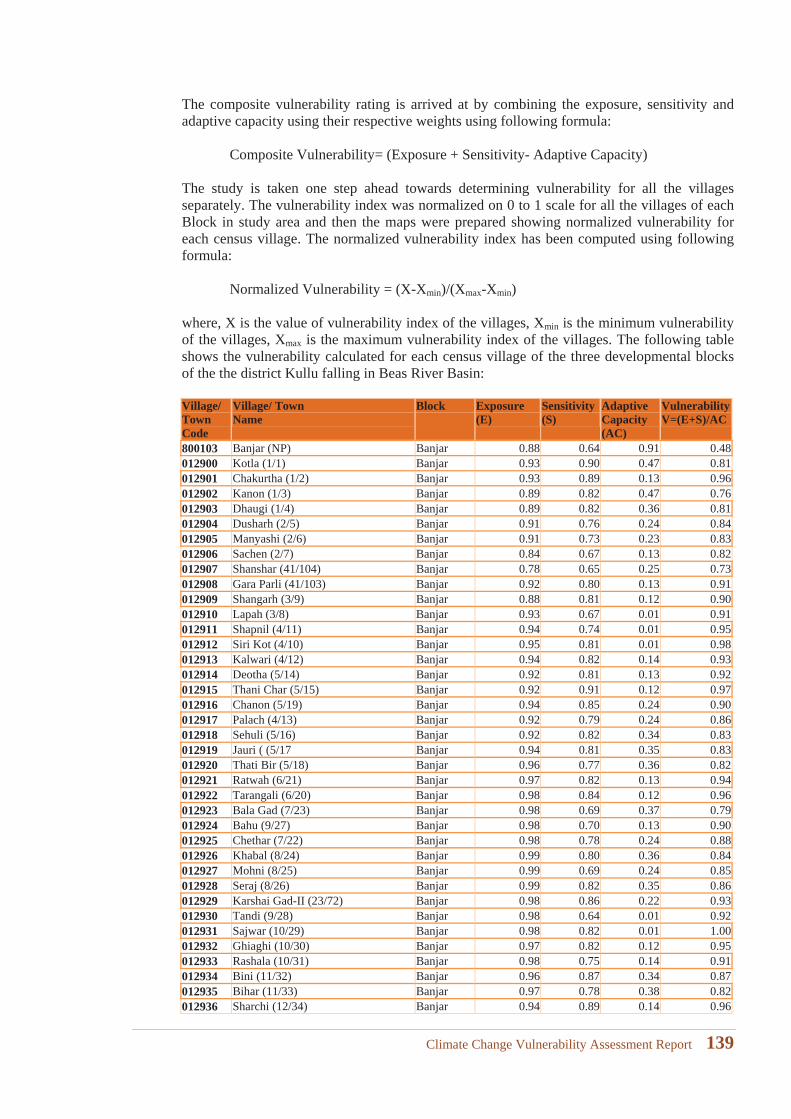
The composite vulnerability rating is arrived at by combining the exposure, sensitivity and adaptive capacity using their respective weights using following formula:
Composite Vulnerability= (Exposure + Sensitivity- Adaptive Capacity)
The study is taken one step ahead towards determining vulnerability for all the villagesseparately. The vulnerability index was normalized on 0 to 1 scale for all the villages of each Block in study area and then the maps were prepared showing normalized vulnerability for each census village. The normalized vulnerability index has been computed using following formula:
Normalized Vulnerability = (X-Xmin)/(Xmax-Xmin)
where, X is the value of vulnerability index of the villages, Xmin is the minimum vulnerability of the villages, Xmax is the maximum vulnerability index of the villages. The following table shows the vulnerability calculated for each census village of the three developmental blocks of the the district Kullu falling in Beas River Basin:
Village/Town Code
Village/ Town Name
Block Exposure(E)
Sensitivity(S)
Adaptive Capacity(AC)
VulnerabilityV=(E+S)/AC
800103 Banjar (NP) Banjar 0.88 0.64 0.91 0.48012900 Kotla (1/1) Banjar 0.93 0.90 0.47 0.81012901 Chakurtha (1/2) Banjar 0.93 0.89 0.13 0.96012902 Kanon (1/3) Banjar 0.89 0.82 0.47 0.76012903 Dhaugi (1/4) Banjar 0.89 0.82 0.36 0.81012904 Dusharh (2/5) Banjar 0.91 0.76 0.24 0.84012905 Manyashi (2/6) Banjar 0.91 0.73 0.23 0.83012906 Sachen (2/7) Banjar 0.84 0.67 0.13 0.82012907 Shanshar (41/104) Banjar 0.78 0.65 0.25 0.73012908 Gara Parli (41/103) Banjar 0.92 0.80 0.13 0.91012909 Shangarh (3/9) Banjar 0.88 0.81 0.12 0.90012910 Lapah (3/8) Banjar 0.93 0.67 0.01 0.91012911 Shapnil (4/11) Banjar 0.94 0.74 0.01 0.95012912 Siri Kot (4/10) Banjar 0.95 0.81 0.01 0.98012913 Kalwari (4/12) Banjar 0.94 0.82 0.14 0.93012914 Deotha (5/14) Banjar 0.92 0.81 0.13 0.92012915 Thani Char (5/15) Banjar 0.92 0.91 0.12 0.97012916 Chanon (5/19) Banjar 0.94 0.85 0.24 0.90012917 Palach (4/13) Banjar 0.92 0.79 0.24 0.86012918 Sehuli (5/16) Banjar 0.92 0.82 0.34 0.83012919 Jauri ( (5/17 Banjar 0.94 0.81 0.35 0.83012920 Thati Bir (5/18) Banjar 0.96 0.77 0.36 0.82012921 Ratwah (6/21) Banjar 0.97 0.82 0.13 0.94012922 Tarangali (6/20) Banjar 0.98 0.84 0.12 0.96012923 Bala Gad (7/23) Banjar 0.98 0.69 0.37 0.79012924 Bahu (9/27) Banjar 0.98 0.70 0.13 0.90012925 Chethar (7/22) Banjar 0.98 0.78 0.24 0.88012926 Khabal (8/24) Banjar 0.99 0.80 0.36 0.84012927 Mohni (8/25) Banjar 0.99 0.69 0.24 0.85012928 Seraj (8/26) Banjar 0.99 0.82 0.35 0.86012929 Karshai Gad-II (23/72) Banjar 0.98 0.86 0.22 0.93012930 Tandi (9/28) Banjar 0.98 0.64 0.01 0.92012931 Sajwar (10/29) Banjar 0.98 0.82 0.01 1.00012932 Ghiaghi (10/30) Banjar 0.97 0.82 0.12 0.95012933 Rashala (10/31) Banjar 0.98 0.75 0.14 0.91012934 Bini (11/32) Banjar 0.96 0.87 0.34 0.87012935 Bihar (11/33) Banjar 0.97 0.78 0.38 0.82012936 Sharchi (12/34) Banjar 0.94 0.89 0.14 0.96
Climate Change Vulnerability Assessment Report 139
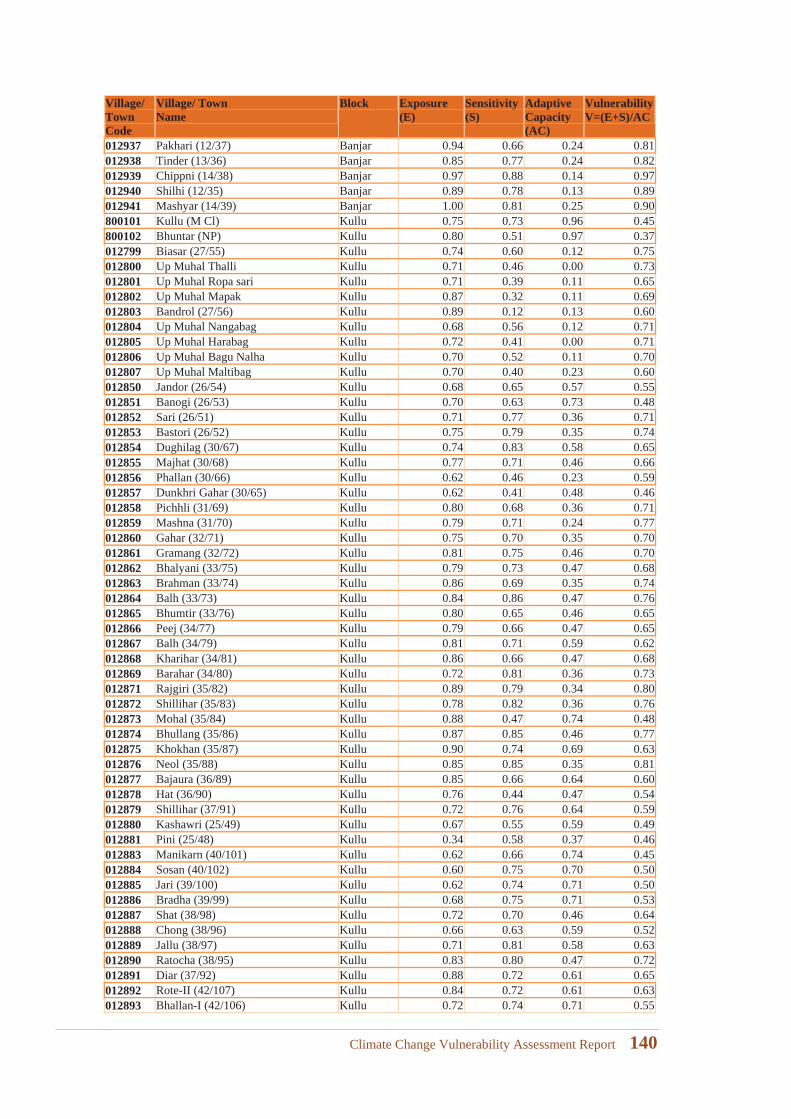
Village/Town Code
Village/ Town Name
Block Exposure(E)
Sensitivity(S)
Adaptive Capacity(AC)
VulnerabilityV=(E+S)/AC
012937 Pakhari (12/37) Banjar 0.94 0.66 0.24 0.81012938 Tinder (13/36) Banjar 0.85 0.77 0.24 0.82012939 Chippni (14/38) Banjar 0.97 0.88 0.14 0.97012940 Shilhi (12/35) Banjar 0.89 0.78 0.13 0.89012941 Mashyar (14/39) Banjar 1.00 0.81 0.25 0.90800101 Kullu (M Cl) Kullu 0.75 0.73 0.96 0.45800102 Bhuntar (NP) Kullu 0.80 0.51 0.97 0.37012799 Biasar (27/55) Kullu 0.74 0.60 0.12 0.75012800 Up Muhal Thalli Kullu 0.71 0.46 0.00 0.73012801 Up Muhal Ropa sari Kullu 0.71 0.39 0.11 0.65012802 Up Muhal Mapak Kullu 0.87 0.32 0.11 0.69012803 Bandrol (27/56) Kullu 0.89 0.12 0.13 0.60012804 Up Muhal Nangabag Kullu 0.68 0.56 0.12 0.71012805 Up Muhal Harabag Kullu 0.72 0.41 0.00 0.71012806 Up Muhal Bagu Nalha Kullu 0.70 0.52 0.11 0.70012807 Up Muhal Maltibag Kullu 0.70 0.40 0.23 0.60012850 Jandor (26/54) Kullu 0.68 0.65 0.57 0.55012851 Banogi (26/53) Kullu 0.70 0.63 0.73 0.48012852 Sari (26/51) Kullu 0.71 0.77 0.36 0.71012853 Bastori (26/52) Kullu 0.75 0.79 0.35 0.74012854 Dughilag (30/67) Kullu 0.74 0.83 0.58 0.65012855 Majhat (30/68) Kullu 0.77 0.71 0.46 0.66012856 Phallan (30/66) Kullu 0.62 0.46 0.23 0.59012857 Dunkhri Gahar (30/65) Kullu 0.62 0.41 0.48 0.46012858 Pichhli (31/69) Kullu 0.80 0.68 0.36 0.71012859 Mashna (31/70) Kullu 0.79 0.71 0.24 0.77012860 Gahar (32/71) Kullu 0.75 0.70 0.35 0.70012861 Gramang (32/72) Kullu 0.81 0.75 0.46 0.70012862 Bhalyani (33/75) Kullu 0.79 0.73 0.47 0.68012863 Brahman (33/74) Kullu 0.86 0.69 0.35 0.74012864 Balh (33/73) Kullu 0.84 0.86 0.47 0.76012865 Bhumtir (33/76) Kullu 0.80 0.65 0.46 0.65012866 Peej (34/77) Kullu 0.79 0.66 0.47 0.65012867 Balh (34/79) Kullu 0.81 0.71 0.59 0.62012868 Kharihar (34/81) Kullu 0.86 0.66 0.47 0.68012869 Barahar (34/80) Kullu 0.72 0.81 0.36 0.73012871 Rajgiri (35/82) Kullu 0.89 0.79 0.34 0.80012872 Shillihar (35/83) Kullu 0.78 0.82 0.36 0.76012873 Mohal (35/84) Kullu 0.88 0.47 0.74 0.48012874 Bhullang (35/86) Kullu 0.87 0.85 0.46 0.77012875 Khokhan (35/87) Kullu 0.90 0.74 0.69 0.63012876 Neol (35/88) Kullu 0.85 0.85 0.35 0.81012877 Bajaura (36/89) Kullu 0.85 0.66 0.64 0.60012878 Hat (36/90) Kullu 0.76 0.44 0.47 0.54012879 Shillihar (37/91) Kullu 0.72 0.76 0.64 0.59012880 Kashawri (25/49) Kullu 0.67 0.55 0.59 0.49012881 Pini (25/48) Kullu 0.34 0.58 0.37 0.46012883 Manikarn (40/101) Kullu 0.62 0.66 0.74 0.45012884 Sosan (40/102) Kullu 0.60 0.75 0.70 0.50012885 Jari (39/100) Kullu 0.62 0.74 0.71 0.50012886 Bradha (39/99) Kullu 0.68 0.75 0.71 0.53012887 Shat (38/98) Kullu 0.72 0.70 0.46 0.64012888 Chong (38/96) Kullu 0.66 0.63 0.59 0.52012889 Jallu (38/97) Kullu 0.71 0.81 0.58 0.63012890 Ratocha (38/95) Kullu 0.83 0.80 0.47 0.72012891 Diar (37/92) Kullu 0.88 0.72 0.61 0.65012892 Rote-II (42/107) Kullu 0.84 0.72 0.61 0.63012893 Bhallan-I (42/106) Kullu 0.72 0.74 0.71 0.55
Climate Change Vulnerability Assessment Report 140
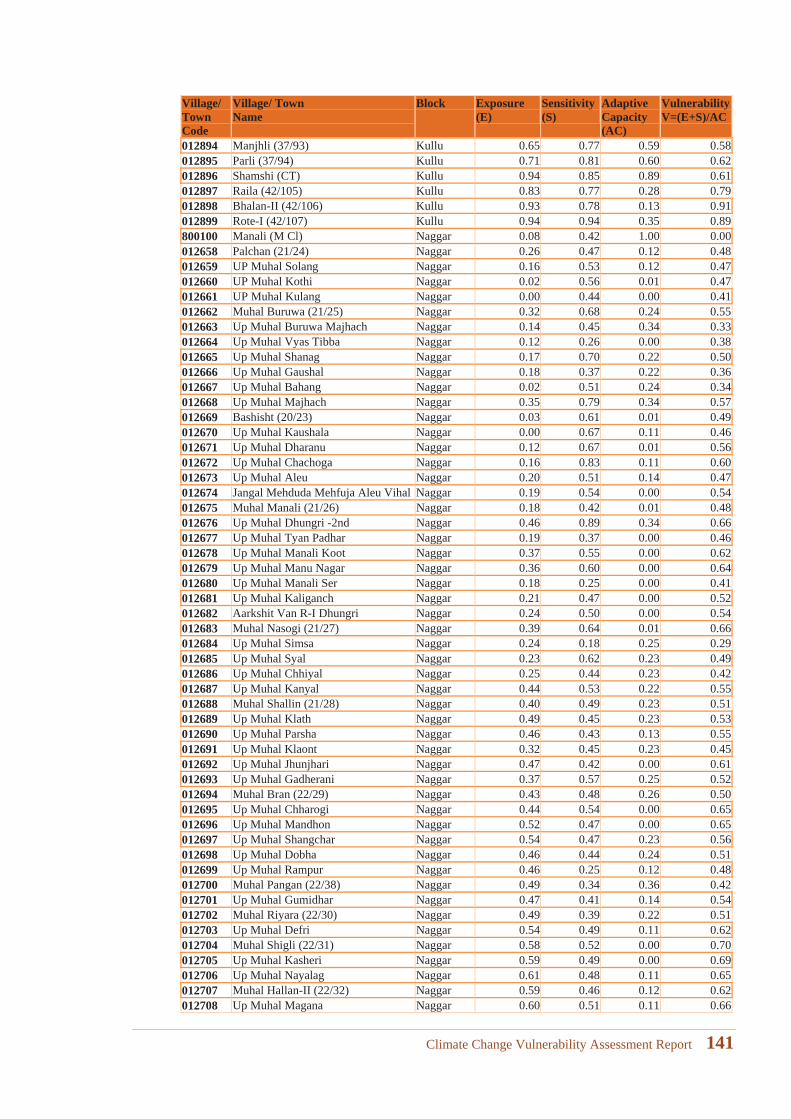
Village/Town Code
Village/ Town Name
Block Exposure(E)
Sensitivity(S)
Adaptive Capacity(AC)
VulnerabilityV=(E+S)/AC
012894 Manjhli (37/93) Kullu 0.65 0.77 0.59 0.58012895 Parli (37/94) Kullu 0.71 0.81 0.60 0.62012896 Shamshi (CT) Kullu 0.94 0.85 0.89 0.61012897 Raila (42/105) Kullu 0.83 0.77 0.28 0.79012898 Bhalan-II (42/106) Kullu 0.93 0.78 0.13 0.91012899 Rote-I (42/107) Kullu 0.94 0.94 0.35 0.89800100 Manali (M Cl) Naggar 0.08 0.42 1.00 0.00012658 Palchan (21/24) Naggar 0.26 0.47 0.12 0.48012659 UP Muhal Solang Naggar 0.16 0.53 0.12 0.47012660 UP Muhal Kothi Naggar 0.02 0.56 0.01 0.47012661 UP Muhal Kulang Naggar 0.00 0.44 0.00 0.41012662 Muhal Buruwa (21/25) Naggar 0.32 0.68 0.24 0.55012663 Up Muhal Buruwa Majhach Naggar 0.14 0.45 0.34 0.33012664 Up Muhal Vyas Tibba Naggar 0.12 0.26 0.00 0.38012665 Up Muhal Shanag Naggar 0.17 0.70 0.22 0.50012666 Up Muhal Gaushal Naggar 0.18 0.37 0.22 0.36012667 Up Muhal Bahang Naggar 0.02 0.51 0.24 0.34012668 Up Muhal Majhach Naggar 0.35 0.79 0.34 0.57012669 Bashisht (20/23) Naggar 0.03 0.61 0.01 0.49012670 Up Muhal Kaushala Naggar 0.00 0.67 0.11 0.46012671 Up Muhal Dharanu Naggar 0.12 0.67 0.01 0.56012672 Up Muhal Chachoga Naggar 0.16 0.83 0.11 0.60012673 Up Muhal Aleu Naggar 0.20 0.51 0.14 0.47012674 Jangal Mehduda Mehfuja Aleu Vihal Naggar 0.19 0.54 0.00 0.54012675 Muhal Manali (21/26) Naggar 0.18 0.42 0.01 0.48012676 Up Muhal Dhungri -2nd Naggar 0.46 0.89 0.34 0.66012677 Up Muhal Tyan Padhar Naggar 0.19 0.37 0.00 0.46012678 Up Muhal Manali Koot Naggar 0.37 0.55 0.00 0.62012679 Up Muhal Manu Nagar Naggar 0.36 0.60 0.00 0.64012680 Up Muhal Manali Ser Naggar 0.18 0.25 0.00 0.41012681 Up Muhal Kaliganch Naggar 0.21 0.47 0.00 0.52012682 Aarkshit Van R-I Dhungri Naggar 0.24 0.50 0.00 0.54012683 Muhal Nasogi (21/27) Naggar 0.39 0.64 0.01 0.66012684 Up Muhal Simsa Naggar 0.24 0.18 0.25 0.29012685 Up Muhal Syal Naggar 0.23 0.62 0.23 0.49012686 Up Muhal Chhiyal Naggar 0.25 0.44 0.23 0.42012687 Up Muhal Kanyal Naggar 0.44 0.53 0.22 0.55012688 Muhal Shallin (21/28) Naggar 0.40 0.49 0.23 0.51012689 Up Muhal Klath Naggar 0.49 0.45 0.23 0.53012690 Up Muhal Parsha Naggar 0.46 0.43 0.13 0.55012691 Up Muhal Klaont Naggar 0.32 0.45 0.23 0.45012692 Up Muhal Jhunjhari Naggar 0.47 0.42 0.00 0.61012693 Up Muhal Gadherani Naggar 0.37 0.57 0.25 0.52012694 Muhal Bran (22/29) Naggar 0.43 0.48 0.26 0.50012695 Up Muhal Chharogi Naggar 0.44 0.54 0.00 0.65012696 Up Muhal Mandhon Naggar 0.52 0.47 0.00 0.65012697 Up Muhal Shangchar Naggar 0.54 0.47 0.23 0.56012698 Up Muhal Dobha Naggar 0.46 0.44 0.24 0.51012699 Up Muhal Rampur Naggar 0.46 0.25 0.12 0.48012700 Muhal Pangan (22/38) Naggar 0.49 0.34 0.36 0.42012701 Up Muhal Gumidhar Naggar 0.47 0.41 0.14 0.54012702 Muhal Riyara (22/30) Naggar 0.49 0.39 0.22 0.51012703 Up Muhal Defri Naggar 0.54 0.49 0.11 0.62012704 Muhal Shigli (22/31) Naggar 0.58 0.52 0.00 0.70012705 Up Muhal Kasheri Naggar 0.59 0.49 0.00 0.69012706 Up Muhal Nayalag Naggar 0.61 0.48 0.11 0.65012707 Muhal Hallan-II (22/32) Naggar 0.59 0.46 0.12 0.62012708 Up Muhal Magana Naggar 0.60 0.51 0.11 0.66
Climate Change Vulnerability Assessment Report 141
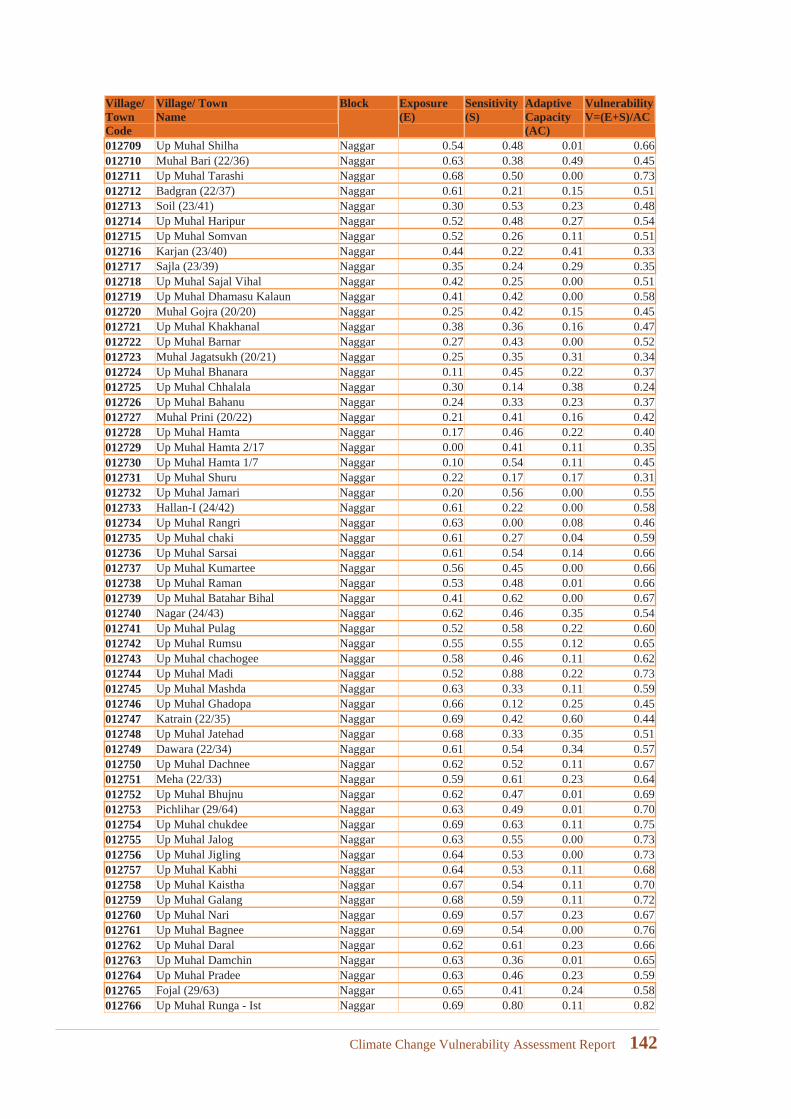
Village/Town Code
Village/ Town Name
Block Exposure(E)
Sensitivity(S)
Adaptive Capacity(AC)
VulnerabilityV=(E+S)/AC
012709 Up Muhal Shilha Naggar 0.54 0.48 0.01 0.66012710 Muhal Bari (22/36) Naggar 0.63 0.38 0.49 0.45012711 Up Muhal Tarashi Naggar 0.68 0.50 0.00 0.73012712 Badgran (22/37) Naggar 0.61 0.21 0.15 0.51012713 Soil (23/41) Naggar 0.30 0.53 0.23 0.48012714 Up Muhal Haripur Naggar 0.52 0.48 0.27 0.54012715 Up Muhal Somvan Naggar 0.52 0.26 0.11 0.51012716 Karjan (23/40) Naggar 0.44 0.22 0.41 0.33012717 Sajla (23/39) Naggar 0.35 0.24 0.29 0.35012718 Up Muhal Sajal Vihal Naggar 0.42 0.25 0.00 0.51012719 Up Muhal Dhamasu Kalaun Naggar 0.41 0.42 0.00 0.58012720 Muhal Gojra (20/20) Naggar 0.25 0.42 0.15 0.45012721 Up Muhal Khakhanal Naggar 0.38 0.36 0.16 0.47012722 Up Muhal Barnar Naggar 0.27 0.43 0.00 0.52012723 Muhal Jagatsukh (20/21) Naggar 0.25 0.35 0.31 0.34012724 Up Muhal Bhanara Naggar 0.11 0.45 0.22 0.37012725 Up Muhal Chhalala Naggar 0.30 0.14 0.38 0.24012726 Up Muhal Bahanu Naggar 0.24 0.33 0.23 0.37012727 Muhal Prini (20/22) Naggar 0.21 0.41 0.16 0.42012728 Up Muhal Hamta Naggar 0.17 0.46 0.22 0.40012729 Up Muhal Hamta 2/17 Naggar 0.00 0.41 0.11 0.35012730 Up Muhal Hamta 1/7 Naggar 0.10 0.54 0.11 0.45012731 Up Muhal Shuru Naggar 0.22 0.17 0.17 0.31012732 Up Muhal Jamari Naggar 0.20 0.56 0.00 0.55012733 Hallan-I (24/42) Naggar 0.61 0.22 0.00 0.58012734 Up Muhal Rangri Naggar 0.63 0.00 0.08 0.46012735 Up Muhal chaki Naggar 0.61 0.27 0.04 0.59012736 Up Muhal Sarsai Naggar 0.61 0.54 0.14 0.66012737 Up Muhal Kumartee Naggar 0.56 0.45 0.00 0.66012738 Up Muhal Raman Naggar 0.53 0.48 0.01 0.66012739 Up Muhal Batahar Bihal Naggar 0.41 0.62 0.00 0.67012740 Nagar (24/43) Naggar 0.62 0.46 0.35 0.54012741 Up Muhal Pulag Naggar 0.52 0.58 0.22 0.60012742 Up Muhal Rumsu Naggar 0.55 0.55 0.12 0.65012743 Up Muhal chachogee Naggar 0.58 0.46 0.11 0.62012744 Up Muhal Madi Naggar 0.52 0.88 0.22 0.73012745 Up Muhal Mashda Naggar 0.63 0.33 0.11 0.59012746 Up Muhal Ghadopa Naggar 0.66 0.12 0.25 0.45012747 Katrain (22/35) Naggar 0.69 0.42 0.60 0.44012748 Up Muhal Jatehad Naggar 0.68 0.33 0.35 0.51012749 Dawara (22/34) Naggar 0.61 0.54 0.34 0.57012750 Up Muhal Dachnee Naggar 0.62 0.52 0.11 0.67012751 Meha (22/33) Naggar 0.59 0.61 0.23 0.64012752 Up Muhal Bhujnu Naggar 0.62 0.47 0.01 0.69012753 Pichlihar (29/64) Naggar 0.63 0.49 0.01 0.70012754 Up Muhal chukdee Naggar 0.69 0.63 0.11 0.75012755 Up Muhal Jalog Naggar 0.63 0.55 0.00 0.73012756 Up Muhal Jigling Naggar 0.64 0.53 0.00 0.73012757 Up Muhal Kabhi Naggar 0.64 0.53 0.11 0.68012758 Up Muhal Kaistha Naggar 0.67 0.54 0.11 0.70012759 Up Muhal Galang Naggar 0.68 0.59 0.11 0.72012760 Up Muhal Nari Naggar 0.69 0.57 0.23 0.67012761 Up Muhal Bagnee Naggar 0.69 0.54 0.00 0.76012762 Up Muhal Daral Naggar 0.62 0.61 0.23 0.66012763 Up Muhal Damchin Naggar 0.63 0.36 0.01 0.65012764 Up Muhal Pradee Naggar 0.63 0.46 0.23 0.59012765 Fojal (29/63) Naggar 0.65 0.41 0.24 0.58012766 Up Muhal Runga - Ist Naggar 0.69 0.80 0.11 0.82
Climate Change Vulnerability Assessment Report 142
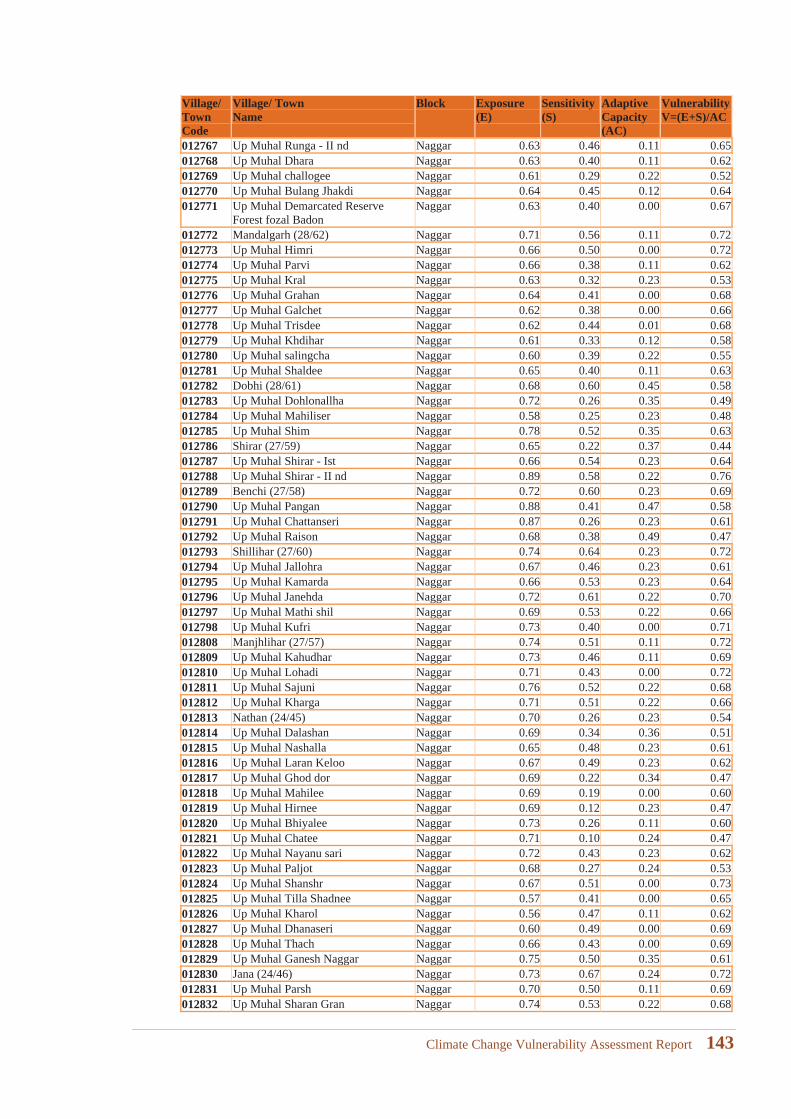
Village/Town Code
Village/ Town Name
Block Exposure(E)
Sensitivity(S)
Adaptive Capacity(AC)
VulnerabilityV=(E+S)/AC
012767 Up Muhal Runga - II nd Naggar 0.63 0.46 0.11 0.65012768 Up Muhal Dhara Naggar 0.63 0.40 0.11 0.62012769 Up Muhal challogee Naggar 0.61 0.29 0.22 0.52012770 Up Muhal Bulang Jhakdi Naggar 0.64 0.45 0.12 0.64012771 Up Muhal Demarcated Reserve
Forest fozal BadonNaggar 0.63 0.40 0.00 0.67
012772 Mandalgarh (28/62) Naggar 0.71 0.56 0.11 0.72012773 Up Muhal Himri Naggar 0.66 0.50 0.00 0.72012774 Up Muhal Parvi Naggar 0.66 0.38 0.11 0.62012775 Up Muhal Kral Naggar 0.63 0.32 0.23 0.53012776 Up Muhal Grahan Naggar 0.64 0.41 0.00 0.68012777 Up Muhal Galchet Naggar 0.62 0.38 0.00 0.66012778 Up Muhal Trisdee Naggar 0.62 0.44 0.01 0.68012779 Up Muhal Khdihar Naggar 0.61 0.33 0.12 0.58012780 Up Muhal salingcha Naggar 0.60 0.39 0.22 0.55012781 Up Muhal Shaldee Naggar 0.65 0.40 0.11 0.63012782 Dobhi (28/61) Naggar 0.68 0.60 0.45 0.58012783 Up Muhal Dohlonallha Naggar 0.72 0.26 0.35 0.49012784 Up Muhal Mahiliser Naggar 0.58 0.25 0.23 0.48012785 Up Muhal Shim Naggar 0.78 0.52 0.35 0.63012786 Shirar (27/59) Naggar 0.65 0.22 0.37 0.44012787 Up Muhal Shirar - Ist Naggar 0.66 0.54 0.23 0.64012788 Up Muhal Shirar - II nd Naggar 0.89 0.58 0.22 0.76012789 Benchi (27/58) Naggar 0.72 0.60 0.23 0.69012790 Up Muhal Pangan Naggar 0.88 0.41 0.47 0.58012791 Up Muhal Chattanseri Naggar 0.87 0.26 0.23 0.61012792 Up Muhal Raison Naggar 0.68 0.38 0.49 0.47012793 Shillihar (27/60) Naggar 0.74 0.64 0.23 0.72012794 Up Muhal Jallohra Naggar 0.67 0.46 0.23 0.61012795 Up Muhal Kamarda Naggar 0.66 0.53 0.23 0.64012796 Up Muhal Janehda Naggar 0.72 0.61 0.22 0.70012797 Up Muhal Mathi shil Naggar 0.69 0.53 0.22 0.66012798 Up Muhal Kufri Naggar 0.73 0.40 0.00 0.71012808 Manjhlihar (27/57) Naggar 0.74 0.51 0.11 0.72012809 Up Muhal Kahudhar Naggar 0.73 0.46 0.11 0.69012810 Up Muhal Lohadi Naggar 0.71 0.43 0.00 0.72012811 Up Muhal Sajuni Naggar 0.76 0.52 0.22 0.68012812 Up Muhal Kharga Naggar 0.71 0.51 0.22 0.66012813 Nathan (24/45) Naggar 0.70 0.26 0.23 0.54012814 Up Muhal Dalashan Naggar 0.69 0.34 0.36 0.51012815 Up Muhal Nashalla Naggar 0.65 0.48 0.23 0.61012816 Up Muhal Laran Keloo Naggar 0.67 0.49 0.23 0.62012817 Up Muhal Ghod dor Naggar 0.69 0.22 0.34 0.47012818 Up Muhal Mahilee Naggar 0.69 0.19 0.00 0.60012819 Up Muhal Hirnee Naggar 0.69 0.12 0.23 0.47012820 Up Muhal Bhiyalee Naggar 0.73 0.26 0.11 0.60012821 Up Muhal Chatee Naggar 0.71 0.10 0.24 0.47012822 Up Muhal Nayanu sari Naggar 0.72 0.43 0.23 0.62012823 Up Muhal Paljot Naggar 0.68 0.27 0.24 0.53012824 Up Muhal Shanshr Naggar 0.67 0.51 0.00 0.73012825 Up Muhal Tilla Shadnee Naggar 0.57 0.41 0.00 0.65012826 Up Muhal Kharol Naggar 0.56 0.47 0.11 0.62012827 Up Muhal Dhanaseri Naggar 0.60 0.49 0.00 0.69012828 Up Muhal Thach Naggar 0.66 0.43 0.00 0.69012829 Up Muhal Ganesh Naggar Naggar 0.75 0.50 0.35 0.61012830 Jana (24/46) Naggar 0.73 0.67 0.24 0.72012831 Up Muhal Parsh Naggar 0.70 0.50 0.11 0.69012832 Up Muhal Sharan Gran Naggar 0.74 0.53 0.22 0.68
Climate Change Vulnerability Assessment Report 143
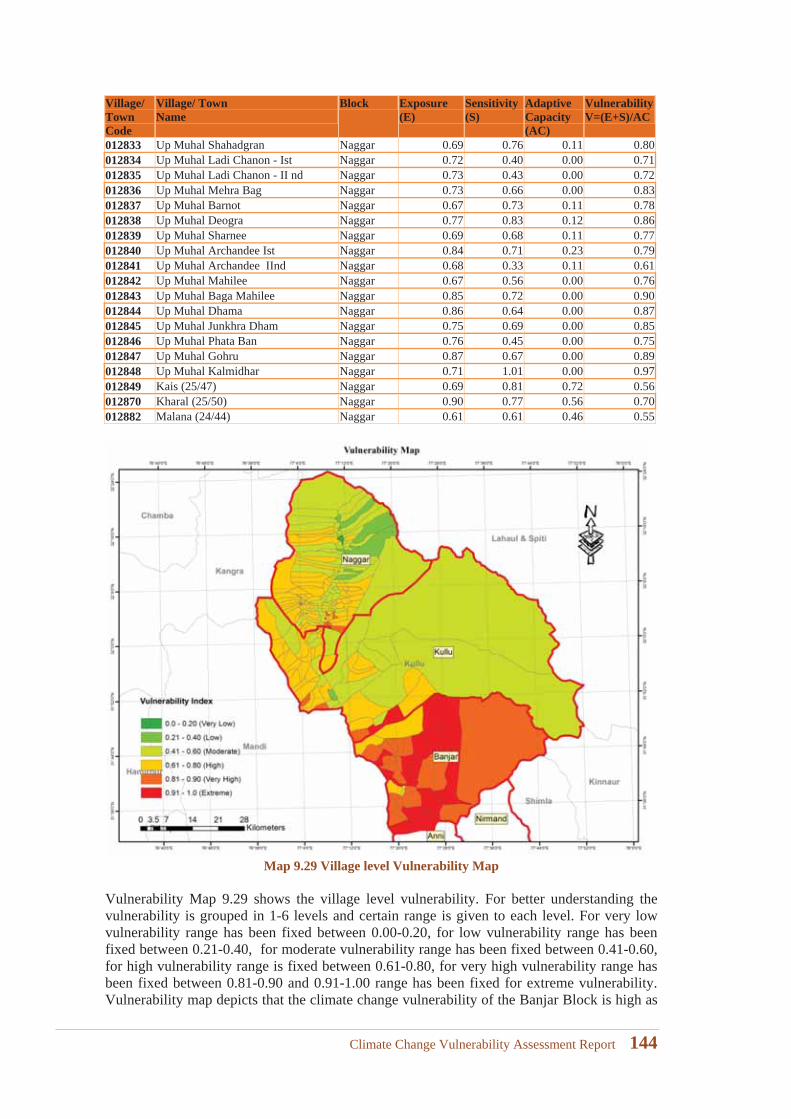
Village/Town Code
Village/ Town Name
Block Exposure(E)
Sensitivity(S)
Adaptive Capacity(AC)
VulnerabilityV=(E+S)/AC
012833 Up Muhal Shahadgran Naggar 0.69 0.76 0.11 0.80012834 Up Muhal Ladi Chanon - Ist Naggar 0.72 0.40 0.00 0.71012835 Up Muhal Ladi Chanon - II nd Naggar 0.73 0.43 0.00 0.72012836 Up Muhal Mehra Bag Naggar 0.73 0.66 0.00 0.83012837 Up Muhal Barnot Naggar 0.67 0.73 0.11 0.78012838 Up Muhal Deogra Naggar 0.77 0.83 0.12 0.86012839 Up Muhal Sharnee Naggar 0.69 0.68 0.11 0.77012840 Up Muhal Archandee Ist Naggar 0.84 0.71 0.23 0.79012841 Up Muhal Archandee IInd Naggar 0.68 0.33 0.11 0.61012842 Up Muhal Mahilee Naggar 0.67 0.56 0.00 0.76012843 Up Muhal Baga Mahilee Naggar 0.85 0.72 0.00 0.90012844 Up Muhal Dhama Naggar 0.86 0.64 0.00 0.87012845 Up Muhal Junkhra Dham Naggar 0.75 0.69 0.00 0.85012846 Up Muhal Phata Ban Naggar 0.76 0.45 0.00 0.75012847 Up Muhal Gohru Naggar 0.87 0.67 0.00 0.89012848 Up Muhal Kalmidhar Naggar 0.71 1.01 0.00 0.97012849 Kais (25/47) Naggar 0.69 0.81 0.72 0.56012870 Kharal (25/50) Naggar 0.90 0.77 0.56 0.70012882 Malana (24/44) Naggar 0.61 0.61 0.46 0.55
Map 9.29 Village level Vulnerability Map
Vulnerability Map 9.29 shows the village level vulnerability. For better understanding the vulnerability is grouped in 1-6 levels and certain range is given to each level. For very low vulnerability range has been fixed between 0.00-0.20, for low vulnerability range has been fixed between 0.21-0.40, for moderate vulnerability range has been fixed between 0.41-0.60,for high vulnerability range is fixed between 0.61-0.80, for very high vulnerability range has been fixed between 0.81-0.90 and 0.91-1.00 range has been fixed for extreme vulnerability. Vulnerability map depicts that the climate change vulnerability of the Banjar Block is high as
Climate Change Vulnerability Assessment Report 144
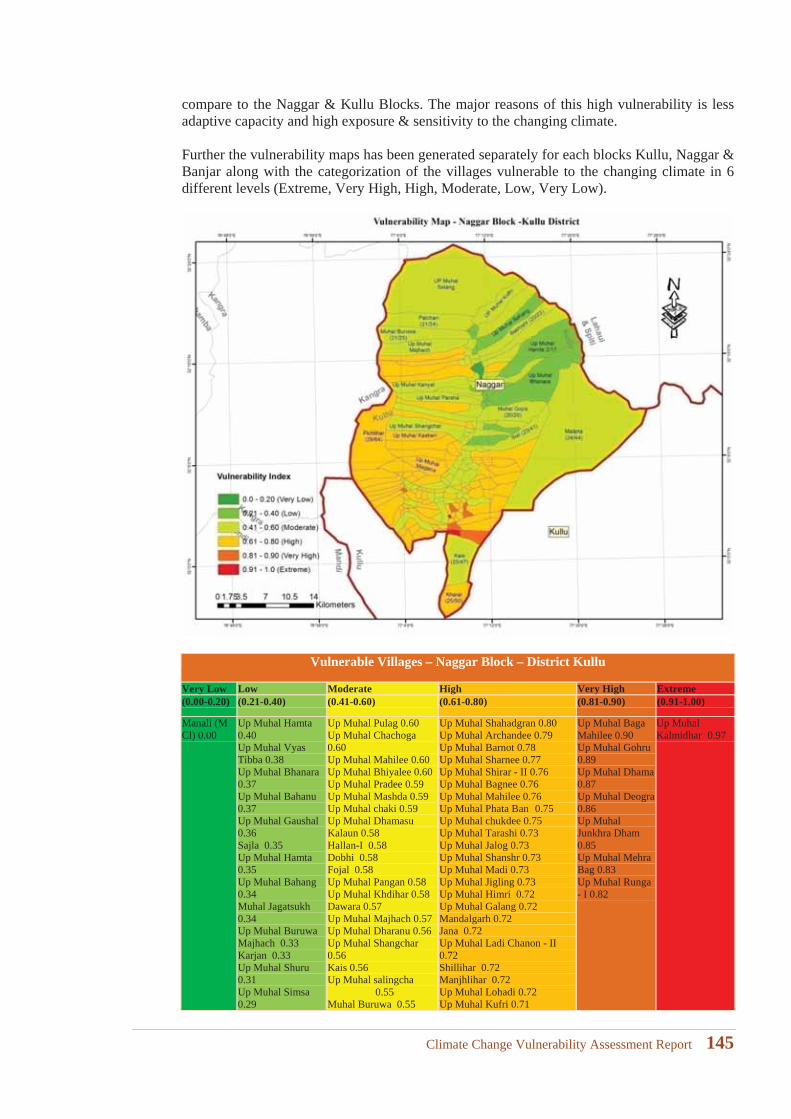
compare to the Naggar & Kullu Blocks. The major reasons of this high vulnerability is less adaptive capacity and high exposure & sensitivity to the changing climate.
Further the vulnerability maps has been generated separately for each blocks Kullu, Naggar & Banjar along with the categorization of the villages vulnerable to the changing climate in 6 different levels (Extreme, Very High, High, Moderate, Low, Very Low).
Vulnerable Villages – Naggar Block – District Kullu
Very Low Low Moderate High Very High Extreme(0.00-0.20) (0.21-0.40) (0.41-0.60) (0.61-0.80) (0.81-0.90) (0.91-1.00)
Manali (M Cl) 0.00
Up Muhal Hamta 0.40Up Muhal Vyas Tibba 0.38Up Muhal Bhanara 0.37Up Muhal Bahanu 0.37Up Muhal Gaushal 0.36Sajla 0.35Up Muhal Hamta 0.35Up Muhal Bahang 0.34Muhal Jagatsukh 0.34Up Muhal Buruwa Majhach 0.33Karjan 0.33Up Muhal Shuru 0.31Up Muhal Simsa 0.29
Up Muhal Pulag 0.60Up Muhal Chachoga 0.60Up Muhal Mahilee 0.60Up Muhal Bhiyalee 0.60Up Muhal Pradee 0.59Up Muhal Mashda 0.59Up Muhal chaki 0.59Up Muhal Dhamasu Kalaun 0.58Hallan-I 0.58Dobhi 0.58Fojal 0.58Up Muhal Pangan 0.58Up Muhal Khdihar 0.58Dawara 0.57Up Muhal Majhach 0.57Up Muhal Dharanu 0.56Up Muhal Shangchar 0.56Kais 0.56Up Muhal salingcha
0.55Muhal Buruwa 0.55
Up Muhal Shahadgran 0.80Up Muhal Archandee 0.79Up Muhal Barnot 0.78Up Muhal Sharnee 0.77Up Muhal Shirar - II 0.76Up Muhal Bagnee 0.76Up Muhal Mahilee 0.76Up Muhal Phata Ban 0.75Up Muhal chukdee 0.75Up Muhal Tarashi 0.73Up Muhal Jalog 0.73Up Muhal Shanshr 0.73Up Muhal Madi 0.73Up Muhal Jigling 0.73Up Muhal Himri 0.72Up Muhal Galang 0.72Mandalgarh 0.72Jana 0.72Up Muhal Ladi Chanon - II0.72Shillihar 0.72Manjhlihar 0.72Up Muhal Lohadi 0.72Up Muhal Kufri 0.71
Up Muhal Baga Mahilee 0.90Up Muhal Gohru 0.89Up Muhal Dhama 0.87Up Muhal Deogra 0.86Up Muhal Junkhra Dham 0.85Up Muhal Mehra Bag 0.83Up Muhal Runga - I 0.82
Up Muhal Kalmidhar 0.97
Climate Change Vulnerability Assessment Report 145
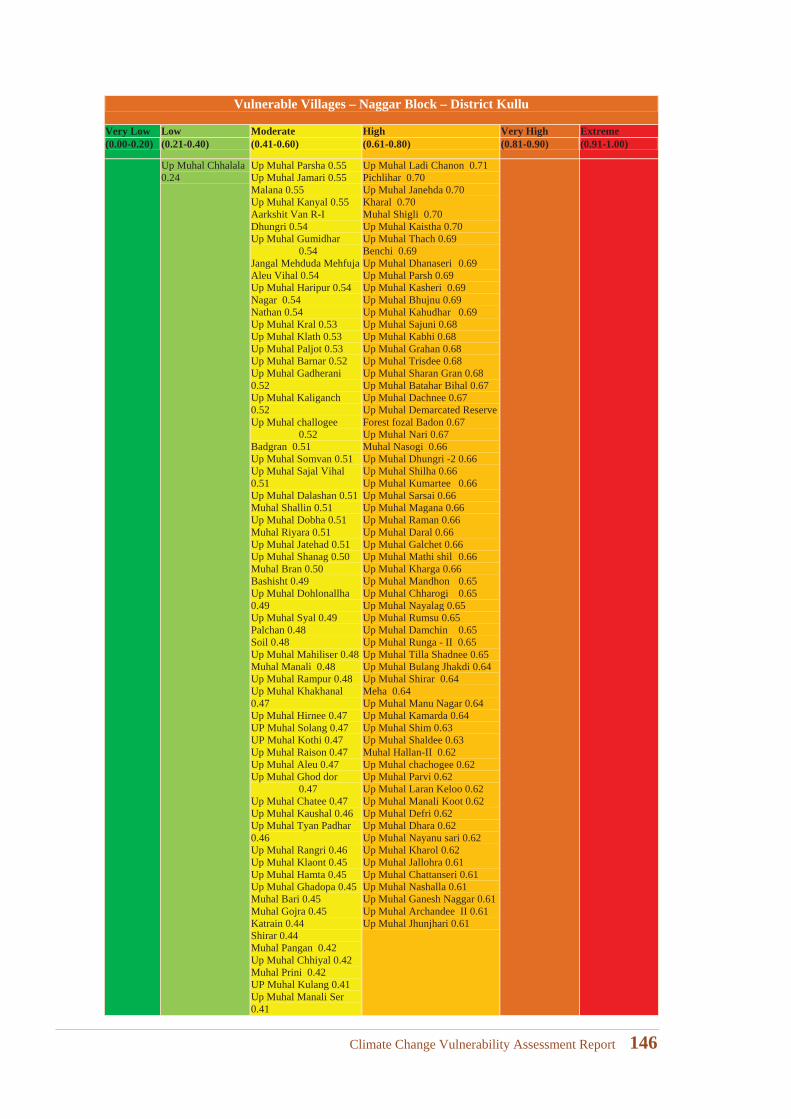
Vulnerable Villages – Naggar Block – District Kullu
Very Low Low Moderate High Very High Extreme(0.00-0.20) (0.21-0.40) (0.41-0.60) (0.61-0.80) (0.81-0.90) (0.91-1.00)
Up Muhal Chhalala 0.24
Up Muhal Parsha 0.55Up Muhal Jamari 0.55Malana 0.55Up Muhal Kanyal 0.55Aarkshit Van R-IDhungri 0.54Up Muhal Gumidhar
0.54Jangal Mehduda Mehfuja Aleu Vihal 0.54Up Muhal Haripur 0.54Nagar 0.54Nathan 0.54Up Muhal Kral 0.53Up Muhal Klath 0.53Up Muhal Paljot 0.53Up Muhal Barnar 0.52Up Muhal Gadherani0.52Up Muhal Kaliganch0.52Up Muhal challogee
0.52Badgran 0.51Up Muhal Somvan 0.51Up Muhal Sajal Vihal0.51Up Muhal Dalashan 0.51Muhal Shallin 0.51Up Muhal Dobha 0.51Muhal Riyara 0.51Up Muhal Jatehad 0.51Up Muhal Shanag 0.50Muhal Bran 0.50Bashisht 0.49Up Muhal Dohlonallha 0.49Up Muhal Syal 0.49Palchan 0.48Soil 0.48Up Muhal Mahiliser 0.48Muhal Manali 0.48Up Muhal Rampur 0.48Up Muhal Khakhanal 0.47Up Muhal Hirnee 0.47UP Muhal Solang 0.47UP Muhal Kothi 0.47Up Muhal Raison 0.47Up Muhal Aleu 0.47Up Muhal Ghod dor
0.47Up Muhal Chatee 0.47Up Muhal Kaushal 0.46Up Muhal Tyan Padhar 0.46Up Muhal Rangri 0.46Up Muhal Klaont 0.45Up Muhal Hamta 0.45Up Muhal Ghadopa 0.45Muhal Bari 0.45Muhal Gojra 0.45Katrain 0.44Shirar 0.44Muhal Pangan 0.42Up Muhal Chhiyal 0.42Muhal Prini 0.42UP Muhal Kulang 0.41Up Muhal Manali Ser 0.41
Up Muhal Ladi Chanon 0.71Pichlihar 0.70Up Muhal Janehda 0.70Kharal 0.70Muhal Shigli 0.70Up Muhal Kaistha 0.70Up Muhal Thach 0.69Benchi 0.69Up Muhal Dhanaseri 0.69Up Muhal Parsh 0.69Up Muhal Kasheri 0.69Up Muhal Bhujnu 0.69Up Muhal Kahudhar 0.69Up Muhal Sajuni 0.68Up Muhal Kabhi 0.68Up Muhal Grahan 0.68Up Muhal Trisdee 0.68Up Muhal Sharan Gran 0.68Up Muhal Batahar Bihal 0.67Up Muhal Dachnee 0.67Up Muhal Demarcated Reserve Forest fozal Badon 0.67Up Muhal Nari 0.67Muhal Nasogi 0.66Up Muhal Dhungri -2 0.66Up Muhal Shilha 0.66Up Muhal Kumartee 0.66Up Muhal Sarsai 0.66Up Muhal Magana 0.66Up Muhal Raman 0.66Up Muhal Daral 0.66Up Muhal Galchet 0.66Up Muhal Mathi shil 0.66Up Muhal Kharga 0.66Up Muhal Mandhon 0.65Up Muhal Chharogi 0.65Up Muhal Nayalag 0.65Up Muhal Rumsu 0.65Up Muhal Damchin 0.65Up Muhal Runga - II 0.65Up Muhal Tilla Shadnee 0.65Up Muhal Bulang Jhakdi 0.64Up Muhal Shirar 0.64Meha 0.64Up Muhal Manu Nagar 0.64Up Muhal Kamarda 0.64Up Muhal Shim 0.63Up Muhal Shaldee 0.63Muhal Hallan-II 0.62Up Muhal chachogee 0.62Up Muhal Parvi 0.62Up Muhal Laran Keloo 0.62Up Muhal Manali Koot 0.62Up Muhal Defri 0.62Up Muhal Dhara 0.62Up Muhal Nayanu sari 0.62Up Muhal Kharol 0.62Up Muhal Jallohra 0.61Up Muhal Chattanseri 0.61Up Muhal Nashalla 0.61Up Muhal Ganesh Naggar 0.61Up Muhal Archandee II 0.61Up Muhal Jhunjhari 0.61
Climate Change Vulnerability Assessment Report 146
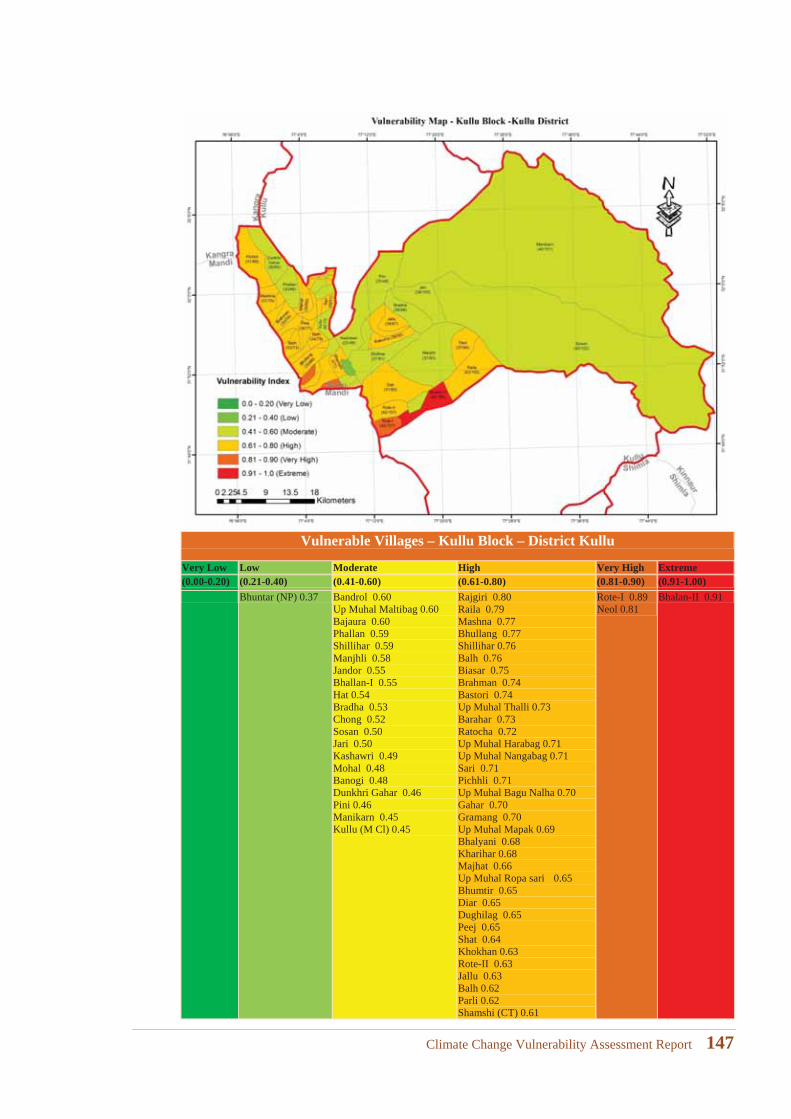
Vulnerable Villages – Kullu Block – District Kullu
Very Low Low Moderate High Very High Extreme(0.00-0.20) (0.21-0.40) (0.41-0.60) (0.61-0.80) (0.81-0.90) (0.91-1.00)
Bhuntar (NP) 0.37 Bandrol 0.60Up Muhal Maltibag 0.60Bajaura 0.60Phallan 0.59Shillihar 0.59Manjhli 0.58Jandor 0.55Bhallan-I 0.55Hat 0.54Bradha 0.53Chong 0.52Sosan 0.50Jari 0.50Kashawri 0.49Mohal 0.48Banogi 0.48Dunkhri Gahar 0.46Pini 0.46Manikarn 0.45Kullu (M Cl) 0.45
Rajgiri 0.80Raila 0.79Mashna 0.77Bhullang 0.77Shillihar 0.76Balh 0.76Biasar 0.75Brahman 0.74Bastori 0.74Up Muhal Thalli 0.73Barahar 0.73Ratocha 0.72Up Muhal Harabag 0.71Up Muhal Nangabag 0.71Sari 0.71Pichhli 0.71Up Muhal Bagu Nalha 0.70Gahar 0.70Gramang 0.70Up Muhal Mapak 0.69Bhalyani 0.68Kharihar 0.68Majhat 0.66Up Muhal Ropa sari 0.65Bhumtir 0.65Diar 0.65Dughilag 0.65Peej 0.65Shat 0.64Khokhan 0.63Rote-II 0.63Jallu 0.63Balh 0.62Parli 0.62Shamshi (CT) 0.61
Rote-I 0.89Neol 0.81
Bhalan-II 0.91
Climate Change Vulnerability Assessment Report 147
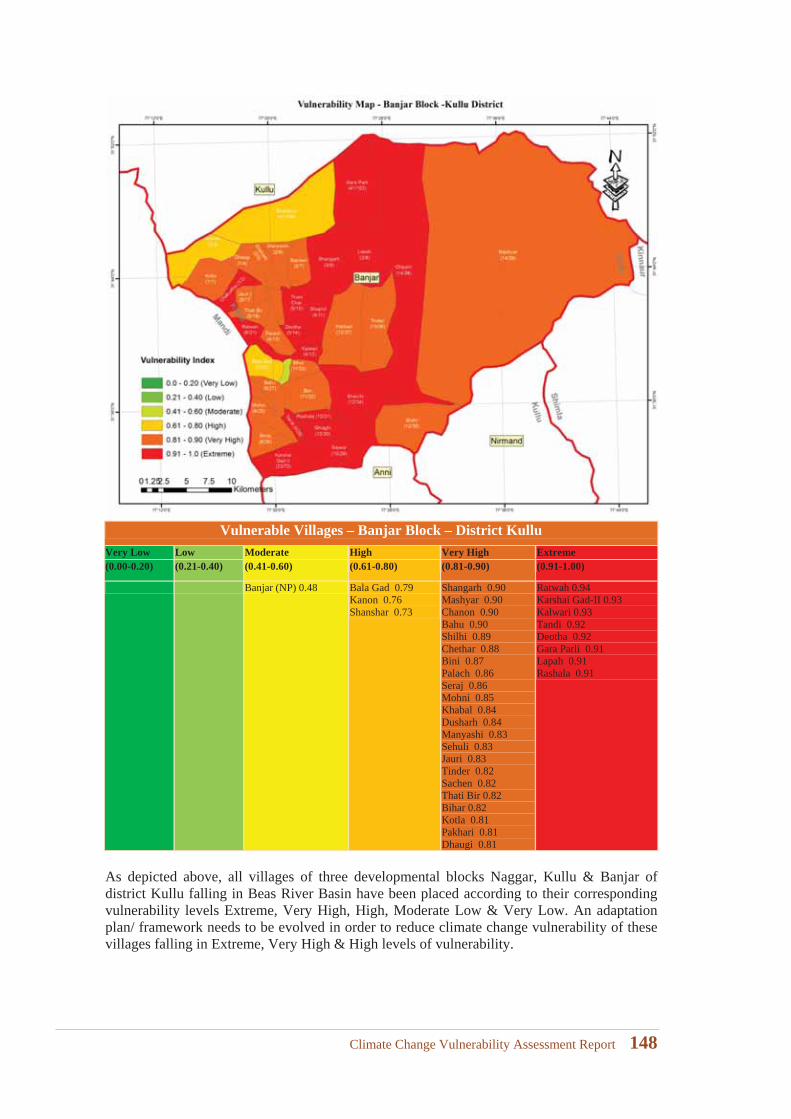
Vulnerable Villages – Banjar Block – District KulluVery Low Low Moderate High Very High Extreme(0.00-0.20) (0.21-0.40) (0.41-0.60) (0.61-0.80) (0.81-0.90) (0.91-1.00)
Banjar (NP) 0.48 Bala Gad 0.79Kanon 0.76Shanshar 0.73
Shangarh 0.90Mashyar 0.90Chanon 0.90Bahu 0.90Shilhi 0.89Chethar 0.88Bini 0.87Palach 0.86Seraj 0.86Mohni 0.85Khabal 0.84Dusharh 0.84Manyashi 0.83Sehuli 0.83Jauri 0.83Tinder 0.82Sachen 0.82Thati Bir 0.82Bihar 0.82Kotla 0.81Pakhari 0.81Dhaugi 0.81
Ratwah 0.94Karshai Gad-II 0.93Kalwari 0.93Tandi 0.92Deotha 0.92Gara Parli 0.91Lapah 0.91Rashala 0.91
As depicted above, all villages of three developmental blocks Naggar, Kullu & Banjar of district Kullu falling in Beas River Basin have been placed according to their corresponding vulnerability levels Extreme, Very High, High, Moderate Low & Very Low. An adaptation plan/ framework needs to be evolved in order to reduce climate change vulnerability of these villages falling in Extreme, Very High & High levels of vulnerability.
Climate Change Vulnerability Assessment Report 148
10 Analysis Report - Conclusions
Climate Change Vulnerability Assessment Report 149

Climate Change Vulnerability Assessment Report 150
10 Analysis Report - Conclusions
The task wise outcomes are given as follows:
10.1 Summary of Vulnerability Assessment at Village level
After detailed analysis of the study area using hydrological and climate change modelling we have been able to determine and identify those villages, which are vulnerable to the climate change. It is evident that change in climate is definitely going to have an impact on agriculture, horticulture, forests and water resources of vulnerable areas. Therefore, in order to reduce vulnerability there is an urgent need to apply clear-cut strategies to cope with the climate change vulnerability in these sectors both long term as well as short term.
The agriculture & horticulture is critical for food, nutritional and livelihood security of people of the district. The district Kullu has made significant progress during the past five decades or so and has become a self-sufficient district by producing various cash crops mainly apples and vegetables. However, with passage of time, it is presently facing several challenges likeincrease in temperature, un even distribution of rainfall/ snow fall, climate change induced diseases, stagnation in net sown area, decrease in crop yield, deterioration of soil quality,reduction in per capita land availability etc. are emerging issues.
The Forests are also playing very important role in determining the accumulation of greenhouse gases in the atmosphere; they absorb 2.6 billion tonnes of carbon dioxide each year, about one-third of the carbon dioxide released from the burning of fossil fuels. However, this great storage system also means that when forests are cut down, the impact is big. Deforestation accounts for nearly 20% of all greenhouse gas emissions — more than the world’s entire transport sector. At the same time, the GHG’s off setting capacity of forests is decreased as forests either illegally cut or lost gradually or not quality forests.
Forests are important for reducing impacts of climate change both present and future effects on people. For example, forest goods tend to be more climate-resilient than traditional agriculture crops and so when disasters strike or crops fail, forests act as safety nets protecting communities from losing all sources of food and income. They also regulate waterways;protect soil, temperature for an entire regions, and more.
There is a need to analyse how forest management can be improved and grow tree cover to benefit the environment and livelihoods. Our research needs to consider everything from REDD+ implementation to land-use change and wetland carbon stores, all of which contribute to our goals of effective climate change mitigation and adaptation.
As the earth's temperature continues to rise, we can expect a significant impact on our fresh water supplies regime with the potential for devastating effects on these resources. As temperatures increase, evaporation increases, sometimes resulting in droughts. In addition, rising temperatures are melting glacial ice at an unprecedented rate and are noted in this region unpresidently. Glaciers are an important source of freshwater here, and some, like those at Glacier National Park, are under critical threat of disappearing within the 21st century. Once these glaciers melt away, they can't be restored. Areas that previously depended on glaciers for freshwater will then have to seek other sources i.e. entire river system in beas basin will be affected. The relationship between climate change and water doesn't end there. The systems used to treat and move public water supplies require large amounts of energy, produced from hydropower projects are in turn under tremendous threat.
The adaptation to climate change has the potential to reduce many of its adverse impacts and may lead to enhanced benefits. The key features of climate change vulnerability and
Climate Change Vulnerability Assessment Report 151
adaptation are related to variability and extremes. The limited economic resources, information and skills, poor infrastructure and insufficient levels of technology makes the blocks inadequate to adapt and highly vulnerable. Increase in adaptive capacity is necessary for reducing vulnerability to climate changes, encountered in the frequency and intensity of extreme events, like floods and droughts which have sever impacts on agriculture and livelihood of local community.
The villages of the three developmental blocks (Kullu, Naggar & Banjar), vulnerable to climate change, need intervention at policy plan and programme level with higher priority. The results are useful for stakeholders such as farmers, policy makers and technical advisors, the scientific community and traders for targeting financial resources and better management of resources towards adaptive capacity with village level analysis. The most of the areas of Beas River Basin falling in Kullu District observed to be quite vulnerable to climate change. In the Panchayats, which are highly vulnerable, policy makers are required to take immediatemeasures to support effective management of environmental resources (e.g., soil, vegetation and water resources); promote increased market participation, especially within the large subsistence farming sector; stimulate both agricultural intensification and diversification of livelihoods away from agriculture practices; and introduce social programs and including on health, education and welfare, which can help in maintaining and augmenting both physical and intangible human capital.
Investment is required for developing infrastructure in rural areas, and in highly exposedregions, priority is required to be accorded to the development of more accurate systems for early warning of extreme climatic events (e.g., drought or flood) apart from appropriate relief programs and financial inclusion programmes are required for both agri-horti sectors. In addition to the usefulness of the study for policy makers and stakeholders, the study is expected to act as a baseline to further improve the methodologies for assessing vulnerability of agriculture to climate change.
10.2 Vulnerability & Potential for Adaptation:
The most important factor for agriculture/ horticulture, forests & water resources is timely availability of rain and irrigation facilities. The farmers of the Kullu district are completely dependent on the rain for irrigation of farms and orchards. People residing along the banks of Beas River Basin somehow manage to irrigate their farms but farmers residing on higher altitude are dependent of rain only there is no option except rain. During summer it gets very sever, when all the natural water resources dries up. Due to the tough geographical condition, it is difficult to connect all the villages with irrigation schemes besides economic reasons.
So far as the government schemes for irrigation are concerned they are not at present available to the all farmers in the region. There are villages where the irrigation schemes were initiated but these are functional as on date and are pending for one or the other reason.
The State Government is implementing various schemes in order to improve agricultural, horticultural production, increasing forest cover and water resource management in sustainable manner various watershed programmes are being run for local communities.Proper implementation of these schemes in the district could help the farmers manage the adverse impacts of climate change and in reduction of climate change vulnerability while improving adaptive capacity of farmers. These schemes should be implemented across all sectors, regions for maximum coverage horizontally and vertically.
Climate Change Vulnerability Assessment Report 152
10.3 Indicative Priority Area/ Sector Climate Change Adaptation-Measures to Reduce Vulnerability:
10.3.1 Possible Strategies for Climate Change Adaptation – Water Sector
Planning, development and management of water resources need to be governed by common integrated perspective considering local, regional, State and national context, having an environmentally sound basis, keeping in view the human, social and economic needs.Principle of equity and social justice must inform use and allocation of water.Good governance through transparent informed decision making is crucial to the objectives of equity, social justice and sustainability. Meaningful intensive participation, transparency and accountability should guide decision making and regulation of water resources.Water needs to be managed as a common pool community resource held, by the state, under public trust doctrine to achieve food security, support livelihood, and ensure equitable and sustainable development for all.Water is essential for sustenance of eco-system, and therefore, minimum ecological needs should be given due consideration and priority.Safe Water for drinking and sanitation should be considered as pre-emptive needs, followed by high priority allocation for other basic domestic needs (including needs of animals), achieving food security, supporting sustenance agriculture and minimum eco-system needs. Available water, after meeting the above needs, should be allocated in a manner to promote its conservation and efficient use.All the elements of the water cycle, i.e., evapo-transpiration, precipitation, runoff, river, lakes, soil moisture, and ground water, sea, etc., are interdependent and the basic hydrological unit is the river basin, which should be considered as the basic hydrologicalunit for planning.Given the limits on enhancing the availability of utilizable water resources and increased variability in supplies due to climate change, meeting the future needs will depend more on demand management, and hence, this needs to be given priority, especially through (a) evolving an agricultural system which economizes on water use and maximizes value from water, and (b) bringing in maximum efficiency in use of water and avoiding wastages/ spillages.The impact of climate change on water resources availability must be factored into water management related decisions. Water using activities need to be regulated keeping in mind the local geo climatic and hydrological situation.All data and entire information (except data of sensitive and classified nature) should be placed in public domain.The initial projections of the impact of climate change on water resources including the likely changes in the water availability in time and location to be targeted.Reassessment of basin wise water availability and demands.Empowerment and involvement of Panchayati Raj Institutions, urban local bodies, Water Users‘ Associations and primary stake holders in management of water resources with focus on water conservation, augmentation and harvesting.Promote participatory irrigation management.Encourage participation of NGOs in various activities related to water resources management, particularly in planning, capacity building and mass awareness.Involve and encourage corporate sector / industries to take up support and promote water conservation, augmentation and preservation within the industry and as part of corporate social responsibility.Sensitization of all Panchayat members and their functionaries on water availability.Promotion of water efficient techniques and technologies including (a) promotion of micro irrigation techniques such as sprinkler and drip irrigation and (b) expansion of Farmers Participatory Action Research Programme, moisture management techniques.
Climate Change Vulnerability Assessment Report 153
Undertake Pilot projects for improvement in water use efficiency. Promote Water Regulatory Authorities for ensuring equitable water distribution and rational charges for water facilities.Promote mandatory water audit including those for drinking & irrigation.Adequate provision for operation & maintenance of water resources projects.Incentive through award for water conservation & efficient use of water.Incentivize use of efficient irrigation practices and fully utilize the created facilities.Guidelines for different uses of water e.g., irrigation, drinking, industrial etc. particularly in context of basin wise situations.
10.3.2 Possible Strategies for Climate Change Adaptation – Agriculture & Horticulture Sector Sector
In order to increase the production of food grains, emphasis to be laid on distribution of seeds of high yielding varieties to the farmers.Establishment of Seed Multiplication Farms from where foundation seed to be distributed to registered farmers.In order to increase the production of crops, adoption of plant protection measures is of paramount importance. During each season, campaigns to be organised to fight the menace of crop disease, insects and pest etc.In order to maintain the fertility of the soil during each season, soil samples to be collected from the farmers field and analysed in the soil testing laboratories. Soil testing laboratories should be established in all the blocks of the district Kullu, where as mobile soil testing vans/labs ply in each panchayat in operation for testing the soil samples at site. The organic farming is becoming popular being suitable, environmental friendly and health concern to all concerned. Organic farming is to be promoted in each block in a systematic manner by providing trainings, laying out demonstrations, organizing fairs/ seminars to the farmers.Set-up vermi-composting units at every house & financial & technical assistance to the farmers is to be provided.Keeping in view the depleting sources of conventional fuel i.e. firewood etc., biogas plants have assumed great importance in the high hills in the Kullu district. To overcome this issue Bio-gas plants needs to be propagated.Sustainable use of fertilizer to increase the production to be promoted. Crop insurance scheme against crop loss especially due to climate change is to be provided to the farmers through financial inclusion programmes.In order to maintain the quality of the seeds and also ensure higher prices of seeds to the growers, Seed certification programme has to be given due emphasis.With the objective to safeguard the interest of the farming community the regulated markets established in different parts of the Blocks to be providing useful services to the farmers. A modernised market complex at least in each Block needs to be made functional for marketing of agricultural produce, besides construction of market yards in cluster in different Blocks.New farm implements/ machines are to be popularized among the farmers. Testing of new machines be carried out and popularize the small power tillers suited to hilly conditions.Due to topographical factors the soil is subject to splash sheet and Gully erosion resulting into degradation of the soil. Besides this there is biotic pressure on the land. To curb this menace particularly on the Agriculture lands effective soil and water conservation programme should be implemented. Water conservation and minor irrigation programme to be accorded priority in order to boost agriculture production.Harvesting of rain water and construction of tanks, ponds, check-dams and storage structures needs to be prioritized. Besides this, optimum use of water by low lifting water
Climate Change Vulnerability Assessment Report 154
devices and efficient irrigation system through sprinklers, drip irrigation are to be popularized in rural areas.Establishment of Farmer Product Organizations (FPO) in each block.Promote sustainable agriculture practices- adopting organic farming, crop rotation, reducing land degradation and soil conservation.Improve land management strategies used to protect the environment, boost productivity, strengthen livelihood and enhance food security among marginal sections of society.
Climate Change Vulnerability Assessment Report 155
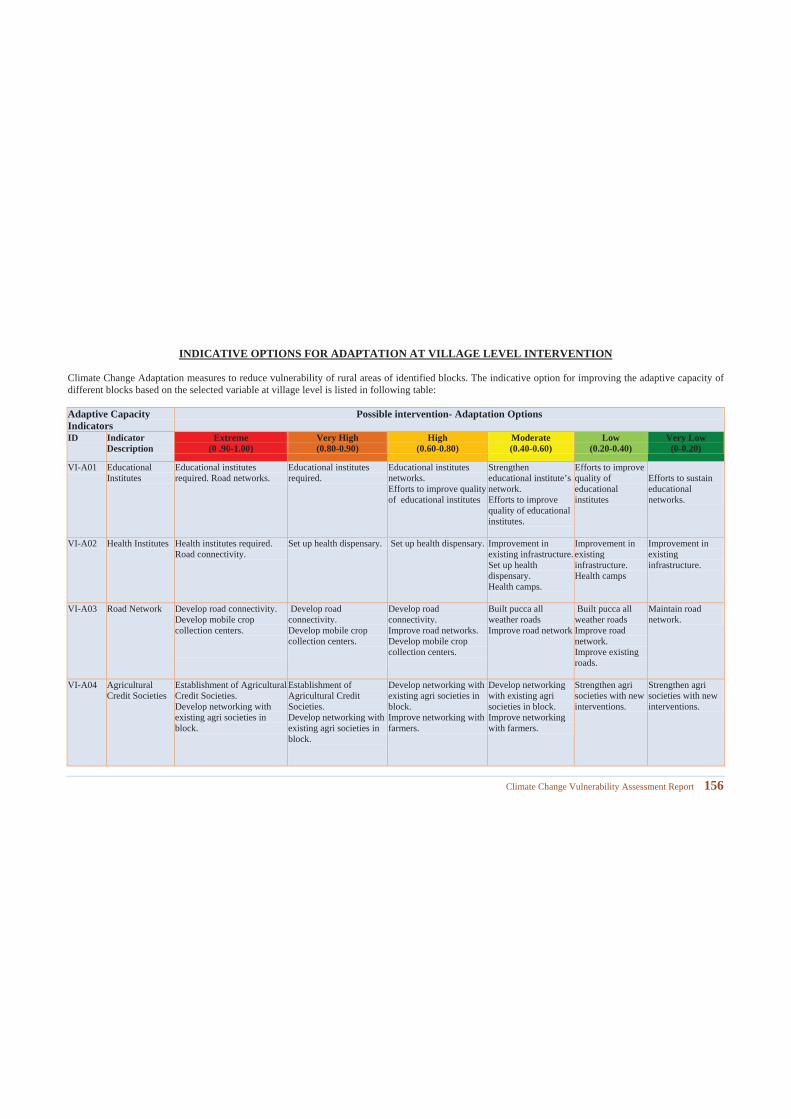
INDICATIVE OPTIONS FOR ADAPTATION AT VILLAGE LEVEL INTERVENTION
Climate Change Adaptation measures to reduce vulnerability of rural areas of identified blocks. The indicative option for improving the adaptive capacity of different blocks based on the selected variable at village level is listed in following table:
Adaptive Capacity Indicators
Possible intervention- Adaptation Options
ID Indicator Description
Extreme(0 .90-1.00)
Very High(0.80-0.90)
High(0.60-0.80)
Moderate(0.40-0.60)
Low(0.20-0.40)
Very Low(0-0.20)
VI-A01 Educational Institutes
Educational institutes required. Road networks.
Educational institutes required.
Educational institutes networks.Efforts to improve quality of educational institutes
Strengthen educational institute’s network.Efforts to improve quality of educational institutes.
Efforts to improve quality of educational institutes
Efforts to sustain educational networks.
VI-A02 Health Institutes Health institutes required.Road connectivity.
Set up health dispensary. Set up health dispensary. Improvement in existing infrastructure.Set up health dispensary.Health camps.
Improvement in existing infrastructure.Health camps
Improvement in existing infrastructure.
VI-A03 Road Network Develop road connectivity.Develop mobile crop collection centers.
Develop road connectivity.Develop mobile crop collection centers.
Develop road connectivity.Improve road networks.Develop mobile crop collection centers.
Built pucca all weather roadsImprove road network
Built pucca all weather roadsImprove road network.Improve existing roads.
Maintain road network.
VI-A04 Agricultural Credit Societies
Establishment of Agricultural Credit Societies.Develop networking with existing agri societies in block.
Establishment of Agricultural Credit Societies.Develop networking with existing agri societies in block.
Develop networking with existing agri societies in block.Improve networking with farmers.
Develop networking with existing agri societies in block.Improve networking with farmers.
Strengthen agri societies with new interventions.
Strengthen agri societies with new interventions.
Climate Change Vulnerability Assessment Report 156
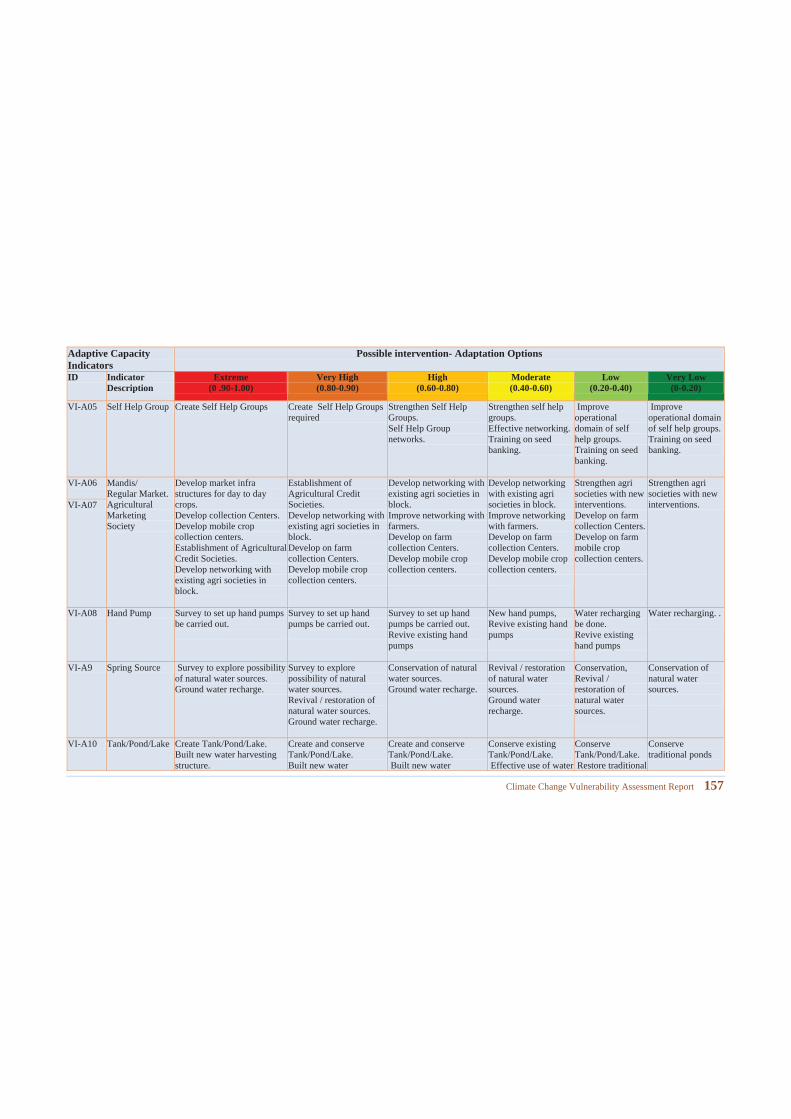
Adaptive Capacity Indicators
Possible intervention- Adaptation Options
ID Indicator Description
Extreme(0 .90-1.00)
Very High(0.80-0.90)
High(0.60-0.80)
Moderate(0.40-0.60)
Low(0.20-0.40)
Very Low(0-0.20)
VI-A05 Self Help Group Create Self Help Groups Create Self Help Groups required
Strengthen Self Help Groups.Self Help Group networks.
Strengthen self help groups.Effective networking.Training on seed banking.
Improve operational domain of self help groups.Training on seedbanking.
Improve operational domain of self help groups.Training on seed banking.
VI-A06 Mandis/Regular Market. Agricultural Marketing Society
Develop market infra structures for day to day crops.Develop collection Centers.Develop mobile crop collection centers.Establishment of Agricultural Credit Societies.Develop networking with existing agri societies in block.
Establishment of Agricultural Credit Societies.Develop networking with existing agri societies in block.Develop on farm collection Centers.Develop mobile crop collection centers.
Develop networking with existing agri societies in block.Improve networking with farmers.Develop on farm collection Centers.Develop mobile crop collection centers.
Develop networking with existing agri societies in block.Improve networking with farmers.Develop on farm collection Centers.Develop mobile crop collection centers.
Strengthen agri societies with new interventions.Develop on farm collection Centers.Develop on farm mobile crop collection centers.
Strengthen agri societies with new interventions.VI-A07
VI-A08 Hand Pump Survey to set up hand pumps be carried out.
Survey to set up hand pumps be carried out.
Survey to set up hand pumps be carried out.Revive existing hand pumps
New hand pumps,Revive existing hand pumps
Water recharging be done.Revive existing hand pumps
Water recharging. .
VI-A9 Spring Source Survey to explore possibility of natural water sources.Ground water recharge.
Survey to explore possibility of natural water sources.Revival / restoration of natural water sources.Ground water recharge.
Conservation of natural water sources.Ground water recharge.
Revival / restoration of natural water sources.Ground water recharge.
Conservation,Revival / restoration of natural water sources.
Conservation of natural water sources.
VI-A10 Tank/Pond/Lake Create Tank/Pond/Lake.Built new water harvesting structure.
Create and conserve Tank/Pond/Lake.Built new water
Create and conserve Tank/Pond/Lake.Built new water
Conserve existing Tank/Pond/Lake.Effective use of water
Conserve Tank/Pond/Lake.Restore traditional
Conserve traditional ponds
Climate Change Vulnerability Assessment Report 157
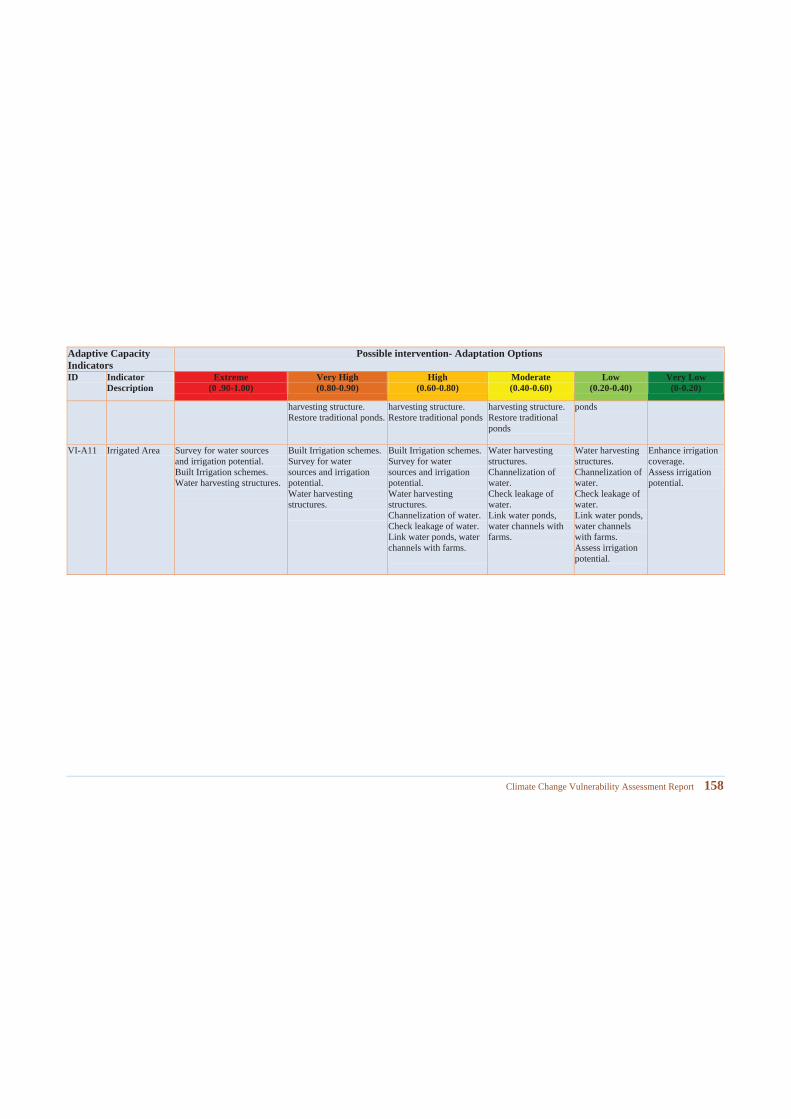
Adaptive Capacity Indicators
Possible intervention- Adaptation Options
ID Indicator Description
Extreme(0 .90-1.00)
Very High(0.80-0.90)
High(0.60-0.80)
Moderate(0.40-0.60)
Low(0.20-0.40)
Very Low(0-0.20)
harvesting structure.Restore traditional ponds.
harvesting structure. Restore traditional ponds
harvesting structure. Restore traditional ponds
ponds
VI-A11 Irrigated Area Survey for water sources and irrigation potential.Built Irrigation schemes.Water harvesting structures.
Built Irrigation schemes.Survey for water sources and irrigation potential.Water harvesting structures.
Built Irrigation schemes.Survey for water sources and irrigation potential.Water harvesting structures.Channelization of water.Check leakage of water.Link water ponds, water channels with farms.
Water harvesting structures.Channelization of water.Check leakage of water.Link water ponds, water channels with farms.
Water harvesting structures.Channelization of water.Check leakage of water.Link water ponds, water channels with farms.Assess irrigation potential.
Enhance irrigation coverage.Assess irrigation potential.
Climate Change Vulnerability Assessment Report 158
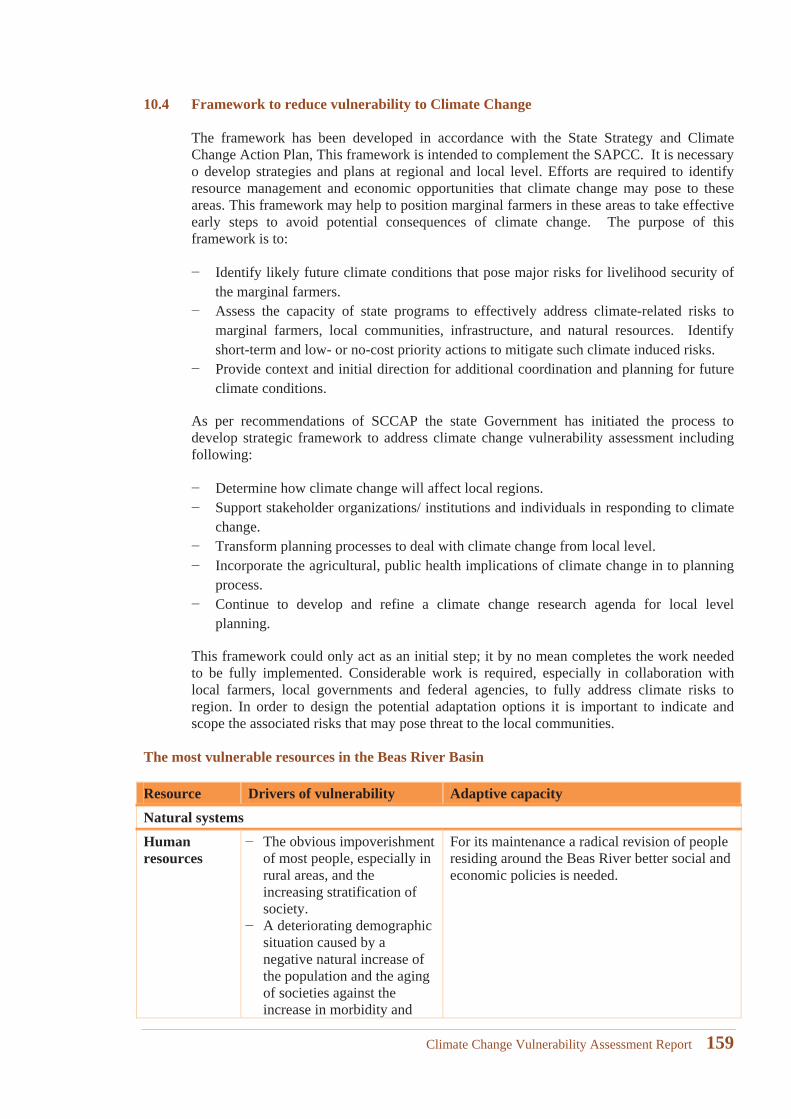
10.4 Framework to reduce vulnerability to Climate Change
The framework has been developed in accordance with the State Strategy and Climate Change Action Plan, This framework is intended to complement the SAPCC. It is necessary o develop strategies and plans at regional and local level. Efforts are required to identify resource management and economic opportunities that climate change may pose to these areas. This framework may help to position marginal farmers in these areas to take effective early steps to avoid potential consequences of climate change. The purpose of this framework is to:
Identify likely future climate conditions that pose major risks for livelihood security of the marginal farmers.Assess the capacity of state programs to effectively address climate-related risks to marginal farmers, local communities, infrastructure, and natural resources. Identify short-term and low- or no-cost priority actions to mitigate such climate induced risks.Provide context and initial direction for additional coordination and planning for future climate conditions.
As per recommendations of SCCAP the state Government has initiated the process to develop strategic framework to address climate change vulnerability assessment including following:
Determine how climate change will affect local regions.Support stakeholder organizations/ institutions and individuals in responding to climate change.Transform planning processes to deal with climate change from local level.Incorporate the agricultural, public health implications of climate change in to planning process.Continue to develop and refine a climate change research agenda for local level planning.
This framework could only act as an initial step; it by no mean completes the work needed to be fully implemented. Considerable work is required, especially in collaboration with local farmers, local governments and federal agencies, to fully address climate risks to region. In order to design the potential adaptation options it is important to indicate and scope the associated risks that may pose threat to the local communities.
The most vulnerable resources in the Beas River Basin
Resource Drivers of vulnerability Adaptive capacity Natural systemsHuman resources
The obvious impoverishment of most people, especially in rural areas, and the increasing stratification of society.A deteriorating demographic situation caused by a negative natural increase of the population and the aging of societies against the increase in morbidity and
For its maintenance a radical revision of people residing around the Beas River better social and economic policies is needed.
Climate Change Vulnerability Assessment Report 159
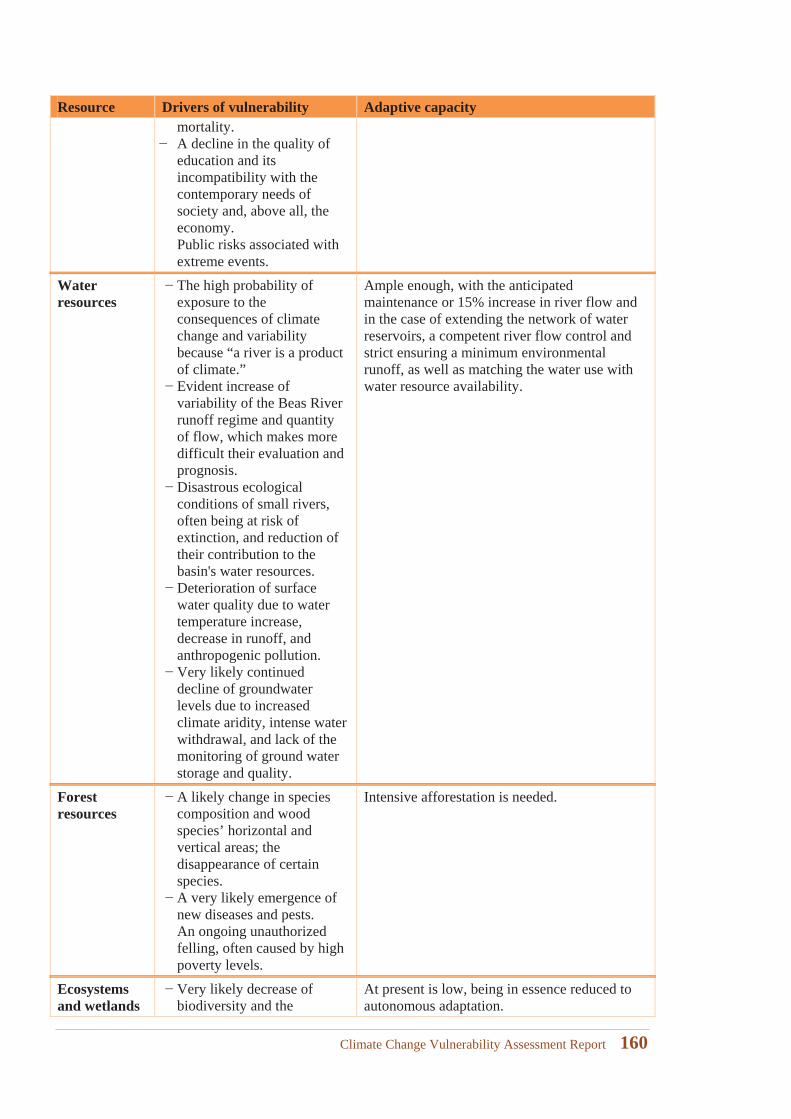
Resource Drivers of vulnerability Adaptive capacity mortality.A decline in the quality of education and its incompatibility with the contemporary needs of society and, above all, the economy.Public risks associated with extreme events.
Water resources
The high probability of exposure to the consequences of climate change and variability because “a river is a product of climate.”Evident increase of variability of the Beas River runoff regime and quantity of flow, which makes more difficult their evaluation and prognosis.Disastrous ecological conditions of small rivers, often being at risk of extinction, and reduction of their contribution to the basin's water resources.Deterioration of surface water quality due to water temperature increase, decrease in runoff, and anthropogenic pollution.Very likely continued decline of groundwater levels due to increased climate aridity, intense water withdrawal, and lack of the monitoring of ground water storage and quality.
Ample enough, with the anticipated maintenance or 15% increase in river flow and in the case of extending the network of water reservoirs, a competent river flow control and strict ensuring a minimum environmental runoff, as well as matching the water use with water resource availability.
Forest resources
A likely change in species composition and wood species’ horizontal and vertical areas; the disappearance of certain species.A very likely emergence of new diseases and pests.An ongoing unauthorized felling, often caused by high poverty levels.
Intensive afforestation is needed.
Ecosystems and wetlands
Very likely decrease of biodiversity and the
At present is low, being in essence reduced to autonomous adaptation.
Climate Change Vulnerability Assessment Report 160
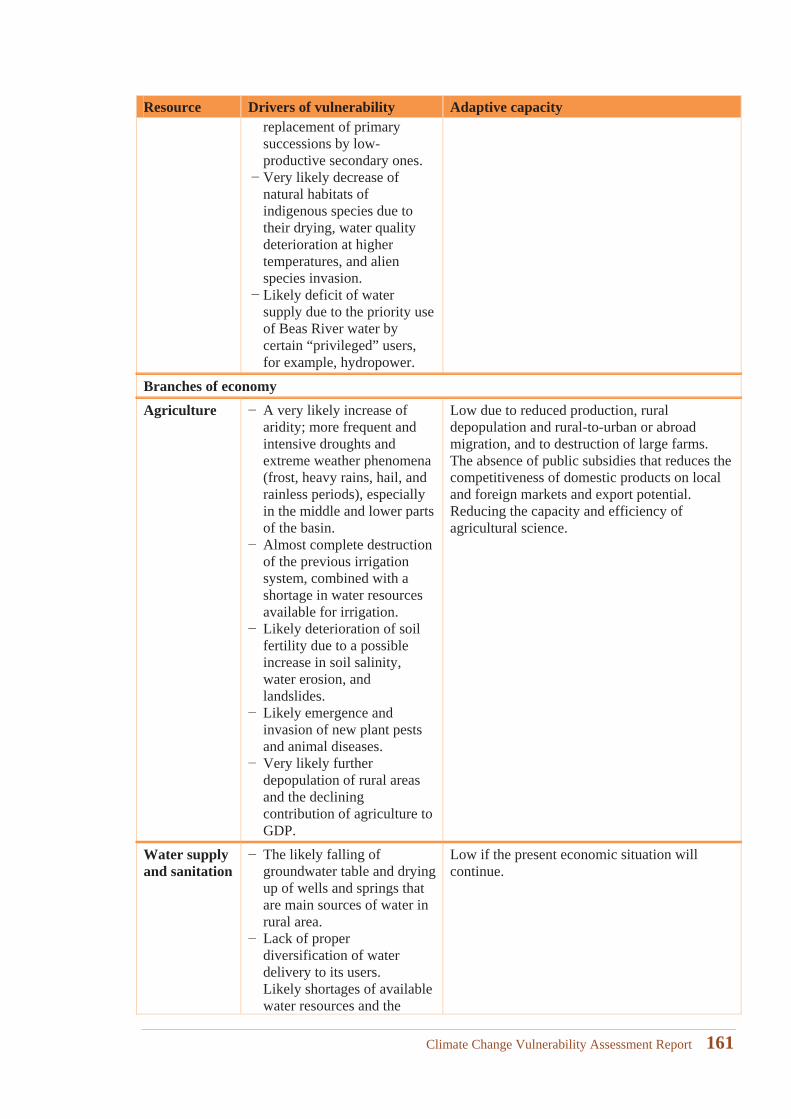
Resource Drivers of vulnerability Adaptive capacity replacement of primary successions by low-productive secondary ones.Very likely decrease of natural habitats of indigenous species due to their drying, water quality deterioration at higher temperatures, and alien species invasion.Likely deficit of water supply due to the priority use of Beas River water by certain “privileged” users, for example, hydropower.
Branches of economyAgriculture A very likely increase of
aridity; more frequent and intensive droughts and extreme weather phenomena (frost, heavy rains, hail, and rainless periods), especially in the middle and lower parts of the basin.Almost complete destruction of the previous irrigation system, combined with a shortage in water resources available for irrigation.Likely deterioration of soil fertility due to a possible increase in soil salinity, water erosion, and landslides.Likely emergence and invasion of new plant pests and animal diseases.Very likely further depopulation of rural areas and the declining contribution of agriculture to GDP.
Low due to reduced production, rural depopulation and rural-to-urban or abroad migration, and to destruction of large farms. The absence of public subsidies that reduces the competitiveness of domestic products on local and foreign markets and export potential.Reducing the capacity and efficiency of agricultural science.
Water supply and sanitation
The likely falling of groundwater table and drying up of wells and springs that are main sources of water in rural area.Lack of proper diversification of water delivery to its users.Likely shortages of available water resources and the
Low if the present economic situation will continue.
Climate Change Vulnerability Assessment Report 161
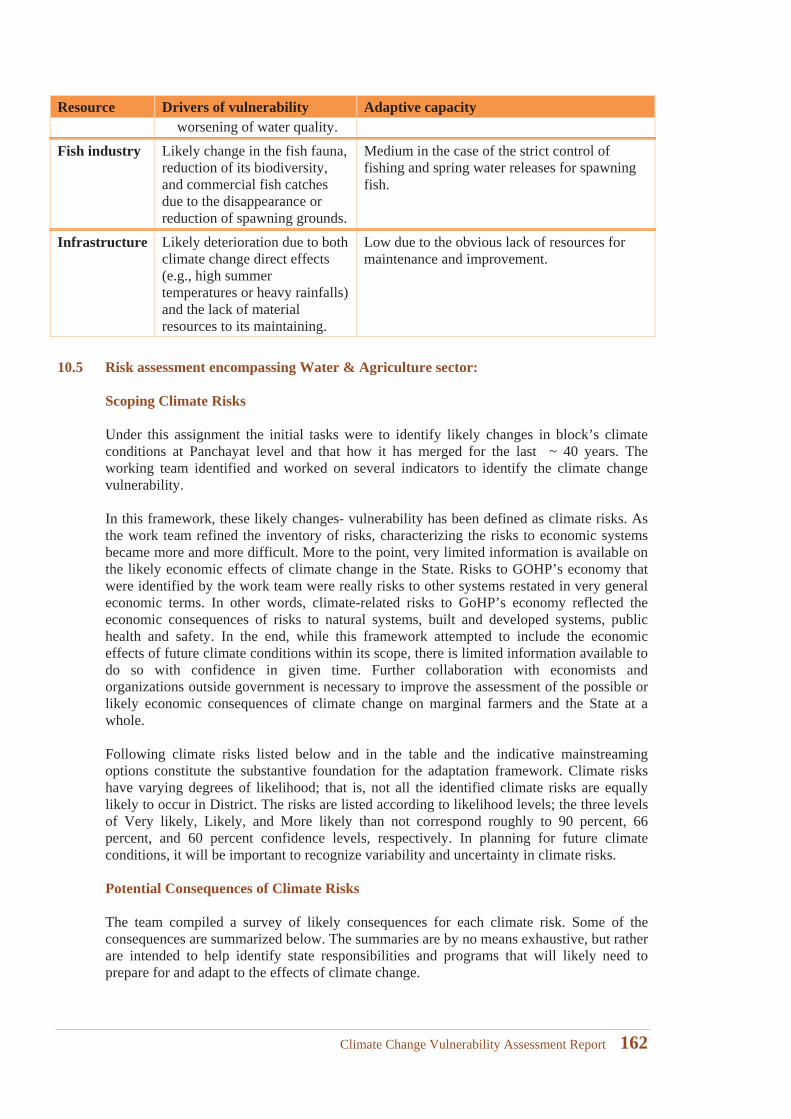
Resource Drivers of vulnerability Adaptive capacity worsening of water quality.
Fish industry Likely change in the fish fauna, reduction of its biodiversity, and commercial fish catches due to the disappearance or reduction of spawning grounds.
Medium in the case of the strict control of fishing and spring water releases for spawning fish.
Infrastructure Likely deterioration due to both climate change direct effects (e.g., high summer temperatures or heavy rainfalls) and the lack of material resources to its maintaining.
Low due to the obvious lack of resources for maintenance and improvement.
10.5 Risk assessment encompassing Water & Agriculture sector:
Scoping Climate Risks
Under this assignment the initial tasks were to identify likely changes in block’s climate conditions at Panchayat level and that how it has merged for the last ~ 40 years. The working team identified and worked on several indicators to identify the climate change vulnerability.
In this framework, these likely changes- vulnerability has been defined as climate risks. As the work team refined the inventory of risks, characterizing the risks to economic systems became more and more difficult. More to the point, very limited information is available on the likely economic effects of climate change in the State. Risks to GOHP’s economy that were identified by the work team were really risks to other systems restated in very general economic terms. In other words, climate-related risks to GoHP’s economy reflected the economic consequences of risks to natural systems, built and developed systems, public health and safety. In the end, while this framework attempted to include the economic effects of future climate conditions within its scope, there is limited information available to do so with confidence in given time. Further collaboration with economists and organizations outside government is necessary to improve the assessment of the possible or likely economic consequences of climate change on marginal farmers and the State at a whole.
Following climate risks listed below and in the table and the indicative mainstreaming options constitute the substantive foundation for the adaptation framework. Climate risks have varying degrees of likelihood; that is, not all the identified climate risks are equally likely to occur in District. The risks are listed according to likelihood levels; the three levels of Very likely, Likely, and More likely than not correspond roughly to 90 percent, 66 percent, and 60 percent confidence levels, respectively. In planning for future climate conditions, it will be important to recognize variability and uncertainty in climate risks.
Potential Consequences of Climate Risks
The team compiled a survey of likely consequences for each climate risk. Some of the consequences are summarized below. The summaries are by no means exhaustive, but rather are intended to help identify state responsibilities and programs that will likely need to prepare for and adapt to the effects of climate change.
Climate Change Vulnerability Assessment Report 162
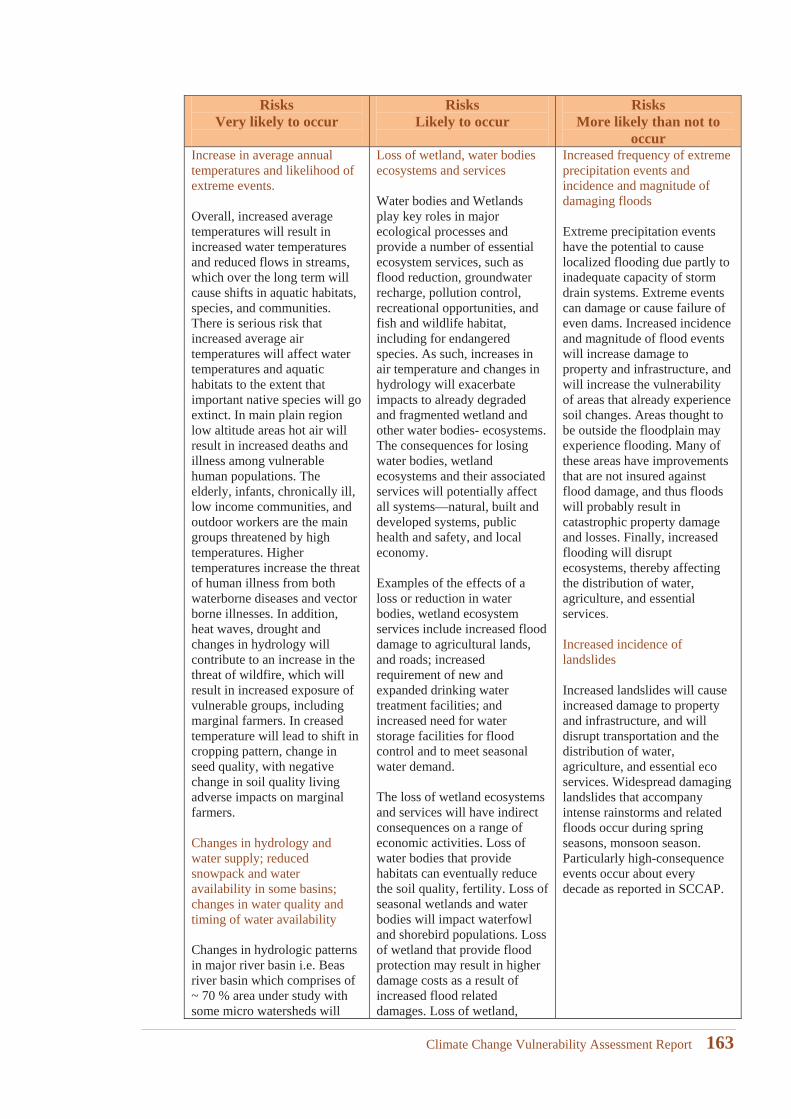
RisksVery likely to occur
RisksLikely to occur
Risks More likely than not to
occurIncrease in average annual temperatures and likelihood of extreme events.
Overall, increased average temperatures will result in increased water temperatures and reduced flows in streams, which over the long term will cause shifts in aquatic habitats, species, and communities. There is serious risk that increased average air temperatures will affect water temperatures and aquatic habitats to the extent that important native species will go extinct. In main plain region low altitude areas hot air will result in increased deaths and illness among vulnerable human populations. The elderly, infants, chronically ill, low income communities, and outdoor workers are the main groups threatened by high temperatures. Higher temperatures increase the threat of human illness from both waterborne diseases and vector borne illnesses. In addition, heat waves, drought and changes in hydrology will contribute to an increase in the threat of wildfire, which will result in increased exposure of vulnerable groups, including marginal farmers. In creased temperature will lead to shift in cropping pattern, change in seed quality, with negative change in soil quality living adverse impacts on marginal farmers.
Changes in hydrology and water supply; reduced snowpack and water availability in some basins; changes in water quality and timing of water availability
Changes in hydrologic patterns in major river basin i.e. Beas river basin which comprises of ~ 70 % area under study with some micro watersheds will
Loss of wetland, water bodies ecosystems and services
Water bodies and Wetlands play key roles in major ecological processes and provide a number of essential ecosystem services, such as flood reduction, groundwater recharge, pollution control, recreational opportunities, and fish and wildlife habitat, including for endangered species. As such, increases in air temperature and changes in hydrology will exacerbate impacts to already degraded and fragmented wetland and other water bodies- ecosystems. The consequences for losing water bodies, wetland ecosystems and their associated services will potentially affect all systems—natural, built and developed systems, public health and safety, and local economy.
Examples of the effects of a loss or reduction in water bodies, wetland ecosystem services include increased flood damage to agricultural lands, and roads; increased requirement of new and expanded drinking water treatment facilities; and increased need for water storage facilities for flood control and to meet seasonal water demand.
The loss of wetland ecosystems and services will have indirect consequences on a range of economic activities. Loss of water bodies that provide habitats can eventually reduce the soil quality, fertility. Loss of seasonal wetlands and water bodies will impact waterfowl and shorebird populations. Loss of wetland that provide flood protection may result in higher damage costs as a result of increased flood related damages. Loss of wetland,
Increased frequency of extreme precipitation events and incidence and magnitude of damaging floods
Extreme precipitation events have the potential to cause localized flooding due partly to inadequate capacity of storm drain systems. Extreme events can damage or cause failure of even dams. Increased incidence and magnitude of flood events will increase damage to property and infrastructure, and will increase the vulnerability of areas that already experience soil changes. Areas thought to be outside the floodplain may experience flooding. Many of these areas have improvements that are not insured against flood damage, and thus floods will probably result in catastrophic property damage and losses. Finally, increased flooding will disrupt ecosystems, thereby affecting the distribution of water, agriculture, and essential services.
Increased incidence of landslides
Increased landslides will cause increased damage to property and infrastructure, and will disrupt transportation and the distribution of water, agriculture, and essential eco services. Widespread damaging landslides that accompany intense rainstorms and related floods occur during spring seasons, monsoon season. Particularly high-consequence events occur about every decade as reported in SCCAP.
Climate Change Vulnerability Assessment Report 163
affect supplies of water for all uses, and will contribute to increased water quality problems. Reduced availability of water will affect marginal irrigators, changed water supply planning in many micro watersheds, and affect the quality and availability of water for some public drinking water systems as well. Proposals for surface water storage may increase. Changes in the timing and quality of available water will affect aquatic, wetland, and riparian ecosystems and species, especially species that need adequate water in stream to survive and populations that are already identified as threatened or endangered. Hydrologic changes will exacerbate temperature-related water quality problems. Water users suffering the most adverse consequences will be the marginal farmers- irrigators. Irrigated agriculture is a primary economic driver in Kullu districts so without careful planning for the consequences of climate change, the agricultural economy may suffer significantly.
Changes in hydrology have the potential to significantly affect agricultural productivity until crops suited to new hydrologic conditions are developed.
water bodies that purify water may result in the need for expanded or additional drinking water treatment facilities. Loss of wetland, water bodies that provide water storage may result in the need for the construction of expanded and additional infrastructure to prevent flooding and to meet summer time water demands.
Increase in stream temperatures, with potential for changes in rivulets chemistry
Higher temperature of water bodies will have a negative effect on some local native species and could result in dramatic changes in local ecosystems. Changes in temperature and upwelling may be positive for some species and negative for others off. If there are large increases in temperatures, there is a potential for significant restructuring of the ecological communities on the rivers basin. Population variation of many local species is likely to increase due to direct biological effects of climate change and indirect cascading ecological effects.
Increased incidence of drought
Longer and drier growing seasons and drought will result in increased demand on ground water resources and increased consumption of water for irrigation, which will have potential consequences for natural systems. Droughts affect wetlands, stream systems, and aquatic habitats. Drought will result in drier forests and increase likelihood of forest fires. Droughts will cause significant economic damage to the agriculture industry through reduced yields and quality of some crops. Droughts can increase irrigation-related water consumption, and thus increase irrigation costs. Drought conditions can also have a
Climate Change Vulnerability Assessment Report 164
significant effect on the supply of drinking water.
Increased soil erosion and risk of inundation from increasing levels due to rain intensity and increasing storm intensity
Increased storm, and high rain intensity levels can lead to loss of natural buffering functions of land scapes, wetlands. Accelerating soil erosion has been observed, and may require increased applications of check dams, protective structures. Soil alterations typically reduce the fertility, chocking of wetlands, and dune to adjust to new conditions. Increasing temperatures, dry conditions will increase soil erosion and likely increase damage to irrigated lands, agricultural lands and infrastructure situated on river banks. Soil erosion and the common response to reduce soil erosion can lead to long-term loss of natural buffering functions of irrigated lands and micro watersheds. Applications for soil alteration permits to protect property and such infrastructure are increasing, but in the long term they may reduce the ability of micro watershed systems to adjust to new conditions.
Changes in abundance and geographical distributions of plant species and habitats for aquatic and terrestrial wildlife
Changes in temperature and precipitation regimes will result in a gradual migration of some species and habitats north and to higher elevations. Species that cannot migrate or shift their range quickly enough to respond to climate change, or that have specific life-history needs that cannot be met through migration, will likely experience a decline in population numbers, potentially leading to extinction. Changes in temperatures and hydrology will affect aquatic, wetland, and
Climate Change Vulnerability Assessment Report 165
riparian ecosystems and species, especially species or population units that are already identified as threatened or endangered. Risk of damage by insect and plant pests, which can result in significant damage to native species and communities, will increase with warmer temperatures. Alterations to the species composition of native ecosystems will likely result in a decline in important ecosystem services, including water quality and quantity, carbon storage, soil stabilization, flood control, and nutrient cycling.
Increase in diseases, invasive species and insect, animal and plant pests
Invasive species can negatively impact native plants, fish, and wildlife in agricultural ecosystems by displacing native species, changing habitat characteristics, consuming significant amounts of water, and changing fire regimes. Invasive species have already caused damage forests, grasslands, and wetlands, and agricultural economy. Spread of infectious diseases in the some of micro watershed is occurring, with increased vulnerability to local ecosystems to existing and emerging conditions.
Increase in wildfire frequency and intensity
Increased temperatures, the potential for reduced precipitation in summer months, and accumulation of dry leaves, pine needles in forests due to insect and disease damage (particularly in eastside forests) present high risk for catastrophic fires. An increase in frequency and intensity of forests fire may damage larger areas, and likely cause greater ecosystem and habitat damage. Forests fires may causes crop
Climate Change Vulnerability Assessment Report 166
damages, human health risks due to exposure to smoke etc. Increased risk of forests fire may result in increased potential for economic damage at the urban-forest land interface. Forests fire destroy property, recreational opportunities, and ecosystem services. Some buildings and infrastructure subject to increased fire risk may not be adequately insured against losses due to fire. Increased fire danger will increase the cost to prevent, prepare for, and respond to forests fires.
Selecting Short-Term Priority Actions
From the above climate risks one can easily look at;1) The basic capacities of different organizations to address the identified risks; and2) to compile a list of immediate or short-term actions that may help to improve local
capacity to address the risks.
This effort is indicative primarily an initial scoping exercise. There may be many other short-term actions that may be needed to effectively address the identified risks. But given resourceand time considerations makes it paramount to limit the list of needed actions to a few relatively low-cost actions. Resources are not indicated to implement any or more than only a few of the needed actions. It thus in turn necessary to identify a limited set of top priority, short-term, low-cost actions from the list. In consultation with nodal department, stakeholders, local agencies, the team prioritized needed actions according to the benefits of each one relative to all the other actions. In selecting priority actions, the team based its assessment on a very general idea of the relative magnitude of the costs and benefits for each of the actions. In attempting to narrow its focus on low cost, high benefit actions, the team assigned high, medium, and low cost and benefit values to each action, relative to the costs and benefits of the other actions, using the following guidelines in the evaluation:
Costs Costs to the state: The approximate individual cost to implement the action.Costs to major farmers, landowners and growers: Costs to private parties and businesses associations of implementing the action. Costs to the public and to particular vulnerable communities, marginal farmers: All other costs to the public, including infrastructure costs and costs to localgovernments.
Benefits Higher priority actions respond to higher likelihood of risks.Avoided costs: Reduced losses and damage from climate conditions that will be achieved in a 10-20 year timeframe if the actions are initiated now onwards.Higher priority actions address the effects of more than one risks simultaneously.
Climate Change Vulnerability Assessment Report 167
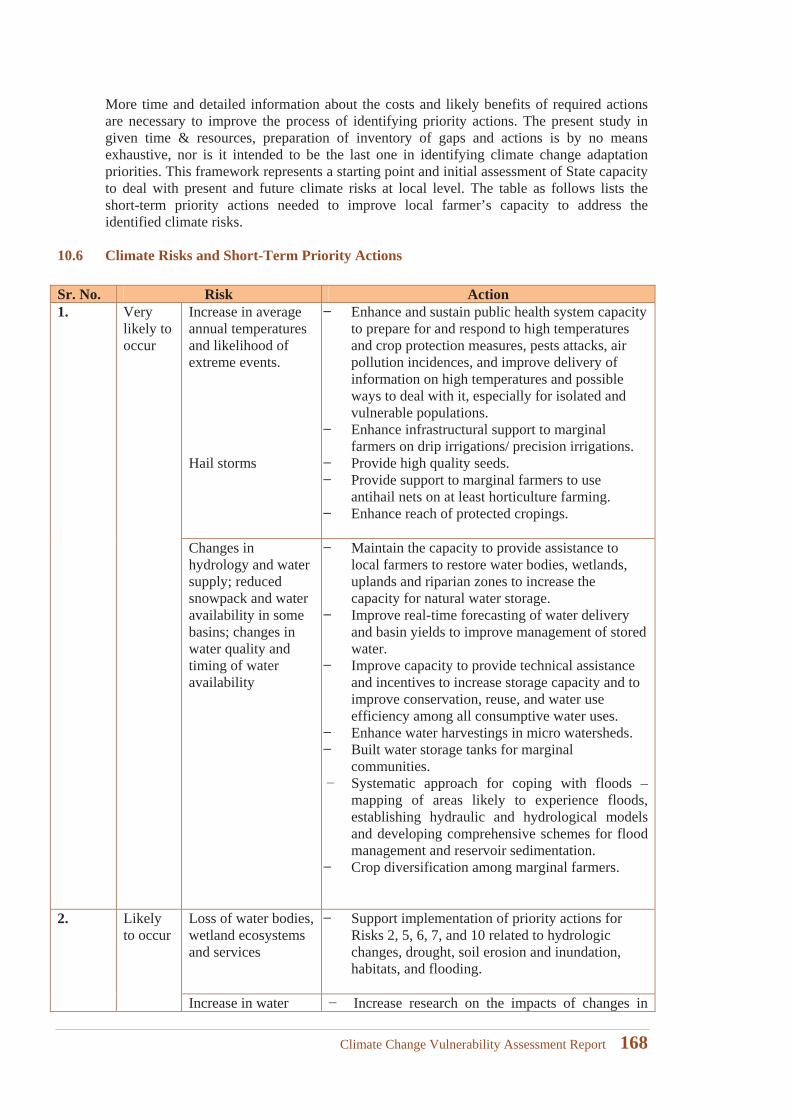
More time and detailed information about the costs and likely benefits of required actions are necessary to improve the process of identifying priority actions. The present study in given time & resources, preparation of inventory of gaps and actions is by no means exhaustive, nor is it intended to be the last one in identifying climate change adaptation priorities. This framework represents a starting point and initial assessment of State capacity to deal with present and future climate risks at local level. The table as follows lists the short-term priority actions needed to improve local farmer’s capacity to address the identified climate risks.
10.6 Climate Risks and Short-Term Priority Actions
Sr. No. Risk Action1. Very
likely to occur
Increase in average annual temperatures and likelihood of extreme events.
Hail storms
Enhance and sustain public health system capacity to prepare for and respond to high temperatures and crop protection measures, pests attacks, air pollution incidences, and improve delivery of information on high temperatures and possible ways to deal with it, especially for isolated and vulnerable populations.Enhance infrastructural support to marginal farmers on drip irrigations/ precision irrigations.Provide high quality seeds.Provide support to marginal farmers to use antihail nets on at least horticulture farming.Enhance reach of protected cropings.
Changes in hydrology and water supply; reduced snowpack and water availability in some basins; changes in water quality and timing of water availability
Maintain the capacity to provide assistance to local farmers to restore water bodies, wetlands, uplands and riparian zones to increase the capacity for natural water storage.Improve real-time forecasting of water delivery and basin yields to improve management of stored water.Improve capacity to provide technical assistance and incentives to increase storage capacity and to improve conservation, reuse, and water use efficiency among all consumptive water uses. Enhance water harvestings in micro watersheds.Built water storage tanks for marginal communities.Systematic approach for coping with floods –mapping of areas likely to experience floods, establishing hydraulic and hydrological models and developing comprehensive schemes for flood management and reservoir sedimentation.Crop diversification among marginal farmers.
2. Likely to occur
Loss of water bodies, wetland ecosystems and services
Support implementation of priority actions for Risks 2, 5, 6, 7, and 10 related to hydrologic changes, drought, soil erosion and inundation, habitats, and flooding.
Increase in water Increase research on the impacts of changes in
Climate Change Vulnerability Assessment Report 168
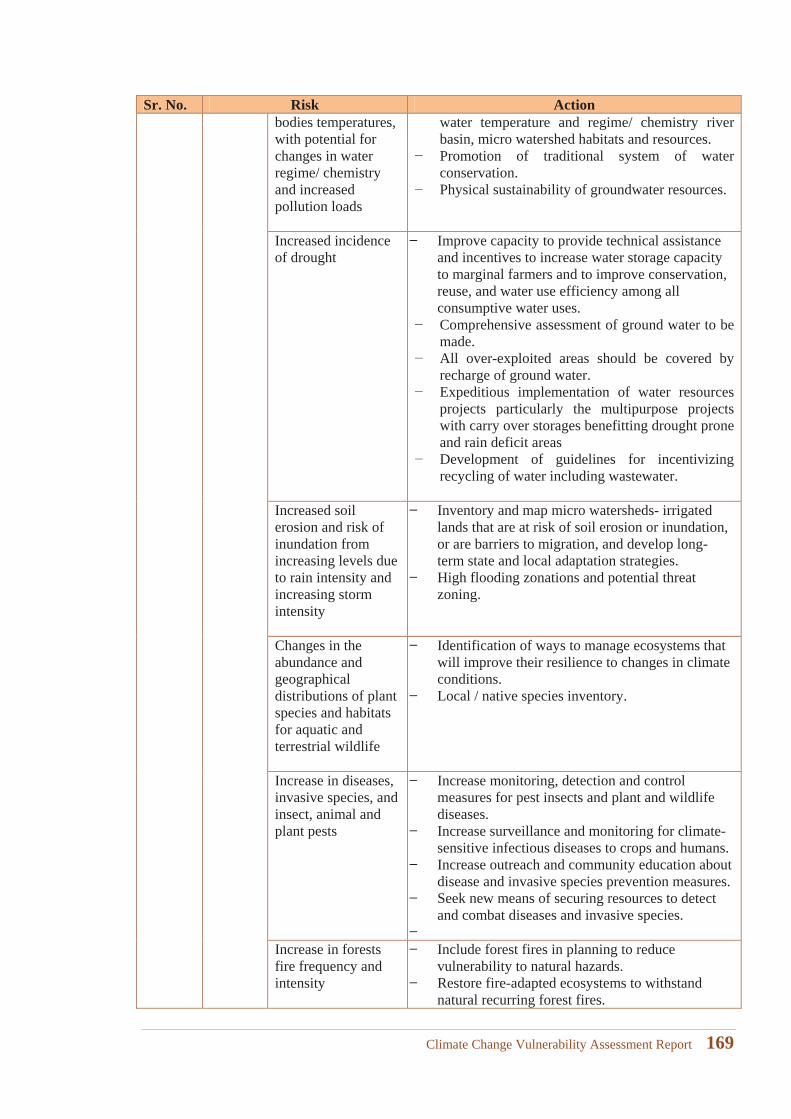
Sr. No. Risk Actionbodies temperatures, with potential for changes in water regime/ chemistry and increased pollution loads
water temperature and regime/ chemistry river basin, micro watershed habitats and resources. Promotion of traditional system of water conservation.Physical sustainability of groundwater resources.
Increased incidence of drought
Improve capacity to provide technical assistance and incentives to increase water storage capacity to marginal farmers and to improve conservation, reuse, and water use efficiency among all consumptive water uses.Comprehensive assessment of ground water to be made.All over-exploited areas should be covered by recharge of ground water.Expeditious implementation of water resources projects particularly the multipurpose projects with carry over storages benefitting drought prone and rain deficit areasDevelopment of guidelines for incentivizing recycling of water including wastewater.
Increased soil erosion and risk of inundation from increasing levels due to rain intensity and increasing storm intensity
Inventory and map micro watersheds- irrigated lands that are at risk of soil erosion or inundation, or are barriers to migration, and develop long-term state and local adaptation strategies.High flooding zonations and potential threat zoning.
Changes in the abundance and geographical distributions of plant species and habitats for aquatic and terrestrial wildlife
Identification of ways to manage ecosystems that will improve their resilience to changes in climate conditions.Local / native species inventory.
Increase in diseases, invasive species, and insect, animal and plant pests
Increase monitoring, detection and control measures for pest insects and plant and wildlife diseases.Increase surveillance and monitoring for climate-sensitive infectious diseases to crops and humans.Increase outreach and community education about disease and invasive species prevention measures.Seek new means of securing resources to detect and combat diseases and invasive species.
Increase in forests fire frequency and intensity
Include forest fires in planning to reduce vulnerability to natural hazards.Restore fire-adapted ecosystems to withstand natural recurring forest fires.
Climate Change Vulnerability Assessment Report 169
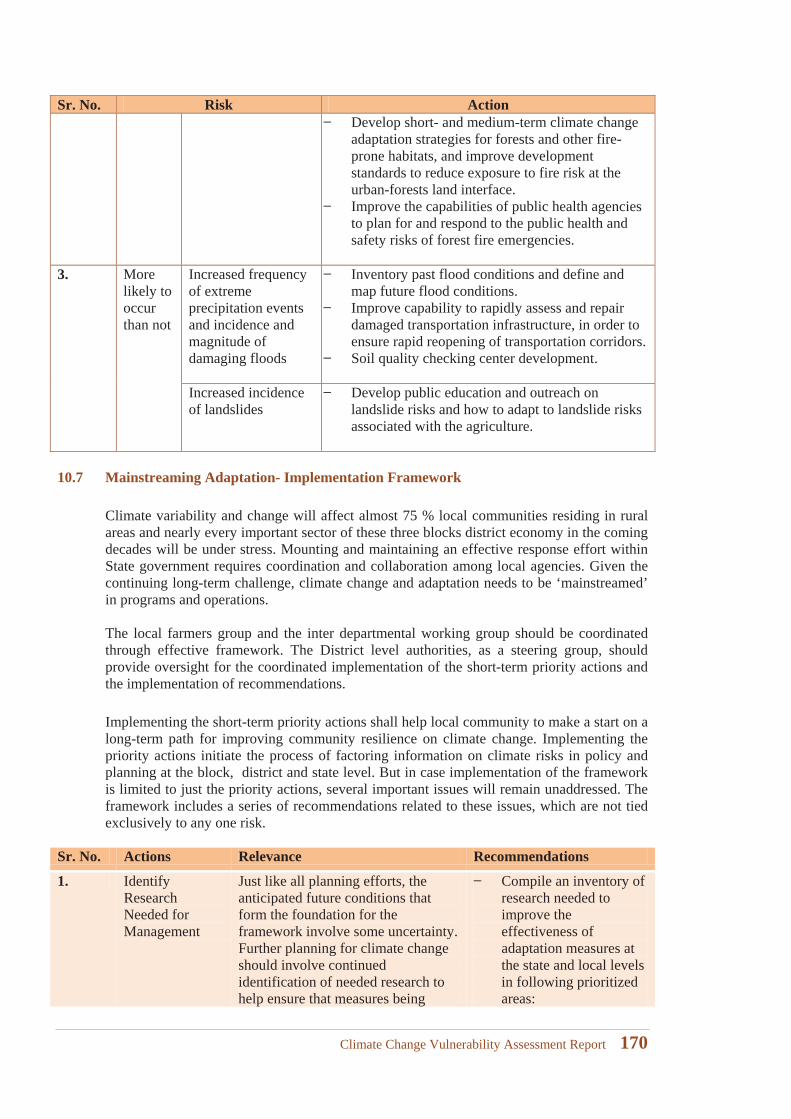
Sr. No. Risk ActionDevelop short- and medium-term climate change adaptation strategies for forests and other fire-prone habitats, and improve development standards to reduce exposure to fire risk at the urban-forests land interface.Improve the capabilities of public health agencies to plan for and respond to the public health and safety risks of forest fire emergencies.
3. More likely to occur than not
Increased frequency of extreme precipitation events and incidence and magnitude of damaging floods
Inventory past flood conditions and define and map future flood conditions.Improve capability to rapidly assess and repair damaged transportation infrastructure, in order to ensure rapid reopening of transportation corridors.Soil quality checking center development.
Increased incidence of landslides
Develop public education and outreach on landslide risks and how to adapt to landslide risks associated with the agriculture.
10.7 Mainstreaming Adaptation- Implementation Framework
Climate variability and change will affect almost 75 % local communities residing in rural areas and nearly every important sector of these three blocks district economy in the coming decades will be under stress. Mounting and maintaining an effective response effort within State government requires coordination and collaboration among local agencies. Given the continuing long-term challenge, climate change and adaptation needs to be ‘mainstreamed’ in programs and operations.
The local farmers group and the inter departmental working group should be coordinated through effective framework. The District level authorities, as a steering group, should provide oversight for the coordinated implementation of the short-term priority actions and the implementation of recommendations.
Implementing the short-term priority actions shall help local community to make a start on a long-term path for improving community resilience on climate change. Implementing the priority actions initiate the process of factoring information on climate risks in policy and planning at the block, district and state level. But in case implementation of the framework is limited to just the priority actions, several important issues will remain unaddressed. The framework includes a series of recommendations related to these issues, which are not tied exclusively to any one risk.
Sr. No. Actions Relevance Recommendations
1. Identify Research Needed for Management
Just like all planning efforts, the anticipated future conditions that form the foundation for the framework involve some uncertainty. Further planning for climate change should involve continued identification of needed research to help ensure that measures being
Compile an inventory of research needed to improve the effectiveness of adaptation measures at the state and local levels in following prioritized areas:
Climate Change Vulnerability Assessment Report 170
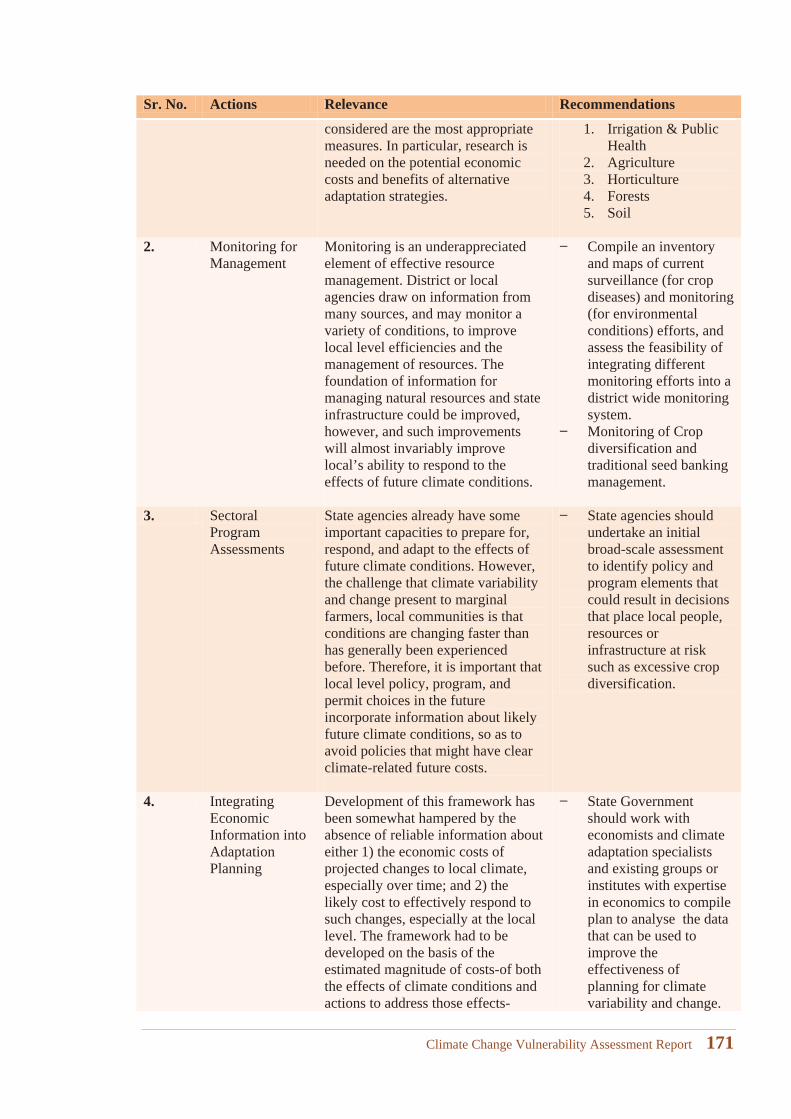
Sr. No. Actions Relevance Recommendations
considered are the most appropriate measures. In particular, research is needed on the potential economic costs and benefits of alternative adaptation strategies.
1. Irrigation & Public Health
2. Agriculture 3. Horticulture 4. Forests5. Soil
2. Monitoring for Management
Monitoring is an underappreciated element of effective resource management. District or local agencies draw on information from many sources, and may monitor a variety of conditions, to improve local level efficiencies and the management of resources. The foundation of information for managing natural resources and state infrastructure could be improved, however, and such improvements will almost invariably improve local’s ability to respond to the effects of future climate conditions.
Compile an inventory and maps of current surveillance (for crop diseases) and monitoring (for environmental conditions) efforts, and assess the feasibility of integrating different monitoring efforts into a district wide monitoring system.Monitoring of Crop diversification and traditional seed banking management.
3. Sectoral Program Assessments
State agencies already have some important capacities to prepare for, respond, and adapt to the effects of future climate conditions. However, the challenge that climate variability and change present to marginal farmers, local communities is that conditions are changing faster than has generally been experienced before. Therefore, it is important that local level policy, program, and permit choices in the future incorporate information about likely future climate conditions, so as to avoid policies that might have clear climate-related future costs.
State agencies should undertake an initial broad-scale assessment to identify policy and program elements that could result in decisions that place local people, resources or infrastructure at risk such as excessive crop diversification.
4. Integrating Economic Information into Adaptation Planning
Development of this framework has been somewhat hampered by the absence of reliable information about either 1) the economic costs of projected changes to local climate, especially over time; and 2) the likely cost to effectively respond to such changes, especially at the local level. The framework had to be developed on the basis of the estimated magnitude of costs-of both the effects of climate conditions and actions to address those effects-
State Government should work with economists and climate adaptation specialists and existing groups or institutes with expertise in economics to compile plan to analyse the data that can be used to improve the effectiveness of planning for climate variability and change.
Climate Change Vulnerability Assessment Report 171
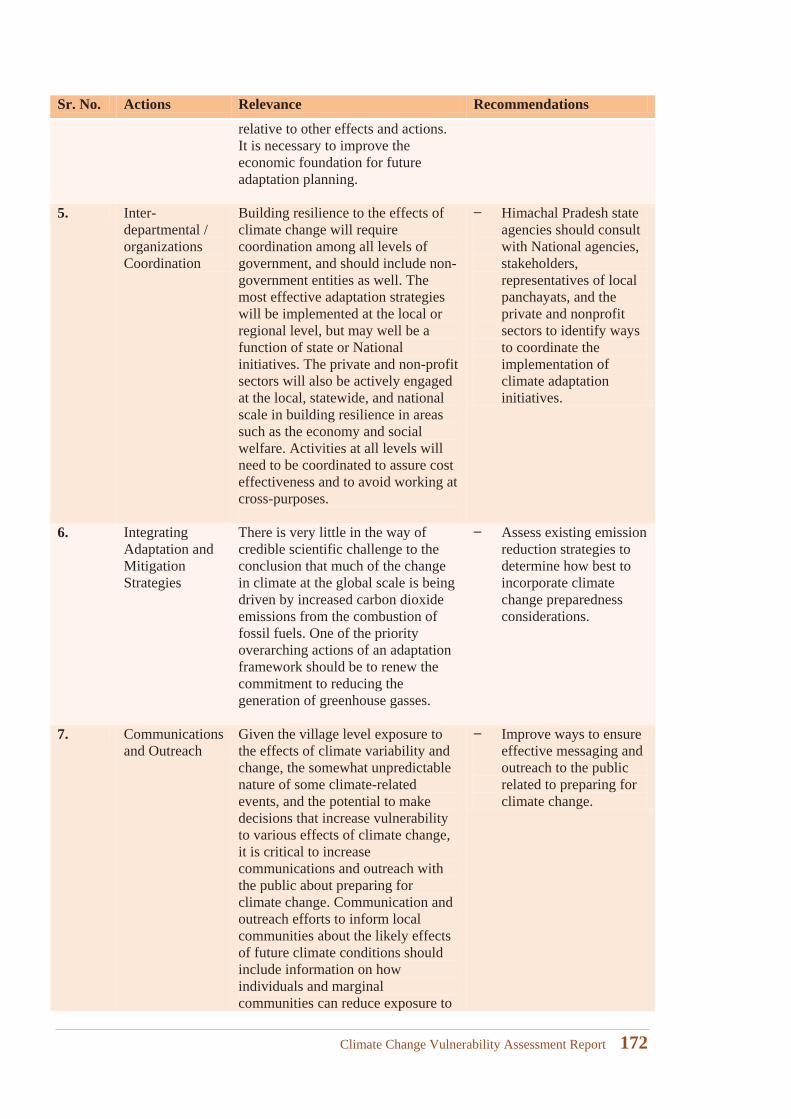
Sr. No. Actions Relevance Recommendations
relative to other effects and actions. It is necessary to improve the economic foundation for future adaptation planning.
5. Inter-departmental / organizations Coordination
Building resilience to the effects of climate change will require coordination among all levels of government, and should include non-government entities as well. The most effective adaptation strategies will be implemented at the local or regional level, but may well be a function of state or National initiatives. The private and non-profit sectors will also be actively engaged at the local, statewide, and national scale in building resilience in areas such as the economy and social welfare. Activities at all levels will need to be coordinated to assure cost effectiveness and to avoid working at cross-purposes.
Himachal Pradesh state agencies should consult with National agencies, stakeholders, representatives of local panchayats, and the private and nonprofit sectors to identify ways to coordinate the implementation of climate adaptation initiatives.
6. Integrating Adaptation and Mitigation Strategies
There is very little in the way of credible scientific challenge to the conclusion that much of the change in climate at the global scale is being driven by increased carbon dioxide emissions from the combustion of fossil fuels. One of the priority overarching actions of an adaptation framework should be to renew the commitment to reducing the generation of greenhouse gasses.
Assess existing emission reduction strategies to determine how best to incorporate climate change preparedness considerations.
7. Communications and Outreach
Given the village level exposure to the effects of climate variability and change, the somewhat unpredictable nature of some climate-related events, and the potential to make decisions that increase vulnerability to various effects of climate change, it is critical to increase communications and outreach with the public about preparing for climate change. Communication and outreach efforts to inform local communities about the likely effects of future climate conditions should include information on how individuals and marginal communities can reduce exposure to
Improve ways to ensure effective messaging and outreach to the public related to preparing for climate change.
Climate Change Vulnerability Assessment Report 172
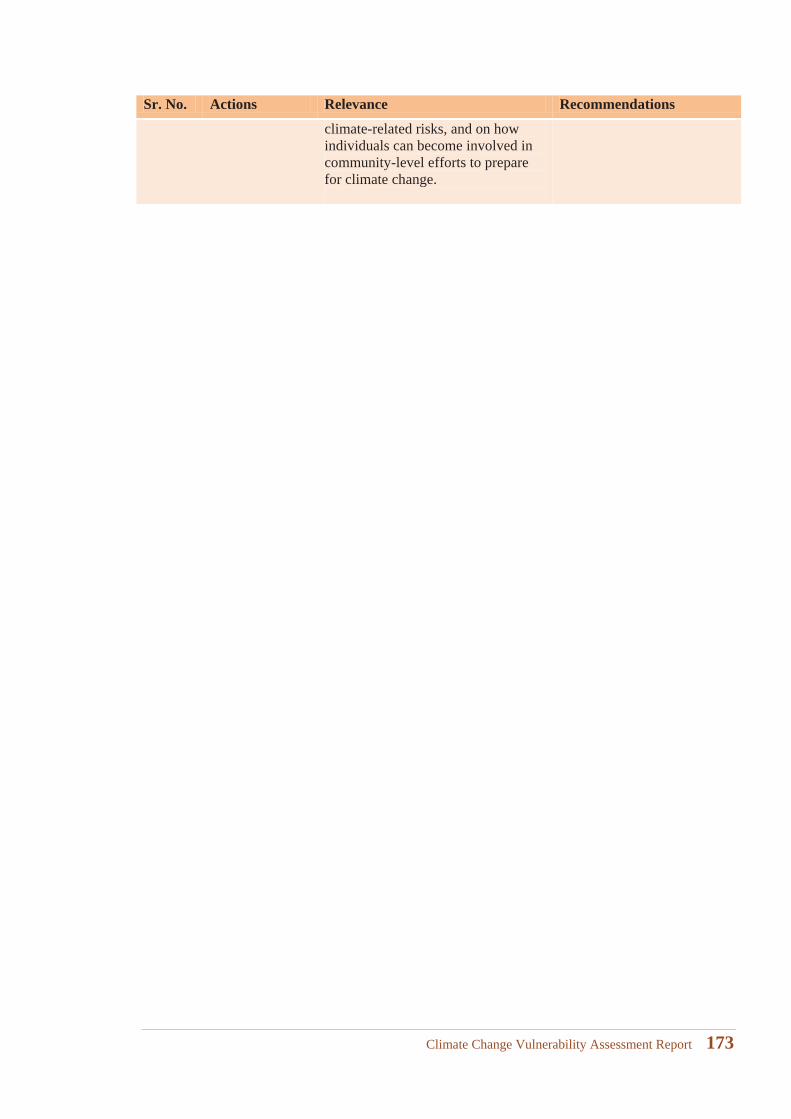
Sr. No. Actions Relevance Recommendations
climate-related risks, and on how individuals can become involved in community-level efforts to prepare for climate change.
Climate Change Vulnerability Assessment Report 173

Climate Change Vulnerability Assessment Report 174
11 Bibliography
Climate Change Vulnerability Assessment Report 175

Climate Change Vulnerability Assessment Report 176
11 Bibliography
State Strategy and Action Plan on Climate Change (SAPCC), Department of Environment, Science & Technology, Government of Himachal Pradesh, website: www.desthp.nic.in.
Environment Master Plan, Department of Environment, Science & Technology, Government of Himachal Pradesh, website: www.desthp.nic.in.
2011 Census Data, Office of the Registrar General & Census Commissioner, India http://www.censusindia.gov.in.
Himachal Pradesh 2011 Census Village Atlas, Regional Office, Directorate of Census, Longwood, Shimla, Himachal Pradesh.
Economic Survey 2016-17, Department of Economics & Statistics, Himachal Pradesh.
Quantum GIS User Guide http://www.qgis.org/en/site/.
QGIS Interface for SWAT (QSWAT) Prepared by: Yihun Dile, R. Srinivasan and Chris George.
QSWAT software downloaded from http://swat.tamu.edu/software/qswat/.
Preparing global soil and landuse data for QSWAT, Chris George, January 2015. http://srtm.csi.cgiar.org/.
Preparing global DEM data for QSWAT, Chris George, March 2015 http://earthexplorer.usgs.gov/.
SRTM DEM data from International Centre for Tropical Agriculture (CIAT), available from the SRTM 30m Database: http://srtm.csi.cgiar.org.
Global Weather Data for QSWAT, The National Centers for Environmental Prediction (NCEP) Climate Forecast System Reanalysis (CFSR) over the 36-year period of 1979 through 2014 https://globalweather.tamu.edu/.
Srinivasan, R. and J.G. Arnold. (1994). Integration of a Basin-Scale Water Quality Model with GIS. Water Resources Bulletin. Vol. 30, No. 3., June 1994. Pgs. 453-462.
OGC, Open Geospatial Consortium, http://www.opengeospatial.org.
OS GIS, Open Source GIS, http://opensourcegis.org/.
Intergovernmental panel on Climate change – IPCC – Fifth Assessment Synthesis Report –Adopted Nov 2014.
IPCC (Intergovernmental Panel on Climate Change) (2001) The Regional Impacts of Climate Change: An Assessment of Vulnerability: Special Report of IPCC Working Group II (Watson, R.T., M.C. Zinyowera, and R.H.Moss (eds.). Intergovernmental Panel on Climate Change, Cambridge, UK: Cambridge University Press. 517.
IPCC (Intergovernmental Panel on Climate Change) (2001) Climate Change 2001: Impacts, Adaptation, and Vulnerability, McCarthy JJ, et al. eds. Contribution of Working Group II to the Third Assessment Report of the Intergovernmental Panel on Climate Change. Cambridge, UK: Cambridge University Press.
IPCC (Intergovernmental Panel on Climate Change) (2007) Climate Change 2007: Impacts, Adaptation and Vulnerability. Contribution of Working Group II to the Fourth Assessment Report of the Intergovernmental Panel on Climate Change, Parry ML, Canziani OF, Palutikof JP, van der Linden PJ and Hanson CE, eds. Cambridge, UK: Cambridge University Press.
Gosain A.K., Nagraj S. Patil, Chakresh Sahu, D.C. Thakur (2009), "Geospatial Web Portal for Hydrological Information", Proceedings of the 4th Indian International Conference on
Climate Change Vulnerability Assessment Report 177
Artificial Intelligence, IICAI 2009, Tumkur, Karnataka, India, December 16-18, 2009, pp 1327-1338. [websites: http://gisserver.civil.iitd.ac.in/ HIS]
Compendium on Impact of Climate Change in Agriculture (2010) compiled and edited by Surgeet Kumar & Rajesh Thakur, Directorate of Extension Education CSKHPKV Palampur.
Proceedings Conference on Himalayan Environment: issues and Challenges(2010) HP Uni. Shimla;
Impact of Climate Change and Himachal Pradesh Action Plan Strategy on Forestry , Walia (2009). The Indian Forester Vol. 135 No 9.
Plant Genetic Resource Management under emerging Climate Change, Rana JC & Sharma SK (2009) Indian J.Genet, 69 (4).
Proceedings of the two days Brain Storming Session on Mountain Environment & Climate Change over Himalayan Region Shimla March (2003).
Kulkarni, AV (1992) Mass Balance of Himalyan Glaciers using AAR and ELA methods Journal of Glaciology 38 (128) 101- 104
Kulkarni AV et al (2007) Glacial retreat in Himalya using Indian Remote Sensing Satellite dates current Science 86, 101-106.
Wagnon et al (2007) Four year of mass balance on Chhota Shigri Glacier Himachal Pradesh, India a new benchmark glacier in the western Himalaya, Journal of Glaciology, 53 (1&3)603- 611.
Climate Change Vulnerability Assessment Report 178
12 Appendices
Appendices: 179

Appendices: 180
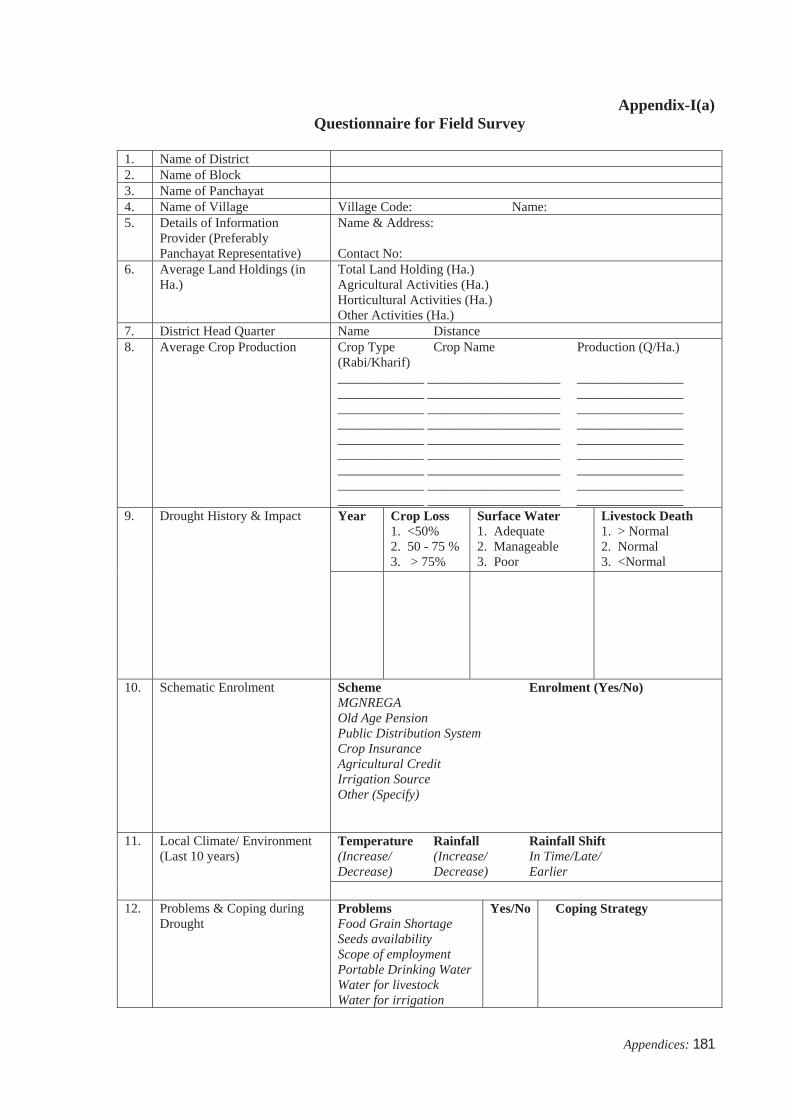
Appendix-I(a)Questionnaire for Field Survey
1. Name of District2. Name of Block3. Name of Panchayat4. Name of Village Village Code: Name: 5. Details of Information
Provider (Preferably Panchayat Representative)
Name & Address:
Contact No:6. Average Land Holdings (in
Ha.)Total Land Holding (Ha.)Agricultural Activities (Ha.)Horticultural Activities (Ha.)Other Activities (Ha.)
7. District Head Quarter Name Distance8. Average Crop Production Crop Type Crop Name Production (Q/Ha.)
(Rabi/Kharif) _____________ ____________________ _____________________________ ____________________ _____________________________ ____________________ _____________________________ ____________________ _____________________________ ____________________ _____________________________ ____________________ _____________________________ ____________________ _____________________________ ____________________ _____________________________ ____________________ ________________
9. Drought History & Impact Year Crop Loss1. <50%2. 50 - 75 %3. > 75%
Surface Water 1. Adequate 2. Manageable 3. Poor
Livestock Death1. > Normal 2. Normal3. <Normal
10. Schematic Enrolment Scheme Enrolment (Yes/No)MGNREGAOld Age PensionPublic Distribution SystemCrop Insurance Agricultural Credit Irrigation Source Other (Specify)
11. Local Climate/ Environment (Last 10 years)
Temperature Rainfall Rainfall Shift(Increase/ (Increase/ In Time/Late/Decrease) Decrease) Earlier
12. Problems & Coping during Drought
ProblemsFood Grain ShortageSeeds availabilityScope of employmentPortable Drinking WaterWater for livestockWater for irrigation
Yes/No Coping Strategy
Appendices: 181
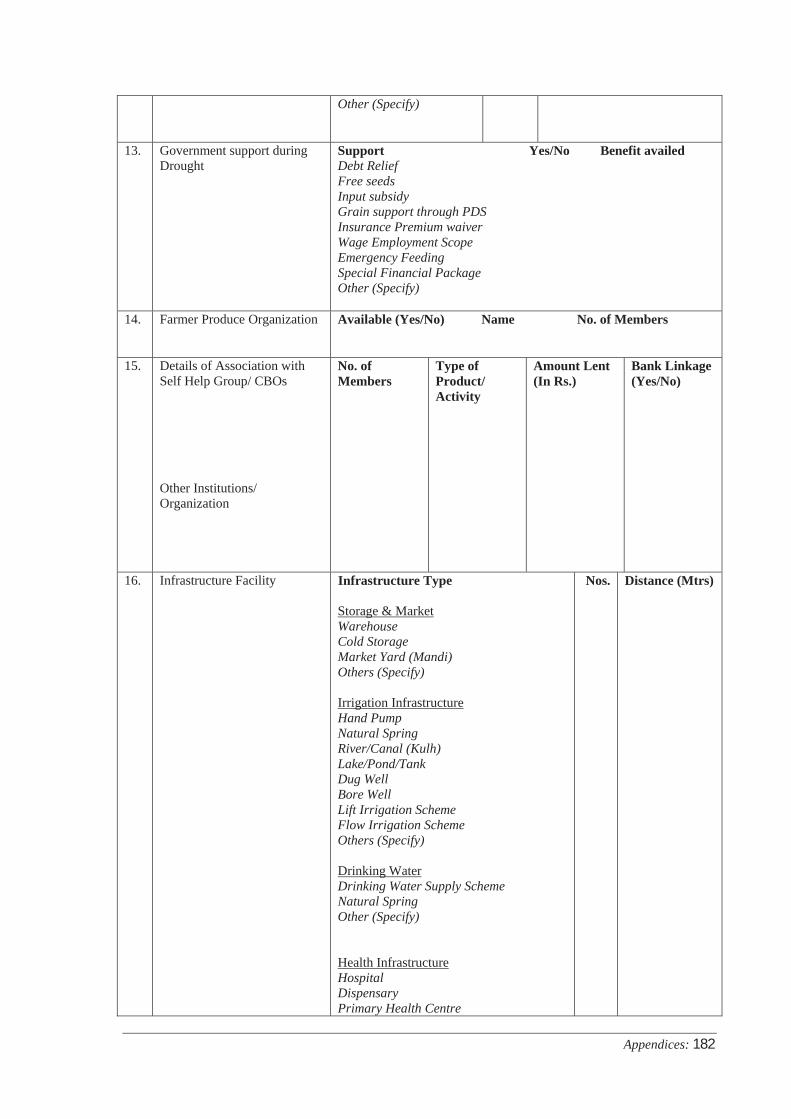
Other (Specify)
13. Government support during Drought
Support Yes/No Benefit availedDebt ReliefFree seeds Input subsidyGrain support through PDSInsurance Premium waiver Wage Employment ScopeEmergency FeedingSpecial Financial PackageOther (Specify)
14. Farmer Produce Organization Available (Yes/No) Name No. of Members
15. Details of Association with Self Help Group/ CBOs
Other Institutions/ Organization
No. of Members
Type of Product/ Activity
Amount Lent (In Rs.)
Bank Linkage (Yes/No)
16. Infrastructure Facility Infrastructure Type
Storage & MarketWarehouseCold StorageMarket Yard (Mandi)Others (Specify)
Irrigation InfrastructureHand PumpNatural SpringRiver/Canal (Kulh)Lake/Pond/TankDug Well Bore WellLift Irrigation SchemeFlow Irrigation SchemeOthers (Specify)
Drinking WaterDrinking Water Supply SchemeNatural Spring Other (Specify)
Health InfrastructureHospitalDispensaryPrimary Health Centre
Nos. Distance (Mtrs)
Appendices: 182
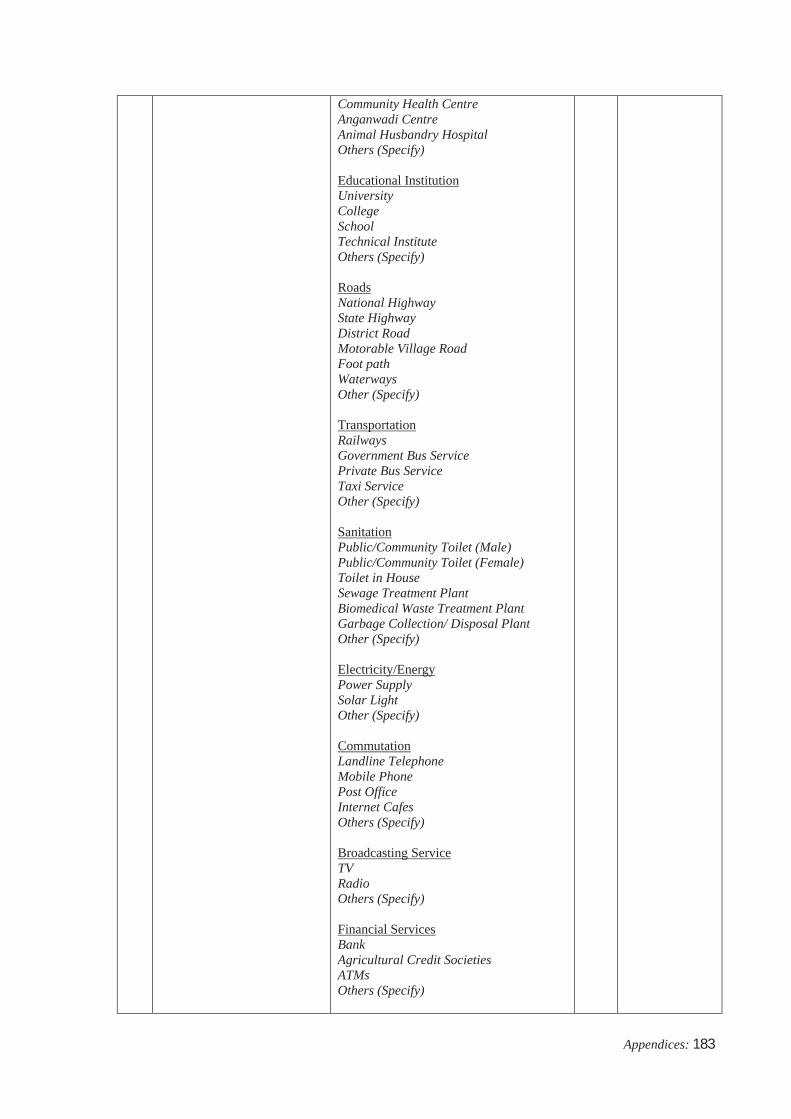
Community Health Centre Anganwadi Centre Animal Husbandry HospitalOthers (Specify)
Educational InstitutionUniversityCollegeSchoolTechnical InstituteOthers (Specify)
RoadsNational HighwayState HighwayDistrict RoadMotorable Village RoadFoot pathWaterwaysOther (Specify)
TransportationRailwaysGovernment Bus ServicePrivate Bus ServiceTaxi ServiceOther (Specify)
Sanitation Public/Community Toilet (Male)Public/Community Toilet (Female)Toilet in HouseSewage Treatment PlantBiomedical Waste Treatment PlantGarbage Collection/ Disposal PlantOther (Specify)
Electricity/EnergyPower SupplySolar LightOther (Specify)
CommutationLandline TelephoneMobile PhonePost OfficeInternet CafesOthers (Specify)
Broadcasting ServiceTVRadioOthers (Specify)
Financial ServicesBankAgricultural Credit SocietiesATMsOthers (Specify)
Appendices: 183
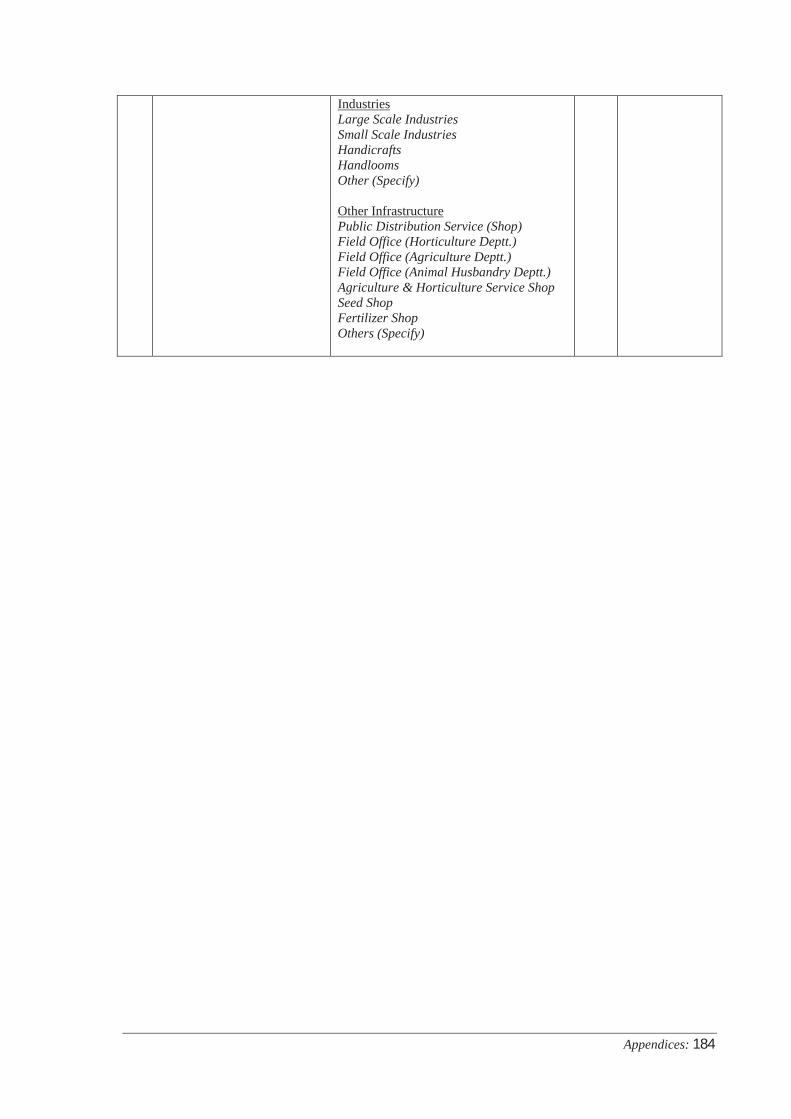
IndustriesLarge Scale IndustriesSmall Scale IndustriesHandicraftsHandloomsOther (Specify)
Other InfrastructurePublic Distribution Service (Shop)Field Office (Horticulture Deptt.)Field Office (Agriculture Deptt.)Field Office (Animal Husbandry Deptt.)Agriculture & Horticulture Service ShopSeed ShopFertilizer ShopOthers (Specify)
Appendices: 184

DiscussionsMeasures taken during drought to save crop?
Paddy:Wheat:Pulses:Vegetables:Fruits:Others:
What are the impacts of climate change on crop health?
Sr. No Disease Impacts Measures taken
Awareness on drought proofing measures ( put )
Sr. No Drought proofing measures Fully aware Have heard but not fully
Not aware
1 Change in cropping pattern2 Judicious use of ground water3 Water Conservation method4 Rain water harvesting5 MGNREGA/BRGF/Watershed
projects6 Govt alert warning on drought7 Others (specify)
What are the problems faced during drought situation?
a. Social:
b. Economic:
C: Livelihood:
What are the measures taken during drought situation (last time)
Appendices: 185

a. Govt…………………
b. Own…………………….
c. NGO/CBO/Others
Is there any migration situation aroused during drought in the village? If yes then discuss it elaborately. Yes
a. How many people migrated during last drought? Approximatelyb.c. Where they have migrated and for how many days?
Women participation in watershed Committee
Total No. of member in the watershed Committee
Total No. of women in the watershed Committee
Whether this watershed committee 1. Functional 2. De-Funct
What do you suggest to tackle the drought situation? (Suggestion of the participants)
Certify that the above information is correct as per the best of my knowledge and experience.
Signature/Thumb Impression
Appendices: 186
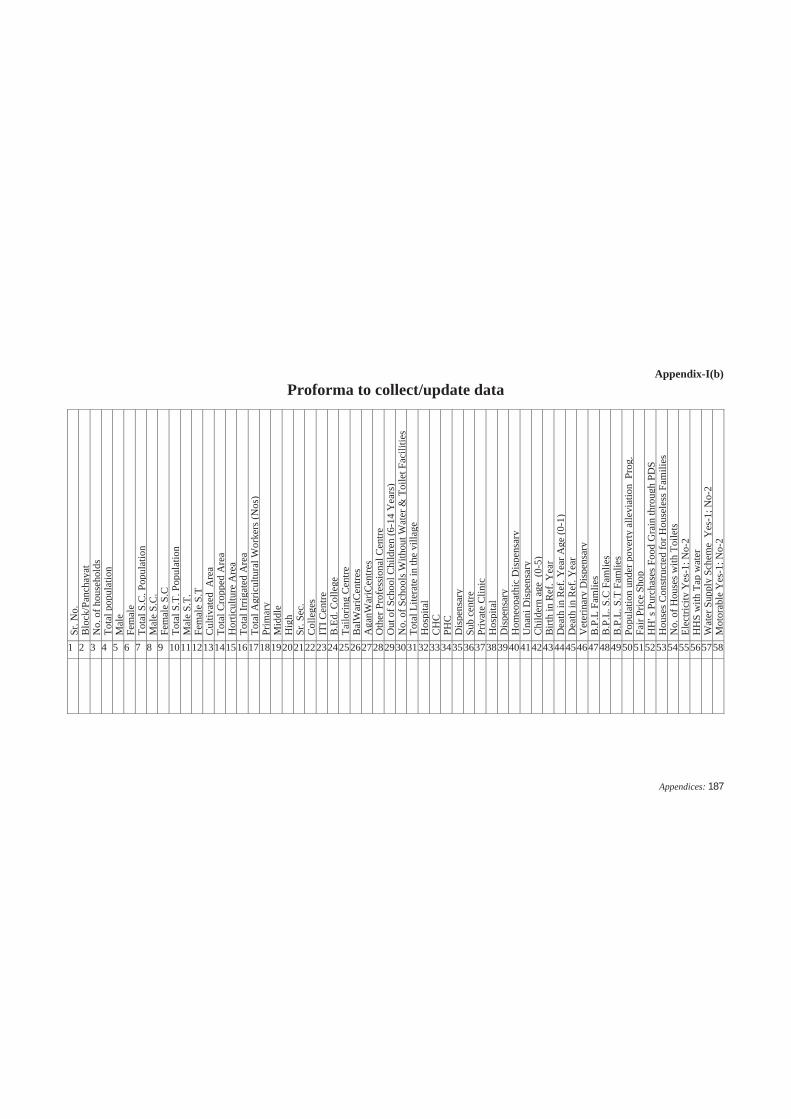
Appendix-I(b)Proforma to collect/update data
Sr. N
o.B
lock
/Pan
chay
atN
o. o
f hou
seho
lds
Tota
l pop
ulat
ion
Mal
eFe
mal
eTo
tal S
.C. P
opul
atio
nM
ale
S.C
.Fe
mal
e S.
CTo
tal S
.T. P
opul
atio
nM
ale
S.T.
Fem
ale
S.T
Cul
tivat
ed A
rea
Tota
l Cro
pped
Are
aH
ortic
ultu
re A
rea
Tota
l Irr
igat
ed A
rea
Tota
l Agr
icul
tura
l Wor
kers
(Nos
)Pr
imar
yM
iddl
eH
igh
Sr. S
ec.
Col
lege
sIT
I Cen
treB
.Ed.
Col
lege
Tailo
ring
Cen
treB
alW
ariC
entre
sA
ganW
ariC
entre
sO
ther
Pro
fess
iona
l Cen
treO
ut o
f Sch
ool C
hild
ren
(6-1
4 Y
ears
)N
o. o
f Sch
ools
With
out W
ater
& T
oile
t Fac
ilitie
sTo
tal L
itera
te in
the
villa
geH
ospi
tal
CH
CPH
CD
ispe
nsar
ySu
b ce
ntre
Priv
ate
Clin
icH
ospi
tal
Dis
pens
ary
Hom
eopa
thic
Dis
pens
ary
Una
ni D
ispe
nsar
yC
hild
ern
age
(0-5
)B
irth
in R
ef. Y
ear
Dea
th in
Ref
. Yea
r Age
(0-1
)D
eath
in R
ef. Y
ear
Vet
erin
ary
Dis
pens
ary
B.P
.L F
amlie
sB
.P.L
. S.C
Fam
lies
B.P
.L. S
.T F
amlie
sPo
pula
tion
unde
r pov
erty
alle
viat
ion
Pro
g.Fa
ir Pr
ice
Shop
HH
' s P
urch
ases
Foo
d G
rain
thro
ugh
PDS
Hou
ses C
onst
ruct
ed fo
r Hou
sele
ss F
amili
esN
o. o
f Hou
ses w
ith T
oile
tsEl
ectri
city
Yes
-1; N
o-2
HH
S w
ith T
ap w
ater
W
ater
Sup
ply
Sche
me
Yes
-1; N
o-2
Mot
orab
leY
es-1
; No-
2
1 2 3 4 5 6 7 8 9 10111213141516171819202122232425262728293031323334353637383940414243444546474849505152535455565758
Appendices: 187