
ASSESSING MONTHLY AVERAGE RUNOFF DEPTH IN SĂRĂȚEL RIVER BASIN, ROMANIA
14
ANALELE ŞTIINTIFICE ALE UNIVERSITĂŢII „ALEXANDRU IOAN CUZA” din IAŞI SCIENTIFIC ANNALS OF „ALEXANDRU IOAN CUZA” UNIVERSITY OF IAŞI Tom LX, nr.1, s. IIc, Geografie 2014 Volume LX, no.1, s. II c, Geography series 2014 ISSN 1223-5334 (printed version) (online version) 2284-6379 eISSN © Author(s) 2014. CC Attribution 3.0 License ASSESSING MONTHLY AVERAGE RUNOFF DEPTH IN SĂRĂȚEL RIVER BASIN, ROMANIA Romulus COSTACHE Faculty of Geography, University of Bucharest [email protected] Abstract. Due to its geographic position, Romania is one of the most exposed to hidryk risk phenomena areas, especially floods and flahs floods. In this context, estimating surface runoff depth is very useful for highlithging vulnerable areas. In this study the estimation of the average monthly runoff depth was performed due to SCS-CN method adjusted with slope. This method is focused on the estimation of the runoff depth caused by precipitation, depending on the retention caused by various land use types and hydrological soil groups. In the present study, the SCS-CN method adjustment was possible due to formulas experimentally determined, based on field studies. The precipitation values contained in the SCS-CN formula, in order to estimate the average runoff depth, were spatially modelled by correlating the precipitation values from 11 meteorological stations with the stations' altitude. The spatially modelled values were integrated the formula for SCS-CN method adjusted with the slope value and, finally, the surface runoff depth was spatially modelled within Sărățel river basin. The highest values of the parameter are about 92 mm, in June, when precipitation records its highest values. The lowest value of this parameter is recorded in January and February, when precipitation quantity is also diminshed. The analysis of the runoff coefficient values demonstrates that surface runoff depth grows simultaneously with the precipitation values. Keywords: Sărățel river basin, Curve Number, slope, land use, hydrological soil group I. INTRODUCTION Global climate changes cause the growth of torrential precipitation frequency, which causes flash-floods (Guhatakurta et al., 2011). Flash-floods occur due to surface runoff and flood propagation in the main collector river and represent the main cause of the lately global floods (Townsend and Walsh, 1998; Dutta et al., 2000; Dolcine et al., 2001; Sheng et al., 2001; Bryant and Rainey, 2002; Hudson and Colditz, 2003; Knebl et al., 2005). Consequently, the estimation
Transcript of ASSESSING MONTHLY AVERAGE RUNOFF DEPTH IN SĂRĂȚEL RIVER BASIN, ROMANIA
ANALELE ŞTIINTIFICE ALE UNIVERSITĂŢII
„ALEXANDRU IOAN CUZA” din IAŞI
SCIENTIFIC ANNALS OF
„ALEXANDRU IOAN CUZA” UNIVERSITY OF IAŞI
Tom LX, nr.1, s. IIc, Geografie 2014 Volume LX, no.1, s. II c, Geography series 2014
ISSN 1223-5334 (printed version) (online version) 2284-6379 eISSN
© Author(s) 2014. CC Attribution 3.0 License
ASSESSING MONTHLY AVERAGE RUNOFF DEPTH IN SĂRĂȚEL
RIVER BASIN, ROMANIA
Romulus COSTACHE Faculty of Geography, University of Bucharest
Abstract. Due to its geographic position, Romania is one of the most exposed to hidryk
risk phenomena areas, especially floods and flahs floods. In this context, estimating surface
runoff depth is very useful for highlithging vulnerable areas. In this study the estimation of
the average monthly runoff depth was performed due to SCS-CN method adjusted with
slope. This method is focused on the estimation of the runoff depth caused by precipitation,
depending on the retention caused by various land use types and hydrological soil groups.
In the present study, the SCS-CN method adjustment was possible due to formulas
experimentally determined, based on field studies. The precipitation values contained in the
SCS-CN formula, in order to estimate the average runoff depth, were spatially modelled by
correlating the precipitation values from 11 meteorological stations with the stations'
altitude. The spatially modelled values were integrated the formula for SCS-CN method
adjusted with the slope value and, finally, the surface runoff depth was spatially modelled
within Sărățel river basin. The highest values of the parameter are about 92 mm, in June,
when precipitation records its highest values. The lowest value of this parameter is recorded
in January and February, when precipitation quantity is also diminshed. The analysis of the
runoff coefficient values demonstrates that surface runoff depth grows simultaneously with
the precipitation values.
Keywords: Sărățel river basin, Curve Number, slope, land use, hydrological soil group
I. INTRODUCTION
Global climate changes cause the growth of torrential precipitation
frequency, which causes flash-floods (Guhatakurta et al., 2011). Flash-floods occur
due to surface runoff and flood propagation in the main collector river and
represent the main cause of the lately global floods (Townsend and Walsh, 1998;
Dutta et al., 2000; Dolcine et al., 2001; Sheng et al., 2001; Bryant and Rainey,
2002; Hudson and Colditz, 2003; Knebl et al., 2005). Consequently, the estimation
ROMULUS COSTACHE
98
of the surface runoff depth caused by a certain precipitation quantity is very
important for hydrological prognosis. Romania is one of the most exposed to flash-
floods and floods countries in Europe (Roo et al., 2007).The most severe floods in
the past 10 years affected Romania in 2005 (Irimescu et al., 2005), 2006, 2010
(Romanescu et al., 2011) and 2014.
In the specialty literature, there are many studies regarding various
methods for estimating surface runoff. One of the most used methods is the Curve
Number, developed by Soil Conservation Services from USA. It is widely used in
research studies (Kumar et al., 1991; Mack, 1995; Scozzafava and Tallini, 2001;
Ranakrishnan et al. 2009; Duncan et al. 2013), also in Romania (Haidu et al. 2007;
Bilaşco 2008; Minea, 2011; Gyory and Haidu, 2011; Domnița, 2012, Costache,
2014). Initially, in order to estimate the surface runoff depth, the method considers
the hydrological soil group and land use/cover types. The minus of this method is
not taking into consideration the slope values (Crăciun et al. 2009). The
improvement of the method due to slope values, Huang et al. (2006) obtained
proper results in a case study for the Loess Plateau in China.
The aim of the present study is to estimate the surface runoff depth in
Sărățel river basin, by applying SCS-CN method adjusted with relief slope. The
calibration of the initial formula with slope is described by the following formula:
KCNCN *22 (Huang et al. 2006), where:
52.323
*63.1579.322
K ,
CN2α – the value of the curve number adjusted with the slope;
CN2 – SCS-CN value for a soil with medium antecedent humidity;
α – average slope (%).
II. STUDY AREA
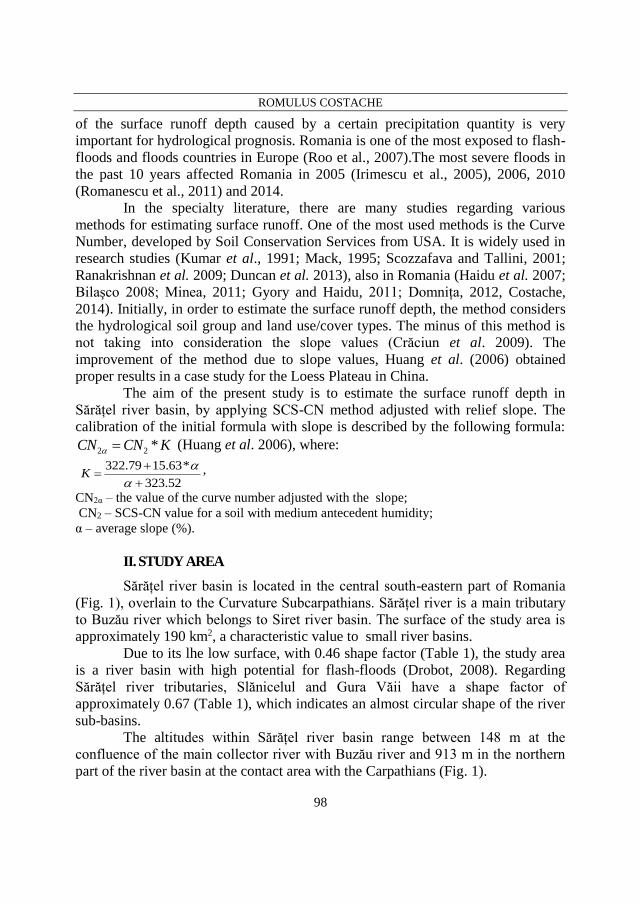
Sărățel river basin is located in the central south-eastern part of Romania
(Fig. 1), overlain to the Curvature Subcarpathians. Sărățel river is a main tributary
to Buzău river which belongs to Siret river basin. The surface of the study area is
approximately 190 km2, a characteristic value to small river basins.
Due to its lhe low surface, with 0.46 shape factor (Table 1), the study area
is a river basin with high potential for flash-floods (Drobot, 2008). Regarding
Sărățel river tributaries, Slănicelul and Gura Văii have a shape factor of
approximately 0.67 (Table 1), which indicates an almost circular shape of the river
sub-basins.
The altitudes within Sărățel river basin range between 148 m at the
confluence of the main collector river with Buzău river and 913 m in the northern
part of the river basin at the contact area with the Carpathians (Fig. 1).
ASSESSING MONTHLY AVERAGE RUNOFF DEPTH IN SĂRĂȚEL......
99
Slope is another important factor that influences surface runoff. The
average slope is 11°, meanwhile slope values exceeding 15°, with low potential for
water retention and high susceptibility to surface runoff, occur on over 20% of the
study area.
Precipitation is also an important
factor due to its influence on runoff
depth.The average multiannual sum of the
precipitation (1960 – 2013) within Sărățel
river basin ranges between 558,69 mm in
low areas close to the confluence with
Buzău river and 725,16 mm on the
highest hilly areas.The forest coverage
has an essential hydrological role, causing
the increase of water retention potential
(Arghiriade, 1980). Sărățel river basin has
a forest coverage of only 27% (Corine
Land Cover, 2006).
Fig. 1. Study area location
Table 1 Morphometrical features of Sărățel River Catchment and its main sub-catchments
River Sub-catchment Hydrografic network
Area Perime
ter
Rc (shape
coefficient)
Altitude (m) Leng
th
Imed (river
slope)
(sq
km)
(km) Rc =
4πA/P2
med max min (km) (m/km)
Slănicel 21.1 19.7 0.68 538 811 302 8.6 45.7
Gura Văii 26 22.2 0.66 490 811 238 9.3 57
Beciul 34.9 28.96 0.52 348 587 193 10 22.8
Strâmbul 9.78 16.81 0.43 468 760 317 6.4 55
Sărățel 188 72 0.46 415 913 148 34.6 30.2
In terms of pedology, over 78% of the soils within the study area have a
predominant loamy – loamy-clay texture. Due to fine texture, these soils favour
surface runoff by holding water infiltration during precipitation.
III. METHODOLOGY
In order to estimate the monthly average runoff depth, several main
working steps were followed: assigning Curve Number values; adjusting Curve
Number values for each surface by its average slope (%); determining the monthly
evolution of the runoff depth by SCS-CN method adjusted with relief slope.

ROMULUS COSTACHE
100
III. 1. Assigning Curve Number values
The Curve Number used by SCS-CN mathematical method, developed by
USDA-Soil Conservation Services (SCS 1972), is an indicator with values between
0 and 100 depending on land use type (Fig. 2.a) and hydrological soil group (Fig.
2.b). The Curve Number was determined through experimental methods, by
measuring runoff depth caused by a certain precipitation value (Huang et al.,
2006).
Fig. 2 Land use (a) and the hydrological soil group (b) within Sărățel river basin
This method is based on the equality relation between the ratio of the
percent water that has been retained to the maximum potential retention and the
ratio of percent water that ran off to the maximum rainfall available for runoff
(NRCS, 1999). This relation is described by the ecuation:
aIP
Q
S
F
, where:
F – is the amount of rainfall retained (after runoff begins);
S – is the maximum potential retention (after runoff begins);
Q – is the amount of runoff;
P – rainfall (mm);
Ia – initial abstraction (mm).
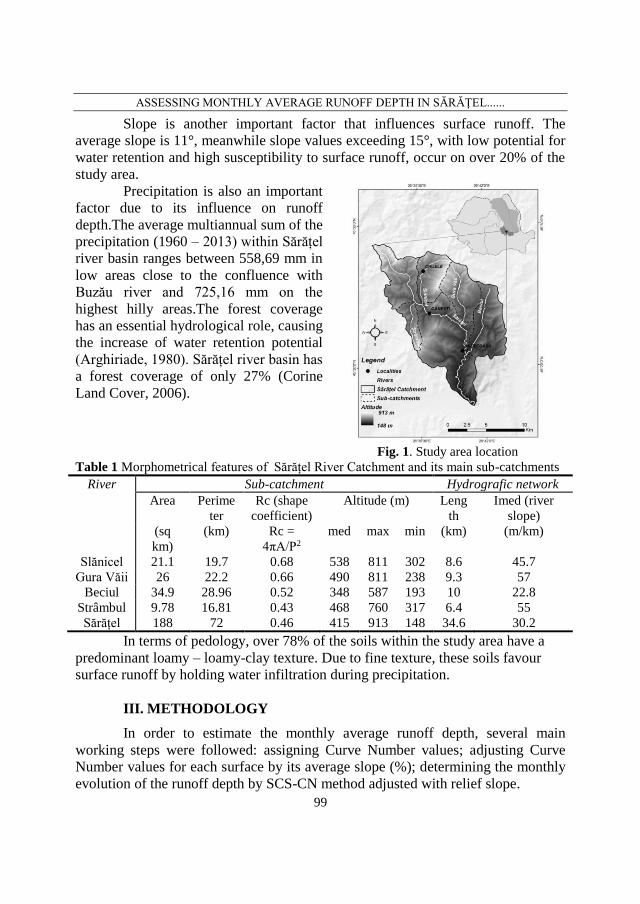
The closest values to 0 correspond to a high potential for water retention
and high permeability, meanwhile the highest values of the CN, close to 100, are
assigned to hydrological soil group D (predominantly clay texture). For Sărățel
river basin, the CN values are contained in Table 2. In order to obtain the CN
values, 2006 Corine Land Cover database was used for land use type data and the
Map of Soils 1:200000 (ICPA, 2002) for the hydrological soil group. The lowest
values of the Curve Number occur on coniferous areas with sandy texture and A
soil group (Table 2). These values occur at the contact area between the
Subcarpathians and the mountainous area (Fig. 3.a). Built-up and bare rock areas
ASSESSING MONTHLY AVERAGE RUNOFF DEPTH IN SĂRĂȚEL......
101
have the highest impermeability, so such areas overlain to predominantly clay
texture were assigned the highest CN, close to 100 (Table 2).
Table 2. The values of the Curve Number of each intersection between the hydrological
soil group and land use type (after Domnița 2012)
Landuse Soil Group CN Area(Ha)
Built area A 77 125.2
B 85 343.8
C 90 0.4
D 95 1986.1
Non-irrigated arable land D 87 115.8
Fruit trees A 43 50.4
B 65 195.9
C 76 1.8
D 82 2539.9
Pastures A 49 47.6
B 69 535.6
D 84 3454.3
Complex cultivation patterns A 67 104.9
B 78 72.9
C 85 0.9
D 89 1349.5
Land principally occupied by agriculture, with
significant areas of natural vegetation
A 52 13.5
B 69 239.9
D 84 959.2
Broad-leaved forest A 42 279.5
B 66 1540.6
C 79 26.5
D 85 2137.1
Coniferous A 34 117.8
B 60 230.0
C 73 71.0
D 79 639.9
Mixed forest A 38 36.5
B 60 61.7
D 79 178.8
Natural grasslands B 69 13.2
C 79 21.0
Moors and heathland A 49 110.0
Transitional woodland-shrub B 60 44.3
D 78 1162.4
Beaches, dunes, sands
A 63 0.8
B 77 0.3
D 88 39.4
Bare rocks B 86 2.7
D 94 26.0
ROMULUS COSTACHE
102
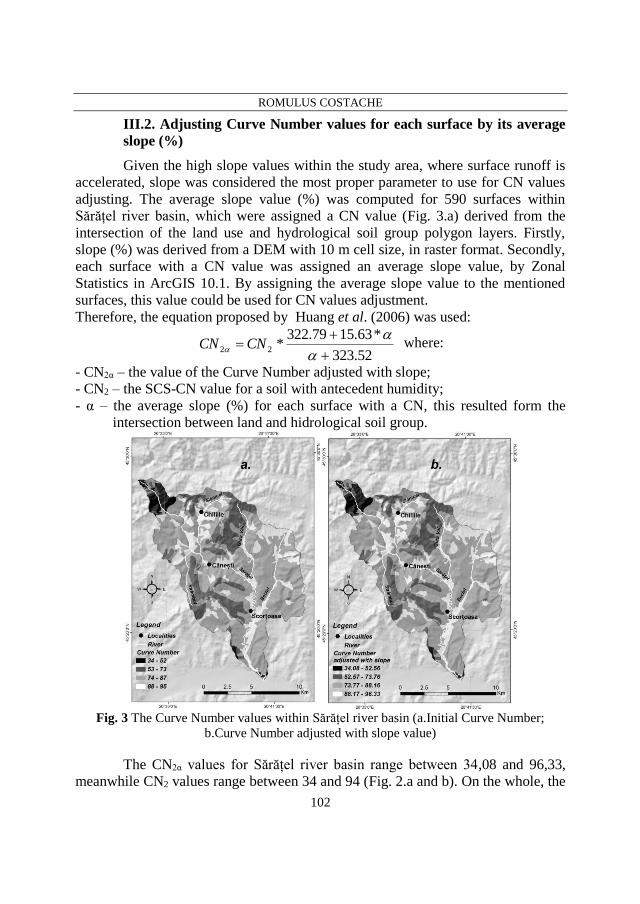
III.2. Adjusting Curve Number values for each surface by its average
slope (%)
Given the high slope values within the study area, where surface runoff is
accelerated, slope was considered the most proper parameter to use for CN values
adjusting. The average slope value (%) was computed for 590 surfaces within
Sărățel river basin, which were assigned a CN value (Fig. 3.a) derived from the
intersection of the land use and hydrological soil group polygon layers. Firstly,
slope (%) was derived from a DEM with 10 m cell size, in raster format. Secondly,
each surface with a CN value was assigned an average slope value, by Zonal
Statistics in ArcGIS 10.1. By assigning the average slope value to the mentioned
surfaces, this value could be used for CN values adjustment.
Therefore, the equation proposed by Huang et al. (2006) was used:
52.323
*63.1579.322*22
CNCN where:
- CN2α – the value of the Curve Number adjusted with slope;
- CN2 – the SCS-CN value for a soil with antecedent humidity;
- α – the average slope (%) for each surface with a CN, this resulted form the
intersection between land and hidrological soil group.
Fig. 3 The Curve Number values within Sărățel river basin (a.Initial Curve Number;
b.Curve Number adjusted with slope value)
The CN2α values for Sărățel river basin range between 34,08 and 96,33,
meanwhile CN2 values range between 34 and 94 (Fig. 2.a and b). On the whole, the

ASSESSING MONTHLY AVERAGE RUNOFF DEPTH IN SĂRĂȚEL......
103
results obtained by adjusting the CN with the average slope, demonstrate that for
slope values under 5% the Curve Number values decrease, meanwhile they
increase on areas with slope exceeding 5%. Within the study area, only 11 of the
590 surfaces resulted from the intersection between land use types and
hydrological soil group recorded slope values under 5%, causing lower CN2α values
comparative to CN2 values. In this case, we can conclude that, CN values increased
by adjusting them the average slope values (%).
III.3. Determining the monthly evolution of the runoff depth by SCS-
CN method adjusted with relief slope
In order to determine the monthly average runoff depth within Sărățel river
basin, the SCS-CN method adjusted with relief slope was used. This method,
widelly used is based on the formula: Q = P – Is – I – E – n (Bilașco, 2008), where:
Q – runoff depth (mm), P – precipitation, Is – water infiltration capacity, I –
interception, E – evapotranspiration, n – other retentions of the precipitation. The
mathematical SCS-CN model is based on the conventional representation of the
maximum potential for water retention during rainfall (Bilașco, 2008), which
depends on the land cover type and the hydrological soil group.
Fig. 4. The regression graphics between rainfall monthly average (January – June) and the
altitude of meteorological stations
ROMULUS COSTACHE
104
Mathematically, the estimation of runoff depth is based on the formula:
SP
SPQ
*8.0
)*2.0( 2
(Ponce and Hawkins 1996), where:
Q – runoff depth (mm);
P - precipitation (mm);
S – water retention potential (mm).
Water retention potential (S) calculation depends on the Curve Number
given by the intersection between land use type and hydrological soil group. Its
formula is:
25425400
CN
S in the present study, the CN value was adjusted by relief
slope (%), an equal value to CN2α , previously calculated in heading 3.2.
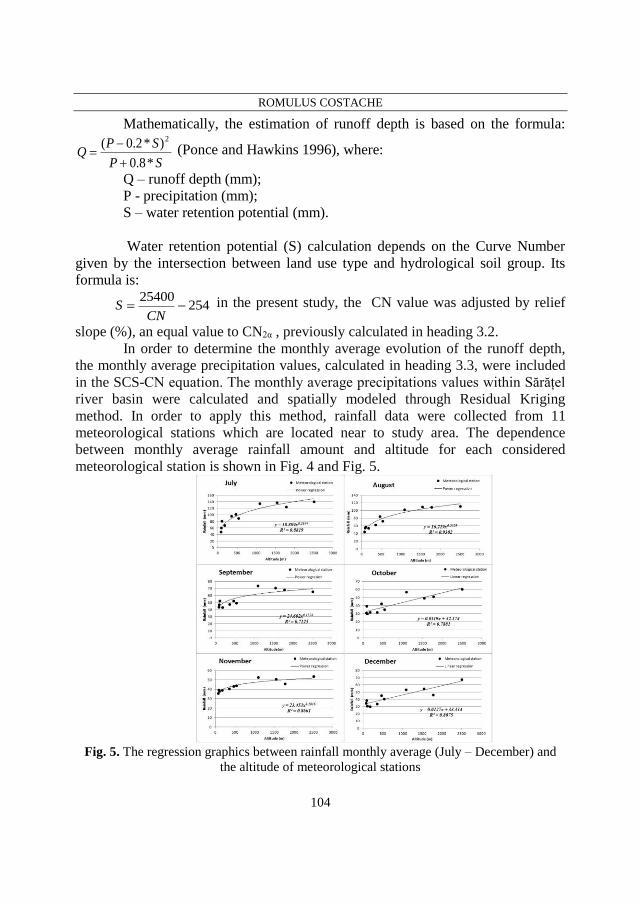
In order to determine the monthly average evolution of the runoff depth,
the monthly average precipitation values, calculated in heading 3.3, were included
in the SCS-CN equation. The monthly average precipitations values within Sărățel
river basin were calculated and spatially modeled through Residual Kriging
method. In order to apply this method, rainfall data were collected from 11
meteorological stations which are located near to study area. The dependence
between monthly average rainfall amount and altitude for each considered
meteorological station is shown in Fig. 4 and Fig. 5.
Fig. 5. The regression graphics between rainfall monthly average (July – December) and
the altitude of meteorological stations
ASSESSING MONTHLY AVERAGE RUNOFF DEPTH IN SĂRĂȚEL......
105
IV. RESULTS
By applying the methodology described above, based on SCS-CN method
adjusted with slope, the monthly average runoff depth was computed (mm) and
spatially modelled within Sărățel river basin (Fig. 6).
The temporal variation of the runoff depth is directly dependent on the
monthly distribution of precipitation within the study area. Thereby, the highest
values of the runoff depth are recorded in June, when the average precipitation
value reaches 102,7 mm. In June, on the most susceptible surfaces to surface
runoff, the runoff depth value is almost 92 mm (Fig. 6). In this case, surface runoff
is approximately 90% of the average precipitation value.
The lowest values of the runoff depth occur, obviously, during months
with the minimum precipitation values. These are January, February and March
(Fig. 6). As a result, surface runoff is extremely reduced in the mentioned period
on forested areas, when the average precipitation value is almost 34 mm,
meanwhile the estimated lowest runoff depth values are near 0.001 mm (Fig. 6).
Regarding the monthly distribution of runoff depth within Sărățel river
basin (Q – mm), there is a symmetry between its values and the values of the
monthly average precipitation (Fig. 6), due to runoff depth direct dependence of
precipitation quantity and intensity. Therefore, the monthly average runoff depth
records minimum values in February, when only 8.58 mm of 33.7 mm average
precipitation convert to surface runoff (Fig. 7). The highest value of the monthly
average runoff depth is recorded in June, when over 55 mm of 102,7 mm average
precipitation convert to surface runoff (Fig. 6). Hence, the surface runoff (mm) is
over half of the average precipitation in June.
The value of the monthly runoff coefficient
)(
)(
mm
mm
P
QC between the average
runoff depth and the average precipitation within Sărățel river basin demonstrates
that surface runoff ratio from the precipitation increases once with the rainfall
value (Fig. 8), due to rainfall exceeding the field capacity of soils, which generates
significant runoff.
By subtracting the monthly average runoff depth from the monthly average
precipitation Q) - P = (F(mm), the monthly average evolution of the amount of water
loss by infiltration, interception and evapotranspiration was obtained (Fig. 9).
During one year, the runoff depth exceeds water infiltration values only in June and
July (Fig. 9). This means that, statistically, surface runoff can generate important
water accumulation in river beds and flash-floods to the downstream areas.

ROMULUS COSTACHE
106
Fig. 6. The monthly distribution of the runoff depth within Sărățel river basin

ASSESSING MONTHLY AVERAGE RUNOFF DEPTH IN SĂRĂȚEL......
107
Fig. 7. The monthly
evolution of the
average precipitation
and runoff depth
within Sărățel river
basin
Fig. 8. The monthly
values of runoff
coefficient in Saratel
River Catchment
Fig. 9. The monthly
evolution of the
runoff depth (mm)
beside the monthly
evolution of water
lost depth
(infiltration,
interception and
evapotranspiration)
(mm)
9 9 920
4056
48
3021
10 14 11
35 34 35
53
81
10392
6855
37 43 39
0
20
40
60
80
100
120
140
160
180
200
0
20
40
60
80
100
120
140
160
180
200
I II III IV V VI VII VIII IX X XI XII
P(m
m)
Q(m
m)
MonthRunoff depth(mm)
0.3 0.3 0.3
0.4
0.50.6 0.5
0.40.4
0.30.3
0.3
0.0
0.1
0.2
0.3
0.4
0.5
0.6
I II III IV V VI VII VIII IX X XI XII
C
Month
0.00
10.00
20.00
30.00
40.00
50.00
60.00
0
10
20
30
40
50
60
I II III IV V VI VII VIII IX X XI XII
F(m
m)
Q(m
m)
MonthRunoff depth(mm) Water lost depth (mm)

ROMULUS COSTACHE
108
V.CONCLUSIONS
We can assert that the SCS-CN method adjusted with relief slope, used for
runoff depth estimation, offers more adequate results than the classic SCS-CN
method. The accuracy of the results is available especially for areas with important
spatially varying slope values, where slope influence on surface runoff is obvious,
such as in Sărățel river basin.
In the study area, the highest values of the runoff depth occur in June. It is
also important to note that the average runoff depth ratio increases once with the
monthly average precipitation. As a result, in case of important quantity of
precipitation, water infiltration capacity decreases so much that surface runoff
occurs, and furthermore, flash-flood occurrence at the base of the slope and
propagation to downstream areas are possible. Also, the areas with high slope
values, where surface runoff is active, are susceptible to geomorphologic
phenomena such as: landslides, and muddy flows.
In terms of economical issues, the estimation of the runoff depth within
Sărățel river basin, and also of the cumulated value from interception, infiltration
and evapotranspiration (F(mm)) is very important due to agricultural land use.
Acknowledgements
This paper has been financially supported within the project entitled „SOCERT.
Knowledge society, dynamism through research”, contract number
POSDRU/159/1.5/S/132406. This project is co-financed by European Social Fund through
Sectoral Operational Programme for Human Resources Development 2007-2013.
Investing in people!”
References
Arghiriade, C.: Rolul hidrologic al pădurii, Editura Ceres, București. 1977
Bilașco Ș.: Implementarea GIS în modelarea viiturilor pe versanți, Casa Cărții de Știință
Cluj-Napoca, 2008
Bryant R. G. and Rainey M. P.: Investigation of flood inundation on playas within the Zone
of Chotts, using a time-series of AVHRR; Remote Sensing of Environment, 82, 2-3,
360–375, 2002
Crăciun A. I., Haidu I., Bilaşco Ş.: The SCS-CN model assisted by G.I.S – alternative
estimation of the hydric runoff in real time, Geographia Technica, 3, 1, 1-7, 2007
Crăciun A. I., Haidu I., Magyari-Saska Zs., Imbroane A. I.: Estimation of runoff
coefficient according to soil moisture using GIS tehchniques, Geographia Technica,
9, 2, 1-10, 2009
Costache R.: Using GIS techniques for assessing lag and concentration time in small river
basins. Case study: Pecineaga river basin, Romania, Geographia Technica, 9, 1, 31-
38, 2014

ASSESSING MONTHLY AVERAGE RUNOFF DEPTH IN SĂRĂȚEL......
109
Dolcine L., Andrieu H., Sempre-Torres D., Creutin D.: Flash flood forecasting with
coupled precipitation model in mountainous Mediterranean basin; Journal of
Hydrologic Engineering, 6, 1, 1–10, 2001
Domnița M Runoff modeling using GIS. Application in torrential basins in the Apuseni
Mountains, Ph.D Thesis, Cluj Napoca, 2012
Dutta D., Herath S., Musiake K. : Flood inundation simulation in a river basin using a
physically based distributed hydrologic model; Hydrological Processes, 14, 3, 497–
519, 2000
Drobot R.: Ways of determining torrential river basins in which there are located human
settlements prone to flash floods, (in romanian). Monitorul Oficial nr. 647/11.IX,
2008.
Duncan O. J., Tollner E., Ssegane H., McCutcheon S C.: Curve Number approaches to
estimate drainage from a Yard Waste Composting Pad; Applied Engineering in
Agriculture Vol.29, No.2, 201-208, 2013
Guhatakurta P, Sreejith O. P., Menon P. A.: Impact of climate change on extreme rainfall
events and flood risk in India; Journal Earth System Science, 12, 3, 359-373, 2011
Gyori Maria-Mihaela, Haidu I.: Unit hydrograph generation for the ungauged subwatershed
in the Monroștia Basin; Geographia Technica, 14, 2, 23-29, 2011
ICPA Bucureşti 2007 The soils map in electronic format, (1:200,000)
Irimescu A., Stăncălie Gh., Crăciunescu V., Flueraru C., Anderson E.:, The use of Remote
Sensing and GIS techniques in flood monitoring and damage assessment: a study
case in Romania, Threats to Global Water Security NATO Science for Peace and
Security Series C: Environmental Security, 167 – 177, 2009
Huang M., Jacgues G., Wang Z., Monique G.: A modification to the soil conservation
service curve number method for steep slopes in the Loess Plateau of China;
Hydrological Processes, 20, 3, 579-589, 2006
Hudson, P. F. and Colditz R. R.: Flood delineation in a large and complex alluvial valley,
lower Panuco basin, Mexico; Journal of Hydrology, 280, 229–245, 2003
Knebl M R, Yang Z.-L, Hutchison K., Maidment D. R.: Regional scale flood modeling
NEXRAD rainfall, GIS, and HEC-HMS/RAS: a case study for San Antonia River
Basin Summer 2002 storm event; Journal of Environmental Management, 75, 325-
336, 2005
Kumar P., Tiwart K. N., Pal D. K.: Establishing SCS Runoff Curve Number from IRS
Digital Data Base, Journal of the Indian Society of Remote Sensing, 19, 4, 245-252,
1991.
Mack Mary J.: HER—Hhydrologic evaluation of runoff; The Soil Conservation Service
Curve Number technique as an interactive computer model;
Computers&Geosciences, 21, 8, 929-935, 1995.
Minea G.: Bazinul hidrografic al râului Bâsca - Studiu de hidrogeografie, Teză de doctorat,
Universitatea din Bucureşti, Facultatea de Geografie, Bucureşti, 2011
Natural Resources Conservation Service : Engineering Hydrology Training Series, Module
205 – SCS Runoff Equation, 1999.
ROMULUS COSTACHE
110
Ponce V. M. and Hawkins R. H.: Runoff curve number: has it reached maturity; Journal of
Hydrologic Engineering, 1, 1, 11–19, 1996.
Ranakrishnan D., Bandyopadhyay A., Kusuma K. N.: SCS-CN and GIS-based approach
for identifying potential water harvesting sites in the Kali Watershed, Mahi River
Basin, India; Journal Earth System Science, 118, 4, 355-368, 2009.
Roo A. D., Barredo J., Lavalle C., Bodis K., Bonk R.: Potential flood hazard and risk
mapping at Pan-European scale, Digital terrain modelling Development and
applications in a policy support environment, Peckham, R. J. and Jordan, G. (Eds),
Springer Berlin Heidelberg, pag. 183-202, 2007.
Romanescu Gh., Jora I., Stoleriu C.: The most important high floods in Vaslui river basin -
causes and consequences, Carpathian Journal of Earth System Science, 6, 1, 119 –
132, 2011
Scozzafava M and Tallini M.: Net Infiltration in the Gran Sasso Massif of Central Italy
using Thornthwaite water budget and curve-number method; Hydrogeology Journal,
9, 5, 461- 475, 2001.
Sheng, Y, Gong P., Xiao Q., Quantitative dynamic flood monitoring with NOAA AVHRR;
International Journal of Remote Sensing, 22, 9, 1709–1724, 2001.
Townsend P. A. and Walsh S. J.: Modeling floodplain inundation using an integrated GIS
with radar and optical remote sensing; Geomorphology, 21, 3-4, 295–312, 1998.
***EEA, Corine Land Cover, 2006
***ICPA, Romania Soil Map, 2002
Received: 09.04.2014
Revised: 25.06.2014
Accepted: 26.06.2014
Published: 30.09.2014