The Case of Romania - MDPI
20
Citation: Sechel, I.C.; Mariasiu, F. Efficiency of Governmental Policy and Programs to Stimulate the Use of Low-Emission and Electric Vehicles: The Case of Romania. Sustainability 2022, 14, 45. https://doi.org/ 10.3390/su14010045 Academic Editor: Chengxiang Zhuge Received: 10 November 2021 Accepted: 15 December 2021 Published: 21 December 2021 Publisher’s Note: MDPI stays neutral with regard to jurisdictional claims in published maps and institutional affil- iations. Copyright: © 2021 by the authors. Licensee MDPI, Basel, Switzerland. This article is an open access article distributed under the terms and conditions of the Creative Commons Attribution (CC BY) license (https:// creativecommons.org/licenses/by/ 4.0/). sustainability Article Efficiency of Governmental Policy and Programs to Stimulate the Use of Low-Emission and Electric Vehicles: The Case of Romania Ioana C. Sechel and Florin Mariasiu * Automotive Engineering and Transports Department, Technical University of Cluj-Napoca, Bdul. Muncii 103-105, RO-400641 Cluj-Napoca, Romania; [email protected] * Correspondence: fl[email protected] Abstract: The contemporary demands for massive reductions in industrial pollution caused by the transport sector, especially in large urban agglomerations, compel local and national authorities to propose, develop, and implement programs and policies that have the ultimate goal of significantly reducing (or eliminating) pollution. The aim of this article is to provide a primary analysis of the effectiveness of Romanian government policies in terms of reducing pollution (CO 2 emissions) caused by transportation (due to the “Rabla Plus” (RP) program, through which financial subsidies are granted for the purchase of a new plug-in hybrid electric vehicles (PHEVs) or battery electric vehicle (BEVs)). After analyzing the justification for the use of low-emission and electric vehicles in traffic (as a major solution to eliminate pollution), a comparative analysis of energy-efficient transport for Romania and Europe is presented in order to identify the directions in which it is necessary to develop and implement government policies specifically in Romania, considering a series of indicators chosen and considered by the authors to be important, including CO 2 emissions compared with the size of the road infrastructure, the number of registered vehicles, the number of passengers transported, and the quantity of goods transported. With the identification of the ability of government programs to encourage the acquisition and use of low-emission and electric vehicles in traffic, the efficiency achieved is calculated in terms of the net CO 2 emissions eliminated (average values of 1949.23 CO 2 tons/year and 1.71 CO 2 tons/vehicle). Furthermore, this aspect is also beneficial for analyses in terms of the economic costs involved (the associated costs are estimated to be 7034.17 EUR/ton of CO 2 eliminated from the transportation sector), identifying new directions of action that are more cost-effective and sustainable and on which government policies should focus in the future. Keywords: energy efficiency; transport; CO 2 emission; electric vehicle; policy; financial subsidies 1. Introduction The current state of advancement of human society is characterized by the exponential development in terrestrial, air, and naval means of transport, which has led to continuous increases in the transport of goods and persons, globalization of the economy, freedom of movement, and the exchange of ideas worldwide. The transport sector is one of the most important branches of an economy, with connections to the field of transport involving almost all areas, starting with the transport of goods and ending with the transport of people. Throughout history, people have tried to use their energy efficiently in order to obtain better results in the shortest time and with the least effort. Technological progress and innovation are closely linked to the evolution of the transport sector, both due to the needs of long-distance passengers and of companies wanting to transport the maximum amount of goods at the lowest possible cost in the shortest possible time. Whether it be road, rail, air, or sea or river transport, each country and region has tried to develop its transport sector according to the specifics of the area and the existing demands. In many Sustainability 2022, 14, 45. https://doi.org/10.3390/su14010045 https://www.mdpi.com/journal/sustainability
-
Upload
khangminh22 -
Category
Documents
-
view
4 -
download
0
Transcript of The Case of Romania - MDPI
�����������������
Citation: Sechel, I.C.; Mariasiu, F.
Efficiency of Governmental Policy
and Programs to Stimulate the Use of
Low-Emission and Electric Vehicles:
The Case of Romania. Sustainability
2022, 14, 45. https://doi.org/
10.3390/su14010045
Academic Editor: Chengxiang Zhuge
Received: 10 November 2021
Accepted: 15 December 2021
Published: 21 December 2021
Publisher’s Note: MDPI stays neutral
with regard to jurisdictional claims in
published maps and institutional affil-
iations.
Copyright: © 2021 by the authors.
Licensee MDPI, Basel, Switzerland.
This article is an open access article
distributed under the terms and
conditions of the Creative Commons
Attribution (CC BY) license (https://
creativecommons.org/licenses/by/
4.0/).
sustainability
Article
Efficiency of Governmental Policy and Programs to Stimulatethe Use of Low-Emission and Electric Vehicles: The Caseof Romania
Ioana C. Sechel and Florin Mariasiu *
Automotive Engineering and Transports Department, Technical University of Cluj-Napoca, Bdul. Muncii 103-105,RO-400641 Cluj-Napoca, Romania; [email protected]* Correspondence: [email protected]
Abstract: The contemporary demands for massive reductions in industrial pollution caused by thetransport sector, especially in large urban agglomerations, compel local and national authorities topropose, develop, and implement programs and policies that have the ultimate goal of significantlyreducing (or eliminating) pollution. The aim of this article is to provide a primary analysis of theeffectiveness of Romanian government policies in terms of reducing pollution (CO2 emissions)caused by transportation (due to the “Rabla Plus” (RP) program, through which financial subsidiesare granted for the purchase of a new plug-in hybrid electric vehicles (PHEVs) or battery electricvehicle (BEVs)). After analyzing the justification for the use of low-emission and electric vehiclesin traffic (as a major solution to eliminate pollution), a comparative analysis of energy-efficienttransport for Romania and Europe is presented in order to identify the directions in which it isnecessary to develop and implement government policies specifically in Romania, considering aseries of indicators chosen and considered by the authors to be important, including CO2 emissionscompared with the size of the road infrastructure, the number of registered vehicles, the numberof passengers transported, and the quantity of goods transported. With the identification of theability of government programs to encourage the acquisition and use of low-emission and electricvehicles in traffic, the efficiency achieved is calculated in terms of the net CO2 emissions eliminated(average values of 1949.23 CO2 tons/year and 1.71 CO2 tons/vehicle). Furthermore, this aspect isalso beneficial for analyses in terms of the economic costs involved (the associated costs are estimatedto be 7034.17 EUR/ton of CO2 eliminated from the transportation sector), identifying new directionsof action that are more cost-effective and sustainable and on which government policies should focusin the future.
Keywords: energy efficiency; transport; CO2 emission; electric vehicle; policy; financial subsidies
1. Introduction
The current state of advancement of human society is characterized by the exponentialdevelopment in terrestrial, air, and naval means of transport, which has led to continuousincreases in the transport of goods and persons, globalization of the economy, freedom ofmovement, and the exchange of ideas worldwide. The transport sector is one of the mostimportant branches of an economy, with connections to the field of transport involvingalmost all areas, starting with the transport of goods and ending with the transport ofpeople. Throughout history, people have tried to use their energy efficiently in order toobtain better results in the shortest time and with the least effort. Technological progressand innovation are closely linked to the evolution of the transport sector, both due to theneeds of long-distance passengers and of companies wanting to transport the maximumamount of goods at the lowest possible cost in the shortest possible time. Whether it beroad, rail, air, or sea or river transport, each country and region has tried to develop itstransport sector according to the specifics of the area and the existing demands. In many
Sustainability 2022, 14, 45. https://doi.org/10.3390/su14010045 https://www.mdpi.com/journal/sustainability
Sustainability 2022, 14, 45 2 of 20
areas, only one form of transport may be appropriate, whereas in other areas, all forms oftransport may be suitable. Recently, the quest for efficiency in transport has coincided withthe creation of coherent inter-modal systems, in which several types of transport have beenintegrated [1].
However, the process of streamlining the transport sector can be described as achievingthe best results with the lowest consumption of resources and in the shortest possible time,and a major component in transport efficiency is the environmental component. Thetransport sector is one of the largest polluters in the world, and vehicle emissions into theatmosphere increase the degree of pollution, affecting the entire ecosystem (air, water, andland), as highlighted extensively by studies carried out in the field [2,3]. As an immediateaction, global environmental authorities, together with representatives of all countries,have established and implemented several objectives and measures to reduce pollutionand pollutant emissions from transport. The measures implemented in this direction relateto establishing and applying mandatory pollution norms for vehicle manufacturers (EUROpollution norms), enforcing the use of mixtures of fossil fuels and biofuels to power internalcombustion engines, reducing access in urban areas for vehicles under a certain age, andencouraging the use of bicycles by creating special or dedicated routes for cyclists [4–6].
For the targeted measures to be as successful as possible, it is necessary for all partiesinvolved in this process to make efforts so that the quality of life of the population isimproved and the environment is affected as little as possible. However, over time, negativeeffects resulting from exploitation of the means of transport have begun to appear, namely,the pollution of the environment [7–9]. This pollution is due to the use of fossil fuel as theenergy source for internal combustion engines, whereby the transformation of chemicalenergy from fossil fuels into usable energy also leads to the emission of pollutants in theatmosphere (CO2, NOx, HC, and PM), which are harmful to both the environment and tohuman health [10–12].
This problem has major negative impacts, especially in large urban areas, and theimmediate solutions are directly related to the field of urban passenger transport throughthe use of low-pollution or non-polluting means of transport, including trams, trolleybuses,electric or hybrid buses, dedicated routes for urban passenger transport, and intermodalconnections between different types of transport (air-to-rail, rail-to-road, etc.). Studies byvarious researchers have shown that significant positive results can be obtained in reducingthe pollution emissions caused by transport through the renewal of vehicle fleets. Thisvehicle transition is one way to reduce the energy intensity and environmental impacts ofpublic transport [13,14].
Although significant efforts are being made worldwide to improve air quality, thelevel of pollution is still on an upward trend, and the main causes are generated by humanfactors through the purchase of increasing numbers of vehicles, but also by increasingglobal transport demands.
The energetic and economic efficiency of the transport process is in close and directconnection with the technologies used in the operation of the energy sources and fuels, andas a result, current transport efficiency policies primarily aim to reduce the level of carbondioxide emitted into the atmosphere and increase the use of electricity in transport. Studieshave shown that the basis of transport efficiency and pollution reduction plans involvesthree essential elements (directions of application) [15–17]:
• Promoting the use of new powertrain technologies to reduce vehicle pollution;• Orientating research and development processes towards the identification of new
sources of alternative energy that can be used in the field of transport;• Supporting and promoting low- or zero-pollution vehicles (electric and hybrid vehicles).
Given that 94% of energy needs are currently represented by oil in the EuropeanUnion (EU), the European Commission (EC) expects that, by 2030, about 15% of energydemand in the transport market will be covered by advanced biofuels, electricity, hydrogen,or renewable fuels. Globally, carbon dioxide emissions in the transport sector increasedby less than 0.5% in 2019, compared with an average annual increase of 1.9% since 2000,
Sustainability 2022, 14, 45 3 of 20
largely due to the increase in transport efficiency, the development of electricity use, theincreased use of biofuels. However, the transport sector generates about 24% of the totalCO2 emissions due to the considerable ongoing use of internal combustion engines basedon fossil fuels. Road transport, represented by cars, trucks, buses, or other such meansof transport (vehicles), generates approximately 75% of the total carbon emissions fromthe transport sphere; however, it must also be considered that CO2 emissions from air andnaval transport are continuously increasing, indicating a need for greater involvement inthis aspect of energy efficiency and in these areas (means of transport). At the Europeanlevel, the transport industry accounts for more than 6% of the gross domestic product(GDP) of the EU, with more than 6% of the EU workforce involved in this field, whereasinvestments account for around 40% of the total budget. In the context in which over 30%of energy consumption in the EU is related to the field of transport, the transportation ofgoods and people has increased significantly in the last 20 years, thus increasing damage tothe environment and society [18]. To improve transportation efficiency in transport, andpotentially promote electrification as an immediate solution, it is necessary to combine andimplement political measures to support the reduction in carbon dioxide emissions and,implicitly, the degree of global pollution [19].
The structure of this article is thus designed to provide a primary analysis of the effec-tiveness of Romanian government policies in terms of reducing pollution (CO2 emissions)due to transportation. After analyzing the justification for the use of low-emission andelectric vehicles in traffic, a comparative analysis of energy efficiency when it comes totransport in Romania and Europe is presented, in order to identify the directions in whichit is necessary to develop and implement government policies in Romania. The follow-ing series of indicators was chosen, because the authors consider these to be important:CO2 emissions compared with the length of road infrastructure; the number of registeredvehicles; the number of passengers transported; and the quantity of goods transported.
By identifying the impact of government programs encouraging the acquisition anduse of low-emission and electric vehicles in traffic, reductions in the CO2 emissions achievedthus far have been calculated. Furthermore, this aspect has been analyzed in terms of theeconomic costs involved, identifying a new course of action, one which is much morecost-effective, on which government policies should focus in the future. Directions foraction are also proposed to reduce the value of the other efficiency indicators considered inthis article, in order to reach below the EU average.
2. Electric Vehicle as Sustainable Solution in Transport Sector
One of the solutions that can partially reduce and/or eliminate some of the pollutantemissions caused by internal combustion engines is the use of vehicles that have an electricmotor in the powertrain group and one or more battery packs as an energy source [20,21].Battery electric vehicles (BEVs) use an onboard battery as a power source, which suppliesa powertrain based on an electric motor. This constructive feature offers a high energyefficiency (80–90%) because it also uses the energy obtained from regenerative braking asa net contribution to the battery charge. This principle of operation means that there areno local exhaust emissions from BEVs. However, the main disadvantage remains that thebattery must be charged periodically at a charging point (slow or fast) connected to thelocal electric grid. Electric vehicles offer the immediate advantage that they do not emitany pollutant emissions locally (zero-emission vehicles).
From the point of view of the performance related to the autonomy (range) that can bereached/travelled, there are major limitations regarding the energy capacity of the battery,which directly influence this parameter. At the present time, in the case of a compact BEV,an autonomy of 80 up to 400 km [22–24] can be expected. The limitation of the autonomymeans that BEVs are used with predilection in trips inside major urban agglomerations,but for interurban trips, it is necessary to adopt another technical approach; an immediatesolution was found in the form of PHEVs (plug-in hybrid vehicles) which combine the
Sustainability 2022, 14, 45 4 of 20
advantages of a BEV with the advantages of a classic vehicle equipped with an internalcombustion engine.
For propulsion, PHEVs have both an internal combustion engine (usually gasolineengine) and an electric motor powered by an on-board battery (with a lower energy capacitythan a BEV) [25]. The internal combustion engine and the electric motor can work eithertogether or separately depending on the operating conditions (i.e., power requirements).Thus, for low loads and speeds, the PHEVs are moved by the electric motor (in towns orwhen commuting), and the internal combustion engine intervenes in operation at highloads and speeds (in the interurban and/or motorway traffic environments). The batterycan be charged both from a charging point connected to the local electrical network or byoperating the internal combustion engine. It goes without saying that the environmentalimpact of PHEVs depends on the modes of operation/exploitation and is higher than in thecase of BEVs, but the main advantage is that they offer a much greater autonomy/range.
At present, in the vehicle market, consumers can choose between several differenttypes of electric vehicles: battery-powered, hybrid, and fuel cell. However, there are sometechnical differences related to their operation, which are not fully accounted for by users,who are mainly interested in the price and the maximum autonomy of the vehicle whenusing it electrically only. It should also be mentioned that the manufacturers of electric andhybrid vehicles offer information related only to the indicative electric autonomy (based onstandardized tests—NEDC, WLTP), a characteristic that users perceive as a real autonomyof movement.
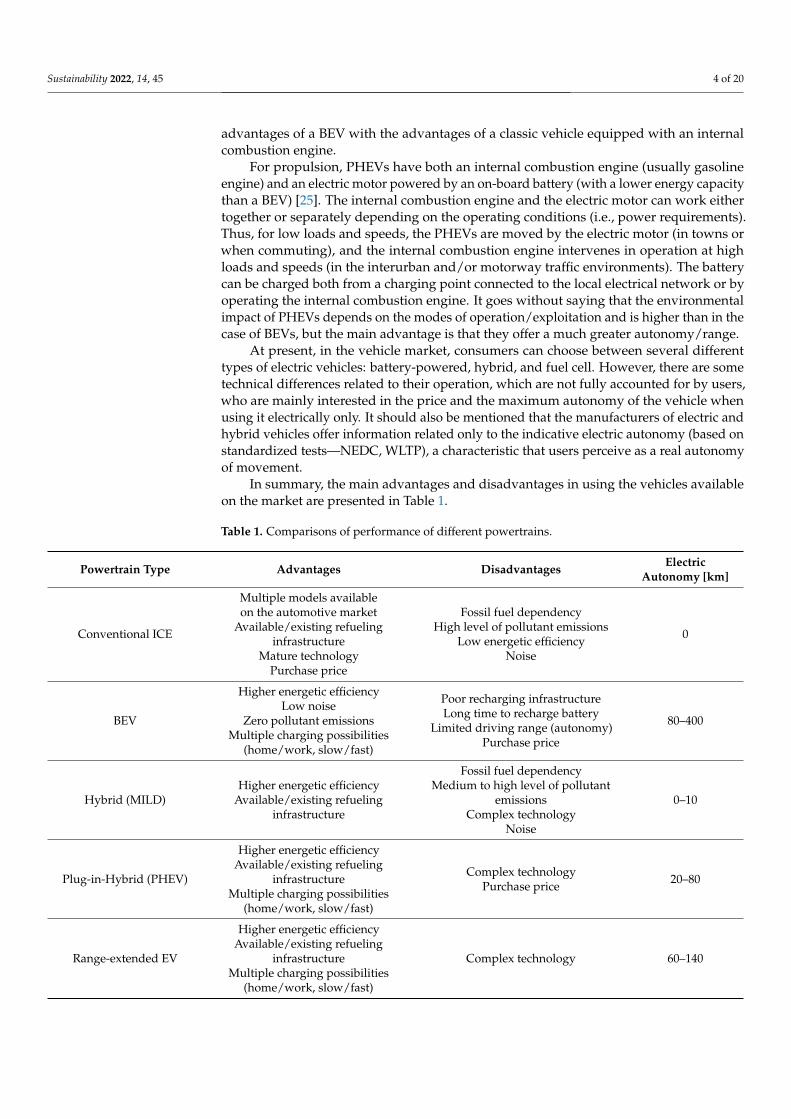
In summary, the main advantages and disadvantages in using the vehicles availableon the market are presented in Table 1.
Table 1. Comparisons of performance of different powertrains.
Powertrain Type Advantages Disadvantages ElectricAutonomy [km]
Conventional ICE
Multiple models availableon the automotive market
Available/existing refuelinginfrastructure
Mature technologyPurchase price
Fossil fuel dependencyHigh level of pollutant emissions
Low energetic efficiencyNoise
0
BEV
Higher energetic efficiencyLow noise
Zero pollutant emissionsMultiple charging possibilities
(home/work, slow/fast)
Poor recharging infrastructureLong time to recharge battery
Limited driving range (autonomy)Purchase price
80–400
Hybrid (MILD)Higher energetic efficiency
Available/existing refuelinginfrastructure
Fossil fuel dependencyMedium to high level of pollutant
emissionsComplex technology
Noise
0–10
Plug-in-Hybrid (PHEV)
Higher energetic efficiencyAvailable/existing refueling
infrastructureMultiple charging possibilities
(home/work, slow/fast)
Complex technologyPurchase price 20–80
Range-extended EV
Higher energetic efficiencyAvailable/existing refueling
infrastructureMultiple charging possibilities
(home/work, slow/fast)
Complex technology 60–140
Sustainability 2022, 14, 45 5 of 20
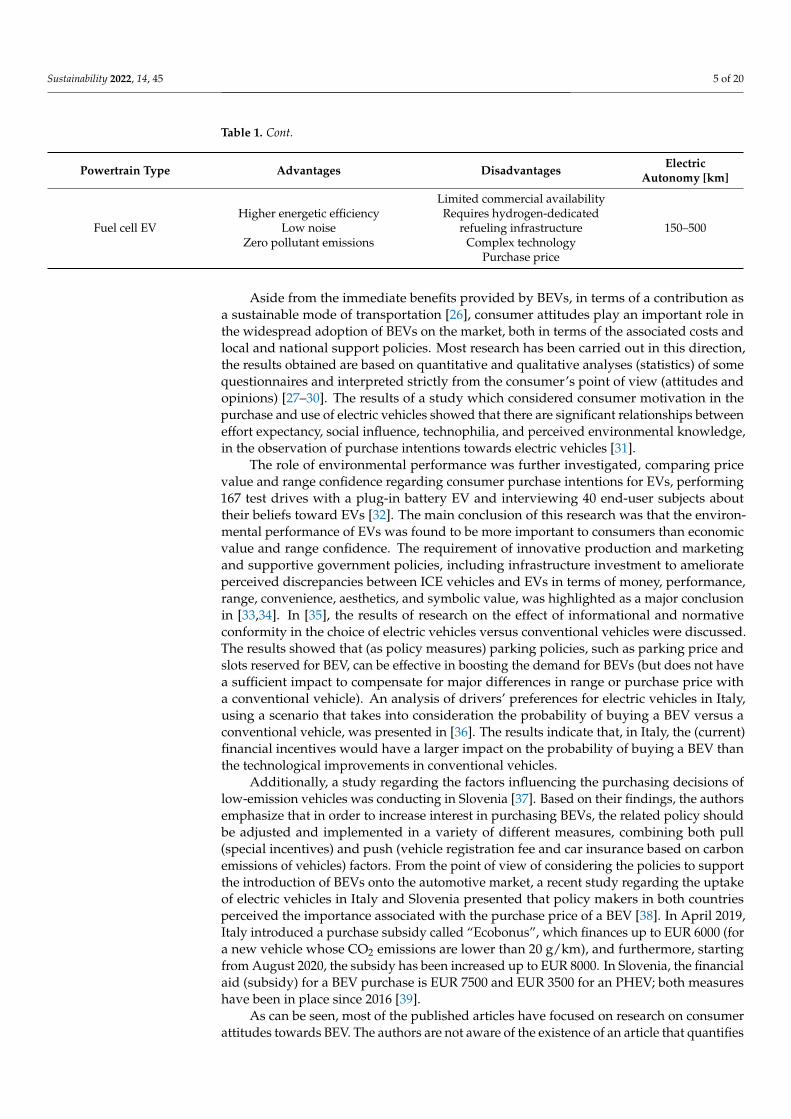
Table 1. Cont.
Powertrain Type Advantages Disadvantages ElectricAutonomy [km]
Fuel cell EVHigher energetic efficiency
Low noiseZero pollutant emissions
Limited commercial availabilityRequires hydrogen-dedicated
refueling infrastructureComplex technology
Purchase price
150–500
Aside from the immediate benefits provided by BEVs, in terms of a contribution asa sustainable mode of transportation [26], consumer attitudes play an important role inthe widespread adoption of BEVs on the market, both in terms of the associated costs andlocal and national support policies. Most research has been carried out in this direction,the results obtained are based on quantitative and qualitative analyses (statistics) of somequestionnaires and interpreted strictly from the consumer’s point of view (attitudes andopinions) [27–30]. The results of a study which considered consumer motivation in thepurchase and use of electric vehicles showed that there are significant relationships betweeneffort expectancy, social influence, technophilia, and perceived environmental knowledge,in the observation of purchase intentions towards electric vehicles [31].
The role of environmental performance was further investigated, comparing pricevalue and range confidence regarding consumer purchase intentions for EVs, performing167 test drives with a plug-in battery EV and interviewing 40 end-user subjects abouttheir beliefs toward EVs [32]. The main conclusion of this research was that the environ-mental performance of EVs was found to be more important to consumers than economicvalue and range confidence. The requirement of innovative production and marketingand supportive government policies, including infrastructure investment to ameliorateperceived discrepancies between ICE vehicles and EVs in terms of money, performance,range, convenience, aesthetics, and symbolic value, was highlighted as a major conclusionin [33,34]. In [35], the results of research on the effect of informational and normativeconformity in the choice of electric vehicles versus conventional vehicles were discussed.The results showed that (as policy measures) parking policies, such as parking price andslots reserved for BEV, can be effective in boosting the demand for BEVs (but does not havea sufficient impact to compensate for major differences in range or purchase price witha conventional vehicle). An analysis of drivers’ preferences for electric vehicles in Italy,using a scenario that takes into consideration the probability of buying a BEV versus aconventional vehicle, was presented in [36]. The results indicate that, in Italy, the (current)financial incentives would have a larger impact on the probability of buying a BEV thanthe technological improvements in conventional vehicles.
Additionally, a study regarding the factors influencing the purchasing decisions oflow-emission vehicles was conducting in Slovenia [37]. Based on their findings, the authorsemphasize that in order to increase interest in purchasing BEVs, the related policy shouldbe adjusted and implemented in a variety of different measures, combining both pull(special incentives) and push (vehicle registration fee and car insurance based on carbonemissions of vehicles) factors. From the point of view of considering the policies to supportthe introduction of BEVs onto the automotive market, a recent study regarding the uptakeof electric vehicles in Italy and Slovenia presented that policy makers in both countriesperceived the importance associated with the purchase price of a BEV [38]. In April 2019,Italy introduced a purchase subsidy called “Ecobonus”, which finances up to EUR 6000 (fora new vehicle whose CO2 emissions are lower than 20 g/km), and furthermore, startingfrom August 2020, the subsidy has been increased up to EUR 8000. In Slovenia, the financialaid (subsidy) for a BEV purchase is EUR 7500 and EUR 3500 for an PHEV; both measureshave been in place since 2016 [39].
As can be seen, most of the published articles have focused on research on consumerattitudes towards BEV. The authors are not aware of the existence of an article that quantifies
Sustainability 2022, 14, 45 6 of 20
the effectiveness of policies to promote low-emission and electric vehicles on the automotivemarket; therefore, this paper seeks to address this knowledge gap, in support of the furtherdevelopment and implementation of public policies of this aspect, with immediate impacton the contemporary need for reducing polluting emissions.
3. Comparative Analysis of Energy Efficiency in Transport for Romania and Europe
To create and implement policies at national and local levels, in terms of reducingpollution in transport, it is first necessary to analyze the energy efficiency of the areas thatcomprise a country’s economy. Energy efficiency can be assessed using technical indicatorsspecific to the analyzed field, as well as an approach that considers the impact of activitieson the environment (by analyzing GHG emissions) [40]. Coordination with current andfuture European environmental policies means that the efficiency indicators considered inthe article should at least be compared with the European average, in order to identify thedirections to be followed in the development and implementation of policies to reduce thepollution caused by transport, and streamlining the use of energy resources in Romania,with a direct effect on environmental protection.
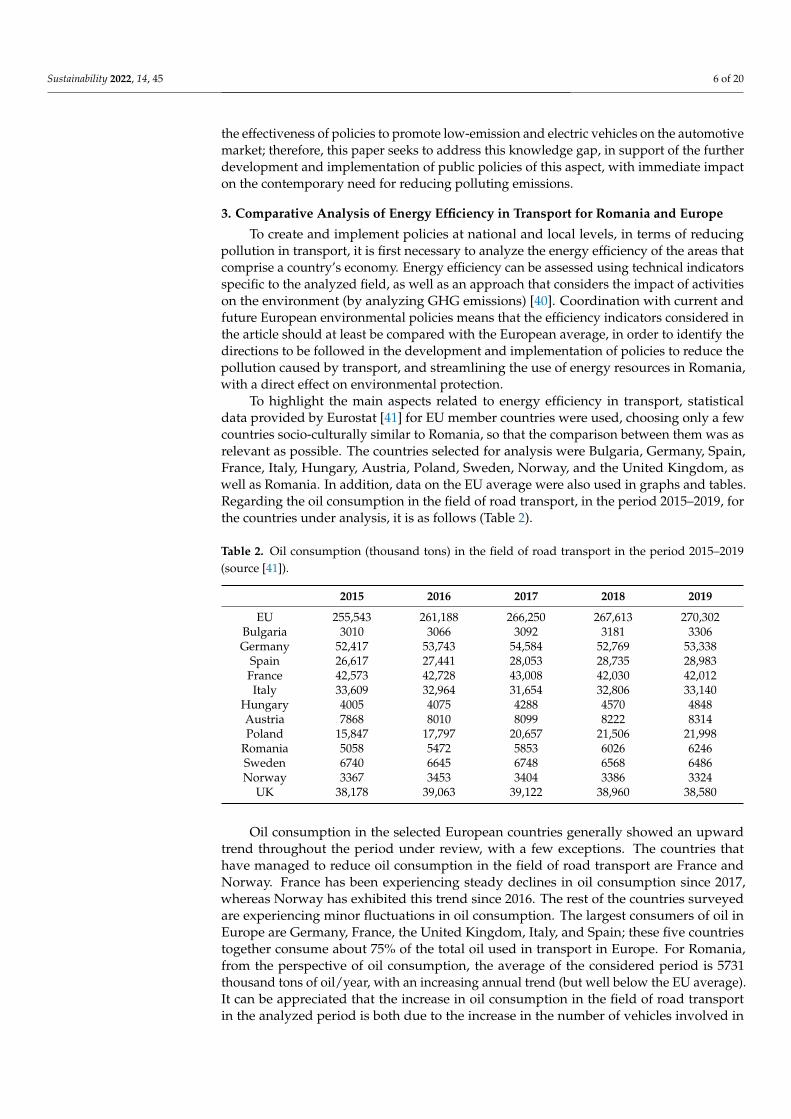
To highlight the main aspects related to energy efficiency in transport, statisticaldata provided by Eurostat [41] for EU member countries were used, choosing only a fewcountries socio-culturally similar to Romania, so that the comparison between them was asrelevant as possible. The countries selected for analysis were Bulgaria, Germany, Spain,France, Italy, Hungary, Austria, Poland, Sweden, Norway, and the United Kingdom, aswell as Romania. In addition, data on the EU average were also used in graphs and tables.Regarding the oil consumption in the field of road transport, in the period 2015–2019, forthe countries under analysis, it is as follows (Table 2).
Table 2. Oil consumption (thousand tons) in the field of road transport in the period 2015–2019(source [41]).
2015 2016 2017 2018 2019
EU 255,543 261,188 266,250 267,613 270,302Bulgaria 3010 3066 3092 3181 3306Germany 52,417 53,743 54,584 52,769 53,338
Spain 26,617 27,441 28,053 28,735 28,983France 42,573 42,728 43,008 42,030 42,012Italy 33,609 32,964 31,654 32,806 33,140
Hungary 4005 4075 4288 4570 4848Austria 7868 8010 8099 8222 8314Poland 15,847 17,797 20,657 21,506 21,998
Romania 5058 5472 5853 6026 6246Sweden 6740 6645 6748 6568 6486Norway 3367 3453 3404 3386 3324
UK 38,178 39,063 39,122 38,960 38,580
Oil consumption in the selected European countries generally showed an upwardtrend throughout the period under review, with a few exceptions. The countries thathave managed to reduce oil consumption in the field of road transport are France andNorway. France has been experiencing steady declines in oil consumption since 2017,whereas Norway has exhibited this trend since 2016. The rest of the countries surveyedare experiencing minor fluctuations in oil consumption. The largest consumers of oil inEurope are Germany, France, the United Kingdom, Italy, and Spain; these five countriestogether consume about 75% of the total oil used in transport in Europe. For Romania,from the perspective of oil consumption, the average of the considered period is 5731thousand tons of oil/year, with an increasing annual trend (but well below the EU average).It can be appreciated that the increase in oil consumption in the field of road transportin the analyzed period is both due to the increase in the number of vehicles involved in
Sustainability 2022, 14, 45 7 of 20
transport activities and an intensification of commercial activities, in most cases becauseof globalization.
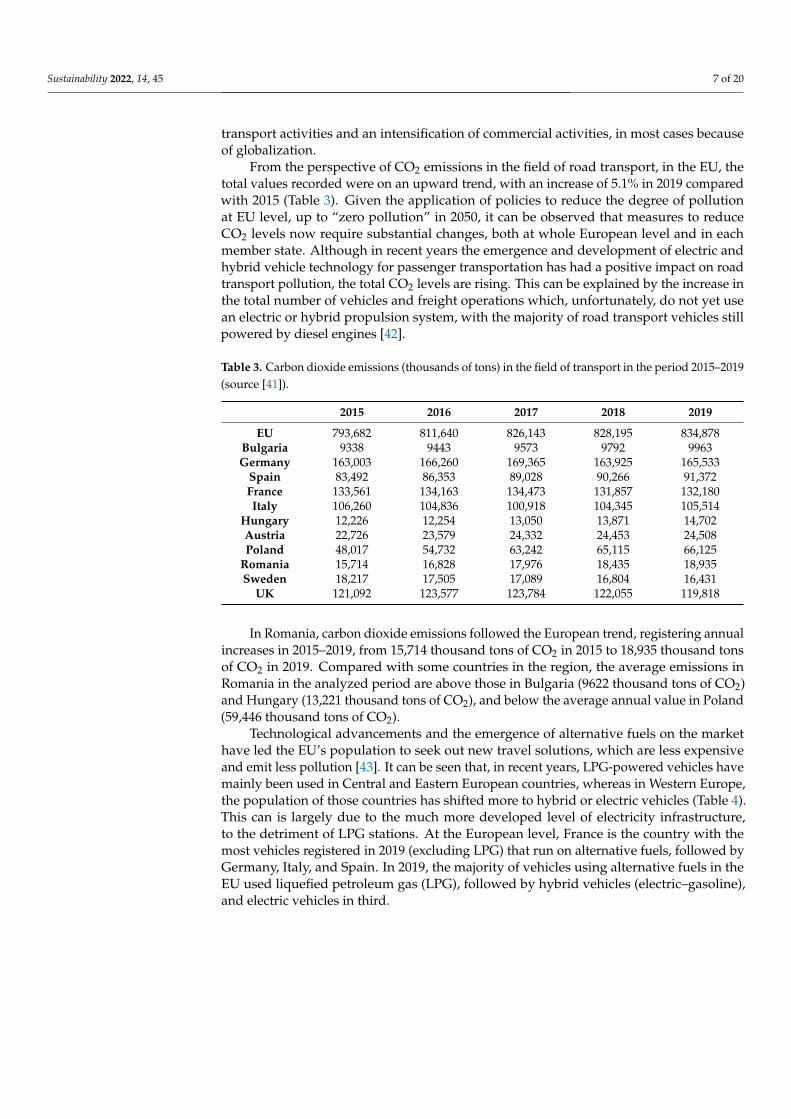
From the perspective of CO2 emissions in the field of road transport, in the EU, thetotal values recorded were on an upward trend, with an increase of 5.1% in 2019 comparedwith 2015 (Table 3). Given the application of policies to reduce the degree of pollutionat EU level, up to “zero pollution” in 2050, it can be observed that measures to reduceCO2 levels now require substantial changes, both at whole European level and in eachmember state. Although in recent years the emergence and development of electric andhybrid vehicle technology for passenger transportation has had a positive impact on roadtransport pollution, the total CO2 levels are rising. This can be explained by the increase inthe total number of vehicles and freight operations which, unfortunately, do not yet usean electric or hybrid propulsion system, with the majority of road transport vehicles stillpowered by diesel engines [42].
Table 3. Carbon dioxide emissions (thousands of tons) in the field of transport in the period 2015–2019(source [41]).
2015 2016 2017 2018 2019
EU 793,682 811,640 826,143 828,195 834,878Bulgaria 9338 9443 9573 9792 9963Germany 163,003 166,260 169,365 163,925 165,533
Spain 83,492 86,353 89,028 90,266 91,372France 133,561 134,163 134,473 131,857 132,180Italy 106,260 104,836 100,918 104,345 105,514
Hungary 12,226 12,254 13,050 13,871 14,702Austria 22,726 23,579 24,332 24,453 24,508Poland 48,017 54,732 63,242 65,115 66,125
Romania 15,714 16,828 17,976 18,435 18,935Sweden 18,217 17,505 17,089 16,804 16,431
UK 121,092 123,577 123,784 122,055 119,818
In Romania, carbon dioxide emissions followed the European trend, registering annualincreases in 2015–2019, from 15,714 thousand tons of CO2 in 2015 to 18,935 thousand tonsof CO2 in 2019. Compared with some countries in the region, the average emissions inRomania in the analyzed period are above those in Bulgaria (9622 thousand tons of CO2)and Hungary (13,221 thousand tons of CO2), and below the average annual value in Poland(59,446 thousand tons of CO2).
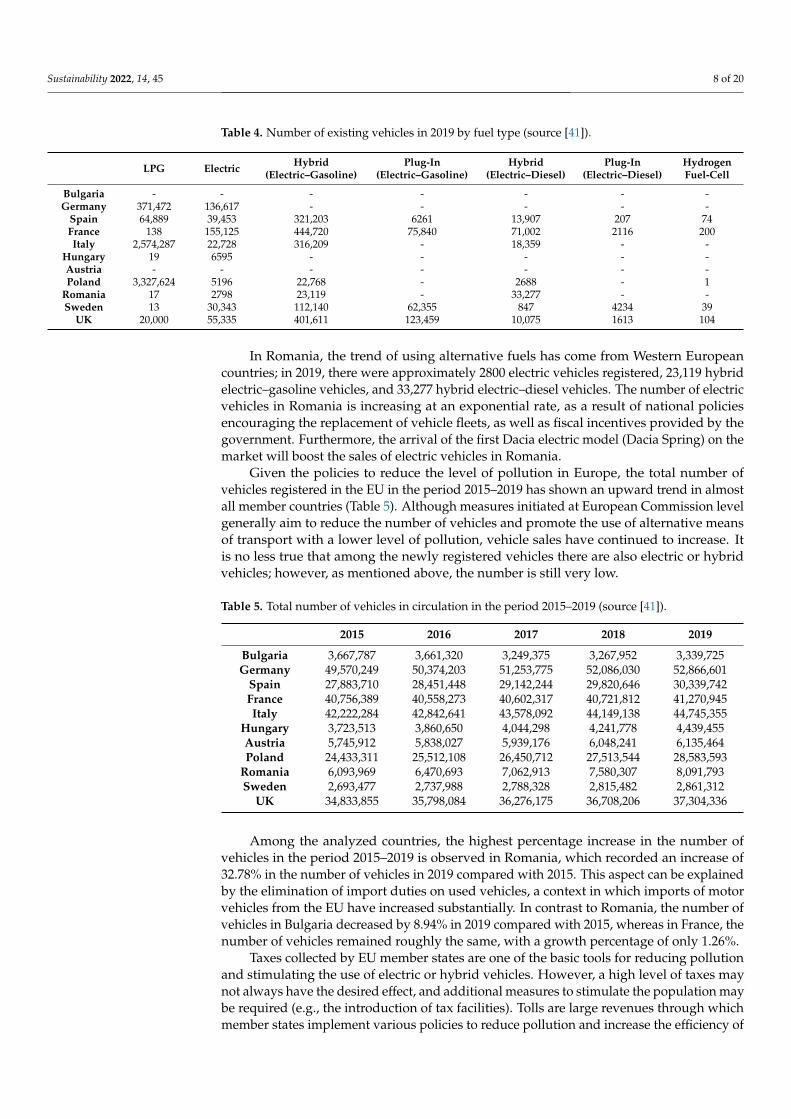
Technological advancements and the emergence of alternative fuels on the markethave led the EU’s population to seek out new travel solutions, which are less expensiveand emit less pollution [43]. It can be seen that, in recent years, LPG-powered vehicles havemainly been used in Central and Eastern European countries, whereas in Western Europe,the population of those countries has shifted more to hybrid or electric vehicles (Table 4).This can is largely due to the much more developed level of electricity infrastructure,to the detriment of LPG stations. At the European level, France is the country with themost vehicles registered in 2019 (excluding LPG) that run on alternative fuels, followed byGermany, Italy, and Spain. In 2019, the majority of vehicles using alternative fuels in theEU used liquefied petroleum gas (LPG), followed by hybrid vehicles (electric–gasoline),and electric vehicles in third.
Sustainability 2022, 14, 45 8 of 20
Table 4. Number of existing vehicles in 2019 by fuel type (source [41]).
LPG Electric Hybrid(Electric–Gasoline)
Plug-In(Electric–Gasoline)
Hybrid(Electric–Diesel)
Plug-In(Electric–Diesel)
HydrogenFuel-Cell
Bulgaria - - - - - - -Germany 371,472 136,617 - - - - -
Spain 64,889 39,453 321,203 6261 13,907 207 74France 138 155,125 444,720 75,840 71,002 2116 200Italy 2,574,287 22,728 316,209 - 18,359 - -
Hungary 19 6595 - - - - -Austria - - - - - - -Poland 3,327,624 5196 22,768 - 2688 - 1
Romania 17 2798 23,119 - 33,277 - -Sweden 13 30,343 112,140 62,355 847 4234 39
UK 20,000 55,335 401,611 123,459 10,075 1613 104
In Romania, the trend of using alternative fuels has come from Western Europeancountries; in 2019, there were approximately 2800 electric vehicles registered, 23,119 hybridelectric–gasoline vehicles, and 33,277 hybrid electric–diesel vehicles. The number of electricvehicles in Romania is increasing at an exponential rate, as a result of national policiesencouraging the replacement of vehicle fleets, as well as fiscal incentives provided by thegovernment. Furthermore, the arrival of the first Dacia electric model (Dacia Spring) on themarket will boost the sales of electric vehicles in Romania.
Given the policies to reduce the level of pollution in Europe, the total number ofvehicles registered in the EU in the period 2015–2019 has shown an upward trend in almostall member countries (Table 5). Although measures initiated at European Commission levelgenerally aim to reduce the number of vehicles and promote the use of alternative meansof transport with a lower level of pollution, vehicle sales have continued to increase. Itis no less true that among the newly registered vehicles there are also electric or hybridvehicles; however, as mentioned above, the number is still very low.
Table 5. Total number of vehicles in circulation in the period 2015–2019 (source [41]).
2015 2016 2017 2018 2019
Bulgaria 3,667,787 3,661,320 3,249,375 3,267,952 3,339,725Germany 49,570,249 50,374,203 51,253,775 52,086,030 52,866,601
Spain 27,883,710 28,451,448 29,142,244 29,820,646 30,339,742France 40,756,389 40,558,273 40,602,317 40,721,812 41,270,945Italy 42,222,284 42,842,641 43,578,092 44,149,138 44,745,355
Hungary 3,723,513 3,860,650 4,044,298 4,241,778 4,439,455Austria 5,745,912 5,838,027 5,939,176 6,048,241 6,135,464Poland 24,433,311 25,512,108 26,450,712 27,513,544 28,583,593
Romania 6,093,969 6,470,693 7,062,913 7,580,307 8,091,793Sweden 2,693,477 2,737,988 2,788,328 2,815,482 2,861,312
UK 34,833,855 35,798,084 36,276,175 36,708,206 37,304,336
Among the analyzed countries, the highest percentage increase in the number ofvehicles in the period 2015–2019 is observed in Romania, which recorded an increase of32.78% in the number of vehicles in 2019 compared with 2015. This aspect can be explainedby the elimination of import duties on used vehicles, a context in which imports of motorvehicles from the EU have increased substantially. In contrast to Romania, the number ofvehicles in Bulgaria decreased by 8.94% in 2019 compared with 2015, whereas in France, thenumber of vehicles remained roughly the same, with a growth percentage of only 1.26%.
Taxes collected by EU member states are one of the basic tools for reducing pollutionand stimulating the use of electric or hybrid vehicles. However, a high level of taxes maynot always have the desired effect, and additional measures to stimulate the population maybe required (e.g., the introduction of tax facilities). Tolls are large revenues through whichmember states implement various policies to reduce pollution and increase the efficiency of
Sustainability 2022, 14, 45 9 of 20
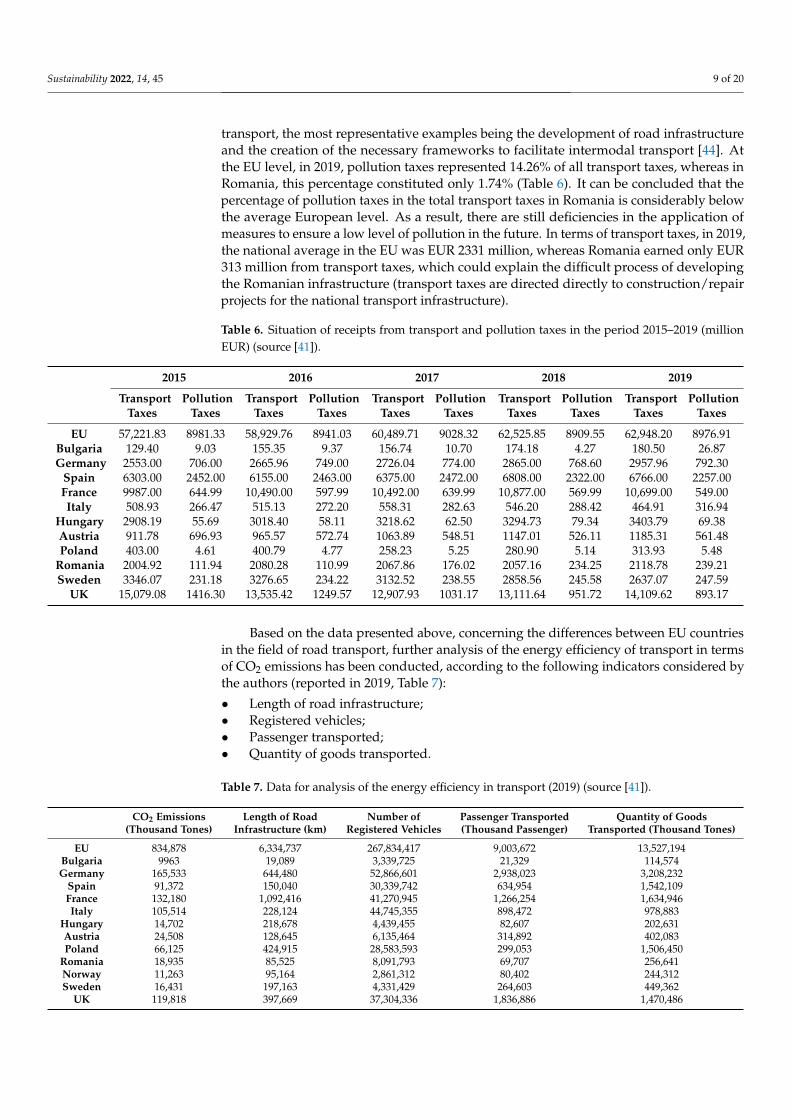
transport, the most representative examples being the development of road infrastructureand the creation of the necessary frameworks to facilitate intermodal transport [44]. Atthe EU level, in 2019, pollution taxes represented 14.26% of all transport taxes, whereas inRomania, this percentage constituted only 1.74% (Table 6). It can be concluded that thepercentage of pollution taxes in the total transport taxes in Romania is considerably belowthe average European level. As a result, there are still deficiencies in the application ofmeasures to ensure a low level of pollution in the future. In terms of transport taxes, in 2019,the national average in the EU was EUR 2331 million, whereas Romania earned only EUR313 million from transport taxes, which could explain the difficult process of developingthe Romanian infrastructure (transport taxes are directed directly to construction/repairprojects for the national transport infrastructure).
Table 6. Situation of receipts from transport and pollution taxes in the period 2015–2019 (millionEUR) (source [41]).
2015 2016 2017 2018 2019
TransportTaxes
PollutionTaxes
TransportTaxes
PollutionTaxes
TransportTaxes
PollutionTaxes
TransportTaxes
PollutionTaxes
TransportTaxes
PollutionTaxes
EU 57,221.83 8981.33 58,929.76 8941.03 60,489.71 9028.32 62,525.85 8909.55 62,948.20 8976.91Bulgaria 129.40 9.03 155.35 9.37 156.74 10.70 174.18 4.27 180.50 26.87Germany 2553.00 706.00 2665.96 749.00 2726.04 774.00 2865.00 768.60 2957.96 792.30
Spain 6303.00 2452.00 6155.00 2463.00 6375.00 2472.00 6808.00 2322.00 6766.00 2257.00France 9987.00 644.99 10,490.00 597.99 10,492.00 639.99 10,877.00 569.99 10,699.00 549.00Italy 508.93 266.47 515.13 272.20 558.31 282.63 546.20 288.42 464.91 316.94
Hungary 2908.19 55.69 3018.40 58.11 3218.62 62.50 3294.73 79.34 3403.79 69.38Austria 911.78 696.93 965.57 572.74 1063.89 548.51 1147.01 526.11 1185.31 561.48Poland 403.00 4.61 400.79 4.77 258.23 5.25 280.90 5.14 313.93 5.48
Romania 2004.92 111.94 2080.28 110.99 2067.86 176.02 2057.16 234.25 2118.78 239.21Sweden 3346.07 231.18 3276.65 234.22 3132.52 238.55 2858.56 245.58 2637.07 247.59
UK 15,079.08 1416.30 13,535.42 1249.57 12,907.93 1031.17 13,111.64 951.72 14,109.62 893.17
Based on the data presented above, concerning the differences between EU countriesin the field of road transport, further analysis of the energy efficiency of transport in termsof CO2 emissions has been conducted, according to the following indicators considered bythe authors (reported in 2019, Table 7):
• Length of road infrastructure;• Registered vehicles;• Passenger transported;• Quantity of goods transported.
Table 7. Data for analysis of the energy efficiency in transport (2019) (source [41]).
CO2 Emissions(Thousand Tones)
Length of RoadInfrastructure (km)
Number ofRegistered Vehicles
Passenger Transported(Thousand Passenger)
Quantity of GoodsTransported (Thousand Tones)
EU 834,878 6,334,737 267,834,417 9,003,672 13,527,194Bulgaria 9963 19,089 3,339,725 21,329 114,574Germany 165,533 644,480 52,866,601 2,938,023 3,208,232
Spain 91,372 150,040 30,339,742 634,954 1,542,109France 132,180 1,092,416 41,270,945 1,266,254 1,634,946Italy 105,514 228,124 44,745,355 898,472 978,883
Hungary 14,702 218,678 4,439,455 82,607 202,631Austria 24,508 128,645 6,135,464 314,892 402,083Poland 66,125 424,915 28,583,593 299,053 1,506,450
Romania 18,935 85,525 8,091,793 69,707 256,641Norway 11,263 95,164 2,861,312 80,402 244,312Sweden 16,431 197,163 4,331,429 264,603 449,362
UK 119,818 397,669 37,304,336 1,836,886 1,470,486
Sustainability 2022, 14, 45 10 of 20
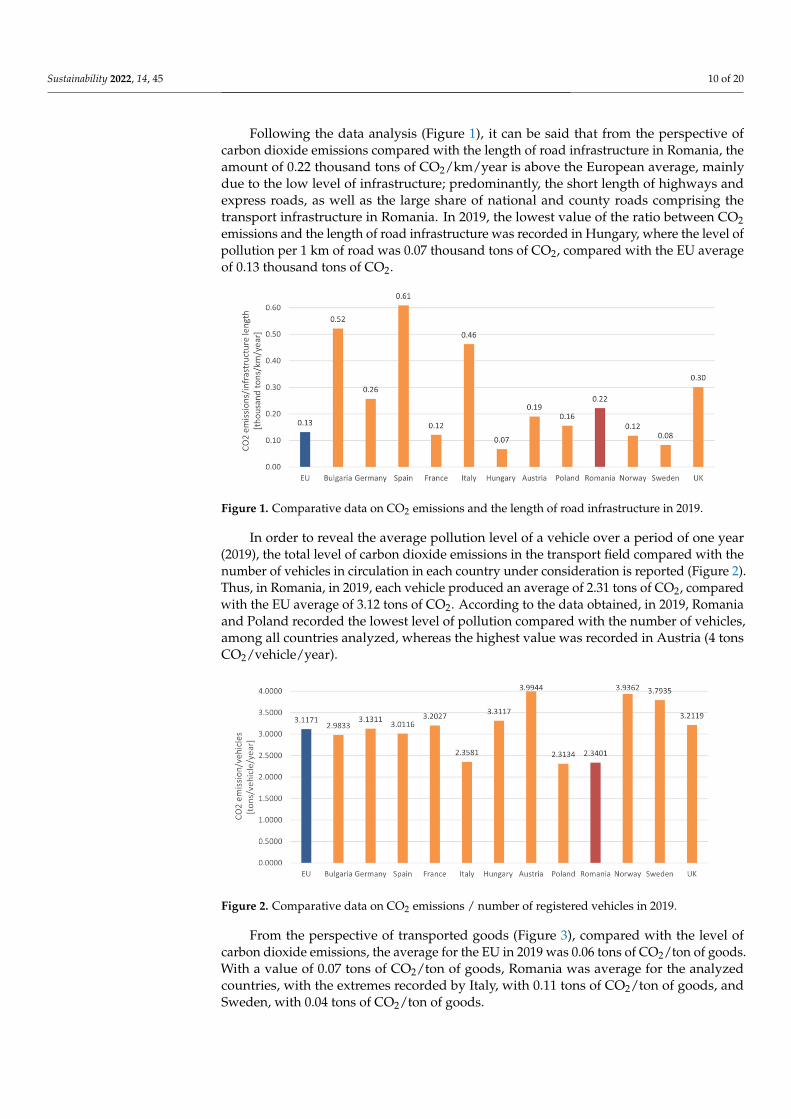
Following the data analysis (Figure 1), it can be said that from the perspective ofcarbon dioxide emissions compared with the length of road infrastructure in Romania, theamount of 0.22 thousand tons of CO2/km/year is above the European average, mainlydue to the low level of infrastructure; predominantly, the short length of highways andexpress roads, as well as the large share of national and county roads comprising thetransport infrastructure in Romania. In 2019, the lowest value of the ratio between CO2emissions and the length of road infrastructure was recorded in Hungary, where the level ofpollution per 1 km of road was 0.07 thousand tons of CO2, compared with the EU averageof 0.13 thousand tons of CO2.
Figure 1. Comparative data on CO2 emissions and the length of road infrastructure in 2019.
In order to reveal the average pollution level of a vehicle over a period of one year(2019), the total level of carbon dioxide emissions in the transport field compared with thenumber of vehicles in circulation in each country under consideration is reported (Figure 2).Thus, in Romania, in 2019, each vehicle produced an average of 2.31 tons of CO2, comparedwith the EU average of 3.12 tons of CO2. According to the data obtained, in 2019, Romaniaand Poland recorded the lowest level of pollution compared with the number of vehicles,among all countries analyzed, whereas the highest value was recorded in Austria (4 tonsCO2/vehicle/year).
Figure 2. Comparative data on CO2 emissions / number of registered vehicles in 2019.
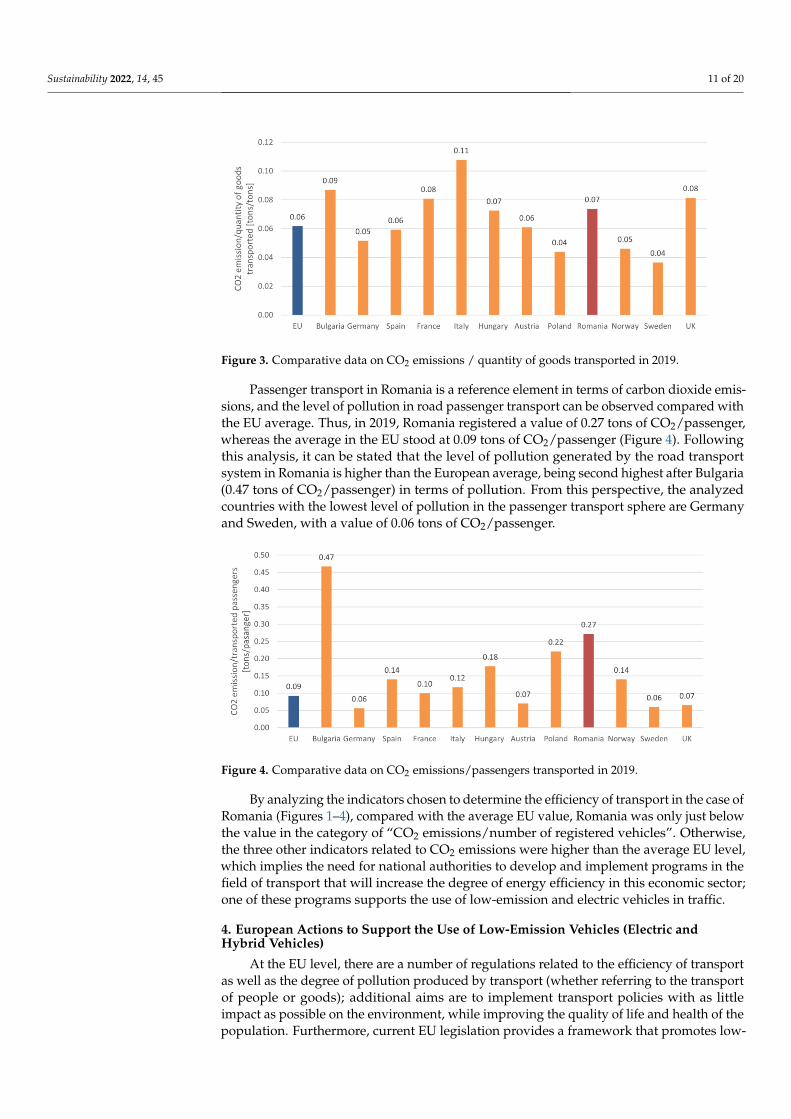
From the perspective of transported goods (Figure 3), compared with the level ofcarbon dioxide emissions, the average for the EU in 2019 was 0.06 tons of CO2/ton of goods.With a value of 0.07 tons of CO2/ton of goods, Romania was average for the analyzedcountries, with the extremes recorded by Italy, with 0.11 tons of CO2/ton of goods, andSweden, with 0.04 tons of CO2/ton of goods.
Sustainability 2022, 14, 45 11 of 20
Figure 3. Comparative data on CO2 emissions / quantity of goods transported in 2019.
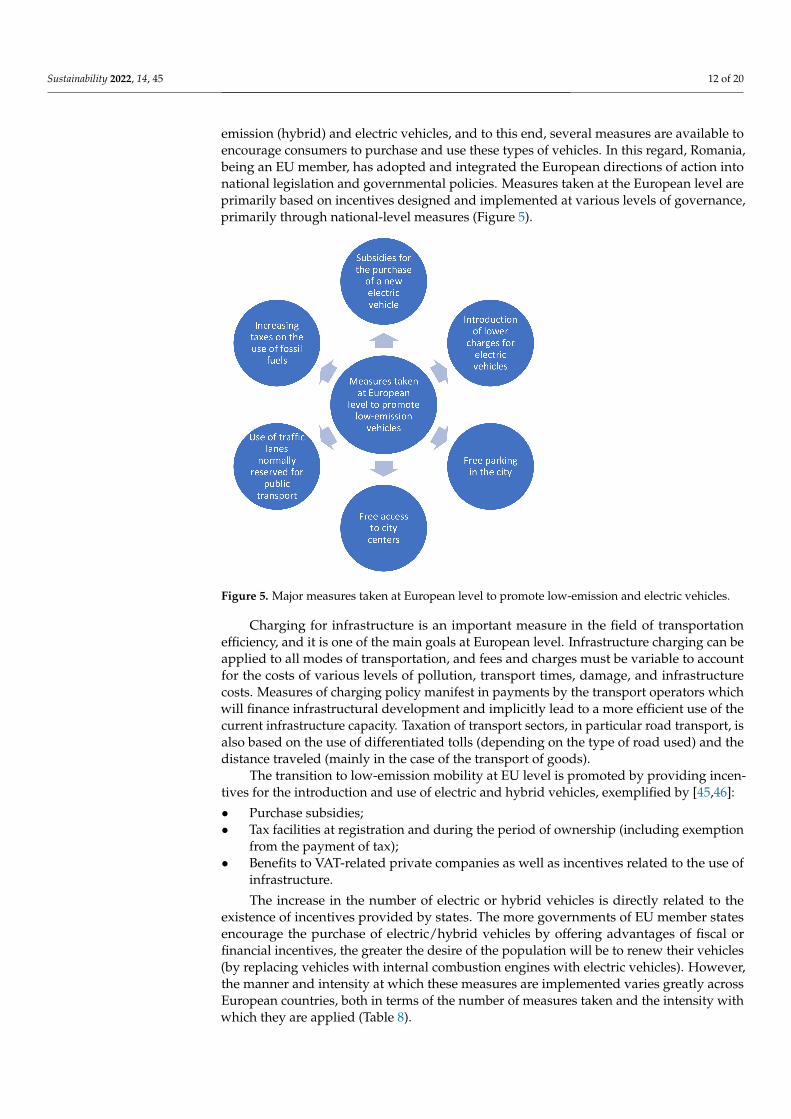
Passenger transport in Romania is a reference element in terms of carbon dioxide emis-sions, and the level of pollution in road passenger transport can be observed compared withthe EU average. Thus, in 2019, Romania registered a value of 0.27 tons of CO2/passenger,whereas the average in the EU stood at 0.09 tons of CO2/passenger (Figure 4). Followingthis analysis, it can be stated that the level of pollution generated by the road transportsystem in Romania is higher than the European average, being second highest after Bulgaria(0.47 tons of CO2/passenger) in terms of pollution. From this perspective, the analyzedcountries with the lowest level of pollution in the passenger transport sphere are Germanyand Sweden, with a value of 0.06 tons of CO2/passenger.
Figure 4. Comparative data on CO2 emissions/passengers transported in 2019.
By analyzing the indicators chosen to determine the efficiency of transport in the case ofRomania (Figures 1–4), compared with the average EU value, Romania was only just belowthe value in the category of “CO2 emissions/number of registered vehicles”. Otherwise,the three other indicators related to CO2 emissions were higher than the average EU level,which implies the need for national authorities to develop and implement programs in thefield of transport that will increase the degree of energy efficiency in this economic sector;one of these programs supports the use of low-emission and electric vehicles in traffic.
4. European Actions to Support the Use of Low-Emission Vehicles (Electric andHybrid Vehicles)
At the EU level, there are a number of regulations related to the efficiency of transportas well as the degree of pollution produced by transport (whether referring to the transportof people or goods); additional aims are to implement transport policies with as littleimpact as possible on the environment, while improving the quality of life and health of thepopulation. Furthermore, current EU legislation provides a framework that promotes low-
Sustainability 2022, 14, 45 12 of 20
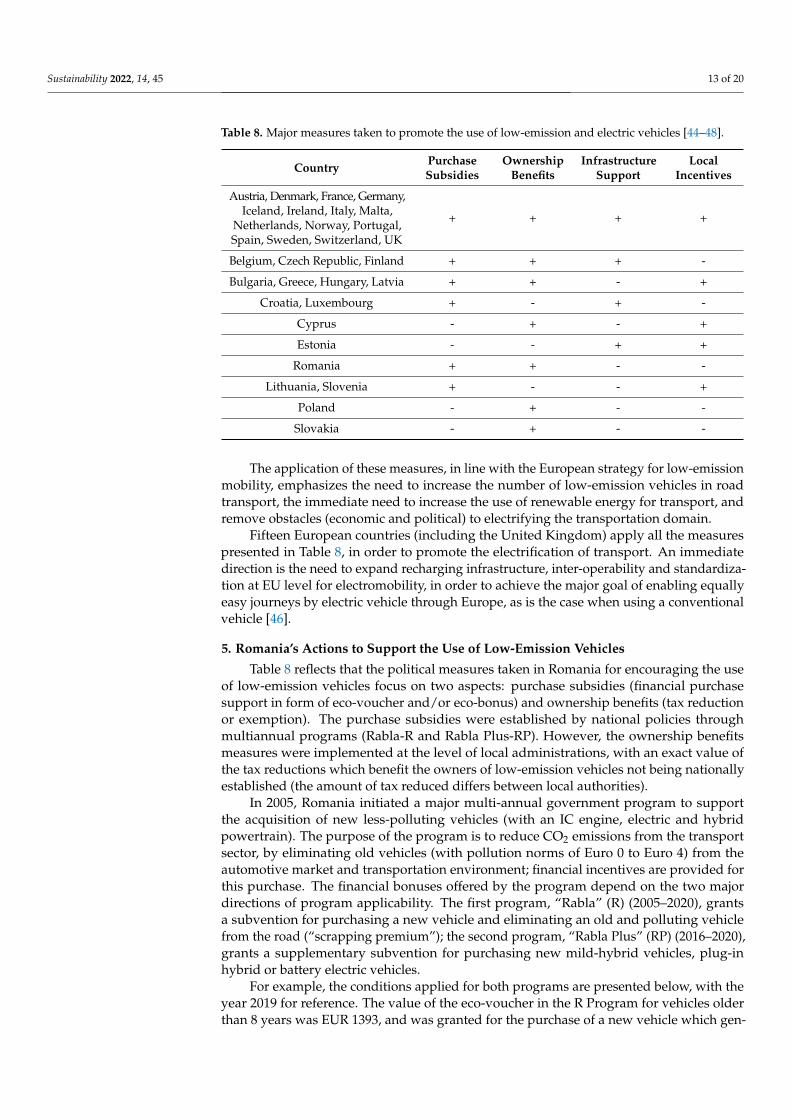
emission (hybrid) and electric vehicles, and to this end, several measures are available toencourage consumers to purchase and use these types of vehicles. In this regard, Romania,being an EU member, has adopted and integrated the European directions of action intonational legislation and governmental policies. Measures taken at the European level areprimarily based on incentives designed and implemented at various levels of governance,primarily through national-level measures (Figure 5).
Figure 5. Major measures taken at European level to promote low-emission and electric vehicles.
Charging for infrastructure is an important measure in the field of transportationefficiency, and it is one of the main goals at European level. Infrastructure charging can beapplied to all modes of transportation, and fees and charges must be variable to accountfor the costs of various levels of pollution, transport times, damage, and infrastructurecosts. Measures of charging policy manifest in payments by the transport operators whichwill finance infrastructural development and implicitly lead to a more efficient use of thecurrent infrastructure capacity. Taxation of transport sectors, in particular road transport, isalso based on the use of differentiated tolls (depending on the type of road used) and thedistance traveled (mainly in the case of the transport of goods).
The transition to low-emission mobility at EU level is promoted by providing incen-tives for the introduction and use of electric and hybrid vehicles, exemplified by [45,46]:
• Purchase subsidies;• Tax facilities at registration and during the period of ownership (including exemption
from the payment of tax);• Benefits to VAT-related private companies as well as incentives related to the use of
infrastructure.
The increase in the number of electric or hybrid vehicles is directly related to theexistence of incentives provided by states. The more governments of EU member statesencourage the purchase of electric/hybrid vehicles by offering advantages of fiscal orfinancial incentives, the greater the desire of the population will be to renew their vehicles(by replacing vehicles with internal combustion engines with electric vehicles). However,the manner and intensity at which these measures are implemented varies greatly acrossEuropean countries, both in terms of the number of measures taken and the intensity withwhich they are applied (Table 8).
Sustainability 2022, 14, 45 13 of 20
Table 8. Major measures taken to promote the use of low-emission and electric vehicles [44–48].
Country PurchaseSubsidies
OwnershipBenefits
InfrastructureSupport
LocalIncentives
Austria, Denmark, France, Germany,Iceland, Ireland, Italy, Malta,
Netherlands, Norway, Portugal,Spain, Sweden, Switzerland, UK
+ + + +
Belgium, Czech Republic, Finland + + + -
Bulgaria, Greece, Hungary, Latvia + + - +
Croatia, Luxembourg + - + -
Cyprus - + - +
Estonia - - + +
Romania + + - -
Lithuania, Slovenia + - - +
Poland - + - -
Slovakia - + - -
The application of these measures, in line with the European strategy for low-emissionmobility, emphasizes the need to increase the number of low-emission vehicles in roadtransport, the immediate need to increase the use of renewable energy for transport, andremove obstacles (economic and political) to electrifying the transportation domain.
Fifteen European countries (including the United Kingdom) apply all the measurespresented in Table 8, in order to promote the electrification of transport. An immediatedirection is the need to expand recharging infrastructure, inter-operability and standardiza-tion at EU level for electromobility, in order to achieve the major goal of enabling equallyeasy journeys by electric vehicle through Europe, as is the case when using a conventionalvehicle [46].
5. Romania’s Actions to Support the Use of Low-Emission Vehicles
Table 8 reflects that the political measures taken in Romania for encouraging the useof low-emission vehicles focus on two aspects: purchase subsidies (financial purchasesupport in form of eco-voucher and/or eco-bonus) and ownership benefits (tax reductionor exemption). The purchase subsidies were established by national policies throughmultiannual programs (Rabla-R and Rabla Plus-RP). However, the ownership benefitsmeasures were implemented at the level of local administrations, with an exact value ofthe tax reductions which benefit the owners of low-emission vehicles not being nationallyestablished (the amount of tax reduced differs between local authorities).
In 2005, Romania initiated a major multi-annual government program to supportthe acquisition of new less-polluting vehicles (with an IC engine, electric and hybridpowertrain). The purpose of the program is to reduce CO2 emissions from the transportsector, by eliminating old vehicles (with pollution norms of Euro 0 to Euro 4) from theautomotive market and transportation environment; financial incentives are provided forthis purchase. The financial bonuses offered by the program depend on the two majordirections of program applicability. The first program, “Rabla” (R) (2005–2020), grantsa subvention for purchasing a new vehicle and eliminating an old and polluting vehiclefrom the road (“scrapping premium”); the second program, “Rabla Plus” (RP) (2016–2020),grants a supplementary subvention for purchasing new mild-hybrid vehicles, plug-inhybrid or battery electric vehicles.
For example, the conditions applied for both programs are presented below, with theyear 2019 for reference. The value of the eco-voucher in the R Program for vehicles olderthan 8 years was EUR 1393, and was granted for the purchase of a new vehicle which gen-
Sustainability 2022, 14, 45 14 of 20
erates a maximum of 120 gCO2/km NEDC (in mixed operation), according to informationentered in the COC (Certificate of Conformity). If the levels of CO2 emissions according tothe WLTP standard are provided in the COC, the eco-voucher can be granted for a newvehicle whose propulsion system generates a maximum of 140 gCO2/km NEDC (in mixedoperation). An eco-bonus can be added to the eco-voucher, under the following conditions:
• When purchasing a new vehicle, equipped with a propulsion system that generatesa maximum emission quantity of 96 gCO2/km NEDC, according to the informationentered in the COC, an eco-bonus of EUR 215 is granted; if the CO2 emissions accordingto the WLTP standard are provided in the COC, for the new vehicle whose propulsionsystem generates a maximum of 105 gCO2/km NEDC (in mixed operation mode), aneco-bonus of EUR 215 is also granted;
• When purchasing a new vehicle equipped with a hybrid propulsion system, an eco-bonus for EUR 360 is granted (as financial aid through the RP program);
• When purchasing a new vehicle equipped with an electric propulsion system, aneco-bonus for EUR 360 is granted (as financial aid through the RP program).
Therefore, if a consumer opts for a vehicle that emits a maximum of 96 (105) gCO2/km,and which is also a conventional hybrid, EUR 1760 will be financed by the governmentfor the total cost of the vehicle. If both conditions are met, the two eco-bonuses can becombined with the eco-voucher, thus reaching a total funding of EUR 2210.
If a consumer opts for a plug-in hybrid vehicle, in addition to previous subsidies, EUR4288 will be financed by the government for the total cost of the vehicle; if a consumer optsfor an electric vehicle, in addition to previous subsidies EUR 9647 will be financed by thegovernment for the total cost of the vehicle.
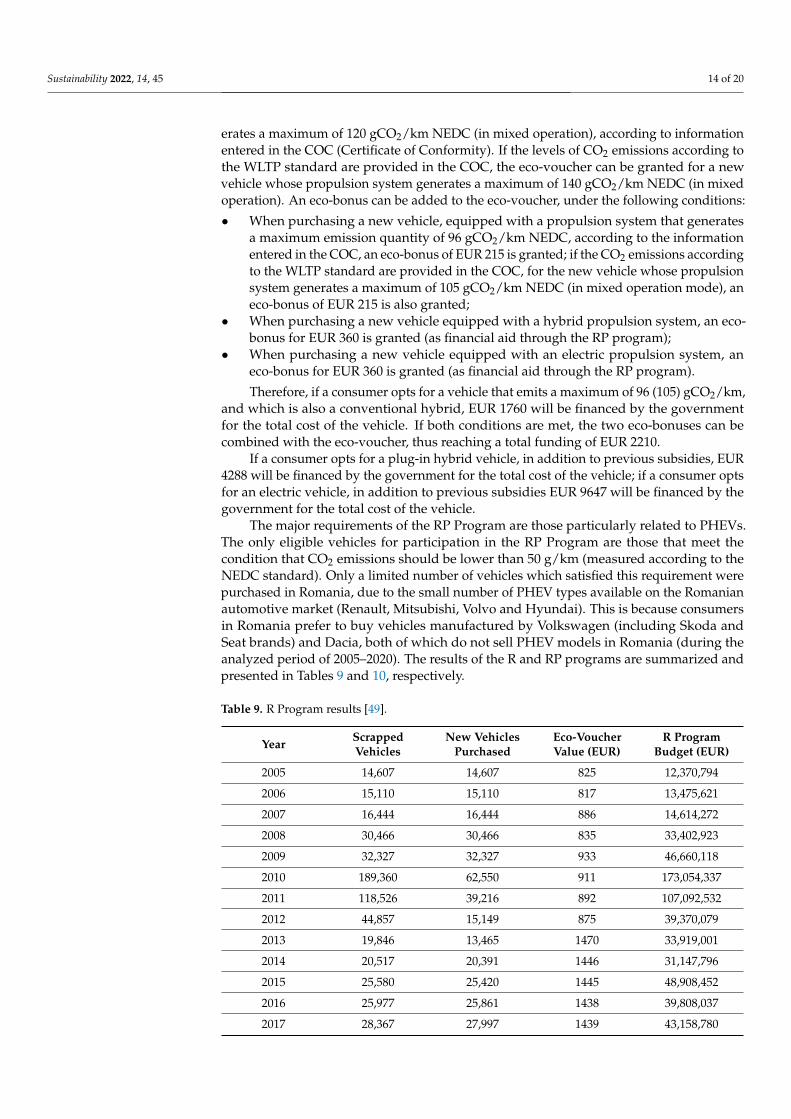
The major requirements of the RP Program are those particularly related to PHEVs.The only eligible vehicles for participation in the RP Program are those that meet thecondition that CO2 emissions should be lower than 50 g/km (measured according to theNEDC standard). Only a limited number of vehicles which satisfied this requirement werepurchased in Romania, due to the small number of PHEV types available on the Romanianautomotive market (Renault, Mitsubishi, Volvo and Hyundai). This is because consumersin Romania prefer to buy vehicles manufactured by Volkswagen (including Skoda andSeat brands) and Dacia, both of which do not sell PHEV models in Romania (during theanalyzed period of 2005–2020). The results of the R and RP programs are summarized andpresented in Tables 9 and 10, respectively.
Table 9. R Program results [49].
Year ScrappedVehicles
New VehiclesPurchased
Eco-VoucherValue (EUR)
R ProgramBudget (EUR)
2005 14,607 14,607 825 12,370,794
2006 15,110 15,110 817 13,475,621
2007 16,444 16,444 886 14,614,272
2008 30,466 30,466 835 33,402,923
2009 32,327 32,327 933 46,660,118
2010 189,360 62,550 911 173,054,337
2011 118,526 39,216 892 107,092,532
2012 44,857 15,149 875 39,370,079
2013 19,846 13,465 1470 33,919,001
2014 20,517 20,391 1446 31,147,796
2015 25,580 25,420 1445 48,908,452
2016 25,977 25,861 1438 39,808,037
2017 28,367 27,997 1439 43,158,780
Sustainability 2022, 14, 45 15 of 20
Table 9. Cont.
Year ScrappedVehicles
New VehiclesPurchased
Eco-VoucherValue (EUR)
R ProgramBudget (EUR)
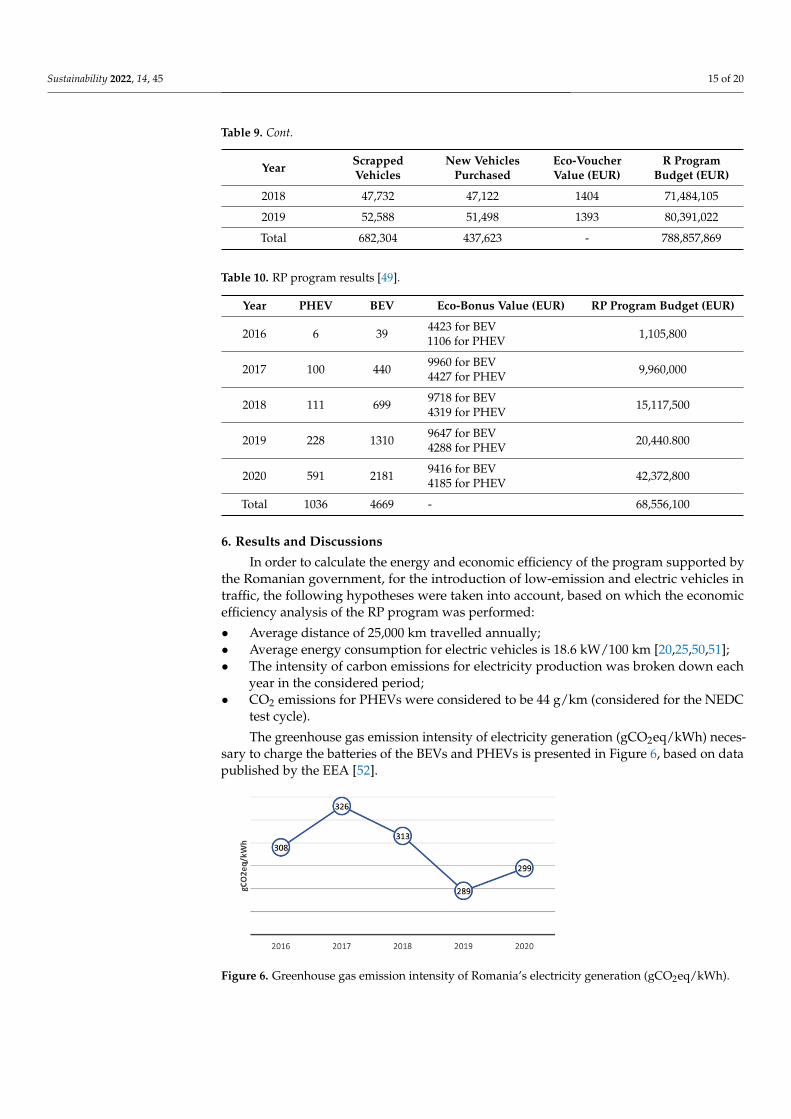
2018 47,732 47,122 1404 71,484,105
2019 52,588 51,498 1393 80,391,022
Total 682,304 437,623 - 788,857,869
Table 10. RP program results [49].
Year PHEV BEV Eco-Bonus Value (EUR) RP Program Budget (EUR)
2016 6 39 4423 for BEV1106 for PHEV 1,105,800
2017 100 440 9960 for BEV4427 for PHEV 9,960,000
2018 111 699 9718 for BEV4319 for PHEV 15,117,500
2019 228 1310 9647 for BEV4288 for PHEV 20,440.800
2020 591 2181 9416 for BEV4185 for PHEV 42,372,800
Total 1036 4669 - 68,556,100
6. Results and Discussions
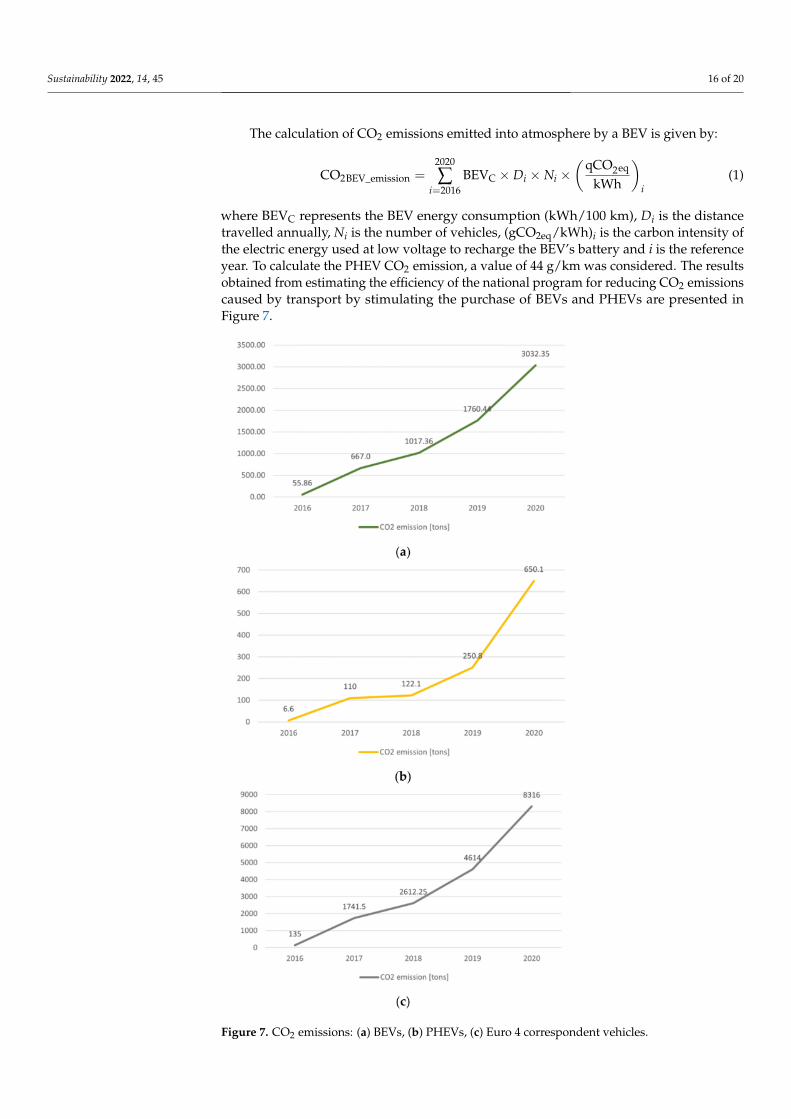
In order to calculate the energy and economic efficiency of the program supported bythe Romanian government, for the introduction of low-emission and electric vehicles intraffic, the following hypotheses were taken into account, based on which the economicefficiency analysis of the RP program was performed:
• Average distance of 25,000 km travelled annually;• Average energy consumption for electric vehicles is 18.6 kW/100 km [20,25,50,51];• The intensity of carbon emissions for electricity production was broken down each
year in the considered period;• CO2 emissions for PHEVs were considered to be 44 g/km (considered for the NEDC
test cycle).
The greenhouse gas emission intensity of electricity generation (gCO2eq/kWh) neces-sary to charge the batteries of the BEVs and PHEVs is presented in Figure 6, based on datapublished by the EEA [52].
Figure 6. Greenhouse gas emission intensity of Romania’s electricity generation (gCO2eq/kWh).
Sustainability 2022, 14, 45 16 of 20
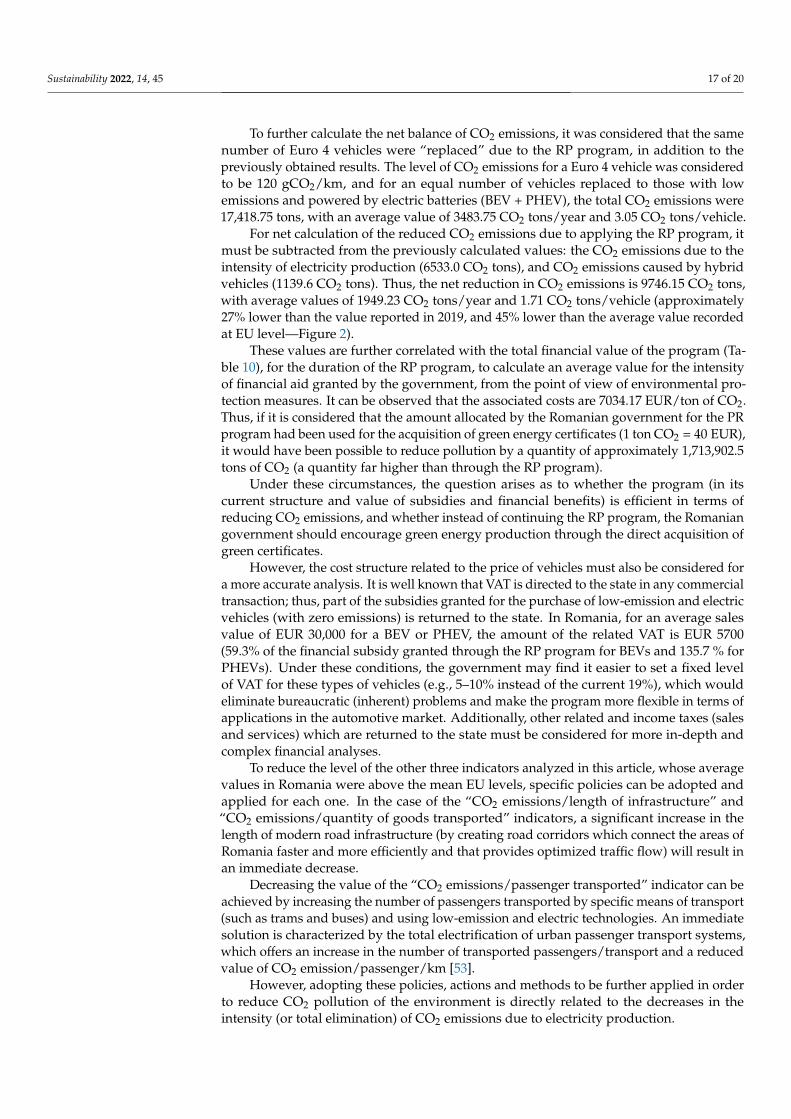
The calculation of CO2 emissions emitted into atmosphere by a BEV is given by:
CO2BEV_emission =2020
∑i=2016
BEVC × Di × Ni ×(
qCO2eq
kWh
)i
(1)
where BEVC represents the BEV energy consumption (kWh/100 km), Di is the distancetravelled annually, Ni is the number of vehicles, (gCO2eq/kWh)i is the carbon intensity ofthe electric energy used at low voltage to recharge the BEV’s battery and i is the referenceyear. To calculate the PHEV CO2 emission, a value of 44 g/km was considered. The resultsobtained from estimating the efficiency of the national program for reducing CO2 emissionscaused by transport by stimulating the purchase of BEVs and PHEVs are presented inFigure 7.
Figure 7. CO2 emissions: (a) BEVs, (b) PHEVs, (c) Euro 4 correspondent vehicles.
Sustainability 2022, 14, 45 17 of 20
To further calculate the net balance of CO2 emissions, it was considered that the samenumber of Euro 4 vehicles were “replaced” due to the RP program, in addition to thepreviously obtained results. The level of CO2 emissions for a Euro 4 vehicle was consideredto be 120 gCO2/km, and for an equal number of vehicles replaced to those with lowemissions and powered by electric batteries (BEV + PHEV), the total CO2 emissions were17,418.75 tons, with an average value of 3483.75 CO2 tons/year and 3.05 CO2 tons/vehicle.
For net calculation of the reduced CO2 emissions due to applying the RP program, itmust be subtracted from the previously calculated values: the CO2 emissions due to theintensity of electricity production (6533.0 CO2 tons), and CO2 emissions caused by hybridvehicles (1139.6 CO2 tons). Thus, the net reduction in CO2 emissions is 9746.15 CO2 tons,with average values of 1949.23 CO2 tons/year and 1.71 CO2 tons/vehicle (approximately27% lower than the value reported in 2019, and 45% lower than the average value recordedat EU level—Figure 2).
These values are further correlated with the total financial value of the program (Ta-ble 10), for the duration of the RP program, to calculate an average value for the intensityof financial aid granted by the government, from the point of view of environmental pro-tection measures. It can be observed that the associated costs are 7034.17 EUR/ton of CO2.Thus, if it is considered that the amount allocated by the Romanian government for the PRprogram had been used for the acquisition of green energy certificates (1 ton CO2 = 40 EUR),it would have been possible to reduce pollution by a quantity of approximately 1,713,902.5tons of CO2 (a quantity far higher than through the RP program).
Under these circumstances, the question arises as to whether the program (in itscurrent structure and value of subsidies and financial benefits) is efficient in terms ofreducing CO2 emissions, and whether instead of continuing the RP program, the Romaniangovernment should encourage green energy production through the direct acquisition ofgreen certificates.
However, the cost structure related to the price of vehicles must also be considered fora more accurate analysis. It is well known that VAT is directed to the state in any commercialtransaction; thus, part of the subsidies granted for the purchase of low-emission and electricvehicles (with zero emissions) is returned to the state. In Romania, for an average salesvalue of EUR 30,000 for a BEV or PHEV, the amount of the related VAT is EUR 5700(59.3% of the financial subsidy granted through the RP program for BEVs and 135.7 % forPHEVs). Under these conditions, the government may find it easier to set a fixed levelof VAT for these types of vehicles (e.g., 5–10% instead of the current 19%), which wouldeliminate bureaucratic (inherent) problems and make the program more flexible in terms ofapplications in the automotive market. Additionally, other related and income taxes (salesand services) which are returned to the state must be considered for more in-depth andcomplex financial analyses.
To reduce the level of the other three indicators analyzed in this article, whose averagevalues in Romania were above the mean EU levels, specific policies can be adopted andapplied for each one. In the case of the “CO2 emissions/length of infrastructure” and“CO2 emissions/quantity of goods transported” indicators, a significant increase in thelength of modern road infrastructure (by creating road corridors which connect the areas ofRomania faster and more efficiently and that provides optimized traffic flow) will result inan immediate decrease.
Decreasing the value of the “CO2 emissions/passenger transported” indicator can beachieved by increasing the number of passengers transported by specific means of transport(such as trams and buses) and using low-emission and electric technologies. An immediatesolution is characterized by the total electrification of urban passenger transport systems,which offers an increase in the number of transported passengers/transport and a reducedvalue of CO2 emission/passenger/km [53].
However, adopting these policies, actions and methods to be further applied in orderto reduce CO2 pollution of the environment is directly related to the decreases in theintensity (or total elimination) of CO2 emissions due to electricity production.
Sustainability 2022, 14, 45 18 of 20
It should be noted that this study has limitations related primarily to the initialassumptions considered (number of average kilometers traveled annually by a vehicle,estimation of the exchange rate of the Romanian currency, the volatile price of greencertificates on the market and the average energy consumption of an electric vehicle), all ofwhich directly affect the calculated levels of CO2 emissions. All these hypotheses are subjectto immediate changes, because they are directly and indirectly related to the technologicaladvancement of electric vehicles, the general economic situation, the existence of a roadinfrastructure that allows for greater mobility with greater efficiency, etc.
7. Conclusions
Reducing pollutant emissions, particularly CO2 emissions, is no longer on some na-tional political agendas, although it is a global necessity and urgency today. The transportsphere, as one of the most polluting economic sectors, must immediately identify andimplement available measures and technologies to reduce and/or eliminate the pollut-ing emissions. At European level, there are significant differences between countries interms of transportation energy efficiency, which are highlighted in this article by analyz-ing specific indicators such as CO2 emissions vs. the length of road infrastructure, thenumber of registered vehicles, the number of passengers transported, and quantity ofgoods transported.
One measure related to increasing the energy efficiency of transportation (in terms ofreducing environmental pollution) is the introduction of low-emission (PHEV) and electric(BEV) vehicles onto the market, which leads to reductions in CO2 emissions produced bytraffic. At present, there are measures in place at the European level and in each memberstate to encourage the purchase of such vehicles through purchase subsidies, ownershipbenefits, infrastructure support and local incentives.
Romania, as a member of the EU, applies two programs (R and RP) at governmentlevel, designed to eliminate old and polluting vehicles from the road and to encourage thepurchase of low-emission and electric vehicles. Analysis of the efficiency of the RP programshowed that during 5 years of application (2016–2020), a net reduction of 9746.15 tons ofCO2 emissions (with an average value of 1949.23 CO2 tons/year and 1.71 CO2 tons/vehicle)was achieved when increasing the number of low-emission and electric vehicles in circulation.
The results obtained are modest but directly related to the low market penetrationrate by the type of vehicles considered in this study (5.5% for Romania in 2020). Thedynamics of increasing customers’ acquisition of these types of vehicles, maintaining anddeveloping support programs, increased involvement of local authorities, and the existenceof a nationally produced electric vehicle model (i.e., the Dacia Spring), can lead to a marketshare of 25–30% in the next 2–4 years.
There are some alternatives to the analyzed program, in terms of efficiency in reducingCO2 emissions in Romanian transportation sector (e.g., the direct acquisition of greencertificates by Romanian government and the encouragement of green energy production).However, it should not neglect the fact that, mainly, electric vehicles are used in largeurban agglomerations and their use provides the benefit of zero local emissions, whichimproves citizens’ quality of life and health (things that must be considered and promotedcontinuously through various programs by any government and local authority).
Author Contributions: Conceptualization, I.C.S. and F.M.; methodology, I.C.S. and F.M.; validation,I.C.S. and F.M.; formal analysis, F.M.; investigation, I.C.S.; writing—original draft preparation, F.M.;writing—review and editing, I.C.S. and F.M. All authors have read and agreed to the publishedversion of the manuscript.
Funding: This research received no external funding.
Institutional Review Board Statement: Not applicable.
Informed Consent Statement: Not applicable.
Conflicts of Interest: The authors declare no conflict of interest.
Sustainability 2022, 14, 45 19 of 20
References1. Kramarz, M.; Dohn, K.; Przybylska, E.; Knop, L. Scenarios for the Development of Multimodal Transport in the TRITIA
Cross-Border Area. Sustainability 2020, 12, 7021. [CrossRef]2. Zefreh, M.M.; Torok, A. Theoretical Comparison of the Effects of Different Traffic Conditions on Urban Road Environmental
External Costs. Sustainability 2021, 13, 3541. [CrossRef]3. Zhang, X.; Li, Z.; Wang, F.; Song, M.; Zhou, X.; Ming, J. Carbonaceous Aerosols in PM1, PM2.5, and PM10 Size Fractions over the
Lanzhou City, Northwest China. Atmosphere 2020, 11, 1368. [CrossRef]4. Cartenì, A.; Henke, I.; Molitierno, C.; Di Francesco, L. Strong Sustainability in Public Transport Policies: An e-Mobility Bus Fleet
Application in Sorrento Peninsula (Italy). Sustainability 2020, 12, 7033. [CrossRef]5. Barbarossa, L. The Post Pandemic City: Challenges and Opportunities for a Non-Motorized Urban Environment. An Overview
of Italian Cases. Sustainability 2020, 12, 7172. [CrossRef]6. Williams, R.; Pettinen, R.; Ziman, P.; Kar, K.; Dauphin, R. Fuel Effects on Regulated and Unregulated Emissions from Two
Commercial Euro V and Euro VI Road Transport Vehicles. Sustainability 2021, 13, 7985. [CrossRef]7. Winkler, S.L.; Anderson, J.E.; Garza, L.; Ruona, W.C.; Vogt, R.; Wallington, T.J. Vehicle criteria pollutant (PM, NOx, CO, HCs)
emissions: How low should we go? Clim. Atmos. Sci. 2018, 1, 26–30. [CrossRef]8. Sharma, A.; Massey, D.D.; Taneja, A. A study of horizontal distribution pattern of particulate and gaseous pollutants based on
ambient monitoring near a busy highway. Urban Clim. 2018, 24, 643–656. [CrossRef]9. International Energy Agency (IEA), Tracking Transport 2020. Available online: https://www.iea.org/reports/tracking-transport-
2020 (accessed on 10 December 2020).10. Brand, C. Beyond ‘Dieselgate’: Implications of unaccounted and future air pollutant emissions and energy use for cars in the
United Kingdom. Energy Policy 2016, 97, 1–12. [CrossRef]11. Kozina, A.; Radica, G.; Nižetic, S. Analysis of methods towards reduction of harmful pollutants from diesel engines. J. Clean.
Prod. 2020, 262, 121105. [CrossRef]12. Trusz, A.; Ghazal, H.; Piekarska, K. Seasonal variability of chemical composition and mutagenic effect of organic PM2.5 pollutants
collected in the urban area of Wrocław (Poland). Sci. Total Environ. 2020, 733, 138911. [CrossRef] [PubMed]13. Varga, B.; Iclodean, C.; Mariasiu, F. Electric and Hybrid Buses for Urban Transport-Energy Efficiency Strategies; Springer: Basel,
Switzerland, 2016; pp. 85–103.14. Konecný, V.; Gnap, J.; Settey, T.; Petro, F.; Skrúcaný, T.; Figlus, T. Environmental Sustainability of the Vehicle Fleet Change in
Public City Transport of Selected City in Central Europe. Energies 2020, 13, 3869. [CrossRef]15. Pöllänen, M.; Liljamo, T.; Kallionpää, E.; Liimatainen, H. Is There Progress towards Environmental Sustainability among Road
Haulage Companies? Sustainability 2021, 13, 5845. [CrossRef]16. García-Olivares, A.; Solé, J.; Samsó, R.; Ballabrera-Poy, J. Sustainable European Transport System in a 100% Renewable Economy.
Sustainability 2020, 12, 5091. [CrossRef]17. Grosso, M.; Marques dos Santos, F.L.; Gikoumas, K.; Stepniak, M.; Pekár, F. The Role of Research and Innovation in Europe for
the Decarbonisation of Waterborne Transport. Sustainability 2021, 13, 10447. [CrossRef]18. European Institute from Romania. Policy in Transportation Domain; European Institute from Romania: Bucharest, Romania, 2005.
Available online: http://ier.gov.ro/wp-content/uploads/publicatii/Transporturi.pdf, (accessed on 23 July 2021). (In Romanian)19. Kii, M. Reductions in CO2 Emissions from Passenger Cars under Demography and Technology Scenarios in Japan by 2050.
Sustainability 2020, 12, 6919. [CrossRef]20. Manzetti, S.; Mariasiu, F. Electric vehicle battery technologies: From present state to future systems. Renew. Sustain. Energy Rev.
2015, 51, 1004–1012. [CrossRef]21. Andwari, A.M.; Pesiridis, A.; Rajoo, S.; Martinez-Botas, R.; Esfahanian, V. A review of Battery Electric Vehicle technology and
readiness levels. Renew. Sustain. Energy Rev. 2017, 78, 414–430. [CrossRef]22. Bonges III, A.H.; Lusk, A.C. Addressing electric vehicle (EV) sales and range anxiety through parking layout, policy and
regulation. Transp. Res. Part A Policy Pract. 2016, 83, 63–73. [CrossRef]23. Günther, M.; Rauh, N.; Krems, J.F. Conducting a study to investigate eco-driving strategies with battery electric vehicles – a
multiple method approach. Transp. Res. Procedia 2017, 25, 2242–2256. [CrossRef]24. Mariasiu, F.; Borzan, A.; Motogna, M.S.; Szabo, I. Performance Analysis of Electric Vehicles Available in the Current Automotive
Market. Ann. Dunarea De Jos Univ. Galati Fascicle IX Metall. Mater. Sci. 2019, 42, 25–30. [CrossRef]25. Un-Noor, F.; Padmanaban, S.; Mihet-Popa, L.; Mollah, M.N.; Hossain, E. A comprehensive study of key electric vehicle (EV)
components, technologies, challenges, impacts, and future direction of development. Energies 2017, 10, 1217. [CrossRef]26. Pašagic Škrinjar, J.; Abramovic, B.; Bukvic, L.; Marušic, Ž. Managing Fuel Consumption and Emissions in the Renewed Fleet of a
Transport Company. Sustainability 2020, 12, 5047. [CrossRef]27. Egbue, O.; Long, S. Barriers to widespread adoption of electric vehicles: An analysis of consumer attitudes and perceptions.
Energy Policy 2012, 48, 717–729. [CrossRef]28. Krause, R.M.; Carley, S.R.; Lane, B.W.; Graham, J.D. Perception and reality: Public knowledge of plug-in electric vehicles in 21 US
cities. Energy Policy 2013, 63, 433–440. [CrossRef]29. Hackbarth, A.; Madlener, R. Willingness-to-pay for alternative fuel vehicle characteristics: A stated choice study for Germany.
Transp. Res. Part A Policy Pract. 2016, 85, 89–111. [CrossRef]
Sustainability 2022, 14, 45 20 of 20
30. Skippon, S.M.; Kinnear, N.; Lloyd, L.; Stannard, J. How experience of use influences mass-market drivers’ willingness to considera battery electric vehicle: A randomised controlled trial. Transp. Res. Part A Policy Pract. 2016, 92, 26–42. [CrossRef]
31. Abbasi, H.A.; Johl, S.K.; Shaari, Z.B.H.; Moughal, W.; Mazhar, M.; Musarat, M.A.; Rafiq, W.; Farooqi, A.S.; Borovkov, A. ConsumerMotivation by Using Unified Theory of Acceptance and Use of Technology towards Electric Vehicles. Sustainability 2021, 13,12177. [CrossRef]
32. Kumar, R.R.; Alok, K. Adoption of electric vehicle: A literature review and prospects for sustainability. J. Clean. Prod. 2020, 253,119911. [CrossRef]
33. Degirmenci, K.; Breitner, M.H. Consumer purchase intentions for electric vehicles: Is green more important than price and range?Transport. Res. Part D Transp. Environ. 2017, 51, 250–260. [CrossRef]
34. Cherchi, E. A stated choice experiment to measure the effect of informational and normative conformity in the preference forelectric vehicles. Transp. Res. Part A 2017, 100, 88–104. [CrossRef]
35. Graham-Rowe, E.; Gardner, B.; Abraham, C.; Skippon, S.; Dittmar, H.; Hutchins, R.; Stannard, J. Mainstream consumers drivingplug-in battery-electric and plug-in hybrid electric cars: A qualitative analysis of responses and evaluations. Transp. Res. Part A2012, 46, 140–153. [CrossRef]
36. Danielis, R.; Rotaris, L.; Giansoldati, M.; Scorrano, M. Drivers’ preferences for electric cars in Italy. Evidence from a country withlimited but growing electric car uptake. Transp. Res. Part A 2020, 137, 79–94. [CrossRef]
37. Knez, M.; Jereb, B.; Obrecht, M. Factors influencing the purchasing decisions of low emission cars: A study of Slovenia. Transport.Res. Part D Transp. Environ. 2014, 30, 53–61. [CrossRef]
38. Rotaris, L.; Giansoldati, M.; Scorrano, M. The slow uptake of electric cars in Italy and Slovenia. Evidence from a stated-preferencesurvey and the role of knowledge and environmental awareness. Transp. Res. Part A 2021, 144, 1–18. [CrossRef]
39. Knez, M.; Obrecht, M. Policies for promotion of electric vehicles and factors influencing consumers’ purchasing decisions of lowemission vehicles. J. Sustain. Dev. Energy Water Environ. Syst. 2017, 5, 151–162. [CrossRef]
40. Moiceanu, G.; Dinca, M.N. Climate Change-Greenhouse Gas Emissions Analysis and Forecast in Romania. Sustainability 2021, 13,12186. [CrossRef]
41. Eurostat, Transport Data. Available online: https://ec.europa.eu/eurostat/web/transport/data (accessed on 19 March 2021).42. Inkinen, T.; Hämäläinen, E. Reviewing Truck Logistics: Solutions for Achieving Low Emission Road Freight Transport.
Sustainability 2020, 12, 6714. [CrossRef]43. He, H.; Wang, C.; Wang, S.; Ma, F.; Sun, Q.; Zhao, X. Does environmental concern promote EV sales? Duopoly pricing analysis
considering consumer heterogeneity. Transp. Res. Part D 2021, 91, 102695. [CrossRef]44. Miceikiene, A.; Geseviciene, K.; Rimkuviene, D. Assessment of the Dependence of GHG Emissions on the Support and Taxes in
the EU Countries. Sustainability 2021, 13, 7650. [CrossRef]45. European Parlament. A European Strategy for Low-Emission Mobility; European Parlament: Brussels, Belgium, 2017. Available
online: https://www.europarl.europa.eu/doceo/document/TA-8-2017-0503_EN.pdf (accessed on 19 March 2021).46. European Comission. A European Strategy for Low-Emission Mobility; European Comission: Brussels, Belgium, 2016. Available
online: https://ec.europa.eu/commission/presscorner/detail/en/MEMO_16_2497 (accessed on 19 March 2021).47. Cansino, J.M.; Sánchez-Braza, A.; Sanz-Díaz, T. Policy Instruments to Promote Electro-Mobility in the EU28: A Comprehensive
Review. Sustainability 2018, 10, 2507. [CrossRef]48. Ogunkunbi, G.A.; Al-Zibaree, H.K.Y.; Meszaros, F. Evidence-Based Market Overview of Incentives and Disincentives in Electric
Mobility as a Key to the Sustainable Future. Future Transp. 2021, 1, 290–302. [CrossRef]49. Romanian Administration of the Environment Fund (AFM), Evolution of Rabla and Rabla Plus Programs. Available online:
https://afm.ro/main/programe/vehicule_electrice/2019/evolutie_rabla_plus_2018-noiembrie_2019.pdf (accessed on 12 March2021). (In Romanian).
50. Moro, A.; Lonza, L. Electricity carbon intensity in European Member States: Impacts on GHG emissions of electric vehicles.Transp. Res. Part D Transp. Environ. 2018, 64, 5–14. [CrossRef] [PubMed]
51. Energy Consumption of Full Electric Vehicles. Available online: https://ev-database.org/cheatsheet/energy-consumption-electric-vehicle (accessed on 19 March 2021).
52. European Environmental Agency (EEA). Greenhouse Gas Emission Intensity of Electricity Generation by Country. Avail-able online: https://www.eea.europa.eu/data-and-maps/daviz/co2-emission-intensity-9/#tab-googlechartid_googlechartid_googlechartid_chart_1111 (accessed on 19 March 2021).
53. Varga, B.O.; Mariasiu, F.; Miclea, C.D.; Szabo, I.; Sirca, A.A.; Vlad, N. Direct and Indirect Environmental Aspects of an ElectricBus Fleet Under Service. Energies 2020, 13, 336. [CrossRef]