Geomathematical characterisation of the mineralization indicators: a case study from Tincova...
7
Studia UBB Geologia, 2011, 56 (2), 17 – 23 *Correspondence: G. Tudor ([email protected]) Geomathematical characterisation of the mineralization indicators: a case study from Tincova magmatic intrusion (Romania) George TUDOR Geological Institute of Romania, 1 Caransebeş Street, Bucharest, 0122171, Romania Received May 2011; accepted August 2011 Available online 15 September 2011 DOI: 10.5038/1937-8602.56.2.2 ABSTRACT. Indicators of the hydrothermal mineralization in the Tincova Laramian intrusion were tested at the contact zone between the intrusive body and the metamorphic host rocks. The mineralization consists of Cu, Pb and Zn sulfides, arsenopyrite, pyrrhotite and pyrite in gangue of quartz, carbonates, feldspar, sericite or clay minerals, and includes areas of hydrothermal alteration or oxidation. Seventy-nine samples were analyzed and processed as two distinct populations. Geomathematical methods highlight the importance of factors such as the shape, sizes of the mineralized zones and geological processes involved in the ore genesis. Trend maps for Cu, Pb + Zn, and Ag interpolated by kriging method, show anomalous values of Cu along the edge of the intrusive body with the metamorphic country rocks, and Pb + Zn in a marginal area. Departing from the study of correlations between different variables, the factor analysis (R-mode) highlights five factors that represent a sequence of geological processes: pneumatolytic phase (Sn), deposition of the association with arsenopyrite, pyrrhotite, pyrite, molybdenite (Ni, Co, Mo), formation of the Cu ± Ag + Bi sulfide mineralization, galena mineralization ± Au, hydrothermal alteration processes (addition of Ba, Sr, V). The dependence of Cu on other elements is performed by multiple linear regression, resulting an equation statistically tested by F-test, and interpreted as originating in a phase of the metallogenetic processes. The shape of the Cu-Mo mineralized stockwork from Vălişor Valley area has been studied on the basis of samples from drillings, Cu trend maps at three depth levels, and a three- dimensional model. Key words: Geomathematics, hydrothermal mineralizations, factor analysis, multiple linear regression, Romania. INTRODUCTION The mineralizations associated with the Laramian magmatism (66 Ma) in the Tincova area represented the research focus of many geologists, such as Giuşcă et al. (1956), Maier et al. (1975), Cioflică et al. (1985). In their studies, they identified two genetic types of mineralizations: pyrometasomatic and hydrothermal. Meanwhile, the mineralization was intercepted at several levels (at the surface, in adits, and in drill holes), showing the presence of Fe and Cu-Pb-Zn minera-lization in skarns (with superpositions of hydrothermal processes), as well as vein-type and stockwork Cu-Mo mineralizations. The surface indicators of mineralizations (studied by author) belong only to the skarn and stockwork types. However, the continuation of the research proved the presence of features indicating new vein-type hydrothermal mineralizations, formed on the faults that mark the contact of Tincova magmatic intrusion with the metamorphic schists. The superficial weathering prevented the study of the new hydrothermal mineralizations, therefore, besides the study of the mineralization, hydrothermal alteration, and weathering zones, the geomathematical methods were applied to the geochemical data obtained from the assaying and analysis of the mineralization indicators. This brought new information regarding the hydrothermal processes. The data analysis proceeded by examining the correlation between the main chemical elements using specific geomathematical methods. GEOLOGICAL SETTING The Laramian magmatic unit from Tincova is represented by a granodioritic intrusive body and a suite of porphyritic granodiorites, andesites, dacites, rhyodacites, and lamprophyres dykes. The intrusive body occurs in a fractured zone located at the intersection of a fault system having the orientation NE-SW with a system of N-S oriented faults. The ramified eastern termination of the intrusive body is caused by the reactivation of E-W oriented reverse faults, during the magmatic stage of the intrusion. The country rocks consist of metamorphic schists of the Ghelar and Sebeş-Lotru Groups. To the west, the intrusive body is transgressively covered by Neogene sedimentary rocks. Interpolating the surface and borehole data, a three- dimensional model of the intrusive body was obtained (Fig. 1), revealing the presence of two important apophyses, situated in the Bârnele Mari and Tincova-Vălişor Valley areas.
-
Upload
independent -
Category
Documents
-
view
2 -
download
0
Transcript of Geomathematical characterisation of the mineralization indicators: a case study from Tincova...

Studia UBB Geologia, 2011, 56 (2), 17 – 23
*Correspondence: G. Tudor ([email protected])
Geomathematical characterisation of the mineralization indicators: a case study from Tincova magmatic intrusion (Romania) George TUDOR Geological Institute of Romania, 1 Caransebeş Street, Bucharest, 0122171, Romania Received May 2011; accepted August 2011 Available online 15 September 2011 DOI: 10.5038/1937-8602.56.2.2
ABSTRACT. Indicators of the hydrothermal mineralization in the Tincova Laramian intrusion were tested at the contact zone between the intrusive body and the metamorphic host rocks. The mineralization consists of Cu, Pb and Zn sulfides, arsenopyrite, pyrrhotite and pyrite in gangue of quartz, carbonates, feldspar, sericite or clay minerals, and includes areas of hydrothermal alteration or oxidation. Seventy-nine samples were analyzed and processed as two distinct populations. Geomathematical methods highlight the importance of factors such as the shape, sizes of the mineralized zones and geological processes involved in the ore genesis. Trend maps for Cu, Pb + Zn, and Ag interpolated by kriging method, show anomalous values of Cu along the edge of the intrusive body with the metamorphic country rocks, and Pb + Zn in a marginal area. Departing from the study of correlations between different variables, the factor analysis (R-mode) highlights five factors that represent a sequence of geological processes: pneumatolytic phase (Sn), deposition of the association with arsenopyrite, pyrrhotite, pyrite, molybdenite (Ni, Co, Mo), formation of the Cu ± Ag + Bi sulfide mineralization, galena mineralization ± Au, hydrothermal alteration processes (addition of Ba, Sr, V). The dependence of Cu on other elements is performed by multiple linear regression, resulting an equation statistically tested by F-test, and interpreted as originating in a phase of the metallogenetic processes. The shape of the Cu-Mo mineralized stockwork from Vălişor Valley area has been studied on the basis of samples from drillings, Cu trend maps at three depth levels, and a three-dimensional model.
Key words: Geomathematics, hydrothermal mineralizations, factor analysis, multiple linear regression, Romania.
INTRODUCTION
The mineralizations associated with the Laramian magmatism (66 Ma) in the Tincova area represented the research focus of many geologists, such as Giuşcă et al. (1956), Maier et al. (1975), Cioflică et al. (1985). In their studies, they identified two genetic types of mineralizations: pyrometasomatic and hydrothermal. Meanwhile, the mineralization was intercepted at several levels (at the surface, in adits, and in drill holes), showing the presence of Fe and Cu-Pb-Zn minera-lization in skarns (with superpositions of hydrothermal processes), as well as vein-type and stockwork Cu-Mo mineralizations.
The surface indicators of mineralizations (studied by author) belong only to the skarn and stockwork types. However, the continuation of the research proved the presence of features indicating new vein-type hydrothermal mineralizations, formed on the faults that mark the contact of Tincova magmatic intrusion with the metamorphic schists.
The superficial weathering prevented the study of the new hydrothermal mineralizations, therefore, besides the study of the mineralization, hydrothermal alteration, and weathering zones, the geomathematical methods were applied to the geochemical data obtained from the assaying and analysis of the mineralization indicators. This brought
new information regarding the hydrothermal processes. The data analysis proceeded by examining the correlation between the main chemical elements using specific geomathematical methods.
GEOLOGICAL SETTING
The Laramian magmatic unit from Tincova is represented by a granodioritic intrusive body and a suite of porphyritic granodiorites, andesites, dacites, rhyodacites, and lamprophyres dykes. The intrusive body occurs in a fractured zone located at the intersection of a fault system having the orientation NE-SW with a system of N-S oriented faults. The ramified eastern termination of the intrusive body is caused by the reactivation of E-W oriented reverse faults, during the magmatic stage of the intrusion. The country rocks consist of metamorphic schists of the Ghelar and Sebeş-Lotru Groups. To the west, the intrusive body is transgressively covered by Neogene sedimentary rocks.
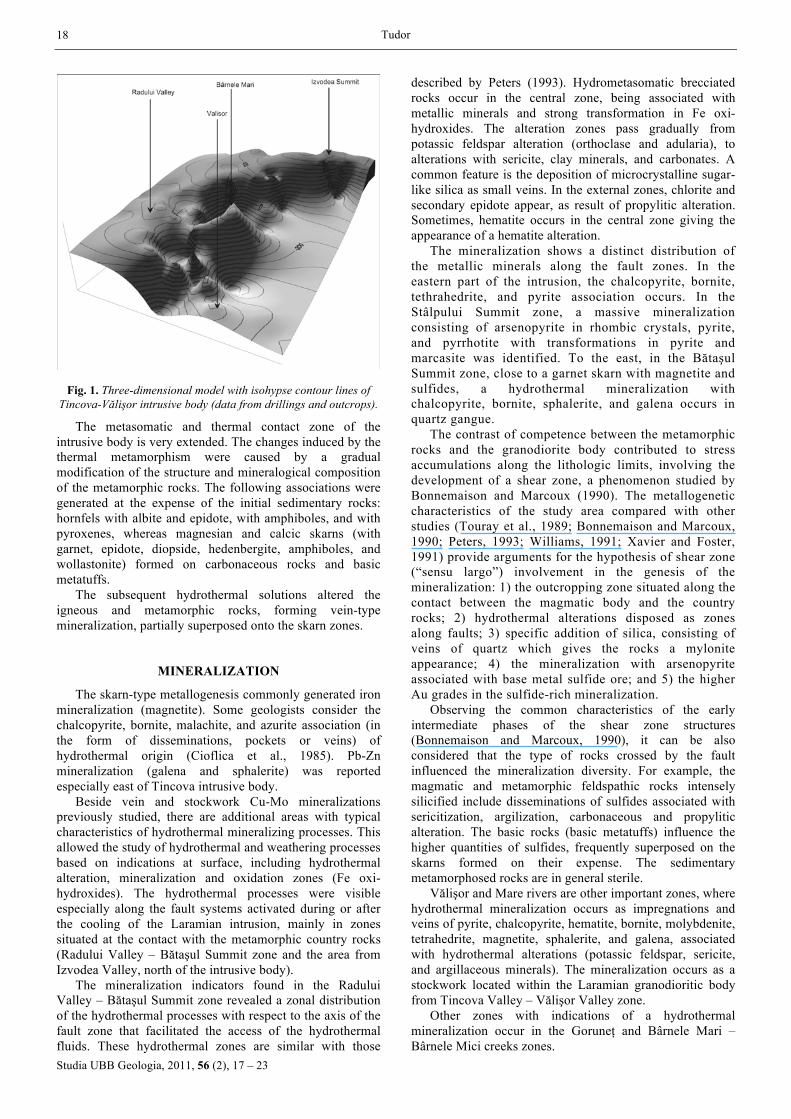
Interpolating the surface and borehole data, a three-dimensional model of the intrusive body was obtained (Fig. 1), revealing the presence of two important apophyses, situated in the Bârnele Mari and Tincova-Vălişor Valley areas.
Tudor
Studia UBB Geologia, 2011, 56 (2), 17 – 23
18
Fig. 1. Three-dimensional model with isohypse contour lines of Tincova-Vălişor intrusive body (data from drillings and outcrops).
The metasomatic and thermal contact zone of the intrusive body is very extended. The changes induced by the thermal metamorphism were caused by a gradual modification of the structure and mineralogical composition of the metamorphic rocks. The following associations were generated at the expense of the initial sedimentary rocks: hornfels with albite and epidote, with amphiboles, and with pyroxenes, whereas magnesian and calcic skarns (with garnet, epidote, diopside, hedenbergite, amphiboles, and wollastonite) formed on carbonaceous rocks and basic metatuffs.
The subsequent hydrothermal solutions altered the igneous and metamorphic rocks, forming vein-type mineralization, partially superposed onto the skarn zones.
MINERALIZATION
The skarn-type metallogenesis commonly generated iron mineralization (magnetite). Some geologists consider the chalcopyrite, bornite, malachite, and azurite association (in the form of disseminations, pockets or veins) of hydrothermal origin (Cioflica et al., 1985). Pb-Zn mineralization (galena and sphalerite) was reported especially east of Tincova intrusive body.
Beside vein and stockwork Cu-Mo mineralizations previously studied, there are additional areas with typical characteristics of hydrothermal mineralizing processes. This allowed the study of hydrothermal and weathering processes based on indications at surface, including hydrothermal alteration, mineralization and oxidation zones (Fe oxi-hydroxides). The hydrothermal processes were visible especially along the fault systems activated during or after the cooling of the Laramian intrusion, mainly in zones situated at the contact with the metamorphic country rocks (Radului Valley – Bătaşul Summit zone and the area from Izvodea Valley, north of the intrusive body).
The mineralization indicators found in the Radului Valley – Bătaşul Summit zone revealed a zonal distribution of the hydrothermal processes with respect to the axis of the fault zone that facilitated the access of the hydrothermal fluids. These hydrothermal zones are similar with those
described by Peters (1993). Hydrometasomatic brecciated rocks occur in the central zone, being associated with metallic minerals and strong transformation in Fe oxi-hydroxides. The alteration zones pass gradually from potassic feldspar alteration (orthoclase and adularia), to alterations with sericite, clay minerals, and carbonates. A common feature is the deposition of microcrystalline sugar-like silica as small veins. In the external zones, chlorite and secondary epidote appear, as result of propylitic alteration. Sometimes, hematite occurs in the central zone giving the appearance of a hematite alteration.
The mineralization shows a distinct distribution of the metallic minerals along the fault zones. In the eastern part of the intrusion, the chalcopyrite, bornite, tethrahedrite, and pyrite association occurs. In the Stâlpului Summit zone, a massive mineralization consisting of arsenopyrite in rhombic crystals, pyrite, and pyrrhotite with transformations in pyrite and marcasite was identified. To the east, in the Bătaşul Summit zone, close to a garnet skarn with magnetite and sulfides, a hydrothermal mineralization with chalcopyrite, bornite, sphalerite, and galena occurs in quartz gangue.
The contrast of competence between the metamorphic rocks and the granodiorite body contributed to stress accumulations along the lithologic limits, involving the development of a shear zone, a phenomenon studied by Bonnemaison and Marcoux (1990). The metallogenetic characteristics of the study area compared with other studies (Touray et al., 1989; Bonnemaison and Marcoux, 1990; Peters, 1993; Williams, 1991; Xavier and Foster, 1991) provide arguments for the hypothesis of shear zone (“sensu largo”) involvement in the genesis of the mineralization: 1) the outcropping zone situated along the contact between the magmatic body and the country rocks; 2) hydrothermal alterations disposed as zones along faults; 3) specific addition of silica, consisting of veins of quartz which gives the rocks a mylonite appearance; 4) the mineralization with arsenopyrite associated with base metal sulfide ore; and 5) the higher Au grades in the sulfide-rich mineralization.
Observing the common characteristics of the early intermediate phases of the shear zone structures (Bonnemaison and Marcoux, 1990), it can be also considered that the type of rocks crossed by the fault influenced the mineralization diversity. For example, the magmatic and metamorphic feldspathic rocks intensely silicified include disseminations of sulfides associated with sericitization, argilization, carbonaceous and propylitic alteration. The basic rocks (basic metatuffs) influence the higher quantities of sulfides, frequently superposed on the skarns formed on their expense. The sedimentary metamorphosed rocks are in general sterile.
Vălişor and Mare rivers are other important zones, where hydrothermal mineralization occurs as impregnations and veins of pyrite, chalcopyrite, hematite, bornite, molybdenite, tetrahedrite, magnetite, sphalerite, and galena, associated with hydrothermal alterations (potassic feldspar, sericite, and argillaceous minerals). The mineralization occurs as a stockwork located within the Laramian granodioritic body from Tincova Valley – Vălişor Valley zone.
Other zones with indications of a hydrothermal mineralization occur in the Goruneţ and Bârnele Mari – Bârnele Mici creeks zones.
Geomathematical studies on the mineralization from Tincova, Romania
Studia UBB Geologia, 2011, 56 (2), 17 – 23
19
STATISTICAL CHARACTERISTICS OF DATA
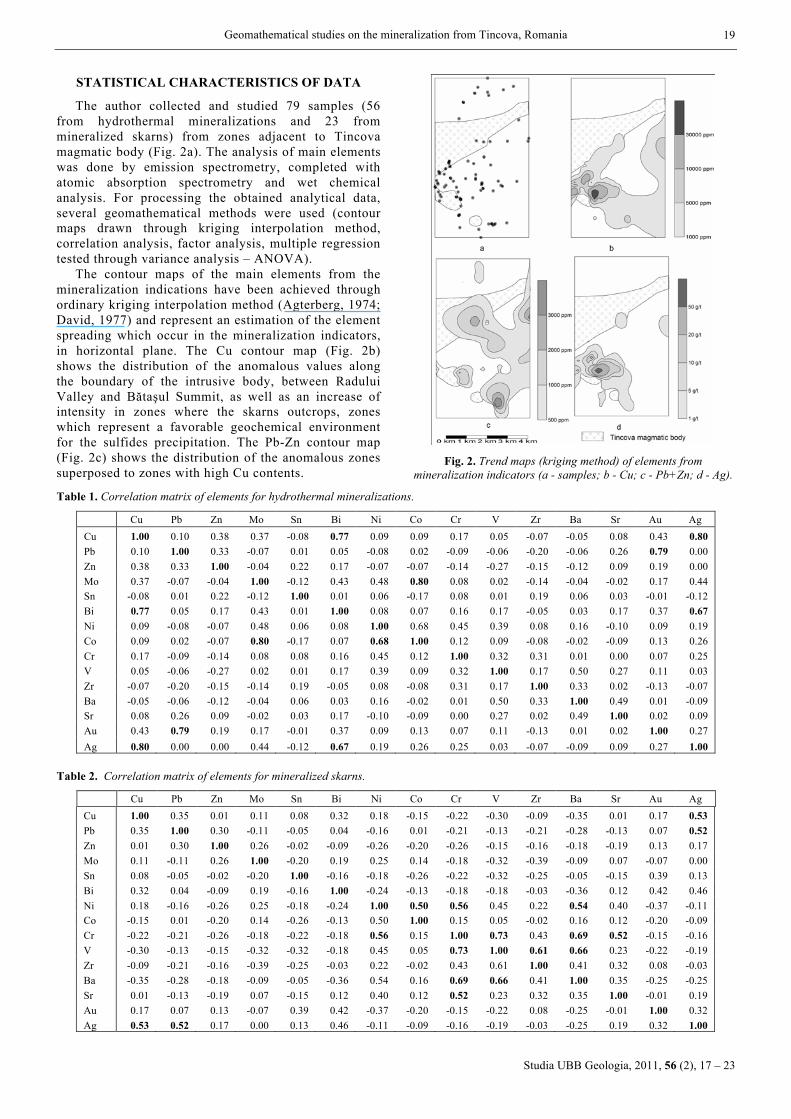
The author collected and studied 79 samples (56 from hydrothermal mineralizations and 23 from mineralized skarns) from zones adjacent to Tincova magmatic body (Fig. 2a). The analysis of main elements was done by emission spectrometry, completed with atomic absorption spectrometry and wet chemical analysis. For processing the obtained analytical data, several geomathematical methods were used (contour maps drawn through kriging interpolation method, correlation analysis, factor analysis, multiple regression tested through variance analysis – ANOVA).
The contour maps of the main elements from the mineralization indications have been achieved through ordinary kriging interpolation method (Agterberg, 1974; David, 1977) and represent an estimation of the element spreading which occur in the mineralization indicators, in horizontal plane. The Cu contour map (Fig. 2b) shows the distribution of the anomalous values along the boundary of the intrusive body, between Radului Valley and Bătaşul Summit, as well as an increase of intensity in zones where the skarns outcrops, zones which represent a favorable geochemical environment for the sulfides precipitation. The Pb-Zn contour map (Fig. 2c) shows the distribution of the anomalous zones superposed to zones with high Cu contents.
Fig. 2. Trend maps (kriging method) of elements from
mineralization indicators (a - samples; b - Cu; c - Pb+Zn; d - Ag).
Table 1. Correlation matrix of elements for hydrothermal mineralizations.
Cu Pb Zn Mo Sn Bi Ni Co Cr V Zr Ba Sr Au Ag Cu 1.00 0.10 0.38 0.37 -0.08 0.77 0.09 0.09 0.17 0.05 -0.07 -0.05 0.08 0.43 0.80 Pb 0.10 1.00 0.33 -0.07 0.01 0.05 -0.08 0.02 -0.09 -0.06 -0.20 -0.06 0.26 0.79 0.00 Zn 0.38 0.33 1.00 -0.04 0.22 0.17 -0.07 -0.07 -0.14 -0.27 -0.15 -0.12 0.09 0.19 0.00 Mo 0.37 -0.07 -0.04 1.00 -0.12 0.43 0.48 0.80 0.08 0.02 -0.14 -0.04 -0.02 0.17 0.44 Sn -0.08 0.01 0.22 -0.12 1.00 0.01 0.06 -0.17 0.08 0.01 0.19 0.06 0.03 -0.01 -0.12 Bi 0.77 0.05 0.17 0.43 0.01 1.00 0.08 0.07 0.16 0.17 -0.05 0.03 0.17 0.37 0.67 Ni 0.09 -0.08 -0.07 0.48 0.06 0.08 1.00 0.68 0.45 0.39 0.08 0.16 -0.10 0.09 0.19 Co 0.09 0.02 -0.07 0.80 -0.17 0.07 0.68 1.00 0.12 0.09 -0.08 -0.02 -0.09 0.13 0.26 Cr 0.17 -0.09 -0.14 0.08 0.08 0.16 0.45 0.12 1.00 0.32 0.31 0.01 0.00 0.07 0.25 V 0.05 -0.06 -0.27 0.02 0.01 0.17 0.39 0.09 0.32 1.00 0.17 0.50 0.27 0.11 0.03 Zr -0.07 -0.20 -0.15 -0.14 0.19 -0.05 0.08 -0.08 0.31 0.17 1.00 0.33 0.02 -0.13 -0.07 Ba -0.05 -0.06 -0.12 -0.04 0.06 0.03 0.16 -0.02 0.01 0.50 0.33 1.00 0.49 0.01 -0.09 Sr 0.08 0.26 0.09 -0.02 0.03 0.17 -0.10 -0.09 0.00 0.27 0.02 0.49 1.00 0.02 0.09 Au 0.43 0.79 0.19 0.17 -0.01 0.37 0.09 0.13 0.07 0.11 -0.13 0.01 0.02 1.00 0.27 Ag 0.80 0.00 0.00 0.44 -0.12 0.67 0.19 0.26 0.25 0.03 -0.07 -0.09 0.09 0.27 1.00
Table 2. Correlation matrix of elements for mineralized skarns.
Cu Pb Zn Mo Sn Bi Ni Co Cr V Zr Ba Sr Au Ag Cu 1.00 0.35 0.01 0.11 0.08 0.32 0.18 -0.15 -0.22 -0.30 -0.09 -0.35 0.01 0.17 0.53 Pb 0.35 1.00 0.30 -0.11 -0.05 0.04 -0.16 0.01 -0.21 -0.13 -0.21 -0.28 -0.13 0.07 0.52 Zn 0.01 0.30 1.00 0.26 -0.02 -0.09 -0.26 -0.20 -0.26 -0.15 -0.16 -0.18 -0.19 0.13 0.17 Mo 0.11 -0.11 0.26 1.00 -0.20 0.19 0.25 0.14 -0.18 -0.32 -0.39 -0.09 0.07 -0.07 0.00 Sn 0.08 -0.05 -0.02 -0.20 1.00 -0.16 -0.18 -0.26 -0.22 -0.32 -0.25 -0.05 -0.15 0.39 0.13 Bi 0.32 0.04 -0.09 0.19 -0.16 1.00 -0.24 -0.13 -0.18 -0.18 -0.03 -0.36 0.12 0.42 0.46 Ni 0.18 -0.16 -0.26 0.25 -0.18 -0.24 1.00 0.50 0.56 0.45 0.22 0.54 0.40 -0.37 -0.11 Co -0.15 0.01 -0.20 0.14 -0.26 -0.13 0.50 1.00 0.15 0.05 -0.02 0.16 0.12 -0.20 -0.09 Cr -0.22 -0.21 -0.26 -0.18 -0.22 -0.18 0.56 0.15 1.00 0.73 0.43 0.69 0.52 -0.15 -0.16 V -0.30 -0.13 -0.15 -0.32 -0.32 -0.18 0.45 0.05 0.73 1.00 0.61 0.66 0.23 -0.22 -0.19 Zr -0.09 -0.21 -0.16 -0.39 -0.25 -0.03 0.22 -0.02 0.43 0.61 1.00 0.41 0.32 0.08 -0.03 Ba -0.35 -0.28 -0.18 -0.09 -0.05 -0.36 0.54 0.16 0.69 0.66 0.41 1.00 0.35 -0.25 -0.25 Sr 0.01 -0.13 -0.19 0.07 -0.15 0.12 0.40 0.12 0.52 0.23 0.32 0.35 1.00 -0.01 0.19 Au 0.17 0.07 0.13 -0.07 0.39 0.42 -0.37 -0.20 -0.15 -0.22 0.08 -0.25 -0.01 1.00 0.32 Ag 0.53 0.52 0.17 0.00 0.13 0.46 -0.11 -0.09 -0.16 -0.19 -0.03 -0.25 0.19 0.32 1.00
Tudor
Studia UBB Geologia, 2011, 56 (2), 17 – 23
20
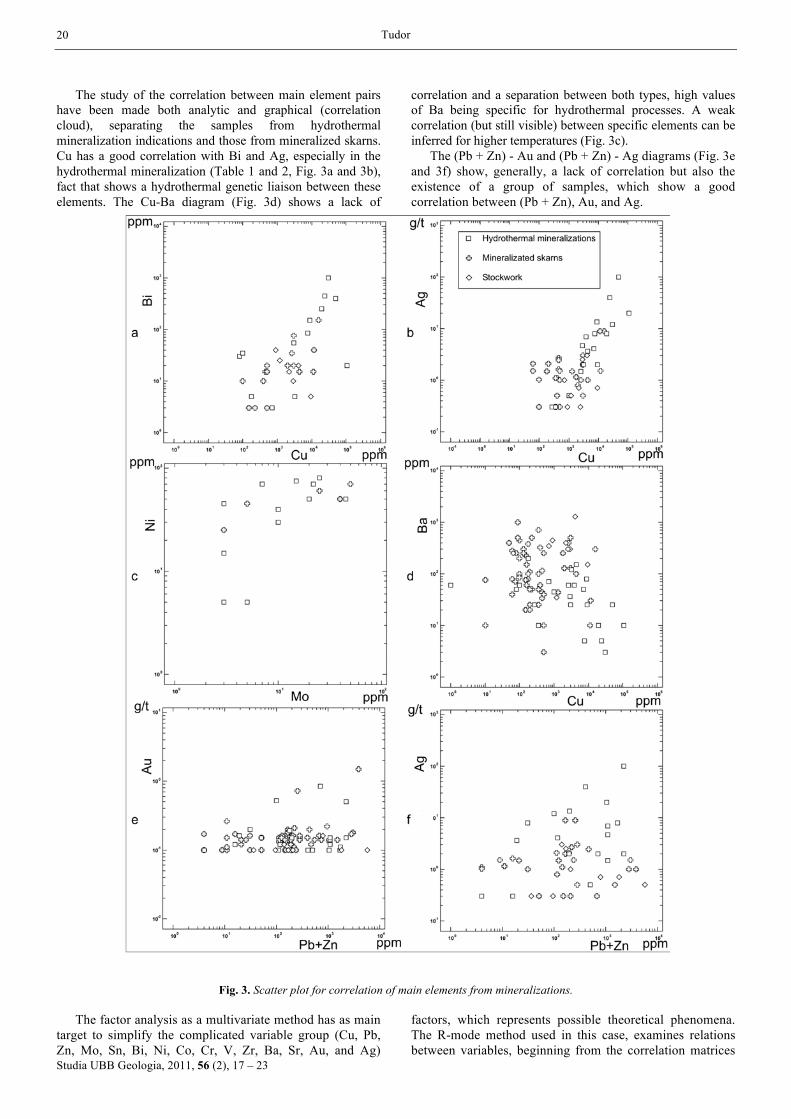
The study of the correlation between main element pairs
have been made both analytic and graphical (correlation cloud), separating the samples from hydrothermal mineralization indications and those from mineralized skarns. Cu has a good correlation with Bi and Ag, especially in the hydrothermal mineralization (Table 1 and 2, Fig. 3a and 3b), fact that shows a hydrothermal genetic liaison between these elements. The Cu-Ba diagram (Fig. 3d) shows a lack of
correlation and a separation between both types, high values of Ba being specific for hydrothermal processes. A weak correlation (but still visible) between specific elements can be inferred for higher temperatures (Fig. 3c).
The (Pb + Zn) - Au and (Pb + Zn) - Ag diagrams (Fig. 3e and 3f) show, generally, a lack of correlation but also the existence of a group of samples, which show a good correlation between (Pb + Zn), Au, and Ag.
Fig. 3. Scatter plot for correlation of main elements from mineralizations.
The factor analysis as a multivariate method has as main
target to simplify the complicated variable group (Cu, Pb, Zn, Mo, Sn, Bi, Ni, Co, Cr, V, Zr, Ba, Sr, Au, and Ag)
factors, which represents possible theoretical phenomena. The R-mode method used in this case, examines relations between variables, beginning from the correlation matrices
Geomathematical studies on the mineralization from Tincova, Romania
Studia UBB Geologia, 2011, 56 (2), 17 – 23
21
of elements (Table 1 and 2). Factor analysis assumes every variable a linear relation between factors, like: xi = aj1f1+aj2f2+...+aimfm (1)
where fi are the factors and aji shows the importance of fi, which is the common factor of each variable. The square sum of the coefficients represents the communality (Table 3a and 3b), which represents how much totals the choice factor from variable variance.
Table 3. Factor matrices (R-mode) for hydrothermal mineralizations (a, left) and skarns (b, right).
F1 F2 F3 F4 F5 Com. F1 F2 F3 F4 F5 Com. Cu 0.93 0.04 -0.04 0.21 0.04 90.89 Cu -0.18 0.77 0.10 0.10 0.06 64.52 Pb -0.06 0.00 0.09 0.93 -0.13 89.04 Pb -0.04 0.48 0.00 0.76 0.04 81.77 Zn 0.19 -0.21 -0.27 0.56 0.12 49.07 Zn -0.20 0.02 -0.12 0.59 -0.13 42.42 Mo 0.41 0.75 -0.06 -0.02 -0.21 77.42 Mo -0.53 0.08 0.47 -0.17 -0.38 67.89 Sn -0.09 -0.16 -0.09 0.21 0.66 52.12 Sn -0.22 0.14 -0.25 -0.20 0.86 91.49 Bi 0.88 0.05 0.11 0.12 0.03 81.16 Bi -0.17 0.55 -0.34 -0.33 -0.54 84.33 Ni 0.02 0.84 0.13 0.00 0.33 83.27 Ni 0.37 0.11 0.84 -0.20 0.05 89.03 Co 0.05 0.92 -0.03 0.03 -0.15 87.49 Co 0.00 -0.04 0.65 -0.06 -0.11 43.72 Cr 0.21 0.32 0.10 -0.11 0.64 58.22 Cr 0.78 -0.07 0.32 -0.23 -0.01 76.85 V 0.05 0.25 0.72 -0.07 0.24 65.25 V 0.87 -0.22 0.12 0.03 -0.12 83.93 Zr -0.05 -0.07 0.26 -0.24 0.63 53.26 Zr 0.78 0.00 -0.19 -0.13 -0.18 69.83 Ba -0.06 -0.02 0.85 -0.05 0.11 73.42 Ba 0.68 -0.26 0.37 -0.18 0.18 72.61 Sr 0.14 -0.21 0.72 0.19 -0.14 63.57 Sr 0.44 0.34 0.29 -0.40 -0.14 57.70 Au 0.27 0.18 0.10 0.81 -0.01 76.50 Au -0.07 0.44 -0.58 -0.26 0.12 61.11 Ag 0.88 0.21 -0.01 -0.02 -0.04 81.64 Ag 0.00 0.86 -0.12 0.21 -0.01 80.10 Var. 18.50 16.56 13.17 13.65 10.28 Var. 21.44 15.52 15.08 10.24 8.96 Cum. 18.50 35.06 48.23 61.88 72.16 Cum. 21.44 36.96 52.04 62.28 71.24
For calculation of factor analysis matrix we used the
principal component method, through Jacobi algorithm (eigenvectors characterized by eigenvalues). The geometrical vision is showed by the original orthogonal coordinate system (n-dimensional) where the axes are the factors and the variable are vectors in a space with the same number of dimensions equal with the number of factors. The eigenvectors values are normalized (in comparison to unit) for a selection of the main factor close to 1. For the ease of interpretation the factors were successively rotated using “Kaiser's varimax” method, so that the variable vectors have projections on axes to values close to 1 and -1 (Saager and Esslaar, 1969; Agterberg, 1974; Dawson and Sinclair, 1974).
The calculus has been done separately on 56 samples from hydrothermal mineralizations and 23 samples from mineralized skarns. The target was to separate possible phenomena associated with hydrothermal processes showed by mineralization indications, removing the influences during metasomatic and thermal metamorphism. The results from Table 3a and 3b show the selection of five factors, which accounts for 72.16% and 71.74% respectively, from total variance of variables.
For hydrothermal mineralizations, the selected factors can be explained as follows: − factor 1, specifically for Cu, Ag, and Bi, represents the mineralization formed from chalcopyrite, bornite, tetrahedrite, and possible Bi sulfosalts; − factor 2 may document the influence of high temperature solutions of the Mo, Ni, and Co grade specifically to minerals from arsenopyrite and pyrite group; − factor 3 represents the variation of the lithophile elements, revealed by the overlap of feldspar hydrothermal alterations over the magmatic rocks with feldspars; this interpretation was done on the basis of influence of Ba, Sr, and V; − factor 4 directly shows the affinity of Pb with Au, as a metallogenetic process spatially overlapped on the previous one as indicated by factors 1 and 2; − factor 5, through the influence of Sn, it can reveal the existence of a pneumatolytic process.
One can remark that the factor interpretation as specific geological phenomena, which influence the variance of the main analyzed elements, could explain the genetic succession of processes showed by indications: pneumatolytic phase, hydrothermal solutions of high temperatures with the precipitation of pyrite and arsenopyrite, the precipitation of the mineralization with Cu sulfides and Bi sulfosalts in a later phase, the presence of the feldspar alteration, and the precipitation of Pb ± Au mineralization in the final phase (Table 3b). The interpretation of factors for the skarn samples document the presence of the same group of elements that shows the overlap of hydrothermal phenomena over the skarns occurring in this region.
To compare the dependence of frequently seen elements in mineralization indications (for example Cu) with other analyzed elements, the multiple regression as a multivariate method was used. The general regression model has the form: y = a0 + a1x1 + … + a14x14 (2) where xi represents independent variables and ai coefficients represent the influence of independent variables in the increase of the dependent variable y and have been calculated through analysis of variances (ANOVA) and showed in Table 4a and 4b (separately for hydrothermal mineralization and mineralized skarns). Introducing the variables one by one and testing every time with the F-test, the final regression equation have been derived. Practically, it compares calculated values of F (the ratio of regression variance against variance of regression deviation (residuals), with the tabled values for 90% confidence interval and m and n-m-1 degrees of freedom (n = number of samples, m = number of variables). If the calculated value is greater than the tabled value, the calculus confirms a good statistic significance of the regression equation (Ciucu and Craiu, 1971; Agterberg 1974). Therefore, as the regression equation and the multiple correlation coefficient (R) illustrates, Cu is dependent on Ag, Zn, and Bi; clearly
Tudor
Studia UBB Geologia, 2011, 56 (2), 17 – 23
22
suggesting that the mineral associations in which Cu precipitated also comprise elements like Bi, Ag, and Zn (the last one with weak influence). For mineralized
skarns, the element that influences Cu is Ag, indicating a dependence on the host rock type in the process of formation of metallic minerals.
Table 4. ANOVA for the regression model – Cu from hydrothermal mineralizations (a, upper table) and mineralized skarns (b, lower table).
Source Sum of squares Degrees of freedom Mean squares F
Regression 416,314,035.78 3 138,771,345.26 91.51 Residual 78,855,457.07 52 1,516,451.09
Total 495,169,492.85
R=0.92 Ftab=2.20 Cu = -584.00 + 994.36Ag + 2.08Zn + 41.42Bi
Source Sum of squares Degrees of freedom Mean squares F
Regression 3,512,365,725.23 1 3,512,365,725.23 8.11 Residual 9,093,619,512.47 21 433,029,500.58
Total 12,605,985,237.47
R=0.53 Ftab=2.96 Cu = -6602.84 + 984.51Ag
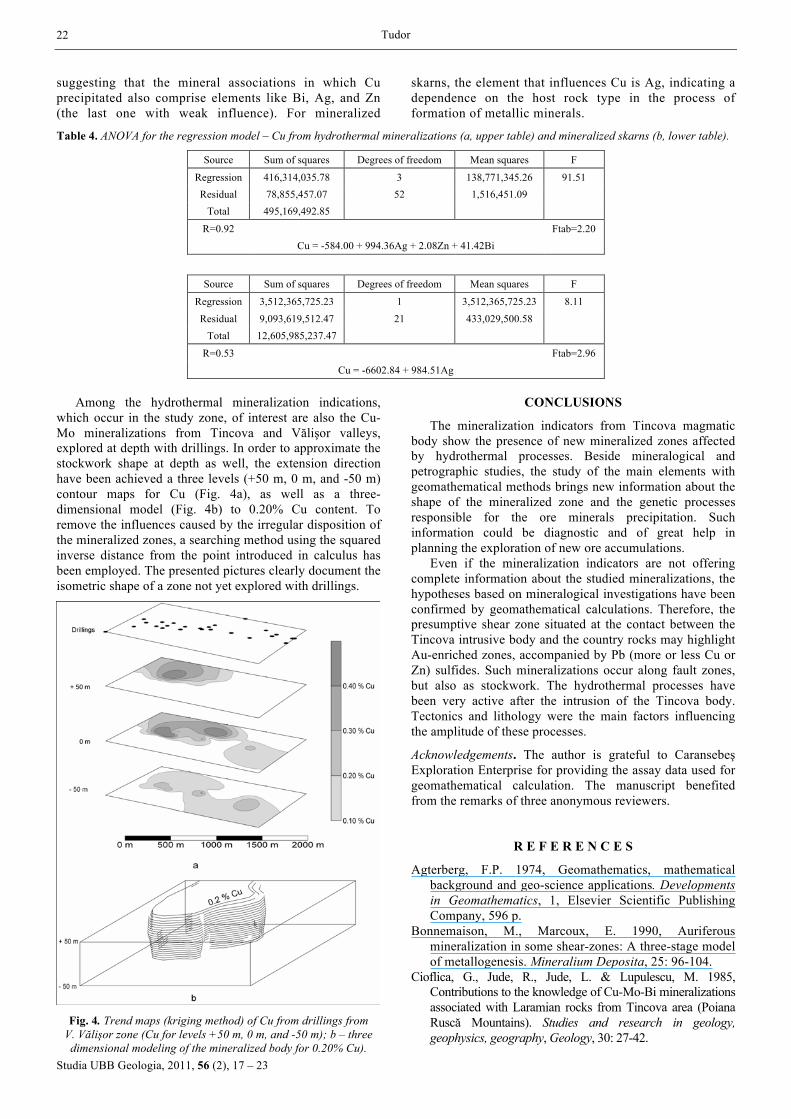
Among the hydrothermal mineralization indications,
which occur in the study zone, of interest are also the Cu-Mo mineralizations from Tincova and Vălişor valleys, explored at depth with drillings. In order to approximate the stockwork shape at depth as well, the extension direction have been achieved a three levels (+50 m, 0 m, and -50 m) contour maps for Cu (Fig. 4a), as well as a three-dimensional model (Fig. 4b) to 0.20% Cu content. To remove the influences caused by the irregular disposition of the mineralized zones, a searching method using the squared inverse distance from the point introduced in calculus has been employed. The presented pictures clearly document the isometric shape of a zone not yet explored with drillings.
Fig. 4. Trend maps (kriging method) of Cu from drillings from
V. Vălişor zone (Cu for levels +50 m, 0 m, and -50 m); b – three dimensional modeling of the mineralized body for 0.20% Cu).
CONCLUSIONS
The mineralization indicators from Tincova magmatic body show the presence of new mineralized zones affected by hydrothermal processes. Beside mineralogical and petrographic studies, the study of the main elements with geomathematical methods brings new information about the shape of the mineralized zone and the genetic processes responsible for the ore minerals precipitation. Such information could be diagnostic and of great help in planning the exploration of new ore accumulations.
Even if the mineralization indicators are not offering complete information about the studied mineralizations, the hypotheses based on mineralogical investigations have been confirmed by geomathematical calculations. Therefore, the presumptive shear zone situated at the contact between the Tincova intrusive body and the country rocks may highlight Au-enriched zones, accompanied by Pb (more or less Cu or Zn) sulfides. Such mineralizations occur along fault zones, but also as stockwork. The hydrothermal processes have been very active after the intrusion of the Tincova body. Tectonics and lithology were the main factors influencing the amplitude of these processes.
Acknowledgements. The author is grateful to Caransebeş Exploration Enterprise for providing the assay data used for geomathematical calculation. The manuscript benefited from the remarks of three anonymous reviewers.
R E F E R E N C E S
Agterberg, F.P. 1974, Geomathematics, mathematical background and geo-science applications. Developments in Geomathematics, 1, Elsevier Scientific Publishing Company, 596 p.
Bonnemaison, M., Marcoux, E. 1990, Auriferous mineralization in some shear-zones: A three-stage model of metallogenesis. Mineralium Deposita, 25: 96-104.
Cioflica, G., Jude, R., Jude, L. & Lupulescu, M. 1985, Contributions to the knowledge of Cu-Mo-Bi mineralizations associated with Laramian rocks from Tincova area (Poiana Ruscă Mountains). Studies and research in geology, geophysics, geography, Geology, 30: 27-42.
Geomathematical studies on the mineralization from Tincova, Romania
Studia UBB Geologia, 2011, 56 (2), 17 – 23
23
Ciucu, G., Craiu, V. 1971, Introduction in the probability theory and statistics. Ed. Didactică şi Pedagogică, Bucureşti, 374 p (in Romanian).
David, M. 1977, Geostatistical ore reserve estimation. Developments in Geomathematics, 2, Elsevier Scientific Publishing Company, Amsterdam, 364 p.
Dawson, K.M., Sinclair, A.J. 1974, Factor analysis of minor element data for pyrites, Endako Molybdenum Mine, British Columbia, Canada. Economic Geology, 69: 404-411.
Giuşcă, D., Biloiu, M., Rădulescu, D., Ştiopol, V. & Dimitrescu, R. 1956, Petrographical study of the SW Poiana Ruscă Mountains. Dări de Seamă ale Comitetului Geologic, XL: 98-111 (in Romanian).
Maier, O., Solomon, I., Zimmermann, P. & Zimmermann, V. 1975, Geological and petrographical study of metamorphic rocks from the southern part Poiana Ruscă Mountains (in Romanian). Anuarul Institutului de Geologie şi Geofizică, XLIII: 65-189.
Peters, S. 1993, Formation if oreshoots in mesothermal gold-quartz vein deposits: examples from Queensland, Australia. Ore Geology Reviews, 8: 277-301.
Saager, R., Esselaar, P.A. 1969, Factor analysis of geochemical data from the Basal Reef, Orange Free State Goldfield, South Africa. Economic Geology, 64: 445-451.
Touray, J.C., Marcoux, E., Hubert, P. & Proust, D. 1989, Hydrothermal Processes and Ore-Forming Fluids in the Le Bourneix Gold Deposit, Central France. Economic Geology, 84: 1328-1339.
Williams, P.S. 1991, Geology, alteration and mesothermal Au- Ag- mineralization associated with a volcanic intrusive complex at Mt. Shamrock-Mt. Ophir, SE Queensland. Mineralium Deposita, 26: 11-17.
Xavier, R.P., Foster, R.P. 1991, The role of carbonaceous shear bands in fluid-flow and gold precipitation in the Fazenda Maria Preta mine, Bahia, north-east Brazil. In Proceedings of Brazil Gold ’91: the Economics, Geology, Geochemistry and Genesis of Gold Deposits (Ladeira, E.A., Ed.): 269-277, Balkema, Rotterdam.