Investigating Groundwater Condition and Seawater Intrusion ...

M ost current intrusion detection system(IDS) products detect network intrusions
and record them into log files. To understand these sys-tems’ performance and limitations and to identify issuesto address, we’ve studied several of the IDS productsdeployed on open and large-scale computer networks.
Some IDSs send an email to network administratorsfor each incident (intrusion records). In large-scale net-works, this can mean that the number of emails is enor-mous. Moreover, it’s difficult for administrators tounderstand the relevancy and statistics of aggregate
incidents when they only receivealerts for individual incidents.
Most recent attacks consist of com-plicated incident combinations. Intel-ligent, intuitive, and real-time solu-tions can help us better understandthis complicated behavior. Also,because databases for storing IDSlogs often grow huge, their usabilitycan be problematic. Solutions thathelp users query can reduce queryoperations. GUIs of current IDS prod-ucts visualize information superfi-cially—such as visualizing the timesequence of numbers of incidents inthe entire domain as simple bar orpolygonal charts.
Other recent research of IDSsstudy intrusion analysis and secure network manage-ment.1,2 We present a new technique for visualizing thecontent of huge IDS log files. This visualization tech-nique aims to make the available statistics from IDS sys-tems understandable and to offer an interactive way ofexploring detailed information. Our technique differsfrom other techniques in that we try to maximize thedensity of the information on display. We represent com-puters as small clickable icons, letting the user interfacepresent detail on demand. By representing the distrib-ution of incidents in IP address spaces, the techniquealso reveals the distribution’s relevance to organization-al structure. Experimental results demonstrate the tech-nique’s ability to visualize enormous numbers of realincidents.
Hierarchical data visualizationOur technique applies a hierarchical data visualiza-
tion technique3,4 (illustrated in Figure 1) that representsleaf nodes as black square icons and branch nodes asrectangular borders enclosing the icons. The techniqueplaces thousands of leaf nodes into one display spacewhile satisfying the following conditions:
■ It never overlaps the leaf and branch nodes in a singlehierarchy of other nodes.
■ It attempts to minimize the display area requirement.■ It draws all leaf nodes using equally shaped and sized
icons.
This representation style visualizes thousands of hier-archical data leaf nodes equally in one display space. We applied the technique to bioactive chemical visual-ization4 and job distribution in parallel-computing environments.5
Rectangle-packing algorithmOur technique first packs icons and then encloses
them in rectangular borders. Similarly, it packs a set ofrectangles belonging to leaf nodes in higher levels of thehierarchy and generates the larger rectangles enclosingthem. Repeating the process from the lowest level to thehighest, the technique places all of the data onto the lay-out area. The packing algorithm for icons and rectan-gles is our visualization technique’s key technology. Thisalgorithm is an improved version4 of a previous rectan-gle-packing algorithm proposed for hierarchical datavisualization.3 Both algorithms place icons and rectan-gles one by one onto display spaces while choosing theirpositions from multiple candidates.
As Figure 2 shows, the improved rectangle-packingalgorithm4 applies a grid-like subdivision of a displayarea by extending the edges of previously placed rec-tangles. The algorithm quickly generates multiple can-didate positions for the rectangle currently beingplaced by referring to the grid-like subdivision. It gen-erates at most four candidates at the corner of emptysubspaces in the grid-like space where the current rec-tangle can be placed without yielding any unneces-sary gaps with previously placed rectangles. The
Visualization for Cybersecurity
A technique for visualizing
intrusion-detection system
log files using hierarchical
data based on IP addresses
represents the number of
incidents for thousands of
computers in one display
space.
Takayuki ItohOchanomizu University
Hiroki Takakura, Atsushi Sawada, and Koji Koyamada Kyoto University
HierarchicalVisualization ofNetwork IntrusionDetection Data
40 March/April 2006 Published by the IEEE Computer Society 0272-1716/06/$20.00 © 2006 IEEE

algorithm then decides the rectangle’s posi-tion while it avoids overlapping the rectan-gle with previously placed rectangles, andattempts to minimize the entire grid-likespace’s area and aspect ratio. If no adequatecandidate position for placing the rectangleexists, the algorithm generates several can-didate positions outside the grid-like spaceand selects one candidate in which to placethe rectangle.
Visualization in the IP address spaceWe group computers according to their IP
addresses to form hierarchical data⎯initial-ly by the first byte of their IP addresses, thenby the second byte, and finally by the thirdbyte. Consequently, the technique forms four-level hierarchical data, as Figure 3a shows. Itvisualizes the computer network’s structureby representing the hierarchical data as in Fig-ure 3b, where black icons represent comput-ers and rectangular borders represent groupsof computers.
By visualizing large-scale hierarchical data contain-ing thousands of leaf nodes without overlapping, ourtechnique can represent thousands of computers asclickable icons in one display space. The technique istherefore useful as a GUI for directly exploring detailedinformation about incidents of arbitrary computers inlarge-scale computer networks. In addition, by visual-izing a computer hierarchy using the computers’ IPaddresses, our technique can briefly represent the cor-relation between incidents and groups of computers ina real-world organization because IP addresses are oftenassigned according to an organization’s structure.
ImplementationOur technique consumes the log files of a commercial
IDS (Cisco Secure IDS 4320). The system detects inci-dents based on signatures that predefine typical mali-cious access patterns. The technique inputs several itemsfrom the log file description (see Figure 4, next page):
■ IP address of the computer sending incidents,■ IP address of the computer receiving incidents,■ date and time,■ positive integer ID (signature ID) denot-
ing the specific signature, and■ security level (1, 2, 3, 4, or 5).
Visualization procedureAfter consuming the log files (see Fig-
ure 4a), our technique visualizes the inci-dents in a specified processing order.
Relational-database-like structure.Using the log files, the technique forms arelational-database-like structure, as Fig-ure 4b shows. It constructs tables for time,signature IDs, security levels, senders’ IP addresses, and receivers’ IP addresses.The data structure accelerates incidentaggregation.
IEEE Computer Graphics and Applications 41
1 Example ofhierarchicaldata visualiza-tion using arectangle-packing algo-rithm.
= Candidate position
(a)
(b)
(c)
2 Improvedrectangle-packing algo-rithm: (a)previouslyplaced rectan-gles and grid-like subdivisionof a displayspace, (b) can-didate positionsfor placing thecurrent rectan-gle, and (c)placement ofthe currentrectangle andupdate of thegrid-like subdi-vision.
1.2.3.4
1.2.3.5
1.2.4.6
1.2.4.5
1.3.3.4
2.3.5.7
2.3.5.5
3.5.6.8
1.*.*.*
2.*.*.* 3.*.*.*
1.2.*.*
1.3.*.*
1.2.3.* 1.2.4.*
(b)(a)
3 (a) Hierarchyof computersaccording totheir IP address-es. (b) Illustra-tion ofvisualizationresults of thehierarchicaldata.

Construction of hierarchical data. Simultaneous-ly, the technique lists the IP addresses of senders andreceivers and forms hierarchical data by referring to IPaddresses byte by byte, as Figure 4c shows. The systemregisters all of the computers described in the log file inthe hierarchical data.
Aggregation of incidents for each computer. Thetechnique then counts the total number of sending andreceiving incidents for each computer. It specifies con-ditions (such as signature IDs, security levels, and timeranges) to filter nonimportant incidents. If an adminis-trator specifies a signature ID, the technique counts theID, referring to the signature ID table. Similarly, it refersto the time or security-level tables if the administratorspecifies a time range or security level.
Representation. The technique then visualizes thehierarchical data, representing the number of sending andreceiving incidents for each computer by mapping the
numbers as leaf node heights. As Figure 5 shows,the technique represents the number of sendingand receiving incidents using different colors.
Configuration of high- or low-securityincidents. An IDS doesn’t always adequatelywarn of an incident’s security level because anincident’s impact strongly depends on eachcomputer network’s situation. Our techniqueuses the description of signature IDs and IPaddresses of experienced high- or low-securityincidents, as Figure 4d shows. This capabilitylets administrators configure the visualizationresults according to their preferences. Forexample, an administrator might specify thatincidents with
■ specific signature IDs are always erroneous or ignorable in this network,
■ specific signature IDs have damaged this network in the past, or
■ specific IP addresses of senders have dam-aged this network in the past.
The capability also lets administrators con-figure some computers as high security, suchas those that
■ have sent or received more than a certain number of incidents in a certain time period, or
■ are sending or receiving incidents in drasti-cally higher numbers.
The technique can control the visualization’sdetail level by eliminating or assigning darkcolors to leaf nodes corresponding to low-secu-rity computers. By assigning bright colors toleaf nodes that correspond to computers send-ing or receiving predefined high-security inci-dents, the system can alert administrators ofknown attacks.
GUI capabilityOur approach’s GUI is a Java applet with several
important features.
Dialog window for configuring conditions forcounting incidents. Figure 6a shows a sample dialogwindow for entering conditions for counting inci-dents⎯such as signature IDs, security levels, timeranges, and IP addresses. The technique only countsincidents that satisfy the entered conditions.
The GUI allows more focused visualization. For exam-ple, the administrator might want to visualize the incidentdistribution during a specific time period (say 13:05 to13:10) during which damage to the network occurred. Or,if specific signatures damaged the network, the adminis-trator can request a visualization of the distribution ofthose signatures. If a particular computer is problematic,the administrator can also visualize the distribution of inci-dents related to that computer by specifying its IP address.
Visualization for Cybersecurity
42 March/April 2006
Date Time
Time
ID
ID
Level
Level
Sender
Sender
Receiver
Receiver
(a)
High danger Low danger
ID = 5237Sender = 1.1.1.1
ID = 4335Receiver = 5.6.7.8
2003-05-26 13:00:00 5237 3 1.2.3.4 5.6.7.82003-05-26 13:00:08 4309 3 5.6.7.8 1.2.3.4
(c)
(d)
(b)
4 Proposed visualization technique’s processing order: (a) log file items , (b) relational-database-like structure, (c) hierarchical data, and (d) registration.
Number ofreceived incidents
Number ofsent incidents
5 Visualizingthe number ofincidents as leafnode heights.

Dialog for listing records of typicalattacks. Network administrators canuse previous strong attacks as referencesto help them securely manage their com-puter networks. A GUI dialog windowdisplays a list of such attacks. For exam-ple, the administrator might request anincident list for a computer that sent an enormous number of maliciousattacks between 12:35 and 12:40 on 21 February.
Figure 6b is a sample dialog windowlisting the incidents’ dates and times andthe senders’ IP addresses. When the userselects an attack from the list, the tech-nique visualizes the distribution of cor-responding incidents. If the displayspace allows for a larger dialog window,the GUI presents additional informa-tion⎯such as receivers’ IP addresses andsignature IDs⎯so users can easily spec-ify past attacks.
Dialog window for listing inci-dents for specific computers. Whena user clicks a leaf node, a dialog win-dow pops up with the list of incidentsfor the corresponding computer (seeFigure 6c).
Segments representing pairs ofsenders and receivers. The GUI candisplay segments connecting pairs ofleaf nodes corresponding to sendersand receivers. It displays the segments for a specificcomputer when a user clicks the corresponding leafnode. This capability helps users explore incident prop-agation. For example, a sender might concentrate itsattacks on a small number of receivers or distribute theattacks to many receivers.
HTML-based reportingWe developed a component to generate JPEG-format
image files of visualization results as well as a compo-nent to generate HTML-based reports using the image-generation component. The reporting component’simplementation frequently regenerates image fileswhile counting the incidents, finally generating HTMLfiles as image file indices. By sharing the HTML andimage files, multiple administrators can easily exchangeknowledge of incidents to remotely manage the network.
If they find malicious traffic in the HTML report,administrators can use the Java-based GUI to exploreincident details. Having the Java-based GUI pop up withthe specified time span from the HTML report windowcan prove useful.
Experimental resultsWe implemented our technique with Java 1.4 and
Microsoft Windows XP on an IBM ThinkPad T42 (witha 1.8-GHz CPU and 756 Mbytes of RAM). We developed
the GUI using the Java Swing library and the drawingcomponent using the Java AWT library.
Figures 7 to 9 (starting on the next page) show the visu-alization results of an IDS log file used in a real networkenvironment. In these figures, the number of sent inci-dents is represented in blue and the number of receivedincidents is represented in red. Viewpoints are set at theright sides of the bars and rectangles in all figures.
Figure 7 shows the time sequence of the visualizationresults using a log file recorded in six hours and contain-ing 61,822 lines and 3,984 computers. The implemen-tation took 120 seconds to read the log file, 0.6 secondsto form and visualize the computer hierarchy, and 7.1seconds to recount incidents during GUI operations.
Figure 7a shows several computers that sent incidentsto several other computers. This might mean that thesenders randomly searched for attack targets. Figure 7bshows that a sender found a specific computer on whichto concentrate its attacks. Figure 7c shows that thesender in Figure 7b was disconnected but that severalnew senders attempted to attack several computers. Oneof the new receivers was in a different department fromthe continuously attacked receivers. Figure 7d showsthat some of the senders and receivers in Figure 7c weredisconnected, but that many computers in the samedepartment received incidents in a short time. The inci-dents might be a scan attack (an attack that accessesevery computer in a target group) for that department.
IEEE Computer Graphics and Applications 43
SendersRange of timeDate
Signature
IP address
Security levelRange of time
Date, time, signature ID,security level, sender, and receiver
for a single incident
(a)
(b)(c)
6 GUIs for visualizing IDS data: (a) dialog window for configuring conditions for countingincidents, (b) dialog for listing records of typical attacks, and (c) dialog window for listingincidents for a specific computer.

When a user clicks a leaf node on the display, thetechnique extracts those incidents in which the corre-sponding computer is sender or receiver and representsthe incidents as yellow segments, as Figure 8 illustrates.The segments connect to the same tall red bar in theupper side of the figure from multiple blue bars in smallrectangles in the figure’s center. The example in Figure8 shows that many computers in one department (thegroup of senders circled) sent incidents to the samecomputer.
Figure 9 shows how the technique highlights leafnodes corresponding to the senders or receivers of high-security incidents on a real network. Network adminis-trators disconnected the incident senders or receivers
16 times in two months because of pernicious attacks. Infive of these 16 attacks, the senders’ signature IDs andIP addresses were identical. In another large group ofincidents, the senders’ signature IDs and IP addresseswere identical in three of 16 attacks. Thus, the samekinds of incidents are often repeated for specific attackpurposes. Our technique can help alert administratorsby highlighting leaf nodes that correspond to thesenders or receivers of high-security incidents. The tech-nique can also register previous damages, which userscan select using the dialog in Figure 6c.
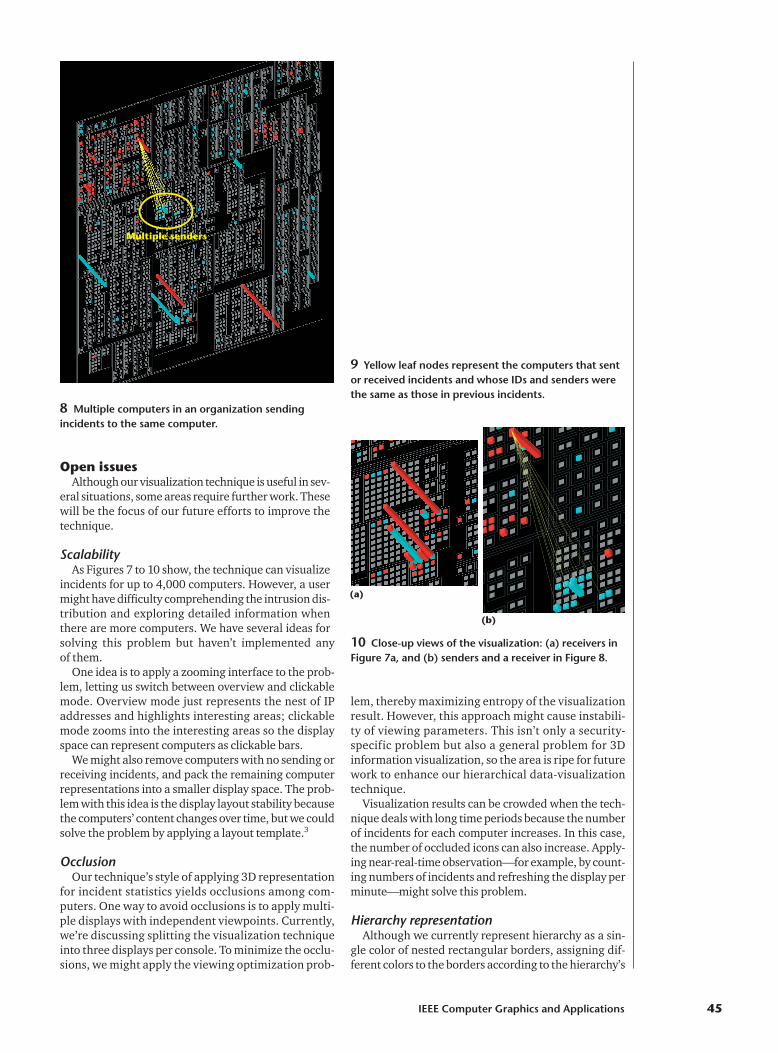
Figure 10 shows close-up views of our visualizationresults, including the receivers in Figure 7a and sendersand a receiver in Figure 8.
Visualization for Cybersecurity
44 March/April 2006
Senders
Receivers
Sender
Receiver
(a) (b)
7 Visualization results. (a) Multiple senders and receivers appear five minutes into the visualization. (b) Five minutes later, a sender starts concentrating its attack on a single receiver. (c) Two hours, five minutes later, thesender has been disconnected, but several other computers have become senders, and several other computersare receiving the attacks. (d) After another two hours, five minutes, the visualization shows many receivers in thesame department.
New sender
New receiver
Newsender
Continuouslyattackedreceiver
Many receiversin the samedepartment
(c) (d)
Open issuesAlthough our visualization technique is useful in sev-
eral situations, some areas require further work. Thesewill be the focus of our future efforts to improve thetechnique.
Scalability As Figures 7 to 10 show, the technique can visualize
incidents for up to 4,000 computers. However, a usermight have difficulty comprehending the intrusion dis-tribution and exploring detailed information whenthere are more computers. We have several ideas forsolving this problem but haven’t implemented any of them.
One idea is to apply a zooming interface to the prob-lem, letting us switch between overview and clickablemode. Overview mode just represents the nest of IPaddresses and highlights interesting areas; clickablemode zooms into the interesting areas so the displayspace can represent computers as clickable bars.
We might also remove computers with no sending orreceiving incidents, and pack the remaining computerrepresentations into a smaller display space. The prob-lem with this idea is the display layout stability becausethe computers’ content changes over time, but we couldsolve the problem by applying a layout template.3
OcclusionOur technique’s style of applying 3D representation
for incident statistics yields occlusions among com-puters. One way to avoid occlusions is to apply multi-ple displays with independent viewpoints. Currently,we’re discussing splitting the visualization techniqueinto three displays per console. To minimize the occlu-sions, we might apply the viewing optimization prob-
lem, thereby maximizing entropy of the visualizationresult. However, this approach might cause instabili-ty of viewing parameters. This isn’t only a security-specific problem but also a general problem for 3Dinformation visualization, so the area is ripe for futurework to enhance our hierarchical data-visualizationtechnique.
Visualization results can be crowded when the tech-nique deals with long time periods because the numberof incidents for each computer increases. In this case,the number of occluded icons can also increase. Apply-ing near-real-time observation⎯for example, by count-ing numbers of incidents and refreshing the display perminute⎯might solve this problem.
Hierarchy representationAlthough we currently represent hierarchy as a sin-
gle color of nested rectangular borders, assigning dif-ferent colors to the borders according to the hierarchy’s
IEEE Computer Graphics and Applications 45
8 Multiple computers in an organization sendingincidents to the same computer.
Multiple senders
9 Yellow leaf nodes represent the computers that sentor received incidents and whose IDs and senders werethe same as those in previous incidents.
10 Close-up views of the visualization: (a) receivers inFigure 7a, and (b) senders and a receiver in Figure 8.
(a)
(b)

depth might be more effective, if understanding the rela-tionship between the distribution of intrusions and theorganization’s hierarchy is critical.
Many-to-many trafficOur technique represents the traffic link only by spec-
ifying a computer, as Figure 8 shows. This doesn’t pro-vide enough information to help us understandmany-to-many traffic. For example, Figure 7a shows anexample of multiple computers sending incidents tomultiple computers. It would be useful if the implemen-tation automatically detects and represents importantlinks. Parameter focusing (see the “Visualization forComputer Network and Intrusion Detection” sidebar)might improve the technique in this way.
ConclusionWe plan to prove the technique’s effectiveness by
observing real network management and users. Futurework will focus on several additional issues.
First, we’ll combine our technique with intelligenttechniques, such as data mining and knowledge man-agement, to effectively discover and alert high-securityincidents.
We’d also like to perform visualizations of incidentstatistics in larger time spans, such as a week or a month.The number of incidents should become less importantas the time span grows, so long-term visualizationsshould produce enhanced incident representations.
Visualizations could also focus on time-varying dis-tribution of incidents. Combining our technique with
Visualization for Cybersecurity
46 March/April 2006
Visualization for Computer Network and Intrusion Detection
Internet and computer network visualization is a vitalresearch area. Some work in this area focuses onrepresenting network connection topology, while otherwork focuses on representing network traffic. In the pastseveral years, a great deal of research has also exploredvisualization for network intrusion detection.
Recent work on the visualization of network intrusion fallsinto four categories:
■ visualization and detail-on-demand user interfaces showing time sequences of network traffic;
■ filtering of error detection or unimportant malicious accesses from visualization results;
■ visual data mining for discovering suspicious traffic pat-terns from general log files; and
■ visualization of traffic distribution on IP-address-orienteddisplay spaces.
Takada and Koike’s MieLog1 technique horizontallydivides a display space. The display space’s left side providesbar charts of incident statistics for a constant time, and theright side provides detailed information about incidentswithin a user-selected time span. The techniquesimultaneously provides global and local views and detail-on-demand operations for incident time sequences.
Incident logs often contain an enormous number of errordetections or ignorable incidents. Koike and Ohno presentan effective visualization technique that indicates only high-danger incidents.2 Axelsson combines a similar visualizationtechnique with a possibility-based filtering system toeliminate errors or ignorable incidents.3
Other research focuses on the visual data mining of non-IDS logs to discover suspicious traffic patterns. Axelssonuses the parallel coordinate technique to visualize themultidimensional data of Web servers’ access log files.4 Thistechnique represents various access attributes in one displayspace and contributes to the analysis of unknown attacks.Yin et al. also used parallel coordinates to discoversuspicious traffic patterns.5 Teoh et al. applied robust visualanalysis technology to discover suspicious traffic fromnetwork log files by combining various visualization
techniques.6 Erbacher et al. used glyph metaphors torepresent network traffic and discover suspicious accesses.7
Still other work visualizes network traffic in IP-addressspaces.8,9 The representation style simply maps values ofeach byte in an IP address onto the horizontal and verticalaxes of display spaces.
References1. T. Takada and H. Koike, “MieLog: A Highly Interactive Visual Log
Browser Using Information Visualization and Statistical Analysis,”Proc. LISA XVI 16th Systems Administration Conf., Usenix Assoc.,2002, pp.133-144.
2. H. Koike and K. Ohno, “SnortView: Visualization System of SnortLogs,” Proc. CCS Workshop Visualization and Data Mining for Com-puter Security (VizSEC/DMSEC 04), ACM Press, 2004, pp. 543-547.
3. S. Axelsson, “Combining a Bayesian Classifier with Visualization:Understanding the IDS,” Proc. CCS Workshop on Visualization andData Mining for Computer Security (VizSEC/DMSEC 04), ACMPress, 2004, pp. 99-108.
4. S. Axelsson, “Visualization for Intrusion Detection: Hooking theWorm,” Proc. European Symp. Research in Computer Security, LNCS2808, Springer-Verlag, 2003, pp. 309-325.
5. X. Yin et al., “VisFlowConnect: Netflow Visualization of Link Rela-tionships for Security Situational Awareness,” Proc. 2004 ACMWorkshop Visualization and Data Mining for Computer Security,ACM Press, 2004, pp. 26-34.
6. S.T. Teoh et al., “Visual Data Analysis for Detecting Flaws andIntruders in Computer Network Systems,” IEEE Computer Graph-ics and Applications, vol. 24, no. 5, 2004, pp. 27-35.
7. R.F. Erbacher, K.L. Walker, and D.A. Fincke, “Intrusion and Mis-use Detection in Large-Scale Systems,” IEEE Computer Graphicsand Applications, vol. 22, no. 1, 2002, pp. 38-48.
8. W. Yurcik et al., “A Prototype Tool for Visual Data Mining of Net-work Traffic for Intrusion Detection,” Proc. ICDM Workshop onData Mining for Computer Security (DMSEC), IEEE CS Press, 2003;http://www.projects.ncassr.org/sift/papers/DMSEC03.pdf.
9. R. Ball, G.A. Fink, and C. North, “Home-Centric Visualization ofNetwork Traffic for Security Administration,” Proc. 2004 ACMWorkshop Visualization and Data Mining for Computer Security,ACM Press, 2004, pp. 55-64.

time-oriented visualization techniques, such as MieLog(see the “Visualization for Computer Network and Intru-sion Detection” sidebar), can effectively visualize thetime-varying distribution of intrusions. Visualizationsof intrusions’ time sequences can also reveal some kindsof trends or attack patterns. ■
AcknowledgmentsWe appreciate the anonymous reviewers’ many fruit-
ful comments on this article.
References1. Y.D. Cai et al., “Maids: Mining Alarming Incidents from
Data Streams,” Proc. Int’l Conf. Management of Data (SIG-MOD), ACM Press, 2004, pp. 919-920.
2. S.J. Stolfo et al., “Data Mining-Based Intrusion Detectors:An Overview of the Columbia IDS,” Project SIGMODRecord, vol. 30, no. 4, 2001, pp. 5-14.
3. T. Itoh et al., “Hierarchical Data Visualization Using a FastRectangle-Packing Algorithm,” IEEE Trans. Visualizationand Computer Graphics, vol. 10, no. 3, 2004, pp. 302-313.
4. T. Itoh and F. Yamashita, “Visualization of Multidimension-al Data of Bioactive Chemicals Using a Hierarchical DataVisualization Technique ‘HeiankyoView’,” to be publishedin Proc. Asia Pacific Symp. Information Visualization(APVIS), Australian Computer Soc., 2006.
5. Y. Yamaguchi and T. Itoh, “Visualization of DistributedProcesses Using ‘Data Jewelry Box’ Algorithm,” Proc. Com-puter Graphics Int’l, IEEE CS Press, 2003, pp. 162-169.
Takayuki Itoh is an associate pro-fessor in the Department of Informa-tion Sciences at Ochanomizu Uni-versity. His research interests includescientific and information visualiza-tion, computer graphics, geometricprocessing, and image processing.Itoh has a PhD in engineering from
Waseda University. He is a member of the IEEE ComputerSociety and the ACM. Contact him at [email protected].
Hiroki Takakura is an associateprofessor in the Academic Center forComputing and Media Studies atKyoto University. His research inter-ests include network security, data-bases, and geographic informationsystems. Takakura has a PhD in engi-neering from Kyoto University. He is a
member of the Information Processing Society, Japan;Geographic Information Systems in Japan; the Institute ofSystems, Control, and Information Engineers; and theACM. Contact him at [email protected].
Atsushi Sawada is an associateprofessor in the Academic Center forComputing and Media Studies atKyoto University. His research inter-ests include software engineering andembedded systems engineering. Sawa-da has a PhD in engineering fromKyoto University. Contact him at
Koji Koyamada is a professor in theCenter for the Promotion of Excellencein Higher Education at Kyoto Univer-sity. His research interests include sci-entific visualization and simulation.Koyamada has a PhD in electronicsengineering from Kyoto University.Contact him at koyamada@kudpc.
kyoto-u.ac.jp.
For further information on this or any other computingtopic, please visit our Digital Library at http://www.computer.org/publications/dlib.
IEEE Computer Graphics and Applications 47
computer.org/e-News
Available for FREE to members.
Be alerted to
• articles and special issues
• conference news
• registration deadlines
Sign Up Today for the IEEE Computer Society’se-News
Sign Up Today for the IEEE Computer Society’se-News
Copyright © 2022 FDOKUMEN