EncCon: an approach to constructing interactive visualization of large hierarchical data
21
EncCon: an approach to constructing interactive visualization of large hierarchical data Quang Vinh Nguyen 1 Mao Lin Huang 1 1 Department of Computer Systems, Faculty of Information Technology, University of Technology, Sydney, Australia Correspondence: Quang Vinh Nguyen, Department of Computer Systems, Faculty of Information Technology, University of Technology, Sydney, P.O. BOX 123 Broadway, NSW 2007, Australia. Tel: þ 61 2 95144519; Fax: þ 61 2 95141807; E-mail: [email protected] Received: 15 August 2004 Revised: 1 December 2004 Accepted: 23 December 2004 Online publication date: 17 March 2005 Abstract This paper describes a new technique called EncCon for visualizing and navigating large hierarchical information. This technique consists of two com- ponents: visualization and navigation. Visualization uses a fast enclosure þ connection method to calculate the geometrical layout for the display of large hierarchies in a two-dimensional space. Our technique uses a rectangular division algorithm for recursively positioning the graph. This visualization aims to maximize the utilization of display space while retaining a good geometrical layout as well as a clear (explicit) presentation of the hierarchical structure of graphs. This paper also presents an experimental evaluation of EncCon’s layout algorithm. Besides the layout algorithm, EncCon uses a new focus þ context viewing technique for the navigation of large hierarchies. We use the zooming þ layering concept to achieve the focus þ context viewing, rather than the traditional enlarge þ embedded concept, which is used by most of the available focus þ context techniques. Technically, it employs semi-transparency to achieve the display of two layers of information in z-coordination at the same visualization. Both context view and detail view are drawn at two separate layers. These layers are then displayed in an overlapped manner at the same physical screen space. Information Visualization (2005) 4, 1–21. doi:10.1057/palgrave.ivs.9500087 Keywords: Information visualization; tree layout; hierarchical visualization; navigation; focus þ context; transparency; interactive visualization Introduction With the rapid growth of information, there is a huge amount of data that have become available for analysis. The size of this data is rapidly increasing each year. The traditional user interfaces provided for informa- tion systems, with the typical working mode of textual display plus scrolling bar that often generate long textual pages of output data for users to read, no longer meet the satisfaction, in terms of human cognitive process, of users, such as Business Managers and System Analysers who are using these systems. It is very time consuming for these users to read through the information line by line through the whole page or several pages to find the particular data items they need. Furthermore, it is even harder for them to extract some inter-relationships among the data items presented across several pages. These problems with the current user interfaces have led many designers of information systems to realize the need for the development of new generation user interfaces that can reduce the human cognitive cost for their next generation information Information Visualization (2005) 4, 1–21 & 2005 Palgrave Macmillan Ltd. All rights reserved 1473-8716 $30.00 www.palgrave-journals.com/ivs
-
Upload
independent -
Category
Documents
-
view
4 -
download
0
Transcript of EncCon: an approach to constructing interactive visualization of large hierarchical data

EncCon: an approach to constructing
interactive visualization of large
hierarchical data
Quang Vinh Nguyen1
Mao Lin Huang1
1Department of Computer Systems, Faculty of
Information Technology, University of
Technology, Sydney, Australia
Correspondence: Quang Vinh Nguyen,Department of Computer Systems, Faculty ofInformation Technology, University ofTechnology, Sydney, P.O. BOX 123Broadway, NSW 2007, Australia.Tel: þ61 2 95144519; Fax: þ61 2 95141807;E-mail: [email protected]
Received: 15 August 2004Revised: 1 December 2004Accepted: 23 December 2004Online publication date: 17 March 2005
AbstractThis paper describes a new technique called EncCon for visualizing and
navigating large hierarchical information. This technique consists of two com-
ponents: visualization and navigation. Visualization uses a fast enclosureþconnection method to calculate the geometrical layout for the display of
large hierarchies in a two-dimensional space. Our technique uses a rectangular
division algorithm for recursively positioning the graph. This visualization aims
to maximize the utilization of display space while retaining a good geometricallayout as well as a clear (explicit) presentation of the hierarchical structure of
graphs. This paper also presents an experimental evaluation of EncCon’s layout
algorithm. Besides the layout algorithm, EncCon uses a new focusþ contextviewing technique for the navigation of large hierarchies. We use the
zoomingþ layering concept to achieve the focusþ context viewing, rather than
the traditional enlargeþ embedded concept, which is used by most of theavailable focusþ context techniques. Technically, it employs semi-transparency
to achieve the display of two layers of information in z-coordination at the same
visualization. Both context view and detail view are drawn at two separate layers.
These layers are then displayed in an overlapped manner at the same physicalscreen space.
Information Visualization (2005) 4, 1–21. doi:10.1057/palgrave.ivs.9500087
Keywords: Information visualization; tree layout; hierarchical visualization; navigation;focusþ context; transparency; interactive visualization
IntroductionWith the rapid growth of information, there is a huge amount of data thathave become available for analysis. The size of this data is rapidlyincreasing each year. The traditional user interfaces provided for informa-tion systems, with the typical working mode of textual display plusscrolling bar that often generate long textual pages of output data for usersto read, no longer meet the satisfaction, in terms of human cognitiveprocess, of users, such as Business Managers and System Analysers who areusing these systems. It is very time consuming for these users to readthrough the information line by line through the whole page or severalpages to find the particular data items they need. Furthermore, it is evenharder for them to extract some inter-relationships among the data itemspresented across several pages. These problems with the current userinterfaces have led many designers of information systems to realize theneed for the development of new generation user interfaces that canreduce the human cognitive cost for their next generation information
Information Visualization (2005) 4, 1–21
& 2005 Palgrave Macmillan Ltd. All rights reserved 1473-8716 $30.00
www.palgrave-journals.com/ivs
systems. As a result, they have started to use a newtechnique called Interactive Visualization for the design oftheir new user interfaces.
Interactive visualization is defined by Colin Ware1 as ‘aprocess made up of a number of interlocking feedbackloops that fall into three broad classes. At the lowest levelis the data manipulation loop, through which objects areselected and moved using the basic skills of eye-handcoordination. y At an intermediate level is an explora-tion and navigation loop, through which an analyst findshis or her way in a large visual data spacey . At thehighest level is a problem-solving loop through whichthe analyst forms hypotheses about the data and refinesthem through an augmented visualization process.’
Interactive visualization, as defined above, is a differentway of thinking about information processing in infor-mation systems. There is no longer a task-driven user whoformulates a precise query, types it into the databasesearch form, retrieves the result and then leaves thecomputer. Information processing becomes a continuousexploration through the visual mappings. The user is inthe information space more or less all the time, togetherwith a multitude of heterogeneous information sources.She/he can explore, view, investigate, discover, learn andmanipulate through the visual metaphors.
There are two important steps that are involved in thedesign of interactive visualization. The first step is to mapthe relational data into a geometrical plane. This is thefundamental problem of visualization. We call it thegraph drawing problem or the layout problem. Thesecond step is view navigation. View navigation is aboutchanging views interactively, step by step, to reach thetarget information that a particular user wants. This stepis defined as the second loop of interactive visualizationby Colin Ware.1 We now introduce some basics about thelayout design and navigation design.
The layout problem in visualizationIn practice, there are many information sources that areorganized in hierarchical form. Therefore, the research of
hierarchical layout becomes one of the major areas ininformation visualization. Chaomei Chen2 stated in hisbook that ‘Hierarchies are one of the most commonlyused structures. The organizational structure of a filesystem can be represented as a hierarchy; the structure ofa classification system is a hierarchy; and a taxonomy ofall animals is also a hierarchy. Hierarchical structures notonly play significant roles in their own right, but alsoprovide a means of representing a complex structure in asimplified form’.
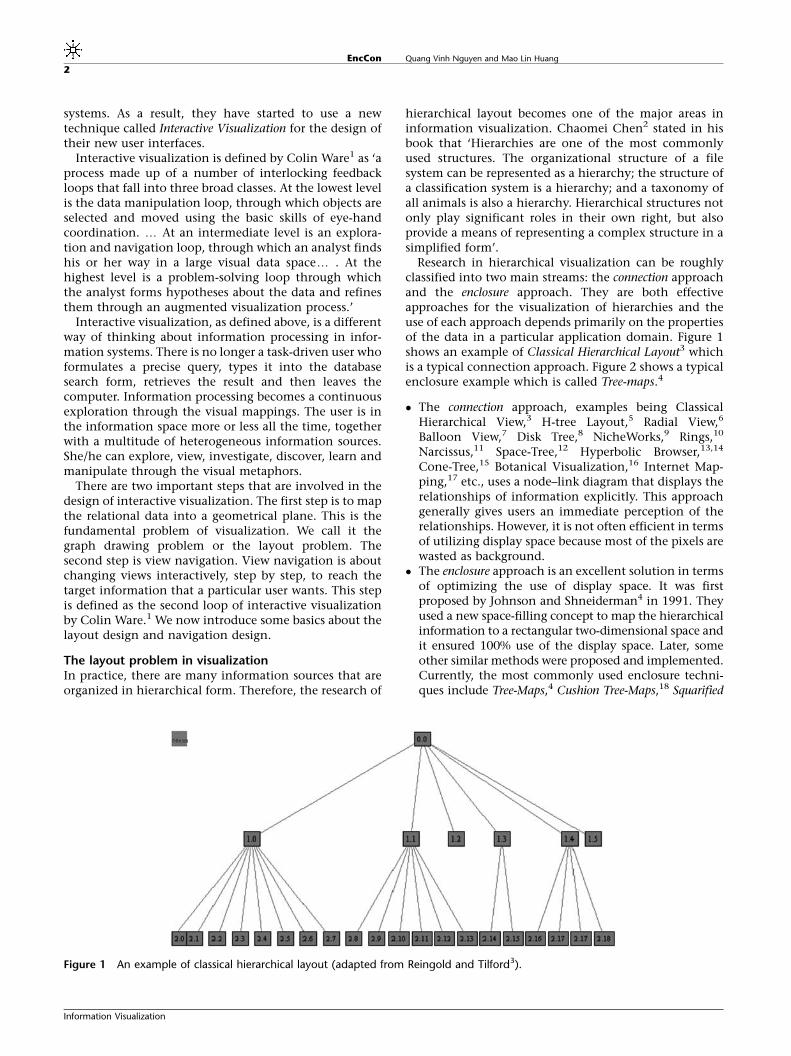
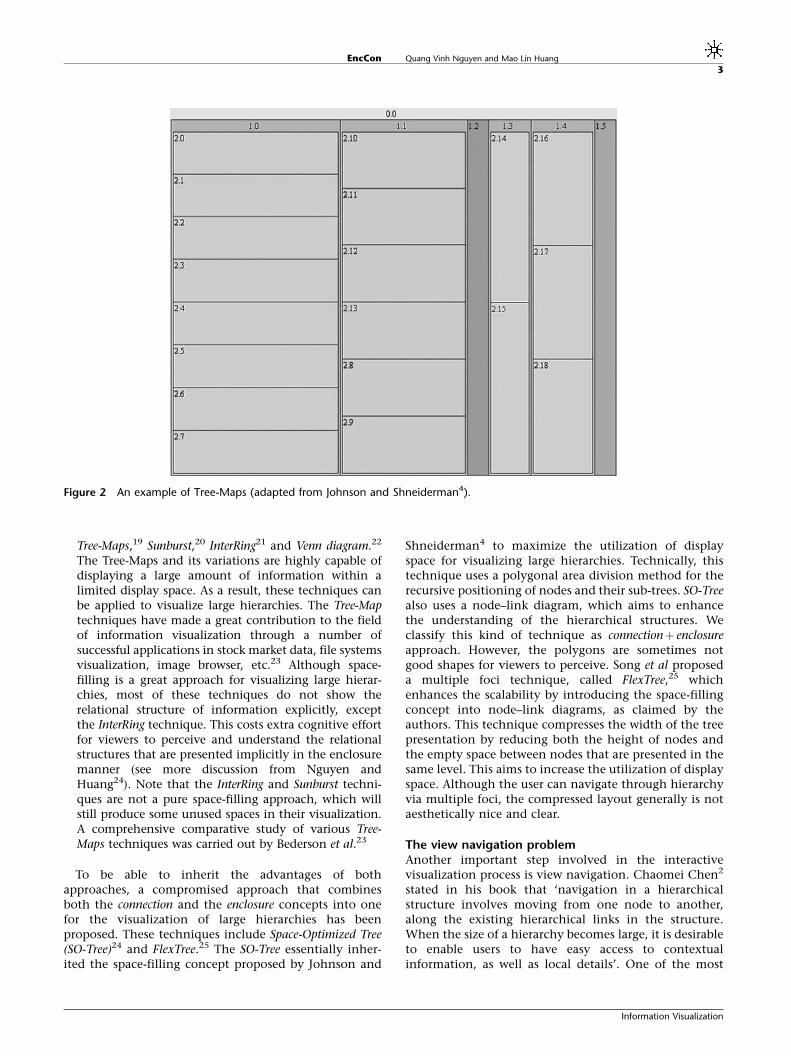
Research in hierarchical visualization can be roughlyclassified into two main streams: the connection approachand the enclosure approach. They are both effectiveapproaches for the visualization of hierarchies and theuse of each approach depends primarily on the propertiesof the data in a particular application domain. Figure 1shows an example of Classical Hierarchical Layout3 whichis a typical connection approach. Figure 2 shows a typicalenclosure example which is called Tree-maps.4
� The connection approach, examples being ClassicalHierarchical View,3 H-tree Layout,5 Radial View,6
Balloon View,7 Disk Tree,8 NicheWorks,9 Rings,10
Narcissus,11 Space-Tree,12 Hyperbolic Browser,13,14
Cone-Tree,15 Botanical Visualization,16 Internet Map-ping,17 etc., uses a node–link diagram that displays therelationships of information explicitly. This approachgenerally gives users an immediate perception of therelationships. However, it is not often efficient in termsof utilizing display space because most of the pixels arewasted as background.
� The enclosure approach is an excellent solution in termsof optimizing the use of display space. It was firstproposed by Johnson and Shneiderman4 in 1991. Theyused a new space-filling concept to map the hierarchicalinformation to a rectangular two-dimensional space andit ensured 100% use of the display space. Later, someother similar methods were proposed and implemented.Currently, the most commonly used enclosure techni-ques include Tree-Maps,4 Cushion Tree-Maps,18 Squarified
Figure 1 An example of classical hierarchical layout (adapted from Reingold and Tilford3).
EncCon Quang Vinh Nguyen and Mao Lin Huang
2
Information Visualization
Tree-Maps,19 Sunburst,20 InterRing21 and Venn diagram.22
The Tree-Maps and its variations are highly capable ofdisplaying a large amount of information within alimited display space. As a result, these techniques canbe applied to visualize large hierarchies. The Tree-Maptechniques have made a great contribution to the fieldof information visualization through a number ofsuccessful applications in stock market data, file systemsvisualization, image browser, etc.23 Although space-filling is a great approach for visualizing large hierar-chies, most of these techniques do not show therelational structure of information explicitly, exceptthe InterRing technique. This costs extra cognitive effortfor viewers to perceive and understand the relationalstructures that are presented implicitly in the enclosuremanner (see more discussion from Nguyen andHuang24). Note that the InterRing and Sunburst techni-ques are not a pure space-filling approach, which willstill produce some unused spaces in their visualization.A comprehensive comparative study of various Tree-Maps techniques was carried out by Bederson et al.23
To be able to inherit the advantages of bothapproaches, a compromised approach that combinesboth the connection and the enclosure concepts into onefor the visualization of large hierarchies has beenproposed. These techniques include Space-Optimized Tree(SO-Tree)24 and FlexTree.25 The SO-Tree essentially inher-ited the space-filling concept proposed by Johnson and
Shneiderman4 to maximize the utilization of displayspace for visualizing large hierarchies. Technically, thistechnique uses a polygonal area division method for therecursive positioning of nodes and their sub-trees. SO-Treealso uses a node–link diagram, which aims to enhancethe understanding of the hierarchical structures. Weclassify this kind of technique as connectionþ enclosureapproach. However, the polygons are sometimes notgood shapes for viewers to perceive. Song et al proposeda multiple foci technique, called FlexTree,25 whichenhances the scalability by introducing the space-fillingconcept into node–link diagrams, as claimed by theauthors. This technique compresses the width of the treepresentation by reducing both the height of nodes andthe empty space between nodes that are presented in thesame level. This aims to increase the utilization of displayspace. Although the user can navigate through hierarchyvia multiple foci, the compressed layout generally is notaesthetically nice and clear.
The view navigation problemAnother important step involved in the interactivevisualization process is view navigation. Chaomei Chen2
stated in his book that ‘navigation in a hierarchicalstructure involves moving from one node to another,along the existing hierarchical links in the structure.When the size of a hierarchy becomes large, it is desirableto enable users to have easy access to contextualinformation, as well as local details’. One of the most
Figure 2 An example of Tree-Maps (adapted from Johnson and Shneiderman4).
EncCon Quang Vinh Nguyen and Mao Lin Huang
3
Information Visualization
important issues involved in navigation is that the usersare always able to see (or have easy access to)contextual information. This allows users to maintainthe perception of where they are and where they canmove from during the navigation of large informationspaces. This also assists users to make further decisionsabout where they should go next, as well as wherethey are, while interactively navigating through theinformation space.
To achieve easy access to both the contextual and thelocal information in large hierarchies, there are severaloptimized navigation solutions that have been developedto accommodate with the geometrical layout techniques.Most of the current navigation techniques can beroughly classified into three approaches: focusþ context,zoomingþ filtering, and incremental exploration.
� Focusþ context – This approach is defined as a viewingapproach that provides users with a detailed view of asmall focus area and a global view of the overallcontext. In other words, it can be defined as follows:‘detailed views of particular parts of an information setare blended in some way with a view of the overallstructure of the set’. Typical focusþ context techniquesare Fisheye Views,26,27 Polyfocal Display,28 BifocalLens,29 Perspective Wall,30 Hyperbolic Browser,13 etc.
� Zoomingþ filtering – This approach is defined as aviewing approach that works by reducing the amountof context in the display. The reduction is done byfiltering the information in the form of selecting asubset of the data along a range of numerical values ofone or more dimensions. The typical zoomingþ filter-filtering techniques are Starfield Display,31 Tree-Maps,4
Pad,32 Padþ þ 33 or the more recent version calledPiccolo,34 etc.
� Incremental exploration – This approach is defined as aviewing approach that displays only a small portion ofthe full hierarchy incrementally following the user’sexploration of information space. Thus, these techni-ques are able to handle huge data sets where it isimpossible to display the entire hierarchy on the screenat a time. Incremental exploration techniques can befound,35–37 etc.
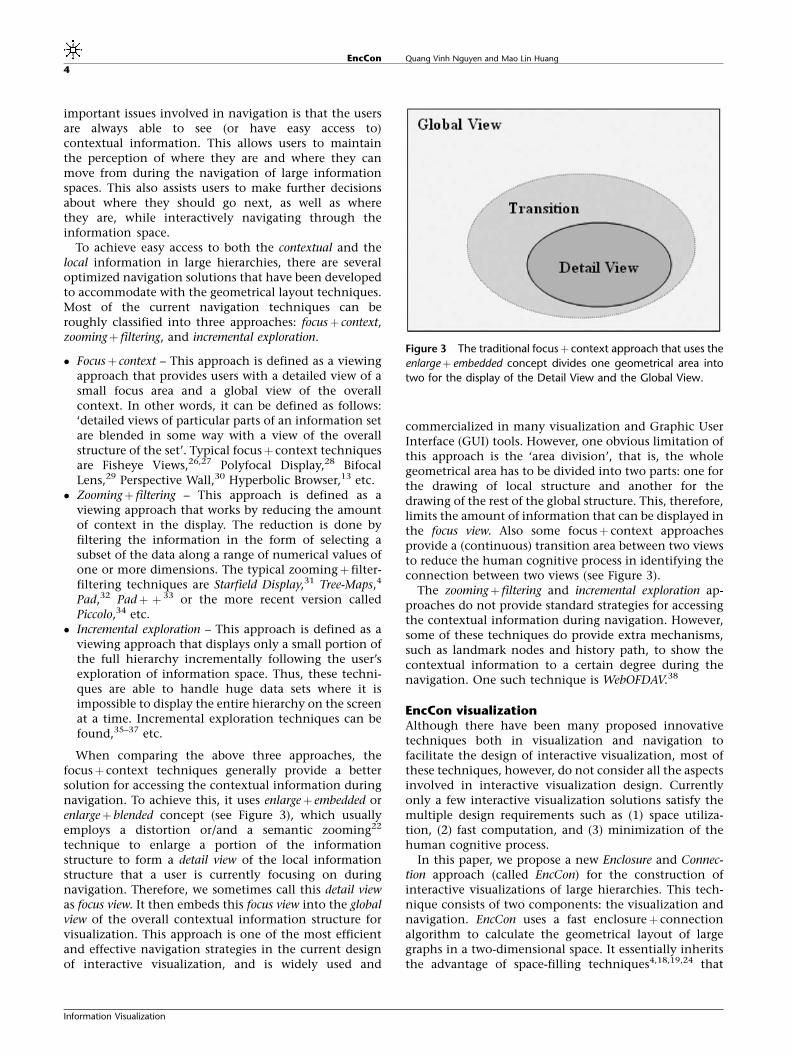
When comparing the above three approaches, thefocusþ context techniques generally provide a bettersolution for accessing the contextual information duringnavigation. To achieve this, it uses enlargeþ embedded orenlargeþ blended concept (see Figure 3), which usuallyemploys a distortion or/and a semantic zooming22
technique to enlarge a portion of the informationstructure to form a detail view of the local informationstructure that a user is currently focusing on duringnavigation. Therefore, we sometimes call this detail viewas focus view. It then embeds this focus view into the globalview of the overall contextual information structure forvisualization. This approach is one of the most efficientand effective navigation strategies in the current designof interactive visualization, and is widely used and
commercialized in many visualization and Graphic UserInterface (GUI) tools. However, one obvious limitation ofthis approach is the ‘area division’, that is, the wholegeometrical area has to be divided into two parts: one forthe drawing of local structure and another for thedrawing of the rest of the global structure. This, therefore,limits the amount of information that can be displayed inthe focus view. Also some focusþ context approachesprovide a (continuous) transition area between two viewsto reduce the human cognitive process in identifying theconnection between two views (see Figure 3).
The zoomingþ filtering and incremental exploration ap-proaches do not provide standard strategies for accessingthe contextual information during navigation. However,some of these techniques do provide extra mechanisms,such as landmark nodes and history path, to show thecontextual information to a certain degree during thenavigation. One such technique is WebOFDAV.38
EncCon visualizationAlthough there have been many proposed innovativetechniques both in visualization and navigation tofacilitate the design of interactive visualization, most ofthese techniques, however, do not consider all the aspectsinvolved in interactive visualization design. Currentlyonly a few interactive visualization solutions satisfy themultiple design requirements such as (1) space utiliza-tion, (2) fast computation, and (3) minimization of thehuman cognitive process.
In this paper, we propose a new Enclosure and Connec-tion approach (called EncCon) for the construction ofinteractive visualizations of large hierarchies. This tech-nique consists of two components: the visualization andnavigation. EncCon uses a fast enclosureþ connectionalgorithm to calculate the geometrical layout of largegraphs in a two-dimensional space. It essentially inheritsthe advantage of space-filling techniques4,18,19,24 that
Figure 3 The traditional focusþ context approach that uses the
enlargeþ embedded concept divides one geometrical area into
two for the display of the Detail View and the Global View.
EncCon Quang Vinh Nguyen and Mao Lin Huang
4
Information Visualization
maximize the utilization of display space by using areadivision for the partitioning of sub-trees and nodes. Notethat the issue of space utilization becomes significantlyimportant when visualizing large graphs with hundredsor thousands of nodes and edges because of the limita-tion of screen pixels. It is similar to the original Tree-Maps4 and Squarified Tree-Maps19 that use a rectangulardivision method for recursively positioning the nodes,rather than a polygonal division method used in SO-Tree.24 This property aims to provide users with a morestraightforward way to perceive the visualization andensures the efficient use of display space.
In order to address the specific criteria of EncCondrawing, we use ‘squarified’ rectangles for the areadivision, which is similar to the Squarified Tree-Maps19
algorithm. We will discuss our drawing criteria in thetechnical section. The EncCon drawing ensures that allsub-hierarchies are inside rectangular geometric localregions. Thus, there is no overlapping between rectan-gular local regions of nodes and their sub-trees. However,our area division algorithm is different from the SquarifiedTree-Maps algorithm. In Squarified Tree-Maps, the parti-tioning is accomplished through the horizontal–verticalmanner. In EncCon, this is achieved in the circularmanner, in which all rectangles are placed in thenorth–east–south–west order around four sides of theparent rectangle. Both of the above partitioning algo-rithms ensure the efficiency of space utilization. TheEncCon visualization also uses a node–link diagram topresent the hierarchical structure explicitly.
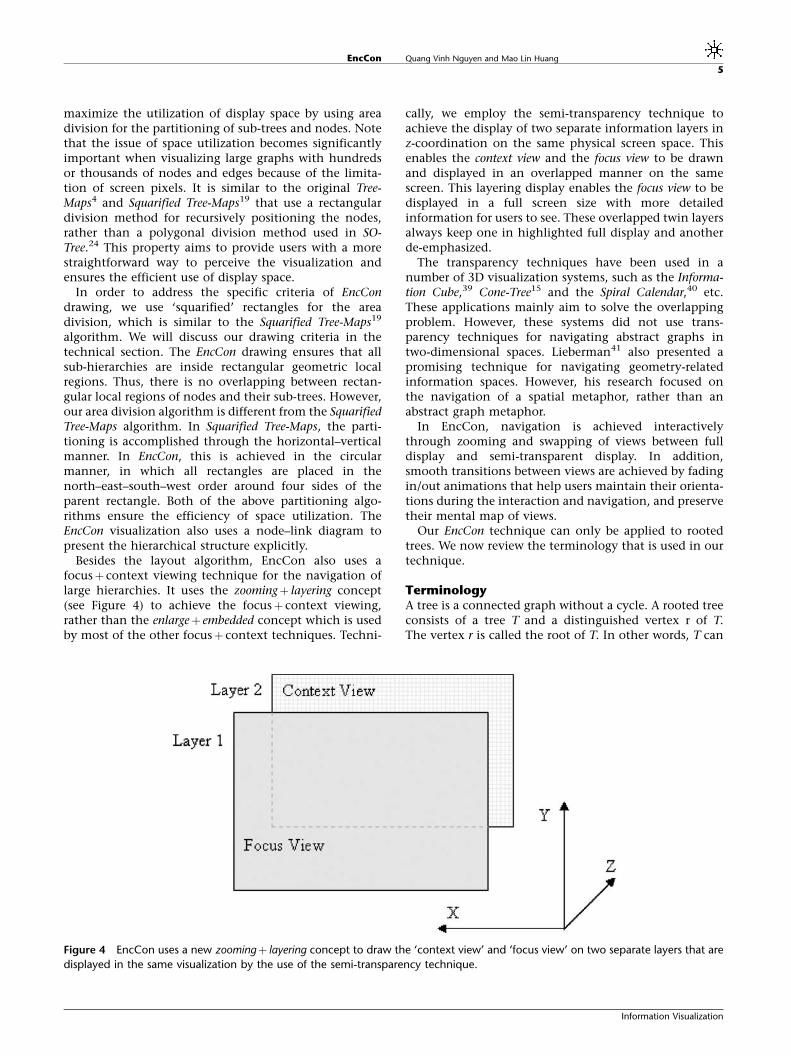
Besides the layout algorithm, EncCon also uses afocusþ context viewing technique for the navigation oflarge hierarchies. It uses the zoomingþ layering concept(see Figure 4) to achieve the focusþ context viewing,rather than the enlargeþ embedded concept which is usedby most of the other focusþ context techniques. Techni-
cally, we employ the semi-transparency technique toachieve the display of two separate information layers inz-coordination on the same physical screen space. Thisenables the context view and the focus view to be drawnand displayed in an overlapped manner on the samescreen. This layering display enables the focus view to bedisplayed in a full screen size with more detailedinformation for users to see. These overlapped twin layersalways keep one in highlighted full display and anotherde-emphasized.
The transparency techniques have been used in anumber of 3D visualization systems, such as the Informa-tion Cube,39 Cone-Tree15 and the Spiral Calendar,40 etc.These applications mainly aim to solve the overlappingproblem. However, these systems did not use trans-parency techniques for navigating abstract graphs intwo-dimensional spaces. Lieberman41 also presented apromising technique for navigating geometry-relatedinformation spaces. However, his research focused onthe navigation of a spatial metaphor, rather than anabstract graph metaphor.
In EncCon, navigation is achieved interactivelythrough zooming and swapping of views between fulldisplay and semi-transparent display. In addition,smooth transitions between views are achieved by fadingin/out animations that help users maintain their orienta-tions during the interaction and navigation, and preservetheir mental map of views.
Our EncCon technique can only be applied to rootedtrees. We now review the terminology that is used in ourtechnique.
TerminologyA tree is a connected graph without a cycle. A rooted treeconsists of a tree T and a distinguished vertex r of T.The vertex r is called the root of T. In other words, T can
Figure 4 EncCon uses a new zoomingþ layering concept to draw the ‘context view’ and ‘focus view’ on two separate layers that are
displayed in the same visualization by the use of the semi-transparency technique.
EncCon Quang Vinh Nguyen and Mao Lin Huang
5
Information Visualization

be viewed as a directed acyclic graph with all edgesoriented away from the root. If (m,n) is a directed edge inT, we then say m is the parent of n and n is a child of m. Aleaf is a vertex with no children. If T contains the vertex n,then the sub-tree T(n) rooted at n is the sub-graph inducedby all vertices on paths originating from n. We also use anode to represent a vertex n with its displaying properties.This terminology is mainly mentioned in the displaysection. Each vertex v has an associated value w(n), whichwe call the weight. The local region R(v) of the vertex n isa rectangle, and it contains the drawing of a sub-tree T(n).The rectangle R(vi) is proportional to the weight w(vi) ofthe vertex vi.
A layered visualization LV consists of two graphicallayers L1 and L2 of information, displayed in an over-lapped manner in the same physical screen space,LV¼L1þL2 (see Figure 4). Graph G¼ {V, E} is the modelthat presents the structure of an information space. Eachgraphical layer is the medium for the drawing of G or asub-graph GiAG. At any time, a graph Gi drawn in L1 isalways a sub-graph of Gj drawn in L2. Thus, we constantlyhave GiAGjAG.
Enclosure + Connection LayoutThe layout algorithm, which is responsible for position-ing of all the vertices {n1, n2,y, nn} of the given tree T in atwo-dimensional geometrical space, is governed by aparticular area division algorithm. Each vertex vi isbounded by a rectangular local region R(vi) and thedrawing of the sub-tree T(vi) is restricted to inside thegeometrical area of R(vi). Thus, the local region R(vi) ofvertex vi is the sum of the rectangular areas assigned to itschildren. The position of vertex vi is at the centre of therectangle defined by R(vi). See the example in Figure 6a.
The area division algorithm, which is based on thespace-filling concept initially proposed by Johnsonand Shneiderman,4 is responsible for the calculation oflocal regions {R(v1), R(v2)y, R(vn)} for the placement ofall vertices {n1,n2,y, nn} and their sub-trees in the giventree T.
The area division algorithm must address a specific areapartitioning criteria to derive a complete set of rectan-gular local regions {R(v1), R(v2) y, R(vn)} that can producea high-quality layout of the node–link diagram of thecorresponding tree T, in terms of satisfying the followinggeneral Aesthetics rules defined by Di Battista, Eade,Tamassia, and Tollis in their Graph Drawing book.42
1. Edge crossings: Edge crossings make it difficult to tracepaths. So all edge crossings should be removed ifthe graph is planar; otherwise the total number ofedge crossings should be minimized.
2. Angular resolution: The angle between the edges ofone vertex should be maximized. This aesthetic isespecially relevant for straight-line drawings.
3. Total edge length: Minimization of the sum of thelengths of the edges. The average of all edge lengthsshould be as small as possible.
4. Uniform edge length: Minimization of the variance ofthe lengths of the edges. Minimization of the numberof long edges that usually cost extra cognitive effort isnecessary to perceive the parent–child relationships.Minimization of the number of very short edges thatsometimes cause overlaps among the graphical nodesis carried out (see Figure 5).
Obviously, from Figure 5a, we can see that the use ofthin (very thin) rectangular local regions for placingnode–link diagrams will greatly reduce the quality ofgraph presentation. Therefore, the ‘squarification’ oflocal regions is essential in the design of the spacepartitioning algorithms, especially when node–linkdiagrams are placed to show relationships amongvertices. This has led to the exclusion of original Tree-Maps4 algorithm for the space partitioning in EncCon,since it naturally produces many thin rectangles (seeFigure 2).
A drawing of sub-tree T(vi) rooted at vi is calculatedbased on the properties of vi and its local region R(vi).Each vertex is associated with a weight and the vertex’slocal region is calculated proportionally to its weight.There are several ways to define the weight of a vertexbased on its physical or logical properties, such as adomain-specific property: the size of a file or a directorythat is presented as a graphical node that we arevisualizing. In this paper, however, we define the weightof vertex vi to be proportional to the number of itsdescendants. The weights of all vertices are pre-calcu-lated before the layout of the node–link diagram isdrawn. This step is described in more detail in the nextsection.
Weight calculationWe assign a weight w(v) to each vertex v for thecalculation of the local region R(v) that relates to theregions of its parent and siblings. Suppose that vertex vhas k children {nlþ 1, nlþ2, y,nlþ k}. The calculation of w(v)is done recursively from leaves to a vertex using thefollowing formula:
wðvÞ ¼ 1 þ CXk
i¼1
wðvlþiÞ; ð1Þ
where C is a constant (0oCo1), and w(vlþ i) is the weightassigned to the ith child of vertex v. The constant C is ascalar that determines the size difference of local regionsof all vertices based on the number of descendants ofthose vertices. The value of C may be altered to adjust thelayout for a better view that can better fulfil the aestheticsrules of graph drawing. We can see that in Figure 6a, thedifference among the local regions is much higher thanthose in 6b. From our experiments that include thosefrom Figures 12 to 15, and Applications 1 and 2, it wasfound that the value C¼0.45 generally gives the bestview of layouts. Therefore, we set this value as the defaultvalue for the generation of other screenshots in the paper.
EncCon Quang Vinh Nguyen and Mao Lin Huang
6
Information Visualization

Example of the partitioningWe first describe our partitioning algorithm using anexample. Suppose that we have a rectangle with width 6and height 4, we need to divide this rectangle into fiverectangles whose weighs are, respectively, {4, 4, 2, 1, 2},and the starting partitioning side is the left side. Theweight of this rectangle is 13.
The first step is to add a single rectangle with theweight 4 into the first division side (height_of_R1¼4*6/13, width_of_R1¼4). Next, we add the second rectangle(weight 4) below the first, that is, they share the commonleft side from the original large rectangle. These tworectangles will have the dimension, respectively, of(height_of_R1¼8*6/13, width_of_R1¼4*4/8) and (height_of_R2¼8*6/13, width_of_R2¼ 4*4/8). Next, step 3 in-volves inserting the third rectangle (weight 2) at thebottom of two rectangles. However, this step is dismissedbecause the last produced rectangle is too thin(height_of_R3¼10*6/13, width_of_R3¼2*4/10, l3¼0.174).
We now start the second partitioning circle, moving fromthe left side to the top side. In the remaining rectangle,the division continues on the second side (on the top).Two more circles are repeated on the other two sides ofthe remaining rectangle until all rectangles have beenpositioned (see Figure 7).
Local region partitioningWe first define the local region of the root-vertex to bethe entire rectangular display area. The root-vertex isplaced at the centre of this rectangle. The partitioningstarts from the root-vertex and ends when all the leaf-vertices are reached. Suppose that the rectangular localregion R(v) for vertex v is defined, and the position of v isat the centre of R(v). We then need to calculate the localregions {R(vlþ1), R(vlþ 2), y, R(vlþ k)} for all the children{vlþ 1, vlþ2, y, vlþ k} of vertex v. The partitioning ensuresthat the area of each rectangle R(vlþ i) is proportional tothe weight w(vlþ i) of the vertex vlþ i.
Figure 5 The top image shows an example of placing a node-link diagram in a thin rectangle. We can see that the quality
of the graph presentation in this thin rectangle is much lower, in terms of Angular Resolution and Uniform Edge Length, than the quality
of layout of the same graph presented in a square-like rectangle on the bottom. Note that the top diagram contains a node
overlapping.
EncCon Quang Vinh Nguyen and Mao Lin Huang
7
Information Visualization
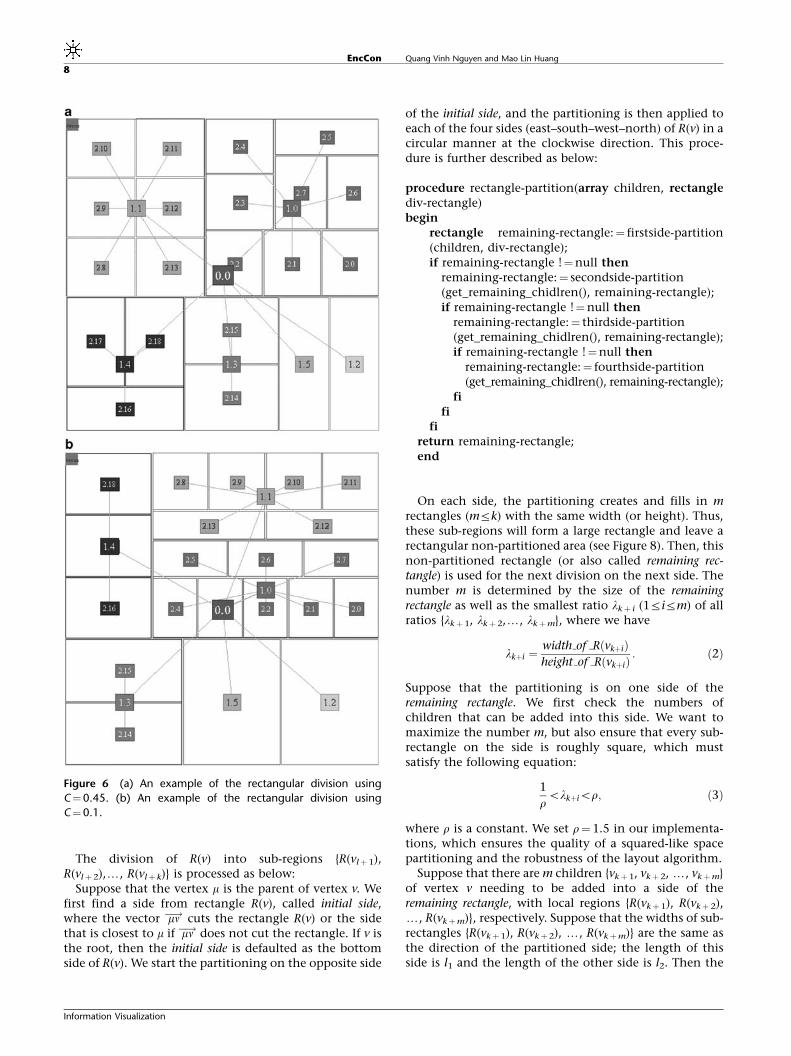
The division of R(v) into sub-regions {R(vlþ 1),R(vlþ2),y, R(vlþ k)} is processed as below:
Suppose that the vertex m is the parent of vertex v. Wefirst find a side from rectangle R(v), called initial side,where the vector mn�! cuts the rectangle R(v) or the sidethat is closest to m if mn�! does not cut the rectangle. If v isthe root, then the initial side is defaulted as the bottomside of R(v). We start the partitioning on the opposite side
of the initial side, and the partitioning is then applied toeach of the four sides (east–south–west–north) of R(v) in acircular manner at the clockwise direction. This proce-dure is further described as below:
procedure rectangle-partition(array children, rectanglediv-rectangle)begin
rectangle remaining-rectangle:¼ firstside-partition(children, div-rectangle);if remaining-rectangle !¼null then
remaining-rectangle:¼ secondside-partition(get_remaining_chidlren(), remaining-rectangle);if remaining-rectangle !¼null then
remaining-rectangle:¼ thirdside-partition(get_remaining_chidlren(), remaining-rectangle);if remaining-rectangle !¼null then
remaining-rectangle:¼ fourthside-partition(get_remaining_chidlren(), remaining-rectangle);
fifi
fireturn remaining-rectangle;end
On each side, the partitioning creates and fills in mrectangles (mrk) with the same width (or height). Thus,these sub-regions will form a large rectangle and leave arectangular non-partitioned area (see Figure 8). Then, thisnon-partitioned rectangle (or also called remaining rec-tangle) is used for the next division on the next side. Thenumber m is determined by the size of the remainingrectangle as well as the smallest ratio lkþ i (1rirm) of allratios {lkþ 1, lkþ2,y, lkþm}, where we have
lkþi ¼width of RðvkþiÞheight of RðvkþiÞ
: ð2Þ
Suppose that the partitioning is on one side of theremaining rectangle. We first check the numbers ofchildren that can be added into this side. We want tomaximize the number m, but also ensure that every sub-rectangle on the side is roughly square, which mustsatisfy the following equation:
1
rolkþior; ð3Þ
where r is a constant. We set r¼ 1.5 in our implementa-tions, which ensures the quality of a squared-like spacepartitioning and the robustness of the layout algorithm.
Suppose that there are m children {vkþ 1, vkþ2, y, vkþm}of vertex v needing to be added into a side of theremaining rectangle, with local regions {R(vkþ1), R(vkþ 2),y, R(vkþm)}, respectively. Suppose that the widths of sub-rectangles {R(vkþ1), R(vkþ2), y, R(vkþm)} are the same asthe direction of the partitioned side; the length of thisside is l1 and the length of the other side is l2. Then the
Figure 6 (a) An example of the rectangular division using
C¼0.45. (b) An example of the rectangular division using
C¼0.1.
EncCon Quang Vinh Nguyen and Mao Lin Huang
8
Information Visualization
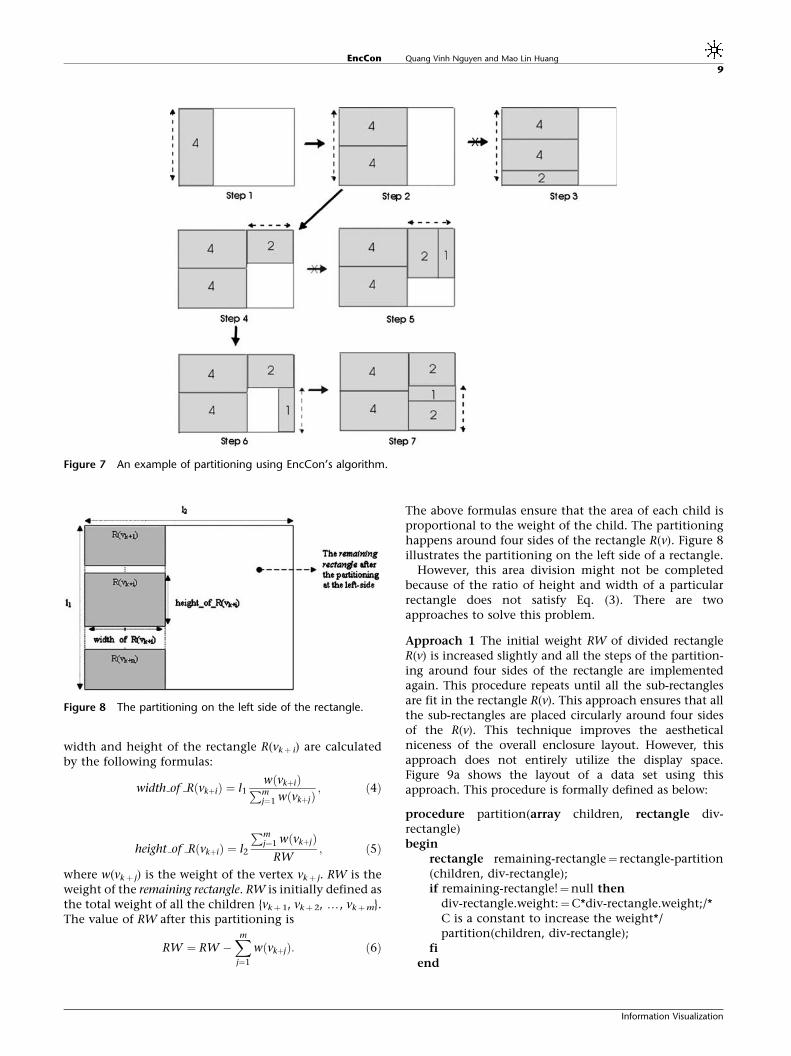
width and height of the rectangle R(vkþ i) are calculatedby the following formulas:
width of RðvkþiÞ ¼ l1wðvkþiÞPmj¼1 wðvkþjÞ
; ð4Þ
height of RðvkþiÞ ¼ l2
Pmj¼1 wðvkþjÞ
RW; ð5Þ
where w(vkþ j) is the weight of the vertex vkþ j. RW is theweight of the remaining rectangle. RW is initially defined asthe total weight of all the children {vkþ 1, vkþ 2, y, vkþm}.The value of RW after this partitioning is
RW ¼ RW �Xm
j¼1
wðvkþjÞ: ð6Þ
The above formulas ensure that the area of each child isproportional to the weight of the child. The partitioninghappens around four sides of the rectangle R(v). Figure 8illustrates the partitioning on the left side of a rectangle.
However, this area division might not be completedbecause of the ratio of height and width of a particularrectangle does not satisfy Eq. (3). There are twoapproaches to solve this problem.
Approach 1 The initial weight RW of divided rectangleR(v) is increased slightly and all the steps of the partition-ing around four sides of the rectangle are implementedagain. This procedure repeats until all the sub-rectanglesare fit in the rectangle R(v). This approach ensures that allthe sub-rectangles are placed circularly around four sidesof the R(v). This technique improves the aestheticalniceness of the overall enclosure layout. However, thisapproach does not entirely utilize the display space.Figure 9a shows the layout of a data set using thisapproach. This procedure is formally defined as below:
procedure partition(array children, rectangle div-rectangle)begin
rectangle remaining-rectangle¼ rectangle-partition(children, div-rectangle);if remaining-rectangle!¼null then
div-rectangle.weight:¼C*div-rectangle.weight;/*C is a constant to increase the weight*/partition(children, div-rectangle);
fiend
Figure 7 An example of partitioning using EncCon’s algorithm.
Figure 8 The partitioning on the left side of the rectangle.
EncCon Quang Vinh Nguyen and Mao Lin Huang
9
Information Visualization
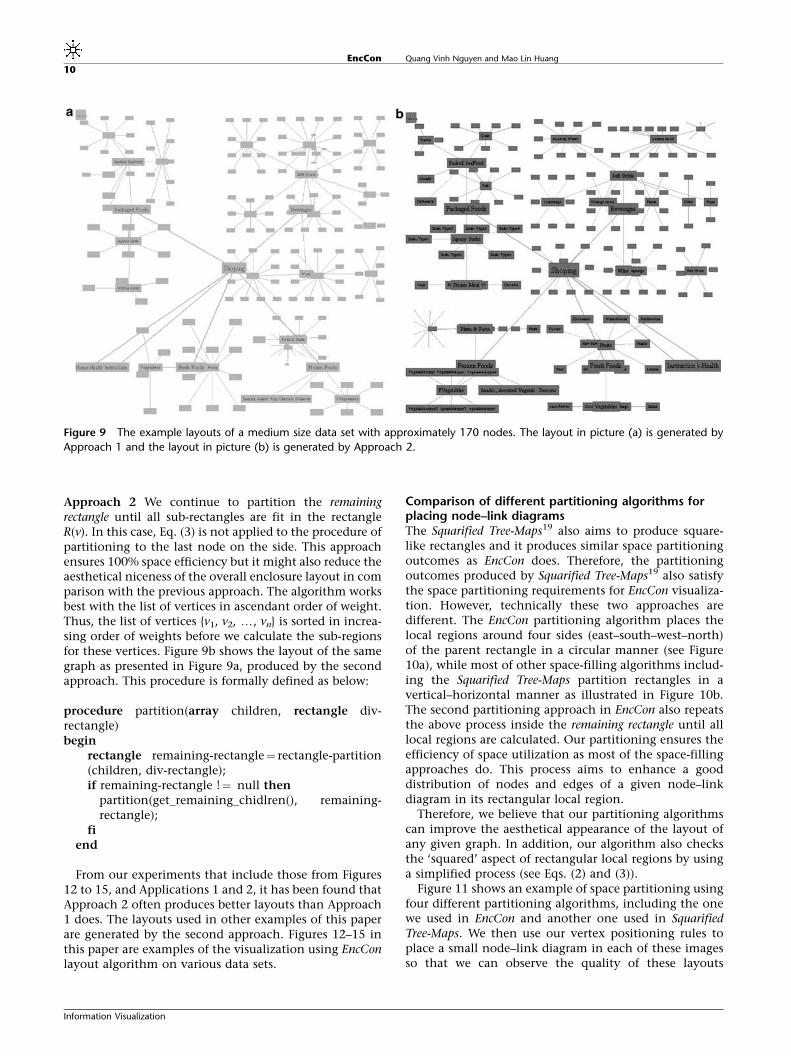
Approach 2 We continue to partition the remainingrectangle until all sub-rectangles are fit in the rectangleR(v). In this case, Eq. (3) is not applied to the procedure ofpartitioning to the last node on the side. This approachensures 100% space efficiency but it might also reduce theaesthetical niceness of the overall enclosure layout in comparison with the previous approach. The algorithm worksbest with the list of vertices in ascendant order of weight.Thus, the list of vertices {v1, v2, y, vn} is sorted in increa-sing order of weights before we calculate the sub-regionsfor these vertices. Figure 9b shows the layout of the samegraph as presented in Figure 9a, produced by the secondapproach. This procedure is formally defined as below:
procedure partition(array children, rectangle div-rectangle)begin
rectangle remaining-rectangle¼ rectangle-partition(children, div-rectangle);if remaining-rectangle !¼ null then
partition(get_remaining_chidlren(), remaining-rectangle);
fiend
From our experiments that include those from Figures12 to 15, and Applications 1 and 2, it has been found thatApproach 2 often produces better layouts than Approach1 does. The layouts used in other examples of this paperare generated by the second approach. Figures 12–15 inthis paper are examples of the visualization using EncConlayout algorithm on various data sets.
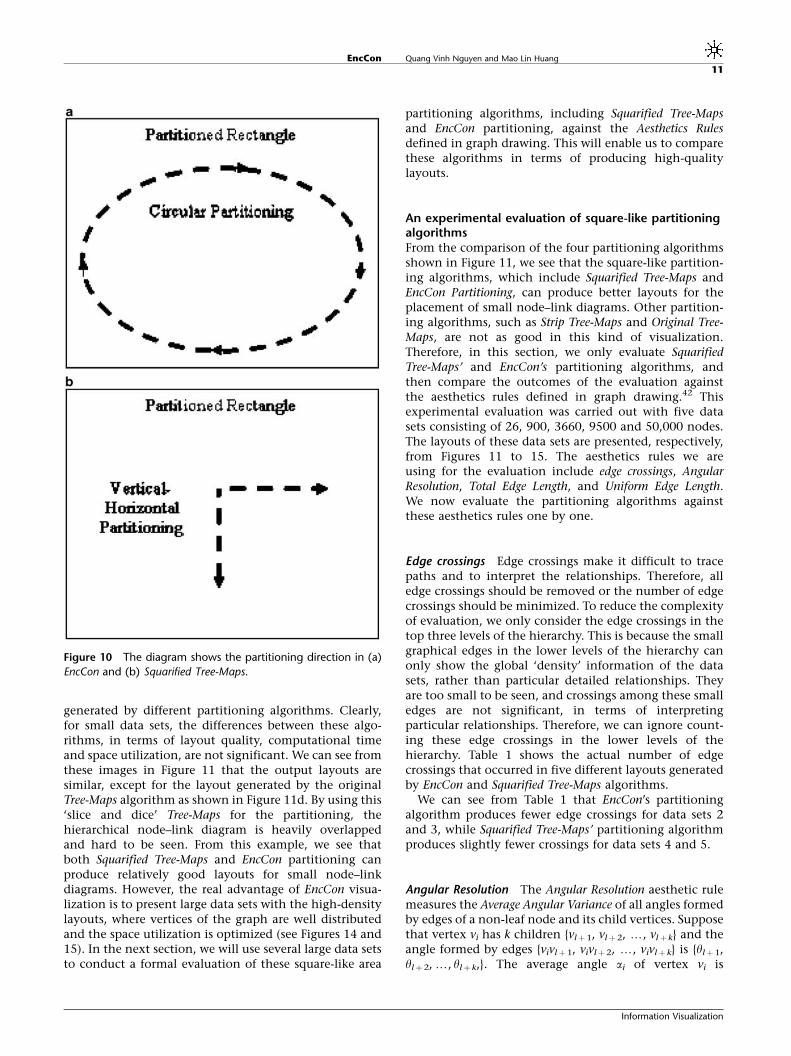
Comparison of different partitioning algorithms forplacing node–link diagramsThe Squarified Tree-Maps19 also aims to produce square-like rectangles and it produces similar space partitioningoutcomes as EncCon does. Therefore, the partitioningoutcomes produced by Squarified Tree-Maps19 also satisfythe space partitioning requirements for EncCon visualiza-tion. However, technically these two approaches aredifferent. The EncCon partitioning algorithm places thelocal regions around four sides (east–south–west–north)of the parent rectangle in a circular manner (see Figure10a), while most of other space-filling algorithms includ-ing the Squarified Tree-Maps partition rectangles in avertical–horizontal manner as illustrated in Figure 10b.The second partitioning approach in EncCon also repeatsthe above process inside the remaining rectangle until alllocal regions are calculated. Our partitioning ensures theefficiency of space utilization as most of the space-fillingapproaches do. This process aims to enhance a gooddistribution of nodes and edges of a given node–linkdiagram in its rectangular local region.
Therefore, we believe that our partitioning algorithmscan improve the aesthetical appearance of the layout ofany given graph. In addition, our algorithm also checksthe ‘squared’ aspect of rectangular local regions by usinga simplified process (see Eqs. (2) and (3)).
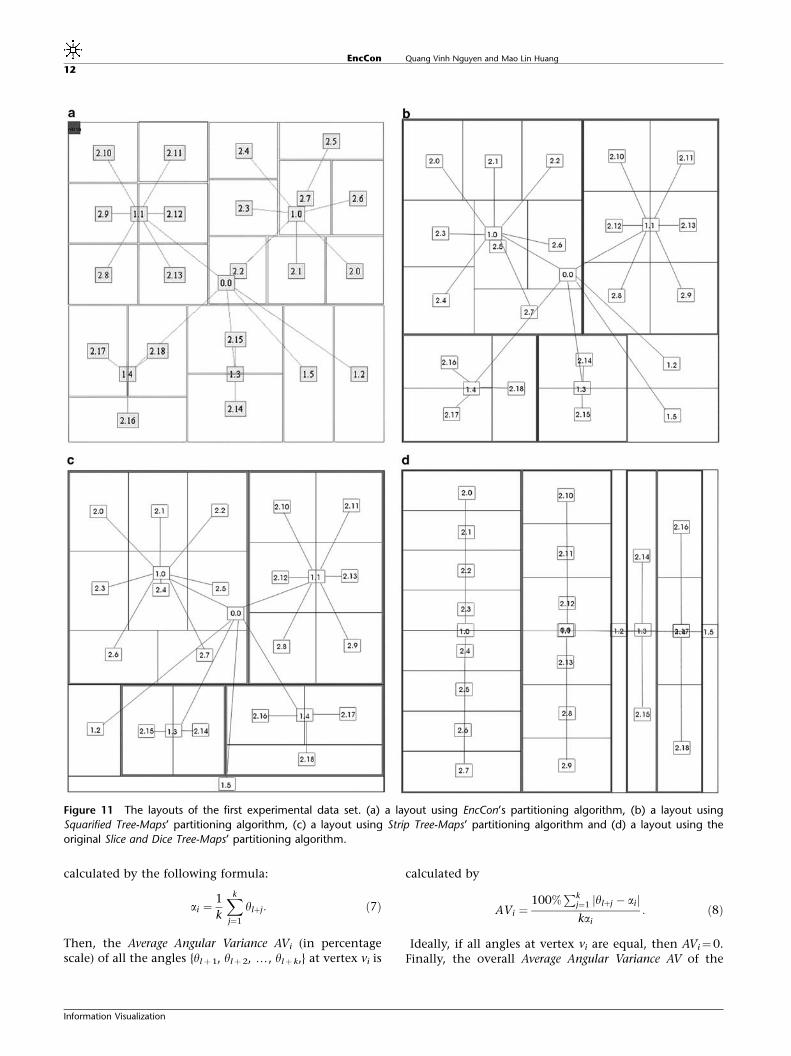
Figure 11 shows an example of space partitioning usingfour different partitioning algorithms, including the onewe used in EncCon and another one used in SquarifiedTree-Maps. We then use our vertex positioning rules toplace a small node–link diagram in each of these imagesso that we can observe the quality of these layouts
Figure 9 The example layouts of a medium size data set with approximately 170 nodes. The layout in picture (a) is generated by
Approach 1 and the layout in picture (b) is generated by Approach 2.
EncCon Quang Vinh Nguyen and Mao Lin Huang
10
Information Visualization
generated by different partitioning algorithms. Clearly,for small data sets, the differences between these algo-rithms, in terms of layout quality, computational timeand space utilization, are not significant. We can see fromthese images in Figure 11 that the output layouts aresimilar, except for the layout generated by the originalTree-Maps algorithm as shown in Figure 11d. By using this‘slice and dice’ Tree-Maps for the partitioning, thehierarchical node–link diagram is heavily overlappedand hard to be seen. From this example, we see thatboth Squarified Tree-Maps and EncCon partitioning canproduce relatively good layouts for small node–linkdiagrams. However, the real advantage of EncCon visua-lization is to present large data sets with the high-densitylayouts, where vertices of the graph are well distributedand the space utilization is optimized (see Figures 14 and15). In the next section, we will use several large data setsto conduct a formal evaluation of these square-like area
partitioning algorithms, including Squarified Tree-Mapsand EncCon partitioning, against the Aesthetics Rulesdefined in graph drawing. This will enable us to comparethese algorithms in terms of producing high-qualitylayouts.
An experimental evaluation of square-like partitioningalgorithmsFrom the comparison of the four partitioning algorithmsshown in Figure 11, we see that the square-like partition-ing algorithms, which include Squarified Tree-Maps andEncCon Partitioning, can produce better layouts for theplacement of small node–link diagrams. Other partition-ing algorithms, such as Strip Tree-Maps and Original Tree-Maps, are not as good in this kind of visualization.Therefore, in this section, we only evaluate SquarifiedTree-Maps’ and EncCon’s partitioning algorithms, andthen compare the outcomes of the evaluation againstthe aesthetics rules defined in graph drawing.42 Thisexperimental evaluation was carried out with five datasets consisting of 26, 900, 3660, 9500 and 50,000 nodes.The layouts of these data sets are presented, respectively,from Figures 11 to 15. The aesthetics rules we areusing for the evaluation include edge crossings, AngularResolution, Total Edge Length, and Uniform Edge Length.We now evaluate the partitioning algorithms againstthese aesthetics rules one by one.
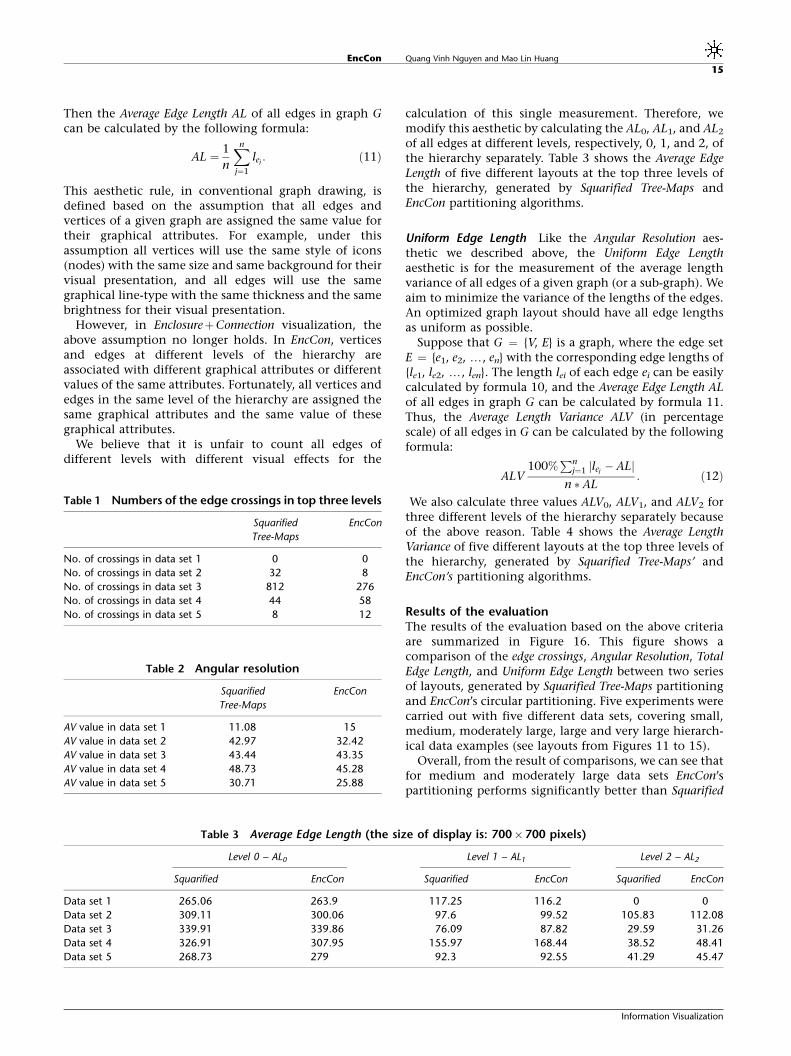
Edge crossings Edge crossings make it difficult to tracepaths and to interpret the relationships. Therefore, alledge crossings should be removed or the number of edgecrossings should be minimized. To reduce the complexityof evaluation, we only consider the edge crossings in thetop three levels of the hierarchy. This is because the smallgraphical edges in the lower levels of the hierarchy canonly show the global ‘density’ information of the datasets, rather than particular detailed relationships. Theyare too small to be seen, and crossings among these smalledges are not significant, in terms of interpretingparticular relationships. Therefore, we can ignore count-ing these edge crossings in the lower levels of thehierarchy. Table 1 shows the actual number of edgecrossings that occurred in five different layouts generatedby EncCon and Squarified Tree-Maps algorithms.
We can see from Table 1 that EncCon’s partitioningalgorithm produces fewer edge crossings for data sets 2and 3, while Squarified Tree-Maps’ partitioning algorithmproduces slightly fewer crossings for data sets 4 and 5.
Angular Resolution The Angular Resolution aesthetic rulemeasures the Average Angular Variance of all angles formedby edges of a non-leaf node and its child vertices. Supposethat vertex vi has k children {vlþ1, vlþ 2, y, vlþ k} and theangle formed by edges {vivlþ 1, vivlþ 2, y, vivlþ k} is {ylþ 1,ylþ2,y, ylþ k,}. The average angle ai of vertex vi is
Figure 10 The diagram shows the partitioning direction in (a)
EncCon and (b) Squarified Tree-Maps.
EncCon Quang Vinh Nguyen and Mao Lin Huang
11
Information Visualization
calculated by the following formula:
ai ¼1
k
Xk
j¼1
ylþj: ð7Þ
Then, the Average Angular Variance AVi (in percentagescale) of all the angles {ylþ1, ylþ 2, y, ylþ k,} at vertex vi is
calculated by
AVi ¼100%
Pkj¼1 jylþj � aijkai
: ð8Þ
Ideally, if all angles at vertex vi are equal, then AVi¼0.Finally, the overall Average Angular Variance AV of the
Figure 11 The layouts of the first experimental data set. (a) a layout using EncCon’s partitioning algorithm, (b) a layout using
Squarified Tree-Maps’ partitioning algorithm, (c) a layout using Strip Tree-Maps’ partitioning algorithm and (d) a layout using the
original Slice and Dice Tree-Maps’ partitioning algorithm.
EncCon Quang Vinh Nguyen and Mao Lin Huang
12
Information Visualization

entire tree T, which consists of n vertices {n1,n2, y,nn}, iscalculated by the following formula:
AV ¼ 1
n
Xn
i¼1
AVi: ð9Þ
We aim to minimize the value of AV for the layout ofgiven trees. Table 2 shows the Angular Resolution in five
different layouts generated by the EncCon and SquarifiedTree-Maps algorithms.
We can see from Table 2 that the EncCon’s partitioningalgorithm produces a better Angular Resolution in layouts2–5, while Squarified Tree-Maps partitioning algorithmproduces a slightly better Angular Resolution in layout 1 ofa small data set.
Figure 12 The layouts of the second experimental data set: a
Unix file directory with approximately 900 sub-directories and
files that are generated by (a) EncCon’s partitioning algorithm
and (b) Squarified Tree-Maps’ partitioning algorithm.
Figure 13 The layouts of the third experimental data set: a file
system with approximately 3660 sub-directories and files that
are generated by (a) EncCon’s partitioning algorithm and (b)
Squarified Tree-Maps’ partitioning algorithm.
EncCon Quang Vinh Nguyen and Mao Lin Huang
13
Information Visualization
Total Edge Length To satisfy the Total Edge Lengthaesthetic of graph drawing, we should minimize thesum of the lengths of all edges of the graph. This aestheticis usually measured through the value of Average EdgeLength AL. In other words, the average of all edge lengthsin optimized graph layouts should be as small as possible.
Suppose that G ¼ {V, E} is a graph, where the edge set E¼ {e1, e2, y, en}. The length lei
of each edge ei linkingbetween two vertices va(xa, ya) and vb(xb, yb) can be easilycalculated by the following formula:
lei¼
ffiffiffiffiffiffiffiffiffiffiffiffiffiffiffiffiffiffiffiffiffiffiffiffiffiffiffiffiffiffiffiffiffiffiffiffiffiffiffiffiffiffiffiffiffiffiffiffiðxa � xbÞ2 þ ðya � ybÞ2
q: ð10Þ
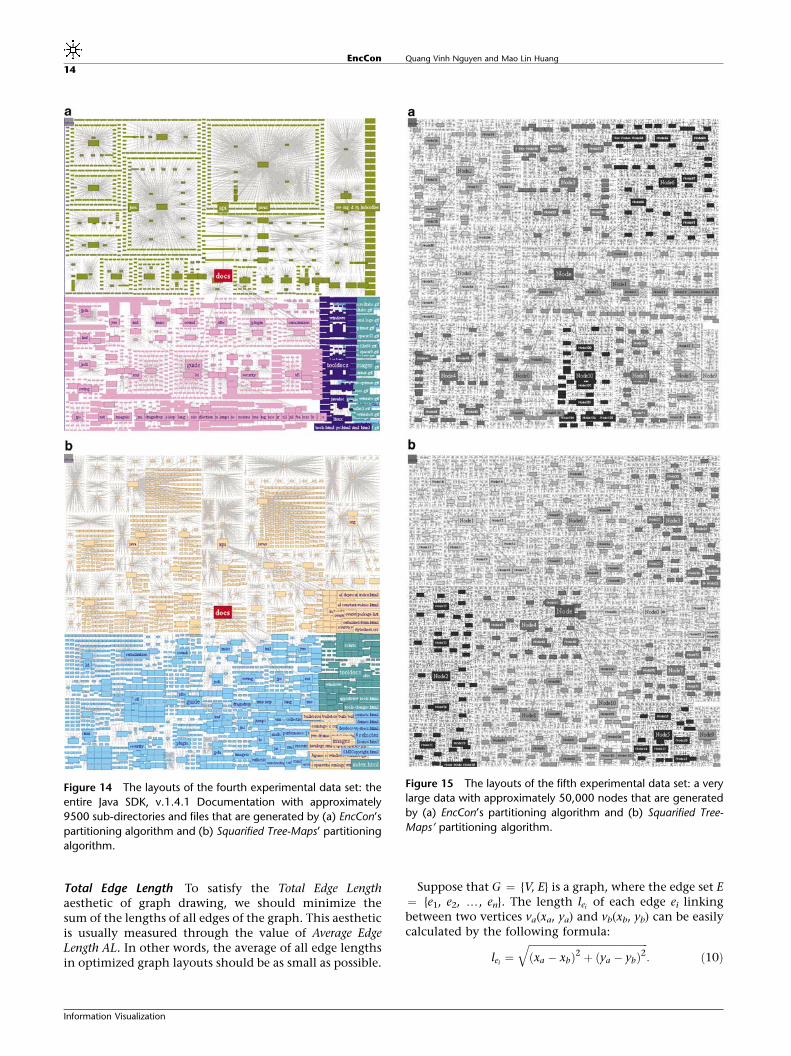
Figure 14 The layouts of the fourth experimental data set: the
entire Java SDK, v.1.4.1 Documentation with approximately
9500 sub-directories and files that are generated by (a) EncCon’s
partitioning algorithm and (b) Squarified Tree-Maps’ partitioning
algorithm.
Figure 15 The layouts of the fifth experimental data set: a very
large data with approximately 50,000 nodes that are generated
by (a) EncCon’s partitioning algorithm and (b) Squarified Tree-
Maps’ partitioning algorithm.
EncCon Quang Vinh Nguyen and Mao Lin Huang
14
Information Visualization
Then the Average Edge Length AL of all edges in graph Gcan be calculated by the following formula:
AL ¼ 1
n
Xn
j¼1
lej: ð11Þ
This aesthetic rule, in conventional graph drawing, isdefined based on the assumption that all edges andvertices of a given graph are assigned the same value fortheir graphical attributes. For example, under thisassumption all vertices will use the same style of icons(nodes) with the same size and same background for theirvisual presentation, and all edges will use the samegraphical line-type with the same thickness and the samebrightness for their visual presentation.
However, in EnclosureþConnection visualization, theabove assumption no longer holds. In EncCon, verticesand edges at different levels of the hierarchy areassociated with different graphical attributes or differentvalues of the same attributes. Fortunately, all vertices andedges in the same level of the hierarchy are assigned thesame graphical attributes and the same value of thesegraphical attributes.
We believe that it is unfair to count all edges ofdifferent levels with different visual effects for the
calculation of this single measurement. Therefore, wemodify this aesthetic by calculating the AL0, AL1, and AL2
of all edges at different levels, respectively, 0, 1, and 2, ofthe hierarchy separately. Table 3 shows the Average EdgeLength of five different layouts at the top three levels ofthe hierarchy, generated by Squarified Tree-Maps andEncCon partitioning algorithms.
Uniform Edge Length Like the Angular Resolution aes-thetic we described above, the Uniform Edge Lengthaesthetic is for the measurement of the average lengthvariance of all edges of a given graph (or a sub-graph). Weaim to minimize the variance of the lengths of the edges.An optimized graph layout should have all edge lengthsas uniform as possible.
Suppose that G ¼ {V, E} is a graph, where the edge setE ¼ {e1, e2, y, en} with the corresponding edge lengths of{le1, le2, y, len}. The length lei of each edge ei can be easilycalculated by formula 10, and the Average Edge Length ALof all edges in graph G can be calculated by formula 11.Thus, the Average Length Variance ALV (in percentagescale) of all edges in G can be calculated by the followingformula:
ALV100%
Pnj¼1 jlej
� ALjn AL
: ð12Þ
We also calculate three values ALV0, ALV1, and ALV2 forthree different levels of the hierarchy separately becauseof the above reason. Table 4 shows the Average LengthVariance of five different layouts at the top three levels ofthe hierarchy, generated by Squarified Tree-Maps’ andEncCon’s partitioning algorithms.
Results of the evaluationThe results of the evaluation based on the above criteriaare summarized in Figure 16. This figure shows acomparison of the edge crossings, Angular Resolution, TotalEdge Length, and Uniform Edge Length between two seriesof layouts, generated by Squarified Tree-Maps partitioningand EncCon’s circular partitioning. Five experiments werecarried out with five different data sets, covering small,medium, moderately large, large and very large hierarch-ical data examples (see layouts from Figures 11 to 15).
Overall, from the result of comparisons, we can see thatfor medium and moderately large data sets EncCon’spartitioning performs significantly better than Squarified
Table 1 Numbers of the edge crossings in top three levels
Squarified
Tree-Maps
EncCon
No. of crossings in data set 1 0 0
No. of crossings in data set 2 32 8
No. of crossings in data set 3 812 276
No. of crossings in data set 4 44 58
No. of crossings in data set 5 8 12
Table 2 Angular resolution
Squarified
Tree-Maps
EncCon
AV value in data set 1 11.08 15
AV value in data set 2 42.97 32.42
AV value in data set 3 43.44 43.35
AV value in data set 4 48.73 45.28
AV value in data set 5 30.71 25.88
Table 3 Average Edge Length (the size of display is: 700700 pixels)
Level 0 – AL0 Level 1 – AL1 Level 2 – AL2
Squarified EncCon Squarified EncCon Squarified EncCon
Data set 1 265.06 263.9 117.25 116.2 0 0
Data set 2 309.11 300.06 97.6 99.52 105.83 112.08
Data set 3 339.91 339.86 76.09 87.82 29.59 31.26
Data set 4 326.91 307.95 155.97 168.44 38.52 48.41
Data set 5 268.73 279 92.3 92.55 41.29 45.47
EncCon Quang Vinh Nguyen and Mao Lin Huang
15
Information Visualization
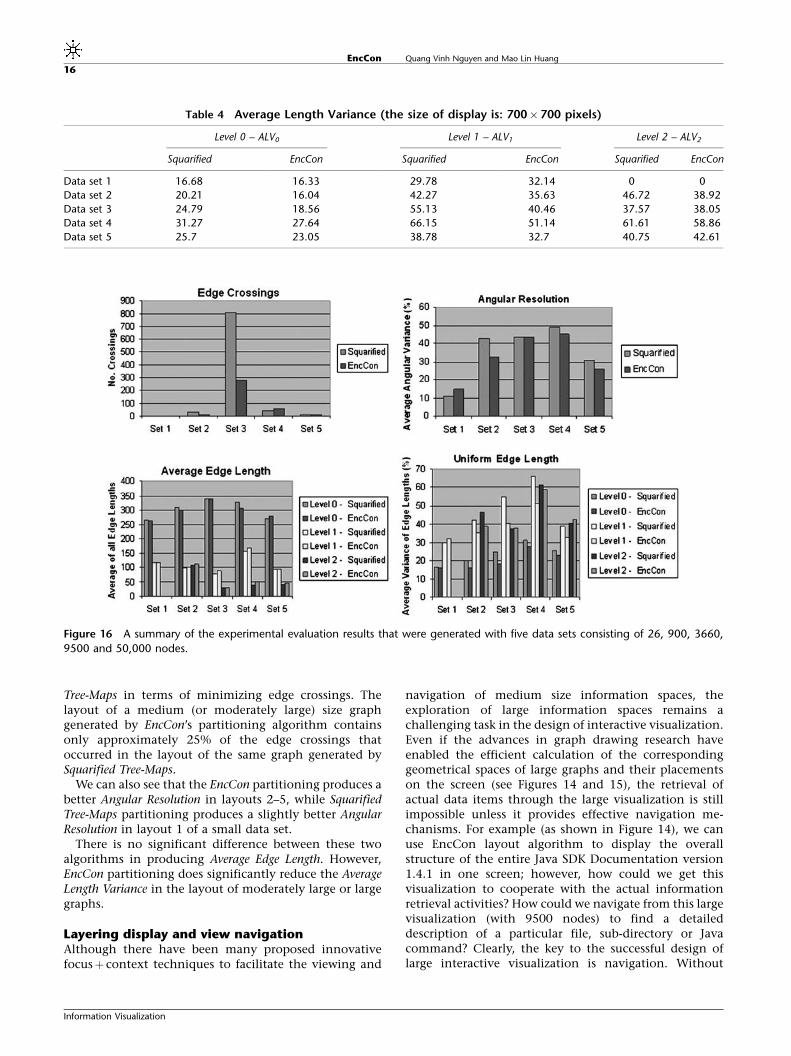
Tree-Maps in terms of minimizing edge crossings. Thelayout of a medium (or moderately large) size graphgenerated by EncCon’s partitioning algorithm containsonly approximately 25% of the edge crossings thatoccurred in the layout of the same graph generated bySquarified Tree-Maps.
We can also see that the EncCon partitioning produces abetter Angular Resolution in layouts 2–5, while SquarifiedTree-Maps partitioning produces a slightly better AngularResolution in layout 1 of a small data set.
There is no significant difference between these twoalgorithms in producing Average Edge Length. However,EncCon partitioning does significantly reduce the AverageLength Variance in the layout of moderately large or largegraphs.
Layering display and view navigationAlthough there have been many proposed innovativefocusþ context techniques to facilitate the viewing and
navigation of medium size information spaces, theexploration of large information spaces remains achallenging task in the design of interactive visualization.Even if the advances in graph drawing research haveenabled the efficient calculation of the correspondinggeometrical spaces of large graphs and their placementson the screen (see Figures 14 and 15), the retrieval ofactual data items through the large visualization is stillimpossible unless it provides effective navigation me-chanisms. For example (as shown in Figure 14), we canuse EncCon layout algorithm to display the overallstructure of the entire Java SDK Documentation version1.4.1 in one screen; however, how could we get thisvisualization to cooperate with the actual informationretrieval activities? How could we navigate from this largevisualization (with 9500 nodes) to find a detaileddescription of a particular file, sub-directory or Javacommand? Clearly, the key to the successful design oflarge interactive visualization is navigation. Without
Table 4 Average Length Variance (the size of display is: 700700 pixels)
Level 0 – ALV0 Level 1 – ALV1 Level 2 – ALV2
Squarified EncCon Squarified EncCon Squarified EncCon
Data set 1 16.68 16.33 29.78 32.14 0 0
Data set 2 20.21 16.04 42.27 35.63 46.72 38.92
Data set 3 24.79 18.56 55.13 40.46 37.57 38.05
Data set 4 31.27 27.64 66.15 51.14 61.61 58.86
Data set 5 25.7 23.05 38.78 32.7 40.75 42.61
Figure 16 A summary of the experimental evaluation results that were generated with five data sets consisting of 26, 900, 3660,
9500 and 50,000 nodes.
EncCon Quang Vinh Nguyen and Mao Lin Huang
16
Information Visualization
providing efficient navigation mechanisms that coop-erate with large displays, the visualization technique isuseless in the field of information retrieval, which aims toassist users to retrieve the particular data items they want.
Most existing focusþ context techniques require thedivision of display areas for the display of both the globalview (or the context view) and the detail view (or the focusview), such as Information Slices43 and Bifocal Tree.44 Thus,the available display space left for displaying the globalstructure (as well as the focus view) is getting smaller (seeFigure 3). Other techniques apply multiple windows todisplay the global context and the focus view of informa-tion.45 However, the use of separate windows breaks thecontext (or nature connection) between two views. Thiscosts viewers extra cognitive efforts to link two views intoone context.
To be able to efficiently handle the viewing/navigationof large data sets and address the above problem, EncConuses a new zoomingþ layering concept to achieve thefocusþ context viewing of large hierarchies. This techni-que is different from the traditional enlargeþ embeddedconcept which is used by other focusþ context techni-ques. Technically, it employs a semi-transparency graphi-cal technique to achieve the display of two layers in thevirtual z-coordination at the same physical screen. Thisallows both the context view and the detail view to bedrawn at two separate layers. These layers are thendisplayed in an overlapped manner at the same physicalscreen space. The EncCon always keeps one view in ahighlighted and another in a de-emphasized state.
The focus view is displayed in a full screen with moredetails for users to see. The system allows the viewer tointeractively shift the highlighting by bring the view tothe front/back between the global view and the detail view.This improves the utility of the display space while stillproviding both the focus and the context information.The viewing technique is independent of the layoutalgorithm, and thus, it can be applied to other layoutalgorithms.
The navigation in EncCon is achieved interactively bysemantic zooming, updating views and swapping viewsbetween layers. All these transactions are accommodatedby animation to preserve the user’s mental map of views.
The transparency techniques have been used in anumber of three-dimensional visualization systems, suchas the Information Cube,39 Cone-Tree15 and the SpiralCalendar,40 etc, to solve the overlapping problem inthree-dimensional viewing. However, these systems didnot use the transparency technique for navigatingabstract graphs in two-dimensional spaces. Lieberman41
also presented a good technique for navigating geometry-related information spaces. However, his research focus ison the navigation of a spatial metaphor in which the datapresentation is based on the graphical rendering techni-ques. We adapted his transparency idea and applied it tothe navigation of graph visualization, in which adifferent visual metaphor ‘the abstract graph’ is used forrepresenting data.
In our visualization, the global view is overlapped withthe detail view and they are displayed in two separategraphical layers of the same physical screen with differentvisibility values. As the default mode of the display, thefocus view is drawn in full screen size on layer 1 of thedisplay while the context view is drawn in a reduced size atthe centre of layer 2. The purpose of this arrangement isto reduce the distraction between two views. Thedistractions may occur when there are too many overlapsamong nodes between two views. At the default mode, weassign a visible value to layer 1 and a semi-transparencyvalue to layer 2. The size of global view can beinteractively adjusted to suit the user’s preference. Inour application, the default size of the global view is a halfof the entire display area.
There are two modes of the display: ‘default’ and‘context’. In the ‘default’ mode, we assume that the user’sattention is on the content of a particular detailed sub-structure from the entire information structure. However,it is quite possible that a user moves his attention from adetailed sub-structure to the content of the globalstructure during navigation. Therefore, we defined a‘context’ display mode that shifts the visibility valuesbetween two display layers. Practically, we re-assign avisible value to layer 2 (the global view) allowing users tosee the content of the global structure and turn off thevisible to semi-transparency for layer 1 (the detail view). Inother words, in the ‘context’ mode, the display is reversedso that the global view is brought from the back to thefront and highlighted and the detail view is sent from thefront to the back and displayed in a semi-transparentmanner. These two views can be shifted interactively byusing left mouse-click on the background of each layer.The shifting between views is accommodated by fade in/out animation to preserve the user’s mental map of views.
The background of the context view is painted with aslightly darkened colour in comparison with the detailview’s background. This helps the context view to stand outfrom the detail view. The selected sub-hierarchy is alsohighlighted in the context view by using a differentbackground colour as well as selected node. This propertyhelps to improve the clarity of the display. The contextview in this visualization can be either the view of theentire hierarchy or the view of a sub-hierarchy, which ispreviously displayed as a detail view before a user selects aparticular subset from this context.
In our visualization, the selection of a focus visual nodev (a sub-hierarchy or an object) is the main mode ofinteractions taken by users during the navigation. Thisinteraction can be applied to any visible node v at thedetail view or context view in order to utilize a semanticzooming technique22 to enlarge the display of local regionR(v) into the full screen and bring it to layer 1 as a newdetail view, which overrides the previous display of layer 1.The system can also return the context view back to thedetail view by a right mouse clicking. The context viewthen will be enlarged through semantic zooming and canbe brought from layer 2 to layer 1 for full screen display.
EncCon Quang Vinh Nguyen and Mao Lin Huang
17
Information Visualization
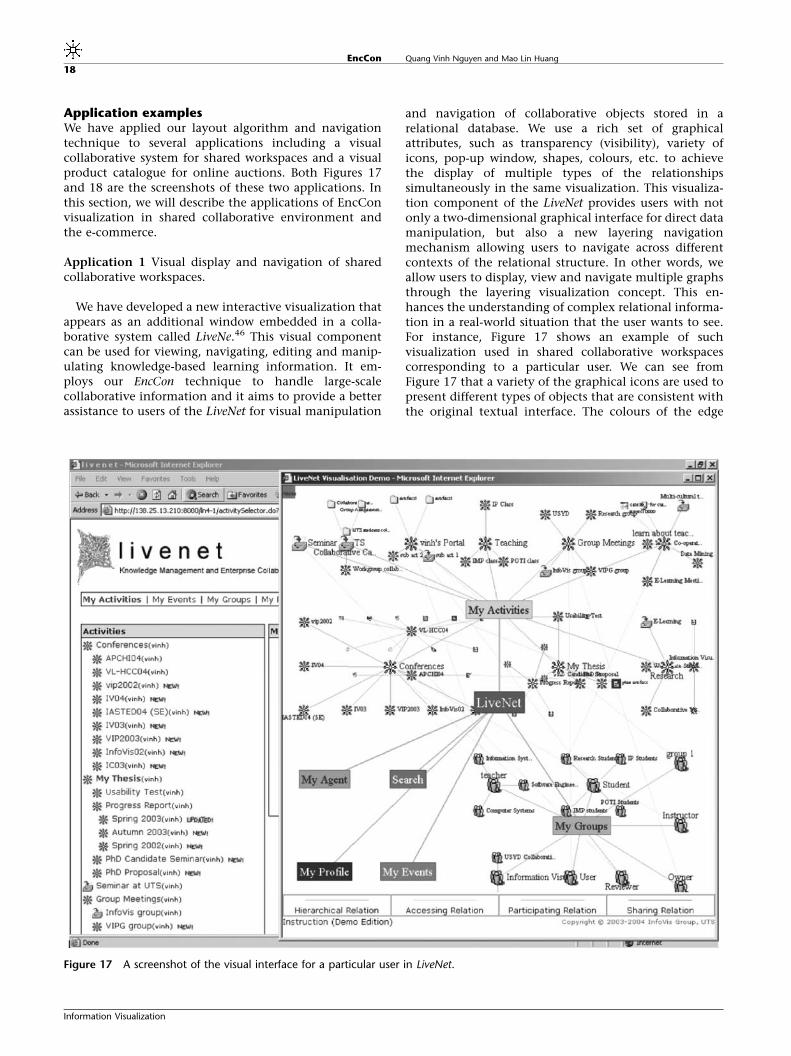
Application examplesWe have applied our layout algorithm and navigationtechnique to several applications including a visualcollaborative system for shared workspaces and a visualproduct catalogue for online auctions. Both Figures 17and 18 are the screenshots of these two applications. Inthis section, we will describe the applications of EncConvisualization in shared collaborative environment andthe e-commerce.
Application 1 Visual display and navigation of sharedcollaborative workspaces.
We have developed a new interactive visualization thatappears as an additional window embedded in a colla-borative system called LiveNe.46 This visual componentcan be used for viewing, navigating, editing and manip-ulating knowledge-based learning information. It em-ploys our EncCon technique to handle large-scalecollaborative information and it aims to provide a betterassistance to users of the LiveNet for visual manipulation
and navigation of collaborative objects stored in arelational database. We use a rich set of graphicalattributes, such as transparency (visibility), variety oficons, pop-up window, shapes, colours, etc. to achievethe display of multiple types of the relationshipssimultaneously in the same visualization. This visualiza-tion component of the LiveNet provides users with notonly a two-dimensional graphical interface for direct datamanipulation, but also a new layering navigationmechanism allowing users to navigate across differentcontexts of the relational structure. In other words, weallow users to display, view and navigate multiple graphsthrough the layering visualization concept. This en-hances the understanding of complex relational informa-tion in a real-world situation that the user wants to see.For instance, Figure 17 shows an example of suchvisualization used in shared collaborative workspacescorresponding to a particular user. We can see fromFigure 17 that a variety of the graphical icons are used topresent different types of objects that are consistent withthe original textual interface. The colours of the edge
Figure 17 A screenshot of the visual interface for a particular user in LiveNet.
EncCon Quang Vinh Nguyen and Mao Lin Huang
18
Information Visualization
represent different types of the relationships, such as theclassification, the accessing, the participating, and the sharingrelationships.
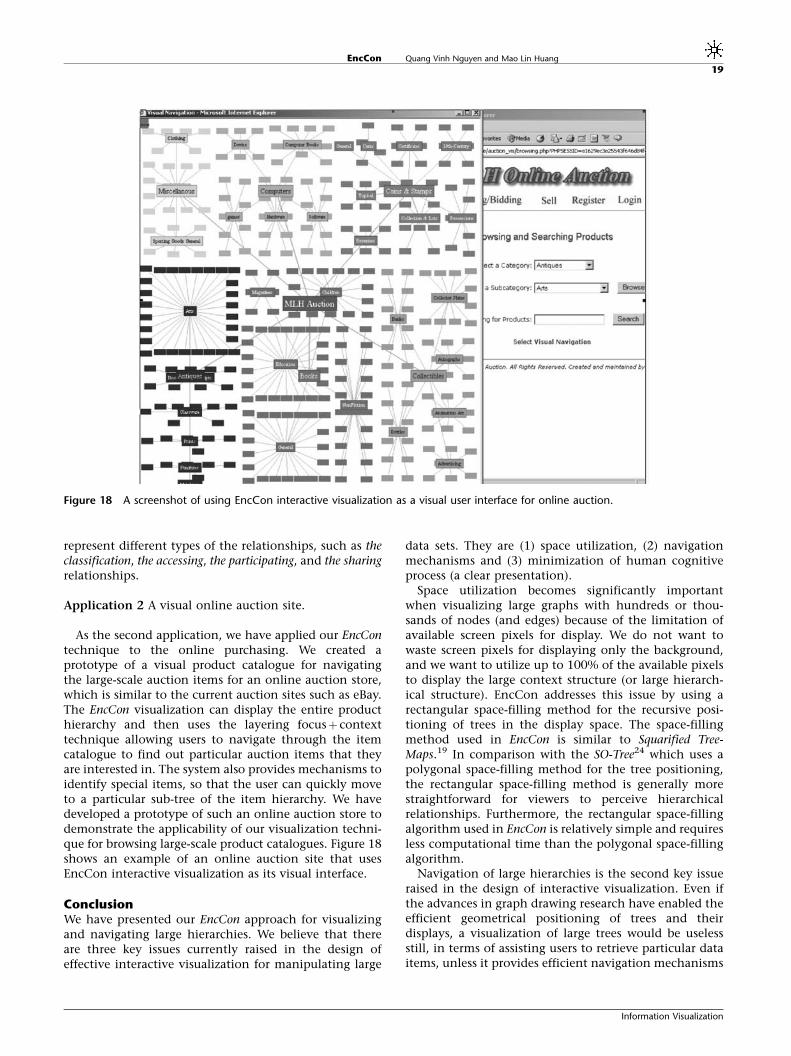
Application 2 A visual online auction site.
As the second application, we have applied our EncContechnique to the online purchasing. We created aprototype of a visual product catalogue for navigatingthe large-scale auction items for an online auction store,which is similar to the current auction sites such as eBay.The EncCon visualization can display the entire producthierarchy and then uses the layering focusþ contexttechnique allowing users to navigate through the itemcatalogue to find out particular auction items that theyare interested in. The system also provides mechanisms toidentify special items, so that the user can quickly moveto a particular sub-tree of the item hierarchy. We havedeveloped a prototype of such an online auction store todemonstrate the applicability of our visualization techni-que for browsing large-scale product catalogues. Figure 18shows an example of an online auction site that usesEncCon interactive visualization as its visual interface.
ConclusionWe have presented our EncCon approach for visualizingand navigating large hierarchies. We believe that thereare three key issues currently raised in the design ofeffective interactive visualization for manipulating large
data sets. They are (1) space utilization, (2) navigationmechanisms and (3) minimization of human cognitiveprocess (a clear presentation).
Space utilization becomes significantly importantwhen visualizing large graphs with hundreds or thou-sands of nodes (and edges) because of the limitation ofavailable screen pixels for display. We do not want towaste screen pixels for displaying only the background,and we want to utilize up to 100% of the available pixelsto display the large context structure (or large hierarch-ical structure). EncCon addresses this issue by using arectangular space-filling method for the recursive posi-tioning of trees in the display space. The space-fillingmethod used in EncCon is similar to Squarified Tree-Maps.19 In comparison with the SO-Tree24 which uses apolygonal space-filling method for the tree positioning,the rectangular space-filling method is generally morestraightforward for viewers to perceive hierarchicalrelationships. Furthermore, the rectangular space-fillingalgorithm used in EncCon is relatively simple and requiresless computational time than the polygonal space-fillingalgorithm.
Navigation of large hierarchies is the second key issueraised in the design of interactive visualization. Even ifthe advances in graph drawing research have enabled theefficient geometrical positioning of trees and theirdisplays, a visualization of large trees would be uselessstill, in terms of assisting users to retrieve particular dataitems, unless it provides efficient navigation mechanisms
Figure 18 A screenshot of using EncCon interactive visualization as a visual user interface for online auction.
EncCon Quang Vinh Nguyen and Mao Lin Huang
19
Information Visualization
in collaboration with the display. EncCon uses a newzoomingþ layering concept to achieve the focusþ contextviewing of large hierarchies, rather than the traditionalenlargeþ embedded approach, which is used by most of theexisting focusþ context techniques. Technically, it em-ploys a semi-transparent graphical technique to achievethe concurrent display of two separate layers of informa-tion on the same physical screen. This alternativeapproach enlarges the display areas for displaying contextview and detailed view and allows more information to bepresented in both views. The navigation in EncCon isachieved interactively by semantic zooming, updatingviews and swapping views between layers. All thesetransactions are accommodated by animation to preservethe user’s mental map of the views.
The third issue we attempted to address is theminimization of the human cognitive process involvedin identifying the relational structure of large graphs. Thelarge graphs usually contain hundreds or thousands ofrelationships, and therefore a clear presentation of suchlarge numbers of relationships is essential for easyunderstanding and avoidance of confusion in viewingsuch complex relational structures. To be able to enhancethe perception of large relational structures for human
understanding, EncCon still uses a node-link diagram toshow the relationships explicitly in addition to the space-filling approach used for addressing the space utilizationissue. Furthermore, to reduce the human cognitive cost,we adopt a rectangular space-filling approach, ratherthan a polyclonal space-filling approach for the position-ing of graphs.
As it addresses all three issues presented above, webelieve that EncCon is an effective approach to createinteractive visualization of large tree-structured relationaldata. However, there are still some problems that need tobe solved. For example, we need to solve the problem ofoverlapping among nodes between layers even if it is notvery significant since layer 2 is displayed in a semi-transparent manner.
In the future, we will investigate optimized graphicaltechniques and layout algorithms to minimize the effectof our layered display in human cognition processes.Although the layering navigation technique is indepen-dent of the layout, it works better with optimized layoutsof the node–link diagram. We believe that by adoptingoptimized layout algorithms, the overlap among nodesbetween the context view and the detail view will becomeinsignificant.
References1 Ware C. Information Visualization: Perception For Design. Morgan
Kaufmann Series in Interactive Technologies, Morgan Kaufmann:San Francisco, CA, 2000, 438pp.
2 Chen C. Information Visualization and Virtual Environments. Springer-Verlag: London, 1999, 223pp.
3 Reingold EM, Tilford JS. Tidier drawing of trees. IEEE Transactions onSoftware Engineering 1981; 7: 223–228.
4 Johnson B, Shneiderman B. Tree-maps: a space-filling approach tothe visualization of hierarchical information structures. The 1991 IEEEVisualization 1991 (Piscataway, NJ, USA). IEEE Computer SocietyPress: Silver Spring, MD, 1991; 284–291.
5 Shiloach Y. Arrangements of planar graphs on the planar lattices.Ph.D. thesis, Weizmann Institute of Science, Rehovot, Israel, 1976.
6 Eades P. Drawing free trees. Bulletin of the Institute of Combinatoricsand its Applications 1992; 5: 10–36.
7 Melancon G, Herman I. Circular Drawings of Rooted Trees. TechnicalReport of the Centre for Mathematics and Computer Sciences.Amsterdam, The Netherlands, 1998, INS-R9817.
8 Chi EH, Pitkow J, Mackinlay JD, Pirolli P, Gossweiller R, Card SK.Visualizing the evolution of web ecologies. CHI’98 Conference onHuman Factors in Computing Systems 1998 (Los Angeles, CA, USA).ACM Press: New York, 1998, 400–407, 644–645.
9 Wills GJ. NicheWorks – interactive visualization of very large graphs.Journal of Computational and Graphical Statistics 1999; 8 (2):190–212.
10 Teoh ST, Ma K-L. RINGS: a technique for visualizing large hierarchies.Graph Drawing 2002 (Irvine, CA, USA). Springer: Berlin, 2002;268–275.
11 Hendley RJ, Drew NS, Wood AM, Beale R. Narcissus: visualizinginformation. Information Visualization ’95 Symposium 1995 (Atlanta,GA, USA). IEEE Press: New York, 1995; 90–96.
12 Plaisant C, Grosjean J, Bederson BB. SpaceTree: supporting explo-ration in large node link tree, design evolution and empiricalevaluation. IEEE Symposium on Information Visualization (InfoVis2002) 2002 (Boston, MA, USA). IEEE Press: New York, 2002; 57–64.
13 Lamping J, Rao R. The Hyperbolic browser: a focus+contexttechnique for visualizing large hierarchies. Journal of Visual Languagesand Computing 1996; 7: 33–55.
14 Munzner T. Exploring large graphs in 3D hyperbolic space. IEEEComputer Graphics & Applications 1997; 18: 18–23.
15 Robertson GG, Mackinlay JD, Card SK. Cone tree: animated 3Dvisualizations of hierarchical information. ACM SIGCHI conference onHuman Factors in Computing Systems ’91 1991 (New York, USA). ACMPress: New York, 1991; 189–194.
16 Kleiberg E, van de Wetering H, van Wijk JJ. Botanical visualization ofhuge hierarchies. IEEE Symposium on Information Visualization(InfoVis’01) 2001 (San Diego, CA, USA). IEEE Computer SocietyPress: Silver Spring, MD, 2001; 87–94.
17 Cheswick B, Burch H, Branigan S. Mapping and visualizing theinternet. 2000 USENIX Annual Technical Conference 2000 (San Diego,CA, USA). USENIX: Berkeley, CA, 2000; 1–12.
18 van Wijk JJ, van de Wetering H. Cushion treemaps: visualization ofhierarchical information. IEEE Symposium on Information Visualization(InfoVis’99) 1999 (San Francisco, CA, USA). IEEE Computer SocietyPress: Silver Spring, MD, 1999; 73–78.
19 Bruls M, Huizing K, van Wijk JJ. Squarified Treemaps. jointEurographics and IEEE TCVG Symposium on Visualization 2000 (Vienna,Austria). Springer: Berlin, 2000; 33–42.
20 Stasko J, Zhang E. Focus+context display and navigation techniquesfor enhancing radial, space-filling hierarchy visualizations. IEEESymposium on Information Vizualization (InfoVis’00) 2000 (Salt LakeCity, UT, USA). IEEE Press: New York, 2000; 57–65.
21 Yang J, Ward MO, Rundensteiner EA. InterRing: an interactivetool for visually navigating and manipulating hierarchical structures.IEEE Symposium on Information Visualization (InfoVis’02) 2002(Boston, MA, USA). IEEE Computer Society Press: Silver Spring,MD, 2002; 77–84.
22 Herman I, Melancon G, Marshall MS. Graph visualization ininformation visualization: a survey. IEEE Transactions on Visualizationand Computer Graphics 2000; 6: 24–44.
23 Bederson BB, Shneiderman B, Wattenberg M. Ordered and quantumtreemaps: making effective use of 2D space to display hierarchies.ACM Transactions on Graphics (TOG) 2002; 21: 833–854.
24 Nguyen QV, Huang ML. Space-optimized tree: a connection+enclo-sure approach for the visualization of large hierarchies. InformationVisualization Journal 2003; 2: 3–15.
EncCon Quang Vinh Nguyen and Mao Lin Huang
20
Information Visualization

25 Song H, Curran EP, Sterritt R. Multiple foci visualisation of largehierarchies with FlexTree. Information Visualization Journal 2004; 3:19–35.
26 Furnas GW. Generalized fisheye views. SIGCHI ’86 Conference onHuman Factors in Computing Systems 1986 (Boston, MA). ACM Press:New York, 1986; 15–22.
27 Sarkar M, Brown MH. Graphical Fisheye views. Communications of theACM 1994; 37: 73–84.
28 Kadmon N, Shlomi E. A polyfocal projection for statistical surfaces.The Cartographic Journal 1978; 15: 36–41.
29 Spence R, Apperley MD. A bifocal display technique for datapresentation. Proceedings of Eurographics’1982 (North Holland).Eurographics Association: Switzerland, 1982; 27–43.
30 Mackinlay JD, Robertson GG, Card SK. The perspective wall: detailand context smoothly integrated. ACM Computer–Human Interaction’91 Conference on Human Factors in Computing Systems 1991(New York, USA). ACM Press: New York, 1991; 173–179.
31 Jog NK, Shneiderman B. Starfield visualization with interactivesmooth zooming. IFIP 2.6 Visual Database Systems 1995 (Lausanne,Switzerland). Chapman & Hall: London, 1995; 3–14.
32 Perlin K, Fox D. Pad: an alternative approach to the computerinterface. The 20th International Conference on Computer Graphics andInteractive Techniques (ACM SIGGRAPH ’93) 1993 (New York, USA).ACM Press: New York, 1993; 57–64.
33 Bederson BB, Hollan JD, Perlin K, Meyer J, Bacon D, Furnas GW.Pad++: a zoomable graphical sketchpad for exploring alternateinterface physics. Journal of Visual Languages and Computing 1996; 7:3–32.
34 Bederson BB, Grosjean J, Meyer J. Toolkit design for interactivestructured graphics. Transactions on Software Engineering 2004; 30:535–546.
35 Huang ML, Eades P, Cohen RF. On-line animated visualization ofhuge graphs using a modified spring algorithm. Journal of VisualLanguages and Computing 1998; 9: 623–645.
36 North SC. Incremental Layout in DynaDAG. Graph Drawing (GD ’95)1996 (Passau, Germany). Springer: Berlin, 1996; 409–418.
37 Brandes U, Wagner D. A Bayesian paradigm for dynamic graph layout.The Symposium on Graph Drawing (GD’97) 1997 (Rome, Italy). IEEEComputer Society Press: Silver Spring, MD, 1997; 236–247.
38 Huang ML, Eades P, Cohen RF. WebOFDAV – navigating andvisualizing the web on-line with animated context swapping. WWW7/Computer Networks 1998; 30: 638–642.
39 Rekimoto J, Green M. The information cube: using transparency in3D information visualization. Third Annual Workshop on InformationTechnologies & Systems (WITS’1993). (Orlando, FL, U.S.A.), WITS,1993; 125–132.
40 Mackinlay JD, Robertson GG, DeLine R. Developing calendarvisualizers for the information visualizer. ACM Symposium on UserInterface Software and Technology 1994 (UIST 094) 1994 (Marina delRey, CA, USA). ACM Press: New York, 1994; 109–118.
41 Lieberman H. Powers of ten thousand: navigating in large informa-tion spaces. ACM Symposium on User Interface Software andTechnology 1994 (Marina del Rey, CA, USA). ACM Press: New York,1994; 15–16.
42 Di Battista G, Eades P, Tamassia R, Tollis IG. Graph Drawing:Algorithms for the Visualization of Graphs. Prentice-Hall: EnglewoodCliffs, NJ, 1999, 397pp.
43 Andrews K, Heidegger H. Information slices: visualising and exploringlarge hierarchies using cascading, semi-circular discs. Late-Breaking HotTopics - IEEE Symposium on Information Visualization (InfoVis’98) 1998(Research Triangle Park, NC, USA). IEEE Press: New York, 1998; 9–12.
44 Cava RA, Luzzardi PRG, Freitas CMDS. The bifocal tree: a techniquefor the visualization of hierarchical information structures. Workshopon Human Factors in Computer Systems (IHC2002) 2002 (Fortaleza,Brazil).
45 Robert JC. On encouraging multiple views for visualisation. Interna-tional Conference on Information Visualisation (IV 1998) 1998(London, UK). IEEE Computer Society Press: Silver Spring, MD,1998; 8–14.
46 Hawryszkiewycz I. Workspace networks for knowledge sharing. FifthAustralian World Wide Web Conference (AusWeb99) 1999 (Sydney,Australia) 1999; 219–227.
Supplementary Information accompanies the paper on Information Visualization website (http://www.palgrave.com/ivs).
EncCon Quang Vinh Nguyen and Mao Lin Huang
21
Information Visualization