apatite mineralization and their host rocks - CORE
134
Mineral chemistry of magnetite from magnetite- apatite mineralization and their host rocks: Examples from Kiruna, Sweden and El Laco, Chile Shannon G. Broughm A thesis submitted to the Department of Earth Sciences in partial fulfillment of the requirements for the degree of Master of Science. Memorial University of Newfoundland
-
Upload
khangminh22 -
Category
Documents
-
view
1 -
download
0
Transcript of apatite mineralization and their host rocks - CORE

Mineral chemistry of magnetite from magnetite-
apatite mineralization and their host rocks:
Examples from Kiruna, Sweden
and El Laco, Chile
Shannon G. Broughm
A thesis submitted to the Department of Earth Sciences in partial fulfillment of the
requirements for the degree of Master of Science.
Memorial University of Newfoundland
ii
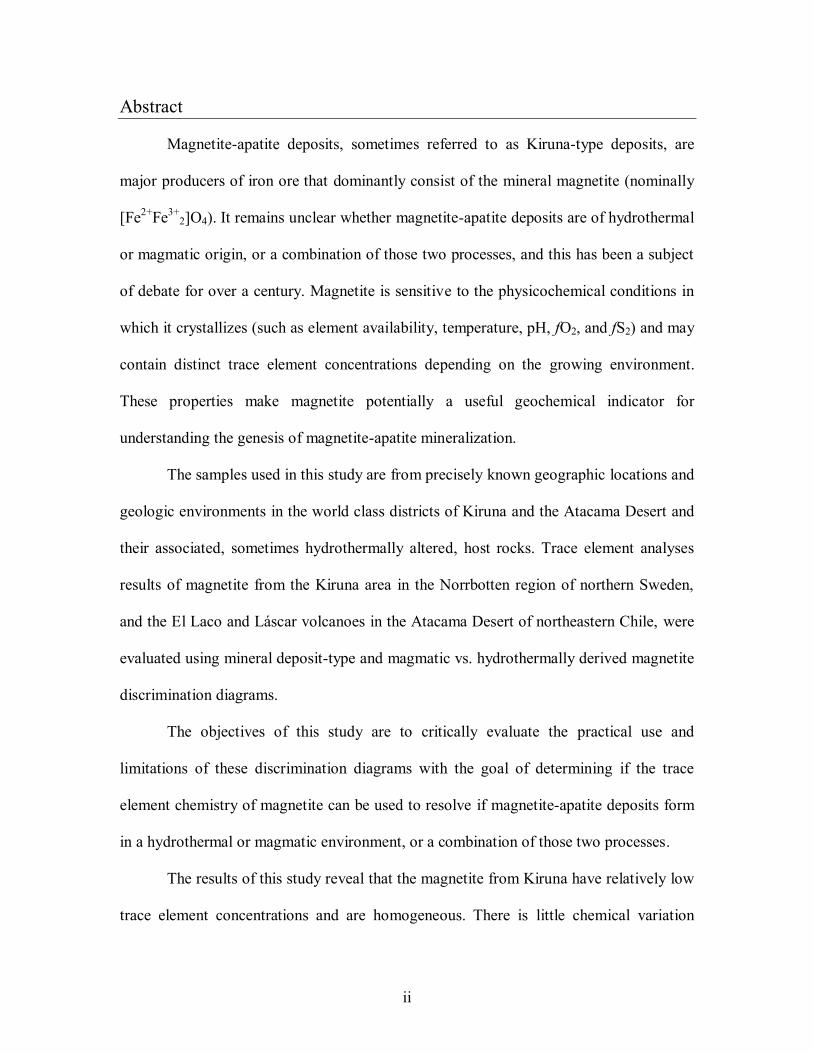
Abstract
Magnetite-apatite deposits, sometimes referred to as Kiruna-type deposits, are
major producers of iron ore that dominantly consist of the mineral magnetite (nominally
[Fe2+
Fe3+
2]O4). It remains unclear whether magnetite-apatite deposits are of hydrothermal
or magmatic origin, or a combination of those two processes, and this has been a subject
of debate for over a century. Magnetite is sensitive to the physicochemical conditions in
which it crystallizes (such as element availability, temperature, pH, fO2, and fS2) and may
contain distinct trace element concentrations depending on the growing environment.
These properties make magnetite potentially a useful geochemical indicator for
understanding the genesis of magnetite-apatite mineralization.
The samples used in this study are from precisely known geographic locations and
geologic environments in the world class districts of Kiruna and the Atacama Desert and
their associated, sometimes hydrothermally altered, host rocks. Trace element analyses
results of magnetite from the Kiruna area in the Norrbotten region of northern Sweden,
and the El Laco and Láscar volcanoes in the Atacama Desert of northeastern Chile, were
evaluated using mineral deposit-type and magmatic vs. hydrothermally derived magnetite
discrimination diagrams.
The objectives of this study are to critically evaluate the practical use and
limitations of these discrimination diagrams with the goal of determining if the trace
element chemistry of magnetite can be used to resolve if magnetite-apatite deposits form
in a hydrothermal or magmatic environment, or a combination of those two processes.
The results of this study reveal that the magnetite from Kiruna have relatively low
trace element concentrations and are homogeneous. There is little chemical variation

iii
between the ore, the hydrothermally altered host rocks, and related igneous intrusives
from Kiruna, which may be a result of pervasive post-formation alteration due to
extensive metasomatism and later greenschist facies metamorphism that has affected the
region. Distinct chemical variations do exist, however, in the magnetite at El Laco
between magnetite from the Laco Sur magnetite-apatite ore and host andesite, and a
dacite sample from the nearby Láscar volcano. Accessory magnetite from the host
andesite and Láscar dacite volcanic rocks have relatively high trace element
concentrations, typical of magnetite crystallizing from a melt and; with overall trace
element concentrations higher than the magnetite-apatite ore, or the Kiruna magnetites.
The Laco Sur ore magnetite has low overall low trace element concentrations and
displays growth zoning defined by incompatible elements (Si, Ca), compatible elements
(Mg, Al, and Mn), LILE (Sr) and HFSE (Y, Nb, Ce and Th) with each element displaying
similar geochemical trends. While the trace element concentrations of the ore magnetite
at Laco Sur has cores that are enriched in incompatible element; similar to magnetite that
is known to have formed from hydrothermal fluids (such as magnetite from iron-rich
skarns), the trace element zoning patterns suggests that the magnetite crystallized from a
volatile-rich iron-oxide melt.

iv
Acknowledgments
I would like to thank those who funded this research, the Natural Sciences and
Engineering Research Council of Canada (NSERC) discovery grant to John M. Hanchar.
The contribution of Fernando Tornos has been funded by the project SEIDI 2014
CGL2014-55949-R.
Thanks to Luossavaara-Kiirunavaara Aktiebolag (LKAB) and Compañía Minera del
Pacífico (CMP) for help in logistics, and permission to sample and granting access to the
mine sites.
I want to express my gratitude to my supervisor John M. Hanchar for giving me
the opportunity to pursue this research and for providing valued feedback throughout.
A special thanks goes to Fernando Tornos and Anne Westhues who both provided
me with critical feedback throughout my research, especially during the compilation of
my manuscript. Thank you to Steve Piercey for being on my committee during this
project, allowing me to use the petrographic microscope in his research lab, and for
having good taste in music.
Thanks to Samuel Attersley for his magnetite data from El Laco, which made this
study vastly more interesting.
Many thanks to all my friends in Newfoundland (especially my office mate and
best friend Sarah Turner) who provided me with emotional support, and food, during
trying times while pursuing my M.Sc. degree.
Thank you to my family for believing in my success and financial contributions
when ends could not be met.

1
Table of Contents
Abstract ii
Acknowledgments iv
Chapter 1: Introduction to the Research 6
Introduction 6
Research Statement 7
Research Questions 9
Project Overview 9
Co-authorship Statement 10
Chapter 2:
Mineral chemistry of magnetite from magnetite-apatite mineralization and their
host rocks: Examples from Kiruna, Sweden and El Laco, Chile 13
Abstract 14
Introduction 15
Geologic background 21
Kiruna geology and magnetite-apatite ores 21
El Laco geology and magnetite-apatite ores 24
Láscar volcano 25
Analytical methods 25
Sample selection and preparation 25
EPMA analyses 27
X-ray maps 28
LA-ICPMS analyses 28
Results 30
El Laco magnetite textures and associated minerals 34
Kiruna magnetite X-ray maps 38
El Laco magnetite X-ray maps 38
Trace element chemistry of Kiruna magnetite 39

2
Trace element chemistry of the El Laco magnetite 40
Mineral deposit-type discrimination diagrams 42
Magmatic vs. hydrothermal magnetite discrimination diagrams 47
Discussion 52
The use of mineral deposit-type discrimination diagrams 53
The use of magmatic vs. hydrothermal magnetite discrimination diagrams 54
Magnetite chemistry at Kiruna 55
Magnetite chemistry at El Laco 57
Chapter 3: Summary 66

3
List of Figures
Fig. 1: Simplified geological maps of the study areas. 22
Fig. 2: LA-ICPMS BCR-2G average concentrations for this study. 30
Fig. 3: Mag BSE images and chemical X-ray maps; Kiirunavaara ore. 31
Fig. 4: Mag BSE images and chemical X-ray maps; smaller
magnetite-apatite ores in Kiruna. 33
Fig. 5: Mag BSE images and chemical X-ray maps Laco Sur ore. 35
Fig. 6: Mag BSE images and chemical X-ray maps; El Laco andesite,
Láscar volcano dacite. 37
Fig. 7: Trace element zoning in a Laco Sur ore Mag 41
Fig. 8: Loberg and Horndahl (1983) deposit-type Mag discrimination plots. 43
Fig. 9: Dupuis and Beaudoin (2011) deposit-type Mag discrimination plots. 45
Fig. 10. Knipping et al. (2015) Cr vs. V deposit-type Mag discrimination plot 46
Fig. 11. Nadoll et al. (2015) hydrothermal vs. magmatic (Ti vs V) Mag
discrimination plots. 48
Fig. 12: Dare at al. (2014) hydrothermal vs. magmatic (Ti vs Ni/Cr) Mag
discrimination plot 49
Fig. 13: Dare et al. (2014) hydrothermal vs. magmatic multi-element Mag
discrimination plots. 51

4
List of Appendices
Appendix I-
Sample list with GPS location, underground level (Kiruna samples) or Elevation
(El Laco and Láscar samples), rock type, mineralogy and magnetite textures. 69
Appendix II-
Summarized methods for EPMA Fe analysis and LA-ICPMS trace element analyses
of magnetite. 71
Appendix III-
Average (mean) LA-ICP-MS (ppm) and EPMA (Fe wt %) results for trace elements
used in plots from Kiruna and El Laco/Láscar magnetite samples. Minimum level
of detection (LOD) calculated by Iolite reported for each analysis session. 72
Appendix IV-
EPMA Fe results. Spot locations are shown on BSE images of magnetite grains
in Appendix VI. 75
Appendix V-
LA-ICPMS spot analysis results. Fe (wt. %) is the mean concentrations of three or
less EPMA analyses in the vicinity of LA-ICPMS spots. Spot locations are shown
on BSE images of magnetite grains in Appendix VI. 88
Appendix VI-
LA-ICPMS and EPMA spot analysis locations on BSE images for Kiruna and
El Laco magnetite. 106
Appendix VII-
LA-ICPMS spot analysis results for Mud Tank, Balmat and Bushveld magnetite.
Fe (wt%) is the mean concentrations of three or less EPMA analyses in the vicinity
of LA-ICPMS spots. Spot locations are shown on BSE images of magnetite grains
in Appendix VI. 124
Appendix VIII-
LA-ICPMS spot analysis results (ppm) for BCR-2G glass during the Kiruna
and El Laco analyses. 130

5
List of Abbreviations
Mag Magnetite
fO2 Oxygen fugacity
fS2 Sulfur fugacity
CVZ Central Volcanic Zone
EPMA Electron probe microanalyzer
LA-ICPMS Laser ablation-inductively coupled plasma mass spectrometer
LOD Level of detection
SEM Scanning electron microscope
BSE Back-scattered electron imaging
EDS Energy dispersive spectroscopy

6
Chapter 1: Introduction to the Research
Introduction
Genetic models for the formation of Kiruna-type magnetite-apatite deposits have
been debated for over a century (e.g., Geijer, 1910; Geijer, 1919; Parák, 1975; Frietsch,
1978; Nyström and Henríquez, 1994; Bergman et al., 2001). The relationship between the
host rock emplacement to their subsequent hydrothermal alteration and mineralization to
form magnetite-apatite deposits remains controversial (Hitzman et al., 1992; Williams et
al., 2005; Groves et al., 2010). Additional research is necessary in order to obtain a better
understanding of the processes involved in forming magnetite-apatite deposits (Groves et
al., 2010).
In a broad sense, there are two genetic models to describe how magnetite-apatite
deposits formed in favor today, with a third model that involves a combination of the first
two models: 1) Originating from immiscible iron-rich melts that separated from a silicate
melt and were emplaced at subvolcanic levels or erupted and cooled at the surface (e.g.,
Henríquez and Martin, 1978; Nyström and Henríquez, 1994; Naslund et al., 2002;
Nyström et al., 2008; Martinsson, 2016); 2) Metasomatic replacement of the host rocks
by hydrothermal fluids (e.g., Hitzman et al., 1992; Rhodes and Oreskes, 1999; Sillitoe
and Burrows, 2002; Edfelt et al., 2005; Groves et al., 2010; Valley et al., 2011; Dare et
al., 2015; Westhues et al., in press); and 3) a magmatic-hydrothermal combination of
these two models (e.g., Knipping et al., 2015; Tornos et al., 2016). A sedimentary-
exhalative origin was suggested by Parák (1975) but was not widely accepted (Frietsch,
1978; Nyström et al., 2008).

7
In this study, the trace element chemistry of magnetite was examined in situ from
world-class magnetite-apatite localities of Kiruna in Sweden and El Laco of the Atacama
Desert in Chile. The samples used in this study are from precisely known geographic
locations and geologic environments. In Kiruna, magnetite grains were analyzed from the
magnetite-apatite mineralization, footwall, hanging wall and spatially related felsic
intrusive rocks. At El Laco, magnetite grains from the magnetite-apatite mineralization
and host andesite rocks were analyzed. Magnetite from the volcanic rocks of the Láscar
volcano nearby to El Laco, which does not have any known occurrences of magnetite-
apatite mineralization, was also analyzed to compare with the andesite magnetite at El
Laco. The magnetite trace element analyses results were evaluated using mineral deposit-
type and magmatic vs. hydrothermally derived magnetite discrimination diagrams.
Research Statement
The present study was undertaken to bring insight into the controversial origin of
magnetite-apatite deposits through interpretation of the geochemical signatures of
magnetite. For this type of study, magnetite (nominally [Fe2+
Fe3+
2]O4) was investigated
because it has the following characteristics: 1) widespread occurrence in relevant deposit
types and host rock assemblages; 2) can accommodate a broad range of minor and trace
elements in its structure; and 3) is relatively resistant to weathering (i.e., mechanical and
chemical surface processes), which potentially makes it an ideal provenance indicator for
mineral exploration and useful for genetic studies of ore deposits (Lindsley, 1991;
Grigsby, 1990; Dupuis and Beaudoin, 2011; Dare et al., 2014; Nadoll et al., 2014).

8
Magnetite is a member of the spinel group of minerals, which have a cubic close-
packing structure with tetrahedral (A) and octahedral (B) sites in coordination with
oxygen anions. The magnetite crystal has the stoichiometry AB2O4 , where A= Fe2+
and
B= Fe3+
(Buddington and Lindsley, 1964; Lindsley, 1976). A variety of lithophile and
siderophile elements with similar ionic radii to Fe2+
and Fe3+
substitute into magnetite,
though in certain favorable physicochemical conditions chalcophile and other elements
can also be incorporated (Nadoll et al., 2014).
Empirical discrimination plots have been proposed illustrating that magnetite
from magnetite-apatite deposits contain distinct trace element chemical compositions
compared to magnetite from other deposit types, such as banded iron formations (BIF),
IOCG, porphyry Cu and Fe-Ti-V deposits (e.g., Loberg & Horndahl, 1983; Dupuis and
Beaudoin, 2011; Dare et al., 2014), as well as magnetite from unaltered volcanic rocks at
El Laco (e.g., Dare et al., 2015). Dare et al. (2015) proposed that the distinct trace
elements signatures of the magnetite from the magnetite-apatite ores at El Laco are
explained by replacement of the andesite host rocks through precipitation of magnetite
from Fe-rich fluids. The present study uses newly obtained data for magnetite trace
element geochemistry to assess the general practical use and limitations of the proposed
empirical magnetite discrimination diagrams; and whether they can be utilized in
interpreting the mineralization style and ore genesis of magnetite-apatite deposits.
The magnetite trace element chemistry was determined through in situ spot
analysis using a laser ablation inductively coupled mass spectrometer (LA-ICPMS). The
LA-ICPMS data were reduced with Iolite software (Paton et al., 2011) using Fe (wt%)

9
concentrations that were determined by an electron probe micro-analyzer (EPMA) from
the same areas of the grains.
Research Questions
Questions we address in this study include: 1) how useful are empirical magnetite
discrimination diagrams in determining the type of mineral deposit of the magnetite?; 2)
how useful are empirical magnetite discrimination diagrams in determining whether
magnetite has formed magmatically or hydrothermally?; and 3) Can the trace element
chemistry and textures of magnetite help shed light on the long-debated subject of how
magnetite-apatite deposits form?
Project Overview
The findings from this research have been presented as a manuscript found in
Chapter 2 of this thesis. The manuscript has been submitted to the journal Mineralium
Deposita.
Appendix I contains the complete sample list with details regarding GPS
coordinates, underground level (Kiirunavaara mine), Elevation (El Laco volcano), rock
type, mineralogy and textures of the magnetite. The location of these samples are shown
in Figure 1 of Chapter 2.
Appendix II contains summarized methods for EPMA and LA-ICPMS analysis of
the magnetite.
Appendix III contains the average (mean) results for EPMA and LA-ICPMS
analysis.
Appendix VI contains individual EPMA analysis for iron concentrations for each
sample. EPMA spot locations can be found in Appendix VI.

10
Appendix V contains LA-ICPMS data for each individual analysis. The Fe
concentrations are presented here as the average of three or less EPMA analysis points in
the vicinity of the corresponding LA-ICPMS spots; these values are also presented in
Appendix IV. LA-ICPMS spot locations can be found in Appendix VI.
Appendix VI shows BSE images of the magnetite grains that were analyzed with
the LA-ICPMS and EPMA spot locations for each sample.
Appendix VII contains LA-ICPMS and EPMA data for the Mudtank, Balmat, and
Bushveld magnetite that were analyzed as secondary standards. Exact spot locations are
not provided, as these magnetite grains were not analyzed in situ.
Appendix VIII contains LA-ICPMS spot analysis results for the primary standard
reference material BCR-2G glass during the Kiruna and El Laco analysis runs and the
Memorial University of Newfoundland long-term average for comparison. See Figure 2
in Chapter 2 for visual results of this data.
Co-authorship Statement
Each step of this thesis (i.e., the research proposal, practical aspects of the
research, data analysis, and initial preparation of the manuscript) was primarily done by
the author of this thesis, Shannon G. Broughm. The manuscript preparation, in Chapter 2,
into its submitted form was a collaborative effort with the co-authors of the manuscript,
however, the author of this thesis wrote the original draft of the manuscript.
References
Bergman S, Kubler L and Martinsson O (2001) Description of regional geological and geophysical maps of
northern Norrbotten County (east of the Caledonian Orogen). Sveriges Geologiska Undersokning
56:110
Buddington AF and Lindsley DG (1964) Iron-titanium oxide minerals and synthetic equivalents. J Petrol
5(2):310-357

11
Dare SAS, Barnes S-J, Beaudoin G, Méric J, Boutroy E and Potvin-Doucet C (2014) Trace elements in
magnetite as petrogenetic indicators. Miner Deposita 49:785-796
Dare SAS, Barnes S-J and Beaudoin G (2015) Did the massive magnetite “lava flows” of El Laco (Chile)
form by magmatic or hydrothermal processes? New contraints from magnetite composition by
LA-ICPMS. Miner Deposita 50:607-617
Dupuis C and Beaudoin G (2011) Discriminant diagrams for iron oxide trace element fingerprinting of
mineral deposit types. Miner Deposita 46:319-335.
Edfelt A, Armstrong RN, Smith M and Martinsson O (2005) Alteration paragenesis and mineral chemistry
of the Tjarrojakka apatite-rion and Cu (-Au) occurrences, Kiruna area, northern Sweden. Miner
Deposita 40:409-434
Frietsch R (1978) On the magmatic origin of iron ores of the Kiruna type. Econ Geol 73:478-485
Geijer P (1910) Igneous rocks and iron ores of Kiirunavaara, Luossavaara and Tuollavaara. Scientific and
practical researches in Lapland arranged by the Luossavaara-Kiirunavaara Aktiebolag - Geology of the Kiruna district, 2: Stockholm, p. 278
Geijer P (1919) Recent developments at Kiruna, SGU, C 288, p. 23
Grigsby JD (1990) Detrital magnetite as a provenance indicator. Journal of Sedimentary Petrology
60(6):940-951
Groves DI, Bierlein FP, Meinert LD and Hitzman MW (2010) Iron oxide copper-gold (IOCG) through
earths history: implications for origin, lithospheric setting, and distinction from other epigenic iron
oxide deposits. Econ Geol 105:641-654
Henríquez F and Martin RF (1978) Crystal growth textures in magnetite flows and feeder dykes, El Laco,
Chile, Can Miner 16:581-589
Hitzman MW, Oreskes N and Einaudi MT (1992) Geological Characteristics and Tectonic Setting of
Proterozoic Iron-Oxide (Cu-U-Au-Ree) Deposits. Precambrian Research 58:241-287
Knipping JL, Bilenker LD, Simon AC, Reich M, Barra F, Deditius AP, Wälle M, Heinrich CA, Holtz F and
Munizaga R (2015) Trace elements in magnetite from massive iron oxide-apatite deposits indicate
a combined formation by igneous and magmatic-hydrothermal processes. Geochim Cosmochim
Acta 171:15-38
Lindsley DH (1976) The crystal chemistry and structure of oxide minerals as exemplified by the Fe-Ti oxides. In Oxide minerals. Mineralogical Society of America, Short Course Notes 3:L-1 to L-60
Lindsley DH (1991) Oxide minerals: petrologic and magnetic significance. Reviews in Mineralogy,
Volume 25, Stony Brook, New York, USA
Martinsson O, Billström K, Broman C, Weihed P and Wanhainen C (2016) Metallogeny of the northern
Norrbotten ore province, northern fennoscandian shield with emphasis on IOCG and apatite-iron
ore deposits. Ore Geology Reviews. doi: 10.1016/j.oregeorev.2016.02.011
Nadoll P, Angerer T, Mauk JL, French D and Walshe J (2014) The chemistry of hydrothermal magnetite: a
review. Ore Geology Reviews 61:1-32
Naslund HR, Henríquez FJ, Nyström JO, Vivallo W and Dobbs F (2002) Magmatic iron ores and
associated mineralization: examples from the Chilean High Andes and Coastal Cordillera; in

12
Porter, T.M. (Ed.), Hydrothermal Iron Oxide Copper-Gold & Related Deposits: A Global
Perspective, PGC Publishing, Adelaide, 2:207-226
Nyström JO and Henríquez F (1994) Magmatic features of iron ores of the Kiruna type in Chile and
Sweden; ore textures and magnetite geochemistry. Econ Geol 89:820-839
Nyström JO, Billström K, Henríquez F, Fallick AE and Naslund H R (2008) Oxygen isotope composition
of magnetite in iron ores of the Kiruna type in Chile and Sweden. Gff 130:177-188
Paton C, Hellstrom J, Paul B, Woodhead J and Hergt J (2011) Iolite: Freeware for the visualisation and
processing of mass spectrometric data. Journal of Analytical Atomic Spectrometry 26:2508-2518.
doi: 10.1039/c1ja10172b
Parák T (1975) Kiruna iron ores are not 'intrusive-magmatic ores of the Kiruna type'. Econ Geol 70:1242-
1258
Rhodes AL and Oreskes N (1999) Oxygen isotope composition of magnetite deposits at El Laco, Chile:
evidence of formation from isotopically heavy fluids. Soc of Econ Geol, Spec Pub 7:333-351
Sillitoe RH and Burrows DR (2002) New field evidence bearing on the origin of the el laco magnetite
deposit, northern Chile. Econ Geol 97:1101-1109
Tornos F, Velasco F and Hanchar JM (2016) Iron oxide melts, magmatic magnetite and superheated
magmatic-hydrothermal systems: the El Laco deposit, Chile. Geology 44:427-430; doi:
10.1130/G37705.1
Valley PM, Hanchar JM, Whitehouse MJ (2011) New insights on the evolution of the Lyon mountain
granite and associated Kiruna-type magnetite-apatite deposits, Adirondack Mountains, New York
State. Geosphere 7:357-389
Westhues A, Hanchar JM, Whitehouse MJ, Martinsson O (2016) New constraints on the timing of host
rock emplacement, hydrothermal alteration and iron oxide apatite mineralization in and around
Kiruna, Norrbotten region, northern Sweden. In press in Econ Geol
Williams PJ, Hedenquist JW, Barton MD, Johnson DA, Fontbote L, de Haller A, Mark G, Oliver NHS,
Marschik R, Thompson JFH, Goldfarb RJ, Richards JP (2005) Iron oxide copper-gold deposits;
geology, space-time distribution, and possible modes of origin. Econ Geol 100:371-405

13
Chapter 2:
Mineral chemistry of magnetite from magnetite-apatite mineralization and
their host rocks: Examples from Kiruna, Sweden and El Laco, Chile
Shannon G. Broughm1, John M. Hanchar
1*, Fernando Tornos
2,
Anne Westhues1, Samuel Attersley
1
1Department of Earth Sciences, Memorial University of Newfoundland
St. John’s, NL A1B 3X5 Canada
2Centro de Astrobiología (CSIC-INTA), Ctra. Ajalvir, km 4.5
28850 Torrejón de Ardoz, Madrid, Spain
Revised manuscript submitted to Mineralium Deposita on December 27th, 2016

14
Abstract
Interpretation of the mineralizing environment of magnetite-apatite deposits
remains controversial with theories that include a hydrothermal or magmatic origin, or a
combination of those two processes. To address this controversy, we have analyzed the
trace element content of magnetite from precisely known geographic locations and
geologic environments from the Precambrian magnetite-apatite ore and host rocks in
Kiruna, Sweden, and the Pliocene-Holocene El Laco volcano in the Atacama Desert of
Chile. Magnetite samples from Kiruna have low trace element concentrations with little
chemical variation between the ore, host, and related intrusive rocks. Magnetite from
andesite at El Laco, and dacite from the nearby Láscar volcano, has high trace element
concentrations typical of magmatic magnetite. El Laco ore magnetite have low trace
element concentrations and displays growth zoning in incompatible elements (Si, Ca, and
Ce), compatible elements (Mg, Al, and Mn), LILE (Sr) and HFSE (Y, Nb, and Th). The
El Laco ore magnetite are similar in composition to magnetite that has been previously
interpreted to have crystallized from hydrothermal fluids; however, there is a significant
difference in the internal zoning patterns. At El Laco each zoned element is either
enriched or depleted in the same layers, suggesting the magnetite crystallized from a
volatile-rich iron-oxide melt. In general, the composition of magnetite from these two
deposits plot in very wide fields that are not restricted to the proposed fields in published
discriminant diagrams. This suggests that the use of these diagrams and genetic models
based on them should be used with caution.
Keywords Magnetite, magnetite-apatite deposits, Kiruna-type deposits, El Laco,
magmatic-hydrothermal

15
Introduction
Genetic models for the formation of Kiruna-type magnetite-apatite deposits have
been discussed and debated for over a century (e.g., Geijer, 1910, 1919; Parák, 1975;
Frietsch, 1978; Nyström and Henríquez, 1994; Bergman et al., 2001). How these deposits
relate to their adjacent host rocks and the relationship of the ore mineralization with
hydrothermal alteration remains controversial (Hitzman et al., 1992; Williams et al.,
2005; Groves et al., 2010). Additional research is necessary in order to obtain a better
understanding of the processes involved in forming these deposits and how they relate, if
at all, to other types of ore deposits (e.g., Fe-Ti oxide, iron oxide copper gold [IOCG],
porphyry copper, skarn, volcanogenic massive sulfide [VMS]) (Williams et al., 2005;
Dupuis and Beaudoin, 2011; Nadoll et al., 2014). In the present study, the trace element
chemistry of magnetite from perhaps the two most representative, and well known,
magnetite-apatite deposits, and their respective host rocks, was determined. The first is
from Kiruna in the Norrbotten region of northern Sweden, and the second is from El Laco
in the Atacama Desert region of northern Chile. In the case of the Kiirunavaara deposit in
Kiruna, magnetite from two related intrusive rocks were also analyzed. For El Laco,
magnetite was also analyzed from the nearby Làscar volcano. The aim is to determine
whether the trace element chemistry of magnetite can be used to aid in settling the
dispute on the processes involved in magnetite-apatite mineralization, e.g., hydrothermal,
or magmatic, or a combination of these two processes. All of the samples used in this
study are from precisely known geographic locations and geologic environments
allowing a spatial analysis of the magnetite textures and associated minerals together with
their trace element compositions.

16
Magnetite-apatite deposits can have high ore grades (up to 65% Fe) and large
sizes (e.g., ~2500 million tons [Mt] of iron has been mined in Kiruna with 644 Mt proven
and probable reserves [Bergman et al., 2001; LKAB, 2015] and ~730 Mt of iron ore at El
Laco [Mario Rojo, Compañia Minera del Pacifico, 2015 pers. comm.]) making them
attractive targets for mining. Magnetite-apatite deposits are the most important ore
deposits in the Norrbotten region of northern Sweden (Bergman et al., 2001). The earliest
studies on magnetite-apatite ores were focused on Kiruna (e.g., Geijer, 1910, 1935;
Parák, 1975; Frietsch, 1978) where the expression “Kiruna-type” deposit was adopted for
this class of low-Ti magnetite, apatite-rich iron ore (e.g., Hildebrand, 1986; Mücke and
Younessi, 1994). Some later studies focused on the magnetite-apatite ores at El Laco in
the Atacama Desert region of northern Chile, a much younger deposit, which is often
considered a modern and shallow (i.e., Pliocene-Holocene) equivalent of the magnetite-
apatite deposits found at Kiruna (e.g., Park, 1961; Nyström and Henríquez, 1994;
Nyström et al., 2008).
Magnetite-apatite deposits are sometimes included as an end-member in the
IOCG class of deposits (e.g., Hitzman et al., 1992; Barton and Johnson, 1996; Hitzman,
2000; Sillitoe, 2003). Both magnetite-apatite and IOCG deposits contain large volumes of
distinctly low-Ti iron oxides within rocks that have undergone extensive alkali-calcic
metasomatism by hydrothermal fluids. Magnetite-apatite deposits do not contain
economic concentrations of Cu or Au and almost exclusively contain massive magnetite
or both magnetite and hematite, while IOCG deposits may also contain iron-rich silicate
phases (Parák, 1975; William et al., 2005; Groves et al., 2010). In some locations,
magnetite-apatite deposits and IOCG deposits occur spatially, but usually not temporally,

17
associated with each other; though, whether there is a genetic relationship between the
formation of magnetite-apatite and IOCG deposits remains unresolved (e.g., Groves et
al., 2010).
There are two genetic models, and a third that is a combination of the first two,
for the formation of magnetite-apatite deposits today: 1) Crystallization from iron-rich
melts that were immiscible from a parental silicate melt and were emplaced at different
depths or erupted and crystallized at the surface (e.g., Henríquez and Martin, 1978;
Nyström and Henríquez, 1994; Naslund et al., 2002; Alva-Valdivia et al., 2003; Nyström
et al., 2008; Martinsson, 2016); crystallization was accompanied by the exsolution of
large amounts of magmatic-hydrothermal fluids (Tornos et al., 2016); 2) Replacement of
the host rocks by iron-rich hydrothermal fluids (e.g., Hitzman et al., 1992; Rhodes and
Oreskes, 1999; Hitzman, 2000; Sillitoe and Burrows, 2002; Edfelt et al., 2005; Groves et
al., 2010; Valley et al., 2011; Dare et al., 2015); and 3) a magmatic-hydrothermal genesis
with an early generation of phenocrysts of magnetite that separated and floated from a
crystallizing andesite melt and later were overgrown by hydrothermal magnetite (e.g.,
Knipping et al., 2015). A sedimentary-exhalative origin was suggested by Parák (1975)
but was not widely accepted (Frietsch, 1978; Nyström et al., 2008) and will not be
discussed further.
Field observations and geochemical data for magnetite-apatite deposits are
arguably compatible with both magmatic and hydrothermal origins (Hitzman et al., 1992;
Nyström and Henríquez, 1994; Naslund et al., 2002). Field evidence at the El Laco ore
bodies that strongly supports an ultimate magmatic origin for the mineralization, i.e.,
direct crystallization from an iron-rich melt, includes distinct magnetite volcanic flow

18
structures, vesicles in the magnetite ore veins with chilled margins that crosscut the host
andesite, as well as the presence of degassing tubes similar to textures observed in
basaltic flows (Henríquez and Martin, 1978; Nyström and Henríquez, 1994; Naslund et
al., 2002; Henríquez 2003; Tornos et al., 2016).
Arguments that support a hydrothermal (metasomatic) origin at El Laco include
the presence of, sometimes jigsaw-like, breccias in which the magnetite supports
fragments of altered host andesite blocks; a feature that is explained by open-space filling
of ascending hydrothermal fluids (Sillitoe and Burrows, 2002). Brecciated contacts
between the ore and hydrothermally altered host rocks are fairly common at other
magnetite-apatite deposits (e.g., Kiruna, the Adirondacks/New York State, and Bafq/Iran;
Geijer, 1910; Bergman et al., 2001; Valley et al., 2011; Sabet-Mobarhan-Talab et al.,
2015; Westhues et al., 2016). Metasomatism of the host rocks surrounding these deposits
is strong evidence that hydrothermal fluids were present. In Kiruna the host rocks are
pervasively hydrothermally altered (Westhues et al., 2016); however, at El Laco there is
not always direct contact between the altered host rock and ore suggesting the
hydrothermal alteration here may not be directly related to ore emplacement (Tornos et
al., 2016).
The magmatic model for magnetite-apatite ores involves the existence of
immiscible iron rich-melts that crystallized to produce the large volumes of massive
magnetite. This type of melt is considered to be similar to nelsonite deposits, which have
a 2:1 oxide:apatite ratio and contain abundant Ti in the form of mostly rutile +/- ilmenite
+/- titanomagnetite). (Philpotts, 1967; Frietsch, 1978; Kolker, 1982; Dymek and Owens,
2001). Kamenetsky et al. (2013) tracked the existence of a large immiscibility gap

19
between silica-rich felsic melts and silica-poor mafic melts. The mechanism(s) through
which the iron-rich melts efficiently segregate into the ore and a presumed residual parent
silicate-rich melt at the scale of massive deposits like those in Kiruna or El Laco, has not
yet been determined or observed in the field (i.e. the magnetite-apatite ore and residual
silicate-melt in contact with each other). However, immiscible iron-rich and silicate melts
have been observed within melt inclusions in the host andesite rocks at El Laco (Tornos
et al., 2016; Velasco et al., 2016).
Hydrothermal models for magnetite-apatite deposits are extrapolated from
hydrothermal models for IOCG deposits, with the assumption that these two types of
deposits are genetically similar (Barton and Johnson, 2004). Two main fluid sources have
been proposed: 1) hydrothermal fluids exsolved from a magmatic source (e.g., Sillitoe
and Burrows, 2002; Groves et al., 2010); or, 2) derived from an external source (e.g.,
basinal brines) where igneous intrusions are a heat source for circulating fluids in the
crust (e.g., Barton and Johnson, 1996; Rhodes and Oreskes, 1999). Each system would
require the generation of saline, sulfur-poor, and oxidized fluids (Barton and Johnson,
2004). It is possible that there are multiple sources for the fluids and they may vary
between different localities (Williams et al., 2005; Valley et al., 2011).
Magnetite is an abundant and widespread oxide mineral and occurs in igneous,
sedimentary, hydrothermal, and metamorphic rock assemblages and different types of ore
deposits (Lindsley, 1991). Magnetite is a member of the spinel group of minerals, which
have a cubic close-packing structure with tetrahedral (Fe2+
) and octahedral (Fe3+
) sites in
coordination with oxygen anions and the general stoichiometry Fe2+
Fe3+
2O4 (Buddington
and Lindsley, 1964; Lindsley, 1976). A variety of lithophile and siderophile elements

20
with similar ionic radii to Fe2+
and Fe3+
substitute in the magnetite structure (e.g., Mg, Al,
Si, P, Ca, Ti, V, Cr, Mn, Co, Ni), though in certain favorable physicochemical conditions
chalcophile and other elements can also be incorporated (e.g., Cu, Zn, Ga, Sn, Ce)
(Nadoll et al., 2014). Of special interest is the behavior of Ti; the solubility of Ti in
magnetite is controlled by the redox state and temperature of the system (Lindsley, 1976).
Magnetite is known to be resistant to surface weathering making it an ideal provenance
indicator for mineral exploration and perhaps useful for genetic studies of ore deposits
(Grigsby, 1990; Dupuis and Beaudoin, 2011; Dare et al., 2012; Nadoll et al., 2014).
Several previous studies have discussed magnetite trace-element chemistry from
Kiruna, El Laco, and other magnetite-apatite deposits (e.g., Loberg and Horndahl 1983;
Frietsch 1995; Muller et al., 2003; Dupuis and Beaudoin 2011; Dare et al., 2015);
however, most of the magnetite samples used in these studies were not from precisely
known locations within the ore and surrounding host rocks. Some of these studies have
proposed empirical plots in which the magnetite of different types of mineralization have
a characteristic trace element signature. In these diagrams, magnetite from magnetite-
apatite deposits have distinct trace element chemical compositions compared to magnetite
from other deposit types, such as banded iron formations (BIF), IOCG, nelsonite,
porphyry Cu and Fe-Ti-V deposits (e.g., Loberg and Horndahl, 1983; Dupuis and
Beaudoin, 2011; Dare et al., 2014). Dare et al. (2015) proposed that the composition of
the magnetite from the El Laco ore, which is different to that of the accessory magnetite
in the unaltered host andesite, is consistent with a hydrothermal origin for the magnetite-
apatite ore (e.g., Dare et al., 2015).

21
The present study uses newly obtained data on the magnetite trace element
geochemistry to assess the practical use and limitations of the proposed empirical
magnetite discrimination diagrams and whether they can be utilized in interpreting the
mineralization style and ore genesis of magnetite-apatite deposits.
Geologic background
Kiruna geology and magnetite-apatite ores
There are over 40 known magnetite-apatite deposits located in the Norrbotten
region, with Kiirunavaara being the largest estimated at nearly 2 Ga before extraction of
high-grade iron ore averaging 30-70% Fe (e.g., Cliff et al., 1990; Hallberg et al., 2012;
Martinsson, 2016; Westhues et al., 2016). The Kiirunavaara magnetite-apatite deposit is a
tabular-shaped ore body approximately 5 km long, 100 m thick and at least 1500 m deep
that lies concordant within steeply dipping volcanic host rocks (e.g., Parák, 1975; Blake,
1992; Bergman et al., 2001; Harlov et al., 2002; Nyström et al., 2008).
The oldest unit in the Kiruna area are the Karelian (2.4-1.96 Ga) mafic-
intermediate metavolcanic flows (Kiruna Greenstone Group), overlain by
metasedimentary and intermediate-felsic metavolcanic rocks of the Svecofennian
Porphyry group (1.96-1.75 Ga) (Fig. 1a) (e.g., Bergman et al., 2001). The magnetite-
apatite deposits in the Kiruna area are hosted by the metavolcanic rocks of the Porphyry
Group (Parák, 1975; Martinsson, 2004). The Kiirunavaara-Luossavaara ore bodies follow
the contact between thick trachyandesitic lava flows (footwall) and pyroclastic
rhyodacites (hanging wall). The entire Norrbotten region has been subjected to
greenschist facies metamorphism (Bergman et al., 2001) and is overprinted by regional

22
Fig. 1. Simplified geological maps of the study areas. a) Kiruna district, Norrbotten
region, northern Sweden, with sample locations for this study. The Kiirunavaara
magnetite-apatite deposit dips eastward between the footwall and hanging wall rock
units. Samples collected underground within the mine are projected to the map surface
and therefore appear to the east of ore body (map modified after SGU data and Westhues
et al., 2016). b) El Laco volcano, ore samples from this study are from the Laco Sur
deposit with one dacite sample from the Láscar volcano shown in the inset map (map
modified after Tornos et al., 2016)
scale Na and Cl metasomatism in the form of albite and Cl-rich scapolite
(Na4Al3Si9O24Cl–Ca4Al6Si6O24CO3) (Frietsch et al., 1997).
There is a syenite intrusion approximately 1 km stratigraphically below the
Kiirunavaara ore body (Blake, 1992; Bergman et al., 2001). Granophyric to granitic
23
dykes intrude the Kiirunavaara ore, and a larger body of potassic granite can be found
within the footwall of the Kiirunavaara mine. New constraints on the ages of these
intrusions show that the syenite (1880 ± 7 and 1881 ± 4 Ma) is of a similar age to the
metavolcanic host rocks (1884 ± 4 and 1880 ± 3 Ma) and older than the ore (1877 ± 4 and
1874 ±7 Ma), while zircon from the granite (1874 ± 7 Ma) and two ore samples have
overlapping ages (Westhues et al., 2016).
Two types of ore can be identified at Kiirunavaara based on their phosphorous
content, primarily residing in apatite: the B-ore (<0.05% P) and D-ore (>1% P) (e.g.,
Bergman et al., 2001). The ore is rich in rare earth elements (REE); dominantly as light
rare earth elements contained within the apatite or in inclusions of monazite in apatite,
which is currently not mined (Hallberg et al., 2012). The contact with the host rocks is
bounded by a magnetite-actinolite filled breccia with veins that can be found extending
tens of meters into the hanging wall (Bergman et al., 2001). The footwall at Kiirunavaara
is strongly albitized, especially near the syenite intrusion, and here widespread amygdales
are found to contain secondary magnetite, actinolite and titanite (Geijer, 1910; Romer et
al., 1994; Bergman et al., 2001).
The Tuollavaara and Per Geijer (e.g., Nukutusvaara and Rektorn) ore bodies are
smaller than Kiirunavaara and are hosted within rhyodacites in the upper parts of the
Porphyry Group (Martinsson, 1994; Bergman et al., 2001). Hematite is more common in
these smaller deposits than at Kiirunavaara. Contacts between the ore and host rocks are
often brecciated (i.e., altered host rock fragments are surrounded by veins of iron oxides
+ apatite) and veining of iron ore commonly extends into both footwall and hanging wall
up to tens of meters (Bergman et al., 2001).

24
El Laco geology and magnetite-apatite ores
The El Laco andesite stratovolcano is located in the current active volcanic arc,
the Central Volcanic Zone (CVZ), of the Andes in the Atacama Desert of northern Chile
(Fig. 1b). The volcano is made up of calc-alkaline andesite flows and pyroclastic rocks,
with K-Ar dates from 5.3 +/- 1.9 Ma to 1.6 +/- 0.5 Ma (Naranjo et al., 2010). There are
seven high-grade iron ore bodies at El Laco that reach up to 1 km2 at the surface and
exceeding 100 m thickness. (Naslund et al., 2002). The dominant magnetite
mineralization occurs as large stratabound lenses that are texturally massive, brecciated,
vesicular or friable and are interpreted as lava flows or pyroclastic rocks. They are rooted
in subvertical veins of massive and coarse grained magnetite (Henríquez and Martin,
1978; Nyström and Henríquez, 1994; Naslund et al., 2002; Nyström et al., 2016; Tornos
et al., 2016). The magnetite ore is associated with minor amounts of diopside, scapolite
and anhydrite (Tornos et al., 2016) while apatite is fairly uncommon in the stratabound
ores but is abundant in the feeder dykes.
The magnetite-apatite ore bodies and some of the andesite host rocks have been
pervasively overprinted by hydrothermal alteration that is thought to be broadly
synchronous with the emplacement of the magnetite ore (see Fig. 1b). The andesite has
been locally replaced by alkali-calcic hydrothermal assemblages, including diopside, K-
feldspar, magnetite, anhydrite and scapolite that are related to widespread brecciation of
the altered andesite (Tornos et al., 2016). The andesite host and the alkali-calcic altered
rocks are overprinted by a later and shallower steam-heated alteration that is observed as
stratabound zones of dominantly alunite and gypsum (Sillitoe and Burrows, 2002; Tornos
et al., 2016). Late martitization related to the steam-heated alteration overprints large
parts of the magnetite ore (Tornos et al., 2016).

25
Láscar volcano
The Láscar volcano is located approximately 57 km northwest of El Laco
(67°43’W; 23°22’S) and is the most active volcano in the CVZ today with a significant
eruption in 1993 and intermittent activity ever since (Tassi et al., 2009). Láscar is
considered a typical arc-related volcano with andesitic to dacitic composition. The
andesite-dacite at Láscar includes anhydrite phenocrysts as well as droplets of magnetite -
no significant concentrations of massive magnetite have been described. The reason to
compare the geochemistry of magnetite at El Laco and Láscar volcanoes is to determine
if a difference exists with the magnetite from a volcano with massive magnetite
mineralization, such as El Laco, with a similar volcano located within the same volcanic
arc system that does not have visible massive magnetite deposits, such as Láscar.
Analytical methods
Sample selection and preparation
The magnetite-bearing rocks of this study have been selected using a systematic
sample collection that was carried out from magnetite-apatite ores and their respective
host rocks in the Norrbotten region of northern Sweden and the El Laco and Láscar
volcanoes (Fig. 1 and Appendix I). The samples have been thoroughly examined using
cross-polarized and reflected light microscopy on polished thin sections in order to select
the samples with minimal replacement of magnetite by hematite. Magnetite grains were
chosen in situ from the samples of ore, hanging wall, and footwall as well as from any
spatially associated intrusive rocks. Some samples from the host rocks did not contain
magnetite or the grains were not large enough for laser ablation analysis and therefore

26
could not be included in this study (e.g., many of the more felsic hanging wall rocks at
Kiruna and altered andesite at El Laco).
For Kiruna, samples that contain sufficient magnetite included all the ore samples
from the Kiirunavaara high-P (KRN-10-02, K-1 and KRN-11-01) and low-P (K-2) ore
and the selected smaller magnetite-apatite ores, Tuolluvaara (TUV-10-01), Nukutusvaara
(NUK-12-02 and NUK-10-03) and Rektorn (REK-10-04). The Rektorn ore also contains
abundant hematite, described further below. At Kiirunavaara, the footwall andesite rocks
were magnetite-rich and there was an altered (KRN-11-04) and a less altered (KRN-11-
03) sample chosen. One sample from the hanging wall rhyodacite rocks at Kiirunavaara
contained a small amount of magnetite (KRN-11-05). Several samples containing
magnetite from felsic intrusive bodies spatially associated with the Kiirunavaara ore body
were also chosen, these included an aplite vein (KRN-12-02) a syenite pluton (KRN-12-
03) and a granite pluton from underground inside the mine (KRN-12-05). As mentioned
above, the smaller magnetite-apatite bodies in Kiruna (i.e., Per Geijer ores: Rektorn,
Nukutus, and Tullovaara) are hosted in the rhyodacitic rocks that generally do not contain
abundant magnetite. However, sufficiently sized magnetite was present in the host rock at
Tuollavaara (TUV-10-03). The Rektorn footwall (REK-12-02) contains abundant
magnetite and the Rektorn hanging wall was eliminated from this study because it
contains abundant hematite.
At El Laco in the upper levels of the large magnetite-apatite ore body at Laco Sur
two massive magnetite ore samples were collected (ELL-14-04 and ELL-14-05). In the
lower levels of the Laco Sur ore body (at approximately 4650 m elevation) a magnetite
vein from a feeder structure was sampled (ELL-14-06). A sample of andesite from the El

27
Laco volcano (ELL-14-02) and a dacite sample from Láscar (LAS-14-07) were also
collected.
The magnetite-bearing samples selected (n=17 from Kiruna; n=4 from El Laco
and n=1 from Láscar) were first trimmed with a saw to remove any altered or weathered
material and then mounted in 25 mm diameter by 6 mm tall epoxy pucks. These pucks
were then polished and carbon coated and examined with a JEOL 7100F scanning
electron microscope (SEM) at Memorial University of Newfoundland equipped with
energy dispersive spectroscopy (EDS) at 15 kV and 50 nA. Magnetite grains, as well as
any associated minerals, were identified using back-scattered electron (BSE) imaging and
confirmed with EDS and later with conventional reflected light microscopy to distinguish
between magnetite and hematite.
EPMA analyses
The iron content of the magnetite grains was measured using a JEOL JXA-8230
SuperProbe electron probe microanalyzer (EPMA) at Memorial University of
Newfoundland. Details concerning the EPMA analyses are summarized in Appendix II
and a complete list of the Fe results in Appendix IV. Quantitative chemical analyses of
magnetite were done to obtain Fe concentrations in the same location as the LA-ICPMS
analyses to use Fe as the internal standard for reducing the laser ablation data with Iolite
software (Paton et al., 2011). The following conditions were used for the EPMA
analyses: accelerating voltage of 15 kV, sample current of 100 nA, peak and background
count times of 10 s and a beam diameter of 3 μm. Natural magnetite from the Astimex
MINM25-53 mineral standards mount was used as a primary Fe standard. Raw X-ray
intensities were corrected using standard ZAF techniques with the JEOL software.

28
X-ray maps
X-ray maps of the Kiruna magnetite grains were made on one representative
magnetite grain per sample for Al, Si, Ca, Ti and V. Vanadium was mapped instead of
Mg for the Kiruna analyses after variations in V were detected with energy dispersive
spectroscopy (EDS). Aluminum and Ti were also chosen because of their generally
immobile nature in hydrothermal fluids. Silica and Ca were chosen for their highly
mobile nature in hydrothermal fluids (Dare et al., 2014; Nadoll et al., 2014). For the El
Laco samples, EPMA X-ray maps for Al, Si, Ca, V, and Mg were acquired on one
representative magnetite grain per sample. For each map an accelerating voltage of 15
kV, and sample current of 250 nA, and a pixel dwell time of 150 ms was used. The map
area, step size and total time to create each map ranged from 150 μm2 to 2 mm
2, 0.4 to
1.0 μm, and 4 to 10 hours, respectively, depending on the size of the magnetite grain.
LA-ICPMS analyses
In situ LA–ICPMS analyses were done at the MicroAnalysis Facility – Bruneau
Innovation Centre (MAF–IIC) at Memorial University of Newfoundland using a Finnigan
Element XR high-resolution double-focusing magnetic-sector inductively coupled plasma
mass spectrometer (HR-ICPMS), coupled to a GeoLas 193 nm Excimer laser system.
Details for the LA-ICPMS analyses are summarized in the Appendix II. Zipkin et al.
(2015) describes the current methodology in the LA-ICPMS facility for trace element
analysis using this equipment; these same methods were used in the present study with
the modifications noted below.
A laser spot diameter of 30 µm was used for all magnetite analyses, a 59 µm spot
was used for the primary calibration material NIST 610, and a 49 µm spot for the

29
secondary standard reference material BCR-2G. A total of 42 elements and 35 elements,
respectively, were analyzed for each magnetite analysis during the Kiruna and El Laco
LA-ICPMS analyses. Magnetite samples from El Laco were analyzed prior to the Kiruna
samples and elements that were consistently below the limit of detection (LOD) were not
measured during the Kiruna analyses after verifying that those elements were again not
detectable. Instead, rare earth elements (REE) were included for the Kiruna analyses in
order to make a comparison with the well-constrained trace REE concentrations in the
BCR-2G glass (Jochum et al., 2005). The laser energy density used for all laser ablation
analyses was 3 J/cm2 with a pulse frequency of 8 Hz. For each analysis, the background
was measured for about 30 s, followed by 90 s of laser ablation, and wash out was
monitored for about 20 s after each ablation. Isotope signals 57
Fe, 51
V, and 9Co were
closely monitored during the day to track instrumental drift. For the El Laco ablation
session laser spots were taken across grains that showed zoning in BSE and X-ray maps.
A total of 72 analyses were done on magnetite from El Laco and Láscar. Eighty-seven
analyses were done on magnetite from the Kiruna area samples. A complete list of the
analyses that was done as well as the spot locations is reported in the Appendix V and VI,
respectively.
The LA-ICPMS data were reduced using the Iolite software (Paton et al., 2011)
with the Fe concentration from the EPMA analysis used as the internal standard. Peaks
for La, Ce, Al, Mg, Zr, Si, P, Ca, and Ti were monitored during the data reduction to
avoid inclusions of other minerals (e.g., monazite, apatite, zircon, titanite) or inclusion of
the host material in the case of tiny magnetite grains (e.g., feldspar, amphibole, quartz).
The LOD for each of the elements measured was calculated in Iolite (Paton et al., 2011)

30
using the method described in Zipkin et al. (2015). The LOD and mean results of each
isotope measured are listed in Appendix III. The BCR-2G results from the Kiruna and El
Laco analysis sessions show excellent correlation with the long term running averages for
BCR-2G collected over a span of 17 years at Memorial University (see Fig. 2 and
Appendix VIII).
Fig. 2. LA-ICP-MS BCR-2G average concentrations for this study (y-axis) compared
with the MUN BCR-2G long term average from 1997-2014 (x-axis).
Results
Kiruna magnetite textures and associated minerals
From the samples investigated at Kiirunavaara, the D-ore (i.e., high-P ore)
contains two types of magnetite: 1) massive magnetite with interstitial apatite, biotite, and

31
Fig. 3. Back-scattered electron images and chemical X-ray maps of representative
magnetite (mag) from the Kiirunavaara ore, host rocks and associated intrusive rocks.
Relative chemical variation scale for X-ray maps in b. Red boxes show locations of BSE
images or X-ray maps that are shown as insets. a) KRN-10-02 (D-ore), massive
magnetite with interstitial apatite (ap) and cross cutting calcium carbonate (cc) vein. b)

32
K-1 (D-ore), subhedral magnetite grains with zones of slight increases in Si and Al
shown in X-ray map. c) KRN-11-01 (D-ore), subhedral magnetite with correlating zones
of increased in Si and Al. d) K-2 (B-ore), massive magnetite. e) KRN-11-04 (FW),
anhedral magnetite aggregate associated with actinolite (act), X-ray map shows spots of
increased Al. f) KRN-11-05 (HW), small euhedral-subhedral magnetite grain. g) KRN-
12-02 (syenite intrusive), small anhedral magnetite grains associated with zircon (zr),
biotite (bt) and ilmenite (ilm), cracks filled with increased Ca, Si and Al concentrations.
h) Anhedral magnetite associated with actinolite, rim of magnetite depleted in V relative
to the core. Other mineral abbreviations: K-feldspar (ksp), quartz (qtz) and plagioclase
(plag).
later calcite (Fig. 3a); and 2) 20-200 µm magnetite grains that are subhedral to anhedral
with apatite as the dominant gangue mineral phase +/- actinolite, plagioclase, and quartz
(Fig. 3b, c). The B-ore (i.e., low-P ore, Fig. 3d) magnetite is massive with interstitial
biotite and calcite and contains much less apatite (and thus phosphorus) than the D-ore.
The Kiirunavaara trachyandesitic footwall has large anhedral magnetite grains ranging in
size from 100-300 µm that are found in clusters as well as disseminated magnetite. The
magnetite clusters are more abundant and larger (approximately 1 mm in diameter) in the
altered footwall (Fig. 3e) compared to the less altered footwall (approximately 500 µm in
diameter). The hanging wall rocks at Kiirunavaara have a low abundance of magnetite
with grains that are euhedral-subhedral and <60 µm (Fig. 3f). The aplite vein sample
(KRN-12-02) has a low abundance of magnetite with grains that are <100 µm, fractured
and associated with biotite, titanite and zircon (Fig. 3g). The syenite sample (KRN-12-
03) has 50-100 µm sized anhedral magnetite grains that are commonly associated with
actinolite (Fig. 3h). The potassic granite intrusion (sample KRN-12-05) found
underground within the mine (Westhues et al., 2016) has disseminated euhedral to
anhedral magnetite grains that are <60 µm in size.
33
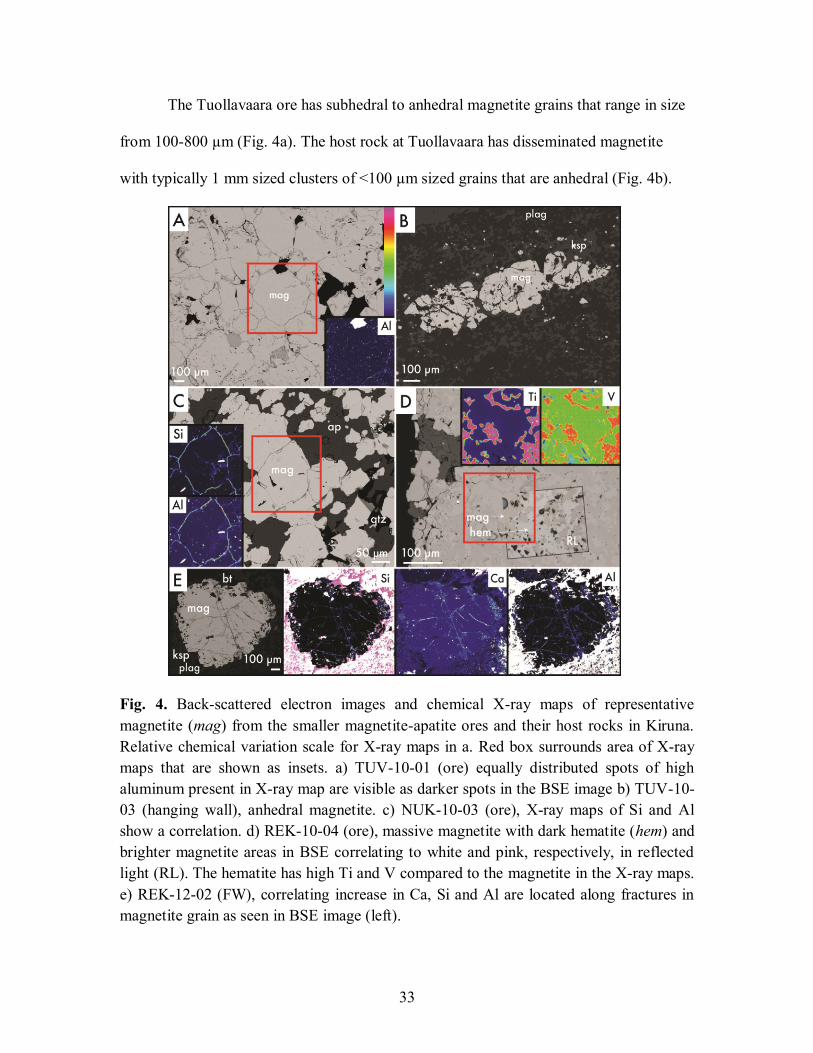
The Tuollavaara ore has subhedral to anhedral magnetite grains that range in size
from 100-800 µm (Fig. 4a). The host rock at Tuollavaara has disseminated magnetite
with typically 1 mm sized clusters of <100 µm sized grains that are anhedral (Fig. 4b).
Fig. 4. Back-scattered electron images and chemical X-ray maps of representative
magnetite (mag) from the smaller magnetite-apatite ores and their host rocks in Kiruna.
Relative chemical variation scale for X-ray maps in a. Red box surrounds area of X-ray
maps that are shown as insets. a) TUV-10-01 (ore) equally distributed spots of high
aluminum present in X-ray map are visible as darker spots in the BSE image b) TUV-10-
03 (hanging wall), anhedral magnetite. c) NUK-10-03 (ore), X-ray maps of Si and Al
show a correlation. d) REK-10-04 (ore), massive magnetite with dark hematite (hem) and
brighter magnetite areas in BSE correlating to white and pink, respectively, in reflected
light (RL). The hematite has high Ti and V compared to the magnetite in the X-ray maps.
e) REK-12-02 (FW), correlating increase in Ca, Si and Al are located along fractures in
magnetite grain as seen in BSE image (left).

34
The Nukutus ore has subhedral to anhedral magnetite grains that range in size from 10-
150 µm with abundant apatite and interstitial actinolite +/- quartz, calcite and biotite (Fig.
4c). The Rektorn ore is massive with interstitial calcite and quartz; BSE imaging revealed
that approximately 60% of ore is lighter and therefore different in composition; under
reflected light it was determined that the lighter BSE iron oxide is magnetite and the
darker BSE iron oxide is hematite (Fig. 4d); both iron oxide phases were analyzed and
differences in the chemistry are described in more detail below. The Rektorn footwall
host rocks contain abundant 1 mm sized magnetite grains with rims that are rich in
inclusions of feldspar, biotite and quartz (Fig. 4e).
El Laco magnetite textures and associated minerals
The magnetite ore samples studied at the Laco Sur magnetite-apatite deposit are
dominated by massive or anhedral magnetite, up to 2 mm sized euhedral to subhedral
grains can be found along the edges of void spaces (Fig. 4). Unlike the magnetite-apatite
ore at Kiruna the El Laco magnetite is generally not associated with other mineral phases
and shows partial to extensive alteration to martite (i.e., pseudomorphic replacement of
magnetite by hematite). One of the samples from the upper levels of the ore body (ELL-
14-04) consists primarily of massive magnetite or anhedral µm-sized grains of magnetite;
there are abundant cm-sized elongated voids that are lined by 200-400 µm euhedral
magnetite crystals.
In BSE images, the magnetite grains have porous inner cores that display
chemical growth zoning and outer regions with no detectable chemical zoning (Fig. 4a).
Under reflected light the magnetite crystals show extensive alteration to kenomagnetite
(nominally Fe2+
1-y(Fe3+
1-2/3y[]y/3O4) and less extensively hematite along fractures (Fig. 4a)

35
Fig. 5. Back-scattered electron images and chemical X-ray maps of representative Laco
Sur ore magnetite. Relative chemical variation scale for X-ray maps in a. Orange circles
represent LA-ICPMS spot locations relevant to Fig. 7 and X-ray maps include the whole
crystals shown in the BSE image. Direct comparisons in the zoning contrast in BSE
cannot be made between each sample because the photographs were taken at different
settings to optimize the chemical structure in the magnetite grains. a) ELL-14-04,
subhedral-euhedral magnetite grain with clear zoning in BSE imaging and no evident
zoning in the X-ray maps for this grain. Adjacent grains with vuggy cores show elevated
growth zones of Si, Ca and Al. Reflected light (RL) microscopy shows areas of the grain
has been altered to kenomagnetite (keno-mag) and slight martite (mar) replacement along

36
fractures. b) ELL-14-05, subhedral-euhedral magnetite grains with clear growth zoning in
the BSE image that correlates with the X-ray maps for Si, Ca and Al, each element is
elevated or depleted in the same layers with increasing concentrations towards the core.
RL microscopy shows slight martite replacement along fractures. c) ELL-14-06, euhedral
magnetite with clear zoning that correlates with increasing Si and Ca towards the core.
RL microscopy shows that extensive replacement of the magnetite to martite has
occurred, which correlates to very low trace element concentration in the X-ray maps.
(Ramanaidou et al., 2008). Another sample from the upper levels of the ore body (ELL-
14-05) consists primarily of spongy porous magnetite with cm-sized elongated voids that
are lined with 200-600 µm euhedral magnetite crystals. In BSE images, the magnetite
crystals have concentric growth zoning with darker central regions. Under reflected light
hematite alteration can be seen along fractures in the magnetite and the edges of the
magnetite (Fig. 4b). The magnetite from a magnetite vein in the lower level of the ore
body (ELL-14-06) has 0.5-2 mm sized magnetite grains that are euhedral along the edge
of 0.5-1 cm sized cavities and the magnetite is anhedral elsewhere. In BSE images, the
magnetite grains displays a lighter core with darker portions that occurs along fractures
and the grain rims (Fig. 4c). Under reflected light the lighter BSE portions of the grain
can be identified as magnetite and the darker portions are martite.
The andesite host rock has microphenocrysts of magnetite, 100-200 µm in size,
that are anhedral and contain trellis texture exsolution lamellae that in BSE images are
visibly darker than the magnetite (Fig. 6a). Under reflected light the lamellae were
identified as ilmenite. The Láscar dacite has disseminated anhedral magnetite in <100 µm
sized grains with local exsolution lamellae, visibly darker in BSE images, but this is not
widespread (Fig. 6b). The exsolution lamellae in the Láscar dacite were identified as

37
ilmenite with reflected light microscopy, a common texture found in titaniferous
magnetite (Mehdilo and Irannajad 2010).
Fig. 6. Back-scattered electron images and chemical X-ray maps of magnetite from the
andesite host rock at El Laco volcano and the dacite sample from Láscar volcano.
Relative chemical variation scale for X-ray maps in a. a) ELL-14-02 (El Laco andesite),
andesite with fine trellis textured ilmenite lamellae visible in BSE image and X-ray map
for Ti, red box surrounds the magnified view of the exsolution domain. b and c) LAS-14-
07 (Láscar dacite), ilmenite exsolution lamellae visible in BSE and RL are found in some
grains (b) and are absent in others (c).

38
Kiruna magnetite X-ray maps
Little chemical variation was observed in the X-ray maps for any of the Kiruna
magnetite samples. The ore magnetite from the deposits in the Kiruna area display zones
of elevated Al and Si that correlate with each other (see Fig. 3b, c and Fig. 4c). Many of
the larger (>100 μm) ore and host rock magnetite grains display equally distributed spots
of elevated Al throughout the grains that is not observed in the Si, V, Ca, or Ti X-ray
maps (see Fig. 3b, e and 4a). These elevated Al spots are displayed in BSE images as
darker spots (see Fig. 4a). The magnetite from the granite intrusive at Kiirunavaara (Fig.
3g), and the footwall magnetite at Rektorn, display elevated contents of Si, Al, Ca, and Ti
can be found along structures that follow the typical shape of spinel exsolution lamellae
(Fig. 4e). The syenite sample of the Kiirunavaara mine revealed rims depleted in V (Fig.
3h). The Rektorn ore X-ray map has the most distinct chemical variations due to the
presence of hematite that correlates to elevated Ti and V found in the zones darker in
BSE (see Fig. 4d).
El Laco magnetite X-ray maps
The ore magnetite-kenomagnetite crystal from ELL-14-04 that was mapped did
not have a porous core that was observed in other grains from that sample and did not
show any variation in chemistry. However, the adjacent grains in the X-ray map have
porous cores which display elevated Si, Ca, and Al with growth zoning (Fig. 5a). The X-
ray maps of the ELL-14-05 magnetite, with concentric growth zoning visible in BSE
imaging, revealed increasing Si, Ca, and Al content towards the core of the grain (Fig.
5b). Magnetite grains from a vein in the lower levels of the ore (ELL-14-06) displays
growth zoning in Si and Ca with highest concentrations in the core. The martite (i.e.,

39
hematite) replaced portions of the magnetite show lowest concentrations of trace
elements (Fig. 5c). The El Laco andesite magnetite grain shows elevated Ti in the
ilmenite exsolution lamellae that are visible in BSE imaging and reflected light
microscopy (Fig. 6a). The Láscar dacite magnetite grain chosen for the X-ray map shows
overall elevated Ti (Fig. 6b) compared to the El Laco magnetite.
Trace element chemistry of Kiruna magnetite
The iron content of magnetite for the ore, host, and intrusive rocks at Kiruna were
slightly lower than the ideal stoichiometric value (72.4 wt.% Fe) with EPMA results
ranging from 69.4 and 70.8 wt.% Fe (Table 2). The iron content for analyses on samples
that were identified as hematite (REK-10-01 and REK-10-04) was distinctly lower than
the magnetite and ranged from 63.8-68.5 wt.% Fe. All of the magnetite grains from the
Kiruna area, including the magnetite-apatite ore, host rocks and related felsic intrusive
rocks, are overall chemically homogeneous and contain low trace element concentrations
(i.e., <500 ppm). The V concentrations, and locally the Si content, in the magnetite are
generally higher than the other trace elements with concentrations around 0.1 wt % and
up to 0.2 wt %. The Ti contents are very low for magnetite with concentrations generally
<50 ppm. The Kiirunavaara D-ore magnetite grains have higher Si and V contents than
the B-ore magnetite. The degree of alteration seems not to affect the chemical
composition of the footwall magnetite at Kiirunavaara; both samples contain similar, and
low, trace element concentrations. The hanging wall magnetite at Kiirunavaara has higher
Si and lower V compared to the footwall magnetite. The magnetite from the syenite,
aplite, and granite intrusive rocks at the Kiirunavaara deposit shows some variation in
chemistry; particularly, the syenite magnetite, which has the highest Si content, and the
40
aplite magnetite has the highest V content. The Nukutusvaara ore magnetite grains have
higher Ti content than Kiirunavaara, Tuollavaara and Rektorn. The Rektorn ore shows
the most chemical variability visible in BSE, X-ray maps and reflected light described
earlier; trace element results confirms that the hematite ore contains elevated Ti and V
and is depleted in Ni and Ga relative to the magnetite ore (see Fig. 8).
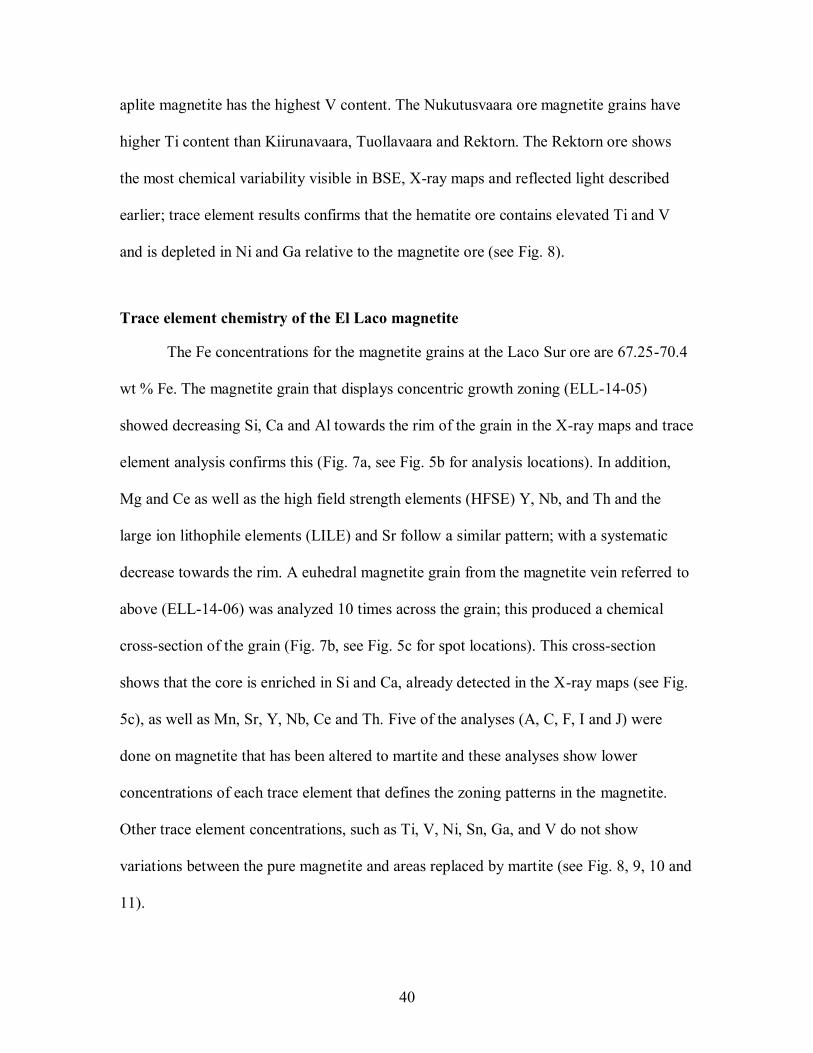
Trace element chemistry of the El Laco magnetite
The Fe concentrations for the magnetite grains at the Laco Sur ore are 67.25-70.4
wt % Fe. The magnetite grain that displays concentric growth zoning (ELL-14-05)
showed decreasing Si, Ca and Al towards the rim of the grain in the X-ray maps and trace
element analysis confirms this (Fig. 7a, see Fig. 5b for analysis locations). In addition,
Mg and Ce as well as the high field strength elements (HFSE) Y, Nb, and Th and the
large ion lithophile elements (LILE) and Sr follow a similar pattern; with a systematic
decrease towards the rim. A euhedral magnetite grain from the magnetite vein referred to
above (ELL-14-06) was analyzed 10 times across the grain; this produced a chemical
cross-section of the grain (Fig. 7b, see Fig. 5c for spot locations). This cross-section
shows that the core is enriched in Si and Ca, already detected in the X-ray maps (see Fig.
5c), as well as Mn, Sr, Y, Nb, Ce and Th. Five of the analyses (A, C, F, I and J) were
done on magnetite that has been altered to martite and these analyses show lower
concentrations of each trace element that defines the zoning patterns in the magnetite.
Other trace element concentrations, such as Ti, V, Ni, Sn, Ga, and V do not show
variations between the pure magnetite and areas replaced by martite (see Fig. 8, 9, 10 and
11).

41
Fig 7. Trace element zoning patterns in magnetite grains from the Laco Sur magnetite
ore. a) ELL-14-05 ore sample (see Fig. 5c for laser spot locations) and b) ELL-14-06 ore
sample (see figure 5c for laser spot locations). Faded symbols represent analysis that are
<LOD and open symbols are analysis of martite (pseudomorphic replacement of
magnetite to hematite). See text for details.

42
The host andesite at El Laco and the dacite from the Láscar volcano have lower
Fe content with concentrations ranging from 59.4-65.6 wt.% Fe and 56.8-61.4 wt % Fe,
respectively. This is possibly due to the presence of unavoidable ilmenite exsolution
lamellae and overall much higher Ti and other trace element concentrations. The andesite
host rock magnetite at El Laco contains elevated concentrations of Al, P, Ti, V, Cr, Mn,
Zn, Nb and Ba compared to the ore magnetite, a similar pattern to that described by Dare
et al. (2015) (see Figure 13). The dacite magnetite from Láscar had the highest trace
element content with the addition of elevated Mg, Si, Ca and Sn compared to the andesite
magnetite.
Mineral deposit-type discrimination diagrams
Loberg and Horndahl (1983) studied the geochemistry of magnetite in different types of
iron ores, including magnetite-apatite, titaniferous, and BIF, including samples from the
Kiruna and Bergslagen (southeast Sweden) regions and some samples from Iran and
Chile. Fe, Ti, V, and Ni, were used to create several discrimination plots. The Ni vs. V
diagram (Fig. 8a) show very homogeneous compositions of these two elements for each
individual sample, but there are significant variations between samples from each locality
and between El Laco and Kiruna samples. In contrast, the Ti concentrations are rather
heterogeneous and vary considerably even within each sample (Fig. 8b and c). Distinct
chemical variations between the Kiirunavaara ore (lowest Ti contents), the Per Geijer
ores near Kiruna (highest Ti concentrations), and the El Laco ores are observed.
-

43
Fig. 8. Magnetite discrimination plots by Loberg and Horndahl (1983) containing fields
for magnetite-apatite ores and BIF (a - d) and titaniferous iron ores (b - d) with samples
from this study plotted. a) V (ppm) vs. Ni (ppm). b) V/Ti vs. Ni/Ti. c) V (ppm) vs. Ti
(ppm) and d) V/Fe (ppm/wt %) vs. Ti/Fe (ppm/wt %). The symbols used here for the ore
magnetite are the same for the remaining figures in this paper. The open symbols
represent analysis of hematite or martite. See text for details.

44
Dupuis and Beaudoin (2011) also proposed several empirical discrimination
diagrams for magnetite from various deposit types including BIF, IOCG,
magnetiteapatite (Kiruna-type), porphyry-Cu, skarn and Fe-Ti-V layered mafic intrusion
deposits (Fig. 9). The two diagrams are based on Al + Mn + Ca (wt %) (Fig. 9a) and
Ni/(Cr + Mn) (Fig. 9b) on the y-axis vs. Ti + V (wt %) on the x-axis. In these plots, the
field of the Kiruna-type deposits was based on the analysis of magnetite from seven
different magnetite-apatite locations around the world, including Kiruna and El Laco
(Dupuis and Beaudoin, 2011). It should be noted that the samples chosen from Kiruna
and El Laco are different to those used in the present study. These diagrams are suggested
for usage during mineral exploration to fingerprint different styles of mineralization using
magnetite chemistry. We chose the version of the first diagram (Fig. 9a) modified by
Nadoll et al. (2014), who eliminated Ca from the y-axis component, because plotting with
or without Ca made little difference in where our data plotted because many of the Ca
contents are low or below the LOD.
In Figure 9a, the majority of the Kiruna and El Laco magnetite analyses from the
present study plot below and to the left of the proposed Kiruna field and none of the data
plot within that field. Magnetite from the Rektorn ore with elevated Ti plot within the Fe-
Ti, V deposit field. Magnetite from the stratabound ore of El Laco, plots non-uniquely in
the IOCG and porphyry copper fields, situated above and to the left of the Kiruna-type
field.
In Figure 9b, about one third of the magnetite-apatite ore analyses plot within the
Kiruna-type field but the majority plots within the IOCG field. The Ti-rich hematite from

45
the Rektorn ore plots within the Fe-Ti, V deposit field. The Ti-poor magnetite from the
Rektorn ore plots above the IOCG and Kiruna-type fields.
Fig. 9. Magnetite discrimination plots for various ore deposit-types by Dupuis and
Beaudoin (2011) and modified by Nadoll et al. (2014) with samples from this study

46
plotted. a) Al + Mn (wt %) vs. Ti + V (wt %). b) Ni/(Cr + Mn) vs. Ti + V (wt %). See
text for details.
Knipping et al. (2015) presented a discrimination diagram to distinguish Kiruna-
type deposits from porphyry, IOCG and Fe-Ti, V deposits based on the Cr and V content
of the magnetite (Fig. 10). The Kiruna-type deposits were defined as having low Cr
content (<~100ppm) and high V content (>~500ppm). Some of the magnetite analyses
from the Kiruna and El Laco magnetite-apatite ores in this study have higher Cr content
than previously reported (Dare et al., 2015) and plot above the Kiruna-type zone with
similar Cr and V content as magnetite from IOCG and porphyry deposits.
Fig. 10. Cr vs. V plot discriminating Kiruna-type from other ore deposit proposed by
Knipping et al. (2015). Many of the magnetite grains from the Kiruna and El Laco
magnetite-apatite ores in this study contain higher Cr concentrations than suggested in
this diagram. The faded symbols represent analysis of Cr that is <LOD. See text for
details.

47
Magmatic vs. hydrothermal magnetite discrimination diagrams
Nadoll et al. (2015) proposed using the concentrations of Ti and V in magnetite to
distinguish between hydrothermally and magmatically formed magnetite (Fig. 11). The
justification for this diagram is that Ti and V are often found in high concentrations
within magmatic magnetite and low concentrations within hydrothermal magnetite
(Nadoll 2015; Knipping et al., 2015). Knipping et al. (2015) used this diagram as well, to
support their magmatic-hydrothermal model for the formation of magnetite-apatite
deposits, and drew magmatic and hydrothermal fields using magnetite data from Nadoll
(2015). This is essentially the same plot used by Loberg and Horndahl (1983), to describe
magnetite from magnetite-apatite deposits vs. BIF and titaniferous iron ores (see Fig. 8c),
though used here to describe magnetite from different environments.
In Figure 11, magnetite data from the magnetite-apatite ores are plotted with the
addition of the host rock magnetite to evaluate the fields drawn by Knipping et al. (2015).
Most of the Kiruna magnetite data in the present study do not plot within the magmatic,
hydrothermal, or overlapping magmatic-hydrothermal fields. The magnetite from the
Kiirunavaara ore and host rocks has very low Ti concentrations that are at or below LOD
and plot to the left of the overlapping magnetite-apatite field. The hematite portions of
the Rektorn ore, with elevated Ti concentrations, plots in the magmatic magnetite field
and the magnetite, with low Ti concentrations, plots in the overlapping field. The
footwall magnetite at Rektorn plots within the hydrothermal magnetite field. The
stratabound ore magnetite at El Laco plots within the overlapping magnetite-apatite field
or to the left of this field. The host andesite magnetite at El Laco and the Láscar dacite
magnetite, both with high Ti and V concentrations, plot at the far top right of the
magmatic field.

48
Fig. 11. V vs. Ti plot first proposed by Nadoll et al. (2015) with hydrothermal and
magmatic magnetite fields drawn by Knipping et al. (2015). The plot suggests overall
higher Ti and V concentrations in igneous magnetite with considerable overlap in Ti and
V chemistry between hydrothermal and igneous magnetite. The symbols used for
magnetite samples of the host rock and related intrusive bodies are the same for the
remaining figures in this paper. The faded symbols here represent analysis of Ti that is
<LOD. See text for details.
Dare et al. (2014) proposed an empirical discrimination diagram of Ti vs. Ni/Cr
that shows there is a distinct chemical difference between magnetite that precipitated

49
from hydrothermal fluids and magnetite that crystallized from a magmatic melt (Fig. 12).
Most of our magnetite data, including the host rock magnetite data for Kiruna, had one or
more of the elements required for this plot below LOD. The Kiruna and Laco Sur ore
magnetite as well as most of the Kiruna host rock and related intrusive magnetite, which
occurs in igneous rocks, plots within the hydrothermal magnetite field proposed by Dare
et al. (2014) due to the low Ti and Cr content of the magnetite. However, magnetite from
Fig. 12. Samples from this study plotted on the Ti vs. Ni/Cr plot proposed by Dare at al.
(2014) to discriminate between magmatic and hydrothermal environments for magnetite
formation. The majority of the magnetite data from Kiruna and the ore magnetite from El
Laco had either Ni, Cr or Ti <LOD and these analysis are plotted here as faded symbols.
The dotted line, placed in this study, separates the host and intrusive magnetite in Kiruna
from the ore magnetite. See text for details.

50
the Kiruna host rocks and related intrusive rocks show a distinctly lower Ni/Cr ratio
compared magnetite from the Kiruna and El Laco ore. A recent detailed study of El Laco
by Velasco et al. (2016) showed that massive magnetite from the stratabound ore and the
disseminated magnetite related to the early alkaline-calcic alteration, and of undisputable
hydrothermal origin, plot in both the magmatic and hydrothermal fields.
Trace element variations for magnetite were plotted on a multi-element diagram
proposed by Dare et al. (2014) that was modified in this present study to leave out trace
elements not commonly found in magnetite and not measured in this study (e.g., Zr, Ge,
W, Sc, and Mo from the Kiruna analyses and Zr, Hf, Sc from the El Laco analyses) (Fig.
13). Elements are normalized to the bulk continental crust data from Rudnick and Gao
(2003). This diagram shows there to be distinct trace element chemical patterns between
magnetite from a magmatic origin and from magnetite that could be from a high-T or
low-T hydrothermal origin. Magmatic magnetite patterns from Dare et al. (2014) are
based on data from the El Laco andesite and the Bushveld complex as well as magnetite
from I-type granite. The high-temperature hydrothermal (500-700°C) region was defined
using analytical results for magnetite from nine different IOCG deposits. The low-
temperature hydrothermal zone (<500°C) is based on magnetite from iron-rich skarns,
Ag-Pb-Zn veins and BIFs. Average results from each magnetite sample in the present
study were used for this plot (Appendix III); this made the diagram easier to read and
interpret.
The trace element patterns for the magnetite-apatite ores at Kiruna are most
similar to the high-temperature hydrothermal magnetite zone (Fig. 13a). Magnetite within
the host and intrusive rocks in Kiruna for the most part follows a similar trace element

51
Fig. 13. Samples from this study on a multi-element variation diagram proposed by Dare
et al. (2014) showing trace elements in magnetite normalized to bulk continental crust
from Rudnick and Gao (2003). Zones showing the proposed compositional patterns of
magnetite from magmatic (pink), high- (yellow) and low- (blue) temperature
hydrothermal environments are shown. Each zone was adjusted in this study to
accommodate elements that were not analyzed. See text for details.

52
pattern to the ore magnetite, in the high-temperature hydrothermal zone, though with
overall lower trace element concentrations than the ore magnetite. None of the host
magnetite at Kiruna resembles the proposed magmatic trend even though they are hosted
in volcanic rocks, except peaks in Hf in magnetite from the Kiirunavaara hanging wall
and the syenite sill in the footwall at Kiirunavaara.
The trace element patterns for the Laco Sur ore magnetite show similar trends as
the high-temperature hydrothermal pattern, with high Mg trending into the magmatic
field and low Ga trending into the low-temperature hydrothermal field (Fig. 13b). The
andesite host rock magnetite at El Laco and the Láscar dacite magnetite follow the
magmatic magnetite trend. All magnetite from El Laco and Láscar analyzed in the
present study, including the andesite and dacite magnetite, shows higher concentrations
of Si, Ca, Y and P than what is typical of the magnetite zones proposed in this plot, with
the volcanic dacite magnetite containing the highest concentrations of these elements.
Discussion
The trace element geochemistry of magnetite depends on the content of the
element in the fluid, melt or aqueous, source and the capability of the host mineral to
accept the trace element in its structure, which can depend on variables such as the
temperature or the redox state. Thus, discrimination diagrams could only be used when
the host mineral is not saturated in the contained element and there is no competing
phases that could host it; otherwise, the trace element composition should be controlled
by the partitioning coefficient (KD) between both minerals. Also, drop in the temperature
or fluctuating conditions can lead to exsolution of separate phases, which also has to also
be taken into account. Furthermore, the accurate use of discrimination diagrams should

53
also exclude the presence of nanoinclusions, which cannot always be removed during the
LA-ICPMS data reduction.
The use of mineral deposit-type discrimination diagrams
The Loberg and Horndahl (1983) diagrams (see Fig. 8) worked effectively
plotting the magnetite-apatite ores within the appropriate fields. These diagrams contain
very broad discrimination fields, which accounts for the chemical variation observed in
the ore magnetite. In the case of the Rektorn ore, a higher Ti concentration in the
hematite ore suggests that this ore body formed at higher temperatures and more reducing
conditions (see Lindsley, 1976) or from a source richer in Ti. Regardless, the data suggest
that this mineralization had a different genesis or a source of different composition, or
both, from the other magnetite-apatite ores at Kiruna.
The Dupuis and Beaudoin (2011) diagrams (see Fig. 9) have narrow
discrimination fields. The magnetite-apatite data from this study do not plot within the
proposed Kiruna-type discrimination field and overlapped significantly with other deposit
types such as IOCG and porphyry-Cu. There is too much overlap in magnetite chemistry
from the Kiruna-type magnetite-apatite mineralization and the other types of deposits for
this diagram to work effectively. For instance, if these diagrams were to be used in
mineral exploration using magnetite as an indicator mineral it would be impossible to
distinguish magnetite sourced from magnetite-apatite ores from magnetite from IOCG or
Cu-porphyry deposits. Thus, and based on the results from the present study, the Kiruna
field needs to be significantly modified or removed from the diagram. Since many of the
magnetite-apatite ore analyses plot within the IOCG field, this could have implications

54
for a common connection between these two styles of mineralization, or alternatively,
could reveal a flaw in the reasoning behind the rationale for these diagrams.
The Knipping et al. (2015) Cr/V discrimination diagram was used to fingerprint
how Kiruna-type deposits have distinct Cr and V contents from porphyry, IOCG, and Fe-
Ti, V deposits (see Fig. 10). The rationale behind the Kiruna-type field in this diagram is
that higher V content relates to the high formational temperatures. The low Cr content of
Kiruna-type magnetite is explained by its high KD into the fractionation of augite or, and
deemed more likely, the high mobility of the Cr6+
into oxidized fluids that transported Cr
out of the magnetite-apatite ore forming system. As mentioned above in the results,
several of the magnetite analyses from the Kiruna and El Laco ores in this study have
higher Cr contents than previously reported for those localities (Dare et al., 2015).
Assuming the rationale behind the diagram is valid, then higher Cr content observed in
the ore magnetite in the present study suggests Cr, and possibly other elements that are
mobile in hydrothermal fluids such as Si, Ca and LILE, were not transported out of the
system but were incorporated into the magnetite.
The use of magmatic vs. hydrothermal magnetite discrimination diagrams
Nadoll et al. (2015), further used by Knipping et al. (2015), used V and Ti
concentrations to discriminate between magmatic and hydrothermal magnetite (see Fig.
11). Based on the magnetite data from the present study, and those of Velasco et al.
(2016), it is clear that magnetite from the magnetite-apatite deposits has extremely
variable V and Ti concentrations. Thus, many of the magnetite samples here plot outside
the fields on this diagram, questioning the integrity of the plot. Dare et al. (2014)
proposed another diagram that discriminates between magmatic and hydrothermal

55
magnetite using Ti and Ni/Cr concentrations (see Fig. 12). Although the magnetite from
magnetite-apatite ores plot within the hydrothermal magnetite field, this does not
necessarily verify that they formed hydrothermally, as has been shown by Velasco et al.
(2016). Probably, these empirical diagrams are too simple to distinguish and the Ti and
Ni/Cr ratios do not only depend on the precipitation from silicate or aqueous fluids or
needs additional constraints and/or adjustments.
Magnetite that crystallized from a melt of unique composition may contain lower
Ti concentrations than is normal for igneous magnetite. The multi-element variation
diagrams proposed by Dare et al. (2014) have fields that overlap significantly with each
other and none of the analyses from the present study plot perfectly within one field,
leaving ambiguity regarding the utility of that diagram (see Fig. 13). Furthermore, it must
be considered that it is not possible to directly compare the trace element patterns
between immiscible melts, such as a silicate melt and a presumable iron rich-melt, since
during phase separation, the KD irregularly distributes the elements between them.
Magnetite chemistry at Kiruna
The magnetite studied from the Kiruna magnetite-apatite ores is generally very
homogenous and shows few textural and chemical variations. It is strongly suggested that
the original trace element chemistry of the magnetite in the Kiruna ore and their host
rocks were affected by subsequent hydrothermal alteration and metamorphism. The rocks
at Kiruna have undergone widespread hydrothermal alteration (Westhues et al., 2016)
and up to greenschist facies metamorphism (Bergman et al., 2001); where widespread re-
crystallization of magnetite can occur (Dahl 1979). The X-ray maps of the Kiruna
magnetite grains revealed areas of increased Si and Al that often are correlated with each

56
other. These zones are blotchy and random and could likely be a result of metasomatic
alteration. The high-Al domains are most prominent in the larger grains of the ore and
footwall magnetite could be nanoinclusions of an Al-rich mineral or may also be the
result of metasomatic alteration.
Hydrothermal titanite is widespread in the Kiruna ore (Romer et al., 1994; Storey
et al., 2007) and indicates that the hydrothermal fluids were rich in Ti. Titanite has been
dated to be just younger, though with overlapping error (1876 ± 9 Ma, Romer et al.,
1994) than the volcanic rocks around Kiirunavaara (1890 ± 90 Ma, Cliff et al., 1990).
Recent in situ dating confirmed these time constraints and it is suggested that the titanite
ages reflect the metasomatic alteration overlapping with the ore formation (Westhues et
al., 2016).
Although the magnetite chemistry of the Kiruna rocks are very similar in most
elements (see Fig. 11 and 13), the Ni/Cr vs Ti plot after Dare et al. (2014) (see Fig. 12)
revealed, a distinct difference in the Ni/Cr content of the magnetite from the magnetite-
apatite ores and the host rocks/related felsic intrusive rocks: The latter have a more
similar Ni/Cr content as the El Laco host rocks but with lower Ti concentrations. This
may suggest that, before subsequent intensive alteration of the host rocks, primary
magnetite may have had a more similar composition to the magnetite in andesite at El
Laco. Because the chemistry of the magnetite studied in the rocks at Kiruna show
indications of being subsequently altered by metasomatism, it is difficult to draw any
conclusive arguments on how the magnetite-apatite ores formed through the utilization of
magnetite discrimination diagrams.

57
Magnetite chemistry at El Laco
The magnetite from El Laco is much younger than at Kiruna and has not been
affected by metamorphism, but most of it likely has undergone various degrees of
hydrothermal alteration (Tornos et al., 2016). There are clear chemical differences at El
Laco in the magnetite ore and magnetite from the andesite host and the dacite sample
from the nearby Láscar Volcano. The andesite and dacite samples have similar trace
element chemistry with signatures that plot as igneous magnetite on proposed
discrimination diagrams (see Figs. 10, 11 and 12) and have clear exsolution textures
common in Ti-rich magmatic magnetite crystallized in hot and reduced settings (Mehdilo
and Irannajad 2010). The Láscar dacite magnetite has elevated trace element
concentrations compared to the El Laco andesite magnetite. This may indicate that the
source melt of the volcanic rocks at Láscar has a different composition from the El Laco
volcanic rocks or certain physicochemical parameters were different such as lower fO2 of
the melt at Láscar during magnetite crystallization.
The ore magnetite at El Laco shows clear zonation patterns in BSE and X-ray
maps, which have also been described by previous authors (Fig. 5) (e.g., Velasco and
Tornos 2011; Dare et al., 2015; Velasco et al., 2016). The centers of the magnetite
crystals show elevated concentrations of Si, Ca and LILE (Fig. 7) compared to the outer
regions; these elements are considered to be incompatible and highly mobile in
hydrothermal environments (Dare et al., 2014; Nadoll et al., 2014). However, the cores
also show elevated concentrations of Mg, Al and Mn, elements that are considered
compatible and generally immobile in hydrothermal fluids as well as HFSE (Y, Nb, Ce
and Th), which are incompatible during partial melting but not as readily mobile in
hydrothermal environments (McCulloch and Gamble 1991, Blake 1992). Also, the ore

58
magnetite were reported as being “enriched” in elements that are highly mobile in
hydrothermal fluids, though concentrations of these elements are not higher than was
detected in the unaltered andesite magnetite or the Láscar dacite magnetite (see Fig. 13
and Appendix III).
If the El Laco ores formed through metasomatic replacement of the andesite host
rocks as proposed by Dare et al. (2015), one would expect elevated LILE concentrations
in the magnetite; however, the HFSE and especially incompatible elements are not
readily mobile in hydrothermal fluids and one would expect them to be in lower
concentrations than the LILE and not behaving the same way during magnetite
crystallization. Dare et al. (2014) describes iron-rich skarn magnetite as having element
concentrations and euhedral zoning similar to the El Laco magnetite. However, the
elements that define growth zones in the iron-rich skarn magnetite are not enriched and
depleted in the same layers, suggesting quick changes in the composition of the
igneous/aqueous fluid pulses that crystallized the magnetite. Also, elements such as V
and Ni are zoned in the iron-rich skarn magnetite (Dare et al., 2014) and this is not
observed in the El Laco magnetite suggesting not all elements were fluctuating during
magnetite growth, as would be the case during growth from hydrothermal fluids.
Looking closely at the zoning chemistry of the El Laco ore magnetite, a
combination of incompatible elements, compatible elements, LILE and HFSE behave the
same way during magnetite crystal growth (i.e., they are all found either elevated or
depleted in the same layers). Formation of magnetite from a crystallizing iron oxide melt
at El Laco is consistent with the presence of magmatic textures, the stable isotope
geochemistry and the presence of melt inclusions with evidences of melt immiscibility; it

59
is also difficult to envisage the circulation of iron-rich hot brines at shallow depths
(Tornos et al., 2016). Thus, the chemistry of the magnetite at El Laco can be explained by
magnetite crystallizing from an iron-rich melt that is initially enriched in the elements
involved in the zonation patterns with periodic replenishment from the source melt during
magnetite growth with less replenishment over time. Or, and more likely, the
crystallization of magnetite during fluctuating redox conditions (fO2), fluid content and
temperature of the melt. As the iron-rich melt moved closer to the surface the system
would have shifted from a reduced environment to an oxidized environment. In an
oxidized system there is an increase of Fe3+
, which occupies octahedral sites in
magnetite, inhibiting the incorporation of other elements, such as Ti, that were present in
the iron-rich melt (Buddington and Lindsley 1964). It should also be noted that spherical
to spheroidal magnetite particles have been described from more friable ore than the
samples used in the study, textures that can only be explained by rapid cooling of an iron-
rich melt (Henríquez and Martin 1978; Nyström et al., 2016).
Conclusions
After a critical evaluation of empirical magnetite discrimination diagrams using
newly obtained data on the trace element composition of magnetite from precisely known
geographic and geologic locations (encompassing the Kiruna and El Laco magnetite-
apatite ores and their associated hydrothermally altered host rocks) the following
conclusions can be drawn for practical usage in determining the environment from which
magnetite crystallized (i.e., hydrothermal or magmatic):
1) Only the earlier diagrams by Loberg and Horndahl (1983), with very broad
discrimination fields, allowed effectively plotting the magnetite-apatite ores within the

60
appropriate field. The more recent discrimination diagrams proposed by Dupuis and
Beaudoin (2011) and Knipping et al. (2015), with more constrained fields, need to be
adjusted if they are to include the Kiruna-type magnetite;
2) The Cr content from Kiruna-type magnetite reached higher concentrations than
previously reported by Knipping et al. (2015), this calls into questions the validity of the
Cr-V plot as well as conclusions drawn from using this plot to support the genetic model
for magnetite-apatite deposits that is proposed by these authors;
3) The magmatic vs. hydrothermal discrimination diagram for magnetite by
Knipping et al. (2015) needs modification as many of the data from the present study did
not plot within either of the proposed fields;
4) The magmatic vs. hydrothermal magnetite diagram by Dare et al. (2014) had
limited use because most of the data collected had non-detectable Cr, Ni, or Ti
concentrations. The data below LOD, however, had to be plotted in order to evaluate this
diagram. The indisputably igneous magnetite (e.g., El Laco andesite and Láscar dacite)
effectively plotted within the magmatic magnetite field. The magnetite-apatite ores from
El Laco and Kiruna and host rock magnetite at Kiruna all plot within the hydrothermal
field. The host rock magnetite has distinctly lower Ni/Cr ratio than magnetite from the
magnetite-apatite ores.
5) The multi-element variation diagrams proposed by Dare et al. (2014) only work
if the magnetite-apatite ores are actually of hydrothermal origin, and do not work on
magnetite that has undergone subsequent metamorphism and/or metasomatic alteration
such as at Kiruna.

61
After reviewing the chemistry and textures of the magnetite from the Kiruna and
El Laco magnetite-apatite ores and their host rocks the following conclusions can be
made:
1) It is likely that the magnetite at Kiruna is largely influenced by subsequent
metamorphism and/or metasomatic alteration. Whether the magnetite-apatite ores, which
show hydrothermal signatures on the diagrams discussed above, originated from
hydrothermal fluids or formed later through post-ore metamorphic or metasomatic
alteration cannot be determined using magnetite chemistry alone; and
2) The magnetite from magnetite-apatite ores at El Laco have chemical zonations
that appear similar to Fe-rich skarns (Dare et al., 2015), though there are very distinct
differences in the zonation patterns. Observations of the chemical zonation patterns in the
El Laco magnetite that do not correlate with iron-rich skarn magnetite include: a) The El
Laco ore magnetite has zonations of compatible, LIL and HFS elements that are all
elevated or depleted in the same crystal layers; and, b) some compatible elements are
homogenous across the magnetite grains (i.e., V and Ni). With these observations, we
propose the magnetite at El Laco is indicative of having crystallized from a volatile-rich
iron-oxide melt that was fluctuating in physiochemical conditions rather than from
replacement of the host rocks by pulses of hydrothermal fluids.
Acknowledgements
We would like to thank the Natural Sciences and Engineering Research Council
of Canada (NSERC) discovery grant to JMH. The contribution of FT has been funded by
the project SEIDI 2014 CGL2014-55949-R. Thanks to LKAB and Compañía Minera del
Pacífico for help in logistics, and permission to sample and granting access to the mine

62
sites. We thank the reviewers (P. Williams and N. Oliver) for thorough and constructive
criticism of the original manuscript. Thanks also to B. Lehmann for his review and
editorial additions, and handling of this paper.
References
Alva-Vadivia LM, Rivas ML, Goguitchaichvili A, Urrutia-Fucugauchi J, Gonzalez JA, Morales J, Gómez
S, Henríquez F, Nyström JO, Naslund RH (2003) Rock-magnetic and oxide microscopic studies of
the El Laco ore deposits, Chilean Andes, and implications for magnetic anomaly modeling.
International Geology Review 45:533-547
Barton MD, Johnson DA (1996) Evaporitic-source model for igneous-related Fe oxide-(REE-Cu-Au-U) mineralization. Geology 24:259-262
Barton MD, Johnson DA (2004) Footprints of Fe-oxide(-Cu-Au) systems. SEG 2004: Predictive Mineral
Discovery Under Cover. Centre for Global Metallogeny, Spec Pub 33:112-116
Bergman S, Kubler L, and Martinsson O (2001) Description of regional geological and geophysical maps
of northern Norrbotten County (east of the Caledonian Orogen). Sveriges Geologiska
Undersokning 56:110
Blake KL (1992) The petrology, geochemistry and association to ore formation of the host rocks of the
Kiirunavaara magnetite-apatite deposit, northern Sweden. PhD thesis. University of Wales College of Cardiff
Buddington AF, Lindsley DG (1964) Iron-titanium oxide minerals and synthetic equivalents. J Petrol
5(2):310-357
Chamberlain SC, Robinson GW, Lupulescu M, Morgan TC, Johnson JT, deLorraine WB (2008) Cubic and
tetrahexahedral magnetite. Rocks & Minerals 83(3):224-239. Doi: 10.3200/RMIN.83.3.224-239
Crohn PW, Moore DH (1984) The Mud Tank carbonatite, Strangways Range, central Australia. Journal of
Australian Geology & Geophysics 9:13-18
Dahl PS (1979) Comparative geothermometry based on major-element and oxygen isotope distributions in precambrian metamorphic rocks from southwestern Montana. American Mineralogist 64:1280-
1293
Dare SAS, Barnes S-J, Beaudoin G, Méric J, Boutroy E, Potvin-Doucet C (2014) Trace elements in
magnetite as petrogenetic indicators. Miner Deposita 49:785-796
Dare SAS, Barnes S-J, Beaudoin G (2015) Did the massive magnetite “lava flows” of El Laco (Chile) form
by magmatic or hydrothermal processes? New contraints from magnetite composition by LA-ICP-
MS. Miner Deposita 50:607-617
Dupuis C, Beaudoin G (2011) Discriminant diagrams for iron oxide trace element fingerprinting of mineral deposit types. Miner Deposita 46:319-335.
Dymek RF, Owens BE (2001) Petrogenesis of apatite-rich rocks (nelsonites and oxide-apatite
gabbronorites) associated with massif anorthosites: Econ Geol 96:797-815

63
Edfelt A, Armstrong RN, Smith M, Martinsson O (2005) Alteration paragenesis and mineral chemistry of
the Tjarrojakka apatite-rion and Cu (-Au) occurrences, Kiruna area, northern Sweden. Miner
Deposita 40:409-434
Frietsch R (1978) On the magmatic origin of iron ores of the Kiruna type. Econ Geol 73:478-485
Frietsch R, Perdahl Jan-Anders (1995) Rare earth elements in apatite and magnetite in Kiruna-type iron
ores and some other iron ore types. Ore Geology Reviews 9:489-510
Geijer P (1910) Igneous rocks and iron ores of Kiirunavaara, Luossavaara and Tuollavaara. Scientific and
practical researches in Lapland arranged by the Luossavaara-Kiirunavaara Aktiebolag - Geology
of the Kiruna district, 2: Stockholm, p. 278
Geijer P (1919) Recent developments at Kiruna, SGU, C 288, p. 23
Grigsby JD (1990) Detrital magnetite as a provenance indicator. Journal of Sedimentary Petrology
60(6):940-951
Groves DI, Bierlein FP, Meinert LD, Hitzman MW (2010) Iron oxide copper-gold (IOCG) through earths
history: implications for origin, lithospheric setting, and distinction from other epigenic iron oxide
deposits. Econ Geol 105:641-654
Hall JM, Fisher BE (1987) The characteristics and significance of secondary magnetite in a profile through
the dike component of the Troodos, Cyprus, ophiolite. Canadian Journal of Earth Science
24:2141-2159
Hallberg A, Bergman T, Gonzalez J, Larsson D, Morris GA, Perdahl JA, Ripa M, Niiranen T, Eilu P (2012)
Metallogenic areas in Sweden. Survey of Finland, Special Paper 53:139-206
Harlov DE, Andersson UB, Forster H-J, Nyström JO, Dulski P, Broman C (2002) Apatite-monazite
relations in the Kiirunavaara magnetite-apatite ore, northern Sweden. Chemical Geology 191:47-
72
Henríquez F, Martin RF (1978) Crystal growth textures in magnetite flows and feeder dykes, El Laco,
Chile, Can Miner 16:581-589
Hildebrand RS (1986) Kiruna-type deposits - their origin and relationship to intermediate subvolcanic
plutons in the Great Bear magmatic zone, northwest Canada: Econ Geol 81:640-659
Hitzman MW, Oreskes N, Einaudi MT (1992) Geological Characteristics and Tectonic Setting of Proterozoic Iron-Oxide (Cu-U-Au-Ree) Deposits. Precambrian Research 58:241-287
Jochum KP, Willbold M, Raczek I, Stoll B, Herwig K (2005) Chemical characterisation of the USGS
reference glasses GSA-1G, GSC-1G, GSD-1G, GSE-1G, BCR-2G, BHVO-2G and BIR-1G using
EPMA, ID-TIMS, ID-ICP-MS and LA-ICP-MS. Geostandards and Geoanalytical Research
29(3):285-302
Knipping JL, Bilenker LD, Simon AC, Reich M, Barra F, Deditius AP, Wälle M, Heinrich CA, Holtz F,
Munizaga R (2015) Trace elements in magnetite from massive iron oxide-apatite deposits indicate
a combined formation by igneous and magmatic-hydrothermal processes. Geochim Cosmochim
Acta 171:15-38
Lindsley DH (1976) The crystal chemistry and structure of oxide minerals as exemplified by the Fe-Ti
oxides. In Oxide minerals. Mineralogical Society of America, Short Course Notes 3:L-1 to L-60

64
Lindsley DH (1991) Oxide minerals: petrologic and magnetic significance. Reviews in Mineralogy,
Volume 25, Stony Brook, New York, USA
LKAB (2015) Annual and sustainability report. http://www.lkab.com/en/. Accessed 30 April 2016
Loberg BEH, Horndahl A-K (1983) Ferride geochemistry of swedish precambrian iron ores. Miner Deposita 18:487-504
Martinsson O (1994) Greenstone and porphyry hosted ore deposits in northern Norbotten, NUTEK report
nr 92-00752P: Luleå, p. 31.
Martinsson O (2004) Geology and metallogeny of the northern Norrbotten Fe-Cu-Au province: Society of
Economic Geologists, Guidebook Series 33:131-148
Martinsson O, Billström K, Broman C, Weihed P, Wanhainen C (2016) Metallogeny of the northern
Norrbotten ore province, northern fennoscandian shield with emphasis on IOCG and apatite-iron
ore deposits. Ore Geology Reviews. doi: 10.1016/j.oregeorev.2016.02.011
McCulloch MT, Gamble JA (1991) Geochemical and geodynamical constraints on subduction zone
magmatism. Earth and Planetary Science Letters 102:358-374
Mehdilo A, Irannajad M (2010) Applied mineralogical studies on iranian hard rock titanium deposit.
Journal of Minerals & Material Characterization & Engineering 9(3):247-262
Mucke A, Younessi R (1994) Magnetite-Apatite Deposits (Kiruna-Type) Along the Sanandaj-Sirjan Zone
and in the Bafq Area, Iran, Associated with Ultramafic and Calcalkaline Rocks and Carbonatites:
Mineralogy and Petrology 50:219-244
Muller B, Axelsson MD, Bjorn O (2003) Trace elements in magnetite from Kiruna, northern Sweden, as determined by LA-ICP-MS. GFF 125:1-5
Nadoll P, Angerer T, Mauk JL, French D, and Walshe J (2014) The chemistry of hydrothermal magnetite: a
review. Ore Geology Reviews 61:1-32
Naranjo JA, Henríquez F, Nyström JO (2010) Subvolcanic contact metasomatism at El Laco Volcanic
Complex, Central Andes. Andean Geology 37:110-120
Naslund HR, Henríquez FJ, Nyström JO, Vivallo W, Dobbs F (2002) Magmatic iron ores and associated
mineralization: examples from the Chilean High Andes and Coastal Cordillera; in Porter, T.M.
(Ed.), Hydrothermal Iron Oxide Copper-Gold & Related Deposits: A Global Perspective, PGC
Publishing, Adelaide, 2:207-226
Nyström JO, Henríquez F (1994) Magmatic features of iron ores of the Kiruna type in Chile and Sweden;
ore textures and magnetite geochemistry. Econ Geol 89:820-839
Nyström JO, Billström K, Henríquez F, Fallick AE, Naslund H R (2008) Oxygen isotope composition of
magnetite in iron ores of the Kiruna type in Chile and Sweden. Gff 130:177-188
Nyström JO, Henríquez F, Naranjo JA, Naslund HR (2016) Magnetite spherules in pyroclastic iron ore at
El Laco, Chile. Am Mineral 101:587-595
Paton C, Hellstrom J, Paul B, Woodhead J, Hergt J (2011) Iolite: Freeware for the visualisation and processing of mass spectrometric data. Journal of Analytical Atomic Spectrometry 26:2508-2518.
doi: 10.1039/c1ja10172b

65
Parák T (1975) Kiruna iron ores are not 'intrusive-magmatic ores of the Kiruna type'. Econ Geol 70:1242-
1258
Park CF (1961) A magnetite “flow” in northern Chile. Econ Geol 56:431-436
Pollard PJ (2006) An intrusion-related origin for Cu-Au mineralization in iron-oxide-copper-gold (IOCG) provinces. Miner Deposita 41:179-187
Philpotts AR (1967) Origin of certain iron-titanium oxide and apatite rocks. Econ Geol 62:303-315
Ramanaidou E, Wells M, Belton D (2008) Mineralogical and microchemical methods for the
characterization of high-grade banded iron formation-derived iron ore. SEG Reviews 15:129-156
Rhodes AL, Oreskes N (1999) Oxygen isotope composition of magnetite deposits at El Laco, Chile:
evidence of formation from isotopically heavy fluids. Soc of Econ Geol, Spec Pub 7:333-351
Richards JP, Mumin AH (2013) Magmatic-hydrothermal processes within an evolving Earth: Iron oxide-
copper-gold and porphyry Cu ± Mo ± Au deposits. Geology 41:767-770
Rudnick R, Gao S (2003) Composition of the continental crust. Treatise Geochem 3:1-64
Sabet-Mobarhan-Talab A, Alinia F, Ghannadpour S-S, Hezarkhani A (2015) Geology, geochemistry, and
some genetic disscussion of the Chador-Malu iron oxide-apatite deposit, Bafq District, Central
Iran. Arab J Geosci 8:8399-8418
Sillitoe RH, Burrows DR (2002) New field evidence bearing on the origin of the el laco magnetite deposit,
northern Chile. Econ Geol 97:1101-1109
Sillitoe RH (2003) Iron oxide-copper-gold deposits: an Andean view. Miner Deposita 38:787-812. doi: 10.1007/s00126-003-0379-7
Tassi F et al. (2009) The magmatic- and hydrothermal-dominated fumarolic system at the active crater of
Láscar volcano, northern Chile. Bull Volcanol 71:171-183
Tornos F, Velasco F, Hanchar JM (2016) Iron oxide melts, magmatic magnetite and superheated magmatic-
hydrothermal systems: the El Laco deposit, Chile. Geology, 44(6):427-430
Valley PM, Fisher CM, Hanchar JM, Lam R, and Tubrett M (2010) Hafnium isotopes in zircon: A tracer of
fluid-rock interaction during magnetite-apatite ("Kiruna-type") mineralization. Chemical Geology
275:208-220
Valley PM, Hanchar JM, Whitehouse MJ (2011) New insights on the evolution of the Lyon mountain
granite and associated Kiruna-type magnetite-apatite deposits, Adirondack Mountains, New York
State. Geosphere 7:357-389
Velasco F, Tornos F (2012) Insights on the effects of the hydrothermal alteration in the El Laco magnetite
deposit (Chile). Revista de la Sociedad Española de Mineralogía 16:210-211
Westhues A, Hanchar JM, Whitehouse MJ, Martinsson O (2016) New constraints on the timing of host
rock emplacement, hydrothermal alteration and iron oxide apatite mineralization in and around
Kiruna, Norrbotten region, northern Sweden. Econ Geol, in press
Williams PJ, Hedenquist JW, Barton MD, Johnson DA, Fontbote L, de Haller A, Mark G, Oliver NHS,
Marschik R, Thompson JFH, Goldfarb RJ, Richards JP (2005) Iron oxide copper-gold deposits;
geology, space-time distribution, and possible modes of origin. Econ Geol 100:371-405

66
Chapter 3: Summary
Magnetite-apatite ore mineralization has been a subject of debate for over a
century and it continues to remain unclear whether they are of hydrothermal or magmatic
origin, or a combination of those two processes (e.g., Geijer, 1910; Geijer, 1919; Parák,
1975; Frietsch, 1978; Nyström and Henríquez, 1994; Dare et al., 2014; Tornos et al.,
2016). My research contributes to the understanding of how magnetite-apatite ore
crystallized at El Laco and Kiruna specifically and possibly other localities through
interpretation of the trace element content of magnetite.
Magnetite can incorporate a wide range of trace elements, with distinctive
chemical characteristics depending on the crystallizing environment in which it formed.
The specific trace element characteristics of magnetite from the various crystallizing
environments are not yet well known. Previous authors have proposed various empirical
discrimination diagrams to delineate the magnetite chemistry from different types of
deposits and crystallizing environments. My research presents new magnetite trace
element geochemistry data from the magnetite-apatite deposits in Kiruna, Sweden, and El
Laco, Chile, and their respective host rocks as well as magnetite from three different
crystallizing environments. The magnetite chemistry was used in this study to critically
evaluate the proposed discrimination diagrams for their general use and determine
whether magnetite chemistry can be used to determine the crystallizing environment (i.e.,
hydrothermal or magmatic) of magnetite-apatite deposits. The following conclusions
were drawn from this study:
1) From the mineral deposit-type magnetite discrimination diagrams tested in this
study only the earlier diagrams by Loberg and Horndahl (1983), worked for effectively

67
plotting the magnetite-apatite ores within the appropriate field. The more recent empirical
discrimination diagrams proposed by Dupuis and Beaudoin (2011) and Knipping et al.
(2015), with more tightly constrained fields, need to be modified if they are to include the
Kiruna-type magnetite.
2) The magmatic vs. hydrothermal diagrams tested in this study did not help in
determining the mineralizing environment of magnetite-apatite deposits. The magnetite
discrimination diagram proposed by Knipping et al. (2015) needs modification as many
of the data from the present study did not plot within either of the proposed fields. We
believe that the magmatic vs. hydrothermal magnetite diagram by Dare et al. (2014) is
too simple to distinguish the crystallizing environment of magnetite because the Ti and
Ni/Cr ratios do not only depend on the precipitation from silicate or aqueous fluids. The
diagram was also not entirely useful since most of the magnetite analyzed has Cr, Ti or
Ni content at or below the LOD. The multi-element variation diagrams proposed by Dare
et al. (2014) only work if the magnetite-apatite ores are actually of hydrothermal origin,
and do not work on magnetite that have undergone subsequent metamorphism and/or
metasomatic alteration such as at Kiruna.
3) Based on the trace element results of the magnetite in Kiruna it is likely that the
grains are mostly influenced by subsequent metamorphism and/or metasomatic alteration
by hydrothermal fluids because primary textures and unique chemical signatures do not
appear to be present. Therefore, conclusions on the crystallizing environment of the
magnetite-apatite ores in Kiruna cannot be made using the magnetite chemistry. At El
Laco however, the magnetite shows internal chemical zonation that are indicative of
having crystallized from a volatile-rich iron oxide melt rather than directly as a

68
precipitate from hydrothermal fluids. This interpretation is based on unique differences in
the chemical zonations of the magnetite-apatite ore magnetite at El Laco and the
chemical zonations found in iron-rich skarn magnetite presented by Dare et al. (2014).
References
Dare SAS, Barnes S-J, Beaudoin G, Méric J, Boutroy E, and Potvin-Doucet C (2014) Trace elements in magnetite as petrogenetic indicators. Miner Deposita 49:785-796
Dupuis C, Beaudoin G (2011) Discriminant diagrams for iron oxide trace element fingerprinting of mineral
deposit types. Miner Deposita 46:319-335.
Frietsch R (1978) On the magmatic origin of iron ores of the Kiruna type. Econ Geol 73:478-485
Geijer P (1910) Igneous rocks and iron ores of Kiirunavaara, Luossavaara and Tuollavaara. Scientific and
practical researches in Lapland arranged by the Luossavaara-Kiirunavaara Aktiebolag - Geology
of the Kiruna district, 2: Stockholm, p. 278
Geijer P (1919) Recent developments at Kiruna, SGU, C 288, p. 23
Knipping JL, Bilenker LD, Simon AC, Reich M, Barra F, Deditius AP, Wälle M, Heinrich CA, Holtz F,
and Munizaga R (2015) Trace elements in magnetite from massive iron oxide-apatite deposits
indicate a combined formation by igneous and magmatic-hydrothermal processes. Geochim
Cosmochim Acta 171:15-38
Loberg BEH, and Horndahl A-K (1983) Ferride geochemistry of swedish precambrian iron ores. Miner
Deposita 18:487-504
Nyström JO, and Henríquez F (1994) Magmatic features of iron ores of the Kiruna type in Chile and
Sweden; ore textures and magnetite geochemistry. Econ Geol 89:820-839
Parák T (1975) Kiruna iron ores are not 'intrusive-magmatic ores of the Kiruna type'. Econ Geol 70:1242-
1258

69
Appendix I. Sample list with GPS location, underground level (Kiruna samples) or Elevation (El Laco and Láscar samples),
rock type, mineralogy and magnetite textures.
Sample Latitude Longitude Underground
level (m) Rock type: mineralogy Magnetite texture
KRN-10-02 N 67° 51' 11.5'' E 20° 12 '42.1'' 1060 B-ore: mag, ±bt massive
K-1 N 67° 51' 0.6'' E 20° 12' 23.8'' 767 D-ore: mag, ap, plag, ±bt, ksp, qtz subhedral
K-2 N 67° 51' 11.5'' E 20° 12 '42.1'' 1060 B-ore: mag, ±bt massive
KRN-11-01 N 67° 51' 15.7'' E 20° 12' 20.7'' 816 D-ore: mag, act, ap massive, subhedral
KRN-11-03 N 67° 50' 13.1'' E 20° 12' 17.4'' 1365 Andesite (less altered FW): plag,
ksp, bt, act, mag, ±qtz anhedral
KRN-11-04 N 67° 51' 07.0'' E 20° 12' 25.1'' 1020 Andesite (altered FW): ksp, plag, bt,
mag, act, ±qtz anhedral
KRN-11-05 N 67° 50' 35.6'' E 20° 12' 37.4'' 1065 Rhyodacite (less altered HW): ksp,
plag, qtz, bt, ±amph euhedral-subhedral
KRN-12-02 N 67° 50' 57.8'' E 20° 10' 24.7'' Surface Aplite vein: qtz, ksp, plag, ±mag, act,
tit, zr anhedral
KRN-12-03 N 67° 50' 23.4'' E 20° 10' 49.7'' Surface Syenite: ksp, amph, tit, ±plag, qtz anhedral
KRN-12-05 N 67° 50' 30.1'' E 20° 10' 50.1'' 1365 Granite: ksp, qtz, tit, ilm, ±plag, bt euhedral-subhedral
REK-10-04 N 67° 52' 17.4'' E 20° 14' 07.4'' Surface Ore: mag, hem, ap, ±cc, qtz massive mag and hem
REK-12-02 N 67° 52' 18.0'' E 20° 14' 08.1'' Surface Rhyodacite (FW): qtz, ap, ksp (ser),
chl, mag ±bt subhedral-anhedral
NUK-10-03 N 67° 53' 51.0'' E 20° 15' 31.9'' Surface Ore: mag, ap, act, bt, ±cc subhedral-anhedral
NUK-12-02 N 67° 53' 51.0'' E 20° 15' 31.9'' Surface Ore + host: mag, ap, qtz, ksp, ser, ±bt subhedral-anhedral
TUV-10-01 N 67° 51' 15.1'' E 20° 18' 54.1'' Surface Ore: mag, act, ap anhedral
TUV-10-03 N 67° 51' 13.9'' E 20° 18' 57.0'' Surface Rhyodacite: ksp, qtz ±amph, tit anhedral

70
Appendix I. (continued)
Sample Latitude Longitude Elevation (m) Rock type: mineralogy Magnetite texture
ELL-14-02 S 23° 49' 5.9'' W 67° 29' 40.2'' 4814 Andesite (host): plag, cpx, ±qtz, mag anhedral, micro-ilmenite
exsolution in BSE
ELL-14-04 S 23° 15' 14.4'' W 67° 29' 22.2'' 5404 Vuggy ore: mag, keno-mag ±mar
massive, euhedral lining
voids, extensive alteration
to keno-mag,
porous cores with growth
zoning
ELL-14-05 S 23° 15' 14.4'' W 67° 29' 22.2'' 5404 Vesicular ore: mag ±mar
massive and vesicular,
euhedral lining voids, mag
growth zoning
ELL-14-06 S 23° 50' 33.8'' W 67° 29' 22.2'' 4653 Vein ore: mag ±mar
massive and subhedral-
euhedral lining voids,
extensive alteration to
martite, mag growth zoning
LAS-14-07 S 23° 22' W 67° 43' base of volcano Dacite (Volcanic ejecta): plag, cpx,
±qtz, mag
anhedral, some ilmenite
exsolution in BSE
Notes: KRN/K: Kiirunavaara, REK: Rektorn, NUK: Nukutusvaara, TUV: Tuollavaara, FW: footwall, HW: hanging wall; ELL: El Laco
volcano, Laco Sur deposit; LAS: Láscar volcano;
Mineral abbreviations: mag=magnetite, hem=hematite, mar=martite, keno-mag=kenomagnetite, ap=apatite, bt=biotite, qt= quartz,
plag=plagioclase, ksp=k-feldspar, act=actinolite, hbl=hornblende, amph=amphibole, ilm=ilmenite, tit=titanite, cc=calcium carbonate,
ser=sericite, chl=chlorite, zr=zircon, cpx=clinopyroxene

71
Appendix II. Summarized methods for EPMA Fe analysis and LA-ICPMS trace
element analyses of magnetite.
EPMA
Model
JEOL JXA-8230 Superprobe
Voltage
15kV
Current
100nA
Spot size
3μm
Peak counting time
10s
Background counting time
20s
Primary standard
Astimex magnetite
Secondary standards used:
Balmat, Mud Tank, and BC-28 natural magnetite
Element X-ray line
Fe (Kα)
Analyzing crystal LiFH
LA-ICPMS
Model
Thermo-Finnigan ELEMENT XR coupled with
a GeoLas 193 nm Excimer laser system
Pulse frequency
8 Hz
Energy density
3 J/cm2
Spot size
30-59μm depending on sample and
trace element concentration.
Gas blank
30s
Signal
60s
Internal standard
Fe (EPMA)
Primary reference material
NIST-610
Secondary reference
material
BCR-2G; Balmat, Mud Tank, BC-28 natural
magnetite

72
Appendix III. Average (mean) LA-ICP-MS (ppm) and EPMA (Fe wt %) results for trace elements used in plots from Kiruna and
El Laco/Láscar magnetite samples. Minimum level of detection (LOD) calculated by Iolite reported for each analysis session.
Kiruna KRN-10-02 K-1 K-2 KRN-11-01 KRN-11-03 KRN-11-04 KRN-11-05 KRN-12-02
Min LOD N=6 N=7 N=9 N=7 N=5 N=7 N=2 N=3
Fe EPMA 69.7 69.6 70.0 70.2 70.3 70.3 69.9 69.7 24
Mg 8.20 764 249 78.4 54.4 64.8 89.5 <LOD 43.3 27
Al 16.59 38.0 263 39.4 569 97.3 92.3 83.0 44.0 29
Si 496.60 3620 1530 947 2590 850 908 1600 850 31
P 16.49 175 38.0 132 297 20.3 <LOD 31.0 36.0 44
Ca 254 860 <LOD 440 <LOD <LOD 660 <LOD 330 47
Ti 31.6 61.0 77.0 63.5 209 <LOD 68.3 <LOD 50.0 51
V 2.21 1439 1526 886 1264 772 986 176 1744 52
Cr 19.9 70.0 63.0 46.7 105 79.2 79.7 101 73.5 55
Mn 2.25 378 362 321 400 615 376 280 275 59
Co 0.37 95.5 118 66.0 35.8 34.6 43.4 23.3 36.9 60
Ni 12.8 256 261 163 <LOD <LOD 35.9 <LOD 54 63
Cu 1.48 <LOD <LOD <LOD <LOD <LOD <LOD <LOD <LOD 66
Zn 1.47 21.0 17.3 16.0 15.6 28.4 17.2 6.45 16.2 71
Ga 0.20 5.52 1.70 11.7 3.40 17.0 10.0 6.94 13.8 88
Sr 0.24 1.52 1.16 1.28 <LOD 2.2 1.16 <LOD 1.39 89
Y 0.03 1.72 0.25 0.27 <LOD 0.56 <LOD 1.09 0.17 93
Nb 0.06 0.30 0.68 <LOD 1.22 0.09 <LOD <LOD <LOD 118
Sn 0.48 1.86 1.02 <LOD 3.55 <LOD 0.53 <LOD <LOD 140
Ce 0.001 7.57 0.58 2.67 0.31 0.24 0.23 0.10 0.21 178
Hf 0.001 0.02 0.00 0.00 <LOD 0.01 0.00 1.91 <LOD 181
Ta 0.001 <LOD 0.08 <LOD <LOD <LOD <LOD 0.04 <LOD 208
Pb 0.03 1.63 0.38 0.39 0.14 0.40 0.18 0.11 0.31 232
Th 0.001 1.23 0.11 0.57 0.02 0.01 0.05 0.10 0.01

73
Appendix III. (continued)
Element
or
KRN-12-03
mag
KRN-12-05
mag
TUV-10-01
mag
TUV-10-03
mag
NUK-10-03
mag
NUK-12-02
mag
REK-10-04
mag
REK-10-04
hem
REK-12-02
mag
isotope N=7 N=2 N=6 N=2 N=6 N=6 N=3 N=3 N=6
Fe 70.1 70.1 70.0 70.6 70.2 70.0 67.4 67.3 70.3 24
Mg 58.6 39 14 221 55.0 103 72.5 16.6 71.2 27
Al 116 166 43 167 142 160 310 120 <LOD 29
Si 2140 1130 <LOD 1055 1060 1373 1700 1845 <LOD 31
P 36.5 196 <LOD 34.5 29.0 52.0 53.0 37.2 <LOD 44
Ca 430 1050 <LOD <LOD <LOD 580 400 <LOD <LOD 47
Ti 123 <LOD <LOD <LOD 853 2164 12419 4648 1120 51
V 964 324 605 549 1075 940 1327 605 232 52
Cr 93.0 431 47 <LOD 120 115 64.0 92.5 53.0 55
Mn 428 94.6 240 388 149 62.5 56.6 16.5 38.9 59
Co 43.1 10.0 76.9 121 130 127 6.33 2.86 70.9 60
Ni <LOD <LOD 76 207 301 176 278 <LOD 78.6 63
Cu <LOD 13.9 <LOD <LOD 9.40 <LOD 136 5.21 <LOD 66
Zn 32.2 11.0 6.10 9.70 21.6 19.6 4.43 <LOD 5.29 71
Ga 4.36 10.7 14 28 22.7 5.91 19.6 3.59 1.74 88
Sr 0.68 <LOD <LOD 1.23 0.87 3.99 2.68 1.07 <LOD 89
Y 0.55 0.43 <LOD 0.17 1.04 0.63 0.89 1.37 <LOD 93
Nb 0.32 <LOD <LOD <LOD 0.32 2.42 0.73 1.21 1.03 118
Sn <LOD <LOD <LOD <LOD 1.43 <LOD 4.73 2.146 <LOD 140
Ce 0.46 2.78 0.05 0.34 23.7 3.19 4.76 5.17 0.10 178
Hf 6.70 <LOD 0.01 0.02 <LOD 0.01 0.06 0.91 <LOD 181
Ta <LOD <LOD <LOD <LOD <LOD 0.14 0.10 0.24 <LOD 208
Pb 0.57 0.27 0.62 0.21 0.61 2.32 1.09 2.66 0.26 232
Th 0.93 0.07 0.06 0.09 1.33 0.31 0.78 0.70 0.02

74
Appendix III. (continued)
Note: N=total number of analysis; <LOD= below level of detection; n.d.,=not determined
El Laco and
Láscar ELL-14-02 ELL-14-04 ELL-14-05 ELL-14-06 LAS-14-07 LAS-14-07 Balmat BC-28
Min LOD N=17 N=14 N=18 N=20 N=9 N=9 N=18 N=14
Fe EPMA 63.6 69.4 68.9 68.1 68 60.4 68.7 57.2 24
Mg 13.6 2560 6615 9626 5157 3606 14440 129 8175 27
Al 39.1 6335 1642 1437 109 117 12599 91.0 12294 29
Si 1349 4363 4178 7161 4890 2784 9500 1240 2700 31
P 36.5 741 158 200 417 482 1188 26.4 188 44
Ca 749 <LOD <LOD 2510 1817 1130 4407 <LOD <LOD 47
Ti 59.6 65920 288 275 517 459 83000 66 70656 51
V 5.82 2947 1882 996 586 604 4574 408 10111 52
Cr 21.2 710 100 54.5 72.4 35 822 134 1409 55
Mn 4.75 4125 276 402 271 221 4093 346 2370 59
Co 1.32 119 119.11 151 111 107 248 18.7 223 60
Ni 19.5 200 438 434 275 269 353 n.d. 450 63
Cu 3.66 28.4 <LOD 22.4 36.0 52.5 52.5 n.d. 126 66
Zn 9.76 1651 51.5 49.8 51.8 1254 1254 22101 337 71
Ga 0.33 49.1 6.31 2.06 1.14 64.9 64.9 35.6 55.6 72
Ge 9.74 <LOD <LOD <LOD <LOD <LOD <LOD 440 n.d. 88
Sr 0.32 1.83 1.59 1.83 3.01 0.32 0.32 0.66 2.66 89
Y 0.00 1.61 1.11 0.97 5.04 0.00 0.00 n.d. n.d. 93
Nb <LOD 19.2 1.54 2.32 12.1 0.00 0.00 n.d. 1.30 95
Mo 1.87 <LOD 3.60 9.57 <LOD 1.87 1.87 322 <LOD 118
Sn 2.50 8.37 14.5 12.8 13.6 27.4 27.4 52.4 1.82 140
Ce <LOD 6.64 1.66 7.81 36.1 17.9 17.9 0.07 0.19 181
Ta <LOD 0.58 0.51 0.30 0.25 1.51 1.51 n.d. 0.08

75
Appendix IV. EPMA Fe results. Spot locations are shown on BSE images of magnetite
grains in Appendix VI.
Analysis
I.D. Sample I.D.
Ablation
Analysis FeO wt. % Fe wt. %
Avg. Spot
Analysis a KRN-10-02 ap22a08 89.9 69.9 69.8
b KRN-10-02 ap22a08 89.9 69.9 c KRN-10-02 ap22a08 89.5 69.6
e KRN-10-02 ap22a09 89.9 69.9 69.8
f KRN-10-02 ap22a09 90.0 69.9 g KRN-10-02 ap22a09 89.5 69.6
h KRN-10-02 ap22a10 89.9 69.9 69.7
i KRN-10-02 ap22a10 89.4 69.5
j KRN-10-02 ap22a10 89.7 69.8 k KRN-10-02 ap22a11 89.5 69.6 69.7
l KRN-10-02 ap22a11 89.6 69.7
n KRN-10-02 ap22a11 89.8 69.8 o KRN-10-02 ap22a12 89.7 69.7 69.1
p KRN-10-02 ap22a12 88.0 68.4
q KRN-10-02 ap22a13 89.7 69.7 69.6
r KRN-10-02 ap22a13 89.5 69.6 s KRN-10-02 ap22a13 89.5 69.6
a K-1 ap22a14 89.7 69.7 69.7
b K-1 89.9 69.9 c K-1 ap22a16 89.7 69.7 69.7
d K-1 ap22a17 89.6 69.6 69.6
e K-1 ap22a17 89.3 69.4 f K-1 ap22a17 89.6 69.6
g K-1 ap22a25 89.3 69.4 69.4
h K-1 ap22a25 89.1 69.2
i K-1 ap22a25 89.4 69.5 j K-1 ap22a26 89.5 69.6 69.7
k K-1 ap22a26 89.7 69.7
l K-1 ap22a26 89.7 69.7 m K-1 ap22a27 89.6 69.6 69.6
n K-1 ap22a27 89.7 69.7
o K-1 ap22a27 89.3 69.4 p K-1 ap22a28 89.9 69.8 69.7
q K-1 ap22a28 89.7 69.7
r K-1 ap22a28 89.4 69.5
a K-2 ap22a30 89.8 69.8 69.8 b K-2 ap22a30 89.9 69.9
c K-2 ap22a30 89.8 69.8
d K-2 ap22a29 89.9 69.9 69.8 e K-2 ap22a29 89.7 69.7
f K-2 ap22a29 89.8 69.8

76
Appendix IV. (Cont.)
Analysis
I.D. Sample I.D.
Ablation
Analysis FeO wt. % Fe wt. %
Avg. Spot
Analysis g K-2 ap22a31 90.1 70.0 70.3
h K-2 ap22a31 90.5 70.3 i K-2 ap22a31 90.7 70.5
j K-2 ap22a32 90.3 70.2 70.1
k K-2 ap22a32 90.2 70.1 l K-2 ap22a32 89.9 69.8
m K-2 ap22a33 90.5 70.4 70.3
n K-2 ap22a33 90.3 70.2
o K-2 ap22a33 90.4 70.2 p K-2 ap22a34 90.4 70.2 70.3
q K-2 ap22a34 90.5 70.3
r K-2 ap22a34 90.6 70.4 s K-2 ap22a42 89.8 69.8 69.7
t K-2 ap22a42 89.8 69.8
u K-2 ap22a42 89.6 69.6 v K-2 ap22a43 90.0 70.0 69.4
w K-2 ap22a43 89.8 69.8
x K-2 ap22a43 87.9 68.4
y K-2 ap22a44 89.6 69.7 69.9 z K-2 ap22a44 89.8 69.8
zz K-2 ap22a44 90.2 70.1
a KRN-11-01 ap22a46 86.8 67.4 69.3 b KRN-11-01 ap22a46 90.4 70.3
c KRN-11-01 ap22a46 90.4 70.3
d KRN-11-01 ap22a47 90.0 70.0 70.1
e KRN-11-01 ap22a47 90.3 70.2 f KRN-11-01 ap22a47 90.2 70.1
g KRN-11-01 ap22a48 90.4 70.2 70.2
h KRN-11-01 ap22a48 90.2 70.1 i KRN-11-01 ap22a48 90.2 70.1
j KRN-11-01 ap22a49 90.2 70.1 70.1
k KRN-11-01 ap22a50 90.2 70.1 70.1 l KRN-11-01 ap22a51 90.6 70.4 70.4
m KRN-11-01 89.5 69.6
n KRN-11-01 ap22a60 90.2 70.1 70.1
o KRN-11-01 90.8 70.6 a KRN-11-03 ap22a80 90.5 70.4 70.2
b KRN-11-03 ap22a80 90.4 70.2
c KRN-11-03 ap22a80 90.2 70.1 d KRN-11-03 ap22a81/82 90.2 70.1 70.4
e KRN-11-03 ap22a81/82 90.7 70.5

77
Appendix IV. (Cont.)
Analysis
I.D. Sample I.D.
Ablation
Analysis FeO wt. % Fe wt. %
Avg. Spot
Analysis f KRN-11-03 ap22a81/82 90.7 70.5
g KRN-11-03 89.6 69.6 h KRN-11-03 90.0 70.0
i KRN-11-03 90.1 70.1
j KRN-11-03 ap22a83/84 90.5 70.3 70.2 k KRN-11-03 ap22a83/84 90.4 70.3
l KRN-11-03 ap22a83/84 90.1 70.1
a KRN-11-04 ap22a85 90.4 70.3 70.3
b KRN-11-04 ap22a85 90.3 70.2 c KRN-11-04 91.0 70.7
d KRN-11-04 ap22a86 90.7 70.5 70.5
e KRN-11-04 ap22a86 90.8 70.6 f KRN-11-04 ap22a86 90.7 70.5
g KRN-11-04 ap22a87 90.8 70.6 70.6
h KRN-11-04 ap22a87 90.8 70.6 i KRN-11-04 ap22a87 90.8 70.6
j KRN-11-04 ap23a05 90.4 70.3 70.1
k KRN-11-04 ap23a05 90.3 70.2
l KRN-11-04 ap23a05 89.9 69.9 m KRN-11-04 ap23a06 90.4 70.3 70.2
n KRN-11-04 ap23a06 90.2 70.1
o KRN-11-04 ap23a07 90.6 70.4 70.1 p KRN-11-04 ap23a07 90.1 70.1
q KRN-11-04 ap23a07 89.9 69.9
r KRN-11-04 ap23a08 90.0 70.0 70.1
s KRN-11-04 ap23a08 90.4 70.2 t KRN-11-04 ap23a08 90.0 70.0
a KRN-11-05 ap23a10 89.4 69.5 69.6
b KRN-11-05 ap23a10 89.6 69.6 c KRN-11-05 ap23a10 89.7 69.7
d KRN-11-05 89.8 69.8
e KRN-11-05 88.9 69.1 f KRN-11-05 89.7 69.7
g KRN-11-05 ap23a09 90.4 70.3 70.1
h KRN-11-05 ap23a09 90.1 70.1
i KRN-11-05 ap23a09 90.1 70.1 69.8 a KRN-12-02 ap23a12 90.0 70.0
b KRN-12-02 ap23a12 90.1 70.0
c KRN-12-02 ap23a12 89.5 69.6 70.0 d KRN-12-02 ap23a11 90.3 70.2
e KRN-12-02 ap23a11 89.9 69.9

78
Appendix IV. (Cont.)
Analysis
I.D. Sample I.D.
Ablation
Analysis FeO wt. % Fe wt. %
Avg. Spot
Analysis f KRN-12-02 ap23a11 89.9 69.9 69.8
g KRN-12-02 ap23a13 89.9 69.9
h KRN-12-02 ap23a13 90.0 70.0 i KRN-12-02 ap23a13 89.6 69.7 70.0
a KRN-12-03 ap23a25 90.0 70.0
b KRN-12-03 90.4 70.3 70.0 c KRN-12-03 ap23a26 90.1 70.0 70.1
d KRN-12-03 ap23a14 90.3 70.2
e KRN-12-03 ap23a14 90.0 70.0
f KRN-12-03 ap23a14 90.2 70.1 70.2 g KRN-12-03 ap23a27 90.4 70.3
h KRN-12-03 ap23a27 90.5 70.4
i KRN-12-03 ap23a27 90.1 70.0 70.1 j KRN-12-03 ap23a28 90.2 70.1
k KRN-12-03 ap23a28 90.3 70.2
l KRN-12-03 ap23a28 90.2 70.1 70.4 m KRN-12-03 ap23a29 90.9 70.7
n KRN-12-03 ap23a29 90.7 70.5
o KRN-12-03 ap23a29 90.2 70.1 70.3
p KRN-12-03 ap23a30 90.4 70.3 q KRN-12-03 ap23a30 90.6 70.4
r KRN-12-03 ap23a30 90.1 70.0 70.0
a KRN-12-05 ap23a31 90.3 70.2 b KRN-12-05 ap23a31 89.9 69.9
c KRN-12-05 ap23a31 90.0 69.9 70.1
e KRN-12-05 ap23a40 90.2 70.1 f KRN-12-05 ap23a40 90.0 69.9
g KRN-12-05 ap23a40 90.5 70.3
h KRN-12-05 90.2 70.1
i KRN-12-05 90.0 69.9 j KRN-12-05 90.3 70.2
a TUV-10-03 90.4 70.3
b TUV-10-03 90.0 69.9 c TUV-10-03 90.2 70.1
d TUV-10-03 ap23a61 90.2 70.1 70.0
e TUV-10-03 ap23a61 89.7 69.8
f TUV-10-03 ap23a61 90.3 70.2 g TUV-10-03 90.4 70.3
h TUV-10-03 90.0 70.0
i TUV-10-03 88.3 68.6 j TUV-10-03 ap23a63 89.8 69.8 69.4

79
Appendix IV. (Cont.)
Analysis
I.D. Sample I.D.
Ablation
Analysis FeO wt. % Fe wt. %
Avg. Spot
Analysis k TUV-10-03 ap23a63 90.3 70.2
l TUV-10-03 ap23a63 89.8 69.8 m TUV-10-03 ap23a63 87.1 67.7
a TUV-10-01 ap22a67 90.5 70.4 70.3
b TUV-10-01 ap22a67 90.3 70.2 c TUV-10-01 ap22a67 90.7 70.5
d TUV-10-01 ap22a68 90.7 70.5 70.5
e TUV-10-01 ap22a68 90.6 70.4
f TUV-10-01 ap22a68 90.8 70.6 g TUV-10-01 ap22a69 91.2 70.9 70.5
h TUV-10-01 ap22a69 90.5 70.4
i TUV-10-01 ap22a69 90.6 70.4 j TUV-10-01 ap22a77 90.9 70.7 70.7
k TUV-10-01 ap22a77 91.0 70.8
l TUV-10-01 ap22a77 91.1 70.8 m TUV-10-01 91.0 70.7
n TUV-10-01 90.5 70.4
o TUV-10-01 90.8 70.6
a NUK-10-03 ap23a41 90.0 70.0 70.0 b NUK-10-03 ap23a41 89.6 69.7
c NUK-10-03 ap23a41 90.5 70.3
d NUK-10-03 ap23a42 90.6 70.4 70.6 e NUK-10-03 ap23a42 90.8 70.6
f NUK-10-03 ap23a42 90.8 70.6
g NUK-10-03 ap23a43 90.1 70.0 70.1
h NUK-10-03 ap23a43 90.3 70.2 i NUK-10-03 ap23a43 90.1 70.0
j NUK-10-03 ap23a44 89.1 69.3 69.9
k NUK-10-03 ap23a44 90.3 70.2 l NUK-10-03 ap23a44 90.5 70.3
m NUK-10-03 ap23a45 90.3 70.2 70.2
n NUK-10-03 90.5 70.4 o NUK-10-03 ap23a46 90.1 70.1 70.1
a NUK-12-02 ap23a47 90.0 70.0 69.9
b NUK-12-02 ap23a47 90.2 70.1
c NUK-12-02 ap23a47 89.6 69.7 d NUK-12-02 ap23a48 89.8 69.8 69.8
e NUK-12-02 ap23a48 89.7 69.7
f NUK-12-02 ap23a48 89.9 69.9 g NUK-12-02 ap23a49 90.3 70.2 69.9
h NUK-12-02 ap23a49 89.7 69.7

80
Appendix IV. (Cont.)
Analysis
I.D. Sample I.D.
Ablation
Analysis FeO wt. % Fe wt. %
Avg. Spot
Analysis i NUK-12-02 ap23a49 89.7 69.7
j NUK-12-02 ap23a59 90.2 70.1 70.1
k NUK-12-02 90.1 70.0
l NUK-12-02 ap23a58 90.3 70.2 70.2 m NUK-12-02 ap23a60 90.2 70.1 70.2
n NUK-12-02 ap23a60 90.1 70.0
o NUK-12-02 ap23a60 90.5 70.3 a REK-10-01 ap23a64 86.8 67.5 67.4
b REK-10-01 ap23a64 86.7 67.4
c REK-10-01 ap23a64 86.7 67.4 d REK-10-01 ap23a65 86.7 67.4 67.5
e REK-10-01 ap23a65 87.1 67.7
f REK-10-01 ap23a65 86.6 67.3
g REK-10-01 ap23a66 86.3 67.1 67.0 h REK-10-01 ap23a66 86.2 67.0
i REK-10-01 ap23a66 85.9 66.8
j REK-10-01 ap23a67 86.6 67.3 67.2 k REK-10-01 ap23a67 86.6 67.3
l REK-10-01 ap23a67 86.4 67.1
m REK-10-01 ap23a68 86.4 67.2 67.3
n REK-10-01 ap23a68 86.8 67.5 o REK-10-01 ap23a68 86.7 67.4
a REK-10-04 ap22a61 84.3 65.5 64.6
b REK-10-04 ap22a61 82.1 63.8 c REK-10-04 ap22a62 82.1 63.9 64.8
d REK-10-04 ap22a62 84.6 65.7
e REK-10-04 ap22a63 89.5 69.6 68.5 f REK-10-04 ap22a63 85.0 66.1
g REK-10-04 ap22a63 89.9 69.9
h REK-10-04 ap22a64 90.3 70.2 70.3
i REK-10-04 ap22a64 90.5 70.4 j REK-10-04 ap22a64 90.6 70.4
k REK-10-04 ap22a66 90.6 70.4 70.4
l REK-10-04 ap22a65 91.2 70.9 68.6 m REK-10-04 ap22a65 85.3 66.3
n REK-10-04 ap22a66 90.0 70.0 70.0
o REK-10-04 ap22a65 84.7 65.9 a REK-12-02 ap23a76 90.7 70.5 70.5
b REK-12-02 ap23a76 90.7 70.5
c REK-12-02 ap23a76 90.7 70.5
d REK-12-02 ap23a77 90.0 70.0 70.0

81
Appendix IV. (Cont.)
Analysis
I.D. Sample I.D.
Ablation
Analysis FeO wt. % Fe wt. %
Avg. Spot
Analysis e REK-12-02 ap23a77 90.2 70.1
f REK-12-02 ap23a77 89.9 69.9 g REK-12-02 ap23a78 90.4 70.2 70.3
h REK-12-02 ap23a78 90.6 70.4
i REK-12-02 ap23a78 90.2 70.1 j REK-12-02 ap23a79 90.5 70.3 70.2
k REK-12-02 ap23a79 90.1 70.1
l REK-12-02 ap23a79 90.4 70.3
m REK-12-02 ap23a81 90.6 70.4 70.4 n REK-12-02 ap23a80 90.9 70.6 70.6

82
Appendix IV. (Cont.)
Analysis
I.D. Sample I.D.
Ablation
Analysis FeO wt. % Fe wt. %
Avg. Spot
Analysis 1 ELL-14-02 no05b09 83.4 64.9 62.6 2 ELL-14-02 no05b09 75.4 58.6
3 ELL-14-02 no05b09 82.9 64.5
4 ELL-14-02 no05b10 79.1 61.5 61.5
5 ELL-14-02 no05b10 80.7 62.7 6 ELL-14-02 no05b10 77.6 60.3
7 ELL-14-02 no05b11 81.3 63.2 62.8
8 ELL-14-02 no05b11 80.2 62.4 9 ELL-14-02 no05b11 81.0 63.0
10 ELL-14-02 no05b12 85.0 66.0 65.6
11 ELL-14-02 no05b12 85.4 66.4 12 ELL-14-02 no05b12 82.8 64.4
13 ELL-14-02 no05b15 85.0 66.1 65.3
14 ELL-14-02 no05b15 84.6 65.8
15 ELL-14-02 no05b15 82.5 64.1 16 ELL-14-02 no05b16 81.0 63.0 63.4
17 ELL-14-02 no05b16 83.8 65.1
18 ELL-14-02 no05b16 79.8 62.0 19 ELL-14-02 no05b17 82.2 63.9 64.1
20 ELL-14-02 no05b17 79.7 61.9
21 ELL-14-02 no05b17 85.4 66.4 22 ELL-14-02 no05b18 83.0 64.5 63.9
23 ELL-14-02 no05b18 82.1 63.8
24 ELL-14-02 no05b18 81.6 63.4
25 ELL-14-02 no05b21 80.6 62.6 64.2 26 ELL-14-02 no05b21 80.4 62.5
27 ELL-14-02 no05b21 86.8 67.4
28 ELL-14-02 no05b22 67.8 52.7 59.4 29 ELL-14-02 no05b22 80.7 62.7
30 ELL-14-02 no05b22 80.9 62.9
31 ELL-14-02 no05b23 78.4 60.9 62.4
32 ELL-14-02 no05b23 81.6 63.4 33 ELL-14-02 no05b23 80.7 62.7
34 ELL-14-02 no05b24 81.5 63.3 64.2
35 ELL-14-02 no05b24 85.5 66.5 36 ELL-14-02 no05b24 80.6 62.7
37 ELL-14-02 no05b26/27 81.2 63.1 62.5
38 ELL-14-02 no05b26/27 79.5 61.8 1 ELL-14-04 no05d05 83.0 64.5 65.9
2 ELL-14-04 no05d05 86.6 67.3
3 ELL-14-04 no05d06 87.0 67.6 66.9
4 ELL-14-04 no05d06 85.3 66.3

83
Appendix IV. (Cont.)
Analysis
I.D. Sample I.D.
Ablation
Analysis FeO wt. % Fe wt. %
Avg. Spot
Analysis 5 ELL-14-04 no05d07 89.7 69.7 68.1 6 ELL-14-04 no05d07 85.7 66.6
7 ELL-14-04 no05d07 87.4 67.9
8 ELL-14-04 no05d08 90.2 70.1 70.0 9 ELL-14-04 no05d08 89.4 69.5
10 ELL-14-04 no05d08 90.5 70.3
11 ELL-14-04 no05d09 90.1 70.0 69.7
12 ELL-14-04 no05d09 88.5 68.8 13 ELL-14-04 no05d09 90.6 70.4
14 ELL-14-04 no05d10 90.0 69.9 70.1
15 ELL-14-04 no05d10 90.3 70.2 16 ELL-14-04 no05d11 90.9 70.6 70.0
17 ELL-14-04 no05d11 90.2 70.1
18 ELL-14-04 no05d11 89.1 69.2 19 ELL-14-04 no05d12 90.2 70.1 70.1
20 ELL-14-04 no05d12 90.0 69.9
21 ELL-14-04 no05d12 90.4 70.3
22 ELL-14-04 no05d13 90.6 70.4 70.1 23 ELL-14-04 no05d13 89.7 69.8
24 ELL-14-04 no05d13 90.4 70.2
25 ELL-14-04 no05d14 90.2 70.1 70.2 26 ELL-14-04 no05d14 90.5 70.3
27 ELL-14-04 no05d14 90.5 70.3
30 ELL-14-04 no05d17 90.5 70.3 69.9 31 ELL-14-04 no05d17 89.9 69.9
32 ELL-14-04 no05d17 89.5 69.6
33 ELL-14-04 no05d18 90.0 69.9 69.2
34 ELL-14-04 no05d18 89.2 69.3 35 ELL-14-04 no05d18 88.1 68.5
36 ELL-14-04 no05d19 90.2 70.1 69.9
37 ELL-14-04 no05d19 90.4 70.2 38 ELL-14-04 no05d19 89.0 69.2
39 ELL-14-04 no05d20 90.7 70.5 70.4
40 ELL-14-04 no05d20 90.5 70.3
41 ELL-14-04 no05d20 90.4 70.3 1 ELL-14-05 no05c08 89.1 69.2 69.6
2 ELL-14-05 no05c08 89.4 69.5
3 ELL-14-05 no05c08 90.1 70.0 4 ELL-14-05 no05c09 87.4 68.0 68.4
5 ELL-14-05 no05c09 88.1 68.5
6 ELL-14-05 no05c09 88.4 68.7 7 ELL-14-05 no05c10 85.7 66.6 69.1
8 ELL-14-05 no05c10 90.4 70.2
9 ELL-14-05 no05c10 90.7 70.5

84
Appendix IV. (Cont.)
Analysis
I.D. Sample I.D.
Ablation
Analysis FeO wt. % Fe wt. %
Avg. Spot
Analysis 1 ELL-14-06 no05a06 85.9 66.8 67.4 2 ELL-14-06 no05a06 86.4 67.1
3 ELL-14-06 no05a07 86.0 66.8 67.2
4 ELL-14-06 no05a07 87.0 67.7 5 ELL-14-06 no05a07 86.5 67.3
6 ELL-14-06 no05a08 87.9 68.3 68.0
7 ELL-14-06 no05a08 86.9 67.6
8 ELL-14-06 no05a08 87.6 68.1 9 ELL-14-06 no05a09 88.3 68.6 67.8
10 ELL-14-06 no05a09 85.2 66.2
11 ELL-14-06 no05a09 88.1 68.5 12 ELL-14-06 no05a10 89.1 69.3 69.4
13 ELL-14-06 no05a10 89.4 69.5
14 ELL-14-06 no05a10 89.3 69.4 15 ELL-14-06 no05a11 88.7 68.9 68.5
16 ELL-14-06 no05a11 86.8 67.4
17 ELL-14-06 no05a11 88.9 69.1
18 ELL-14-06 no05a12 88.8 69.0 68.8 19 ELL-14-06 no05a12 88.8 69.0
20 ELL-14-06 no05a12 87.9 68.3
21 ELL-14-06 no05a13 88.8 69.0 67.9 22 ELL-14-06 no05a13 86.3 67.1
23 ELL-14-06 no05a13 87.0 67.6
24 ELL-14-06 no05a14 86.7 67.4 67.5 25 ELL-14-06 no05a14 86.9 67.6
26 ELL-14-06 no05a14 86.9 67.5
27 ELL-14-06 no05a15 87.3 67.9 67.2
28 ELL-14-06 no05a15 85.5 66.5 29 ELL-14-06 no05a15 86.5 67.2
30 ELL-14-06 no05a23 88.5 68.8 67.9
31 ELL-14-06 no05a23 86.4 67.2 32 ELL-14-06 no05a23 87.3 67.8
33 ELL-14-06 no05a24 87.3 67.8 68.9
34 ELL-14-06 no05a24 89.0 69.2
35 ELL-14-06 no05a24 89.6 69.7 36 ELL-14-06 no05a26 88.8 69.0 69.0
37 ELL-14-06 no05a26 88.5 68.8
38 ELL-14-06 no05a26 89.1 69.2 39 ELL-14-06 no05a27 87.5 68.0 68.0
40 ELL-14-06 no05a27 87.1 67.7
41 ELL-14-06 no05a27 88.1 68.4 42 ELL-14-06 no05a28 86.8 67.5 67.9
43 ELL-14-06 no05a28 87.4 67.9
44 ELL-14-06 no05a28 88.0 68.4

85
Appendix IV. (Cont.)
Analysis
I.D. Sample I.D.
Ablation
Analysis FeO wt. % Fe wt. %
Avg. Spot
Analysis 1 ELL-14-06 no05a06 85.9 66.8 67.4
2 ELL-14-06 no05a06 86.4 67.1 3 ELL-14-06 no05a07 86.0 66.8 67.2
4 ELL-14-06 no05a07 87.0 67.7
5 ELL-14-06 no05a07 86.5 67.3
6 ELL-14-06 no05a08 87.9 68.3 68.0 7 ELL-14-06 no05a08 86.9 67.6
8 ELL-14-06 no05a08 87.6 68.1
9 ELL-14-06 no05a09 88.3 68.6 67.8 10 ELL-14-06 no05a09 85.2 66.2
11 ELL-14-06 no05a09 88.1 68.5
12 ELL-14-06 no05a10 89.1 69.3 69.4
13 ELL-14-06 no05a10 89.4 69.5 14 ELL-14-06 no05a10 89.3 69.4
15 ELL-14-06 no05a11 88.7 68.9 68.5
16 ELL-14-06 no05a11 86.8 67.4 17 ELL-14-06 no05a11 88.9 69.1
18 ELL-14-06 no05a12 88.8 69.0 68.8
19 ELL-14-06 no05a12 88.8 69.0 20 ELL-14-06 no05a12 87.9 68.3
21 ELL-14-06 no05a13 88.8 69.0 67.9
22 ELL-14-06 no05a13 86.3 67.1
23 ELL-14-06 no05a13 87.0 67.6 24 ELL-14-06 no05a14 86.7 67.4 67.5
25 ELL-14-06 no05a14 86.9 67.6
26 ELL-14-06 no05a14 86.9 67.5 27 ELL-14-06 no05a15 87.3 67.9 67.2
28 ELL-14-06 no05a15 85.5 66.5
29 ELL-14-06 no05a15 86.5 67.2 30 ELL-14-06 no05a23 88.5 68.8 67.9
31 ELL-14-06 no05a23 86.4 67.2
32 ELL-14-06 no05a23 87.3 67.8
33 ELL-14-06 no05a24 87.3 67.8 68.9 34 ELL-14-06 no05a24 89.0 69.2
35 ELL-14-06 no05a24 89.6 69.7
36 ELL-14-06 no05a26 88.8 69.0 69.0 37 ELL-14-06 no05a26 88.5 68.8
38 ELL-14-06 no05a26 89.1 69.2
39 ELL-14-06 no05a27 87.5 68.0 68.0
40 ELL-14-06 no05a27 87.0 67.7 41 ELL-14-06 no05a27 88.1 68.4
42 ELL-14-06 no05a28 86.8 67.5 67.9
43 ELL-14-06 no05a28 87.4 67.9 44 ELL-14-06 no05a28 88.0 68.4

86
Appendix IV. (Cont.)
Analysis
I.D. Sample I.D.
Ablation
Analysis FeO wt. % Fe wt. %
Avg. Spot
Analysis 10 ELL-14-05 no05c11 88.4 68.7 69.6
11 ELL-14-05 no05c11 90.7 70.5
12 ELL-14-05 no05c11 89.6 69.7 13 ELL-14-05 no05c12 90.0 70.0 69.5
14 ELL-14-05 no05c12 89.9 69.9
15 ELL-14-05 no05c13 88.4 68.7 68.1
16 ELL-14-05 no05c13 86.6 67.3 17 ELL-14-05 no05c13 87.7 68.2
18 ELL-14-05 no05c14 88.1 68.5 68.6
19 ELL-14-05 no05c14 87.0 67.6 20 ELL-14-05 no05c14 89.5 69.5
21 ELL-14-05 no05c15 89.4 69.5 69.0
22 ELL-14-05 no05c15 89.2 69.3
23 ELL-14-05 no05c15 87.5 68.0 24 ELL-14-05 no05c16 88.7 68.9 69.1
25 ELL-14-05 no05c16 89.1 69.2
26 ELL-14-05 no05c16 89.0 69.2 27 ELL-14-05 no05c17 86.6 67.3 67.6
28 ELL-14-05 no05c17 88.3 68.6
29 ELL-14-05 no05c17 85.9 66.7 30 ELL-14-05 no05c18 85.3 66.3 67.9
31 ELL-14-05 no05c18 88.9 69.1
32 ELL-14-05 no05c18 87.8 68.2
33 ELL-14-05 no05c22 87.5 68.0 68.4 34 ELL-14-05 no05c22 88.1 68.5
35 ELL-14-05 no05c22 88.2 68.6
36 ELL-14-05 no05c23 88.2 68.5 68.8 37 ELL-14-05 no05c23 87.6 68.1
38 ELL-14-05 no05c23 89.9 69.9
39 ELL-14-05 no05c24 89.1 69.2 69.5 40 ELL-14-05 no05c24 88.8 69.0
41 ELL-14-05 no05c24 90.3 70.2
42 ELL-14-05 no05c25 89.3 69.4 69.4
43 ELL-14-05 no05c25 89.4 69.5 44 ELL-14-05 no05c25 89.1 69.2
45 ELL-14-05 no05c26 87.9 68.4 69.4
46 ELL-14-05 no05c26 89.8 69.8 47 ELL-14-05 no05c26 90.0 70.0
48 ELL-14-05 no05c27 88.8 69.0 69.2
49 ELL-14-05 no05c27 89.2 69.3
50 ELL-14-05 no05c28 88.1 68.5 68.5 51 ELL-14-05 no05c28 88.2 68.5

87
Appendix IV. (Cont.)
Analysis
I.D. Sample I.D.
Ablation
Analysis FeO wt. % Fe wt. %
Avg. Spot
Analysis 45 ELL-14-06 no05a18 89.9 69.9 69.4 46 ELL-14-06 no05a18 88.3 68.7
47 ELL-14-06 no05a18 89.8 69.8
48 ELL-14-06 no05a19 89.0 69.1 69.1 49 ELL-14-06 no05a19 89.0 69.2
50 ELL-14-06 no05a19 89.0 69.0
51 ELL-14-06 no05a20 85.6 66.5 67.4
52 ELL-14-06 no05a20 89.0 69.1 53 ELL-14-06 no05a20 86.0 66.7
54 ELL-14-06 no05a21 89.1 69.2 68.6
55 ELL-14-06 no05a21 86.6 67.3 56 ELL-14-06 no05a21 89.1 69.3
57 ELL-14-06 no05a22 85.6 66.5 66.8
58 ELL-14-06 no05a22 86.2 67.0 59 ELL-14-06 no05a22 86.0 66.9
1 LAS-14-07 no05d21 79.8 62.0 61.9
2 LAS-14-07 no05d21 79.6 61.9
3 LAS-14-07 no05d21 79.4 61.7 4 LAS-14-07 no05d22 79.7 61.9 61.8
5 LAS-14-07 no05d22 79.5 61.8
6 LAS-14-07 no05d22 79.3 61.6 7 LAS-14-07 no05d23 78.4 60.9 61.3
8 LAS-14-07 no05d23 78.8 61.3
9 LAS-14-07 no05d23 79.4 61.7 10 LAS-14-07 no05d24 79.3 61.6 61.9
11 LAS-14-07 no05d24 79.8 62.1
12 LAS-14-07 no05d24 79.8 62.0
13 LAS-14-07 no05d27 79.9 62.1 58.9 14 LAS-14-07 no05d27 79.2 61.5
15 LAS-14-07 no05d27 68.3 53.1
16 LAS-14-07 no05d30 79.5 61.8 61.5 17 LAS-14-07 no05d30 79.4 61.7
18 LAS-14-07 no05d30 78.6 61.1
19 LAS-14-07 no05d33 80.9 62.9 62.1
20 LAS-14-07 no05d33 80.1 62.3 21 LAS-14-07 no05d33 78.7 61.2
22 LAS-14-07 no05d34 80.0 62.1 62.3
23 LAS-14-07 no05d34 79.9 62.1 24 LAS-14-07 no05d34 80.7 62.7

88
Appendix V. LA-ICPMS spot analysis results. Fe (wt. %) is the mean concentrations of three or less EPMA analyses in the vicinity
of LA-ICPMS spots. Spot locations are shown on BSE images of magnetite grains in Appendix VI.
Sample Rock type
Grain
#
LA-ICPMS
spot Fe wt. % (EPMA) 24Mg 27Al 29Si 31P 34S 44Ca 47Ti 51V 52Cr 55Mn 59Co 60Ni 63Cu 66Zn
KRN-10-02 high P ore 1 ap22a08 70 113 140 1464 352 94 269 15
1 ap22a09 70 110 350 1454 33 365 94 244 15
1 ap22a10 70 2490 38 5870 430 1422 90 384 97 247 21
1 ap22a11 70 1340 2870 1417 369 95 259 15
2 ap22a12 70 329 2120 312 940 860 61 1426 87 426 96 255 39
2 ap22a13 70 202 38 310 1449 372 95 261 18
K-1 high P ore 1 ap22a14 70 840 420 2130 1531 364 120 270 22
1 ap22a16 70 600 410 2840 42 320 106 1539 51 376 119 269 20
1 ap22a17 70 18 34 49 1517 361 119 256 14
1 ap22a25 69 24 940 260 1507 85 347 115 262 15
2 ap22a26 70 31 1529 366 118 259 17 2 ap22a27 70 87 124 940 300 76 1504 53 354 114 251 15
2 ap22a28 70 143 99 800 1552 359 118 256 16
K-2 low P ore 1 ap22a29 70 47 158 180 440 44 884 315 64 166 13
1 ap22a30 70 50 31 910 520 878 70 318 64 167 13
1 ap22a31 70 106 43 106 430 892 337 69 163 19
2 ap22a32 70 115 960 540 883 28 338 66 165 22
2 ap22a33 70 42 170 74 901 327 67 159 15
2 ap22a34 70 136 47 970 470 66 880 42 324 65 152 12
3 ap22a42 70 68 410 70 873 306 66 150 17
3 ap22a43 70 102 820 890 310 65 158 15
3 ap22a44 70 39 35 150 889 313 63 181 14
KRN-11-01 high P ore 1 ap22a46 70 20 360 163 1283 379 33 15
1 ap22a47 70 77 247 800 1284 387 34 18
2 ap22a48 70 23 70 500 1277 69 467 34 20 3 ap22a49 70 254 1227 140 377 37 11
3 ap22a50 70 750 1250 369 37
3 ap22a51 70 95 139 4380 297 830 1265 452 37 12
3 ap22a60 70 620 1260 366 35 16

89
Appendix V. (Cont.)
Sample Rock type Grain #
LA-
ICPMS
spot 71Ga 75As 88Sr 89Y 93Nb 118Sn 139La 140Ce 141Pr 146Nd 147Sm 153Eu 157Gd 159Tb
KRN-10-02 high P ore 1 ap22a08 5.1 0.7 0.4 0.1 0.4 1.2 0.1 0.6 0.2 0.0
1 ap22a09 5.0 1.5 1.0 0.2 0.8 1.0 2.5 0.3 1.4 0.1 1 ap22a10 6.2 4.0 0.7 3.3 0.4 2.7 3.0 9.0 1.1 4.2 0.9 0.1
1 ap22a11 5.2 0.9 0.8 0.2 0.4 1.2 0.1 0.4
2 ap22a12 5.8 3.8 3.1 4.0 0.8 2.0 11.0 19.3 2.2 7.5 1.4 0.2 1.3 0.2
2 ap22a13 5.9 1.1 0.8 0.8 0.1 9.2 12.3 0.9 2.5 0.2
K-1 high P ore 1 ap22a14 1.7 0.3 0.2 0.3 0.7 0.1 0.2
1 ap22a16 1.8 1.6 1.6 0.3 0.4 1.1 1.0 2.0 0.3 0.6 0.1 0.0
1 ap22a17 1.5 0.1 0.0
1 ap22a25 1.8 0.4 0.1 0.1 0.1 0.6
2 ap22a26 1.6 0.3
2 ap22a27 1.9 0.3 1.9 1.0 0.1 0.3 0.0 0.2 0.0
2 ap22a28 1.7 1.5 0.2 0.2 0.2 0.5 0.3 0.3
K-2 low P ore 1 ap22a29 11.5 1.1 0.3 4.6 8.1 1.3 2.3 0.7 0.0
1 ap22a30 12.3 0.7 0.9 0.1 0.7 2.0 0.2 2.2 0.0 1 ap22a31 11.7 0.9 3.1 0.4 2.3 2.6 0.2 1.4 0.2 0.1
2 ap22a32 11.7 1.0 0.1 0.6 1.1 0.5 0.4
2 ap22a33 11.8 0.7 0.3 0.4 1.7 3.2 0.3 1.2 0.1
2 ap22a34 11.4 0.9 0.2 1.0 1.7 0.2 0.6 0.2 0.0
3 ap22a42 12.6 1.0 0.3 2.5 0.1 0.3
3 ap22a43 11.7 2.9 0.3 1.2 2.2 0.2 0.8
3 ap22a44 10.7 0.6 0.3 0.2 0.6 0.1 0.1
KRN-11-01 high P ore 1 ap22a46 3.1 0.9 0.1 0.2
1 ap22a47 2.9 0.3 0.5 0.0 0.1
2 ap22a48 3.2 0.0 0.0 0.0
3 ap22a49 3.8 0.2 2.4 0.5 0.0
3 ap22a50 3.3 0.4
3 ap22a51 3.3 2.2 7.4 0.1 3 ap22a60 4.2

90
Appendix V. (Cont.)
Sample Rock type Grain #
LA-
ICPMS
spot 163Dy 165Ho 166Er 169Tm 172Yb 175Lu 178Hf 181Ta 197Au 205Tl 208Pb 232Th 238U
KRN-10-02 high P ore 1 ap22a08 0.2 0.2 0.1
1 ap22a09 0.2 0.0 0.0 0.0 0.0 0.5 0.7 0.3
1 ap22a10 0.5 0.1 0.2 0.1 3.7 2.2 0.4 1 ap22a11 0.1 0.0 0.0 2.5 0.5 0.3
2 ap22a12 0.7 0.1 0.3 0.0 0.1 0.0 2.2 1.9 1.0
2 ap22a13 0.1 0.0 0.6 1.9 0.0
K-1 high P ore 1 ap22a14 0.0 0.0 0.0 0.0 0.1
1 ap22a16 0.0 0.0 0.0 0.1 0.3 0.4 0.6
1 ap22a17 0.0
1 ap22a25 0.0 0.1 0.0 0.0
2 ap22a26 0.0 0.0 0.1
2 ap22a27 0.0 0.0 0.1 0.1 0.1
2 ap22a28 0.0 0.0 0.0 0.0 0.7 0.1 0.2
K-2 low P ore 1 ap22a29 0.2 0.0 0.0 0.3 0.7 0.0
1 ap22a30 0.0 0.0 0.4 0.5
1 ap22a31 0.1 0.0 0.0 0.3 0.4 0.1 2 ap22a32 0.0 0.0 1.0 0.3 0.1
2 ap22a33 0.0 0.0 0.0 0.5 1.4 0.1
2 ap22a34 0.0 0.0 0.3 0.5 0.0
3 ap22a42 0.0 0.0 0.4 0.3 0.0
3 ap22a43 0.0 0.1 1.0 0.1
3 ap22a44 0.0 0.2 0.2 0.0
KRN-11-01 high P ore 1 ap22a46 0.0 0.0
1 ap22a47 0.0 0.2 0.0 0.0
2 ap22a48 0.1 0.0
3 ap22a49
3 ap22a50
3 ap22a51 0.0 0.1 1.3 0.0 0.6 3 ap22a60

91
Appendix V. (Cont.)
Sample Rock type Grain #
LA-
ICPMS
spot Fe wt. % (EPMA) 24Mg 27Al 29Si 31P 34S 44Ca 47Ti 51V 52Cr 55Mn 59Co 60Ni 63Cu 66Zn
KRN-11-03 andesite 1 ap22a80 70 41 250 803 85 585 35 29
(LA-FW) 1 ap22a81 70 54 802 60 640 35 33
1 ap22a82 70 94 106 730 20 360 790 96 600 35 33
2 ap22a83 70 66 112 970 735 76 621 35 24
2 ap22a84 70 69 74 731 79 627 33 23
KRN-11-04 andesite 1 ap22a85 70 90 33 810 977 52 370 42 52 20
(A-FW) 1 ap22a86 71 31 996 383 45 15 1 ap22a87 71 20 620 380 989 96 388 45 35 12
1 ap23a05 70 15 820 50 986 91 364 44 41 15
1 ap23a06 70 39 85 983 363 42 25 17
2 ap23a07 70 112 64 1380 460 660 71 992 374 43 34 22
2 ap23a08 70 320 180 67 976 391 43 30 20
KRN-11-05 rhyodacite 1 ap23a09 70 37 1600 31 390 167 101 288 23 7
(HW) 2 ap23a10 70 129 250 185 272 24 6
KRN-12-02 aplite vein ap23a11 70 56 330 1801 282 37 64 16
ap23a12 70 850 36 430 50 1727 103 296 38 44 19
ap23a13 70 31 44 220 1705 44 245 36 54 14
KRN-12-03 syenite 1 ap23a14 70 77 116 2970 37 670 885 83 341 41 24
1 ap23a24 70 230 955 448 43 32
1 ap23a25 70 1220 290 943 68 417 42 30
2 ap23a27 70 19 260 360 42 966 438 43 36
2 ap23a28 70 123 2230 490 500 204 967 128 443 44 35
3 ap23a29 70 1023 440 44 33
3 ap23a30 70 16 1012 472 44 36
KRN-12-05 granite 1 ap23a31 70 1130 355 1400 1050 296 437 87 12 23 13 2 ap23a40 70 39 166 36 350 351 424 102 8 5 9
TUV-10-03 rhyodacite 1 ap23a61 70 15 43 260 654 47 228 70 84 5
host 2 ap23a63 70 13 250 555 253 84 69 7

92
Appendix V. (Cont.)
Sample Rock type Grain #
LA-ICPMS
spot 71Ga 75As 88Sr 89Y 93Nb 118Sn 139La 140Ce 141Pr 146Nd 147Sm 153Eu 157Gd 159Tb
KRN-11-03 andesite 1 ap22a80 17.8
(LA-FW) 1 ap22a81 18.4 0.5 0.1 0.3 0.0 0.7
1 ap22a82 18.5 5.7 0.2 0.1 0.3 0.1 0.0 0.3 2 ap22a83 14.7 0.3 0.5 0.4 0.1
2 ap22a84 15.5 0.9 0.2 0.2 0.1
KRN-11-04 andesite 1 ap22a85 9.7 1.0
(A-FW) 1 ap22a86 10.4 0.2
1 ap22a87 9.5 0.2 0.0
1 ap23a05 9.8 0.5
1 ap23a06 10.0 0.8 0.3 0.2 0.1 0.1
2 ap23a07 10.6 1.7 0.1 0.3 0.1 0.3 0.1
2 ap23a08 10.3 0.2 0.0
KRN-11-05 rhyodacite 1 ap23a09 7.9 0.1 0.0
(HW) 2 ap23a10 6.0 1.1 0.1 0.1 0.2
KRN-12-02 aplite vein ap23a11 14.6 0.9 0.0 0.1 0.1
ap23a12 13.0 1.3 0.2 0.3 0.1
ap23a13 14.0 2.0 0.2 0.3 0.3 0.4
KRN-12-03 syenite 1 ap23a14 4.8 0.2 0.7 0.3 0.2 1 ap23a24 4.5 0.1
1 ap23a25 4.2 0.1 0.1
2 ap23a27 4.1 0.7 0.1 0.1 0.1 0.1
2 ap23a28 4.3 0.8 2.2 0.3 0.4 1.7 0.1 0.1
3 ap23a29 4.4 0.7 0.1 0.1
3 ap23a30 4.3 0.6 0.1 0.1
KRN-12-05 granite 1 ap23a31 10.3 0.4 1.9 5.2 0.4 1.5 0.1
2 ap23a40 11.2 0.4 0.4
TUV-10-03 rhyodacite 1 ap23a61 14.4 0.1 0.1
host 2 ap23a63 12.8 0.1

93
Appendix V. (Cont.)
Sample Rock type Grain #
LA-
ICPMS
spot 163Dy 165Ho 166Er 169Tm 172Yb 175Lu 178Hf 181Ta 197Au 205Tl 208Pb 232Th 238U
KRN-11-03 andesite 1 ap22a80 0.1 0.0 0.0
(LA-FW) 1 ap22a81 0.0 0.0 0.0
1 ap22a82 0.1 0.0 0.0 2 ap22a83 0.0 0.0 0.0
2 ap22a84 1.0 0.0 0.0
KRN-11-04 andesite 1 ap22a85 0.3
(A-FW) 1 ap22a86 0.0 0.0 0.0 0.0
1 ap22a87 0.0 0.0
1 ap23a05 0.1 0.0
1 ap23a06 0.0 0.1 0.0 0.0
2 ap23a07 0.0 0.0 0.0 0.2 0.2 0.1
2 ap23a08 0.0 0.0 0.2 0.0 0.0
KRN-11-05 rhyodacite 1 ap23a09 0.1 0.0
(HW) 2 ap23a10 0.2 0.0 0.2 0.5 0.1 1.9 0.0 0.1 0.1 0.8
KRN-12-02 aplite vein ap23a11 0.2 0.0
ap23a12 0.1 0.0 0.0
ap23a13 0.5 0.0 0.0
KRN-12-03 syenite 1 ap23a14 0.4 0.0 0.1 1 ap23a24 0.0 0.0
1 ap23a25 0.0
2 ap23a27 0.2 0.2
2 ap23a28 0.3 0.1 0.4 0.1 1.1 0.3 6.7 1.1 4.4 2.6
3 ap23a29 0.0 0.0 0.0
3 ap23a30 0.0 0.0 0.0 0.0
KRN-12-05 granite 1 ap23a31 0.1
2 ap23a40 0.3 0.0
TUV-10-03 rhyodacite 1 ap23a61 0.9 0.0 0.0
host 2 ap23a63 0.0 0.4 0.1

94
Appendix V. (Cont.)
Sample Rock type Grain #
LA-ICPMS
spot
Fe wt. % (EPMA) 24Mg 27Al 29Si 31P 34S 44Ca 47Ti 51V 52Cr 55Mn 59Co 60Ni 63Cu 66Zn
TUV-10-01 ore 1 ap22a67 70 195 224 1190 35 730 543 402 119 206 9 1 ap22a68 71 191 366 920 36 530 553 366 122 213 4 1 ap22a69 71 214 126 32 190 557 407 122 212 12 2 ap22a77 71 228 81 260 550 405 120 214 13 2 ap22a78 71 193 70 350 547 372 119 203 9
2 ap22a79 71 305 132 210 546 378 122 197 12
NUK-10-03 ore 1 ap23a41 70 36 1160 29 740 1080 59 140 128 309 15 1 ap23a42 71 128 142 320 358 1093 147 126 301 9 26 1 ap23a43 70 25 960 410 231 1072 145 128 299 20 1 ap23a44 70 670 1970 1082 180 165 138 278 28 2 ap23a45 70 31 420 1054 150 130 320 24 2 ap23a46 70 1068 148 128 302 18
NUK-12-02 ore + host 1 ap23a47 70 340 321 937 59 123 160 14 1 ap23a48 70 106 126 4380 942 61 128 166 17 1 ap23a49 70 88 35 1660 52 660 580 2640 931 137 75 125 185 27 2 ap23a58 70 92 106 1710 954 61 63 131 173 23 2 ap23a59 70 138 490 1690 250 1770 946 118 62 128 185 20 2 ap23a60 70 90 43 770 929 145 55 127 188 17
REK-10-01 rhyodacite 1 ap23a64 67 61 2220 600 4360 605 110 16 3
1 ap23a65 67 155 42 4532 607 16 3 7 1 ap23a66 67 17 155 1000 36 5150 616 75 22 3 2 ap23a67 67 107 720 34 420 5040 601 13 3 4 2 ap23a75 67 3440 870 4160 593 16 3
REK-10-04 ore 1 ap22a61 64 87 109 29720 2001 77 12 3 1 ap22a62 65 61 146 370 22250 1771 56 62 8 1 ap22a63 69 67 431 870 27 650 9550 1396 46 7 61 261 5 2 ap22a64 70 186 700 2530 79 550 400 65 937 72 61 6 373 11 7
3 ap22a65 66 21 166 896 40 3 338 3 ap22a66 70 13 250 510 960 54 2 339 3
REK-12-02 rhyodacite 1 ap23a76 70 229 56 34 70 81 5 1 ap23a77 70 360 1120 233 36 70 74 6
1 ap23a78 70 210 460 225 41 65 66 11 2 ap23a79 70 23 228 40 77 72 3 3 ap23a80 71 20 170 239 50 41 74 102 3 3 ap23a81 70 31 236 42 69 76 3

95
Appendix V. (Cont.)
Sample Rock type Grain # LA-ICPMS
spot 71Ga 75As 88Sr 89Y 93Nb 118Sn 139La 140Ce 141Pr 146Nd 147Sm 153Eu 157Gd 159Tb
TUV-10-01 ore 1 ap22a67 27.2 0.1 0.0 0.0 0.1 1 ap22a68 27.7 0.2 0.2 0.2 0.3 1 ap22a69 28.1 1.4 2.0 0.3 2 ap22a77 28.5 0.5 0.3 1.0
2 ap22a78 27.0 0.5 0.2 0.1 1.6 2 ap22a79 28.6 2.0 0.1 0.2 0.3
NUK-10-03 ore 1 ap23a41 20.5 0.3 0.1 0.4 0.3 1 ap23a42 22.8 1.0 0.4 1.9 0.9 1.5 3.9 0.4 1.9 0.3 1 ap23a43 21.2 0.1 0.2 0.1 0.3 1 ap23a44 28.2 1.9 0.4 2.0 95.0 137.0 7.4 18.1 2.1 0.2 2 ap23a45 21.8 1.3 0.3 0.2 2 ap23a46 21.6 0.3 0.4 0.1
NUK-12-02 ore + host 1 ap23a47 5.9 2.5 0.4 0.3 0.9 1.9 0.4 0.5 1 ap23a48 6.0 1.3 1.7 0.5 4.9 0.6 1.1 0.1 0.6 1 ap23a49 6.0 1.7 5.4 0.8 2.9 2.3 2.9 0.3 1.3 0.2 0.1 0.0 2 ap23a58 6.3 1.3 5.4 0.9 1.7 3.0 6.5 0.4 1.8 0.3 2 ap23a59 6.1 1.1 3.9 0.8 2.2 2.3 4.4 0.5 1.0 0.1 2 ap23a60 5.2 5.1 0.3 1.2 2.4 0.3 1.1 0.2 0.0
REK-10-01 rhyodacite 1 ap23a64 4.2 15.0 1.0 0.8 2.5 4.1 5.4 0.4 0.9 1 ap23a65 3.6 15.9 1.0 1.9 1.1 2.1 5.2 5.4 0.5 1.3 0.2 1 ap23a66 3.3 36.9 1.0 2.2 2.2 1.8 5.5 6.2 0.5 1.6 0.4 0.2 0.7 0.1 2 ap23a67 3.6 2.9 0.3 0.4 1.7 4.8 4.3 0.6 1.0 0.2 2 ap23a75 3.3 27.3 1.2 1.5 1.6 2.6 3.3 4.5 0.6 0.7 0.1
REK-10-04 ore 1 ap22a61 9.6 0.1 0.5 6.0 0.3 0.3 0.1 1 ap22a62 10.4 1.7 0.2 0.8 4.8 0.3 0.7 0.1 0.6 1 ap22a63 16.7 3.2 2.2 1.2 1.3 3.4 2.2 3.8 0.4 1.4 0.2
2 ap22a64 30.1 2.2 4.2 2.4 17.0 21.8 2.3 5.7 1.2 0.3 0.7 0.1 3 ap22a65 23.5 0.1 0.5 3 ap22a66 27.3 0.5 0.2 0.6 1.4 0.2 0.6
REK-12-02 rhyodacite 1 ap23a76 1.7
1 ap23a77 1.7 1.0 0.2 1 ap23a78 1.5 0.2 0.1 2 ap23a79 1.7 0.1 3 ap23a80 1.8 3 ap23a81 2.1

96
Appendix V. (Cont.)
Sample Rock type Grain #
LA-
ICPMS
spot 163Dy 165Ho 166Er 169Tm 172Yb 175Lu 178Hf 181Ta 197Au 205Tl 208Pb 232Th 238U TUV-10-01 ore 1 ap22a67 0.0 0.0 0.0 0.0
1 ap22a68 0.1 0.1 0.1 1 ap22a69 0.0 0.0 0.3 0.0 0.0 2 ap22a77 0.3 0.1 0.0 2 ap22a78 0.0 0.3 0.1 0.0 2 ap22a79 0.1 0.3 0.1
NUK-10-03 ore 1 ap23a41 0.0 0.1 0.1 1 ap23a42 0.2 0.3 0.3 0.4 0.4 0.2 1 ap23a43 0.7 0.2 0.1 1 ap23a44 0.5 0.1 2.2 7.2 1.2 2 ap23a45 0.1 0.1 0.0 2 ap23a46 0.0 0.1 0.0 0.0
NUK-12-02 ore + host 1 ap23a47 0.3 0.0 0.0 1.1 0.1 0.2 1 ap23a48 0.2 0.0 0.7 0.3 1.9
1 ap23a49 0.2 0.0 0.1 0.2 3.6 0.6 1.0 2 ap23a58 0.3 0.0 0.0 0.1 4.2 0.4 0.8 2 ap23a59 0.3 0.1 0.1 3.1 0.2 0.5 2 ap23a60 0.0 0.1 0.0 1.3 0.3 0.2
REK-10-01 rhyodacite 1 ap23a64 0.1 0.1 1.7 0.4 8.4 1 ap23a65 0.3 0.1 0.2 0.0 0.3 2.7 0.3 0.0 3.2 0.8 11.6 1 ap23a66 1.0 0.1 0.4 0.2 0.0 0.4 4.1 1.5 50.9
2 ap23a67 0.0 0.1 0.1 1.0 0.2 1.0 2 ap23a75 0.4 0.1 1.6 3.3 0.6 14.1
REK-10-04 ore 1 ap22a61 0.0 0.0 0.1 0.8 1 ap22a62 0.0 0.1 0.1 0.1 0.5 1 ap22a63 0.2 0.1 0.2 0.0 0.1 2.0 1.4 5.1 2 ap22a64 0.4 0.1 0.2 0.1 2.6 2.9 1.3 3 ap22a65 0.0 0.0 0.1 0.0 0.1 3 ap22a66 0.1 0.0 0.1 0.7 0.1 1.6
REK-12-02 rhyodacite 1 ap23a76 0.0 0.1 0.0 1 ap23a77 0.3 0.0 0.1 1 ap23a78 0.0 0.4 0.0 0.0 2 ap23a79 0.0
3 ap23a80 0.0 3 ap23a81 0.0 0.0

97
Appendix V. (Cont.)
Sample rock type Grain #
LA-ICPMS
spot Fe wt. % (EPMA) 24Mg 27Al 29Si 31P 34S 44Ca 47Ti 51V 52Cr 55Mn
ELL-14-02 andesite host 1 no05b09 63 2403 6050
85
62100 3168 664 3723
1 no05b10 61 3310 6370 4100
62100 3050 775 4690
1 no05b11 66 2088 5040
56500 3167 839 3360
2 no05b12 66 2410 5210
142 680
59800 3122 842 3570
2 no05b13 66 4690 5420
1600
70900 2990 590 4210
2 no05b14 65 3430 4840 6060
1370
64600 2951 748 5040
3 no05b15 63 1438 3730
56300 2809 700 3523
3 no05b16 64 3250 4600 2930
91000 2721 630 5060
3 no05b17 64 2147 9340
1860 2500
57300 3160 837 3786
4 no05b18 64 2516 1027
66100 3241 772 3915
4 no05b19 59 2220 8870
390
57400 2926 739 3484
4 no05b20 62 2089 8980
64000 3010 718 3839
4 no05b21 64 2030 5270
470
70600 2616 646 4372
5 no05b22 64 2162 5490
80100 2708 503 4839
5 no05b23 62 2219 5550
287
70000 2571 642 4465
ELL-14-04 vuggy ore 1 no05d05 66 745 1681 4580 240
405 1929
53.9
1 no05d06 67 842 1543
470
273 1938
43.2
1 no05d07 69 438 1526 3600 253
285 1944
23.7
2 no05d08 70 8580 1808
234 1934
321
2 no05d09 70 8040 1572
100
284 1947
385.5
2 no05d10 70 7960 1601
278 1871
351
3 no05d11 70 7250 1638 3060 106 1260
239 1873 100 310
3 no05d12 70 7770 1737
137
349 1967
354
3 no05d13 70 7790 1626
124
307 1961
417
3 no05d14 70 7070 1613
100
224 1804
306
4 no05d17 70 8170 1645
301 1810
234.5
4 no05d18 69 7860 1611
209 1771
333.5
4 no05d19 70 11440 1733 6440 182
366 1760
313
4 no05d20 70 8660 1653 3210 182 470
281 1843
412

98
Appendix V. (Cont.)
Sample rock type Grain #
LA-ICPMS
spot 59Co 60Ni 63Cu 66Zn 71Ga 72Ge 75As 88Sr 89Y 93Nb 95Mo
ELL-14-02 andesite host 1 no05b09 127.7 223 23.5 847 52.3 1.72 14.2
1 no05b10 123.5 241 25.5 2210 48.7 1.23 13.59
1 no05b11 123 305 31.4 1251 53.5 1.22 15.1
2 no05b12 121.5 281 35.8 1212 50.6 1.21 11.99
2 no05b13 128.4 274 1103 51.5 3.1 2.33 17
2 no05b14 124.4 196 96.1 1691 49.6 1.03 1.26 24.5
3 no05b15 107.2 152 24.2 844 45.2 0.98 19.79
3 no05b16 114.7 155 23.9 1164 44.6 0.69 1.44 31.1
3 no05b17 127.4 226 24 3060 57 3.29 4.2 8.9
4 no05b18 131.1 188 19.6 1659 51.3 1.65 11.44 4 no05b19 118.9 176 23.1 2780 50.7 1.05 9.57
4 no05b20 126.2 174 17.8 1666 46.8 1.55 10.7
4 no05b21 101.4 132 17.6 1468 45.2 1.23 1.53 30.9
5 no05b22 101.9 139 16.9 1850 44.3 1.4 37
5 no05b23 101.4 140 18.3 1967 44.6 1.66 1.32 32.7
ELL-14-04 vuggy ore 1 no05d05 21.2 572 6.75 27.3
1 no05d06 23.1 427 6.45
1 no05d07 16.3 430 6.55 17.5 0.52 3.6
2 no05d08 147.3 469 56 6.22 1.35 0.81
2 no05d09 149.4 414 53.5 6.04
2 no05d10 146.2 435 37.3 6.12 0.007
3 no05d11 143.7 409 46.5 5.86 0.44 3 no05d12 150.3 443 62.5 5.99 1.58
3 no05d13 146.7 456 57.8 5.65 0.42
3 no05d14 147.1 381 50 5.49 0.55
4 no05d17 144 418 60.5 7.1 0.19
4 no05d18 144.3 463 53.8 6.11 0.27
4 no05d19 143 424 42.5 7.84 1.52 1.99 8.27
4 no05d20 144.9 397 46.4 6.23 1.9 0.23 3.92

99
Appendix V. (Cont.)
Sample rock type Grain #
LA-ICPMS
spot 107Ag 115In 118Sn 121Sb 138Ba 140Ce 181Ta 184W 197Au 205Tl 208Pb 232Th
ELL-14-02 andesite 1 no05b09 6.93 2.57 0.46
host 1 no05b10 6.8 13.2 7.22 0.39 1.87 1.79 0.51
1 no05b11
0.20
1 10.2 3.24 0.72 0.125 0.015 0.136
2 no05b12 0.013 10.4 2.69 0.32 0.024 0.48 0.044
2 no05b13 17.8 20.1 9.6 0.32 1 0.061
2 no05b14 6.34 24.8 10 0.6 4.39 0.02 3.48 1.38
3 no05b15 5.95 3.01 0.5 0.52
3 no05b16 6.77 12.4 16.8 0.84 2.6 3.06 0.93
3 no05b17 11.9 0.79 0.056 4 no05b18 6.51 1.82 0.6
4 no05b19 7.8 3.08 0.39 0.121 0.178
4 no05b20 7.5 0.72 0.33
4 no05b21 8.9 2.35 8.3 0.71 0.23 0.016 0.4
5 no05b22 6.9 1.12 8.51 0.93 0.24 1.18 0.4
5 no05b23 11.6 10.2 0.57 0.008 1.89 0.84
ELL-14-04 vuggy 1 no05d05 17.7 5.1 0.61 4.02 0.57 0.018
ore 1 no05d06 14.4 2.77 0.082 0.009
1 no05d07 15.5 2.32 0.56 4.2 0.026
2 no05d08 15.2 2.01 1.28 0.83
2 no05d09 11.6 0.165
2 no05d10 14.8 0.07 0.051 3 no05d11 12.4 0.151
3 no05d12 13.8 0.64 0.49
3 no05d13 14 0.022 0.054
3 no05d14 16.4 0.36 0.03
4 no05d17 13 0.015
4 no05d18 15.6 0.0059
4 no05d19 15.9 3.03 7.85 0.7 0.006 1.78
4 no05d20 13.3 1.86 3.41 0.32 0.56 0.57

100
Appendix V. (Cont.)
Sample rock type Grain #
LA-
ICPMS
spot Fe wt. % (EPMA) 24Mg 27Al 29Si 31P 34S 44Ca 47Ti 51V 52Cr 55Mn
ELL-14-05 vesicular ore 1 no05c08 70 13740 1796 9700 124 410 1002 481
1 no05c09 68 14420 2209 13500 2520 215 1045 532
1 no05c10 69 12900 1715 9300 2070 239 1030 485
1 no05c11 70 9110 1099 162 960 403 2 no05c12 70 9580 2240 8000 365 350 999 245
2 no05c13 68 9640 1470 1068 388
2 no05c14 69 9060 1586 7560 199 700 1045 55 433
2 no05c15 69 10970 1474 5720 1059 470
3 no05c16 69 8980 1326 4000 149 878 407
3 no05c17 68 7800 1337 3920 162 238 898 288
3 no05c18 68 8700 1478 4400 113 873 325
4 no05c22 68 12400 1771 11700 2940 373 1016 494
4 no05c23 69 9270 1460 7710 420 424 939 462
4 no05c24 69 10170 1343 580 1032 485
4 no05c25 69 8970 1092 4170 332 1056 463
5 no05c26 69 5720 891 3410 170 204 1032 54 307 5 no05c27 69 6450 746 1000 304.2
5 no05c28 68 5390 838 182 996 267
ELL-14-06 vein ore 1 no05a06 67 3400 167 297 720 350 614 65 261
1 no05a07 67 2640 206 4110 843 320 270 630 209
1 no05a08 68 5420 106 2720 417 650 602 260.6
1 no05a09 68 7610 77 6750 318 1730 460 553 362
1 no05a10 69 8840 6390 171 640 1980 561 132 406.7
1 no05a11 68 6150 132 578 311.5
1 no05a12 69 7220 6470 330 780 1780 586 57 340
1 no05a13 68 5820 79 4910 253 680 638 315.8
1 no05a14 67 422 83 2120 96 1380 460 774 39.3
1 no05a15 67 4040 295 1140 666 54 304.3

101
Appendix V. (Cont.)
Sample rock type Grain #
LA-ICP
-MS spot 59
Co 60
Ni 63
Cu 66
Zn 71
Ga 72
Ge 75
As 88
Sr 89
Y 93
Nb 95
Mo
ELL-14-05 vesicular ore 1 no05c08 176 426 1.7 1.4 1.2 3.6
1 no05c09 162 416 63 2.7 2.9 1.6 3.7
1 no05c10 163 446 52.6 2.3 1.6 1.2 3.4
1 no05c11 160 483 36.8 1.9 0.02 2 no05c12 159 447 39 38.9 1.7 2.4 1.9 8.5
2 no05c13 168 462 58 3.4 0.7 2.1
2 no05c14 163 441 23 67 3.2 2.3 2.8 3.2 2 no05c15 149 419 49.9 1.7 0.46 1.6
3 no05c16 141 408 31.8 1.5 0.47 1.6
3 no05c17 153 414 31 40.1 1.7 1.7 0.69 2.8 3 no05c18 149 459 14 34.5 2.1 1.2 0.93 1.9
4 no05c22 133 400 66 2.2 2.0 1.43 3.5
4 no05c23 138 434 65 1.7 1.2 0.94 3.5
4 no05c24 129 409 0.52 2.1 4 no05c25 131 421 55 0.53 1.1
5 no05c26 155 467 14 39.2 1.4 1.8 0.42 1.1 10
5 no05c27 136 451 1.9 1.7 5 no05c28 143 403 13 1.7 1.9 0.55 2.2 9.8
ELL-14-06 vein ore 1 no05a06 113 290 13 55 0.73 0.36
1 no05a07 95 281 54.8 11 1.9 6.2 10
1 no05a08 107 291 15 38.9 0.6 1.54 1 no05a09 122 256 60.4 1.4 31 4.3 9.96 21.2
1 no05a10 126 273 52.3 0.9 26 4.0 8.23 17.7
1 no05a11 116 243 47.7 8.3 1.1 1.37 3.85 1 no05a12 120 263 58.7 1.26 22 3.4 6.63 13.0
1 no05a13 110 256 54 0.66 17 2.3 4.91 11.7
1 no05a14 64 265 0.41 1.99
1 no05a15 110 235 47 0.56 0.54 1.3

102
Appendix V. (Cont.)
Sample rock type Grain #
LA-
ICPMS spot 107Ag 115In 118Sn 121Sb 138Ba 140Ce 181Ta 184W 197Au 205Tl 208Pb 232Th
ELL-14-05 vesicular 1 no05c08 15.9 1.23 10.7 0.53 0.49
ore 1 no05c09 13.7 2.13 11.49 1.25
1 no05c10 14.4 1.63 8.1 0.76 0.54 1 no05c11 0.1 13.9 0.009
2 no05c12 13.9 3.17 2.85 0.061 4.6 1.39
2 no05c13 13.5 2.67 3.36 2.02 1.45
2 no05c14 15.6 1.99 56.2 3.84 8.3
2 no05c15 9.8 2.95 0.134
3 no05c16 10 1.33 0.048
3 no05c17 12.7 3.95 3.56 2.55 1.29
3 no05c18 13.5 1.83 3.81 0.93 1.06
4 no05c22 12.2 1.55 9.8 1.2
4 no05c23 12.4 1.09 5.22 0.92
4 no05c24 0.037 0.26 4.72 0.07 0.185 0.18 4 no05c25 9.8 1.93
5 no05c26 10.6 3.93 2.88 8.9 0.5
5 no05c27 15.9 0.78 0.16 0.012 4.65 0.9
5 no05c28 10.3 2.74 3.04 5.8 1.34
ELL-14-06 vein ore 1 no05a06 12.7 17.4 0.034
1 no05a07 13.9 2.58 24.2 0.53 0.31 13
1 no05a08 13.3 0.94 6.8 0.007 1.53
1 no05a09 0.211 13.22 3.86 5.17 68.9 0.36 0.8 35.7
1 no05a10 11.7 4 4.23 53.9 0.17 0.65 29.8
1 no05a11 11.9 1.55 13.7 0.075 6.74
1 no05a12 12.84 3.42 55.2 0.27 0.48 0.197 22.14
1 no05a13 0.17 13.11 2.54 30.5 0.15 0.45 15.6
1 no05a14 12.84 2.44 0.292 1 no05a15 14.01 4.72 0.157

103
Appendix V. (Cont.)
Sample rock type
Grain
#
LA-ICPMS
spot Fe wt. % (EPMA) 24Mg 27Al 29Si 31P 34S 44Ca 47Ti 51V 52Cr 55Mn
ELL-14-06 vein ore 2 no05a18 69 9200
7490 85 280 2750 1290 538.4
399.3
2 no05a19 69 8160 56 6790 327
1570
521
348.4
2 no05a20 67 5940
4800 220
280 545
291
2 no05a21 69 4950 82 5950 404 730
555
234
2 no05a22 67 2120 74 3300 500 970
541
149
3 no05a23 68 2265 156 3350 920 500 1130 930 570
150.3
3 no05a24 69 5440
2430 71
96 570
313.3
3 no05a26 69 6700
5770 570 650 1780
550 54 303
3 no05a27 68 1979 113
1262 1230
571
168.7
3 no05a28 68 4820
830 800
557
250.1
LAS-14-07 pyroclastic 1 no05d21 61 13430 13710
2140 650 5500 79800 4683 747 4345
dacite 1 no05d22 61 13680 13350
2940 770 5960 79100 4605 811 4304
1 no05d23 60 13450 13690
500 910 1760 79000 4496 773 4174
1 no05d24 61 13790 13550
291 640
81600 4631 847 4309
2 no05d27 57 15080 7650
11320 5250 795 3930
3 no05d30 61 14780 10850
70
77800 4820 771 3907
4 no05d33 61 15320 15000 9500
75900 4080 916 3816
4 no05d34 61 15990 12990
550
77600 4030 914 3955

104
Appendix V. (Cont.)
Sample rock type
Grain
#
LA-ICPMS
spot 59Co 60Ni 63Cu 66Zn 71Ga 72Ge 75As 88Sr 89Y 93Nb 95Mo
ELL-14-06 vein ore 2 no05a18 117.1 299
63 1.12
24.2 4.24 7.42 17.8
2 no05a19 121.6 307
55.6 1.36
39.2 5.26 10.36 26.5
2 no05a20 112.6 301
38 1.97
28.2 3.35 7.34 15.5
2 no05a21 111 297
0.9
16.3 3.16 5.69 14.5
2 no05a22 103.9 250
49.7 0.93
19.4 1.98 5.47 15.6
3 no05a23 108.3 334
61 1.24
13.2 3.15 5.31 18
3 no05a24 159 279
54.2
6.5 1.42 2.55 5.84
3 no05a26 114.2 266.6 40 47.8 1.33
26.8 4.21 9.02 25.1
3 no05a27 68.1 249
50.6
9.9 1.73 3.42 9.22
3 no05a28 124 255 76 44
17 2.76 4.63 11.1
LAS-14-07 pyroclastic 1 no05d21 264.3 496 54.6 1127 68
6.8 19.4 20.2 5.8
dacite 1 no05d22 264.5 320 54.9 1151 70.4
8.6 26.1 20.1
1 no05d23 252.6 263 50.9 1087 63.9
4.2 5.8 19.3
1 no05d24 263.8 279 48.7 1009 67.8
1.06 20.5 4.9
2 no05d27 214.8 340 50.1 1309 52.9
1.24 99.3 13.1
3 no05d30 236 373 63.3 1665 66.4
5.35 6.7
4 no05d33 246.6 368 51.3 1408 68.1
11
14.1
4 no05d34 242 382 46.2 1277 61.6
15.3

105
Appendix V. (Cont.)
Sample rock type Grain #
LA-
ICPMS spot 107Ag 115In 118Sn 121Sb 138Ba 140Ce 181Ta 184W 197Au 205Tl 208Pb 232Th
ELL-14-06 vein ore 2 no05a18 13.8 4.16 48.7 0.233 0.28 24.4
2 no05a19 0.198 16.71 4.97 5.51 68.3 0.35 0.65 34.5 2 no05a20 15.4 4.23 51 0.31 26.7
2 no05a21 12.66 2.27 4.18 40.8 0.24 0.59 0.25 23.3
2 no05a22 0.245 14.2 2.41 50.6 0.38 0.0025 24.2
3 no05a23 0.149 17.2 6.3 48.4 0.42 21.8
3 no05a24 10.5 1.61 17.07 0.164 0.081 0.06 9.09
3 no05a26 0.153 12.8 3.44 5.71 57.7 0.31 0.47 31.5
3 no05a27 14.8 3.43 25.2 0.08 12.14
3 no05a28 13.8 3.81 36.7 0.3 0.005 18.26
LAS-14-07 pyroclastic 1 no05d21 27.6 44.8 0.81 0.32 3.49
dacite 1 no05d22 27.4 1.57 61.8 0.78 0.36 4.63
1 no05d23 25 13.9 0.91 0.58 0.99
1 no05d24 25.2 3 1 0.52 0.34 2 no05d27 0.9 41 1.46 0.52 5.92 1.36 1.41
3 no05d30 26.2 0.68 0.26 0 0.061
4 no05d33 0.6 24.2 51 0.65 0.86 0.24 1.81 0.24
4 no05d34 0.57 22.2 1.54 0 0 0.13

106
Appendix VI. LA-ICPMS and EPMA spot analysis locations on BSE images for Kiruna and El
Laco magnetite

107
Appendix VI. (Cont.)

108
Appendix VI. (Cont.)

109
Appendix VI. (Cont.)
110
Appendix VI. (Cont.)

111
Appendix VI. (Cont.)

112
Appendix VI. (Cont.)

113
Appendix VI. (Cont.)

114
Appendix VI. (Cont.)

115
Appendix VI. (Cont.)

116
Appendix VI. (Cont.)

117
Appendix VI. (Cont.)

118
Appendix VI. (Cont.)

119
Appendix VI. (Cont.)

120
Appendix VI. (Cont.)

121
Appendix VI. (Cont.)

122
Appendix VI. (Cont.)

123
Appendix VI. (Cont.)

124
Appendix VII. LA-ICPMS spot analysis results for Mud Tank, Balmat and Bushveld magnetite. Fe (wt%) is the mean concentrations
of three or less EPMA analyses in the vicinity of LA-ICPMS spots.
Sample Rock Type
Fe wt.%
(EPMA) 24Mg 27Al 29Si 31P 34S 44Ca 47Ti 51V 52Cr 55Mn 59Co 60Ni 63Cu 66Zn
Mudtank
Carbonatite
Mag 68 1017 789 980 47 550
2109 14170 193 276 124 657 4.4 407
68 966 760 280 35 90
2194 13960 87 289 123 664 11.5 365
68 1002 699 240 7 100
2213 13890 137 277 121 615 0.21 377
68 962 716 230 10 450 100 2245 13710 94 276 118 611
358
68 941 737 230 14 290
2229 13700 71 273 124 655 3.1 397
68 901 708 1220 19 840
2098 13740 168 260 121 630 1.8 376
68 907 657 160
640
1789 13450 83 242 119 624
331
68 915 714 790 8.4 560 40 2017 13730 156 252 118 623
354
67 1138 672 530 9 420 100 3690 12640 112 426 117 606
408
68 1162 713 20 4 250 10 4760 13130 45 455 120 617 0.05 406
67 1136 727 940
250
3662 13170 202 416 125 647
512
67 1096 688 110 24 210
3310 13240 83 381 122 635
475
67 1100 724 610 8 520 140 3470 13120 94 401 123 637
551
68 44.1
340 20 400 220 80 548 123 373 17
25060
Balmat MVT Zn 69 70
710 19 370 140 65 594 134 350 19
23480
Vein Mag 68 40
240 10 180 140 45 592 57 353 18
24850
68 47
230 7.9 230
34 638 89 289 17
22820
69 37
1330 26 830 120 48 593 216 251 17
22570
69 44
140 2 20
45 635 33 304 18
23700
69 33
1040 15 860 90 2 288 158 217 16
20980

125
Appendix VII. (Cont.)
Sample Rock Type
Fe wt.%
(EPMA) 24Mg 27Al 29Si 31P 34S 44Ca 47Ti 51V 52Cr 55Mn 59Co 60Ni 63Cu 66Zn
Balmat MVT Zn Vein 68 46 820 6 700 200 64 443 84 615 21 27890
Mag 69 44 310 16 510 70 12 4 435 22 25420
69 50 80 12 260 54 372 70 549 20 27090
69 750 91 1920 27 490 190 23 220 267 434 20 22820
69 44 970 26 350 140 17 280 185 445 19 22480
69 198 1120 23 280 30 37 289 199 456 20 24240
Bushveld layered mafic 57 6770 9100 3200 84 1960 290 70000 10530 1458 2381 182 326 99 262
(BC-28) intrusion Mag 58 5280 9430 200 188 600 130 85900 14280 1670 2690 230 318 477 307
57 7770 4810 1360 21 1860 220 69100 9760 1498 2395 180 458 72 193
57 6650 4980 1800 14 2260 320 75600 11730 1660 2540 178 261 89 242
58 7930 5220 35 1930 74600 11210 1282 2717 394 112 102 268
57 7230 4920 1660 9 1580 100 73100 10110 1494 2423 105 395 175 214
57 5050 4500 2170 31 810 30 73100 10430 1396 2362 193 389 101 150
57 5140 5550 4180 65 1010 73600 11610 1502 2605 166 326 5 287
58 11020 21140 1250 18 590 64900 8410 1277 1986 290 572 475
56 10490 20910 120 15 320 63500 8430 1237 1959 286 549 451
57 10380 19030 390 7 300 66800 8820 1274 2312 307 596 10 425
58 9870 20030 330 15 180 67390 8680 1355 2318 309 578 460
57 11050 23320 130 19 230 64700 8600 1312 2182 297 567 0 540
57 9820 19170 590 20 170 70 66890 8950 1313 2306 290 570 7 443

126
Appendix VII. (Cont.)
Sample Rock Type 71Ga 75As 88Sr 89Y 93Nb 118Sn 139La 140Ce 141Pr 146Nd 147Sm 153Eu 157Gd
Mudtank
Carbonatite
Mag 28 0.82 0.86 0.14 0.15 7 0.41 1.43 0.04 0.31 0.03 0.07 0.33
26 0.07 2.40 0.16 0.11 7 0.34 0.55 0.07 0.13 0.01 0.08 0.36
26 0.16 0.03 0.06 0.01 7 0.07 0.14 0.06 0.01 0.02 0.35
26 1.10 0.01 0.09 7 0.04 0.11 0.02 0.10 0.02 0.06 0.40
28 0.05 1.70 0.16 0.31 8 0.47 0.49 0.13 0.11 0.06 0.04 0.56
26 0.13 0.60 0.11 1.32 8 0.34 0.38 0.05 0.13 0.01 0.02 0.56
26 0.45 0.03 7 0.10 0.18 0.06 0.03 0.09 0.07 0.52
27 0.01 0.01 7 0.12 0.07 0.01 0.15 0.10 0.07 0.25
25 0.12 0.06 0.03 10 0.02 0.04 0.02 0.02 0.02 0.03 0.03
26 0.00 0.04 0.04 10 0.04 0.02 0.03 0.04 0.01 0.03
27 0.42 0.09 0.08 0.03 10 0.04 0.00 0.02 0.01 0.02 0.05 0.22
27 0.24 0.09 0.02 0.02 9 0.01 0.06 0.02 0.05 0.02 0.03
27 0.03 9 0.01 0.02 0.03 0.03
Balmat MVT Zn Vein 47 0.26 0.08 0.02 0.09 64 0.04 0.01 0.03 0.03 0.03 0.08
Mag 47 2.28 0.20 0.02 0.05 61 0.08 0.02 0.02 0.05 0.01 0.16
46 0.07 0.04 0.09 0.03 65 0.07 0.04 0.05 0.18 0.01 0.02 0.08
35 0.60 0.05 0.04 0.02 71 0.08 0.06 0.01 0.09 0.03 0.03 0.35
36 0.51 0.13 0.06 0.05 70 0.07 0.00 0.03 0.15 0.01 0.02 0.35
34 0.62 0.05 0.08 71 0.06 0.00 0.03 0.01 0.03 0.54
32 1.11 0.02 0.02 0.09 46 0.05 0.01 0.00 0.03 0.47 0.03 0.27

127
Appendix VII. (Cont.)
Sample Rock Type 71Ga 75As 88Sr 89Y 93Nb 118Sn 139La 140Ce 141Pr 146Nd 147Sm 153Eu 157Gd
Balmat
MVT Zn Vein
Mag 31 3.33 0.06 0.05 63 0.03 0.07 0.02 0.01 0.00 0.08
19 0.59 0.08 0.05 7 0.05 0.03 0.07 0.02 0.02
36 0.12 0.90 0.03 0.02 53 0.02 0.02 0.04 0.09 0.08
53 3.16 0.41 0.05 46 0.06 0.03 0.01 0.05 0.02
44 0.43 0.16 0.03 48 0.02 0.02 0.05 0.07 0.04
49 3.78 0.04 51 0.02 0.06 0.00 0.01 0.02
Bushveld layered mafic 52 0.09 2.93 0.17 1.29 2 0.20 0.12 0.09 0.02 0.33
(BC-28) intrusion Mag 68 6.00 0.17 2.37 2 0.22 0.27 0.07 0.17 1.80
54 1.09 0.02 1.30 1 0.07 0.03 0.01 0.02 0.03 0.44
66 2.16 0.02 1.69 2 0.09 0.20 0.04 0.05 0.06 0.07 0.77
66 3.23 1.39 1 0.16 0.08 0.07 0.03 0.11 0.09 0.40
65 1.93 0.04 1.33 1 0.00 0.04 0.09 0.01 0.01 0.08 0.28
51 0.21 1.19 0.02 1.52 2 0.05 0.05 0.02 0.03 0.13 0.02 0.04
67 2.93 0.11 1.47 2 0.16 0.27 0.04 0.23 0.03 1.07
47 0.25 1.40 0.08 1.05 2 0.02 0.01 0.04 0.07 0.01 0.02
47 0.15 3.60 0.03 1.01 2 0.36 0.12 0.06 0.02 0.02 0.04
48 0.11 0.37 0.07 0.92 2 0.08 0.04 0.04 0.09 0.02 0.03
48 0.07 0.05 0.85 2 0.06 0.05 0.08 0.32 0.02 0.12
50 0.01 1.30 0.02 1.01 2 0.11 0.01 0.06 0.15 0.01 0.09 0.25
49 4.20 0.02 1.00 2 0.08 0.06 0.06 0.03 0.01 0.01 0.28

128
Appendix VII. (Cont.)
Sample Rock Type 159Tb 163Dy 165Ho 166Er 169Tm 172Yb 175Lu 178Hf 181Ta 197Au 205Tl 208Pb 232Th 238U
Mudtank Carbonatite Mag 0.02 0.00 0.00 0.00 0.00 0.00 0.01 0.01 0.71 0.06 0.04
0.00 0.04 0.00 0.01 0.01 0.02 0.02 0.00 0.56 0.05 0.05
0.00 0.01 0.00 0.01 0.03 0.01 0.01 0.01 0.05 0.01 0.06 0.11
0.00 0.04 0.00 0.00 0.01 0.00 0.01 0.01 0.00 0.02 0.01 0.11 0.12 0.00
0.02 0.01 0.00 0.01 0.00 0.03 0.00 0.02 0.03 0.02 0.50 0.00 0.07
0.01 0.00 0.00 0.00 0.01 0.03 0.02 0.00 0.07 0.39 0.33 0.11
0.00 0.01 0.00 0.01 0.01 0.01 0.01 0.00 0.01 0.06
0.03 0.00 0.00 0.00 0.01 0.00 0.01 0.00 0.02 0.01 0.09 0.02
0.00 0.00 0.01 0.00 0.01 0.01 0.01 0.01 0.10 0.04 0.01
0.03 0.00 0.00 0.01 0.01 0.01 0.02 0.01 0.00 0.03
0.05 0.01 0.00 0.02 0.01 0.02 0.01 0.02 0.00 0.05
0.02 0.01 0.01 0.01 0.01 0.02 0.01 0.01 0.03 0.00 0.03 0.01
0.01 0.00 0.02 0.01 0.01 0.00 0.04 0.00 0.04 0.00 0.00
Balmat MVT Zn Vein 0.00 0.01 0.00 0.00 0.00 0.00 0.02 0.09 0.01 0.00
Mag 0.02 0.01 0.01 0.00 0.01 0.01 0.02 0.01 0.91 0.01
0.03 0.00 0.00 0.01 0.01 0.00 0.01 0.00 0.06 0.26
0.02 0.02 0.00 0.01 0.00 0.00 0.00 0.02 0.25 0.02 0.00
0.01 0.01 0.00 0.01 0.00 0.01 0.09
0.01 0.01 0.08 0.03 0.02 0.06 0.05 0.00
0.01 0.01 0.01 0.00 0.00 0.03 0.01 0.01 0.02 0.00 0.20 0.01

129
Appendix VII. (Cont.)
Sample Rock Type 159Tb 163Dy 165Ho 166Er 169Tm 172Yb 175Lu 178Hf 181Ta 197Au 205Tl 208Pb 232Th 238U
Balmat MVT Zn Vein 0.01 0.03 0.00 0.00 0.00 0.00 0.01 0.01 0.02 0.02 0.83
Mag 0.03 0.00 0.01 0.02 0.00 0.00 0.01 0.01 0.01 0.05
0.01 0.02 0.00 0.00 0.01 0.01 0.00 0.01 0.03 0.00 0.00
0.02 0.00 0.00 0.01 0.01 0.01 0.02 0.02 0.01 0.46 0.02 0.00
0.02 0.01 0.02 0.00 0.01 0.01 0.00 0.01 0.05 0.01 0.00
0.01 0.00 0.01 0.00 0.02 0.01 0.00 0.02 0.00 0.63 0.00 0.02
Bushveld layered mafic 0.00 0.01 0.03 0.04 0.28 0.08 0.91
(BC-28) intrusion Mag 0.01 0.01 0.02 0.02 0.05 0.12 0.18 0.18 0.33 0.02 1.68
0.01 0.01 0.01 0.14 0.15 0.01 0.32
0.05 0.00 0.07 0.01 0.15 0.11 0.23 0.01 1.53
0.02 0.05 0.03 0.00 0.07 0.04 0.08 0.09 0.02 0.51 0.01
0.01 0.01 0.00 0.01 0.03 0.01 0.32 0.09 0.37 0.00
0.02 0.00 0.02 0.02 0.01 0.14 0.11 0.45
0.03 0.03 0.02 0.06 0.02 0.02 0.05 0.06 0.01 1.17
0.01 0.01 0.01 0.02 0.01 0.01 0.47 0.08 0.00 0.04 0.04 0.21
0.02 0.02 0.00 0.02 0.03 0.02 0.61 0.05 0.07 0.03 0.02
0.01 0.02 0.00 0.00 0.00 0.06 0.01 0.47 0.09 0.06 0.18 0.00
0.02 0.02 0.00 0.01 0.01 0.01 0.63 0.07 0.02 0.00 0.00
0.02 0.01 0.01 0.00 0.04 0.02 0.41 0.08 0.00 0.07 0.02 0.01
0.00 0.04 0.02 0.01 0.01 0.01 0.01 0.53 0.05 0.10 0.05

130
Appendix VIII. LA-ICPMS spot analysis results (ppm) for BCR-2G glass during the Kiruna
and El Laco analyses.
Element Kiruna El Laco MUN Long term Element Kiruna El Laco MUN Long term 24
Mg 19662 22984 17318 140
Ce 47.3
51.2 29
Si 2.55E+05 2.89E+05 2.54E+05 141
Pr 5.73
6.44 31
P 1175 1316 643.99 146
Nd 24.9
27.8 44
Ca 45972 54324 42317 147
Sm 5.75
6.30 47
Ti 12021 13740 35.58 153
Eu 1.79
1.87 51
V 405 457 15714 157
Gd 5.78
6.24 52
Cr 32.2 21.7 408 159
Tb 0.90
0.94 55
Mn 1586 1815
163Dy 5.43
6.10
59Co 37.1 42.3 1825
165Ho 1.13
1.23 60
Ni 5.88 18.5 36.0 166
Er 2.99
3.43 63
Cu 17.1 19.3 12.0 169
Tm 0.44
0.49 66
Zn 131 153 26.0 172
Yb 2.85
3.38 75
As 1.10 1.06 156 175
Lu 0.43
0.48 88
Sr 304 360
178Hf 4.35
4.57
89Y 28.8 35.4 326
181Ta 0.67 0.76 0.76
93Nb 9.98 11.8 32.3
197Au 0.58
118Sn 2.02 2.00 12.0
208Pb 9.94 10.9 11.4
138Ba
694
232Th 5.31 6.39 5.80
139La 23.2
24.6 238
U 1.65
1.62


![Rocks and Minerals.ppt [Read-Only]](https://static.fdokumen.com/doc/165x107/633751f86fd2e64f8d0df5b5/rocks-and-mineralsppt-read-only.jpg)