A Case Study of Altino Sweet Pepper - MDPI
17
Citation: Stagnari, F.; Ficcadenti, N.; Manetta, A.C.; Platani, C.; Dattoli, M.A.; Galieni, A. Modulation of Light and Nitrogen for Quality-Traits Improvement: A Case Study of Altino Sweet Pepper. Horticulturae 2022, 8, 499. https://doi.org/ 10.3390/horticulturae8060499 Academic Editor: Martina Bavec Received: 10 May 2022 Accepted: 1 June 2022 Published: 4 June 2022 Publisher’s Note: MDPI stays neutral with regard to jurisdictional claims in published maps and institutional affil- iations. Copyright: © 2022 by the authors. Licensee MDPI, Basel, Switzerland. This article is an open access article distributed under the terms and conditions of the Creative Commons Attribution (CC BY) license (https:// creativecommons.org/licenses/by/ 4.0/). horticulturae Article Modulation of Light and Nitrogen for Quality-Traits Improvement: A Case Study of Altino Sweet Pepper Fabio Stagnari 1 , Nadia Ficcadenti 2 , Anna Chiara Manetta 1 , Cristiano Platani 2 , Maria Assunta Dattoli 2 and Angelica Galieni 2, * 1 Faculty of Bioscience and Technology for Agriculture Food and Environment, Campus Universitario di Coste Sant’Agostino, University of Teramo, Via R. Balzarini 1, 64100 Teramo, Italy; [email protected] (F.S.); [email protected] (A.C.M.) 2 Research Centre for Vegetable and Ornamental Crops, Council for Agricultural Research and Economics—CREA, Via Salaria 1, 63077 Monsampolo del Tronto, Italy; nadia.fi[email protected] (N.F.); [email protected] (C.P.); [email protected] (M.A.D.) * Correspondence: [email protected] Abstract: Local varieties are known to cope more efficiently with stressful and/or low-input condi- tions than cultivated ones by activating secondary metabolisms and, hence, are supposed to have higher nutraceutical potential. In this work, we investigate the effects of N and light, supplied at opti- mal and sub-optimal levels, on the fruit yield and quality of a local ecotype of sweet pepper, Altino, grown in the Abruzzo Region (Southern Italy). In 2017, two open-field experiments were carried out, comparing increasing N rates (0, 100 and 200 kg N ha -1 , 0_N, 100_N and 200_N, respectively) and different percentages of shading and/or manipulations of the transmitted solar radiation, obtained through photoselective nets (red net, RN; black net, BN; unshaded Control). Both N and light were preconditions to obtain stable yields in terms of both fruit number and fruit weights. However, BN significantly reduced the number of sunscalded fruits (0.39 vs. 3.38 and 2.59 fruit plant -1 for BN, Control and RN, respectively), leading to lower waste. N deficiency favoured higher total polyphenol (TPC) and flavonoid (TFC) contents in ripened fruits; on the other hand, shading significantly reduced TPC (-12.4%) in immature and TFC (-18.2%) in red fruits. The variations in nutraceuticals were also evaluated in terms of the variations of the single phenolic acids in fruits during ripening; the most interesting results were associated with light treatments. Further research should be directed to the in-depth study of nutrition regimes, in combination with other photoselective nets applications (i.e., pearl nets), that could be suitable for the Altino genotype to enhance the yield and nutraceutical potentials of its fruits. Keywords: N management; light availability; Altino ecotype; sweet pepper; nutraceutical traits; fruit quality; yield performances 1. Introduction A landrace is defined as a dynamic population of a cultivated plant characterized by its own distinct identity, often genetically diverse and locally adapted, selected and associated with specific farmers’ practices of seed selection and crop/field management [1,2]. Italy, due to its geographical and historical compliance, includes a significant richness of cultivated biodiversity and local varieties such as Altino, an ecotype of sweet pepper (Capsicum annuum L.). This crop is one of the most cultivated and economically important within the Mediterranean Basin [3], and the Italian germplasm includes a variety of highly diverse landraces having specific morphological traits [4]. The Altino ecotype is typical of the Abruzzo region (Southern Italy), in the province of Chieti, and it is known for its air- or sun-dried fruits, commonly used in many typical culinary dishes and as a spice after grinding [5]. Horticulturae 2022, 8, 499. https://doi.org/10.3390/horticulturae8060499 https://www.mdpi.com/journal/horticulturae
-
Upload
khangminh22 -
Category
Documents
-
view
0 -
download
0
Transcript of A Case Study of Altino Sweet Pepper - MDPI

Citation: Stagnari, F.; Ficcadenti, N.;
Manetta, A.C.; Platani, C.; Dattoli,
M.A.; Galieni, A. Modulation of Light
and Nitrogen for Quality-Traits
Improvement: A Case Study of
Altino Sweet Pepper. Horticulturae
2022, 8, 499. https://doi.org/
10.3390/horticulturae8060499
Academic Editor: Martina Bavec
Received: 10 May 2022
Accepted: 1 June 2022
Published: 4 June 2022
Publisher’s Note: MDPI stays neutral
with regard to jurisdictional claims in
published maps and institutional affil-
iations.
Copyright: © 2022 by the authors.
Licensee MDPI, Basel, Switzerland.
This article is an open access article
distributed under the terms and
conditions of the Creative Commons
Attribution (CC BY) license (https://
creativecommons.org/licenses/by/
4.0/).
horticulturae
Article
Modulation of Light and Nitrogen for Quality-TraitsImprovement: A Case Study of Altino Sweet PepperFabio Stagnari 1, Nadia Ficcadenti 2, Anna Chiara Manetta 1, Cristiano Platani 2, Maria Assunta Dattoli 2
and Angelica Galieni 2,*
1 Faculty of Bioscience and Technology for Agriculture Food and Environment, Campus Universitario di CosteSant’Agostino, University of Teramo, Via R. Balzarini 1, 64100 Teramo, Italy; [email protected] (F.S.);[email protected] (A.C.M.)
2 Research Centre for Vegetable and Ornamental Crops, Council for Agricultural Research andEconomics—CREA, Via Salaria 1, 63077 Monsampolo del Tronto, Italy; [email protected] (N.F.);[email protected] (C.P.); [email protected] (M.A.D.)
* Correspondence: [email protected]
Abstract: Local varieties are known to cope more efficiently with stressful and/or low-input condi-tions than cultivated ones by activating secondary metabolisms and, hence, are supposed to havehigher nutraceutical potential. In this work, we investigate the effects of N and light, supplied at opti-mal and sub-optimal levels, on the fruit yield and quality of a local ecotype of sweet pepper, Altino,grown in the Abruzzo Region (Southern Italy). In 2017, two open-field experiments were carried out,comparing increasing N rates (0, 100 and 200 kg N ha−1, 0_N, 100_N and 200_N, respectively) anddifferent percentages of shading and/or manipulations of the transmitted solar radiation, obtainedthrough photoselective nets (red net, RN; black net, BN; unshaded Control). Both N and light werepreconditions to obtain stable yields in terms of both fruit number and fruit weights. However, BNsignificantly reduced the number of sunscalded fruits (0.39 vs. 3.38 and 2.59 fruit plant−1 for BN,Control and RN, respectively), leading to lower waste. N deficiency favoured higher total polyphenol(TPC) and flavonoid (TFC) contents in ripened fruits; on the other hand, shading significantly reducedTPC (−12.4%) in immature and TFC (−18.2%) in red fruits. The variations in nutraceuticals werealso evaluated in terms of the variations of the single phenolic acids in fruits during ripening; themost interesting results were associated with light treatments. Further research should be directed tothe in-depth study of nutrition regimes, in combination with other photoselective nets applications(i.e., pearl nets), that could be suitable for the Altino genotype to enhance the yield and nutraceuticalpotentials of its fruits.
Keywords: N management; light availability; Altino ecotype; sweet pepper; nutraceutical traits; fruitquality; yield performances
1. Introduction
A landrace is defined as a dynamic population of a cultivated plant characterized by itsown distinct identity, often genetically diverse and locally adapted, selected and associatedwith specific farmers’ practices of seed selection and crop/field management [1,2]. Italy, dueto its geographical and historical compliance, includes a significant richness of cultivatedbiodiversity and local varieties such as Altino, an ecotype of sweet pepper (Capsicumannuum L.). This crop is one of the most cultivated and economically important within theMediterranean Basin [3], and the Italian germplasm includes a variety of highly diverselandraces having specific morphological traits [4]. The Altino ecotype is typical of theAbruzzo region (Southern Italy), in the province of Chieti, and it is known for its air-or sun-dried fruits, commonly used in many typical culinary dishes and as a spice aftergrinding [5].
Horticulturae 2022, 8, 499. https://doi.org/10.3390/horticulturae8060499 https://www.mdpi.com/journal/horticulturae

Horticulturae 2022, 8, 499 2 of 17
Generally, local varieties are characterized by good adaptation and rusticity, includingresistance to both biotic and abiotic environmental factors, and are prone to sustainablecultivation systems under low-input conditions [6]. In addition, environmental constraintscould eventually translate into modification in terms of phytochemical’s profiles and nu-traceutical potentials. Indeed, plant stress-response mechanisms are correlated with theincreased content of bioactive molecules; consequently landraces, coping more efficientlywith environmentally stressful conditions than cultivated varieties, are generally character-ized by higher nutraceutical potential [7].
In such context, we report data on yield and quality (nutraceutical) performances ofAltino ecotype in response to N and light availability as a section of our complex study [8]involving morphological and physiological adaptation to the environment, as well as theactivation/modulation of secondary metabolism. N availability is essential for normal plantgrowth and development, although high N fertilizer rates often result in increased levels ofN losses and environmental pollution [9]; moreover, high N levels lead to lower secondarymetabolites and vitamin contents [10]. Hence, N management has become a priority issue,and local varieties required a specific approach, leading to lower chemical inputs.
On the other hand, the availability of solar radiation can be modulated through theuse of photoselective nets, which also provides physical protection against hail, wind, andbird- and insect-transmitted virus diseases [11]. Moreover, it has been shown that photos-elective nets are also involved in the biosynthesis of bioactive compounds in many cropspecies [12,13], including sweet peppers [14,15]. The Altino ecotype could take advantageof this protection practice, in terms of sunburn damages [16], providing a valid justificationfor the high added value of local production (i.e., DOP, IGP, Slow Food praesidium).
The assumptions at the base of our study were: (i) N and light are involved in thebiosynthesis of secondary metabolites; (ii) both factors can be easily modulated in openfields under low-input systems, thus optimizing yield and quality characteristics (harvestand post-harvest); (iii) adaptive responses to the environment and crop management oflocal varieties are still poorly studied, and (iv) the N and light availabilities significantlyinfluence the growth and physiological performances of the Altino ecotype [8]. On thesebases, our study was aimed at evaluating both the separate and cumulative effects oflight and N, supplied at optimal and suboptimal levels, on the yield and nutraceuticalcharacteristics of the fruits of the Altino sweet pepper.
2. Materials and Methods2.1. Plant Materials and Experimental Design
This study used data as a part of a complex study that investigated the growth andphysiological responses of the sweet pepper (red-skinned fruit) ecotype “Altino”, alreadydescribed in Stagnari et al. [8], to which we recommend referring to obtain any furtherinformation. Seeds obtained from a keeper farmer located at Altino (CH), in the Abruzzoregion (Central Italy), were used. As a local variety, the collection was firstly subjected totwo cycles of phenotypic selection (2015 and 2016) to obtain a generation of self-fertilizationsufficiently stable for the typical characters indicated for the ideotype [8]. Two phenotypes(named 97 and 99) were selected and used to establish two experiments (from 15 May to22 September, 2017), named Exp_1 and Exp_2, using seeds of the two phenotypes 97 and99, for Exp_1 and Exp_2, respectively. Experiments were carried out at the experimentalfields of the Research Centre for Vegetable and Ornamental Crops, Council for AgriculturalResearch and Economics (CREA-OF), located in Monsampolo del Tronto (AP) (latitude42◦52′59.1′′ N, longitude 13◦48′01.9′′ E), in the coastal area of the Marche Region (CentralItaly) (see also [8]).
In both experiments, pepper seeds were sown on 15 May 2017, in a nursery substrate;22 days after sowing, seedlings (4 leaf stage) were transplanted in the open field in twinrows with a spacing of 0.4 m between plants and rows and 1.6 m between twin rows (toensure the setting-up of the experimental treatments), following a split-plot design withthree replications. For both Exp_1 and Exp_2, experimental treatments (nine) concerned

Horticulturae 2022, 8, 499 3 of 17
three nitrogen fertilization rates (main treatment; N_rates) in combination with three shadeconditions (secondary treatment; Sh), covering a total of 20 pepper plants for each “N_ratesx Sh” combination, grown in a single twin row (see [8]). N_rates were obtained by applyingurea at 0, 100 and 200 kg N ha−1 (0_N, 100_N and 200_N, respectively). For each N treat-ment, subplots were obtained by splitting the total area into three subplots and shadingconditions were accomplished using different colored shading nets (Sh treatments: rednet, RN; black net, BN), in addition to an unshaded control (Control). Nets were wrappedaround 1.7 m-height tunnels, opened at both ends, and placed over the crop. Red and blacknets were provided by Agrintech S.r.l. (Iridium®Rosso and Monotex 30, respectively; Eboli,Italy). Photosynthetically active radiation (PAR) intensity, relative humidity and air tem-peratures under nets were continuously monitored starting from 9 days after transplanting(DAT) with specific sensors connected to a data logger (EM50 Data Collection System;Decagon Devices Inc., Pullman, WA, USA). The amount of shade (%) was determined bycomparing the daily average PAR values of nets with the daily average PAR values ofthe Control treatment; the amount of scattered light in the PAR range was measured asindicated by Shahak et al. [17]. Radiance (from 325 to 1075 nm; ±2 nm) was measured withthe HandHeld 2 Pro Portable Spectroradiometer (FieldSpec, ADS Inc., Boulder, CO, USA).The analysis of the light properties were as follows: irradiance total daily quantum input(DQI), 45.6 mol m−2 day−1, 34.9 mol m−2 day−1 and 27.3 mol m−2 day−1 for Control, RNand BN, respectively; shade, 23.8% for RN and 40.4% for BN; scattering, 15.4% and 12.1%for RN and BN, respectively; daytime mean temperatures, 30.0 ◦C for Control, 30.5 ◦C forRN and 29.7 ◦C for BN; night mean temperatures, 19.9, 19.8 and 19.5 ◦C for Control, RNand BN, respectively; relative humidity, 58.4% for Control, 57.8% for RN and 59.6% for BN(see [8]).
Potassium (80 kg P2O5 ha−1) and phosphorus (150 kg P2O5 ha−1) fertilization wasprovided during soil preparation. Black plastic mulch and a drip irrigation system ontwin rows were used. Plant protection measures were adopted to keep crops free fromfungal diseases, using when necessary, CUPROXAT SDI (Nufarm Italy, Milano, Italy), atthe dose of 2 L ha−1. No insecticide treatment was carried out. Weeds were mechanicallyand manually removed between twin rows and in the rows, respectively.
2.2. Yield and Morphological Traits
In both Exp_1 and Exp_2, the yield was monitored in three randomly selected plantsfor each experimental unit. Fruits were harvested along with three successive timing at77 and 93 DAT, plus a further collection at 108 DAT, before crop termination. Fruits werecounted and divided into marketable (ripe and free of visible defects) and unmarketablefruits. The unmarketable fruits included misshapen, undersized, sunscalded and green(only at 108 DAT) fruits. Before fresh weight (FW, g) determination, marketable fruitswere characterized for their length (L, cm) and equatorial diameter (D, cm) using a manualcaliper; the number of seeds per fruit (Seed), as well as the single seed dry weight (SeedDW, mg), were also measured after placing the seeds in an oven at 70 ◦C for 72 h.
At 83 DAT, fruits were sampled in a further two plants per experimental unit and weredivided into green (immature, with up to 90% green color; G_fru), early ripening (with10–90% green color; RI_fru) and red (mature, with up to 90% red color; R_fru) fruits. Thefruits were thoroughly cleaned and cut, and the seeds and placenta were removed. Sub-samples were selected and frozen, freeze-dried, finely ground and homogenized and thenwere kept at −20 ◦C until analysis (total polyphenols content, TPC; total flavonoid content,TFC; vitamin C, Vit C; antioxidant capacity, TEAC/ABTS; single phenolic acids, PAs).
2.3. Pigments
Pigment concentrations in fruits—chlorophyll (Chla), Chlb and carotenoids (Car)—were determined, following the method described by Lichtenthaler and Buschmann [18].The results were expressed in µg g−1 of dry weight (DW).

Horticulturae 2022, 8, 499 4 of 17
2.4. Spectrophotometric Determination of TPC, TFC and Antioxidant Capacity
The extraction of polyphenols and flavonoids was carried out as described by Gouveiaand Castilho [19].
The TPC was evaluated using the Folin–Ciocalteu reagent following the methoddescribed by Gouveia and Castilho [20]. The samples (50 µL) were added to 1.25 mL ofFolin–Ciocalteu (dilution, 1:10) and 1.0 mL of a 7.5% Na2CO3 solution. After 30 min atroom temperature under dark conditions, TPC was determined at 765 nm using a BeckmanDU640B spectrophotometer (Beckman Coulter, Brea, CA, USA). Results were expressed asmg gallic acid equivalents (GAE) per 100 g−1 dry weight (DW).
Total flavonoid content (TFC) was calculated following the procedure described byGouveia and Castilho [19] and expressed as mg of rutin equivalents (RUE) 100 g−1 DW.Extract sub-samples (100 µL) were mixed with 1.5 mL of methanol, 2.8 mL of water, 100 µLof potassium acetate (1 M) and 100 µL of aluminum chloride (10% in methanol). TFC wasdetermined after 30 min at room temperature, reading the reaction mixture at 415 nm,using a Beckman DU640B spectrophotometer.
For the antioxidant capacity (AOC) determination, Trolox equivalent antioxidantcapacity—with 2,2′-azino-bis(3-ethylbenzothiazoline-6-sulphonic acid)—TEAC/ABTS as-say (ABTS)—was used following Re et al. [21], modified as described by Gouveia andCastilho [22]. The absorbance at 734 nm was evaluated, and results were expressed asmmol Trolox equivalent (TE) 100 g−1 DW.
2.5. Vitamin C Content
Ascorbic acid was determined according to the 2,6-dichlorophenolindophenol (DIP)dye method as described by Ghasemnezhad et al. [23], with some modifications. Drysamples (250 mg) were homogenized with 5 mL of 3% metaphosphoric acid (w/v) andcentrifuged. A total of 3 mL of supernatant were titrated against standard DIP dye, whichwas already standardized against standard ascorbic acid. Results were expressed in mgascorbic acid 100 g−1 DW.
2.6. Determination of the Polyphenol Profile by High-Performance Liquid Chromatography (HPLC)2.6.1. Chemicals
Methanol (high-performance liquid chromatography (HPLC grade) and acetonitrile(HPLC grade) were purchased from Carlo Erba (Milano, Italy). 4-hydroxybenzoic acid(4-OHBA), vanillic acid (VA), caffeic acid (CaA) and trans-ferulic acid (FA) were purchasedfrom Sigma-Aldrich (St. Louis, MO, USA). All standards were prepared as a stock solutionat 1 mg mL−1 in methanol and stored at −20 ◦C in dark conditions.
2.6.2. Sample Extraction
The extraction of free phenolic acids (PAs) was achieved using finely homogenizedfreeze-dried material and following the procedure of Zhang et al. [24], starting from 0.25 gof each sample. After sonication with methanol 80% in H2O, samples were centrifuged at2000× g for 10 min, and the supernatant was filtered through nylon 0.45 µm filters. Allthe extraction procedures were performed under dim light to avoid sample degradationby photo-oxidation.
2.6.3. PAs Identification and Quantification
Identification and quantification of the PAs were carried out on 10 µL of each sampleextract according to the procedure described by Benincasa et al. [25]. The identificationof PAs was based on their retention times and UV–VIS spectra compared with those ofstandard solutions eluted using the same chromatographic conditions. The calibrationcurves (i.e., the peak area versus concentration) were linear in the range of concentrationbetween 0.1 and 10 mg L−1. The lines of regression calculated were used for the quantitativeanalysis of PAs in the extracts; the results are expressed as mg kg−1 DW. Accuracy, evaluatedthrough the recovery of PAs added to samples, was found to be more than 94% for all of
Horticulturae 2022, 8, 499 5 of 17
the PAs detected. The within-assay precision (repeatability) never exceeded 7%. Limits ofdetection, set based on a signal-to-noise ratio (S/N) of 3, were 0.40 mg kg−1 for 4-OHBA,VA, CaA and 0.8 mg kg−1 for FA.
2.7. Statistical Analysis
A three-factor analysis of variance (ANOVA) was applied to test (F-test) the effects ofthe experiment (Exp) and treatments (N_rates and Sh). Since no significant effects of ‘Exp’or ‘Exp × N_rates’ or ‘Exp × Sh’ or ‘Exp × N_rates × Sh’ interactions were detected, wehave performed a split-plot ANOVA to evaluate the effects of N_rates (main factor) andSh (secondary factor). ANOVA assumptions were tested through graphical methods. Thestatistical analyses were performed using R software [26].
3. Results3.1. Yield and Yield Components
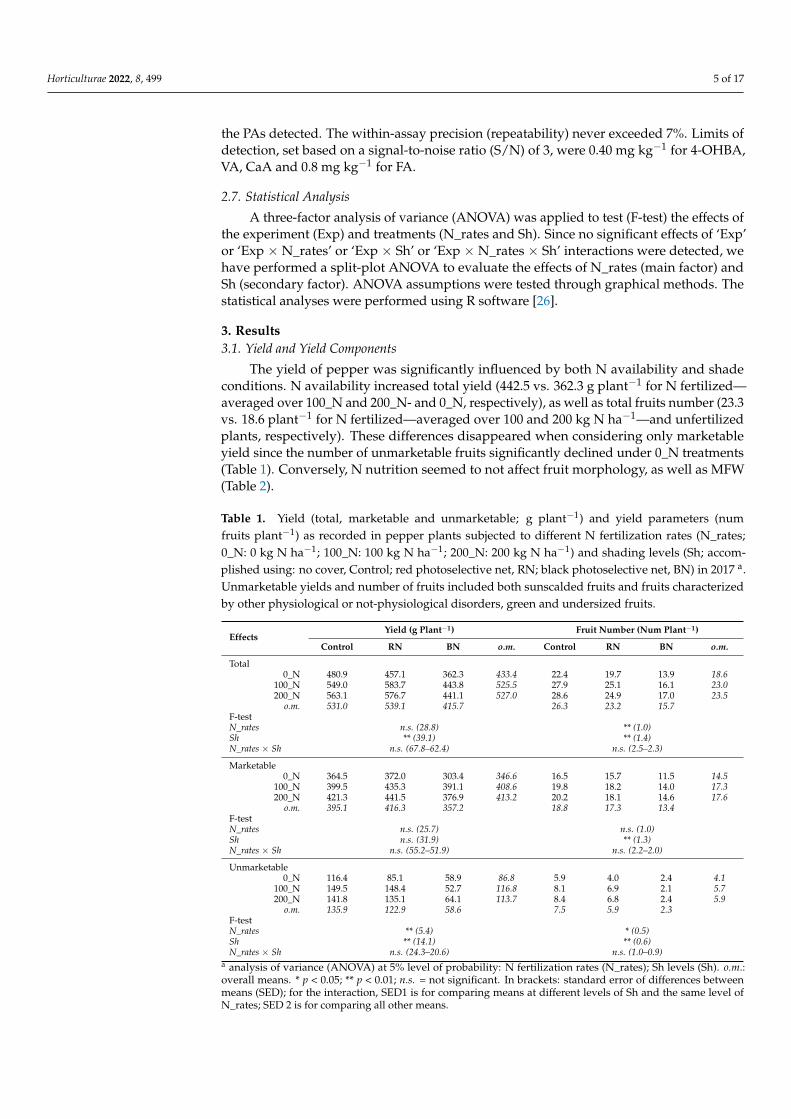
The yield of pepper was significantly influenced by both N availability and shadeconditions. N availability increased total yield (442.5 vs. 362.3 g plant−1 for N fertilized—averaged over 100_N and 200_N- and 0_N, respectively), as well as total fruits number (23.3vs. 18.6 plant−1 for N fertilized—averaged over 100 and 200 kg N ha−1—and unfertilizedplants, respectively). These differences disappeared when considering only marketableyield since the number of unmarketable fruits significantly declined under 0_N treatments(Table 1). Conversely, N nutrition seemed to not affect fruit morphology, as well as MFW(Table 2).
Table 1. Yield (total, marketable and unmarketable; g plant−1) and yield parameters (numfruits plant−1) as recorded in pepper plants subjected to different N fertilization rates (N_rates;0_N: 0 kg N ha−1; 100_N: 100 kg N ha−1; 200_N: 200 kg N ha−1) and shading levels (Sh; accom-plished using: no cover, Control; red photoselective net, RN; black photoselective net, BN) in 2017 a.Unmarketable yields and number of fruits included both sunscalded fruits and fruits characterizedby other physiological or not-physiological disorders, green and undersized fruits.
EffectsYield (g Plant−1) Fruit Number (Num Plant−1)
Control RN BN o.m. Control RN BN o.m.
Total0_N 480.9 457.1 362.3 433.4 22.4 19.7 13.9 18.6
100_N 549.0 583.7 443.8 525.5 27.9 25.1 16.1 23.0200_N 563.1 576.7 441.1 527.0 28.6 24.9 17.0 23.5
o.m. 531.0 539.1 415.7 26.3 23.2 15.7F-testN_rates n.s. (28.8) ** (1.0)Sh ** (39.1) ** (1.4)N_rates × Sh n.s. (67.8–62.4) n.s. (2.5–2.3)
Marketable0_N 364.5 372.0 303.4 346.6 16.5 15.7 11.5 14.5
100_N 399.5 435.3 391.1 408.6 19.8 18.2 14.0 17.3200_N 421.3 441.5 376.9 413.2 20.2 18.1 14.6 17.6
o.m. 395.1 416.3 357.2 18.8 17.3 13.4F-testN_rates n.s. (25.7) n.s. (1.0)Sh n.s. (31.9) ** (1.3)N_rates × Sh n.s. (55.2–51.9) n.s. (2.2–2.0)
Unmarketable0_N 116.4 85.1 58.9 86.8 5.9 4.0 2.4 4.1
100_N 149.5 148.4 52.7 116.8 8.1 6.9 2.1 5.7200_N 141.8 135.1 64.1 113.7 8.4 6.8 2.4 5.9
o.m. 135.9 122.9 58.6 7.5 5.9 2.3F-testN_rates ** (5.4) * (0.5)Sh ** (14.1) ** (0.6)N_rates × Sh n.s. (24.3–20.6) n.s. (1.0–0.9)
a analysis of variance (ANOVA) at 5% level of probability: N fertilization rates (N_rates); Sh levels (Sh). o.m.:overall means. * p < 0.05; ** p < 0.01; n.s. = not significant. In brackets: standard error of differences betweenmeans (SED); for the interaction, SED1 is for comparing means at different levels of Sh and the same level ofN_rates; SED 2 is for comparing all other means.

Horticulturae 2022, 8, 499 6 of 17
Table 2. Mean marketable fruit weight (MFW, g), fruit length (L, cm), fruit diameter (D, cm), number of seeds per fruit (Seed, num) and single-seed dry weight (SeedDW, mg), as recorded in pepper plants subjected to different N fertilization rates (N_rates; 0_N: 0 kg N ha−1; 100_N: 100 kg N ha−1; 200_N: 200 kg N ha−1) andshade levels (Sh; accomplished using: no cover, Control; red photoselective net, RN; black photoselective net, BN) in 2017 a.
EffectsMFW (g) L (cm) D (cm) Seed (num) Seed DW (mg)
Control RN BN o.m. Control RN BN o.m. Control RN BN o.m. Control RN BN o.m. Control RN BN o.m.
0_N 22.5 24.3 26.5 24.4 13.1 13.7 15.0 13.9 3.1 2.5 2.6 2.8 234.0 244.7 196.7 225.2 5.51 5.42 6.20 5.71100_N 20.4 23.6 27.8 23.9 12.9 13.5 15.1 13.9 2.7 2.6 2.7 2.7 237.4 246.6 226.7 236.9 5.53 5.53 6.03 5.70200_N 20.8 25.4 25.8 24.0 12.8 13.3 14.7 13.6 2.4 2.6 2.6 2.5 215.9 235.6 198.2 216.6 6.18 6.02 6.34 6.18
o.m. 21.2 24.4 26.7 12.9 13.5 14.9 2.7 2.6 2.7 229.1 242.3 207.2 5.74 5.66 6.19F testN_rates n.s. (1.9) n.s. (0.21) n.s. (0.17) n.s. (14.4) n.s. (0.23)Sh ** (0.8) ** (0.19) n.s. (0.17) n.s. (15.4) * (0.19)N_rates × Sh n.s. (1.4–2.2) n.s. (0.33–0.34) n.s. (0.30–0.30) n.s. (26.6–26.1) n.s. (0.33–0.36)
a analysis of variance (ANOVA) at 5% level of probability: N fertilization rates (N_rates); Sh levels (Sh). o.m.: overall means. * p < 0.05; ** p < 0.01; n.s. = not significant. In brackets:standard error of differences between means (SED); for the interaction, SED1 is for comparing means at different levels of Sh and the same level of N_rates; SED 2 is for comparing allother means.

Horticulturae 2022, 8, 499 7 of 17
Shading with black nets significantly reduced total yield and fruit number per plant,as well as the number of unmarketable fruits and, consequently, the unmarketable yield(Table 1). In particular, regardless of N conditions, BN sharply decreased the number ofsunscalded fruits (0.39 vs. 3.38 and 2.59 fruit plant−1 for BN, Control and RN, respectively;Figure 1). Although BN significantly reduced the number of marketable fruits per plant(13.4 vs. 18.8 and 17.3 fruit plant−1 for BN, Control and RN, respectively), marketable yieldwas not affected (357.2, 395.1 and 416.3 g plant−1 for BN, Control and RN, respectively;Table 1), and a significant increase of MFW was also observed (21.2, 24.4 and 26.7 forControl, RN and BN, respectively; Table 2). Indeed, shade influenced fruit length, andBN recorded the highest values (Table 2). On the contrary, RN data on yield and yieldcomponents were not significantly different from Control (Table 1 and Figure 1).
Horticulturae 2022, 8, x FOR PEER REVIEW 8 of 19
Shading with black nets significantly reduced total yield and fruit number per plant,
as well as the number of unmarketable fruits and, consequently, the unmarketable yield
(Table 1). In particular, regardless of N conditions, BN sharply decreased the number of
sunscalded fruits (0.39 vs. 3.38 and 2.59 fruit plant−1 for BN, Control and RN, respectively;
Figure 1). Although BN significantly reduced the number of marketable fruits per plant
(13.4 vs. 18.8 and 17.3 fruit plant−1 for BN, Control and RN, respectively), marketable yield
was not affected (357.2, 395.1 and 416.3 g plant−1 for BN, Control and RN, respectively;
Table 1), and a significant increase of MFW was also observed (21.2, 24.4 and 26.7 for Con‐
trol, RN and BN, respectively; Table 2). Indeed, shade influenced fruit length, and BN
recorded the highest values (Table 2). On the contrary, RN data on yield and yield com‐
ponents were not significantly different from Control (Table 1 and Figure 1).
Figure 1. Number of unmarketable fruits (num plant−1), as recorded in pepper plants subjected to
different N fertilization rates (N_rates; 0_N: 0 kg N ha−1; 100_N: 100 kg N ha−1; 200_N: 200 kg N ha−1)
and shade levels (Sh; accomplished using: no cover, Control; red photoselective net, RN; black pho‐
toselective net, BN) in 2017. White chart: sunscald fruits; gray chart: fruits characterized by other
disorders. Data are means ± standard errors, over Exp_1 and Exp_2 (n = 6).
Light availability seemed to be crucial for seed development: fruits yielded from BN
plants showed a lower seed number, while N did not induce any effects (Table 2).
3.2. Fruit Pigments
The amounts of Chl (Chl A, Chl B and Chl TOT) and Car in pepper fruits were rec‐
orded from green, early ripening and red fruits and are reported in Figure 2 and Table 3.
Shade significantly enhanced Chl A and Chl B contents (and, consequently, Chl TOT as
the sum of Chl A and Chl B) in fruits, as recorded in the immature ones (Chl TOT: 947.3,
710.8 and 773.9 g g−1 for BN, Control and RN, respectively). Despite Car content in red
fruits being promoted by full light availability, especially at the lowest N doses, the dif‐
ferences were always insignificant (Figure 2 and Table 3).
Figure 1. Number of unmarketable fruits (num plant−1), as recorded in pepper plants subjected to dif-ferent N fertilization rates (N_rates; 0_N: 0 kg N ha−1; 100_N: 100 kg N ha−1; 200_N: 200 kg N ha−1)and shade levels (Sh; accomplished using: no cover, Control; red photoselective net, RN; blackphotoselective net, BN) in 2017. White chart: sunscald fruits; gray chart: fruits characterized by otherdisorders. Data are means ± standard errors, over Exp_1 and Exp_2 (n = 6).
Light availability seemed to be crucial for seed development: fruits yielded from BNplants showed a lower seed number, while N did not induce any effects (Table 2).
3.2. Fruit Pigments
The amounts of Chl (Chl A, Chl B and Chl TOT) and Car in pepper fruits were recordedfrom green, early ripening and red fruits and are reported in Figure 2 and Table 3. Shadesignificantly enhanced Chl A and Chl B contents (and, consequently, Chl TOT as the sumof Chl A and Chl B) in fruits, as recorded in the immature ones (Chl TOT: 947.3, 710.8 and773.9 µg g−1 for BN, Control and RN, respectively). Despite Car content in red fruits beingpromoted by full light availability, especially at the lowest N doses, the differences werealways insignificant (Figure 2 and Table 3).

Horticulturae 2022, 8, 499 8 of 17Horticulturae 2022, 8, x FOR PEER REVIEW 9 of 19
Figure 2. Pigment content (g g−1 dry weight), as determined in pepper fruits from plants subjected
to different N fertilization rates (0_N: 0 kg N ha−1; 100_N: 100 kg N ha−1; 200_N: 200 kg N ha−1) and
shade levels (accomplished using: no cover, Control; red photoselective net, RN; black photoselec‐
tive net, BN) at harvest (83 days after transplanting, DAT), in 2017. Light gray chart: total chloro‐
phyll (Chl TOT) content (Chl A + Chl B); white chart: carotenoids (Car) content. G_fru: green fruits;
RI_fru: early‐ripening fruits; R_fru: red fruits. Data are means ± standard errors, over Exp_1 and
Exp_2 (n = 6).
Figure 2. Pigment content (µg g−1 dry weight), as determined in pepper fruits from plants subjectedto different N fertilization rates (0_N: 0 kg N ha−1; 100_N: 100 kg N ha−1; 200_N: 200 kg N ha−1) andshade levels (accomplished using: no cover, Control; red photoselective net, RN; black photoselectivenet, BN) at harvest (83 days after transplanting, DAT), in 2017. Light gray chart: total chlorophyll(Chl TOT) content (Chl A + Chl B); white chart: carotenoids (Car) content. G_fru: green fruits; RI_fru:early-ripening fruits; R_fru: red fruits. Data are means ± standard errors, over Exp_1 and Exp_2(n = 6).

Horticulturae 2022, 8, 499 9 of 17
Table 3. Overall means and F-test from the analysis of variance (ANOVA a) performed on pigmentcontent [Chlorophyll (Chl) A, Chl B, Chl TOT (Chl A + Chl B) and Carotenoids (Car); µg g−1 dryweight] data. Pigments were analyzed on pepper fruits from plant subjected to different N fertilizationrates (N_rates; 0_N: 0 kg N ha−1; 100_N: 100 kg N ha−1; 200_N: 200 kg N ha−1) and shade levels (Sh;accomplished using: no cover, Control; red photoselective net, RN; black photoselective net, BN) atharvest (83 days after transplanting, DAT), in 2017.
Overall Means Chl A Chl B Chl TOT Car
Green fruits0_N 629.6 221.1 850.7 280.5
100_N 571.7 202.5 774.2 271.1200_N 594.0 213.1 807.1 271.9
Control 533.1 177.7 710.8 268.5RN 572.6 201.3 773.9 267.7BN 689.6 257.7 947.3 287.3
N_rates n.s. (70.3) n.s. (20.0) n.s. (89.7) n.s. (10.2)Sh ** (37.8) ** (18.9) ** (55.8) n.s. (12.9)
N_rates × Sh n.s. (65.4–88.2) n.s. (32.8–33.4) n.s. (96.6–119.4) n.s. (22.3–20.9)
Early-ripening fruits0_N 312.1 111.7 423.9 675.5
100_N 271.1 98.6 369.7 875.3200_N 225.7 101.5 327.2 760.4
Control 283.0 97.6 380.6 628.2RN 300.8 139.5 440.4 784.6BN 225.1 74.8 299.9 898.4
N_rates n.s. (60.9) n.s. (9.4) n.s. (67.6) n.s. (200.3)Sh * (27.4) ** (14.3) ** (37.3) n.s. (111.7)
N_rates × Sh ** (47.5–72.2) * (24.8–22.4) ** (64.6–85.7) n.s. (193.4–255.0)
Red fruits0_N 1.7 2.8 4.5 4228.3
100_N 3.1 4.1 7.2 4045.8200_N 3.0 4.5 7.5 4418.6
Control 2.4 4.0 6.3 4409.4RN 1.9 2.1 4.0 4167.2BN 3.4 5.3 8.8 4116.0
N_rates n.s. (1.9) n.s. (2.2) n.s. (3.9) n.s. (335.2)Sh n.s. (1.8) n.s. (3.8) n.s. (5.0) n.s. (416.8)
N_rates × Sh n.s. (3.1–3.2) n.s. (5.9–5.3) n.s. (8.6–8.1) n.s. (721.8–678.1)a analysis of variance (ANOVA) at 5% level of probability: N fertilization rates (N_rates); Sh levels (Sh). * p < 0.05;** p < 0.01; n.s. = not significant. In brackets: standard error of differences between means (SED); for the interaction,SED1 is for comparing means at different levels of Sh and the same level of N_rates; SED 2 is for comparing allother means.
3.3. Phenolics and Vitamin C in Fruits
The dynamic of polyphenols accumulation (TPC and TFC) in pepper fruits wasrecorded at different ripeness fruit stages, from green to red, without separating the en-docarp, mesocarp and epicarp (Table 4). The role of N nutrition emerges at the end offruit ripening, when nitrogen stress (i.e., 0_N treatment) induced higher (although notsignificantly higher) TPC and TFC in red fruits (TPC: +4.4% on average; TFC: +8.7% onaverage (Table 4).
In general, a clear trend showing a decrease in TPC and TFC content, as shade changed,was observed. However, BN showed significantly lower TPC values with respect to Controland RN only in G_fru and RI_fru (G_fru: 989.6, 927.4 and 866.5 mg GAE 100 g−1 for Control,RN and BN, respectively; RI_fru: 932.3, 921.4 and 847.3 mg GAE 100 g−1 for Control, RNand BN, respectively); conversely, significant differences in terms of TFC were recordedonly in R_fru (332.1, 293.7 and 271.6 mg RUE 100 g−1 for Control, RN and BN, respectively;Table 4). The observed differences translated into a reduction in ABTS values in green andearly-ripening fruits harvested from plants grown under the black net (Table 4).

Horticulturae 2022, 8, 499 10 of 17
Table 4. Total phenolic content [TPC, mg gallic acid equivalent (GAE) 100 g−1 dry weight (DW)], total flavonoid content [TFC, mg rutin equivalents (RUE) 100 g−1
DW], vitamin C [mg ascorbic acid 100 g−1 dry weight (DW)] and Trolox-equivalent antioxidant capacity [with 2,2′-azinobis-3-ethylbenzothiazoline-6-sulfonic acid(ABTS)—mmol Trolox equivalents (TE) 100 g−1] as determined in pepper fruits from plants subjected to different N fertilization rates (N_rates; 0_N: 0 kg N ha−1;100_N: 100 kg N ha−1; 200_N: 200 kg N ha−1) and shade levels (Sh; accomplished using: no cover, Control; red photoselective net, RN; black photoselective net, BN)at harvest (83 days after transplanting), in 2017 a.
EffectsTPC (mg GAE 100 g−1) TFC (mg RUE 100 g−1) Vit C (mg 100 g−1) ABTS (mmol TE 100 g−1)
Control RN BN o.m. Control RN BN o.m. Control RN BN o.m. Control RN BN o.m.
Green fruits0_N 968.3 958.6 887.9 938.3 388.2 347.4 337.5 357.7 126.6 129.81 86.7 114.4 1.79 1.48 1.52 1.60
100_N 981.2 871.2 866.7 906.4 383.5 328.3 369.4 360.4 123.7 88.72 91.1 101.2 1.88 1.61 1.62 1.70200_N 1019.1 952.5 845.0 938.9 430.9 389.2 284.0 368.1 82.4 143.64 91.7 105.9 2.03 1.67 1.31 1.67
o.m. 989.6 927.4 866.5 400.9 355.0 330.3 110.9 120.7 89.8 1.90 1.59 1.48F-testN_rates n.s. (58.6) n.s. (45.4) n.s. (22.3) n.s. (0.17)Sh * (39.1) n.s. (42.5) n.s. (13.5) n.s. (0.18)N_rates × Sh n.s. (67.7–80.6) n.s. (73.7–75.4) n.s. (23.4–29.4) n.s. (0.32–0.31)
Early-ripening fruits0_N 871.4 860.8 807.7 846.6 305.6 284.4 291.5 293.8 107.0 138.6 139.2 128.3 2.01 1.92 1.77 1.90
100_N 992.5 954.1 851.2 932.6 369.8 275.6 323.6 323.0 108.7 104.6 120.9 111.4 2.26 1.86 1.84 1.98200_N 933.0 949.4 883.2 921.8 328.4 338.4 279.1 315.3 141.1 138.3 131.8 137.1 2.04 2.04 1.87 1.98
o.m. 932.3 921.4 847.3 334.6 299.5 298.1 118.9 127.2 130.7 2.10 A 1.94 1.82F-testN_rates n.s. (29.2) n.s. (16.8) n.s. (11.5) n.s. (0.12)Sh ** (24.6) n.s. (19.3) n.s. (10.1) * (0.11)N_rates × Sh n.s. (42.6–45.4) n.s. (33.4–32.0) n.s. (17.5–18.3) n.s. (0.17–0.18)
Red fruits0_N 1069.0 1006.1 1011.1 1028.7 358.8 310.3 278.5 315.8 160.6 156.6 160.6 159.2 2.54 2.39 2.28 2.40
100_N 944.6 948.6 1041.5 978.2 282.0 285.9 282.6 283.5 130.2 139.7 145.0 138.3 2.13 2.03 2.22 2.12200_N 1036.9 957.3 985.1 993.1 355.7 284.8 253.7 298.1 151.9 139.4 147.7 146.3 2.26 2.11 2.20 2.19
o.m. 1016.8 970.7 1012.5 332.1 293.7 271.6 147.6 145.2 151.1 2.31 2.17 2.23F-testN_rates n.s. (25.6) n.s. (17.6) n.s. (17.9) n.s. (0.19)Sh n.s. (30.8) * (18.4) n.s. (8.6) n.s. (0.08)N_rates × Sh n.s. (53.4–50.6) n.s. (31.9–31.4) n.s. (15.0–21.7) n.s. (0.13–0.22)
a analysis of variance (ANOVA) at 5% level of probability: N fertilization rates (N_rates); Sh levels (Sh). * p < 0.05; ** p < 0.01; n.s. = not significant. In brackets: standard error ofdifferences between means (SED); for the interaction, SED1 is for comparing means at different levels of Sh and same level of N_rates; SED 2 is for comparing all other means.
Horticulturae 2022, 8, 499 11 of 17
No significant differences in terms of Vit C content were observed in response to bothN and radiation availability (Table 4).
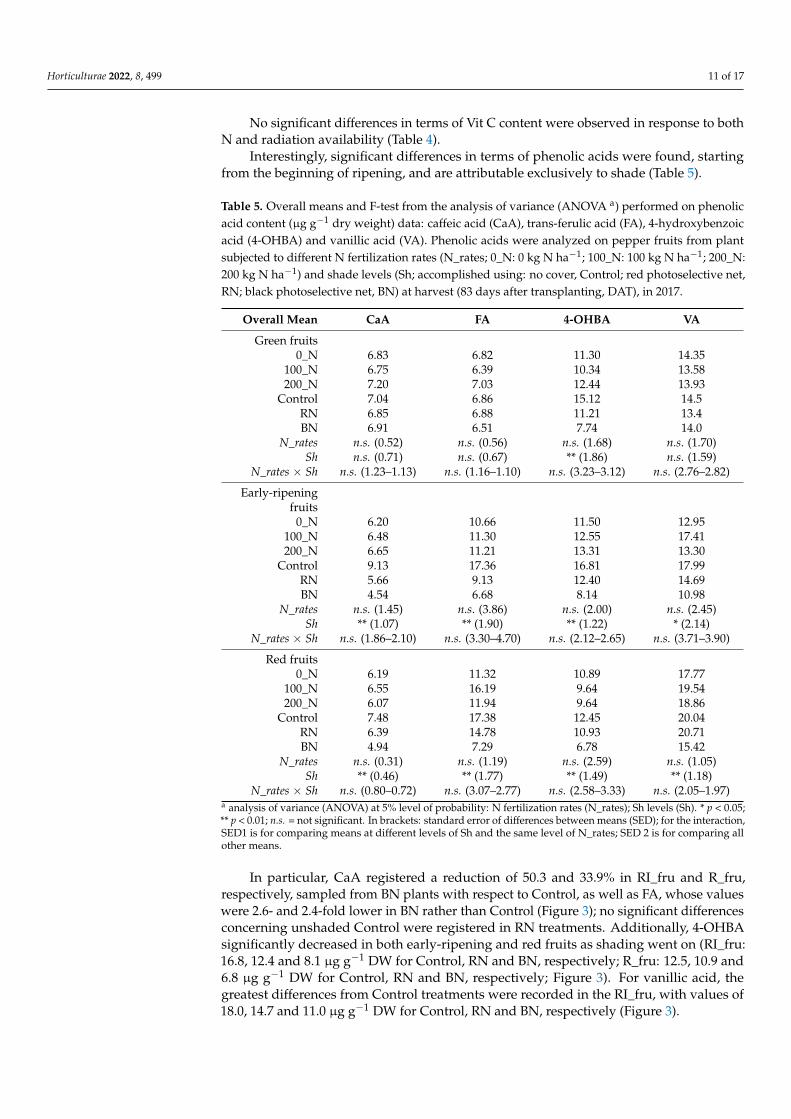
Interestingly, significant differences in terms of phenolic acids were found, startingfrom the beginning of ripening, and are attributable exclusively to shade (Table 5).
Table 5. Overall means and F-test from the analysis of variance (ANOVA a) performed on phenolicacid content (µg g−1 dry weight) data: caffeic acid (CaA), trans-ferulic acid (FA), 4-hydroxybenzoicacid (4-OHBA) and vanillic acid (VA). Phenolic acids were analyzed on pepper fruits from plantsubjected to different N fertilization rates (N_rates; 0_N: 0 kg N ha−1; 100_N: 100 kg N ha−1; 200_N:200 kg N ha−1) and shade levels (Sh; accomplished using: no cover, Control; red photoselective net,RN; black photoselective net, BN) at harvest (83 days after transplanting, DAT), in 2017.
Overall Mean CaA FA 4-OHBA VA
Green fruits0_N 6.83 6.82 11.30 14.35
100_N 6.75 6.39 10.34 13.58200_N 7.20 7.03 12.44 13.93
Control 7.04 6.86 15.12 14.5RN 6.85 6.88 11.21 13.4BN 6.91 6.51 7.74 14.0
N_rates n.s. (0.52) n.s. (0.56) n.s. (1.68) n.s. (1.70)Sh n.s. (0.71) n.s. (0.67) ** (1.86) n.s. (1.59)
N_rates × Sh n.s. (1.23–1.13) n.s. (1.16–1.10) n.s. (3.23–3.12) n.s. (2.76–2.82)
Early-ripeningfruits
0_N 6.20 10.66 11.50 12.95100_N 6.48 11.30 12.55 17.41200_N 6.65 11.21 13.31 13.30
Control 9.13 17.36 16.81 17.99RN 5.66 9.13 12.40 14.69BN 4.54 6.68 8.14 10.98
N_rates n.s. (1.45) n.s. (3.86) n.s. (2.00) n.s. (2.45)Sh ** (1.07) ** (1.90) ** (1.22) * (2.14)
N_rates × Sh n.s. (1.86–2.10) n.s. (3.30–4.70) n.s. (2.12–2.65) n.s. (3.71–3.90)
Red fruits0_N 6.19 11.32 10.89 17.77
100_N 6.55 16.19 9.64 19.54200_N 6.07 11.94 9.64 18.86
Control 7.48 17.38 12.45 20.04RN 6.39 14.78 10.93 20.71BN 4.94 7.29 6.78 15.42
N_rates n.s. (0.31) n.s. (1.19) n.s. (2.59) n.s. (1.05)Sh ** (0.46) ** (1.77) ** (1.49) ** (1.18)
N_rates × Sh n.s. (0.80–0.72) n.s. (3.07–2.77) n.s. (2.58–3.33) n.s. (2.05–1.97)a analysis of variance (ANOVA) at 5% level of probability: N fertilization rates (N_rates); Sh levels (Sh). * p < 0.05;** p < 0.01; n.s. = not significant. In brackets: standard error of differences between means (SED); for the interaction,SED1 is for comparing means at different levels of Sh and the same level of N_rates; SED 2 is for comparing allother means.
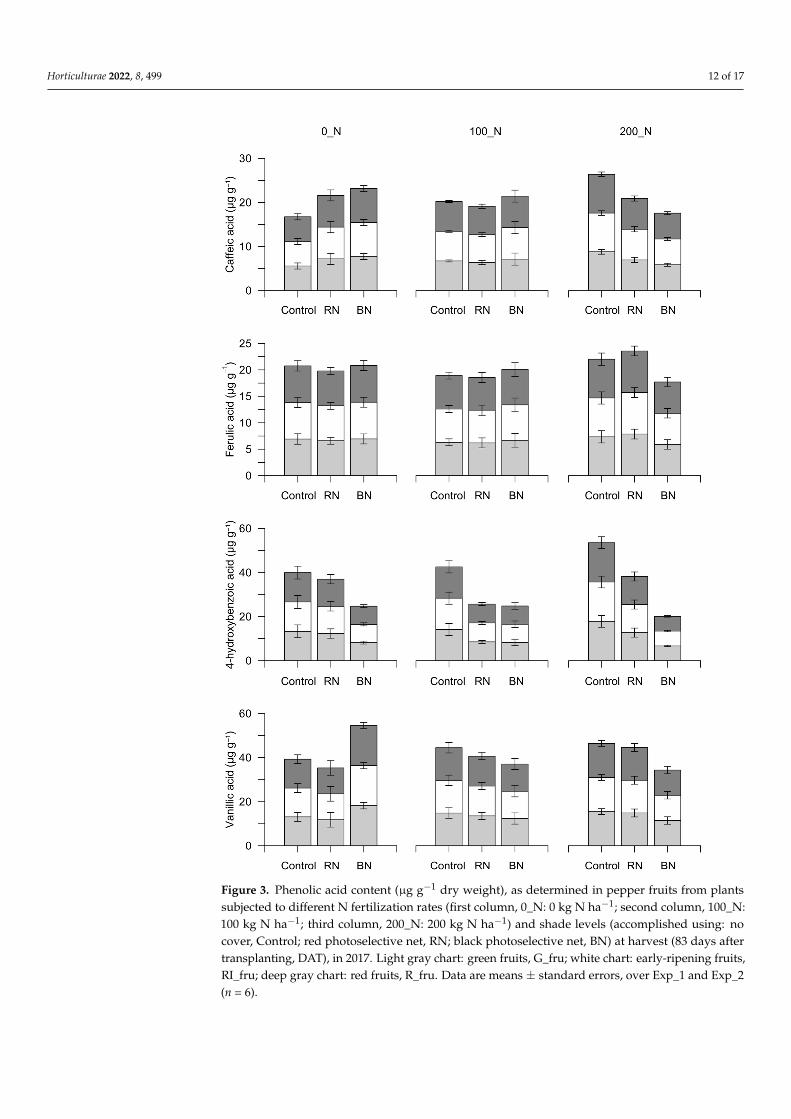
In particular, CaA registered a reduction of 50.3 and 33.9% in RI_fru and R_fru,respectively, sampled from BN plants with respect to Control, as well as FA, whose valueswere 2.6- and 2.4-fold lower in BN rather than Control (Figure 3); no significant differencesconcerning unshaded Control were registered in RN treatments. Additionally, 4-OHBAsignificantly decreased in both early-ripening and red fruits as shading went on (RI_fru:16.8, 12.4 and 8.1 µg g−1 DW for Control, RN and BN, respectively; R_fru: 12.5, 10.9 and6.8 µg g−1 DW for Control, RN and BN, respectively; Figure 3). For vanillic acid, thegreatest differences from Control treatments were recorded in the RI_fru, with values of18.0, 14.7 and 11.0 µg g−1 DW for Control, RN and BN, respectively (Figure 3).
Horticulturae 2022, 8, 499 12 of 17
Horticulturae 2022, 8, x FOR PEER REVIEW 14 of 19
In particular, CaA registered a reduction of 50.3 and 33.9% in RI_fru and R_fru, re‐
spectively, sampled from BN plants with respect to Control, as well as FA, whose values
were 2.6‐ and 2.4‐fold lower in BN rather than Control (Figure 3); no significant differences
concerning unshaded Control were registered in RN treatments. Additionally, 4‐OHBA
significantly decreased in both early‐ripening and red fruits as shading went on (RI_fru:
16.8, 12.4 and 8.1 g g−1 DW for Control, RN and BN, respectively; R_fru: 12.5, 10.9 and
6.8 g g−1 DW for Control, RN and BN, respectively; Figure 3). For vanillic acid, the great‐
est differences from Control treatments were recorded in the RI_fru, with values of 18.0,
14.7 and 11.0 g g−1 DW for Control, RN and BN, respectively (Figure 3).
Figure 3. Phenolic acid content (µg g−1 dry weight), as determined in pepper fruits from plantssubjected to different N fertilization rates (first column, 0_N: 0 kg N ha−1; second column, 100_N:100 kg N ha−1; third column, 200_N: 200 kg N ha−1) and shade levels (accomplished using: nocover, Control; red photoselective net, RN; black photoselective net, BN) at harvest (83 days aftertransplanting, DAT), in 2017. Light gray chart: green fruits, G_fru; white chart: early-ripening fruits,RI_fru; deep gray chart: red fruits, R_fru. Data are means ± standard errors, over Exp_1 and Exp_2(n = 6).

Horticulturae 2022, 8, 499 13 of 17
4. Discussion
Local varieties, such as the Altino ecotype, are supposed to have traits favorableto sustainable and low-input crop management systems. This work brings some usefulinformation on the adaptation of such landrace to modified environments in terms ofnitrogen and light availability, also involving quality/nutraceutical traits. It is worthpointing out that, even if data on fruit quality and characterization are yet available for thisecotype [5,27], no investigation on yield and antioxidant responses as tolerance mechanismsto cope with the growing environment were accomplished.
Our results exerted a clear effect of both N and light availability—two essential growthfactors—on crop yield, and especially a stronger influence of the quantity and quality ofradiation transmitted to the canopy in terms of nutraceutical traits. We confirmed theprimary role of N in pepper yield [28,29], as it was involved principally in floweringand fruit-setting and, consequently, in terms of fruit number, rather than fruit size. Asevaluated in our previous work [8], the stimulating effect of N in crop vegetation growthtranslated into higher production, as has been extensively observed in various Pepperspp. genotypes [30–32]). We found that 100_N is confirmed to be the N fertilization rate toassure optimal yields [8].
On the other hand, our study demonstrates that, to decrease total yield, it is necessaryto reduce light at the highest levels and that the application of photoselective nets can beusefully adjusted to obtain quality results without affecting crop performances. In addition,it should be remarked that the effects of photoselective net applications depend on: (i) thecolor, type of polymer, weave, porosity and knitting density of the nets, which influencethe quantity and quality of the direct and diffuse radiation under the cover; (ii) species andspecific light requirements. For instance, D’Egidio et al. [33] recorded a slightly enhancedyield of storage roots of red beet grown under a 50% shade net; additionally, Carusoet al. [34] found a yield increase—due to the higher number of produced fruits, under 30%on average—from light extinction. Higher shade levels (up to 79%) induced a markablereduction in the yield of rocket plants [35], while a 36.2% leaf dry weight constrictionwas observed in lettuce plants grown under 85% shade [36]. In our study, we found that,although a 40.4% PAR reduction lowered total fruit production in the Altino ecotype, themarketable yield remained unchanged. Such results found explication in the increasein L and MFW—although at the expense of fruit number, as well as in the reduction ofthe number of unmarketable and, especially, sunscalded fruits—as already observed inother studies [11,37]. The latter represents an enormous advantage for this local variety,characterized by fruit with an upright bearing and that are more sensitive to physiologicaldisorders related to excessive light exposure during fruit development.
The reduction in total fruit number was due to the reduction of fruit set—also ac-companied by a lower seed number per fruit—and to the increase of flower and/or budabortion rates. Pepper normally exhibits high rates of organ abortion due to numerousfactors, especially low light intensity [38,39]. Severe shade is involved in curtain pollengermination and/or tube growth but is more likely in extremely low light environments,and the abscission of nearby organs is associated with the very low assimilation rates ofthe leaves [40,41].
The availability of N and light was investigated due to their key regulatory role forgenes and gene products related to photosynthetic pigments, including carotenoids. Ourprevious study indicates that high N availability stimulates Chl accumulation in Altinoleaves [8] but not in immature fruits. Differently, shaded conditions (e.g., BN treatments; [8])induce high Chl TOT (and Chl A and Chl B) both in leaves and green, immature fruits.High levels of light deficiency also seems to inhibit Car biosynthesis, leading to lowerconcentration in mature pepper fruits, confirming previous works [42,43]. It is known thatchloroplasts are gradually replaced by chromoplasts during fruit ripening, translating intothe replacement of chlorophylls with carotenoids, capsanthin and capsorubin, which givethe pepper fruit a red color [44]. Our work highlights the role of light in increasing theaccumulation of carotenoids and flavonoids (i.e., higher Car in R_fru in Control) and in

Horticulturae 2022, 8, 499 14 of 17
accelerating the degradation of chlorophyll in immature fruits (i.e., lower Chl in G_fru inControl) during ripening [45,46].
Moreover, N and light are also directly involved in secondary metabolism, and theirmodulation could produce significant modifications in the nutraceutical values of har-vested fruits. del Amor et al. [47] found high levels of TPC under relatively limited Nsupply, while other authors highlighted differences in phytochemical content related toan appropriate ammonium–nitrate ratio [48] or to other agricultural practices (organic vs.conventional) [49] or the use of biostimulants [50]. We did not observe any significant differ-ence in terms of total phenolics, flavonoids, Vit C and antioxidant activity as a consequenceto N nutrition management, in any of the stages of fruit ripening, confirming previousworks on both sweet and hot peppers [10,51]. Conversely, we observed a reduction ofTPC and ABTS in green and early-ripened fruits under light scarcity; the effects wereappreciable at the highest shading levels, with no apparent influence of the quality of thetransmitted radiation (e.g., RN treatments with high levels of diffuse radiation, greaterlight absorption around 350–550 nm with respect to the other spectral bands; [8]). Ourresults match with literature bringing out the detrimental effects of the black net on somenutraceutical parameters, i.e., ascorbic acid, total phenolic content, flavonoid content andthe antioxidant scavenging activity of sweet pepper [14]. Medium-low shading levels(RN) seems to also be contradictory towards phenolic acid accumulation (i.e., caffeic, trans-ferulic, 4-hydroxybenzoic and vanillic acids) in the mature fruits of the Altino ecotype,beginning early in ripening (RI_fru).
It is worth pointing out that we identified a higher number of PAs in Altino pepperextract but found relatively low concentrations of both PAs and TPC than those detectedby Della Valle et al. [27]. It was probably related to the extraction methods and to the use ofthe fresh product rather than whole sundried peppers.
In conclusion, this study represents the first attempt to include agronomic practiceswithin sustainable management systems of local varieties, such as the Altino ecotype, toinduce the nutraceutical and/or quality amelioration of marketable yields adding valueto such typical products of Abruzzo Region (Southern Italy). The crop copes with bothlow N and PAR environments through a modification of yield and fruit quality. Low-lightavailability from black net coverage assure less fruit waste, leading to longer and heavierfruits, although with worse nutraceutical traits. The amount of photosynthetically activeradiation necessary to assure adequate quality performance should range between 874and 670 µmol m−2 s−1 (Control and RN, respectively). Further studies, involving nets ofdifferent colors (i.e., pearl nets), could find a justification based on the limited effect of RNon all the investigated variables, as well as on the literature results encouraging the useof photoselective covers thanks to the positive effects on the harvest and post-harvest ofmany horticultural crops, including sweet pepper.
Nutrition is confirmed to be essential to obtaining adequate yields in pepper—with100 kg N ha−1 being the rate to reach adequate production standards—and further effortsshould be directed to the in-depth study of fertilization rates and forms (both for macro andmicronutrients), including biological formulations, that could be suitable for this peppergenotype (i.e., local variety, lack of a formal crop improvement).
Lastly, two cycles of phenotypic selection were enough to characterize and stabilizethe Altino ecotype for its uniformity (please refer to Stagnari et al. [8] for further explana-tions), as confirmed by the insignificant differences that emerged between the two selectedgenotypes used in the two experiments.
Author Contributions: Conceptualization, F.S., A.G. and N.F.; methodology, F.S. and A.G.; formalanalysis, A.C.M., C.P. and M.A.D.; investigation, F.S. and A.G.; resources, N.F.; data curation, A.G.and N.F.; writing—original draft preparation, A.G.; writing—review and editing, F.S. and N.F.;funding acquisition, A.G. and N.F. All authors have read and agreed to the published version ofthe manuscript.

Horticulturae 2022, 8, 499 15 of 17
Funding: This research is a part of the “Programma triennale 2020–2022 per la conservazione, carat-terizzazione, uso e valorizzazione delle risorse genetiche vegetali per l’alimentazione e l’agricoltura—Recupero, conservazione e valorizzazione di specie orticole, floricole e aromatiche—acronimoRGV/ORFLORA”—Ente finanziatore: MiPAAF (Ministero delle politiche agricole alimentari eforestali). Processing Charge was covered by “PEPALT_2”.
Institutional Review Board Statement: Not applicable.
Informed Consent Statement: Not applicable.
Conflicts of Interest: The authors declare no conflict of interest. The funders had no role in the designof the study; in the collection, analyses, or interpretation of data; in the writing of the manuscript, orin the decision to publish the results.
References1. Camacho-Villa, T.C.; Maxted, N.; Scholten, M.; Ford-Lloyd, B. Defining and identifying crop landraces. Plant Genet. Resour.
Characterisation Util. 2005, 3, 373–384. [CrossRef]2. Azeez, M.A.; Adubi, A.O.; Durodola, F.A. Landraces and crop genetic improvement. In Rediscovery of Landraces as a Resource for
the Future; IntechOpen: London, UK, 2008.3. Fratianni, F.; Cozzolino, A.; d’Acierno, A.; Nazzaro, F.; Riccardi, R.; Spigno, P. Qualitative aspects of some of some traditional
landraces of the tomato “Piennolo” (Solanum lycopersicum L.) of the Campania region, southern Italy. Antioxidants 2020, 9, 565.[CrossRef] [PubMed]
4. Portis, E.; Nervo, G.; Cavallanti, F.; Barchi, L.; Lanteri, S. Multivariate analysis of genetic relationships between Italian pepperlandraces. Crop Sci. 2006, 46, 2517–2525. [CrossRef]
5. Reale, S.; Biancolillo, A.; Gasparrini, C.; Martino, L.D.; Cecco, V.D.; Manzi, A.; Santo, M.D.; D’Archivio, A.A. Geographicaldiscrimination of bell pepper (Capsicum annuum) spices by (HS)-SPME/GC-MS aroma profiling and chemometrics. Molecules2021, 26, 6177. [CrossRef] [PubMed]
6. Lyon, A.; Tracy, W.; Colley, M.; Culbert, P.; Mazourek, M.; Myers, J.; Zystro, J.; Silva, E.M. Adaptability analysis in a participatoryvariety trial of organic vegetable crops. Renew. Agric. Food Syst. 2020, 35, 296–312. [CrossRef]
7. Berni, R.; Cantini, C.; Romi, M.; Hausman, J.F.; Guerriero, G.; Cai, G. Agrobiotechnology goes wild: Ancient local varieties assources of bioactives. Int. J. Mol. Sci. 2018, 19, 2248. [CrossRef]
8. Stagnari, F.; Campanelli, G.; Galieni, A.; Platani, C.; Bertone, A.; Ficcadenti, N. Adaptive Responses to Nitrogen and LightSupplies of a Local Varieties of Sweet Pepper from the Abruzzo Region, Southern Italy. Agronomy 2021, 11, 1343. [CrossRef]
9. Rodríguez, A.; Peña-Fleitas, M.T.; Gallardo, M.; Souza, R.D.; Padilla, F.M.; Thompson, R.B. Sweet pepper and nitrogen supply ingreenhouse production: Critical nitrogen curve, agronomic responses and risk of nitrogen loss. Eur. J. Agron. 2020, 117, 126046.[CrossRef]
10. Yasuor, H.; Ben-Gal, A.; Yermiyahu, U.; Beit-Yannai, E.; Cohen, S. Nitrogen management of greenhouse pepper production:Agronomic, nutritional, and environmental implications. HortScience 2013, 48, 1241–1249. [CrossRef]
11. Ilic, Z.S.; Milenkovic, L.; Šunic, L.; Barac, S.; Mastilovic, J.; Kevrešan, Ž.; Fallik, E. Effect of shading by coloured nets on yield andfruit quality of sweet pepper. Zemdirbyste 2017, 104, 53–62. [CrossRef]
12. Ilic, Z.S.; Milenkovic, L.; Šunic, L.; Manojlovic, M. Color shade nets improve vegetables quality at harvest and maintain qualityduring storage. Contemp. Agric. 2018, 67, 9–19. [CrossRef]
13. Sivakumar, D.; Jifon, J.; Soundy, P. Spectral quality of photo-selective shade nettings improves antioxidants and overall quality inselected fresh produce after postharvest storage. Food Rev. Int. 2018, 34, 290–307. [CrossRef]
14. Mashabela, M.N.; Selahle, K.M.; Soundy, P.; Crosby, K.M.; Sivakumar, D. Bioactive compounds and fruit quality of green sweetpepper grown under different colored shade netting during postharvest storage. J. Food Sci. 2015, 80, 2612–2618. [CrossRef][PubMed]
15. Selahle, K.M.; Sivakumar, D.; Jifon, J.; Soundy, P. Postharvest responses of red and yellow sweet peppers grown under photo-selective nets. Food Chem. 2015, 173, 951–956. [CrossRef]
16. Amarante, C.V.T.D.; Steffens, C.A.; Argenta, L.C. Yield and fruit quality of ‘Gala’and ‘Fuji’apple trees protected by white anti-hailnet. Sci. Hortic. Amst. 2011, 129, 79–85. [CrossRef]
17. Shahak, Y.; Gal, E.; Offir, Y.; Ben-Yakir, D. Photoselective Shade Netting Integrated with Greenhouse Technologies for improvedperformance of Vegetable and Ornamental Crops. In Proceedings of the International Workshop on Greenhouse EnvironmentalControl and Crop Production in Semi-Arid Regions, Tucson, AZ, USA, 20–24 October 2008; pp. 75–80.
18. Lichtenthaler, H.K.; Buschmann, C. Extraction of photosynthetic tissues: Chlorophylls and carotenoids. Curr. Protoc. Food Anal.Chem. 2001, 1, F4.2.1–F4.2.6. [CrossRef]
19. Gouveia, S.; Castilho, P.C. Helichrysum monizii Lowe: Phenolic composition and antioxidant potential. Phytochem. Analysis 2012,23, 72–83. [CrossRef]
20. Gouveia, S.; Castilho, P.C. Antioxidant potential of Artemisia argentea L’Hér alcoholic extract and its relation with the phenoliccomposition. Food Res. Int. 2012, 44, 1620–1631. [CrossRef]

Horticulturae 2022, 8, 499 16 of 17
21. Re, R.; Pellegrini, N.; Proteggente, A.; Pannala, A.; Yang, M.; Rice-Evans, C. Antioxidant activity applying an improved ABTSradical cation decolorization assay. Free Radic. Biol. Med. 1999, 26, 1231–1237. [CrossRef]
22. Gouveia, S.; Castilho, P.C. Phenolic composition and antioxidant capacity of cultivated artichoke, Madeira cardoon and artichoke-based dietary supplements. Food Res. Int. 2012, 48, 712–724. [CrossRef]
23. Ghasemnezhad, M.; Sherafati, M.; Payvast, G.A. Variation in phenolic compounds, ascorbic acid and antioxidant activity of fivecoloured bell pepper (Capsicum annum) fruits at two different harvest times. J. Funct. Foods 2011, 3, 44–49. [CrossRef]
24. Zhang, L.; Li, Y.; Liang, Y.; Liang, K.; Zhang, F.; Xu, T.; Wang, M.; Song, H.; Liu, X.; Lu, B. Determination of phenolic acid profilesby HPLC-MS in vegetables commonly consumed in China. Food Chem. 2019, 276, 538–546. [CrossRef] [PubMed]
25. Benincasa, P.; Galieni, A.; Manetta, A.C.; Pace, R.; Guiducci, M.; Pisante, M.; Stagnari, F. Phenolic compounds in grains, sproutsand wheatgrass of hulled and non-hulled wheat species. J. Sci. Food Agric. 2015, 95, 1795–1803. [CrossRef] [PubMed]
26. R Core Team. R: A Language and Environment of Statistical Computing; R Foundation for Statistical Computing: Vienna, Austria, 2017.27. Valle, A.D.; Dimmito, M.P.; Zengin, G.; Pieretti, S.; Mollica, A.; Locatelli, M.; Cichelli, A.; Novellino, E.; Ak, G.; Yerlikaya, S.; et al.
Exploring the nutraceutical potential of dried pepper Capsicum annuum L. on market from Altino in Abruzzo region. Antioxidants2020, 9, 400. [CrossRef]
28. Silva, J.M.D.; Fontes, P.C.R.; Milagres, C.D.C.; Garcia, E., Jr. Application of proximal optical sensors to assess nitrogen status andyield of bell pepper grown in slab. J. Soil Sci. Plant Nutr. 2021, 21, 229–237. [CrossRef]
29. Hassan, S.M.; El-Bebany, A.F.; Salem, M.Z.; Komeil, D.A. Productivity and post-harvest fungal resistance of hot pepper as affectedby potassium silicate, clove extract foliar spray and nitrogen application. Plants 2021, 10, 662. [CrossRef]
30. Ayodele, O.J.; Alabi, E.O.; Aluko, M. Nitrogen fertilizer effects on growth, yield and chemical composition of hot pepper (Rodo).Int. J. Agri. Crop Sci. 2015, 8, 666.
31. Jovicich, E.D.; Cantiffe, J.; Stoffella, P.J.; Vansickle, J.J. Reduced fertigation of soil-less greenhouse peppers improves fruit yieldand quality. Acta Hortic. 2003, 609, 193–199. [CrossRef]
32. Medina-Lara, F.; Echevarria-Machado, I.; Pacheco-Arjona, R.; Ruiz-Lau, N.; Guzman-Antonio, A.; Martinez-Estevez, M. Influenceof nitrogen and potassium fertilization on fruiting and capsaicin content of habanero pepper (Capsicum chinense Jacq). HortScience2008, 43, 1549–1554. [CrossRef]
33. D’Egidio, S.; Galieni, A.; Stagnari, F.; Pagnani, G.; Pisante, M. Yield, quality and physiological traits of red beet under differentmagnesium nutrition and light intensity levels. Agronomy 2019, 9, 379. [CrossRef]
34. Caruso, G.; Cozzolino, E.; Cuciniello, A.; Maiello, R.; Cenvinzo, V.; Giordano, M.; Pascale, S.D.; Rouphael, Y. Yield and quality ofgreenhouse organic pepper as affected by shading net in Mediterranean area. Acta Hortic. 2020, 1268, 335–340. [CrossRef]
35. Caruso, G.; Formisano, L.; Cozzolino, E.; Pannico, A.; El-Nakhel, C.; Rouphael, Y.; Tallarita, A.; Cenvinzo, V.; Pascale, S.D. Shadingaffects yield, elemental composition and antioxidants of perennial wall rocket crops grown from spring to summer in southernItaly. Plants 2020, 9, 933. [CrossRef] [PubMed]
36. Galieni, A.; Stagnari, F.; Speca, S.; Pisante, M. Leaf traits as indicators of limiting growing conditions for lettuce (Lactuca sativa).Ann. Appl. Biol. 2016, 169, 342–356. [CrossRef]
37. Díaz-Pérez, J.C. Bell pepper (Capsicum annum L.) crop as affected by shade level: Fruit yield, quality, and postharvest attributes,and incidence of phytophthora blight (caused by Phytophthora capsici Leon.). HortScience 2014, 49, 891–900. [CrossRef]
38. Aloni, B.; Karni, L.; Zaidman, Z.; Schaffer, A.A. Changes of carbohydrates in pepper (Capsicum annuum L.) flowers in relation totheir abscission under different shading regimes. Ann. Bot. 1996, 78, 163–168. [CrossRef]
39. Shifriss, C.; Pilowsky, M.; Aloni, B. Variation in flower abscission of peppers under stress shading conditions. Euphytica 1994, 78,133–136. [CrossRef]
40. Joshi, N.C.; Ratner, K.; Eidelman, O.; Bednarczyk, D.; Zur, N.; Many, Y.; Shahak, Y.; Aviv-Sharon, E.; Achiam, M.; Gilad, Z.;et al. Effects of daytime intra-canopy LED illumination on photosynthesis and productivity of bell pepper grown in protectedcultivation. Sci. Hortic. 2019, 250, 81–88. [CrossRef]
41. González-Real, M.M.; Liu, H.Q.; Baille, A. Influence of fruit sink strength on the distribution of leaf photosynthetic traits infruit-bearing shoots of pepper plants (Capsicum annuum L.). Environ. Exp. Bot. 2009, 66, 195–202. [CrossRef]
42. Yoo, H.J.; Kim, J.H.; Park, K.S.; Son, J.E.; Lee, J.M. Light-controlled fruit pigmentation and flavor volatiles in tomato and bellpepper. Antioxidants 2019, 9, 14. [CrossRef]
43. Keyhaninejad, N.; Richins, R.D.; O’Connell, M.A. Carotenoid content in field-grown versus greenhouse-grown peppers: Differentresponses in leaf and fruit. HortSci 2012, 47, 852–855. [CrossRef]
44. Filyushin, M.A.; Dzhos, E.A.; Shchennikova, A.V.; Kochieva, E.Z. Dependence of pepper fruit colour on basic pigments ratio andexpression pattern of carotenoid and anthocyanin biosynthesis genes. Russ. J. Plant Physiol. 2020, 67, 1054–1062. [CrossRef]
45. Pizarro, L.; Stange, C. Light-dependent regulation of carotenoid biosynthesis in plants. Cienc. Investig. Agrar. 2009, 36, 143–161.[CrossRef]
46. Zoratti, L.; Karppinen, K.; Escobar, A.L.; Haggman, H.; Jaakola, L. Light-controlled flavonoid biosynthesis in fruits. Front. PlantSci. 2014, 5, 534. [CrossRef] [PubMed]
47. Amor, F.M.D.; Serrano-Martinez, A.; Fortea, M.I.; Legua, P.; Núñez-Delicado, E. The effect of plant-associative bacteria (Azospiril-lum and Pantoea) on the fruit quality of sweet pepper under limited nitrogen supply. Sci. Hortic. 2008, 117, 191–196. [CrossRef]
48. Zhang, J.; Lv, J.; Dawuda, M.M.; Xie, J.; Yu, J.; Li, J.; Zhang, X.; Tang, C.; Wang, C.; Gan, Y. Appropriate ammonium-nitrate ratioimproves nutrient accumulation and fruit quality in pepper (Capsicum annuum L.). Agronomy 2019, 9, 683. [CrossRef]

Horticulturae 2022, 8, 499 17 of 17
49. Pérez-López, A.J.; Amor, F.M.D.; Serrano-Martínez, A.; Fortea, M.I.; Núñez-Delicado, E. Influence of agricultural practices on thequality of sweet pepper fruits as affected by the maturity stage. J. Sci. Food Agric. 2007, 87, 2075–2080. [CrossRef]
50. Ghoname, A.A.; Dawood, M.G.; Riad, G.S.; El-Tohamy, W.A. Effect of nitrogen forms and biostimulants foliar application on thegrowth, yield and chemical composition of hot pepper grown under sandy soil conditions. Res. J. Agric. Biol. Sci. 2009, 5, 840–852.
51. Nunez-Ramirez, F.; González-Mendoza, D.; Grimaldo-Juarez, O.; Díaz, L.C. Nitrogen fertilization effect on antioxidants com-pounds in fruits of habanero chili pepper (Capsicum chinense). Int. J. Agric. Biol. 2011, 13, 827–830.