Chili Pepper AN2 (CaAN2): A Visible Selection Marker for ...
Upload
khangminh22Category
view
1download
0
Online ISSN : 2245-4626Print ISSN : 0975-5896
Volume 12 | Issue 1 | Version 1.0
Evaluation for Pepper Production Analysis of Household Demand
Assessment of Militancy Activities
Waterside Local Government

Global Journal of Science Frontier Research: D Agriculture & Biology
Global Journal of Science Frontier Research: D
Agriculture & Biology Volume 12 Issue 1 (Ver. 1.0)
Open Association of Research Society

Global Journals Inc. (A Delaware USA Incorporation with “Good Standing”; Reg. Number: 0423089) Sponsors: Open Scientific Standards
Publisher’s Headquarters office
Global Journals Inc., Headquarters Corporate Office, Cambridge Office Center, II Canal Park, Floor No. 5th, Cambridge (Massachusetts), Pin: MA 02141 United States USA Toll Free: +001-888-839-7392 USA Toll Free Fax: +001-888-839-7392
Offset Typesetting
Packaging & Continental Dispatching Global Journals, India Find a correspondence nodal officer near you To find nodal officer of your country, please email us at [email protected]
eContacts Press Inquiries: [email protected] Investor Inquiries: [email protected] Technical Support: [email protected] Media & Releases: [email protected] Pricing (Including by Air Parcel Charges): For Authors: 22 USD (B/W) & 50 USD (Color) Yearly Subscription (Personal & Institutional): 200 USD (B/W) & 250 USD (Color)
© Global Journal of Science
All rights reserved.
This is a special issue published in version 1.0 of “Global Journal of Science Frontier
Research.” By Global Journals Inc.
All articles are open access articles distributed under “Global Journal of Science Frontier
Research”
Reading License, which permits restricted use. Entire contents are copyright by of “Global
Journal of Science Frontier Research” unless otherwise noted on specific articles.
No part of this publication may be reproduced or transmitted in any form or by any means,
electronic or mechanical, including photocopy, recording, or any information
storage and retrieval system, without written permission.
The opinions and statements made in this book are those of the authors concerned. Ultraculture has not verified and neither
confirms nor denies any of the foregoing and no warranty or fitness is implied.
Engage with the contents herein at your own risk.
The use of this journal, and the terms and conditions for our providing information, is
governed by our Disclaimer, Terms and Conditions and Privacy Policy given on our
By referring / using / reading / any type of association / referencing this journal, this
signifies and you acknowledge that you have read them and that you accept and will be
bound by the terms thereof.
All information, journals, this journal, activities undertaken, materials, services and our website, terms and conditions, privacy policy, and this journal is subject to change
anytime without any prior notice.
Incorporation No.: 0423089 License No.: 42125/022010/1186
Registration No.: 430374 Import-Export Code: 1109007027
Employer Identification Number (EIN): USA Tax ID: 98-0673427
Rainham, Essex, London RM13 8EUUnited Kingdom.
Open Association of Research Society, Marsh Road,
Open Association of Research Society
website http://globaljournals.us/terms-and-condition/menu-id-1463/
Frontier Research .2012 .
John A. Hamilton,"Drew" Jr., Ph.D., Professor, Management Computer Science and Software Engineering Director, Information Assurance Laboratory Auburn University
Dr. Wenying Feng Professor, Department of Computing & Information Systems Department of Mathematics Trent University, Peterborough, ON Canada K9J 7B8
Dr. Henry Hexmoor IEEE senior member since 2004 Ph.D. Computer Science, University at Buffalo Department of Computer Science Southern Illinois University at Carbondale
Dr. Thomas Wischgoll Computer Science and Engineering, Wright State University, Dayton, Ohio B.S., M.S., Ph.D. (University of Kaiserslautern)
Dr. Osman Balci, Professor Department of Computer Science Virginia Tech, Virginia University Ph.D.and M.S.Syracuse University, Syracuse, New York M.S. and B.S. Bogazici University, Istanbul, Turkey
Dr. Abdurrahman Arslanyilmaz Computer Science & Information Systems Department Youngstown State University Ph.D., Texas A&M University University of Missouri, Columbia Gazi University, Turkey
Yogita Bajpai M.Sc. (Computer Science), FICCT U.S.A.Email: [email protected]
Dr. Xiaohong He Professor of International Business University of Quinnipiac BS, Jilin Institute of Technology; MA, MS, PhD,. (University of Texas-Dallas)
Dr. T. David A. Forbes Associate Professor and Range Nutritionist Ph.D. Edinburgh University - Animal Nutrition M.S. Aberdeen University - Animal Nutrition B.A. University of Dublin- Zoology
Burcin Becerik-Gerber University of Southern California Ph.D. in Civil Engineering DDes from Harvard University M.S. from University of California, Berkeley & Istanbul University
Editorial Board Members (HON.)

Dr. Bart Lambrecht Director of Research in Accounting and FinanceProfessor of Finance Lancaster University Management School BA (Antwerp); MPhil, MA, PhD (Cambridge)
Dr. Söhnke M. Bartram Department of Accounting and FinanceLancaster University Management SchoolPh.D. (WHU Koblenz) MBA/BBA (University of Saarbrücken)
Dr. Carlos García Pont Associate Professor of Marketing IESE Business School, University of Navarra Doctor of Philosophy (Management), Massachusetts Institute of Technology (MIT) Master in Business Administration, IESE, University of Navarra Degree in Industrial Engineering, Universitat Politècnica de Catalunya
Dr. Miguel Angel Ariño Professor of Decision Sciences IESE Business School Barcelona, Spain (Universidad de Navarra) CEIBS (China Europe International Business School). Beijing, Shanghai and Shenzhen Ph.D. in Mathematics University of Barcelona BA in Mathematics (Licenciatura) University of Barcelona
Dr. Fotini Labropulu Mathematics - Luther College University of ReginaPh.D., M.Sc. in Mathematics B.A. (Honors) in Mathematics University of Windso
Philip G. Moscoso Technology and Operations Management IESE Business School, University of Navarra Ph.D in Industrial Engineering and Management, ETH Zurich M.Sc. in Chemical Engineering, ETH Zurich
Dr. Lynn Lim Reader in Business and Marketing Roehampton University, London BCom, PGDip, MBA (Distinction), PhD, FHEA
Dr. Sanjay Dixit, M.D. Director, EP Laboratories, Philadelphia VA Medical Center Cardiovascular Medicine - Cardiac Arrhythmia Univ of Penn School of Medicine
Dr. Mihaly Mezei ASSOCIATE PROFESSOR Department of Structural and Chemical Biology, Mount Sinai School of Medical Center Ph.D., Etvs Lornd University Postdoctoral Training, New York University
Dr. Han-Xiang Deng MD., Ph.D Associate Professor and Research Department Division of Neuromuscular Medicine Davee Department of Neurology and Clinical NeuroscienceNorthwestern University Feinberg School of Medicine

Dr. Pina C. Sanelli Associate Professor of Public Health Weill Cornell Medical College Associate Attending Radiologist NewYork-Presbyterian Hospital MRI, MRA, CT, and CTA Neuroradiology and Diagnostic Radiology M.D., State University of New York at Buffalo,School of Medicine and Biomedical Sciences
Dr. Roberto Sanchez Associate Professor Department of Structural and Chemical Biology Mount Sinai School of Medicine Ph.D., The Rockefeller University Dr. Wen-Yih Sun Professor of Earth and Atmospheric SciencesPurdue University Director National Center for Typhoon and Flooding Research, Taiwan University Chair Professor Department of Atmospheric Sciences, National Central University, Chung-Li, TaiwanUniversity Chair Professor Institute of Environmental Engineering, National Chiao Tung University, Hsin-chu, Taiwan.Ph.D., MS The University of Chicago, Geophysical Sciences BS National Taiwan University, Atmospheric Sciences Associate Professor of Radiology
Dr. Michael R. Rudnick
M.D., FACP Associate Professor of Medicine Chief, Renal Electrolyte and Hypertension Division (PMC) Penn Medicine, University of Pennsylvania Presbyterian Medical Center, Philadelphia Nephrology and Internal Medicine Certified by the American Board of Internal Medicine
Dr. Bassey Benjamin Esu
B.Sc. Marketing; MBA Marketing; Ph.D Marketing Lecturer, Department of Marketing, University of Calabar Tourism Consultant, Cross River State Tourism Development Department Co-ordinator , Sustainable Tourism Initiative, Calabar, Nigeria
Dr. Aziz M. Barbar, Ph.D. IEEE Senior Member Chairperson, Department of Computer Science AUST - American University of Science & Technology Alfred Naccash Avenue – Ashrafieh
Dr. George Perry, (Neuroscientist) Dean and Professor, College of Sciences
Denham Harman Research Award (American Aging Association)
ISI Highly Cited Researcher, Iberoamerican Molecular Biology Organization
AAAS Fellow, Correspondent Member of Spanish Royal Academy of Sciences
University of Texas at San Antonio
Postdoctoral Fellow (Department of Cell Biology)
Baylor College of Medicine
Houston, Texas, United States
Dr. R.K. Dixit M.Sc., Ph.D., FICCT Chief Author, India Email: [email protected]
Vivek Dubey(HON.)
MS (Industrial Engineering),
MS (Mechanical Engineering)
University of Wisconsin, FICCT
Editor-in-Chief, USA
Er. Suyog Dixit
(M. Tech), BE (HONS. in CSE), FICCT SAP Certified Consultant CEO at IOSRD, GAOR & OSS Technical Dean, Global Journals Inc. (US) Website: www.suyogdixit.com Email:[email protected] Pritesh Rajvaidya (MS) Computer Science Department California State University BE (Computer Science), FICCT Technical Dean, USA Email: [email protected]
Sangita Dixit M.Sc., FICCT Dean & Chancellor (Asia Pacific) [email protected]
Luis Galárraga J!Research Project Leader Saarbrücken, Germany
President Editor (HON.)
Chief Author (HON.)
Dean & Editor-in-Chief (HON.)
Contents of the Volume
i. Copyright Notice ii. Editorial Board Members iii. Chief Author and Dean iv. Table of Contents v. From the Chief Editor’s Desk vi. Research and Review Papers
1. Yield - Crop Water Use (Cwu) Evaluation For Pepper Production Under
Irrigated Cultivation In Akure, Nigeria. 1-8 2. Determinant of Land Management Practices among Crop Farmers in South-
Western Nigeria. 9-14 3. Analysis of Household Demand for Meat, in Southwest, Nigeria. 15-21 4. Economic Analysis Of Rural Women Income From Non-Timber Forest
Products In Ife South Local Government Area Of Osun State, Nigeria. 23-31 5. Assessment of Militancy Activities on Rural Dwellers in Delta State, Nigeria.
33-42 6. Evaluation Of Fishermen And Fish Traders In Transactional Sex For Fish
Marketing In Coastal Areas Of Ogun Waterside Local Government Area, Ogun State, Nigeria . 43-53
7. Physiological Performance Of Different Durum Wheat Varieties Grown Under Rainfed Conditio n. 55-63
vii.
Auxiliary Memberships
viii.
Process
of Submission of Research Paper
ix.
Preferred Author Guidelines
x.
Index
8. Effects of phosphorus on biological nitrogen fixation in soybean under irrigation using saline water. 65-72
© 2012 . Olotu Yahaya, Femi Alao, Odighi Cletus J .This is a research/review paper, distributed under the terms of the Creative Commons Attribution-Noncommercial 3.0 Unported License http://creativecommons.org/licenses/by-nc/3.0/), permitting all non commercial use, distribution, and reproduction in any medium, provided the original work is properly cited.
Global Journal of Science Frontier Research Agriculture & Biology Volume 12 Issue 1 Version 1.0 January 2012 Type : Double Blind Peer Reviewed International Research Journal Publisher: Global Journals Inc. (USA) Online ISSN: 2249-4626 & Print ISSN: 0975-5896
Yield-Crop Water Use (Cwu) Evaluation For Pepper Production Under Irrigated Cultivation In Akure, Nigeria
By Olotu Yahaya, Femi Alao, Odighi Cletus J Federal University of Technology, Akure, Nigeria
Abstract - Three treatments of water application on NHVIA pepper were carried out at Department of Agricultural Engineering Teaching and Research Farm, Federal University of Technology, Akure, Nigeria. The study was conducted during the dry seasons of 2008 and 2009 respectively in order to determine the growth, yield; and evaluate water use of pepper. Relationship between crop water use and yield produced from pepper grown under micro- sprinkler irrigation system was established. NHV1A variety of pepper was nursed for six weeks and transplanted. It was subjected to three treatments based on 50% water requirement (WR) of pepper as low (treatment 1, T1), 75% WR as medium (T2) and 100% WR as high (T3) irrigation systems. Water applications were carried 3-day interval, volume of water applied in each treatment was technically monitored. Water balance parameters such as Soil Moisture Content (SMC) and evapotranspiration were measured using tensiometer and Water Balance Equation respectively. Agronomic parameters such as plant height stem diameter, fruit width, length, root depth, leaf area and leaf area index were measured on weekly interval. It was observed that T3 recorded highest yield of 20.101 ton/ha in 2008 and 21.062 ton/ha in 2009 seasons, while T1 with minimum yield of 14.886 ton/ha and 15.260 ton/ha for the two seasons, respectively. In addition, T3 recorded maximum crop water use of 821.07 mm in 2008 and 833.61 mm in 2009 seasons, respectively.
Keywords : Water requirement, water, pepper, yield, irrigation, parameter, leaf, interval, NHVIA pepper, season.
Yield-Crop Water Use Cwu Evaluation For Pepper Production Under Irrigated Cultivation In Akure, Nigeria Strictly as per the compliance and regulations of:
GJSFR-D Classification : FOR Code: 079901
Yield-Crop Water Use (Cwu) Evaluation For Pepper Production Under Irrigated Cultivation In
Akure, Nigeria Olotu Yahayaα, Femi AlaoΩ, Odighi Cletus Jβ
Abstract - Three treatments of water application on NHVIA pepper were carried out at Department of Agricultural Engineering Teaching and Research Farm, Federal University of Technology, Akure, Nigeria. The study was conducted during the dry seasons of 2008 and 2009 respectively in order to determine the growth, yield; and evaluate water use of pepper. Relationship between crop water use and yield produced from pepper grown under micro- sprinkler irrigation system was established. NHV1A variety of pepper was nursed for six weeks and transplanted. It was subjected to three treatments based on 50% water requirement (WR) of pepper as low (treatment 1, T1), 75% WR as medium (T2) and 100% WR as high (T3) irrigation systems. Water applications were carried 3-day interval, volume of water applied in each treatment was technically monitored. Water balance parameters such as Soil Moisture Content (SMC) and evapotranspiration were measured using tensiometer and Water Balance Equation respectively. Agronomic parameters such as plant height stem diameter, fruit width, length, root depth, leaf area and leaf area index were measured on weekly interval. It was observed that T3 recorded highest yield of 20.101 ton/ha in 2008 and 21.062 ton/ha in 2009 seasons, while T1 with minimum yield of 14.886 ton/ha and 15.260 ton/ha for the two seasons, respectively. In addition, T3 recorded maximum crop water use of 821.07 mm in 2008 and 833.61 mm in 2009 seasons, respectively. Keywords : Water requirement, water, pepper, yield, irrigation, parameter, leaf, interval, NHVIA pepper, season.
I. INTRODUCTION
eppers (Capsicum annuum L.) belongs to the family Solanaceae, which is an important group of vegetables cultivated extensively in Pakistan and
also widely cultivated in almost every country of the world (Channabasavanna and Setty, 2000). It thrives best in warm climate, where frost is not a problem during the growing seasons. In general, it requires temperatures ranging from 25-35oC (Olalla and Valero, 1994). Peppers thrive in a wide range of soil types, but good drainage is essential. The soil should be worked over to break up large clods and any hardpan that prevents good drainage. A soil pH of 5.5 –7.0 is
Author α β:
Department of Agricultural Engineering, Auchi Polytechnic,
Auchi, Nigeria . Corresponding author: [email protected]
Author Ω : Department of Agricultural Engineering, Federal University
of Technology,
Akure, Nigeria.
desirable. Green peppers are less sweet and slightly bitter than yellow, orange, purple or red peppers. The taste of ripe peppers can also vary with growing conditions and post-harvest storage treatment. Green pepper is widely grown in the Northern parts of Nigeria as a result of its uses and application which in turns increases demand and consumption of the vegetable. However, the vegetable is considered as medicinal plant in some parts of Nigeria. All these values have led to developing technically-based precision farming of green pepper so as to boost the production in order to match its increasing demand.
Consumption water use of pepper must be accurately maintained for its growth, development and yield. This could be achieved by uniform water application. Irrigation is an artificial application of water to the soil. It is applied to assist in the growing of agricultural crops, maintenance of landscapes and re-vegetation of disturbed soils in dry areas and during periods of inadequate rainfall. Irrigation also has a few other uses in crop production, which include protecting plants against frost (Snyder and Melo-Abreu, 2005), suppressing weed growing in grain fields (Williams et al, 2007) and helping in preventing soil consolidation. Various types of irrigation techniques differ on how the water obtained from the source is distributed within the field, irrigation design mechanism, cost and technicalities.
Sprinkler irrigation systems are increasingly being used in crop production in South-West of Nigeria. Sprinkler irrigation systems apply water directly to the surface of the crop as well as the soil around the roots of the crop. Studies have shown that sprinkler irrigation systems reduce the water use of crop by about 50% compared to that under seepage system (Pitts and Clark, 1991). Due to efficiency and maintainability of sprinkler irrigation, it is therefore considered as method of water application for the purpose of this research study which focuses on determining the growth, development and yield response of green pepper cultivated under monitored sprinkler irrigation system.
P
Globa
lJo
urna
lof
Scienc
eFr
ontier
Resea
rch
V
olum
e
1
()
Janu
ary
2012
D
© 2012 Global Journals Inc. (US)
XII
Issu
e er
sion
IV
I
II.
MATERIALS AND METHODS
a) Study Area
The study was carried out at the Research Farm of the Department of Agricultural Engineering, Federal University of Technology, Akure, Nigeria. Akure is located within the humid region of Nigeria on latitude 7o16’N; longitude 5o13’E. The field experiment was conducted during 2007/08 and 2008/2009 dry seasons respectively. The physical and chemical properties of the soil were determined. The experimental design was a Randomized Complete Block Design (RCBD) with three treatments and three replicates. The experimental plots were divided into 9 plots of 2 m by 2 m each. Each treatment was subjected to different water application of 50% Water Requirements (WR) as Low, 75%WR as Medium, and 100% WR as High irrigations.
b) The Crop
A variety of Pepper (Capsicum annuum L.),
NHV1A, of drought resistance,
was obtained from the
National Institute of Horticulture (NIHORT), Ibadan to ensure the viability of the seeds used. Pepper seeds used were nursed at the farm site.
c) Water Supply at the Experimental Site
The water supply to the experimental site was mainly from a hand dug well located at about 50 m distance from the experimental plot. The water source
has adequate water that could meet the irrigation water demand of the crop under study.
d) Experimental Design
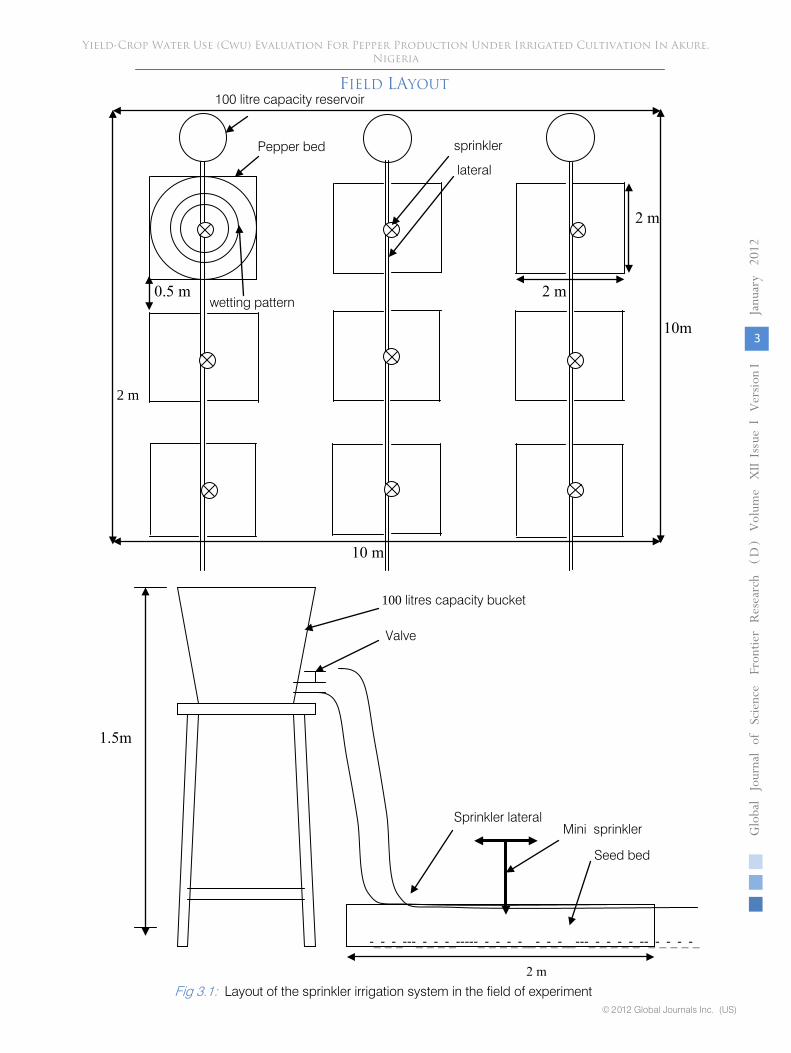
Plot (10 m x 60 m) portion of the farm site was prepared for effective seed bed formation and (10 m x 10 m) part of the prepared land was divided into nine seed beds (micro-sprinkler plots), 2.0 m long, 2.0 m wide and 0.15 m deep and leaving 0.5 m spacing between beds. The micro-sprinklers were installed at the centers of the nine 2.0 m x 2.0 m plots. There were three treatments replicated three
times in a randomized
complete block design. Each treatment plot was connected to separate supplies (0.1 m3
capacity
reservoirs) placed adjacent to each of the beds at uniform pressure head of 1.5 m as shown in Figure 3.1. Treatments were based on different percentage of water requirements (WR) of pepper as 50% WR, 75% WR, and 100% WR. Irrigations were carried out at three-
day
intervals and the volume of water applied in each treatment was monitored. Rainfalls were measured during the experiment with the
aid of automated
rainguage. Pepper seeds were transplanted manually at a spacing of 45 cm x 60 cm between stands after having been nursed on seedbeds for six weeks. Water application rates (A) from sprinkler into the catch cans
were determined using the following relationship (Michael and Ojha, 2003):
3.1
A = Application rate mm/hr
Q=
Sprinkler discharge, l/min, determined from the volume of water applied divided by the period of application
a = Wetted area of sprinkler; m2
(surface area of can)
(3.01 x10⁻³m2)
K = Unit constant (K=60.0 for A in mm/hr, Q in l/min and
a in m2), at a constant pressure head.
The uniformity coefficient of the sprinkler system was determined to ascertain the efficiency of the uniformity in the sprinkling of water using the Christiansen’s formula (Michael and Ojha, 2003).
−−= ∑
nxxx
C iu 1100
3.2
where
Cu =
Christiansen’s uniformity coefficient, percent;
n = number of collecting cans placed on the bed;
xi = water measurement in the ith collecting can
(I = 1,2,…..,n);
x
=
mean of n measurements in the area under consideration;
∑ ix -
x =
sum of absolute deviations from the mean
measurement.
aKQAratenApplicatio =)(
Yield-Crop Water Use (Cwu) Evaluation For Pepper Production Under Irrigated Cultivation In Akure, Nigeria
Globa
lJo
urna
lof
Scienc
eFr
ontier
Resea
rch
V
olum
e
2
()
Janu
ary
2012
D
© 2012 Global Journals Inc. (US)
XII
Issu
e er
sion
IV
I
FIELD LAYOUT 100 litre capacity reservoir
Pepper bed
sprinkler
lateral
2 m
wetting pattern
100 litres capacity bucket
Valve
Sprinkler lateral
Mini sprinkler
Seed bed
Globa
lJo
urna
lof
Scienc
eFr
ontier
Resea
rch
V
olum
e
3
()
Janu
ary
2012
D
© 2012 Global Journals Inc. (US)
2 m
0.5 m 2 m
10m
10 m
1.5m
-_-_-_---_-_-_-_-----_-_-_-_-__-_-_-__---_-_-_-_-_--_-_-_-_-_
2 mFig 3.1: Layout of the sprinkler irrigation system in the field of experiment
Yield-Crop Water Use (Cwu) Evaluation For Pepper Production Under Irrigated Cultivation In Akure, Nigeria
XII
Issu
e er
sion
IV
I
3.4
g)
Pepper Yield
Harvestable yields of Pepper (Capsicum annum) were determined on weekly interval starting from the day harvesting began (65DAT). Fresh peppers were harvested from the treatment plots for
ease of measurement of fresh biomass. The weight of the harvested fresh biomass was determined using an electronic weighing device that could measure up to 0.01 level of accuracy.
III.
RESULTS AND DISCUSSION
a)
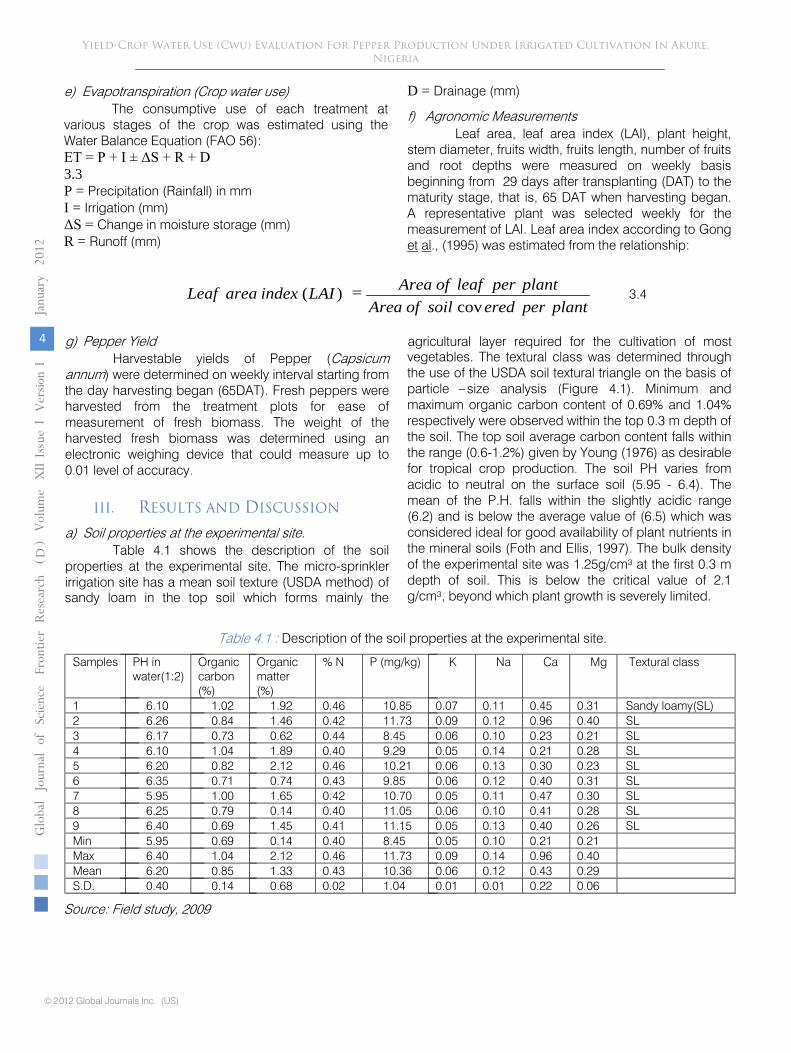
Soil properties at the experimental site.
Table 4.1 shows the description of the soil properties at the experimental site. The micro-sprinkler irrigation site has a mean soil texture (USDA method) of sandy loam in the top soil which forms mainly the
agricultural layer required for the cultivation of most vegetables. The textural class was determined through the use of the USDA soil textural triangle on the basis of particle –size analysis (Figure 4.1). Minimum and maximum organic carbon content of 0.69% and 1.04% respectively were observed within the top 0.3 m depth of the soil. The top soil average carbon content falls within the range (0.6-1.2%) given by Young (1976) as desirable for tropical crop production. The soil PH varies from acidic to neutral on the surface soil (5.95 -
6.4). The mean of the P.H. falls within the slightly acidic range (6.2) and is below the average value of (6.5) which was considered ideal for good availability of plant nutrients in the mineral soils (Foth and Ellis, 1997). The bulk density of the experimental site was 1.25g/cm³ at
the first 0.3 m depth of soil. This is below the critical value of 2.1 g/cm³, beyond which plant growth is severely limited.
Table 4.1
:
Description of the soil properties at the experimental site.
Samples
PH in water(1:2)
Organic carbon (%)
Organic matter (%)
% N
P (mg/kg)
K
Na
Ca
Mg
Textural class
1
6.10
1.02
1.92
0.46
10.85
0.07
0.11
0.45
0.31
Sandy loamy(SL)
2
6.26
0.84
1.46
0.42
11.73
0.09
0.12
0.96
0.40
SL
3
6.17
0.73
0.62
0.44
8.45
0.06
0.10
0.23
0.21
SL
4
6.10
1.04
1.89
0.40
9.29
0.05
0.14
0.21
0.28
SL
5
6.20
0.82
2.12
0.46
10.21
0.06
0.13
0.30
0.23
SL
6
6.35
0.71
0.74
0.43
9.85
0.06
0.12
0.40
0.31
SL
7
5.95
1.00
1.65
0.42
10.70
0.05
0.11
0.47
0.30
SL
8
6.25
0.79
0.14
0.40
11.05
0.06
0.10
0.41
0.28
SL
9
6.40
0.69
1.45
0.41
11.15
0.05
0.13
0.40
0.26
SL
Min
5.95
0.69
0.14
0.40
8.45
0.05
0.10
0.21
0.21
Max
6.40
1.04
2.12
0.46
11.73
0.09
0.14
0.96
0.40
Mean
6.20
0.85
1.33
0.43
10.36
0.06
0.12
0.43
0.29
S.D.
0.40
0.14
0.68
0.02
1.04
0.01
0.01
0.22
0.06
Source: Field study, 2009
plantpereredsoilofAreaplantperleafofAreaLAIindexareaLeaf
cov)( =
© 2012 Global Journals Inc. (US)
Globa
lJo
urna
lof
Scienc
eFr
ontier
Resea
rch
V
olum
e
4
()
Janu
ary
2012
D
e) Evapotranspiration (Crop water use)The consumptive use of each treatment at
various stages of the crop was estimated using the Water Balance Equation (FAO 56):ET = P + I ± ΔS + R + D 3.3P = Precipitation (Rainfall) in mmI = Irrigation (mm)ΔS = Change in moisture storage (mm)R = Runoff (mm)
D = Drainage (mm)
f) Agronomic Measurements Leaf area, leaf area index (LAI), plant height,
stem diameter, fruits width, fruits length, number of fruits and root depths were measured on weekly basis beginning from 29 days after transplanting (DAT) to the maturity stage, that is, 65 DAT when harvesting began. A representative plant was selected weekly for the measurement of LAI. Leaf area index according to Gong et al., (1995) was estimated from the relationship:
Yield-Crop Water Use (Cwu) Evaluation For Pepper Production Under Irrigated Cultivation In Akure, Nigeria
XII
Issu
e er
sion
IV
I
(a)
(b)
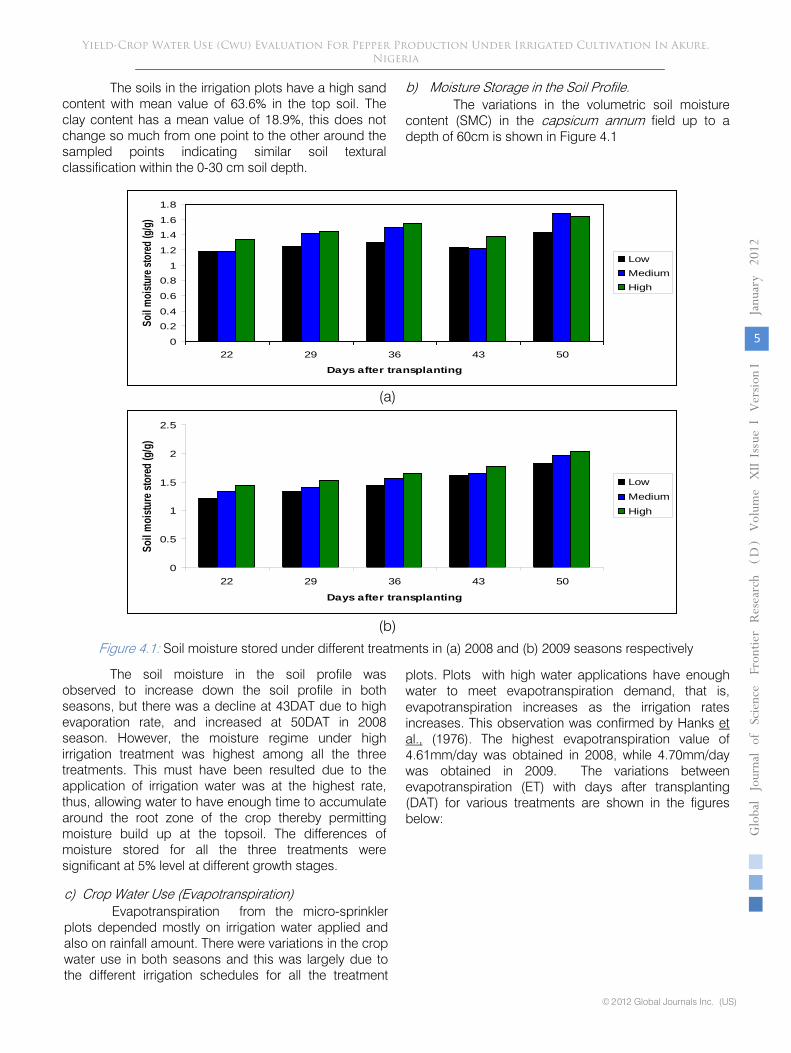
Figure 4.1:
Soil moisture stored under different treatments in (a) 2008
and (b) 2009 seasons respectively
The soil moisture in the soil profile was observed to increase down the soil profile in both seasons, but there was a decline at 43DAT due to high evaporation rate, and increased at 50DAT in 2008 season. However, the moisture regime under high irrigation treatment was highest among all the three treatments. This must have been resulted due to the application of irrigation water was at the highest rate, thus, allowing water to have enough time to accumulate around the root zone of the crop thereby permitting moisture build up at the topsoil. The differences of moisture stored for all the three treatments were significant at 5% level at different growth stages.
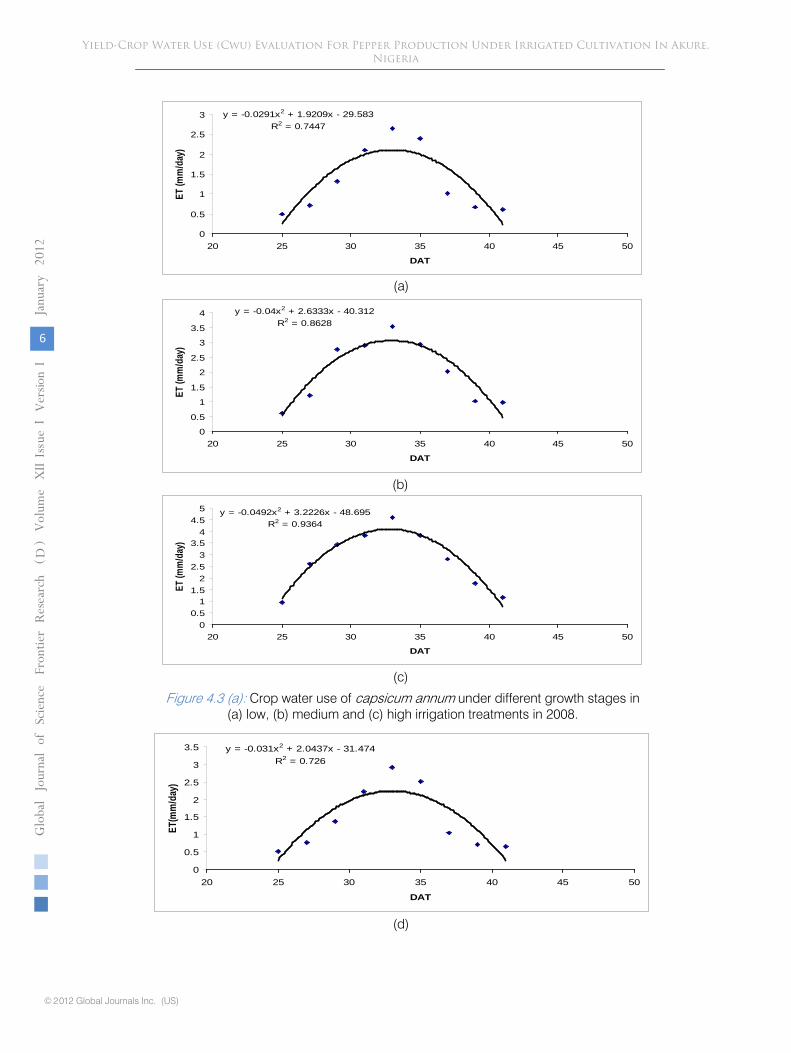
c)
Crop Water Use (Evapotranspiration)
Evapotranspiration from the micro-sprinkler plots depended mostly on irrigation water applied and also on rainfall amount. There were variations in the crop water use in both seasons and this was largely due to the different irrigation schedules for all the treatment
plots. Plots with high water applications have enough water to meet evapotranspiration demand, that is, evapotranspiration increases as the irrigation rates increases. This observation was confirmed by Hanks et
al.,
(1976). The highest
evapotranspiration value of
4.61mm/day was obtained in 2008, while 4.70mm/day was obtained in 2009. The variations between evapotranspiration (ET) with days after transplanting (DAT) for various treatments are shown in the figures below:
0
0.2
0.4
0.6
0.8
1
1.2
1.4
1.6
1.8
22 29 36 43 50
Days after transplanting
Soil m
oistur
e stor
ed (g
/g)
LowMediumHigh
0
0.5
1
1.5
2
2.5
22 29 36 43 50
Days after transplanting
Soil
moi
sture
stor
ed (g
/g)
LowMediumHigh
Globa
lJo
urna
lof
Scienc
eFr
ontier
Resea
rch
V
olum
e
5
()
Janu
ary
2012
D
© 2012 Global Journals Inc. (US)
The soils in the irrigation plots have a high sand content with mean value of 63.6% in the top soil. The clay content has a mean value of 18.9%, this does not change so much from one point to the other around the sampled points indicating similar soil textural classification within the 0-30 cm soil depth.
b) Moisture Storage in the Soil Profile.The variations in the volumetric soil moisture
content (SMC) in the capsicum annum field up to a depth of 60cm is shown in Figure 4.1
Yield-Crop Water Use (Cwu) Evaluation For Pepper Production Under Irrigated Cultivation In Akure, Nigeria
XII
Issu
e er
sion
IV
I
(a)
(b)
(c)
Figure 4.3
(a):
Crop water use of capsicum annum under different growth stages in
(a) low, (b) medium and (c) high irrigation treatments in 2008.
(d)
y = -0.0291x2 + 1.9209x - 29.583R2 = 0.7447
0
0.5
1
1.5
2
2.5
3
20 25 30 35 40 45 50
DAT
ET (m
m/d
ay)
y = -0.04x2 + 2.6333x - 40.312R2 = 0.8628
0
0.5
1
1.5
2
2.5
3
3.5
4
20 25 30 35 40 45 50
DAT
ET (m
m/d
ay)
y = -0.0492x2 + 3.2226x - 48.695R2 = 0.9364
00.5
11.5
22.5
33.5
44.5
5
20 25 30 35 40 45 50
DAT
ET (m
m/d
ay)
y = -0.031x2 + 2.0437x - 31.474R2 = 0.726
0
0.5
1
1.5
2
2.5
3
3.5
20 25 30 35 40 45 50
DAT
ET(m
m/d
ay)
Globa
lJo
urna
lof
Scienc
eFr
ontier
Resea
rch
V
olum
e
6
()
Janu
ary
2012
D
© 2012 Global Journals Inc. (US)
Yield-Crop Water Use (Cwu) Evaluation For Pepper Production Under Irrigated Cultivation In Akure, Nigeria
XII
Issu
e er
sion
IV
I
(e)
(f)
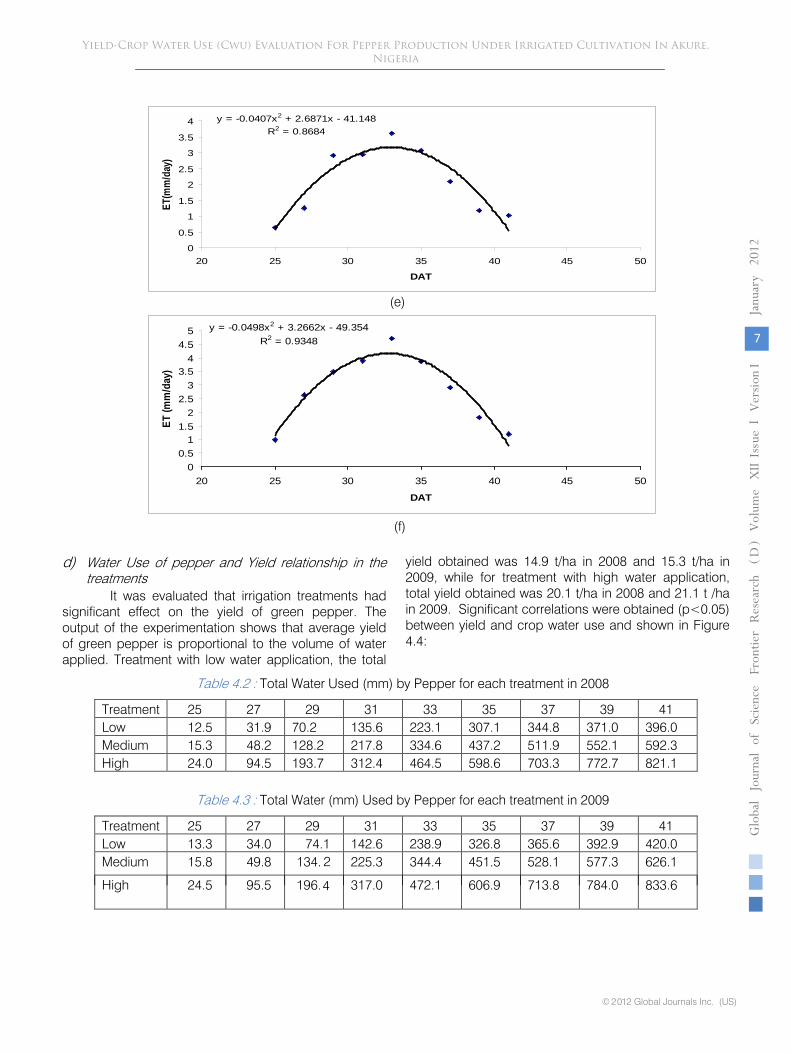
d)
Water Use of pepper and Yield relationship in the treatments
It was evaluated that irrigation treatments had significant effect on the yield of green pepper. The output of the experimentation shows that average yield of green pepper is proportional to the volume of water applied. Treatment with low water application, the total
yield obtained was 14.9 t/ha in 2008 and 15.3 t/ha in 2009, while for treatment with high water application, total yield obtained was 20.1 t/ha in 2008 and 21.1 t /ha in 2009. Significant correlations were obtained (p<0.05) between yield and crop water use and shown in Figure 4.4:
Table 4.2
:
Total Water Used (mm) by Pepper for each treatment in 2008
Treatment
25
27
29
31
33
35
37
39
41
Low
12.5
31.9
70.2
135.6
223.1
307.1
344.8
371.0
396.0
Medium
15.3
48.2
128.2
217.8
334.6
437.2
511.9
552.1
592.3
High
24.0
94.5
193.7
312.4
464.5
598.6
703.3
772.7
821.1
Table 4.3
:
Total Water (mm) Used by Pepper for each treatment in 2009
Treatment
25
27
29
31
33
35
37
39
41
Low
13.3
34.0
74.1
142.6
238.9
326.8
365.6
392.9
420.0
Medium
15.8
49.8
134. 2
225.3
344.4
451.5
528.1
577.3
626.1
High
24.5
95.5
196.4 317.0
472.1
606.9
713.8
784.0
833.6
y = -0.0407x2 + 2.6871x - 41.148R2 = 0.8684
0
0.5
1
1.5
2
2.5
3
3.5
4
20 25 30 35 40 45 50
DAT
ET(m
m/d
ay)
y = -0.0498x2 + 3.2662x - 49.354R2 = 0.9348
00.5
11.5
22.5
33.5
44.5
5
20 25 30 35 40 45 50
DAT
ET (m
m/d
ay)
Globa
lJo
urna
lof
Scienc
eFr
ontier
Resea
rch
V
olum
e
7
()
Janu
ary
2012
D
© 2012 Global Journals Inc. (US)
Yield-Crop Water Use (Cwu) Evaluation For Pepper Production Under Irrigated Cultivation In Akure, Nigeria
XII
Issu
e er
sion
IV
I
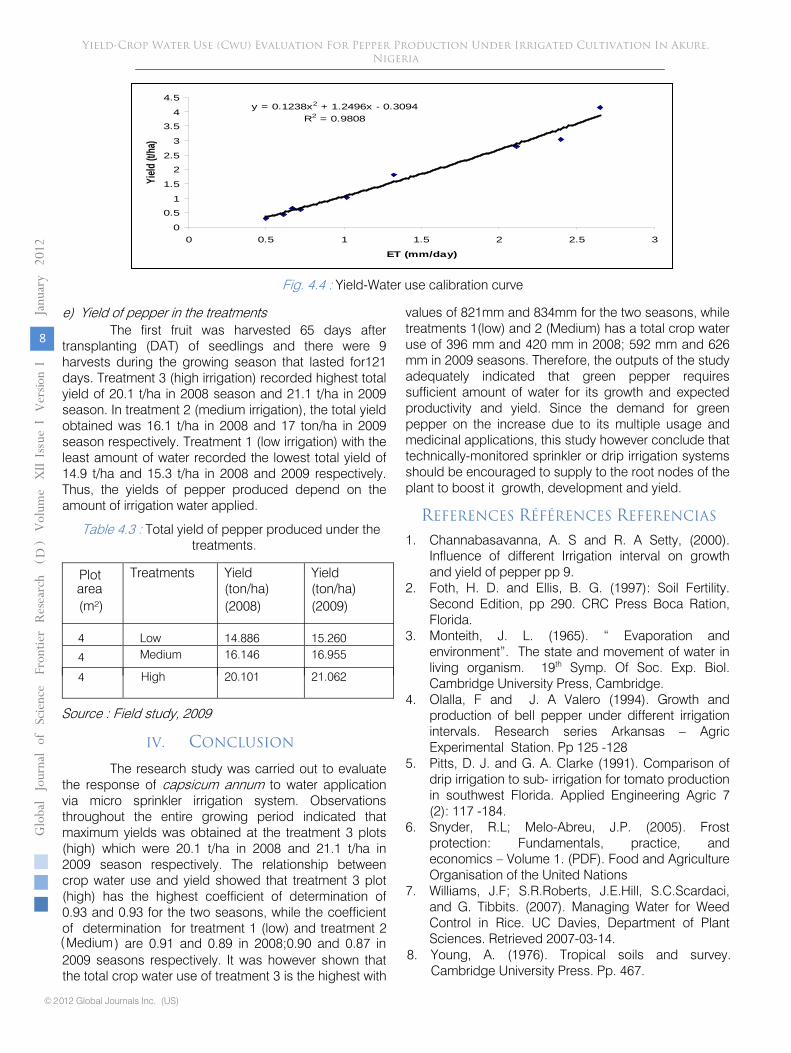
Fig. 4.4 : Yield-Water use calibration curve
e) Yield of pepper in the treatments
The first fruit was harvested 65 days after transplanting (DAT) of seedlings and there were 9 harvests during the growing season that lasted for121 days. Treatment 3 (high irrigation) recorded highest total yield of 20.1 t/ha in 2008 season and 21.1 t/ha in 2009 season. In treatment 2 (medium irrigation), the total yield obtained was 16.1 t/ha in 2008 and 17 ton/ha in 2009 season respectively. Treatment 1 (low irrigation) with the least amount of water recorded the lowest total yield of 14.9 t/ha and 15.3 t/ha in 2008 and 2009 respectively. Thus, the yields of pepper produced depend on the amount of irrigation water applied.
Table 4.3 : Total yield of pepper produced under the
treatments.
Plot area (m²)
Treatments Yield (ton/ha)
(2008)
Yield (ton/ha)
(2009)
4 Low 14.886 15.260
4
Medium 16.146 16.955
4
High 20.101 21.062
Source : Field study, 2009
IV. CONCLUSION
The research study was carried out to evaluate the response of capsicum annum to water application via micro sprinkler irrigation system. Observations throughout the entire growing period indicated that maximum yields was obtained at the treatment 3 plots (high) which were 20.1 t/ha in 2008 and 21.1 t/ha in 2009 season respectively. The relationship between crop water use and yield showed that treatment 3 plot (high) has the highest coefficient of determination of 0.93 and 0.93 for the two seasons, while the coefficient of determination for treatment 1 (low) and treatment 2 Medium
2009 seasons respectively. It was however shown that the total crop water use of treatment 3 is the highest with
values of 821mm and 834mm for the two seasons, while treatments 1(low) and 2 (Medium) has a total
crop water
use of 396 mm and 420 mm in 2008; 592 mm and 626 mm in 2009 seasons. Therefore, the outputs of the study adequately indicated that green pepper requires sufficient amount of water for its growth and expected productivity and yield. Since the demand for green pepper on the increase due to its multiple usage and medicinal applications, this study however conclude that technically-monitored sprinkler or drip irrigation systems should be encouraged to supply to the root nodes of the plant to boost it growth, development and yield.
1.
Channabasavanna, A. S and R. A Setty, (2000). Influence of different Irrigation interval on growth and yield of pepper pp 9.
2.
Foth, H. D. and Ellis, B. G. (1997): Soil Fertility. Second Edition, pp 290. CRC Press Boca Ration, Florida.
3.
Monteith, J. L. (1965). “ Evaporation and environment”. The state and movement of water in living organism. 19th
Symp. Of Soc. Exp. Biol.
Cambridge University Press, Cambridge. 4.
Olalla, F and J. A Valero (1994). Growth and production of bell pepper under different irrigation intervals. Research series Arkansas –
Agric
Experimental Station. Pp 125 -128 5.
Pitts, D. J. and G. A. Clarke (1991). Comparison of drip irrigation to sub-
irrigation for tomato production
in southwest Florida. Applied Engineering Agric 7 (2): 117 -184.
6.
Snyder, R.L; Melo-Abreu, J.P. (2005). Frost protection: Fundamentals, practice, and economics –
Volume 1. (PDF). Food and Agriculture
Organisation of the United Nations 7.
Williams, J.F; S.R.Roberts, J.E.Hill,
S.C.Scardaci,
and G. Tibbits. (2007). Managing Water for Weed Control in Rice. UC Davies, Department of Plant Sciences. Retrieved 2007-03-14.
y = 0.1238x2 + 1.2496x - 0.3094R2 = 0.9808
0
0.5
1
1.5
2
2.5
3
3.5
4
4.5
0 0.5 1 1.5 2 2.5 3
ET (mm/day)
Yield
(t/ha
)
Globa
lJo
urna
lof
Scienc
eFr
ontier
Resea
rch
V
olum
e
8
()
Janu
ary
2012
D
© 2012 Global Journals Inc. (US)
8. Young, A. (1976). Tropical soils and survey. Cambridge University Press. Pp. 467.
REFERENCES RÉFÉRENCES REFERENCIAS
) are 0.91 and 0.89 in 2008;0.90 and 0.87 in (
Yield-Crop Water Use (Cwu) Evaluation For Pepper Production Under Irrigated Cultivation In Akure, Nigeria
XII
Issu
e er
sion
IV
I
© 2012 . Raufu, M.O., Adetunji M.O.This is a research/review paper, distributed under the terms of the Creative Commons Attribution-Noncommercial 3.0 Unported License http://creativecommons.org/licenses/by-nc/3.0/), permitting all non commercial use, distribution, and reproduction in any medium, provided the original work is properly cited.
Determinant of Land Management Practices among Crop Farmers in South-Western Nigeria
By Raufu, M.O., Adetunji M.O. Ladoke Akintola University of Technology, Ogbomoso Oyo State, Nigeria
Abstract - The study examined the determinants of land management practices among crop farmers in South-Western Nigeria. A total of 360 respondents were selected from the three agro-ecological zones of the State typical of some Nigeria South-Western States. Well-structured questionnaires with few open-ended questions were administered out of which 301 were found to be very useful for the study. Analysis of data was done using descriptive statistics and probit models were employed as the inferential statistics.The result showed that 90 percent of the farmers are male and married while 85.5 percent of their household members are literate. About 40 percent of the farmers are in their active age. The male education at secondary and tertiary level has significant impact on land management practices contrary to female education. Also the livelihood strategy of the household head has limited impact on most land management practices. Investment on land encourages fallowing and incorporation of crop residues while assess to credit favors non-farm rather than farm activities.
Keywords : Land, Land Management, Livelihood Strategy, Agro-Ecological Zones, Crops Diversification, Support Policy, Herfindal Index, Probit Model, Human and Financial Capital.
Determinant of Land Management Practices among Crop Farmers in South-Western Nigeria
Strictly as per the compliance and regulations of:
Global Journal of Science Frontier ResearchAgriculture & BiologyVolume 12 Issue 1 Version 1.0 January 2012Type : Double Blind Peer Reviewed International Research JournalPublisher: Global Journals Inc. (USA)Online ISSN: 2249-4626 & Print ISSN: 0975-5896
GJSFR-D Classification : FOR Code: 960904, 070101
Determinant of Land Management Practices among Crop Farmers in South-Western Nigeria
Raufu, M.O.α , Adetunji M.O.Ω
Abstract - The study examined the determinants of land management practices among crop farmers in South-Western Nigeria. A total of 360 respondents were selected from the three agro-ecological zones of the State typical of some Nigeria South-Western States. Well-structured questionnaires with few open-ended questions were administered out of which 301 were found to be very useful for the study. Analysis of data was done using descriptive statistics and probit models were employed as the inferential statistics. The result showed that 90 percent of the farmers are male and married while 85.5 percent of their household members are literate. About 40 percent of the farmers are in their active age. The male education at secondary and tertiary level has significant impact on land management practices contrary to female education. Also the livelihood strategy of the household head has limited impact on most land management practices. Investment on land encourages fallowing and incorporation of crop residues while assess to credit favors non-farm rather than farm activities. Keywords : Land, Land Management, Livelihood Strategy, Agro-Ecological Zones, Crops Diversification, Support Policy, Herfindal Index, Probit Model, Human and Financial Capital
I. INTRODUCTION
and is the major resource for the livelihood of the poor. In Nigeria, a typical villager recognizes land in its entirety. According to Fabiyi, (1990) land, to
the farmer, is home and work place and shares it with the entire biotic complex. As important as land is to farmers’ livelihood, Adekoya (1997) observed that subsistent farmers are with a lot of in integrating many of the land management practices. Dixon (1995) arranged these constraint under three headings; economic obstacles such as capital need and financial incentives; social conditions which include land tenure, availability of infrastructures and educational level of farmers; and ecological consideration such as limited knowledge of inputs and sustainability of some systems.
Land use in many African nations have been characterized by a significant amount of land degradation. Moreover, these two processes are clearly related (Brabier, 1999). Many poor African pastorialists and farming households respond to declining land productivity by abandoning existing degraded pasture Author α Ω : Department of Agricultural Economics and Extension, Ladoke Akintola University of Technology, P.M.B. 4000, Ogbomoso Oyo State, Nigeria. E-mail : [email protected] Tel. +23438261934
and cropland, and moving to new land for grazing and crop cultivation. Due to the fact that the pattern of land use will often result into depletion of soil nutrients, appropriate management practices have to be adopted. Couper (1995) noted that the need for appropriate soil management in tropical soils becomes imperative because of inability of the soil to sustain increased crop yields as cultivation continues on an annual basis. This was traced to the fact that the clay in most tropical soil, referred to as low activity clay (LAC) does not expand and contract readily with moisture changes and the soil becomes susceptible to soil compaction. Also, LAC soils have a low cation exchange capacity, which means that nutrients are not held by the soil, but quickly leached below the crop roots. This is due to high temperatures, which makes organic matters in tropical soil to be susceptible to rapid mineralization.
Furthermore, in an imperfect market setting, the nature of poverty is also important in determining its impact on natural resources management and degradation. Households that are not poor by welfare criteria such as minimum levels of consumption may still face “investment poverty” that prevents them from making profitable investments in resource conservation and improvement. (Reardon and Vosti 1995) claimed that households that lack access to road and markets, or that own little land may deplete soil nutrients less rapidly since they are subsistence – oriented and thus export less soil nutrients in the farm of crop harvest and sales. On the other hand, households that are livestock poor may deplete soil nutrients more rapidly because they lack access to manure.
As a result of this, the study centered on land management since land is the major resource for the livelihoods of the poor. A large body of past research shows that the major determinants of land management include households’ endowments of different types of capital, land tenure and the biophysical and socio-economic environment in which rural households live (Reardon and Vosti, 1995; Barrett, et al, 2002; Nkonya, et al, 2004). Land use and management practices affect human health directly and indirectly. It affects fauna and flora, contributes to local, regional, and global climate changes and is the primary source of soil, water and land degradation (Sala et al., 2000; Pielke, 2005). Altering ecosystem services— i.e., the provisions people obtain from ecosystems (e.g., food, water), regulating
L
Globa
lJo
urna
lof
Scienc
eFr
ontier
Resea
rch
V
olum
e
9
()
Janu
ary
2012
D
© 2012 Global Journals Inc. (US)
XII
Issu
e er
sion
IV
I
services (e.g., predator-prey relationships, flood and disease control), cultural services (e.g., spiritual and recreational benefits), and support services (e.g., pollination, nutrient cycling, productivity)—that maintain the conditions for life on Earth affect the ability of biological systems to support human needs (Vitousek et al., 1997). Alterations lead to large scale land degradation, changing the ecology of diseases that influence human health and making it more vulnerable to infections (Collins, 2001).
In addition, the identification of constraints to farmers’ use of sustainable management practices would provide a direction of action for government in trying to boost farmers involvement in land management practices, reveal areas of inadequacy and where the farmers need improvement. There is likewise the need to focus on the sustainability of the environment through emphasizing the desirable ways by which farmers can utilize the land that would prevent consequential depletion of the soil fertility. Finally, there is the need to develop a benchmark of wider dimension that would identify land-use indices and threshold in a typified smallholder farming system. This is even more important now that the Federal Government of Nigeria is exploring ways of sourcing revenue from non-oil sector. The consequence of enhanced production is also most likely to result in enhanced welfare for crop farming communities. The achievements of all these would not only improve agricultural production but would further ensure the sustainability of the environment. The results of this study is likewise expected to provide policy makers with good understanding of the situation in the south-western part of the country such that they would be adequately equipped with the right policy intervention tools that will promote the welfare of crop farming households.
II. OBJECTIVE OF THE STUDY
The main objective of the study is to identify the determinants of land management practices among crop farmers in South-western Nigeria. The specific objectives are to: 1. identify the socio-economic characteristics of the
farmers, 2. examine the pattern of land use as regards crops
diversification, and 3. highlight the determinants of land management
practices in the study area.
iiiII. HYPOTHESIS
The working hypothesis stated in null form is ; There is no significant relationship between access to credit and land management practices.
Iv . METHODOLOGY
The study was conducted in Osun State of South-Western Nigeria that is made up of three agro-ecological zones, characteristics of some of the South-Western States of the federation. The State has six administrative zones and thirty local government areas. The predominant farming system in the area is shifting cultivation with mixed cropping and crop rotation. Crops cultivated include maize, yam, cassava, cocoyam, cocoa, kolanut, citrus and vegetables. Livestock like sheep, cattle, goat, pig rabbit and poultry are also reared for sales and consumption. A three-stage sampling procedure was adopted in proportionately selecting 71 respondents from Iwo (Savannah zone), 109 respondents from Osogbo (Derived savannah zone) and 180 respondents from Ife/Ijesha (Rainforest zone) zones of the State. Out of the 360 questionnaires administered, 301 were found to be very useful for the study. The primary data collected were coded and subjected to both descriptive and inferential statistics.
The descriptive statistics used are frequency and percentage distribution, mean and standard deviation to describe the socio-economic characteristics of the respondents while the probit models were employed as the inferential statistics since the dependent variables are dichotomous (e.g whether or not farmer use inorganic fertilizer, organic fertilizer, purchased seeds and agrochemicals) as shown below;
LM = f (NC, PC, HC, FC, AS, XN,) (1)
Where; LM = Land management practices NC = Natural capital (including land size and investments on land) PC = Physical capital (including fixed inputs such as farm buildings, equipments) HC = Human Capital (including education and primary source of income of household head). FC = Financial Capital (including access to financial capital or participation in rural credit and savings). XN = Village and higher level factors influencing comparative advantage (agro-climatic potential and access to roads) AS = Access to agricultural technical assistance (including contact with extension agents). I= random factors
a) Land Use Pattern Analysis Analysis of land use pattern was done by measuring the index of crop diversification. Crop Diversification Index (CDI) consists of Entropy and Herfindal Index. Entropy Index is given as;
Determinant of Land Management Practices among Crop Farmers in South-Western Nigeria
Globa
lJo
urna
lof
Scienc
eFr
ontier
Resea
rch
V
olum
e
10
()
Janu
ary
2012
D
© 2012 Global Journals Inc. (US)
I
XII
Issu
e er
sion
IV
I

n
CDIe = ΣPi
log Pi
–1
(1)
i=1
Where
CDIe
= Crop Diversification Index
Pi
= Proportion of net income from the crop.
The Diversification Index is optimal when
0< CDIe/n< 1¯
The Herfindal Index is given as;
n
CDIh
= ΣPi
2
(2)
i=1
Pi
is as described above.
b)
Probit model
The probit model represents another type of widely used statistical model for studying data with binomial distributions. Probit models are generalized linear models with a probit link;
η = ϕ-1
(µ)
(3)
Where η
is a linear
predictor produced by x1,
x2, x3,
………………….,xk
ϕ-1 is the inverse of the standard normal cumulative distribution function (CDF) and
µ
is the expected value of the
xs.
The inverse of the normal CDF is in effect a standardized variable, or a Z score. As with the logit model, the probit model is used for studying a binary outcome variable. The probit model can be expressed in probability thus;
=
=
−−==
∑
∑∑
=
==
K
KKK
K
KKK
K
KKK
b
bFbFyob
1
111)1(Pr
βφ
ββ
-------
(4)
Where the more general form of CDF, F, is replaced by the standard normal cumulative distribution function, ϕ. Unlike the logit model, which may take on two major forms-one expressing the model in logit (and a transformed version expressed
in odds) and the other expressing the model in event probability-the probit model expressed in η
is a linear regression of the Z score of the event probability. The equation for probability of nonevent is then;
−== ∑
−
K
KKKbyob
11)0(Pr βφ
(5)
The farmer’s decision on use of a particular input depends on the criterion function,
Yi* = γ Zi
+ μ i
(6)
Where Yi* is an underlying index reflecting the difference between the use of an input and ts non-use, γ
is a vector of parameters to be estimated, Zi
is a vector of exogenous variables which explain use of an input, and μi
is the standard normally distributed error term. Given the farmer’s assessment, when Yi* crosses the threshold value, 0, we observe the farmer using the input in question. In practice, Yi*is unobservable. Its observable counterpart is Yi, which is defined by
Yi
= 1 if Yi* > 0 (Household i use the input in question), and
Yi = 0 if otherwise.
In the case of normal distribution function, the model to estimate the probability of observing a farmer using a input can be stated as
( ) ( ) ( )∫−
−Φβ
α πβ
1
2exp211 21
X
i dzzXXYP
(7)
Where,
P is the probability that the ith household use the input and 0 otherwise;
x is the K by 1 vector of the explanatory variables;
z is the standard normal variable, i.e., Z ~ N(0,σ2
) ; and
β
is the K by 1 vector of the coefficients estimated.
LIMDEP 8.0 software was used to derive estimates for the probit model used.
V.
RESULTS AND DISCUSSION
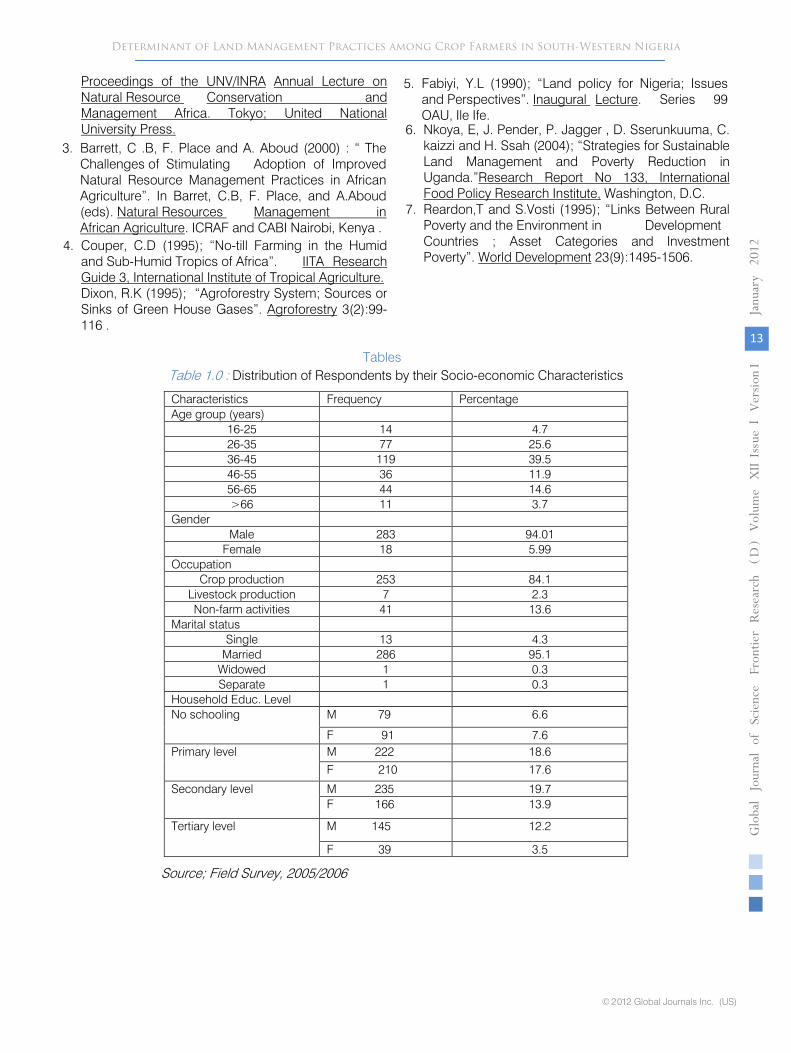
Table 1.0 reveals that about 69.8 percent of the farmers are between 16-45 years of age, showing that they are in active age brackets. The mean age is 46.81 and this has implication on the available family labor and productivity of the labor because age has a direct bearing on the availability of farm labor and the ease with which improved agricultural practices are adopted. The gender distribution of the farmers depicts more male (94.01%) than female owning farms. This result conforms with the cultural setting in the study area where male have more access to land than female.
Also the main occupation of most of the sampled farmers is farming and larger proportion (84.%) of them depends on crop production for daily existence. This result has effect on the level of cropping pattern and intensity in which the agricultural land is used. Majority (95.10%) of the
respondents are married, 4.3 percent
Globa
lJo
urna
lof
Scienc
eFr
ontier
Resea
rch
V
olum
e
11
()
Janu
ary
2012
D
© 2012 Global Journals Inc. (US)
are single and just 0.3 percent each are widowed and divorced.
Most of the farmer’s households (85.8%), male and female, have at least a primary education. Those households with tertiary education probably constitute the civil servants who engaged in part-time farming in the area. This is expected in line with a priori expectation, to have significant impact on productivities,
Determinant of Land Management Practices among Crop Farmers in South-Western Nigeria
===
XII
Issu
e er
sion
IV
I

income earning opportunities and ability of farmers to effectively adopt better management practices.
Table 2.0 shows that 52.5 percent of the farmers had two-crop mixture on their farm with combination mean of diversification index being 0.714. For the four-crop combination and five-crop combination, the average H-index is 0.433 and 0.218 respectively. The result however, shows that as the number of crops in combination decreases, the H-index increases and would become one for sole cropping implying specialization.
But on the average, the H-index for all the sampled farms is 0.578. The H-indices show that the sampled farmers undertook one form of cropping diversity or the other, but the majority of them practiced one to two crop combinations.
Table 3.0 implies that
secondary and tertiary education of males is associated with higher likelihood of practicing crop rotation and greater likelihood of encouraging fallow respectively. Encouraging crop rotation may be less labor intensive means of addressing concerns about soil fertility, pest and weeds while education at the tertiary level is a signal of higher opportunity cost of labor in more educated households directly encouraging fallow of agricultural land. But female education at all levels has no significant impact on land management practices.
The livelihood strategy of the household measured by the primary source of income of the household head, has limited impact on most land management practices. Non-farm activity as a primary source of income increases the probability to fallow relative to household for whom crop production is the primary activity. Likewise non-farm activities enable and encourage less intensive crop production, by providing households with alternative sources of income and increasing the opportunity cost of family labor. There is no statistical significant difference in land management practices between households
whose primary income source is livestock as against crop production.
Natural capital, particularly in terms of investment on land encourages fallowing and incorporation of crop residues. Fallowing, for example, is common on farms where agro forestry (non-crop) trees have been planted. Other land investment such as fishponds, fences and paddocks increase the probability to incorporate crop residues. Furthermore, as expected, larger farms are more likely to fallow since they have enough land for crop production while resting part of their land. They are likewise less likely to incorporate crop residue on a given plot.
Access to credit has statistically insignificant impacts on most land management practices, except a negative impact on crop rotation. The negative association of credit with crop rotation may be because credit is used to facilities non-farm activities, rather than efforts to increase soil fertility and crop production. Therefore the hypothesis that there is no significant
relationship between access to credit and land management practices is accepted. This findings suggest that credit constraint are not major impediment to adoption of improved land management practices, and that access to credit may promote less intensive land management practices by facilitating more remunerative non-farm activities. This finding goes in contrary to observation of Sharma and B u c h e r n r i e d e r
(2002) that limited credit is a constraint to improved land management practices.
The results of the agro-ecological zone shows that fallowing and crop rotation practices are more common in the rainforest zone of the State than the other zones perhaps because of the adoption of non-crop trees in their farming systems.
VI.
SUMMARY
The study revealed that about 40 percent of the farmers are between 36 to 45 years of age, majority (94.01%) are male and 84.1 percent of the farmers takes farming as main occupation.
95.10 percent of the farmers’ are married and 85.8 percent of the farmers’ households have at least primary education. Education of male at secondary and tertiary education level has significant impact on land management practices contrary to female education. Also the livelihood strategy of the household has limited impact on most land management practices. Investment on land encourages fallowing and incorporation of crop residues while assess to credit encourages non-farm rather than the expected farm
activities.
VII.
RECOMMENDATION
Government should encourage researches that would be farmers specific for awareness to be created on how to improve the quality of farm management practices currently in practice. More farmer groups should be formed for collection, distributions and utilization of agricultural loans. There is need for the government to add to the present subsidy style (credit support) of providing subsidized planting materials, inorganic fertilizers and agro-chemicals as well as provision
of soft loan with a price support policy where farmers’ outputs at peak
period are bought at fairly reasonable prices above the current market prices. This will encourage farmers who are unable to benefit directly from the credit subsidies to remain in agriculture.
Globa
lJo
urna
lof
Scienc
eFr
ontier
Resea
rch
V
olum
e
12
()
Janu
ary
2012
D
© 2012 Global Journals Inc. (US)
1. Adekoya, AE (1997); An Analysis of Farmers Participation in Agroforestry in Oyo State.
2. Barbier, E.B (1999); “The Economics of Land Degradation and Rural Poverty Linkage in Africa”.
Unpublished Ph.D Thesis of the Department of Agricultural Extension Services University of Ibadan pp15.27.
REFERENCES RÉFÉRENCES REFERENCIAS
Determinant of Land Management Practices among Crop Farmers in South-Western NigeriaXII
Issu
e er
sion
IV
I
3.
Barrett, C .B, F. Place and A. Aboud (2000) : “ The Challenges of Stimulating
Adoption of Improved Natural Resource Management Practices in African Agriculture”. In Barret, C.B, F. Place, and A.Aboud (eds).
Natural Resources
Management in African Agriculture
4.
Couper, C.D
(1995); “No-till Farming in the Humid and Sub-Humid Tropics of Africa”.
. ICRAF and CABI Nairobi, Kenya .
Dixon, R.K (1995); “Agroforestry System; Sources or Sinks of Green House Gases”.
IITA Research Guide 3, International Institute of Tropical Agriculture.
Agroforestry
5.
Fabiyi, Y.L (1990); “Land policy for Nigeria; Issues and Perspectives”.
3(2):99-116 .
Inaugural
Lecture
6.
Nkoya, E, J. Pender, P. Jagger , D. Sserunkuuma,
C. kaizzi and H. Ssah (2004); “Strategies for Sustainable Land Management and Poverty Reduction in Uganda.”
. Series 99 OAU, Ile Ife.
Research Report No 133, International Food Policy Research Institute,
7.
Reardon,T and S.Vosti (1995); “Links Between Rural Poverty and the Environment in
Development Countries ; Asset Categories and Investment Poverty”.
Washington, D.C.
World
Development
23(9):1495-1506.
Table 1.0
:
Distribution of Respondents by their Socio-economic Characteristics
Characteristics
Frequency
Percentage
Age group (years)
16-25
14
4.7
26-35
77
25.6
36-45
119
39.5
46-55
36
11.9
56-65
44
14.6
>66
11
3.7
Gender
Male
283
94.01
Female
18
5.99
Occupation
Crop production
253
84.1
Livestock production
7
2.3
Non-farm activities
41
13.6
Marital status
Single
13
4.3
Married
286
95.1
Widowed
1
0.3
Separate
1
0.3
Household Educ. Level
No schooling
M 79
6.6
F 91
7.6
Primary level
M 222
18.6
F 210
17.6
Secondary level
M 235
19.7
F 166
13.9
Tertiary level
M 145
12.2
F 39
3.5
Source; Field Survey, 2005/2006
Globa
lJo
urna
lof
Scienc
eFr
ontier
Resea
rch
V
olum
e
13
()
Janu
ary
2012
D
© 2012 Global Journals Inc. (US)
Proceedings of the UNV/INRA Annual Lecture on Natural Resource Conservation and Management Africa. Tokyo; United National University Press.
Tables
Determinant of Land Management Practices among Crop Farmers in South-Western Nigeria
XII
Issu
e er
sion
IV
I
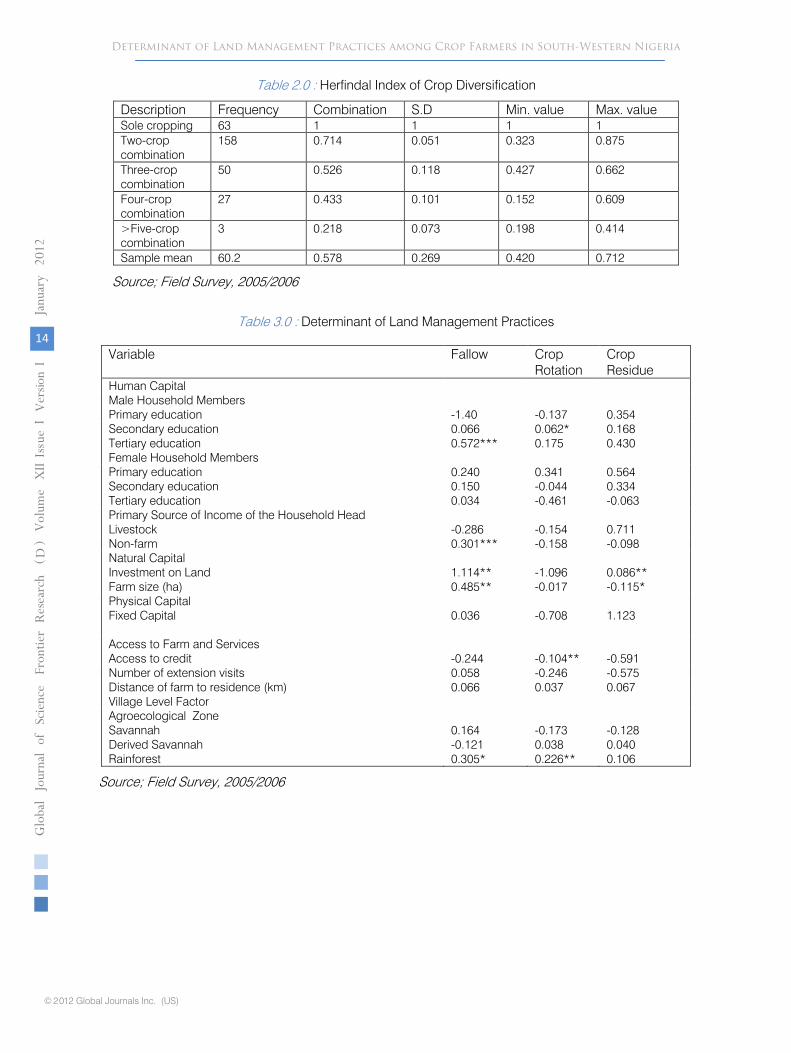
Table 2.0 : Herfindal Index of Crop Diversification
Description Frequency Combination S.D Min. value Max. value
Sole cropping 63 1 1 1 1
Two-crop combination
158 0.714 0.051 0.323 0.875
Three-crop combination
50 0.526 0.118 0.427 0.662
Four-crop combination
27 0.433 0.101 0.152 0.609
>Five-crop combination
3 0.218 0.073 0.198 0.414
Sample mean 60.2 0.578 0.269 0.420 0.712
Source; Field Survey, 2005/2006
Table 3.0 : Determinant of Land Management Practices
Variable Fallow Crop Rotation
Crop Residue
Human Capital
Male Household Members
Primary education -1.40 -0.137 0.354
Secondary education 0.066 0.062* 0.168
Tertiary education 0.572*** 0.175 0.430
Female Household Members
Primary education
Secondary education 0.240
0.150 0.341
-0.044 0.564
0.334
Tertiary education 0.034 -0.461 -0.063
Primary Source of Income of the Household Head
Livestock -0.286 -0.154 0.711
Non-farm 0.301*** -0.158 -0.098
Natural Capital
Investment on Land
Farm size (ha)
1.114**
0.485**
-1.096
-0.017
0.086**
-0.115*
Physical Capital
Fixed Capital
0.036
-0.708
1.123
Access to Farm and Services
Access to credit -0.244 -0.104** -0.591
Number of extension visits 0.058 -0.246 -0.575
Distance of farm to residence (km) 0.066 0.037 0.067
Village Level Factor
Agroecological Zone
Savannah
Derived Savannah
Rainforest
0.164
-0.121
0.305*
-0.173
0.038
0.226**
-0.128
0.040
0.106 Source; Field Survey, 2005/2006
Globa
lJo
urna
lof
Scienc
eFr
ontier
Resea
rch
V
olum
e
14
()
Janu
ary
2012
D
© 2012 Global Journals Inc. (US)
Determinant of Land Management Practices among Crop Farmers in South-Western NigeriaXII
Issu
e er
sion
IV
I
© 2012 . Dr (Mrs) Adetunji, M.O, Dr M.O Rauf.This is a research/review paper, distributed under the terms of the Creative Commons Attribution-Noncommercial 3.0 Unported License http://creativecommons.org/licenses/by-nc/3.0/), permitting all non commercial use, distribution, and reproduction in any medium, provided the original work is properly cited.
Analysis of Household Demand for Meat, in Southwest, Nigeria
By Dr (Mrs) Adetunji, M.O, Dr M.O Rauf Ladoke Akintola University of Technology, Ogbomoso Oyo State, Nigeria
Abstract - This study investigated household demand for meat in some selected states in the Southwest Nigeria. The systematic sampling technique was used to select two hundred and forty household in the study area and data were collected through well structured questionnaire. Analysis was done using Descriptive Statistics and Almost Ideal Demand System (AIDS) Model. The findings showed that beef (43.7%) was mostly preferred in the study area, income levels of respondents and taste influenced the type of meat preferred. The budget share of beef decreased with an increase in the price of chicken and vice versa, but increased with an increase in its price, the budget share of chevon , chicken and mutton increased with an increase in their own prices respectively. The budget share of pork increased with an increase in the price of mutton but it decreased with an increase in its own price.. Also one percent change in prices of beef,chevon and chicken would result in -0.827, -0.527 and -0.721 reduction in the quantity demanded respectively. Mutton and pork were confirmed to be luxury goods while chicken, beef and chevon were normal goods for households in southwest, Nigeria. Price intervention programmes should be introduced in order to stabilize the fluctuation in meat prices
Keywords : Meat, household demand, pork, mutton, beef, chevon, chicken, elasticity, price, Southwest, Nigeria.
Analysis of Household Demand for Meat, in Southwest, Nigeria
Strictly as per the compliance and regulations of:
Global Journal of Science Frontier ResearchAgriculture & BiologyVolume 12 Issue 1 Version 1.0 January 2012Type : Double Blind Peer Reviewed International Research JournalPublisher: Global Journals Inc. (USA)Online ISSN: 2249-4626 & Print ISSN: 0975-5896
GJSFR-D Classification : FOR Code: 630101, 839999p
Analysis of Household Demand for Meat, in Southwest, Nigeria Dr (Mrs) Adetunji, M.O α, Dr M.O Rauf Ω
Abstract - This study investigated household demand for meat in some selected states in the Southwest Nigeria. The systematic sampling technique was used to select two hundred and forty household in the study area and data were collected through well structured questionnaire. Analysis was done using Descriptive Statistics and Almost Ideal Demand System (AIDS) Model.
preferred in the study area, income levels of respondents and taste influenced the type of meat preferred. The budget share of beef decreased with an increase in the price of chicken and vice versa, but increased with an increase in its price, the budget share of chevon , chicken and mutton increased with an increase in their own prices respectively. The budget share of pork increased with an increase in the price of mutton but it decreased with an increase in its own price.. Also one
result in - 0.827, - 0.527 and - 0.721 reduction in the quantity demanded respectively. Mutton and pork were confirmed to be luxury goods while chicken, beef and chevon were normal goods for households in southwest, Nigeria. Price intervention programmes should be introduced in order to stabilize the fluctuation in meat prices. Keywords : Meat, household demand, pork, mutton, beef, chevon, chicken, elasticity, price, Southwest, Nigeria
I. INTRODUCTION
efore the 1970’s oil boom, agricultural exports were the backbone of the Nigerian economy with livestock products accounting for a significant
share of exports. During this period, the country had a well-developed domestic agricultural market. However, despite this sound potential for growth in the domestic market, Nigeria is currently witnessing a drastic decline in agricultural production, especially in livestock and meat sectors of the industry. This decline in agricultural production coincides with the nation’s oil boom.
Furthermore, Nigeria has enjoyed yearly economic growth (GDP) of 10.8 percent in real terms between 1980 and 1987 as a result of export earnings from petroleum. Real per capita income rose at 60 percent per year during this period. However, the decline in the world oil prices experienced in 1987, combined with the reduction in world market prices of
Author α Ω :
Department of Agricultural Economics, P.M.B. 4000,
Ladoke Akintola University of Technology, Ogbomoso, Nigeria.
E-mail : [email protected], [email protected].
Tel : 08033601965, Fax: 038720940
agricultural products in 1995 brought an end to country’s economics growth and real per capita income. Between 1989 and 1997 real per capita income dropped at a rate of 7.8 percent per year (Ademosun, 2000).
During this period, the federal government of Nigeria maintained a trade policy dominated by quantitative restrictions and price controls on food items. In January 1990, a tax was imposed on meat imports, ostensibly to raise government revenues and stimulate domestic meat production. The abrupt drop in meat imports, coupled with inadequate domestic supply pushed up price of meat and thus depressed domestic demand. For example, per capita meat consumption that had risen from 12.05 kg in 1981 to 13.8 kg in 1986 dropped to 11.6 kg in 1992. Also meat prices rose by 70 percent from 1987 to 1999, resulting in a decline in Nigerian per capita meat consumption from 10.5kilograms of meat per year in 1987 to 9.4 kilograms per year in 1999 (Osho and Asghar, 2004).
Although the federal government of Nigeria has designed various programs to help stabilize meat prices and consumption, the country is still experiencing meat shortage and price fluctuations till date (Osho and Asghar, 2004)
Meat demand in most African countries its very low at a level of 25g and the demand is even lower especially in the southern and eastern parts of Nigeria where production of animal protein has not been high enough to meet the demand of rapid growth population (Obi, 2000). Ademosun (2000) puts Nigerian’s total meat production at 810,000 tonnes for a population of about 110 million resulting in a meat production index of 22g per caput per day. Regmi. (2007) noted the unprecedented population growth that has occurred in the last half of the century has created an additional demand for meat and general food in developing countries.
Household demand for meat products such as beef, mutton, pork, chevon and chicken are faced with problems which is mostly due to market prices, consumers taste, credit availability and consumers wealth. This problem leads to unbalance diet because meat contributes essentially to human’s diet Aromolaran (2004) and the consequence of this poor nutritional status is infection which will eventually result in weakness, lethargy, absenteeism, poor productivity and stress (Jamison and Leslie 2001).
B
Globa
lJo
urna
lof
Scienc
eFr
ontier
Resea
rch
V
olum
e
15
()
Janu
ary
2012
D
© 2012 Global Journals Inc. (US)
XII
Issu
e er
sion
IV
I
The findings showed that beef (43.7%) was mostly
percent change in prices of beef,chevon and chicken would
a) Approaches To Estimating Demand Equations In estimating the demand relationships the
formulation of a model expressing these relationship between consumption and the relevant explanatory variables. Various estimation functions have been developed and applied over the years. In their review of such models, Sadoulet and de January (1995).indicated that three demand system have received considerable attention because of their relative empirical expediency. These are the linear expenditure system (LES) developed by Stone (1954), the almost ideal demand system.(AIDS) developed by Deaton and Muellbauer (1980) and the combination of these two system into a generalized Almost Ideal Demand system(GAIDS proposed by Billion (1990). Another variant of the AIDS model is the Quadratic almost ideal demand system (QUAIDS) derived by Bank et al, (1997). Implications for each of these specifications have been well reviewed in the literature on demand analysis.(Wohlegenant, 1984).in this paper the LA/AIDS model is used to estimate the elasticities of demand for meat and meat products such as beef, mutton, and chevon, and chicken, eggs, fish and milk. because of its flexibility as a complete system this model has been used for similar studies in West Africa (Savadogo and Brandt,1988), India (Abdulai and Jain, 2000), Greece (Karagiannis et al, 2000), Morocco ( Mdafri and Borsen, 1993) and the United States of America (Helen and Pompelli, 1998).
II. EMPIRICAL STUDIES
Aromolaran ,(2004) studied intra household redistribution of income and calories consumption in south western Nigeria. His study investigates how per capita calorie in low income households of rural south western Nigeria responds to changes in total household income and women’s share of household income. Two major questions were addressed in this study. First, is calories-income elasticity large enough to justify the use of income increases as a food/nutrition policy strategy for increasing calorie intake among low income household? Second, what is the potential effect of intra – household redistribution of income from men to women on per capital calorie consumption? The results show that calorie income elasticity is small and close to zero implying that income policies may not be the most effective way to achieve substantial improvements in calorie consumption. Moreover, increases in women’s share of household income are likely to result in marginal declines in per capital food calorie intake: this implies that income redistribution from men to women would not increase per capita food energy intake in these households.
Bereket (2003), studied intra-household distribution of expenditure in rural Ethiopia. This study examined the combined effects of changes in prices, income and demographic composition
on young and
adult, males and female household members. The recently developed Quadratic Almost Ideal Demand System (QUAIDS) was used since a demand system provides a unified framework for analyzing the combined effects in a systematic approach. The ‘outlay equivalent method’ which was used with single demand equation in previous studies, was married to the demand system literature. Panel/longitudinal data are used: helping to control for household level heterogeneity. Underlying preference structures for classifying goods into different groups was also examined by conducting alternative tests of separabilitity in preferences. The empirical results show that Ethiopians rural respond to price, income and demographic changes in a more complicated manner than usually assumed, demographic groups absorbing most of the impact differ for different types of changes. Furthermore, changes in household income affected male member (men and boys) more than female members. On the other hand, changes in prices affected women and boys more than men and girls. Also, adjustment in household expenditure due to demographic changes imply that boys were favoured relative to girls. However, the overall position of boys and girls in the household depends not only on the ‘outlay equivalent ratios’, but also on the effect of changes in household incomes and prices as determined by budget and price elasticities. These findings show that household distribute risks among different demographic groups rather than only one group absorbing all shocks. The findings indicated that studies that focus solely at ‘out lay equivalent ratio’ are incomplete.
Taljaard et al., (2003), used the Linear Approximate of Almost Ideal Demand System (LA/AIDS) model to estimate the demand for meat in South Africa. The LA/AIDS was first employ to analyze the demand relations for meat which comprises of beef, chicken, pork and mutton from 1970-2000. Two test for weak separability including an F and likely hood ratio version, failed to reject the null hypothesis of weak separability, confirming that four meat products are separable, and should be modeled together. Hausman exogeneity test show that, the expensive term in the South African meat demand model, is exogenous. As a result, a Restricted Seemingly Unrelated Regression (RSUR) was used to estimate the model, where after the estimated parameters were used to estimate compensated, uncompensated and expenditure elasticities.
Hughes et al., (2000), argued that for a shift: the focus for modeling production from traditional assumption of profit maximization and cost minimization to mere general assumption of managerial utility maximization that can incorporate risk incentives into the analysis of production and recover value-maximizing
Analysis of Household Demand for Meat, in Southwest, Nigeria
Globa
lJo
urna
lof
Scienc
eFr
ontier
Resea
rch
V
olum
e
16
()
Janu
ary
2012
D
© 2012 Global Journals Inc. (US)
technologies. They show how this shift can be implemented using the Almost Ideal Demand System
XII
Issu
e er
sion
IV
I

(AIDS): and the more general way of measuring efficiency that can incorporate a concern for the market of firms assets equity and identify value maximizing firms were suggested. This shift bridges the gap between the risk incentives literature in banking that ignores the microeconomics of production and the production literature that ignores the relationship between production decisions and risk Many authors had used the Almost Ideal Demand System (AIDS) model to determine household demand pattern. Oyekale, (2000), studied the food demand among Nigerian household. Since food calorie has been found to have a strong empirical linkage with both human health productivity: they therefore, determine the probable influence of price and income changes on the availability of nutrient to the Nigerian household. Their findings show that guinea corn is the food that would have the greatest implication for the nutrient status of low income status: while millet, guinea corn and maize and rice, beans and maize respectively are the major food items for the household whose heads earn average and high income. Moreover, Adejobi (2004) studied the demand structure of rural household food pattern in relationship with poverty. In his study, the analysis of food demand revealed that 72.0% of household expenditure was on food; out of this, 56.0% was cereals, while 22.0%, 7.0%, 5.0%, 5.0%, 4.0% and 1.0% respectively was on animal protein, fruits, vegetables, legumes, roots and tubers, fats and oils other food items.
III.
JUSTIFICATION FOR THE STUDY
Meat is a nutritious food containing quantities of essential amino acids in forms of protein, It contains B group vitamins (especially niacin and riboflavin), iron phosphorus, ash and calcium. Adeshinwa et al., (1999) observed that the Food and Agricultural Organization (FAO) recommended that an average of 200g animal protein is required per day for healthy living in the developing countries. (Obi, 2000), explained that global demand for meat production will increase by 58% between 1995 and 2020 and that the consumption of meat will increase tremendously by 2020.
Proteins are the major structural components of
all cells of the body and amino acids are the building blocks of human proteins. Protein can function as enzymes, membrane transporters and hormones. As far as the human body is concerned there are two types of amino acids .There are essential and non essential amino acid. The former cannot be produced by the body while the latter can be produced out of other biochemical products in the body. The only means of obtaining essential amino acid is through feeding (Bopape and Myers, 2007).
Protein contains approximately 22 amino acids, eight of which are essential. The sulphur containing
amino acids: methionine, cysteine and cystine are particularly important for the health of the brain and nervous system. Protein constitute about 90% of dry weight of food, 80% of enzymes, hormones and antibodies of which meat is a major source (Oloyede, 2005). Proteins form the foundation for muscles, skin,bone, heart and billions of biochemical activities. When we fail to consume adequate amounts of protein, it result in growth retardation with the body being prone to infections and poor wound healing.
Man obtains his necessary proteins from either animals or vegetables. Meat from cattle, goat, sheep, pig and poultry are the main sources of daily per capita consumption of animal proteins. According to Britton (2003) the main difference between
animal and plant protein is that animal products contain different ratios of amino acids and higher concentrations of proteins than most plant products. Hence in a strictly vegetarian diet, it is important to mix and match different plants to get the variety of protein and amino acids needed in the body as opposed to plant proteins in which one or more of these essential amino acids
are lacking (Oloyede, 2005). Omotosho (2004) estimated that the daily minimum protein required of an adult in Nigeria should be between 65 and 85g per person and that 35g of this minimum requirement should be obtained from animal products.
A review of the data of food supplies available for consumption in different countries shows that the per caput proteins intakes in developing countries, Nigeria inclusive is comparatively low. Not only is the total protein deficient but the quality of dietary protein available is inferior to that consumed in developed countries FAO/WHO (2001).
a)
Nutritional Value Of Meat
Meat, and other animal foods such as milk, can make a valuable contribution to the diets in developing countries. It has less nutritional importance in industrialized countries where a wide variety of foods of all kinds is available. Many diets in developing countries are based on cereals or root crops and are relatively bulky, especially where fats are in short supply, and this can limit the total energy intake. This is especially true of infants after weaning and young children. The importance of meat in the diet is as a concentrated source of protein which is not only of high biological value but its amino acid composition complements that of cereal and other vegetable proteins. It is also a good source of iron and zinc and several B vitamins, and liver is a very rich source of vitamin A (Somaiya, 1982).
Globa
lJo
urna
lof
Scienc
eFr
ontier
Resea
rch
V
olum
e
17
()
Janu
ary
2012
D
© 2012 Global Journals Inc. (US)
Demand for meat and meat products has been assessed as an aggregate subset of the food category analyzed as one or two products separately from the general meat category in different countries. Abdulai and Jain (1999) made projections estimates for food and non-food commodities in Indonesia and
Analysis of Household Demand for Meat, in Southwest, Nigeria
XII
Issu
e er
sion
IV
I
desegregated data on the meat category(e.g. meat, poultry) as a subset of food categories.
Goat meat, also known as chevon (Northern Europe) Cappreto (Australia and Southern Europe) or Cabrito (Hispanic).has been around since the advent of civilization. It is the rising star in the red meat proteins as a result of its lower total fat, unsaturated fat, calories and cholesterol than traditional meats. It retains a sweet flavour which is reminiscent to mutton with similar protein content.
Chicken meat is derived from poultry and it is reputed to be one of the safest meats available, as it is least associated with any side effects of consumption.
Many scientific studies have been conducted on chicken to assess its healthy
properties and most of the research have found very positive side effects of the meat on human health. It is a very good source of lean high quality protein. Protein is an essential nutrient for growth and development and also plays important role in assisting overweight and obese people in losing weight fast. It is a good source of phosphorus ,which is a very essential mineral for the body .phosphorus maintains the health of teeth bones and also healthy functioning of the kidneys ,liver, and the central
nervous system (Luz, 2009).
Although the most liking feature of meat consumption in many African society is the overwhelming importance of meat which contributes over 70% of betal protein intake Today, the increasing human population in the face of inelastic production strategies appear to have widened the demand supply gap and accentuates society of meat products. Regmi. (2007) supported this view and noted that the unprecedented growth that has occurred in the last half of the century has created an additional demand for meat and general food in developing countries.
Production capacity of beef and other meat products has failed to match with the human population growth and distribution of livestock in Nigeria is inadequate. Composite transportation cost incurred coupled with remote distance between major meat producing areas and consuming urban centres together make the value of wholesome beef, mutton, pork, chicken and chevon often unavailable (Mdafri and Borsen,1993). Early empirical studies on meat
production and consumption focused on single meat product analysis with little or no work done on effect of socio-economic variables on demand and effect of prices on expenditures.
This study was conducted to add to the existing literature by comparing how the changes in income and price affect the demand for meat products. The following are the objectives of the study;
1)
Ascertain household preferential characteristics for meat product in the study area.
2)
Analyse household expenditure on
meat products in the study area.
3)
Estimate its own price, cross price and expenditure elasticity of demand for meat in the study area.
IV.
METHODOLOGY AND DATA
This study investigated household demand for meat in Oyo, Osun and Ondo States of Nigeria. The systematic sampling technique was used to select two hundred and forty household (n = 240) respondents from the study area; eighty respondents (80) from each state and data were collected through well structured questionnaire. Analysis was done using Descriptive Statistics and Almost Ideal Demand System (AIDS) Model.
a)
Linear approximate of almost ideal demand system model
Theoretical model of demand are single and system of demand equations. Systems of demand include models such as; Translog model, Rotterdam model, Linear Expenditure System (LES) model, Armington model and Almost Ideal Demand System (AIDS) model (Giancarlo et al, 1994). The main difference between single equation model and AIDS is that the latter employs budget share as dependent variable: while the single equation make use of quantity consumed as dependent variable.
AIDS was used in this study because of its desirable properties relatives to the other models (Deaton and Muellbauer, 1980b). The functional form is general allowing variable to be either substitute or complement. AIDS flexibility allows it to encompass broad ranges of behavior and it avoids nonlinear estimation. It’s flexibility permit wide range of variable to be included in the household demand modeling. It is consistent with the theory of demand, additivity, substitution, homogeneity and the postulate that household maximize utility (minimize cost) in their consumption decision making process. Since Deaton and Muellbauer (1980b) proposed AIDS model, it has been widely applied in
many empirical studies for consumer behavior for both cross sectional and time series data.
The Linear Approximate AIDS (LA/AIDS) of Deaton and Muellbauer (1980b), that uses Stone (expenditure) share weighted price instead of the
Globa
lJo
urna
lof
Scienc
eFr
ontier
Resea
rch
V
olum
e
18
()
Janu
ary
2012
D
© 2012 Global Journals Inc. (US)
nonlinear general price index of full AIDS model is used to estimate the demand system.
The price and expenditure elasticities were derived from parameter estimates of the model using the following formulae:
Own-price elasticity: =
1 + U
αi1 U Bi
wi
Analysis of Household Demand for Meat, in Southwest, NigeriaXII
Issu
e er
sion
IV
I
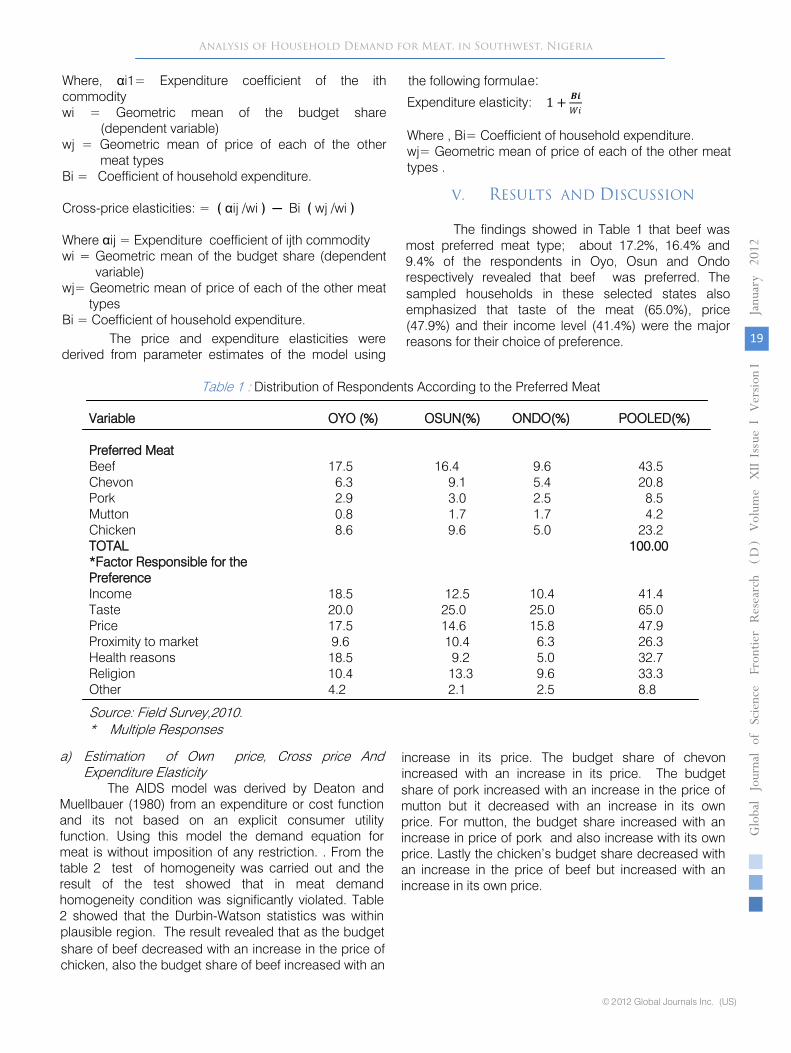
Where, αi1= Expenditure coefficient of the ith commodity
wi = Geometric mean of the budget share
(dependent variable)
wj = Geometric mean of price of each of the other
meat types
Bi = Coefficient of household expenditure.
Cross-price elasticities: = ﴾
αij /wi ﴿
Bi ﴾
wj /wi ﴿
Where αij = Expenditure coefficient of ijth commodity
wi = Geometric mean of the budget share
(dependent variable)
wj= Geometric mean of price of each of the other meat types
Bi = Coefficient of household expenditure.
Where , Bi= Coefficient of household expenditure.
wj= Geometric mean of price of each of the other meat types .
V.
RESULTS AND DISCUSSION
The findings showed in Table 1 that beef was most preferred meat type; about 17.2%, 16.4% and 9.4% of the respondents in Oyo, Osun and Ondo respectively revealed that beef was preferred. The sampled households in these selected states also emphasized that taste of the meat (65.0%), price (47.9%) and their income level (41.4%) were the major reasons for their choice of preference.
Globa
lJo
urna
lof
Scienc
eFr
ontier
Resea
rch
V
olum
e
19
()
Janu
ary
2012
D
© 2012 Global Journals Inc. (US)
a) Estimation of Own price, Cross price And Expenditure Elasticity
The AIDS model was derived by Deaton and Muellbauer (1980) from an expenditure or cost function and its not based on an explicit consumer utility function. Using this model the demand equation for meat is without imposition of any restriction. . From the table 2 test of homogeneity was carried out and the result of the test showed that in meat demand homogeneity condition was significantly violated. Table 2 showed that the Durbin-Watson statistics was within plausible region. The result revealed that as the budget share of beef decreased with an increase in the price of chicken, also the budget share of beef increased with an
increase in its price. The budget share of chevon increased with an increase in its price. The budget share of pork increased with an increase in the price of mutton but it decreased with an increase in its own price. For mutton, the budget share increased with an increase in price of pork and also increase with its own price. Lastly the chicken’s budget share decreased with an increase in the price of beef but increased with an increase in its own price.
Variable
Preferred MeatBeef ChevonPorkMuttonChickenTOTAL*Factor Responsible for thePreference Income Taste PriceProximity to marketHealth reasonsReligionOther
OYO (%) OSUN(%)
17.5 16.4 6.3 9.12.9 3.00.8 1.7
8.6 9.6
18.5 12.520.0 25.017.5 14.69.6 10.418.5 9.210.4 13.34.2 2.1
ONDO(%)
9.6 5.4 2.5 1.7 5.0
10.4 25.0 15.8 6.3 5.0 9.6 2.5
POOLED(%)
43.520.8 8.5 4.223.2
100.00
41.465.047.926.332.733.38.8
Expenditure elasticity: 1 + 𝑩𝑩𝑩𝑩𝑊𝑊𝑊𝑊
Table 1 : Distribution of Respondents According to the Preferred Meat
Source: Field Survey,2010.* Multiple Responses
The price and expenditure elasticities were derived from parameter estimates of the model using
the following formulae:
Analysis of Household Demand for Meat, in Southwest, Nigeria
XII
Issu
e er
sion
IV
I
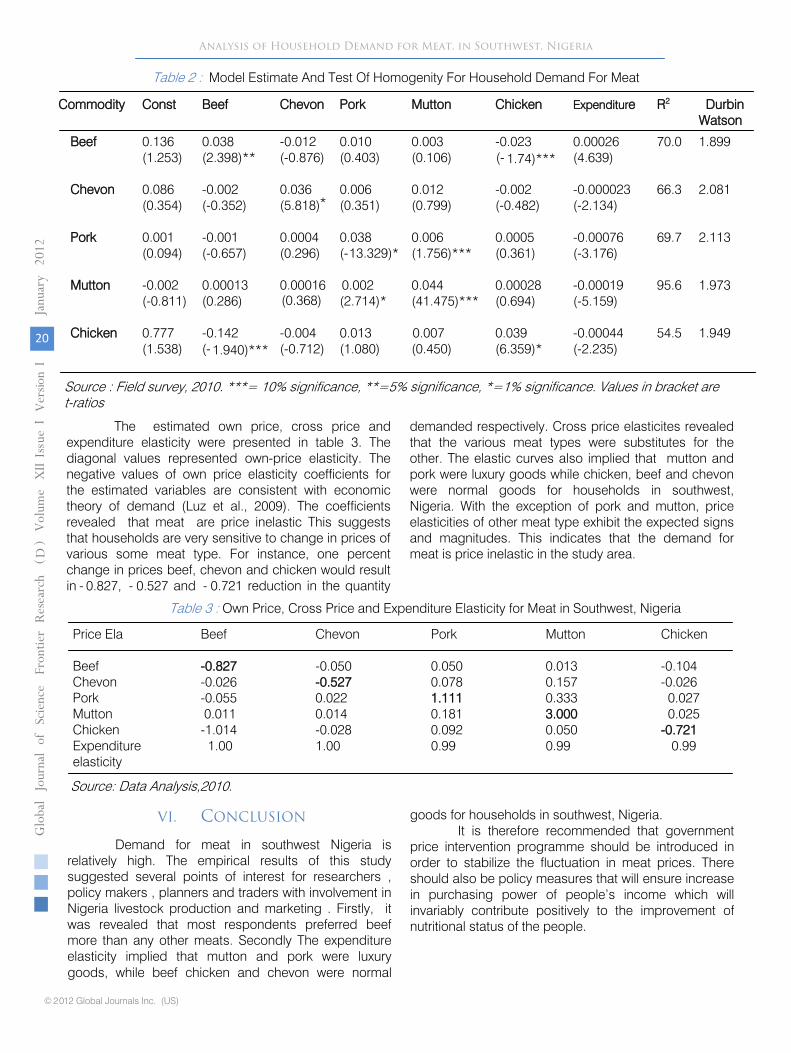
Table 2
: Model Estimate And Test Of Homogenity For Household Demand For Meat
Source
: Field survey, 2010. ***= 10% significance, **=5% significance, *=1% significance. Values in bracket are
t-ratios
Globa
lJo
urna
lof
Scienc
eFr
ontier
Resea
rch
V
olum
e
20
()
Janu
ary
2012
D
© 2012 Global Journals Inc. (US)
Commodity Const Beef Chevon Pork Mutton Chicken Expenditure R2 Durbin Watson
Beef 0.136(1.253)
0.038(2.398)**
-0.012(-0.876)
0.010(0.403)
0.003(0.106)
-0.023 (- 1.74)***
0.00026(4.639)
70.0 1.899
Chevon 0.086(0.354)
-0.002(-0.352)
0.036(5.818)*
0.006(0.351)
0.012(0.799)
-0.002(-0.482)
-0.000023(-2.134)
66.3 2.081
Pork 0.001(0.094)
-0.001(-0.657)
0.0004(0.296)
0.038(-13.329)*
0.006(1.756)***
0.0005(0.361)
-0.00076(-3.176)
69.7 2.113
Mutton -0.002(-0.811)
0.00013(0.286)
0.00016(0.368)
0.002(2.714)*
0.044(41.475)***
0.00028(0.694)
-0.00019(-5.159)
95.6 1.973
Chicken 0.777(1.538)
-0.142 (- 1.940)***
-0.004(-0.712)
0.013(1.080)
0.007(0.450)
0.039(6.359)*
-0.00044(-2.235)
54.5 1.949
The estimated own price, cross price and expenditure elasticity were presented in table 3. The diagonal values represented own-price elasticity. The negative values of own price elasticity coefficients for the estimated variables are consistent with economic theory of demand (Luz et al., 2009). The coefficients revealed that meat are price inelastic This suggests that households are very sensitive to change in prices of various some meat type. For instance, one percent change in prices beef, chevon and chicken would result in - 0.827, - 0.527 and - 0.721 reduction in the quantity
demanded respectively. Cross price elasticites revealed that the various meat types were substitutes for the other. The elastic curves also implied that mutton and pork were luxury goods while chicken, beef and chevon were normal goods for households in southwest, Nigeria. With the exception of pork and mutton, price elasticities of other meat type exhibit the expected signs and magnitudes. This indicates that the demand for meat is price inelastic in the study area.
Table 3 : Own Price, Cross Price and Expenditure Elasticity for Meat in Southwest, Nigeria
Price Ela Beef Chevon Pork Mutton Chicken
Beef -0.827 -0.050 0.050 0.013 -0.104Chevon -0.026 -0.527 0.078 0.157 -0.026Pork -0.055 0.022 1.111 0.333 0.027Mutton 0.011 0.014 0.181 3.000 0.025Chicken -1.014 -0.028 0.092 0.050 -0.721Expenditure elasticity
1.00 1.00 0.99 0.99 0.99
Source: Data Analysis,2010.
VI. CONCLUSION
Demand for meat in southwest Nigeria is relatively high. The empirical results of this study suggested several points of interest for researchers , policy makers , planners and traders with involvement in Nigeria livestock production and marketing . Firstly, it was revealed that most respondents preferred beef more than any other meats. Secondly The expenditure elasticity implied that mutton and pork were luxury goods, while beef chicken and chevon were normal
goods for households in southwest, Nigeria.It is therefore recommended that government
price intervention programme should be introduced in order to stabilize the fluctuation in meat prices. There should also be policy measures that will ensure increase in purchasing power of people’s income which will invariably contribute positively to the improvement of nutritional status of the people.
Analysis of Household Demand for Meat, in Southwest, NigeriaXII
Issu
e er
sion
IV
I
1.
Adegeye, A. (1988) “A Statistical Analysis of Demand for Beef in the Western State of Nigeria.” Readings in the Agricultural Marketing. University of Ibadan, Nigeria.
2.
Adeshinwa A.O.K, F. Ogunmodede and A.O Ogunsanmi (1999): Weaner Pigs Fed Upgraded Level of Maize Offal as Replacement for Maize and its Effects on Performance. Tropical. Journal. Animal Science 1: 101-105
3.
Adejobi A.O(2004): Rural Poverty ,Food Production and Demand
in Kebbi State Nigeria, Unpublished PhD Thesis ,Department of Agricultural Economics, University of Ibadan, Ibadan.
4.
Ademosun,A.A.(2000):Structural Adjustment and the Nigerian Livestock Industry Stuporin Infancy. Keynote address delivered at the Nigerian Society For Animal production Annual Conference held at University of Agriculture, Makurdi.
5.
Aromolaran (2004): Household Income Womens Share of Income and Calorie Intake In South Western Nigeria Food Policy,29 (50) pp507-530.
6.
Banks, J.; Blundell, R., and A.
Lewbel. “Quadratic Engel Curves and Consumer Demand.” The Review of Economics and Statistics 79(4)(November 1997):527-539.
7.
Bopape, L and Myers R (2007): Analysis Of Household Demand For Food In South Africa; Model Selection, Expenditure Endogeneity And The Influence Of Socio-Demographic Effects, African Econometrics Society Annual Conference, Cape Town, South Africa
8.
Bereket K,. (2003): Intra-Household Distribution Of Expenditures In Rural Ethiopia : A Demand System Approach ‘’CSAE Working Paper Series 2003-08, Center For The Study Of African Economies. University Of Oxford.
9.
Britton A. (2003): Annual Protein Issues, Speed Way Publishers
10.
Deaton, A., and J. Muellbauer. (1980) “An Almost Ideal Demand System.” American Economic Review 70(3):312-336.
Globa
lJo
urna
lof
Scienc
eFr
ontier
Resea
rch
V
olum
e
21
()
Janu
ary
2012
D
© 2012 Global Journals Inc. (US)
11. Helen. D and Pompelli .G(1988): The Demand For Beef Products: Cross Section Estimation Of Demographic And Economic Effects Western Journal Of Agricultural Economics 13 (1) 37-44
12. Hughes.C, and Joseph. P(2000): Capitalization and cost: Evidence of Scale Economics in Risk management and Signaling, review of Economics and Statistics, vol.80,,pp 314-25.
13. Jamison, D.T. , Leslie .J. (2001): Evidence from China and Comparison” Food and Nutrients Bulletin, 24(2): 145-154, The United Nation University.
14. Karaguannis. , Katrandis and Velentzask (2000): An Error Correction Almost Ideal Demand System For Meat In Greece Agricultural Economics 22 (1) 29-35
15. Mdafri A, and B.W. Borsen (1993):Demand for Red Meat Poultry and Fish in Morocco. An Almost Ideal Demand System. Am .J.Agric Econ, 155-163.
16. Luz M, Malabayabas M, Yorobe J.M and De Castro N.L (2009) Household Demand Analysis For Fresh Meat In The Philippine. Philippine Jornal Of Veternary And Animal Sciences 35 (2): 168 -176
17. Obi C.I (2000): Game Production- An Accumulative To Beef Game Production. An Alternative To Beef Cattle Production In Southern Nigeria Forum., 4:36-40
18. Oloyede H.O.B (2005): All for The Love of Nutrients The Seventy Eight Inaugural Lecture, Worthy And Publication, Commerce University of Ilorin.
19. Osho G.S and Asgar .N (2004): Consumerism: Statistical Estimation of Nigeria Meat Demand. Allied Academies International Conference.www.sbaer.uca.edu/research/allied/2004/international/Business/pdf/14.pdf. Retrieved-27/9/11
20. Oloyede H.O.B (2005): All for The Love of Nutrients The Seventy Eight Inaugural Lecture, Worthy And Publication, commerce University of Ilorin.
21. Omotosho J.S (2004):“key note address” Proceedings of the FISON Annual Conference. Fishers Society of Nigeria
22. Pollak R.A and T.J Wales,(2003).:Demographic Variables In Demand Analysis.Econometrica, 49:533-538.
23. Regmi, A.,(2002).: Urbanization And Food Consum-ption. A USDA City study_aregmi@ers_usda.gov
24. Sadoulet and de Janury (1998): Quantitative Development Policy Model for The Growth And Development of Three Demand System.
25. Savadoo and Brandt (1988): Household food demand in Burkina Faso Implications of Food Policy Agricultural Economics .
26. Sonaiya E.B,(1982): Beef Quality And Nigeria Consumer. In Beef Production Nigeria. National Conference. Beef Production, pp: 555-564.
27. Stone. R. (1954): Linear expenditure systems and demand analysis, An application to pattern of British demand Economic Journal 64:511-527
28. Taljaard P.R. and VanSchalkwyk,H.D (2003): National Department of Agriculture (NDA ) (2003).Abstracts of Agricultural Statistics, RSA.
29. Wohlegenant (1984) lee et al (1994): Conceptual and Functional Form issues in estimating demand elasticities. American Journal of Agricultural Economics 66 (27):211-217
REFERENCES RÉFÉRENCES REFERENCIAS
Analysis of Household Demand for Meat, in Southwest, Nigeria
XII
Issu
e er
sion
IV
I
Globa
lJo
urna
lof
Scienc
eFr
ontier
Resea
rch
V
olum
e
22
()
Janu
ary
2012
D
© 2012 Global Journals Inc. (US)
Analysis of Household Demand for Meat, in Southwest, Nigeria
This page is intentionally left blank XII
Issu
e er
sion
IV
I
© 2012 . Raufu M. O., Akinniran T.N., Olawuyi S.O., Akinpelu M. O.This is a research/review paper, distributed under the terms of the Creative Commons Attribution-Noncommercial 3.0 Unported License http://creativecommons.org/licenses/by-nc/3.0/), permitting all non commercial use, distribution, and reproduction in any medium, provided the original work is properly cited.
Economic Analysis Of Rural Women Income From Non-Timber Forest Products In Ife South Local Government Area Of Osun State, Nigeria
By Raufu M. O., Akinniran T.N., Olawuyi S.O., Akinpelu M. O. Ladoke Akintola University of Technology, Ogbomoso Oyo State, Nigeria
Abstract - This study was carried out to examine the effects of Non-timber forest products (NTFPs) on rural women income in Ife South Local Government area of Osun State, Nigeria. A sample of 90 respondents were randomly selected from five (5) of the eleven (11) wards. A structured interview schedule was administered on the respondents. Data were collected and analyzed using frequency counts, percentage and econometric model. The study discovered that there is a positive and significant relationship between the year of education, total cost and income earned from NTFPs activities, and a negative but significant negative association with distance from forest to point of sale . The majority of the respondents (58.9%) supported Non-availability of NTFPs as the significant effect of deforestation on NTFPs activities. The major problem encountered in NTFPs gathering and marketing are insufficient labour (38.9%), storage problem (23.2%), and thieves (14.4%).
Keywords : Non -Timber Forest Products (NTFPs), Tropical Forests, Rural women, Source of Livelihood, Deforestation.
Strictly as per the compliance and regulations of:
Global Journal of Science Frontier ResearchAgriculture & BiologyVolume 12 Issue 1 Version 1.0 January 2012Type : Double Blind Peer Reviewed International Research JournalPublisher: Global Journals Inc. (USA)Online ISSN: 2249-4626 & Print ISSN: 0975-5896
GJSFR-D Classification : FOR Code:140201,120505
Economic Analysis Of Rural Women Income From Non-Timber Forest Products In Ife South Local Government Area Of Osun State, Nigeria
Economic Analysis Of Rural Women Income From Non-Timber Forest Products In Ife South Local Government Area Of Osun State, Nigeria
Raufu M. O.α, Akinniran T.N.Ω, Olawuyi S.O.β, Akinpelu M. O. ѱ
Abstract - This study was carried out to examine the effects of Non-timber forest products (NTFPs) on rural women income in Ife South Local Government area of Osun State, Nigeria. A sample of 90 respondents were randomly selected from five (5) of the eleven (11) wards. A structured interview schedule was administered on the respondents. Data were collected and analyzed using frequency counts, percentage and econometric model.
The study discovered that there is a positive and significant relationship between the year of education, total cost and income earned from NTFPs activities, and a negative but significant negative association with distance from forest to point of sale .
The majority of the respondents (58.9%) supported Non-availability of NTFPs as the significant effect of deforestation on NTFPs activities. The major problem encountered in NTFPs gathering and marketing are insufficient labour (38.9%), storage problem (23.2%), and thieves (14.4%).
It is therefore, recommended that the government should educate the women and embarks on policies and strategies that aim at improving the welfare of rural people and controlling the rate of deforestation. Keywords : Non -Timber Forest Products (NTFPs), Tropical Forests, Rural women, Source of Livelihood, Deforestation.
I. INTRODUCTION
a) Background Tropical forests provide ample goods and
services; these mainly include timber and Non-Timber Forest Products (NTFPs). NTFPs have been studied by researchers from many different academic fields and each field used a slightly different definition of NTFPs. NTFPs are any product or service other than timber that is produced in a forest (CIFOR, 2004). They include fruits, nuts, vegetables, fish and, medicinal plants, resins, essences, and a range of barks and fibers such as bamboo, rattans, and a host of other palms and grasses. NTFPs are indispensable part of the livelihood strategy of communities living in and near forests. Non-timber forest products (NTFPs) constitute an important source of livelihood for millions of people across the
Author α: Department of Agricultural Economics and Extension, Ladoke Akintola University of Technology, P.M.B. 4000, Ogbomoso Oyo State, Nigeria. E-mail : [email protected]
Tel. +2348038261934
world. In India alone it is estimated that over 50 million people are dependent on NTFPs for their subsistence and cash income (Shaanker et al., 2004). Forest-based activities in developing countries, which are mostly in NTFPs area, provide an equivalent of 17 million full-time jobs in the formal sector and another 30 million in the informal sector, as well as 13-35% of all rural non-farm employment (Duong, 2008).
The independent nature of the activity is also suitable for people who do not fit comfortably within the demands of contemporary wage labour. The primary requirements to work with NTFPs are knowledge of products, their uses and locations, and the time, energy and mobility to access (Pierce et al., 2002). Clay (1992) and Ruiz Perezi (2005) stated that NTFPs attracted early attention among practitioners and researchers alike, based on three largely untested assumptions: i) NTFPs are widely distributed, contributing more than timber to forest people’s livelihoods; ii) their harvesting is ecologically more friendly than alternative forest or non-forest uses , and iii) an increasing their commercial value will contribute to an increased appreciation of forests, therefore contributing both to poverty alleviation and to forest conservation.
Forests contribute to all aspects of rural life: providing food, fodder, fuel, medicines, building materials, and materials for all sorts of household items, as well as many more intangible benefits such as cultural symbols, ritual artifacts and locals (Facloner, 1995). There is, however, great variation in the extent to which forest products are used from area to area and even between households within a community. Because of this variation, it is difficult to abstract generalizations about NTFPs use. Indeed, this variation reflects the extent to which NTFPs are an integral part of rural livelihoods. People only exploit resources from the forests when they cannot be found on nearby fallow lands, or when they are collecting for trade and better supplies are available in the forest. Classifying these products into like categories is an important first step of understanding the NTFPs industry.
NTFPs can be classified into different categories, based on the purpose of use (for example, as food, fuel, medicine, house hold utensils, farm
Globa
lJo
urna
lof
Scienc
eFr
ontier
Resea
rch
V
olum
e
23
()
Janu
ary
2012
D
© 2012 Global Journals Inc. (US)
implements); level of use (self supporting, commercial);
XII
Issu
e er
sion
IV
I

the part of plants harvested (leaf, fruit, stem ,roots ) and trophy from wild animals (Jeannette, 2000). For this study, the classification of NTFPs is based on categories related to their use and on the
recently
developed International Economic Botany Data Collection Standard use categories of NTFPs (Andel, 2006) is considered.
This paper provides answers to the following questions;
•
What are the socio- economic characteristics of the
respondents? •
What are the main types of NTFPs in the study forest area?
•
What are the effects of NTFPs on rural women income?
•
What are the problems encountered in NTFPs gathering and marketing?
b)
Objectives of the Study
The overall objective of this study is to investigate
the effect of non-timber forest products on
the income of rural women in Ife South Local Government.
c)
Specific objectives
•
To describe the socio-economic characteristics of the respondents.
•
To identify the NTFPs usually collected by the women.
•
To ascertain the effect of NTFPs on rural women income.
•
To highlight the problems encountered in NTFPs gathering.
II.
METHODOLOGY
This research was carried out in Ife-south local
government area of Osun state, which has its secretariat at Ifetedo in Ife. The council is heterogeneously populated with high domination of Yoruba, all doing legitimate business harmoniously. The people of the area are mostly farmers.
The study population is made up of rural women who are engaged in NTFPS activities selected randomly across the
local government area to give a
total of 90 respondents. Primary data were collected through structured interview and data were analysed using descriptive statistics and econometric model.
The model is specified as:
Y = f(X1, X2, X3……X7)
Where Y = the rural women income
X1
= Age (yrs)
X2
= Year of Education
X3
= Family Size
X4
= Years of Experience
X5
= Hours Spent in NTFPS Collection
X6
= Distance to point of sale
X7
= Total production cost
This is estimated using four functional forms;
Linear function:
Y
= b0
+ b1x1
+ b2x2
+ b3x3
+ b4x4
+ …………..b7x7
+ e
Semi-log function:
Y = lnb0
+ b1lnx1
+ b2lnx2
+ b3lnx3
+ b4lnx4
+
…………..b7lnx7
+ e
Double log function:
lnY = lnb0
+ b1lnx1
+ b2lnx2
+ b3lnx3
+ b4lnx4
+
…………..b7lnx7+ e and
Exponential function:
lnY =
b0
+ b1x1
+ b2x2
+ b3x3
+ b4x4
+ …………..b7x7
+ e
Where:
b1
–
b8 = regression coefficient of the variables
b0 = Constant Term
e = Error Term
III.
RESULT AND DISCUSSION
Table 1 shows the socio-economic characteristics of the respondents.76.7% of the respondents fell within age range 20-50years, and the mean age was 40.76years. Majority of the women are married (70%), this is to serve as financial support to the husband and children. 74.5% of the women has years of experience between 1-20years and the mean value is 15.46years which implies that people are realizing the potentials of NTFPS in the recent decades. Most respondents engage in trading to supplements income from NTFPS, other source of income include, farming (32%) and civil servants(3%).
The data in table 2 shows the distribution of
various NTFPS usually collected by the women in the study area. The distribution according to the data collected is tri-modal. Equal number of people collect seasonal fruits, leaves and snails with 16.7% each of the total population. The diversion of most household to these products is due to their high income generating power than other NTFPS and their availability in the forest. Falconer (1992) noted that forest foods continue
Economic Analysis Of Rural Women Income From Non-Timber Forest Products In Ife South Local Government Area Of Osun State, Nigeria
Globa
lJo
urna
lof
Scienc
eFr
ontier
Resea
rch
V
olum
e
24
()
Janu
ary
2012
D
© 2012 Global Journals Inc. (US)
to contribute significantly to the diet of many rural households while a great variety of goods are gathered from forest and fallow lands, the forests commonly
XII
Issu
e er
sion
IV
I
supply tubers, mushrooms and snails. Less people engaged in mushroom collection because it is readily available every where for every household,
so, their marketing will be less economical. NTFPS coded by others include; honey, vegetables, ropes, e.t.c. Lesser people are into the collection of these products because they are available in little quantity. For vegetables, nearly every villager has access to it so it is less demanded in market.
Table 3 distributes the respondents according to income earned from other occupation and NTFPS. The highest income earned from NTFPS was within the range of #8,100 to #10,000, while the highest income from other occupation is between #4,100 and #6,000. From the analysis, it could be inferred that the major source of income to the household is the NTFPs and income from other occupation only supplements the real income. Studies conducted by (Shackleton and Shackleton, 2004) show that extraction, processing, and trading of NTFPs is often the only employment available for the population in remote rural areas. Being able to collect and use NTFP to a meet daily needs of energy, shelter, food and medicine, allows the scarce cash resources to be used to secure other household needs and to attempt to accumulate the necessary asset base for a more secure livelihood. This includes the education of children, investment in agricultural tools, or capital for activities that generate income. Such a cost saving would best be reflected by replacement values of the goods that the NTFPs substitute, rather than direct-use value based on farm-gate prices (Shackleton and Shackleton, 2004).
From table 4, the major perceived effect of deforestation on NTFPs is the non –availability of NTFPs as supported by 58.9% of the population study. 28.9% 0f the population attested to soil degradation. When a tree is cut off, other valuable NTFPs are removed along with it and the soil structure is greatly affected. Many who approach NTFPs sector as conservation tool begin with a set of basic assumptions. It is assumed that natural forest will have greater long-term benefits if left standing; that local people will tend to manage their forest resources more sustainable if they directly benefit from doing so; and that poverty in forest communities is both caused by, degradation of the forest resources (Clark, 2004). The logical conclusion is that if poverty can be alleviated through harvesting forest products, then there will be greater incentive to conserve those forests (Neumann and Hirsch, 2000).
Table 5 distributes the respondents on basis of problem encountered in NTFPs activities. 38.9% supported insufficient labour,23.3% supported storage problem, 8.9% are restricted from the forest, 2.2% lack
Table 6 presents the regression analysis. Of the four functional forms, the exponential function was selected as the lead equation based on the value of adjusted R2 (0.765); which implies that 76.5% of the variation in women income(dependent variable) is explained by the independent variable
(Xs). Years of education (X2) and total cost (X7) have positive and significant relationship with the income earned by the women from NTFPs while distance from forest to point of sale (X6) has a negative and significant association with it. The primary requirement to work with NTFPs
are knowledge of product, their uses and location, and the time, energy and mobility to access (Pierce et al, 2002). These requirements are fulfilled with increasing years of education among the respondents and contrary to the apriori expectation, total cost can increase income from NTFPs if accompanished by increased quality of products. Also, distance from forest to point of sale (X6) has a negative and significant effects on NTFPs income which may results from large transportation cost, if large quantities of NTFPs is gathered. Getachew et al (2007) also noted that distance from forest, household total income; adult labor and household size are among the factors that influence people dependence on forest resources. With the exception of household size, these factors are negatively related to forest income (Getachew et al 2007). Although not significant, hours spent in NTFPs collection had a negative effects on the income resulting from deforestation effects which causes non availability of the NTFPs and soil degradation has attested to by majority of the respondents and it is not significant.
IV.
SUMMARY CONCLUSION AND RECOMMENDATIONS
Summarily, the socio-economic characteristics
that affect the women income from NTFPs are age, marital status, years of education and other occupations they engaged in. Also, the major NTFPs activities they engaged in are leaves gathering seasonal fruit collection and snail gathering and major effect of deforestation perceived by the women are non-availability of NTFPs and
soil degradation. The problem encountered in NTFPs include, inaccessibility to forest and forest produce, storage problem, thieves and marketing problems.
From this study, it can be concluded that certain factors affect the income earned by Rural women such as age, years of education family size, years of experience, hours spent in gathering NTFPs, distance point of sale and total production cost. Among these factors, the years of education, total cost and distance
Globa
lJo
urna
lof
Scienc
eFr
ontier
Resea
rch
V
olum
e
25
()
Janu
ary
2012
D
© 2012 Global Journals Inc. (US)
define right to the forest produce, 14.4% supported thieves stealing their produce and 11.1% respondents are faced with marketing problems.
from forest to point of sale are important and significant determinant of the rural women income. NTFPs are the major source of income to the rural women.
Economic Analysis Of Rural Women Income From Non-Timber Forest Products In Ife South Local Government Area Of Osun State, Nigeria
XII
Issu
e er
sion
IV
I

Deforestation has a significant effect on the availability of the NTFPs in the forest. The major problem encountered in NTFPs in the area was the insufficient of labour.
Based on these findings, it is therefore recommended that government should provide supports to the rural women in areas of education, storage and infrastructural facilities to include good road network. Also, policies and strategies that aim at improving the welfare of the rural people and increase productivity on agricultural land including NTFPs should be put in place.
1.
Adepoju, K. (2007);
2.
Adhikari, B. (2004): “Analysis Household characteristics and forest dependency”: evidence from common property forest management in Nepal Salvatore Di Falco1, Jon Center for Ecology, Law and Policy, Environment Department, University of York, Heslington, York YO10 5DD, UK Ecological Economics 48 (2004) 245–
257.
Economic Valuation of Non-Timber Forest Products (NTFPs), Nigeria.
3.
Andel, (2006.); Non-timberforest product and the value of wild plants.
4.
Angelsen A. and Wunder, S. (2003). “Exploring the Forestry-Poverty Link: Key Concepts, Issues and Research Implications”. CIFOR Occasional Paper No. 40. Center for International Forestry Research, Bogor, Indonesia.
The Netherlands.
5.
Anonymous, (2004.): Atlas of Arsi and Bale Rural Development project
6.
Arnold J. E. M. and Ruez .P, M. (1998): “The role of non timber forest product in conserving and development” in Wallenberg, E. and ingles, A.(eds.). (1998). Incomes from the forest .methods for the development and conservation of forest products for local community, PP.17-42.CIFOR.indonesia.
, Asella. Ethiopia.
7.
Arnold, J. and Ruiz P,
M. (2001): “Can non-timber forest products match tropical forest conservation and development objectives”? .Ecological Economics (39): 437–447.
8.
Arsema .
A (2008): “Value Chain Analysis for Bamboo Originating from Shedem Kebele, Bale Zone”. Msc thesis, Addis Ababa University, Ethiopia.
9.
Aylew, K and Gezahegn, T. (1991); Suitability classification in Apiculture development
10.
Barfoot, J. (2006): “A Study to Investigate the Potential for Development of Non-Timber Forest Products and Values from the Boreal Forests of
. Ministry of Agriculture. Addis Ababa.
management of commercial NTFPs”: implications for livelihoods and conservation, World Development 33 (2005), pp. 1435–1452
12.
Birhanu, D. (2004): “Contribution of non timber forest products to the rural household economy.Gore district, southwestern Ethiopia”. M SC. thesis. SLU/WGCF.
13.
Byron, N and
M, Arnold, (1999): “What futures for peoples of tropical forests”? world development (27),5:789-805.
14.
Campbell, B. M. and M. K. Luckert. (2002):Towards understanding the role of forests in rural livelihood
15.
Campbell, J. Y and Tewari, D .(1995): “Developing and sustaining non timber forest products” some policy issues and concerns with special reference to India journal of sustainable forestry, 1995,(3),53-79.
. Uncovering the hidden harvest: Valuation methods for forest and woodland resources.
Earthscan.
London.
16.
Cavendish, W. (2000): “Empirical regularities in the poverty-environment relationship of rural households: evidence from Zimbabwe”. World Development 28(11):1979-2003.
17.
Cavendish, W. (2002): “Quantitative methods for estimating the economic value of resource use to rural households”. in cifor, (2004). Forests for people and the environment. CIFOR Annual Report.
18.
Chikamai, B. N. and J. Kagombe, (2002): “Country report for Kenya”. In: Review and synthesis on the state of knowledge of Boswellia spp. and commercialization of Frankincense in the drylands of Eastern Africa. KEFRI, Nairobi.
19.
CIFOR, (2004); “Forests for people and the environment”. CIFOR Annual Report (2004), Delacote, J. (2008). The Safety-net Use of Non Timber Forest Products .France.
20.
CIFOR. (1999): “The Status of Non Timber Forest Products in Tanzania” by forestry and beekeeping division”.
21.
Clarke, L. (2004): “The state of art of non timber forest products in West Africa”. Usaid technical paper no.122.washington d c
22.
Clay, J. W. (1992); Some general principles and strategies for developing markets in north America and Europe for non timber forest products.
23.
Duong, N. H. (2008): “The role of non timber forest products in livelihood strategies and household economics in a remote upland village in the upper ca river basinnghe the Phuong”. Journal of science and development feb.2008:88-98.
lesson from cultural survival enterprises,1989-1990.advanced economic Botany.
Globa
lJo
urna
lof
Scienc
eFr
ontier
Resea
rch
V
olum
e
26
()
Janu
ary
2012
D
© 2012 Global Journals Inc. (US)
REFERENCES RÉFÉRENCES REFERENCIAS
Newfoundland and Labrador Memorial University of Newfoundland Botanical Garden”.
11. Belicher, B. M. Ruiz .P and R. Achdiawan, (2005): “Global patterns and trends in the use and
24. EFPA, (1994): Ethiopian Forestry Action Programme
25. Falconer, J (1995); “The major significance of ‘minor’ forest products: The local use and value of forests in the West African humid forest zone” .FAO
. EFPA, Addis Ababa.
Economic Analysis Of Rural Women Income From Non-Timber Forest Products In Ife South Local Government Area Of Osun State, Nigeria
XII
Issu
e er
sion
IV
I
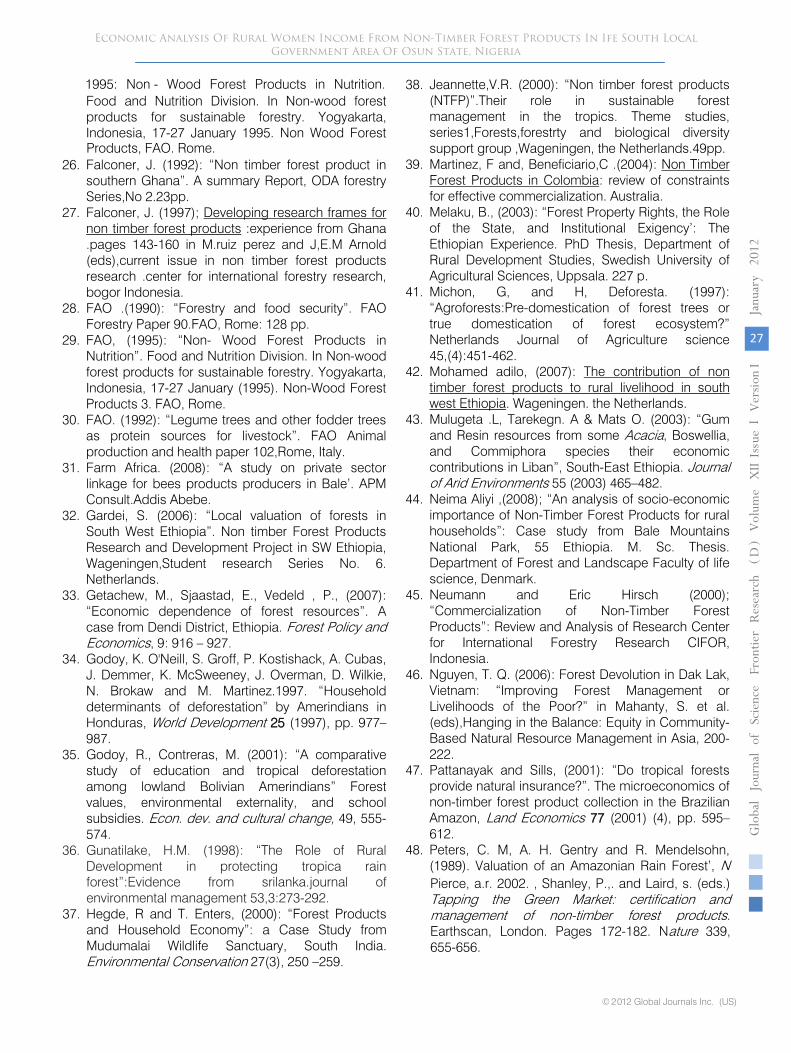
Food and Nutrition Division. In Non-wood forest products for sustainable forestry. Yogyakarta, Indonesia, 17-27 January 1995. Non Wood Forest Products, FAO. Rome.
26.
Falconer, J. (1992): “Non timber forest product in southern Ghana”. A summary Report, ODA forestry Series,No 2.23pp.
27.
Falconer, J. (1997); Developing research frames for non timber forest products
28.
FAO .(1990): “Forestry and food security”. FAO Forestry Paper 90.FAO, Rome: 128 pp.
:experience from Ghana .pages 143-160 in M.ruiz perez and J,E.M Arnold (eds),current issue in non timber forest products research .center for international forestry research, bogor Indonesia.
29.
FAO, (1995): “Non-
Wood Forest Products in Nutrition”. Food and Nutrition Division. In Non-wood forest products for sustainable forestry. Yogyakarta, Indonesia, 17-27 January (1995). Non-Wood Forest Products 3.
FAO, Rome.
30.
FAO. (1992): “Legume trees and other fodder trees as protein sources for livestock”. FAO Animal production and health paper 102,Rome, Italy.
31.
Farm Africa. (2008): “A study on private sector linkage for bees products producers in Bale’. APM Consult.Addis Abebe.
32.
Gardei, S. (2006): “Local valuation of forests in South West Ethiopia”. Non timber Forest Products Research and Development Project in SW Ethiopia, Wageningen,Student research Series No. 6. Netherlands.
33.
Getachew, M., Sjaastad, E., Vedeld , P., (2007): “Economic dependence of forest resources”. A case from Dendi District, Ethiopia. Forest Policy and Economics, 9: 916 –
927.
34.
Godoy, K. O'Neill, S. Groff, P. Kostishack, A. Cubas, J. Demmer, K. McSweeney, J. Overman, D. Wilkie, N. Brokaw and M. Martinez.1997. “Household determinants of deforestation” by Amerindians in Honduras, World Development 25 (1997), pp. 977–987.
35.
Godoy, R., Contreras, M. (2001): “A comparative study of education and tropical deforestation among lowland Bolivian Amerindians” Forest values, environmental externality, and school subsidies. Econ. dev. and cultural change, 49, 555-574.
36.
Gunatilake,
H.M. (1998): “The Role of Rural Development in protecting tropica rain
38.
Jeannette,V.R. (2000): “Non timber forest products (NTFP)”.Their role in sustainable forest management in the tropics. Theme studies,
series1,Forests,forestrty and biological diversity support group ,Wageningen, the Netherlands.49pp.
39.
Martinez, F and, Beneficiario,C .(2004): Non Timber Forest Products in Colombia
40.
Melaku, B., (2003): “Forest Property Rights, the Role of the State, and Institutional Exigency’: The Ethiopian Experience. PhD Thesis, Department of Rural Development Studies, Swedish University of Agricultural Sciences, Uppsala. 227 p.
: review of constraints for effective commercialization. Australia.
41.
Michon, G, and H, Deforesta. (1997): “Agroforests:Pre-domestication of forest trees or true domestication of forest ecosystem?” Netherlands Journal of Agriculture science 45,(4):451-462.
42.
Mohamed adilo, (2007): The contribution of non timber forest products to rural livelihood in south west Ethiopia
43.
Mulugeta .L, Tarekegn. A & Mats O. (2003): “Gum and Resin resources from some Acacia, Boswellia, and Commiphora species their economic contributions in Liban”, South-East Ethiopia. Journal of Arid Environments 55 (2003) 465–482.
. Wageningen. the Netherlands.
44.
Neima Aliyi ,(2008); “An analysis of socio-economic importance of Non-Timber Forest Products for rural households”: Case study from Bale Mountains National Park, 55 Ethiopia. M. Sc. Thesis. Department of Forest and Landscape Faculty of life science, Denmark.
45.
Neumann and Eric Hirsch (2000); “Commercialization of Non-Timber Forest Products”: Review and Analysis of Research Center for International Forestry Research CIFOR, Indonesia.
46.
Nguyen, T. Q. (2006): Forest Devolution in Dak Lak, Vietnam: “Improving Forest Management or Livelihoods of the Poor?” in Mahanty, S. et al. (eds),Hanging in the Balance: Equity in Community-Based Natural Resource Management in Asia, 200-222.
47.
Pattanayak and Sills, (2001): “Do tropical forests provide natural insurance?”. The microeconomics of non-timber forest product collection in the Brazilian Amazon, Land Economics 77 (2001) (4), pp. 595–612.
48.
Peters, C. M, A. H. Gentry and R. Mendelsohn, (1989). Valuation of an Amazonian Rain Forest’, N
Globa
lJo
urna
lof
Scienc
eFr
ontier
Resea
rch
V
olum
e
27
()
Janu
ary
2012
D
© 2012 Global Journals Inc. (US)
1995: Non - Wood Forest Products in Nutrition.
forest”:Evidence from srilanka.journal of environmental management 53,3:273-292.
37. Hegde, R and T. Enters, (2000): “Forest Products and Household Economy”: a Case Study from Mudumalai Wildlife Sanctuary, South India.Environmental Conservation 27(3), 250 –259.
Pierce, a.r. 2002. , Shanley, P.,. and Laird, s. (eds.) Tapping the Green Market: certification and management of non-timber forest products. Earthscan, London. Pages 172-182. Nature 339, 655-656.
Economic Analysis Of Rural Women Income From Non-Timber Forest Products In Ife South Local Government Area Of Osun State, Nigeria
XII
Issu
e er
sion
IV
I
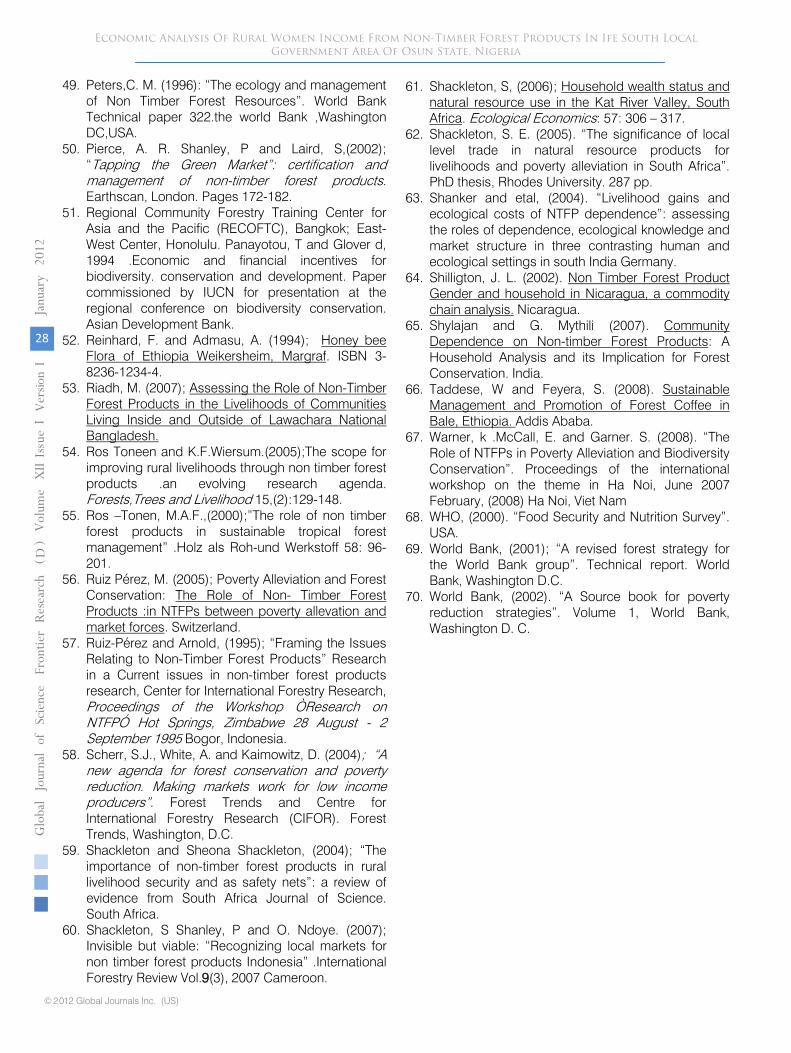
49.
Peters,C. M. (1996): “The ecology and management of Non Timber Forest Resources”. World Bank Technical paper 322.the world Bank ,Washington DC,USA.
50.
Pierce, A. R. Shanley, P and Laird, S,(2002); “Tapping the Green Market”: certification and management of non-timber forest products. Earthscan, London. Pages 172-182.
51.
Regional Community Forestry Training Center for Asia and the Pacific (RECOFTC), Bangkok; East-West Center, Honolulu. Panayotou, T and Glover d, 1994 .Economic and financial incentives for biodiversity. conservation and development. Paper commissioned by IUCN for presentation at the regional conference on biodiversity conservation. Asian Development Bank.
52.
Reinhard, F. and Admasu, A. (1994); Honey bee Flora of Ethiopia Weikersheim, Margraf
53.
Riadh, M. (2007);
. ISBN 3-8236-1234-4.
Assessing the Role of Non-Timber Forest Products in the Livelihoods of Communities Living Inside and Outside of Lawachara National Bangladesh.
54.
Ros Toneen and K.F.Wiersum.(2005);The scope for improving rural livelihoods through non timber forest products .an evolving research agenda. Forests,Trees and Livelihood 15,(2):129-148.
55.
Ros –Tonen, M.A.F.,(2000);”The role of non timber forest products in sustainable tropical forest management” .Holz als Roh-und Werkstoff 58: 96-201.
56.
Ruiz Pérez, M. (2005); Poverty Alleviation and Forest Conservation: The Role of Non-
Timber Forest Products :in NTFPs between poverty allevation and market forces
57.
Ruiz-Pérez and Arnold, (1995); “Framing the Issues Relating to Non-Timber Forest Products” Research in a Current issues in non-timber forest products research, Center for International Forestry Research, Proceedings of the Workshop ÒResearch on NTFPÓ Hot Springs, Zimbabwe 28 August -
2 September 1995 Bogor, Indonesia.
. Switzerland.
58.
Scherr, S.J., White, A. and Kaimowitz, D. (2004); “A new agenda for forest conservation and poverty reduction. Making markets work for low income producers”. Forest Trends and Centre for International Forestry Research (CIFOR). Forest Trends, Washington, D.C.
59.
Shackleton and Sheona Shackleton, (2004); “The importance of non-timber forest products in rural livelihood security and as safety nets”: a review of
61.
Shackleton, S, (2006); Household wealth status and natural resource use in the Kat River Valley, South Africa
62.
Shackleton, S. E. (2005). “The significance of local level trade in natural resource products for livelihoods and poverty alleviation in South Africa”. PhD thesis, Rhodes University. 287 pp.
. Ecological Economics: 57: 306 –
317.
63.
Shanker and etal, (2004). “Livelihood gains and ecological costs of NTFP dependence”: assessing the roles of dependence, ecological knowledge and market structure in three contrasting human and ecological settings in south India Germany.
64.
Shilligton, J. L. (2002). Non Timber Forest Product Gender and household in Nicaragua, a commodity chain analysis.
65.
Shylajan and G. Mythili (2007).
Nicaragua.
Community Dependence on Non-timber Forest Products
66.
Taddese, W and Feyera, S. (2008).
: A Household Analysis and its Implication for Forest Conservation. India.
Sustainable Management and Promotion of Forest Coffee in Bale, Ethiopia.
67.
Warner, k .McCall, E. and Garner. S. (2008). “The Role of NTFPs in Poverty Alleviation and Biodiversity Conservation”. Proceedings of the international workshop on the theme in Ha Noi, June 2007 February, (2008) Ha Noi, Viet Nam
Addis Ababa.
68.
WHO, (2000). “Food Security and Nutrition Survey”. USA.
69.
World Bank, (2001); “A revised forest strategy for the World Bank group”. Technical report. World Bank, Washington D.C.
70.
World Bank, (2002). “A Source book for poverty reduction strategies”. Volume 1, World Bank, Washington D. C.
Globa
lJo
urna
lof
Scienc
eFr
ontier
Resea
rch
V
olum
e
28
()
Janu
ary
2012
D
© 2012 Global Journals Inc. (US)
evidence from South Africa Journal of Science.South Africa.
60. Shackleton, S Shanley, P and O. Ndoye. (2007); Invisible but viable: “Recognizing local markets for non timber forest products Indonesia” .International Forestry Review Vol.9(3), 2007 Cameroon.
Economic Analysis Of Rural Women Income From Non-Timber Forest Products In Ife South Local Government Area Of Osun State, Nigeria
XII
Issu
e er
sion
IV
I
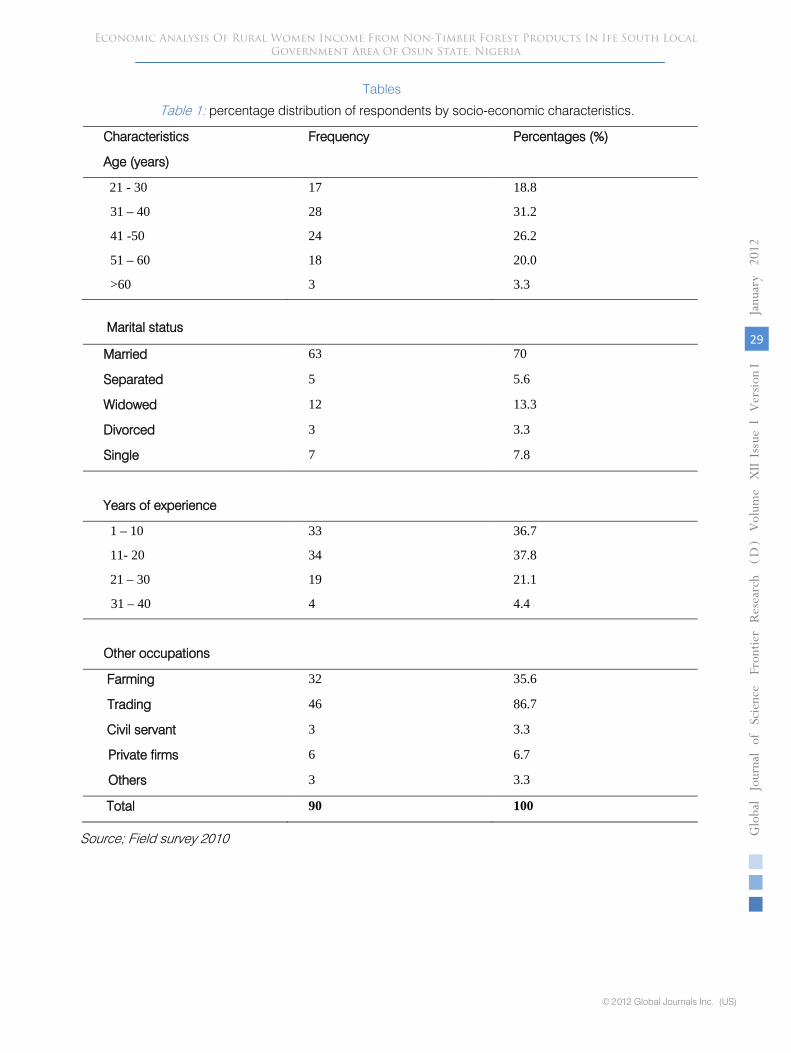
Tables
Globa
lJo
urna
lof
Scienc
eFr
ontier
Resea
rch
V
olum
e
29
()
Janu
ary
2012
D
© 2012 Global Journals Inc. (US)
Table 1: percentage distribution of respondents by socio-economic characteristics.
Characteristics Frequency Percentages (%)
Age (years)
21 - 30 17 18.8
31 – 40 28 31.2
41 -50 24 26.2
51 – 60 18 20.0
>60 3 3.3
Marital status
Married 63 70
Separated 5 5.6
Widowed 12 13.3
Divorced 3 3.3
Single 7 7.8
Years of experience
1 – 10 33 36.7
11- 20 34 37.8
21 – 30 19 21.1
31 – 40 4 4.4
Other occupations
Farming 32 35.6
Trading 46 86.7
Civil servant 3 3.3
Private firms 6 6.7
Others 3 3.3
Total 90 100
Source; Field survey 2010
Economic Analysis Of Rural Women Income From Non-Timber Forest Products In Ife South Local Government Area Of Osun State, Nigeria
XII
Issu
e er
sion
IV
I
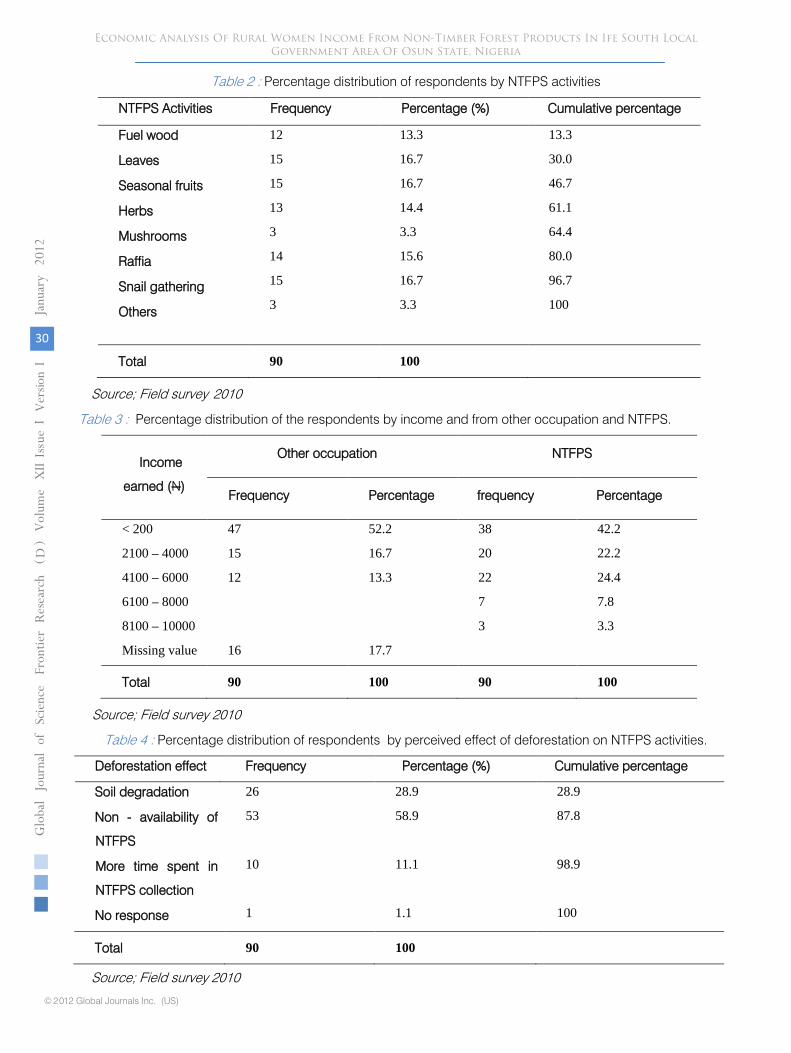
Globa
lJo
urna
lof
Scienc
eFr
ontier
Resea
rch
V
olum
e
30
()
Janu
ary
2012
D
© 2012 Global Journals Inc. (US)
Table 2 : Percentage distribution of respondents by NTFPS activities
NTFPS Activities Frequency Percentage (%) Cumulative percentage
Fuel wood
Leaves
Seasonal fruits
Herbs
Mushrooms
Raffia
Snail gathering
Others
12
15
15
13
3
14
15
3
13.3
16.7
16.7
14.4
3.3
15.6
16.7
3.3
13.3
30.0
46.7
61.1
64.4
80.0
96.7
100
Total 90 100
Source; Field survey 2010
Table 3 : Percentage distribution of the respondents by income and from other occupation and NTFPS.
Income
earned (N)
Other occupation NTFPS
Frequency Percentage frequency Percentage
< 200
2100 – 4000
4100 – 6000
6100 – 8000
8100 – 10000
Missing value
47
15
12
16
52.2
16.7
13.3
17.7
38
20
22
7
3
42.2
22.2
24.4
7.8
3.3
Total 90 100 90 100
Source; Field survey 2010
Table 4 : Percentage distribution of respondents by perceived effect of deforestation on NTFPS activities.
Deforestation effect Frequency Percentage (%) Cumulative percentage
Soil degradation
Non - availability of
NTFPS
More time spent in
NTFPS collection
No response
26
53
10
1
28.9
58.9
11.1
1.1
28.9
87.8
98.9
100
Total 90 100
Source; Field survey 2010
Economic Analysis Of Rural Women Income From Non-Timber Forest Products In Ife South Local Government Area Of Osun State, Nigeria
XII
Issu
e er
sion
IV
I
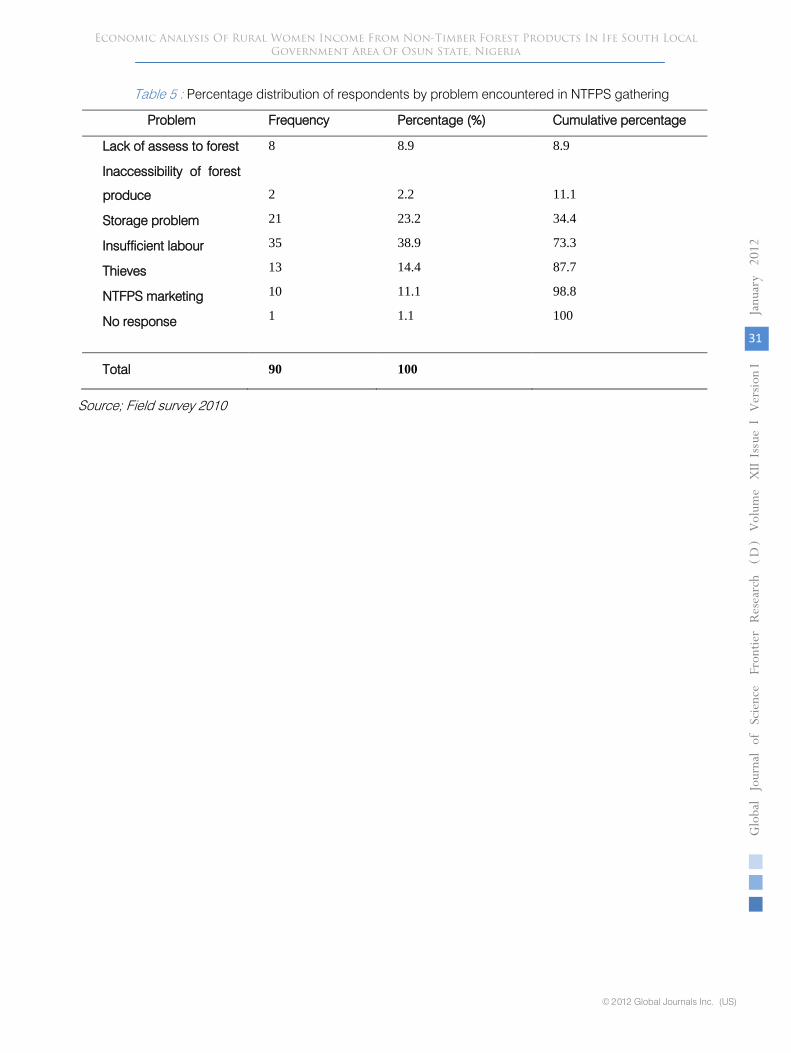
Globa
lJo
urna
lof
Scienc
eFr
ontier
Resea
rch
V
olum
e
31
()
Janu
ary
2012
D
© 2012 Global Journals Inc. (US)
Table 5 : Percentage distribution of respondents by problem encountered in NTFPS gathering
Problem Frequency Percentage (%) Cumulative percentage
Lack of assess to forest
Inaccessibility of forest
produce
Storage problem
Insufficient labour
Thieves
NTFPS marketing
No response
8
2
21
35
13
10
1
8.9
2.2
23.2
38.9
14.4
11.1
1.1
8.9
11.1
34.4
73.3
87.7
98.8
100
Total 90 100
Source; Field survey 2010
Economic Analysis Of Rural Women Income From Non-Timber Forest Products In Ife South Local Government Area Of Osun State, Nigeria
XII
Issu
e er
sion
IV
I
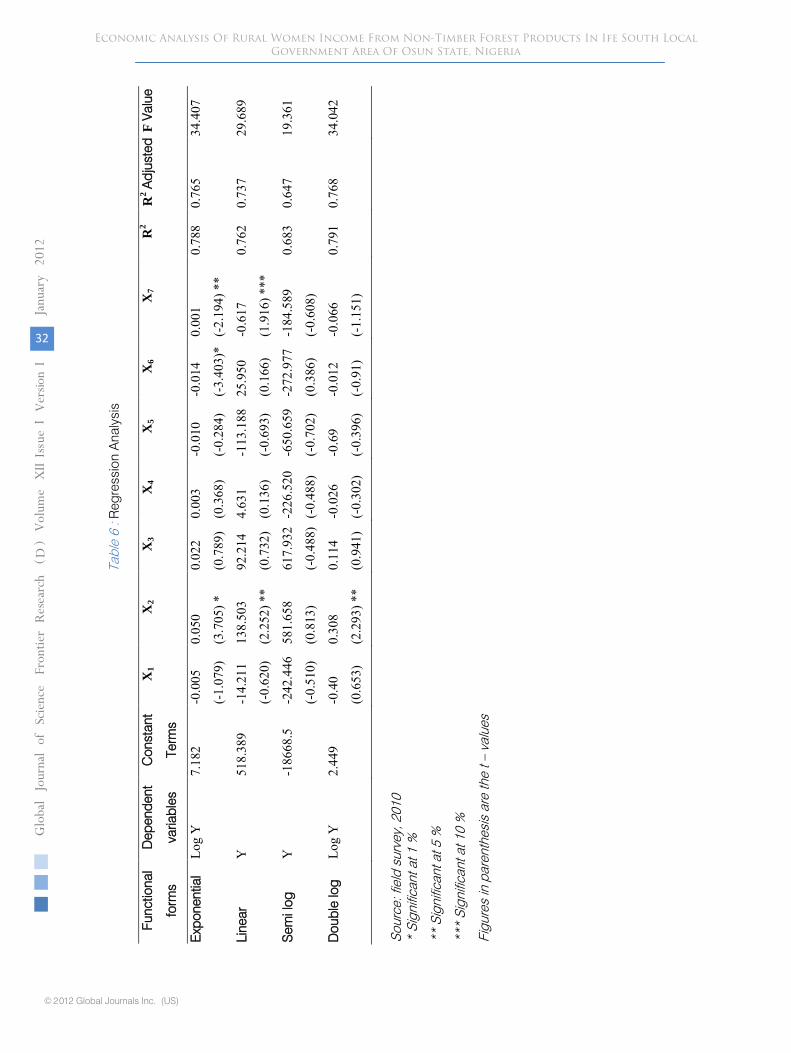
Globa
lJo
urna
lof
Scienc
eFr
ontier
Resea
rch
V
olum
e
32
()
Janu
ary
2012
D
© 2012 Global Journals Inc. (US)
Economic Analysis Of Rural Women Income From Non-Timber Forest Products In Ife South Local Government Area Of Osun State, Nigeria
Tabl
e 6
:Reg
ress
ion
Ana
lysi
s
Func
tiona
l
form
s
Dep
ende
nt
varia
bles
Con
stan
t
Term
s
X1
X2
X3
X4
X5
X6
X7
R2
R2
Adj
uste
dF
Valu
e
Exp
onen
tial
Log
Y7.
182
-0.0
05
(-1.
079)
0.05
0
(3.7
05) *
0.02
2
(0.7
89)
0.00
3
(0.3
68)
-0.0
10
(-0.
284)
-0.0
14
(-3.
403)
*
0.00
1
(-2.
194)
**
0.78
80.
765
34.4
07
Line
a rY
518.
389
-14.
211
(-0.
620)
138.
503
(2.2
52) *
*
92.2
14
(0.7
32)
4.63
1
(0.1
36)
-113
.188
(-0.
693)
25.9
50
(0.1
66)
-0.6
17
(1.9
16) *
**
0.76
20.
737
29.6
89
Sem
i log
Y-1
8668
.5-2
42.4
46
(-0.
510)
581.
658
(0.8
13)
617.
932
(-0.
488)
-226
.520
(-0.
488)
-650
.659
(-0.
702)
-272
.977
(0.3
86)
-184
.589
(-0.
608)
0.68
30.
647
19.3
61
Dou
ble
log
Log
Y2.
449
-0.4
0
(0.6
53)
0.30
8
(2.2
93) *
*
0.11
4
(0.9
41)
-0.0
26
(-0.
302)
-0.6
9
(-0.
396)
-0.0
12
(-0.
91)
-0.0
66
(-1.
151)
0.79
10.
768
34.0
42
Sour
ce: f
ield
sur
vey,
201
0*
Sign
ifica
nt a
t 1 %
**Si
gnifi
cant
at 5
%
***
Sign
ifica
nt a
t 10
%
Figu
res
inpa
rent
hesi
s ar
e th
e t –
valu
es
XII
Issu
e er
sion
IV
I
© 2012 . O.R. Ashimolowo, Odiachi G.N.This is a research/review paper, distributed under the terms of the Creative Commons Attribution-Noncommercial 3.0 Unported License http://creativecommons.org/licenses/by-nc/3.0/), permitting all non commercial use, distribution, and reproduction in any medium, provided the original work is properly cited.
Assessment of Militancy Activities on Rural Dwellers in Delta State, Nigeria
By O.R. Ashimolowo, Odiachi G.N. University of Agriculture, Abeokuta
Abstract - Militant activities in the oil-rich Delta region have been wanton and continuous with dire health, social and economic consequences for its people, for over three decades. The study assessed militancy activities in rural areas of Delta State, Nigeria. Study was carried out using multistage sampling technique to draw respondents from the three zones of Delta State Agricultural Development Programme. Respondents were selected from seven (7) cells located within five (5) blocks namely Oshimili South, Aniocha, Ughelli South, Warri North, Warri South. Farmers within each community were selected purposively, making a total of seventy (70)
respondents. Both descriptive (frequencies and percentages) and inferential statistics (Chi-square and t-test) were used in data analysis. Result revealed that 75.71% of the respondents
were males while 22.29% were females. Majority (60%) of the respondents had at least a secondary school education while 85.71% were married. Only 25.71% had over 25 years of
farming experience with 32.86% having less than 1 hectare of farmland. Also, 50% of the respondents strongly agreed that the government should be blamed for the crises in the State
while 41.31% strongly disagreed that militants are to be blamed.
Keywords : Militancy Activities, farming experience, Multinational Oil Companies, developmental projects, Sustainable development.
Assessment of Militancy Activities on Rural Dwellers in Delta State, Nigeria
Strictly as per the compliance and regulations of :
Global Journal of Science Frontier ResearchAgriculture & BiologyVolume 12 Issue 1 Version 1.0 January 2012Type : Double Blind Peer Reviewed International Research JournalPublisher: Global Journals Inc. (USA)Online ISSN: 2249-4626 & Print ISSN: 0975-5896
GJSFR-D Classification : FOR Code: 070106
Assessment of Militancy Activities on Rural Dwellers in Delta State, Nigeria
O.R. Ashimolowo (Ph.D)α , Odiachi G.N.Ω
Abstract - Militant activities in the oil-rich Delta region have been wanton and continuous with dire health, social and economic consequences for its people, for over three decades. The study assessed militancy activities in rural areas of Delta State, Nigeria. Study was carried out using multistage sampling technique to draw respondents from the three zones of Delta State Agricultural Development Programme. Respondents were selected from seven (7) cells located within five (5) blocks namely Oshimili South, Aniocha, Ughelli South, Warri North, Warri South. Farmers within each community were selected purposively, making a total of seventy (70) respondents. Both descriptive (frequencies and percentages) and inferential statistics (Chi-square and t-test) were used in data analysis. Result revealed that 75.71% of the respondents were males while 22.29% were females. Majority (60%) of the respondents had at least a secondary school education while 85.71% were married. Only 25.71% had over 25 years of farming experience with 32.86% having less than 1 hectare of farmland. Also, 50% of the respondents strongly agreed that the government should be blamed for the crises in the State while 41.31% strongly disagreed that militants are to be blamed. Nevertheless, 50% of the respondents agreed that Multinational Oil Companies (MNOC’S) provided infrastructures for the area before amnesty. Furthermore, 37.14% of the respondents opined that militancy activities caused very little destruction of farmland. Moreover, 50% of the respondents strongly agreed that the government did the right thing by granting amnesty. Significant relationship existed between marital status (χ2= 4.37, p=0.04) and their perception of militancy activities in Delta State. Also, result revealed a significant relationship between the perception of rural dwellers on the MNOC’S before and after the amnesty (t=-1.90) at 0.05. The study concluded that marital status of individual farmers affects their perception of the MNOC’S. The study recommended that the government should create enabling policies towards enforcing developmental projects aimed at sustainable development and improved family lifestyles. Keywords : Militancy Activities, farming experience, Multinational Oil Companies, developmental projects, Sustainable development.
I. INTRODUCTION
ilitancy is a state or condition of being combative or disposed to fight for a cause or belief (Chindah and Braide (2000). It can also
Author α
Ω:
Department of Agricultural Extension and Rural Develop
-
ment, University of Agriculture, Abeokuta.
E-mail : [email protected]
be defined as a violent response by an individual, group or sect in a region, community, state or nation due to claims of underdevelopment, political oppression, religious beliefs and segregation. The motive is that people want their rights and if they are not going to get it by negotiation, they simply will then have it by violence against the “powers that be”.
The presence of oil resources in developing countries presents a large paradox (Shakleman, 2006). On one hand, oil and gas discovery make the eradication of poverty and the development of weak economies a possibility. An example of this is Angola which sees its burgeoning oil industry as a means of escaping poor economic conditions. On the other hand, the “curse of oil” is evident in many oil-rich countries worldwide with oil producing states showing a high incidence of corruption, violent conflicts, poor educational structure and health services and economic strength.
Delta state which is one of the nine states of the Niger-delta region is greatly endowed with abundant natural resources and a weather which supports all year round agricultural production. About fifty percent of the active labour force is engaged in one form of agricultural activity or another (cropping enterprise and fishing enterprise), with yam, cassava, plantain, maize, cocoyam, and vegetables as the predominant food crops grown by the farmers in the area. However, owing to the hydrographic conditions of the state, only a fraction of the land size is cultivated with crops. (Federal Office of Statistics, 1995). Farming practices are traditional, and the use of crude implements such as hoe and cutlasses predominate. Mechanization is on a very low scale and the use of modern farming inputs such as fertilizers and pesticides is limited because farmers hardly have access to it, since it is nationally distributed by the Federal Government.
Delta state is the largest crude oil producing state in the Niger-delta area and in Nigeria. Nigerian oil and gas industry generates over ninety percent of the nation’s foreign exchange earnings. Paradoxically, in spite of the increasing revenue from crude oil exploration, the communities from which these resource flow in Delta state continue to live in conditions of social deprivation and abject poverty. This has led to militancy activities in the state.
M
Globa
lJo
urna
lof
Scienc
eFr
ontier
Resea
rch
V
olum
e
33
()
Janu
ary
2012
D
© 2012 Global Journals Inc. (US)
XII
Issu
e er
sion
IV
I
Oil was meant for the indigenes of Delta state. People’s rights have come under severe assault by the ecologically unfriendly practices of the Multi-national Oil Companies (MNOC’S). In addition, state laws and policies as they relate to petroleum resources officially take away private property from indigenous people for public use denying them of their rights to their natural resources. Farming lands were collected by the Government and promises made to the communities have not been kept, and all form of agricultural activities was almost totally abandoned by the Government in this areas including funding. According to Brown (1998), the local economies of the oil producing communities have collapsed, and they are not integrated into the oil economy of the nation. The success of the all companies has not directly led to their own development.
With militancy in the state and region escalating, and disturbing Nigerian oil production, the government offered to give militants amnesty in return for laying down and surrendering their arms in October 2009.
II. PROBLEM STATEMENT
Delta state has been embroiled in crisis between the government forces and militant groups that are aggrieved over certain fundamental issues affecting the region. Since the turn of a “new democracy” in 1999, militants intensified their fight with government forces, sabotaged oil installations (which has led to more oil spillages), taken foreign oil workers hostage and carried out lethal car bombings. At the root of the problem is a crisis of underdevelopment. The crisis was exacerbated by emergent issues of gross distortion of Nigerian federalism in respect to resource control, citizenship rights and environmental degradation. Unfortunately, the external manifestation has been mainly that of violent agitation, and criminal activities of some elements, taking advantage of the bad situation. Communities are in severe need for help as their youths see no more hope and end up joining these militant groups as they are very lucrative.
This led to government imposing security measures like curfew to reduce the rate of crime but also this affects the economic activities of these communities (agriculture, education, health, etc). The amnesty deal from October 2009 is failing, money allocated for training are not reaching the ex-militants as contractors skim huge profits for themselves, the oil companies continue to neglect the environment and needs of the community. The Nigerian Federal and state governments’ commitment is limited to speeches and promises. The above mentioned scenario has affected agricultural activities within the area, leading to increased poverty among the farming households.
III. OBJECTIVE OF STUDY
a) Broad Objective The general objective of this study is the
assessment of militant activities on rural dwellers in Delta-state, Nigeria.
b) Specific Objective 1. Examine the socio-economic characteristics of the
respondents 2. Ascertain their perception on the causes of the
militant crisis in the state. 3. Investigate the rural dwellers perception on the
MNOC’S before and after the amnesty 4. Investigate the perception of the rural dwellers on
effects of militant activities on their farming operations.
5. Determine the rural dwellers’ perception of the amnesty granted to the militants by the Federal Government.
6. Ascertain the rural dwellers views on the end to crisis.
HYPOTHESIS
H01 : The is no significant relationship between the socio-economic characteristics of the respondents and their perceptions on militant activities in the state
Ho2 : The is a significant difference between the rural dwellers perception on the MNOC’S before the amnesty and after the amnesty
IV.
RESEARCH METHODOLOGY
a) Area of study Delta State lies approximately between
longitudes 5000E and 6045E of the Greenwich Meridian, and latitude 5000N and 6030N of the equator. It is one of Nigeria’s extremely southern states, and covers an area of 17, 001Km2(Delta State Environmental Protection Agency, 1996).
Delta state consists of 25 local government areas. According to the Delta State Agricultural Development Programme (DSADP), these local governments have been grouped into three zones:
(1)
Delta-north, which has its headquarters in Agbor has nine local governments under it with most of them consisting of the Igbo speaking tribe. This area of the state has little or insignificant amounts of militant activities with kidnapping the major militant activity.
(2)
Delta-central, which has its headquarters in Effurun
has ten local governments under it with most of them Urohbos by tribe. This area of the state suffers from spillover of militant activities from the highly volatile delta-south zone. This is where the amnesty camp for the rehabilitation of the militants is located.
Globa
lJo
urna
lof
Scienc
eFr
ontier
Resea
rch
V
olum
e
34
()
Janu
ary
2012
D
© 2012 Global Journals Inc. (US)
Assessment of Militancy Activities on Rural Dwellers in Delta State, Nigeria
V.
XII
Issu
e er
sion
IV
I
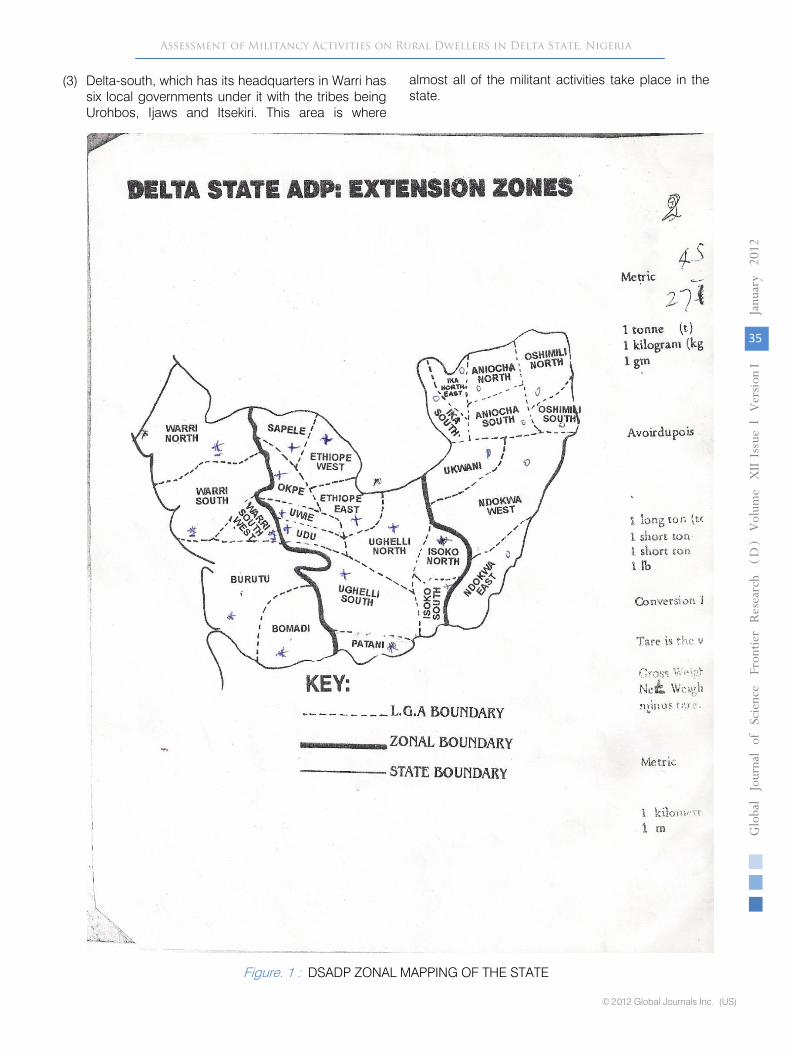
(3) Delta-south, which has its headquarters in Warri has six local governments under it with the tribes being Urohbos, Ijaws and Itsekiri. This area is where
almost all of the militant activities take place in the state.
Figure. 1 :
DSADP ZONAL MAPPING OF THE STATE
Globa
lJo
urna
lof
Scienc
eFr
ontier
Resea
rch
V
olum
e
35
()
Janu
ary
2012
D
© 2012 Global Journals Inc. (US)
Assessment of Militancy Activities on Rural Dwellers in Delta State, Nigeria
XII
Issu
e er
sion
IV
I
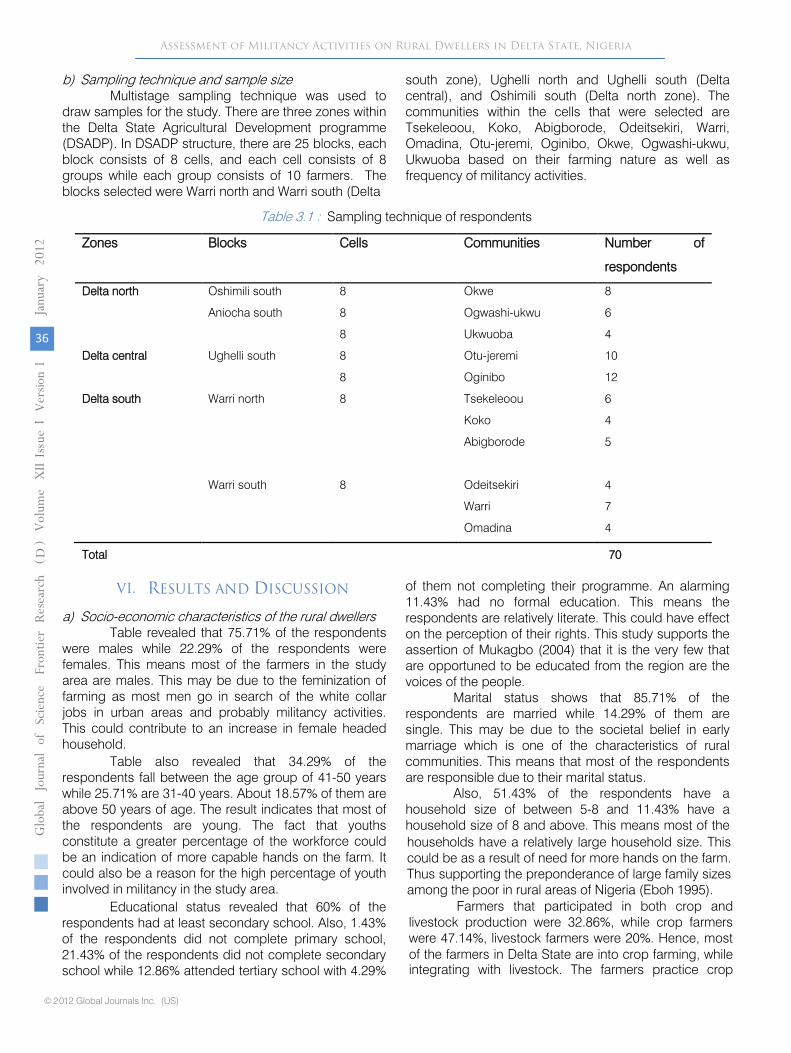
b) Sampling technique and sample size Multistage sampling technique was used to
draw samples for the study. There are three zones within the Delta State Agricultural Development programme (DSADP). In DSADP structure, there are 25 blocks, each block consists of 8 cells, and each cell consists of 8 groups while each group consists of 10 farmers. The blocks selected were Warri north and Warri south (Delta
south zone), Ughelli north and Ughelli south (Delta central), and Oshimili south (Delta north zone). The communities within the cells that were selected are Tsekeleoou, Koko, Abigborode, Odeitsekiri, Warri, Omadina, Otu-jeremi, Oginibo, Okwe, Ogwashi-ukwu, Ukwuoba based on their farming nature as well as frequency of militancy activities.
Table 3.1
: Sampling technique of respondents
RESULTS AND DISCUSSION
a)
Socio-economic characteristics of the rural dwellers
Table revealed that 75.71% of the respondents were males while
22.29% of the respondents were females. This means most of the farmers in the study area are males. This may be due to the feminization of farming as most men go in search of the white collar jobs in urban areas and probably militancy activities. This could contribute to an increase in female headed household.
Table also revealed that 34.29% of the respondents fall between the age group of 41-50 years while 25.71% are 31-40 years. About 18.57% of them are above 50 years of age. The result indicates that most of the respondents are young. The fact that youths constitute a greater percentage of the workforce could be an indication of more capable hands on the farm. It could also be a reason for the high percentage of youth involved in militancy in the study area.
Educational status revealed that 60% of the respondents had at least secondary school. Also, 1.43% of the respondents did not complete primary school, 21.43% of the respondents did not complete secondary school while 12.86% attended tertiary school with 4.29%
of them not completing their programme. An alarming 11.43% had no formal education. This means the respondents are relatively literate. This could have effect on the perception of their rights. This study supports the assertion of Mukagbo (2004) that it is the very few that are opportuned to be educated from the region are the voices of the people.
Marital status shows that 85.71% of the respondents are married while 14.29% of them are single. This may be due to the societal belief in early marriage which is one of the characteristics of rural communities. This means that most of the respondents are responsible due to their marital status.
Also, 51.43% of the respondents have a household size of between 5-8 and 11.43% have a household size of 8 and
above. This means most of the
Zones Blocks Cells Communities Number of
respondents
Delta north Oshimili south 8 Okwe 8
Aniocha south 8 Ogwashi-ukwu 6
8 Ukwuoba 4
Delta central Ughelli south 8 Otu-jeremi 10
8 Oginibo 12
Delta south Warri north 8 Tsekeleoou
Koko
Abigborode
6
4
5
Warri south 8 Odeitsekiri
Warri
Omadina
4
7
4
Total 70
households have a relatively large household size. This could be as a result of need for more hands on the farm. Thus supporting the preponderance of large family sizes among the poor in rural areas of Nigeria (Eboh 1995).
Farmers that participated in both crop and livestock production were 32.86%, while crop farmers were 47.14%, livestock farmers were 20%. Hence, most of the farmers in Delta State are into crop farming, while
Globa
lJo
urna
lof
Scienc
eFr
ontier
Resea
rch
V
olum
e
36
()
Janu
ary
2012
D
© 2012 Global Journals Inc. (US)
Assessment of Militancy Activities on Rural Dwellers in Delta State, Nigeria
VI.
XII
Issu
e er
sion
IV
I
integrating with livestock. The farmers practice crop
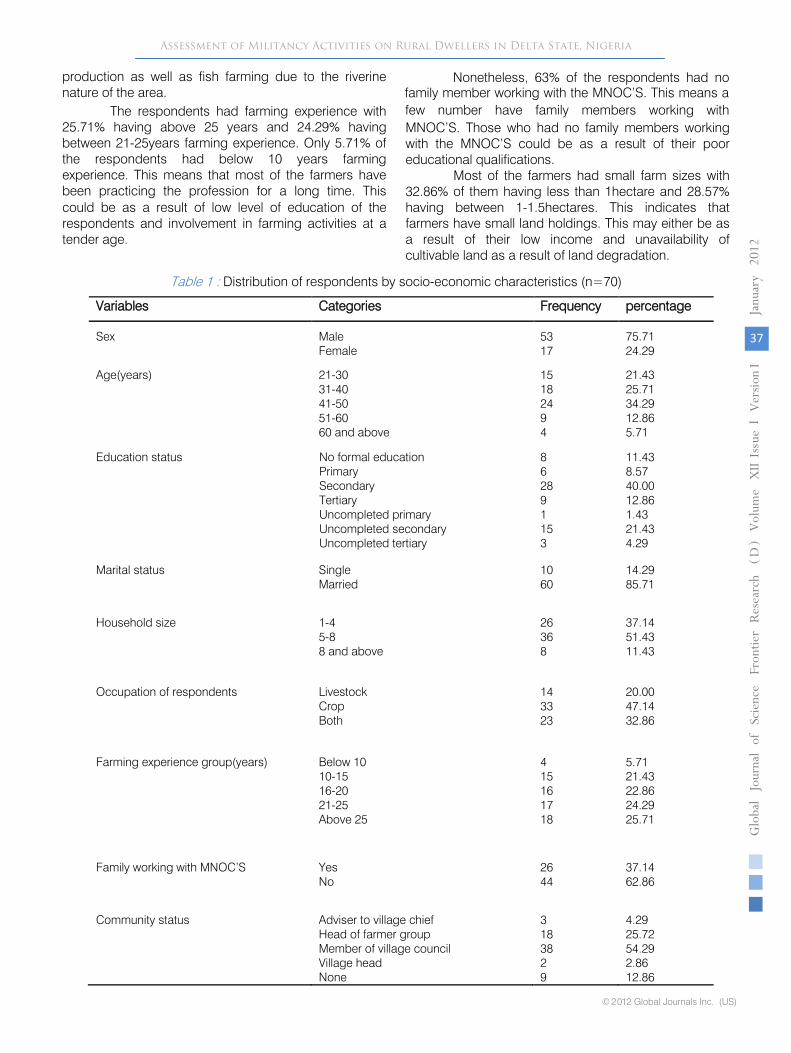
production as well as fish farming due to the riverine nature of the area.
The respondents had farming experience with 25.71% having above 25 years and 24.29% having between 21-25years farming experience. Only 5.71% of the respondents had below 10 years farming experience. This means that most of the farmers have been practicing the profession for a long time. This could be as a result of low level of education of the respondents and involvement in farming activities at a tender age.
Nonetheless, 63% of
the respondents had no family member working with the MNOC’S. This means a few number have family members working with MNOC’S. Those who had no family members working with the MNOC’S could be as a result of their poor educational qualifications.
Most of the farmers had small farm sizes with 32.86% of them having less than 1hectare and 28.57% having between 1-1.5hectares. This indicates that farmers have small land holdings. This may either be as a result of their low income and unavailability of cultivable
land as a result of land degradation.
Table 1 :
Distribution of respondents by socio-economic characteristics (n=70)
Variables Categories Frequency percentage
Sex MaleFemale
5317
75.7124.29
Age(years) 21-3031-4041-5051-6060 and above
15 182494
21.4325.7134.2912.865.71
Education status No formal education PrimarySecondaryTertiaryUncompleted primaryUncompleted secondaryUncompleted tertiary
862891153
11.438.5740.0012.861.4321.434.29
Marital status SingleMarried
1060
14.2985.71
Household size 1-45-88 and above
26368
37.1451.4311.43
Occupation of respondents LivestockCropBoth
143323
20.0047.1432.86
Farming experience group(years) Below 1010-1516-2021-25Above 25
415161718
5.7121.4322.8624.2925.71
Family working with MNOC’S YesNo
2644
37.1462.86
Community status Adviser to village chiefHead of farmer groupMember of village councilVillage headNone
3183829
4.2925.7254.292.8612.86
Globa
lJo
urna
lof
Scienc
eFr
ontier
Resea
rch
V
olum
e
37
()
Janu
ary
2012
D
© 2012 Global Journals Inc. (US)
Assessment of Militancy Activities on Rural Dwellers in Delta State, Nigeria
XII
Issu
e er
sion
IV
I
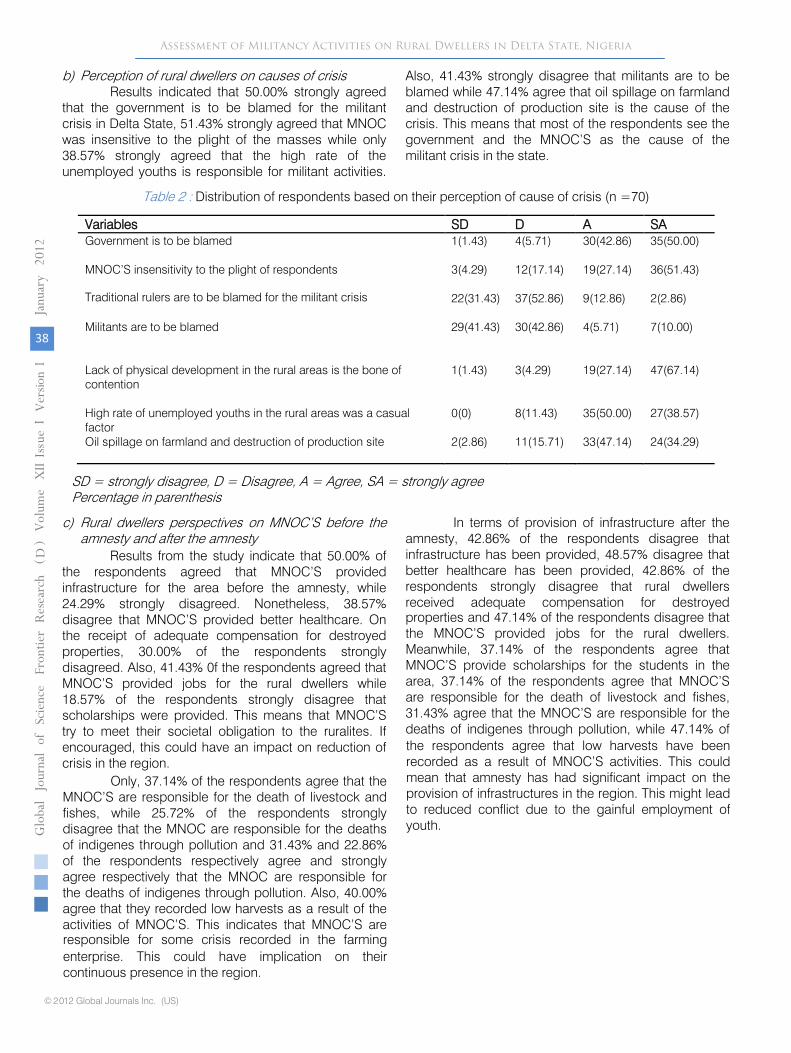
b) Perception of rural dwellers on causes of crisis
Results indicated that 50.00% strongly agreed that the government is to be blamed for the militant crisis in Delta State, 51.43% strongly agreed that MNOC was insensitive to the plight of the masses while only 38.57% strongly agreed that the high rate of the unemployed youths is responsible for militant activities.
Also, 41.43% strongly disagree that militants are to be blamed while 47.14% agree that oil spillage on farmland and destruction of production site is the cause of the crisis. This means that most of the respondents see the government and the MNOC’S as the cause of the militant crisis in the state.
Table 2 : Distribution of respondents based on their perception of cause of crisis (n =70)
SD = strongly disagree, D = Disagree, A = Agree, SA = strongly agree
Percentage in parenthesis
c)
Rural dwellers perspectives on MNOC’S before the amnesty and after the amnesty
Results from the study indicate that 50.00% of the respondents agreed that MNOC’S provided infrastructure for the area before the amnesty, while 24.29% strongly disagreed. Nonetheless, 38.57% disagree that MNOC’S provided better healthcare. On the receipt of adequate compensation for destroyed properties, 30.00% of the respondents strongly disagreed. Also, 41.43% 0f the respondents agreed that MNOC’S provided jobs for the rural dwellers while 18.57% of the respondents strongly disagree that scholarships were provided. This means that MNOC’S try to meet their societal obligation to the ruralites. If encouraged, this could have an impact on reduction of crisis in the region.
Only, 37.14% of the respondents agree that the MNOC’S are responsible for the death of livestock and fishes, while 25.72% of the respondents strongly disagree that the MNOC are responsible for the deaths of indigenes through pollution and 31.43% and 22.86% of the respondents respectively agree and strongly agree respectively that the MNOC
are responsible for the deaths of indigenes through pollution. Also, 40.00% agree that they recorded low harvests as a result of the activities of MNOC’S. This indicates that MNOC’S are responsible for some crisis recorded in the farming enterprise. This could have implication on their continuous presence in the region.
In terms of provision of infrastructure after the amnesty, 42.86% of the respondents disagree that infrastructure has been provided, 48.57% disagree that better healthcare has been provided, 42.86% of the respondents strongly disagree that rural dwellers received adequate compensation for destroyed
Variables SD D A SAGovernment is to be blamed 1(1.43) 4(5.71) 30(42.86) 35(50.00)
MNOC’S insensitivity to the plight of respondents
Traditional rulers are to be blamed for the militant crisis
3(4.29)
22(31.43)
12(17.14)
37(52.86)
19(27.14)
9(12.86)
36(51.43)
2(2.86)
Militants are to be blamed 29(41.43) 30(42.86) 4(5.71) 7(10.00)
Lack of physical development in the rural areas is the bone of contention
1(1.43) 3(4.29) 19(27.14) 47(67.14)
High rate of unemployed youths in the rural areas was a casual factor
0(0) 8(11.43) 35(50.00) 27(38.57)
Oil spillage on farmland and destruction of production site 2(2.86) 11(15.71) 33(47.14) 24(34.29)
properties and 47.14% of the respondents disagree that the MNOC’S provided jobs for the rural dwellers. Meanwhile, 37.14% of the respondents agree that MNOC’S provide scholarships for the students in the area, 37.14% of the respondents agree that MNOC’S are responsible for the death of livestock and fishes, 31.43% agree that the MNOC’S are responsible for the deaths of indigenes through pollution, while 47.14% of the respondents agree that low harvests have been recorded as a result of MNOC’S activities. This could mean that amnesty has had significant impact on the provision of infrastructures in the region. This might lead to reduced conflict due to the gainful employment of youth.
Globa
lJo
urna
lof
Scienc
eFr
ontier
Resea
rch
V
olum
e
38
()
Janu
ary
2012
D
© 2012 Global Journals Inc. (US)
Assessment of Militancy Activities on Rural Dwellers in Delta State, NigeriaXII
Issu
e er
sion
IV
I
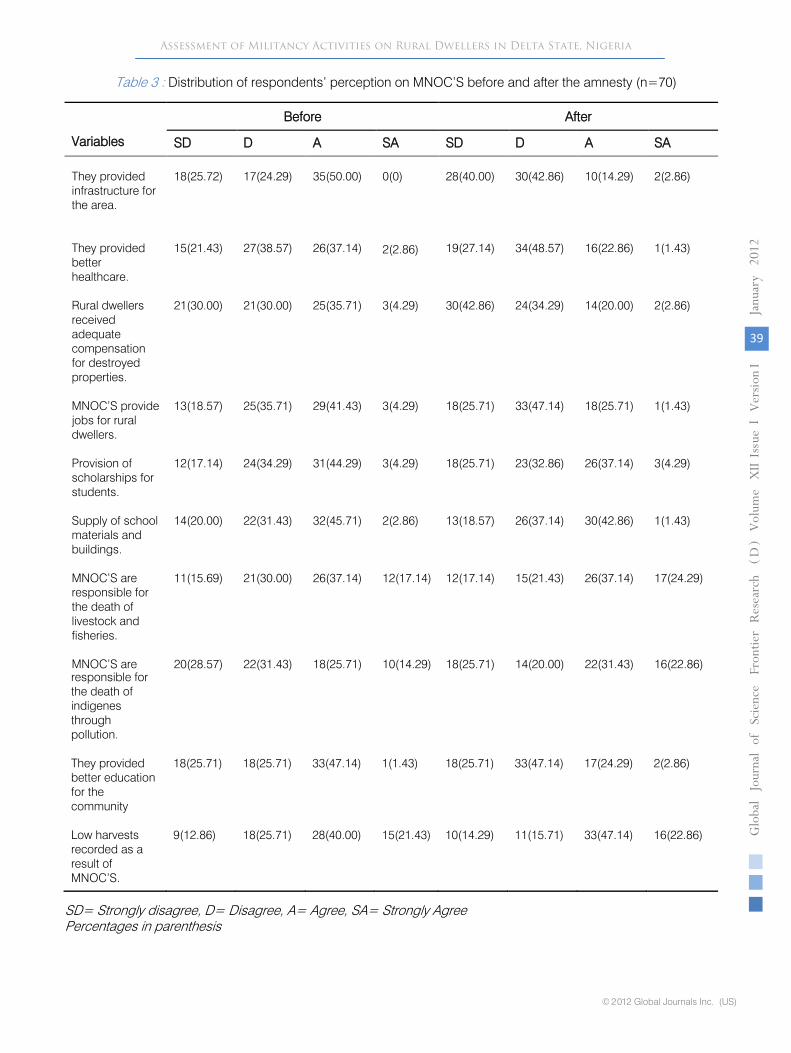
Table 3
:
Distribution of respondents’ perception on MNOC’S before and after the amnesty (n=70)
SD= Strongly disagree, D= Disagree, A= Agree, SA= Strongly Agree
Percentages in parenthesis
Variables
Before After
SD D A SA SD D A SA
They providedinfrastructure for the area.
18(25.72) 17(24.29) 35(50.00) 0(0) 28(40.00) 30(42.86) 10(14.29) 2(2.86)
They provided better healthcare.
15(21.43) 27(38.57) 26(37.14) 2(2.86) 19(27.14) 34(48.57) 16(22.86) 1(1.43)
Rural dwellers received adequate compensation for destroyed properties.
21(30.00) 21(30.00) 25(35.71) 3(4.29) 30(42.86) 24(34.29) 14(20.00) 2(2.86)
MNOC’S provide jobs for rural dwellers.
13(18.57) 25(35.71) 29(41.43) 3(4.29) 18(25.71) 33(47.14) 18(25.71) 1(1.43)
Provision of scholarships for students.
12(17.14) 24(34.29) 31(44.29) 3(4.29) 18(25.71) 23(32.86) 26(37.14) 3(4.29)
Supply of school materials and buildings.
14(20.00) 22(31.43) 32(45.71) 2(2.86) 13(18.57) 26(37.14) 30(42.86) 1(1.43)
MNOC’S are responsible for the death of livestock and fisheries.
11(15.69) 21(30.00) 26(37.14) 12(17.14) 12(17.14) 15(21.43) 26(37.14) 17(24.29)
MNOC’S are 20(28.57) 22(31.43) 18(25.71) 10(14.29) 18(25.71) 14(20.00) 22(31.43) 16(22.86)responsible for the death of indigenes through pollution.
They provided better education for the community
18(25.71) 18(25.71) 33(47.14) 1(1.43) 18(25.71) 33(47.14) 17(24.29) 2(2.86)
Low harvests recorded as a result of MNOC’S.
9(12.86) 18(25.71) 28(40.00) 15(21.43) 10(14.29) 11(15.71) 33(47.14) 16(22.86)
Globa
lJo
urna
lof
Scienc
eFr
ontier
Resea
rch
V
olum
e
39
()
Janu
ary
2012
D
© 2012 Global Journals Inc. (US)
Assessment of Militancy Activities on Rural Dwellers in Delta State, Nigeria
XII
Issu
e er
sion
IV
I
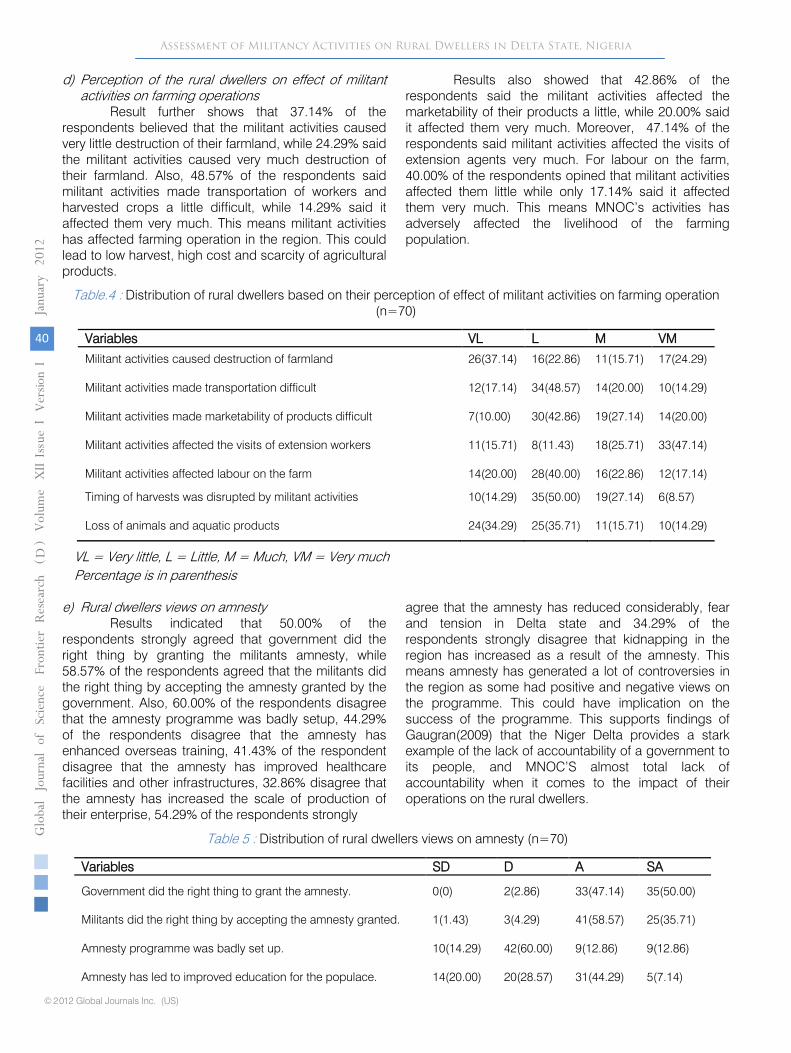
d) Perception of the rural dwellers on effect of militant activities on farming operations
Result further shows that 37.14% of the respondents believed that the militant activities caused very little destruction of their farmland, while 24.29% said the militant activities caused very much destruction of their farmland. Also, 48.57% of the respondents said militant activities made transportation of workers and harvested crops a little difficult, while 14.29% said it affected them very much. This means militant activities has affected farming operation in the region. This could lead to low harvest, high cost and scarcity of agricultural products.
Results also showed that 42.86% of the respondents said the militant activities affected the marketability of their products a little, while 20.00% said it affected them very much. Moreover, 47.14% of the respondents said militant activities affected the visits of extension agents very much. For labour on the farm, 40.00% of the respondents opined that militant activities affected them little while only 17.14% said it affected them very much. This means MNOC’s activities has adversely affected the livelihood of the farming population.
Table.4 : Distribution of rural dwellers based on their perception of effect of militant activities on farming operation (n=70)
VL = Very little, L = Little, M = Much, VM = Very much
Percentage is in parenthesis
e)
Rural dwellers views on amnesty
Results indicated that 50.00% of the respondents strongly agreed that government did the right thing by granting the militants amnesty, while 58.57% of the respondents agreed that the militants did the right thing by accepting the amnesty granted by the government. Also, 60.00% of the respondents disagree that the amnesty programme was badly setup, 44.29% of the respondents disagree that the amnesty has enhanced overseas training, 41.43% of the respondent disagree that the amnesty has improved healthcare facilities and other infrastructures, 32.86% disagree that the amnesty has increased the scale of production of their enterprise, 54.29% of the respondents strongly
agree that the amnesty has reduced considerably, fear and tension in Delta state and 34.29% of the respondents strongly disagree that kidnapping in the region has increased as a result of the amnesty. This means amnesty has generated a lot of controversies
in the region as some had positive and negative views on the programme. This could have implication on the success of the programme. This supports findings of Gaugran(2009) that the Niger Delta provides a stark example of the lack of accountability of a government to its people, and MNOC’S almost total lack of accountability when it comes to the impact of their operations on the rural dwellers.
Variables VL L M VMMilitant activities caused destruction of farmland 26(37.14) 16(22.86) 11(15.71) 17(24.29)
Militant activities made transportation difficult 12(17.14) 34(48.57) 14(20.00) 10(14.29)
Militant activities made marketability of products difficult 7(10.00) 30(42.86) 19(27.14) 14(20.00)
Militant activities affected the visits of extension workers 11(15.71) 8(11.43) 18(25.71) 33(47.14)
Militant activities affected labour on the farm 14(20.00) 28(40.00) 16(22.86) 12(17.14)
Timing of harvests was disrupted by militant activities 10(14.29) 35(50.00) 19(27.14) 6(8.57)
Loss of animals and aquatic products 24(34.29) 25(35.71) 11(15.71) 10(14.29)
Table 5 : Distribution of rural dwellers views on amnesty (n=70)
Variables SD D A SA
Militants did the right thing by accepting the amnesty granted. 1(1.43) 3(4.29) 41(58.57) 25(35.71)
Amnesty programme was badly set up. 10(14.29) 42(60.00) 9(12.86) 9(12.86)
Amnesty has led to improved education for the populace. 14(20.00) 20(28.57) 31(44.29) 5(7.14)
Globa
lJo
urna
lof
Scienc
eFr
ontier
Resea
rch
V
olum
e
40
()
Janu
ary
2012
D
© 2012 Global Journals Inc. (US)
Government did the right thing to grant the amnesty. 0(0) 2(2.86) 33(47.14) 35(50.00)
Assessment of Militancy Activities on Rural Dwellers in Delta State, NigeriaXII
Issu
e er
sion
IV
I
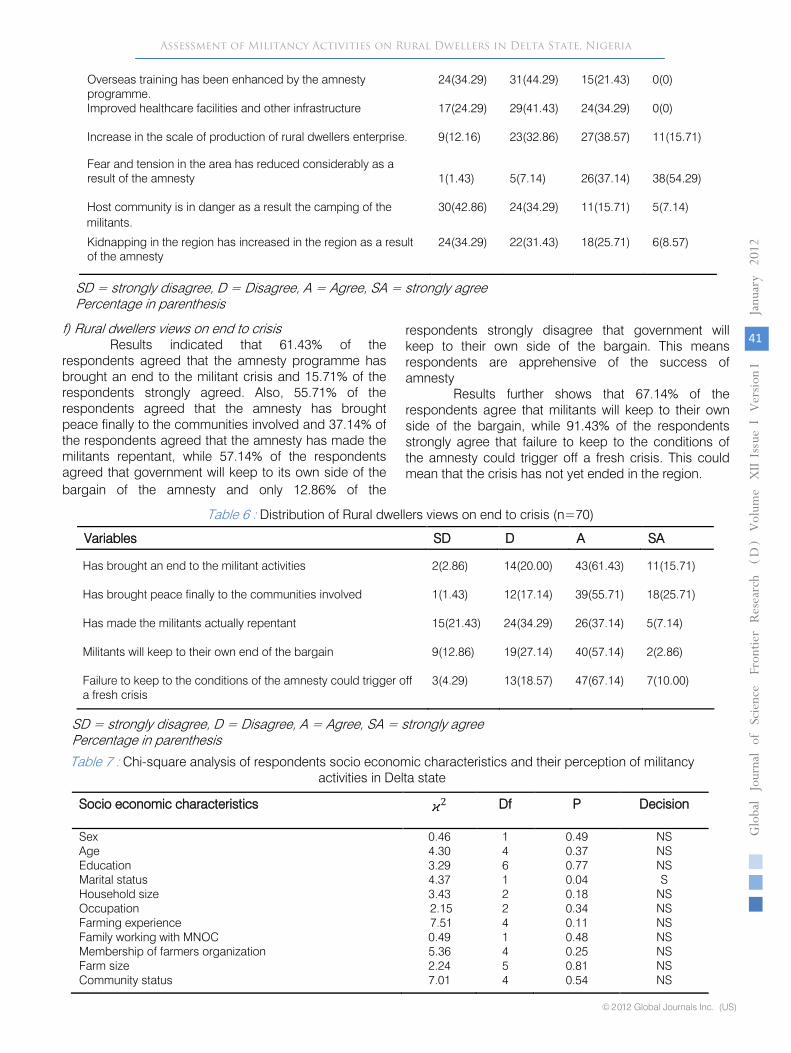
Overseas training has been enhanced by the amnesty programme.Improved healthcare facilities and other infrastructure
24(34.29)
17(24.29)
31(44.29)
29(41.43)
15(21.43)
24(34.29)
0(0)
0(0)
Increase in the scale of production of rural dwellers enterprise.
Fear and tension in the area has reduced considerably as a result of the amnesty
9(12.16)
1(1.43)
23(32.86)
5(7.14)
27(38.57)
26(37.14)
11(15.71)
38(54.29)
Host community is in danger as a result the camping of the 30(42.86) 24(34.29) 11(15.71) 5(7.14)
Kidnapping in the region has increased in the region as a result of the amnesty
24(34.29) 22(31.43) 18(25.71) 6(8.57)
SD = strongly disagree, D = Disagree, A = Agree, SA = strongly agreePercentage in parenthesis
f) Rural dwellers views on end to crisisResults indicated that 61.43% of the
respondents agreed that the amnesty programme has brought an end to the militant crisis and 15.71% of the respondents strongly agreed. Also, 55.71% of the respondents agreed that the amnesty has brought peace finally to the communities involved and 37.14% of the respondents agreed that the amnesty has made the militants repentant, while 57.14% of the respondents agreed that government will keep to its own side of the bargain of the amnesty and only 12.86% of the
respondents strongly disagree that government will keep to their own side of the bargain. This means respondents are apprehensive of the success of amnesty
Results further shows that 67.14% of the respondents agree that militants will keep to their own side of the bargain, while 91.43% of the respondents strongly agree that failure to keep to the conditions of the amnesty could trigger off a fresh crisis. This could mean that the crisis has not yet ended in the region.
Variables SD D A SA
Table 6 : Distribution of Rural dwellers views on end to crisis (n=70)
Has brought an end to the militant activities 2(2.86) 14(20.00) 43(61.43) 11(15.71)
Has brought peace finally to the communities involved 1(1.43) 12(17.14) 39(55.71) 18(25.71)
Has made the militants actually repentant 15(21.43) 24(34.29) 26(37.14) 5(7.14)
Militants will keep to their own end of the bargain 9(12.86) 19(27.14) 40(57.14) 2(2.86)
Failure to keep to the conditions of the amnesty could trigger off a fresh crisis
3(4.29) 13(18.57) 47(67.14) 7(10.00)
SD = strongly disagree, D = Disagree, A = Agree, SA = strongly agreePercentage in parenthesis
Socio economic characteristics 𝜘𝜘2 Df P Decision
Sex 0.46 1 0.49 NSAge 4.30 4 0.37 NSEducation 3.29 6 0.77 NSMarital status 4.37 1 0.04 SHousehold size 3.43 2 0.18 NSOccupation 2.15 2 0.34 NSFarming experience 7.51 4 0.11 NSFamily working with MNOC 0.49 1 0.48 NSMembership of farmers organization 5.36 4 0.25 NSFarm size 2.24 5 0.81 NSCommunity status 7.01 4 0.54 NS
Table 7 : Chi-square analysis of respondents socio economic characteristics and their perception of militancy activities in Delta state
Globa
lJo
urna
lof
Scienc
eFr
ontier
Resea
rch
V
olum
e
41
()
Janu
ary
2012
D
© 2012 Global Journals Inc. (US)
Assessment of Militancy Activities on Rural Dwellers in Delta State, Nigeria
militants.
XII
Issu
e er
sion
IV
I

H01: There is no significant relationship between the socio economic characteristics of the respondents and their perception on militant activities in the state.
Result of Chi-square analysis indicated a significant relationship between marital status (=4.37)
and the perception of respondents on militant activities at p≤ 0.05. This means that the marital status of the respondents would determine their perception of militant activities. This means for instance that a married respondent could perceive militancy as bad due to its effect on their family.
Table 8 : Relationship between perception of rural dwellers on the MNOC’S before the amnesty and after the amnesty
Source : Field survey 2010
Ho2: The is a significant difference between the rural dwellers perception on the MNOC’S before the amnesty and after the amnesty
A significant difference was recorded between the perceptions of rural dwellers on the MNOC before (t = -1.90) and after (t = -1.90) the amnesty at p ≤ 0.05. This means that the perception of the respondents on the MNOC activities differ before and after amnesty probably due to their conditions.
VII.CONCLUSION AND RECOMMENDATION
a) Conclusion The educational qualification and literacy level
of the rural dwellers is still very low and nothing urgent is being done by the Government and stakeholders to solve this problem and therefore employment opportunities for the people of the region is limited since they do not have the necessary educational qualifications to get good jobs.
Also, the rural dwellers blame the Government and the MNOC’S for the crisis in the state and accuse them of not providing infrastructure, job opportunities, better education, better healthcare, degraded forests and farmland, clean enabling environment for living and a few of them also accuse them for the death of livestock, fishes and even relations through pollution. The amnesty granted to the militants and the reduction of violence and tension in the state has done little to improve and/ or solve the problems that led to the crisis in the first place. Although most of the people believe the amnesty was the right and best step to take, they
Variable N Df Mean Std Dev t-value P DecisionPerspective Before 70 138 23 4.25 -1.90 0.05 Sig
After 70 137 21.67 4.01 -1.90 0.05 Sig
4) Government and the MNOC’S should involve the rural dwellers in project planning, implementation and policy making as they are the ones that know their needs the most.
1. Brown, Bobo 1998. External Relations manager of the Shell Petroleum Development Company (SPDC) of Nigeria, quoted in Environment Watch, 15 July 1998, 3-9.
2. Chindah A.C., Braide S.A. (2000): “The Impact of Oil Spills on the Ecology and Economy of the NigerDelta”. In Proceedings of the Workshop on Sustainable Remediation Development Technology held at the Institute of Pollution Studies, Rivers State University of Science and Technology, Port Harcourt.
3. Eboh, E.C.(1995): “Poverty, Population growth and Environmental Degradation: The Vicious Cycle of Human Misery”, in Eboh, E. C., Okoye, C. U., Ayichi, D. (Eds.), Rural Development in Nigeria: Concepts, Processes and Prospects, Auto-century Publishing Co. Enugu, Nigeria. pp274-285
4. Federal Office of Statistics [Nigeria] (FOS). 1992. Nigeria Demographic and Health Survey, 1990. Columbia, Maryland: Federal Office of Statistics and Macro International Inc.
5. Gaughran, A (2009): “Petroleum, Pollution and Poverty in the Niger Delta”
6. Makagbo, T.(2004): “Inside africa”, aired by CNN. http://transcripts.cnn.com, accessed August 10,2010
7. Whelan, T.(2003)“U.S. Partners With Nigeria on Security for Oil-Rich Delta Region”, accessed from,www. usinf0. state.gov, July 29, 2010
8. Shakleman, J. (2006). Oil profits and peace: Does Business Have a Role in Peacemaking? United States Institute for Peace.
still insist that the Government and the MNOC’S have not improved in terms of their commitment to the region.
b) Recommendation1) Non-farm enterprises are a strategy by which the
rural farming community in the state can cope with the decline in farmland availability and unemployment
2) Government interventions to develop rural social and economic infrastructure (transport, communication, health and education) and skills development are fundamental in creating peace in the state.
3) Rural dwellers should be better informed on the need for quality education so that they can get the jobs they feel they have a right too.
Globa
lJo
urna
lof
Scienc
eFr
ontier
Resea
rch
V
olum
e
42
()
Janu
ary
2012
D
© 2012 Global Journals Inc. (US)
Assessment of Militancy Activities on Rural Dwellers in Delta State, Nigeria
References Références Referencias
XII
Issu
e er
sion
IV
I

© 2012 . Idowu, AA, Olaoye, OJ, Ifegbesan, A, Abdul, WO, Olawale O ‘Busayo. This is a research/review paper, distributed under the terms of the Creative Commons Attribution-Noncommercial 3.0 Unported License http://creativecommons.org/licenses/by-nc/3.0/), permitting all non commercial use, distribution, and reproduction in any medium, provided the original work is properly cited.
Evaluation Of Fishermen And Fish Traders In Transactional Sex For Fish Marketing In Coastal Areas Of Ogun Waterside Local Government Area, Ogun State, Nigeria
By Idowu, AA, Olaoye, OJ, Ifegbesan, A, Abdul, WO, Olawale O ‘Busayo
University of Agriculture, Abeokuta, Ogun state, Nigeria Abstract - This study was undertaken to reveal the occurrence of transactional sex in coastal fishing communities of Ogun water side local government area, Ogun state, Nigeria. Fifty fishermen and female fish traders were randomly selected from four locations, Enu waya, JK Camp, Mosafejo and Okun- Elefon based on the fishing activities. Questionnaires were randomly administered to respondents to determine their socioeconomic activities and the level of involvement and reasons for going into transactional sexual activities in the study area. Data collected from the interview guides were subjected to statistical analysis such as descriptive and inferential analysis. Respondents’ age ranged between 26years - 65years, fishermen to fish traders ratio was 3:2(60% and 40%respectively), marital status of respondent was single, married, divorced/separated or widowed, Respondents religion was Islam, Christianity or Traditional belief. Trading is reduced in dry season as fish abundance is only experienced in rainy season. The study revealed that main reasons for going into transactional sex in fish trading was linked to inadequate capital (F cal = 0.00 for p<0.05), Generosity (F cal = 0.004 for p< 0.05) and Poverty (F cal = 0.040 for p<0.05) there was no significant difference in the frequency of involvement of transactional sex analyzed for both fishermen and fish traders (p>0.05 of F cal = 0.429) when statistically tested.
Keywords : Transactional-sex, coastal, Ogun waterside, socio-economic.
Evaluation Of Fishermen And Fish Traders In Transactional Sex For Fish Marketing In Coastal Areas Of Ogun Waterside Local Government Area, Ogun State, Nigeria
Strictly as per the compliance and regulations of :
Global Journal of Science Frontier ResearchAgriculture & BiologyVolume 12 Issue 1 Version 1.0 January 2012Type : Double Blind Peer Reviewed International Research JournalPublisher: Global Journals Inc. (USA)Online ISSN: 2249-4626 & Print ISSN: 0975-5896
GJSFR-D Classification : FOR Code: 070499

Evaluation Of Fishermen And Fish Traders In Transactional Sex For Fish Marketing In Coastal
Areas Of Ogun Waterside Local Government Area, Ogun State, Nigeria
Idowu, AAα, Olaoye, OJΩ, Ifegbesan, Aβ, Abdul, WO, α Olawale O ‘Busayoα
Abstract - This study was undertaken to reveal the occurrence of transactional sex in coastal fishing communities of Ogun water side local government area, Ogun state, Nigeria. Fifty fishermen and female fish traders were randomly selected from four locations, Enu waya, JK Camp, Mosafejo and Okun-Elefon based on the fishing activities. Questionnaires were randomly administered to respondents to determine their socioeconomic activities and the level of involvement and reasons for going into transactional sexual activities in the study area. Data collected from the interview guides were subjected to statistical analysis such as descriptive and inferential analysis. Respondents’ age ranged between 26years - 65years, fishermen to fish traders ratio was 3:2(60% and 40%respectively), marital status of respondent was single, married, divorced/separated or widowed, Respondents religion was Islam, Christianity or Traditional belief. Trading is reduced in dry season as fish abundance is only experienced in rainy season. The study revealed that main reasons for going into transactional sex in fish trading was linked to inadequate capital (F cal = 0.00 for p<0.05), Generosity (F cal = 0.004 for p< 0.05) and Poverty (F cal = 0.040 for p<0.05) there was no significant difference in the frequency of involvement of transactional sex analyzed for both fishermen and fish traders (p>0.05 of F cal = 0.429) when statistically tested. Resultant effects of transactional sex are financial loss, unwanted pregnancy which brings about polygamy and increase in household size. Information derived from this study serves as baseline study to establish the fact that transactional sex exist among fishermen and fish traders in the study area. It is suggested that adequate provisions be made to fish traders by government to help reduce poverty, augment their trading capital especially the fish traders who are majorly women as they fall victims of transactional sex in order to survive. Keywords : Transactional-sex, coastal, Ogun waterside, socio-economic.
Author α
:
Department of Aquaculture and Fisheries Management, University of Agriculture, Abeokuta, Ogun state, Nigeria.
Author
Ω
:
Agricultural Media Resources and Extension Center (AMREC), University of Agriculture, Abeokuta, Ogun State, Nigeria.
Author
β
:
Department of Curriculum Studies & Instructional Technology, Faculty of Education, Olabisi Onabanjo University, Ago-Iwoye, Nigeria. αE mail
Tel: +2348034709759
INTRODUCTION
ish is one of the most important foods on the planet earth. It is a rich source of protein and easily accessible compared to other sources of
protein such as egg, milk, meat etc. Fish is the most important animal protein food available in the tropics and it constitute about 40% of animal protein intake in Nigeria (Eyo, 1992). Coastal communities are the first to benefit from the different fish species that forage for food in estuaries, marshes, wetlands and bar areas (Cantoria, 2010). A constant but subtle theme in human development in the regions surrounded by water is the use of fish and dependence on fish and other aquatic lives for sustenance, trade, and livelihood and for the environment (Williams, 2004). With an estimated 200 million people directly dependent on fisheries and aquaculture by 2008, the sector contributes significantly to livelihoods around the world (FAO/IFAD/WB, 2009). The current estimates from the big number projects for employment in small scale capture fisheries in developing countries alone reach 25 to 27 million with an additional 68 to 70 million engaged in post harvesting (FAO/World Bank and World Fish, 2008).
As women form the majority that engaged in post harvesting in many countries, revised estimates of employment in the fisheries could indicate that the sector is predominantly a female one, challenging the long held notion that fisheries is a male dominated vocation. Preliminary BNP data for nine significant fish producing countries based on available statistics and case studies revealed that 47% of the labour forces in fishery sector (including post harvest) are women (FAO/ World Bank and World Fish, 2008). The major role women play in the fishery sector is to preserve and process the fish so as to retain some freshness. Consumers’ acceptability depends on the freshness of the fish. Freshness of fish can be maintained by processing and preservation, through which spoilage can be slowed or stopped (Tobor, 1985). The women
F
Globa
lJo
urna
lof
Scienc
eFr
ontier
Resea
rch
V
olum
e
43
()
Janu
ary
2012
D
© 2012 Global Journals Inc. (US)
I.
XII
Issu
e er
sion
IV
I

get involved in activities such as frying, smoking, drying, just to extend the fish’s shelf life and satisfy a proportion of the fish demanding ever growing population because according to Tobor (1990) increase in Nigeria’s population with restrictions to fish importation has put stress to limited supply of fish.
In modern times, fish in these region surrounded by water has been a source of stability and instability and over time, the same resource may cause either (Williams, 2004). One of the instabilities is transactional sex which has silently crept into the fishery sector without much being done about it. Transactional sex however means the exchange of sex for money, goods or services. Transactional sex affects mostly women in that it is a way of life for many poor women in developing countries (Robinson and Ethan, 2008).
According to Weeratunge and Synder (2009) much of the researches on gender differences and inequalities in capture fisheries in Africa and Pacific remain descriptive of the gender division of labour within the sector. They emphasize the need to move beyond this perspective by identifying emerging research on globalization, market changes, poverty and trends in gendered employment in the fishery sector.
In the fishery sector, the women mostly affected by transactional sex are chiefly in the post harvest sector and are not called sex workers but fish traders. This they are called because they can’t pay fishermen enough, so they exchange sex for fish (Laura, 2010). The above has been affirmed in recent studies in Botswana, Swaziland, Malawi, Zambia and Tanzania. Another reason given for it is the acute food insecurity (Laura, 2010). Ben (2006) reported that transactional sex is likened to prostitution and that it has come to stay in the Pacific Islands where nearly the whole world goes to fish because of its water. There, the women or ladies spend days with purse seiners in their harbour, gets ride back home and also get cash, fish and other material goods.
An ever increasing population, lack of employment, crowded housing conditions, low educations, low educational opportunities and sustenance at all cost has left many at the mercy of transactional sex. Women are mostly affected by the above and this reaches far to the fishery sector where they process, transport and retail fish (Christophe and Mertenb, 2007). To anyone in business, profit maximization is the most eligible reason. Hence, the fish traders probably engage in transactional sex to really maximize their profit. The need to survive has led many such as single mothers, divorced and widows to transactional sex as they are very prone to poverty. This study therefore describe the socio-demographic features, identify the reasons of transactional sex between the fishermen and fish traders and know the effects of transactional sex on the health and economic status of the respondents of respondents in the study
area. The exploitation of both fishing and transactional sex in places where they constantly create new vulnerabilities is another reason for taking up the project work to reveal the risk involved in the partnership between transactional sex and fishery sector.
II. MATERIALS AND METHODS a) Description Of The Study Area The study was carried out in Ogun state, a
south-western part of Nigeria. Ogun state has a total land area of 16,762km which is about 2% of the country’s land mass. It is bordered in the south by Lagos state and Atlantic Ocean, the north by Oyo and Osun State, the east by Ondo State and the West by republic of Benin (Oloruntoba and Adegbite, 2006). Rainy season in Ogun state starts around middle of March and continues until late October. Dry season starts around middle October and continues until February in most part of the State. The State is warm throughout the year with a temperature of between 28OC and 35 OC. Humidity is between 85% and 95% (Oloruntoba and Adegbite, 2006). Ogun state is predominantly inhabited by people who belong to the Yoruba ethnic group, the largest ethnic group in the West African Coast and one of the largest and longest established ethnic groups on the African continent (Oyesiku, 1992). Ogun state has marine biotopes covering 12, 482, 640 Ha, lacustrine biotopes totalling 4, 404.35 Ha and estuarine biotopes of 767.3km2 (Ayansanwo, 1999). Ogun waterside Local Government Area has a total land area of 734.35km2 and a population of 72,935 people (2006 census). Ogun waterside is the only area of Ogun state with a coastline on the might of Benin and which borders Lagos lagoon. It is bounded in the west by Ijebu East local government area and in the east by Ondo and Lagos lagoon. Its coordinates in Nigeria are 6O29’N4 O 24’E6.483 O N4.4 O E (www.ogunministry oflocalgovtandchieftaffairs.com). b) Study Population Respondents targeted for the study were fishermen and fish traders in Ogun waterside Local government area, Ogun state, Nigeria. c) Data Collection Technique And Sample Size Fifty fisherfolks (50) were randomly selected from four locations, Enu waya, JK Camp, Okun-Elefon and Mosafejo from the study area based on activities. 50 questionnaires were administered to the respondents to get information on the socioeconomic activities, factors that are determinant to transactional sex in fisheries activities and the effects of transactional sex on
Globa
lJo
urna
lof
Scienc
eFr
ontier
Resea
rch
V
olum
e
44
()
Janu
ary
2012
D
© 2012 Global Journals Inc. (US)
the health and economic status of the respondent in the study area.
Evaluation Of Fishermen And Fish Traders In Transactional Sex For Fish Marketing In Coastal Areas Of Ogun Waterside Local Government Area, Ogun State, Nigeria
XII
Issu
e er
sion
IV
I

III.
MEASUREMENT OF VARIABLES
The following variables were measured:
a)
Socio-Demographic Features Of Respondent
i. Age:
this is obtained in years and measured at interval level and
numeric values of 1 is used for ages 18-24years, 2 for 25
-35years, 3 for 36-45years, 4 for 46-55years and 56-65years.
ii. Sex:
respondents were distributed according to their roles and measured at numeric level of 1 is for male and 2 for female.
iii. Marital Status:
respondents were measured at numeric level of 1 for single, 2 for married, 3 for separated/divorced and 4 for widowed.
iv. Household size: it refers to the number of people
living under the same roof as the respondent, numeric value 1 stands for 1person, 2 for 2people, 3 for 3people, 4 for 4people, 5 for 5people and 6 for 6people and above.
v. Education type: numeric
value of value 1 is for formal
and 2 is for informal
vi. Education level: numeric value of 1 is for No formal education, 2 for primary education, 3 for Secondary education, 4 for NCE, 5 for HND, 6 for B.Sc, and 7 for Post graduate. vii. Religion: this refers to respondent’s belief measured at numeric value of 1 for Christians, 2 for Muslims and 3 for Traditional. viii. Month of fish abundance: numeric value of 1 is used for April-June and 2 for September-December ix. Season of fish abundance: numeric value of 1 is used for rainy season and 2 for dry season.
x. Mobility Period: numeric value of 1 stands for a period of 1-2 weeks, 2 for 3-4 weeks, 3 for 1-2 months and 4 for 3 months and above.
xi. Seasonality of trade:
refers to the effects of different season on the fish trade and numeric value of 1 stands for seasonal and 2 for not-seasonal
xii. Level of involvement:
numeric value 1 stands for full involvement while 2 is for part involvement.
xiii. Year of fishing: numeric value of 1 stands for 1-
10years, 2 for 11-20 years, 3 for 21-30 years and 31-40 is denoted by 4.
xiv. Water body fished in:
numeric value of 1 for coastal, 2 for lagoon and 3 for marine.
b)
Determinants Of Transactional Sex
i. Source of capital:
numeric value of 1 stands for personal savings, 2 for loan from cooperative, 3 for loan from friends, 4 for loan from relatives, 5 for personal savings and loan from friend, 6 for personal savings and
iii. Returns per time on investment: numeric value of 1 stands for varied while 2 stands for no response. iv. Form of loan repayment: numeric value of 1 stands for cash, 2 for kind and 3 for cash and kind. v. Type of kind payment: numeric value of 1 connotes fish sale, 2 for sex, 3 for friendship and 4 for domestic work.
vi. Convenience: numeric value of 1 connotes very convenient, 2 for convenient and 3 for not convenient.
vii. Penalty Involved: numeric value of 1 is used for presence of penalty while 2 is for no penalty
viii. Relationship between fisher-folks:
numeric value of 1
stands for Yes, 2 for No and 3 for No response.
ix. Basis of trade transaction: numeric value of 1 stands
for credit, 2 for payment and 3 for both credit and payment.
x. Factors leading to Transactional Sex:
the possible listed factors were rated using numeric value of 1 for Greed, 2 for Pleasure, 3 for Poverty, 4 for Social Status, 5 for No response and 6 for To get fish for sale.
xi. Rating for each factor:
numeric value of 1 was used for Strongly Agreed, 2 for Agreed, 3 for Undecisive, 4 for Disagree and 5 for Strongly Disagree.
c)
Effects Of Transactional Sex
i. Sex outside marriage:
numeric value of 1 is used for Yes, 2 for No and 3 for No response.
ii. If Yes, reason?:
numeric value 1 stands for pleasure and 2 stands for exchange medim.
iii. Ever traded sex?:
numeric value of 1 is used for Yes, 2 for No and 3 for No response.
iv. Ever used protection?
: numeric value of 1 is for Yes, 2 for No, 3 for No response and 4 for Not Always.
v. Protection used:
numeric value of 1 stands for condom, 2 for no protection, 3 for traditional protection and 4 for withdrawal.
vi. Awareness of STI’S:
numeric value of 1 stands for Yes, 2 for No and 3 for Not sure.
vii. Ways of erasing STI:
numeric value of 1 stands for faithfulness to one’s partner, 2 stands for condom use and 3 for traditional means.
viii. Effects:
suggested effects are commercial loss for fishermen, exposure to STD, unwanted pregnancy, abortion, transfer
of communicable disease and lack of respect between transactors. The different effects were rated with description to way of response. 1 stands for Strongly Agreed, 2 for Agreed, 3 for Undecisive, 4 for Disagree and 5 for Strongly Disagree.
Globa
lJo
urna
lof
Scienc
eFr
ontier
Resea
rch
V
olum
e
45
()
Janu
ary
2012
D
© 2012 Global Journals Inc. (US)
loan from personal savings and 7 for personal savings and loan from cooperatives.
ii. Amount loaned: numeric value of 1 is used for N5,000 - N 10,000, 2 for N11,000 - N20,000, 3 for N 21,000 - N 30,000, 4 for N 40,000 - N 50,000, 5 for N51,000 –N100,000 and 6 for N101,000 and above.
Evaluation Of Fishermen And Fish Traders In Transactional Sex For Fish Marketing In Coastal Areas Of Ogun Waterside Local Government Area, Ogun State, Nigeria
XII
Issu
e er
sion
IV
I
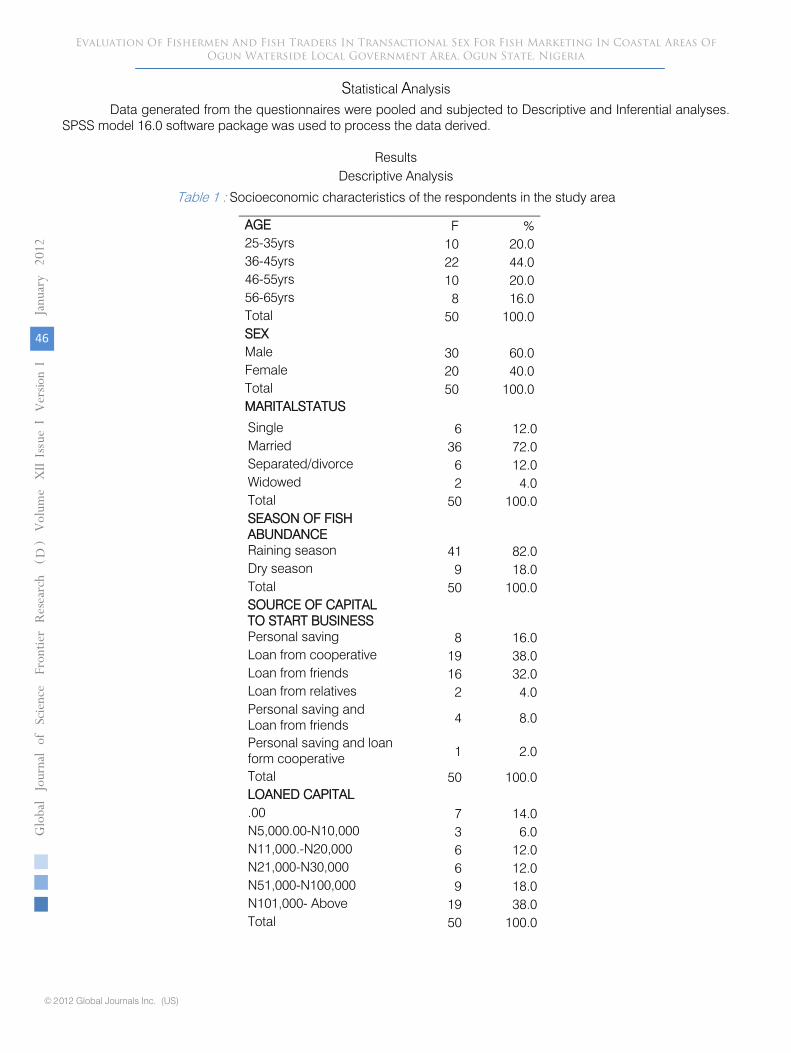
Statistical Analysis
Data generated from the questionnaires were pooled and subjected to Descriptive and Inferential analyses. SPSS model 16.0 software package was used to process the data derived.
Results
Descriptive Analysis
Table 1 : Socioeconomic characteristics of the respondents in the study area
Globa
lJo
urna
lof
Scienc
eFr
ontier
Resea
rch
V
olum
e
46
()
Janu
ary
2012
D
© 2012 Global Journals Inc. (US)
AGE F %25-35yrs 10 20.036-45yrs 22 44.046-55yrs 10 20.056-65yrs 8 16.0Total 50 100.0SEXMale 30 60.0Female 20 40.0Total 50 100.0MARITALSTATUS
Single 6 12.0Married 36 72.0Separated/divorce 6 12.0Widowed 2 4.0Total 50 100.0SEASON OF FISH ABUNDANCERaining season 41 82.0Dry season 9 18.0Total 50 100.0SOURCE OF CAPITAL TO START BUSINESSPersonal saving 8 16.0Loan from cooperative 19 38.0Loan from friends 16 32.0Loan from relatives 2 4.0Personal saving and Loan from friends 4 8.0
Personal saving and loan form cooperative 1 2.0
Total 50 100.0LOANED CAPITAL.00 7 14.0N5,000.00-N10,000 3 6.0N11,000.-N20,000 6 12.0N21,000-N30,000 6 12.0N51,000-N100,000 9 18.0N101,000- Above 19 38.0Total 50 100.0
Evaluation Of Fishermen And Fish Traders In Transactional Sex For Fish Marketing In Coastal Areas Of Ogun Waterside Local Government Area, Ogun State, Nigeria
XII
Issu
e er
sion
IV
I
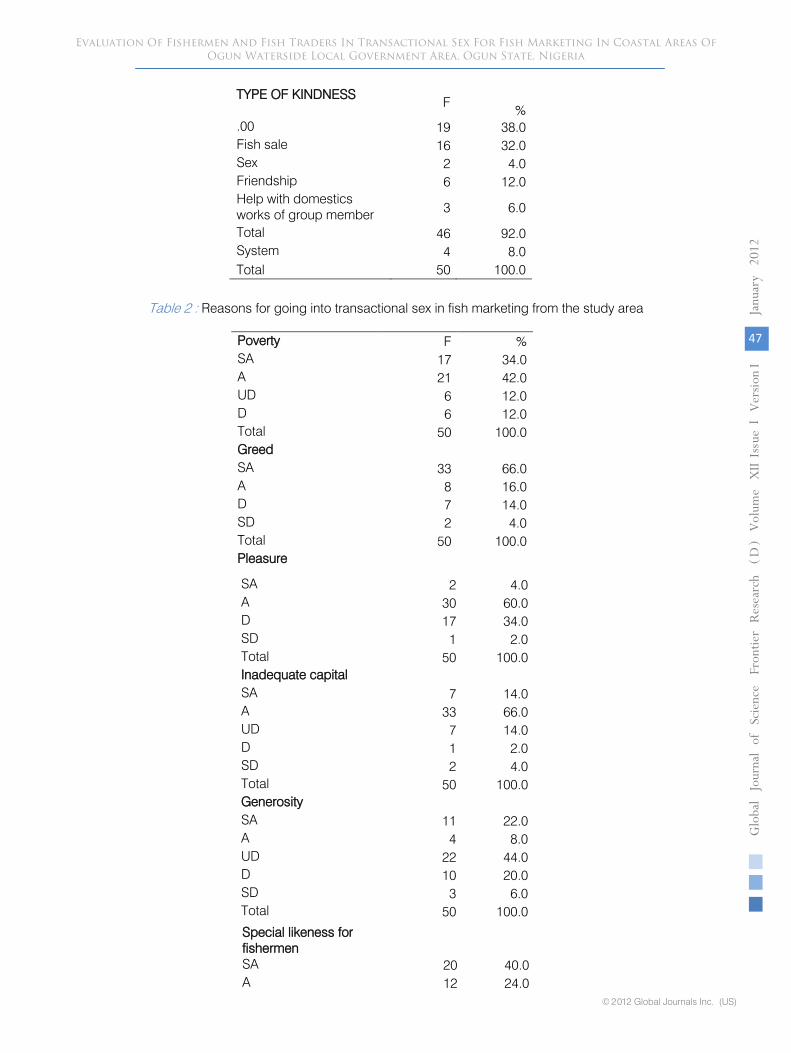
Table 2
:
Reasons for going into transactional sex in fish marketing from the study area
Globa
lJo
urna
lof
Scienc
eFr
ontier
Resea
rch
V
olum
e
47
()
Janu
ary
2012
D
© 2012 Global Journals Inc. (US)
TYPE OF KINDNESS F %
.00 19 38.0Fish sale 16 32.0Sex 2 4.0Friendship 6 12.0Help with domestics works of group member 3 6.0
Total 46 92.0System 4 8.0Total 50 100.0
Poverty F %SA 17 34.0A 21 42.0UD 6 12.0D 6 12.0Total 50 100.0GreedSA 33 66.0A 8 16.0D 7 14.0SD 2 4.0Total 50 100.0Pleasure
SA 2 4.0A 30 60.0D 17 34.0SD 1 2.0Total 50 100.0Inadequate capitalSA 7 14.0A 33 66.0UD 7 14.0D 1 2.0SD 2 4.0Total 50 100.0Generosity SA 11 22.0A 4 8.0UD 22 44.0D 10 20.0SD 3 6.0Total 50 100.0
Evaluation Of Fishermen And Fish Traders In Transactional Sex For Fish Marketing In Coastal Areas Of Ogun Waterside Local Government Area, Ogun State, Nigeria
Special likeness for fishermenSA 20 40.0A 12 24.0
XII
Issu
e er
sion
IV
I

Table 3
:
Resultant effects of transactional sex in fish marketing according to the respondents from the study area
Globa
lJo
urna
lof
Scienc
eFr
ontier
Resea
rch
V
olum
e
48
()
Janu
ary
2012
D
© 2012 Global Journals Inc. (US)
UD 8 16.0D 10 20.0Total 50 100.0Traditional effectSA 1 2.0A 12 24.0UD 17 34.0D 18 36.0SD 2 4.0Total 50 100.0
Commercial loss on the part of fisherman F %
SA 6 12.0A 32 64.0D 11 22.0SD 1 2.0Total 50 100.0Exposure to sexually transmitted diseaseSA 17 34.0A 23 46.0UD 2 4.0D 8 16.0Total 50 100.0Unwanted pregnancySA 11 22.0A 24 48.0UD 7 14.0D 8 16.0Total 50 100.0
AbortionSA 4 8.0A 18 36.0UD 8 16.0D 20 40.0Total 50 100.0Lack of respect between transactorsSA 9 18.0A 27 54.0UD 9 18.0\D 3 6.0SD 2 4.0Total 50 100.0
Evaluation Of Fishermen And Fish Traders In Transactional Sex For Fish Marketing In Coastal Areas Of Ogun Waterside Local Government Area, Ogun State, Nigeria
XII
Issu
e er
sion
IV
I
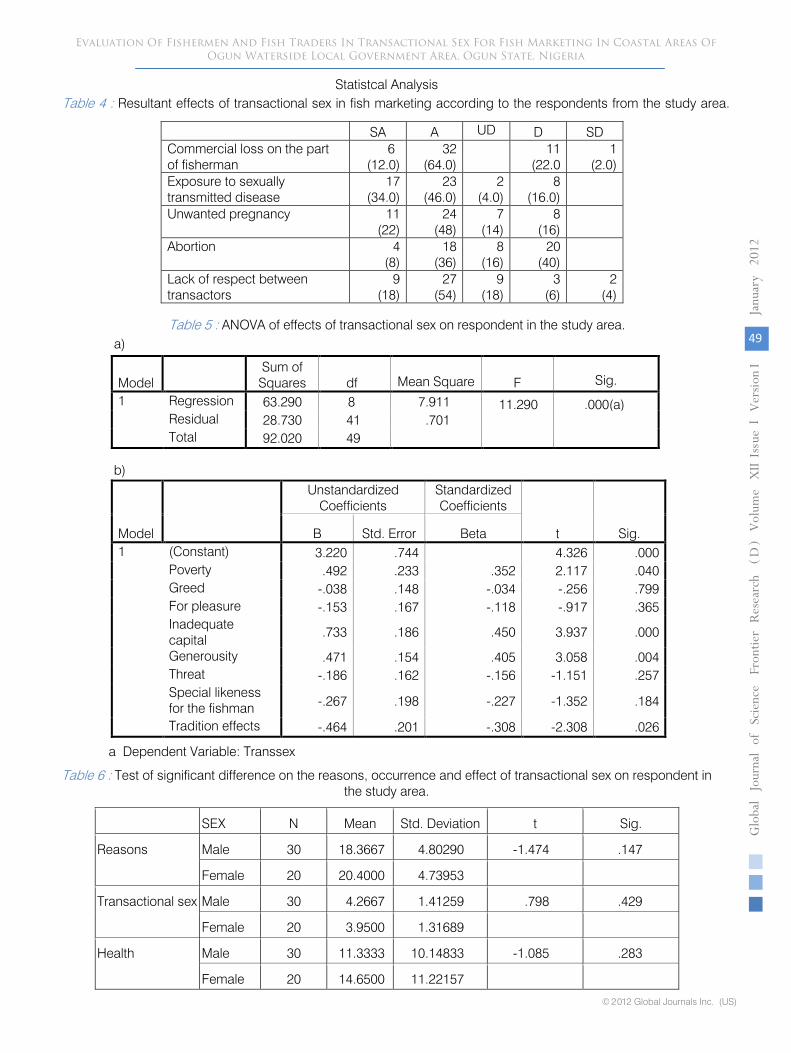
Statistcal Analysis
Table 4
:
Resultant effects of transactional sex in fish marketing according to the respondents from the study area.
Globa
lJo
urna
lof
Scienc
eFr
ontier
Resea
rch
V
olum
e
49
()
Janu
ary
2012
D
© 2012 Global Journals Inc. (US)
SA A UD D SDCommercial loss on the part of fisherman
6(12.0)
32(64.0)
11(22.0
1(2.0)
Exposure to sexually transmitted disease
17(34.0)
23(46.0)
2(4.0)
8(16.0)
Unwanted pregnancy 11(22)
24(48)
7(14)
8(16)
Abortion 4(8)
18(36)
8(16)
20(40)
Lack of respect between transactors
9(18)
27(54)
9(18)
3(6)
2(4)
Table 5 : ANOVA of effects of transactional sex on respondent in the study area.
ModelSum of Squares df Mean Square F Sig.
1 Regression 63.290 8 7.911 11.290 .000(a)Residual 28.730 41 .701Total 92.020 49
Model
Unstandardized Coefficients
Standardized Coefficients
t Sig.B Std. Error Beta1 (Constant) 3.220 .744 4.326 .000
Poverty .492 .233 .352 2.117 .040Greed -.038 .148 -.034 -.256 .799For pleasure -.153 .167 -.118 -.917 .365Inadequate capital .733 .186 .450 3.937 .000
Generousity .471 .154 .405 3.058 .004Threat -.186 .162 -.156 -1.151 .257Special likeness for the fishman -.267 .198 -.227 -1.352 .184
Tradition effects -.464 .201 -.308 -2.308 .026
a Dependent Variable: Transsex
a)
b)
Table 6 : Test of significant difference on the reasons, occurrence and effect of transactional sex on respondent in the study area.
SEX N Mean Std. Deviation t Sig.
Reasons Male 30 18.3667 4.80290 -1.474 .147
Female 20 20.4000 4.73953
Transactional sex Male 30 4.2667 1.41259 .798 .429
Female 20 3.9500 1.31689
Health Male 30 11.3333 10.14833 -1.085 .283
Female 20 14.6500 11.22157
Evaluation Of Fishermen And Fish Traders In Transactional Sex For Fish Marketing In Coastal Areas Of Ogun Waterside Local Government Area, Ogun State, Nigeria
XII
Issu
e er
sion
IV
I
Globa
lJo
urna
lof
Scienc
eFr
ontier
Resea
rch
V
olum
e
50
()
Janu
ary
2012
D
© 2012 Global Journals Inc. (US)
IV. DISCUSSIONS
The study site was chosen because apart from its relevance to fisheries, it is more of a rural area. This relates with the works of Varga (1996), Webb (1997), Luiz and Roets (1998) who affirmed that transactional sex occurs in township, rural areas and semi urban areas. 50 respondents selected for the interview is as a result of the sensitivity of the work. Previous work done on transactional sex by Minki et al (2004) required that small geographical locations be used for such studies.The ages of the respondents ranged between 36 and 45 years and formed 44% of the study population that were more informed about the occurrence of transactional sex possibly because it thrives more within that age group. This goes in line with the study done by Nzyoku et al (1997) which found out that young people were more proned to transactional sex activities. As against the findings from the work of Ali et al (2008) which revealed that the percentage of people involved in fish marketing fall within the age bracket of 20-30 above is about three times that of those within age bracket 40-50 above, this study recorded the same percentage of 20% for both age brackets.
Jonathan and Ethan(2008) also reflects that transactional sex is very present in the midst of divorced and separated who see themselves as survivals exchanging sex to survive.
The work of Adewale and Ikeola (2005) revealed that volume of market and income generated depends on seasonality of trade which also depend on seasonality of production supports what this study found out. In table 1, 82% of the respondent agreed that fish is more abundant in rainy season which implies more trade and more income at that time.
From findings, married women are less likely to engage in transactional sex when compared to single or once married women such as divorced, separated and widowed considering the admitting of transactional sex occurrence by the different female group. In six of the twelve countries on which Minki et al (2004) worked on specifically Nigeria, Togo, Kenya, Guinea, Niger and Zambia, percentage of ever married women engaged in transactional sex is 80% lesser than never married women. Also in countries like Chad, Mali, Zimbabwe and Central African Republic, percentage of ever married women involved in Transactional sex is 60%
lesser than those of single women. The works of
In support to findings made from this study, women are the major marketers of fish and they do so at small scale level or with little capital (Adewale and Ikeola 2005). They however have to lend money from friends, relatives, and fishermen if they want to make the business grow as formal credit institutions hardly lend out money to females (Moll et al 2001). Credit most times goes from fishermen to traders and rarely from traders to fishermen, these were affirmed on the field and work done by Adewale and Ikeola (2005) supports this. This creates a cordial relationship between the fishermen and fish traders and transactional sex could eventually result. Considering the large household size majorly recorded in my findings, women from poor household may see transactional sex as a way of augmenting what is being given them by the household head. This approves what is observed in Burkina-Faso by Minki et al (2004) that probability of women from poor household engaging in transactional sex is 118% higher than those from rich household and because poor household most times have large population.
According to WHO (2006), poverty, gender inequality are reasons that make people vulnerable to involvement in transactional sex and hence the risk of HIV/AIDS contraction. This could be seen from Table 2 where most percentage of the study population strongly agreed (34%) and agreed (42%) to poverty as a factor that could predetermine transactional sex and also the power the men has over them since they supply fish to the women for marketing because they are the ones who source it from the wild and could determine on what basis they dispose it. Research carried out by Minki et al (2004) suggests adverse economic conditions as a factor that could lead to transactional sex. This agrees with what is perceived on the field as the economic condition of most of the female respondent doesn’t meet up to what is seen as their necessities.
The livelihood/survival strategies employed by the fish traders depend to a large extent on their age, educational background, income level, experience in the trade and seasonality of trade among others. Work done by Adewale and Ikeola (2005) supports this implying that all this factor work together to either suggest
Evaluation Of Fishermen And Fish Traders In Transactional Sex For Fish Marketing In Coastal Areas Of Ogun Waterside Local Government Area, Ogun State, Nigeria
Multiple sex partners confessed by some of the respondents as seen in the case of polygamy for men and women having extramarital affairs though in a monogamous relationship is a very good medium for transactional sex to occur. Castle and Konate’s 1999 study supports this view as a socio-cultural factor that is present in Nigeria. From responses given to the interview guide by respondents, tradition believers especially men are most proned to transactional sex, Muslim men were more proned to it while Christians are less proned group due to different beliefs held by the different religious group on man-woman relationship. This is in accordance with the findings of Minki et al (2004) where they discovered that in eight out of the eleven countries they worked on, tradition believers are more proned to transactional sex than Christians while in seven of the eleven countries, Muslims are more engaged in transactional sex than Christians. The countries are sub Saharan African countries among which are Nigeria, Togo and Kenya to mention a few.
XII
Issu
e er
sion
IV
I

Transactional sex to the trader or not. Whether or not to resolve to Transactional sex at times of constraint, factors such as indigenous knowledge, credit transaction, social capital, dependence on female friends for loan and network of trust helps the fish trader make her decision.
The strict division of labour between fishermen and fish traders has made fish trade a source of income for women in the fish marketing sector, however institutional and cultural constraints notably lack of infrastructure and finance, polygamous household among others limit their economic activities and livelihood and hence make these women diversify as a survival strategy into things that could include transactional sex, Clark (1994).
According to Udong et al (2009), there was no formal financial and infrastructural support for the sector and these works translate to high transaction cost and low income creating a barrier to the women’s success and livelihood security in the fishery sector. This could make them embrace transactional sex as a survival means. It could be seen in the analyzed filled interview guide that most of these women get the fish they sell on credit and only make payment after sales.
According to Clark (1994), household upkeep and children education lies mostly on women’s shoulder in the rural community, hence most of the women in the market place struggle by all means to secure household livelihood, household upkeep and children’s education and since they earn little, transactional sex is embraced. This was affirmed on the field.
Considering the reasons why male and female go into transactional sex in the study area, the analysed data using t-test got for it a significant difference of 0.147 (Table 6) Of the reasons leading to transactional sex, poverty is very significant with a value of 0.040 from Table 5b. The present age of unemployment and poverty in Southern Africa may make many women rely on sexual exchange to support themselves financially (Ogden, 1996 and Schoepf, 1992) Even outside the African world, work done by Barker et al (1998) and Johnson (1997) on survival sex (sex for money or gift exchange) in United States of America reveals that it is done at times just to survive poverty.
Greed has no significant (p>0.05) F cal = 0.799 (Table 5b).
The significance of pleasure is little with a value of 0.365 from Table 5b.
Inadequate capital is greatly significant as it has a value of 0.000 from Table 5b. Work of Udong et al (2009) affirms that lack of infrastructure and finance, polygamy and patriarchy limit their economic activities and livelihood strategies and as a result, most women diversify as a survival strategy.
Generosity as one of the reasons for going into transactional sex in marketing fish in the study area was statistically significant (p<0.05) with a value of 0.004 (Table 5b).
Threat
as a reason for engaging in transactional sex has little significance of 0.259 (Table 5b). According to Janet (2002), women are at risk for violence because of factors that link resources exchange with sex.
Special likeness between fishermen and fish traders as a reason for transactional sex was significant (p<0.05) of 0.184 from Table 5b.
Use of traditional spell to bring about transactional sex has significance of 0.026 from Table 5b.
When frequency of involvement in transactional sex was analysed for
both male and female respondent, there was no significant difference as a value of 0.429 was gotten using t-test from Table 5b.
The implication transactional sex had on the health of both the male and female respondent has a significant value of 0.283 from Table 6.
1. Adewale, J.G., Ikeola, R.F. (2005): “Resettlement Coping Strategies Of Women Settlers Around Dams In Nigeria: A Case Study of Erelu Dam In Oyo, Oyo State, Nigeria.” Journal of Human Ecology 17(3): 177-181.
2. Alan, G.F., Morris, C.N. Cecilia, W.K. (2006): “Using Diaries To Measure Parameters Of Transactional Sex: An Example From The Trans-Africa Highway In Kenya.” Culture, Health And Sexuality 8 (2), Pp 175-185.
3. Ali, E.A., Gaya, H.I.M., Jampada, T.N. (2008): “Economic Analysis Of Fresh Fish Marketing In Maiduguri Gambou Market and Kachallari Alau Dam Landing Site of North-Eastern Nigeria.” Journal Of Agriculture And Social Sciences.
4. Ankomah, A. (1998): “Condom Use In Sexual Exchange Relationships Among Young Single Adults in Ghana.” AIDS Education Prevention 10(4): 303-316.
5. Ayansanwo, T.O. (1999): “Aquatic Biotopes, Fish And Fisheries Of Ogun State, Nigeria.” Aquafield Vol 1 No1
6. Ayinde, I.A., Afolami, C.A., Aromolaran, A.B., Vaughan, I.O., Fanimo, A.O. (2002): “Intrazonal Poverty Situation Among Farmers In Ogun State, Nigeria.” Moor Journal Of Agricultural Research. 3. (2) 306-312.
7. Barker, J.C., Robynn S. B., Gayle L.C., Bancroft, K.N. (1998): “Condom & Consequences : HIV/AIDS, Education and African-American Women.” Human Organisation 57: 273-283.
8. Bene, C., Merten, S. (2008): “Women And Fish For Sex: Transactional Sex, HIV/AIDS and Gender In African Fisheries” World Development.
9. Bledsoe, C. (1990): “School Fees and the Marriage Process For Mende Girls In Sierra-Leone.” New Directions In The Anthropology Of Gender,edited by Peggy R. S. and R.G.Goodenough. pp 283-309.
Globa
lJo
urna
lof
Scienc
eFr
ontier
Resea
rch
V
olum
e
51
()
Janu
ary
2012
D
© 2012 Global Journals Inc. (US)
Evaluation Of Fishermen And Fish Traders In Transactional Sex For Fish Marketing In Coastal Areas Of Ogun Waterside Local Government Area, Ogun State, Nigeria
References Références Referencias
XII
Issu
e er
sion
IV
I
10.
Burke, R.J.(1996): “Work Experience, Stress And Health Among Managerial And Professional Women, In M.J Schabracq, J.A.M. Winnubst and C.L. Cooper(Eds) Handbook Of Work And Health Psychology, Pp 205-230, Chichester: Wiley.
11.
Calves, A.E., Gretcen T.C., Enyegue, P.E. (1996): “Adolescent Sexual Activity In Sub-Saharan Africa: Do Men Have The Same Strategies And Motivations As Women?” University Park, PA: Population Research Institute.
12.
Cantoria, C.S. (2010): ‘’Importance of fish’’ Bright Hub
13.
Castle, S, Konate, M.K. (1999): “The Context and Consequences of Economic Transactions Associated with Sexual Relations Among Malian Adolescents” The African Population In the 21st Century: Proceeding Of The Third African Population Conference 2:105-125 Durban.
14.
Ciel, S.S. (2010): “Importance Of Fish” Bright Hub.
15.
Clark, G (1994): “Onions Are My Husband : Survival And Accumulation By West African Market Women.” The University Of Chicago Press, Chicago and London.
16.
Davis, C.(2010): “Transactional Sex, HIV And Livelihoods.” Siyahamba No 20 –
HIV and AIDS Newsletter of The Africa Alliance of YMCA.
17.
Dunkle K.L., Jewkes R.K., Brown H.C., Gray G.E., Mclntyre J.A. Harlow, S.D. (2004): “Transactional Sex Among Women In Soweto, South Africa: Prevalence, Risk Factors and Association With HIV Infection.” Pubmeb
18.
Eyo, A.A. (1992): “Utilization Of Freshwater Fish Species In Nigeria. In: Eyo, A.A. and A.M. Balogun (eds), Proceeding Of The 10th Annual Conference Of The Fisheries Society Of Nigeria.” pp 32-8.
FAO/WORLD BANK & WORLD FISH, 2008.
19.
Gorgen, R., Mohammed, Y., Michael M., Millimonumou, D. (1998): “Sexual Behaviour And Attitudes Among Unmarried Urban Youths In Guinea. International Family Planning Perspective
24(2): 65-71.
20.
Gregson, S., Nyamukapa, C.A., Garnett, G.P., Mason, P.R., Zhuwau,T., Carael, M., Stephen, K.C., Anderson, R. M. (2002): “Sexual Mixing Patterns And Sex-Differentials In Teenage Exposure to HIV Infection In Rural Zimbabwe.” Studies In Family Planning 38(3):147-162.
21.
Jacob, J. (2010): “Fish For Sex Thrives In Mangochi” Nation Online.
22.
Janet M.W. (2002): “She Drank His Money ”, Survival Sex and the Problem of Violence in Taverns in Guateng Province, South Africa. 16 (3) pp 267-293.
23.
Joe, W. (2008): “Fish For Sex” Hemodynamics.
24.
Johnson, C. (1997): “ Healing From Within: Women, HIV/AIDS, and The African-
American Church. ” In The Gender Politics Of HIV/AIDS in
Women. Nancy Goldstein and Jennifer L. Man-Lowe, eds. New York: New University Press. pp 273-282.
25.
Julharsen, E., Overa J., Nielson, J. Van, J.R., Zwietan, P. (2003): “Management, Co-Management or No-Management? Major Dilemma In Southern African Fresh Water Fisheries.” FAO Fisheries Technical Paper 426 1&2. Rome Food And Agriculture Organization.
26. Luiz, J., Roets, L. (1998): “On Prostitution, STDs and the LawnIn South Africa: The State As Punp.” Paper presented at thenAfrican Studies Association Conference, Chicago, November.
27. Machel, J.Z. (2001): “Unsafe Sexual Behaiour Among School Girls In Mozambique: A Matter Of Gender and Class.” Reproductive Health Matters 9(17):82-90.
28. Margaret, O. (2008): “Sale Of Womanhood Or Sex” Sexuality In Africa.
29. McLean, A (1976): Work Stress Addison-Wesley, New York.
30. Moll, H., Vanderstaaij, F., Vantilburg, A. (2001): (Eds) Smallholder and Market:Towards A Conducive Environment Policy And Best Practise Document 8, Netherlands Ministry of Foreign Affairs The Hague,1027.
31. Nzioka, C. (2001): “Dealing with the Risks of Unwanted Pregnancy And Sexually Transmitted Infections Among Adolescent: Some Experiences From Kenya.” African Journal Of Reproductive Health 5(3): 132-149.
32. Nzyuko, S, Lurie, P, McFarland, Leyden, W, Nyamwaya, D., Mandel, J.S. (1997): Adolescent sexual behaviour along the Trans-Africa highway in Kenya. AIDS, 11 (Supplement 1), s21-s26.
33. OGADEP (2005): Annual In-House Review Fisheries Report. Ogun State Agricultural Development Programme (OGADEP) Fisheries Unit.
34. Ogden, J.A. (1996): Respect: The “Proper Woman” in Post Colonial Kampala. In Post Colonial Identities in Africa, Richard Werbner and Terence O. Rouger, eds. London: Zed Books. pp 165-192.
35. Oke, A., Dawson, P. (2008): “Contextualising Workplace Stress: The Experience of Bank Employees In Nigeria.” Research Online
36. Oloruntoba, A., Adegbite, A. (2006): “Improving Agricultural Extension Services Through University Outreach Initiative: A Case Of Farmers In Model Village In Ogun State, Nigeria.” Journal Of Agricultural Education And Extension. Vol 12, No 14, 273-283.
37. Olowosegun, O.M., Sule A.M., Owena, V. Akangbe, J.A. (2009): “Prevalence of Transactional Sex In Selected Fishing Communities of Kainji Lake Basin” Nature And Science ISSN: 1545-0740.
38. Oyesiku, O.O. (1996): “Women In Agriculture(WIA)”
Globa
lJo
urna
lof
Scienc
eFr
ontier
Resea
rch
V
olum
e
52
()
Janu
ary
2012
D
© 2012 Global Journals Inc. (US)
Evaluation Of Fishermen And Fish Traders In Transactional Sex For Fish Marketing In Coastal Areas Of Ogun Waterside Local Government Area, Ogun State, Nigeria
Agricultural Extension In Africa. Proceeding Of An
XII
Issu
e er
sion
IV
I
International Workshop Organised by CTA. Vol 11, Yaounde, Cameroon Pp 240-250.
39.
Panayotou, T. (1985): Small Scale Fisheries In Asia, Socio-economic Analysis And Policy Ottawa, Canada: International Development Research Centre.
40.
Robinson,
J., Ethan, Y. (2008): “Transactional Sex As Response To Risk In Western Kenya.”Munich Personal RePEC Archive Paper No 7405.
41.
Schaepf, B. (1992): “Women At Risk: Case Studies From Zaire.” In the Time of AIDS: Social Analysis, Theory and Method. Gilbert Herdt and Shirley Lindenbaum,eds. London: Sage. pp 259-
286.
42.
Tobor, J.G. (1990): “The Fishing Industry In Nigeria: Status And Potential For Self Suficiency In Fish Technical” Paper No 54 Of Nigerian Institute For Marine Research, pp 4-5.
43.
Tobor, J.G.(1985): Fish Production and Processing in Nigeria. Technical Paper No. 22 Nigeria Institute of Ocanography And Marine Research, Pp 10.
44.
Udong, E., Niehof, A., Van Tilburg, A. (2009): “Struggle for Surival: Women Fish Traders Fighting Institutional and Cultural Constraints in Fishing Communities in the Niger Delta, Nigeria.” Conference On International Research On Food Security, National Resource Management and Rural Development.
45.
Varga, A.C. (1996): “The Commercial Sex Industry In Durban, South Africa. A Conceptual Life History Of A Sex Worker.” Paper Presented At The Pan African Anthropology Association For Anthropology In Southern Africa Conference, University Of South Africa, Pretoria, September 9-13.
46.
Webb, D. (1997): “HIV and AIDS in Africa Cape Town: David Phillip.”
World Health Organisation (2006): “Gender and HIV/AIDS” Geneva
Globa
lJo
urna
lof
Scienc
eFr
ontier
Resea
rch
V
olum
e
53
()
Janu
ary
2012
D
© 2012 Global Journals Inc. (US)
Evaluation Of Fishermen And Fish Traders In Transactional Sex For Fish Marketing In Coastal Areas Of Ogun Waterside Local Government Area, Ogun State, Nigeria
XII
Issu
e er
sion
IV
I

This page is intentionally left blank
Globa
lJo
urna
lof
Scienc
eFr
ontier
Resea
rch
V
olum
e
52
()
Janu
ary
2012
D
© 2012 Global Journals Inc. (US)
Evaluation Of Fishermen And Fish Traders In Transactional Sex For Fish Marketing In Coastal Areas Of Ogun Waterside Local Government Area, Ogun State, Nigeria
54
XII
Issu
e er
sion
IV
I
© 2012 . Moaed Almeselmani , AbdAlrzak Saud , Kamal Al Zubi, Fouad Hareri, Mahran Naaesan, Mohammad Adel Ammar , Osama Zuher Kanbar. This is a research/review paper, distributed under the terms of the Creative Commons Attribution-Noncommercial 3.0 Unported License http://creativecommons.org/licenses/by-nc/3.0/), permitting all non commercial use, distribution, and reproduction in any medium, provided the original work is properly cited.
Physiological Performance Of Different Durum Wheat Varieties Grown Under Rainfed Condition
By Moaed Almeselmani , AbdAlrzak Saud , Kamal Al Zubi, Fouad Hareri, Mahran Naaesan, Mohammad Adel Ammar , Osama Zuher Kanbar
Ezra Research Station, Ezra, Daraa, Syria Abstract - Wheat is a cereal of choice in most countries of the world and it is a staple food crop for more than 35% of the world population and also one of the widely cultivated crops in Syria. Constant efforts are therefore needed to boost its production to keep the pace with ever increasing population. But unfortunately, these efforts are seriously being hampered by a number of abiotic stresses among which is drought. Considerable attention over the years from plant breeders with the purpose of increasing the grain yield and to minimize crop loss due to unfavourable environmental conditions. Drought tolerance is a difficult trait to define as it encompasses a wide range of characteristics involving multiple genetic, physiological, cellular and biochemical strategies in the plant. Nine tolerant, moderately tolerant and susceptible durum wheat varieties were used in this experiment with major objective of examine the efficiency of the physiological system of these varieties under rainfed condition. Our result clearly showed significant differences between the three groups of varieties under study at vegetative and anthesis stage.
Keywords : Drought; rainfed; wheat; chlorophyll; membrane stability; relative water content; Fv/Fm.
Physiological Performance Of Different Durum Wheat Varieties Grown Under Rainfed Condition
Strictly as per the compliance and regulations of :
Global Journal of Science Frontier ResearchAgriculture & BiologyVolume 12 Issue 1 Version 1.0 January 2012Type : Double Blind Peer Reviewed International Research JournalPublisher: Global Journals Inc. (USA)Online ISSN: 2249-4626 & Print ISSN: 0975-5896
GJSFR-D Classification : FOR Code: 070302, 070307

Physiological Performance Of Different Durum Wheat Varieties Grown Under Rainfed Condition Moaed Almeselmani , AbdAlrzak Saud Ω, Kamal Al Zubiβ, Fouad Hareriβ, Mahran Naaesanβ, Mohammad
Adel Ammarβ , Osama Zuher Kanbarβ
Abstract - Wheat is a cereal of choice in most countries of the world and it is a staple food crop for more than 35% of the world population and also one of the widely cultivated crops in Syria. Constant efforts are therefore needed to boost its production to keep the pace with ever increasing population. But unfortunately, these efforts are seriously being hampered by a number of abiotic stresses among which is drought. Considerable attention over the years from plant breeders with the purpose of increasing the grain yield and to minimize crop loss due to unfavourable environmental conditions. Drought tolerance is a difficult trait to define as it encompasses a wide range of characteristics involving multiple genetic, physiological, cellular and biochemical strategies in the plant. Nine tolerant, moderately tolerant and susceptible durum wheat varieties were used in this experiment with major objective of examine the efficiency of the physiological system of these varieties under rainfed condition. Our result clearly showed significant differences between the three groups of varieties under study at vegetative and anthesis stage. Drought tolerant varieties showed better physiological performance (membrane stability index, relative water content, chlorophyll content and chlorophyll florescence), higher yield and yield components (total biomass, grain yield, tiller number/m2, grain number/ear and 1000 grain weight) compared to susceptible one. Our finding indicates that the physiological approach would be the most attractive way to develop new varieties rapidly with better adaptation to dry and semidry area. Abbreviations : RWC: relative water content; MSI: membrane stability index; Fv/Fm: chlorophyll florescence. Keywords : Drought; rainfed; wheat; chlorophyll; membrane stability; relative water content; Fv/Fm
I. INTRODUCTION
heat is widely grown as a rainfed crop in semi-arid areas, where large fluctuations occur in the amount and frequency of rainfall
events(Pakniyat and Tavakol, 2007).Drought is generally accepted to be the most widespread abiotic stress experienced by crop plants, and is becoming an Author α: Molecular Biology Lab, Department of Biotechnology, General Commission for Scientific Agricultural Research, Douma, Damascus, Syria, Phone: 00963-11-57386303, Fax: 00963-11-5757992, Mobile: 00963-988327510, E-mail : [email protected], [email protected]
Author Ω: Ezra Research Station, Ezra, Daraa, Syria. Author β: Daraa Agricultural Research Center, Jellen, Daraa, Syria.
increasingly severe problem in many regions of the world (Demirevskaet al., 2008, Ashraf and Harris, 2005, Quarrieet al., 2003). It considered as the main causes for crop yield reduction in the majority of agricultural regions of the world,particularly in the dry and semi dry areas (Mollasadeghiet al., 2011).Plant growth and productivity are negatively affected by water stress and genetic improvement of water stress tolerance is important to agricultural plants. Water stress tolerance has been documented in almost all plants but its extent varies from species to species (Chaitanyaet al., 2003).Water stress limiting durum wheat distribution and productivity in the Mediterranean environment and its major contributors to yield reduction in the semiarid regions, therefore improving drought resistance is a major objective in plant breeding programs for rainfed agriculture (Zareiet al., 2007).
Drought tolerance does not exist as a unique and easily quantifiable plant attribute, it is a complex physiological, morphological and molecular character connected with relative water content (RWC), relative water loss (RWL), chlorophyll fluorescence, stomatal resistance, cell membrane stability (CMS) and accumulation of free proline (Farshadfaret al., 2008). The integration of these novel approaches with conventional system of crop genetic improvement should provide exciting results to breed for drought tolerance in wheat in the near future (Khan and Iqbal, 2011). The development of drought tolerant cultivars of wheat will give great opportunities to obtain high productivity in stressed environments(Abdel-Hady and El-Naggar, 2007)But it is hampered by low heritability for drought tolerance and lack of effective strategies(Kirigwiet al., 2004; Pakniyat and Tavakol, 2007).Conventional plant breeding attempts have changed over to use physiological selection criteria since they are time consuming and rely on present genetic variability (Zhu, 2002). A physiological approach would be the most attractive way to develop new varieties rapidly (Turner and Nicolas, 1987). The scientists pay attention to the physiological basis for improving yield under abiotic stress and the use of physiological indices in the breeding program. Physiological traits that are integrative, either in time or at an organizational level (Arauset al., 2002)constitute ideal selection criteria for drought adaptation. In recent
W
Globa
lJo
urna
lof
Scienc
eFr
ontier
Resea
rch
V
olum
e
55
()
Janu
ary
2012
D
© 2012 Global Journals Inc. (US)
α
XII
Issu
e er
sion
IV
I
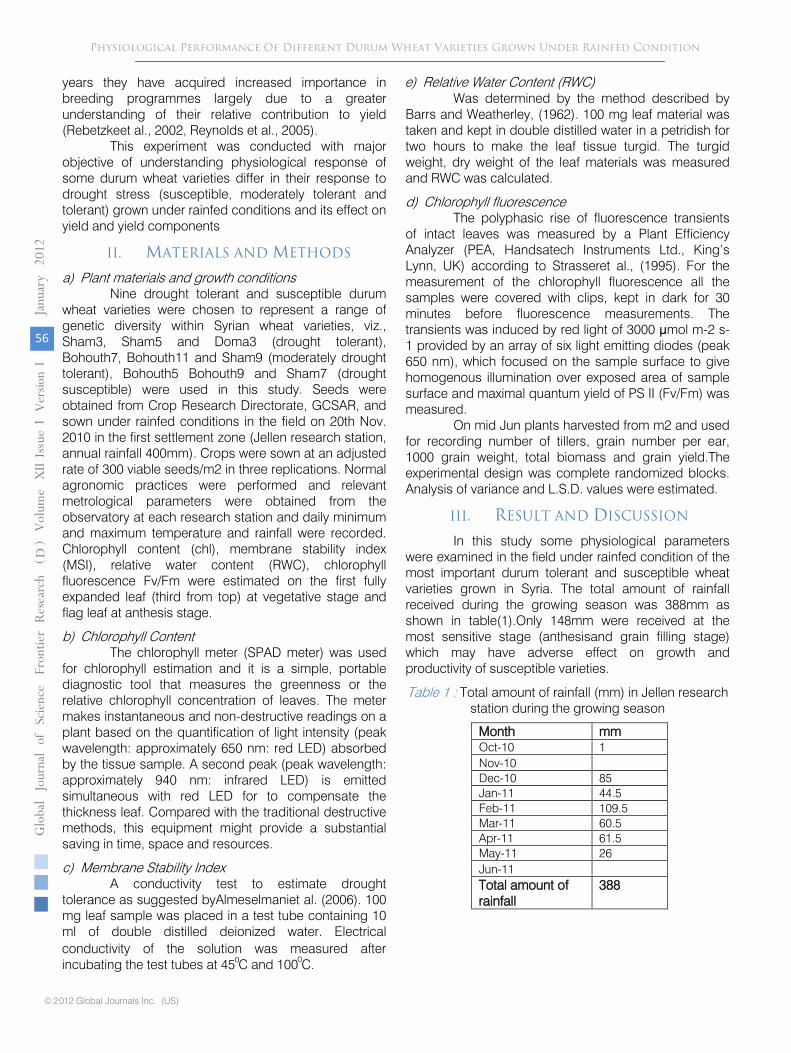
years they have acquired increased importance in breeding programmes largely due to a greater understanding of their relative contribution to yield (Rebetzkeet al., 2002, Reynolds et al., 2005).
This experiment was conducted with major objective of understanding physiological response of some durum wheat varieties differ in their response to drought stress (susceptible, moderately tolerant and tolerant) grown under rainfed conditions and its effect on yield and yield components
II. MATERIALS AND METHODS
a) Plant materials and growth conditions Nine drought tolerant and susceptible durum
wheat varieties were chosen to represent a range of genetic diversity within Syrian wheat varieties, viz., Sham3, Sham5 and Doma3 (drought tolerant), Bohouth7, Bohouth11 and Sham9 (moderately drought tolerant), Bohouth5 Bohouth9 and Sham7 (drought susceptible) were used in this study. Seeds were obtained from Crop Research Directorate, GCSAR, and sown under rainfed conditions in the field on 20th Nov. 2010 in the first settlement zone (Jellen research station, annual rainfall 400mm). Crops were sown at an adjusted rate of 300 viable seeds/m2 in three replications. Normal agronomic practices were performed and relevant metrological parameters were obtained from the observatory at each research station and daily minimum and maximum temperature and rainfall were recorded. Chlorophyll content (chl), membrane stability index (MSI), relative water content (RWC), chlorophyll fluorescence Fv/Fm were estimated on the first fully expanded leaf (third from top) at vegetative stage and flag leaf at anthesis stage.
b) Chlorophyll Content The chlorophyll meter (SPAD meter) was used
for chlorophyll estimation and it is a simple, portable diagnostic tool that measures the greenness or the relative chlorophyll concentration of leaves. The meter makes instantaneous and non-destructive readings on a plant based on the quantification of light intensity (peak wavelength: approximately 650 nm: red LED) absorbed by the tissue sample. A second peak (peak wavelength: approximately 940 nm: infrared LED) is emitted simultaneous with red LED for to compensate the thickness leaf. Compared with the traditional destructive methods, this equipment might provide a substantial saving in time, space and resources.
c) Membrane Stability Index A conductivity test to estimate drought
tolerance as suggested byAlmeselmaniet al. (2006). 100 mg leaf sample was placed in a test tube containing 10 ml of double distilled deionized water. Electrical conductivity of the solution was measured after incubating the test tubes at 45 C and 100 C.
Was determined by the method described by Barrs and Weatherley, (1962). 100 mg leaf material was taken and kept in double distilled water in a petridish for two hours to make the leaf tissue turgid. The turgid weight, dry weight of the leaf materials was measured and RWC was calculated.
d)
Chlorophyll fluorescence
The polyphasic rise of fluorescence transients
of intact leaves was measured by a Plant Efficiency
Analyzer (PEA, Handsatech Instruments Ltd., King’s Lynn, UK) according to Strasseret al., (1995). For the measurement of the chlorophyll fluorescence all the samples were covered with clips, kept in dark for 30 minutes before fluorescence measurements. The transients was induced by red light of 3000 μmol m-2 s-1 provided by an array of six light emitting diodes (peak 650 nm), which focused on the sample surface to give homogenous illumination over exposed area of sample surface and maximal quantum yield of PS II (Fv/Fm) was measured.
On mid Jun plants harvested from m2 and used
for recording number of tillers, grain number per ear, 1000 grain weight, total biomass and grain yield.The experimental design was complete randomized blocks. Analysis of variance and L.S.D. values were estimated.
III.
RESULT AND DISCUSSION
In this study some physiological parameters were examined in the field under rainfed condition of the most important durum tolerant and susceptible wheat varieties grown in Syria. The total amount of rainfall received during the growing season was 388mm as shown in table(1).Only 148mm were received at the most sensitive stage (anthesisand grain filling stage) which may have adverse effect on growth and productivity of susceptible varieties.
Table 1
:
Total amount of rainfall (mm) in Jellen research station during the growing season
mmMonth1Oct-10
Nov-1085Dec-1044.5Jan-11109.5Feb-1160.5Mar-1161.5Apr-1126May-11
Jun-11388Total amount of
rainfall
Globa
lJo
urna
lof
Scienc
eFr
ontier
Resea
rch
V
olum
e
56
()
Janu
ary
2012
D
© 2012 Global Journals Inc. (US)
Physiological Performance Of Different Durum Wheat Varieties Grown Under Rainfed Condition
e) Relative Water Content (RWC)
00
XII
Issu
e er
sion
IV
I

Cell membrane is one of the first targets of plant stresses (Levitt, 1972) and membrane stability is a widely used criterion to assess crop drought tolerance. This indicates the importance of this test in discriminating among tolerant and susceptible varieties. Drought susceptible varieties showed highest MSI value i.e., 82.1compared to moderately tolerant and tolerant one, i.e., 79.4 and 80.4 % respectively at vegetative stage, however no differences were recorded between tolerant and moderately tolerant varieties. While at
anthesis stage drought moderately tolerant varieties showed lowest MSI values i.e., 75.7% and the highest value were recorded in drought tolerant varieties i.e., 78.8% as shown in figure (1), in general, MSI decreased as plant advanced in age. Water stress caused water loss from plant tissues which seriously impair both membrane structure and function. Martin et al., (1987) reported that electrolyte leakage was correlated with drought tolerance. The leakage was due to damage to cell membranes which become more permeable.
Figure 1 : Effect of drought stress on membrane stability index (%), of drought tolerant, moderately tolerant and susceptible wheat varieties at vegetative and anthesisstages, LSD values at vegetative and anthesis stage: 1.5 and
1.2 respectively.
No differences in RWC were recorded between drought tolerant, moderately tolerant and susceptible wheat varieties at vegetative stage, however RWC values at this stage were more higher compared toanthesis stage. Data at anthesis stage showed that drought tolerant varieties had highest value of RWC in compared to the other varieties, the values were, 83.5, 82.3 and 81.4% for tolerant, moderately tolerant and susceptible varietiesrespectively as shown in figure(2).A decrease in the RWCin response to drought stress has been noted in wide variety of plants (Nayyar and Gupta, 2006).According to Almeselmaniet al.,( 2011; 2006) RWC indicates the water status of the cells and has significant association with yield and stress tolerance. Sinclair and Ludlow, (1985) reported that RWC of the leaves is a better indicator of water stress than other growth or biochemical parameters of the plants. RWC of the leaves is very responsive to drought stress and has been shown to correlate with drought tolerance (Colom and Vazzana, 2003).
72
74
76
78
80
82
84
Vgetative stage Anthesis stage
TolerantModerately TolerantSusceptible
Globa
lJo
urna
lof
Scienc
eFr
ontier
Resea
rch
V
olum
e
57
()
Janu
ary
2012
D
© 2012 Global Journals Inc. (US)
Physiological Performance Of Different Durum Wheat Varieties Grown Under Rainfed Condition
XII
Issu
e er
sion
IV
I

Figure 2 : Effect of drought stress on relative water content (%), of drought tolerant, moderately tolerant and susceptible wheat varieties at vegetative and anthesisstages, LSD values at vegetative and anthesis stage: 1.6 and
0.8 respectively.
The results in this experiment showed no differences in chlorophyll content between tolerant and susceptible varieties at vegetative stage and highest value were recorded in moderately tolerant varieties. At anthesis stage lowest chlorophyll content were recorded in drought varieties and no significant differences between drought tolerant moderately, tolerant varieties at this stage, however, the values were 60.7, 63.4 and 62.8 for drought susceptible, moderately tolerant and tolerant varieties respectively as shown infigure (3).This trait has been used successfully by many workers for screening and selection of drought tolerance wheat cultivars (Almeselmaniet al., 2011). According to Izanlooet al., (2008) water deficit leads to an increased depletion of chlorophyll and a decreased concentration of chlorophyll. Zaharievaet al., (2001) reported that leaf color and chlorophyll content were correlated, as expected, since chlorophyll loss is the main factor responsible for change in leaf color. According to Manivannanet al., (2007) chlorophyll is one of the major chloroplast components for photosynthesis and relative chlorophyll content has a positive relationship with photosynthetic rate and flag leaf chlorophyll content is an indicator of the photosynthetic activity and its stability for the conjugation of assimilate biosynthesis (Bijanzadeh and Emam, 2010).
78
79
80
81
82
83
84
85
86
87
88
Vgetative stage Anthesis stage
Tolerant
Moderately Tolerant
Susceptible
Globa
lJo
urna
lof
Scienc
eFr
ontier
Resea
rch
V
olum
e
58
()
Janu
ary
2012
D
© 2012 Global Journals Inc. (US)
Physiological Performance Of Different Durum Wheat Varieties Grown Under Rainfed ConditionXII
Issu
e er
sion
IV
I
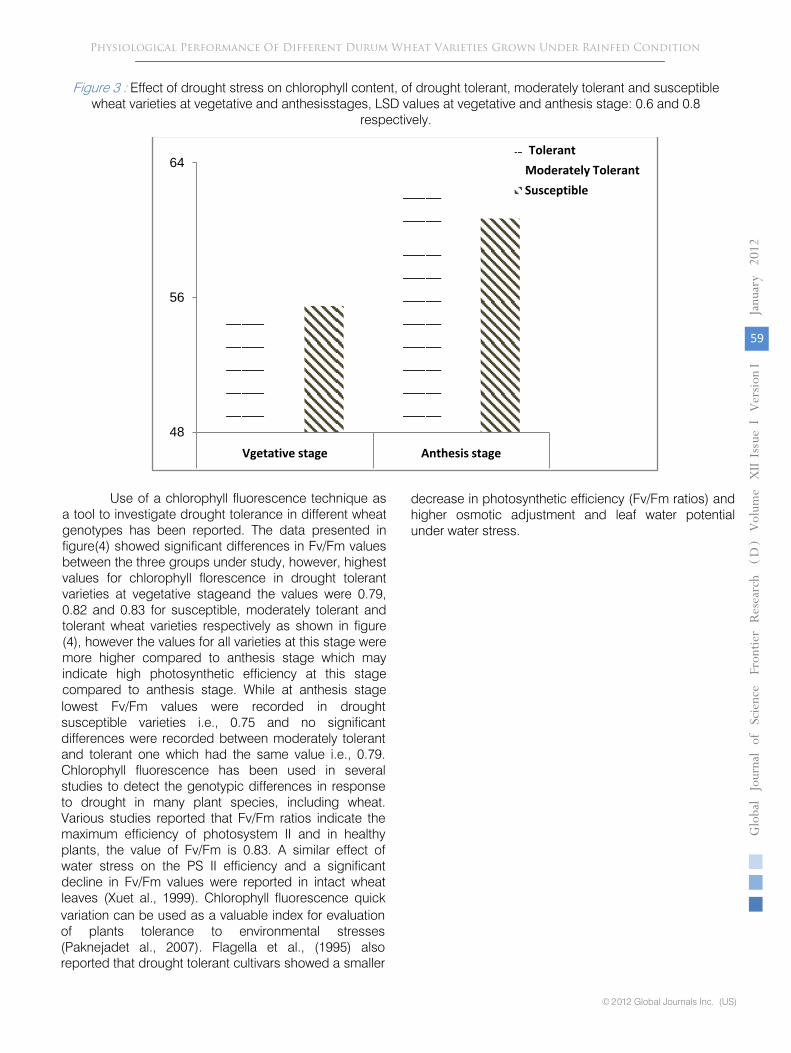
Figure 3 : Effect of drought stress on chlorophyll content, of drought tolerant, moderately tolerant and susceptible wheat varieties at vegetative and anthesisstages, LSD values at vegetative and anthesis stage: 0.6 and 0.8
respectively.
Use of a chlorophyll fluorescence technique as a tool to investigate drought tolerance in different wheat genotypes has been reported. The data presented in figure(4) showed significant differences in Fv/Fm values between the three groups under study, however, highest values for chlorophyll florescence in drought tolerant varieties at vegetative stageand the values were 0.79, 0.82 and 0.83 for susceptible, moderately tolerant and tolerant wheat varieties respectively as shown in figure (4), however the values for all varieties at this stage were more higher compared to anthesis stage which may indicate high photosynthetic efficiency at this stage compared to anthesis stage. While at anthesis stage lowest Fv/Fm values were recorded in drought susceptible varieties i.e., 0.75 and no significant differences were recorded between moderately tolerant and tolerant one which had the same value i.e., 0.79. Chlorophyll fluorescence has been used in several studies to detect the genotypic differences in response to drought in many plant species, including wheat. Various studies reported that Fv/Fm ratios indicate the maximum efficiency of photosystem II and in healthy plants, the value of Fv/Fm is 0.83. A similar effect of water stress on the PS II efficiency and a significant decline in Fv/Fm values were reported in intact wheat leaves (Xuet al., 1999). Chlorophyll fluorescence quick
48
56
64
Vgetative stage Anthesis stage
TolerantModerately TolerantSusceptible
Globa
lJo
urna
lof
Scienc
eFr
ontier
Resea
rch
V
olum
e
59
()
Janu
ary
2012
D
© 2012 Global Journals Inc. (US)
variation can be used as a valuable index for evaluation of plants tolerance to environmental stresses (Paknejadet al., 2007). Flagella et al., (1995) also reported that drought tolerant cultivars showed a smaller
decrease in photosynthetic efficiency (Fv/Fm ratios) and higher osmotic adjustment and leaf water potential under water stress.
Physiological Performance Of Different Durum Wheat Varieties Grown Under Rainfed Condition
XII
Issu
e er
sion
IV
I

Figure 4
:
Effect of drought stress on chlorophyll fluorescence, of drought tolerant, moderately tolerant and susceptible wheat varieties at vegetative and anthesisstages, LSD values at vegetative and anthesis stage: 0.06 and
0.03 respectively.
Drought, being the most important environmental stress, severely impairs plant growth and development, limits plant production and the performance of crop plants, more than any other environmental factor (Shao et al., 2009). Significant differences were recorded between drought tolerant, moderately tolerant and susceptible varieties with regard to total biomass i.e., 1202, 1287 and 1183g/m2 respectively as shown in table (2), however,Drought moderately tolerant varieties showed highest total
biomass values compared to other two groups. Plant produces their maximum biomass under adequate water supply, whereas moisture stress causes a marker decrease in plant biomass production (Clarke et al., 1991; Ashraf, 1998).
Table 2
:
Effect of drought stress on wheat yield and yield components (total biomass g/m , grain yield g/m , grain number per ear, tiller number/m2, 1000 grain weight (g) in drought tolerant, moderately tolerant and susceptible
group.
0.7
0.72
0.74
0.76
0.78
0.8
0.82
0.84
Vgetative stage Anthesis stage
Tolerant
Moderately Tolerant
Susceptible
1000grain weight (g)
Grain number/m2
Tillers number/m2
Grain yield (g)
Total biomass (g)
51.650.53495881184Tolerant50.149.33745681287Moderately Tolerant49.848.23635631202susceptible0.630.8815718LSD at 5%
Globa
lJo
urna
lof
Scienc
eFr
ontier
Resea
rch
V
olum
e
60
()
Janu
ary
2012
D
© 2012 Global Journals Inc. (US)
Physiological Performance Of Different Durum Wheat Varieties Grown Under Rainfed Condition
2 2
XII
Issu
e er
sion
IV
I
Blum and Pnuel (1990) reported that yield and yield components of twelve spring wheat varieties were significantly decreased when they received minimum annual precipitation. Our data showed thattolerant wheat varieties were superior in grain yield as shown in table (2) and drought susceptible varieties showed lowest grain yield i.e., 563g/m2 compared with moderately tolerant and tolerant one i.e., 568 and 588g/m2 respectively. However significant differences were reported between the three groups of varieties.
Drought stress may reduce all yield components, but particularly the number of fertile spikes per unit area and the number of grains per spike (Giuntaet al., 1993; Simaneet al., 1993), while kernel weight is negatively influenced by high temperatures and drought during ripening (Atefehet al., 2011 ). Our data on tillers number/m2 showed no significant differences between the moderately tolerant and susceptible one i.e., 363 and 374 respectively and lowest value were recorded in drought tolerant varieties i.e., 349.
While in case of grain number per ear, significant differences between susceptible and moderately tolerant and tolerant wheat varieties and the values were 48.2, 49.3 and 50.5 respectively as shown in Table (2), which indicates that drought tolerance varieties had highest grain number per ear. Drought stress reduced the number of gain/spike and grain yield
(Saleem, 2003) and the genotypes with higher number of grain/ear produce more yields (Iqbalet al., 1999).
In general the highest 1000 grain weight was observed in tolerant varieties i.e., 51.6g and no significant differences between susceptible and moderately tolerant varieties. However lowest 1000 grain yield were recorded in drought susceptible varieties i.e., 49.8g. Chandler and Singh (2008) reported that number of grains per main spike, 1000-grain weight, number of tillers per plant, biological yield per plant and grain yield per plant were decreased under stressed environment.
Plant growth and productivity are negatively affected by water stress and genetic improvement of water stress tolerance is important to agricultural plants. Generally, drought stress reduces growth (Levitt, 1980) and yield of various crops by decreasing chlorophyll pigments and photosynthetic rate (Asada, 1999). It's obvious that all these traits have directly or indirectly transfer their effects to yield particularly at anthesis stage, at the time the tolerant varieties showed better Physiological performance and maintain efficient physiological system the same varieties showed better yield. Considering that any improvement in grain yield must be a result of an underlying physiological change it is surprising that direct selection for a physiological trait has not contributed more to yield progress.
1. Abdel-Hady, M.S. and El–NaggarHoda, M.H., 2007.Wheat genotypic variation and protein markers in relation with in vitro selection for drought tolerance.J.Appl. Sci. Res.3: 926-934.
2. Almeselmani M., Deshmukh P.S., Sairam R.K., Kushwaha S.R. and Singh T.P., 2006.Protective role of antioxidant enzymes under high temperature stress.Plant Sci.171: 382-388.
3. Almeselmani M., Abdullah F., Hareri F., Naaesan M., Ammar M.A., Kanbar O.Z. and Saud Abd., 2011.Effect of drought on different physiological characters and yield component in different Syrian durum wheat varieties.J Agric. Sci.3: 127-133.
4. Araus J.L., Slafer G.A., Reynolds M.P. and Royo C., 2002. Plant breeding and drought in C3 Cereals: what should we bread for? Ann Bot. 89: 925-940.
5. Asada K., 1999. The water–water cycle in chloroplasts: scavenging of active oxygen and dissipation of excess photons. Ann. Rev. Plant Physio. Plant Mol. Biol. 50: 601-637.
6. Ashraf M.Y., 1998. Yield and yield components response of wheat (Triticumaestivum L.) genotypes grown under different soil water deficit conditions. ActaAgron. Hung. 46: 45-51.
7. Ashraf M. and Harris, P.J.C., 2005. Abiotic stresses: Plant resistance through breeding and molecular approaches. Haworth Press Inc., New York
8. Atefeh N.A., EtminanA., Teixeira Da Silva J. and Mohammadi R., 2011.Assessment of yield, yield-related traits and drought tolerance of durum wheat genotypes (Triticumturjidumvar. durum Desf.).Aust. J. Crop Sci.5: 8-16
9. Barrs H.D. and Weatherley P.E., 1962.Are-examination of the relative turgidity technique for estimating water deficits in leaves.Aust. J. Biol. Sci.24: 519-570.
10. Blum A. and Pnuel Y., 1990. Physiological attributes associated with drought resistance of wheat cultivars in a Mediterranean environment. Aust. J. Agri. Res.41: 799–810.
11. Bijanzadeh E. and Emam Y., 2010.Effect of Defoliation and drought stress on yield components and chlorophyll content of wheat.Pakistan J.Biol. Sci.13: 699-705.
12. Colom M. R.andVazzana C., 2003. Photosynthesis and PSII functionality of drought resistant and drought sensitive weeping love grass plants. Environ. Exp. Bot. 49: 135-144
13. Chaitanya K.V., Sundar D., Jutur P.P. and Ramachandra R.A., 2003. Water stress effects on photosynthesis in different mulberry cultivars. Plant Growth Regul. 40:75-80.
14. Chander S.S. and Singh T.K., 2008.Selection criteria for drought tolerance in spring wheat
Globa
lJo
urna
lof
Scienc
eFr
ontier
Resea
rch
V
olum
e
61
()
Janu
ary
2012
D
© 2012 Global Journals Inc. (US)
Physiological Performance Of Different Durum Wheat Varieties Grown Under Rainfed Condition
References Références Referencias
XII
Issu
e er
sion
IV
I

(Triticumaestivum L.). In: 11th International Wheat Genetics Symposium. p. 975-977.
15. Clarke J.M., Richards R.A. and Condon A.L., 1991.Effect of drought stress on residual transpiration and its relationship with water use of wheat.Canadian J Plant Sci. 71: 695-699.
16. Demirevska K., Simova-Stoilova L., Vassileva V., Vaseva I., grigorva B. and Feller U., 2008. Drought induced leaf protein alteration in sensitive and tolerant wheat varieties. Gen. Appl. Plant Physiol.34: 79-102.
17. Farshadfar E., Haghparast R. and Qaitoli M., 2008.Chromosomal localization of the genes controlling agronomic and physiological indicators of drought tolerance in barley using disomic addition lines. Asian J. Plant Sci.7: 536-543.
18. Flagella Z., Pastore D., Campanile R.G. and Di Fonzo N., 1995. The quantum yield of photosynthesis electron transport evaluated by chlorophyll fluorescence as an indicator of drought tolerance in durum wheat.J. Agric. Sci., Camb. 125: 325-329.
19. Giuanta F., Mortzo R. and Deielda M., 1993.Effect of drought on yield and yield components of durum
wheat and Triticale in Mediterranean environment.Field Crops Res. 33: 399-409.
20. Iqbal M., Ahmad K., Ahmad S., Sadiq M. and Ashraf, M.Y., 1999. Yield and yield components of durum wheat as influenced by water stress at various growth stages. Pakistan J. Biol. Sci.2: 11-14.
21. Izanloo A., Condon A.G., Langridge P., Tester M. and Schnurbusch T., 2008. Different mechanisms of adaptation of cyclic water stress in two South Australian bread wheat cultivars. J Exp. Bot.59: 3327–3346.
22. Khan M.A. and Iqbal M., 2011.Breeding for drought tolerance in wheat (Triticumaestivum L.): constraints and future prospects.Front. Agric. China.5: 3134.DOI 10.1007/s11703-010-1054-2.
23. Kirigwi F.M., Ginkel M.V., Trethowan R., Sears R.G. and Rajaram S., 2004.Evaluation of selection strategies for wheat adaptation across water regimes.Euphytica.135: 361-371.
24. Levitt J., 1972. Responses of plants to environmental stresses.Academic press, New York.
25. Levitt J., 1980. Stress terminology. In: Adaptation of plants to water and high temperature stress. John Wiley & Sons Inc., New York, p. 473-439.
26. Mollasadeghi V., Valizadeh M., Shahryari R and Imani A. A., 2011.Evaluation of end drought tolerance of 12 wheat genotypes by stress indices.Middle-East J. Sci. Res.7: 241-247.
27. Manivannan P., Jaleel C.A., Sankar B., Kishore K.A., Somasundaram R., AlaguLakshmanan G.M. and Panneerselvam R., 2007. Growth, biochemical modifications and proline metabolism in Helianthus
annuus L. as induced by drought stress. Colloids Surf. B: Biointerf. 59: 141-149
28. Martin U., Alladru S.G. and Bahari Z.A., 1987.Dehydration tolerance of leaf tissues of six woody angiosperm species.Physiol.Plant.69:182-186.
29. Nayyar, H. and Gupta, D. (2006).Differential sensitivity of C3 and C4 plants to water deficit stress: Association with oxidative stress and antioxidants. Environ. Exp. Bot.58: 106-113
30. Pakniyat H. and Tavakol E., 2007. RAPD markers associated with drought tolerance in bread wheat (Triticumaestivum L.). Pakistan J. Biol. Sci. 10: 3237-3239.
31. Paknejad F., Nasri M., Reza H., Moghadam T., Zahedi H. and Alahmadi M.J., 2007. Effects of drought stress on chlorophyll fluorescence parameters, chlorophyll content and grain yield of wheat cultivars. J Biol. Sci.7: 841-847.
32. Quarrie S. A., Dodig D., Pekiç S., Kirby J., Kobiljski B., 2003. Prospects for marker-assisted selection of improved drought responses in wheat.Bulg. J. Plant Physiol., Special Issue 2003: 83-95.
33. Rebetzke G.K., Condon A.G., Richards R.A. and Farquher G.D., 2002. Selection for reduced carbon discrimination increases aerial biomass and grain yield of rainfed bread wheat. Crop Sci. 42: 739-745.
34. Reynolds M.P., Mujeeb-Kazi A. and Sawkins M., 2005. Prospects for utilizing Plant adoptive mechanisms to improve wheat and other crops in drought and salinity –prone environments. Ann. Appli. Biol.146: 239-259.
35. Saleem M., 2003. Responses of durum and bread wheat genotypes to drought stress: Biomass and yield components. Asian J. Plant Sci.2: 290-293
36. Shao H.B., Chu L.Y., Jaleel C.A., Manivannan P., Panneerselvam R. and Shao M.A., 2009.Understanding water deficit stress -induced changes in the basic metabolism of higher plants-biotechnologically and sustainably improving agriculture and the ecoenvironment in arid regions of the globe.Crit. Rev. Biotechnol.29: 131-151.
37. Simane B., Struik P.C., Nachit M. and Peacock J.M., 1993. Ontogenic analysis of yield components and yield stability of durum wheat in water-limited environments.Euphytica.71: 211–219.
38. Strasser R.J., Srivastava A., and Govindjee 1995. Polyphasic chlorophyll a fluorescence transient in plants and Cyanobacteria.Photochem.Photobiol.61: 32-42.
39. Sinclair T.R. and Ludlow M.M., 1985. Who taught plants thermodynamics? The unfulfilled potential of plant water potential. Aust. J. Plant Physiol. 33:.213-217.
40. Turner N.C. and Nicolas M.E., 1987.Drought resistance of wheat for light-textured soils in a
Globa
lJo
urna
lof
Scienc
eFr
ontier
Resea
rch
V
olum
e
62
()
Janu
ary
2012
D
© 2012 Global Journals Inc. (US)
Physiological Performance Of Different Durum Wheat Varieties Grown Under Rainfed ConditionXII
Issu
e er
sion
IV
I
Mediterranean climate. In: Drought Tolerance in Winter Cereals, Srivastava, P., Porceddu, E., Acevedo, E. and Varma, S. (eds). John Wiley & Sons, Chichester, pp. 203-216.
41. Zaharieva M., Gaulin E., Havaux M., Acevedo E. and Monneveux P., 2001. Drought and heat responses in the wild wheat relative Aegilops geniculata Roth. Crop Sci. 41: 1321–9
42. Zarei L., Farshadfar E., Haghparast R. Rajabi R. and Mohammadi M., 2007.Evaluation of some indirect traits and indices to identify drought tolerance in bread wheat.Asian J. Plant Sci.6: 1204-1210.
43. Zhu J.K., 2002. Salt and drought stress signal transduction in plants. Annu. Rev. Plant Biol. 53: 243-273.
44. Xu C.C., Lee H.Y. and Lee C.H., 1999. Recovery from low temperature photo inhibition is not governed by changes in the level of zeaxanthin in rice (Oryza sativa L.) leaves. J. Plant Physiol. 155: 755– 761.
Globa
lJo
urna
lof
Scienc
eFr
ontier
Resea
rch
V
olum
e
63
()
Janu
ary
2012
D
© 2012 Global Journals Inc. (US)
Physiological Performance Of Different Durum Wheat Varieties Grown Under Rainfed Condition
XII
Issu
e er
sion
IV
I

This page is intentionally left blank
Globa
lJo
urna
lof
Scienc
eFr
ontier
Resea
rch
V
olum
e
64
()
Janu
ary
2012
D
© 2012 Global Journals Inc. (US)
Physiological Performance Of Different Durum Wheat Varieties Grown Under Rainfed ConditionXII
Issu
e er
sion
IV
I
© 2012 . B.K. Abdul Jabbar , H.M. Saud. This is a research/review paper, distributed under the terms of the Creative Commons Attribution-Noncommercial 3.0 Unported License http://creativecommons.org/licenses/by-nc/3.0/), permitting all non commercial use, distribution, and reproduction in any medium, provided the original work is properly cited.
Effects of phosphorus on biological nitrogen fixation in soybean under irrigation using saline water
By B.K. Abdul Jabbar , H.M. Saud Ezra Research Station, Ezra, Daraa, Syria
Abstract – A field experiment was conducted on Serdang soil, to study the effect of both phosphorus application and bacterial inoculation on the growth and yield of soybean crop under irrigation by saline water (3.5dS/m). Factorial experiment was used with randomize complete block design (RCBD) for phosphorus and Rhizobial inoculation factors, the phosphorus levels were 0, 40, 80 and 120 Kg P /ha, while Rhizobial inoculation contained two treatments( Rhizobial inoculation and control) with three replicates. The following parameters were measured: number of nodules, weight of nodules, plant dry weight, plant height, number of pods, weight of pods and root dry weight. The results showed that the inoculation treatment was significantly higher than non – inoculation treatment, also results showed increasing in all parameters at 120 Kg P/ ha. We can conclude that the rhizobial inoculation with phosphorus application for soybean crops caused increasing in both yield and its components
Keywords : phosphorus, saline water, bacterial inoculation, soybean.
Effects of phosphorus on biological nitrogen fixation in soybean under irrigation using saline water
Strictly as per the compliance and regulations of :
Global Journal of Science Frontier ResearchAgriculture & BiologyVolume 12 Issue 1 Version 1.0 January 2012Type : Double Blind Peer Reviewed International Research JournalPublisher: Global Journals Inc. (USA)Online ISSN: 2249-4626 & Print ISSN: 0975-5896
GJSFR-D Classification : FOR Code: 100103, 070103
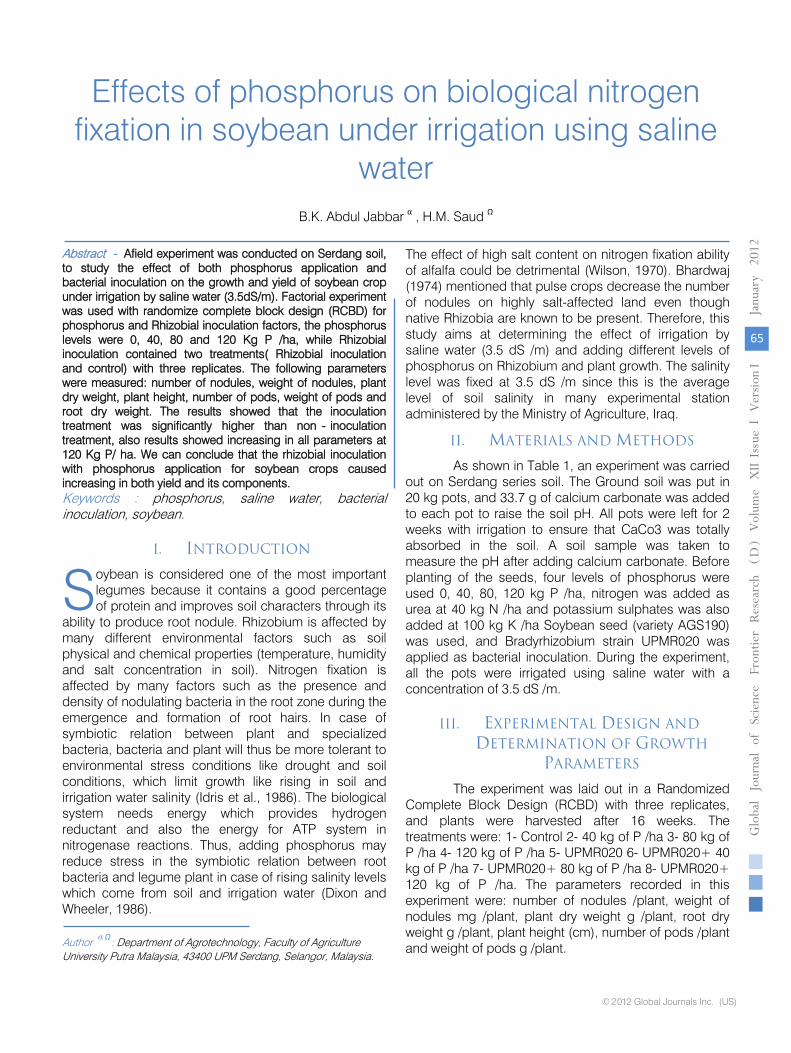
Effects of phosphorus on biological nitrogen fixation in soybean under irrigation using saline
water B.K. Abdul Jabbar α , H.M. Saud Ω
Abstract - Afield experiment was conducted on Serdang soil, to study the effect of both phosphorus application and bacterial inoculation on the growth and yield of soybean crop under irrigation by saline water (3.5dS/m). Factorial experiment was used with randomize complete block design (RCBD) for phosphorus and Rhizobial inoculation factors, the phosphorus levels were 0, 40, 80 and 120 Kg P /ha, while Rhizobial inoculation contained two treatments( Rhizobial inoculation and control) with three replicates. The following parameters were measured: number of nodules, weight of nodules, plant dry weight, plant height, number of pods, weight of pods and root dry weight. The results showed that the inoculation treatment was significantly higher than non - inoculation treatment, also results showed increasing in all parameters at 120 Kg P/ ha. We can conclude that the rhizobial inoculation with phosphorus application for soybean crops caused increasing in both yield and its components. Keywords : phosphorus, saline water, bacterial inoculation, soybean.
I. INTRODUCTION
oybean is considered one of the most important legumes because it contains a good percentage of protein and improves soil characters through its
ability to produce root nodule. Rhizobium is affected by many different environmental factors such as soil physical and chemical properties (temperature, humidity and salt concentration in soil). Nitrogen fixation is affected by many factors such as the presence and density of nodulating bacteria in the root zone during the emergence and formation of root hairs. In case of symbiotic relation between plant and specialized bacteria, bacteria and plant will thus be more tolerant to environmental stress conditions like drought and soil conditions, which limit growth like rising in soil and irrigation water salinity (Idris et al., 1986). The biological system needs energy which provides hydrogen reductant and also the energy for ATP system in nitrogenase reactions. Thus, adding phosphorus may reduce stress in the symbiotic relation between root bacteria and legume plant in case of rising salinity levels which come from soil and irrigation water (Dixon and Wheeler, 1986). Author α Ω: Department of Agrotechnology, Faculty of Agriculture University Putra Malaysia, 43400 UPM Serdang, Selangor, Malaysia.
The effect of high salt content on nitrogen fixation ability of alfalfa could be detrimental (Wilson, 1970). Bhardwaj (1974) mentioned that pulse crops decrease the number of nodules on highly salt-affected land even though native Rhizobia are known to be present. Therefore, this study aims at determining the effect of irrigation by saline water (3.5 dS /m) and adding different levels of phosphorus on Rhizobium and plant growth. The salinity level was fixed at 3.5 dS /m since this is the average level of soil salinity in many experimental station administered by the Ministry of Agriculture, Iraq.
II. MATERIALS AND METHODS
As shown in Table 1, an experiment was carried out on Serdang series soil. The Ground soil was put in 20 kg pots, and 33.7 g of calcium carbonate was added to each pot to raise the soil pH. All pots were left for 2 weeks with irrigation to ensure that CaCo3 was totally absorbed in the soil. A soil sample was taken to measure the pH after adding calcium carbonate. Before planting of the seeds, four levels of phosphorus were used 0, 40, 80, 120 kg P /ha, nitrogen was added as urea at 40 kg N /ha and potassium sulphates was also added at 100 kg K /ha Soybean seed (variety AGS190) was used, and Bradyrhizobium strain UPMR020 was applied as bacterial inoculation. During the experiment, all the pots were irrigated using saline water with a concentration of 3.5 dS /m.
III. EXPERIMENTAL DESIGN AND DETERMINATION OF GROWTH
PARAMETERS
The experiment was laid out in a Randomized Complete Block Design (RCBD) with three replicates, and plants were harvested after 16 weeks. The treatments were: 1- Control 2- 40 kg of P /ha 3- 80 kg of P /ha 4- 120 kg of P /ha 5- UPMR020 6- UPMR020+ 40 kg of P /ha 7- UPMR020+ 80 kg of P /ha 8- UPMR020+ 120 kg of P /ha. The parameters recorded in this experiment were: number of nodules /plant, weight of nodules mg /plant, plant dry weight g /plant, root dry weight g /plant, plant height (cm), number of pods /plant and weight of pods g /plant.
S
Globa
lJo
urna
lof
Scienc
eFr
ontier
Resea
rch
V
olum
e
65
()
Janu
ary
2012
D
© 2012 Global Journals Inc. (US)
XII
Issu
e er
sion
IV
I
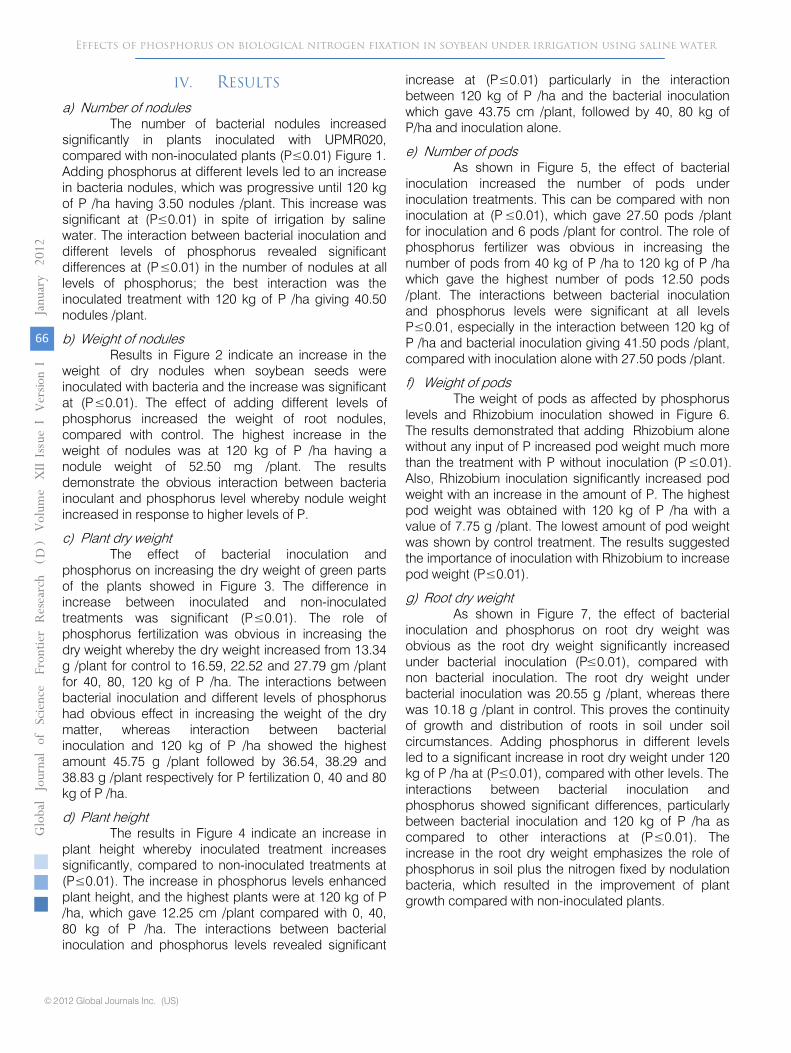
IV. RESULTS
a) Number of nodules The number of bacterial nodules increased
significantly in plants inoculated with UPMR020, compared with non-inoculated plants (P≤0.01) Figure 1. Adding phosphorus at different levels led to an increase in bacteria nodules, which was progressive until 120 kg of P /ha having 3.50 nodules /plant. This increase was significant at (P≤0.01) in spite of irrigation by saline water. The interaction between bacterial inoculation and different levels of phosphorus revealed significant differences at (P≤0.01) in the number of nodules at all levels of phosphorus; the best interaction was the inoculated treatment with 120 kg of P /ha giving 40.50 nodules /plant.
b) Weight of nodules Results in Figure 2 indicate an increase in the
weight of dry nodules when soybean seeds were inoculated with bacteria and the increase was significant at (P≤0.01). The effect of adding different levels of phosphorus increased the weight of root nodules, compared with control. The highest increase in the weight of nodules was at 120 kg of P /ha having a nodule weight of 52.50 mg /plant. The results demonstrate the obvious interaction between bacteria inoculant and phosphorus level whereby nodule weight increased in response to higher levels of P.
c) Plant dry weight The effect of bacterial inoculation and
phosphorus on increasing the dry weight of green parts of the plants showed in Figure 3. The difference in increase between inoculated and non-inoculated treatments was significant (P≤0.01). The role of phosphorus fertilization was obvious in increasing the dry weight whereby the dry weight increased from 13.34 g /plant for control to 16.59, 22.52 and 27.79 gm /plant for 40, 80, 120 kg of P /ha. The interactions between bacterial inoculation and different levels of phosphorus had obvious effect in increasing the weight of the dry matter, whereas interaction between bacterial inoculation and 120 kg of P /ha showed the highest amount 45.75 g /plant followed by 36.54, 38.29 and 38.83 g /plant respectively for P fertilization 0, 40 and 80 kg of P /ha.
d) Plant height The results in Figure 4 indicate an increase in
plant height whereby inoculated treatment increases significantly, compared to non-inoculated treatments at (P≤0.01). The increase in phosphorus levels enhanced plant height, and the highest plants were at 120 kg of P /ha, which gave 12.25 cm /plant compared with 0, 40, 80 kg of P /ha. The interactions between bacterial inoculation and phosphorus levels revealed significant
increase at (P≤0.01) particularly in the interaction between 120 kg of P /ha and the bacterial inoculation which gave 43.75 cm /plant, followed by 40, 80 kg of P/ha and inoculation alone.
e) Number of pods As shown in Figure 5, the effect of bacterial
inoculation increased the number of pods under inoculation treatments. This can be compared with non inoculation at (P ≤0.01), which gave 27.50 pods /plant for inoculation and 6 pods /plant for control. The role of phosphorus fertilizer was obvious in increasing the number of pods from 40 kg of P /ha to 120 kg of P /ha which gave the highest number of pods 12.50 pods /plant. The interactions between bacterial inoculation and phosphorus levels were significant at all levels P≤0.01, especially in the interaction between 120 kg of P /ha and bacterial inoculation giving 41.50 pods /plant, compared with inoculation alone with 27.50 pods /plant.
f) Weight of pods The weight of pods as affected by phosphorus
levels and Rhizobium inoculation showed in Figure 6. The results demonstrated that adding Rhizobium alone without any input of P increased pod weight much more than the treatment with P without inoculation (P ≤0.01). Also, Rhizobium inoculation significantly increased pod weight with an increase in the amount of P. The highest pod weight was obtained with 120 kg of P /ha with a value of 7.75 g /plant. The lowest amount of pod weight was shown by control treatment. The results suggested the importance of inoculation with Rhizobium to increase pod weight (P≤0.01).
g) Root dry weight As shown in Figure 7, the effect of bacterial
inoculation and phosphorus on root dry weight was obvious as the root dry weight significantly increased under bacterial inoculation (P≤0.01), compared with non bacterial inoculation. The root dry weight under bacterial inoculation was 20.55 g /plant, whereas there was 10.18 g /plant in control. This proves the continuity of growth and distribution of roots in soil under soil circumstances. Adding phosphorus in different levels led to a significant increase in root dry weight under 120 kg of P /ha at (P≤0.01), compared with other levels. The interactions between bacterial inoculation and phosphorus showed significant differences, particularly between bacterial inoculation and 120 kg of P /ha as compared to other interactions at (P≤0.01). The increase in the root dry weight emphasizes the role of phosphorus in soil plus the nitrogen fixed by nodulation bacteria, which resulted in the improvement of plant growth compared with non-inoculated plants.
Effects of phosphorus on biological nitrogen fixation in soybean under irrigation using saline water
Globa
lJo
urna
lof
Scienc
eFr
ontier
Resea
rch
V
olum
e
66
()
Janu
ary
2012
D
© 2012 Global Journals Inc. (US)
XII
Issu
e er
sion
IV
I

V. DISCUSSION
The response of soybean to bacterial inoculation was obvious through increasing all parameters. Biological fertilization by nodules bacteria improved the growth and yield of soybean. Increasing phosphorus levels improved plant growth and fixed atmospheric nitrogen by specialized bacteria, which benefitted soybean and increased the studied parameters.
The decrease in plant parameters under low phosphorus treatments with or without bacterial inoculation may be due to the negative effect of low phosphorus on the nodule capacity to fix nitrogen as a result of small nodules. On the other hand, the effect of low phosphorus on nodules formation and functions may be due to low exchange between shoot and nodules, which is the proper way to decrease leaf photosynthesis with the decline in the available phosphorus (Tsvetkova and Georgiev, 2003). In this experiment, the balancing in nutrient elements especially phosphorus contributed to the growth and survival of bacteria.It reduced salt stress in spite of irrigated plants by water with Ec= 3.5 dS/ m.
Un-inoculated plants produced fewer nodules and had lower dry matter than inoculated plants, which confirms the result obtained by Hafeez et al. (1988). Accordingly, Hafeez found that bacterial inoculation and using saline water with suitable concentration had obvious effect on both bacteria and plant and suggested that salinity had an indirect effect on biological nitrogen fixation. The bacteria are generally more capable to survive with salinity than their host plants.
Since soybean is considered moderately sensitive to salinity, irrigation by saline water with a concentration of 3.5 dS /m did not much affect plant parameters. According to Keating and Fisher (1985), soybean has a higher tolerance to salinity (3.5 to 5.4 dS /m) than green gram, black gram and pigeon pea, all cultivated in the same soil salinity.
In line with Wilson (1985), inoculation with suitable Rhizobium strain showed good tolerance of high salinity. Accordingly, Wilson found that Siratro plants depend on symbiotic nitrogen fixation. They show a better tolerance of salinity compared with Cooper (glycine), which appear to be less resistant than Siratro cells to injury at high tissue salts concentrations.
Adding saline water with 3.5 dS /m did not have inhibitory effect on plant nodulation, which is in accordance with Douka et al. (1984). In their experiment it was found that additional NaCl to soil- agar slopes displayed higher or equal nodulation compared with plants grown without any addition of NaCl.
Adding phosphorus to legumes increases plant parameters, paralleled with an increase in phosphorus
levels. Deficiencies in phosphorus are most likely to be manifested in decreasing the growth of the legumes, which in turn reduces total nitrogen fixation and effect the nodule formation. These results confirmed the results mentioned in FAO (1984) on soybean; it showed that application of phosphorus alone increased the number of nodules per plant and per unit volume of soil.
Fertilization with phosphorus and bacterial inoculation increased the number of nodules and other plant parameters. Hoque and Haq (1994) also reached the same results when they treated several legumes with Rhizobium and phosphorus and they found an increase in the number of nodules and maximum growth features with inoculation and phosphorus. In line with the result of a study on lentil by Abdallah (1986), using 120kg of P/ ha with bacterial inoculation increased the number of nodules, number of pods and plant dry weight.
VI. CONCLUSION
Using bacterial inoculation was very effective on all plant parameters where adding UPMR020 showed significant increase in the plant growth, compared with the control. This experiment indicated that UPMR020 with 120 kg of P /ha was the best and most effectinve combination for soybean plants under irrigation by saline water (3.5 dS /m).
1. Abdallah, M.M. (1986). Effect of phosphatic fertilizers and trace elements application on growth, yield and quality of lenti Assiut. Journal of Agricultural Science. 17(1): 121- 132.
2. Bhardwaj, K.K. (1974). Growth and symbiotic effective-ness of indigenous Rhizobium species in a saline- alkaline soil. Procedure of Indian Academy of Science. 40: 540- 543.
3. Dixon, R.O.D and Wheeler, C.T. (1986). Nitrogen fixation. New York: Chapman and Hall Publishing
4. Douka, C.E., Xenoulis, A.C. and Paradellis, T. (1984). Salinity tolerance of a
5. Rhizobium meliloti strain isolated from salt affected soils. Folia Microbiol. 29:316- 324.
6. Hafeez, F., Aslam, Z. and Malik, K. (1988). Effect of salinity and inoculation on growth, nitrogen fixation and nutrient uptake of Vigna radiate L. Plant and Soil. 106: 3-8.
7. Idris, M., Ashraf, M. and Malik, K.A. (1986). Response of mungbean (Vigna Radiata L.) to Rhizobium inoculation for effective nodulation and nitrogen fixation under field conditions. Pakistan journal of Soil Science. 41- 46.
8. Fao. (1984). Legume inoculants and their use. A pocket manual jointly prepared by NIFTAL project, USA
Effects of phosphorus on biological nitrogen fixation in soybean under irrigation using saline water
Globa
lJo
urna
lof
Scienc
eFr
ontier
Resea
rch
V
olum
e
67
()
Janu
ary
2012
D
© 2012 Global Journals Inc. (US)
References Références Referencias
XII
Issu
e er
sion
IV
I

9. Hoque, M. and Haq, M.F. (1994). Rhizobial inoculation and fertilization of lentil in Bangladesh. Lens Newsletter. 21(2): 29- 30.
10. Keating, B.A. and Fisher, M.J. (1985). Comparative tolerance of tropical grain legumes to salinity. Australian journal of Agricultural Researches. 36: 373-383.
11. Tsvetkova, G.E. and Georgiev, G.I. (2003). Effect of phosphorus nutrition on the nodulation, nitrogen fixation and nutrient use efficiency of Bradyrhizobuim japonicum soybean (Glycine max L. merr) symbiosis. Bulgarian Journal of Plant Physiology. 331- 335.
12. Wilson, J.R. (1985). Comparative response to salinity of the growth and nodulation of Macroptilium atropurpureum cv. Siratro and Neonotonia wightii cv. Cooper seedlings. Australian journal of agricultural Researches. 36: 589-599.
13. Wilson J.R. (1970). Response to salinity in Glycine. VI, some effects of a range of short term salt stresses on growth, nodulation and nitrogen fixation of Glycine. Australian journal of agricultural Researches. 21: 571- 582.
Figure 1 : Effect of phosphorus and bacterial inoculation on number of nodules under irrigation by saline water. The letters above the bars represents significant differences at 0.01 level of significance.
Effects of phosphorus on biological nitrogen fixation in soybean under irrigation using saline water
Globa
lJo
urna
lof
Scienc
eFr
ontier
Resea
rch
V
olum
e
68
()
Janu
ary
2012
D
© 2012 Global Journals Inc. (US)
XII
Issu
e er
sion
IV
I
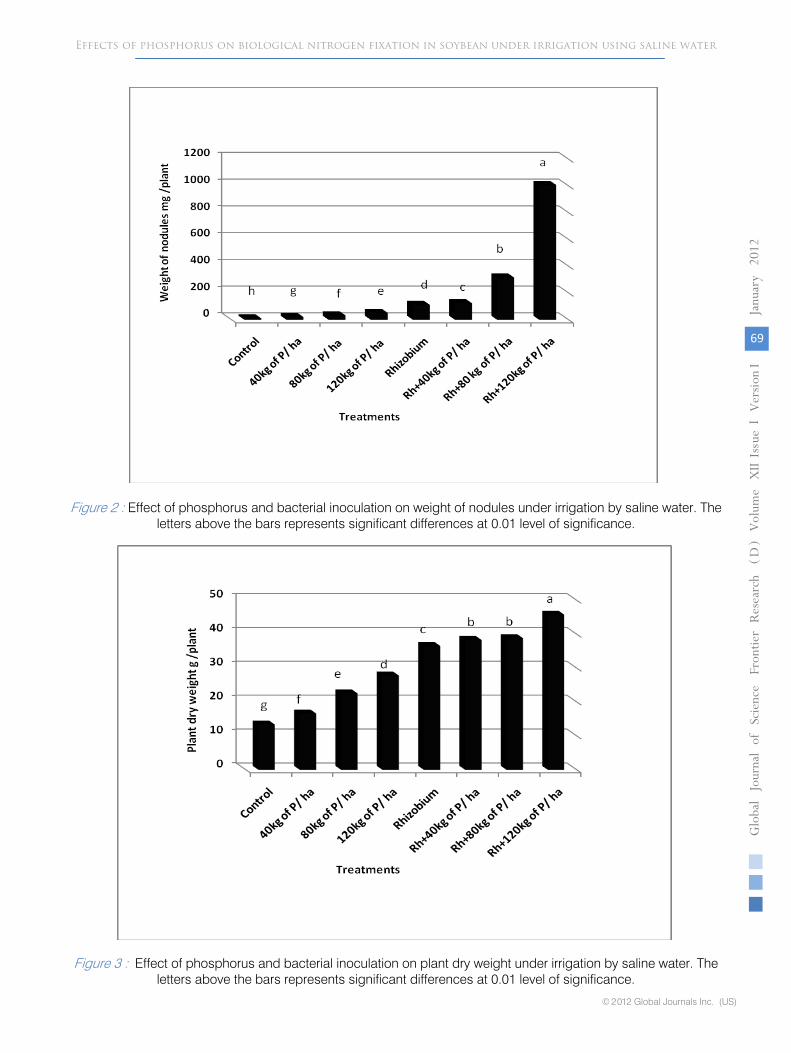
Figure 2
:
Effect of phosphorus and bacterial inoculation on weight of nodules under irrigation by saline water. The letters above the bars represents significant differences at
0.01 level of significance.
Figure 3
:
Effect of phosphorus and bacterial inoculation on plant dry weight under irrigation by saline water. The letters above the bars represents significant differences at 0.01 level of significance.
Effects of phosphorus on biological nitrogen fixation in soybean under irrigation using saline water
Globa
lJo
urna
lof
Scienc
eFr
ontier
Resea
rch
V
olum
e
69
()
Janu
ary
2012
D
© 2012 Global Journals Inc. (US)
XII
Issu
e er
sion
IV
I
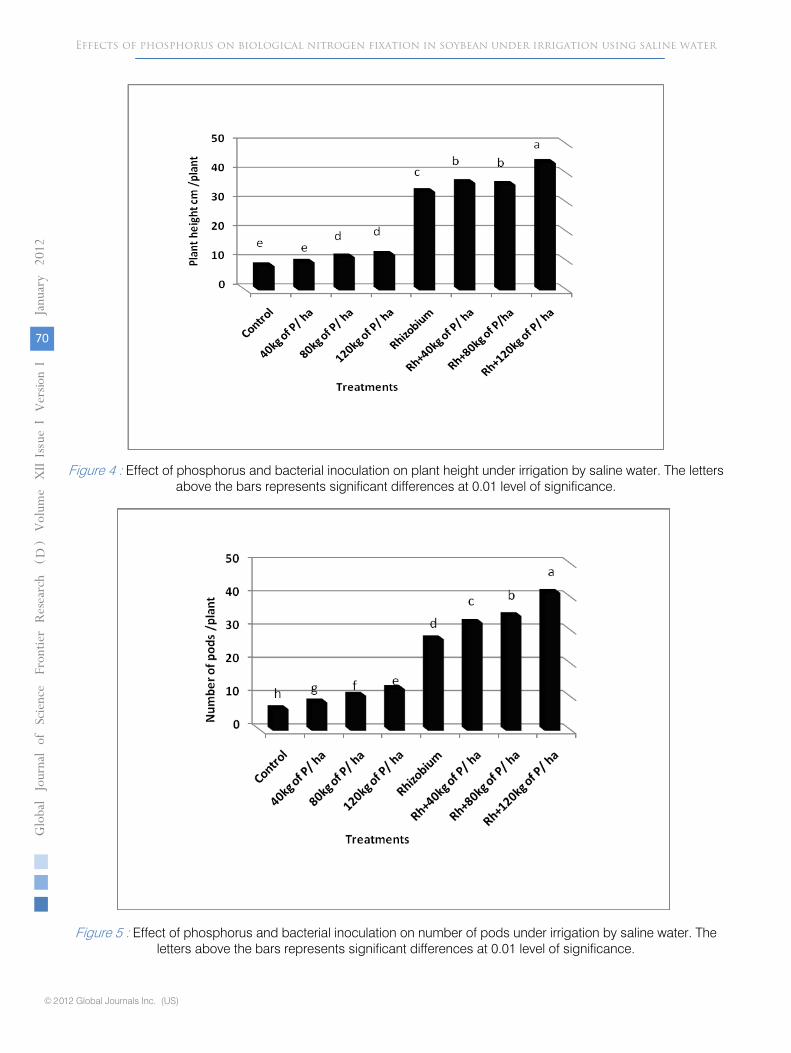
Figure 4 : Effect of phosphorus and bacterial inoculation on plant height under irrigation by saline water. The letters above the bars represents significant differences at 0.01 level of significance.
Figure 5 : Effect of phosphorus and bacterial inoculation on number of pods under irrigation by saline water. The letters above the bars represents significant differences at 0.01 level of significance.
Effects of phosphorus on biological nitrogen fixation in soybean under irrigation using saline water
Globa
lJo
urna
lof
Scienc
eFr
ontier
Resea
rch
V
olum
e
70
()
Janu
ary
2012
D
© 2012 Global Journals Inc. (US)
XII
Issu
e er
sion
IV
I
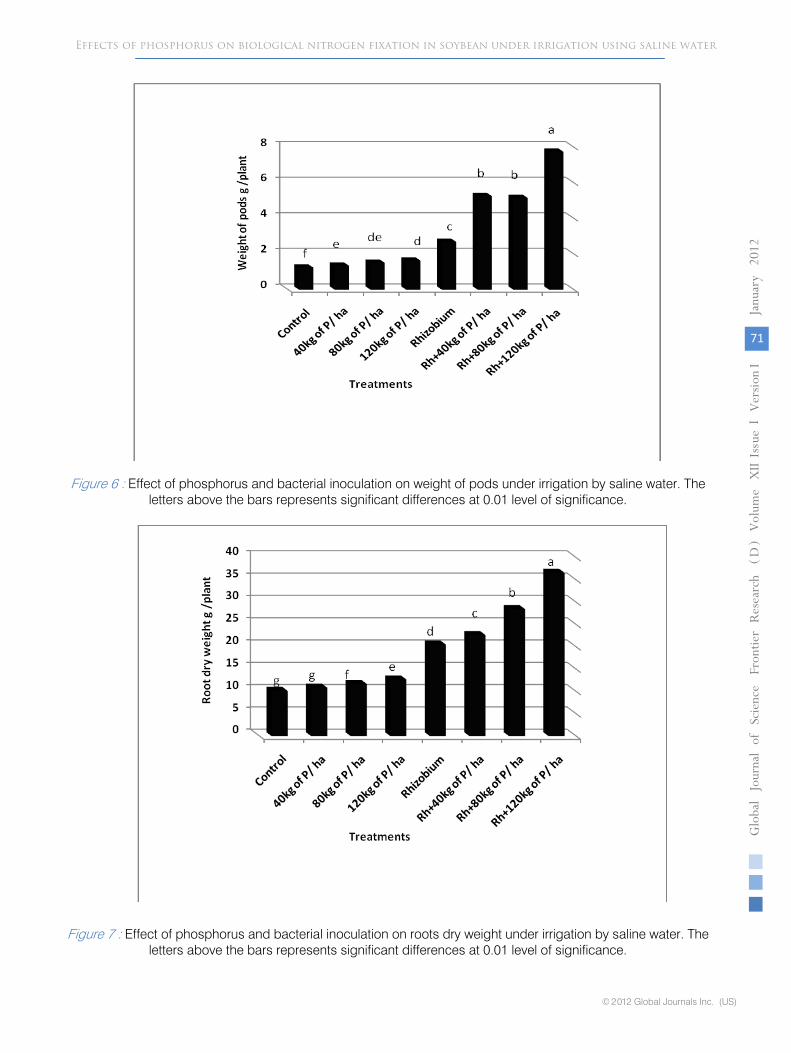
Figure 6
:
Effect of phosphorus
and bacterial inoculation on weight of pods under irrigation by saline water. The letters above the bars represents significant differences at 0.01 level of significance.
Figure 7
:
Effect of phosphorus and bacterial inoculation on roots dry weight under irrigation by saline water. The letters above the bars represents significant differences at 0.01 level of significance.
Effects of phosphorus on biological nitrogen fixation in soybean under irrigation using saline water
Globa
lJo
urna
lof
Scienc
eFr
ontier
Resea
rch
V
olum
e
71
()
Janu
ary
2012
D
© 2012 Global Journals Inc. (US)
XII
Issu
e er
sion
IV
I
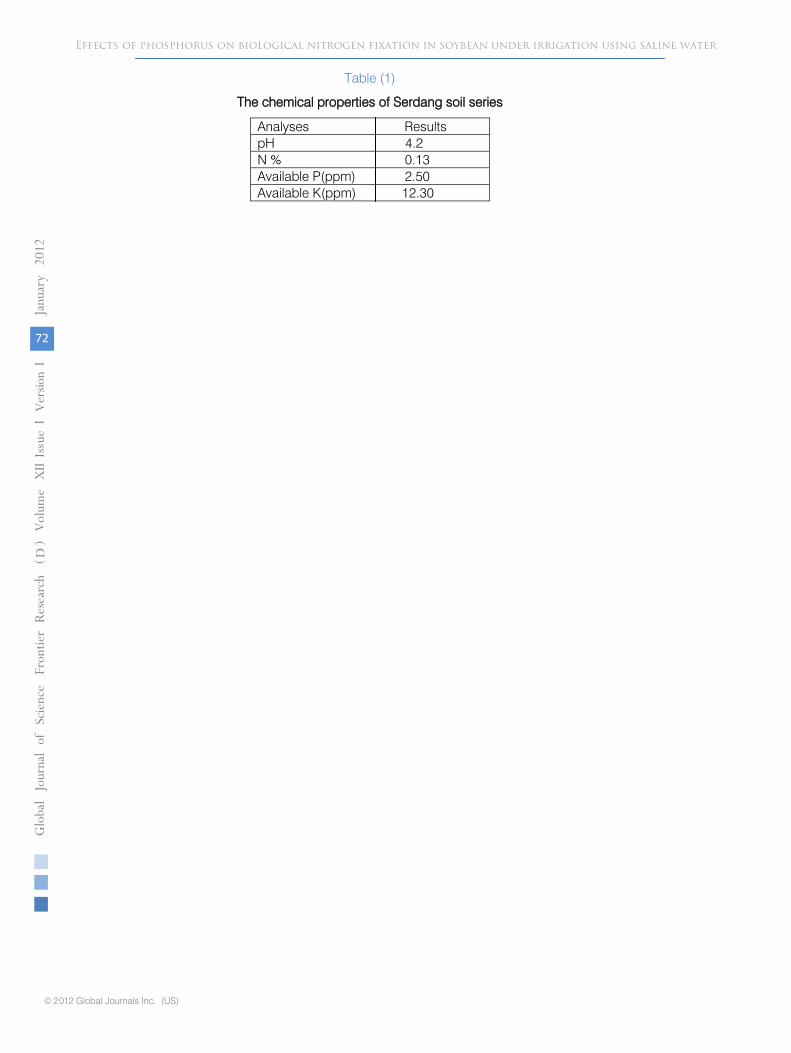
Table (1) The chemical properties of Serdang soil series
Analyses Results pH 4.2
N % 0.13 Available P(ppm) 2.50 Available K(ppm) 12.30
Effects of phosphorus on biological nitrogen fixation in soybean under irrigation using saline water
Globa
lJo
urna
lof
Scienc
eFr
ontier
Resea
rch
V
olum
e
72
()
Janu
ary
2012
D
© 2012 Global Journals Inc. (US)
XII
Issu
e er
sion
IV
I

Global Journals Inc. (US)
Guidelines Handbook
2011
www.GlobalJournals.org
FELLOW OF ASSOCIATION OF RESEARCH SOCIETY IN SCIENCE (FARSS)
Fellows
© Copyright by Global Journals Inc.(US) | Guidelines Handbook
I
'FARSS' title will be awarded to the person after approval of Editor-in-Chief and Editorial Board. The title 'FARSS" can be added to name in the following manner. eg. Dr. John E. Hall, Ph.D., FARSS or William Walldroff Ph. D., M.S., FARSS
Being FARSS is a respectful honor. It authenticates your research activities. After becoming FARSS, you can use 'FARSS' title as you use your degree in suffix of your name. This willdefinitely will enhance and add up your name. You can use it on your Career Counseling Materials/CV/Resume/Visiting Card/Name Plate etc.
60% Discount will be provided to FARSS members for publishing research papers in Global Journals Inc., if our Editorial Board and Peer Reviewers accept the paper. For the life time, if you are author/co-author of any paper bill sent to you will automatically be discounted one by 60%
FARSS will be given a renowned, secure, free professional email address with 100 GB of space
[email protected]. You will be facilitated with Webmail, SpamAssassin, Email Forwarders, Auto-Responders, Email Delivery Route tracing, etc.
FARSS member is eligible to become paid peer reviewer at Global Journals Inc. to earn up to 15% of realized author charges taken from author of respective paper. After reviewing 5 or more papers you can request to transfer the amount to your bank account or to your PayPal account.
Eg. If we had taken 420 USD from author, we can send 63 USD to your account. FARSS member can apply for free approval, grading and certification of some of their
Educational and Institutional Degrees from Global Journals Inc. (US) and Open Association of Research,Society U.S.A.
After you are FARSS. You can send us scanned copy of all of your documents. We will verify, grade and certify them within a month. It will be based on your academic records, quality of research papers published by you, and 50 more criteria. This is beneficial for your job interviews as recruiting organization need not just rely on you for authenticity and your unknown qualities, you would have authentic ranks of all of your documents. Our scale is unique worldwide.
FARSS member can proceed to get benefits of free research podcasting in Global Research Radio with their research documents, slides and online movies.
After your publication anywhere in the world, you can upload you research paper with your recorded voice or you can use our professional RJs to record your paper their voice. We can also stream your conference videos and display your slides online.
FARSS will be eligible for free application of Standardization of their Researches by Open Scientific Standards. Standardization is next step and level after publishing in a journal. A team of research and professional will work with you to take your research to its next level, which is worldwide open standardization.
MEMBER OF
ASSOCIATION OF RESEARCH SOCIETY IN SCIENCE (MARSS)
II
© Copyright by Global Journals Inc.(US)| Guidelines Handbook
II
© Copyright by Global Journals Inc.(US)| Guidelines Handbook
manner. When readers will buy that individual research paper for reading, 80% of its earning by Global Journals Inc. (US) will be transferred to FARSS member's bank account after certain threshold balance. There is no time limit for collection. FARSS member can decide its price and we can help in decision.
FARSS is eligible to earn from their researches: While publishing his paper with Global Journals Inc. (US), FARSS can decide whether he/she would like to publish his/her research in closed
'MARSS' title will be awarded to the person after approval of Editor-in-Chief and Editorial Board. The title 'MARSS" can be added to name in the following manner. eg. Dr. John E. Hall, Ph.D., MARSS or William Walldroff Ph. D., M.S., MARSS
Being MARSS is a respectful honor. It authenticates your research activities. After becoming MARSS, you can use 'MARSS' title as you use your degree in suffix of your name. This will definitely will enhance and add up your name. You can use it on your Career Counseling Materials/CV/Resume/Visiting Card/Name Plate etc.
40% Discount will be provided to MARSS members for publishing research papers in Global Journals Inc., if our Editorial Board and Peer Reviewers accept the paper. For the life time, if you are author/co-author of any paper bill sent to you will automatically be discounted one by 60%
MARSS will be given a renowned, secure, free professional email address with 30 GB of space [email protected]. You will be facilitated with Webmail, SpamAssassin, Email Forwarders, Auto-Responders, Email Delivery Route tracing, etc.
MARSS member is eligible to become paid peer reviewer at Global Journals Inc. to earn up to 10% of realized author charges taken from author of respective paper. After reviewing 5 or more papers you can request to transfer the amount to your bank account or to your PayPal account.
MARSS member can apply for free approval, grading and certification of some of their Educational and Institutional Degrees from Global Journals Inc. (US) and Open Association of Research,Society U.S.A.
MARSS is eligible to earn from their researches: While publishing his paper with Global Journals Inc. (US), MARSS can decide whether he/she would like to publish his/her research in closed manner. When readers will buy that individual research paper for reading, 40% of its earning by Global Journals Inc. (US) will be transferred to MARSS member's bank account after certain threshold balance. There is no time limit for collection. MARSS member can decide its price and we can help in decision.
Auxiliary Memberships
ANNUAL MEMBER
•
Annual Member will be authorized to receive e-Journal GJSFR
for one
year (subscription for one year).
•
The member will be allotted free 1 GB Web-space
along with subDomain to
contribute and participate in our activities. •
A professional email address
will be allotted free 500 MB email space.
PAPER PUBLICATION
• The members can publish paper once. The paper will be sent to two-peer reviewer. The paper will be published after the acceptance of peer reviewers and Editorial Board.
© Copyright by Global Journals Inc.(US) | Guidelines Handbook
III

Process of submission of Research Paper
The Area or field of specialization may or may not be of any category as mentioned in ‘Scope of Journal’ menu of the GlobalJournals.org website. There are 37 Research Journal categorized with Six parental Journals GJCST, GJMR, GJRE, GJMBR, GJSFR, GJHSS. For Authors should prefer the mentioned categories. There are three widely used systems UDC, DDC and LCC. The details are available as ‘Knowledge Abstract’ at Home page. The major advantage of this coding is that, the research work will be exposed to and shared with all over the world as we are being abstracted and indexed worldwide.
The paper should be in proper format. The format can be downloaded from first page of ‘Author Guideline’ Menu. The Author is expected to follow the general rules as mentioned in this menu. The paper should be written in MS-Word Format (*.DOC,*.DOCX).
The Author can submit the paper either online or offline. The authors should prefer online submission.Online Submission: There are three ways to submit your paper:
(A) (I) First, register yourself using top right corner of Home page then Login. If you are already registered, then login using your username and password.
(II) Choose corresponding Journal.
(III) Click ‘Submit Manuscript’. Fill required information and Upload the paper.
(B) If you are using Internet Explorer, then Direct Submission through Homepage is also available.
(C) If these two are not conveninet , and then email the paper directly to [email protected].
Offline Submission: Author can send the typed form of paper by Post. However, online submission should be preferred.
IV
© Copyright by Global Journals Inc.(US)| Guidelines Handbook
Preferred Author Guidelines
MANUSCRIPT STYLE INSTRUCTION (Must be strictly followed)
Page Size: 8.27" X 11'"
• Left Margin: 0.65 • Right Margin: 0.65 • Top Margin: 0.75 • Bottom Margin: 0.75 • Font type of all text should be Swis 721 Lt BT. • Paper Title should be of Font Size 24 with one Column section. • Author Name in Font Size of 11 with one column as of Title. • Abstract Font size of 9 Bold, “Abstract” word in Italic Bold. • Main Text: Font size 10 with justified two columns section • Two Column with Equal Column with of 3.38 and Gaping of .2 • First Character must be three lines Drop capped. • Paragraph before Spacing of 1 pt and After of 0 pt. • Line Spacing of 1 pt • Large Images must be in One Column • Numbering of First Main Headings (Heading 1) must be in Roman Letters, Capital Letter, and Font Size of 10. • Numbering of Second Main Headings (Heading 2) must be in Alphabets, Italic, and Font Size of 10.
You can use your own standard format also. Author Guidelines:
1. General,
2. Ethical Guidelines,
3. Submission of Manuscripts,
4. Manuscript’s Category,
5. Structure and Format of Manuscript,
6. After Acceptance.
1. GENERAL
Before submitting your research paper, one is advised to go through the details as mentioned in following heads. It will be beneficial, while peer reviewer justify your paper for publication.
Scope
The Global Journals Inc. (US) welcome the submission of original paper, review paper, survey article relevant to the all the streams of Philosophy and knowledge. The Global Journals Inc. (US) is parental platform for Global Journal of Computer Science and Technology, Researches in Engineering, Medical Research, Science Frontier Research, Human Social Science, Management, and Business organization. The choice of specific field can be done otherwise as following in Abstracting and Indexing Page on this Website. As the all Global
© Copyright by Global Journals Inc.(US) | Guidelines Handbook
V
Journals Inc. (US) are being abstracted and indexed (in process) by most of the reputed organizations. Topics of only narrow interest will not be accepted unless they have wider potential or consequences.
2. ETHICAL GUIDELINES
Authors should follow the ethical guidelines as mentioned below for publication of research paper and research activities.
Papers are accepted on strict understanding that the material in whole or in part has not been, nor is being, considered for publication elsewhere. If the paper once accepted by Global Journals Inc. (US) and Editorial Board, will become the copyright of the Global Journals Inc. (US).
Authorship: The authors and coauthors should have active contribution to conception design, analysis and interpretation of findings. They should critically review the contents and drafting of the paper. All should approve the final version of the paper before submission
The Global Journals Inc. (US) follows the definition of authorship set up by the Global Academy of Research and Development. According to the Global Academy of R&D authorship, criteria must be based on:
1) Substantial contributions to conception and acquisition of data, analysis and interpretation of the findings.
2) Drafting the paper and revising it critically regarding important academic content.
3) Final approval of the version of the paper to be published.
All authors should have been credited according to their appropriate contribution in research activity and preparing paper. Contributors who do not match the criteria as authors may be mentioned under Acknowledgement.
Acknowledgements: Contributors to the research other than authors credited should be mentioned under acknowledgement. The specifications of the source of funding for the research if appropriate can be included. Suppliers of resources may be mentioned along with address.
Appeal of Decision: The Editorial Board’s decision on publication of the paper is final and cannot be appealed elsewhere.
Permissions: It is the author's responsibility to have prior permission if all or parts of earlier published illustrations are used in this paper.
Please mention proper reference and appropriate acknowledgements wherever expected.
If all or parts of previously published illustrations are used, permission must be taken from the copyright holder concerned. It is the author's responsibility to take these in writing.
Approval for reproduction/modification of any information (including figures and tables) published elsewhere must be obtained by the authors/copyright holders before submission of the manuscript. Contributors (Authors) are responsible for any copyright fee involved.
3. SUBMISSION OF MANUSCRIPTS
Manuscripts should be uploaded via this online submission page. The online submission is most efficient method for submission of papers, as it enables rapid distribution of manuscripts and consequently speeds up the review procedure. It also enables authors to know the status of their own manuscripts by emailing us. Complete instructions for submitting a paper is available below.
Manuscript submission is a systematic procedure and little preparation is required beyond having all parts of your manuscript in a given format and a computer with an Internet connection and a Web browser. Full help and instructions are provided on-screen. As an author, you will be prompted for login and manuscript details as Field of Paper and then to upload your manuscript file(s) according to the instructions.
VI
© Copyright by Global Journals Inc.(US)| Guidelines Handbook
To avoid postal delays, all transaction is preferred by e-mail. A finished manuscript submission is confirmed by e-mail immediately and your paper enters the editorial process with no postal delays. When a conclusion is made about the publication of your paper by our Editorial Board, revisions can be submitted online with the same procedure, with an occasion to view and respond to all comments.
Complete support for both authors and co-author is provided.
4. MANUSCRIPT’S CATEGORY
Based on potential and nature, the manuscript can be categorized under the following heads:
Original research paper: Such papers are reports of high-level significant original research work.
Review papers: These are concise, significant but helpful and decisive topics for young researchers.
Research articles: These are handled with small investigation and applications
Research letters: The letters are small and concise comments on previously published matters.
5.STRUCTURE AND FORMAT OF MANUSCRIPT
The recommended size of original research paper is less than seven thousand words, review papers fewer than seven thousands words also.Preparation of research paper or how to write research paper, are major hurdle, while writing manuscript. The research articles and research letters should be fewer than three thousand words, the structure original research paper; sometime review paper should be as follows:
Papers: These are reports of significant research (typically less than 7000 words equivalent, including tables, figures, references), and comprise:
(a)Title should be relevant and commensurate with the theme of the paper.
(b) A brief Summary, “Abstract” (less than 150 words) containing the major results and conclusions.
(c) Up to ten keywords, that precisely identifies the paper's subject, purpose, and focus.
(d) An Introduction, giving necessary background excluding subheadings; objectives must be clearly declared.
(e) Resources and techniques with sufficient complete experimental details (wherever possible by reference) to permit repetition; sources of information must be given and numerical methods must be specified by reference, unless non-standard.
(f) Results should be presented concisely, by well-designed tables and/or figures; the same data may not be used in both; suitable statistical data should be given. All data must be obtained with attention to numerical detail in the planning stage. As reproduced design has been recognized to be important to experiments for a considerable time, the Editor has decided that any paper that appears not to have adequate numerical treatments of the data will be returned un-refereed;
(g) Discussion should cover the implications and consequences, not just recapitulating the results; conclusions should be summarizing.
(h) Brief Acknowledgements.
(i) References in the proper form.
Authors should very cautiously consider the preparation of papers to ensure that they communicate efficiently. Papers are much more likely to be accepted, if they are cautiously designed and laid out, contain few or no errors, are summarizing, and be conventional to the approach and instructions. They will in addition, be published with much less delays than those that require much technical and editorial correction.
© Copyright by Global Journals Inc.(US) | Guidelines Handbook
VII

The Editorial Board reserves the right to make literary corrections and to make suggestions to improve briefness.
It is vital, that authors take care in submitting a manuscript that is written in simple language and adheres to published guidelines.
Format
Language: The language of publication is UK English. Authors, for whom English is a second language, must have their manuscript efficiently edited by an English-speaking person before submission to make sure that, the English is of high excellence. It is preferable, that manuscripts should be professionally edited.
Standard Usage, Abbreviations, and Units: Spelling and hyphenation should be conventional to The Concise Oxford English Dictionary. Statistics and measurements should at all times be given in figures, e.g. 16 min, except for when the number begins a sentence. When the number does not refer to a unit of measurement it should be spelt in full unless, it is 160 or greater.
Abbreviations supposed to be used carefully. The abbreviated name or expression is supposed to be cited in full at first usage, followed by the conventional abbreviation in parentheses.
Metric SI units are supposed to generally be used excluding where they conflict with current practice or are confusing. For illustration, 1.4 l rather than 1.4 × 10⁻³ m3, or 4 mm somewhat than 4 × 10⁻³ m. Chemical formula and solutions must identify the form used, e.g. anhydrous or hydrated, and the concentration must be in clearly defined units. Common species names should be followed by underlines at the first mention. For following use the generic name should be constricted to a single letter, if it is clear.
Structure
All manuscripts submitted to Global Journals Inc. (US), ought to include:
Title: The title page must carry an instructive title that reflects the content, a running title (less than 45 characters together with spaces), names of the authors and co-authors, and the place(s) wherever the work was carried out. The full postal address in addition with the e-mail address of related author must be given. Up to eleven keywords or very brief phrases have to be given to help data retrieval, mining and indexing.
Abstract, used in Original Papers and Reviews:
Optimizing Abstract for Search Engines
Many researchers searching for information online will use search engines such as Google, Yahoo or similar. By optimizing your paper for search engines, you will amplify the chance of someone finding it. This in turn will make it more likely to be viewed and/or cited in a further work. Global Journals Inc. (US) have compiled these guidelines to facilitate you to maximize the web-friendliness of the most public part of your paper.
Key Words
A major linchpin in research work for the writing research paper is the keyword search, which one will employ to find both library and Internet resources.
One must be persistent and creative in using keywords. An effective keyword search requires a strategy and planning a list of possible keywords and phrases to try.
Search engines for most searches, use Boolean searching, which is somewhat different from Internet searches. The Boolean search uses "operators," words (and, or, not, and near) that enable you to expand or narrow your affords. Tips for research paper while preparing research paper are very helpful guideline of research paper.
Choice of key words is first tool of tips to write research paper. Research paper writing is an art.A few tips for deciding as strategically as possible about keyword search:
VIII
© Copyright by Global Journals Inc.(US)| Guidelines Handbook
• One should start brainstorming lists of possible keywords before even begin searching. Think about the most important concepts related to research work. Ask, "What words would a source have to include to be truly valuable in research paper?" Then consider synonyms for the important words.
• It may take the discovery of only one relevant paper to let steer in the right keyword direction because in most databases, the keywords under which a research paper is abstracted are listed with the paper.
• One should avoid outdated words.
Keywords are the key that opens a door to research work sources. Keyword searching is an art in which researcher's skills are bound to improve with experience and time.
Numerical Methods: Numerical methods used should be clear and, where appropriate, supported by references.
Acknowledgements: Please make these as concise as possible.
References
References follow the Harvard scheme of referencing. References in the text should cite the authors' names followed by the time of their publication, unless there are three or more authors when simply the first author's name is quoted followed by et al. unpublished work has to only be cited where necessary, and only in the text. Copies of references in press in other journals have to be supplied with submitted typescripts. It is necessary that all citations and references be carefully checked before submission, as mistakes or omissions will cause delays.
References to information on the World Wide Web can be given, but only if the information is available without charge to readers on an official site. Wikipedia and Similar websites are not allowed where anyone can change the information. Authors will be asked to make available electronic copies of the cited information for inclusion on the Global Journals Inc. (US) homepage at the judgment of the Editorial Board.
The Editorial Board and Global Journals Inc. (US) recommend that, citation of online-published papers and other material should be done via a DOI (digital object identifier). If an author cites anything, which does not have a DOI, they run the risk of the cited material not being noticeable.
The Editorial Board and Global Journals Inc. (US) recommend the use of a tool such as Reference Manager for reference management and formatting.
Tables, Figures and Figure Legends
Tables: Tables should be few in number, cautiously designed, uncrowned, and include only essential data. Each must have an Arabic number, e.g. Table 4, a self-explanatory caption and be on a separate sheet. Vertical lines should not be used.
Figures: Figures are supposed to be submitted as separate files. Always take in a citation in the text for each figure using Arabic numbers, e.g. Fig. 4. Artwork must be submitted online in electronic form by e-mailing them.
Preparation of Electronic Figures for Publication
Even though low quality images are sufficient for review purposes, print publication requires high quality images to prevent the final product being blurred or fuzzy. Submit (or e-mail) EPS (line art) or TIFF (halftone/photographs) files only. MS PowerPoint and Word Graphics are unsuitable for printed pictures. Do not use pixel-oriented software. Scans (TIFF only) should have a resolution of at least 350 dpi (halftone) or 700 to 1100 dpi (line drawings) in relation to the imitation size. Please give the data for figures in black and white or submit a Color Work Agreement Form. EPS files must be saved with fonts embedded (and with a TIFF preview, if possible).
For scanned images, the scanning resolution (at final image size) ought to be as follows to ensure good reproduction: line art: >650 dpi; halftones (including gel photographs) : >350 dpi; figures containing both halftone and line images: >650 dpi.
© Copyright by Global Journals Inc.(US) | Guidelines Handbook
IX
Color Charges: It is the rule of the Global Journals Inc. (US) for authors to pay the full cost for the reproduction of their color artwork. Hence, please note that, if there is color artwork in your manuscript when it is accepted for publication, we would require you to complete and return a color work agreement form before your paper can be published.
Figure Legends: Self-explanatory legends of all figures should be incorporated separately under the heading 'Legends to Figures'. In the full-text online edition of the journal, figure legends may possibly be truncated in abbreviated links to the full screen version. Therefore, the first 100 characters of any legend should notify the reader, about the key aspects of the figure.
6. AFTER ACCEPTANCE
Upon approval of a paper for publication, the manuscript will be forwarded to the dean, who is responsible for the publication of the Global Journals Inc. (US).
6.1 Proof Corrections
The corresponding author will receive an e-mail alert containing a link to a website or will be attached. A working e-mail address must therefore be provided for the related author.
Acrobat Reader will be required in order to read this file. This software can be downloaded
(Free of charge) from the following website:
www.adobe.com/products/acrobat/readstep2.html. This will facilitate the file to be opened, read on screen, and printed out in order for any corrections to be added. Further instructions will be sent with the proof.
Proofs must be returned to the dean at [email protected] within three days of receipt.
As changes to proofs are costly, we inquire that you only correct typesetting errors. All illustrations are retained by the publisher. Please note that the authors are responsible for all statements made in their work, including changes made by the copy editor.
6.2 Early View of Global Journals Inc. (US) (Publication Prior to Print)
The Global Journals Inc. (US) are enclosed by our publishing's Early View service. Early View articles are complete full-text articles sent in advance of their publication. Early View articles are absolute and final. They have been completely reviewed, revised and edited for publication, and the authors' final corrections have been incorporated. Because they are in final form, no changes can be made after sending them. The nature of Early View articles means that they do not yet have volume, issue or page numbers, so Early View articles cannot be cited in the conventional way.
6.3 Author Services
Online production tracking is available for your article through Author Services. Author Services enables authors to track their article - once it has been accepted - through the production process to publication online and in print. Authors can check the status of their articles online and choose to receive automated e-mails at key stages of production. The authors will receive an e-mail with a unique link that enables them to register and have their article automatically added to the system. Please ensure that a complete e-mail address is provided when submitting the manuscript.
6.4 Author Material Archive Policy
Please note that if not specifically requested, publisher will dispose off hardcopy & electronic information submitted, after the two months of publication. If you require the return of any information submitted, please inform the Editorial Board or dean as soon as possible.
6.5 Offprint and Extra Copies
A PDF offprint of the online-published article will be provided free of charge to the related author, and may be distributed according to the Publisher's terms and conditions. Additional paper offprint may be ordered by emailing us at: [email protected] .
X
© Copyright by Global Journals Inc.(US)| Guidelines Handbook
the search? Will I be able to find all information in this field area? If the answer of these types of questions will be "Yes" then you can
choose that topic. In most of the cases, you may have to conduct the surveys and have to visit several places because this field is related
to Computer Science and Information Technology. Also, you may have to do a lot of work to find all rise and falls regarding the various
data of that subject. Sometimes, detailed information plays a vital role, instead of short information.
2. Evaluators are human: First thing to remember that evaluators are also human being. They are not only meant for rejecting a paper.
They are here to evaluate your paper. So, present your Best.
3. Think Like Evaluators: If you are in a confusion or getting demotivated that your paper will be accepted by evaluators or not, then
think and try to evaluate your paper like an Evaluator. Try to understand that what an evaluator wants in your research paper and
automatically you will have your answer.
4. Make blueprints of paper: The outline is the plan or framework that will help you to arrange your thoughts. It will make your paper
logical. But remember that all points of your outline must be related to the topic you have chosen.
5. Ask your Guides: If you are having any difficulty in your research, then do not hesitate to share your difficulty to your guide (if you
have any). They will surely help you out and resolve your doubts. If you can't clarify what exactly you require for your work then ask the
supervisor to help you with the alternative. He might also provide you the list of essential readings.
6. Use of computer is recommended: As you are doing research in the field of Computer Science, then this point is quite obvious.
7. Use right software: Always use good quality software packages. If you are not capable to judge good software then you can lose
quality of your paper unknowingly. There are various software programs available to help you, which you can get through Internet.
8. Use the Internet for help: An excellent start for your paper can be by using the Google. It is an excellent search engine, where you can
have your doubts resolved. You may also read some answers for the frequent question how to write my research paper or find model
research paper. From the internet library you can download books. If you have all required books make important reading selecting and
analyzing the specified information. Then put together research paper sketch out.
9. Use and get big pictures: Always use encyclopedias, Wikipedia to get pictures so that you can go into the depth.
10. Bookmarks are useful: When you read any book or magazine, you generally use bookmarks, right! It is a good habit, which helps to
not to lose your continuity. You should always use bookmarks while searching on Internet also, which will make your search easier.
11. Revise what you wrote: When you write anything, always read it, summarize it and then finalize it.
12. Make all efforts: Make all efforts to mention what you are going to write in your paper. That means always have a good start. Try to
mention everything in introduction, that what is the need of a particular research paper. Polish your work by good skill of writing and
always give an evaluator, what he wants.
13. Have backups: When you are going to do any important thing like making research paper, you should always have backup copies of it
either in your computer or in paper. This will help you to not to lose any of your important.
14. Produce good diagrams of your own: Always try to include good charts or diagrams in your paper to improve quality. Using several
and unnecessary diagrams will degrade the quality of your paper by creating "hotchpotch." So always, try to make and include those
diagrams, which are made by your own to improve readability and understandability of your paper.
15. Use of direct quotes: When you do research relevant to literature, history or current affairs then use of quotes become essential but
if study is relevant to science then use of quotes is not preferable.
© Copyright by Global Journals Inc.(US) | Guidelines Handbook
XI
16. Use proper verb tense: Use proper verb tenses in your paper. Use past tense, to present those events that happened. Use present
tense to indicate events that are going on. Use future tense to indicate future happening events. Use of improper and wrong tenses will
confuse the evaluator. Avoid the sentences that are incomplete.
17. Never use online paper: If you are getting any paper on Internet, then never use it as your research paper because it might be
possible that evaluator has already seen it or maybe it is outdated version.
18. Pick a good study spot: To do your research studies always try to pick a spot, which is quiet. Every spot is not for studies. Spot that
suits you choose it and proceed further.
19. Know what you know: Always try to know, what you know by making objectives. Else, you will be confused and cannot achieve your
target.
20. Use good quality grammar: Always use a good quality grammar and use words that will throw positive impact on evaluator. Use of
good quality grammar does not mean to use tough words, that for each word the evaluator has to go through dictionary. Do not start
sentence with a conjunction. Do not fragment sentences. Eliminate one-word sentences. Ignore passive voice. Do not ever use a big
word when a diminutive one would suffice. Verbs have to be in agreement with their subjects. Prepositions are not expressions to finish
sentences with. It is incorrect to ever divide an infinitive. Avoid clichés like the disease. Also, always shun irritating alliteration. Use
language that is simple and straight forward. put together a neat summary.
21. Arrangement of information: Each section of the main body should start with an opening sentence and there should be a
changeover at the end of the section. Give only valid and powerful arguments to your topic. You may also maintain your arguments with
records.
22. Never start in last minute: Always start at right time and give enough time to research work. Leaving everything to the last minute
will degrade your paper and spoil your work.
23. Multitasking in research is not good: Doing several things at the same time proves bad habit in case of research activity. Research is
an area, where everything has a particular time slot. Divide your research work in parts and do particular part in particular time slot.
24. Never copy others' work: Never copy others' work and give it your name because if evaluator has seen it anywhere you will be in
trouble.
25. Take proper rest and food: No matter how many hours you spend for your research activity, if you are not taking care of your health
then all your efforts will be in vain. For a quality research, study is must, and this can be done by taking proper rest and food.
26. Go for seminars: Attend seminars if the topic is relevant to your research area. Utilize all your resources.
27. Refresh your mind after intervals: Try to give rest to your mind by listening to soft music or by sleeping in intervals. This will also
improve your memory.
28. Make colleagues: Always try to make colleagues. No matter how sharper or intelligent you are, if you make colleagues you can have
several ideas, which will be helpful for your research.
29.
Think technically: Always think technically. If anything happens, then search its reasons, its benefits, and demerits.
30. Think and then print: When you will go to print your paper, notice that tables are not be split, headings are not detached from their
descriptions, and page sequence is maintained.
31. Adding unnecessary information: Do not add unnecessary information, like, I have used MS Excel to draw graph. Do not add
irrelevant and inappropriate material. These all will create superfluous. Foreign terminology and phrases are not apropos. One should
NEVER take a broad view. Analogy in script is like feathers on a snake. Not at all use a large word when a very small one would be
XII
© Copyright by Global Journals Inc.(US)| Guidelines Handbook
sufficient. Use words properly, regardless of how others use them. Remove quotations. Puns are for kids, not grunt readers.
Amplification is a billion times of inferior quality than sarcasm.
32. Never oversimplify everything: To add material in your research paper, never go for oversimplification. This will definitely irritate the
evaluator. Be more or less specific. Also too, by no means, ever use rhythmic redundancies. Contractions aren't essential and shouldn't
be there used. Comparisons are as terrible as clichés. Give up ampersands and abbreviations, and so on. Remove commas, that are, not
necessary. Parenthetical words however should be together with this in commas. Understatement is all the time the complete best way
to put onward earth-shaking thoughts. Give a detailed literary review.
33. Report concluded results: Use concluded results. From raw data, filter the results and then conclude your studies based on
measurements and observations taken. Significant figures and appropriate number of decimal places should be used. Parenthetical
remarks are prohibitive. Proofread carefully at final stage. In the end give outline to your arguments. Spot out perspectives of further
study of this subject. Justify your conclusion by at the bottom of them with sufficient justifications and examples.
34. After conclusion: Once you have concluded your research, the next most important step is to present your findings. Presentation is
extremely important as it is the definite medium though which your research is going to be in print to the rest of the crowd. Care should
be taken to categorize your thoughts well and present them in a logical and neat manner. A good quality research paper format is
essential because it serves to highlight your research paper and bring to light all necessary aspects in your research.
INFORMAL GUIDELINES OF RESEARCH PAPER WRITING
Key points to remember:
Submit all work in its final form.
Write your paper in the form, which is presented in the guidelines using the template.
Please note the criterion for grading the final paper by peer-reviewers.
Final Points:
A purpose of organizing a research paper is to let people to interpret your effort selectively. The journal requires the following sections,
submitted in the order listed, each section to start on a new page.
The introduction will be compiled from reference matter and will reflect the design processes or outline of basis that direct you to make
study. As you will carry out the process of study, the method and process section will be constructed as like that. The result segment will
show related statistics in nearly sequential order and will direct the reviewers next to the similar intellectual paths throughout the data
that you took to carry out your study. The discussion section will provide understanding of the data and projections as to the implication
of the results. The use of good quality references all through the paper will give the effort trustworthiness by representing an alertness
of prior workings.
Writing a research paper is not an easy job no matter how trouble-free the actual research or concept. Practice, excellent preparation,
and controlled record keeping are the only means to make straightforward the progression.
General style:
Specific editorial column necessities for compliance of a manuscript will always take over from directions in these general guidelines.
To make a paper clear
· Adhere to recommended page limits
Mistakes to evade
Insertion a title at the foot of a page with the subsequent text on the next page
© Copyright by Global Journals Inc.(US) | Guidelines Handbook
XIII

Separating a table/chart or figure - impound each figure/table to a single page
Submitting a manuscript with pages out of sequence
In every sections of your document
· Use standard writing style including articles ("a", "the," etc.)
· Keep on paying attention on the research topic of the paper
· Use paragraphs to split each significant point (excluding for the abstract)
· Align the primary line of each section
· Present your points in sound order
· Use present tense to report well accepted
· Use past tense to describe specific results
· Shun familiar wording, don't address the reviewer directly, and don't use slang, slang language, or superlatives
· Shun use of extra pictures - include only those figures essential to presenting results
Title Page:
Choose a revealing title. It should be short. It should not have non-standard acronyms or abbreviations. It should not exceed two printed
lines. It should include the name(s) and address (es) of all authors.
Abstract:
The summary should be two hundred words or less. It should briefly and clearly explain the key findings reported in the manuscript--
must have precise statistics. It should not have abnormal acronyms or abbreviations. It should be logical in itself. Shun citing references
at this point.
An abstract is a brief distinct paragraph summary of finished work or work in development. In a minute or less a reviewer can be taught
the foundation behind the study, common approach to the problem, relevant results, and significant conclusions or new questions.
Write your summary when your paper is completed because how can you write the summary of anything which is not yet written?
Wealth of terminology is very essential in abstract. Yet, use comprehensive sentences and do not let go readability for briefness. You can
maintain it succinct by phrasing sentences so that they provide more than lone rationale. The author can at this moment go straight to
XIV
© Copyright by Global Journals Inc.(US)| Guidelines Handbook
shortening the outcome. Sum up the study, with the subsequent elements in any summary. Try to maintain the initial two items to no
more than one ruling each.
Reason of the study - theory, overall issue, purpose
Fundamental goal
To the point depiction of the research
Consequences, including definite statistics - if the consequences are quantitative in nature, account quantitative data; results of any numerical analysis should be reported
Significant conclusions or questions that track from the research(es)
Approach:
Single section, and succinct
As a outline of job done, it is always written in past tense
A conceptual should situate on its own, and not submit to any other part of the paper such as a form or table
Center on shortening results - bound background information to a verdict or two, if completely necessary
What you account in an conceptual must be regular with what you reported in the manuscript
Exact spelling, clearness of sentences and phrases, and appropriate reporting of quantities (proper units, important statistics) are just as significant in an abstract as they are anywhere else
Introduction:
The Introduction should "introduce" the manuscript. The reviewer should be presented with sufficient background information to be capable to comprehend and calculate the purpose of your study without having to submit to other works. The basis for the study should be offered. Give most important references but shun difficult to make a comprehensive appraisal of the topic. In the introduction, describe the problem visibly. If the problem is not acknowledged in a logical, reasonable way, the reviewer will have no attention in your result. Speak in common terms about techniques used to explain the problem, if needed, but do not present any particulars about the protocols here. Following approach can create a valuable beginning:
Explain the value (significance) of the study
Shield the model - why did you employ this particular system or method? What is its compensation? You strength remark on its appropriateness from a abstract point of vision as well as point out sensible reasons for using it.
Present a justification. Status your particular theory (es) or aim(s), and describe the logic that led you to choose them.
Very for a short time explain the tentative propose and how it skilled the declared objectives.
Approach:
Use past tense except for when referring to recognized facts. After all, the manuscript will be submitted after the entire job is done.
Sort out your thoughts; manufacture one key point with every section. If you make the four points listed above, you will need a least of four paragraphs.
Present surroundings information only as desirable in order hold up a situation. The reviewer does not desire to read the whole thing you know about a topic.
Shape the theory/purpose specifically - do not take a broad view.
As always, give awareness to spelling, simplicity and correctness of sentences and phrases.
Procedures (Methods and Materials):
This part is supposed to be the easiest to carve if you have good skills. A sound written Procedures segment allows a capable scientist to replacement your results. Present precise information about your supplies. The suppliers and clarity of reagents can be helpful bits of information. Present methods in sequential order but linked methodologies can be grouped as a segment. Be concise when relating the protocols. Attempt for the least amount of information that would permit another capable scientist to spare your outcome but be cautious that vital information is integrated. The use of subheadings is suggested and ought to be synchronized with the results section. When a technique is used that has been well described in another object, mention the specific item describing a way but draw the basic
© Copyright by Global Journals Inc.(US) | Guidelines Handbook
XV

principle while stating the situation. The purpose is to text all particular resources and broad procedures, so that another person may use some or all of the methods in one more study or referee the scientific value of your work. It is not to be a step by step report of the whole thing you did, nor is a methods section a set of orders. Materials:
Explain materials individually only if the study is so complex that it saves liberty this way.
Embrace particular materials, and any tools or provisions that are not frequently found in laboratories.
Do not take in frequently found.
If use of a definite type of tools.
Materials may be reported in a part section or else they may be recognized along with your measures.
Methods:
Report the method (not particulars of each process that engaged the same methodology)
Describe the method entirely
To be succinct, present methods under headings dedicated to specific dealings or groups of measures
Simplify - details how procedures were completed not how they were exclusively performed on a particular day.
If well known procedures were used, account the procedure by name, possibly with reference, and that's all.
Approach:
It is embarrassed or not possible to use vigorous voice when documenting methods with no using first person, which would focus the reviewer's interest on the researcher rather than the job. As a result when script up the methods most authors use third person passive voice.
Use standard style in this and in every other part of the paper - avoid familiar lists, and use full sentences.
What to keep away from
Resources and methods are not a set of information.
Skip all descriptive information and surroundings - save it for the argument.
Leave out information that is immaterial to a third party.
Results:
The principle of a results segment is to present and demonstrate your conclusion. Create this part a entirely objective details of the outcome, and save all understanding for the discussion.
The page length of this segment is set by the sum and types of data to be reported. Carry on to be to the point, by means of statistics and tables, if suitable, to present consequences most efficiently.You must obviously differentiate material that would usually be incorporated in a study editorial from any unprocessed data or additional appendix matter that would not be available. In fact, such matter should not be submitted at all except requested by the instructor.
Content
Sum up your conclusion in text and demonstrate them, if suitable, with figures and tables.
In manuscript, explain each of your consequences, point the reader to remarks that are most appropriate.
Present a background, such as by describing the question that was addressed by creation an exacting study.
Explain results of control experiments and comprise remarks that are not accessible in a prescribed figure or table, if appropriate.
Examine your data, then prepare the analyzed (transformed) data in the form of a figure (graph), table, or in manuscript form. What to stay away from
Do not discuss or infer your outcome, report surroundings information, or try to explain anything.
Not at all, take in raw data or intermediate calculations in a research manuscript.
XVI
© Copyright by Global Journals Inc.(US)| Guidelines Handbook
Do not present the similar data more than once.
Manuscript should complement any figures or tables, not duplicate the identical information.
Never confuse figures with tables - there is a difference. Approach
As forever, use past tense when you submit to your results, and put the whole thing in a reasonable order.
Put figures and tables, appropriately numbered, in order at the end of the report
If you desire, you may place your figures and tables properly within the text of your results part. Figures and tables
If you put figures and tables at the end of the details, make certain that they are visibly distinguished from any attach appendix materials, such as raw facts
Despite of position, each figure must be numbered one after the other and complete with subtitle
In spite of position, each table must be titled, numbered one after the other and complete with heading
All figure and table must be adequately complete that it could situate on its own, divide from text Discussion:
The Discussion is expected the trickiest segment to write and describe. A lot of papers submitted for journal are discarded based onproblems with the Discussion. There is no head of state for how long a argument should be. Position your understanding of the outcomevisibly to lead the reviewer through your conclusions, and then finish the paper with a summing up of the implication of the study. Thepurpose here is to offer an understanding of your results and hold up for all of your conclusions, using facts from your research andgenerally accepted information, if suitable. The implication of result should be visibly described. Infer your data in the conversation in suitable depth. This means that when you clarify an observable fact you must explain mechanismsthat may account for the observation. If your results vary from your prospect, make clear why that may have happened. If your resultsagree, then explain the theory that the proof supported. It is never suitable to just state that the data approved with prospect, and let itdrop at that.
Make a decision if each premise is supported, discarded, or if you cannot make a conclusion with assurance. Do not just dismissa study or part of a study as "uncertain."
Research papers are not acknowledged if the work is imperfect. Draw what conclusions you can based upon the results thatyou have, and take care of the study as a finished work
You may propose future guidelines, such as how the experiment might be personalized to accomplish a new idea.
Give details all of your remarks as much as possible, focus on mechanisms.
Make a decision if the tentative design sufficiently addressed the theory, and whether or not it was correctly restricted.
Try to present substitute explanations if sensible alternatives be present.
One research will not counter an overall question, so maintain the large picture in mind, where do you go next? The beststudies unlock new avenues of study. What questions remain?
Recommendations for detailed papers will offer supplementary suggestions.Approach:
When you refer to information, differentiate data generated by your own studies from available information
Submit to work done by specific persons (including you) in past tense.
Submit to generally acknowledged facts and main beliefs in present tense.
ADMINISTRATION RULES LISTED BEFORE SUBMITTING YOUR RESEARCH PAPER TO GLOBAL JOURNALS INC. (US)
Please carefully note down following rules and regulation before submitting your Research Paper to Global Journals Inc. (US):
Segment Draft and Final Research Paper: You have to strictly follow the template of research paper. If it is not done your paper may get
rejected.
© Copyright by Global Journals Inc.(US) | Guidelines Handbook
XVII

Do not give permission to anyone else to "PROOFREAD" your manuscript.
Methods to avoid Plagiarism is applied by us on every paper, if found guilty, you will be blacklisted by all of our collaboratedresearch groups, your institution will be informed for this and strict legal actions will be taken immediately.)
To guard yourself and others from possible illegal use please do not permit anyone right to use to your paper and files.
The major constraint is that you must independently make all content, tables, graphs, and facts that are offered in the paper.You must write each part of the paper wholly on your own. The Peer-reviewers need to identify your own perceptive of theconcepts in your own terms. NEVER extract straight from any foundation, and never rephrase someone else's analysis.
XVIII
© Copyright by Global Journals Inc.(US)| Guidelines Handbook
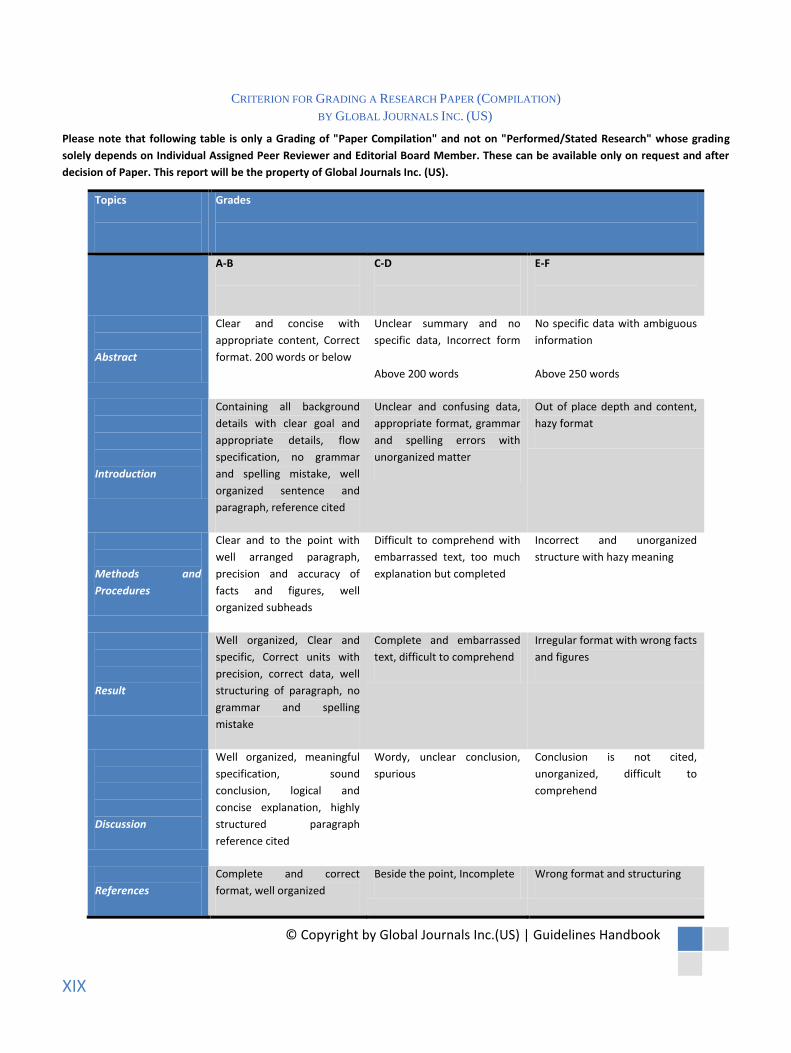
CRITERION FOR GRADING A RESEARCH PAPER (COMPILATION)BY GLOBAL JOURNALS INC. (US)
Please note that following table is only a Grading of "Paper Compilation" and not on "Performed/Stated Research" whose grading
solely depends on Individual Assigned Peer Reviewer and Editorial Board Member. These can be available only on request and after
decision of Paper. This report will be the property of Global Journals Inc. (US).
Topics Grades
A-B C-D E-F
Abstract
Clear and concise with
appropriate content, Correct
format. 200 words or below
Unclear summary and no
specific data, Incorrect form
Above 200 words
No specific data with ambiguous
information
Above 250 words
Introduction
Containing all background
details with clear goal and
appropriate details, flow
specification, no grammar
and spelling mistake, well
organized sentence and
paragraph, reference cited
Unclear and confusing data,
appropriate format, grammar
and spelling errors with
unorganized matter
Out of place depth and content,
hazy format
Methods and
Procedures
Clear and to the point with
well arranged paragraph,
precision and accuracy of
facts and figures, well
organized subheads
Difficult to comprehend with
embarrassed text, too much
explanation but completed
Incorrect and unorganized
structure with hazy meaning
Result
Well organized, Clear and
specific, Correct units with
precision, correct data, well
structuring of paragraph, no
grammar and spelling
mistake
Complete and embarrassed
text, difficult to comprehend
Irregular format with wrong facts
and figures
Discussion
Well organized, meaningful
specification, sound
conclusion, logical and
concise explanation, highly
structured paragraph
reference cited
Wordy, unclear conclusion,
spurious
Conclusion is not cited,
unorganized, difficult to
comprehend
References
Complete and correct
format, well organized
Beside the point, Incomplete Wrong format and structuring
© Copyright by Global Journals Inc.(US) | Guidelines Handbook
XIX
A
absenteeism
· 23
accompanished
· 42
agro-ecological
· 13, 19
Anthropology
· 77, 79
apprehensive
· 60
artifacts
· 37
augmenting
· 75
B
biochemical
· 27, 28, 81, 85, 95
biosynthesis
· 87
C
calorie
· 25, 27
Capsicum
· 2, 4, 6
chlorophyll
· 81, 83, 84, 87, 89, 91, 93, 94, 95, 96
Chlorophyll
· 83, 84, 89
cholesterol
· 29
cocoyam
· 15, 50
collapsed
· 52
combination
· 18, 21, 25, 104
commercialization
· 43, 44
concentration
· 83, 87, 99, 100, 103
contractors
· 52
correlations
· 11
criterion
· 17, 85
cumulative
· 16
D
deforestation
· 37, 41, 42, 44, 47
Deforestation
· 37, 43, 47
degradation
· 13, 14, 15, 41, 42, 47, 52, 56
developmental
· 50
Directorate
· 83
diversification
· 15, 18
Diversification
· 13, 15, 16, 21
domestication
· 44
E
ecologically
· 37, 52
Econometrics
· 35
economical
· 41
elasticities
· 25, 26, 30, 31, 33, 35
elasticity
· 23, 25, 30, 31, 33
emphasize
· 64
encourages
· 13, 18, 19
Ethiopians
· 26
evaporation
· 8
Evapotranspiration
· 6, 8
exogenous
· 16, 26
expenditures
· 29
experimentation
· 11
exploitation
· 65
F
federalism
· 52
feminization
· 55
fertilization
· 101, 103, 105
fixation
· 1, 99, 101, 103, 104, 105, 107, 108, 109, 110
fluorescence
· 81, 83, 84, 89, 91, 95, 96
G
genotypic
· 89, 94
globalization
· 64
H
harmoniously
· 39
Harvestable
· 6
Helianthus
· 95
Herfindal
· 13, 15, 16, 21
heterogeneity
· 26
heterogeneously
· 39
homogeneity
· 30, 31
Horticulture
· 4
household
· 13, 15, 16, 18, 19, 23, 25, 26, 27, 29, 30,41, 42, 43, 45, 55, 63, 75, 76
I
implementation
· 62
implication
· 16, 27, 57, 59, 77
Inaccessibility
· 48
Indonesia · 28, 43, 44, 45inferential
31, 37, 40,
Index
marketability
· 59
maximization
· 26, 64
metabolism
· 95, 96
methionine
· 28
metrological
· 83
militancy
· 50, 52, 55, 60, 61
monogamous
· 74
Multinational
· 50
N
negotiation
· 50
Neonotonia
· 105
nodulating
· 99
O
observation
· 9, 19
P
pastorialists
· 13
perception
· 50, 53, 55, 57, 58, 59, 60, 61
phosphorus
· 1, 27, 29, 99, 101, 102, 103, 104, 105, 110
photosynthesis
· 87, 94, 95, 103
physiological
· 81, 83, 84, 93, 94, 95
Physiological
· 1, 81, 82, 83, 85, 87, 89, 91, 93, 94, 95, 97, 98
plausible
· 31
polygamous
· 76
precipitation
· 93
predominantly
· 63, 65
preferential
· 29
Q
qualification
· 61
qualifications
· 56, 61
quantification
· 83
R
redistribution
· 25
rehabilitation
· 53
remunerative
· 19
requirement
· 2, 28, 42
retardation
· 28
Rhizobium
· 99, 102, 103, 104
ruralites
· 57
S
sabotaged
· 52
scarcity
· 59
seasonality
· 75
secretariat
· 39
significantly
· 31, 40, 63, 93, 99, 101, 102
specialization
· 18
specifically
· 74
spillage
· 57
statistical
· 16, 18, 63
susceptible
· 13, 81, 83, 84, 85, 87, 89, 91, 93
Sustainable
· 20, 45, 50, 62
symbiotic
· 99, 103, 104
systematic
· 23, 26, 30
T
transactional
· 63, 64, 65, 68, 72, 73, 74, 75, 76, 77
transplanting
· 6, 8, 9, 12
U
unobservable
· 16
L
localization · 95
M
Macroptilium · 105
infrastructural · 43, 76inoculation · 99, 100, 101, 102, 103, 104, 105, 107, 108, 109instabilities · 64irrigation · 1, 2, 4, 5, 6, 8, 9, 10, 11, 12, 99, 101, 103, 104, 105,
107, 108, 109,
Global Journal of Science Frontier Research
Visit us on the Web at www.GlobalJournals.org | www.JournalofScience.org
or email us at [email protected]
save our planet
9 2
70 116 58 698 >72416
© 2012 by Global Journals
ISSN 9755896
Copyright © 2022 FDOKUMEN