Verticillium wilt and Phytophthora blight of chile pepper - CORE
Upload
khangminh22Category
view
1download
0
BELL PEPPER GROWTH RESPONSES AND SOIL ENVIRONMENTAL CHANGES
TO HUMIC SUBSTANCES AND DEFICIT IRRIGATION
A Thesis
by
KUAN QIN
Submitted to the Office of Graduate and Professional Studies of
Texas A&M University
in partial fulfillment of the requirements for the degree of
MASTER OF SCIENCE
Chair of Committee, Daniel I. Leskovar
Co-Chair of Committee, Kevin M. Crosby
Committee Members, Xuejun Dong
Head of Department, Dan Lineberger
December 2017
Major Subject: Horticulture
Copyright 2017 Kuan Qin

ii
ABSTRACT
Organic matter-derived soil amendments containing humic substances (HS) play
a functional role in improving plant root growth and soil quality, but their interaction
with water deficit levels is unknown. In this study, lignite-derived HS were mixed with
pot soil in controlled environments (growth chamber and greenhouse) and field soil in
two different environmental locations (clay in Uvalde and sandy in Weslaco), then
subjected to four irrigation levels -- severe deficit (20%), mild deficit (40%), moderate
deficit (60%) and well-watered (80%) on bell pepper (Capsicum annuum L.) plants
based on water-holding capacity in controlled environment and evapotranspiration
requirement in field conditions. Plant morphology and physiology were assessed in
different growth environments. Root traits, soil chemical properties and microbial
activities were measured and analyzed at the end of the study.
HS application significantly increased plant height and stem diameter during
seedling development and early vegetative growth period, and decreased plant
transpiration rates during early growth while maintaining photosynthesis at the same
level as the control (increased water use efficiency), especially under severe or mild
deficit levels. HS increased plant biomass accumulation in controlled environments and
increased early yield in field conditions. HS increased root length, surface area and dry
weight in controlled environments. These root promotion effects were consistent in field
conditions although not statistically significant. HS also increased soil organic carbon as
well as soil respiration and microbial population in both soil types. Plant growth

iii
performance was significantly decreased in severe and mild deficit stress, but was
similar in moderate deficit and well-watered treatments.
These results suggest that HS have the ability to ameliorate severe or mild stress
in the short-term, which can reduce water loss in plants exposed transiently to water
deficit conditions. In addition, this study provides evidence that the application of HS
might be considered for long-term agricultural use due to their capacity to improve crop
early yield, soil nutrient cycling, organic carbon retention, microbial enrichment and
activity under moderate stress or well-watered conditions.

iv
DEDICATION
To my father

v
ACKNOWLEDGEMENTS
I would like to thank my committee chair, Dr. Leskovar, for his guidance and
assistance to my research and study, and providing me with a lot of opportunities to
experience different projects and gain valuable skills. I would also like to thank my
committee members, Dr. Crosby and Dr. Dong, for their precious advice and suggestions
on different problems and concerns in my research. I want to further thank Dr. Subas
Malla, Dr. Vijay Joshi, Dr. Desire Djidonou, Dr. Madhumita Joshi, Christine Thompson,
Ray King, Sixto Silva, Carrie Hensarling, Ben Puerta, Manuel Figueroa-Pagan, Liza
Silva, Michael Tidwell and all the people in Texas A&M AgriLife Research and
Extension Center at Uvalde and Dr. John Jifon in AgriLife Research Center at Weslaco
for their kindness help.
I extend my gratitude to all faculty and staff in the Department of Horticultural
Sciences, thanks also go to my friends and colleagues Andrea Macias Leon, Ankai Zhou
and Rahul Raman for their friendship and encouragement, which make my life in Texas
A&M University a great and unforgettable time.
Finally, I want to thank my father for his support and my mother for her eternal
love in heaven.

vi
CONTRIBUTORS AND FUNDING SOURCES
Contributors
Part 1, faculty committee recognition
This work was supervised by a thesis committee consisting of Professor Daniel I.
Leskovar as advisor and Professor Kevin M. Crosby as co-advisor of the Department of
Horticultural Sciences and Professor Xuejun Dong of the Department of Soil and Crop
Sciences.
Part 2, student/advisor contributions
All work for the thesis completed by the student, under the advisement of Daniel
I. Leskovar of the Department of Horticultural Sciences.
Funding Sources
This work was funded by Novihum Technologies GmbH.

vii
NOMENCLATURE
HS Humic substances
OM Organic matter
SA Soil amendment
IR Irrigation
WUE Water use efficiency
WHC Water-holding capacity
ET Evapotranspiration

viii
TABLE OF CONTENTS
Page
ABSTRACT ....................................................................................................................... ii
DEDICATION .................................................................................................................. iv
ACKNOWLEDGEMENTS ............................................................................................... v
CONTRIBUTORS AND FUNDING SOURCES ............................................................. vi
NOMENCLATURE ......................................................................................................... vii
TABLE OF CONTENTS ............................................................................................... viii
LIST OF FIGURES ............................................................................................................ x
LIST OF TABLES ........................................................................................................... xii
CHAPTER I INTRODUCTION AND LITERATURE REVIEW ................................... 1
Organic soil amendments ............................................................................................... 1
Humic substances ........................................................................................................... 2
Water stress and deficit irrigation .................................................................................. 7
Research questions ......................................................................................................... 9
CHAPTER II BELL PEPPER GROWTH RESPONSES AND SOIL PROPERTY
CHANGES TO HUMIC SUBSTANCES AND DEFICIT IRRIGATION IN
CONTROLLED ENVIRONMENTS ............................................................................... 10
Introduction .................................................................................................................. 10
Approach ...................................................................................................................... 11
Results .......................................................................................................................... 15
Discussion .................................................................................................................... 25
CHAPTER III BELL PEPPER GROWTH RESPONSES AND SOIL PROPERTY
CHANGES TO HUMIC SUBSTANCES AND DEFICIT IRRIGATION IN FIELD
CONDITIONS ................................................................................................................. 34
Introduction .................................................................................................................. 34
Approach ...................................................................................................................... 35
Results - Uvalde ........................................................................................................... 42

ix
Results - Weslaco ......................................................................................................... 64
Discussion .................................................................................................................... 81
CHAPTER IV SUMMARY AND CONCLUSIONS ..................................................... 88
Summary ...................................................................................................................... 88
Conclusions .................................................................................................................. 89
REFERENCES ................................................................................................................. 90

x
LIST OF FIGURES
Page
Figure 1. Bell pepper above-ground dry weight accumulation (± standard error) in the
growth chamber sandy soil (a), greenhouse sandy soil (b) and clay soil (c)
for soil amendment and different irrigation levels. .......................................... 23
Figure 2. Bell pepper root dry weight, length, surface area and average diameter (±
standard error) in the growth chamber sandy soil (a), greenhouse sandy soil
(b) and clay soil (c) for soil amendment and different irrigation levels. .......... 24
Figure 3. The principal component analysis (PCA) of the relationship between
selected variables and different environmental factors in the greenhouse
sandy (a) and clay soil (b) experiment. ............................................................. 33
Figure 4. Weather data from Uvalde and Weslaco, TX from Aug 2016 to Aug 2017. ... 36
Figure 5. Volumetric soil moisture data in Uvalde, TX from Aug to Dec 2016.
Irrigation levels were imposed based on crop-evapotranspiration (ET)
demand. ............................................................................................................. 39
Figure 6. Bell pepper year-1 early and total harvest yield in response to soil
amendment treatment in Uvalde. ...................................................................... 45
Figure 7. Bell pepper year-1 early and total harvest yield in response to different
irrigation levels in Uvalde. ............................................................................... 46
Figure 8. Bell pepper year-2 early and total harvest yield in response to soil
amendment treatment in Uvalde. ...................................................................... 54
Figure 9. Bell pepper year-2 early and total harvest yield in response to different
irrigation levels in Uvalde. ............................................................................... 54
Figure 10. Bell pepper new year-1 early and total harvest yield in response to soil
amendment treatment in Uvalde. ...................................................................... 60
Figure 11. Bell pepper new year-1 early and total harvest yield in response to
different irrigation levels in Uvalde. ................................................................. 60
Figure 12. Bell pepper year-1 yield in response to different soil amendment and
different irrigation levels in Weslaco. .............................................................. 66
Figure 13. Bell pepper year-2 yield in response to different soil amendment and
irrigation levels in Weslaco. ............................................................................. 72

xi
Figure 14. Bell pepper new year-1 yield in response to the interaction of soil
amendment and irrigation treatments in Weslaco. ........................................... 78

xii
LIST OF TABLES
Page
Table 1. Sandy and clay soil basic properties .................................................................. 19
Table 2. Composition of humic substances (HS) soil amendment .................................. 19
Table 3. Time affected source of variations and P-values from repeated measures
analysis of variance on plant height (PH), stem diameter (SD), chlorophyll
content index (SPAD), rate of photosynthesis (Pn), stomatal conductance
(gs) and transpiration (E) of bell pepper grown in growth chamber (GC) and
greenhouse (GH) environments ........................................................................ 20
Table 4. Time-course effects (P-values) of HS on plant height (PH), stem diameter
(SD), chlorophyll content index (SPAD), rate of photosynthesis (Pn),
stomatal conductance (gs) and transpiration (E) under different controlled
environments ..................................................................................................... 21
Table 5. Sandy and clay soil final chemical and microbial properties as affected by
soil amendment (SA) and irrigation (IR) treatments in greenhouse (GH)
environment. Soil chemical properties including pH, electrical conductivity
(EC), nitrate-nitrogen (NO3-N), phosphorus (P) and potassium (K);
microbial properties including soil respiration (CO2-C), active bacteria
(AB), total bacteria (TB), active fungi (AF) and total fungi (TF) .................... 22
Table 6. Basic soil properties from Uvalde and Weslaco, TX ......................................... 37
Table 7. Timeline for the field experiments in Uvalde and Weslaco in 2016 (year-1)
and 2017 (year-2, new year-1) .......................................................................... 42
Table 8. Summary of morphological and physiological traits of bell pepper grown in
year-1 experiment at Uvalde ............................................................................. 44
Table 9. Source of variations and P-values from ANOVA on bell pepper year-1 yield
in Uvalde ........................................................................................................... 45
Table 10. Bell pepper year-1 quality in Uvalde ............................................................... 47
Table 11. Summary of plant root traits under soil amendment (SA) and irrigation (IR)
treatments in year-1 field at Uvalde .................................................................. 47
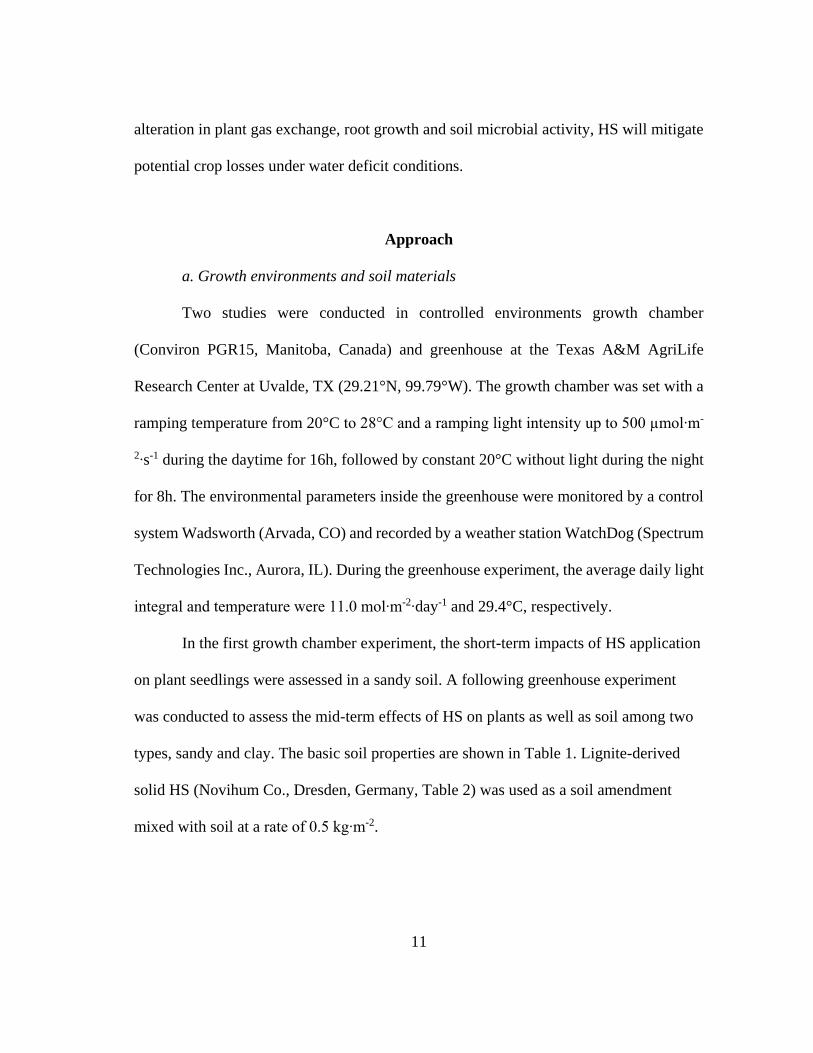
Table 12. Summary of soil pH, electrical conductivity (EC), chemical component
analysis under soil amendment (SA) and irrigation (IR) treatments in year-1
field at Uvalde ................................................................................................... 48

xiii
Table 13. Summary of soil respiration (SR), active bacteria (AB), total bacteria (TB),
active fungi (AF) and total fungi (TF) under soil amendment (SA) and
irrigation (IR) treatments in year-1 field at Uvalde .......................................... 49
Table 14. Summary of morphological and physiological traits of bell pepper grown in
year-2 experiment at Uvalde ............................................................................. 52
Table 15. Source of variations and P-values from ANOVA on bell pepper year-2
yield in Uvalde .................................................................................................. 53
Table 16. Bell pepper year-2 quality in Uvalde ............................................................... 55
Table 17. Summary of plant root traits under soil amendment (SA) and irrigation (IR)
treatments in year-2 field at Uvalde .................................................................. 55
Table 18. Summary of soil pH, electrical conductivity (EC), chemical component
analysis and organic carbon (OC) under soil amendment (SA) and irrigation
(IR) treatments in year-2 field at Uvalde .......................................................... 56
Table 19. Summary of soil respiration (SR), active bacteria (AB), total bacteria (TB),
active fungi (AF) and total fungi (TF) under soil amendment (SA) and
irrigation (IR) treatments in year-2 field at Uvalde. ......................................... 56
Table 20. Summary of morphological and physiological traits of bell pepper grown in
new year-1 experiment at Uvalde ..................................................................... 58
Table 21. Source of variations and P-values from ANOVA on bell pepper new year-1
yield in Uvalde .................................................................................................. 59
Table 22. Bell pepper new year-1 quality in Uvalde ........................................................ 61
Table 23. Summary of plant root traits under soil amendment (SA) and irrigation (IR)
treatments in new year-1 field at Uvalde .......................................................... 61
Table 24. Summary of soil pH, electrical conductivity (EC), chemical component
analysis and organic carbon (OC) under soil amendment (SA) and irrigation
(IR) treatments in new year-1 field at Uvalde .................................................. 63
Table 25. Summary of morphological and physiological traits of bell pepper grown in
year-1 experiment at Weslaco .......................................................................... 65
Table 26. Source of variations and P-values from ANOVA on bell pepper year-1
yield in Weslaco ............................................................................................... 66
Table 27. Bell pepper year-1 quality in Weslaco ............................................................. 66

xiv
Table 28. Summary of plant root traits under soil amendment (SA) and irrigation (IR)
treatments in year-1 field at Weslaco ............................................................... 67
Table 29. Summary of soil pH, electrical conductivity (EC), chemical component
analysis under soil amendment (SA) and irrigation (IR) treatments in year-1
field at Weslaco ................................................................................................ 68
Table 30. Summary of soil respiration (SR), active bacteria (AB), total bacteria (TB),
active fungi (AF) and total fungi (TF) under soil amendment (SA) and
irrigation (IR) treatments in year-1 field at Weslaco ........................................ 69
Table 31. Summary of morphological and physiological traits of bell pepper grown in
year-2 experiment at Weslaco .......................................................................... 71
Table 32. Source of variations and P-values from ANOVA on bell pepper year-2
yield in Weslaco ............................................................................................... 72
Table 33. Bell pepper year-2 quality in Weslaco ............................................................. 73
Table 34. Summary of plant root traits in year-2 field at Weslaco .................................. 74
Table 35. Summary of soil pH, electrical conductivity (EC), chemical component
analysis and organic carbon (OC) under soil amendment (SA) and irrigation
(IR) treatments in year-2 field at Weslaco ........................................................ 74
Table 36. Summary of soil respiration (SR), active bacteria (AB), total bacteria (TB),
active fungi (AF) and total fungi (TF) under soil amendment (SA) and
irrigation (IR) treatments in year-2 field at Weslaco ........................................ 75
Table 37. Summary of morphological and physiological traits of bell pepper grown in
new year-1 experiment at Weslaco ................................................................... 77
Table 38. Source of variations and P-values from ANOVA on bell pepper new year-1
yield in Weslaco ............................................................................................... 78
Table 39. Bell pepper new year-1 quality in Weslaco ..................................................... 79
Table 40. Summary of plant root traits in new year-1 field at Weslaco........................... 79
Table 41. Summary of soil pH, conductivity, chemical component analysis and
organic carbon (OC) under soil amendment (SA) and irrigation (IR)
treatments in new year-1 field at Weslaco ........................................................ 80

1
CHAPTER I
INTRODUCTION AND LITERATURE REVIEW
Intense human activities in agricultural practices such as excessive irrigation,
fertilization and the use of various agrochemicals cause soil degradation (Diacono and
Montemurro, 2010), increase the soil nutritional imbalance and the susceptibility of
plants to abiotic stress, which will become a threat for human health due to the
decreasing crop yield and food quality (Lal, 2009). Besides, maximizing yields to feed
the increasing human population under decreasing soil fertility and limited water
resources is also a major challenge. It is expected that significant improvements in soil
properties will also improve plant growth by changing water and nutrient uptake
efficiency, and shoot and root morphological and physiological responses, which will
ultimately enhance crop yield and quality, as well as economic benefits.
Organic soil amendments
Using functional soil amendments is an effective method to improve soil quality.
Organic-matter derived from plant decomposition leads to a mixture of substrate that
contains more than 70% lignite in the surface layer (0-5 cm) of soil (Rumpel et al.,
1998), which provides a good source for organic matter derived-amendments. The
amount of soil organic matter and N content can be significantly increased with the
application of organic amendments along with inorganic fertilizers (Goyal et al., 1999),
which makes organic amendments promising for the development of sustainable

2
agriculture, high-yields and profitable production systems. Therefore, organic
amendments have been studied in depth and used in practice (Bulluck et al., 2002;
Diacono and Montemurro, 2010). Other than lignites, animal manure, crop residues and
organic waste are also good sources to make organic amendments, such as compost and
humic substances. Compost refers to the biological decomposition of organic matter
under well managed and aerobic conditions into stabilized organic product (Epstein,
1996); Humic substances (HS) refer to a mixture of soil organic matter resulting from
the decay of plant and animal residues. They have large impacts on soil composition and
overall soil improvement, resulting in beneficial effects on soil biological and
physiochemical environment changes as well as plant growth improvement.
Humic substances
HS can be applied as solid or liquid products extracted by various methods from
a wide variety of raw materials including lignites, peat, composts and organic wastes,
which determine the different physicochemical properties and application effects of HS
(Rose et al., 2014). HS typically contain three fractions on the basis of their solubility in
water under different pH conditions: fulvic acid, humic acid and humin (MacCarthy et
al., 1990): 1) fulvic acid (FA): the fraction of HS that is soluble in water under all pH
values; 2) humic acid (HA): the fraction of HS that is insoluble in water under acidic
conditions (pH < 2) but soluble at higher pH values (pH > 2); 3) humin: the fraction of
HS that is insoluble in water under any pH values. Based on the sequence of
classification, they are increasing in color intensity: light yellow and yellow brown for

3
fulvic acid, dark brown and grey black for humic acid, and black for humin; they are
also increasing in molecular weight (in Daltons, Da) and carbon content but decreasing
in oxygen content, degree of solubility and exchange acidity (the amount of total CEC
occupied by the acidic cations H+ and Al3+) (Rumpel et al., 1998). A study by Lobartini
et al. (1997) showed that humic acid fractions with different molecular weights (Da) had
minor differences in elemental composition of C and N, with carbon elements
accounting for 49% to 58% of the total composition, and nitrogen elements for 2.6% to
3.8%. By using infrared analysis, they also found humic acids had similar functional
groups and bonds regardless of the different Da fractions. These evidences indicate that
humic acid is composed of homogeneous fractions, which can ensure uniformity in its
application. Based on that, humic acid became the most widely studied material for soil
applications of HS, while only a few studies focused on fulvic acids.
Different raw materials can provide different HS components and properties,
including various beneficial effects on plant growth and soil properties (Chen and Aviad,
1990). They can be summarized as follow:
a. Improve seed germination rates
HS application increased water absorption and enhanced overall enzyme
activities in seeds, which led to an increase in respiration rate, and the energy released by
respiration could be utilized in embryo development and rapid germination (Chen and
Aviad, 1990). A study (Piccolo et al., 1993) tested the effects of coal-derived humic
substances on lettuce and tomato seed germination, and found the fresh weight of

4
seedlings increased with HS application in both crops, which was due to cell elongation,
increased water absorption and the uptake of HS in seedlings.
b. Stimulate root initiation and growth
These are the most significant impacts of HS. Canellas et al. (2002) investigated
the effects of HS isolated from earthworm compost and found that HS enhanced maize
(Zea mays L.) seedling root elongation and lateral root initiation. Nardi et al. (1994)
showed the roots of Nicotiana plumbaginifolia leaf explants were promoted when treated
with HS or IAA alone, but were inhibited when adding an auxin inhibitor (TIBA) with
HS or IAA. These studies concluded the root growth promotion was contributed by the
auxin-like activity of HS. It is important to note that the hormone-like fraction of HS
mostly comes from the low molecular weight (LMW) parts (< 5000 Da), which can
easily reach and interact with plasma membranes of plant cells (Nardi et al., 2002;
Varanini et al., 1993). By summarizing the outcomes of previous studies about the
uptake of radioactive labeled 14C-HS in plants, it showed that HS were absorbed by roots
quickly in the initial timeframe, then absorption slowed down. The activity of uptake
was promoted by increasing plant physiological metabolism and the solubility of HS
(Nardi et al., 2002). After being absorbed in plant cells, LMW-HS was also shown to
stimulate H+-ATPase (proton-pumping ATPase) activity in isolated oat plasma
membrane (Varanini et al., 1993). This generated the proton electrochemical gradient
across the plasma membrane which was essential to activate most of the ion and
metabolite transport (Morsomme and Boutry, 2000) and ultimately, enhance nutrient
acquisition in roots, and therefore generate positive functions for root growth.

5
c. Improve shoot growth and affect plant physiological performance
Promotion of root growth also leads to improvements in shoot growth, Tahir et
al. (2011) tested the effects of lignite-derived HS application on wheat (Triticum
aestivum L.) growth and nutrient uptake under greenhouse conditions; they found an
improvement in plant height, shoot weight and nitrogen uptake efficiency (NUE) at an
optimal HS concentration. Another group (Rose et al., 2014) summarized previous
research by using a random-effects meta-analysis and concluded that plant shoot and
root dry weight increased 22.4% and 21.6%, respectively due to HS application. The
increase of shoot dry weight appears to be due to increased mineral nutrient supply and
uptake in HS treated soil (Sharif et al., 2002). In addition to increasing plant biomass
accumulation, HS had been shown to affect some plant physiological performances like
enzymes activity associated with photosynthetic (Ferretti et al., 1991) and carbohydrate
metabolism of maize seedling leaves (Merlo et al., 1991). However, the effects of HS on
plant gas exchange have not been widely explored (Nardi et al., 2002), which gives a
potential aspect to emphasize in this study.
d. Improve soil structure and soil quality
The mechanisms by which HS change soil environment and quality are
controversial and not clearly understood. HS have been shown to have positive effects
on soil permeability, water-holding capacity and aeration (Chen and Aviad, 1990). The
presence of functional groups such as cellulose and polyols in HS (Vlčková et al., 2009)
alter the water uptake and holding capacity of soil particles (Brooks et al., 2004),
resulting in higher water retention. These functional properties suggest that HS

6
application may be a promising strategy for mitigating water-limited conditions. HS
have also been reported to increase cation exchange capacity (CEC), organic carbon
content, N and P concentration, and solubility of some micronutrients like Fe in the soil
(Sharif et al., 2002). HS can also enhance the ability of phytoremediation for some heavy
metals in contaminated soils like Cd, Cu and Pb. This response was due to the temporary
biological activity of metal-humic complexes, decreasing their transferable toxic effects
in the soil environment (Halim et al., 2003).
e. Enhance soil biological activity
In the soil microbial environment, studies by Gryndler et al. (2005) showed that
HS stimulated root colonization and production of extra-radical mycelium induced by
mycorrhizal fungi. The slow decomposition ability of HS can provide carbon and
nitrogen resources to microbes especially with limited nutrient levels; some microbes
can even use HS as electron acceptors for their oxidation to provide energy (Lovley et
al., 1996). Additionally, the long-term interaction between HS and microorganisms may
generate new HS (Kulikova et al., 2005), which provide extended benefits in soil quality
changes.
In summary, HS have positive impacts on plant-soil interactions, and the effects
on promoting root growth are more obvious than shoot growth (Chen and Aviad, 1990).
Besides, conventional soil tillage management that causes organic matter degradation
has negative effects on HS formation (Shepherd et al., 2001). So adding exogenous HS
as a soil amendment can reverse the degradation along with soil tillage while improving
soil properties (Rose et al., 2014). With these benefits and concerns, HS as soil

7
amendments have been widely studied on agronomic crops like wheat, maize, oat
(Canellas et al., 2002; Varanini et al., 1993; Tahir et al., 2011; Sharif et al., 2002;
Dunstone et al., 1988; Ferretti et al., 1991) and vegetable crops like tomato, celery and
lettuce (David et al., 1994; Ciarkowska et al., 2017; Hartz and Bottoms, 2010).
However, higher HS application rates can easily exacerbate the plight of micronutrient
deficiency by depleting the available pool for plant uptake (Rose et al., 2014), and finally
inhibit plant growth. Therefore, a suitable rate of HS application into soils is critically
important.
Water stress and deficit irrigation
Drought stress has cost $200 billion in losses from 1980 to 2013 in the U.S.,
which accounted for about 20% of total loss due to all other weather and climate
disasters (Smith and Matthews, 2015). Agriculture is a major activity that heavily
depends on water demand, and therefore has suffered the greatest damage from water
stress. Due to insufficient precipitation (available water from outside the soil) and low
soil water-holding capacity (available water from inside the soil), water deficit stress can
seriously affect plant morphology and physiology and therefore overall growth and
productivity. In order to decrease water losses, plants have unique mechanisms to cope
with deficit stress. For example, plant cell water potential is reduced and abscisic acid
(ABA) is accumulated, which induce stomatal closure, thereby decreasing transpiration
rate (Taiz et al., 2015). However, stomatal closure also decreases CO2 uptake, which will
inhibit leaf photosynthesis, cause the imbalance of free electrons and NADP+

8
dehydrogenase and leads to the generation of reactive oxygen species (ROS), which will
impede plant growth by oxidizing and damaging the normal functional cellular
constituents in plant cells such as proteins, DNA, RNA and lipids (Taiz et al., 2015).
Improving plant water use efficiency (WUE) as a potential solution to alleviate
worldwide water shortages, has become a paradigm for scientists. Deficit irrigation, the
application of water below sufficient crop-water requirements, without causing
significantly economic losses, is an important method to cope with limited water supply
and improve WUE, especially in arid or semi-arid regions of the world (Fereres and
Soriano, 2006). For example, based on a watermelon study of Leskovar et al. (2016),
suitable water stress achieved by deficit irrigation maintained plant performance and
improved plant water use efficiency, as well as forcing a surplus of vegetative growth to
be transformed into economic fruit growth, while severe stress significantly decreased
plant yield. It showed that appropriate deficit irrigation could become an essential tool in
agricultural production. But a successful deficit irrigation procedure is not easy to
accomplish, as it depends on accurate soil water content and proper irrigation scheduling
methods (Jones, 2004). In this study, in order to test the effects of deficit irrigation on
bell pepper growth, we implemented deficit irrigation in controlled environments
(growth chamber and greenhouse) based on soil water-holding capacity, and
uncontrolled environments (field) based on crop evapotranspiration (ET) demand. We
hope these studies will provide additional useful information when considering deficit
irrigation in agriculture.

9
Research questions
A large body of research reviewed the biological effects of HS on biota growth
(Kulikova et al., 2005), and concluded that HS were ideal modulators in adverse soil
environments such as drought, salinity and other abiotic stress conditions due to the
detoxifying ability of HS. However, there is a lack of understanding of short- or long-
term effects of HS on alleviating plant biological responses in water deficit scenarios,
such as the modification of leaf gas exchange and WUE. Within this framework, this
research is intended to address the following five questions, using bell pepper as a model
plant system:
a. Will HS added to soils at optimal rates promote plant morphological and
physiological responses and increase growth compared to control?
b. Do HS regulate the activity and solubility of major nutrients in soil?
c. Do HS applications improve the concentration and activity of soil
microorganisms, such as bacteria and fungi?
d. Can HS mitigate potential crop losses under water deficit conditions?
e. Do HS applied to different soil textures (sandy and clay) uniquely affect soil
properties, water content, nutrient levels, and plant growth?

10
CHAPTER II
BELL PEPPER GROWTH RESPONSES AND SOIL PROPERTY CHANGES TO
HUMIC SUBSTANCES AND DEFICIT IRRIGATION IN CONTROLLED
ENVIRONMENTS
Introduction
Peppers, which originated in Mexico and South America, are becoming popular
in people’s diet due to their various colors, flavor, spice and nutritional values (Villalón,
1981). Bell green pepper (Capsicum annuum L.), as one of the pepper types, has a high
economic value in agriculture. In 2014, the yield of green peppers is 16.7 t/ha with the
total production 32 million tons on a global basis, and the gross production value is more
than $30 billion all around the world (FAO, 2014). Due to the benefit prospects, the
potential application of HS on vegetable crops like bell pepper is becoming promising
and important.
HS can be applied as commercial solid or liquid products derived from soil and
water (Malcolm and MacCarthy, 1986). For practical field applications, the solid form
seems to be better than liquid due to less cost and potentially less leaching losses. In this
study, we focus on lignite-derived solid HS, and then use bell pepper as a model
vegetable crop and controlled environments as suitable growth conditions, to access and
test the HS effects on bell pepper morphology and physiology responses and soil
environmental changes at different irrigation levels. We hypothesize that through the
11
alteration in plant gas exchange, root growth and soil microbial activity, HS will mitigate
potential crop losses under water deficit conditions.
Approach
a. Growth environments and soil materials
Two studies were conducted in controlled environments growth chamber
(Conviron PGR15, Manitoba, Canada) and greenhouse at the Texas A&M AgriLife
Research Center at Uvalde, TX (29.21°N, 99.79°W). The growth chamber was set with a
ramping temperature from 20°C to 28°C and a ramping light intensity up to 500 µmol∙m-
2∙s-1 during the daytime for 16h, followed by constant 20°C without light during the night
for 8h. The environmental parameters inside the greenhouse were monitored by a control
system Wadsworth (Arvada, CO) and recorded by a weather station WatchDog (Spectrum
Technologies Inc., Aurora, IL). During the greenhouse experiment, the average daily light
integral and temperature were 11.0 mol∙m-2∙day-1 and 29.4°C, respectively.
In the first growth chamber experiment, the short-term impacts of HS application
on plant seedlings were assessed in a sandy soil. A following greenhouse experiment
was conducted to assess the mid-term effects of HS on plants as well as soil among two
types, sandy and clay. The basic soil properties are shown in Table 1. Lignite-derived
solid HS (Novihum Co., Dresden, Germany, Table 2) was used as a soil amendment
mixed with soil at a rate of 0.5 kg∙m-2.

12
b. Plant material, soil amendment and irrigation treatments
Bell pepper (Capsicum annuum cv. Revolution) seeds were directly sown into 2.5
L pots (15 cm diameter, 15 cm height) filled with sandy soil previously amended with 8.8
g∙pot-1 HS at the beginning of the growth chamber experiment. At the initial stage of the
greenhouse experiment, 8-week old bell pepper seedlings grown in 200-cell trays (2.7 ×
2.7 × 7.2 cm3 per cell) were transplanted into 10 L pots (25 cm diameter, 20 cm height)
filled with sandy and clay soil previously amended with 24.5 g∙pot-1 HS. Control pots
filled with soil without HS amendment were included.
Three deficit irrigation levels -- severe stress (20% soil water-holding capacity,
WHC), mild stress (40% WHC) and moderate stress (60% WHC), with a well-watered
(80% WHC as no stress) treatments were initiated 4 weeks after direct seeding in the
growth chamber and 1 week after transplanting in the greenhouse. Pots were weighed daily
and irrigation management was conducted at different times and frequencies based on
daily soil moisture loss in each treatment. Plants were fertilized using macro-fertilizer 3N-
1P-2K (CNS17, Botanicare, Chandler, AZ) and micronutrients (Valagro Brexil Multi,
Italy) during the growth period. Standard bell pepper management practices and pest
control were applied in both environments.
c. Plant growth response measurements
During the growing period, plant morphological and physiological measurements
were conducted after imposing water-deficit stress. Plant height and stem diameter were
measured using ruler and digital caliper (VWR, Radnor, PA); rate of photosynthesis (Pn),
stomatal conductance (gs) and transpiration (E) were measured with a portable

13
photosynthesis system (LI-6400 XT, LI-COR Biosciences, NE) and chlorophyll content
index (SPAD) with a chlorophyll meter (SPAD-502 Plus, Minolta, Japan). These
parameters were collected at biweekly intervals in the growth chamber for 4 weeks which
represented the bell pepper seedling stage, and the experiment ended 10 weeks after direct
seeding; measurements were taken at monthly intervals in the greenhouse for 3 months
which represented the bell pepper vegetative stage, flowering stage and mid-harvest stage,
respectively, and the experiment ended 4 months after transplanting.
At the end of the experiment, plant leaf, shoot and fruit dry weight were determined
as above-ground biomass after oven drying at 75°C for 48 hours. For root measurements,
in the growth chamber, whole roots were carefully washed and collected; while in the
greenhouse, partial root samples were taken out with a soil auger (0-15 cm depth), and
carefully collected. Root length, surface area and average diameter were scanned using an
EPSON V700 scanner (Epson, Japan) and measured with a WinRHIZO software (V5.0,
Regent Instruments, Canada), while root dry weight was determined after oven drying at
75°C.
d. Soil chemical and biological analysis
At the end of the growing period, in the greenhouse experiment, a soil auger with
diameter 2.5 cm was used to collect soil cores within 0-15 cm depth in the pots. About
50% of the fresh soil samples were split into two parts. The first part was immediately
shipped to Earthfort Lab (Corvallis, OR) for microbial activity analysis, and the rest part
was used for soil respiration (Soil CO2-Burst) (Haney et al., 2008) test with SOLVITA
soil respiration box (Woods End Laboratories, Mt Vernon, ME). Total and active bacteria,

14
total and active fungi were obtained by following staining procedures (Stamatiadis et al.,
1990), direct microscope observation and other procedures provided by Babiuk and Paul
(1970), Van Veen and Paul (1979), and Ingham and Klein (1984).
The remaining soil samples were dried at 75°C in the oven, then ground and sieved
to 2 mm, and shipped to the Soil, Water and Forage Testing Laboratory (Texas AgriLife
Extension Service, College Station, TX) for chemical analysis. Soil pH and electrical
conductivity were measured in a 1:2 soil: water ratio extract (Rhoades, 1982); nitrate-
nitrogen (NO3-N) was extracted using 1 M KCl solution (Keeney and Nelson, 1982) and
determined by spectrophotometry. Soil P and K were extracted using an extractant
evaluated by Mehlich (1978) and then determined by an ICP-MS.
e. Statistical analysis
A two-way factorial completely randomized design with two soil amendments
(Control and HS) and four irrigation levels (20%, 40%, 60% and 80% WHC) replicated
six times was used in growth chamber experiment. The same experimental design, with
two soil types (sandy and clay) was used in the greenhouse experiment. Plant morphology
and physiology performances were analyzed by repeated measures analysis of variance
using Proc Mixed in SAS (Version 9.4, SAS Institute, Cary, NC); plant biomass
accumulation, root and soil traits were analyzed using the ANOVA; while multiple
comparisons of means were analyzed using the least significant difference (LSD) at α =
0.05. A principal component analysis (PCA) was used to evaluate the relationship between
selected variables and treatments using the prcomp function in R (Version 3.4.0).

15
Results
a. Plant growth responses to humic substances and deficit irrigation
Based on the results of repeated measures analysis of variance (Table 3, as the
main purpose is to test the time effects, the P-values for factor soil amendment,
irrigation and their interaction were not shown), different irrigation levels had
significantly different effects on plant morphological and physiological traits within
different growth period in both controlled environments. In terms of soil amendment, it
had significantly different effects on plant stomatal conductance and transpiration among
different seedling stage in the growth chamber, and the rate of photosynthesis and
transpiration in different growth period in the greenhouse. In addition, time significantly
affected the effects of soil amendment under different irrigation levels on stomatal
conductance (P-value = 0.030) in greenhouse sandy soil, and transpiration (P-value =
0.024) in clay soil.
In the seedling or vegetative period, HS significantly increased plant height and
stem diameter, and also promoted plant chlorophyll content (SPAD) in sandy soil, but
the results were opposite in clay soil (Table 4). Interestingly, during the seedling stage in
growth chamber, HS application significantly decreased plant stomatal conductance
while maintaining photosynthesis the same level as control; but in the greenhouse,
stomatal conductance as well as plant photosynthesis were both decreased in plant
vegetative stage regardless of the soil types as a result of HS application, and these
effects lasted even longer in clay soil (flowering stage). Leaf gas exchange decreased
under severe and mild water stress, and that reaction was further accelerated with HS

16
application especially in sandy soil (data not shown), yet the HS-related reduction in
stomatal conductance and photosynthesis appeared less evident in late plant growth.
Reduced gas exchange resulted in higher plant morphological performances in sandy soil
but lower performances in clay soil, indicating that HS had different behaviors in
different soil types.
In the growth chamber experiment, HS increased plant above-ground dry weight
(Figure 1 a) compared to the control, especially significant in mild, moderate water
stress and well-watered conditions. In addition, HS treated pots showed a set of small
fruits, indicating an early promotion of the reproductive development. Despite
differences in early plant growth between HS and control, no significant difference was
found in the final dry matter accumulation of plants grown in greenhouse for 4 months
(Figure 1 b, c); there was only a slight increase due to HS application occurring in sandy
and clay soil, under moderate water stress and well-watered conditions. Under severe
and mild water stress, HS slightly decreased plant biomass in sandy soil. Besides the
relatively insignificant effects on bell pepper above-ground biomass, HS showed
remarkable promotions in root parameters (Figure 2), especially in root length, surface
area and root dry weight under moderate water stress (60%) and well-watered (80%)
conditions in both soil types. HS also increased root average diameter under severe
water stress (20%) in the growth chamber sandy soil and under well-watered in the
greenhouse clay soil environments.
Water deficit treatments had significant effects on plant morpho-physiological
traits after irrigation treatment started. Severe and mild water stress significantly

17
decreased plant shoot and root performance, biomass accumulation regardless of soil
types. Moderate water stress maintained and even promoted plant growth compared to
well-watered treatment. Irrigation levels also differentially impacted plant shoot and root
growth on different soil types in greenhouse. For example, well-watered treatment
decreased plant above-ground biomass accumulation in sandy soil but increased it in
clay soil compared to deficit stress (Figure 1 b, c); similar effects were observed for root
growth, whereas well-watered treatment decreased root parameters in sandy soil but
increased them in clay soil especially compared to severe and mild deficit water stress
(Figure 2 b, c).
b. Soil environmental changes humic substances and deficit irrigation
In the greenhouse under clay soil condition, HS slightly decreased soil pH, but
significantly increased soil electrical conductivity (EC) by 25.6% and NO3-N content by
68.7%, and decreased K content by 10.0% (Tables 5). In sandy soil, HS significantly
increased soil EC in severe and mild water stress (20%, 40%), and also increased K
content regardless of irrigation levels. The K content change indicating the response of
K to HS depends on soil type. HS significantly increased soil total bacteria by 11.8% in
sandy soil and by 43.8% in clay soil, but decreased total fungi by 30.9% in clay soil.
There were no significant differences between HS and control in soil respiration, active
bacteria and fungi population. Severe and mild deficit irrigations significantly decreased
soil pH but they increased soil electrical conductivity and N, P, K content in both soil
types. The increase in nutrient retention might be due to the reduced irrigation frequency
and less nutrient leaching. In addition, low irrigation (20%, 40%) decreased soil

18
respiration and soil active bacteria population especially in clay soil; furthermore, these
two parameters were significantly positively correlated (r = 0.58 with P-value 0.003).

19
Table 1. Sandy and clay soil basic properties
Table 2. Composition of humic substances (HS) soil amendment
pH Density Carbon Nitrogen Ash Fulvic acid Humic acid Humin
g·cm-3 % % % % % %
7.7 0.6 65.8a 5.78 5.2 0.7 56.7 24.1 a All percentages are in relation to dry matter of the HS material
Soil type Sand Clay Silt Density WHC a pH EC b Nitrate-N Phosphorus Potassium
% % % g·cm-3 g·cm-3 µmhos·cm-1 mg/kg mg/kg mg/kg
Sandy 94 4 2 1.61 0.48 5.9 81 0.3 17 62
Clay 33 37 30 1.26 0.73 7.9 384 21 59 900 a WHC: water holding capacity; b EC: electrical conductivity

20
Table 3. Time affected source of variations and P-values from repeated measures analysis of variance on plant height (PH), stem diameter
(SD), chlorophyll content index (SPAD), rate of photosynthesis (Pn), stomatal conductance (gs) and transpiration (E) of bell pepper grown
in growth chamber (GC) and greenhouse (GH) environments
Environment Source of variation a PH SD SPAD Pn gs E cm mm μmol·m-2·s-1 mol·m-2·s-1 mmol·m-2·s-1
GC sandy soil SA × T 0.285 0.466 0.002 0.958 0.015 0.038
IR × T < 0.001 0.002 < 0.001 < 0.001 < 0.001 < 0.001
SA × IR × T 0.362 0.751 0.118 0.751 0.693 0.403
GH sandy soil SA × T 0.015 0.379 0.347 0.023 0.170 0.036
IR × T < 0.001 < 0.001 0.007 < 0.001 < 0.001 < 0.001
SA × IR × T 0.677 0.229 0.156 0.121 0.030 0.559
GH clay soil SA × T 0.021 0.134 0.152 0.001 0.101 0.044
IR × T 0.001 < 0.001 < 0.001 < 0.001 < 0.001 < 0.001
SA × IR × T 0.884 0.180 0.882 0.123 0.071 0.024 a SA: soil amendment; IR: Irrigation; T: time effects of biweekly interval in growth chamber and monthly in greenhouse.

21
Table 4. Time-course effects (P-values) of HS on plant height (PH), stem diameter (SD), chlorophyll content index (SPAD), rate of
photosynthesis (Pn), stomatal conductance (gs) and transpiration (E) under different controlled environments
Environment Time a PH SD SPAD Pn gs E cm Mm μmol·m-2·s-1 mol·m-2·s-1 mmol·m-2·s-1
GC sandy soil Week 2 < 0.001 + b < 0.001 + < 0.001 + 0.742 0.047 - c 0.059
Week 4 < 0.001 + < 0.001 + 0.092 0.811 0.079 0.309
GH sandy soil Month 1 0.002 + 0.015 + 0.353 0.001 - < 0.001 - 0.006 -
Month 2 0.696 0.193 0.284 0.767 0.755 0.522
Month 3 0.725 0.021 + 0.738 0.710 0.283 0.704
GH clay soil Month 1 0.071 0.027 - 0.008 - 0.011 - 0.037 - 0.077
Month 2 0.065 0.633 0.223 0.016 - 0.036 - 0.030 -
Month 3 0.336 0.576 0.843 0.537 0.679 0.864 a Time was shown biweekly interval in growth chamber and monthly in greenhouse after imposing different irrigation treatments; b +
indicated significantly increased, c - indicated significantly decreased compare HS to control at α = 0.05 according to LSD test.

22
Table 5. Sandy and clay soil final chemical and microbial properties as affected by soil amendment (SA) and irrigation (IR) treatments in
greenhouse (GH) environment. Soil chemical properties including pH, electrical conductivity (EC), nitrate-nitrogen (NO3-N), phosphorus
(P) and potassium (K); microbial properties including soil respiration (CO2-C), active bacteria (AB), total bacteria (TB), active fungi (AF)
and total fungi (TF)
Environment
pH EC NO3-N P K CO2-C AB TB AF TF
μmhos·cm-
1
mg/kg mg/kg mg/kg mg/kg µg·g-1 µg·g-1 µg·g-
1
µg·g-
1
GH
sandy
SA Control 8.1 271 15.0 264 41 b 4.17 27.12 1020 b * 6.71 433
HS 7.9 265 10.2 259 50 a 4.86 28.68 1140 a 7.56 388
IR 20% 7.6 c 396 a 38.1 a 314 66 a 2.72 b 26.43 1069 5.07 352 40% 7.9 b 310 b 10.6 b 333 54 a 4.25 b 25.68 1098 8.48 352 60% 8.3 a 191 c 1.2 b 213 31 b 4.17 b 30.22 1104 9.92 437 80% 8.2 a 176 c 0.5 b 186 31 b 6.92 a 29.25 1048 5.08 500
P-value SA 0.074 0.796 0.263 0.923 0.047 0.357 0.565 0.046 0.577 0.483 IR < 0.001 < 0.001 < 0.001 0.152 < 0.001 0.007 0.580 0.881 0.082 0.299 SA × IR 0.886 0.0188 0.062 0.268 0.517 0.104 0.197 0.202 0.869 0.649
GH clay SA Control 8.1 941 b 57.2 b 181 881 a 82.72 35.95 828 b 13.71 243 a HS 8.0 1182 a 96.5 a 172 792 b 80.01 33.33 1191 a 13.22 168 b
IR 20% 8.0 b 1235 a 128.9 a 195 ab 1109 a 60.75 bc 31.38 bc 1112 10.67 159 40% 7.9 b 1441 a 166.7 a 213 a 1126 a 54.97 c 30.53 c 1078 11.89 209 60% 8.2 a 781 b 6.6 b 140 c 578 b 100.90 ab 37.57 ab 945 11.44 236 80% 8.1 a 788 b 5.2 b 158 bc 534 b 108.83 a 39.07 a 904 19.87 218
P-value SA 0.207 0.004 0.015 0.554 0.031 0.849 0.261 0.005 0.880 0.014 IR < 0.001 < 0.001 < 0.001 0.011 < 0.001 0.031 0.035 0.513 0.177 0.260
SA × IR 0.762 0.154 0.095 0.770 0.547 0.723 0.289 0.245 0.608 0.421
* Different letters within column from the same factor indicate significant differences at α = 0.05 according to LSD test.

23
Figure 1. Bell pepper above-ground dry weight accumulation (± standard error) in the growth
chamber sandy soil (a), greenhouse sandy soil (b) and clay soil (c) for soil amendment and
different irrigation levels.
* indicated significantly differences between HS and control at α = 0.05 according to LSD test.

24
Figure 2. Bell pepper root dry weight, length, surface area and average diameter (± standard
error) in the growth chamber sandy soil (a), greenhouse sandy soil (b) and clay soil (c) for soil
amendment and different irrigation levels.
* indicated significantly differences between HS and control at α = 0.05 according to LSD test.

25
Discussion
The application of soil amendments is ultimately aiming to promote plant growth
and minimize yield loss due to unsuitable environments. As organic matter derived soil
amendment, HS have two positive influences: improve biota growth and mitigate some
abiotic stress due to the detoxifying nature of HS (Kulikova et al., 2005). This discussion
will combine the results from the growth chamber and greenhouse, and analyze the
potential impacts of HS on plant and soil response variables under different environment
conditions.
a. HS improved biota growth
In the growth chamber study, the promotive responses of HS in plant height,
stem diameter, chlorophyll content (SPAD) and plant biomass during seedling growth,
agree with the results of Azcona et al. (2011), who used sewage sludge derived HS on
pepper plant (Capsicum annuum L. cv. Piquillo) in greenhouse conditions. The increase
in plant chlorophyll content suggests that HS treated plants had an increased nutrient
absorption ability, particularly in sandy soil during early growth. Although similar
promotive effects were measured for some variables in the greenhouse, total plant
above-ground biomass was minimally affected by HS. Instead, plant roots were highly
affected by HS application regardless of the growth environments and soil types -- it has
been reported that HS have auxin-like activity, reaching and interacting with the plasma
membrane of plant cells (Varanini et al., 1993; Nardi et al., 2002), and therefore
conferring functional benefits for root growth. HS were also shown to stimulate H+-
ATPase (proton-pumping ATPase) activity in plasma membrane of maize (Canellas et

26
al., 2002) and isolated oat (Avena sativa L.) roots (Varanini et al., 1993), these ATPases
generate a proton electrochemical gradient across plasma membrane that is essential to
complete most ions and metabolite transport process for nutrient acquisition in roots
(Morsomme and Boutry, 2000). Moreover, future understanding of the potential
mechanism of auxin-like activity of HS and the study about how to transfer the
beneficial outcomes from root to shoot growth is still needed.
HS have been considered to be a nutrient carrier, with beneficial impacts on soil
nutrient supply and retention, which are the basis for plant growth. However, these
effects appear to differ across soil types as reported by Ciarkowska et al. (2017). That
study found HS increased shoot and root biomass of celery and leek due to increased soil
available nutrients, and they also observed that the mean biomass was higher in medium
and fine textured (silt to clay) soil compared to coarse textured (sandy) soil with poor
nutrient retention capacity. In this study, although the above-ground biomass of bell
pepper was not significantly affected by HS application, the root biomass was indeed
improved by HS, possibly due to an increase in soil EC and NO3-N content. The increase
of root biomass by HS was only about 10% in sandy soil, which was much lower
compared to 80% in clay soil. Moreover, roots grew better in the fine texture (clay) than
coarse textured (sandy) soil, especially at moderate deficit and well-watered conditions.
It is expected that HS might have an effective ability to enhance the existing poor fertile
quality of sandy soil: Valdrighi et al. (1996) showed that compost derived HS
significantly increased chicory biomass in sandy soil, especially when applied at a higher
rate (4000 mg∙kg-1) as in aqueous solutions. However, in this study, except for a notable

27
biomass promotion in the growth chamber sandy soil experiment, the effects of HS on
sandy soil were not significant in the mid-term greenhouse experiment. The lack of
response may be explained by three possible scenarios: 1) the sandy soil we used could
not provide sufficient nutrients to plant growth when compared to nutrient-rich clay soil;
2) the application rate of HS was not high enough to bring on significant growth changes
in sandy soil especially for a mid- to long-term growth; however, we need to be careful
for the application rate because extra HS beyond an optimal level may deplete soil
nutrient by “stealing” the nutrient cations and made them unavailable for root uptake,
and ultimately decreasing plant growth (Chen and Aviad, 1990); 3) the diverse nature of
HS caused inconsistent effects on different soil conditions, as previously reported by
Kulikova et al. (2005).
Soil microbial activity of bacteria and fungi is a key factor that influences plant
productivity, changes plant-water relations, affects soil properties, and regulates
decomposition of organic material and nutrient cycling (Neher, 1999). The total bacteria
and fungi population represent soil nutrient cycling capacity, while active bacteria and
fungi population represent the part that currently metabolize organic compounds to
provide nutrients to plants. A large population of microbial community was reported to
decompose HS as nutrient and energy resources (Lovley et al., 1996; Kulikova et al.,
2005), which revealed a potential ability of HS to improve the long-term soil microbial
population. The alteration of microbial growth from HS was a key response to reveal soil
health, as well as plant-microbial interactions. In this study, HS increased soil total
bacteria in the greenhouse environment regardless of soil types. HS also decreased total

28
fungi population in clay soil, resulting in a lower fungi-to-bacteria (F/B) ratio (0.14)
compared to control (0.29). It had been reported F/B ratio changed rapidly as a result of
diverse soil managements, especially the soil with higher N inputs lowered F/B ratio (De
Vries et al., 2006). In our study, a higher NO3-N retention was observed in clay soil as a
result of HS application, and it was negatively correlated with the F/B ratio (r = −0.47
with P-value 0.02). In addition, a survey study across forest, cultivated and livestock
pasture soil showed bacteria population was highly associated with soil pH while fungi
population was associated with current soil nutrient status (Lauber et al., 2008).
Moreover, soil with higher F/B ratio was hypothesized to have more sustainability
because the activity of fungi was positively correlated with soil C content (Bailey et al.,
2002). However, in our study, as an organic-amendment, HS didn’t show a positive
effect on F/B ratio. Instead, an increase in total bacteria was observed with increased soil
EC and NO3-N content in clay soil. When Hartz and Bottoms (2010) tested five
commercial HS, they found the effects of HS were not consistent, and most HS were
ineffective in promoting soil nutrient retention as well as microbial activity. Therefore,
although the results were contrary to expectations, the decline in F/B ratio doesn’t imply
a negative impact of HS on plant growth, since HS didn’t reduce the plant above-ground
development and even significantly promoted plant root growth; moreover, the results
only showed a mid-term effects from HS, a long-term test is still required for a better
understanding. The specific mechanism of HS impact on bacteria and fungi community
is also needed to be examined, with the consideration of different raw materials derived

29
HS, application rate and diverse environments, in order to achieve the best beneficial
effects of HS application on biota growth.
b. HS mitigated water limited stress
Due to the special structural features, HS are able to bind toxic organic and
inorganic compounds that exist in polar and hydrophobic environments, thereby
reducing their bio-availability and toxicity (Kulikova et al., 2005). As a result, HS were
commonly used for pollutants detoxification (Bollag and Myers, 1992; De Paolis and
Kukkonen, 1997). This is one of the key functions by which HS mitigate abiotic stress
conditions. In the current study, we were interested in the time-course effects of HS on
mitigating water stress, because water stress tends to occur over a short period in non-
suitable environments. In order to decrease water loss, plants have unique responses to
cope with deficit stress. For example, plant cell water potential is reduced and abscisic
acid (ABA) is accumulated, which induce stomatal closure, thereby decreasing
transpiration rate (Taiz et al., 2015). However, stomatal closure also decreases CO2
uptake, which will inhibit photosynthesis and potentially cause significant crop yield
losses. In our study, we found that HS can mitigate short-term severe or mild water
stress by reducing plant transpiration and moisture loss (increase water use efficiency) in
plant seedling and vegetative development stages, especially in the soil with a low
water-holding capacity (sandy). Although these reductions were accompanied by
reduced photosynthesis and showed inconsistent plant morphology performance in
different soil types, the final above-ground biomass accumulation was not much
different. HS seemed to cause plants become more sensitive to water stress, with a rapid

30
and positive response from root growth -- HS had short- to mid-term influences for
stimulating plant root growth under moderate water stress, which was critical for plant
water and nutrient absorption, as well as for mid-term non-severe stress tolerance.
Similarly, an early study by Dunstone et al. (1988) found HS reduced wheat stomatal
conductance and transpiration. In that study, the conductance of wheat leaf sprayed with
liquid fulvic acid solution was reduced by more than 50% compared to control, but the
effects only lasted for a short period and was mainly occurring on well-watered plants,
not on dry conditions. A study by Azcona et al. (2011) found HS increased bell pepper
gas exchange, which is in contrast to the findings in our study. More likely, a possible
reason for the differential response is associated with the nature and properties of HS,
since they used compost sludge derived HS. In addition, they used soilless medium
under optimal irrigation conditions, and didn’t test the responses under water deficit
stress. Therefore, these findings illustrate that HS-based soil amendment can
differentially affected bell pepper plant performance based on specific soil moisture
levels and soil textural types.
Besides the reduction in leaf gas exchange, water stress will also cause the
imbalance of free electrons and NADP+ dehydrogenase and leads to the generation of
reactive oxygen species (ROS), which will impede plant growth by oxidizing and
damaging the normal functional cellular constituents in plant cells such as proteins,
DNA, RNA and lipids (Taiz et al., 2015). In addition to the toxin-binding property and
the ability to alter leaf gas exchange, with the phenolic function group as electron donor,
HS also have an antioxidant capacity (Aeschbacher et al., 2012) to scavenge ROS

31
generated by plants under water stress, which provides a new scope for future studies
about the effects of HS on ameliorating abiotic stress conditions.
c. Relationship between plant, soil responses and environmental factors
Principal component analysis (PCA) was used to explore the differences or
associations between main environmental factors (soil amendment, deficit irrigations) by
soil types (Figure 3). Since the most plant and soil responses from 80% and 60% WHC
irrigation were similar, we combined these two irrigations as a high irrigation level,
while those of 40% and 20% WHC were combined as a low irrigation level. In sandy
soil, the first and second components explained 89% of the variability. PC1 accounted
for 64% variance, which was more contributed by soil chemical variables, and less by
soil microbial and plant biomass variables. It distinguished the difference between low
and high irrigation -- low irrigation tended to associate with soil nutrient retention (N, P,
K, EC), while high irrigation was highly related with plant growth and soil active
microbial population, as well as soil pH; PC2 accounted for 25% variance, which was
shaped by plant biomass, soil respiration, active fungi and total bacteria. It only
differentiated the impacts of HS on low irrigation (HS-L versus C-L) -- HS was
positively associated with soil biota activity but negatively associated with plant biomass
accumulation, while there was no clear difference on high irrigation. In clay soil, the first
and second components explained 92% of the variability. PC1 accounted for 76%
variance, which was most attributed by every selected variable, except a slight
contribution from soil total bacteria and fungi. It featured the effects of irrigation levels,
which was similar to sandy soil. Additionally, the application of HS in high irrigation

32
soil tended to negatively associate with total bacteria (TB) population; PC2 accounted
for 16% variance, which was mainly shaped by soil total microbial population and plant
root biomass. It differentiated the effects of HS regardless of irrigation levels -- HS was
positively related with plant root growth and total bacteria but negatively related with
total fungi (TF) population. A potential explanation for the negative relationship
between HS and TB in PC1 and TF in PC2 especially under the high irrigation
conditions is the soil with higher clay content and higher field water-holding capacity
tends to have a lower decomposition rate of organic carbon (Xu et al., 2016), which
provides less nutrient sources for fungi and bacteria populations to consume.
In both soil types, plant root biomass accumulation was highly positively
correlated with soil pH but negative correlated with soil N, P, K content, soil respiration
was positively correlated with active bacteria and fungi, as well as soil pH. There was a
negative correlation between total or active fungi population with N content as
previously mentioned in the results, additional N fertilization decreased diversity of
fungi by altering plant carbon inputs and reduced microbial biomass, which caused
declined soil CO2 emissions (Treseder, 2008; Allison et al., 2007). This indicates that the
balance between nitrogen input and the activity of microorganism community need to be
carefully controlled. Interestingly, we found soil active microbial populations had
profound influences on plant biomass accumulation especially the active bacteria (AB):
AB had positive correlation with plant above-ground and root dry weight regardless of
soil types, while active fungi performed differently in different soil types -- negative in
sandy soil, positive in clay soil.

33
All the information from PCA provides three possible future directions when
considering new HS research: 1) the decomposition rate of HS in different soil types and
irrigation levels, and its relationship with soil total and active microbial population; 2)
the activity of different species of soil fungi that are affected by HS and different soil
nitrogen content, and their relationship with plant biomass or crop yield in different soil
types; 3) the population of active bacteria that is affected by HS, and its relationship with
plant biomass or crop yield under different abiotic stress conditions.
Figure 3. The principal component analysis (PCA) of the relationship between selected variables
and different environmental factors in the greenhouse sandy (a) and clay soil (b) experiment.
Selected variables were displayed by arrows and included plant biomass parameters: above-
ground dry weight (AGDW) and root dry weight (RDW); and soil parameters: soil pH, electrical
conductivity (EC), nitrate-nitrogen (N), available phosphorus (P), available potassium (K), soil
respiration (SR), total bacteria (TB), active bacteria (AB), total fungi (TF), active fungi (AF).
Environmental factors were displayed by filled grey circles and included two parts separated by
dashes: the first part shows control (C) or humic substances (HS), the second part shows high
irrigation level (H) or low irrigation level (L).

34
CHAPTER III
BELL PEPPER GROWTH RESPONSES AND SOIL PROPERTY CHANGES TO
HUMIC SUBSTANCES AND DEFICIT IRRIGATION IN FIELD CONDITIONS
Introduction
In the studies under controlled environments, we found that HS have an ability to
improve biota growth from plant and soil, and have potential to mitigate deficit stress.
That study also found that soil texture greatly influenced the effects of HS application.
However, since field environmental conditions are difficult to predict, we expect that
plant responses to field application of HS will be significantly different from those in
growth chamber and greenhouse experiments. In order to test the long-term effects and
potential application of HS, field experiments were conducted for two years at two
Texas locations with different soil types.
Unlike the controlled environment, in the field, water deficit stress was imposed
based on weather conditions. Evapotranspiration (ET) based approach is a widely used
technique in agricultural practices to quantify the water consumption by crops, and
therefore this method was used in our water deficit studies. The basic parameters to
determine a particular crop ET (ETc) are reference ET (ET0) and crop coefficient (Kc)
(Allen et al., 1998). ET0 is obtained from a reference grass growing surface with
adequate irrigation, and the change of ET0 is only affected by climatic factors; while Kc
is changed and acquired according to different crop types, growth stages and other crop
characteristics. By multiplying these two parameters we can obtain the standard ETc or

35
evapotranspiration rate for varied crops, which represents the daily water loss from soil
as well as the water requirement by the crops (Allen, 2000). Therefore, water deficit
treatments can be achieved by multiplying ETc with a deficit percentage, and set the
daily cumulative results as reference to regulate the irrigation schedule in field practices
and compensate the deficit water required. The combination of HS application and ET-
based deficit irrigation was used in two field studies, with adjustments based on
precipitation and other field conditions such as percentage of covered soil with plastic
mulch and the flow rate from drip tape.
Approach
a. Growth environments and soil materials
The field experiments were conducted in 2016 and 2017 for two growth seasons
at two Texas A&M AgriLife Research and Extension Centers: Uvalde, Texas (29.21° N,
99.79° W) represented by a clay soil type; and Weslaco, Texas (26.16° N, 97.99° W)
represented by a sandy soil type. The climatic conditions such as temperature, relative
humidity, daily light integral and precipitation for both locations are shown in Figure 4.
During the experimental period, the seasonal mean temperature, relative humidity, daily
light integral and total precipitation were 23°C, 73%, 66 mol·m-2·day-1 and 426 mm,
respectively in 2016 Uvalde; 26°C, 67%, 86 mol·m-2·day-1 and 210 mm, respectively in
2017 Uvalde; 26°C, 72%, 70 mol·m-2·day-1 and 155 mm, respectively in 2016 Weslaco;
and 30°C, 72%, 88 mol·m-2·day-1 and 126 mm, respectively in 2017 Weslaco. The basic
surface soil properties (0-20 cm depth) from Uvalde and Weslaco are also shown in

36
Table 6. Lignite-derived HS from the Novihum company (Germany) was used as soil
amendment, by mixing with field soil at the rate of 5 t/ha.
Figure 4. Weather data from Uvalde and Weslaco, TX from Aug 2016 to Aug 2017.
Letter “S” indicates the start time of the experiments (after transplanting), letter “E” indicates the
end time of the experiments (after final harvest).

37
Table 6. Basic soil properties from Uvalde and Weslaco, TX
b. Plant material, soil amendment and irrigation treatments
Bell pepper seeds (Capsicum annuum cv. Revolution) were sowed into 200 cells
trays (2.7 × 2.7 × 7.2 cm3 per cell) for 7-8 weeks growth at a commercial nursery
(Speedling, Alamo, TX). After transplants reached the mature standard size, 120 pepper
transplants were established in a 6 m × 6 m block previously amended with HS at the
rate of 5 t/ha. HS were first evenly sprayed on the surface of the soil, then were evenly
mixed with the ground soil (0-20 cm) by using a tractor. Each block contained 3 rows (1
center row, 2 guard rows) with 2 lines per row and 4 replicates. The rows spaced 2 m
apart, the plants grown in a row were 0.3 m apart in distance. Control in absence of HS
was included. Drip irrigation system was installed 10-15 cm below the soil surface. Soil
moisture sensors (EC5, Decagon devices, WA, USA) were installed at 15 and 30 cm
depth to assess daily moisture variation. Standard bell pepper management practices
were followed including fertilization, weeding, trellis, pest and disease control.
In both locations, two different experiments were conducted. The first was aimed
to test the residual long-term effects of HS application on plant-soil relationships, so a
two-years trial was conducted without replenishing HS in the field. The second
experiment was aimed to verify the first-year effects of HS application, so the repeat
Soil
properties
Sand Clay Silt pH EC NO3-N P K Ca2+ Mg2+
% % % µmhos/cm mg/kg mg/kg mg/kg mg/kg mg/kg
Uvalde 28 47 25 8.2 338 18 73 776 12378 335
Weslaco 63 25 12 7.9 480 42 29 320 3687 242

38
one-year trial was also conducted in the same environmental location, but in a new field
and with a new HS application. We separately named the experiments as year-1 (2016),
year-2 (2017, same field location as year-1) and new year-1 (2017).
Bell peppers were transplanted to the field and subjected to four irrigation levels:
a well-watered, 100% of evapotranspiration (ET) demands and three water deficit
irrigation treatments, moderate stress 75% ET, mild stress 50% ET and severe stress
25% ET demands. The irrigation rate was determined by dynamically changing the Kc of
green bell pepper following specific phenological stages: the initial growth and
development stages was 60 days with a Kc ini of 0.6; the middle growth stage was 40 days
with a Kc mid of 1.15; the final growth stage was 20 days with a Kc end of 0.9 (Allen et al.,
1998). Irrigation was provided based on calculated volumes of application, using the
respective proportion of 100% ET (base reference). Different volumes of applications
for four irrigation levels were adjusted by time, for example 12 hours irrigation for the
well-watered, 3 hours for the severe deficit treatment. These were reflected by dynamic
soil moisture changes, with the percentage of volumetric soil moisture from high
irrigation treatment (100% ET) having higher values but changing rapidly, especially in
15 cm depth as compared to 25%ET (Figure 5).
For year-1 experiments in both locations Uvalde and Weslaco in 2016, all four
irrigation levels were conducted. Since we found similar responses between W1 and W2,
W3 and W4 in year-1, for year-2 and new year-1 experiments in 2017, we decided to use
only two irrigation levels, a well-watered (100% ET demands) and a mild deficit (50%
ET demands) irrigation treatments.

39
Figure 5. Volumetric soil moisture data in Uvalde, TX from Aug to Dec 2016. Irrigation levels
were imposed based on crop-evapotranspiration (ET) demand.
c. Plant growth response measurements
Regular measurements were conducted on pepper plants after imposing water-
deficit stress: plant height and stem diameter were measured using ruler and digital
caliper (VWR, Radnor, PA); photosynthesis rate (Pn), stomatal conductance (gs) and
transpiration (E) were measured with a portable photosynthesis system (LI-6400 XT, LI-
COR Biosciences, NE); and chlorophyll content index (SPAD) was measured using a
chlorophyll meter (SPAD-502 Plus, Minolta, Japan). The parameters were collected on
monthly intervals for 2 months after irrigation treatment started, which in bell pepper

40
represented the flowering and fruiting stage. From the beginning of harvesting to the end
of the experimental period, bell pepper marketable yield, total yield and fruit quality
were measured following the USDA standard grading system (USDA, 2005). Bell pepper
sizes include US Fancy (diameter > 3 inches or 7.6 cm, length > 3.5 inches or 8.9 cm),
US No.1 (both diameter and length > 2.5 inches or 6.4 cm) and unmarketable cull fruit
(sun-burn, decay, misshapen, etc.). Measurements of bell pepper quality included soluble
sugar content (o Brix) (ATAGO, PR-32α digital refractometer, Japan), firmness (digital
force gauge, DFS II, Chatillon Inc., Largo, FL) and wall thickness (digital caliper).
All the experiments ended 4 months after transplanting. At the end point, part of
the plant root system (0-20 cm depth) was collected by a soil auger and carefully
washed. Root length, surface area and average diameter were then scanned and
measured using an EPSON V700 scanner (Epson, Japan) and analyzed with a
WinRHIZO software (V5.0, Regent Instruments, Canada), while root dry weight was
measured after oven drying at 75°C for 2 days.
d. Soil chemical and biological analysis
At the end of the experiment, a soil auger was also used to collect soil cores
within 0-20 cm depth in the field close to the plant rhizosphere. Part of the fresh soil
samples collected from field was immediately shipped to Earthfort Lab (Corvallis, OR)
for microbial activity analysis and the rest were used for the soil respiration (Soil CO2-
Burst) (Haney et al., 2008) test by using the SOLVITA soil respiration box (Woods End
Laboratories, Mt Vernon, ME). Total and active bacteria, total and active fungi were
obtained by following staining procedures (Stamatiadis et al., 1990), direct microscope

41
observation and other procedures provided by Babiuk and Paul (1970), Ingham and
Klein (1984) and Van Veen and Paul (1979).
Another part of the soil samples was dried at 75°C in the oven, then grinded and
sieved the soil to 2 mm, and shipped for chemical analysis to the Soil, Water and Forage
Testing Laboratory (Texas AgriLife Extension Service, CS, TX). Soil pH and electrical
conductivity were obtained in a 1:2 soil: water ratio extract (Rhoades, 1982); and nitrate-
nitrogen (NO3-N) was extracted by 1 M KCl solution (Keeney and Nelson, 1982) and
determined by spectrophotometry. Soil P, K, Ca, Mg, S and Na were extracted and
evaluated following the method of Mehlich (1978) and then determined by an ICP-MS.
e. Statistical analysis
A two-way randomized complete block design with soil amendment and
irrigation levels was used in the studies. Regular measurements of plant morphology and
physiology, crop yield and quality, root and soil traits were analyzed by the analysis of
variance (ANOVA) in SAS (Version 9.4, SAS Institute, Cary, NC); and multiple
comparisons of the means were analyzed by the least significant difference (LSD) at α =
0.05.
f. Timeline
Table 7 shows the main experimental periods for the field experiments in 2016
and 2017.

42
Table 7. Timeline for the field experiments in Uvalde and Weslaco in 2016 (year-1) and 2017
(year-2, new year-1)
Location Season 2-Aug 8-Sep 13-Oct 14-Nov 14-Dec
Uvalde
Year-1 Seedling
transplant
ITS a PM b PM End
experiment
1-April 2-May 5-Jun 5-Jul 30-Jul
Year-2,
New Year-1
Seedling
transplant
ITS PM PM End
experiment
Location Season 2-Aug 4-Oct 1-Nov 6-Dec 13-Dec
Weslaco Year-1 Seedling
transplant
ITS PM PM End
experiment
1-April 15-May 14-Jun 20-Jul 30-Jul
Year-2,
New Year-1
Seedling
transplant
ITS PM PM End
experiment a ITS: Irrigation treatment start; b PM: plant measurement.
Results - Uvalde
a. Year-1 plant (2016)
Growth and physiology - Based on the results from table 8, after irrigation
treatment started, HS significantly decreased plant height regardless of irrigation levels.
HS did not exhibit significant effects on plant physiology. Deficit irrigation increased
leaf chlorophyll content (SPAD) but decreased leaf gas exchange during the flowering
period compared to the well-watered treatment.
Yield and quality - Table 9 shows the lack of significant interaction between soil
amendment and irrigation levels. Therefore, data was combined to investigate the effects
of soil amendment and irrigation separately. HS significantly increased pepper early
marketable yield by 28.9% and total yield by 32.8% as compared to control. However,
total harvest yield was similar to the control (Figure 6). In terms of irrigation, severe
(25% ET) and mild (50% ET) deficit significantly decreased yield from early and total

43
harvest, especially Fancy size fruit yield as compared to moderate deficit (75% ET) and
well-watered (100% ET). The marketable and total yields were not different between
severe and mild deficit irrigations; moderate deficit (75% ET) and well-watered
irrigations also had similar yields regardless of early or total harvest (Figure 7). Table 10
shows the bell pepper quality from the Uvalde year-1 experiment. Overall, HS did not
affect fruit quality, while severe and mild deficit irrigation had an increase in sugar
content (o Brix) with a P-value = 0.05, and a numerical, but not statistical increase in
ascorbic acid concentration.
Root development - Root parameters are shown in Table 11. In general, root
parameters were not affected by HS or irrigation, except for a slight increase in root
length by HS and a decrease in root average diameter by the combination of HS and
severe deficit irrigation.
b. Year-1 soil (2016)
At the end of the experiment, soil amendment and deficit irrigation treatments
did not affect soil environmental changes, since soil chemical properties and soil
microbial activity were similar (Tables 12, 13).

44
Table 8. Summary of morphological and physiological traits of bell pepper grown in year-1 experiment at Uvalde
Time a Source PH SD SPAD Pn gs E cm mm μmol m-2 s-1 mol m-2 s-1 mmol m-2 s-1
1 SA Control 52.73 a * 14.64 61.76 21.66 0.40 3.50 HS 50.20 b 14.72 60.22 19.64 0.41 3.28
IR 25% 51.78 14.52 63.28 a 16.37 0.24 b 2.39 b
50% 50.66 14.90 59.47 b 19.09 0.34 b 3.15 b 75% 51.44 14.51 61.76 ab 24.89 0.54 a 4.09 a 100% 52.00 14.79 59.45 b 22.23 0.50 a 3.92 a
P-value SA 0.049 0.869 0.159 0.570 0.843 0.381
IR 0.871 0.903 0.045 0.362 < 0.001 < 0.001 SA × IR 0.951 0.896 0.716 0.899 0.887 0.817
2 SA Control 52.30 a 15.14 66.53 12.47 0.17 2.91 HS 48.55 b 15.06 65.03 12.00 0.16 2.53
IR 25% 48.78 14.77 67.10 12.82 0.18 2.92
50% 51.13 15.06 66.18 12.15 0.14 2.50 75% 50.97 15.23 65.19 11.70 0.16 2.63 100% 50.81 15.35 64.65 12.27 0.18 2.83
P-value SA 0.014 0.839 0.380 0.610 0.592 0.120
IR 0.611 0.755 0.740 0.850 0.634 0.577 SA × IR 0.722 0.650 0.167 0.971 0.714 0.596
a Time is shown as monthly interval after irrigation treatment started for 2 months. PH: Plant height, SD: stem diameter, SPAD:
chlorophyll content index, Pn: photosynthesis, gs: stomatal conductance, E: transpiration. * Different letters within column from the
same factor indicate significant differences at α = 0.05 according to LSD test.

45
Table 9. Source of variations and P-values from ANOVA on bell pepper year-1 yield in Uvalde
Source of variation Early harvest Total harvest
Fancy No.1 MY Cull TY Fancy No.1 MY Cull TY
SA 0.082 0.147 0.033 0.022 0.019 0.601 0.525 0.932 0.524 0.943
IR 0.014 0.783 0.021 0.883 0.048 < 0.001 0.089 < 0.001 0.537 < 0.001
SA × IR 0.856 0.808 0.834 0.824 0.795 0.453 0.728 0.436 0.930 0.476
SA: soil amendment; IR: deficit irrigation; Early harvest: first 3 harvests; Total harvest: 6 harvests; MY: marketable yield, sum of US
Fancy and No.1; TY: total yield, sum of marketable and cull yield.
Figure 6. Bell pepper year-1 early and total harvest yield in response to soil amendment treatment in Uvalde.
MY: marketable yield, sum of US Fancy and No.1; TY: total yield, sum of marketable and cull yield. * indicated significant difference
between HS and control at α = 0.05 based on LSD test.

46
Figure 7. Bell pepper year-1 early and total harvest yield in response to different irrigation levels in Uvalde.
The percentage of irrigation levels is based on bell pepper evapotranspiration (ET) demands. MY: marketable yield, sum of US Fancy and
No.1; TY: total yield, sum of marketable and cull yield. Different letters among irrigation levels indicate significantly different at α = 0.05
based on LSD test.

47
Table 10. Bell pepper year-1 quality in Uvalde
Table 11. Summary of plant root traits under soil amendment (SA) and irrigation (IR) treatments
in year-1 field at Uvalde
Source RL RSA RAD RDW
m cm2 mm g
SA Control 9.75 116.59 0.38 a * 0.26 HS 10.16 116.37 0.36 b 0.26
IR 25% 10.12 113.22 0.35 b 0.21
50% 9.30 116.01 0.39 a 0.30 75% 9.59 109.39 0.36 b 0.24 100% 10.82 127.29 0.38 ab 0.28
P-value SA 0.781 0.990 0.049 0.923
IR 0.888 0.903 0.044 0.639
SA × IR 0.751 0.823 0.294 0.947
RL: root length; RSA: root surface area; RAD: root average diameter; RDW: root dry weight.
* Different letters within column from the same factor indicate significant differences at α =
0.05 according to LSD test.
Source o Brix Firmness
KgF
Wall thickness
mm
Ascorbic acid
µg/g FW
SA Control 3.64 1.51 6.44 828.3 HS 3.64 1.52 6.19 837.3
IR 25% 3.92 a * 1.57 6.51 949.2
50% 3.71 a 1.48 6.07 832.6 75% 3.64 ab 1.45 6.00 749.8 100% 3.29 b 1.54 6.68 800.8
P-value SA 0.979 0.834 0.248 0.918
IR 0.050 0.590 0.082 0.353
SA × IR 0.759 0.949 0.899 0.870
FW: fresh weight. * Different letters within column from the same factor indicate significant
differences at α = 0.05 according to LSD test.
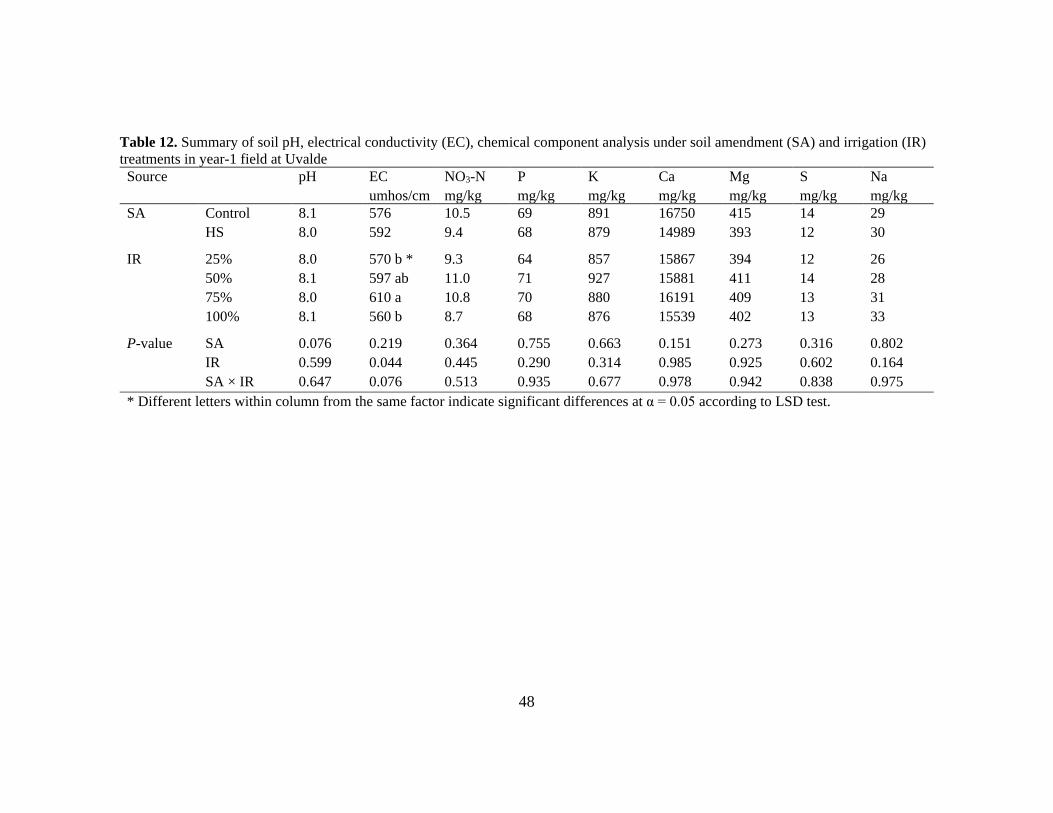
48
Table 12. Summary of soil pH, electrical conductivity (EC), chemical component analysis under soil amendment (SA) and irrigation (IR)
treatments in year-1 field at Uvalde
Source pH EC NO3-N P K Ca Mg S Na
umhos/cm mg/kg mg/kg mg/kg mg/kg mg/kg mg/kg mg/kg
SA Control 8.1 576 10.5 69 891 16750 415 14 29 HS 8.0 592 9.4 68 879 14989 393 12 30
IR 25% 8.0 570 b * 9.3 64 857 15867 394 12 26
50% 8.1 597 ab 11.0 71 927 15881 411 14 28 75% 8.0 610 a 10.8 70 880 16191 409 13 31 100% 8.1 560 b 8.7 68 876 15539 402 13 33
P-value SA 0.076 0.219 0.364 0.755 0.663 0.151 0.273 0.316 0.802
IR 0.599 0.044 0.445 0.290 0.314 0.985 0.925 0.602 0.164
SA × IR 0.647 0.076 0.513 0.935 0.677 0.978 0.942 0.838 0.975
* Different letters within column from the same factor indicate significant differences at α = 0.05 according to LSD test.

49
Table 13. Summary of soil respiration (SR), active bacteria (AB), total bacteria (TB), active fungi (AF) and total fungi (TF) under soil
amendment (SA) and irrigation (IR) treatments in year-1 field at Uvalde
Source SR AB TB AF TF
mg/kg CO2-C µg/g µg/g µg/g µg/g
SA Control 34.93 26.47 782.38 10.89 140.50 HS 36.41 25.87 802.19 8.30 136.11
IR 25% 27.51 27.53 715.75 6.64 114.91
50% 40.08 25.86 851.88 11.79 138.65 75% 27.98 25.30 793.88 11.26 165.41 100% 47.10 25.99 807.63 8.69 134.25
P-value SA 0.890 0.665 0.652 0.319 0.784
IR 0.499 0.697 0.193 0.467 0.189
SA × IR 0.677 0.307 0.143 0.969 0.635

50
c. Year-2 plant (2017)
The year 2 field experiment was aimed to test the long-term effects of HS on bell
pepper growth and physiology performances. Due to similar results between severe and
mild deficit (25% and 50% ET) irrigation from year-1 experiment, for year-2, we
removed the 25% and kept the 50% irrigation as a low irrigation level. Similarity, since
in year-1, there were no differences between moderate deficit and well-watered (75%
and 100% ET) irrigation, we removed the 75% and kept the 100% irrigation as well-
watered irrigation level.
Growth and physiology - The results (Table 14) showed that HS significantly
increased plant height at the fruiting stage 2 months after irrigation treatment started
(ITS), but decreased plant chlorophyll content (SPAD) and photosynthesis of the
flowering period 1 month after ITS. The early decrease in transpiration observed in year-
1 was not detected in year-2, which might indicate that the reduction in leaf gas
exchange due to HS application are diminished in year-2. Deficit irrigation did not have
effects on bell pepper growth and physiology performances.
Yield and quality - Since there were no significant interactions for yield between
soil amendment and irrigation levels (Table 15), the effects of soil amendment and
irrigation were analyzed separately. The results indicated that HS significantly increased
bell pepper early yield of No.1 size fruits by 81.4 % compared to control, while early
marketable and total yield increased numerically but not statistically by 5.5% and 6.4%,
respectively. For total harvest, HS numerically increased marketable and total yield by
9.1% and 8.0%, respectively (Figure 8). In terms of irrigation, deficit (50% ET)

51
treatment did not affect early harvest yield, but it decreased marketable and total yield
from total harvest by 11.9% and 11.4% compared to well-watered (100% ET) treatment
(Figure 9). Table 16 showed bell pepper quality from the Uvalde year-2 experiment.
Overall, HS did not affect fruit quality, while low irrigation increased fruit sugar content
(o Brix) (P-value = 0.05) and decreased wall thickness (P-value = 0.08).
Root development - Root length, surface area and dry weight were numerically
decreased by HS application in year-2, while HS also decreased root average diameter
which was consistent with year-1. In terms of irrigation, all root parameters were
decreased by deficit (50% ET) treatment, especially root dry biomass decreased by
32.6% compared to well-watered treatment (Table 17).
d. Year-2 soil (2017)
HS significantly increased soil electrical conductivity, nitrogen and organic
carbon content by 28.8%, 40.7% and 20.4%, respectively (Table 18). Regarding soil
microbial activity, HS significantly increased active bacteria population, and although
not statistically significant, HS also increased soil respiration by two-fold, which might
due to the promotion of total fungi population (115.9%). Low irrigation decreased soil
total bacteria and fungi population, although not statistically significant (Table 19).

52
Table 14. Summary of morphological and physiological traits of bell pepper grown in year-2 experiment at Uvalde
Time Source PH SD SPAD Pn gs E
cm mm μmol m-2 s-1 mol m-2 s-1 mmol m-2 s-1
1 SA Control 40.13 11.43 62.63 a * 18.29 a 0.70 13.20 HS 42.04 11.84 58.34 b 16.81 b 0.60 12.32
IR 50% 41.29 11.75 60.83 18.05 0.66 13.06
100% 40.88 11.51 60.14 17.05 0.64 12.46
P-value SA 0.077 0.403 0.006 0.020 0.153 0.138
IR 0.696 0.612 0.643 0.108 0.749 0.315
SA × IR 0.639 0.885 0.144 0.164 0.143 0.438
2 SA Control 52.96 b 13.76 49.99 17.67 0.68 8.88 HS 56.13 a 14.47 49.61 17.17 0.75 9.02
IR 50% 53.04 14.38 50.83 18.07 0.69 8.83 100% 56.04 13.85 48.78 16.77 0.74 9.07
P-value SA 0.047 0.125 0.888 0.618 0.208 0.711
IR 0.059 0.254 0.441 0.203 0.380 0.522
SA × IR 0.312 0.165 0.325 0.896 0.915 0.938
Time is shown as monthly interval after deficit irrigation started for 2 months. PH: Plant height, SD: stem diameter, SPAD: chlorophyll
content index, Pn: photosynthesis, gs: stomatal conductance, E: transpiration. * Different letters within column from the same factor indicate
significant differences at α = 0.05 according to LSD test.

53
Table 15. Source of variations and P-values from ANOVA on bell pepper year-2 yield in Uvalde
Source of variation Early harvest Total harvest
Fancy No.1 MY Cull TY Fancy No.1 MY Cull TY
SA 0.427 0.003 0.374 0.670 0.448 0.469 0.161 0.527 0.457 0.480
IR 0.401 0.186 0.677 0.763 0.947 0.422 0.390 0.366 0.157 0.275
SA × IR 0.229 0.700 0.171 0.765 0.515 0.304 0.444 0.345 0.601 0.359
SA: soil amendment; IR: deficit irrigation; Early harvest: first 2 harvests; total harvest: 5 harvests; MY: marketable yield, sum of Fancy and
No.1 yield; TY: total yield, sum of marketable and cull yield.

54
Figure 8. Bell pepper year-2 early and total harvest yield in response to soil amendment
treatment in Uvalde.
MY: marketable yield, sum of Fancy and No.1 yield; TY: total yield, sum of marketable and cull
yield. * indicated significantly different between HS and control at α = 0.05 based on LSD test.
Figure 9. Bell pepper year-2 early and total harvest yield in response to different irrigation levels
in Uvalde.
The percentage of irrigation levels is based on bell pepper evapotranspiration (ET) demands.
MY: marketable yield, sum of US Fancy and No.1; TY: total yield, sum of marketable and cull
yield.

55
Table 16. Bell pepper year-2 quality in Uvalde
Table 17. Summary of plant root traits under soil amendment (SA) and irrigation (IR) treatments
in year-2 field at Uvalde
Source RL RSA RAD RDW
m cm2 mm g
SA Control 14.07 173.55 0.39 0.42 HS 11.63 138.69 0.37 0.35
IR 50% 11.73 136.57 0.37 0.31 100% 13.97 175.67 0.40 0.46
P-value SA 0.078 0.107 0.434 0.467 IR 0.100 0.075 0.258 0.161
SA × IR 0.111 0.416 0.303 0.712
RL: root length; RSA: root surface area; RAD: root average diameter; RDW: root dry weight.
Source o Brix Firmness
KgF
Wall thickness
mm
SA Control 3.64 1.51 6.44 HS 3.64 1.52 6.19
IR 50% 3.71 a * 1.48 6.07
100% 3.29 b 1.54 6.68
P-value SA 0.979 0.834 0.248
IR 0.050 0.590 0.082
SA × IR 0.759 0.949 0.899
* Levels not connected by same letter are significantly different at α = 0.05 based on LSD test.

56
Table 18. Summary of soil pH, electrical conductivity (EC), chemical component analysis and organic carbon (OC) under soil amendment
(SA) and irrigation (IR) treatments in year-2 field at Uvalde
Source pH EC NO3-N P K Ca Mg S Na OC
umhos/cm mg/kg mg/kg mg/kg mg/kg mg/kg mg/kg mg/kg %
SA Control 8.2 a * 403 b 5.9 b 64 868 12723 309 29 58 1.37 b HS 8.1 b 519 a 8.3 a 68 938 12299 313 31 54 1.65 a
IR 50% 8.2 409 b 7.4 67 900 12235 306 24 b 40 b 1.49
100% 8.1 513 a 6.8 64 906 12787 317 35 a 72 a 1.53
P-value SA 0.034 0.018 0.020 0.225 0.479 0.380 0.682 0.569 0.471 0.039
IR 0.346 0.031 0.488 0.442 0.951 0.260 0.222 0.007 0.000 0.753
SA × IR 0.748 0.957 0.900 0.381 0.619 0.997 0.950 0.798 0.818 0.790
* Levels not connected by same letter are significantly different at α = 0.05 based on LSD test.
Table 19. Summary of soil respiration (SR), active bacteria (AB), total bacteria (TB), active fungi (AF) and total fungi (TF) under soil
amendment (SA) and irrigation (IR) treatments in year-2 field at Uvalde.
Source SR AB TB AF TF
mg/kg CO2-C µg/g µg/g µg/g µg/g
SA Control 26.19 11.56 b * 1259.06 1.55 74.84 HS 54.80 17.94 a 1115.71 1.64 159.79
IR 50% 48.09 14.51 1120.13 1.49 84.37
100% 32.90 14.99 1254.63 1.70 150.26
P-value SA 0.116 0.032 0.404 0.932 0.304
IR 0.380 0.853 0.432 0.831 0.419
SA × IR 0.242 0.729 0.453 0.110 0.357
* Levels not connected by same letter are significantly different at α = 0.05 based on LSD test.

57
e. New year-1 plant (2017)
Growth and physiology - The new year-1 (2017) field experiment was aimed to
repeat and validate the results from year-1 (2016). At the fruiting period 2 months after
irrigation treatment started (ITS), HS significantly increased plant stem diameter with
the well-watered treatment. At the flowering period 1 month after ITS, HS significantly
decreased leaf transpiration while maintaining photosynthesis to the same level as
control. In terms of irrigation, deficit stress significantly decreased plant photosynthesis
rate by 15.6% and gas exchange performances (stomatal conductance) by 44.6% in late
growth (fruiting stage) compared to well-watered treatment (Table 20).
Yield and quality - Table 21 shows the lack of significant interaction between soil
amendment and irrigation levels for yield and fruit quality. Therefore, data was
combined to investigate the effects of soil amendment and irrigation separately.
Compared to control, plants grown in HS treated soil had significant decreases in
marketable and total yield from early harvest: 22.2% and 19.5%, respectively, which
was opposite to what we found in year-1 (2016). However, these significant reductions
in yield were not observed from total harvest (Figure 10). Deficit irrigation significantly
decreased early yield with a decrease in Fancy fruit size yield by 35.2% compared to
well-watered irrigation. When combining all harvest, deficit stress decreased both Fancy
and No.1 fruit yield by 43.0% and 21.4%, respectively (Figure 11). HS and irrigation did
not affect bell pepper quality (Table 22), except that HS decreased the sugar content
(3.98 o Brix) of bell pepper especially in well-watered irrigation compared to the control
(4.45 o Brix).

58
Table 20. Summary of morphological and physiological traits of bell pepper grown in new year-1 experiment at Uvalde
Time Source PH SD SPAD Pn gs E
cm mm μmol m-2 s-1 mol m-2 s-1 mmol m-2 s-1
1 SA Control 41.13 11.67 62.24 19.66 0.59 10.43 a * HS 40.21 11.84 59.98 19.55 0.60 9.31 b
IR 50% 41.21 11.94 61.03 19.24 0.57 9.65
100% 40.13 11.57 61.20 19.97 0.62 10.09
P-value SA 0.385 0.704 0.145 0.816 0.753 0.005
IR 0.305 0.415 0.911 0.135 0.360 0.241
SA × IR 0.634 0.416 0.911 0.026 0.123 0.105
2 SA Control 56.42 13.71 b 62.89 18.99 0.59 9.38 HS 54.75 15.10 a 61.42 18.46 0.55 9.87
IR 50% 55.00 13.99 63.40 17.14 b 0.41 b 8.07 b
100% 56.17 14.81 60.91 20.31 a 0.74 a 11.18 a
P-value SA 0.297 0.004 0.429 0.413 0.596 0.363
IR 0.464 0.080 0.184 < 0.001 < 0.001 < 0.001
SA × IR 0.297 0.022 0.365 0.273 0.510 0.324
Time is shown as monthly interval after deficit irrigation started for 2 months. PH: Plant height, SD: stem diameter, SPAD: chlorophyll
content index, Pn: photosynthesis, gs: stomatal conductance, E: transpiration. * Levels not connected by same letter are significantly
different at α = 0.05 based on LSD test.

59
Table 21. Source of variations and P-values from ANOVA on bell pepper new year-1 yield in Uvalde
Source of
variation
Early harvest Total harvest
Fancy No.1 MY Cull TY Fancy No.1 MY Cull TY
SA 0.092 0.173 0.012 0.805 0.021 0.298 0.506 0.078 0.918 0.144
IR 0.011 0.816 0.026 0.943 0.040 0.032 0.003 < 0.001 0.079 < 0.001
SA × IR 0.958 0.523 0.432 0.274 0.333 0.968 0.679 0.735 0.704 0.873
SA: soil amendment; IR: deficit irrigation; Early harvest: first 2 harvests; total harvest: 5 harvests; MY: marketable
yield, sum of Fancy and No.1 yield; TY: total yield, sum of marketable and cull yield.
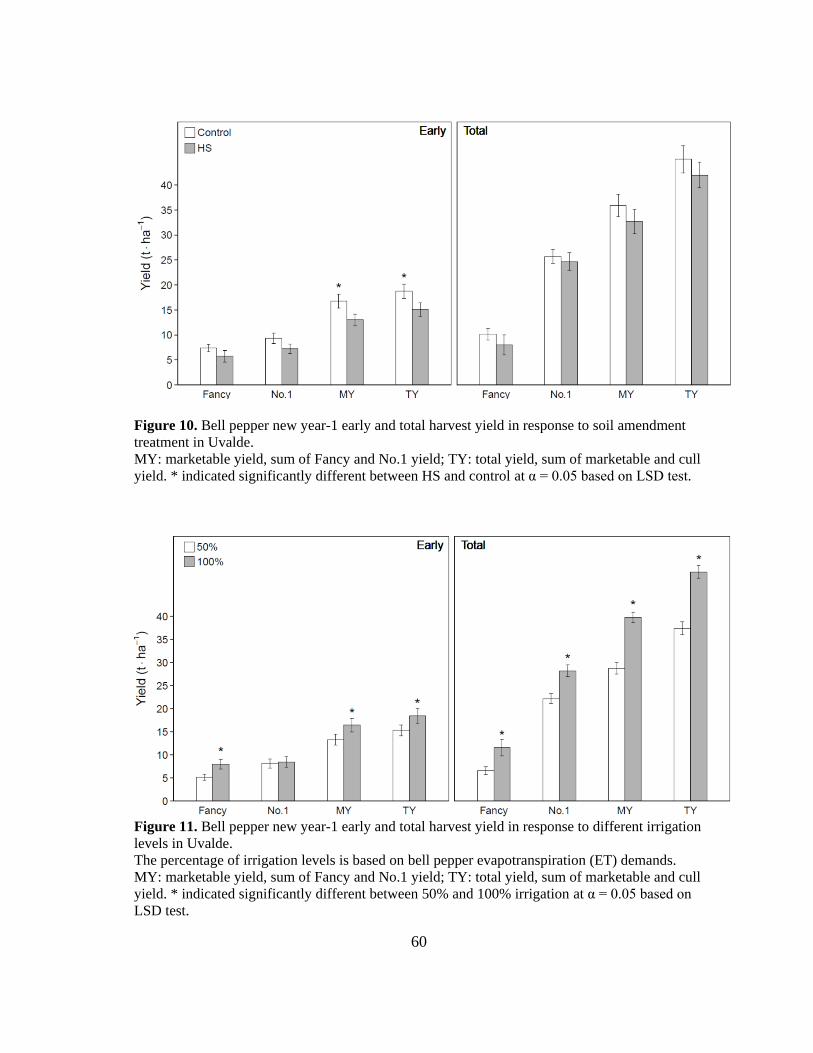
60
Figure 10. Bell pepper new year-1 early and total harvest yield in response to soil amendment
treatment in Uvalde.
MY: marketable yield, sum of Fancy and No.1 yield; TY: total yield, sum of marketable and cull
yield. * indicated significantly different between HS and control at α = 0.05 based on LSD test.
Figure 11. Bell pepper new year-1 early and total harvest yield in response to different irrigation
levels in Uvalde.
The percentage of irrigation levels is based on bell pepper evapotranspiration (ET) demands.
MY: marketable yield, sum of Fancy and No.1 yield; TY: total yield, sum of marketable and cull
yield. * indicated significantly different between 50% and 100% irrigation at α = 0.05 based on
LSD test.

61
Table 22. Bell pepper new year-1 quality in Uvalde
Table 23. Summary of plant root traits under soil amendment (SA) and irrigation (IR) treatments
in new year-1 field at Uvalde
Source RL RSA RAD RDW
m cm2 mm g
SA Control 11.07 115.98 b * 0.33 0.24 HS 14.06 158.33 a 0.36 0.45
IR 50% 12.29 142.00 0.37 a 0.39
100% 12.84 132.30 0.32 b 0.30
P-value SA 0.064 0.047 0.150 0.089
IR 0.709 0.612 0.025 0.422
SA × IR 0.372 0.281 0.280 0.403
RL: root length; RSA: root surface area; RAD: root average diameter; RDW: root dry weight.
* Levels not connected by same letter are significantly different at α = 0.05 based on LSD test.
Root development - Roots from plants treated with HS had significantly higher
surface area than control; in addition, HS also increased root length and dry weight
although not statistically significant. Deficit irrigation increased root average diameter,
but did not affect other root traits such as root length and root surface area (Table 23).
Source o Brix Firmness
KgF
Wall thickness
mm
SA Control 4.31 2.07 5.63 HS 4.14 2.03 5.28
IR 50% 4.24 1.90 5.35
100% 4.21 2.20 5.56
P-value SA 0.187 0.864 0.416
IR 0.843 0.166 0.624
SA × IR 0.037 0.162 0.629

62
f. New year-1 soil (2017)
HS and deficit irrigation did not affect soil chemical changes except that HS
increased organic carbon content by 27.4% although not significant. Interestingly, well-
watered soil had slightly higher organic carbon (19.2%) than deficit irrigation (Table
24).

63
Table 24. Summary of soil pH, electrical conductivity (EC), chemical component analysis and organic carbon (OC) under soil amendment
(SA) and irrigation (IR) treatments in new year-1 field at Uvalde
Source pH EC NO3-N P K Ca Mg S Na OC
umhos/cm mg/kg mg/kg mg/kg mg/kg mg/kg mg/kg mg/kg %
SA Control 8.0 661 87 57 690 11957 210 28 31 1.82 HS 8.0 664 62 42 666 11580 211 25 44 2.32
IR 50% 8.1 542 55 47 681 11804 211 26 36 1.85
100% 8.0 783 94 52 675 11734 210 27 40 2.29
P-value SA 0.707 0.993 0.691 0.230 0.633 0.409 0.911 0.217 0.105 0.079
IR 0.265 0.381 0.546 0.678 0.891 0.875 0.914 0.611 0.560 0.113
SA × IR 0.793 0.326 0.419 0.458 0.467 0.383 0.644 0.998 0.973 0.247

64
Results - Weslaco
a. Year-1 plant (2016)
Growth and physiology - Based on the results from Table 25, after irrigation
treatment started (ITS), HS significantly decreased bell pepper leaf stomatal conductance
and transpiration especially in severe and mild deficit treatments (25% and 50% ET) at
the fruiting stage, while maintaining photosynthesis to the same level as control.
Different irrigation levels did not affect plant growth and physiology performances.
Yield and quality - Table 26 shows the lack of significant interaction between soil
amendment and irrigation levels for yield and quality. HS did not affect early yield, and
only numerically increased total harvest yield by 7.4%. In terms of irrigation, there were
no significant reduction in yield from deficit irrigation regardless of early or total harvest
(Figure 12). Overall, HS and irrigation did not affect bell pepper quality, except that the
severe deficit irrigation had a numerical but not significant increase in bell pepper
ascorbic acid concentration (Table 27).
Root development - HS significantly increased root dry weight by 29.6%
compared to control, while they numerically increased root length and root surface area;
irrigation rates did not have a clear effect on root performance (Table 28).

65
Table 25. Summary of morphological and physiological traits of bell pepper grown in year-1 experiment at Weslaco
Time Source PH SD SPAD Pn gs E
cm mm μmol m-2 s-1 mol m-2 s-1 mmol m-2 s-1
1 SA Control 52.94 16.28 68.19 20.71 0.30 a * 5.47 a HS 53.44 15.72 72.17 20.07 0.24 b 4.69 b
IR 25% 54.56 16.56 ab 67.71 20.87 0.28 5.21
50% 53.81 14.81 c 70.96 19.73 0.27 4.93 75% 52.38 17.09 a 70.19 20.68 0.27 5.27 100% 52.00 15.54 bc 71.85 20.27 0.26 4.90
P-value SA 0.813 0.199 0.065 0.317 0.007 0.048
IR 0.803 0.004 0.533 0.596 0.838 0.855 SA × IR 0.994 0.887 0.301 0.010 0.003 0.148
2 SA Control 62.56 18.76 57.37 11.86 0.21 3.55 HS 58.59 18.46 58.48 11.33 0.19 3.45
IR 25% 63.94 19.44 57.99 11.08 0.17 3.13
50% 54.75 18.35 57.54 11.86 0.21 3.68 75% 63.25 18.17 57.04 11.58 0.20 3.51 100% 60.38 18.48 59.13 11.87 0.22 3.66
P-value SA 0.204 0.703 0.604 0.604 0.706 0.840
IR 0.158 0.675 0.910 0.939 0.745 0.835
SA × IR 0.375 0.978 0.965 0.975 0.885 0.827
Time is shown as monthly interval after deficit irrigation started for 2 months. PH: Plant height, SD: stem diameter, SPAD: chlorophyll
content index, Pn: photosynthesis, gs: stomatal conductance, E: transpiration. * Levels not connected by same letter are significantly
different at α = 0.05 based on LSD test.

66
Table 26. Source of variations and P-values from ANOVA on bell pepper year-1 yield in
Weslaco
Source of variation Early harvest Total harvest
TY TY
SA 0.454 0.076
IR 0.994 0.454
SA × IR 0.996 0.787
SA: soil amendment; IR: deficit irrigation; Early harvest: first 2 harvests; Total harvest: 4
harvests; TY: total yield, sum of marketable and cull yield.
Figure 12. Bell pepper year-1 yield in response to different soil amendment and different
irrigation levels in Weslaco.
The percentage of irrigation levels is based on bell pepper evapotranspiration (ET) demands;
TY: total yield.
Table 27. Bell pepper year-1 quality in Weslaco
Source o Brix Firmness Wall thickness Ascorbic acid
KgF mm µg/g FW
SA Control 3.64 1.82 4.81 779.72 HS 3.75 1.98 4.99 869.19
IR 25% 3.59 1.80 4.89 1092.75
50% 3.68 2.23 5.30 786.27 75% 3.54 1.77 4.62 526.43 100% 3.99 1.81 4.79 892.38
P-value SA 0.713 0.380 0.422 0.651
IR 0.686 0.219 0.214 0.251
SA × IR 0.908 0.924 0.674 0.833
.

67
Table 28. Summary of plant root traits under soil amendment (SA) and irrigation (IR) treatments
in year-1 field at Weslaco
Source RL RSA RAD RDW
m cm2 mm g
SA Control 9.67 103.90 0.34 0.19 b * HS 11.39 126.47 0.35 0.27 a
IR 25% 11.28 121.78 0.34 0.21
50% 9.37 98.88 0.34 0.18 75% 11.08 121.33 0.35 0.26 100% 10.38 118.74 0.37 0.26
P-value SA 0.108 0.052 0.312 0.023
IR 0.562 0.416 0.308 0.207
SA × IR 0.327 0.178 0.641 0.414
RL: root length; RSA: root surface area; RAD: root average diameter; RDW: root dry weight.
* Levels not connected by same letter are significantly different at α = 0.05 based on LSD test.
b. Year-1 soil (2016)
At the end of the experiment, HS increased soil nitrate-nitrogen content by 166%
compared to control (P-value = 0.067). HS also significantly decreased active fungi
population by 37.8%, which might cause the reduction in soil respiration. Irrigation did
not significantly affect soil chemical and microbial properties. However, an interesting
pattern of soil respiration was found under different irrigation levels: from severe to
well-watered treatments, soil respiration was increased until moderate deficit (75% ET),
then decreased in well-watered (100% ET) treatment (Tables 29, 30).

68
Table 29. Summary of soil pH, electrical conductivity (EC), chemical component analysis under soil amendment (SA) and irrigation (IR)
treatments in year-1 field at Weslaco
Source pH EC NO3-N P K Ca Mg S Na
umhos/cm mg/kg mg/kg mg/kg mg/kg mg/kg mg/kg mg/kg
SA Control 7.9 707 5.9 40 416 4481 324 85 139 HS 7.9 710 15.7 38 385 4255 316 85 143
IR 25% 7.9 714 6.8 42 399 4359 323 80 141
50% 7.9 709 9.8 38 404 4473 324 92 147 75% 8.0 680 17.2 39 406 4313 318 80 124 100% 7.9 731 9.5 38 392 4326 316 88 151
P-value SA 0.180 0.950 0.067 0.751 0.095 0.124 0.476 0.996 0.711
IR 0.269 0.941 0.524 0.853 0.938 0.851 0.923 0.826 0.265
SA × IR 0.811 0.905 0.911 0.746 0.879 0.976 0.939 0.775 0.507

69
Table 30. Summary of soil respiration (SR), active bacteria (AB), total bacteria (TB), active fungi (AF) and total fungi (TF) under soil
amendment (SA) and irrigation (IR) treatments in year-1 field at Weslaco
Source SR AB TB AF TF
mg/kg CO2-C µg/g µg/g µg/g µg/g
SA Control 7.95 28.90 551.69 8.18 a * 132.57 HS 5.31 29.38 560.75 5.09 b 142.41
IR 25% 4.69 30.16 592.75 7.56 167.38
50% 6.94 27.68 525.75 5.98 139.25 75% 8.94 28.76 545.38 6.65 129.33 100% 5.95 29.95 561.00 6.36 114.00
P-value SA 0.102 0.778 0.786 0.018 0.454
IR 0.287 0.699 0.539 0.816 0.050
SA × IR 0.369 0.585 0.755 0.862 0.779
* Levels not connected by same letter are significantly different at α = 0.05 based on LSD test.

70
c. Year-2 plant (2017)
Growth and physiology - Based on the results from Table 31, HS significantly
decreased bell pepper leaf gas exchange as well as the rate of photosynthesis at the
fruiting stage 2 months after irrigation treatment started (ITS). HS also decreased plant
height at the same period (P-value = 0.061). In terms of irrigation, deficit irrigation
decreased plant chlorophyll content (SPAD) at the flowering stage 1 month after ITS,
while it did not affect leaf gas exchange regardless of plant growth periods.
Yield and quality - There were no significant interactions between soil
amendment and irrigation levels for total harvest yield (Table 32). HS treated field had a
13.7% lower marketable yield than control, which mainly because of the significantly
reduction (43.8%) in No.1 size fruit yield. However, HS increased Fancy size fruit yield
by 34.1% compared to control. Deficit irrigation (50% ET) reduced marketable yield by
12.5% compare to well-watered (100% ET) treatment, but the negative effect was not
significant (Figure 13). In terms of quality, HS significantly increased the wall thickness
of bell pepper in deficit irrigation (4.89 mm) compared to control (4.25 mm), while had
no effects in well-watered treatment (Table 33).
Root development - HS significantly increased root dry weight by 54.2%, which
was consistent with the results from year-1, and the increase in root biomass especially
happened in well-watered treatment (0.45 g) compared to control (0.13 g). HS also
increased root length and surface area although the promotion was not statistically
significant. Deficit irrigation did not affect root performance (Table 34).

71
Table 31. Summary of morphological and physiological traits of bell pepper grown in year-2 experiment at Weslaco
Time Source PH SD SPAD Pn gs E
cm mm μmol m-2 s-1 mol m-2 s-1 mmol m-2 s-1
1 SA Control 43.44 13.92 63.06 11.56 0.23 6.78 HS 44.31 14.08 63.39 12.11 0.22 6.64
IR 50% 43.94 13.30 60.44 b * 12.05 0.23 6.79
100% 43.81 14.71 66.19 a 11.62 0.22 6.64
P-value SA 0.698 0.855 0.891 0.572 0.871 0.787
IR 0.956 0.124 0.028 0.660 0.769 0.764
SA × IR 0.657 0.769 0.372 0.743 0.390 0.410
2 SA Control 62.38 18.43 48.31 8.94 a 0.22 a 6.50 a HS 56.38 16.76 51.64 6.05 b 0.11 b 3.83 b
IR 50% 62.13 17.95 48.09 7.83 0.16 4.94
100% 56.63 17.24 51.85 7.16 0.17 5.40
P-value SA 0.061 0.134 0.208 0.003 0.011 0.003
IR 0.084 0.517 0.157 0.449 0.643 0.572
SA × IR 0.808 0.913 0.987 0.916 0.971 0.976
Time is shown as monthly interval after deficit irrigation started for 2 months. PH: Plant height, SD: stem diameter, SPAD: chlorophyll
content index, Pn: photosynthesis, gs: stomatal conductance, E: transpiration. * Levels not connected by same letter are significantly
different at α = 0.05 based on LSD test.

72
Table 32. Source of variations and P-values from ANOVA on bell pepper year-2 yield in
Weslaco
Source of variation Total harvest
Fancy No.1 MY
SA 0.202 0.004 0.072
IR 0.330 0.718 0.098
SA × IR 0.540 0.529 0.816
SA: soil amendment; IR: deficit irrigation; Total harvest: a 1-time harvest. MY: marketable
yield, sum of Fancy and No.1 yield.
Figure 13. Bell pepper year-2 yield in response to different soil amendment and irrigation levels
in Weslaco.
The percentage of irrigation levels is based on bell pepper evapotranspiration (ET) demands;
MY: marketable yield, sum of Fancy and No.1 yield. * Levels not connected by same letter are
significantly different at α = 0.05 based on LSD test.

73
Table 33. Bell pepper year-2 quality in Weslaco
Source o Brix Firmness Wall thickness
KgF mm
SA Control 5.66 1.40 4.71 HS 5.53 1.34 4.96
IR 50% 5.60 1.38 4.57 b *
100% 5.59 1.36 5.10 a
P-value SA 0.607 0.629 0.129
IR 0.962 0.868 0.006
SA × IR 0.124 0.473 0.029
* Levels not connected by same letter are significantly different at α = 0.05 based on LSD test.

74
Table 34. Summary of plant root traits in year-2 field at Weslaco
Source RL RSA RAD RDW
m cm2 mm g
SA Control 8.24 92.91 0.35 0.24 b * HS 8.97 106.14 0.38 0.37 a
IR 50% 9.40 108.99 0.37 0.32
100% 7.81 90.06 0.36 0.29
P-value SA 0.611 0.404 0.167 0.035
IR 0.281 0.242 0.781 0.613
SA × IR 0.251 0.084 0.175 0.006
RL: root length; RSA: root surface area; RAD: root average diameter; RDW: root dry weight. * Levels not connected by same letter are
significantly different at α = 0.05 based on LSD test.
Table 35. Summary of soil pH, electrical conductivity (EC), chemical component analysis and organic carbon (OC) under soil amendment
(SA) and irrigation (IR) treatments in year-2 field at Weslaco
Source pH EC NO3-N P K Ca Mg S Na OC
umhos/cm mg/kg mg/kg mg/kg mg/kg mg/kg mg/kg mg/kg %
SA Control 8.1 267 6.0 56 534 a * 5640 381 61 87 0.43 b HS 8.2 261 7.1 48 474 b 5394 365 49 94 0.64 a
IR 50% 8.2 268 6.7 51 497 5553 371 49 88 0.58
100% 8.2 260 6.4 52 510 5481 375 61 94 0.49
P-value SA 0.220 0.827 0.242 0.103 0.019 0.074 0.108 0.509 0.597 0.030
IR 0.740 0.779 0.787 0.819 0.548 0.568 0.609 0.514 0.650 0.294
SA × IR 0.604 0.150 0.971 0.887 0.027 0.467 0.903 0.479 0.197 0.265
* Levels not connected by same letter are significantly different at α = 0.05 based on LSD test.

75
Table 36. Summary of soil respiration (SR), active bacteria (AB), total bacteria (TB), active
fungi (AF) and total fungi (TF) under soil amendment (SA) and irrigation (IR) treatments in
year-2 field at Weslaco
Source SR AB TB AF TF
mg/kg CO2-C µg/g µg/g µg/g µg/g
SA Control 19.94 16.08 513.18 2.64 16.01 HS 40.19 16.79 624.97 3.27 21.37
IR 50% 24.80 15.98 567.57 4.22 16.84
100% 35.33 16.89 570.59 1.69 20.54
P-value SA 0.120 0.763 0.107 0.723 0.181
IR 0.396 0.699 0.963 0.179 0.343
SA × IR 0.593 0.057 0.067 0.350 0.565
d. Year-2 soil (2017)
HS significantly increased soil organic carbon by 48.8%, but decreased
potassium content especially in well-watered condition (453 mg/kg) compared to control
(568 mg/kg). Although not statistically significant, HS also increased soil respiration by
2-fold, total bacteria population by 21.8% and total fungi population by 33.6%. Deficit
irrigation did not affect soil chemical properties, but it decreased soil respiration by
29.8% although not statistically significant (Tables 35, 36).
e. New year-1 plant (2017)
Growth and physiology - Based on the results from Table 37, HS slightly
decreased leaf gas exchange at the fruiting stage 2 months after ITS. Although not
statistically significant compared to control, HS also increased plant height at the same
period (P-value = 0.057). Deficit irrigation did not affect plant morphological and
physiological traits, except that deficit stress decreased plant height at the fruiting stage
(P-value = 0.07).

76
Yield and quality - There was a significant interaction between soil amendment
and irrigation levels on Fancy size fruit yield from total harvest (Table 38). HS
significantly increased Fancy size fruit yield by 71.9% compared to control especially
under well-watered (100% ET) treatment. Deficit irrigation did not affect marketable
yield. In addition, HS and deficit irrigation did not have significant impacts on bell
pepper quality (Tables 39).
Root development - Although not statistically significant, roots from HS treated
plants had lower root length and surface area, but higher root dry weight compared to
control. Deficit irrigation had numerically lower root length, surface area and dry weight
compared to well-watered treatment (Table 40).
f. New year-1 soil (2017)
HS slightly increased soil organic carbon (33.3%) compared to control, while had
no effects on other soil chemical properties. In terms of deficit irrigation, it significantly
increased soil pH but decreased magnesium content in soil (Table 41).

77
Table 37. Summary of morphological and physiological traits of bell pepper grown in new year-1 experiment at Weslaco
Time Source PH SD SPAD Pn gs E
cm mm μmol m-2 s-1 mol m-2 s-1 mmol m-2 s-1
1 SA Control 47.13 14.37 70.13 12.29 0.23 7.40 HS 45.44 13.88 70.24 11.30 0.21 6.90
IR 50% 47.06 14.27 70.09 12.40 0.24 7.51
100% 45.50 13.97 70.28 11.19 0.21 6.78
P-value SA 0.410 0.433 0.945 0.275 0.320 0.285
IR 0.445 0.638 0.916 0.187 0.087 0.125 SA × IR 0.194 0.908 0.390 0.164 0.093 0.067
2 SA Control 57.31 17.36 61.95 7.22 0.14 5.57 HS 62.25 18.09 62.52 5.85 0.11 4.60
IR 50% 57.44 17.85 63.56 6.68 0.13 5.23
100% 62.13 17.61 60.91 6.40 0.12 4.95
P-value SA 0.057 0.371 0.762 0.148 0.135 0.125
IR 0.070 0.770 0.165 0.762 0.640 0.657
SA × IR 0.940 0.977 0.923 0.588 0.224 0.262
Time is shown as monthly interval after deficit irrigation started for 2 months. PH: Plant height, SD: stem diameter, SPAD: chlorophyll
content index, Pn: photosynthesis, gs: stomatal conductance, E: transpiration.

78
Table 38. Source of variations and P-values from ANOVA on bell pepper new year-1 yield in
Weslaco
Source of variation Total harvest
Fancy No.1 MY
SA 0.050 0.842 0.415
IR 0.497 0.392 0.639
SA × IR 0.042 0.966 0.507
SA: soil amendment; IR: deficit irrigation; Total harvest: a 1-time harvest. MY: marketable
yield, sum of Fancy and No.1 yield.
Figure 14. Bell pepper new year-1 yield in response to the interaction of soil amendment and
irrigation treatments in Weslaco.
The percentage of irrigation levels is based on bell pepper evapotranspiration (ET) demands;
MY: marketable yield, sum of Fancy and No.1 yield. Different letters among treatments indicate
significantly different at α = 0.05 based on LSD test.

79
Table 39. Bell pepper new year-1 quality in Weslaco
Source o Brix Firmness Wall thickness
KgF mm
SA Control 5.26 1.55 4.85 HS 5.51 1.75 4.78
IR 50% 5.23 1.78 4.82
100% 5.55 1.53 4.81
P-value SA 0.220 0.167 0.787
IR 0.120 0.082 0.964
SA × IR 0.220 0.527 0.534
Table 40. Summary of plant root traits in new year-1 field at Weslaco
Source RL RSA RAD RDW
m cm2 mm g
SA Control 8.19 84.34 0.32 0.30 HS 6.93 76.25 0.34 0.32
IR 50% 7.12 73.51 0.32 0.27
100% 7.99 87.08 0.34 0.34
P-value SA 0.239 0.551 0.481 0.908
IR 0.408 0.326 0.506 0.573
SA × IR 0.320 0.271 0.391 0.285
RL: root length; RSA: root surface area; RAD: root average diameter; RDW: root dry weight.

80
Table 41. Summary of soil pH, conductivity, chemical component analysis and organic carbon (OC) under soil amendment (SA) and
irrigation (IR) treatments in new year-1 field at Weslaco
Source pH Cond NO3-N P K Ca Mg S Na OC
umhos/cm mg/kg mg/kg mg/kg mg/kg mg/kg mg/kg mg/kg %
SA Control 8.1 215 11.9 48 543 5788 381 28 54 0.30 HS 8.2 231 10.8 48 582 5777 385 35 68 0.40
IR 50% 8.2 a * 222 11.0 47 533 5759 378 b 28 59 0.35
100% 8.1 b 224 11.6 49 592 5806 388 a 35 62 0.35
P-value SA 0.170 0.314 0.555 0.794 0.330 0.891 0.241 0.277 0.137 0.126
IR 0.026 0.856 0.740 0.165 0.158 0.559 0.025 0.240 0.754 0.921
SA × IR 0.917 0.987 0.460 0.072 0.584 0.527 0.202 0.522 0.865 0.448
* Levels not connected by same letter are significantly different at α = 0.05 based on LSD test.

81
Discussion
The results from HS application on bell pepper growth and soil environmental
changes showed both similarities but also differences between field and controlled
conditions. In general, field weather conditions are more variable, which led to
inconsistent impacts of HS application. The positive plant responses caused by HS in the
controlled environments needed to be explored in the field for the potential future
applications. The following discussion will mainly focus on the effects of HS on biota
growth, crop yield, and the mitigation of water stress.
a. Biota growth and yield
Currently, information about the impacts of HS on vegetable crop yield is
limited. Most of the studies were conducted under greenhouse or other controlled
environments, and very few in field conditions. Ciarkowska et al. (2017) found that the
high application rate (around 0.33 kg/m2 in 11 L pot with diameter 22 cm and height 30
cm) of lignite-derived liquid HS (6% humic acids) increased celery and leek yield grown
in greenhouse by more than 2-fold, compared to the low application rate (around 0.16
kg/m2). Hartz and Bottoms (2010) tested 4 liquid commercial HS (6% to 11% humic
acids), and found that HS did not appear to efficiently increase dry biomass of romaine
lettuce (Lactuca sativae L.) grown in greenhouse (within 1 L pot), and yield of tomato
(Lycopersicon esculentum Mill.) grown in field conditions at the application rate of 0.02
to 0.04 kg/m2. In addition, Azcona et al. (2011) tested and compared the liquid HS
derived from composted sewage sludge (HSS) and leonardite (HSL, an oxidation
product of lignite) in a greenhouse environment, and they found that a higher application

82
rate of HSS (around 0.07 kg/m2 within 2 L pot) significantly increased pepper
(Capsicum annuum L. cv. Piquillo) growth such as plant height, leaf area and net
photosynthesis at the vegetative stage, but the final yield was similar to the control.
Two-year experiments in Uvalde - In our bell pepper study, a similar early
vegetative growth promotion was detected from the results in Uvalde with clay soil,
which led to the promotion of bigger fruit yield from early harvest (Fancy size increased
by 33.8%), as well as increasing the marketable and total yield from early harvest by
28.9% and 32.8%, respectively. The early yield improvement is important for farmers to
compete in high value markets. However, the early boost effect was not translated into
improvement in the final marketable and total yield. Interestingly, the effects of HS on
plant early growth and production promotion continued in the second year, although the
effects diminished and only improved the No.1 size fruit yield. At the end of the
experiment, HS treated field did not differentiate nutrient retention based on the soil
chemical analysis as compared to control field. Within the same fertilization input, the
total nutrient uptake in plants should be similar between control and HS treatment.
Therefore, the early yield promotion effects of HS seemed to be caused by different
nutrient uptake rate across the different plant growth stages – a faster uptake rate during
early growth, following by a slower uptake in late growth. However, Azcona et al.
(2011) concluded that the positive effect of HS on pepper growth was not related to the
improved nutrient concentrations in plant tissues; instead, it might be associated with
other growth-promoting factors such as auxin-like activity from HS or hormone
generated by microbes that are entrapped in HS. But they only conducted the analysis of

83
nutrient concentration at the end of plant growth, and they used soilless growth medium.
Therefore, we suggest future work to address the mechanisms by which HS promote
early plant growth especially in different soil types. This will require testing nutrient
concentration from plant tissues and soil during different growth periods.
HS did not affect bell pepper quality in the consecutive two-year field
experiments, which might indicate the subtle effects of HS on fruit quality composition.
Unlike the results from year-1 in 2016, the soil microbial activity from the
second year in 2017 was accelerated due to HS application, showing a long-term soil
microbial improvement from HS. This might suggest positive reactions between HS and
heterotrophic or autotrophic bacteria, which can benefit from the consumption of certain
compounds in HS such as organic acids or amino acids (Valdrighi et al., 1996). The
additional organic compounds can be reflected by an increase in organic carbon content
due to HS application. At the same time, microbes can also take the advantage of HS as
electron acceptors for their respiration to provide energy (Lovley et al., 1996). However,
research on specific type of microbes and their influences to soil environment is still
lacking and needs further investigation.
Considering plant roots, HS significantly decreased average root diameter while
maintaining root length and surface area to the same level as the control in year-1. This
revealed that the application of HS could induce finer roots for water and nutrient
absorption, but this effect was diminished in the second year. Based on a germination
study of HS application (2 mM C L−1 based on humic acid content) in maize (Jindo et
al., 2012), due to the auxin (IAA) compound contained in HS, the proton pump activity
84
in root plasma membrane was promoted, as well as the principal and lateral root growth,
and these effects were more obvious when the source materials of HS contained more
carboxylic and hydrophobic groups. In our study, the solid product we used was derived
from lignite using ammonoxidation procedure (the reaction of a given substrate with
oxygen in aqueous ammonia), in which method the carboxylic and hydrophobic contents
will be decreased as mentioned by (Karapanagioti et al., 2010). Therefore, the
significant effects of HS on plant root development in the field might diminish due to the
specific type of HS we used.
Two-year experiments in Weslaco - In the Weslaco location with sandy soil, a
similar plant early growth promotion effect from HS was observed in the year-1
experiment (2016). Plant root biomass accumulation also increased due to HS
application in both years, but there was not an increase in finer roots as observed in
Uvalde with clay soil. In terms of yield, HS slightly increased bell pepper total harvest
yield in year-1. In the second year (2017) from one time over harvest, HS increased the
bigger size (Fancy) yield but decreased the smaller size (No.1) yield, leading to a
decrease in marketable yield. This indicated a similar promotion of fruit size when
compared to Uvalde, although this yield promotion in bigger fruit could not offset the
decrease in smaller fruit yield. It is expected that HS might be more effective to enhance
the existing poor fertility of sandy soil; however, similar to Uvalde, the impacts of HS on
bell pepper yield seemed not to be related to the soil nutrient changes. In another sandy
soil study with potato, Selim et al. (2009) found an increase in crop yield in response to
liquid HS application at a rate 120kg/ha (or 0.12 kg/m2), and the change in yield was

85
indeed related to soil nutrient concentrations change. Different observations once again
explained that HS had inconsistent effects on soil environmental changes.
In year-1, HS decreased soil active fungi with a slight increase in nitrogen
content, which was in agreement with Allison et al. (2007). In year-2, HS slightly
increased soil microbial population and activity, especially soil respiration. It has been
reported that soil respiration reflects the soil CO2 efflux generated by soil biota activity,
which is mainly influenced by temperature and water content of soil (Davidson et al.,
1998). In this study, the soil samples collected to perform the soil respiration test was
from the plant rhizosphere, a zone where respiration is mainly generated by the
decomposition of the rhizosphere carbon (Epstein, 1996). Our study showed that HS
application increased soil organic carbon, providing more carbon resources for soil
microbes to consume. Moreover, the decomposition rate is sensitive to soil temperature
changes. Therefore, in further investigation, a soil temperature sensor is also highly
recommended to install in order to observe the dynamic changes of soil temperature.
New year-1 experiments in both locations (Uvalde and Weslaco) - Overall in
both locations, similar plant growth promotions by HS were observed in new year-1
(2017) experiments. In Uvalde, HS significantly increased plant stem diameter and root
surface area, but early yield was significantly decreased by HS application, which was a
conflicting result as compared to year-1 experiment (2016). Since the increase in early
yield occurred only in year-1, HS did not seem to have a consistent promotive effects on
crop yield in the clay soil conditions, which might limit the scope of HS application as
mentioned by Hartz and Bottoms (2010). However, root growth was greatly promoted as

86
a result of HS application, which might indicate that the beneficial effects from HS were
more translated into root development instead of shoot growth (as well as yield). In
Weslaco, compared to the results from year-1 (2016), HS did not have obvious effects
on plant morphology and physiology changes, but significantly increased bell pepper
fancy size yield under well-watered condition. This was similar to the results from year-
2 (2017), except that the beneficial effects of HS on fruit development occurred under
more appropriate environments.
b. Mitigation of water stress
Changing in plant physiology - In the previous study conducted under controlled
environments, we found HS had the potential to mitigate short-term severe or mild water
stress by reducing plant transpiration and moisture loss while keeping the photosynthesis
rate. In the field experiment, the reductions in leaf stomatal conductance and
transpiration caused by HS application were observed in both locations regardless of the
growing season (year-1, year-2, new year-1), and these effects tended to occur rapidly
after irrigation treatment started (1 month after ITS). But sometimes, such effects
occurred along with a reduced photosynthetic rate. With limited information, we can
only speculate that HS might have functions to catalyze some physiological reactions
such as the change of ROS, ATP synthase, ATP and RuBP contents, or ABA
concentration that can control leaf photosynthesis rate and stomatal conductance, which
will ultimately affect plant photosynthesis and gas exchange performance.
Root - Plant shoot growth is highly associated with root development. In the
initiate hypothesis, we speculated that HS could ameliorate plant shoot performance in

87
deficit stress by significantly increasing root growth. The results of this study confirmed
that hypothesis - HS had profound effects on plant root development regardless of
irrigation levels. However, root samples were only obtained from the plant final growth
stage. There are still lack of observations about the plant early root development
responses, especially under low irrigations (sever or mild deficit stress), when leaf gas
exchange rapidly decreased due to the HS application. Therefore, the dynamic change of
root development across growing stages might also be worthwhile to investigate.
Regarding to lignite-derived HS, this study provided new information on
phenotypic changes of bell pepper grown in deficit stress. As mentioned earlier, there are
only few studies addressing the relationship between HS and plant gas exchange
(Azcona et al., 2011; Dunstone et al., 1988). A detailed study relating enzyme activity,
ABA and gene expression levels for root traits would be valuable to further explore and
elucidate specific HS effects and mechanisms on plant root and shoot physiological
responses.

88
CHAPTER IV
SUMMARY AND CONCLUSIONS
Summary
By testing and evaluating the effects of HS application on bell pepper growth and
soil quality changes under controlled environment, we found HS-based soil amendment
differentially affected bell pepper plant performance depending on soil moisture and soil
types. HS improved plant growth under water limiting conditions due to reduced
moisture loss and root growth stimulation. These two aspects were critical for plant
water and nutrient absorption, and provided increased plant tolerance under water
limited conditions. HS had short-term potential to mitigate severe water stress and
promote plant growth under moderate stress conditions. The beneficial response of HS
was greater in poor soil conditions (sand) than in rich soil (clay). The enhancement of
microbial growth from HS was a key potential effect improving soil health, as well as an
essential factor to improve plant-microbial interaction. Overall, HS application led to
some short-term positive soil environmental changes under both controlled
environments.
The field experiments in two diverse locations (Uvalde, Weslaco) and two
seasons revealed the mid- to long-term effects of HS on bell pepper growth, yield and
quality, as well as soil chemical and microbial properties under different irrigation levels
and soil types. HS increased bell pepper early growth and early yield in clay soil
(Uvalde), especially due to an early yield promotion of the more valuable Fancy size

89
fruit. But in sandy soil (Weslaco), the effects on plant early growth and yield promotion
was inconsistent among different seasons. HS had little or no effects on bell pepper
quality regardless of soil types. HS decreased plant gas exchange performance during the
vegetative growth period after irrigation treatment started; meanwhile, HS increased
plant root development in both locations. In the field study, HS did not greatly change
the soil chemical environment over two years, but increased soil organic carbon content,
soil respiration and microbial activity, while they decreased the activity of fungi due to
the increase in nitrogen content.
As mentioned by Brown et al. (2014), information about chemical structure,
molecular nature and mineral concentration of HS is still in need for further investigation
in order to be considered for specific agricultural uses. Moreover, a detailed study
relating enzyme activity, ABA concentration changes and root dynamics is required for a
better understanding of the specific mechanisms of mitigation and promotion effects of
HS.
Conclusions
In conclusion, the future potential use of lignite-derived HS as soil amendment
could be focused on three functions: a) improve seedling vigor, especially root
development; b) promote biota growth, improve crop yield and soil nutrient retention;
and c) relief and mitigate plants grown under abiotic stress conditions.

90
REFERENCES
Aeschbacher, M., Graf, C., Schwarzenbach, R. P., Sander, M. (2012): Antioxidant
properties of humic substances. Environ. Sci. Technol. 46, 4916-4925.
Allen, R. G. (2000): Using the FAO-56 dual crop coefficient method over an irrigated
region as part of an evapotranspiration intercomparison study. J. Hydrol. 229, 27-
41.
Allen, R. G., Pereira, L. S., Raes, D., Smith, M. (1998): Crop Evapotranspiration-
Guidelines for Computing Crop Water Requirements. FAO, Rome.
Allison, S. D., Hanson, C. A., Treseder, K. K. (2007): Nitrogen fertilization reduces
diversity and alters community structure of active fungi in boreal ecosystems.
Soil Biol. Biochem. 39, 1878-1887.
Azcona, I., Pascual, I., Aguirreolea, J., Fuentes, M., García‐Mina, J. M., Sánchez‐Díaz, M. (2011): Growth and development of pepper are affected by humic
substances derived from composted sludge. J. Plant Nutr. Soil Sci. 174, 916-924.
Babiuk, L., Paul, E. (1970): The use of fluorescein isothiocyanate in the determination of
the bacterial biomass of grassland soil. Can. J. Microbiol. 16, 57-62.
Bailey, V. L., Smith, J. L., Bolton, H. (2002): Fungal-to-bacterial ratios in soils
investigated for enhanced C sequestration. Soil Biol. Biochem. 34, 997-1007.
Bollag, J.-M., Myers, C. (1992): Detoxification of aquatic and terrestrial sites through
binding of pollutants to humic substances. Sci. Total Environ. 117, 357-366.
Brooks, S. D., DeMott, P. J., Kreidenweis, S. M. (2004): Water uptake by particles
containing humic materials and mixtures of humic materials with ammonium
sulfate. Atmos. Environ. 38, 1859-1868.
Brown, A. L., Jackson, W. R., Cavagnaro, T. R. (2014): A meta-analysis and review of
plant-growth response to humic substances: practical implications for agriculture.
Adv. Agron. 124, 37-46.
Bulluck, L., Brosius, M., Evanylo, G., Ristaino, J. (2002): Organic and synthetic fertility
amendments influence soil microbial, physical and chemical properties on
organic and conventional farms. Appl Soil Ecol. 19, 147-160.
Canellas, L. P., Olivares, F. L., Okorokova-Façanha, A. L., Façanha, A. R. (2002):
Humic acids isolated from earthworm compost enhance root elongation, lateral

91
root emergence, and plasma membrane H+-ATPase activity in maize roots. Plant
Physiol. 130, 1951-1957.
Chen, Y., Aviad, T. (1990): Effects of humic substances on plant growth, in MacCarthy,
P., Bloom, P. R., Clapp, C. E., Malcolm, R. L. (eds.): Humic Substances in Soil
and Crop Sciences: Selected Readings. Soil Science Society of America,
Madison, Wisconsin, USA, pp. 161-186.
Ciarkowska, K., Sołek-Podwika, K., Filipek-Mazur, B., Tabak, M. (2017): Comparative
effects of lignite-derived humic acids and FYM on soil properties and vegetable
yield. Geoderma 303, 85-92.
David, P., Nelson, P., Sanders, D. (1994): A humic acid improves growth of tomato
seedling in solution culture. J. Plant Nutr. 17, 173-184.
Davidson, E., Belk, E., Boone, R. D. (1998): Soil water content and temperature as
independent or confounded factors controlling soil respiration in a temperate
mixed hardwood forest. Glob. Change Biol. 4, 217-227.
De Paolis, F., Kukkonen, J. (1997): Binding of organic pollutants to humic and fulvic
acids: influence of pH and the structure of humic material. Chemosphere 34,
1693-1704.
De Vries, F. T., Hoffland, E., van Eekeren, N., Brussaard, L., Bloem, J. (2006):
Fungal/bacterial ratios in grasslands with contrasting nitrogen management. Soil
Biol. Biochem. 38, 2092-2103.
Diacono, M., Montemurro, F. (2010): Long-term effects of organic amendments on soil
fertility. A review. Agron. Sustain. Dev 30, 401-422.
Dunstone, R., Richards, R., Rawson, H. (1988): Variable responses of stomatal
conductance, growth, and yield to fulvic acid applications to wheat. Aust. J.
Agric. Res. 39, 547-553.
Epstein, E. (1996): The science of composting. CRC press, Florida, USA.
FAO (2014): Statistical databases.
Fereres, E., Soriano, M. A. (2006): Deficit irrigation for reducing agricultural water use.
J. Exp. Bot. 58, 147-159.
Ferretti, M., Passera, C., Ghisi, R., Nardi, S. (1991): Effect of humic substances on
photosynthetic sulphate assimilation in maize seedlings. Can. J. Soil Sci. 71, 239-
242.

92
Goyal, S., Chander, K., Mundra, M., Kapoor, K. (1999): Influence of inorganic
fertilizers and organic amendments on soil organic matter and soil microbial
properties under tropical conditions. Biol. Fertil. Soils 29, 196-200.
Gryndler, M., Hršelová, H., Sudová, R., Gryndlerová, H., Řezáčová, V., Merhautová, V.
(2005): Hyphal growth and mycorrhiza formation by the arbuscular mycorrhizal
fungus Glomus claroideum BEG 23 is stimulated by humic substances.
Mycorrhiza 15, 483-488.
Halim, M., Conte, P., Piccolo, A. (2003): Potential availability of heavy metals to
phytoextraction from contaminated soils induced by exogenous humic
substances. Chemosphere 52, 265-275.
Haney, R., Brinton, W., Evans, E. (2008): Soil CO2 respiration: Comparison of chemical
titration, CO2 IRGA analysis and the Solvita gel system. Renew. Agric. Food
Syst. 23, 171-176.
Hartz, T. K., Bottoms, T. G. (2010): Humic substances generally ineffective in improving
vegetable crop nutrient uptake or productivity. HortScience 45, 906-910.
Ingham, E., Klein, D. (1984): Soil fungi: relationships between hyphal activity and
staining with fluorescein diacetate. Soil Biol. Biochem. 16, 273-278.
Jindo, K., Martim, S. A., Navarro, E. C., Pérez-Alfocea, F., Hernandez, T., Garcia, C.,
Aguiar, N. O., Canellas, L. P. (2012): Root growth promotion by humic acids
from composted and non-composted urban organic wastes. Plant Soil 353, 209-
220.
Jones, H. G. (2004): Irrigation scheduling: advantages and pitfalls of plant-based
methods. J. Exp. Bot. 55, 2427-2436.
Karapanagioti, H. K., Kalaitzidis, S., Vakros, J., Christanis, K., Liebner, F. (2010):
Effect of ammonoxidation on lignite properties. Environ. Chem. Lett. 8, 373-380.
Keeney, D. R., Nelson, D. W. (1982): Nitrogen—inorganic forms, in Dinauer, R. C.
(eds.): Methods of Soil Analysis. Part 2. Chemical and Microbiological
Properties. American Society of Agronomy, Soil Science Society of America,
Madison, Wisconsin, USA, pp. 643-698.
Kulikova, N., Stepanova, E., Koroleva, O. (2005): Mitigating activity of humic
substances: direct influence on biota, in Perminova, I. V., Hatfield, K., Hertkorn,
N. (eds.): Use of Humic Substances to Remediate Polluted Environments: From
Theory to Practice. Springer, Zvenigorod, Russia, pp. 285-309.

93
Lal, R. (2009): Soil degradation as a reason for inadequate human nutrition. Food Secur
1, 45-57.
Lauber, C. L., Strickland, M. S., Bradford, M. A., Fierer, N. (2008): The influence of soil
properties on the structure of bacterial and fungal communities across land-use
types. Soil Biol. Biochem. 40, 2407-2415.
Leskovar, D., Othman, Y., Dong, X. (2016): Strip tillage improves soil biological
activity, fruit yield and sugar content of triploid watermelon. Soil Tillage Res.
163, 266-273.
Lobartini, J., Orioli, G., Tan, K. (1997): Characteristics of soil humic acid fractions
separated by ultrafiltration. Commun. Soil Sci. Plant Anal. 28, 787-796.
Lovley, D. R., Coates, J. D., Blunt-Harris, E. L., Phillips, E. J., Woodward, J. C. (1996):
Humic substances as electron acceptors for microbial respiration. Nature 382,
445.
MacCarthy, P., Malcolm, R. L., Clapp, C. E., Bloom, P. R. (1990): An introduction to
soil humic substances, in MacCarthy, P., Bloom, P. R., Clapp, C. E., Malcolm, R.
L. (eds.): Humic Substances in Soil and Crop Sciences: Selected Readings. Soil
Science Society of America, Madison, Wisconsin, USA, pp. 1-12.
Malcolm, R. L., MacCarthy, P. (1986): Limitations in the use of commercial humic acids
in water and soil research. Environ. Sci. Technol. 20, 904-911.
Mehlich, A. (1978): New extractant for soil test evaluation of phosphorus, potassium,
magnesium, calcium, sodium, manganese and zinc. Commun. Soil Sci. Plant
Anal. 9, 477-492.
Merlo, L., Ghisi, R., Passera, C., Rascio, N. (1991): Effects of humic substances on
carbohydrate metabolism of maize leaves. Can. J. Plant Sci. 71, 419-425.
Morsomme, P., Boutry, M. (2000): The plant plasma membrane H+-ATPase: structure,
function and regulation. Biochim. Biophys. Acta, Biomembr. 1465, 1-16.
Nardi, S., Panuccio, M., Abenavoli, M., Muscolo, A. (1994): Auxin-like effect of humic
substances extracted from faeces of Allolobophora caliginosa and A. rosea. Soil
Biol. Biochem. 26, 1341-1346.
Nardi, S., Pizzeghello, D., Muscolo, A., Vianello, A. (2002): Physiological effects of
humic substances on higher plants. Soil Biol. Biochem. 34, 1527-1536.
Neher, D. (1999): Soil community composition and ecosystem processes: comparing
agricultural ecosystems with natural ecosystems. Agrofor. Syst. 45, 159-185.

94
Piccolo, A., Celano, G., Pietramellara, G. (1993): Effects of fractions of coal-derived
humic substances on seed germination and growth of seedlings (Lactuga sativa
and Lycopersicum esculentum). Biol. Fertil. Soils 16, 11-15.
Rhoades, J. D. (1982): Soluble salts, in Dinauer, R. C. (eds.): Methods of Soil Analysis.
Part 2. Chemical and Microbiological Properties. American Society of
Agronomy, Soil Science Society of America, Madison, Wisconsin, USA, pp.
167-178.
Rose, M. T., Patti, A. F., Little, K. R., Brown, A. L., Jackson, W. R., Cavagnaro, T. R.
(2014): A meta-analysis and review of plant-growth response to humic
substances: practical implications for agriculture, in Sparks, D. L. (ed.):
Advances in Agronomy, Volume 124. Elsevier, Amsterdam, Netherlands, pp. 37-
89.
Rumpel, C., Knicker, H., Kögel-Knabner, I., Skjemstad, J., Hüttl, R. (1998): Types and
chemical composition of organic matter in reforested lignite-rich mine soils.
Geoderma 86, 123-142.
Selim, E., Mosa, A., El-Ghamry, A. (2009): Evaluation of humic substances fertigation
through surface and subsurface drip irrigation systems on potato grown under
Egyptian sandy soil conditions. Agric. Water Manag. 96, 1218-1222.
Sharif, M., Khattak, R. A., Sarir, M. (2002): Effect of different levels of lignitic coal
derived humic acid on growth of maize plants. Commun. Soil Sci. Plant Anal. 33,
3567-3580.
Shepherd, T., Saggar, S., Newman, R., Ross, C., Dando, J. (2001): Tillage-induced
changes to soil structure and organic carbon fractions in New Zealand soils. Soil
Res. 39, 465-489.
Smith, A. B., Matthews, J. L. (2015): Quantifying uncertainty and variable sensitivity
within the US billion-dollar weather and climate disaster cost estimates. Nat.
Hazards 77, 1829-1851.
Stamatiadis, S., Doran, J., Ingham, E. (1990): Use of staining and inhibitors to separate
fungal and bacterial activity in soil. Soil Biol. Biochem. 22, 81-88.
Tahir, M., Khurshid, M., Khan, M., Abbasi, M., Kazmi, M. (2011): Lignite-derived
humic acid effect on growth of wheat plants in different soils. Pedosphere 21,
124-131.
Taiz, L., Zeiger, E., Møller, I. M., Murphy, A. (2015): Plant Physiology and
Development. Sinauer Associates, Incorporated, Cary, NC, USA.

95
Treseder, K. K. (2008): Nitrogen additions and microbial biomass: A meta-analysis of
ecosystem studies. Ecol. Lett. 11, 1111-1120.
USDA (2005): United States standards for grades of sweet peppers.
Valdrighi, M. M., Pera, A., Agnolucci, M., Frassinetti, S., Lunardi, D., Vallini, G.
(1996): Effects of compost-derived humic acids on vegetable biomass production
and microbial growth within a plant (Cichorium intybus)-soil system: a
comparative study. Agric. Ecosyst. Environ. 58, 133-144.
Van Veen, J. A., Paul, E. A. (1979): Conversion of biovolume measurements of soil
organisms, grown under various moisture tensions, to biomass and their nutrient
content. Appl. Environ. Microbiol. 37, 686-692.
Varanini, Z., Pinton, R., De Biasi, M., Astolfi, S., Maggioni, A. (1993): Low molecular
weight humic substances stimulate H+-ATPase activity of plasma membrane
vesicles isolated from oat (Avena sativa L.) roots. Plant Soil 153, 61-69.
Villalón, B. (1981): Breeding Peppers. Plant Disease 65, 557.
Vlčková, Z., Grasset, L., Antošová, B., Pekař, M., Kučerík, J. (2009): Lignite pre-
treatment and its effect on bio-stimulative properties of respective lignite humic
acids. Soil Biol. Biochem. 41, 1894-1901.
Xu, X., Shi, Z., Li, D., Rey, A., Ruan, H., Craine, J. M., Liang, J., Zhou, J., Luo, Y.
(2016): Soil properties control decomposition of soil organic carbon: results from
data-assimilation analysis. Geoderma 262, 235-242.
Copyright © 2022 FDOKUMEN