The Case of Osor, Catalonia, Spai - MDPI
14
Minerals 2020, 10, 819; doi:10.3390/min10090819 www.mdpi.com/journal/minerals Article The Use of Tailings to Make Glass as an Alternative for Sustainable Environmental Remediation: The Case of Osor, Catalonia, Spain Pura Alfonso 1 , Oriol Tomasa 1 , Luis Miguel Domenech 2,3 , Maite Garcia-Valles 2, *, Salvador Martinez 2 and Núria Roca 4 1 Departament d’Enginyeria Minera, Industrial i TIC, Universitat Politècnica de Catalunya Barcelona Tech, Av. de les Bases de Manresa 61–63, 08242 Manresa, Spain; [email protected] (P.A.); [email protected] (O.T.) 2 Departament de Mineralogia, Petrologia i Geologia Aplicada, Universitat de Barcelona, Carrer Martí i Franquès 1, 08028 Barcelona, Spain; [email protected] (L.M.D.); [email protected] (S.M.) 3 Departament de Mecànica de Fluids, Universitat Politècnica de Catalunya Barcelona Tech, Carrer Colom 11, 08222 Terrassa, Spain 4 Departament de Biologia Evolutiva, Ecologia i Ciències Ambientals, Universitat de Barcelona, Av. Diagonal 343, 08028 Barcelona, Spain; [email protected] * Correspondence: [email protected]; Tel.: +34-934-02-13-48 Received: 17 August 2020; Accepted: 14 September 2020; Published: 16 September 2020 Abstract: Tailings from the Osor fluorite mines release large amounts of potentially toxic elements into the environment. This work is a proposal to remove these waste materials and use them as a raw material in the manufacture of glass. The chemical composition of the tailings was determined by X-ray fluorescence and the mineralogy by X-ray diffraction. Waste materials have SiO2, Al2O3 and CaO contents suitable for a glass production, but Na as NaCO3 has to be added. Two glass formulations, with 80–90% of the residue and 10–20% Na2CO3, have been produced. The crystallization temperatures, obtained by differential thermal analysis, were 875 and 901 °C, and the melting temperatures were 1220 and 1215 °C for the G80-20 and G90-10 glasses, respectively. The transition temperatures of glass were 637 and 628 °C. The crystalline phases formed in the thermal treatment to produce devitrification were nepheline, plagioclase and diopside in the G80-20 glass, and plagioclase and akermanite-gehlenite in the G90-10 glass. The temperatures for the fixed viscosity points, the working temperatures and the coefficient of expansion were obtained. The chemical stability of the glass was tested and results indicate that the potentially toxic elements of the tailings were incorporated into the glass structure. Keywords: recycling; tailings; glass; workability 1. Introduction Tailings produce a large number of environmental impacts [1]. Especially dangerous are the problems that occur when the tailings result from the processing of sulphide ores. In these cases the interaction of meteoric water with the sulphides remaining in the tailings drives the generation of acid drainage, which can carry large amounts of potentially toxic elements [2–4]. These elements are liberated into the environment and produce pollution in water, which cannot be used for other applications. Special care must be taken in those tailings with small particles, since this enlarges the reactive surface, thus promoting the development of acid-generation reactions [5].
-
Upload
khangminh22 -
Category
Documents
-
view
4 -
download
0
Transcript of The Case of Osor, Catalonia, Spai - MDPI
Minerals 2020, 10, 819; doi:10.3390/min10090819 www.mdpi.com/journal/minerals
Article
The Use of Tailings to Make Glass as an Alternative
for Sustainable Environmental Remediation:
The Case of Osor, Catalonia, Spain
Pura Alfonso 1, Oriol Tomasa 1, Luis Miguel Domenech 2,3, Maite Garcia-Valles 2,*,
Salvador Martinez 2 and Núria Roca 4
1 Departament d’Enginyeria Minera, Industrial i TIC, Universitat Politècnica de Catalunya Barcelona Tech,
Av. de les Bases de Manresa 61–63, 08242 Manresa, Spain; [email protected] (P.A.);
[email protected] (O.T.) 2 Departament de Mineralogia, Petrologia i Geologia Aplicada, Universitat de Barcelona,
Carrer Martí i Franquès 1, 08028 Barcelona, Spain; [email protected] (L.M.D.);
[email protected] (S.M.) 3 Departament de Mecànica de Fluids, Universitat Politècnica de Catalunya Barcelona Tech,
Carrer Colom 11, 08222 Terrassa, Spain 4 Departament de Biologia Evolutiva, Ecologia i Ciències Ambientals, Universitat de Barcelona,
Av. Diagonal 343, 08028 Barcelona, Spain; [email protected]
* Correspondence: [email protected]; Tel.: +34-934-02-13-48
Received: 17 August 2020; Accepted: 14 September 2020; Published: 16 September 2020
Abstract: Tailings from the Osor fluorite mines release large amounts of potentially toxic elements
into the environment. This work is a proposal to remove these waste materials and use them as a
raw material in the manufacture of glass. The chemical composition of the tailings was determined
by X-ray fluorescence and the mineralogy by X-ray diffraction. Waste materials have SiO2, Al2O3
and CaO contents suitable for a glass production, but Na as NaCO3 has to be added. Two glass
formulations, with 80–90% of the residue and 10–20% Na2CO3, have been produced. The
crystallization temperatures, obtained by differential thermal analysis, were 875 and 901 °C, and
the melting temperatures were 1220 and 1215 °C for the G80-20 and G90-10 glasses, respectively. The
transition temperatures of glass were 637 and 628 °C. The crystalline phases formed in the thermal
treatment to produce devitrification were nepheline, plagioclase and diopside in the G80-20 glass,
and plagioclase and akermanite-gehlenite in the G90-10 glass. The temperatures for the fixed
viscosity points, the working temperatures and the coefficient of expansion were obtained. The
chemical stability of the glass was tested and results indicate that the potentially toxic elements of
the tailings were incorporated into the glass structure.
Keywords: recycling; tailings; glass; workability
1. Introduction
Tailings produce a large number of environmental impacts [1]. Especially dangerous are the
problems that occur when the tailings result from the processing of sulphide ores. In these cases the
interaction of meteoric water with the sulphides remaining in the tailings drives the generation of
acid drainage, which can carry large amounts of potentially toxic elements [2–4]. These elements are
liberated into the environment and produce pollution in water, which cannot be used for other
applications. Special care must be taken in those tailings with small particles, since this enlarges the
reactive surface, thus promoting the development of acid-generation reactions [5].
Minerals 2020, 10, 819 2 of 14
The world consumption of mineral resources is very large and produces a large amount of
waste, which has been reported as at least 5 to 7 billion tons of mine tailings per year [6], and up to 14
billion tons per year [7]. It is expected this will increase throughout the 21st century due to the need
to exploit ores with lower grade [8]. Thus, management strategies that contribute new solutions for
sustainable development need to be adopted. The recycling of these tailings is an attractive proposal
for tailings management. This has a double benefit since the volume of new exploitations can be
reduced, which is one of the principles of the circular economy [9]. On the other hand, materials
from tailings frequently have high homogeneity and a fine particle size, which is useful for many
applications and important energy savings can be obtained.
Moreover, the recycling of tailings for use as raw materials for the manufacture of glass and
glass-ceramics removes the hazardous elements from the environment. Vitrification is a stabilization
technology for hazardous wastes since it converts them into a stable glass or glass-ceramic that is
suitable for manufacturing products for commercial purposes [10,11]. The mine wastes used in glass
manufacturing have been extensively studied to produce glass [12–14], glass fibres [15] and
glass-ceramics [16–19].
In this work, the tailings from the Osor mines (Girona, Catalonia, Spain), are characterized and
their viability to be used as raw material for the production of commercial glass is evaluated. This is
a proposal for using these raw materials in the manufacture of glass, thus contributing to the
remediation of the old mining area. The Osor tailings are of special interest for making glass. They
show two favourable characteristics in their chemical composition because they are waste materials
of an old mine in which one of the ores was fluorite; thus, these residues are rich in fluorine and
calcium. These elements favour the manufacture of glass, so the addition of CaF2 decreases melting
and sintering temperatures [20]. CaF2 can play an important role in the properties of glass and
glass-ceramics [21,22]. Fluorine replaces bridging oxygens in the glass network by nonbridging
fluorine, which disrupts and weakens the glass network [21]. Calcium can act as a network modifier
and as charge compensator for the deficiency in positive charges produced by the Al-Si substitution
in the tetrahedral sites [23,24] in silicate glasses, which depolymerizes the glass network following
the formation of nonbridging oxygen.
The Osor mines became one of the most important mines in Catalonia, and were exploited from
Roman times until the 1980s. The volume of production was especially high between 1942 and 1980,
with a daily production during the last period of activity of 80 to 90 tons of fluorite, 10 to 12 tons of
zinc, and 6 to 7 tons of lead [25]. Although the mine water has a neutral pH due to the high content
of neutralising minerals, it is rich in metals, especially Cd, Co, Pb, Zn, As, Ba and Sb [26], leached
from the breakage of the sulphide minerals. Part of these pollutants come directly from the mine
adits but also from the tailings. The small particle size of the tailings, less than 200 µm, contributes to
the high pollution in soils, sediments and surface waters of the area. The tailings containing
potentially toxic elements are leached and end up in the river that is a few meters from the dump
[27,28].
2. Materials and Methods
2.1. Materials
The Osor mines are located in the Montseny massif, Prelitoral Catalan coastal range, 30 km west
of the city of Girona. The mine exploited Ba-F-Pb-Zn veins hosted in metapelitic rocks of Paleozoic
age. Such veins are abundant in the Catalonian coastal ranges with other exploited deposits, such as
the Berta mine [29]. The exploited minerals were mainly fluorite, galena and sphalerite, hosted in
quartz, with a minor amount of calcite, barite and pyrite.
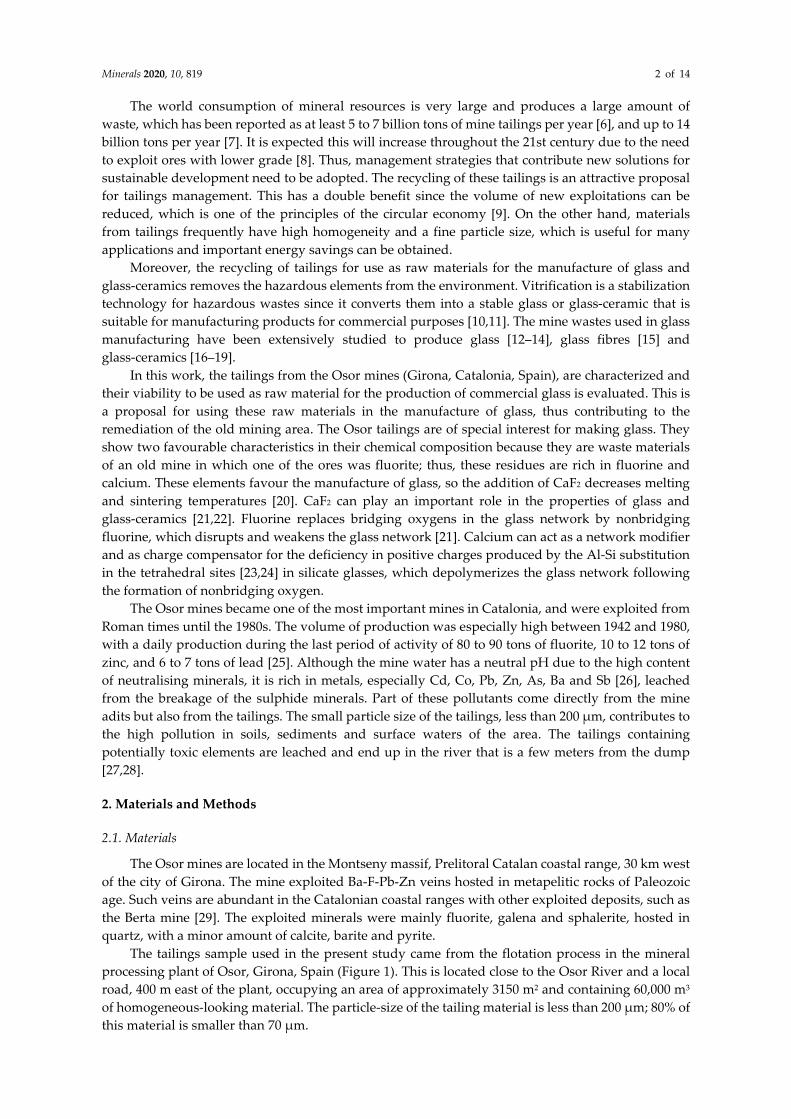
The tailings sample used in the present study came from the flotation process in the mineral
processing plant of Osor, Girona, Spain (Figure 1). This is located close to the Osor River and a local
road, 400 m east of the plant, occupying an area of approximately 3150 m2 and containing 60,000 m3
of homogeneous-looking material. The particle-size of the tailing material is less than 200 µm; 80% of
this material is smaller than 70 µm.
Minerals 2020, 10, 819 3 of 14
Three composite samples of about 10 kg each were collected from profiles along different levels
of height of the tailing. Samples OS-1 and OS-3 represent the lower and uppermost parts of the
tailing and OS-2 was obtained at the intermediate height of the tailing. Samples were dried, sieved
and quartered to determine their chemical and mineralogical compositions.
Figure 1. Satellite image showing UTM coordinates and the location of the Osor tailings.
Sample OS-2 was selected for experiments because it represents most of the tailing material.
This material was powdered and quartered to obtain homogeneous samples. According to the
chemical composition of the raw tailing, two glasses were prepared, taking into account that the
composition should be equilibrated with respect to the content of former, stabilizer, and refining
oxides to produce a commercial quality glass [17]. To this end, the tailing sample was mixed with
Na2CO3 (PANREAC, Barcelona, Spain cod.131648). Two glasses were obtained in order to establish
their industrial behaviour by using 80 wt.% tailing and 20 wt.% Na2CO3 (sample G90-10), and 90 wt.%
tailing and 10 wt.% Na2CO3 (sample G80-20). In order to obtain a homogeneous sample, each mixture
was homogenized in a ball mill for 48 h.
2.2. Analytical Methods
The particle size distribution of the tailing samples was determined by means of an LS 13 320.
Coulter particle size analyser (Beckman, Brea, CA, USA). The chemical composition of tailing
samples was determined by X-ray fluorescence (XRF) using a Thermo Scientific ARL ADVANT’XP
series instrument (ThermoFisher Scientific, Waltan, MA, USA). The mineralogical composition of the
tailings and the phases formed during the thermal treatment of the glasses were determined by
X-ray powder diffraction (XRD) using a Bragg-Brentano PANAnalyticalX’Pert Diffractometer. The
system has graphite monochromator, an automatic gap, Cu Kα-radiation at λ = 1.54061 Å, powered
at 45 kV-40 mA, a scanning range of 4–100° with a 0.017° 2θ step scan and a 50 s measuring time.
Identification and semiquantitative evaluation of the phases was performed by using PANanalytical
X’Pert HighScore software (Malvern PANanalytical, Malvern, UK). XRD and scanning electron
microscopy (SEM) were used to demonstrate the amorphous structure of the glasses. The equipment
used was a compact Phenom XL Desktop SEM (ThermoFisher Scientific, Waltan, MA, USA).
The density of the glass was measured by the Archimedes method using toluene as the
immersion liquid following the Spanish standard UNE-EN 993-2:1996 [30].
Minerals 2020, 10, 819 4 of 14
Thermal analysis of samples was obtained by simultaneous differential thermal analysis and
thermogravimetry (DTA-TG), using a Netzsch instrument (STA 409C model NETZSCH-Gerätebau
GmbH, Selb, Bavaria, Germany). Analyses were carried out in the temperature range 25–1300 °C
under an air atmosphere, at a constant flow rate of 80 mL/min, in a platinum crucible and at a
heating rate of 10 °C/min. The amount of sample analysed was ~75 mg. The aluminium oxide Perkin
Elmer 0419–0197 was taken as reference.
Glass transition temperature analysis (Tg), the dilatometric softening point (Td) and the
expansion coefficient were measured with a Linseis horizontal dilatometer L76/1550 (Linseis
Messgeräte GmbH, Selb, Bavaria, Germany) using a 2 cm annealing bar. The experiment was carried
out from room temperature to 1300 °C at a heating rate of 10 °C/min. Viscosity at Tg had a constant
value, independent of composition, of 1012.3 Pa·s [31].
The experimental viscosity–temperature curves (η–T) were drawn using the fixed points
defined by Scholze [32] for hot-stage microscopy (HSM) according to rule DIN 51730 [33] and Tg
(obtained with dilatometry). In this case, a quenching glass sample, with 3-mm-high test cylinders,
was conformed with raw materials powdered under 45 µm and bound using a 1/20 solution of
Elvacite® in acetone, and conformed in a uniaxial press. Test cylinders were heated at a 5 °C/min rate
from room temperature to 1500 °C in an air atmosphere. This process was recorded in pictures with
ProgRes Capture Pro software (Jenoptik AG, Jena, Germany). Analysis was performed with
Hot-Stage software, developed by the Departament de Llenguatges i Sistemes Informàtics, ETSEIB,
UPC [34]. The output points were plotted in a graph and then fitted to the Vögel-Fulcher-Tammann
(VFT) equation. The theoretical viscosity–temperature curves were obtained using the model
defined by Fluegel [35].
Glass colour was measured with a Spectrophotometer CM-700d Konica-Minolta Investment
Ltd. (Sensing Business Division, Shanghai, China) and calibrated according to international
standards [36]. The spectrophotometer was fitted with a barium sulphate-coated integrating sphere,
and a standard illuminant C was used as a light source. The description of the colour was based on
three parameters: lightness, saturation and intensity [37], which were based on the use of three
coordinates, L*, a* and b*. L* indicates lightness, 100 being white colour and 0 black. The variables a*
and b* are the chromatic coordinates: +a* is the red axis, –a* is the green axis, +b* is the yellow axis
and –b* is the blue axis. Low L* values indicate that the glasses are dark and the a* and b* parameters
correspond to yellowish green glasses. The colour purity was measured by the Chroma (C)
parameter, which is defined by the equation:
C∗ = �a∗� + b∗� (1)
The intensity of colour is defined by the hue angle (h), which can be determined by Equation
(2). Measurement range is 360°, counted clockwise from 0° for the red colour (a*).
h∗ = arctgb∗
a∗ (2)
The refractive index was obtained using a Shibuya MC-601 refractometer (Shibuya Kogyo CO.,
Ltd., Tokyo, Japan).
The chemical stability of the glasses was determined by leaching tests in an acidic solution
according to the DIN38414-S4 standard [38]. Leachates were analysed using inductively coupled
plasma optical emission spectrometry (ICP–OES, Optima 3100, PerkinElmer, Waltham, MA USA)
and ICP–mass spectrometry (ICP-MS, Elan 6000, PerkinElmer, Waltham, MA, USA).
2.3. Glass Production
The raw mixtures were introduced in an alumina-mullite crucible and heated using a globular
alumina furnace equipped with molybdenum disilicide Super Kanthal® and a Eurotherm® 902
programmer. Heating started at 2 °C min–1 up to 800 °C, followed by a holding time of 2 h, and a
second step of heating at 1 °C min–1 up to 900 °C, in order to control the Na2CO3 decomposition, and
a rate of 2 °C min–1 up to 1450 °C, where it remained for 4 h. After this, the components were molten.
Minerals 2020, 10, 819 5 of 14
Part of this melt was cast into a metallic mould preheated at 350 °C and annealed near the glass
transition temperature (Tg) at 450 °C for 30 min, followed by free cooling inside the kiln until room
temperature was reached. Another part of the melt was quenched via casting on a Cu plate.
3. Results and Discussion
3.1. Characterization of the Tailing Materials
The chemical composition of tailing materials from Osor has small variations, as shown in the
analyses of the three samples from different heights of the tailing (Table 1). The differences were not
important for preventing their use in a glass-making plant, but the composition needs to be
periodically controlled to adjust the additives. The more significant variation was in the SiO2
content, which varied from 61.76 to 66.11 wt.%. The high calcium content of the tailings, about 12
wt.%, rendered the addition of this component unnecessary. However, the low content in alkaline
oxides, 1.33–1.54 wt.% of Na2O and 2.46–2.66 wt.% of K2O, rendered the addition of them necessary.
The content of potentially toxic elements was significant; the experimental sample had As 12.6,
Bi 0.212, Sb 3.1, Hg 0.064, Cr 35.5, Pb 4930, Zn 4500 and Cu 264 ppm.
Table 1. Chemical composition, in wt.%, of the raw Osor tailings.
Samples Os-1 Os-2 Os-3
SiO2 66.11 61.76 65.69
Al2O3 11.69 11.11 11.09
TiO2 0.42 0.38 0.39
Fe2O3 2.85 2.79 2.76
CaO 12.07 12.15 11.31
MgO 1.05 1.03 1.00
BaO 0.50 0.45 0.61
MnO 0.12 0.10 0.11
Na2O 1.43 1.54 1.33
K2O 2.66 2.46 2.52
P2O5 0.09 0.10 0.11
Zn 0.02 0.61 0.02
Pb 0.33 0.45 0.34
S 0.22 0.48 0.29
F– 3.70 2.03
–O = F2 –1.56 –0.85
∑ 99.59 98.51 98.74
The mineralogical composition of the Osor tailing showed small variations in different areas.
The most abundant minerals were quartz, albite, K-feldspar, muscovite, chlorite and calcite (Figure
2). Locally, gypsum and sphalerite occurred in relatively significant amounts (Table 2).
Minerals 2020, 10, 819 6 of 14
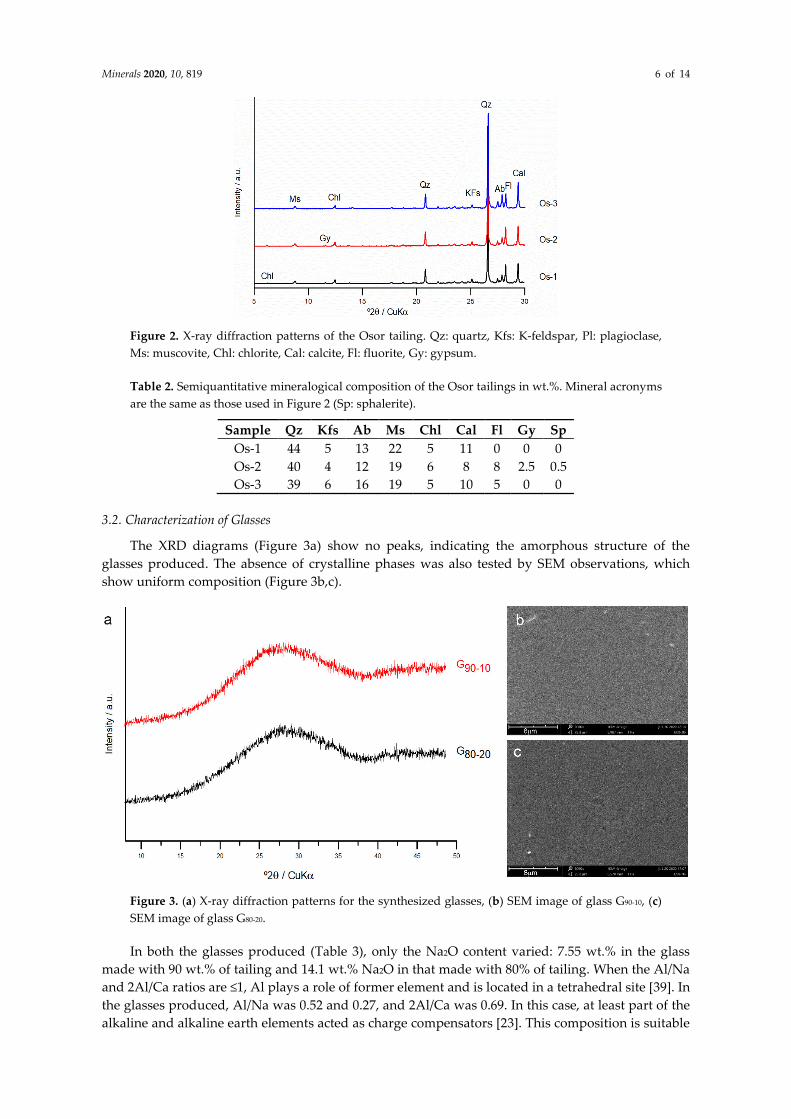
Figure 2. X-ray diffraction patterns of the Osor tailing. Qz: quartz, Kfs: K-feldspar, Pl: plagioclase,
Ms: muscovite, Chl: chlorite, Cal: calcite, Fl: fluorite, Gy: gypsum.
Table 2. Semiquantitative mineralogical composition of the Osor tailings in wt.%. Mineral acronyms
are the same as those used in Figure 2 (Sp: sphalerite).
Sample Qz Kfs Ab Ms Chl Cal Fl Gy Sp
Os-1 44 5 13 22 5 11 0 0 0
Os-2 40 4 12 19 6 8 8 2.5 0.5
Os-3 39 6 16 19 5 10 5 0 0
3.2. Characterization of Glasses
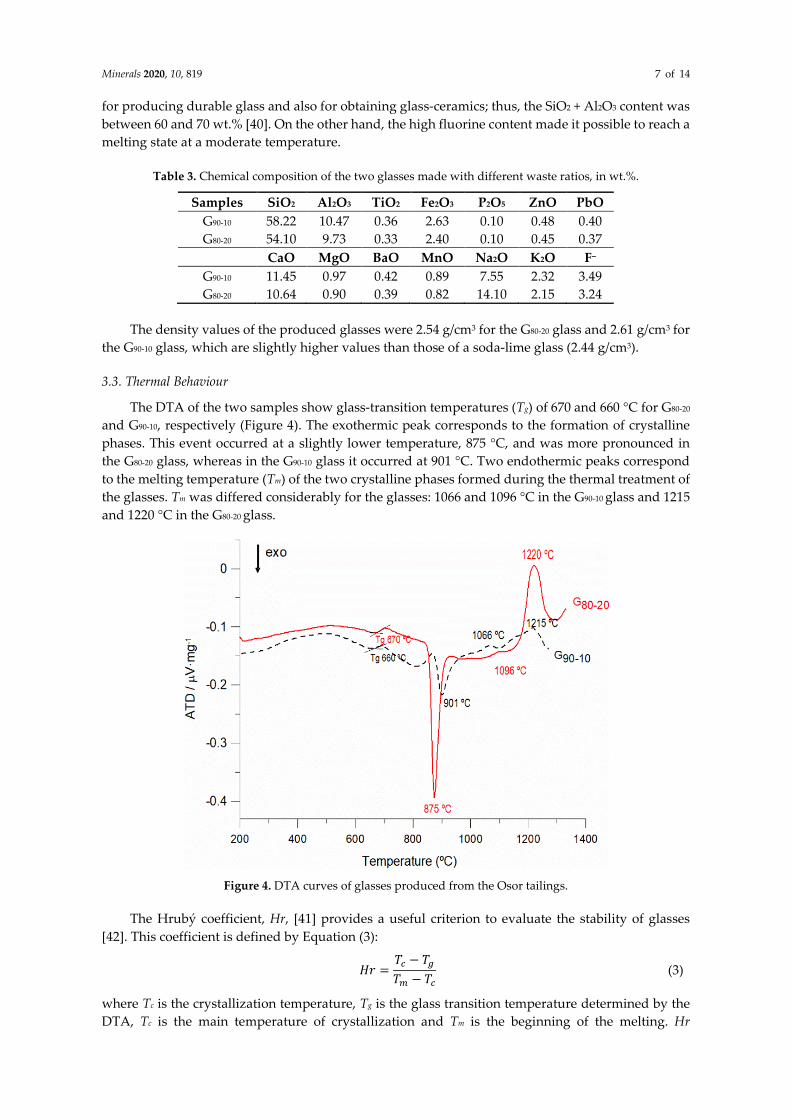
The XRD diagrams (Figure 3a) show no peaks, indicating the amorphous structure of the
glasses produced. The absence of crystalline phases was also tested by SEM observations, which
show uniform composition (Figure 3b,c).
Figure 3. (a) X-ray diffraction patterns for the synthesized glasses, (b) SEM image of glass G90-10, (c)
SEM image of glass G80-20.
In both the glasses produced (Table 3), only the Na2O content varied: 7.55 wt.% in the glass
made with 90 wt.% of tailing and 14.1 wt.% Na2O in that made with 80% of tailing. When the Al/Na
and 2Al/Ca ratios are ≤1, Al plays a role of former element and is located in a tetrahedral site [39]. In
the glasses produced, Al/Na was 0.52 and 0.27, and 2Al/Ca was 0.69. In this case, at least part of the
alkaline and alkaline earth elements acted as charge compensators [23]. This composition is suitable
Minerals 2020, 10, 819 7 of 14
for producing durable glass and also for obtaining glass-ceramics; thus, the SiO2 + Al2O3 content was
between 60 and 70 wt.% [40]. On the other hand, the high fluorine content made it possible to reach a
melting state at a moderate temperature.
Table 3. Chemical composition of the two glasses made with different waste ratios, in wt.%.
Samples SiO2 Al2O3 TiO2 Fe2O3 P2O5 ZnO PbO
G90-10 58.22 10.47 0.36 2.63 0.10 0.48 0.40
G80-20 54.10 9.73 0.33 2.40 0.10 0.45 0.37 CaO MgO BaO MnO Na2O K2O F–
G90-10 11.45 0.97 0.42 0.89 7.55 2.32 3.49
G80-20 10.64 0.90 0.39 0.82 14.10 2.15 3.24
The density values of the produced glasses were 2.54 g/cm3 for the G80-20 glass and 2.61 g/cm3 for
the G90-10 glass, which are slightly higher values than those of a soda-lime glass (2.44 g/cm3).
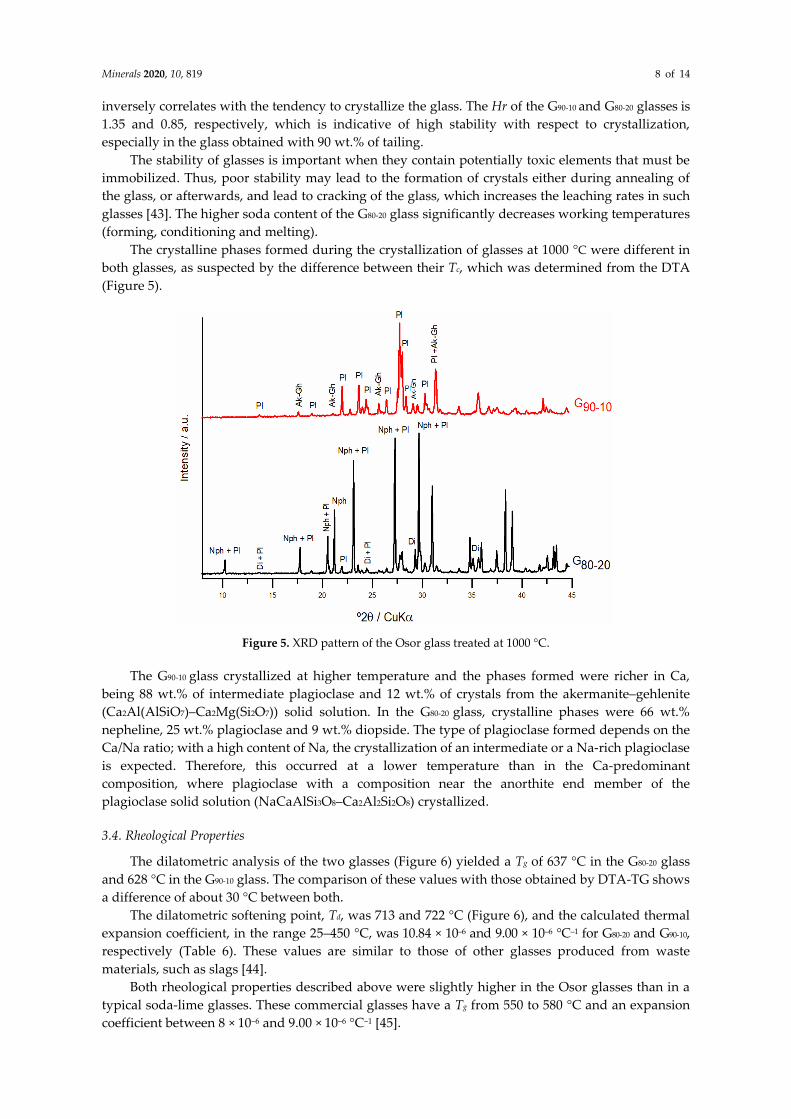
3.3. Thermal Behaviour
The DTA of the two samples show glass-transition temperatures (Tg) of 670 and 660 °C for G80-20
and G90-10, respectively (Figure 4). The exothermic peak corresponds to the formation of crystalline
phases. This event occurred at a slightly lower temperature, 875 °C, and was more pronounced in
the G80-20 glass, whereas in the G90-10 glass it occurred at 901 °C. Two endothermic peaks correspond
to the melting temperature (Tm) of the two crystalline phases formed during the thermal treatment of
the glasses. Tm was differed considerably for the glasses: 1066 and 1096 °C in the G90-10 glass and 1215
and 1220 °C in the G80-20 glass.
Figure 4. DTA curves of glasses produced from the Osor tailings.
The Hrubý coefficient, Hr, [41] provides a useful criterion to evaluate the stability of glasses
[42]. This coefficient is defined by Equation (3):
�� =�� − ��
�� − �� (3)
where Tc is the crystallization temperature, Tg is the glass transition temperature determined by the
DTA, Tc is the main temperature of crystallization and Tm is the beginning of the melting. Hr
Minerals 2020, 10, 819 8 of 14
inversely correlates with the tendency to crystallize the glass. The Hr of the G90-10 and G80-20 glasses is
1.35 and 0.85, respectively, which is indicative of high stability with respect to crystallization,
especially in the glass obtained with 90 wt.% of tailing.
The stability of glasses is important when they contain potentially toxic elements that must be
immobilized. Thus, poor stability may lead to the formation of crystals either during annealing of
the glass, or afterwards, and lead to cracking of the glass, which increases the leaching rates in such
glasses [43]. The higher soda content of the G80-20 glass significantly decreases working temperatures
(forming, conditioning and melting).
The crystalline phases formed during the crystallization of glasses at 1000 °C were different in
both glasses, as suspected by the difference between their Tc, which was determined from the DTA
(Figure 5).
Figure 5. XRD pattern of the Osor glass treated at 1000 °C.
The G90-10 glass crystallized at higher temperature and the phases formed were richer in Ca,
being 88 wt.% of intermediate plagioclase and 12 wt.% of crystals from the akermanite–gehlenite
(Ca2Al(AlSiO7)–Ca2Mg(Si2O7)) solid solution. In the G80-20 glass, crystalline phases were 66 wt.%
nepheline, 25 wt.% plagioclase and 9 wt.% diopside. The type of plagioclase formed depends on the
Ca/Na ratio; with a high content of Na, the crystallization of an intermediate or a Na-rich plagioclase
is expected. Therefore, this occurred at a lower temperature than in the Ca-predominant
composition, where plagioclase with a composition near the anorthite end member of the
plagioclase solid solution (NaCaAlSi3O8–Ca2Al2Si2O8) crystallized.
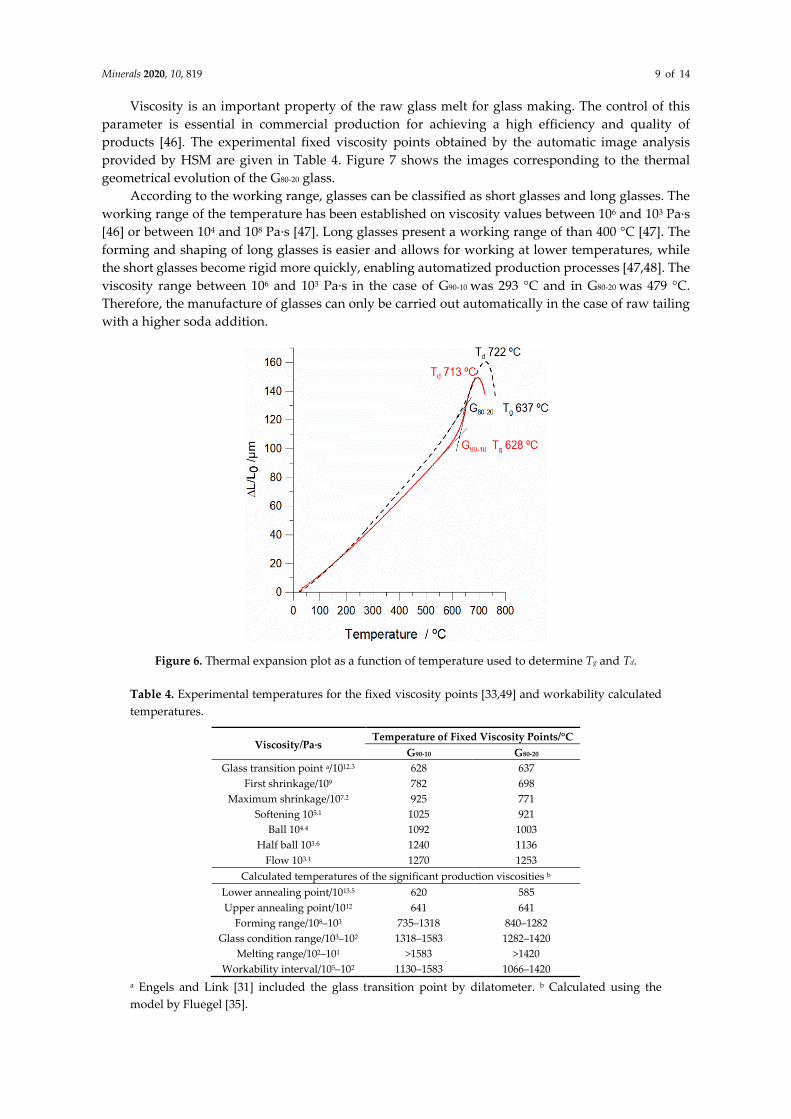
3.4. Rheological Properties
The dilatometric analysis of the two glasses (Figure 6) yielded a Tg of 637 °C in the G80-20 glass
and 628 °C in the G90-10 glass. The comparison of these values with those obtained by DTA-TG shows
a difference of about 30 °C between both.
The dilatometric softening point, Td, was 713 and 722 °C (Figure 6), and the calculated thermal
expansion coefficient, in the range 25–450 °C, was 10.84 × 10⁻⁶ and 9.00 × 10⁻⁶ °C–1 for G80-20 and G90-10,
respectively (Table 6). These values are similar to those of other glasses produced from waste
materials, such as slags [44].
Both rheological properties described above were slightly higher in the Osor glasses than in a
typical soda-lime glasses. These commercial glasses have a Tg from 550 to 580 °C and an expansion
coefficient between 8 × 10⁻⁶ and 9.00 × 10⁻⁶ °C−1 [45].
Minerals 2020, 10, 819 9 of 14
Viscosity is an important property of the raw glass melt for glass making. The control of this
parameter is essential in commercial production for achieving a high efficiency and quality of
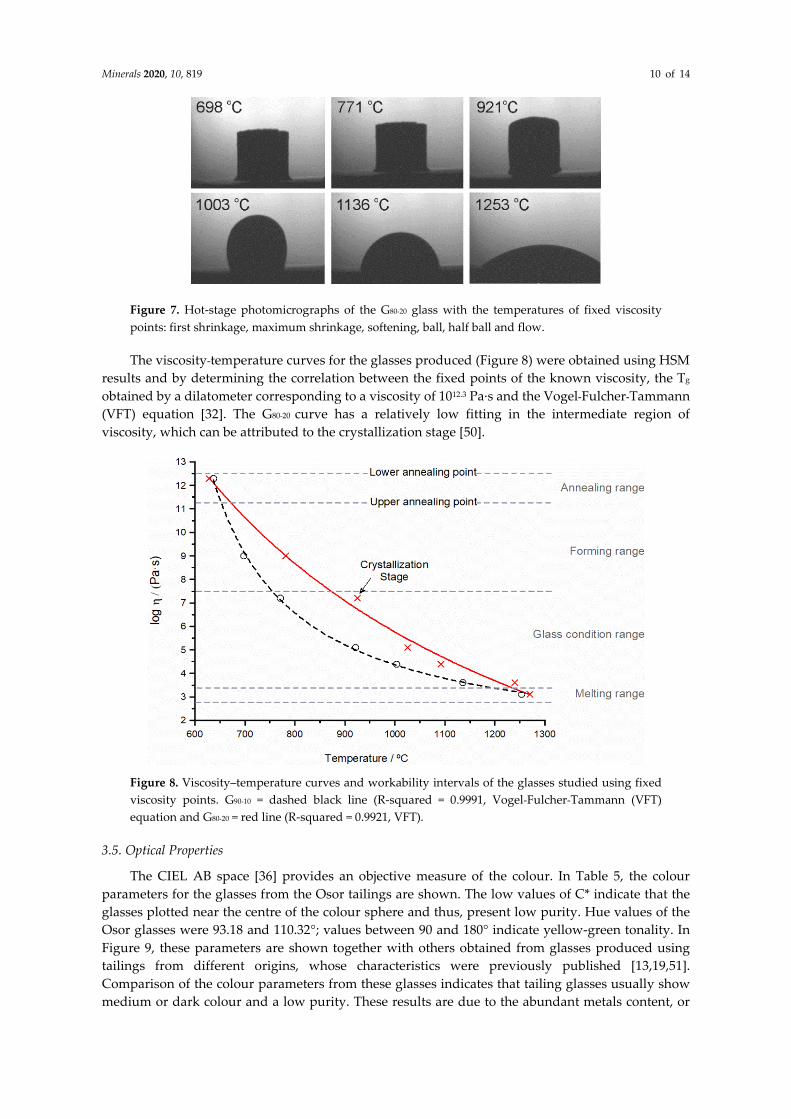
products [46]. The experimental fixed viscosity points obtained by the automatic image analysis
provided by HSM are given in Table 4. Figure 7 shows the images corresponding to the thermal
geometrical evolution of the G80-20 glass.
According to the working range, glasses can be classified as short glasses and long glasses. The
working range of the temperature has been established on viscosity values between 106 and 103 Pa·s
[46] or between 104 and 108 Pa·s [47]. Long glasses present a working range of than 400 °C [47]. The
forming and shaping of long glasses is easier and allows for working at lower temperatures, while
the short glasses become rigid more quickly, enabling automatized production processes [47,48]. The
viscosity range between 106 and 103 Pa·s in the case of G90-10 was 293 °C and in G80-20 was 479 °C.
Therefore, the manufacture of glasses can only be carried out automatically in the case of raw tailing
with a higher soda addition.
Figure 6. Thermal expansion plot as a function of temperature used to determine Tg and Td.
Table 4. Experimental temperatures for the fixed viscosity points [33,49] and workability calculated
temperatures.
Viscosity/Pa·s Temperature of Fixed Viscosity Points/°C
G90-10 G80-20
Glass transition point a/1012.3 628 637
First shrinkage/109 782 698
Maximum shrinkage/107.2 925 771
Softening 105.1 1025 921
Ball 104.4 1092 1003
Half ball 103.6 1240 1136
Flow 103.1 1270 1253
Calculated temperatures of the significant production viscosities b
Lower annealing point/1013.5 620 585
Upper annealing point/1012 641 641
Forming range/108–103 735–1318 840–1282
Glass condition range/103–102 1318–1583 1282–1420
Melting range/102–101 >1583 >1420
Workability interval/105–102 1130–1583 1066–1420
a Engels and Link [31] included the glass transition point by dilatometer. b Calculated using the
model by Fluegel [35].
Minerals 2020, 10, 819 10 of 14
Figure 7. Hot-stage photomicrographs of the G80-20 glass with the temperatures of fixed viscosity
points: first shrinkage, maximum shrinkage, softening, ball, half ball and flow.
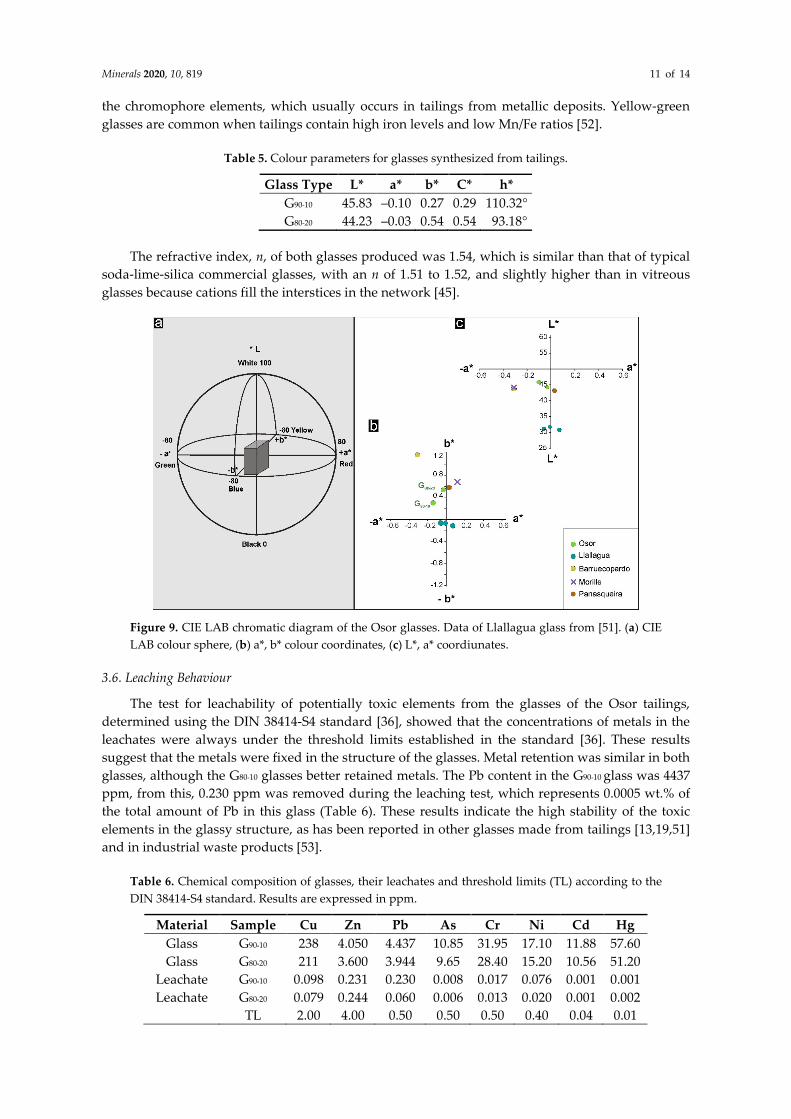
The viscosity-temperature curves for the glasses produced (Figure 8) were obtained using HSM
results and by determining the correlation between the fixed points of the known viscosity, the Tg
obtained by a dilatometer corresponding to a viscosity of 1012.3 Pa·s and the Vogel-Fulcher-Tammann
(VFT) equation [32]. The G80-20 curve has a relatively low fitting in the intermediate region of
viscosity, which can be attributed to the crystallization stage [50].
Figure 8. Viscosity–temperature curves and workability intervals of the glasses studied using fixed
viscosity points. G90-10 = dashed black line (R-squared = 0.9991, Vogel-Fulcher-Tammann (VFT)
equation and G80-20 = red line (R-squared = 0.9921, VFT).
3.5. Optical Properties
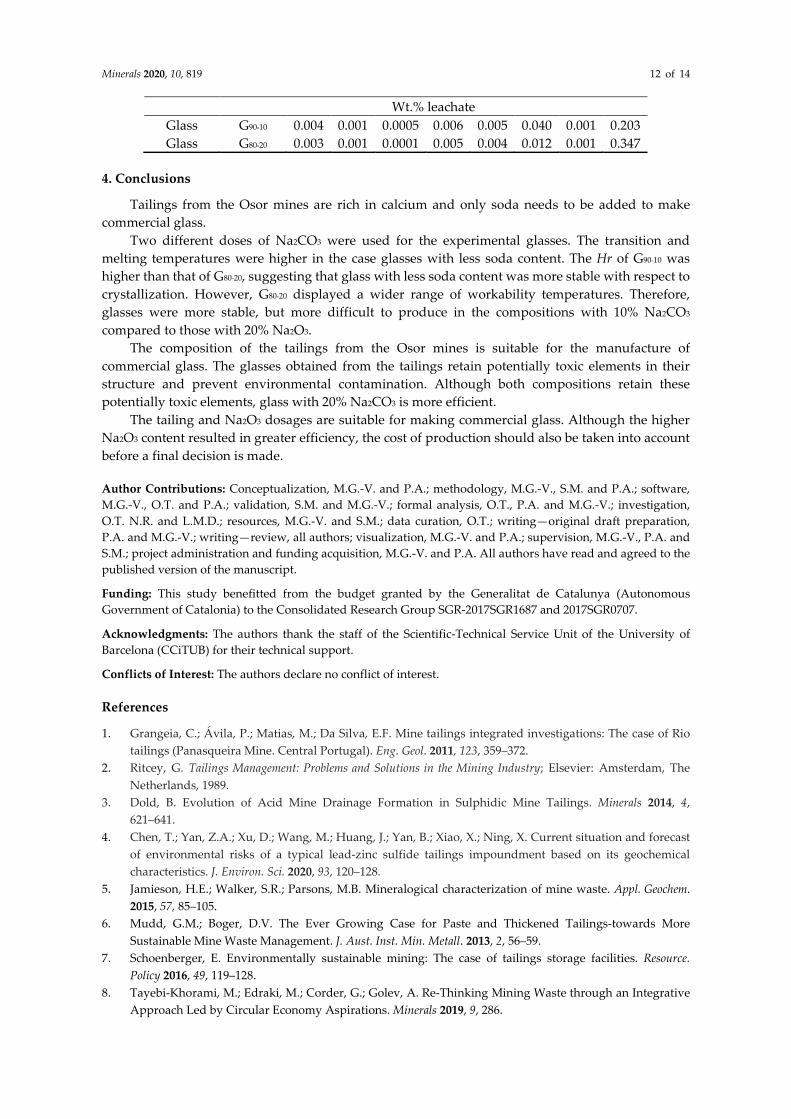
The CIEL AB space [36] provides an objective measure of the colour. In Table 5, the colour
parameters for the glasses from the Osor tailings are shown. The low values of C* indicate that the
glasses plotted near the centre of the colour sphere and thus, present low purity. Hue values of the
Osor glasses were 93.18 and 110.32°; values between 90 and 180° indicate yellow-green tonality. In
Figure 9, these parameters are shown together with others obtained from glasses produced using
tailings from different origins, whose characteristics were previously published [13,19,51].
Comparison of the colour parameters from these glasses indicates that tailing glasses usually show
medium or dark colour and a low purity. These results are due to the abundant metals content, or
Minerals 2020, 10, 819 11 of 14
the chromophore elements, which usually occurs in tailings from metallic deposits. Yellow-green
glasses are common when tailings contain high iron levels and low Mn/Fe ratios [52].
Table 5. Colour parameters for glasses synthesized from tailings.
Glass Type L* a* b* C* h*
G90-10 45.83 –0.10 0.27 0.29 110.32°
G80-20 44.23 –0.03 0.54 0.54 93.18°
The refractive index, n, of both glasses produced was 1.54, which is similar than that of typical
soda-lime-silica commercial glasses, with an n of 1.51 to 1.52, and slightly higher than in vitreous
glasses because cations fill the interstices in the network [45].
Figure 9. CIE LAB chromatic diagram of the Osor glasses. Data of Llallagua glass from [51]. (a) CIE
LAB colour sphere, (b) a*, b* colour coordinates, (c) L*, a* coordiunates.
3.6. Leaching Behaviour
The test for leachability of potentially toxic elements from the glasses of the Osor tailings,
determined using the DIN 38414-S4 standard [36], showed that the concentrations of metals in the
leachates were always under the threshold limits established in the standard [36]. These results
suggest that the metals were fixed in the structure of the glasses. Metal retention was similar in both
glasses, although the G80-10 glasses better retained metals. The Pb content in the G90-10 glass was 4437
ppm, from this, 0.230 ppm was removed during the leaching test, which represents 0.0005 wt.% of
the total amount of Pb in this glass (Table 6). These results indicate the high stability of the toxic
elements in the glassy structure, as has been reported in other glasses made from tailings [13,19,51]
and in industrial waste products [53].
Table 6. Chemical composition of glasses, their leachates and threshold limits (TL) according to the
DIN 38414-S4 standard. Results are expressed in ppm.
Material Sample Cu Zn Pb As Cr Ni Cd Hg
Glass G90-10 238 4.050 4.437 10.85 31.95 17.10 11.88 57.60
Glass G80-20 211 3.600 3.944 9.65 28.40 15.20 10.56 51.20
Leachate G90-10 0.098 0.231 0.230 0.008 0.017 0.076 0.001 0.001
Leachate G80-20 0.079 0.244 0.060 0.006 0.013 0.020 0.001 0.002
TL 2.00 4.00 0.50 0.50 0.50 0.40 0.04 0.01
Minerals 2020, 10, 819 12 of 14
Wt.% leachate
Glass G90-10 0.004 0.001 0.0005 0.006 0.005 0.040 0.001 0.203
Glass G80-20 0.003 0.001 0.0001 0.005 0.004 0.012 0.001 0.347
4. Conclusions
Tailings from the Osor mines are rich in calcium and only soda needs to be added to make
commercial glass.
Two different doses of Na2CO3 were used for the experimental glasses. The transition and
melting temperatures were higher in the case glasses with less soda content. The Hr of G90-10 was
higher than that of G80-20, suggesting that glass with less soda content was more stable with respect to
crystallization. However, G80-20 displayed a wider range of workability temperatures. Therefore,
glasses were more stable, but more difficult to produce in the compositions with 10% Na2CO3
compared to those with 20% Na2O3.
The composition of the tailings from the Osor mines is suitable for the manufacture of
commercial glass. The glasses obtained from the tailings retain potentially toxic elements in their
structure and prevent environmental contamination. Although both compositions retain these
potentially toxic elements, glass with 20% Na2CO3 is more efficient.
The tailing and Na2O3 dosages are suitable for making commercial glass. Although the higher
Na2O3 content resulted in greater efficiency, the cost of production should also be taken into account
before a final decision is made.
Author Contributions: Conceptualization, M.G.-V. and P.A.; methodology, M.G.-V., S.M. and P.A.; software,
M.G.-V., O.T. and P.A.; validation, S.M. and M.G.-V.; formal analysis, O.T., P.A. and M.G.-V.; investigation,
O.T. N.R. and L.M.D.; resources, M.G.-V. and S.M.; data curation, O.T.; writing—original draft preparation,
P.A. and M.G.-V.; writing—review, all authors; visualization, M.G.-V. and P.A.; supervision, M.G.-V., P.A. and
S.M.; project administration and funding acquisition, M.G.-V. and P.A. All authors have read and agreed to the
published version of the manuscript.
Funding: This study benefitted from the budget granted by the Generalitat de Catalunya (Autonomous
Government of Catalonia) to the Consolidated Research Group SGR-2017SGR1687 and 2017SGR0707.
Acknowledgments: The authors thank the staff of the Scientific-Technical Service Unit of the University of
Barcelona (CCiTUB) for their technical support.
Conflicts of Interest: The authors declare no conflict of interest.
References
1. Grangeia, C.; Ávila, P.; Matias, M.; Da Silva, E.F. Mine tailings integrated investigations: The case of Rio
tailings (Panasqueira Mine. Central Portugal). Eng. Geol. 2011, 123, 359–372.
2. Ritcey, G. Tailings Management: Problems and Solutions in the Mining Industry; Elsevier: Amsterdam, The
Netherlands, 1989.
3. Dold, B. Evolution of Acid Mine Drainage Formation in Sulphidic Mine Tailings. Minerals 2014, 4,
621–641.
4. Chen, T.; Yan, Z.A.; Xu, D.; Wang, M.; Huang, J.; Yan, B.; Xiao, X.; Ning, X. Current situation and forecast
of environmental risks of a typical lead-zinc sulfide tailings impoundment based on its geochemical
characteristics. J. Environ. Sci. 2020, 93, 120–128.
5. Jamieson, H.E.; Walker, S.R.; Parsons, M.B. Mineralogical characterization of mine waste. Appl. Geochem.
2015, 57, 85–105.
6. Mudd, G.M.; Boger, D.V. The Ever Growing Case for Paste and Thickened Tailings-towards More
Sustainable Mine Waste Management. J. Aust. Inst. Min. Metall. 2013, 2, 56–59.
7. Schoenberger, E. Environmentally sustainable mining: The case of tailings storage facilities. Resource.
Policy 2016, 49, 119–128.
8. Tayebi-Khorami, M.; Edraki, M.; Corder, G.; Golev, A. Re-Thinking Mining Waste through an Integrative
Approach Led by Circular Economy Aspirations. Minerals 2019, 9, 286.
Minerals 2020, 10, 819 13 of 14
9. Lèbre, É.; Corder, G.; Golev, A. The role of the mining industry in a circular economy: A framework for
resource management at the mine site level. J. Ind. Ecol. 2017, 21, 662–672.
10. Marabini, A.M.; Plescia, P.; Maccari, D.; Burragato, F.; Pelino, M. New materials from industrial mining
wastes: Glass–ceramic and glass and rock-wool fibre. Int. J. Miner. Process. 1998, 53, 121–134.
11. Bingham, P.A.; Hand, R.J.; Forder, S.D.; Lavaysierre, A. Vitrified Metal Finishing Wastes II. Thermal and
Structural Characterisation. J. Hazard. Mater. 2005, 122, 129–138.
12. Park, H.S., Park, J.H. Vitrification of red mud with mine wastes through melting and granulation
process–Preparation of glass ball. Non-Cryst. Solids 2017, 475, 129–135.
13. Alfonso, P.; Tomasa, O.; Garcia-Valles, M.; Tarragó, M.; Martínez, S.; Esteves, H. Potential of tungsten
tailings as glass raw materials. Mater. Lett. 2018, 228, 456–458.
14. Okereafor, U.; Makhatha, M.; Mekuto, L.; Mavumengwana, V. Gold Mine Tailings: A Potential Source of
Silica Sand for Glass Making. Minerals 2020, 10, 488.
15. Kim, Y.; Kim, M.; Sohn, J.; Park, H. Applicability of gold tailings, waste limestone, red mud, and
ferronickel slag for producing glass fibers. J. Clean. Prod. 2018, 203, 957–965.
16. Shao, H.; Liang, K.; Peng, F.; Zhou, F.; Hu, A. Production and properties of cordierite-based
glass-ceramics from gold tailings. Miner. Eng. 2005, 18, 635–637.
17. Lay, G.F.T.; Rockwell, M.C.; Wiltshire, J.C.; Ketata, C. Characteristics of silicate glasses derived from
vitrification of manganese crust tailings. Ceram Int. 2009, 35, 1961–1967.
18. Baowei, L.; Leibo, D.; Xuefeng, Z.; Xiaolin, J. Structure and performance of glass–ceramics obtained by
Bayan Obo tailing and fly ash. J. Non-Cryst. Solids 2013, 380, 103–108.
19. Alfonso, P.; Castro, D.; García-Vallès, M.; Tarragó, M.; Tomasa, O.; Martínez. S. Recycling of tailings from
the Barruecopardo tungsten deposit for the production of glass. J. Therm. Anal. Calorim. 2016, 125, 681–687.
20. Karamanov, A.; Hamzawy, E.M.; Karamanova, E.; Jordanov, N.B.; Darwish, H. Sintered glass-ceramics
and foams by metallurgical slag with addition of CaF2. Ceram. Int. 2020, 46, 6507–6516.
21. Hill, R.; Wood, D.; Thomas, M. Trimethylsilylation analysis of the silicate structure of
fluoro-alumino-silicate glasses and the structural role of fluorine. J. Mater. Sci. 1999, 34, 1767–1774.
22. Pei, F.; Zhu, G.; Li. P.; Guo, H.; Yang, P. Effects of CaF2 on the sintering and crystallisation of
CaO–MgO–Al2O3–SiO2 glass-ceramics. Ceram. Int. 2020, 46, 17825–17835.
23. Cormier, L.; Neuville, D.R. Ca and Na environments in Na2O–CaO–Al2O3–SiO2 glasses: Influence of
cation mixing and cation-network interactions. Chem. Geol. 2004, 213, 103–113.
24. Angeli, F.; Gaillard, M.; Jollivet, P.; Charpentier, T. Contribution of 43Ca MAS NMR for probing the
structural configuration of calcium in glass. Chem. Phys. Lett. 2007, 440, 324–328.
25. Ligero, F.B. La mineria a Osor. Quad. Selva 1995, 8, 137–137.
26. Corcoll, N.; Bonet, B.; Morin, S.; Tlili, A.; Leira, M.; Guasch, H. The effect of metals on photosynthesis
processes and diatom metrics of biofilm from a metal-contaminated river: A translocation experiment.
Ecol. Indic. 2012, 18, 620–631.
27. Navarro, A.; Font, X.; Viladevall, M. Metal Mobilization and Zinc-Rich Circumneutral Mine Drainage
from the Abandoned Mining Area of Osor (Girona. NE Spain). Mine Water Environ. 2015, 34, 329–342.
28. Bori, J.; Vallès, B.; Navarro, A.; Riva, M.C. Ecotoxicological risks of the abandoned F–Ba–Pb–Zn mining
area of Osor (Spain). Environ. Geochem. Health 2017, 39, 665–679.
29. Piqué, À.; Canals, À.; Grandia, F.; Banks, D.A. Mesozoic fluorite veins in NE Spain record regional base
metal-rich brine circulation through basin and basement during extensional events. Chem. Geol. 2008, 257,
139–152.
30. UNE-EN 993-2:1996. Métodos de Ensayo para Productos Refractarios Conformados Densos. Parte 2: Determinación
de la Densidad Absoluta. Spanish Standard; AENOR: Madrid, Spain, 1996.
31. Engels, M.; Link, S. Bubble control in ceramic glazes. Interceram 2006, 3, 152–156.
32. Scholze, H. Der Einfluss von Viskosität und Oberflächenspannung auf erhitzungsmikroskopische
Messungen an Gläsern. Ber. Dtsch. Keram. Ges. 1962, 39, 63–68.
33. DIN 51730. Determination of ash Fusion Behaviour, German Standard; DIN Deutsches Institut für Normung,
E.V.: Berlin, Germany, 1976.
34. Garcia-Valles, M.; Hafez, H.; Cruz-Matías, I.; Vergés, E.; Aly, M.H.; Nogués, J.M.; Ayala, D.; Martinez, S.
Calculation of viscosity–temperature curves for glass obtained from four wastewater treatment plants in
Egypt. J. Therm. Anal. Calorim. 2013, 111, 107–114.
Minerals 2020, 10, 819 14 of 14
35. Fluegel, A. Glass viscosity calculation based on a global statistical modeling approach. Glass Technol. 2007,
48, 13–30.
36. CIE. Technical Report, Colorimetry; Commission Internationale de L’Eclairage: Vienna, Austria, 1931.
37. McGuire, R.G. Reporting of objective color measurements. HortScience 1992, 27, 1254–1255.
38. DIN 38414-S4. Schlamm und Sedimente, Bestimmung der Eluierbarkeit mit Wasser; DIN Deutsches Institut für
Normung, E.V.: Berlin, Germany, 1984.
39. Mysen, B.O. Structure and Properties of Silicate Melts; Elsevier: Amsterdam, The Netherlands, 1988.
40. Barbieri, L.; Lancettotti, I.; Manffredini, T.; Queralt, I.; Rincon, J.M.; Romero, M. Design, obtainment and
properties of glasses and glass–ceramics from coal fly ash. Fuel 1999, 78, 271–276.
41. Hrubý, A. Evaluation of glass-forming tendency by means of DTA. Czechoslov. J. Phys. B 1972, 22, 1187–93.
42. Kozmidis-Petrovic, A.; Šesták, J. Forty years of the Hrubý glass-forming coefficient via DTA when
comparing other criteria in relation to the glass stability and vitrification ability. J. Therm. Anal. Calorim.
2012, 110, 997–1004.
43. Donald, I.W.; Metcalfe, B.L.; Taylor, R.J. The immobilization of high level radioactive wastes using
ceramics and glasses. J. Mater. Sci. 1997, 32, 5851–5887.
44. Wu, J.P.; Rawlings, R.D.; Boccaccini, A.R. A glass–ceramic derived from high TiO2-containing slag:
Microstructural development and mechanical behaviour. J. Am. Ceram. Soc. 2006, 89, 2426–2433.
45. Shelby, J.E. Introduction to Glass Science and Technology; Royal Society of Chemistry: Cambridge, UK, 2005.
46. Cheng, J.; Xiao, Z.; Yang, K.; Wu, H. Viscosity, fragility and structure of Na2O–CaO–Al2O3–SiO2 glasses of
increasing Al/Si ratio. Ceram. Int. 2013, 39, 4055–4062.
47. Fernández Navarro, J.M. La Sociedad Española de Cerámica y Vidrio a lo Largo de Medio Siglo; Sociedad
Española de Cerámica y Vidrio: Madrid, Spain, 1991.
48. Karamanov, A.; Di Gioacchino, R.; Pisciella, P.; Pelino, M.; Hreglich, A. Viscosity of iron rich glasses
obtained from industrial wastes. Glass Technol. 2002, 43, 34–38.
49. Pascual, M.J.; Pascual, L.; Duran, A. Determination of the viscosity-temperature curve for glasses on the
basis of fixed viscosity-temperature determined by hot stage microscopy. Phys. Chem. Glasses 2001, 42,
61–66.
50. Khalil, T.K.; Boccaccini, A.R. Heating microscopy study of the sintering behaviour of glass powder
compacts in the binary system SiO2–TiO2. Mater. Lett. 2002, 56, 317–321.
51. Arancibia, J.R.H.; Alfonso, P.; Garcia Vallès, M.; Martínez Manent, S.; Parcerisa, D.; Canet, C.; Romero,
F.M. Manufacturing of glass from tin mining tailings in Bolivia. Bol. Soc. Esp. Ceram. Vidr. 2013, 52,
143–150.
52. Mirti, P.; Davit, P.; Gulmini, M. Colourants and opacifiers in seventh and eighth century glass
investigated by spectroscopic techniques. Anal. Bioanal. Chem. 2002, 372, 221–229.
53. Pisciella, P.; Crisucci, S.; Karamanov, A.; Pelino, M. Chemical durability of glasses obtained by
vitrification of industrial wastes. Waste Manag. 2001, 21, 1–9.
© 2020 by the authors. Licensee MDPI, Basel, Switzerland. This article is an open access
article distributed under the terms and conditions of the Creative Commons Attribution
(CC BY) license (http://creativecommons.org/licenses/by/4.0/).