
Applications of Porous Silicon Thin Films in Solar Cells and Biosensors
Upload
khangminh22Category
view
0download
0
�����������������
Citation: Cheng, C.-Y.; Li, S.-F.; Lee,
C.-L.; Jientrakul, R.; Yuangyai, C. A
Comparative Study of Unbalanced
Production Lines Using Simulation
Modeling: A Case Study for Solar
Silicon Manufacturing. Sustainability
2022, 14, 697. https://doi.org/
10.3390/su14020697
Academic Editors: Tsu-Ming Yeh,
Hsin-Hung Wu, Yuh-Wen Chen and
Fan-Yun Pai
Received: 16 November 2021
Accepted: 20 December 2021
Published: 9 January 2022
Publisher’s Note: MDPI stays neutral
with regard to jurisdictional claims in
published maps and institutional affil-
iations.
Copyright: © 2022 by the authors.
Licensee MDPI, Basel, Switzerland.
This article is an open access article
distributed under the terms and
conditions of the Creative Commons
Attribution (CC BY) license (https://
creativecommons.org/licenses/by/
4.0/).
sustainability
Article
A Comparative Study of Unbalanced Production Lines UsingSimulation Modeling: A Case Study for SolarSilicon ManufacturingChen-Yang Cheng 1, Shu-Fen Li 2 , Chia-Leng Lee 3, Ranon Jientrakul 4 and Chumpol Yuangyai 4,*
1 Department of Industrial Engineering and Management, National Taipei University of Technology,Taipei 10608, Taiwan; [email protected]
2 Department of Industrial Engineering and Management, National Chin-Yi University of Technology,Taichung 407224, Taiwan; [email protected]
3 Department of Industrial Engineering and Enterprise Information, Tunghai University,Taichung 411030, Taiwan; [email protected]
4 Department of Industrial Engineering, School of Engineering, King Mongkut’s Institute of TechnologyLadkrabang, Bangkok 10520, Thailand; [email protected]
* Correspondence: [email protected]
Abstract: In the solar silicon manufacturing industry, the production time for crystal growth is tentimes longer than at other workstations. The pre-processing time at the ingot-cutting station causeswork-in-process (WIP) accumulation and an excessively long cycle time. This study aimed to findthe most effective production system for reducing WIP accumulation and shortening the cycle time.The proposed approach considered pull production systems, and the response surface methodologywas adopted for performance optimization. A simulation-based optimization technique was usedfor determining the optimal pull production system. The comparison between the results of varioussimulated pull production systems and those of the existing solar silicon manufacturing systemshowed that a hybrid production system in which a kanban station was installed before the bottleneckstation with a CONWIP system incorporated for the rest of the production line could reduce the WIPvolume by 26% and shorten the cycle time by 16% under the same throughput conditions.
Keywords: lean production; kanban pull production system; CONWIP; hybrid production system;simulation model
1. Introduction
Silicon is the most common material used in the production of solar energy products.The key production steps for photovoltaic products, from upstream to downstream, areobtaining silicon as raw material; producing silicon crystals; and producing batteries,systems, and other equipment. The silicon wafers produced from silicon crystals are acritical raw material, not only for photovoltaic batteries but also for the entire semiconductorindustry. Because more than 90% of the solar cell is based on silicon wafers, the increaseddemand for solar products has increased the demand for silicon wafers [1]. In such anenvironment, it is necessary for the industry to respond rapidly to market demand tomaintain and increase profits. The production of solar silicon crystals primarily involvespush production systems, although flow shop production lines are an important element inthe manufacturing system. Because each workstation in the production line has a differentcycle time, the scheduler must consider whether a push production environment canfacilitate a smooth flow between workstations and a similar production capacity across allthe workstations. When either or both of these conditions cannot be ensured, unbalancedproduction lines and work-in-process (WIP) accumulation are likely to result [2,3].
The kanban production system adopted by lean production advocates is based on pulldemand such that it is also referred to as a pull production system [4]. The differences
Sustainability 2022, 14, 697. https://doi.org/10.3390/su14020697 https://www.mdpi.com/journal/sustainability

Sustainability 2022, 14, 697 2 of 15
between push production systems and pull production systems are as follows: In pushsystems, replenishment is based on forecasting and planned mass production, and alarge inventory is required to meet consumer demand. However, unbalanced productiontime across the workstations results in dissimilar production capacity and unbalancedproduction lines, with WIP accumulating at each bottleneck workstation. High WIPlevels result in excessive inventory cost, and accumulated WIP results in an extensivecycle time [5]. In pull production systems, production is based on customer demand.Such systems emphasize just-in-time (JIT) production and rapid response to customerdemand [6,7]. Thus, WIP levels can be regulated effectively and waste from overproductioncan be reduced, thereby lowering inventory costs.
The original kanban production system was the basis for other pull production sys-tems, such as constant work-in-process (CONWIP) production systems, which incorporateboth push and pull production systems, and other hybrid production systems [8–11]. In thepresent study, we examined a solar silicon crystal manufacturer with uneven workstationproduction capacities and an unbalanced production line. We present a lean productionanalysis, which we performed to evaluate site improvement processes, thereby providing away to eliminate unnecessary waste and shorten the production time to increase productiv-ity. For example, the production time for crystal-growing and ingot-cutting stations waslong. The preproduction time at the ingot-cutting station caused WIP accumulation and anexcessively long cycle time. The objective of this study was to find the most effective pro-duction system for reducing WIP accumulation and shortening the cycle time. We adoptedthe response surface methodology (RSM) to optimize the performance of various pullproduction systems and obtained results that were verified through system simulations.
The remainder of this paper is organized as follows. In Section 2, we review the relatedwork on pull production systems. We describe the case study in Section 3. We report andanalyze the simulation results in Section 4 and offer a conclusion in Section 5.
2. Related Work
Proposed by Japan’s Toyota Motor Corporation as a means of implementing JITproduction, the kanban production system is considered the prototypical pull productionsystem [12]. Hopp and Spearman [13] explained that in a kanban production system, theflow of information is transferred through kanban cards, the number of which is usedto regulate the WIP levels in the system. Products leave the production system only ondemand. Each workstation in the production line uses a kanban card to transmit its demandto the preceding station in order to obtain parts or products as necessary. To control costsand eliminate production waste, each workstation regulates its own resources and productquantity to ensure that the WIP level does not exceed a predetermined threshold [14].
Williams et al. [15] asserted that the kanban system is representative of JIT productionsystems. It is a critical method for defining production quantity and is often considered thekey component of lean production systems. The kanban system possesses the followingthree characteristics: First, it employs a pull production system to avoid WIP accumulationin the production line. Second, it employs a fast exchange mode method to enable thetransformation of a single-product production line into a multi-product hybrid productionline. Third, it reduces WIP accumulation by dividing large-quantity production orders intorepeated manufacturing processes involving smaller quantities.
With the purpose of limiting WIP levels in a production line, Spearman et al. [16]proposed the CONWIP system, which is based on pull production systems. The basicconcepts of this system were adopted from the kanban production system, where thephilosophy of regulating WIP levels was extended to facilitate better control over the WIPvolume in the production line. CONWIP production systems retain the high productionand equipment utilization rate of push production systems, but incorporate the WIP controlof the kanban system, and can be considered an improved kanban control system.
CONWIP production systems also use kanban cards to regulate the WIP level in theproduction line. In CONWIP systems, the entire production line is regarded as a single

Sustainability 2022, 14, 697 3 of 15
workstation. When a customer places an order, information regarding the finished productis transmitted using kanban cards to the beginning of the production line, and feedingand operations commence according to the kanban card. If no demand exists, no kanbaninformation is generated. Accordingly, a predefined number of kanban cards are used toensure that the WIP levels in the production line do not exceed the preset range.
Bonvik and Gershwin [17] agreed that CONWIP production systems could ensurethat WIP levels in the production lines do not exceed predefined thresholds by defining thenumber of kanban cards and enabling easy control over WIP levels at each workstation.However, the researchers asserted that when the production line is long and there areequipment malfunctions or bottleneck stations with a longer production time than the otherworkstations have, high WIP levels accumulate at the malfunctioning machine or beforethe bottleneck station. This situation makes it impossible to determine the distributionof the WIP at each station in the system. To resolve this issue, they proposed a pullproduction system called the hybrid control system. This system integrates the kanbanproduction system with independent kanban cards, which control the materials fed intothe bottleneck workstations.
Gaury et al. [18] optimized the kanban, CONWIP, and hybrid systems by using agenetic algorithm and compared the performance of each in order to select the mostefficient system at a service level of 99%. For each system, the genetic algorithm determinedthe optimal number of kanban cards and whether segmentation was necessary. Whensegmentation was deemed necessary, the workstation at which segmentation should occurand the number of kanban cards were determined. Simulation experiments showed thatwhen the service level remained constant, the performance of the hybrid system was moreoptimal than that of either of the other two systems. Geraghty and Heavey [19] usedsimulations to determine which of the eight hybrid control architectures proposed byHodgson and Wang [20] attained the most efficient performance when inventory levelsand optimal safety stock conditions were considered.
Abdulmalek and Rajgopal [21] incorporated pull production systems at a steel man-ufacturer and applied lean value streams through simulations to compare the systems.Yang et al. [22] employed a genetic algorithm to solve pull production system problemsin semiconductor integrated circuit packaging factories. Lu et al. [23] employed valuestream maps and the multiple criteria decision-making method to design a lean pull systemfor semiconductor manufacturing. Their proposed pull production system combined aCONWIP with a kanban system, and the performance was verified through simulations.Yang et al. [24] demonstrated the effectiveness of the CONWIP pull system and proposedthat multi-CONWIP can reduce the production lead time and WIP in bike chain production.Onyeocha et al. [25] evaluated the hybrid kanban CONWIP control strategy and basestockkanban CONWIP control strategy in a multi-product serial flow line. It was shown that anincrease in the number of product types increases the amount of WIP inventory. Romag-noli [26] showed that CONWIP is a very useful tool for planning and controlling a complexflexible job shop. Pursuing a similar approach, we examined the case of a solar siliconcrystal manufacturer. We applied the pull production systems proposed in previous studiesto this case and used the response surface methodology (RSM) to determine the optimalsystem. Finally, system simulations were performed to verify the system performance.
3. Problem Statement
In this study, we examined the production environment of a solar silicon crystal man-ufacturer. There were ten main manufacturing processes—sandblast, etching, resistancemeasuring, allocation, crucible making, feeding, growing, preparing for ingot cutting, ingotcutting, and electrical inspection—after which, cutting, testing, and packaging operationstook place. The production times varied widely between the workstations in the factory,resulting in WIP accumulation, which, in turn, gave rise to high inventory costs. Infor-mation on the existing conditions was gathered and applied to construct a current-statevalue stream map. Because the obtained information involves real data from the case
Sustainability 2022, 14, 697 4 of 15
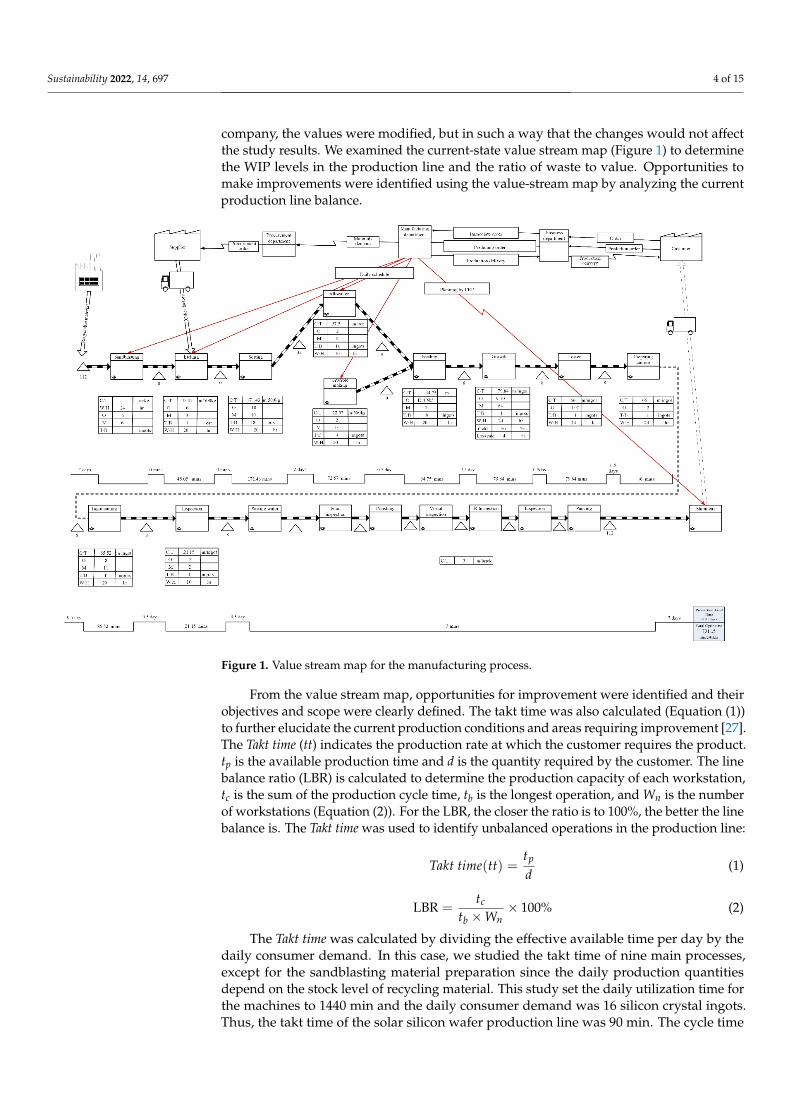
company, the values were modified, but in such a way that the changes would not affectthe study results. We examined the current-state value stream map (Figure 1) to determinethe WIP levels in the production line and the ratio of waste to value. Opportunities tomake improvements were identified using the value-stream map by analyzing the currentproduction line balance.
Sustainability 2022, 14, x FOR PEER REVIEW 4 of 15
measuring, allocation, crucible making, feeding, growing, preparing for ingot cutting, in-got cutting, and electrical inspection—after which, cutting, testing, and packaging opera-tions took place. The production times varied widely between the workstations in the fac-tory, resulting in WIP accumulation, which, in turn, gave rise to high inventory costs. In-formation on the existing conditions was gathered and applied to construct a current-state value stream map. Because the obtained information involves real data from the case com-pany, the values were modified, but in such a way that the changes would not affect the study results. We examined the current-state value stream map (Figure 1) to determine the WIP levels in the production line and the ratio of waste to value. Opportunities to make improvements were identified using the value-stream map by analyzing the current production line balance.
Figure 1. Value stream map for the manufacturing process.
From the value stream map, opportunities for improvement were identified and their objectives and scope were clearly defined. The takt time was also calculated (Equation (1)) to further elucidate the current production conditions and areas requiring improvement [27]. The takt time (tt) indicates the production rate at which the customer requires the product. tp is the available production time and d is the quantity required by the customer. The line balance ratio (LBR) is calculated to determine the production capacity of each workstation, tc is the sum of the production cycle time, tb is the longest operation, and Wn is the number of workstations (Equation (2)). For the LBR, the closer the ratio is to 100%, the better the line balance is. The takt time was used to identify unbalanced operations in the production line: 𝑇𝑎𝑘𝑡 𝑡𝑖𝑚𝑒(𝑡𝑡) = 𝑡𝑑 (1) LBR = 𝑡𝑡 × 𝑊 × 100% (2)
Figure 1. Value stream map for the manufacturing process.
From the value stream map, opportunities for improvement were identified and theirobjectives and scope were clearly defined. The takt time was also calculated (Equation (1))to further elucidate the current production conditions and areas requiring improvement [27].The Takt time (tt) indicates the production rate at which the customer requires the product.tp is the available production time and d is the quantity required by the customer. The linebalance ratio (LBR) is calculated to determine the production capacity of each workstation,tc is the sum of the production cycle time, tb is the longest operation, and Wn is the numberof workstations (Equation (2)). For the LBR, the closer the ratio is to 100%, the better the linebalance is. The Takt time was used to identify unbalanced operations in the production line:
Takt time(tt) =tp
d(1)
LBR =tc
tb ×Wn× 100% (2)
The Takt time was calculated by dividing the effective available time per day by thedaily consumer demand. In this case, we studied the takt time of nine main processes,except for the sandblasting material preparation since the daily production quantitiesdepend on the stock level of recycling material. This study set the daily utilization time forthe machines to 1440 min and the daily consumer demand was 16 silicon crystal ingots.Thus, the takt time of the solar silicon wafer production line was 90 min. The cycle time

Sustainability 2022, 14, 697 5 of 15
was calculated according to each station’s production capacity to compare the differencesin production times between stations. In this case, compared with the cycle times of theother stations, the ingot-cutting workstation’s cycle time was relatively long and the closestto the takt time. Therefore, the ingot-cutting station was identified as the bottleneck station(Figure 2). The x-axis represents nine stations and the y-axis indicates the processing timeat each station. The LBR was calculated to be 49.86%, which was lower than the acceptedstandard of 70%, indicating that the production line was unbalanced. This also showedthe difference in the cycle times of the feeding and crystal-growing stations, as well asthe substantial difference between preproduction for the ingot-cutting station and thecycle time of the ingot-cutting station. Thus, the WIP tended to accumulate before thecrystal-growing and ingot-cutting stations. In this production environment, simulationswere conducted to incorporate the pull production systems to reduce the WIP levels andcycle time. Thus, the research problem was how to reduce the WIP level and shorten thecycle time. Various pull production systems were incorporated and RSM was applied todetermine optimal factor configurations, which were verified through system simulations.
Sustainability 2022, 14, x FOR PEER REVIEW 5 of 15
The takt time was calculated by dividing the effective available time per day by the
daily consumer demand. In this case, we studied the takt time of nine main processes,
except for the sandblasting material preparation since the daily production quantities de‐
pend on the stock level of recycling material. This study set the daily utilization time for
the machines to 1440 min and the daily consumer demand was 16 silicon crystal ingots.
Thus, the takt time of the solar silicon wafer production line was 90 min. The cycle time
was calculated according to each station’s production capacity to compare the differences
in production times between stations. In this case, compared with the cycle times of the
other stations, the ingot‐cutting workstation’s cycle time was relatively long and the closest
to the takt time. Therefore, the ingot‐cutting station was identified as the bottleneck station
(Figure 2). The x‐axis represents nine stations and the y‐axis indicates the processing time
at each station. The LBR was calculated to be 49.86%, which was lower than the accepted
standard of 70%, indicating that the production line was unbalanced. This also showed
the difference in the cycle times of the feeding and crystal‐growing stations, as well as the
substantial difference between preproduction for the ingot‐cutting station and the cycle
time of the ingot‐cutting station. Thus, the WIP tended to accumulate before the crystal‐
growing and ingot‐cutting stations. In this production environment, simulations were
conducted to incorporate the pull production systems to reduce the WIP levels and cycle
time. Thus, the research problem was how to reduce the WIP level and shorten the cycle
time. Various pull production systems were incorporated and RSM was applied to deter‐
mine optimal factor configurations, which were verified through system simulations.
Figure 2. Production line balance analysis in the case company.
4. Evaluation
4.1. Simulation Setting and Kanban Models
A simulation model schematic, shown in Figure 3, was constructed based on the cur‐
rent value stream map of the whole production processes in this case company, as well as
two after‐processes: wafer sawing and packing. The demand data were generated accord‐
ing to historical data from the case company. The ramp‐up time for the workstations was
set to 30 days and the simulation time to 12 months. To minimize the simulation errors,
the experiment was repeated 10 times. Line balance analysis identified the ingot‐cutting
station as the bottleneck station. Data on the production time of each machine are pre‐
sented in Table 1. To determine whether the simulation model was reasonable, the analy‐
sis results were both verified and validated (Table 2). The equation for the percentage
error is expressed in Equation (3):
simulation error|Simulation systems Production systems|
Production systems100% (3)
0
10
20
30
40
50
60
70
80
90
100
Etching Sorting Allocation Crucible
making
Feeding Growth Preparing
ingot
cutting
Ingot
cutting
Inspection
Time
Cycle time Bottleneck Takt time
Figure 2. Production line balance analysis in the case company.
4. Evaluation4.1. Simulation Setting and Kanban Models
A simulation model schematic, shown in Figure 3, was constructed based on thecurrent value stream map of the whole production processes in this case company, aswell as two after-processes: wafer sawing and packing. The demand data were generatedaccording to historical data from the case company. The ramp-up time for the workstationswas set to 30 days and the simulation time to 12 months. To minimize the simulationerrors, the experiment was repeated 10 times. Line balance analysis identified the ingot-cutting station as the bottleneck station. Data on the production time of each machineare presented in Table 1. To determine whether the simulation model was reasonable, theanalysis results were both verified and validated (Table 2). The equation for the percentageerror is expressed in Equation (3):
simulation error =|Simulation systems− Production systems|
Production systems× 100% (3)
Three primary types of pull production systems were incorporated in this study:kanban, CONWIP, and hybrid. The characteristics and parameters of each type of systemare described in detail as follows.

Sustainability 2022, 14, 697 6 of 15Sustainability 2022, 14, x FOR PEER REVIEW 6 of 15
Figure 3. As-is manufacturing process simulation.
Table 1. Machine production time.
No. Process Machine Average Production
Time (min) 1 Etching 1 54.06 2 Resistance measuring 1 30 3 Allocation 1 37.5 4 Crucible 1 72.57 5 Feeding 5 139 6 Growth 63 5030 7 Ingot cutting 1 7 1228 8 Ingot cutting 2 2 633 9 Ingot cutting 3 2 706
10 Inspection 2 42.3
Table 2. Simulation difference rate.
Item Production System Simulation System Difference Rate Output (ingots/day) 16 15.97 0.17%
Cycle time (in-gots/day)
9645.23 10,448.36 8.33%
WIP (ingots/day) 107 110.00 2.80% Notes: The parameter values of the simulation model: one year period, 30-day warm-up, and 10 replications.
Three primary types of pull production systems were incorporated in this study: kan-ban, CONWIP, and hybrid. The characteristics and parameters of each type of system are described in detail as follows.
In the kanban production system, when the last workstation in the production line receives an order and the finished product is removed, a kanban card transmits a demand request (WIP) from a given station to the immediately preceding station, whereupon the preceding station begins production. Similarly, the preceding station, from which the WIP was taken, receives WIP from its immediately preceding station for further production [4]. During the implementation, the kanban production system designates a specific kind of kanban card for each type of component. Using kanban cards ensures that the WIP levels at each station do not exceed a predetermined threshold. The purpose of maintain-
Figure 3. As-is manufacturing process simulation.
Table 1. Machine production time.
No. Process Machine Average Production Time (min)
1 Etching 1 54.06
2 Resistance measuring 1 30
3 Allocation 1 37.5
4 Crucible 1 72.57
5 Feeding 5 139
6 Growth 63 5030
7 Ingot cutting 1 7 1228
8 Ingot cutting 2 2 633
9 Ingot cutting 3 2 706
10 Inspection 2 42.3
Table 2. Simulation difference rate.
Item Production System Simulation System Difference Rate
Output (ingots/day) 16 15.97 0.17%
Cycle time(ingots/day) 9645.23 10,448.36 8.33%
WIP (ingots/day) 107 110.00 2.80%Notes: The parameter values of the simulation model: one year period, 30-day warm-up, and 10 replications.
In the kanban production system, when the last workstation in the production linereceives an order and the finished product is removed, a kanban card transmits a demandrequest (WIP) from a given station to the immediately preceding station, whereupon thepreceding station begins production. Similarly, the preceding station, from which the WIPwas taken, receives WIP from its immediately preceding station for further production [4].During the implementation, the kanban production system designates a specific kind ofkanban card for each type of component. Using kanban cards ensures that the WIP levelsat each station do not exceed a predetermined threshold. The purpose of maintaining acertain WIP level is to reduce the impact of an equipment malfunction or an unforeseenstoppage in the production process and to ensure smooth production overall. In this study,kanban stations were installed before each station. In the first type of kanban installation,the number of cards was determined based on the station’s production capacity. Figure 4illustrates six workstations denoted A to E, with C as the bottleneck station.
Sustainability 2022, 14, 697 7 of 15
Sustainability 2022, 14, x FOR PEER REVIEW 7 of 15
ing a certain WIP level is to reduce the impact of an equipment malfunction or an unfore-seen stoppage in the production process and to ensure smooth production overall. In this study, kanban stations were installed before each station. In the first type of kanban in-stallation, the number of cards was determined based on the station’s production capacity. Figure 4 illustrates six workstations denoted A to E, with C as the bottleneck station.
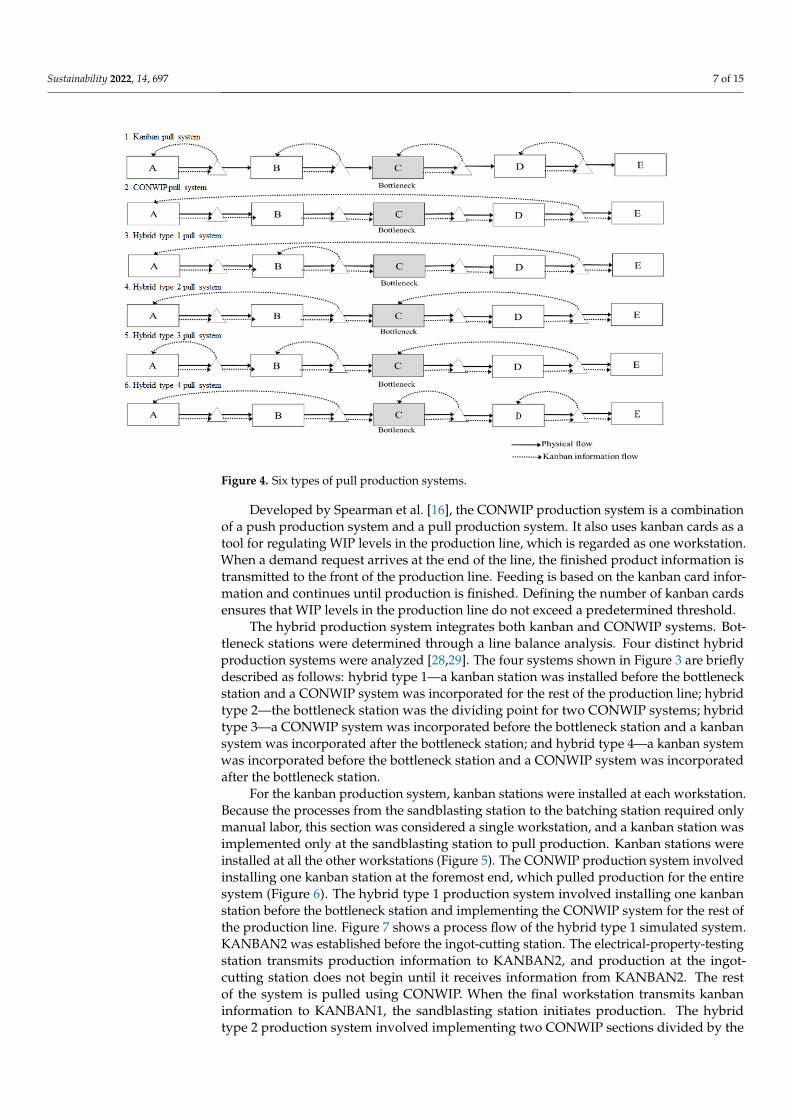
Figure 4. Six types of pull production systems.
Developed by Spearman et al. [16], the CONWIP production system is a combination of a push production system and a pull production system. It also uses kanban cards as a tool for regulating WIP levels in the production line, which is regarded as one work-station. When a demand request arrives at the end of the line, the finished product infor-mation is transmitted to the front of the production line. Feeding is based on the kanban card information and continues until production is finished. Defining the number of kan-ban cards ensures that WIP levels in the production line do not exceed a predetermined threshold.
The hybrid production system integrates both kanban and CONWIP systems. Bottle-neck stations were determined through a line balance analysis. Four distinct hybrid pro-duction systems were analyzed [28,29]. The four systems shown in Figure 3 are briefly described as follows: hybrid type 1—a kanban station was installed before the bottleneck station and a CONWIP system was incorporated for the rest of the production line; hybrid type 2—the bottleneck station was the dividing point for two CONWIP systems; hybrid type 3—a CONWIP system was incorporated before the bottleneck station and a kanban system was incorporated after the bottleneck station; and hybrid type 4—a kanban system was incorporated before the bottleneck station and a CONWIP system was incorporated after the bottleneck station.
For the kanban production system, kanban stations were installed at each work-station. Because the processes from the sandblasting station to the batching station re-quired only manual labor, this section was considered a single workstation, and a kanban station was implemented only at the sandblasting station to pull production. Kanban sta-tions were installed at all the other workstations (Figure 5). The CONWIP production sys-tem involved installing one kanban station at the foremost end, which pulled production for the entire system (Figure 6). The hybrid type 1 production system involved installing one kanban station before the bottleneck station and implementing the CONWIP system
Figure 4. Six types of pull production systems.
Developed by Spearman et al. [16], the CONWIP production system is a combinationof a push production system and a pull production system. It also uses kanban cards as atool for regulating WIP levels in the production line, which is regarded as one workstation.When a demand request arrives at the end of the line, the finished product information istransmitted to the front of the production line. Feeding is based on the kanban card infor-mation and continues until production is finished. Defining the number of kanban cardsensures that WIP levels in the production line do not exceed a predetermined threshold.
The hybrid production system integrates both kanban and CONWIP systems. Bot-tleneck stations were determined through a line balance analysis. Four distinct hybridproduction systems were analyzed [28,29]. The four systems shown in Figure 3 are brieflydescribed as follows: hybrid type 1—a kanban station was installed before the bottleneckstation and a CONWIP system was incorporated for the rest of the production line; hybridtype 2—the bottleneck station was the dividing point for two CONWIP systems; hybridtype 3—a CONWIP system was incorporated before the bottleneck station and a kanbansystem was incorporated after the bottleneck station; and hybrid type 4—a kanban systemwas incorporated before the bottleneck station and a CONWIP system was incorporatedafter the bottleneck station.
For the kanban production system, kanban stations were installed at each workstation.Because the processes from the sandblasting station to the batching station required onlymanual labor, this section was considered a single workstation, and a kanban station wasimplemented only at the sandblasting station to pull production. Kanban stations wereinstalled at all the other workstations (Figure 5). The CONWIP production system involvedinstalling one kanban station at the foremost end, which pulled production for the entiresystem (Figure 6). The hybrid type 1 production system involved installing one kanbanstation before the bottleneck station and implementing the CONWIP system for the rest ofthe production line. Figure 7 shows a process flow of the hybrid type 1 simulated system.KANBAN2 was established before the ingot-cutting station. The electrical-property-testingstation transmits production information to KANBAN2, and production at the ingot-cutting station does not begin until it receives information from KANBAN2. The restof the system is pulled using CONWIP. When the final workstation transmits kanbaninformation to KANBAN1, the sandblasting station initiates production. The hybridtype 2 production system involved implementing two CONWIP sections divided by the

Sustainability 2022, 14, 697 8 of 15
bottleneck station. As shown in Figure 7, the sandblasting station was the dividing pointfor the two CONWIP sections. In the front section, the crystal-growing station transmitskanban information to KANBAN1, which was installed at the sandblasting station. Inthe back section, the packaging station transmits kanban information to KANBAN2. Thehybrid type 3 production system involved a simulation divided by the bottleneck station, inwhich the CONWIP system was implemented before the bottleneck station and the kanbansystem is implemented after the bottleneck, as shown in Figure 7. The ingot-cutting stationwas the bottleneck station. Production from the crystal-growing station transmits kanbaninformation to KANBAN1, which was located at the sandblasting station. Each stationafter the ingot-cutting station had a kanban station, forming a pull production system. Thehybrid type 4 production system is the reverse of the hybrid type 3 system. Kanban stationswere installed at each station before the bottleneck station. After the bottleneck station, theCONWIP system was implemented by installing one kanban station for pull production.
Sustainability 2022, 14, x FOR PEER REVIEW 8 of 15
for the rest of the production line. Figure 7 shows a process flow of the hybrid type 1 simulated system. KANBAN2 was established before the ingot-cutting station. The elec-trical-property-testing station transmits production information to KANBAN2, and pro-duction at the ingot-cutting station does not begin until it receives information from KAN-BAN2. The rest of the system is pulled using CONWIP. When the final workstation trans-mits kanban information to KANBAN1, the sandblasting station initiates production. The hybrid type 2 production system involved implementing two CONWIP sections divided by the bottleneck station. As shown in Figure 7, the sandblasting station was the dividing point for the two CONWIP sections. In the front section, the crystal-growing station trans-mits kanban information to KANBAN1, which was installed at the sandblasting station. In the back section, the packaging station transmits kanban information to KANBAN2. The hybrid type 3 production system involved a simulation divided by the bottleneck station, in which the CONWIP system was implemented before the bottleneck station and the kanban system is implemented after the bottleneck, as shown in Figure 7. The ingot-cutting station was the bottleneck station. Production from the crystal-growing station transmits kanban information to KANBAN1, which was located at the sandblasting sta-tion. Each station after the ingot-cutting station had a kanban station, forming a pull pro-duction system. The hybrid type 4 production system is the reverse of the hybrid type 3 system. Kanban stations were installed at each station before the bottleneck station. After the bottleneck station, the CONWIP system was implemented by installing one kanban station for pull production.
Figure 5. Kanban simulation model.
Figure 5. Kanban simulation model.
Sustainability 2022, 14, x FOR PEER REVIEW 9 of 15
Figure 6. CONWIP simulation model.
Figure 7. Hybrid-type simulation models.
4.2. Optimal Configuration Because each of the pull production systems requires its own specific kanban config-
urations and the number of kanban cards affects the system output, the number of kanban cards was identified as a factor in each pull production system that must be accounted for when attempting to obtain the best performance from that system. In this section, RSM was employed to determine the optimal combination of factor levels. The measurable ob-jectives were defined as the WIP level and cycle time. Based on an annual production of 5840 ingots, the production system yielding the lowest WIP level and the shortest cycle time was identified.
Using the hybrid type 1 production system as an example, the two primary goals were to reduce both the WIP level and the cycle time. The experimental procedure solved for an optimal WIP level as an example and performed sensitivity analysis on the optimal pull production system determined is as follows:
Figure 6. CONWIP simulation model.

Sustainability 2022, 14, 697 9 of 15
Sustainability 2022, 14, x FOR PEER REVIEW 9 of 15
Figure 6. CONWIP simulation model.
Figure 7. Hybrid-type simulation models.
4.2. Optimal Configuration Because each of the pull production systems requires its own specific kanban config-
urations and the number of kanban cards affects the system output, the number of kanban cards was identified as a factor in each pull production system that must be accounted for when attempting to obtain the best performance from that system. In this section, RSM was employed to determine the optimal combination of factor levels. The measurable ob-jectives were defined as the WIP level and cycle time. Based on an annual production of 5840 ingots, the production system yielding the lowest WIP level and the shortest cycle time was identified.
Using the hybrid type 1 production system as an example, the two primary goals were to reduce both the WIP level and the cycle time. The experimental procedure solved for an optimal WIP level as an example and performed sensitivity analysis on the optimal pull production system determined is as follows:
Figure 7. Hybrid-type simulation models.
4.2. Optimal Configuration
Because each of the pull production systems requires its own specific kanban configu-rations and the number of kanban cards affects the system output, the number of kanbancards was identified as a factor in each pull production system that must be accounted forwhen attempting to obtain the best performance from that system. In this section, RSMwas employed to determine the optimal combination of factor levels. The measurableobjectives were defined as the WIP level and cycle time. Based on an annual productionof 5840 ingots, the production system yielding the lowest WIP level and the shortest cycletime was identified.
Using the hybrid type 1 production system as an example, the two primary goals wereto reduce both the WIP level and the cycle time. The experimental procedure solved for anoptimal WIP level as an example and performed sensitivity analysis on the optimal pullproduction system determined is as follows:
(1) Define the initial value for each of the factorsTwo kanban stations were installed in the hybrid type 1 production system, one at
the etching station and the other at the ingot-cutting station. The parameters KANBAN1and KANBAN2 were initially set at 90 and 11, respectively. The combination of an initialexperimental range of 70–110 for KANBAN1 and 9–13 for KANBAN2 was chosen.
(2) Fit a first-order regression modelTo fit the WIP data to the first-order regression model, the least-squares method was
adopted with the level of significance set at α = 0.05. The relationship between the WIP leveland all the other variables was obtained. Minitab software was employed to determine thefirst-order regression model that fit the WIP level and all the other variables (Equation (4)).The WIP target value was set at Y1. Among all the regression coefficients, only X1 wassmaller than 0.05 such that this model contained only one variable: X1. The adjustedcoefficient of determination R-sq(adj) was high, indicating a significant linear correlationbetween the variable and response values:
Y1 = 86.279 + 19.310X1 (4)
(3) Fit a second-order regression modelTo fit an appropriate second-order model, central composite design (CCD) was
adopted. The CCD was an experimental design that included a 2k factorial or partial

Sustainability 2022, 14, 697 10 of 15
factorial design, 2k axial points, the distance from the axial points to the central pointdetermined by α = (n f )
1/4 (where nf is the number of experiments), and a center point nc.This example included 22 experiments, with α set at 1.414. Five center point experimentswere added for a total of 13 experiments.
Regression analysis was performed on the results of the experimental designs ofthe second-order models. The fit of these second-order models was calculated usingEquation (5). These results (Table 3) showed that the adjusted coefficient of determinationR-sq(adj) was high, indicating a strong relationship between the response values andthe variables:
Y1 = 85.925 + 19.378X1 + 0.419X2 + 0.782X22 (5)
Table 3. Regression analysis results.
Term Coef SE Coef t-Value p-Value
Constant 86.279 0.251 344 <0.000X1 19.31 0.376 51.33 <0.000X2 0.75 0.376 1.99 0.093
S R-sq R-sq(adj)
0.752428 0.9977 0.997
(4) Multi-objective optimizationAlthough the experiment described above resulted in models that fit the WIP level
and cycle time regressions, the obtained solutions were individual target response valuesbecause different response values have different target values. The maximum daily demandwas approximately 16 ingots, and the yearly output was 5860 ingots. Output within amargin of error of 5% was deemed acceptable. Thus, the objectives were defined as aminimum output of 5700 ingots, a maximum WIP level of 90 ingots, and a maximumcycle time of 9000 min. Accordingly, a solution satisfying these parameter requirementswas sought.
First, the WIP and cycle time models in the aforementioned experiment were rewrittenin equation form, each with its own target values: Y1 ≤ 90 for the WIP level, Y2 ≤ 9000for the cycle time, and Y3 ≥ 5700 for the output. Targets were set for the contourmaps of models that fit the various response values. The overlapping regions on thesecontour maps were the regions containing the optimal solution. Minitab software wasused to overlay the contour plot tool to solve for the optimal overlapping region (Figure 8).CT is the cycle time and OT is the output. The blank region in Figure 8 contains theoptimal parameter settings for this study, and the optimal solution was solved using thesimultaneous optimization method.
This study used Minitab software to solve the focal functions (i.e., parameter settingsthat could satisfy the target values for Y1, Y2, and Y3). This yielded the coded variablesof X1= 0.8714 and X2 = 1.4142 and the predictive values of Y1 = 84.28, Y2 = 8562.35, andY3= 5796.31.
Transforming the factors to natural variables yielded KANBAN1 ≈ 92.4 and KAN-BAN2 ≈ 13.828. Using these data in the system simulation yielded WIP = 81.75, cycletime = 8729.29, and output = 5711. These values matched the anticipated targets set in thisstudy. The kanban stations for the hybrid type 1 production system were, therefore, set toKANBAN1 = 92 and KANBAN2 = 13.
When RSM is used, the needed target can be quickly obtained at a lower experimentalcost and less time. Six different pull production systems and optimal kanban configurationcombinations were examined, and the results are shown in Table 4. A comparison of thesix pull production systems showed that all outputs were similar, but the hybrid type 1showed the best performance with the lowest WIP level and the shortest cycle time.

Sustainability 2022, 14, 697 11 of 15
Sustainability 2022, 14, x FOR PEER REVIEW 11 of 15
parameter settings for this study, and the optimal solution was solved using the simulta‐
neous optimization method.
Figure 8. Multi‐response optimization scope.
This study used Minitab software to solve the focal functions (i.e., parameter set‐
tings that could satisfy the target values for 𝑌 , 𝑌 , and 𝑌 ). This yielded the coded varia‐
bles of 𝑋 = 0.8714 and 𝑋 = 1.4142 and the predictive values of 𝑌 = 84.28, 𝑌 = 8562.35, and 𝑌 = 5796.31.
Transforming the factors to natural variables yielded KANBAN1 ≈ 92.4 and KAN‐
BAN2 ≈ 13.828. Using these data in the system simulation yielded WIP = 81.75, cycle time
= 8729.29, and output = 5711. These values matched the anticipated targets set in this
study. The kanban stations for the hybrid type 1 production system were, therefore, set to
KANBAN1 = 92 and KANBAN2 = 13.
When RSM is used, the needed target can be quickly obtained at a lower experimental
cost and less time. Six different pull production systems and optimal kanban configura‐
tion combinations were examined, and the results are shown in Table 4. A comparison of
the six pull production systems showed that all outputs were similar, but the hybrid type
1 showed the best performance with the lowest WIP level and the shortest cycle time.
Table 4. Comparison of the pull production systems and industrial practice.
Production
Type Kanban Stations No. of Kanban
Output WIP Cycle Time
(Ingots) (Ingots) (min)
Kanban (Etching, feeding, growth, cutting,
inspection) (16, 6, 58, 22, 5) 5724.00 89.9 9281.97
CONWIP (Etching) −89 5790.60 85.2 8787.68
Hybrid 1 (Etching, cutting) (92, 13) 5711.00 81.75 8729.29
Hybrid 2 (Etching, cutting) (75, 22) 5766.33 83.33 8926.74
Hybrid 3 (Etching, cutting, inspection) (73, 18, 6) 5743.80 85.4 8891.64
Hybrid 4 (Etching, feeding, growth, cutting) (21, 5, 59, 19) 5784.20 84.9 9713.12
Industry
practice 5829.90 111.7 10,163.13
Figure 8. Multi-response optimization scope.
Table 4. Comparison of the pull production systems and industrial practice.
Production Type Kanban Stations No. of KanbanOutput WIP Cycle Time
(Ingots) (Ingots) (min)
Kanban (Etching, feeding, growth,cutting, inspection) (16, 6, 58, 22, 5) 5724.00 89.9 9281.97
CONWIP (Etching) −89 5790.60 85.2 8787.68Hybrid 1 (Etching, cutting) (92, 13) 5711.00 81.75 8729.29Hybrid 2 (Etching, cutting) (75, 22) 5766.33 83.33 8926.74Hybrid 3 (Etching, cutting, inspection) (73, 18, 6) 5743.80 85.4 8891.64Hybrid 4 (Etching, feeding, growth, cutting) (21, 5, 59, 19) 5784.20 84.9 9713.12
Industry practice 5829.90 111.7 10,163.13
In the simulations, the degree of improvement was compared by incorporating thepull production systems into the existing conditions. Table 5 shows that hybrid type 1showed the highest percentage of improvement: its WIP decreased from 110 ingots to81 ingots, an improvement of approximately 25.68%, and its cycle time decreased from10,448.36 min to 8729.29 min, an improvement of approximately 16.45%. These resultsindicate that the hybrid type 1 system outperformed the other systems in this environment.The sensitivity analysis of this system is described in the following section.
Table 5. Improvement ratio between pull production systems and industrial practice.
Pull Production System WIP Improvement Ratio Cycle Time Improvement Ratio
Kanban 18.27% 11.16%CONWIP 22.55% 15.89%Hybrid 1 25.68% 16.45%Hybrid 2 24.25% 14.56%Hybrid 3 22.36% 14.90%Hybrid 4 22.82% 7.04%
The line balance analysis results showed that the bottleneck station was at the back endof the production line. The number of machines at the bottleneck station was reduced toincrease the workstation load and exacerbate the production line imbalance. These changes

Sustainability 2022, 14, 697 12 of 15
were input into the system to analyze their effect on the bottleneck station load in theexisting system and all the pull production systems. Four levels of bottleneck station loadswere defined based on increasing the load by a specific percentage, and the resulting outputwas compared with that of the current system and each of the pull production systems.Results that differed from each other by less than 5% were deemed to be equivalent. Table 6shows changes in WIP levels and cycle times resulting from changes to the bottleneckstation load. In the existing system, an increase in WIP levels was observed when anincrease in the bottleneck station load occurred. WIP levels in the pull production systemswere lower than those in the existing system. Figure 9 shows a comparison of the changesobserved in the pull production systems resulting from an increase in the bottleneck stationload. The cycle time and WIP levels were lower in the hybrid type 1 system than in theother systems.
Table 6. Comparison of the cycle time and WIP at various levels of bottleneck loading.
BottleneckLoading
0% 7.50% 15.60% 34.50% 48.30%
CycleTime WIP Cycle
Time WIP CycleTime WIP Cycle
Time WIP CycleTime WIP
Kanban 9281.97 89.9 9726.65 82.33 10,527.30 90.33 12,209.63 84 13,320.32 85CONWIP 8787.68 85.2 9302.14 87.13 10,077.00 87.38 11,796.27 86.25 12,984.49 86.88Hybrid1 8729.29 81.75 9121.92 80.4 9858.11 80.8 11,526.50 82.5 12,683.22 79Hybrid2 8926.74 83.33 9389.86 82.67 10,165.50 85 11,773.83 82.67 12,830.07 79.33Hybrid3 8891.64 85.4 9214.42 82.67 9960.99 79.33 11,532.71 82.33 12,555.86 79.33Hybrid4 9713.12 84.9 10,257.44 86 11,101.10 88.67 12,848.24 86.67 14,005.93 87.33Industrypractice 10,163.13 111.7 26,532.32 474.5 48,526.70 931.2 86,078.40 1716.9 105,765.21 2138.3Sustainability 2022, 14, x FOR PEER REVIEW 13 of 15
Figure 9. Cycle time and WIP trends under various bottleneck loads.
The sensitivity analysis of the bottleneck station load described above revealed that in the existing production system, an increase in the bottleneck station load led to in-creases in both the WIP level and the cycle time. However, the hybrid type 1 production system was unaffected by the increase in the bottleneck station load. Thus, this system outperformed the existing production system.
Further analysis of customer demand was performed in this study based on the pull production system with the best performance (i.e., the hybrid type 1 system). The config-uration of factors obtained through this study was examined at various levels of demand to determine how this would affect both the hybrid type 1 system and the current system. First, customer demand levels were defined as high, intermediate, and low. A high level of demand was defined as the current annual demand (5840 ingots), an intermediate level of demand was defined as 75% of high demand (5840 × 0.75 = 4380), and a low level of demand was defined as 50% of high demand (5840 × 0.5 = 2920). Table 7 shows the results based on these three levels of demand and the optimal configuration of the factor levels for the hybrid type 1 system, as determined by the system simulation and RSM. Table 8 shows the results of the system simulations of the current system and the hybrid type 1 system. Figure 10 was produced based on the results in Table 8. Both the WIP level and the cycle time were lower in the hybrid type 1 system than in the current system. The sensitivity analysis results showed that the hybrid type 1 system was suitable for this pro-duction environment and that it effectively improved the WIP level and the cycle time.
Table 7. Hybrid type 1 at various levels of customer demand and various kanban configurations.
Customer Demand
Kanban Configuration Output (Ingots) WIP (Ingots) Cycle Time (min)
Etching Cutting 100% 92 13 5818 80 8657.24 75% 67 15 4416.63 61.25 8705.83 50% 48 8 2994 41.88 9429.97
Table 8. Comparison of WIP and cycle time at various levels of customer demand.
Customer Demand
Industrial Practice Hybrid Type 1 WIP (Ingots) Cycle Time (min) WIP (Ingots) Cycle Time (min)
100% 110 9159.26 80 8657.24 75% 63.75 8737.46 61.25 8705.83 50% 43.63 9613.02 41.88 9429.97
77
82
87
92
0% 7.50% 15.60% 34.50% 48.30%
WIP
(Ing
ots)
Bottleneck load
Kanban CONWIP Hybrid 1
Hybrid 2 Hybrid 3 Hybrid 4
8500
10500
12500
14500
0% 7.50% 15.60% 34.50% 48.30%
Cycle
tim
e (m
in)
Bottleneck load
Kanban CONWIP Hybrid 1
Hybrid 2 Hybrid 3 Hybrid 4
Figure 9. Cycle time and WIP trends under various bottleneck loads.
The sensitivity analysis of the bottleneck station load described above revealed that inthe existing production system, an increase in the bottleneck station load led to increases inboth the WIP level and the cycle time. However, the hybrid type 1 production system wasunaffected by the increase in the bottleneck station load. Thus, this system outperformedthe existing production system.
Further analysis of customer demand was performed in this study based on thepull production system with the best performance (i.e., the hybrid type 1 system). Theconfiguration of factors obtained through this study was examined at various levels ofdemand to determine how this would affect both the hybrid type 1 system and the currentsystem. First, customer demand levels were defined as high, intermediate, and low. A highlevel of demand was defined as the current annual demand (5840 ingots), an intermediatelevel of demand was defined as 75% of high demand (5840 × 0.75 = 4380), and a low levelof demand was defined as 50% of high demand (5840 × 0.5 = 2920). Table 7 shows theresults based on these three levels of demand and the optimal configuration of the factor

Sustainability 2022, 14, 697 13 of 15
levels for the hybrid type 1 system, as determined by the system simulation and RSM.Table 8 shows the results of the system simulations of the current system and the hybridtype 1 system. Figure 10 was produced based on the results in Table 8. Both the WIPlevel and the cycle time were lower in the hybrid type 1 system than in the current system.The sensitivity analysis results showed that the hybrid type 1 system was suitable for thisproduction environment and that it effectively improved the WIP level and the cycle time.
Table 7. Hybrid type 1 at various levels of customer demand and various kanban configurations.
CustomerDemand
Kanban Configuration Output(Ingots) WIP (Ingots) Cycle Time
(min)Etching Cutting
100% 92 13 5818 80 8657.2475% 67 15 4416.63 61.25 8705.8350% 48 8 2994 41.88 9429.97
Table 8. Comparison of WIP and cycle time at various levels of customer demand.
CustomerDemand
Industrial Practice Hybrid Type 1
WIP (Ingots) Cycle Time(min) WIP (Ingots) Cycle Time
(min)
100% 110 9159.26 80 8657.2475% 63.75 8737.46 61.25 8705.8350% 43.63 9613.02 41.88 9429.97
Sustainability 2022, 14, x FOR PEER REVIEW 14 of 15
Figure 10. WIP quantity and cycle time at various levels of demand.
5. Conclusions Solar silicon manufacturers operate in a flow shop production environment. Produc-
tion times differ greatly between workstations, resulting in unequal production capacity and unbalanced production lines. WIP accumulation at the bottleneck station results in an excessively long cycle time. A case study was undertaken that relied on an analysis of current conditions based on lean production methods. Optimal kanban card configura-tions for various pull production systems were obtained through RSM. To decrease the WIP level and shorten the production time, RSM was employed in the design of several pull production systems to optimize the number of kanban cards and to determine the optimal pull production system.
A comparison of the existing system and a pull production system showed that im-plementing a pull production system reduced the WIP level from 110 to 80 ingots (an improvement of approximately 25.68%) and reduced the cycle time from 10,448.36 to 8729.29 min (an improvement of approximately 16.45%). The study results showed that the hybrid type 1 pull production system achieved the highest performance for the case company and that implementing this system would effectively regulate the WIP level and shorten the cycle time, thereby reducing system waste. In future studies, it would be ben-eficial to use different research designs to determine the optimal solution and/or to con-sider whether other research designs produce different results in response to the produc-tion environment. In addition, in future studies, researchers could pursue the direction of comparing how pull production systems compare in different production environments or multi-product environments.
Author Contributions: Conceptualization, C.-Y.C., C.-L.L. and C.Y.; Data curation, C.-L.L.; Formal analysis, C.-L.L. and S.-F.L.; Methodology, C.-Y.C. and S.-F.L.; Project administration, S.-F.L.; Soft-ware, C.-L.L. and C.Y.; Writing—original draft, C.-L.L. and S.-F.L.; Supervision, C.-Y.C. and C.Y.; Writing—review and editing, C.-Y.C., R.J. and C.Y; Funding acquisition, C.-Y.C. and C.Y. All au-thors have read and agreed to the published version of the manuscript.
Funding: This research was supported by the National Taipei University of Technology, King Mongkut’s Institute of Technology Ladkrabang Joint Research Program grant numbers NTUT-KMITL-108-03 and KMITL-2564-02-01-028.
Conflicts of Interest: The authors declare no conflict of interest.
References 1. Müller, A.; Ghosh, M.; Sonnenschein, R.; Woditsch, P. Silicon for photovoltaic applications. Mater. Sci. Eng. B 2006, 134, 257–
262. 2. Conway, R.; Maxwell, W.; McClain, J.O.; Thomas, L.J. The role of work-in-process inventory in serial production lines. Oper.
Res. 1988, 36, 229–241. 3. Meyers, F.E.; Stewart, J.R. Motion and Time Study for Lean Manufacturing; Pearson College Division: Victoria, Canada, 2002.
020406080
100120
100% 75% 50%
WIP
(ing
ots)
Demand
As-is Hybrid Type 1
8,000
8,500
9,000
9,500
10,000
100% 75% 50%
Cycle
tim
e (m
in)
Demand
As-is Hybrid Type 1
Figure 10. WIP quantity and cycle time at various levels of demand.
5. Conclusions
Solar silicon manufacturers operate in a flow shop production environment. Produc-tion times differ greatly between workstations, resulting in unequal production capacityand unbalanced production lines. WIP accumulation at the bottleneck station results inan excessively long cycle time. A case study was undertaken that relied on an analysis ofcurrent conditions based on lean production methods. Optimal kanban card configurationsfor various pull production systems were obtained through RSM. To decrease the WIPlevel and shorten the production time, RSM was employed in the design of several pullproduction systems to optimize the number of kanban cards and to determine the optimalpull production system.
A comparison of the existing system and a pull production system showed thatimplementing a pull production system reduced the WIP level from 110 to 80 ingots (animprovement of approximately 25.68%) and reduced the cycle time from 10,448.36 to8729.29 min (an improvement of approximately 16.45%). The study results showed thatthe hybrid type 1 pull production system achieved the highest performance for the case

Sustainability 2022, 14, 697 14 of 15
company and that implementing this system would effectively regulate the WIP leveland shorten the cycle time, thereby reducing system waste. In future studies, it wouldbe beneficial to use different research designs to determine the optimal solution and/orto consider whether other research designs produce different results in response to theproduction environment. In addition, in future studies, researchers could pursue thedirection of comparing how pull production systems compare in different productionenvironments or multi-product environments.
Author Contributions: Conceptualization, C.-Y.C., C.-L.L. and C.Y.; Data curation, C.-L.L.; Formalanalysis, C.-L.L. and S.-F.L.; Methodology, C.-Y.C. and S.-F.L.; Project administration, S.-F.L.; Software,C.-L.L. and C.Y.; Writing—original draft, C.-L.L. and S.-F.L.; Supervision, C.-Y.C. and C.Y.; Writing—review and editing, C.-Y.C., R.J. and C.Y; Funding acquisition, C.-Y.C. and C.Y. All authors have readand agreed to the published version of the manuscript.
Funding: This research was supported by the National Taipei University of Technology, KingMongkut’s Institute of Technology Ladkrabang Joint Research Program grant numbers NTUT-KMITL-108-03 and KMITL-2564-02-01-028.
Conflicts of Interest: The authors declare no conflict of interest.
References1. Müller, A.; Ghosh, M.; Sonnenschein, R.; Woditsch, P. Silicon for photovoltaic applications. Mater. Sci. Eng. B 2006, 134, 257–262.
[CrossRef]2. Conway, R.; Maxwell, W.; McClain, J.O.; Thomas, L.J. The role of work-in-process inventory in serial production lines. Oper. Res.
1988, 36, 229–241. [CrossRef]3. Meyers, F.E.; Stewart, J.R. Motion and Time Study for Lean Manufacturing; Pearson College Division: Victoria, Canada, 2002.4. Sugimori, Y.; Kusunoki, K.; Cho, F.; Uchikawa, S. Toyota production system and kanban system materialization of just-in-time
and respect-for-human system. Int. J. Prod. Res. 1977, 15, 553–564. [CrossRef]5. Deleersnyder, J.-L.; Hodgson, T.J.; Muller-Malek, H.; O’Grady, P.J. Kanban controlled pull systems: An analytic approach. Manag.
Sci. 1989, 35, 1079–1091. [CrossRef]6. Seth, D.; Gupta, V. Application of value stream mapping for lean operations and cycle time reduction: An Indian case study. Prod.
Plan. Control. 2005, 16, 44–59. [CrossRef]7. Shah, R.; Ward, P.T. Defining and developing measures of lean production. J. Oper. Manag. 2007, 25, 785–805. [CrossRef]8. Gstettner, S.; Kuhn, H. Analysis of production control systems kanban and CONWIP. Int. J. Prod. Res. 1996, 34, 3253–3273.
[CrossRef]9. Leonardo, D.G.; Sereno, B.; da Silva, D.S.A.; Sampaio, M.; Massote, A.A.; Simões, J.C. Implementation of hybrid Kanban-CONWIP
system: A case study. J. Manuf. Technol. Manag. 2017, 28, 714–736. [CrossRef]10. Pettersen, J.A.; Segerstedt, A. Restricted work-in-process: A study of differences between Kanban and CONWIP. Int. J. Prod. Econ.
2009, 118, 199–207. [CrossRef]11. Khojasteh-Ghamari, Y. A performance comparison between Kanban and CONWIP controlled assembly systems. J. Intell. Manuf.
2009, 20, 751–760. [CrossRef]12. Ono, T.; Mito, S. Just-In-Time for Today and Tomorrow; Productivity Press: Woodland Hills, CA, USA, 1988.13. Hopp, W.J.; Spearman, M.L. Factory Physics: Foundations of Manufacturing Management, 2nd ed.; Irwin/McGraw-Hill:
Boston, MA, USA, 2001.14. Womack, J.P.; Jones, D.T. Lean Thinking: Banish Waste and Create Wealth in Your Corporation; Simon and Schuster: New Work, NY, USA, 2010.15. Williams, E.J.; Ulgen, O.M.; DeWitt, C. Manufacturing modeling methods: An approach and interface for building generic
manufacturing kanban-systems models. In Proceedings of the 34th conference on Winter simulation: Exploring new frontiers,San Diego, CA, USA, 8–11 December 2002; pp. 1138–1141.
16. Spearman, M.L.; Woodruff, D.L.; Hopp, W.J. CONWIP: A pull alternative to kanban. Int. J. Prod. Res. 1990, 28, 879–894. [CrossRef]17. Bonvik, A.M.; Gershwin, S.B. Beyond Kanban: Creating and analyzing lean shop floor control policies. In Proceedings of the
Manufacturing and Service Operations Management Conference Proceeding, Hanover, NH, USA, 28 June 1996; pp. 46–51.18. Gaury, E.; Pierreval, H.; Kleijnen, J.P. An evolutionary approach to select a pull system among Kanban, Conwip and Hybrid.
J. Intell. Manuf. 2000, 11, 157–167. [CrossRef]19. Geraghty, J.; Heavey, C. A comparison of hybrid push/pull and CONWIP/pull production inventory control policies. Int. J. Prod.
Econ. 2004, 91, 75–90. [CrossRef]20. Hodgson, T.J.; Wang, D. Optimal hybrid push/pull control strategies for a parallel multistage system: Part I. Int. J. Prod. Res.
1991, 29, 1279–1287. [CrossRef]21. Abdulmalek, F.A.; Rajgopal, J. Analyzing the benefits of lean manufacturing and value stream mapping via simulation: A process
sector case study. Int. J. Prod. Econ. 2007, 107, 223–236. [CrossRef]

Sustainability 2022, 14, 697 15 of 15
22. Yang, T.; Fu, H.-P.; Yang, K.-Y. An evolutionary-simulation approach for the optimization of multi-constant work-in-processstrategy—A case study. Int. J. Prod. Econ. 2007, 107, 104–114. [CrossRef]
23. Lu, J.-C.; Yang, T.; Wang, C.-Y. A lean pull system design analysed by value stream mapping and multiple criteria decision-makingmethod under demand uncertainty. Int. J. Comput. Integr. Manuf. 2011, 24, 211–228. [CrossRef]
24. Yang, T.; Hung, Y.H.; Huang, K.C. A simulation study on CONWIP system design for bicycle chain manufacturing. IFAC-PapersOnLine 2019, 52, 2477–2481. [CrossRef]
25. Onyeocha, C.E.; Wang, J.; Khoury, J.; Geraghty, J. A comparison of HK-CONWIP and BK-CONWIP control strategies in amulti-product manufacturing system. Oper. Res. Perspect. 2015, 2, 137–149. [CrossRef]
26. Romagnoli, G. Design and simulation of CONWIP in the complex flexible job shop of a Make-To-Order manufacturing firm. Int.J. Ind. Eng. Comput. 2015, 6, 117–134. [CrossRef]
27. Rother, M.; Shook, J. Learning to See; Lean Enterprise Institute: Boston, MA, USA, 1999.28. Wang, Y.; Cao, J.; Kong, L. Hybrid Kanban/Conwip control system simulation and optimization based on theory of constraints.
In Proceedings of the 2009 IEEE International Conference on Intelligent Computing and Intelligent Systems, Shanghai, China,20–22 November 2009; IEEE: Manhattan, NY, USA, 2009; Volume 2, pp. 666–670.
29. Khojasteh-Ghamari, Y. Developing a framework for performance analysis of a production process controlled by Kanban andCONWIP. J. Intell. Manuf. 2012, 23, 61–71. [CrossRef]
Copyright © 2022 FDOKUMEN