Earthquake response of concrete arch dams: a plastic-damage approach
Upload
khangminh22Category
view
3download
0
sustainability
Article
Post-Earthquake Damage Assessment—Case Study of theEducational Building after the Zagreb Earthquake
Luka Lulic, Karlo Ožic, Tomislav Kišicek , Ivan Hafner and Mislav Stepinac *
�����������������
Citation: Lulic, L.; Ožic, K.; Kišicek,
T.; Hafner, I.; Stepinac, M.
Post-Earthquake Damage
Assessment—Case Study of the
Educational Building after the Zagreb
Earthquake. Sustainability 2021, 13,
6353. https://doi.org/10.3390/
su13116353
Academic Editor: Giacomo Salvadori
Received: 29 April 2021
Accepted: 27 May 2021
Published: 3 June 2021
Publisher’s Note: MDPI stays neutral
with regard to jurisdictional claims in
published maps and institutional affil-
iations.
Copyright: © 2021 by the authors.
Licensee MDPI, Basel, Switzerland.
This article is an open access article
distributed under the terms and
conditions of the Creative Commons
Attribution (CC BY) license (https://
creativecommons.org/licenses/by/
4.0/).
Faculty of Civil Engineering, University of Zagreb, 10000 Zagreb, Croatia; [email protected] (L.L.);[email protected] (K.O.); [email protected] (T.K.); [email protected] (I.H.)* Correspondence: [email protected]
Abstract: In the wake of recent strong earthquakes in Croatia, there is a need for a detailed andmore comprehensive post-earthquake damage assessment. Given that masonry structures are highlyvulnerable to horizontal actions caused by earthquakes and a majority of the Croatian buildingstock is made of masonry, this field is particularly important for Croatia. In this paper, a completeassessment of an educational building in Zagreb Lower Town is reported. An extensive programof visual inspection and geometrical surveys has been planned and performed. Additionally, anin situ shear strength test is presented. After extensive fieldwork, collected data and results wereinput in 3Muri software for structural modeling. Moreover, a non-linear static (pushover) analysiswas performed to individuate the possible failure mechanisms and to compare real-life damage tosoftware results.
Keywords: assessment; earthquake; Zagreb; case study; cultural heritage
1. Introduction
On 22 March 2020, at 6 h 22 min, Zagreb Metropolitan area was hit by an earthquake ofmedium magnitude ML = 5.5, and intensity of VII, in the epicenter, according to the EMS-98scale [1]. At 7 h 1 min followed the strongest subsequent earthquake of magnitude ML = 5.0and intensity of VI. The main earthquake damaged most of the buildings in the LowerTown, including residential buildings, universities, schools, kindergartens, hospitals andpublic buildings. The vast majority of buildings built after the first mandatory earthquakeregulations in former Yugoslavia (1964) [2,3] either remained intact or suffered smalldamage. Nonetheless, the larger part of the city’s historical center (Upper and LowerTown) was severely damaged because the buildings in the center were built before anyseismic regulations. The damage to historical buildings is enormous. Numerous museums,churches and university buildings have been severely damaged (Figure 1). At the end ofthe year, Croatia was hit by another devastating earthquake with an epicenter in Petrinja,located approx. 50 km from Zagreb (ML = 6.3). The quake caused subsequent damage toalready damaged buildings, but to a lesser extent.
As well as most parts of the European region, many existing buildings in Croatiaare built in masonry. Given that most of the so-called “strategic” buildings of culturalsignificance and high historical importance are built using masonry, such a condition issuggesting that the assessment and rehabilitation of existing masonry structures must beconducted on a very high level [4–8]. An important part of the structural assessment isnumerical analysis. When it comes to existing buildings, a more refined non-linear analysisshould be adopted. Non-linear static analysis or pushover analysis is important and isrecommended in Eurocode 8-3 as a reference method for such situations.
Sustainability 2021, 13, 6353. https://doi.org/10.3390/su13116353 https://www.mdpi.com/journal/sustainability

Sustainability 2021, 13, 6353 2 of 25Sustainability 2021, 11, x FOR PEER REVIEW 2 of 27
Figure 1. Typical damage to educational buildings after the Zagreb earthquake (photo credit: M. Stepinac).
As well as most parts of the European region, many existing buildings in Croatia are
built in masonry. Given that most of the so-called “strategic” buildings of cultural signif-
icance and high historical importance are built using masonry, such a condition is sug-
gesting that the assessment and rehabilitation of existing masonry structures must be con-
ducted on a very high level [4–8]. An important part of the structural assessment is nu-
merical analysis. When it comes to existing buildings, a more refined non-linear analysis
should be adopted. Non-linear static analysis or pushover analysis is important and is
recommended in Eurocode 8-3 as a reference method for such situations.
After the earthquake, the first to respond to a disaster were civil engineers who led
and coordinated the entire organization of building assessment and damage detection.
Various similar post-earthquake assessment procedures are used worldwide [9–11].
In the first week, a large number of buildings were inspected, with a rapid post-earth-
quake assessment. The most endangered buildings in the city’s center were the ones under
cultural heritage protection. The aim of a rapid assessment of buildings is to determine
the degree of damage to buildings concerning the protection of life and property, that is,
to determine if the buildings are usable, temporarily unusable or unusable. Emerging
technological advances allow the usage of artificial intelligence in the post-earthquake as-
sessment process in the form of machine learning methods for more efficient and precise
results [6,12–15].
Zagreb’s historic urban complex is a protected area regulated by the Law on the Pro-
tection and Preservation of Cultural Heritage. The area is divided into two zones, zone A
and zone B (Figure 2) [1]. Zone A includes the oldest and most architecturally valuable
Figure 1. Typical damage to educational buildings after the Zagreb earthquake (photo credit: M. Stepinac).
After the earthquake, the first to respond to a disaster were civil engineers who ledand coordinated the entire organization of building assessment and damage detection.Various similar post-earthquake assessment procedures are used worldwide [9–11].
In the first week, a large number of buildings were inspected, with a rapid post-earthquake assessment. The most endangered buildings in the city’s center were theones under cultural heritage protection. The aim of a rapid assessment of buildings isto determine the degree of damage to buildings concerning the protection of life andproperty, that is, to determine if the buildings are usable, temporarily unusable or unusable.Emerging technological advances allow the usage of artificial intelligence in the post-earthquake assessment process in the form of machine learning methods for more efficientand precise results [6,12–15].
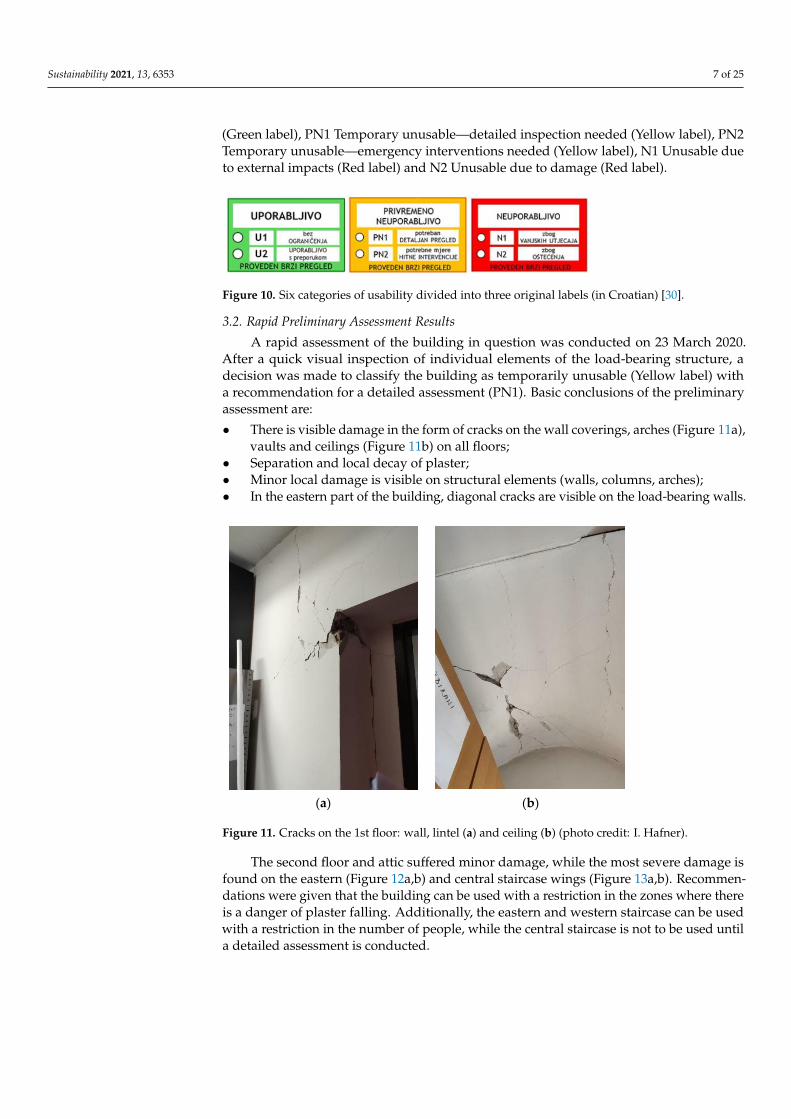
Zagreb’s historic urban complex is a protected area regulated by the Law on theProtection and Preservation of Cultural Heritage. The area is divided into two zones, zoneA and zone B (Figure 2) [1]. Zone A includes the oldest and most architecturally valuableparts of Zagreb and is characterized by densely-built blocks of buildings made of stone,brick or a combination of materials. Most buildings consist of massive longitudinal andorthogonal walls and masonry ceiling vaults or wooden ceiling beams and wooden roofs(Figure 3) [1]. Many hospitals, schools, business premises, residential and governmentbuildings, cultural institutions, monuments, churches and chapels are located in zoneA and are protected either as part of a historic urban complex or as individual heritagebuildings per se. A total of 72% [1] of buildings in zone A suffered major damage due tothe earthquake; to compare the damage suffered by this area is almost proportional to the
Sustainability 2021, 13, 6353 3 of 25
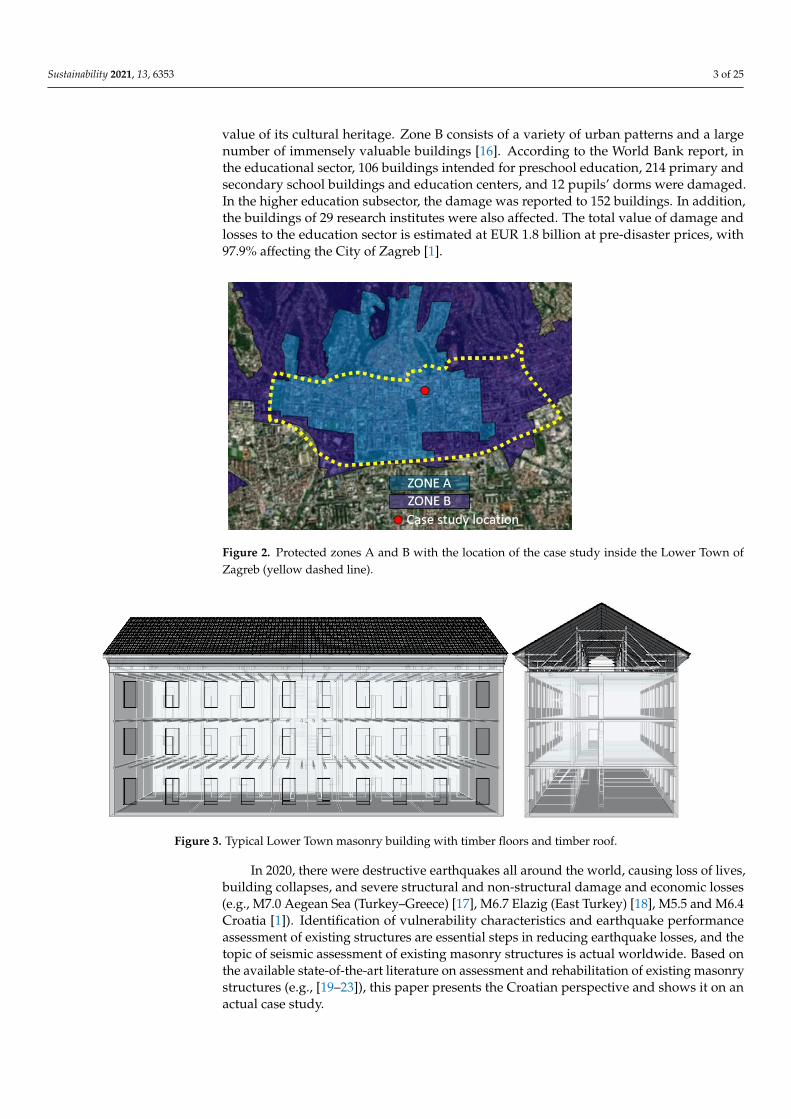
value of its cultural heritage. Zone B consists of a variety of urban patterns and a largenumber of immensely valuable buildings [16]. According to the World Bank report, inthe educational sector, 106 buildings intended for preschool education, 214 primary andsecondary school buildings and education centers, and 12 pupils’ dorms were damaged.In the higher education subsector, the damage was reported to 152 buildings. In addition,the buildings of 29 research institutes were also affected. The total value of damage andlosses to the education sector is estimated at EUR 1.8 billion at pre-disaster prices, with97.9% affecting the City of Zagreb [1].
Sustainability 2021, 11, x FOR PEER REVIEW 3 of 27
parts of Zagreb and is characterized by densely-built blocks of buildings made of stone,
brick or a combination of materials. Most buildings consist of massive longitudinal and
orthogonal walls and masonry ceiling vaults or wooden ceiling beams and wooden roofs
(Figure 3) [1]. Many hospitals, schools, business premises, residential and government
buildings, cultural institutions, monuments, churches and chapels are located in zone A
and are protected either as part of a historic urban complex or as individual heritage build-
ings per se. A total of 72% [1] of buildings in zone A suffered major damage due to the
earthquake; to compare the damage suffered by this area is almost proportional to the
value of its cultural heritage. Zone B consists of a variety of urban patterns and a large
number of immensely valuable buildings [16]. According to the World Bank report, in the
educational sector, 106 buildings intended for preschool education, 214 primary and sec-
ondary school buildings and education centers, and 12 pupils’ dorms were damaged. In
the higher education subsector, the damage was reported to 152 buildings. In addition,
the buildings of 29 research institutes were also affected. The total value of damage and
losses to the education sector is estimated at EUR 1.8 billion at pre-disaster prices, with
97.9% affecting the City of Zagreb [1].
Figure 2. Protected zones A and B with the location of the case study inside the Lower Town of
Zagreb (yellow dashed line).
Figure 3. Typical Lower Town masonry building with timber floors and timber roof.
In 2020, there were destructive earthquakes all around the world, causing loss of
lives, building collapses, and severe structural and non-structural damage and economic
losses (e.g., M7.0 Aegean Sea (Turkey–Greece) [17], M6.7 Elazig (East Turkey) [18], M5.5
Figure 2. Protected zones A and B with the location of the case study inside the Lower Town ofZagreb (yellow dashed line).
Sustainability 2021, 11, x FOR PEER REVIEW 3 of 27
parts of Zagreb and is characterized by densely-built blocks of buildings made of stone,
brick or a combination of materials. Most buildings consist of massive longitudinal and
orthogonal walls and masonry ceiling vaults or wooden ceiling beams and wooden roofs
(Figure 3) [1]. Many hospitals, schools, business premises, residential and government
buildings, cultural institutions, monuments, churches and chapels are located in zone A
and are protected either as part of a historic urban complex or as individual heritage build-
ings per se. A total of 72% [1] of buildings in zone A suffered major damage due to the
earthquake; to compare the damage suffered by this area is almost proportional to the
value of its cultural heritage. Zone B consists of a variety of urban patterns and a large
number of immensely valuable buildings [16]. According to the World Bank report, in the
educational sector, 106 buildings intended for preschool education, 214 primary and sec-
ondary school buildings and education centers, and 12 pupils’ dorms were damaged. In
the higher education subsector, the damage was reported to 152 buildings. In addition,
the buildings of 29 research institutes were also affected. The total value of damage and
losses to the education sector is estimated at EUR 1.8 billion at pre-disaster prices, with
97.9% affecting the City of Zagreb [1].
Figure 2. Protected zones A and B with the location of the case study inside the Lower Town of
Zagreb (yellow dashed line).
Figure 3. Typical Lower Town masonry building with timber floors and timber roof.
In 2020, there were destructive earthquakes all around the world, causing loss of
lives, building collapses, and severe structural and non-structural damage and economic
losses (e.g., M7.0 Aegean Sea (Turkey–Greece) [17], M6.7 Elazig (East Turkey) [18], M5.5
Figure 3. Typical Lower Town masonry building with timber floors and timber roof.
In 2020, there were destructive earthquakes all around the world, causing loss of lives,building collapses, and severe structural and non-structural damage and economic losses(e.g., M7.0 Aegean Sea (Turkey–Greece) [17], M6.7 Elazig (East Turkey) [18], M5.5 and M6.4Croatia [1]). Identification of vulnerability characteristics and earthquake performanceassessment of existing structures are essential steps in reducing earthquake losses, and thetopic of seismic assessment of existing masonry structures is actual worldwide. Based onthe available state-of-the-art literature on assessment and rehabilitation of existing masonrystructures (e.g., [19–23]), this paper presents the Croatian perspective and shows it on anactual case study.

Sustainability 2021, 13, 6353 4 of 25
2. The Case Study
The subject of this paper is a building (Figures 4 and 5) located at Vlaška Street 38as an attached building inside a block. Today’s building was built in 1895 by adaptingand upgrading two one-story buildings that were built in the early 19th century. Thebuilding was upgraded in 1906, while the building’s current shape established completereconstruction in 1997. The building was retrofitted in 1997 for educational purposes andseismic strengthening was not implemented. The building has a rectangular ground planwith the main orientation, which is the longer side of the building in the east-west direction.The building’s external dimensions are 12 × 53 m, with two wings: one, 4.4 × 7.6 m andthe other, 4.2 × 5.4 m located at the south side of the building. The total floor area of thebuilding is approximately 685 m2. The building consists of a basement, first, second, thirdfloor and attic. According to the Croatian seismic hazard map [24], the building is locatedin the area of peak ground acceleration intensity of agR = 0.255 g for a return period of475 years. The building serves as an educational-scientific institution. The condition ofthe building before the earthquake, regarding the vertical loads, was satisfactory, and thebuilding was regularly maintained.
Sustainability 2021, 11, x FOR PEER REVIEW 4 of 27
and M6.4 Croatia [1]). Identification of vulnerability characteristics and earthquake per-
formance assessment of existing structures are essential steps in reducing earthquake
losses, and the topic of seismic assessment of existing masonry structures is actual world-
wide. Based on the available state-of-the-art literature on assessment and rehabilitation of
existing masonry structures (e.g., [19–23]), this paper presents the Croatian perspective
and shows it on an actual case study.
2. The Case Study
The subject of this paper is a building (Figures 4 and 5) located at Vlaška Street 38 as
an attached building inside a block. Today’s building was built in 1895 by adapting and
upgrading two one-story buildings that were built in the early 19th century. The building
was upgraded in 1906, while the building’s current shape established complete recon-
struction in 1997. The building was retrofitted in 1997 for educational purposes and seis-
mic strengthening was not implemented. The building has a rectangular ground plan with
the main orientation, which is the longer side of the building in the east-west direction.
The building’s external dimensions are 12 × 53 m, with two wings: one, 4.4 × 7.6 m and the
other, 4.2 × 5.4 m located at the south side of the building. The total floor area of the build-
ing is approximately 685 m2. The building consists of a basement, first, second, third floor
and attic. According to the Croatian seismic hazard map [24], the building is located in
the area of peak ground acceleration intensity of agR = 0.255 g for a return period of 475
years. The building serves as an educational-scientific institution. The condition of the
building before the earthquake, regarding the vertical loads, was satisfactory, and the
building was regularly maintained.
Figure 4. Aerial view of the building—north façade (photo credit: M. Stepinac). Figure 4. Aerial view of the building—north façade (photo credit: M. Stepinac).Sustainability 2021, 11, x FOR PEER REVIEW 5 of 27
Figure 5. Aerial view of the building—south façade (photo credit: M. Stepinac).
The original drawings show foundations that are approximately 1.0 m wide and 1.15
m deep in relation to the surrounding terrain. They were probably built in brick or stone,
which is in line with the construction technology of the time. The building is built of a
solid brick of a standard format 30 × 15 × 6.5 (unusual for today’s standards) used in the
late 19th century. The load-bearing wall thicknesses vary throughout the building, reduc-
ing with height, and are 51, 43, 28 cm (Figures 6 and 7). Plaster thickness also varies
throughout the building from 3 to 6 cm. The ceiling structures before the reconstruction
in 1997 were wooden beams, except for the basement ceiling and the first floor where the
masonry vaults are located. After the 1997 reconstruction, the attic and 2nd floor ceilings
(Figures 8 and 9) were replaced with reinforced concrete slabs, 12 cm and 16 cm, respec-
tively. The 1st floor ceiling is a semi-precast masonry/concrete floor system (Fert ceiling)
inserted between the existing wooden beams. In contrast, the ceilings on the ground floor
and basement remained masonry vaults. The building also has two auxiliary staircases at
the ends of the building made during the 1997 reconstruction and are made of reinforced
concrete, and the main central staircase is older and is made of prefabricated stone stairs
supported by a wall on one and a beam on the other edge.
Figure 6. Ground floor plan with load-bearing walls in red.
Figure 5. Aerial view of the building—south façade (photo credit: M. Stepinac).

Sustainability 2021, 13, 6353 5 of 25
The original drawings show foundations that are approximately 1.0 m wide and1.15 m deep in relation to the surrounding terrain. They were probably built in brick orstone, which is in line with the construction technology of the time. The building is built ofa solid brick of a standard format 30 × 15 × 6.5 (unusual for today’s standards) used in thelate 19th century. The load-bearing wall thicknesses vary throughout the building, reducingwith height, and are 51, 43, 28 cm (Figures 6 and 7). Plaster thickness also varies throughoutthe building from 3 to 6 cm. The ceiling structures before the reconstruction in 1997 werewooden beams, except for the basement ceiling and the first floor where the masonry vaultsare located. After the 1997 reconstruction, the attic and 2nd floor ceilings (Figures 8 and 9)were replaced with reinforced concrete slabs, 12 cm and 16 cm, respectively. The 1st floorceiling is a semi-precast masonry/concrete floor system (Fert ceiling) inserted betweenthe existing wooden beams. In contrast, the ceilings on the ground floor and basementremained masonry vaults. The building also has two auxiliary staircases at the ends of thebuilding made during the 1997 reconstruction and are made of reinforced concrete, andthe main central staircase is older and is made of prefabricated stone stairs supported by awall on one and a beam on the other edge.
Sustainability 2021, 11, x FOR PEER REVIEW 5 of 26
Figure 5. Aerial view of the building—south façade (photo credit: M. Stepinac).
The original drawings show foundations that are approximately 1.0 m wide and 1.15
m deep in relation to the surrounding terrain. They were probably built in brick or stone,
which is in line with the construction technology of the time. The building is built of a
solid brick of a standard format 30 × 15 × 6.5 (unusual for today’s standards) used in the
late 19th century. The load-bearing wall thicknesses vary throughout the building, reduc-
ing with height, and are 51, 43, 28 cm (Figures 6 and 7). Plaster thickness also varies
throughout the building from 3 to 6 cm. The ceiling structures before the reconstruction
in 1997 were wooden beams, except for the basement ceiling and the first floor where the
masonry vaults are located. After the 1997 reconstruction, the attic and 2nd floor ceilings
(Figures 8 and 9) were replaced with reinforced concrete slabs, 12 cm and 16 cm, respec-
tively. The 1st floor ceiling is a semi-precast masonry/concrete floor system (Fert ceiling)
inserted between the existing wooden beams. In contrast, the ceilings on the ground floor
and basement remained masonry vaults. The building also has two auxiliary staircases at
the ends of the building made during the 1997 reconstruction and are made of reinforced
concrete, and the main central staircase is older and is made of prefabricated stone stairs
supported by a wall on one and a beam on the other edge.
Figure 6. Ground floor plan with load-bearing walls in red. Figure 6. Ground floor plan with load-bearing walls in red.Sustainability 2021, 11, x FOR PEER REVIEW 6 of 26
Figure 7. 1st floor plan with load-bearing walls in red. The floor plan of the 2nd floor is identical to the 1st floor plan.
Figure 8. Longitudinal building section.
Figure 9. Transversal building sections.
Figure 7. 1st floor plan with load-bearing walls in red. The floor plan of the 2nd floor is identical to the 1st floor plan.

Sustainability 2021, 13, 6353 6 of 25
Sustainability 2021, 11, x FOR PEER REVIEW 6 of 26
Figure 7. 1st floor plan with load-bearing walls in red. The floor plan of the 2nd floor is identical to the 1st floor plan.
Figure 8. Longitudinal building section.
Figure 9. Transversal building sections.
Figure 8. Longitudinal building section.
Sustainability 2021, 11, x FOR PEER REVIEW 6 of 26
Figure 7. 1st floor plan with load-bearing walls in red. The floor plan of the 2nd floor is identical to the 1st floor plan.
Figure 8. Longitudinal building section.
Figure 9. Transversal building sections. Figure 9. Transversal building sections.
3. Methodology3.1. Assessment Procedure
The first step in a complete post-earthquake building assessment is a rapid, prelimi-nary assessment of the usability [25,26] of all buildings damaged in the earthquake. Addi-tionally, it is of great importance to preserve the three-dimensional data of the facades ofculturally-protected goods in the form of point clouds obtained by laser scanning or droneimaging. The mentioned data can also be used to assess existing structures for the creationof a 3D numerical model. Similar technology was used in the following papers [6,27,28]. Incases where it is needed, detailed assessment and available Non-Destructive Testing (NDT)assessment methods [29] are favorably used. A rapid preliminary assessment is conductedas early as possible after the earthquake, bearing in mind the safety of civil engineersin the field. In Croatia, this type of assessment consisted of a quick visual inspectionof individual elements of the load-bearing structure, stating the appropriate degree ofdamage and deciding on the classification of the building into one of six possible categories(Figure 10): U1 Usable without limitations (Green label), U2 Usable with recommendations
Sustainability 2021, 13, 6353 7 of 25
(Green label), PN1 Temporary unusable—detailed inspection needed (Yellow label), PN2Temporary unusable—emergency interventions needed (Yellow label), N1 Unusable dueto external impacts (Red label) and N2 Unusable due to damage (Red label).
Sustainability 2021, 11, x FOR PEER REVIEW 7 of 27
Figure 9. Transversal building sections.
3. Methodology
3.1. Assessment Procedure
The first step in a complete post-earthquake building assessment is a rapid, prelimi-
nary assessment of the usability [25,26] of all buildings damaged in the earthquake. Ad-
ditionally, it is of great importance to preserve the three-dimensional data of the facades
of culturally-protected goods in the form of point clouds obtained by laser scanning or
drone imaging. The mentioned data can also be used to assess existing structures for the
creation of a 3D numerical model. Similar technology was used in the following papers
[6,27,28]. In cases where it is needed, detailed assessment and available Non-Destructive
Testing (NDT) assessment methods [29] are favorably used. A rapid preliminary assess-
ment is conducted as early as possible after the earthquake, bearing in mind the safety of
civil engineers in the field. In Croatia, this type of assessment consisted of a quick visual
inspection of individual elements of the load-bearing structure, stating the appropriate
degree of damage and deciding on the classification of the building into one of six possible
categories (Figure 10): U1 Usable without limitations (Green label), U2 Usable with rec-
ommendations (Green label), PN1 Temporary unusable—detailed inspection needed
(Yellow label), PN2 Temporary unusable—emergency interventions needed (Yellow la-
bel), N1 Unusable due to external impacts (Red label) and N2 Unusable due to damage
(Red label).
Figure 10. Six categories of usability divided into three original labels (in Croatian) [30].
Figure 10. Six categories of usability divided into three original labels (in Croatian) [30].
3.2. Rapid Preliminary Assessment Results
A rapid assessment of the building in question was conducted on 23 March 2020.After a quick visual inspection of individual elements of the load-bearing structure, adecision was made to classify the building as temporarily unusable (Yellow label) witha recommendation for a detailed assessment (PN1). Basic conclusions of the preliminaryassessment are:
• There is visible damage in the form of cracks on the wall coverings, arches (Figure 11a),vaults and ceilings (Figure 11b) on all floors;
• Separation and local decay of plaster;• Minor local damage is visible on structural elements (walls, columns, arches);• In the eastern part of the building, diagonal cracks are visible on the load-bearing walls.
Sustainability 2021, 11, x FOR PEER REVIEW 8 of 27
3.2. Rapid Preliminary Assessment Results
A rapid assessment of the building in question was conducted on 23 March 2020.
After a quick visual inspection of individual elements of the load-bearing structure, a de-
cision was made to classify the building as temporarily unusable (Yellow label) with a
recommendation for a detailed assessment (PN1). Basic conclusions of the preliminary
assessment are:
• There is visible damage in the form of cracks on the wall coverings, arches (Figure
11a), vaults and ceilings (Figure 11b) on all floors;
• Separation and local decay of plaster;
• Minor local damage is visible on structural elements (walls, columns, arches);
• In the eastern part of the building, diagonal cracks are visible on the load-bearing
walls.
The second floor and attic suffered minor damage, while the most severe damage is
found on the eastern (Figure 12a,b) and central staircase wings (Figure 13a,b). Recommen-
dations were given that the building can be used with a restriction in the zones where
there is a danger of plaster falling. Additionally, the eastern and western staircase can be
used with a restriction in the number of people, while the central staircase is not to be
used until a detailed assessment is conducted.
(a) (b)
Figure 11. Cracks on the 1st floor: wall, lintel (a) and ceiling (b) (photo credit: I. Hafner). Figure 11. Cracks on the 1st floor: wall, lintel (a) and ceiling (b) (photo credit: I. Hafner).
The second floor and attic suffered minor damage, while the most severe damage isfound on the eastern (Figure 12a,b) and central staircase wings (Figure 13a,b). Recommen-dations were given that the building can be used with a restriction in the zones where thereis a danger of plaster falling. Additionally, the eastern and western staircase can be usedwith a restriction in the number of people, while the central staircase is not to be used untila detailed assessment is conducted.

Sustainability 2021, 13, 6353 8 of 25Sustainability 2021, 11, x FOR PEER REVIEW 9 of 27
(a) (b)
Figure 12. Cracks on the eastern staircase: exterior (a) and interior (b) (photo credit: I. Hafner).
(a) (b)
Figure 13. Diagonal cracks on the central staircase: exterior (a) and interior (b) (photo credit: I.
Hafner).
3.3. Detailed Assessment Results
According to the current standards for the design of structures—a series of Euro-
codes, HRN EN 1990–1998 and the relevant national annexes, the building that is the sub-
ject of this study is in the range of peak ground acceleration of 0.255 g; that is, the expected
earthquake intensity is IX according to EMS-98 scale for a return period of 475 years. No
geotechnical tests have been performed for the site in question for this article, but based
on empirical data, a category B foundation soil (deposits of very compacted sand, gravel
or hard clay, at least several tens of meters deep) or category C (deep deposits of com-
pacted or medium—compacted sand, gravel or hard clay with a thickness of several tens
of meters to several hundred meters) can be assumed. Moreover, based on the latest find-
ings obtained from the research of the Croatian Geological Institute in cooperation with
Figure 12. Cracks on the eastern staircase: exterior (a) and interior (b) (photo credit: I. Hafner).
Sustainability 2021, 11, x FOR PEER REVIEW 9 of 27
(a) (b)
Figure 12. Cracks on the eastern staircase: exterior (a) and interior (b) (photo credit: I. Hafner).
(a) (b)
Figure 13. Diagonal cracks on the central staircase: exterior (a) and interior (b) (photo credit: I.
Hafner).
3.3. Detailed Assessment Results
According to the current standards for the design of structures—a series of Euro-
codes, HRN EN 1990–1998 and the relevant national annexes, the building that is the sub-
ject of this study is in the range of peak ground acceleration of 0.255 g; that is, the expected
earthquake intensity is IX according to EMS-98 scale for a return period of 475 years. No
geotechnical tests have been performed for the site in question for this article, but based
on empirical data, a category B foundation soil (deposits of very compacted sand, gravel
or hard clay, at least several tens of meters deep) or category C (deep deposits of com-
pacted or medium—compacted sand, gravel or hard clay with a thickness of several tens
of meters to several hundred meters) can be assumed. Moreover, based on the latest find-
ings obtained from the research of the Croatian Geological Institute in cooperation with
Figure 13. Diagonal cracks on the central staircase: exterior (a) and interior (b) (photo credit:I. Hafner).
3.3. Detailed Assessment Results
According to the current standards for the design of structures—a series of Eurocodes,HRN EN 1990–1998 and the relevant national annexes, the building that is the subjectof this study is in the range of peak ground acceleration of 0.255 g; that is, the expectedearthquake intensity is IX according to EMS-98 scale for a return period of 475 years. Nogeotechnical tests have been performed for the site in question for this article, but based onempirical data, a category B foundation soil (deposits of very compacted sand, gravel orhard clay, at least several tens of meters deep) or category C (deep deposits of compacted ormedium—compacted sand, gravel or hard clay with a thickness of several tens of meters toseveral hundred meters) can be assumed. Moreover, based on the latest findings obtainedfrom the research of the Croatian Geological Institute in cooperation with the University ofZagreb, a seismic microzonation map was prepared according to Eurocode 8 standards forthe Zagreb area [31]. According to the mentioned seismic microzonation (2017–2019), the

Sustainability 2021, 13, 6353 9 of 25
soil in the immediate vicinity of the assessed building belongs to the category of soil typeC. Soil type C causes a certain amplification of the soil shaking, which must be taken intoaccount when assessing the condition of the structure.
All damage, structural and non-structural, is photographed and described. They areplotted in the floor plans of the building (Figures 14–16). The building was inspectedfrom the air by an unmanned aerial vehicle, and no damage was observed to the mainload-bearing structure or the building’s roof structure. Decorative crosses, statues andreliefs were also inspected. For the purposes of digital preservation, the 3D model of thebuilding was made on the basis of photogrammetric images.
Sustainability 2021, 11, x FOR PEER REVIEW 11 of 27
repaired and reinforced. Before that, it is necessary to do all the research work to deter-
mine the characteristics of the masonry and other necessary data for the structural analy-
sis.
Figure 14. Ground floor of the building—damage scheme and shear strength testing positions.
Figure 15. 1st floor of the building—damage scheme and shear strength testing positions.
Figure 16. 2nd floor of the building—damage scheme and shear strength testing positions.
3.4. In Situ Masonry Shear Strength Tests
In order to assess the condition of the structure after the earthquake and correspond-
ing analysis of the existing condition of the load-bearing structure, in situ tests were car-
ried out. Determination of shear strength (mortar in the composition of load-bearing ma-
sonry) of solid brick masonry [32,33] was performed “in situ” using a small hydraulic
press “Holmatro” with a load capacity of 200 kN. The mortar was moved horizontally in
Figure 14. Ground floor of the building—damage scheme and shear strength testing positions.
Sustainability 2021, 11, x FOR PEER REVIEW 11 of 27
repaired and reinforced. Before that, it is necessary to do all the research work to deter-
mine the characteristics of the masonry and other necessary data for the structural analy-
sis.
Figure 14. Ground floor of the building—damage scheme and shear strength testing positions.
Figure 15. 1st floor of the building—damage scheme and shear strength testing positions.
Figure 16. 2nd floor of the building—damage scheme and shear strength testing positions.
3.4. In Situ Masonry Shear Strength Tests
In order to assess the condition of the structure after the earthquake and correspond-
ing analysis of the existing condition of the load-bearing structure, in situ tests were car-
ried out. Determination of shear strength (mortar in the composition of load-bearing ma-
sonry) of solid brick masonry [32,33] was performed “in situ” using a small hydraulic
press “Holmatro” with a load capacity of 200 kN. The mortar was moved horizontally in
Figure 15. 1st floor of the building—damage scheme and shear strength testing positions.
Sustainability 2021, 11, x FOR PEER REVIEW 11 of 27
repaired and reinforced. Before that, it is necessary to do all the research work to deter-
mine the characteristics of the masonry and other necessary data for the structural analy-
sis.
Figure 14. Ground floor of the building—damage scheme and shear strength testing positions.
Figure 15. 1st floor of the building—damage scheme and shear strength testing positions.
Figure 16. 2nd floor of the building—damage scheme and shear strength testing positions.
3.4. In Situ Masonry Shear Strength Tests
In order to assess the condition of the structure after the earthquake and correspond-
ing analysis of the existing condition of the load-bearing structure, in situ tests were car-
ried out. Determination of shear strength (mortar in the composition of load-bearing ma-
sonry) of solid brick masonry [32,33] was performed “in situ” using a small hydraulic
press “Holmatro” with a load capacity of 200 kN. The mortar was moved horizontally in
Figure 16. 2nd floor of the building—damage scheme and shear strength testing positions.

Sustainability 2021, 13, 6353 10 of 25
A detailed inspection of the building revealed the following damage: at the groundfloor, the damage is visible in the form of cracks on the wall coverings, arches, vaults andceilings, as well as separation and local decay of plaster. Cracks in the barrel vaults aremostly parallel to the supporting joints, probably due to lateral movements during theearthquake. They are the result of the occurrence of tensile stresses perpendicular to thesupporting joint. Such cracks can cause hinge formation and consequent loss of stability ifthey propagate deep enough. Fortunately, the cracks in the assessed building are narrowand mostly found in the plaster. Minor local damage to structural elements (walls, columns,arches) is also visible. In the central core of the building where the main staircase is locatedand in the eastern part of the building, diagonal cracks are visible on the load-bearingwalls, which can also be seen on the north side of the building. Damage is visible on allfloors in the form of cracks and falling plaster on the walls. Minor local damage to thewalls on the 1st floor is also visible, and cracks at the joints of partition walls and ceilingsare locally visible. In the central wing of the building where the main staircase is locatedand in the eastern wing of the building, diagonal cracks are visible on the load-bearingwalls, which can also be seen on the north side of the building.
The 2nd floor and attic suffered minor damage. Particular attention should be paid tothe central part of the building, occupying the wing with the staircase. The formation ofcracks on the central wing transverse walls is clearly visible, indicating a possible failuremechanism out-of-plane of the entire wing. A wedge was made, and the cracks wereinterconnected and propagated inside the building (they also appear in the stair beams).There was no displacement of the walls out-of-plane, but the preconditions for its failurewere met. The central wing needs to be strengthened as soon as possible as part of theentire building’s renovation.
The east wing was also damaged at the ground floor and 1st floor level. The cracksthat appeared propagated were through the entire wall of the south facade of the wing. Itis unfavorable that the cracks are joined and continue to the transversely-joined walls andlintels. The cause of such cracks can be the slight contribution of a torsional response ofthe building as a whole, where the boundary elements are the most loaded ones, and theirfailure occurs. Additionally, that part with the building is connected to the neighboringbuilding. Although this can generally have a positive effect on the whole building, in thecase of walls on the east wing, such a boundary condition can cause additional forces. Ifthe walls are not well connected to the diaphragms by a tensile compression connection,this can cause them to fail. Since there has been no displacement of the wall out-of-plane,it is not in danger of collapsing, but it should be strengthened soon, and further damagepropagation should be prevented. Minor damage in the form of cracks on the walls can beseen on the west and east staircases.
The building can be used in its entirety except for the main staircase. Depending onthe possibilities in the future, a static and seismic analysis of the existing condition of thebuilding should be made, and regardless of whether the entire building will be reinforced,the main staircase and other walls with cracks along the entire width of the walls must berepaired and reinforced. Before that, it is necessary to do all the research work to determinethe characteristics of the masonry and other necessary data for the structural analysis.
3.4. In Situ Masonry Shear Strength Tests
In order to assess the condition of the structure after the earthquake and correspondinganalysis of the existing condition of the load-bearing structure, in situ tests were carriedout. Determination of shear strength (mortar in the composition of load-bearing masonry)of solid brick masonry [32,33] was performed “in situ” using a small hydraulic press“Holmatro” with a load capacity of 200 kN. The mortar was moved horizontally in thevicinity of one brick in order to determine the shear strength. At the same time, the structureof the existing wall was minimally damaged. A total of eleven positions on the load-bearingwalls were selected for testing the shear strength of the masonry (Figures 14–16): fivepositions on the ground floor (PS-PR-1 to PS-PR-5), three positions on the 1st floor (PS-1-1

Sustainability 2021, 13, 6353 11 of 25
to PS-1-3) and three positions on the 2nd floor (PS-2-1 to PS-2-3). The shear strength test ofthe masonry was carried out in nine places. After removing the plaster, it was found thatdue to the method of masonry (no bricks were found in the longitudinal direction—theinner part of the wall is built of bricks “on edge”), conditions to perform the test were notmet for positions PS-PR-3 and PS-PR-4.
Results of the Shear Strength Tests
The shear strength of the masonry was obtained based on the registered horizontalforce Humax acting on one brick at the time of reaching the shear strength in that brick andthe corresponding mortar area on both sides of the shear is transmitted (Ag + Ad). The testmethod can be seen in Figure 17 and photographs (Figures 18 and 19).
Sustainability 2021, 11, x FOR PEER REVIEW 12 of 27
the vicinity of one brick in order to determine the shear strength. At the same time, the
structure of the existing wall was minimally damaged. A total of eleven positions on the
load-bearing walls were selected for testing the shear strength of the masonry (Figures
14–16): five positions on the ground floor (PS-PR-1 to PS-PR-5), three positions on the 1st
floor (PS-1-1 to PS-1-3) and three positions on the 2nd floor (PS-2-1 to PS-2-3). The shear
strength test of the masonry was carried out in nine places. After removing the plaster, it
was found that due to the method of masonry (no bricks were found in the longitudinal
direction—the inner part of the wall is built of bricks “on edge”), conditions to perform
the test were not met for positions PS-PR-3 and PS-PR-4.
Results of the Shear Strength Tests
The shear strength of the masonry was obtained based on the registered horizontal
force Humax acting on one brick at the time of reaching the shear strength in that brick and
the corresponding mortar area on both sides of the shear is transmitted (Ag + Ad). The
test method can be seen in Figure 17 and photographs (Figures 18 and 19).
Figure 17. Masonry shear strength test method.
(a) (b)
Figure 18. Masonry shear strength tests at measuring positions PS-PR-1 (a) and PS-PR-2 (b) on the ground floor (photo
credit: L. Lulić).
Figure 17. Masonry shear strength test method.
Sustainability 2021, 11, x FOR PEER REVIEW 12 of 27
the vicinity of one brick in order to determine the shear strength. At the same time, the
structure of the existing wall was minimally damaged. A total of eleven positions on the
load-bearing walls were selected for testing the shear strength of the masonry (Figures
14–16): five positions on the ground floor (PS-PR-1 to PS-PR-5), three positions on the 1st
floor (PS-1-1 to PS-1-3) and three positions on the 2nd floor (PS-2-1 to PS-2-3). The shear
strength test of the masonry was carried out in nine places. After removing the plaster, it
was found that due to the method of masonry (no bricks were found in the longitudinal
direction—the inner part of the wall is built of bricks “on edge”), conditions to perform
the test were not met for positions PS-PR-3 and PS-PR-4.
Results of the Shear Strength Tests
The shear strength of the masonry was obtained based on the registered horizontal
force Humax acting on one brick at the time of reaching the shear strength in that brick and
the corresponding mortar area on both sides of the shear is transmitted (Ag + Ad). The
test method can be seen in Figure 17 and photographs (Figures 18 and 19).
Figure 17. Masonry shear strength test method.
(a) (b)
Figure 18. Masonry shear strength tests at measuring positions PS-PR-1 (a) and PS-PR-2 (b) on the ground floor (photo
credit: L. Lulić). Figure 18. Masonry shear strength tests at measuring positions PS-PR-1 (a) and PS-PR-2 (b) on the ground floor (photocredit: L. Lulic).

Sustainability 2021, 13, 6353 12 of 25Sustainability 2021, 11, x FOR PEER REVIEW 13 of 27
(a) (b)
Figure 19. Masonry shear strength tests at measuring positions PS-1-1 (a) and PS-1-3 (b) on the 1st floor (photo credit: L.
Lulić).
The masonry shear strength test results in the load-bearing walls of the ground floor,
1st floor and 2nd floor are shown in the following Table 1. The values from testing site
positions PS-PR-5, PS-1-1, PS-1-2 and PS-2-3 were disregarded because of significant de-
viations from other results (Figure 20).
Figure 20. fv (shear strength)—𝜎𝑜 (vertical stress) diagram.
Table 1. Masonry shear strength test results in load-bearing walls.
Floor Testing Site h (cm) Ah (cm2) Hu, max (kN) Shear Strength
fv (MPa)
Ground floor PS-PR-1 45 784 55.5 0.708
PS-PR-2 60 812 58.3 0.717
PS-PR-3 75 - - -
PS-PR-4 60 - - -
PS-PR-5 60 504 16.3 0.323
1st floor PS-1-1 50 448 17.6 0.393
PS-1-2 50 728 121.9 1.675
PS-1-3 70 526 24.4 0.464
2nd floor PS-2-1 45 783 44.7 0.571
Figure 19. Masonry shear strength tests at measuring positions PS-1-1 (a) and PS-1-3 (b) on the 1st floor (photo credit: L. Lulic).
The masonry shear strength test results in the load-bearing walls of the groundfloor, 1st floor and 2nd floor are shown in the following Table 1. The values from testingsite positions PS-PR-5, PS-1-1, PS-1-2 and PS-2-3 were disregarded because of significantdeviations from other results (Figure 20).
Table 1. Masonry shear strength test results in load-bearing walls.
Floor Testing Site h (cm) Ah (cm2)Hu, max
(kN)Shear Strength
fv (MPa)
Ground floor PS-PR-1 45 784 55.5 0.708PS-PR-2 60 812 58.3 0.717PS-PR-3 75 - - -PS-PR-4 60 - - -PS-PR-5 60 504 16.3 0.323
1st floor PS-1-1 50 448 17.6 0.393PS-1-2 50 728 121.9 1.675PS-1-3 70 526 24.4 0.464
2nd floor PS-2-1 45 783 44.7 0.571PS-2-2 55 812 40.6 0.500PS-2-3 55 840 94.8 1.129
Sustainability 2021, 11, x FOR PEER REVIEW 13 of 27
(a) (b)
Figure 19. Masonry shear strength tests at measuring positions PS-1-1 (a) and PS-1-3 (b) on the 1st floor (photo credit: L.
Lulić).
The masonry shear strength test results in the load-bearing walls of the ground floor,
1st floor and 2nd floor are shown in the following Table 1. The values from testing site
positions PS-PR-5, PS-1-1, PS-1-2 and PS-2-3 were disregarded because of significant de-
viations from other results (Figure 20).
Figure 20. fv (shear strength)—𝜎𝑜 (vertical stress) diagram.
Table 1. Masonry shear strength test results in load-bearing walls.
Floor Testing Site h (cm) Ah (cm2) Hu, max (kN) Shear Strength
fv (MPa)
Ground floor PS-PR-1 45 784 55.5 0.708
PS-PR-2 60 812 58.3 0.717
PS-PR-3 75 - - -
PS-PR-4 60 - - -
PS-PR-5 60 504 16.3 0.323
1st floor PS-1-1 50 448 17.6 0.393
PS-1-2 50 728 121.9 1.675
PS-1-3 70 526 24.4 0.464
2nd floor PS-2-1 45 783 44.7 0.571
Figure 20. fv(shear strength)—σ0 (vertical stress) diagram.

Sustainability 2021, 13, 6353 13 of 25
It is the shear strength fv with the contribution of σ0—vertical stress. During thetest, each measuring position is precisely located to calculate the vertical load (G0), that is,vertical stress (σ0) from the numerical model. Therefore, for each test site, in addition tothe floor plan position, the height of the measuring position from the upper edge of theceiling structure (h) is recorded. When analyzing the shear strength of mortar, the verticalconstant load is taken into account, that is, vertical stresses at a particular test position.Shear strength according to Mohr–Coulomb law is calculated by Equation (1).
fvm = µ · σ0 + fvm0 (1)
It can be seen from the diagram that the shear strength without vertical pressure is0.316 MPa and that coefficient of friction is 1.303. Due to the high value in comparisonto EC standard recommendation, the friction coefficient was taken as µ = 0.40 (accordingto [34]). The obtained shear strength of masonry without vertical pressure, i.e., cohesion,is higher than the one provided by the regulations for the case when there are no tests(fvm0 = 0.32 MPa > 0.10 MPa). The results show that the quality of masonry is good incontrast to similar buildings from that period.
3.5. Numerical Modeling
The 3D numerical model of the assessed building is obtained in 3Muri software. Themacro-element approach is adopted due to computational efficiency and high precision [35].Its versatility in modeling (implementing elements of various materials, realistic floorstiffnesses, strengthening and many more) makes it highly valuable in a region where avast majority of building stock is made of masonry. Similar case studies in 3Muri softwarewere used as a base for our research [36–38].
Macro-element approach implies equivalent-frame method which uses non-linearbeam elements. Macro-elements (or non-linear beam elements) are divided into three cate-gories which are piers, spandrels and rigid nodes. In piers and spandrels, all deformationis concentrated, and they are connected with rigid nodes. Figure 21 shows an equivalentframe model made of mentioned macro-elements.
Sustainability 2021, 11, x FOR PEER REVIEW 14 of 27
PS-2-2 55 812 40.6 0.500
PS-2-3 55 840 94.8 1.129
It is the shear strength fv with the contribution of 𝜎𝑜—vertical stress. During the test,
each measuring position is precisely located to calculate the vertical load (G0), that is, ver-
tical stress (𝜎𝑜) from the numerical model. Therefore, for each test site, in addition to the
floor plan position, the height of the measuring position from the upper edge of the ceiling
structure (h) is recorded. When analyzing the shear strength of mortar, the vertical con-
stant load is taken into account, that is, vertical stresses at a particular test position. Shear
strength according to Mohr–Coulomb law is calculated by Equation (1).
𝑓𝑣m = 𝜇 ∙ 𝜎𝑜 + 𝑓𝑣𝑚0 (1)
It can be seen from the diagram that the shear strength without vertical pressure is
0.316 MPa and that coefficient of friction is 1.303. Due to the high value in comparison to
EC standard recommendation, the friction coefficient was taken as 𝜇 = 0.40 (according to
[34]). The obtained shear strength of masonry without vertical pressure, i.e., cohesion, is
higher than the one provided by the regulations for the case when there are no tests (fvm0
= 0.32 MPa > 0.10 MPa). The results show that the quality of masonry is good in contrast
to similar buildings from that period.
3.5. Numerical Modeling
The 3D numerical model of the assessed building is obtained in 3Muri software. The
macro-element approach is adopted due to computational efficiency and high precision
[35]. Its versatility in modeling (implementing elements of various materials, realistic floor
stiffnesses, strengthening and many more) makes it highly valuable in a region where a
vast majority of building stock is made of masonry. Similar case studies in 3Muri software
were used as a base for our research [36–38].
Macro-element approach implies equivalent-frame method which uses non-linear
beam elements. Macro-elements (or non-linear beam elements) are divided into three cat-
egories which are piers, spandrels and rigid nodes. In piers and spandrels, all deformation
is concentrated, and they are connected with rigid nodes. Figure 21 shows an equivalent
frame model made of mentioned macro-elements.
Figure 21. 3D model and 3D equivalent frame in 3Muri.
Non-linear static pushover analysis [39,40] allows us to check the overstrength ratio
used in linear analysis and it gives us more detailed insight into critical elements, possible
failure mechanisms, and global behavior of the building as a whole. Pushover analysis is
performed with constant gravity loads and monotonically-increasing horizontal loads.
Two different distributions of the horizontal loads along the structure’s height are used
Figure 21. 3D model and 3D equivalent frame in 3Muri.
Non-linear static pushover analysis [39,40] allows us to check the overstrength ratioused in linear analysis and it gives us more detailed insight into critical elements, possiblefailure mechanisms, and global behavior of the building as a whole. Pushover analysis isperformed with constant gravity loads and monotonically-increasing horizontal loads. Twodifferent distributions of the horizontal loads along the structure’s height are used for thepushover analysis. The first distribution has a uniform pattern where the horizontal loadis proportional to the mass of the building. The second distribution has a modal patternwhere the horizontal load is distributed along with the building’s height proportionallyto the first vibration mode shape of the building determined through elastic analysis(Figures 22 and 23). These horizontal loads are applied at the location of the masses in themodel, i.e., at each floor level in the center of masses. Moreover, accidental eccentricityis taken into account to cover uncertainty in the calculation of the center of masses of the

Sustainability 2021, 13, 6353 14 of 25
building. The 5% of the building’s length perpendicular to seismic load direction is takeninto account on each side for both x (longitudinal) and y (transverse) directions.
Sustainability 2021, 11, x FOR PEER REVIEW 15 of 27
for the pushover analysis. The first distribution has a uniform pattern where the horizon-
tal load is proportional to the mass of the building. The second distribution has a modal
pattern where the horizontal load is distributed along with the building’s height propor-
tionally to the first vibration mode shape of the building determined through elastic anal-
ysis (Figures 22 and 23). These horizontal loads are applied at the location of the masses
in the model, i.e., at each floor level in the center of masses. Moreover, accidental eccen-
tricity is taken into account to cover uncertainty in the calculation of the center of masses
of the building. The 5% of the building’s length perpendicular to seismic load direction is
taken into account on each side for both x (longitudinal) and y (transverse) directions.
Figure 22. Mode shape used for pushover in y-direction, T = 0.37 s.
Figure 23. Mode shape used for pushover in x-direction, T = 0.24 s.
In each incremental step, internal forces are redistributed according to the element
equilibrium, and stiffness is degraded in plastic range. Additionally, ductility is controlled
with maximum drift which is 0.004 for shear failure and 0.008 for bending failure [34,41].
Generally, masonry walls have three main failure modes as described in [41–44]. Turnsek–
Cacovic constitutive law is used as diagonal cracking is usually the dominant failure mode
for existing unreinforced masonry structures [45,46]. In the work of [47], diagonal failure
strength is correlated with shear strength used for Turnsek–Cacovic constitutive law.
Shear strength obtained by in situ testing is compared with shear strength approximation
from the visual MQI method which is explained in more detail in [48] and further devel-
oped in [49,50]. Compared shear strengths are very close for this case study which implies
good precision of the MQI method. Cracked stiffness of vertical elements is used in a
model as recommended in [34], so that cracking that occurs during lifetime because of
expected earthquakes of a smaller magnitude is taken into account. Shear and flexural
stiffness are taken as half value of initial stiffness.
In a 3D model, floors are modeled as horizontally rigid diaphragms, which is precise
enough due to the real in-plane stiffness of the horizontal floor structures. Axial in-plane
stiffness of rigid diaphragms in software is infinite and the mass of the real slab is taken
into account. Many similar old masonry buildings have an unfavorable distribution of
seismic forces due to traditional flexible timber floors [22]. In seismic analysis, the roof is
Figure 22. Mode shape used for pushover in y-direction, T = 0.37 s.
Sustainability 2021, 11, x FOR PEER REVIEW 15 of 26
Figure 23. Mode shape used for pushover in x-direction, T = 0.24 s.
In each incremental step, internal forces are redistributed according to the element
equilibrium, and stiffness is degraded in plastic range. Additionally, ductility is controlled
with maximum drift which is 0.004 for shear failure and 0.008 for bending failure [34,41].
Generally, masonry walls have three main failure modes as described in [41–44]. Turnsek–
Cacovic constitutive law is used as diagonal cracking is usually the dominant failure mode
for existing unreinforced masonry structures [45,46]. In the work of [47], diagonal failure
strength is correlated with shear strength used for Turnsek–Cacovic constitutive law.
Shear strength obtained by in situ testing is compared with shear strength approximation
from the visual MQI method which is explained in more detail in [48] and further devel-
oped in [49,50]. Compared shear strengths are very close for this case study which implies
good precision of the MQI method. Cracked stiffness of vertical elements is used in a
model as recommended in [34], so that cracking that occurs during lifetime because of
expected earthquakes of a smaller magnitude is taken into account. Shear and flexural
stiffness are taken as half value of initial stiffness.
In a 3D model, floors are modeled as horizontally rigid diaphragms, which is precise
enough due to the real in-plane stiffness of the horizontal floor structures. Axial in-plane
stiffness of rigid diaphragms in software is infinite and the mass of the real slab is taken
into account. Many similar old masonry buildings have an unfavorable distribution of
seismic forces due to traditional flexible timber floors [22]. In seismic analysis, the roof is
excluded from the load-bearing structure because it does not significantly affect the re-
sponse of the structure and does not contribute to the global resistance of the structure.
Although it was left out of the structural part, its contribution in the form of load on the
structure itself was not neglected.
The mean values of material characteristics used in the numerical model (Table 2) are a combina-
tion of the literature review [34,51] and on-site testing. Regarding experimental in situ tests and
detailed inspection of the structure knowledge level 2 (normal knowledge) can be defined. Based
on the achieved knowledge level, confidence factor was taken as 1.2.
Table 2. Masonry material characteristics.
Material Characteristic Value
Modulus of elasticity 3000 N/mm2
Shear modulus 1200 N/mm2
Specific weight 18 kN/m3
Mean compressive strength of masonry 6.63 N/mm2
Shear strength 0.14 N/mm2
Characteristic compressive strength of ma-
sonry 5.53 N/mm2
Confidence factor 1.2
Partial safety factor for material 1
Shear drift 0.0053
Figure 23. Mode shape used for pushover in x-direction, T = 0.24 s.
In each incremental step, internal forces are redistributed according to the elementequilibrium, and stiffness is degraded in plastic range. Additionally, ductility is controlledwith maximum drift which is 0.004 for shear failure and 0.008 for bending failure [34,41].Generally, masonry walls have three main failure modes as described in [41–44]. Turnsek–Cacovic constitutive law is used as diagonal cracking is usually the dominant failure modefor existing unreinforced masonry structures [45,46]. In the work of [47], diagonal failurestrength is correlated with shear strength used for Turnsek–Cacovic constitutive law. Shearstrength obtained by in situ testing is compared with shear strength approximation fromthe visual MQI method which is explained in more detail in [48] and further developedin [49,50]. Compared shear strengths are very close for this case study which implies goodprecision of the MQI method. Cracked stiffness of vertical elements is used in a modelas recommended in [34], so that cracking that occurs during lifetime because of expectedearthquakes of a smaller magnitude is taken into account. Shear and flexural stiffness aretaken as half value of initial stiffness.
In a 3D model, floors are modeled as horizontally rigid diaphragms, which is preciseenough due to the real in-plane stiffness of the horizontal floor structures. Axial in-planestiffness of rigid diaphragms in software is infinite and the mass of the real slab is takeninto account. Many similar old masonry buildings have an unfavorable distribution ofseismic forces due to traditional flexible timber floors [22]. In seismic analysis, the roofis excluded from the load-bearing structure because it does not significantly affect theresponse of the structure and does not contribute to the global resistance of the structure.Although it was left out of the structural part, its contribution in the form of load on thestructure itself was not neglected.
The mean values of material characteristics used in the numerical model (Table 2) area combination of the literature review [34,51] and on-site testing. Regarding experimentalin situ tests and detailed inspection of the structure knowledge level 2 (normal knowledge)can be defined. Based on the achieved knowledge level, confidence factor was taken as 1.2.

Sustainability 2021, 13, 6353 15 of 25
Table 2. Masonry material characteristics.
Material Characteristic Value
Modulus of elasticity 3000 N/mm2
Shear modulus 1200 N/mm2
Specific weight 18 kN/m3
Mean compressive strength of masonry 6.63 N/mm2
Shear strength 0.14 N/mm2
Characteristic compressive strength of masonry 5.53 N/mm2
Confidence factor 1.2Partial safety factor for material 1
Shear drift 0.0053Bending drift 0.0107
Final creep coefficient 0.5
According to the work in [52], the building is classified as regular in height but irregularin floor plan, requiring 3D modeling. The building is classified as a torsional stiff system.
First, static analysis is performed according to [53]. Next, the seismic analysis is done.The educational building belongs to importance class III because its seismic resistance isof great importance given the consequences associated with a collapse. Hence, impor-tance factor is γI = 1.2. Three PGA values are used for two limit states. According tothe new law “Law on the Reconstruction of Earthquake-Damaged Buildings in the Cityof Zagreb, Krapina-Zagorje County and Zagreb County (NN 102/2020)” [54], ultimatelimit state return period can be different depending on the level of strengthening for oldmasonry buildings damaged in the recent earthquakes. Limit state of significant damagewith a return period of 475 and limit state of damage limitation with a return period of95 years were checked [55]. In the new law [54], the return period of 225 years whichcorresponds to a probability of exceedance of 20% in 50 years is introduced for a limit stateof significant damage.
Elastic response spectrums for acceleration are calculated for all three return periodstaking into account parameters for soil type C, which is found on the location of the building.Altogether, 24 pushover analyses are performed; for x- and y-direction in both orientation,with two load distributions, without and with −/+ 5% of accidental eccentricity.
The result of the performed seismic analysis is a capacity curve that shows the ratioof the shear force in the base of the structure and the displacement of the control node.The control node was selected in the immediate vicinity of the center of mass and islocated on the top floor of the building. Obtained capacity curves for all 24 analyses canbe seen in Figure 24. Bilinearized pushover curves for the x- and y-direction are shown inFigures 25 and 26. Total base shear in kN is plotted on the y-axis and the displacement ofthe control nodes in mm is plotted on the x-axis.
Sustainability 2021, 11, x FOR PEER REVIEW 17 of 27
Figure 24. Pushover curves for the x- (blue) and y- (red) direction.
Figure 25. The most relevant pushover curve for the x-direction.
Figure 26. The most relevant pushover curve for the y-direction.
Figures 27 and 28 show the damaged state at the last step of the pushover curves for
the x- and y-direction where yellow color represents shear damage, and the red color rep-
resents bending damage.
Figure 24. Pushover curves for the x- (blue) and y- (red) direction.
Sustainability 2021, 13, 6353 16 of 25
Sustainability 2021, 11, x FOR PEER REVIEW 17 of 27
Figure 24. Pushover curves for the x- (blue) and y- (red) direction.
Figure 25. The most relevant pushover curve for the x-direction.
Figure 26. The most relevant pushover curve for the y-direction.
Figures 27 and 28 show the damaged state at the last step of the pushover curves for
the x- and y-direction where yellow color represents shear damage, and the red color rep-
resents bending damage.
Figure 25. The most relevant pushover curve for the x-direction.
Sustainability 2021, 11, x FOR PEER REVIEW 17 of 27
Figure 24. Pushover curves for the x- (blue) and y- (red) direction.
Figure 25. The most relevant pushover curve for the x-direction.
Figure 26. The most relevant pushover curve for the y-direction.
Figures 27 and 28 show the damaged state at the last step of the pushover curves for
the x- and y-direction where yellow color represents shear damage, and the red color rep-
resents bending damage.
Figure 26. The most relevant pushover curve for the y-direction.
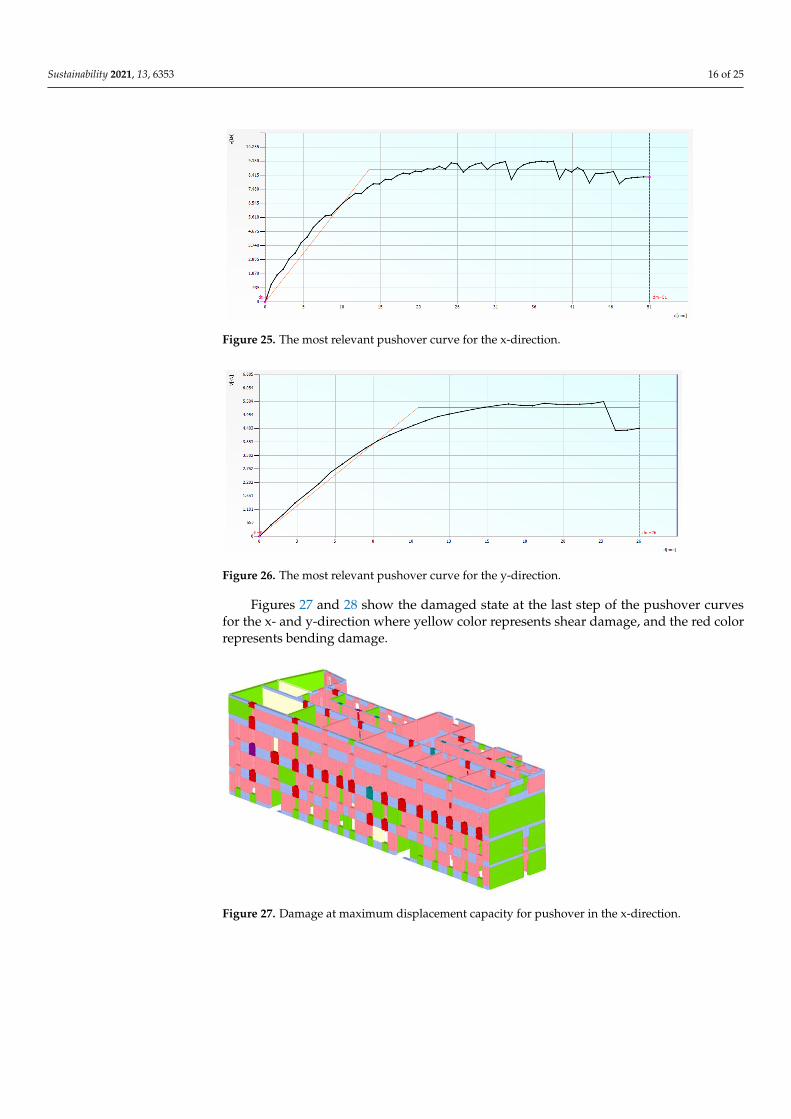
Figures 27 and 28 show the damaged state at the last step of the pushover curvesfor the x- and y-direction where yellow color represents shear damage, and the red colorrepresents bending damage.
Sustainability 2021, 11, x FOR PEER REVIEW 18 of 27
Figure 27. Damage at maximum displacement capacity for pushover in the x-direction.
Figure 28. Damage at maximum displacement capacity for pushover in the y-direction.
After the response of the structure, the capacity of the structure is obtained and
checks are carried out according to the basic requirements relating to the state of structural
damage, defined by limit states. Parameters for equivalent SDOF systems from Figures 27
and 28 are shown in Table 3. These parameters are obtained during bilinearization based
on the equivalent energy principal and are used for target displacement determination.
Table 3. SDOF parameters for pushover in x- and y-direction.
Parameter Value (x-Direction) Value (y-Direction)
T* (s) 0.411 0.433
m* (kg) 2,725,590 2,339,506
w (kN) 45,733 45,733
M (kg) 4,661,901 4,661,901
m*/M (%) 58.47 50.18
Γ 1.31 1.41
F*y (kN) 6719 3736
d*y (cm) 1.06 0.76
d*m (cm) 3.91 1.81
Results are also given in the form of a parameter α (Table 4), where α is the ratio
between the limit capacity acceleration of the building and reference peak ground accel-
eration on type A ground. Parameter α is given for all limit states. A problem arises with
Figure 27. Damage at maximum displacement capacity for pushover in the x-direction.

Sustainability 2021, 13, 6353 17 of 25
Sustainability 2021, 11, x FOR PEER REVIEW 18 of 27
Figure 27. Damage at maximum displacement capacity for pushover in the x-direction.
Figure 28. Damage at maximum displacement capacity for pushover in the y-direction.
After the response of the structure, the capacity of the structure is obtained and
checks are carried out according to the basic requirements relating to the state of structural
damage, defined by limit states. Parameters for equivalent SDOF systems from Figures 27
and 28 are shown in Table 3. These parameters are obtained during bilinearization based
on the equivalent energy principal and are used for target displacement determination.
Table 3. SDOF parameters for pushover in x- and y-direction.
Parameter Value (x-Direction) Value (y-Direction)
T* (s) 0.411 0.433
m* (kg) 2,725,590 2,339,506
w (kN) 45,733 45,733
M (kg) 4,661,901 4,661,901
m*/M (%) 58.47 50.18
Γ 1.31 1.41
F*y (kN) 6719 3736
d*y (cm) 1.06 0.76
d*m (cm) 3.91 1.81
Results are also given in the form of a parameter α (Table 4), where α is the ratio
between the limit capacity acceleration of the building and reference peak ground accel-
eration on type A ground. Parameter α is given for all limit states. A problem arises with
Figure 28. Damage at maximum displacement capacity for pushover in the y-direction.
After the response of the structure, the capacity of the structure is obtained and checksare carried out according to the basic requirements relating to the state of structural damage,defined by limit states. Parameters for equivalent SDOF systems from Figures 27 and 28are shown in Table 3. These parameters are obtained during bilinearization based on theequivalent energy principal and are used for target displacement determination.
Table 3. SDOF parameters for pushover in x- and y-direction.
Parameter Value (x-Direction) Value (y-Direction)
T* (s) 0.411 0.433m* (kg) 2,725,590 2,339,506w (kN) 45,733 45,733M (kg) 4,661,901 4,661,901
m*/M (%) 58.47 50.18Γ 1.31 1.41
F*y (kN) 6719 3736d*y (cm) 1.06 0.76d*m (cm) 3.91 1.81
Results are also given in the form of a parameter α (Table 4), where α is the ratiobetween the limit capacity acceleration of the building and reference peak ground acceler-ation on type A ground. Parameter α is given for all limit states. A problem arises withold masonry buildings that often cannot be strengthened to such an extent that today’sbuilding codes regarding seismic resistance are satisfied. Hence, a new legal document [54]that followed recent earthquakes allows for different levels of earthquake resistance afterreconstruction.
Table 4. α values.
Return Period α (x-Direction) α (y-Direction)
475 0.633 0.291225 0.894 0.41195 0.560 0.363
For the return period of 475 years, none of the 24 analyses satisfies the limit stateof significant damage, while for the return period of 225 years, only 8 of the 24 analysessatisfies the same limit state. For a return period of 95 years, none of the 24 analyses satisfiesthe limit state of limited damage.
The target displacement is determined in accordance with Eurocode 8 (Appendix B) [52].Since the building’s natural period of vibration is less than the period of TC, the target

Sustainability 2021, 13, 6353 18 of 25
displacement is determined by the procedure for short periods shown in Figure 29. Buildingswith short natural periods of vibration do not comply with the equal displacement rule [56]as buildings with medium-long and long natural periods of vibration.
Sustainability 2021, 11, x FOR PEER REVIEW 19 of 27
old masonry buildings that often cannot be strengthened to such an extent that today’s
building codes regarding seismic resistance are satisfied. Hence, a new legal document
[54] that followed recent earthquakes allows for different levels of earthquake resistance
after reconstruction.
Table 4. α values.
Return Period α (x-Direction) α (y-Direction)
475 0.633 0.291
225 0.894 0.411
95 0.560 0.363
For the return period of 475 years, none of the 24 analyses satisfies the limit state of
significant damage, while for the return period of 225 years, only 8 of the 24 analyses
satisfies the same limit state. For a return period of 95 years, none of the 24 analyses satis-
fies the limit state of limited damage.
The target displacement is determined in accordance with Eurocode 8 (Appendix B).
[52], Since the building’s natural period of vibration is less than the period of TC, the target
displacement is determined by the procedure for short periods shown in Figure 29. Build-
ings with short natural periods of vibration do not comply with the equal displacement
rule [56] as buildings with medium-long and long natural periods of vibration.
Figure 29. Target displacement determination for short periods.
Since 3Muri does not consider the bending failure of walls out-of-plane during the
global non-linear static analysis, it is necessary to subsequently perform an analysis of the
bending of the walls out-of-plane. This takes into account the seismic action perpendicular
to the walls. The analysis is performed for the boundary condition near collapse. A return
period of 475 years is used. Walls are considered to have passed the out-of-plane bending
check if their MRd/MEd ratio is greater than or equal to 1.0. In Figure 30, walls that did not
satisfy the check are colored red.
Figure 29. Target displacement determination for short periods.
Since 3Muri does not consider the bending failure of walls out-of-plane during theglobal non-linear static analysis, it is necessary to subsequently perform an analysis of thebending of the walls out-of-plane. This takes into account the seismic action perpendicularto the walls. The analysis is performed for the boundary condition near collapse. A returnperiod of 475 years is used. Walls are considered to have passed the out-of-plane bendingcheck if their MRd/MEd ratio is greater than or equal to 1.0. In Figure 30, walls that did notsatisfy the check are colored red.
Sustainability 2021, 11, x FOR PEER REVIEW 20 of 27
Figure 30. Bending out-of-plane results.
The 3Muri program does not consider out-of-plane loss of stability of local mecha-
nisms in the global analysis either. It assumes that proper connection is established be-
tween walls and between walls and diaphragms. That way, out-of-plane local mecha-
nisms are prevented so that the global in-plane response of the building can be evaluated
[43]. Therefore, the resistance to local losses of stability is checked in a special program
module; certain parts of a single wall are checked and the interaction of parts of several
individual walls that can together form different local mechanisms. Figure 31 shows an
example of a local mechanism where the kinematic block is colored red.
Figure 31. Example of a local mechanism.
Local mechanisms are arbitrarily defined according to the structure’s shape, common
failure mechanisms and earthquake damage. The emergence of local mechanisms is often
due to the poor interconnection of walls and walls with floor structures. Linear kinematic
analysis is used. Defining a local mechanism consists of three steps. To begin with, it is
necessary to define a kinematic block that is a part of a wall that is considered absolutely
rigid, and that is subject to movement or tilting relative to another block or the rest of the
wall. Then, the boundary conditions are defined and finally, the load needs to be set. Some
of the possible local failure mechanisms of the observed structure and its resistance to the
shown forms of failure are presented below (Figure 32 and Table 5). Parameter α repre-
sents the ratio between the spectral acceleration of the activation of the mechanisms and
spectral acceleration of the seismic demand.
Figure 30. Bending out-of-plane results.
The 3Muri program does not consider out-of-plane loss of stability of local mechanismsin the global analysis either. It assumes that proper connection is established betweenwalls and between walls and diaphragms. That way, out-of-plane local mechanismsare prevented so that the global in-plane response of the building can be evaluated [43].Therefore, the resistance to local losses of stability is checked in a special program module;certain parts of a single wall are checked and the interaction of parts of several individualwalls that can together form different local mechanisms. Figure 31 shows an example of alocal mechanism where the kinematic block is colored red.
Local mechanisms are arbitrarily defined according to the structure’s shape, commonfailure mechanisms and earthquake damage. The emergence of local mechanisms is oftendue to the poor interconnection of walls and walls with floor structures. Linear kinematicanalysis is used. Defining a local mechanism consists of three steps. To begin with, it isnecessary to define a kinematic block that is a part of a wall that is considered absolutely

Sustainability 2021, 13, 6353 19 of 25
rigid, and that is subject to movement or tilting relative to another block or the rest of thewall. Then, the boundary conditions are defined and finally, the load needs to be set. Someof the possible local failure mechanisms of the observed structure and its resistance to theshown forms of failure are presented below (Figure 32 and Table 5). Parameter α representsthe ratio between the spectral acceleration of the activation of the mechanisms and spectralacceleration of the seismic demand.
Sustainability 2021, 11, x FOR PEER REVIEW 20 of 27
Figure 30. Bending out-of-plane results.
The 3Muri program does not consider out-of-plane loss of stability of local mecha-nisms in the global analysis either. It assumes that proper connection is established be-tween walls and between walls and diaphragms. That way, out-of-plane local mecha-nisms are prevented so that the global in-plane response of the building can be evaluated [43]. Therefore, the resistance to local losses of stability is checked in a special program module; certain parts of a single wall are checked and the interaction of parts of several individual walls that can together form different local mechanisms. Figure 31 shows an example of a local mechanism where the kinematic block is colored red.
Figure 31. Example of a local mechanism.
Local mechanisms are arbitrarily defined according to the structure’s shape, common failure mechanisms and earthquake damage. The emergence of local mechanisms is often due to the poor interconnection of walls and walls with floor structures. Linear kinematic analysis is used. Defining a local mechanism consists of three steps. To begin with, it is necessary to define a kinematic block that is a part of a wall that is considered absolutely rigid, and that is subject to movement or tilting relative to another block or the rest of the wall. Then, the boundary conditions are defined and finally, the load needs to be set. Some of the possible local failure mechanisms of the observed structure and its resistance to the shown forms of failure are presented below (Figure 32 and Table 5). Parameter α repre-sents the ratio between the spectral acceleration of the activation of the mechanisms and spectral acceleration of the seismic demand.
Figure 31. Example of a local mechanism.Sustainability 2021, 11, x FOR PEER REVIEW 21 of 27
Figure 32. Local mechanism LM1 (east wing), LM2 and LM3 (central wing).
Table 5. Results for local mechanisms’ analysis.
Local Mechanism α
LM1 4.93
LM2 2.10
LM3 0.53
After the performed analyses, the real damage was compared with the damage dis-
tribution previewed in 3Muri (Figures 33–36). Description of building’s capacity through
displacement rather than forces allows us to better understand and accurately predict a
building’s response in the form of a damage initiation and propagation throughout all
phases of analysis all the way until the formation of failure mechanism and collapse. That
is possible, thanks to incremental non-linear static pushover analysis that shows us dam-
age patterns for every macro-element in every step of the analysis. Compared results are
very similar to real damage, which implies good accuracy of the used analysis and soft-
ware.
Figure 33. First comparison (photo credit: T. Kišiček).
Figure 32. Local mechanism LM1 (east wing), LM2 and LM3 (central wing).
Table 5. Results for local mechanisms’ analysis.
Local Mechanism α
LM1 4.93LM2 2.10LM3 0.53
After the performed analyses, the real damage was compared with the damagedistribution previewed in 3Muri (Figures 33–36). Description of building’s capacity throughdisplacement rather than forces allows us to better understand and accurately predict abuilding’s response in the form of a damage initiation and propagation throughout allphases of analysis all the way until the formation of failure mechanism and collapse. Thatis possible, thanks to incremental non-linear static pushover analysis that shows us damagepatterns for every macro-element in every step of the analysis. Compared results are verysimilar to real damage, which implies good accuracy of the used analysis and software.

Sustainability 2021, 13, 6353 20 of 25
Sustainability 2021, 11, x FOR PEER REVIEW 21 of 27
Figure 32. Local mechanism LM1 (east wing), LM2 and LM3 (central wing).
Table 5. Results for local mechanisms’ analysis.
Local Mechanism α
LM1 4.93
LM2 2.10
LM3 0.53
After the performed analyses, the real damage was compared with the damage dis-
tribution previewed in 3Muri (Figures 33–36). Description of building’s capacity through
displacement rather than forces allows us to better understand and accurately predict a
building’s response in the form of a damage initiation and propagation throughout all
phases of analysis all the way until the formation of failure mechanism and collapse. That
is possible, thanks to incremental non-linear static pushover analysis that shows us dam-
age patterns for every macro-element in every step of the analysis. Compared results are
very similar to real damage, which implies good accuracy of the used analysis and soft-
ware.
Figure 33. First comparison (photo credit: T. Kišiček). Figure 33. First comparison (photo credit: T. Kišicek).
Sustainability 2021, 11, x FOR PEER REVIEW 21 of 26
464 Figure 34. Second comparison (photo credit: T. Kišiček). 465
466 Figure 35. Third comparison (photo credit: T. Kišiček). 467
468
Figure 34. Second comparison (photo credit: T. Kišicek).
Sustainability 2021, 11, x FOR PEER REVIEW 22 of 27
Figure 34. Second comparison (photo credit: T. Kišiček).
Figure 35. Third comparison (photo credit: T. Kišiček).
Figure 35. Third comparison (photo credit: T. Kišicek).
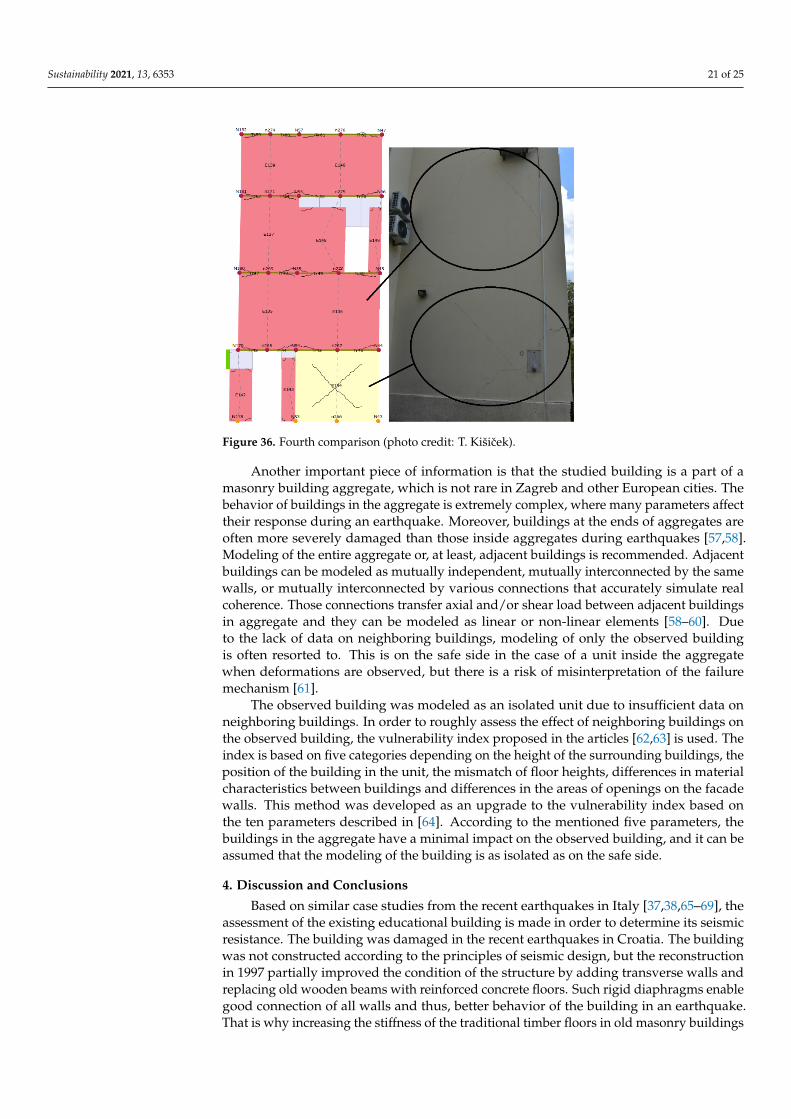
Sustainability 2021, 13, 6353 21 of 25
Sustainability 2021, 11, x FOR PEER REVIEW 21 of 26
464 Figure 34. Second comparison (photo credit: T. Kišiček). 465
466 Figure 35. Third comparison (photo credit: T. Kišiček). 467
468 Figure 36. Fourth comparison (photo credit: T. Kišicek).
Another important piece of information is that the studied building is a part of amasonry building aggregate, which is not rare in Zagreb and other European cities. Thebehavior of buildings in the aggregate is extremely complex, where many parameters affecttheir response during an earthquake. Moreover, buildings at the ends of aggregates areoften more severely damaged than those inside aggregates during earthquakes [57,58].Modeling of the entire aggregate or, at least, adjacent buildings is recommended. Adjacentbuildings can be modeled as mutually independent, mutually interconnected by the samewalls, or mutually interconnected by various connections that accurately simulate realcoherence. Those connections transfer axial and/or shear load between adjacent buildingsin aggregate and they can be modeled as linear or non-linear elements [58–60]. Dueto the lack of data on neighboring buildings, modeling of only the observed buildingis often resorted to. This is on the safe side in the case of a unit inside the aggregatewhen deformations are observed, but there is a risk of misinterpretation of the failuremechanism [61].
The observed building was modeled as an isolated unit due to insufficient data onneighboring buildings. In order to roughly assess the effect of neighboring buildings onthe observed building, the vulnerability index proposed in the articles [62,63] is used. Theindex is based on five categories depending on the height of the surrounding buildings, theposition of the building in the unit, the mismatch of floor heights, differences in materialcharacteristics between buildings and differences in the areas of openings on the facadewalls. This method was developed as an upgrade to the vulnerability index based onthe ten parameters described in [64]. According to the mentioned five parameters, thebuildings in the aggregate have a minimal impact on the observed building, and it can beassumed that the modeling of the building is as isolated as on the safe side.
4. Discussion and Conclusions
Based on similar case studies from the recent earthquakes in Italy [37,38,65–69], theassessment of the existing educational building is made in order to determine its seismicresistance. The building was damaged in the recent earthquakes in Croatia. The buildingwas not constructed according to the principles of seismic design, but the reconstructionin 1997 partially improved the condition of the structure by adding transverse walls andreplacing old wooden beams with reinforced concrete floors. Such rigid diaphragms enablegood connection of all walls and thus, better behavior of the building in an earthquake.That is why increasing the stiffness of the traditional timber floors in old masonry buildings

Sustainability 2021, 13, 6353 22 of 25
is usually one of the first measures in seismic retrofitting. On the other hand, new researchsuggests that replacing traditional wooden floors with rigid diaphragms, i.e., RC floors,can induce some unwanted consequences such as cracks on the edges of the two materialsor, in the worst scenario, disintegration and collapse of the masonry walls. However, forearthquakes with expected smaller magnitudes as the ones in Zagreb, this measure isconvenient and serves to reinforce the existing structure to horizontal actions.
The assessment of the existing unconfined masonry structure was performed using3Muri with an equivalent frame method. Rather than linear analysis, non-linear static(pushover) seismic analysis is used due to its various benefits. Limit state checks werecarried out for the return periods of 95, 225 and 475 years. The results are in line withthe expected behavior with respect to the existing wall distribution in the structure. Thestructure is less rigid and has greater displacements in the y-direction. Additionally, thecapacity of the structure is smaller for the y-direction. There is also a small eccentricitybetween the center of rigidity and the center of mass that causes a slight but negativeimpact of torsion on the global behavior of the structure. The critical elements are thewalls of the central stairwell and the transverse walls on the west side of the building.Additionally, bending failure out-of-plane was checked. Local failure mechanisms werealso analyzed using linear kinematic analysis. A comparison of the actual damage withthe damage obtained as a result of the conducted non-linear static seismic analysis in the3Muri program was also conducted.
After assessing the building’s behavior in an earthquake, it is obvious that strengthen-ing is needed to raise the seismic resistance level of the building. Damage caused by anearthquake must be repaired to prevent the progression of damage and the possible threatto the global resistance and stability of the building.
As Croatia was hit by two severe earthquakes last year, the knowledge of ‘buildback better’ is fully appreciated. That means that sustainable materials and innovativeconcepts [70–73] should be used and energy efficiency ensured [74,75]. Various methodsare used for strengthening of masonry buildings [76–78] and materials such as FRP andTRM will probably be adopted due to their compatibility and reversibility.
This study provides a detailed insight into the behavior of the building during theearthquake, as well as the extent and distribution of damage and critical elements forearthquakes of different intensities.
Author Contributions: Conceptualization: M.S., L.L. and T.K.; methodology: M.S. and T.K.; software:L.L.; validation: M.S. and T.K.; investigation: I.H., L.L. and K.O.; writing—original draft preparation:M.S., K.O., L.L. and I.H.; writing—review and editing: L.L., M.S. and T.K.; visualization: L.L., K.O.,I.H. and M.S.; supervision: M.S. and T.K.; project administration: M.S. All authors have read andagreed to the published version of the manuscript.
Funding: This research was funded by the Croatian Science Foundation, grant number UIP-2019-04-3749 (ARES project—Assessment and rehabilitation of existing structures—development of contem-porary methods for masonry and timber structures), project leader: Mislav Stepinac.
Institutional Review Board Statement: Not applicable.
Informed Consent Statement: Not applicable.
Data Availability Statement: The data presented in this study are available on request from thecorresponding author. The data are not publicly available due to privacy reasons.
Conflicts of Interest: The authors declare no conflict of interest.
References and Note1. Stepinac, M.; Lourenço, P.B.; Atalic, J.; Kišicek, T.; Uroš, M.; Banicek, M.; Šavor Novak, M. Damage classification of residential
buildings in historical downtown after the ML5.5 earthquake in Zagreb, Croatia in 2020. Int. J. Disaster Risk Reduct. 2021, 56,102140. [CrossRef]
2. Federal Republic of Yugoslavia (FRY) Official Journal. Ordinance on Technical Standards for the Construction of High-RiseBuildings in Seismic Areas. No. 31/81, 49/82, 29/83, 20/88, 52/90, 1 February 2021.

Sustainability 2021, 13, 6353 23 of 25
3. Federal Republic of Yugoslavia (FRY) Official Journal. Ordinance on Temporary Technical Regulations for Construction in SeismicAreas. No. 39/64, 1 February 2021.
4. ARES Project 1st Workshop. Available online: www.grad.hr/ares (accessed on 15 February 2021).5. Atalic, J.; Šavor Novak, M.; Uroš, M. Seismic risk for Croatia: Overview of research activities and present assessments with
guidelines for the future. Gradevinar. 2019, 71, 923–947.6. Stepinac, M.; Gašparovic, M. A Review of Emerging Technologies for an Assessment of Safety and Seismic Vulnerability and
Damage Detection of Existing Masonry Structures. Appl. Sci. 2020, 10, 5060. [CrossRef]7. Ortega, J.; Vasconcelos, G.; Rodrigues, H.; Correia, M.; Ferreira, T.M.; Vicente, R. Use of post-earthquake damage data to calibrate,
validate and compare two seismic vulnerability assessment methods for vernacular architecture. Int. J. Disaster Risk Reduct. 2019,39, 101242. [CrossRef]
8. Rodríguez, A.S.; Rodríguez, B.R.; Rodríguez, M.S.; Sánchez, P.A. 9-Laser Scanning and Its Applications to Damage Detectionand Monitoring in Masonry Structures. Woodhead Publishing Series in Civil and Structural Engineering, Long-term Performance andDurability of Masonry Structures; Ghiassi, B., Lourenço, P.B., Eds.; Woodhead Publishing, 2019; pp. 265–285. Available online:https://www.sciencedirect.com/science/article/pii/B9780081021101000091 (accessed on 15 February 2021).
9. Yavari, S.; Chang, S.E.; Elwood, K.J. Modeling post-earthquake functionality of regional health care facilities. Earthq. Spectra.2010, 26, 869–892. [CrossRef]
10. Marshall, J.D.; Jaiswal, K.; Gould, N.; Turner, F.; Lizundia, B.; Barnes, J.C. Post-earthquake building safety inspection: Lessonsfrom the canterbury, New Zealand, earthquakes. Earthq. Spectra. 2013, 29, 1091–1107. [CrossRef]
11. Didier, M.; Baumberger, S.; Tobler, R.; Esposito, S.; Ghosh, S.; Stojadinovic, B. Improving post-earthquake building safetyevaluation using the 2015 Gorkha, Nepal, Earthquake rapid visual damage assessment data. Earthq. Spectra. 2017, 33, 415–438.[CrossRef]
12. Zhang, Y.; Burton, H.V.; Sun, H.; Shokrabadi, M. A machine learning framework for assessing post-earthquake structural safety.Struct. Saf. 2018, 72, 1–16. [CrossRef]
13. Kim, T.; Song, J.; Kwon, O.S. Pre- and post-earthquake regional loss assessment using deep learning. Earthq. Eng. Struct. Dyn.2020, 49, 657–678. [CrossRef]
14. Naito, S.; Tomozawa, H.; Mori, Y.; Nagata, T.; Monma, N.; Nakamura, H.; Fujiwara, H.; Shoji, G. Building-damage detectionmethod based on machine learning utilizing aerial photographs of the Kumamoto earthquake. Earthq. Spectra. 2020, 36, 1166–1187.[CrossRef]
15. Bialas, J.; Oommen, T.; Rebbapragada, U.; Levin, E. Object-based classification of earthquake damage from high-resolution opticalimagery using machine learning. J. Appl. Remote Sens. 2016, 10, 036025. [CrossRef]
16. Republic of Croatia Ministry of Construction and Physical Planning. Proposal of the Long-Term Strategy for MobilisingInvestment in the Renovation of the National Building Stock of the Republic of Croatia. 2014. Available online: https://mgipu.gov.hr/UserDocsImages//dokumenti/Engleska//HR-Art4BuildingStrategy_en.pdf (accessed on 15 February 2021).
17. Papadimitriou, P.; Kapetanidis, V.; Karakonstantis, A.; Spingos, I.; Kassaras, I.; Sakkas, V.; Kouskouna, V.; Karatzetzou, A.; Pavlou,K.; Kaviris, G.; et al. First Results on the Mw=6.9 Samos Earthquake of 30 October 2020. Bull. Geol. Soc. Greece. 2020, 56, 251–279.[CrossRef]
18. Günaydin, M.; Atmaca, B.; Demir, S.; Altunisik, A.C.; Hüsem, M.; Adanur, S.; Ates, S.; Angin, Z. Seismic damage assessmentof masonry buildings in Elazıg and Malatya following the 2020 Elazıg-Sivrice earthquake, Turkey. Bull. Earthq. Eng. 2021, 19,2421–2456. [CrossRef]
19. Casapulla, C.; Argiento, L.U.; Maione, A. Seismic safety assessment of a masonry building according to Italian Guidelineson Cultural Heritage: Simplified mechanical-based approach and pushover analysis. Bull. Earthq. Eng. 2018, 16, 2809–2837.[CrossRef]
20. Grillanda, N.; Valente, M.; Milani, G.; Chiozzi, A.; Tralli, A. Advanced numerical strategies for seismic assessment of historicalmasonry aggregates. Eng. Struct. 2020, 212, 110441. [CrossRef]
21. Valente, M.; Milani, G. Damage assessment and collapse investigation of three historical masonry palaces under seismic actions.Eng. Fail. Anal. 2019, 98, 10–37. [CrossRef]
22. Ortega, J.; Vasconcelos, G.; Rodrigues, H.; Correia, M. Assessment of the influence of horizontal diaphragms on the seismicperformance of vernacular buildings. Bull. Earthq. Eng. 2018, 16, 3871–3904. [CrossRef]
23. Endo, Y.; Pelà, L.; Roca, P. Review of Different Pushover Analysis Methods Applied to Masonry Buildings and Comparison withNonlinear Dynamic Analysis. J. Earthq. Eng. 2017, 21, 1234–1255. [CrossRef]
24. Herak, M.; Allegretti, I.; Herak, D.; Ivancic, I.; Kuk, V.; Maric, K.; Markušic, S.; Sovic, I. Seismic Hazard Map of Croatia for aReturn Periods of 95, 225 and 475 years. Available online: http://seizkarta.gfz.hr/karta.php (accessed on 15 February 2021).
25. Uroš, M.; Šavor Novak, M.; Atalic, J.; Sigmund, Z.; Banicek, M.; Demšic, M.; Hak, S. Post-earthquake damage assessment ofbuildings–procedure for conducting building inspections. Gradjevinar 2020, 72, 1089–1115. [CrossRef]
26. Stepinac, M.; Rajcic, V.; Barbalic, J. Inspection and condition assessment of existing timber structures. Gradjevinar 2017, 69,861–873. [CrossRef]
27. Dall’Asta, A.; Leoni, G.; Meschini, A.; Petrucci, E.; Zona, A. Integrated approach for seismic vulnerability analysis of historicmassive defensive structures. J. Cult. Herit. 2019, 35, 86–98. [CrossRef]

Sustainability 2021, 13, 6353 24 of 25
28. Betti, M.; Bonora, V.; Galano, L.; Pellis, E.; Tucci, G.; Vignoli, A. An Integrated Geometric and Material Survey for the Conservationof Heritage Masonry Structures. Heritage 2021, 4, 35. [CrossRef]
29. Stepinac, M.; Kisicek, T.; Renic, T.; Hafner, I.; Bedon, C. Methods for the assessment of critical properties in existing masonrystructures under seismic loads-the ARES project. Appl. Sci. 2020, 10, 1576. [CrossRef]
30. The Database of Usability Classification, Croatian Centre of Earthquake Engineering (HCPI—Hrvatski Centar za PotresnoInženjerstvo), Faculty of Civil Engineering, University of Zagreb and The City of Zagreb. June 2020. Available online: https://www.hcpi.hr/ (accessed on 15 February 2021).
31. Seismic and Geological Micro-Zoning of a Part of the City of Zagreb, Book 1—Seismic and Geological Micro-Zoning, CroatianGeological Institute, Zagreb. 2019. Available online: https://www.hgi-cgs.hr/studija-seizmicka-i-geoloska-mikronizacija-dijela-grada-zagreba/ (accessed on 15 February 2021).
32. Krolo, J.; Damjanovic, D.; Duvnjak, I.; Smrkic, M.F.; Bartolac, M.; Košcak, J. Methods for determining mechanical properties ofwalls. Gradjevinar 2021, 73, 127–140. [CrossRef]
33. Methods of Test for Masonry—Part 3: Determination of Initial Shear Strength. Available online: https://standards.iteh.ai/catalog/standards/cen/bbead1e6-bd33-4a25-bc75-c023da989f65/en-1052-3-2002 (accessed on 15 February 2021).
34. Eurocode 8: Design of Structures for Earthquake Resistance—Part 3: Assessment and Retrofitting of Buildings. Available online:https://www.phd.eng.br/wp-content/uploads/2014/07/en.1998.3.2005.pdf (accessed on 15 February 2021).
35. Mouyiannou, A.; Rota, M.; Penna, A.; Magenes, M. Identification of Suitable Limit States from Nonlinear Dynamic Analyses ofMasonry Structures. J. Earthq. Eng. 2014, 18, 231–263. [CrossRef]
36. Lamego, P.; Lourenço, P.B.; Sousa, M.L.; Marques, R. Seismic vulnerability and risk analysis of the old building stock at urbanscale: Application to a neighbourhood in Lisbon. Bull. Earthq. Eng. 2017, 15, 2901–2937. [CrossRef]
37. Formisano, A.; Marzo, A. Simplified and refined methods for seismic vulnerability assessment and retrofitting of an Italiancultural heritage masonry building. Comput. Struct. 2017, 180, 13–26. [CrossRef]
38. Malcata, M.; Ponte, M.; Tiberti, S.; Bento, R.; Milani, G. Failure analysis of a Portuguese cultural heritage masterpiece: Bonetbuilding in Sintra. Eng. Fail. Anal. 2020, 115, 104636. [CrossRef]
39. Fajfar, P.; Fischinger, M. N2—a method for non-linear seismic analysis of regular buildings. In Proceedings of the 9th Worldconference in earthquake engineering, Tokyo-Kyoto, Japan, 2–9 August 1998; pp. 111–116.
40. Cerovecki, A.; Kraus, I.; Moric, D. N2 building design method. Gradjevinar 2018, 70, 509–518. [CrossRef]41. 3muri User Manual 12.2.1. Available online: https://www.3muri.com/en/brochures-and-manuals/ (accessed on 11 January
2021).42. Kišicek, T.; Stepinac, M.; Renic, T.; Hafner, I.; Lulic, L. Strengthening of masonry walls with FRP or TRM. Gradjevinar 2020, 72,
937–953. [CrossRef]43. Lagomarsino, S.; Penna, A.; Galasco, A.; Cattari, S. TREMURI program: An equivalent frame model for the nonlinear seismic
analysis of masonry buildings. Eng. Struct. 2013, 56, 1787–1799. [CrossRef]44. Penna, A.; Lagomarsino, S.; Galasco, A. A nonlinear macroelement model for the seismic analysis of masonry buildings. Earthq.
Eng. Struct. Dyn. 2014, 43, 159–179. [CrossRef]45. Turnšek, V.; Cacovic, F. Some Experimental Results on the Strength of Brick Masonry Walls. Available online: http://www.hms.
civil.uminho.pt/ibmac/1970/149.pdf (accessed on 8 February 2021).46. Tomaževic, M. Shear resistance of masonry walls and Eurocode 6: Shear versus tensile strength of masonry. Mater. Struct. Mater.
Constr. 2009, 42, 889–907. [CrossRef]47. Borri, A.; Castori, G.; Corradi, M.; Speranzini, E. Shear behavior of unreinforced and reinforced masonry panels subjected to in
situ diagonal compression tests. Constr. Build. Mater. 2011, 25, 4403–4414. [CrossRef]48. Borri, A.; Corradi, M.; Castori, G.; De Maria, A. A method for the analysis and classification of historic masonry. Bull. Earthq. Eng.
2015, 13, 2647–2665. [CrossRef]49. Borri, A.; Corradi, A.; De Maria, A.; Sisti, R. Calibration of a visual method for the analysis of the mechanical properties of historic
masonry. Procedia Struct. Integr. 2018, 11, 418–427. [CrossRef]50. Borri, A.; Corradi, M.; De Maria, A. The Failure of Masonry Walls by Disaggregation and the Masonry Quality Index. Heritage
2020, 3, 65. [CrossRef]51. Ghiassi, B.; Vermelfoort, A.T.; Lourenço, P.B. Masonry Mechanical Properties; Ghiassi, B., Milani, G., Eds.; Woodhead Publishing,
2019. Chapter 7. pp. 239–261. Available online: https://www.sciencedirect.com/science/article/pii/B9780081024393000075(accessed on 8 February 2021). [CrossRef]
52. Eurocode 8: Design of Structures for Earthquake Resistance—Part 1: General Rules, Seismic Actions and Rules for Buildings.Available online: https://www.phd.eng.br/wp-content/uploads/2015/02/en.1998.1.2004.pdf (accessed on 8 February 2021).
53. Eurocode 6: Design of Masonry Structures—Part 1-1: General Rules for Reinforced and Unreinforced Masonry Structures.Available online: https://www.phd.eng.br/wp-content/uploads/2015/02/en.1996.1.1.2005.pdf (accessed on 8 February 2021).
54. Law on the Reconstruction of Earthquake-Damaged Buildings in the City of Zagreb, Krapina-Zagorje County and Zagreb County(NN 102/2020). Available online: https://www.zakon.hr/z/2656/Zakon-o-obnovi-zgrada-o%C5%A1te%C4%87enih-potresom-na-podru%C4%8Dju-Grada-Zagreba,-Krapinsko-zagorske-%C5%BEupanije,-Zagreba%C4%8Dke-%C5%BEupanije,-Sisa%C4%8Dko-moslava%C4%8Dke-%C5%BEupanije-i-Karlova%C4%8Dke-%C5%BEupanije (accessed on 9 February 2021).
55. Eurocode 8: Design of Structures for Earthquake Resistance—Part 3: Assessment and Retrofitting of Buildings—National Annex.

Sustainability 2021, 13, 6353 25 of 25
56. Sürmeli, M.; Yüksel, E. An adaptive modal pushover analysis procedure (VMPA-A) for buildings subjected to bi-directionalground motions. Bull. Earthq. Eng. 2018, 16, 5257–5277. [CrossRef]
57. Fagundes, C.; Bento, R.; Cattari, S. On the seismic response of buildings in aggregate: Analysis of a typical masonry buildingfrom Azores. Structures 2017, 10, 184–196. [CrossRef]
58. Senaldi, I.; Magenes, G.; Penna, A. Numerical Investigations on the Seismic Response of Masonry Building Aggregates. Adv.Mater. Res. 2010, 133–134, 715–720. [CrossRef]
59. Formisano, A.; Massimilla, A. A Novel Procedure for Simplified Nonlinear Numerical Modeling of Structural Units in MasonryAggregates. Int. J. Archit. Herit. 2018, 12, 1162–1170. [CrossRef]
60. Stavroulaki, M.E. Dynamic Behavior of Aggregated Buildings With Different Floor Systems and Their Finite Element Modeling.Front. Built Environ. 2019, 5, 138. [CrossRef]
61. Tomic, I.; Penna, A.; DeJong, M.; Butenweg, C.; Correia, A.; Candeias, P.; Senaldi, I.; Guerrini, G.; Malomo, D.; Beyer, K.Seismic Testing of Adjacent Interacting Masonry Structures (AIMS). In Proceedings of the 17th World Conference on EarthquakeEngineering, Sendai, Japan, 27 September–2 October 2021.
62. Formisano, A.; Landolfo, R.; Mazzolani, F.M.; Florio, G. A Quick Methodology for Seismic Vulnerability Assessment of HistoricalMasonry Aggregates. 2010. Available online: https://www.researchgate.net/publication/266617700_A_quick_methodology_for_seismic_vulnerability_assessment_of_historical_masonry_aggregates (accessed on 8 February 2021).
63. Formisano, A.; Florio, G.; Landolfo, R.; Mazzolani, F.M. Numerical calibration of an easy method for seismic behaviour assessmenton large scale of masonry building aggregates. Adv. Eng. Softw. 2015, 80, 116–138. [CrossRef]
64. Benedetti, D.; Benzoni, G.; Parisi, M.A. Seismic vulnerability and risk evaluation for old urban nuclei. Earthq. Eng. Struct. Dyn.1988, 16, 183–201. [CrossRef]
65. Formisano, A. Theoretical and Numerical Seismic Analysis of Masonry Building Aggregates: Case Studies in San Pio DelleCamere (L’Aquila, Italy). J. Earthq. Eng. 2017, 21, 227–245. [CrossRef]
66. da Porto, F.; Munari, M.; Prota, A.; Modena, C. Analysis and repair of clustered buildings: Case study of a block in the historiccity centre of L’Aquila (Central Italy). Constr. Build. Mater. 2013, 38, 1221–1237. [CrossRef]
67. Lucibello, G.; Brandonisio, G.; Mele, E.; De Luca, A. Seismic damage and performance of Palazzo Centi after L’Aquila earthquake:A paradigmatic case study of effectiveness of mechanical steel ties. Eng. Fail. Anal. 2013, 34, 407–430. [CrossRef]
68. Chieffo, N.; Formisano, A. Comparative Seismic Assessment Methods for Masonry Building Aggregates: A. Case Study. Front.Built Environ. 2019, 5, 123. [CrossRef]
69. Boschi, S.; Borghini, A.; Pintucchi, B.; Bento, R.; Milani, G. Seismic vulnerability of historic masonry buildings: A case study inthe center of Lucca. Procedia Struct. Integr. 2018, 11, 169–176. [CrossRef]
70. Fortunato, G.; Funari, M.F.; Lonetti, P. Survey and seismic vulnerability assessment of the Baptistery of San Giovanni in Tumba(Italy). J. Cult. Herit. 2017, 26, 64–78. [CrossRef]
71. Stepinac, M.; Šušteršic, I.; Gavric, I.; Rajcic, V. Seismic design of timber buildings: Highlighted challenges and future trends. Appl.Sci. 2020, 10, 1380. [CrossRef]
72. Funari, M.F.; Mehrotra, A.; Lourenço, P.B. A Tool for the Rapid Seismic Assessment of Historic Masonry Structures Based onLimit Analysis Optimisation and Rocking Dynamics. Appl. Sci. 2021, 11, 942. [CrossRef]
73. Funari, M.F.; Spadea, S.; Lonetti, P.; Fabbrocino, F.; Luciano, R. Visual programming for structural assessment of out-of-planemechanisms in historic masonry structures. J. Build. Eng. 2020, 31, 101425. [CrossRef]
74. Milovanovic, B.; Bagaric, M. How to achieve Nearly zero-energy buildings standard. Gradjevinar 2020, 72, 703–720. [CrossRef]75. Valluzzi, M.R.; Salvalaggio, M.; Croatto, G.; Dorigatti, G.; Turrini, U. Nested Buildings: An Innovative Strategy for the Integrated
Seismic and Energy Retrofit of Existing Masonry Buildings with CLT Panels. Sustainability 2021, 13, 1188. [CrossRef]76. Ortega, J.; Vasconcelos, G.; Rodrigues, H.; Correia, M.; Lourenço, P.B. Traditional earthquake resistant techniques for vernacular
architecture and local seismic cultures: A literature review. J. Cult. Herit. 2017, 27, 181–196. [CrossRef]77. Skejic, D.; Lukacevic, I.; Curkovic, I.; Cudina, I. Application of steel in refurbishment of earthquake-prone buildings. Gradjevinar
2020, 72, 955–966. [CrossRef]78. Kouris, L.A.S.; Triantafillou, T.C. State-of-the-art on strengthening of masonry structures with textile reinforced mortar (TRM).
Constr. Build. Mater. 2018, 188, 1221–1233. [CrossRef]
Copyright © 2022 FDOKUMEN