Difficulties observed when implementing Total Productive ...
Soil Dynamics and Earthquake Engineering 31 (2011) 583–597
Contents lists available at ScienceDirect
Soil Dynamics and Earthquake Engineering
0267-72
doi:10.1
n Corr
E-m
journal homepage: www.elsevier.com/locate/soildyn
EC8-based earthquake record selection procedure evaluation: Validationstudy based on observed damage of an irregular R/C building
Anastasios G. Sextos n, Evangelos I. Katsanos, George D. Manolis
Department of Civil Engineering, Aristotle University, Thessaloniki GR-54124, Greece
a r t i c l e i n f o
Article history:
Received 1 September 2010
Received in revised form
25 October 2010
Accepted 30 October 2010Available online 18 December 2010
61/$ - see front matter & 2010 Elsevier Ltd. A
016/j.soildyn.2010.10.009
esponding author. Tel.: +30 2310 995697; fax
ail address: [email protected] (A.G. Sextos
a b s t r a c t
This study investigates the applicability and limitations of the Eurocode 8 earthquake ground motion
selection framework for the assessment of both elastic and inelastic structural response of multi-storey,
irregular R/C buildings subjected to bi-directional loading. In order to minimize modelling uncertainties
inherent in the quantification of structural damage and the consideration of the supporting soil–
foundation system for complex structural systems, an existing building damaged by the 2003 Lefkada
earthquake was adopted as case study. This selection has an advantage in that ground excitation, soil
profile and damage observations are all available, thus permitting calibration of the finite element model
with the observed response, especially in terms of use of appropriate plasticity models and damage
indices, plus the assessment of soil–structure interaction effects. After establishing a reliable finite
element model of the structure under study, extensive parametric analyses for different EC8 compliant
sets of records were conducted, permitting quantification of the discrepancy of the structural response
due to record-to-record and set-to-set variability (i.e., intra-set and inter-set scatter, respectively). The
results confirm that many of the observations found in the literature regarding the effect of ground motion
selection on the predicted seismic performance of SDOF systems are also valid for bi-directionally excited,
multi-storey, irregular buildings. Finally, the results also highlight specific limitations of the EC8
provisions that may lead to erroneous results in many practical cases.
& 2010 Elsevier Ltd. All rights reserved.
1. Introduction
Notwithstanding useful insights obtained from the elastic analysisof structures in terms of their seismic response, it is clear that thehierarchy of failure mechanisms, the energy dissipation and forceredistribution phenomena in case of strong ground motion cannot bepredicted. This type of response can only be captured throughnonlinear static (i.e., standard or multi-modal pushover) and non-linear response history analyses. The latter is preferable in the case ofcomplex buildings characterized by a dominance of their highermodes (i.e., tall or irregular buildings, structures supported on softsoils), structures of high importance (industrial facilities, powerplants) and cases with significant material or geometrical nonlinea-rities (i.e., seismically isolated structures).
In contrast to past practice, nonlinear analysis in the timedomain is currently computationally feasible even for structuralsystems with thousands of degrees of freedom, given the highincrease in computational power and parallel evolution of engi-neering software. As such, it has been incorporated in the majorityof modern seismic design codes as a legitimate analysis option forall aforementioned categories of structures.
ll rights reserved.
: +30 2310 995769.
).
Current research work, however, has demonstrated that amongall possible sources of uncertainty stemming from the structuraland soil material properties, the design and analysis assumptionsand the earthquake-induced ground motions, the latter has thehighest effect on the variability observed in the structural response[1–3]. Thus, the selection of a ‘reasonable’ set of earthquakemotions for conducting dynamic analysis is an imperative. To thisend, numerous state-of-the-art methods have been proposed foroptimization of the selection and scaling process of real records, asreviewed by Bommer and Acevedo [4] and Katsanos et al. [5]. Thesemethods are not currently used in engineering practice, mainlybecause they have not been included in the seismic design codes.This holds true for Eurocode 8 [6], which does permit the selectionof real records or the generation of artificial ones that comply withsome general criteria related to matching a target responsespectrum, but without ensuring a stable mean value for thestructural response. As a result, seismic codes allow the designerto conduct complex response history analyses without providingthe framework for selecting appropriate earthquake excitationscenarios, or at least warning about the impact of the selectionprocess on the predicted structural response.
Furthermore, the effect of ground motion selection on structuralresponse has been studied primarily for the case of SDOF orsimplified MDOF models [2,7–11]. Thus, the impact of earthquakerecord selection on the nonlinear response of complex and irregular
A.G. Sextos et al. / Soil Dynamics and Earthquake Engineering 31 (2011) 583–597584
buildings has not been adequately investigated, primarily due to (a)significant computational cost, (b) high sensitivity (as comparedto simpler systems) on the amplitude, frequency content andduration of the earthquake excitation used and (c) high sensitivityto a number of assumptions related to the modelling and quanti-fication of (concrete and soil) inelasticity, which in turn yieldsindeed difficult to isolate the actual impact of earthquake selectionon the overall structural response. The scope of this paper istherefore to use a case study involving an existing, irregular multi-storey R/C building, damaged by the Lefkada 2003 earthquake(Ms¼6.4) for which all relevant data are available: earthquakemotion recorded at 700 m from the building, in-situ soil measure-ments, structural properties, drawings and reinforcement plans aswell as the damage assessed on site. All this reduces the epistemicuncertainty associated with finite element modelling before study-ing the effect of record selection strategies on the overall seismicdemand.
The strategy now is to:
(a)
investigate the applicability of Eurocode 8 provisions inselecting natural accelerograms for input to complex struc-tures such as, multi-storey, irregular, R/C buildings subjected tobi-directional loading,(b)
quantify the discrepancy produced in their inelastic responsein terms of record-to-record and set-to-set variability fordifferent, but legitimate, EC8 compliant record selectionalternatives,(c)
identify cases where use of relevant EC8 provisions withoutproper engineering judgment may lead to erroneous predic-tions of structural performance and(d)
draft practical suggestions for the designer aiming to resolvethe issues raised above.2. Earthquake record selection alternatives
Numerous methods exist for selecting sets of earthquakerecords as required for the dynamic analysis of structures. Thesemethods can be generally classified [4,5] as based on the following:
(a)
Earthquake magnitude (M), distance (R), soil type (S), seismo-tectonic environment and other strong-motion parameters[i.e., 2,4,7,12–19].(b)
Spectral matching [i.e., 9,10,20]. (c) Ground motion intensity measures [i.e., 2,13,21,22] inclusive ofthe use of e as a predictor of nonlinear structural response, andof CMS-e, i.e., the conditional mean spectrum considering e, soas to simultaneously consider the effect of magnitude, distanceand epsilon values likely to cause a target ground motionintensity at a given site [8].
It is notable though that this classification is rather approximateand is provided herein for reference purposes only. A detailedcategorization of the available methods for earthquake groundmotion selection can be found in [4,5].
3. Selection of seismic input according to Eurocode 8
By way of contrast to the current state-of-the art, Eurocode 8,Part1 [6] on seismic design of buildings, prescribes a set of rathersimple criteria according to which the selection of recorded seismicmotions for use in dynamic analysis should depend on the type ofstructural assessment made and on any data available at thebuilding site, while at the same time satisfying the following three
quantitative criteria (also applicable when artificial records areused):
(a)
The mean of the zero-period spectral acceleration values, ascalculated from the individual records selected, must exceedthe value of agS for the site in question.(b)
The mean of the 5% damped elastic spectrum calculated fromall time histories should not be less than 90% of the correspond-ing value of the 5% damped EC8 elastic response spectrum, inthe range of periods from 0.2T1 and 2T1, where T1 is thefundamental period of the structure in the direction where theaccelerogram is applied (Section 3.2.3.1.2.4, EC8).(c)
A minimum of three accelerograms must comprise each set.When three different accelerograms are used, the structuraldemand is determined from the most unfavourable valueproduced from the corresponding three dynamic analyses.On the other hand, when at least seven different (real orsimulated) records are used, the design value of the actioneffect Ed can be derived from the average of the responsequantities resulting from all analyses (Section 4.3.3.4.3, EC8).When a spatial model is developed for the dynamic analysis (asin the case of the building studied herein), EC8 states that seismicmotion should consist of three simultaneously acting accelero-grams representing the two horizontal and the vertical componentof strong ground motion. Also, the same record must not be usedsimultaneously along both horizontal directions. The verticalcomponent of seismic motion should only be considered if thedesign vertical ground acceleration for type A ground, avg, is greaterthan 0.25 g or in other cases (see Section 4.3.3) primarily dealingwith slender members and base-isolation. The importance of all theabove criteria will be examined in what follows.
4. Overview of the irregular R/C building used as case study
4.1. The Lefkada, Greece, 2003 earthquake event
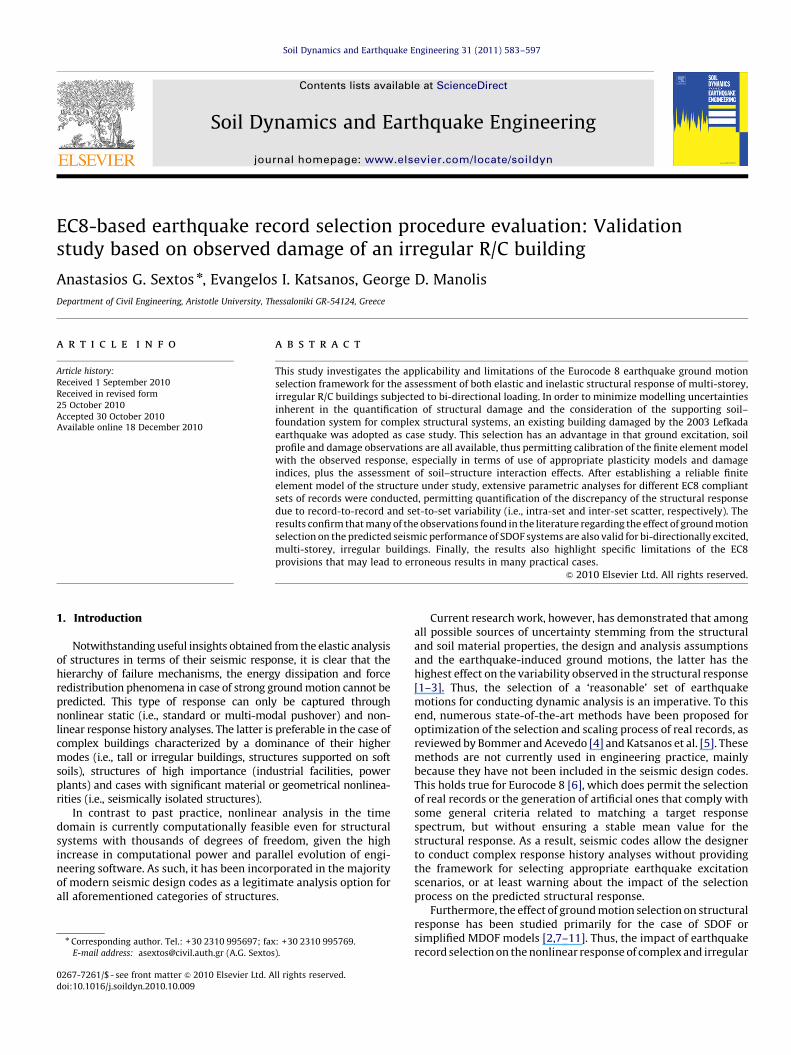
In order to assess the applicability of the aforementioned EC8earthquake record criteria, a multi-storey R/C building that washeavily damaged during the Lefkada earthquake is adopted as casestudy. The Lefkada earthquake of August 14, 2003 measuring a 6.4magnitude occurred in the Ionian Sea area, which has the highestseismicity in Greece. This fact is reflected in the Greek Seismic CodeEAK2000 [23] where the peak ground acceleration is set at 0.36 gfor that given area. The epicenter was located 13.6 km under thesea, approximately 32 km north-west of Lefkada Island. The mainshock and the four aftershocks (of magnitudes 5.3–5.5) causedsevere damage to R/C buildings, roads, quay walls, water supplyand wastewater systems. The acceleration time histories are shownin Fig. 1, where the high intensity of the earthquake reaching amaximum horizontal ground acceleration of 0.42 g is clearlyviewed.
4.2. Structural configuration and regional soil profile for the building
under study
The structure under study is a four-storey R/C building withpilotis, located in the center of the city of Lefkada that was heavilydamaged. This building has been studied in the past [25,26],following an on-site investigation. As already stated, all structuraland foundation configuration plans, soil profile and earthquakerecords in its vicinity are known. Thus, we have a rare advantage inthat all modelling assumptions made can be verified by matchingthe numerical prediction with the observed inelastic response ofthe building before investigating the earthquake record selection
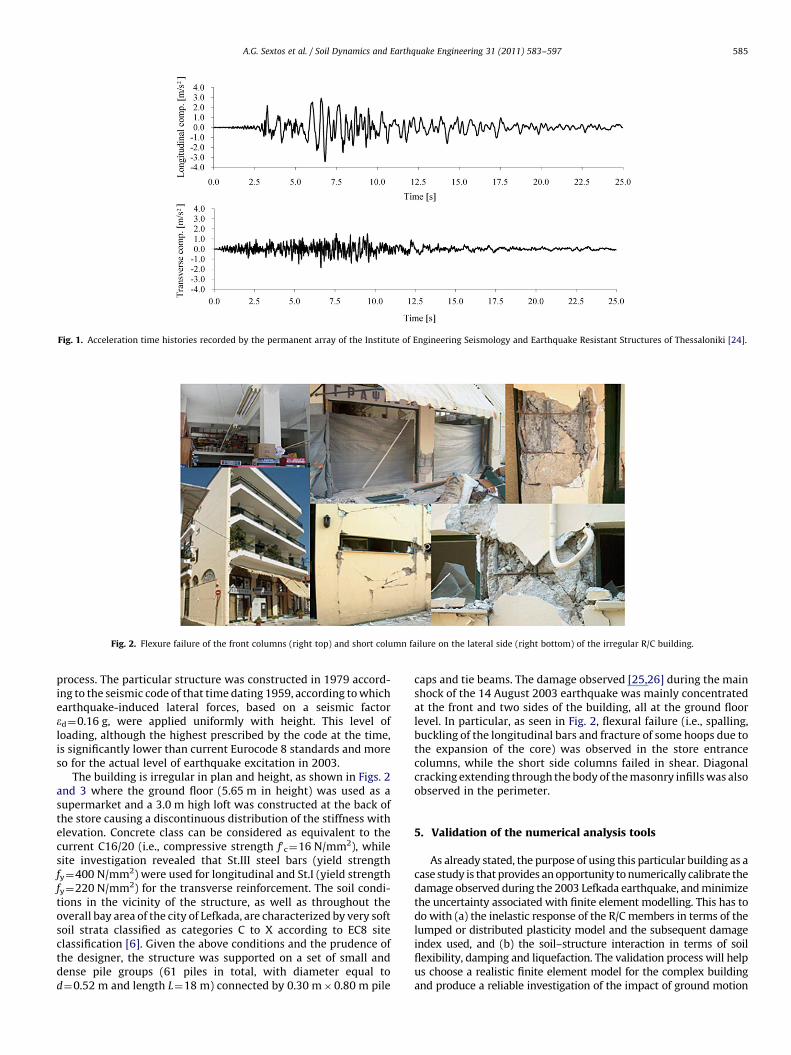
Fig. 1. Acceleration time histories recorded by the permanent array of the Institute of Engineering Seismology and Earthquake Resistant Structures of Thessaloniki [24].
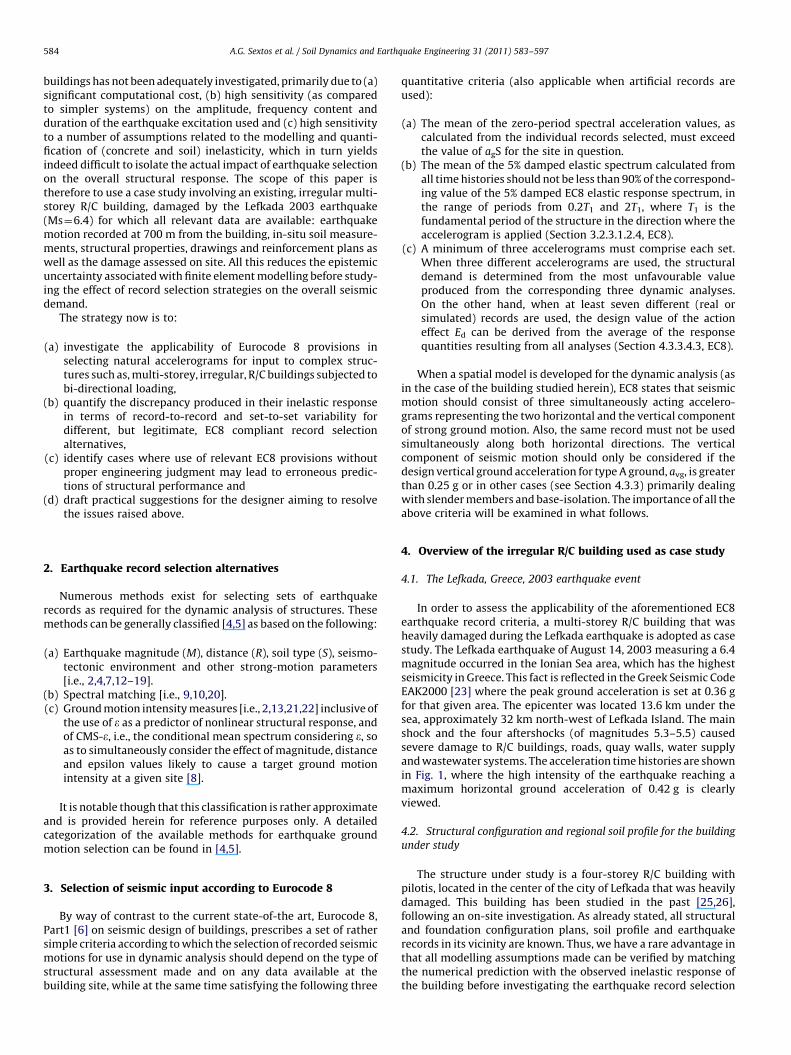
Fig. 2. Flexure failure of the front columns (right top) and short column failure on the lateral side (right bottom) of the irregular R/C building.
A.G. Sextos et al. / Soil Dynamics and Earthquake Engineering 31 (2011) 583–597 585
process. The particular structure was constructed in 1979 accord-ing to the seismic code of that time dating 1959, according to whichearthquake-induced lateral forces, based on a seismic factored¼0.16 g, were applied uniformly with height. This level ofloading, although the highest prescribed by the code at the time,is significantly lower than current Eurocode 8 standards and moreso for the actual level of earthquake excitation in 2003.
The building is irregular in plan and height, as shown in Figs. 2and 3 where the ground floor (5.65 m in height) was used as asupermarket and a 3.0 m high loft was constructed at the back ofthe store causing a discontinuous distribution of the stiffness withelevation. Concrete class can be considered as equivalent to thecurrent C16/20 (i.e., compressive strength f0c¼16 N/mm2), whilesite investigation revealed that St.III steel bars (yield strengthfy¼400 N/mm2) were used for longitudinal and St.I (yield strengthfy¼220 N/mm2) for the transverse reinforcement. The soil condi-tions in the vicinity of the structure, as well as throughout theoverall bay area of the city of Lefkada, are characterized by very softsoil strata classified as categories C to X according to EC8 siteclassification [6]. Given the above conditions and the prudence ofthe designer, the structure was supported on a set of small anddense pile groups (61 piles in total, with diameter equal tod¼0.52 m and length L¼18 m) connected by 0.30 m�0.80 m pile
caps and tie beams. The damage observed [25,26] during the mainshock of the 14 August 2003 earthquake was mainly concentratedat the front and two sides of the building, all at the ground floorlevel. In particular, as seen in Fig. 2, flexural failure (i.e., spalling,buckling of the longitudinal bars and fracture of some hoops due tothe expansion of the core) was observed in the store entrancecolumns, while the short side columns failed in shear. Diagonalcracking extending through the body of the masonry infills was alsoobserved in the perimeter.
5. Validation of the numerical analysis tools
As already stated, the purpose of using this particular building as acase study is that provides an opportunity to numerically calibrate thedamage observed during the 2003 Lefkada earthquake, and minimizethe uncertainty associated with finite element modelling. This has todo with (a) the inelastic response of the R/C members in terms of thelumped or distributed plasticity model and the subsequent damageindex used, and (b) the soil–structure interaction in terms of soilflexibility, damping and liquefaction. The validation process will helpus choose a realistic finite element model for the complex buildingand produce a reliable investigation of the impact of ground motion
B124 20/60
B121 25/60
B120 25/60
B119 25/60
B118 25/60
B116 25/70
B115 25/70
B114 20/60
B117 20/60
B17 20/50 B18 20/50 B19 20/50
B21 20/50 B22 20/50 B24 20/50 B25 20/50 B26 20/50
B110 20/50
C15 60/45
C16 45/45
C20 55/55
C8 60/35
C9 45/45
C17 45/45
C24 180/30
C26 50/30
C27 60/35
C10 60/60
C1 50/35
C4 50/35
C12 180/20
C11 20/180
C28 60/40
C31 35/50
C22 55/55
C21 55/55
C18 80/80
C23 35/60
C14 35/60
C13 50/50
C29 60/35
C30 50/35
C2 50/30
C3 50/30
C5 50/35
C6 50/35
C7 35/50
B111 20/50B112 20/50
B113 20/50
B123 20/60
B122 20/60
S12
d=16
S13
d=16
S14
d=16
S15
d=16
S11
d=16
S16
d=16
S17
d=16
S18
d=16
S19
d=16
S20
d=16
B138 20/60
B140 20/70
B139 20/70
B126 20/50B125 20/50
B135 20/60
B134 20/70
B122 20/50
B130 20/50B129 20/50
C19 60/40
B136 20/70
B137 20/70
C25 50/30
B131 20/50B132 20/50
B133 20/50
N
B128 20/50
B23 20/50
Fig. 3. Plan view of a typical storey of the irregular R/C building in the city of Lefkada.
A.G. Sextos et al. / Soil Dynamics and Earthquake Engineering 31 (2011) 583–597586
selection on its inelastic response (herein considered as the main stepfor assessing the applicability of the Eurocode 8 provisions). Theoverall validation approach and numerical study is described in whatfollows.
5.1. Prediction of the observed damage considering soil–foundation–
structure interaction and liquefaction effects (Model A)
Since there is no finite element software currently available toprovide a balance between structural and geotechnical analysisrefinement, especially in terms of R/C members and soil inelasticresponse including liquefaction, an effort was made to combinedifferent software codes in order to model the phenomena involvedin the most realistic way possible. This global framework, hereaftercalled Model A, is the nine-step procedure described below [25].
Step 1: Reference recorded motion—The strong ground motion ofthe Lefkada main-shock (Fig. 1) comprising two componentsduring which the building was damaged, as recorded at the cityhospital approximately 700 m away, is taken as the referenceearthquake excitation.
Step 2: Deconvolution accounting for soil nonlinearity—Given theabove recorded surface motion, an equivalent linear approach wasimplemented to deconvolute the motion to bedrock level. Soilnonlinearity was considered through modified stiffness and damp-ing properties according to the G–g and D�g curves available at therecording site [27]. The motion deconvolution was performed withthe finite element code Cyberquake [28] assuming deformablebedrock to account for the relatively low shear wave velocitymeasured at the particular site. It is noted that the deconvoluted
process was performed twice for the two reference record hor-izontal components defined in Step 1.
Step 3: Site response at the location of the building considering soil
liquefaction—Having defined the bedrock motion, site responseanalysis was conducted at the building location using available soilproperties from another borehole 300 m away, but along the samecoastline [27]. The liquefaction-susceptible layer (i.e., the sanddeposit of medium density extending at a depth of 6.50–12.0 m)was considered using the program Cyclic-1D [29]. This employs aliquefaction model formulated within the framework of multi-yield-surface plasticity. Thus, acceleration and displacement timehistories were then obtained at various depths. As previously, siteresponse analysis was performed twice for each component of theground motion.
Step 4: Modelling of the pile foundation system (kinematic soil–pile
interaction)—Beam elements were used in the finite element codeETABS [30] to reproduce the 18 m deep pile foundation behaviour,after using modified R/C section properties to account for crackingat various levels of seismic excitation. Uniaxial springs and dash-pots in the horizontal plane that vary with depth were used tomodel lateral pile support with the following properties [31]:
kx ¼ 1:2Es and Cx¼ 1:6rsVsdffiffiffiffiffiffiffiffiffiffiffiffiffiffiod=Vs
4
qþ2bskx=o ð1Þ
where Es is the modulus of elasticity of the soil,rs is its density, Vs isthe shear wave velocity, d is the diameter of the pile, bs is thedamping coefficient ando is the dominant circular frequency of theparticular excitation. The rigid cap connection of the piles wasimplemented through rigid beam elements imposing constraintedmotion. The vertical and horizontal stiffnesses of each pile cap,with dimensions 1.0�1.0 m2 and 0.8�0.8 m2, were calculated
A.G. Sextos et al. / Soil Dynamics and Earthquake Engineering 31 (2011) 583–597 587
according to the relationship proposed in [32] that matches wellmore recent solutions [33]:
Kv ¼ ðG=1�vÞbz
ffiffiffiffiffiffiffiffi4cdp
and Kh ¼ 4ð1þvÞGbx
ffiffiffiffifficdp
ð2Þ
where bz and bx are damping coefficients, 2c and 2d the pile capdimensions, v Poisson’s ratio taken equal to 0.2 and G the shearmodulus of the soil. It is noted that dynamic pile-to-pile interactionwas not explicitly considered, and the pile group was treated as anassembly of the individual dynamic stiffness of the piles compris-ing each group. The reason for this simplification is that liquefac-tion-induced, depth-dependent multiple excitation along the pileswas deemed more important than the introduction of pile groupdamping with a point 6-DOF spring-dashpot element concentratedat the structure–foundation interface.
Step 5: Depth-varying input seismic displacements—Displace-ment time histories describing the free-field response at every1 m of depth were calculated from site-response analysis andemployed as the vertically propagating asynchronous input motionfor the piles.
Step 6: Effect of liquefaction on soil stiffness—Pore pressure resultsand liquefaction prediction at specific layers led to a modification (i.e.,a reduction to 10% of their initial stiffness) of the dynamic Winklerspring values at the pile–soil interface based on [34].
Step 7: Simultaneous 2D earthquake excitation—Dynamic analy-sis of the SSI system was performed in the time domain simulta-neously using both components of the ground excitation as derivedin Steps 1–5.
Step 8: Angle of incidence of the incoming seismic wavefield—Inorder to achieve a realistic simulation of the SSI response during theearthquake, input motion orientation was aligned with theobserved directivity of the earthquake event, resulting in a 301rotation of the set of ground motions as compared to the structure’smain axes. It is noted that the orientation of the recorded long-itudinal motion was at an angle of 651 with respect to north.
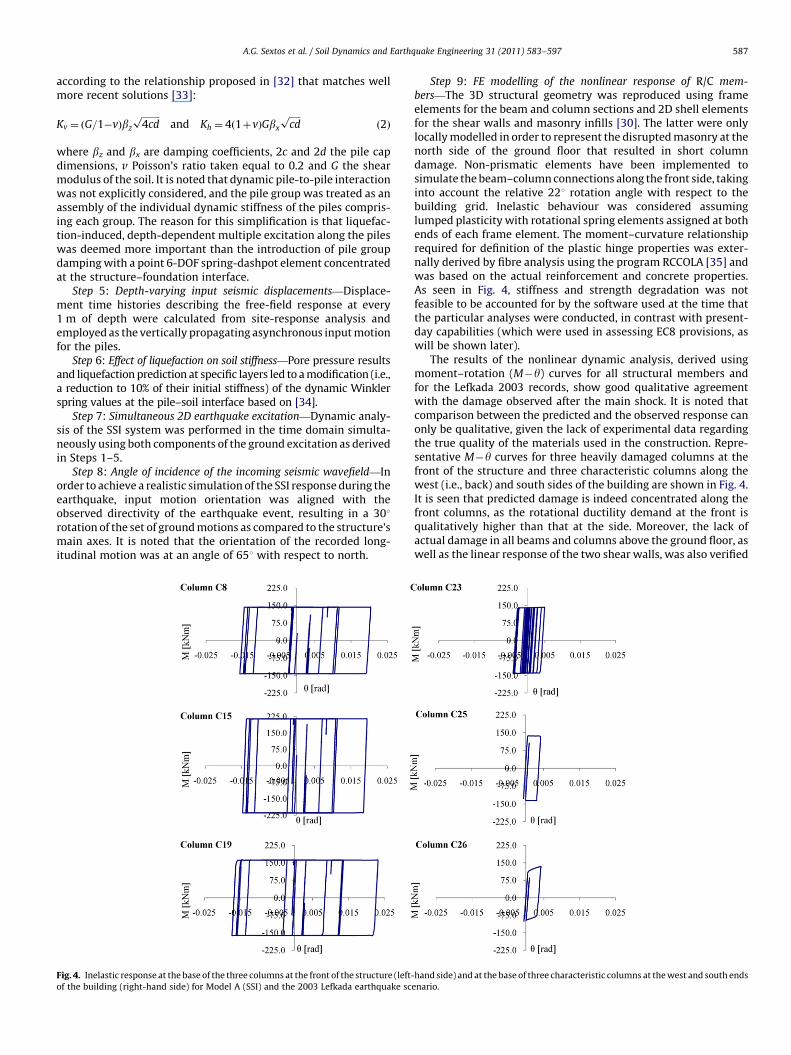
Fig. 4. Inelastic response at the base of the three columns at the front of the structure (left-
of the building (right-hand side) for Model A (SSI) and the 2003 Lefkada earthquake sc
Step 9: FE modelling of the nonlinear response of R/C mem-
bers—The 3D structural geometry was reproduced using frameelements for the beam and column sections and 2D shell elementsfor the shear walls and masonry infills [30]. The latter were onlylocally modelled in order to represent the disrupted masonry at thenorth side of the ground floor that resulted in short columndamage. Non-prismatic elements have been implemented tosimulate the beam–column connections along the front side, takinginto account the relative 221 rotation angle with respect to thebuilding grid. Inelastic behaviour was considered assuminglumped plasticity with rotational spring elements assigned at bothends of each frame element. The moment–curvature relationshiprequired for definition of the plastic hinge properties was exter-nally derived by fibre analysis using the program RCCOLA [35] andwas based on the actual reinforcement and concrete properties.As seen in Fig. 4, stiffness and strength degradation was notfeasible to be accounted for by the software used at the time thatthe particular analyses were conducted, in contrast with present-day capabilities (which were used in assessing EC8 provisions, aswill be shown later).
The results of the nonlinear dynamic analysis, derived usingmoment–rotation (M�y) curves for all structural members andfor the Lefkada 2003 records, show good qualitative agreementwith the damage observed after the main shock. It is noted thatcomparison between the predicted and the observed response canonly be qualitative, given the lack of experimental data regardingthe true quality of the materials used in the construction. Repre-sentative M�y curves for three heavily damaged columns at thefront of the structure and three characteristic columns along thewest (i.e., back) and south sides of the building are shown in Fig. 4.It is seen that predicted damage is indeed concentrated along thefront columns, as the rotational ductility demand at the front isqualitatively higher than that at the side. Moreover, the lack ofactual damage in all beams and columns above the ground floor, aswell as the linear response of the two shear walls, was also verified
hand side) and at the base of three characteristic columns at the west and south ends
enario.
A.G. Sextos et al. / Soil Dynamics and Earthquake Engineering 31 (2011) 583–597588
numerically. Based on the above, Model A is in principle consideredto yield a realistic representation of the actual soil–structureconditions.
5.2. Prediction of the observed damage ignoring soil–foundation–
structure interaction and liquefaction effects (Model B)
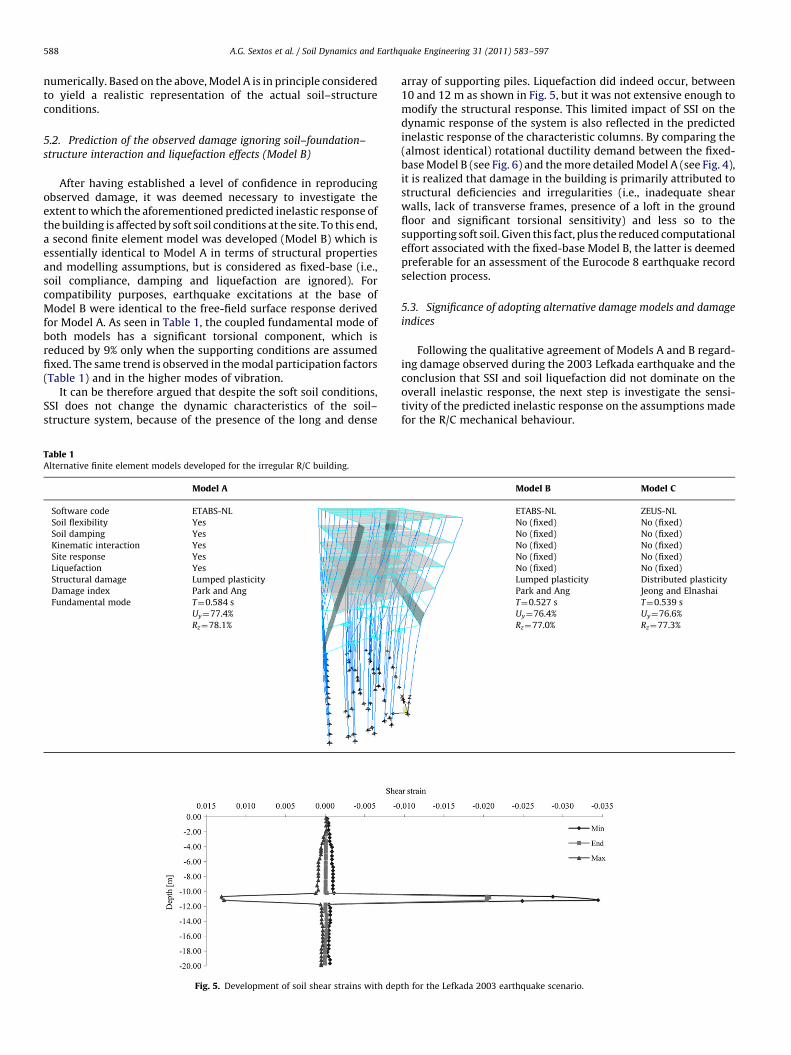
After having established a level of confidence in reproducingobserved damage, it was deemed necessary to investigate theextent to which the aforementioned predicted inelastic response ofthe building is affected by soft soil conditions at the site. To this end,a second finite element model was developed (Model B) which isessentially identical to Model A in terms of structural propertiesand modelling assumptions, but is considered as fixed-base (i.e.,soil compliance, damping and liquefaction are ignored). Forcompatibility purposes, earthquake excitations at the base ofModel B were identical to the free-field surface response derivedfor Model A. As seen in Table 1, the coupled fundamental mode ofboth models has a significant torsional component, which isreduced by 9% only when the supporting conditions are assumedfixed. The same trend is observed in the modal participation factors(Table 1) and in the higher modes of vibration.
It can be therefore argued that despite the soft soil conditions,SSI does not change the dynamic characteristics of the soil–structure system, because of the presence of the long and dense
Table 1Alternative finite element models developed for the irregular R/C building.
Model A
Software code ETABS-NL
Soil flexibility Yes
Soil damping Yes
Kinematic interaction Yes
Site response Yes
Liquefaction Yes
Structural damage Lumped plasticity
Damage index Park and Ang
Fundamental mode T¼0.584 s
Uy¼77.4%
Rz¼78.1%
Fig. 5. Development of soil shear strains with dep
array of supporting piles. Liquefaction did indeed occur, between10 and 12 m as shown in Fig. 5, but it was not extensive enough tomodify the structural response. This limited impact of SSI on thedynamic response of the system is also reflected in the predictedinelastic response of the characteristic columns. By comparing the(almost identical) rotational ductility demand between the fixed-base Model B (see Fig. 6) and the more detailed Model A (see Fig. 4),it is realized that damage in the building is primarily attributed tostructural deficiencies and irregularities (i.e., inadequate shearwalls, lack of transverse frames, presence of a loft in the groundfloor and significant torsional sensitivity) and less so to thesupporting soft soil. Given this fact, plus the reduced computationaleffort associated with the fixed-base Model B, the latter is deemedpreferable for an assessment of the Eurocode 8 earthquake recordselection process.
5.3. Significance of adopting alternative damage models and damage
indices
Following the qualitative agreement of Models A and B regard-ing damage observed during the 2003 Lefkada earthquake and theconclusion that SSI and soil liquefaction did not dominate on theoverall inelastic response, the next step is investigate the sensi-tivity of the predicted inelastic response on the assumptions madefor the R/C mechanical behaviour.
Model B Model C
ETABS-NL ZEUS-NL
No (fixed) No (fixed)
No (fixed) No (fixed)
No (fixed) No (fixed)
No (fixed) No (fixed)
No (fixed) No (fixed)
Lumped plasticity Distributed plasticity
Park and Ang Jeong and Elnashai
T¼0.527 s T¼0.539 s
Uy¼76.4% Uy¼76.6%
Rz¼77.0% Rz¼77.3%
th for the Lefkada 2003 earthquake scenario.
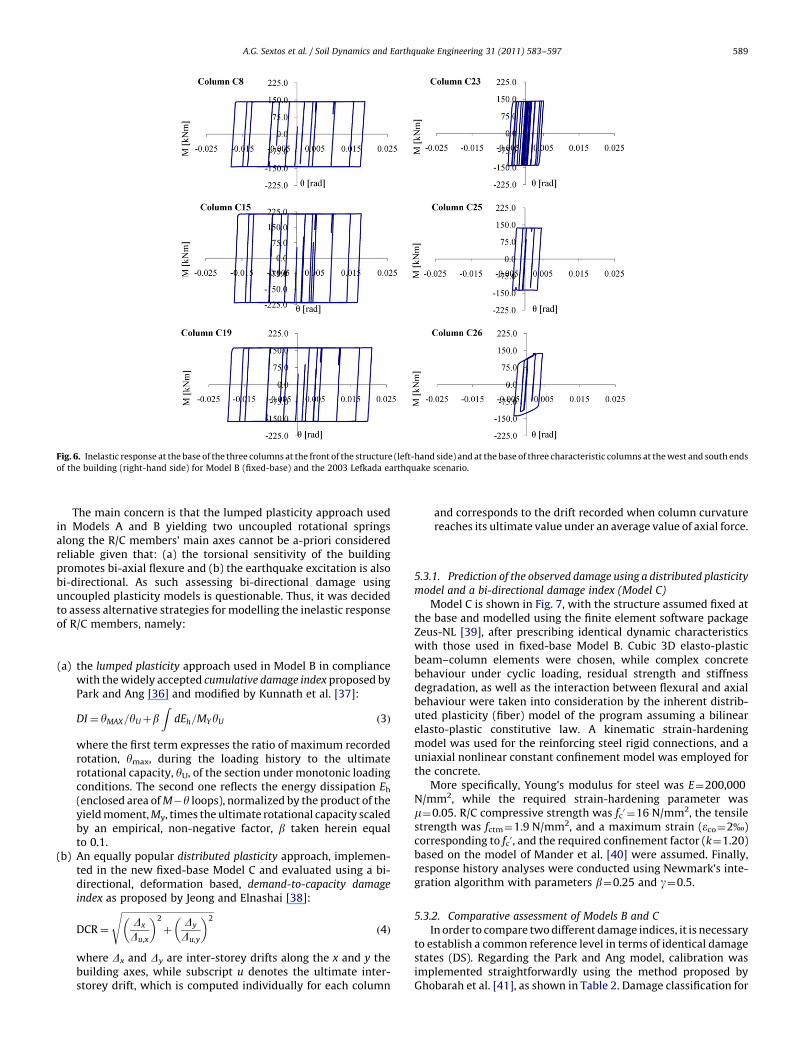
Fig. 6. Inelastic response at the base of the three columns at the front of the structure (left-hand side) and at the base of three characteristic columns at the west and south ends
of the building (right-hand side) for Model B (fixed-base) and the 2003 Lefkada earthquake scenario.
A.G. Sextos et al. / Soil Dynamics and Earthquake Engineering 31 (2011) 583–597 589
The main concern is that the lumped plasticity approach usedin Models A and B yielding two uncoupled rotational springsalong the R/C members’ main axes cannot be a-priori consideredreliable given that: (a) the torsional sensitivity of the buildingpromotes bi-axial flexure and (b) the earthquake excitation is alsobi-directional. As such assessing bi-directional damage usinguncoupled plasticity models is questionable. Thus, it was decidedto assess alternative strategies for modelling the inelastic responseof R/C members, namely:
(a)
the lumped plasticity approach used in Model B in compliancewith the widely accepted cumulative damage index proposed byPark and Ang [36] and modified by Kunnath et al. [37]:DI¼ yMAX=yUþbZ
dEh=MYyU ð3Þ
where the first term expresses the ratio of maximum recordedrotation, ymax, during the loading history to the ultimaterotational capacity, yU, of the section under monotonic loadingconditions. The second one reflects the energy dissipation Eh
(enclosed area of M�y loops), normalized by the product of theyield moment, My, times the ultimate rotational capacity scaledby an empirical, non-negative factor, b taken herein equalto 0.1.
(b)
An equally popular distributed plasticity approach, implemen-ted in the new fixed-base Model C and evaluated using a bi-directional, deformation based, demand-to-capacity damageindex as proposed by Jeong and Elnashai [38]:
DCR¼
ffiffiffiffiffiffiffiffiffiffiffiffiffiffiffiffiffiffiffiffiffiffiffiffiffiffiffiffiffiffiffiffiffiffiffiffiffiffiffiffiDx
Du,x
� �2
þDy
Du,y
� �2s
ð4Þ
where Dx and Dy are inter-storey drifts along the x and y thebuilding axes, while subscript u denotes the ultimate inter-storey drift, which is computed individually for each column
and corresponds to the drift recorded when column curvaturereaches its ultimate value under an average value of axial force.
5.3.1. Prediction of the observed damage using a distributed plasticity
model and a bi-directional damage index (Model C)
Model C is shown in Fig. 7, with the structure assumed fixed atthe base and modelled using the finite element software packageZeus-NL [39], after prescribing identical dynamic characteristicswith those used in fixed-base Model B. Cubic 3D elasto-plasticbeam–column elements were chosen, while complex concretebehaviour under cyclic loading, residual strength and stiffnessdegradation, as well as the interaction between flexural and axialbehaviour were taken into consideration by the inherent distrib-uted plasticity (fiber) model of the program assuming a bilinearelasto-plastic constitutive law. A kinematic strain-hardeningmodel was used for the reinforcing steel rigid connections, and auniaxial nonlinear constant confinement model was employed forthe concrete.
More specifically, Young’s modulus for steel was E¼200,000N/mm2, while the required strain-hardening parameter wasm¼0.05. R/C compressive strength was fc
0 ¼16 N/mm2, the tensilestrength was fctm¼1.9 N/mm2, and a maximum strain (eco¼2%)corresponding to fc
0, and the required confinement factor (k¼1.20)based on the model of Mander et al. [40] were assumed. Finally,response history analyses were conducted using Newmark’s inte-gration algorithm with parameters b¼0.25 and g¼0.5.
5.3.2. Comparative assessment of Models B and C
In order to compare two different damage indices, it is necessaryto establish a common reference level in terms of identical damagestates (DS). Regarding the Park and Ang model, calibration wasimplemented straightforwardly using the method proposed byGhobarah et al. [41], as shown in Table 2. Damage classification for
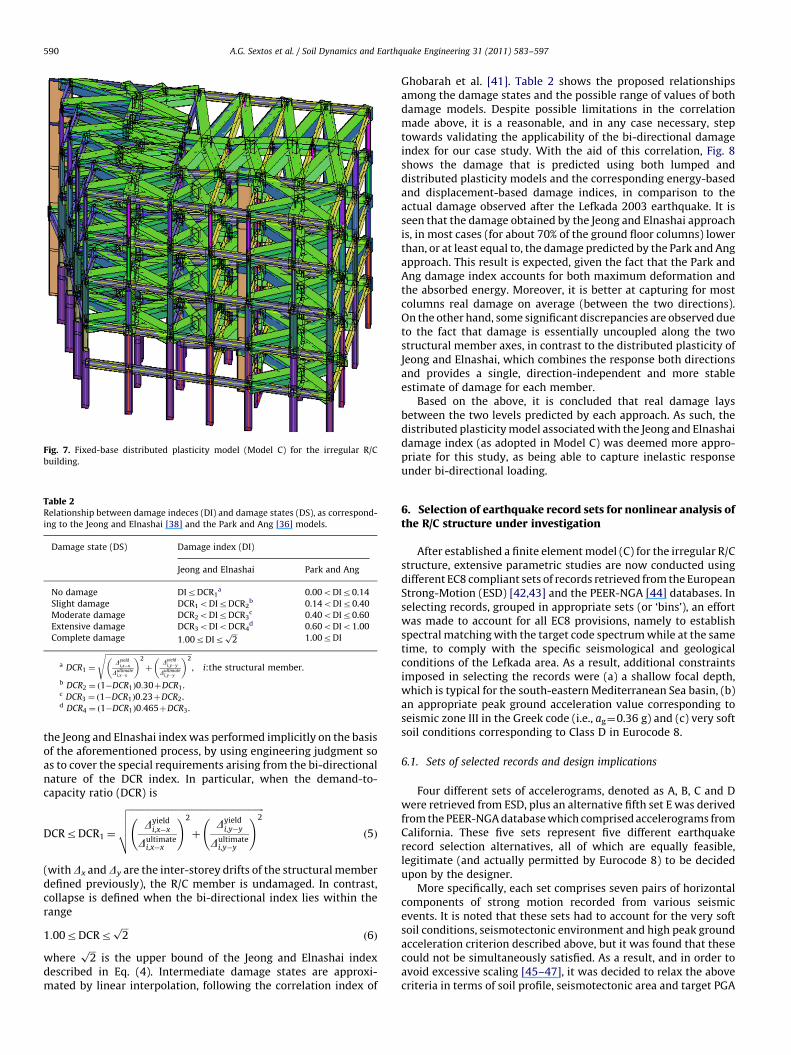
Table 2Relationship between damage indeces (DI) and damage states (DS), as correspond-
ing to the Jeong and Elnashai [38] and the Park and Ang [36] models.
Damage state (DS) Damage index (DI)
Jeong and Elnashai Park and Ang
No damage DIrDCR1a 0.00oDIr0.14
Slight damage DCR1oDIrDCR2b 0.14oDIr0.40
Moderate damage DCR2oDIrDCR3c 0.40oDIr0.60
Extensive damage DCR3oDIoDCR4d 0.60oDIo1.00
Complete damage 1:00rDIrffiffiffi2p
1.00rDI
a DCR1 ¼
ffiffiffiffiffiffiffiffiffiffiffiffiffiffiffiffiffiffiffiffiffiffiffiffiffiffiffiffiffiffiffiffiffiffiffiffiffiffiffiffiffiffiffiffiffiffiffiDyield
i,x�x
Dultimatei,x�x
� �2
þDyield
i,y�y
Dultimatei,y�y
� �2s
, i:the structural member.
b DCR2 ¼ ð1�DCR1Þ0:30þDCR1.c DCR3 ¼ ð1�DCR1Þ0:23þDCR2.d DCR4 ¼ ð1�DCR1Þ0:465þDCR3.
Fig. 7. Fixed-base distributed plasticity model (Model C) for the irregular R/C
building.
A.G. Sextos et al. / Soil Dynamics and Earthquake Engineering 31 (2011) 583–597590
the Jeong and Elnashai index was performed implicitly on the basisof the aforementioned process, by using engineering judgment soas to cover the special requirements arising from the bi-directionalnature of the DCR index. In particular, when the demand-to-capacity ratio (DCR) is
DCRrDCR1 ¼
ffiffiffiffiffiffiffiffiffiffiffiffiffiffiffiffiffiffiffiffiffiffiffiffiffiffiffiffiffiffiffiffiffiffiffiffiffiffiffiffiffiffiffiffiffiffiffiffiffiffiffiffiffiffiffiffiffiffiffiDyield
i,x�x
Dultimatei,x�x
!2
þDyield
i,y�y
Dultimatei,y�y
!2vuuut ð5Þ
(withDx andDy are the inter-storey drifts of the structural memberdefined previously), the R/C member is undamaged. In contrast,collapse is defined when the bi-directional index lies within therange
1:00rDCRrffiffiffi2p
ð6Þ
whereffiffiffi2p
is the upper bound of the Jeong and Elnashai indexdescribed in Eq. (4). Intermediate damage states are approxi-mated by linear interpolation, following the correlation index of
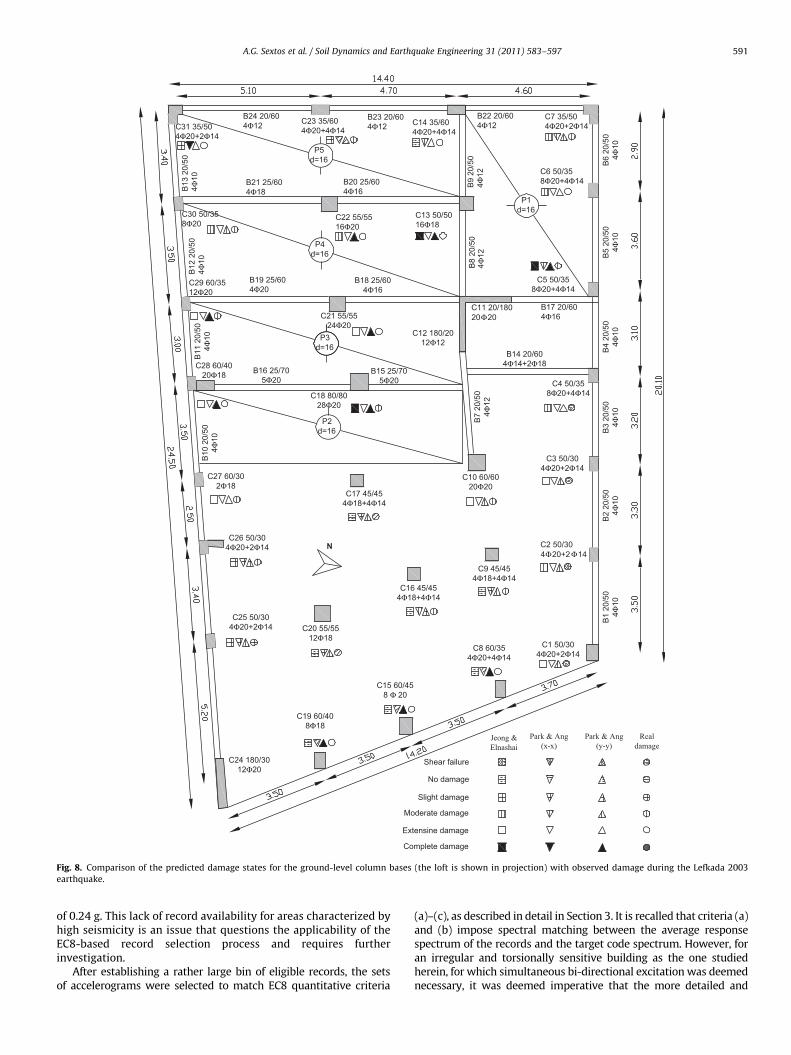
Ghobarah et al. [41]. Table 2 shows the proposed relationshipsamong the damage states and the possible range of values of bothdamage models. Despite possible limitations in the correlationmade above, it is a reasonable, and in any case necessary, steptowards validating the applicability of the bi-directional damageindex for our case study. With the aid of this correlation, Fig. 8shows the damage that is predicted using both lumped anddistributed plasticity models and the corresponding energy-basedand displacement-based damage indices, in comparison to theactual damage observed after the Lefkada 2003 earthquake. It isseen that the damage obtained by the Jeong and Elnashai approachis, in most cases (for about 70% of the ground floor columns) lowerthan, or at least equal to, the damage predicted by the Park and Angapproach. This result is expected, given the fact that the Park andAng damage index accounts for both maximum deformation andthe absorbed energy. Moreover, it is better at capturing for mostcolumns real damage on average (between the two directions).On the other hand, some significant discrepancies are observed dueto the fact that damage is essentially uncoupled along the twostructural member axes, in contrast to the distributed plasticity ofJeong and Elnashai, which combines the response both directionsand provides a single, direction-independent and more stableestimate of damage for each member.
Based on the above, it is concluded that real damage laysbetween the two levels predicted by each approach. As such, thedistributed plasticity model associated with the Jeong and Elnashaidamage index (as adopted in Model C) was deemed more appro-priate for this study, as being able to capture inelastic responseunder bi-directional loading.
6. Selection of earthquake record sets for nonlinear analysis ofthe R/C structure under investigation
After established a finite element model (C) for the irregular R/Cstructure, extensive parametric studies are now conducted usingdifferent EC8 compliant sets of records retrieved from the EuropeanStrong-Motion (ESD) [42,43] and the PEER-NGA [44] databases. Inselecting records, grouped in appropriate sets (or ‘bins’), an effortwas made to account for all EC8 provisions, namely to establishspectral matching with the target code spectrum while at the sametime, to comply with the specific seismological and geologicalconditions of the Lefkada area. As a result, additional constraintsimposed in selecting the records were (a) a shallow focal depth,which is typical for the south-eastern Mediterranean Sea basin, (b)an appropriate peak ground acceleration value corresponding toseismic zone III in the Greek code (i.e., ag¼0.36 g) and (c) very softsoil conditions corresponding to Class D in Eurocode 8.
6.1. Sets of selected records and design implications
Four different sets of accelerograms, denoted as A, B, C and Dwere retrieved from ESD, plus an alternative fifth set E was derivedfrom the PEER-NGA database which comprised accelerograms fromCalifornia. These five sets represent five different earthquakerecord selection alternatives, all of which are equally feasible,legitimate (and actually permitted by Eurocode 8) to be decidedupon by the designer.
More specifically, each set comprises seven pairs of horizontalcomponents of strong motion recorded from various seismicevents. It is noted that these sets had to account for the very softsoil conditions, seismotectonic environment and high peak groundacceleration criterion described above, but it was found that thesecould not be simultaneously satisfied. As a result, and in order toavoid excessive scaling [45–47], it was decided to relax the abovecriteria in terms of soil profile, seismotectonic area and target PGA
B24 20/604Φ12
B21 25/604Φ18
B20 25/604Φ16
B19 25/604Φ20
B18 25/604Φ16
B16 25/705Φ20
B15 25/705Φ20
B14 20/604Φ14+2Φ18
B17 20/604Φ16
B7
20/5
04Φ
12
B9
20/5
04Φ
12
B1
20/5
04Φ
10B
2 20
/50
4Φ10
B3
20/5
04Φ
10B
4 20
/50
4Φ10
B5
20/5
04Φ
10B
6 20
/50
4Φ10
B10
20/
504Φ
10
C19 60/408Φ18
C15 60/458 Φ 20
C8 60/354Φ20+4Φ14
C20 55/5512Φ18
C16 45/454Φ18+4Φ14
C9 45/454Φ18+4Φ14
C17 45/454Φ18+4Φ14
C24 180/3012Φ20
C25 50/304Φ20+2Φ14
C26 50/304Φ20+2Φ14
C27 60/302Φ18
C10 60/6020Φ20
C1 50/304Φ20+2Φ14
C4 50/358Φ20+4Φ14
C12 180/2012Φ12
C11 20/18020Φ20
C28 60/4020Φ18
C31 35/504Φ20+2Φ14
C22 55/5516Φ20
C21 55/5524Φ20
C18 80/8028Φ20
C23 35/604Φ20+4Φ14
C14 35/604Φ20+4Φ14
C13 50/5016Φ18
C29 60/3512Φ20
C30 50/358Φ20
C2 50/304Φ20+2 Φ14
C3 50/304Φ20+2Φ14
C5 50/358Φ20+4Φ14
C6 50/358Φ20+4Φ14
C7 35/504Φ20+2Φ14
B11
20/
504Φ
10
B12
20/
504Φ
10
B13
20/
504Φ
10
B23 20/604Φ12
B22 20/604Φ12
P2d=16
P3d=16
P4d=16
P5d=16
P1d=16
Slight damage
Moderate damage
Extensine damage
Complete damage
No damage
Shear failure
N
Jeong &Elnashai
Park & Ang(x-x)
Park & Ang(y-y)
Realdamage
B8
20/5
04Φ
12
Fig. 8. Comparison of the predicted damage states for the ground-level column bases (the loft is shown in projection) with observed damage during the Lefkada 2003
earthquake.
A.G. Sextos et al. / Soil Dynamics and Earthquake Engineering 31 (2011) 583–597 591
of 0.24 g. This lack of record availability for areas characterized byhigh seismicity is an issue that questions the applicability of theEC8-based record selection process and requires furtherinvestigation.
After establishing a rather large bin of eligible records, the setsof accelerograms were selected to match EC8 quantitative criteria
(a)–(c), as described in detail in Section 3. It is recalled that criteria (a)and (b) impose spectral matching between the average responsespectrum of the records and the target code spectrum. However, foran irregular and torsionally sensitive building as the one studiedherein, for which simultaneous bi-directional excitation was deemednecessary, it was deemed imperative that the more detailed and
A.G. Sextos et al. / Soil Dynamics and Earthquake Engineering 31 (2011) 583–597592
demanding matching requirements for bi-directional loading pre-scribed in EC8-Part 2 [6] were used. In particular, SRSS responsespectra corresponding to each pair of horizontal components of theselected records were computed, and mean spectra for all seven SRSS-combined spectra were then calculated. It has to be noted that thesetwo approaches (i.e., either matching the mean spectrum of the sevenpairs of records to 0.9 of the target code spectrum or matching themean spectrum of the SRSS spectra of the seven pairs of records to the1.3 times the code spectrum) are numerically equivalent [48]. Thesespectra were finally compared with the reference 5% damped elasticcode spectrum (augmented by a factor 1.3) in the period rangebetween 0.2T1 and 2T1 (as prescribed in part 1 of Eurocode 8), whereT1¼0.539 s is the fundamental period of the building under study.
Based on all these considerations, set A comprised seven pairs ofaccelerograms recorded on soft soils from South Europe and theMiddle East and generally characterized by high values of PGA, achoice that seems to be closer to all the above criteria and possiblyreflects the first decision of an ordinary design office. In addition, setsB–D include seven pairs of horizontal components of strong motionsselected on the basis of their epicentral distance R, a selectionparameter not explicitly imposed by EC8, but commonly adoptedin many studies. In particular, the records of sets B–D werecharacterized by distances RZ35 km, 15rRr35 km and Rr15 km,respectively. This distinction was necessary, not because it constitutesa source of structural variability (actually there is evidence to thecontrary [2,13]), but because the complexity of the structure and the(bi-directional) excitation is such that cannot permit taking thisindependency for granted. Finally, set E was formed using near-field(Rr15 km) records from soft soils in California, as a means to
Table 3Selected earthquake records for set A(ESD).
Event (country) Date Station name
Gazli (Uzbekistan) 17.05.1976 Gazli
Montenegro 15.04.1979 Petrovac-Hotel Oliva
Tabas (Iran) 16.09.1978 Tabas
Erzincan (Turkey) 13.03.1992 Erzincan-Meteorologij
Kocaeli (Turkey) 17.08.1999 Duzce-Meteorologij
Duzce (Turkey) 12.11.1999 Bolu-Bayindirilik
Ionian (Greece) 11.04.1973 Lefkada-OTE Building
Table 4Selected earthquake records for set B(ESD).
Event (country) Date Station name M
Friuli (Italy) 06.05.1976 Barcis 6
Campano L. (Italy) 23.11.1980 Mercato San Sev. 6
Manjil (Iran) 20.06.1990 Abhar 7
Tabas (Iran) 16.09.1978 Tabas 7
Kocaeli (Turkey) 17.08.1999 Duzce-Meteorologij 7
Duzce (Turkey) 12.11.1999 Bolu-Bayindirilik 7
Spitak (Armenia) 07.12.1988 Gukasian 6
Table 5Selected earthquake records for set C(ESD).
Event (country) Date Station name
Gazli (Uzbekistan) 17.05.1976 Gazli
Ionian (Greece) 11.04.1973 Lefkada-OTE Build.
Alkion (Greece) 24.02.1981 Korinthos-OTE Build.
Campano L. (Italy) 23.11.1980 Sturno
Kocaeli (Turkey) 17.08.1999 Yarimca-Petkim
Friuli (Italy) 06.05.1976 Tolmazo-Diga Ambiest
Montenegro 15.04.1979 Petrovac-Hotel Oliva
investigate possible systematic differences in the structural responseobtained when using ground motions from western North Americaversus South Europe and the Middle East.
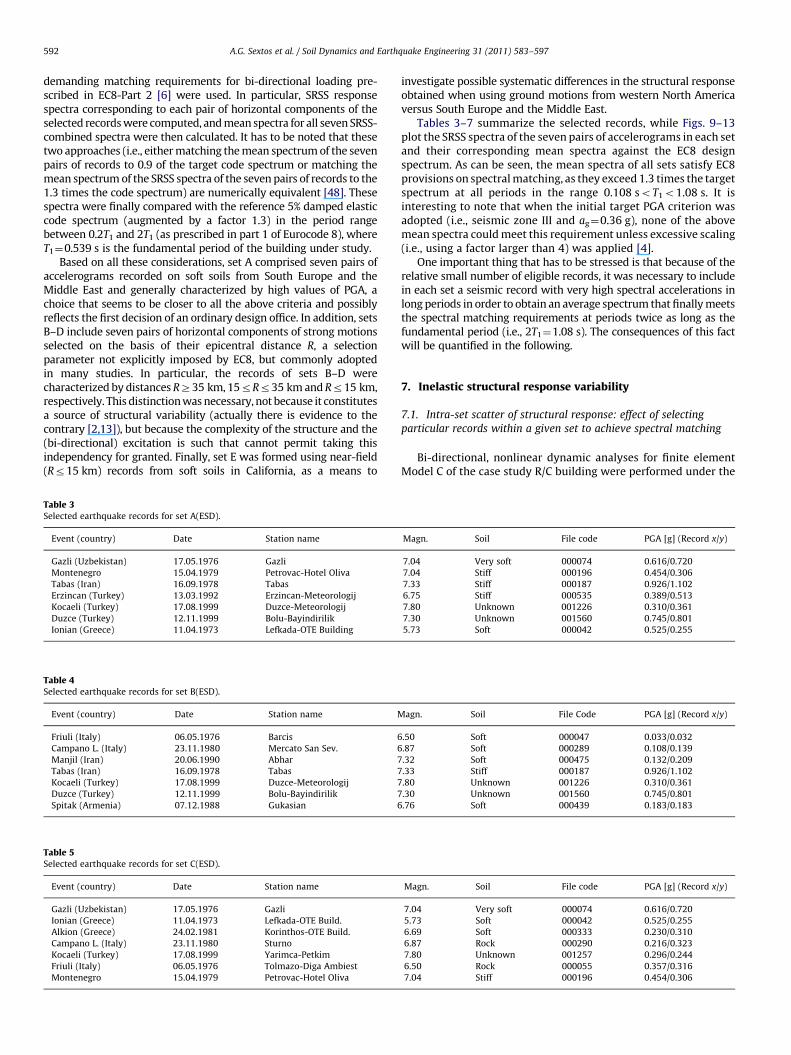
Tables 3–7 summarize the selected records, while Figs. 9–13plot the SRSS spectra of the seven pairs of accelerograms in each setand their corresponding mean spectra against the EC8 designspectrum. As can be seen, the mean spectra of all sets satisfy EC8provisions on spectral matching, as they exceed 1.3 times the targetspectrum at all periods in the range 0.108 soT1o1.08 s. It isinteresting to note that when the initial target PGA criterion wasadopted (i.e., seismic zone III and ag¼0.36 g), none of the abovemean spectra could meet this requirement unless excessive scaling(i.e., using a factor larger than 4) was applied [4].
One important thing that has to be stressed is that because of therelative small number of eligible records, it was necessary to includein each set a seismic record with very high spectral accelerations inlong periods in order to obtain an average spectrum that finally meetsthe spectral matching requirements at periods twice as long as thefundamental period (i.e., 2T1¼1.08 s). The consequences of this factwill be quantified in the following.
7. Inelastic structural response variability
7.1. Intra-set scatter of structural response: effect of selecting
particular records within a given set to achieve spectral matching
Bi-directional, nonlinear dynamic analyses for finite elementModel C of the case study R/C building were performed under the
Magn. Soil File code PGA [g] (Record x/y)
7.04 Very soft 000074 0.616/0.720
7.04 Stiff 000196 0.454/0.306
7.33 Stiff 000187 0.926/1.102
6.75 Stiff 000535 0.389/0.513
7.80 Unknown 001226 0.310/0.361
7.30 Unknown 001560 0.745/0.801
5.73 Soft 000042 0.525/0.255
agn. Soil File Code PGA [g] (Record x/y)
.50 Soft 000047 0.033/0.032
.87 Soft 000289 0.108/0.139
.32 Soft 000475 0.132/0.209
.33 Stiff 000187 0.926/1.102
.80 Unknown 001226 0.310/0.361
.30 Unknown 001560 0.745/0.801
.76 Soft 000439 0.183/0.183
Magn. Soil File code PGA [g] (Record x/y)
7.04 Very soft 000074 0.616/0.720
5.73 Soft 000042 0.525/0.255
6.69 Soft 000333 0.230/0.310
6.87 Rock 000290 0.216/0.323
7.80 Unknown 001257 0.296/0.244
6.50 Rock 000055 0.357/0.316
7.04 Stiff 000196 0.454/0.306
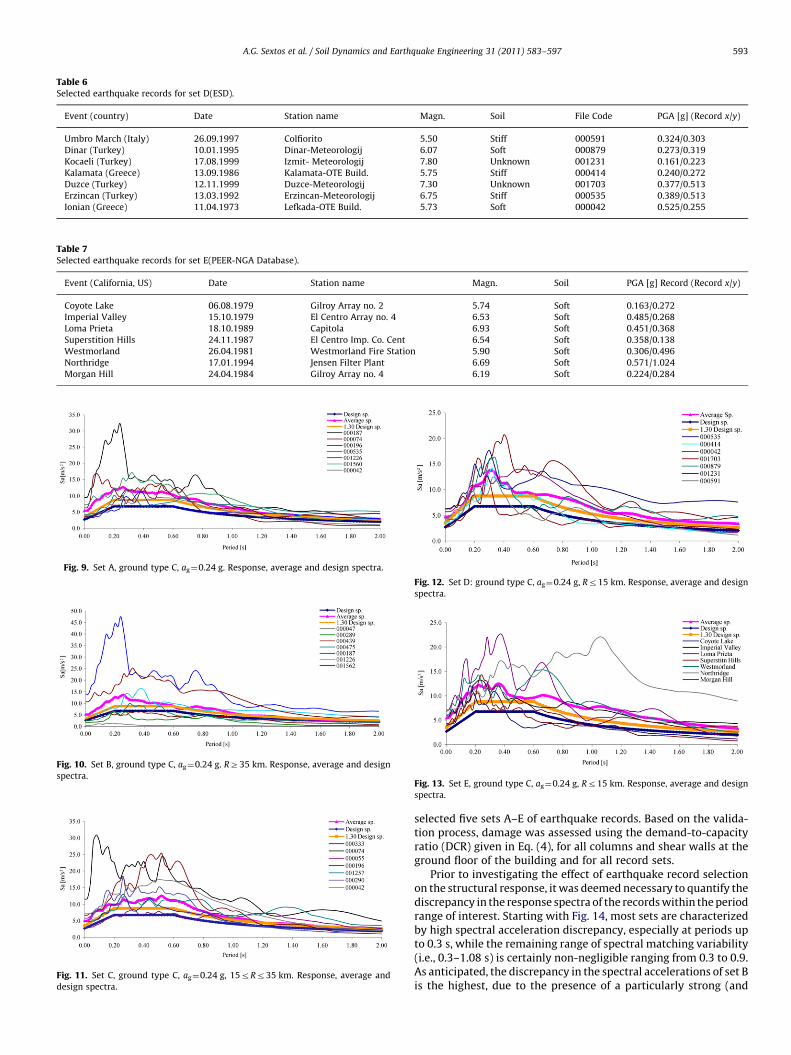
Table 6Selected earthquake records for set D(ESD).
Event (country) Date Station name Magn. Soil File Code PGA [g] (Record x/y)
Umbro March (Italy) 26.09.1997 Colfiorito 5.50 Stiff 000591 0.324/0.303
Dinar (Turkey) 10.01.1995 Dinar-Meteorologij 6.07 Soft 000879 0.273/0.319
Kocaeli (Turkey) 17.08.1999 Izmit- Meteorologij 7.80 Unknown 001231 0.161/0.223
Kalamata (Greece) 13.09.1986 Kalamata-OTE Build. 5.75 Stiff 000414 0.240/0.272
Duzce (Turkey) 12.11.1999 Duzce-Meteorologij 7.30 Unknown 001703 0.377/0.513
Erzincan (Turkey) 13.03.1992 Erzincan-Meteorologij 6.75 Stiff 000535 0.389/0.513
Ionian (Greece) 11.04.1973 Lefkada-OTE Build. 5.73 Soft 000042 0.525/0.255
Table 7Selected earthquake records for set E(PEER-NGA Database).
Event (California, US) Date Station name Magn. Soil PGA [g] Record (Record x/y)
Coyote Lake 06.08.1979 Gilroy Array no. 2 5.74 Soft 0.163/0.272
Imperial Valley 15.10.1979 El Centro Array no. 4 6.53 Soft 0.485/0.268
Loma Prieta 18.10.1989 Capitola 6.93 Soft 0.451/0.368
Superstition Hills 24.11.1987 El Centro Imp. Co. Cent 6.54 Soft 0.358/0.138
Westmorland 26.04.1981 Westmorland Fire Station 5.90 Soft 0.306/0.496
Northridge 17.01.1994 Jensen Filter Plant 6.69 Soft 0.571/1.024
Morgan Hill 24.04.1984 Gilroy Array no. 4 6.19 Soft 0.224/0.284
Fig. 9. Set A, ground type C, ag¼0.24 g. Response, average and design spectra.
Fig. 10. Set B, ground type C, ag¼0.24 g. RZ35 km. Response, average and design
spectra.
Fig. 11. Set C, ground type C, ag¼0.24 g, 15rRr35 km. Response, average and
design spectra.
Fig. 12. Set D: ground type C, ag¼0.24 g, Rr15 km. Response, average and design
spectra.
Fig. 13. Set E, ground type C, ag¼0.24 g, Rr15 km. Response, average and design
spectra.
A.G. Sextos et al. / Soil Dynamics and Earthquake Engineering 31 (2011) 583–597 593
selected five sets A–E of earthquake records. Based on the valida-tion process, damage was assessed using the demand-to-capacityratio (DCR) given in Eq. (4), for all columns and shear walls at theground floor of the building and for all record sets.
Prior to investigating the effect of earthquake record selectionon the structural response, it was deemed necessary to quantify thediscrepancy in the response spectra of the records within the periodrange of interest. Starting with Fig. 14, most sets are characterizedby high spectral acceleration discrepancy, especially at periods upto 0.3 s, while the remaining range of spectral matching variability(i.e., 0.3–1.08 s) is certainly non-negligible ranging from 0.3 to 0.9.As anticipated, the discrepancy in the spectral accelerations of set Bis the highest, due to the presence of a particularly strong (and
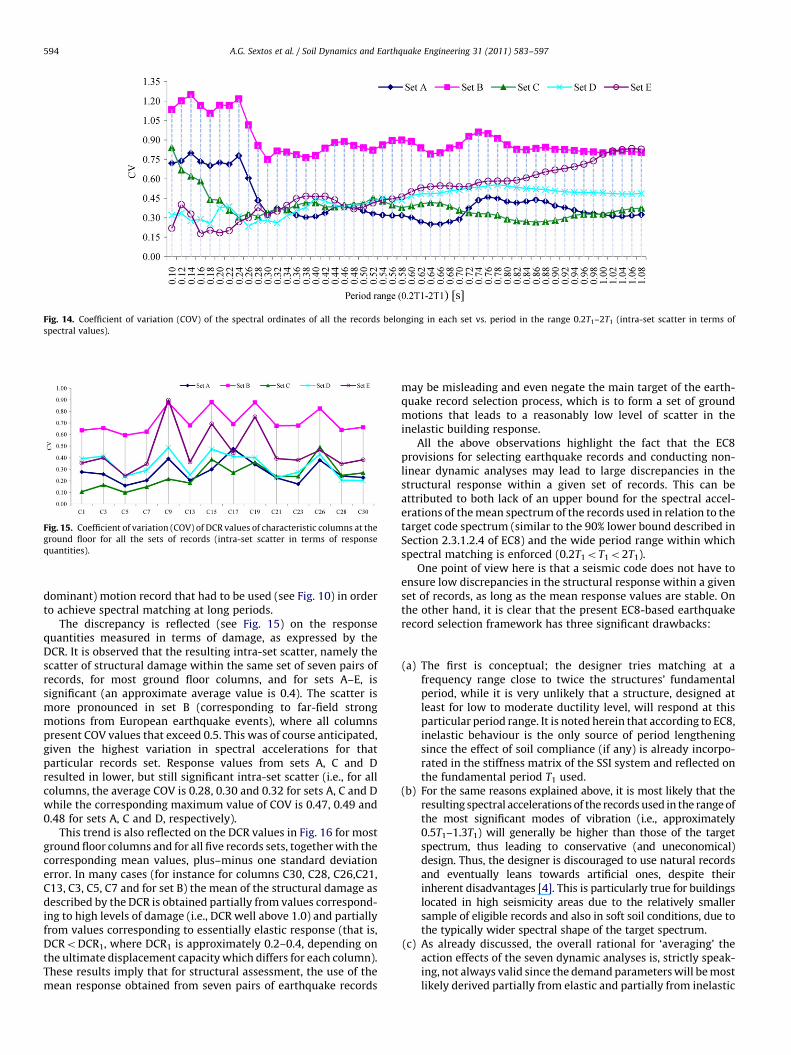
Fig. 14. Coefficient of variation (COV) of the spectral ordinates of all the records belonging in each set vs. period in the range 0.2T1–2T1 (intra-set scatter in terms of
spectral values).
Fig. 15. Coefficient of variation (COV) of DCR values of characteristic columns at the
ground floor for all the sets of records (intra-set scatter in terms of response
quantities).
A.G. Sextos et al. / Soil Dynamics and Earthquake Engineering 31 (2011) 583–597594
dominant) motion record that had to be used (see Fig. 10) in orderto achieve spectral matching at long periods.
The discrepancy is reflected (see Fig. 15) on the responsequantities measured in terms of damage, as expressed by theDCR. It is observed that the resulting intra-set scatter, namely thescatter of structural damage within the same set of seven pairs ofrecords, for most ground floor columns, and for sets A–E, issignificant (an approximate average value is 0.4). The scatter ismore pronounced in set B (corresponding to far-field strongmotions from European earthquake events), where all columnspresent COV values that exceed 0.5. This was of course anticipated,given the highest variation in spectral accelerations for thatparticular records set. Response values from sets A, C and Dresulted in lower, but still significant intra-set scatter (i.e., for allcolumns, the average COV is 0.28, 0.30 and 0.32 for sets A, C and Dwhile the corresponding maximum value of COV is 0.47, 0.49 and0.48 for sets A, C and D, respectively).
This trend is also reflected on the DCR values in Fig. 16 for mostground floor columns and for all five records sets, together with thecorresponding mean values, plus–minus one standard deviationerror. In many cases (for instance for columns C30, C28, C26,C21,C13, C3, C5, C7 and for set B) the mean of the structural damage asdescribed by the DCR is obtained partially from values correspond-ing to high levels of damage (i.e., DCR well above 1.0) and partiallyfrom values corresponding to essentially elastic response (that is,DCRoDCR1, where DCR1 is approximately 0.2–0.4, depending onthe ultimate displacement capacity which differs for each column).These results imply that for structural assessment, the use of themean response obtained from seven pairs of earthquake records
may be misleading and even negate the main target of the earth-quake record selection process, which is to form a set of groundmotions that leads to a reasonably low level of scatter in theinelastic building response.
All the above observations highlight the fact that the EC8provisions for selecting earthquake records and conducting non-linear dynamic analyses may lead to large discrepancies in thestructural response within a given set of records. This can beattributed to both lack of an upper bound for the spectral accel-erations of the mean spectrum of the records used in relation to thetarget code spectrum (similar to the 90% lower bound described inSection 2.3.1.2.4 of EC8) and the wide period range within whichspectral matching is enforced (0.2T1oT1o2T1).
One point of view here is that a seismic code does not have toensure low discrepancies in the structural response within a givenset of records, as long as the mean response values are stable. Onthe other hand, it is clear that the present EC8-based earthquakerecord selection framework has three significant drawbacks:
(a)
The first is conceptual; the designer tries matching at afrequency range close to twice the structures’ fundamentalperiod, while it is very unlikely that a structure, designed atleast for low to moderate ductility level, will respond at thisparticular period range. It is noted herein that according to EC8,inelastic behaviour is the only source of period lengtheningsince the effect of soil compliance (if any) is already incorpo-rated in the stiffness matrix of the SSI system and reflected onthe fundamental period T1 used.(b)
For the same reasons explained above, it is most likely that theresulting spectral accelerations of the records used in the range ofthe most significant modes of vibration (i.e., approximately0.5T1–1.3T1) will generally be higher than those of the targetspectrum, thus leading to conservative (and uneconomical)design. Thus, the designer is discouraged to use natural recordsand eventually leans towards artificial ones, despite theirinherent disadvantages [4]. This is particularly true for buildingslocated in high seismicity areas due to the relatively smallersample of eligible records and also in soft soil conditions, due tothe typically wider spectral shape of the target spectrum.(c)
As already discussed, the overall rational for ‘averaging’ theaction effects of the seven dynamic analyses is, strictly speak-ing, not always valid since the demand parameters will be mostlikely derived partially from elastic and partially from inelastic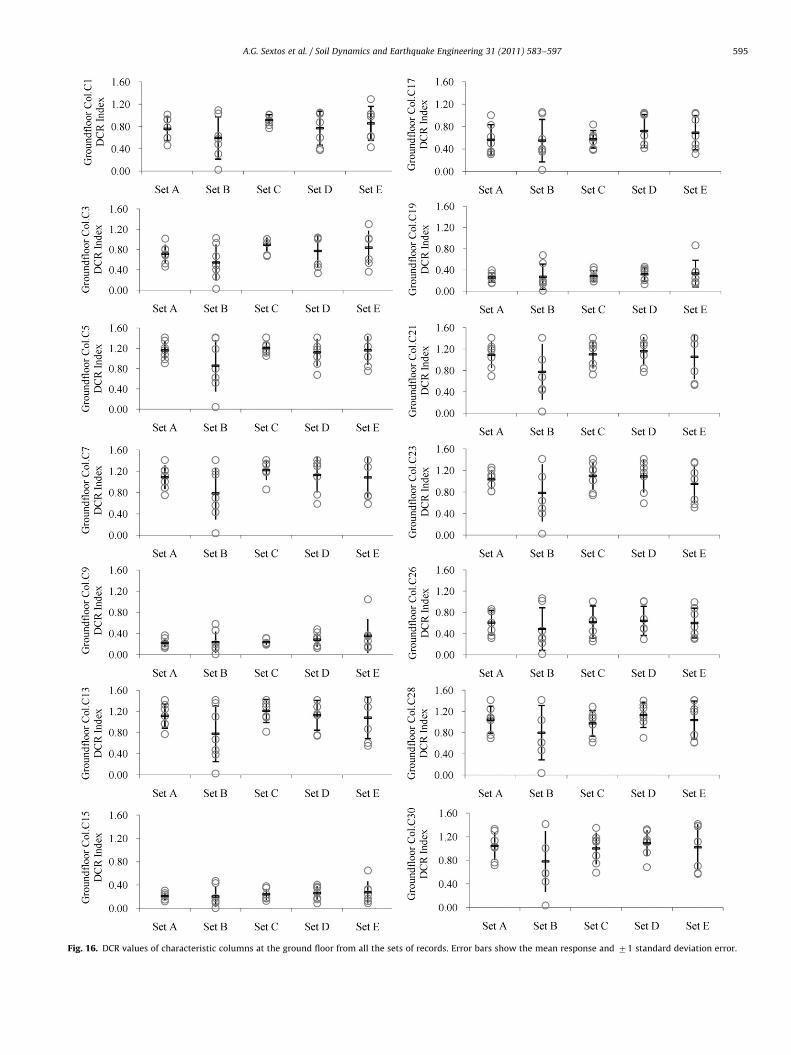
Fig. 16. DCR values of characteristic columns at the ground floor from all the sets of records. Error bars show the mean response and 71 standard deviation error.
A.G. Sextos et al. / Soil Dynamics and Earthquake Engineering 31 (2011) 583–597 595
A.G. Sextos et al. / Soil Dynamics and Earthquake Engineering 31 (2011) 583–597596
analysis. This is also particularly true for stresses and deforma-tions, as they do not increase proportionally with earthquakeintensity.
Fig. 17. Coefficient of variation (COV) of the mean DCR values of characteristic
columns at the ground floor for all the sets of records, calculated for three different
groups of record sets (inter-set scatter in terms of response results).
All the above reasons point supplementing the EC8 earthquakerecord selection provisions by some additional guidance related to(i) introduction of an upper bound for the spectral ordinates of themean of the 5% damped elastic spectrum calculated from the seventime histories, so that it cannot exceed the corresponding values ofthe 5% damped EC8 elastic response spectrum; (ii) use of themedian instead of the mean of the structural response and (iii)relaxation of the period range within which spectral matching isforeseen, especially towards the long period bound 2T1. It is notedthat the latter long period bound equals 1.5 in both the latest ASCE07-10 [49] and EC8-Part 2 [6] codes.
It is also interesting to note that scatter in the spectralaccelerations of the records used in low periods (i.e., 1.0oCOVo1.2 for To0.3 s and set B as shown in Fig. 14) is not proportional toscatter of the inelastic response of the individual structuralmembers (0.6oCOVo0.85 also for set B in Fig. 15). This is because85% of the modal mass is activated in periods higher than 0.3 s, andthe contribution of higher modes close to T¼0.3 s is insignificant.This in turn points to the conclusion that the lower bound (i.e.,0.2T1) prescribed for spectral matching should also be seen inconjunction with the modal participation factors of the structureand should possibly be increased where appropriate.
It is finally noted that in case the designer had decided to form aset consisting of three pairs of records only (also permitted by EC8)and design the structure to the maximum of the three, compared tothe average of the seven, response quantities of each structuralmember, the dispersive effect of using a strong motion record justto ensure spectral matching up to periods as high as 2T1 is expectedto lead to even more conservative seismic designs.
7.2. Inter-set scatter of structural response: effect of selecting different
sets of records using specific M–R and seismotectonic criteria
Results from the nonlinear dynamic analyses were also utilizedto measure inter-set scatter, namely discrepancy in the inelasticresponse of the building for alternative sets of records that wereformed using different selection approaches in terms of theepicentral distance and the seismotectonic environment consid-ered. The motivation for such an investigation is when a seismichazard analysis is not available for the site under study, record setsA–D would all be equally legitimate choices in the design office.Moreover, the lack of a large number of strong motion recordsobtained for soft soils inevitably leads to the utilization of groundmotions from other parts of the world, hence set E also consists analternative.
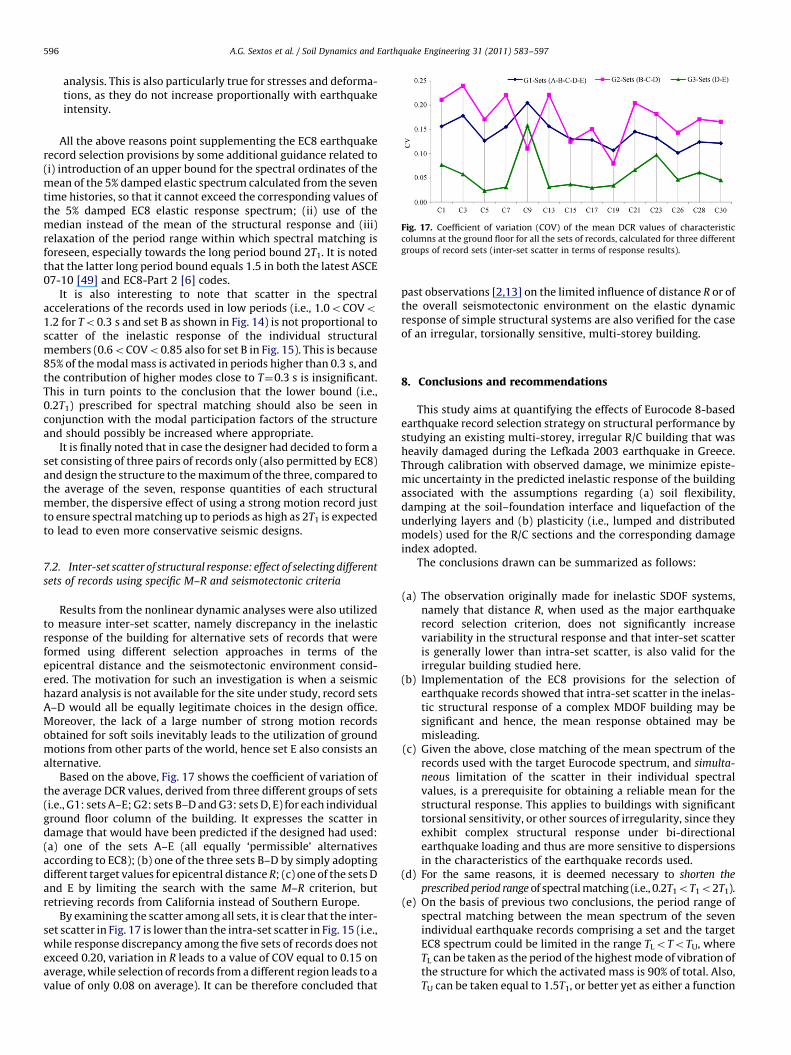
Based on the above, Fig. 17 shows the coefficient of variation ofthe average DCR values, derived from three different groups of sets(i.e., G1: sets A–E; G2: sets B–D and G3: sets D, E) for each individualground floor column of the building. It expresses the scatter indamage that would have been predicted if the designed had used:(a) one of the sets A–E (all equally ‘permissible’ alternativesaccording to EC8); (b) one of the three sets B–D by simply adoptingdifferent target values for epicentral distance R; (c) one of the sets Dand E by limiting the search with the same M–R criterion, butretrieving records from California instead of Southern Europe.
By examining the scatter among all sets, it is clear that the inter-set scatter in Fig. 17 is lower than the intra-set scatter in Fig. 15 (i.e.,while response discrepancy among the five sets of records does notexceed 0.20, variation in R leads to a value of COV equal to 0.15 onaverage, while selection of records from a different region leads to avalue of only 0.08 on average). It can be therefore concluded that
past observations [2,13] on the limited influence of distance R or ofthe overall seismotectonic environment on the elastic dynamicresponse of simple structural systems are also verified for the caseof an irregular, torsionally sensitive, multi-storey building.
8. Conclusions and recommendations
This study aims at quantifying the effects of Eurocode 8-basedearthquake record selection strategy on structural performance bystudying an existing multi-storey, irregular R/C building that washeavily damaged during the Lefkada 2003 earthquake in Greece.Through calibration with observed damage, we minimize episte-mic uncertainty in the predicted inelastic response of the buildingassociated with the assumptions regarding (a) soil flexibility,damping at the soil–foundation interface and liquefaction of theunderlying layers and (b) plasticity (i.e., lumped and distributedmodels) used for the R/C sections and the corresponding damageindex adopted.
The conclusions drawn can be summarized as follows:
(a)
The observation originally made for inelastic SDOF systems,namely that distance R, when used as the major earthquakerecord selection criterion, does not significantly increasevariability in the structural response and that inter-set scatteris generally lower than intra-set scatter, is also valid for theirregular building studied here.(b)
Implementation of the EC8 provisions for the selection ofearthquake records showed that intra-set scatter in the inelas-tic structural response of a complex MDOF building may besignificant and hence, the mean response obtained may bemisleading.(c)
Given the above, close matching of the mean spectrum of therecords used with the target Eurocode spectrum, and simulta-neous limitation of the scatter in their individual spectralvalues, is a prerequisite for obtaining a reliable mean for thestructural response. This applies to buildings with significanttorsional sensitivity, or other sources of irregularity, since theyexhibit complex structural response under bi-directionalearthquake loading and thus are more sensitive to dispersionsin the characteristics of the earthquake records used.
(d)
For the same reasons, it is deemed necessary to shorten theprescribed period range of spectral matching (i.e., 0.2T1oT1o2T1).
(e) On the basis of previous two conclusions, the period range ofspectral matching between the mean spectrum of the sevenindividual earthquake records comprising a set and the targetEC8 spectrum could be limited in the range TLoToTU, whereTL can be taken as the period of the highest mode of vibration ofthe structure for which the activated mass is 90% of total. Also,TU can be taken equal to 1.5T1, or better yet as either a function
A.G. Sextos et al. / Soil Dynamics and Earthquake Engineering 31 (2011) 583–597 597
of the behaviour factor q, or of the ductility [9] if this can beassessed globally and in advance for a complex system.
In closing, the above directions for possible future revisions ofEurocode 8 could be complemented by three additional guidelinesrelated to (a) the introduction of an additional upper bound for thespectral ordinates Sa of the mean spectrum of the records usedwithin the period range specified above, (b) an additional limitpreventing the use of excessive scaling factors and (c) specificclauses for record selection in case where bi-directional loading isto be used. Finally, some further study is needed in order to quantifythe aforementioned limits in terms of other structural configura-tions and different irregularity and ductility levels.
Acknowledgements
The authors wish to thank Dr. N. Theodoulidis of the Institute ofEngineering Seismology and Earthquake Engineering in Thessaloniki,Greece, for his contribution on various seismological aspects relatedto earthquake record selection. They also wish to acknowledge theaid of Mrs. V. Fotaki, Mrs. A. Georgiou and Dr. E. Kirtas for somepreliminary finite element analyses of the building studied.
References
[1] Elnashai AS, McClure DC. Effect of modelling assumptions and input motioncharacteristics on seismic design parameters of RC bridge piers. EarthquakeEngineering and Structural Dynamics 1996;25(5):435–63.
[2] Shome N, Cornell CA, Bazzurro P, Carballo JE. Earthquakes, records andnonlinear responses. Earthquake Spectra 1998;14(3):469–500.
[3] Padgett J, Desroches R. Sensitivity of seismic response and fragility toparameter uncertainty. Journal of Structural Engineering 2007;133(12):1710–8.
[4] Bommer JJ, Acevedo A. The use of real earthquake accelerograms as input todynamic analysis. Journal of Earthquake Engineering 2004;8(1):43–91.
[5] Katsanos EI, Sextos AG, Manolis GD. Selection of earthquake ground motionrecords: a state-of-the-art review from a structural engineering perspective.Soil Dynamics and Earthquake Engineering 2010;30(4):157–69.
[6] CEN. Eurocode 8: design provisions of structures for earthquake resistance.Part 1: general rules, seismic actions and rules for buildings. Part 2: bridges.Final drafts pr EN1998-1 and -2. European Committee for Standardization,Brussels, 2004.
[7] Iervolino I, Cornell CA. Record selection for nonlinear seismic analysis ofstructures. Earthquake Spectra 2005;21(3):685–713.
[8] Baker J, Cornell CA. Spectral shape, epsilon and record selection. EarthquakeEngineering and Structural Dynamics 2006;32:1077–95.
[9] Beyer K, Bommer JJ. Selection and Scaling of real accelerograms for bi-directional loading: a review of current practice and code provisions. Journalof Earthquake Engineering 2007;11(1):13–45.
[10] Huang Y-N, Whittaker AS, Luco N, Hamburger RO. Scaling earthquake groundmotions for the performance-based assessment of buildings. Journal of StructuralEngineering—ASCE 2009;in press, doi:10.1061/(ASCE)ST.1943-541X.0000155.
[11] Hancock J, Bommer JJ, Stafford P. Numbers of scaled and matched accelero-grams required for inelastic dynamic analyses. Earthquake Engineering andStructural Dynamics 2008;37:1585–607.
[12] Bazzurro P, Cornell CA. Seismic hazard analysis of nonlinear structures, I:methodology. Journal of Structural Engineering—ASCE 1994;120(11):3320–44.
[13] Baker J, Cornell CA. A vector-valued ground motion intensity measureconsisting of spectral acceleration and epsilon. Earthquake Engineering andStructural Dynamics 2005;34:1193–217.
[14] Kurama YC, Farrow KT. Ground motion scaling methods for different siteconditions and structure characteristics. Earthquake Engineering and Struc-tural Dynamics 2003;32:2425–50.
[15] Bommer JJ, Scott SG. The feasibility of using real accelerograms for seismicdesign. In: Elnashai AS, Antoniou S, editors. Implications of recent earthquakeson seismic risk; 2000. [Chapter 9].
[16] Kawaga T, Irikura K, Somerville GP. Differences in ground motion and faultprocess between the surface and buried rupture earthquakes. Earth Planetsand Space 2004;56:3–14.
[17] Dhakal PR, Mander BJ, Mashiko N. Identification of critical ground motions forseismic performance assessment of structures. Earthquake Engineering andStructural Dynamics 2006;35:989–1008.
[18] Hancock J, Bommer JJ. Using matched records to explore the influence ofstrong-motion duration on inelastic structural response. Soil Dynamics andEarthquake Engineering 2007;27(4):291–9.
[19] Tso WK, Zhu TJ, Heiderbrecht AC. Engineering application of ground motion A/Vratio. Soil Dynamics and Earthquake Engineering 1992;11:133–44.
[20] Iervolino I, Maddaloni G, Cosenza E. Eurocode 8 compliant real records sets forseismic analysis of structures. Journal of Earthquake Engineering 2008;12(1):54–90.
[21] Luco N, Cornell CA. Structure-specific scalar intensity measures for near-sourceand ordinary earthquake motions. Earthquake Spectra 2007;23(2):357–95.
[22] Tothong P, Luco N. Probabilistic seismic demand analysis using advancedground motion intensity measures. Earthquake Engineering and StructuralDynamics 2007;36:1837–60.
[23] EPPO. Hellenic Antiseismic Code (EAK 2000). Ministry of Public Works, Athens,2000.
[24] Giarlelis C, Lekka D, Mylonakis G, Karabalis D. The M6.4 Lefkada 2003, Greeceearthquake: dynamic response of a 3-storey R/C structure on soft soil.Engineering Structures, accepted for publication.
[25] Sextos AG, Pitilakis K, Kirtas E, Fotaki V. A refined computational framework forthe assessment of the inelastic response of an irregular building that wasdamaged during the Lefkada earthquake. In: Proceedings of the fourthEuropean workshop on the seismic behaviour of irregular and complexstructures, Thessaloniki, Greece, 2005.
[26] Papathanasiou A, Papatheodorou I. Rehabilitation of a building damaged inLefkada during the 14.08.2003 earthquake. In: Proceedings of the 16th Hellenicconcrete conference, Alexandroupolis, Greece, 2007 [in Greek].
[27] Pitilakis K. Study of the effect of local site conditions, geomorphologyand dynamic soil–structure interaction on the recordings of the NationalSeismic Network. Technical report, Laboratory of Soil Mechanics andGeotechnical Earthquake Engineering of Aristotle University and Institute ofEngineering Seismology and Earthquake Resistant Structures, 1996 [in Greek].
[28] Modaressi H, Foerster E. CyberQuake ver. 2, user’s manual. France: BRGM; 2000.[29] Elgamal A, Yang Z, Parra E, Ragheb A. Cyclic 1D: nonlinear finite element
program for execution of one-dimensional site amplification and liquefactionsimulations. San Diego, USA: University of California; 2001.
[30] Computers and Structures, Inc., ETABS: integrated building design software,v.8—user’s manual. Berkeley, California, USA, 2003.
[31] Makris N, Gazetas G. Dynamic soil–pile interaction. Part II: lateral and seismicresponse. Earthquake Engineering and Structural Dynamics 1992;21(2):145–62.
[32] Gorbunov-Possadov MI, Serebrjanyi RV. Design of structures on elasticfoundations. In: Proceedings of the fifth international conference on soilmechanics and foundation engineering, Paris, France, 1961. p. 643–55.
[33] Russo G. Numerical analysis of piled rafts. International Journal for Numericaland Analytical methods in Geomechanics 1998;22:477–93.
[34] Tokimatsu K. Performance of pile foundations in laterally spreading soils. In:Proceedings of the second international conference on earthquake geotechni-cal engineering, Lisbon, Portugal, vol. 3, 1999. p. 957–64.
[35] Kappos AJ. RCCOLA-90: a microcomputer program for the analysis of theinelastic response of reinforced concrete sections. Department of CivilEngineering, Aristotle University of Thessaloniki, Greece, 1993.
[36] Park Y-J, Ang AH-S. Mechanistic seismic damage model for reinforced concrete.Journal of Structural Engineering 1985;111(4):722–39.
[37] Kunnath SK, Reinhorn AM, Lobo RF. IDARC version 3.0: a program for theinelastic damage analysis of reinforced concrete structures. Report no. NCEER-92-0022, National Center for Earthquake Engineering Research, State Uni-versity of New York at Buffalo, USA, 1992.
[38] Jeong SH, Elnashai AS. Analytical assessment of an irregular RC frame for full-scale 3D pseudo-dynamic testing. Part I: analytical model verification. Journalof Earthquake Engineering 2005;9(1):95–128.
[39] Elnashai AS, Papanikolaou V, Lee DH. ZEUS-NL user manual. Mid-AmericaEarthquake Center report, 2002.
[40] Mander JB, Priestley MJ, Park R. Theoretical stress–strain model for confinedconcrete. Journal of Structural Engineering 1998;114(8):1804–26.
[41] Ghobarah A, Aly NM, El-Attar M. Performance level criteria and evaluation. In:Proceedings of the international workshop on seismic design methodologiesfor the next generation of codes, Balkema, Rotterdam, 1997. p. 207–15.
[42] Ambraseys NN, Smit P, Berardi R, Rinaldis D, Cotton F, Berge C. Dissemination ofEuropean strong-motion data, vol. 1, CD-ROM collection. European Commis-sion, DGXII, Science, Research and Development, Brussels, 2000.
[43] Ambraseys NN, Douglas J, Rinaldis D, Berge-Thierry C, Suhadolc P, Costa G, et al.Dissemination of European strong-motion data, vol. 2, CD-ROM Collection.Engineering and Physical Sciences Research Council, UK, 2004.
[44] Chiou B, Darragh R, Gregor N, Silva W. NGA project strong motion database.Earthquake Spectra 2008;24(1):23–44.
[45] Luco N, Bazzurro P. Does amplitude scaling of ground motion records result inbiased nonlinear structural drift responses. Earthquake Engineering andStructural Dynamics 2008;36:1813–35.
[46] Watson-Lamprey J, Abrahamson N. Selection of ground motion time series andlimits on scaling. Soil Dynamics and Earthquake Engineering 2006;26:477–82.
[47] Stafford JP, Strasser OF, Bommer JJ. An evaluation of the applicability of theNGA models to ground-motion prediction in the Euro-Mediterranean region.Bulletin of Earthquake Engineering 2008;6:149–77.
[48] Iervolino I, Maddaloni G, Cosenza E. A note on selection of time-histories forseismic analysis of bridges in Eurocode 8. Journal of Earthquake Engineering2009;13(1):1125–52.
[49] American Society of Civil Engineers. Minimum design loads for buildings andother structures. ASCE/SEI 07-05, Virginia, US, 2010.
Copyright © 2022 FDOKUMEN