10 Haiti Earthquake
30
Page 144 of 178 !" Haiti Earthquake Haiti occupies the Western third of the island of Hispaniola in the Caribbean (Figure 39), shared with the Dominican Republic. Haiti is the poorest country in the Americas, and suffers from political instability, environmental degradation including almost complete deforestation, food insecurity, and frequent natural disasters, including hurricanes, floods, and earthquakes. Figure 39: Haiti map (http://en.wikipedia.org/wiki/Haiti) !"#! Description of Emergency On January 12, 2010, a 7.0 magnitude earthquake struck 17km southwest of Port-au-Prince, Haiti. Nearly one-third of Haiti’s population, almost three million people, were affected by ‘extreme’, ‘violent’, or ‘severe’ shaking (USGS, 2010). An estimated 222,517 people died and 310,928 were injured (OCHA, 2010). This powerful quake in an area of poor quality construction materials caused extensive damage to shelters and an estimated 682,693 people were internally displaced into 433 spontaneous and transitional settlements in the Port-au-Prince and Jacmel area alone (Figure 40). Out-migration of an estimated 482,000 people from affected areas also strained resources in rural Haiti (CDEMA, 2010). Figure 40: Earthquake intensity maps (USGS, 2010)
-
Upload
khangminh22 -
Category
Documents
-
view
2 -
download
0
Transcript of 10 Haiti Earthquake

Page 144 of 178
!" Haiti Earthquake
Haiti occupies the Western third of the island of Hispaniola in the Caribbean
(Figure 39), shared with the Dominican Republic. Haiti is the poorest country
in the Americas, and suffers from political instability, environmental
degradation including almost complete deforestation, food insecurity, and
frequent natural disasters, including hurricanes, floods, and earthquakes.
Figure 39: Haiti map (http://en.wikipedia.org/wiki/Haiti)
!"#! Description of Emergency
On January 12, 2010, a 7.0 magnitude earthquake struck 17km southwest of Port-au-Prince, Haiti. Nearly one-third of
Haiti’s population, almost three million people, were affected by ‘extreme’, ‘violent’, or ‘severe’ shaking (USGS,
2010). An estimated 222,517 people died and 310,928 were injured (OCHA, 2010). This powerful quake in an area
of poor quality construction materials caused extensive damage to shelters and an estimated 682,693 people were
internally displaced into 433 spontaneous and transitional settlements in the Port-au-Prince and Jacmel area alone
(Figure 40). Out-migration of an estimated 482,000 people from affected areas also strained resources in rural Haiti
(CDEMA, 2010).
Figure 40: Earthquake intensity maps (USGS, 2010)

Page 145 of 178
The immediate humanitarian response was complicated by the: 1) inability to import goods due to damage to the
airport and port; 2) inability to transport goods due to rubble and temporary shelters blocking roadways; 3) loss of life
and resources within humanitarian organizations; 4) communications difficulties; 5) lack of staff capacity to respond;
and, 6) the overwhelming scale of the disaster. The Water, Sanitation, and Hygiene (WASH) cluster alone estimated
1.1 million people hosted in approximately 651 spontaneous settlements in Port-au-Prince, Jacmel, Gressier, Leogane,
Grand Goave, and Petit Goave were in need of services (OCHA, 2010). Despite these obstacles, however, as of
March 15th, within eight weeks of the disaster, 876,000 of the 900,000 people in need in the Port-au-Prince area
(primarily in spontaneous settlements) had been reached with safe water supplies such as tanker trucked water,
treated water, or safe water sources from government, NGO, and international agency sources.
!"#$ Situational analysis and methods
Before the earthquake, numerous household water treatment and safe storage products (HWTS) were promoted in
Haiti to improve microbiological quality of stored water and reduce diarrheal disease (Figure 41), including: 1)
Aquatabs brand sodium dichloroisocyanurate tablets sold commercially; 2) Gadyen Dlo sodium hypochlorite solution
sold in rural areas by the NGO Deep Springs International (DSI); 3) Dlo Lavi sodium hypochlorite solution socially
marketed by Population Services International (PSI); 4) Klorfasil powdered sodium dichlororisocyanurate promoted in
rural areas; 5) commercial bleaches or powdered HTH (‘Klowoks’) sold in markets; 6) Biosand filters produced locally
by Clean Water for Haiti (CWH) and Pure Water for Haiti (PWH); and, 7) combined filtration/chlorination systems
distributed in more than 30 rural communities by the currently inactive, but regrouping, Gift of Water (GOW). The
Procter & Gamble PuR flocculant/disinfectant sachet had been socially marketed in Haiti, but was discontinued, as
was a ceramic filter factory established with support from Potters for Peace. Boiling is not widely promoted in Haiti
due to extensive deforestation. All of the above non-commercial projects were small, reaching a few thousand to a
few tens of thousands of targeted families.
Figure 41: HWTS options available before the emergency (Haiti)
In a national survey, 45.6% of urban and 24.4% of rural populations in Haiti reported treating drinking water, the
large majority (42.0% and 21.2% of respondents) by adding bleach or chlorine (MSPP, 2007), indicating widespread

Page 146 of 178
pre-earthquake knowledge and reported use of chlorine based HWTS options. Small percentages (0.1-3.4%) reported
boiling, filtering, solar disinfection, settling & decanting, PuR, adding citrus, and other.
Following the earthquake, there was widespread interest from manufacturers and some implementers in responding
with HWTS options. Upon arrival to Haiti on February 15, 2010, the field researcher identified six programs that had
actually distributed HWTS in the acute emergency context, including (Figure 42):
- Before the earthquake, DSI distributed locally-manufactured safe storage containers and sodium hypochlorite
via 35 community health workers (CHWs) to 1,500 families in 50 communities around Leogane. In response
to the earthquake, DSI plans to distribute 15,000 systems in Leogane commune, covering 20% of urban and
80-90% of rural families. As of February 16, 2010, DSI had reached 2,880 families with safe storage
containers and Aquatabs chlorine tablets through an expanded network of 165 CHW distributors.
- The Haiti Response Coalition (HRC) is a network of small-to-medium NGOs distributing donations, including
an unknown number of Aquatabs, in 48 Port-au-Prince spontaneous settlements.
- FilterPure manufactures ceramic filters in the Dominican Republic and delivered 350 filters to the NGOs
PWH, Guerrilla Aid, and Konpay.
- CWH is a Haitian based NGO that has distributed about 11,000 biosand filters (BSFs) over the last seven
years. Within six weeks of the earthquake, CWH distributed 238 BSFs through a network of pastors-in-
training to families (and some institutions) in Port-au-Prince.
- Four hundred Klorfasil bottles were flown into Haiti the week after the earthquake. Seventy were distributed
in one spontaneous settlement chosen because the distributing NGO: 1) worked in that area before; 2)
residents had access to water sources; and, 3) water supply aid had not yet reached the settlement.
- DSI provided Aquatabs and/or sodium hypochlorite to four former GOW communities still operating programs.
In addition, three million PuR sachets were available in Haiti. Confirmed PuR distribution occurred only by one
NGO, which was unable to provide information for surveying. Over 30 million Aquatabs of various sizes were
ordered specifically for the Haiti response from the manufacturer, plus many NGOs stock Aquatabs that may have
been used as well. Via word-of-mouth we heard of additional Aquatabs distributions, but were unable to confirm
where they occurred. Any omissions of distributed products are unintentional, and due to the difficulties in finding
information in the acute emergency context. Commercial options (like Klowoks) were also available to the population
after the emergency.
Figur
e 42: HWTS treatment options distributed (Haiti)

Page 147 of 178
!"#$#! Spatial analysis
Coordinates from 430 (97.3%) of 442 surveyed households were collected by enumerators during the survey (Figure
43). Three coordinates (0.7%) were discarded due to improbable placement. The USGS image overlay depicts
Modified Mercalli Intensity ground-shaking measurement, of 10 (highest intensity, thinnest line) to 7 moving from
northwest to southeast. The legend for this figure is as follows: 1) medium blue markers indicate DSI program
surveyed households that received Aquatabs and safe storage container in urban (see the red roads) and mountainous
(no roads) areas; 2) spontaneous settlements that received Aquatabs distributions are the red/black bullets in Port-au-
Prince; 3) surveyed families who received a ceramic filters from Konpay are in brown markers near Jacmel to the
south; 4) the green markers are surveyed families that received BSF from CWH; 5) the spontaneous settlement that
received Klorfasil is shown with an orange marker; and, 6) households surveyed in the rural community that was
formally with GOW that received Aquatabs from DSI are shown in light blue markers. The epicenter is depicted by
the red star. As can be seen, the HWTS distributions were over a large geographical area, with some options localized
in one community (like the ceramic filters) and others spread over a large area (like the biosand filters).
Figure 43: Map of households surveyed (Haiti)
Page 148 of 178
!"#$#$ Methods used in investigation
!"#$#$#! Household survey
A randomly selected sample of 442 households that had received HWTS options was conducted using a
questionnaire developed by the field researcher. The survey tool was translated into Kreyol and printed before arrival
in Haiti. Back-translation and pre-testing occurred during enumerator training on February 18-19, 2010, and survey
changes hand-completed. The survey was administered from February 19th-March 11th, 2010, and consisted of: 1) 30
questions on respondent and household characteristics, assets, diarrhea prevalence, and water knowledge and source
before and after the earthquake; 2) 12-20 questions specific for each HWTS option received; and, 3) questions about,
water quality testing of, and collection of, current treated and untreated stored household drinking water. The survey
and water quality testing and sample collection took about 20-30 minutes per household.
We randomly selected recipients of HWTS options from each of the six programs that had distributed product during
the acute emergency context for survey, including:
• DSI Aquatabs/buckets. Fifty of the 124 CHWs who had actually received systems for distribution were
randomly selected. Enumerators contacted them, obtained a written list of recipient households, and
randomly selected four households for survey. Because one CHW had not distributed, two had not received
supplies, and one was not locatable, four surveys each with 44 CHWs and 3 surveys each with 2 CHWs were
conducted (182 surveys).
• HRC Aquatabs. One to two settlements in each Port-au-Prince geographical area HRC distributed within (six
settlements total) were randomly selected and convenience sampling of 10-18 families who received
Aquatabs in each settlement was conducted (87 surveys total).
• Ceramic Filters. The NGO Konpay provided a partial list of 30 recipients, which was used by the
enumerators to find and survey recipient households (43 surveys).
• CWH BSF. CWH provided all filter installation sheets. Every fourth filter installation data sheet (excluding
institutions) was selected for survey (60 total). The enumerators surveyed 85.0% of selected households in
two sampling days (51 surveys).
• Klorfasil. A convenience sample in the area of the spontaneous settlement present during distribution was
conducted (50 surveys).
• Former GOW Aquatabs. Every fifth house from a list of 230 participant households obtained from the CHW
in Baudin, the most earthquake affected community, was selected. Twenty-nine (72.5%) of 40 selected
households were reached in one sampling day (29 surveys).
!"#$#$#$ Water quality testing
The enumerators tested FCR using Hach ColorWheel test kits during the survey at any household reporting household
water treatment or tanker truck water supplies and collected samples of treated water (if available) and untreated
water from each surveyed household in sterile WhirlPak! bags. The bags were stored on cold packs. The field
researcher completed membrane filtration microbiological testing each afternoon/evening. The only deviations from
Standard Methods included: 1) the holding time of eight hours was exceeded (to 12 hours) because of the time taken

Page 149 of 178
for transit each day from the survey location back to Leogane. A dedicated turbidity tester was hired to test samples
within 24 hours of collection the morning after they were collected.
!"#$ Qualitative interview results
Due to logistical and transportation constraints in this emergency, we were able to conduct a recorded qualitative
interview with one responder, an email interview with another, and verbal informal conversations with an additional
four responders.
One respondent expressed how critical it was to work with other organizations to both locate populations where
HWTS was appropriate and complete a full WASH response, stating “One of the main reasons that we chose this
[HWTS] as a response is because this is what we are good at, this is what we are doing prior to the emergency. And
so we kind of knew we would be responding with this sort of intervention and the question was more where is that
most appropriate and how do we do that” and “we have done some water distribution ... but that’s not our specialty
so we haven’t done much” and “we are talking with other organizations that are also filling in different parts of the
response”, listing other groups focusing on “sanitation”, “working on hand pump repair”, and “doing hand pump
assessments.”
At the outset of the emergency “most of the progress was on tanker trucks and getting water to where it was needed
and I felt that was a good, quick way to respond and I felt like that has worked so far. I think, here in Haiti, once you
get outside of the city, there is not a whole lot that works other than water treatment so it’s a real necessity to do that”
as well. They noted that they are “specifically mostly concentrating on household water treatment and hygiene
promotion,” and the end, “we selected [our exact rural location], because we had stronger partners here and the
networks were already in place.” “I think it took some time for us to figure out where exactly we fit in, to get moving.
I felt we had an advantage in that we were already on the ground and had some things in place but I wish we would
have been able to get moving more quickly than we did. I think a lot of that had to do with never having been in an
emergency before,” but “because of the partnerships we have we are able to link into existing community networks
with individuals who are already trained in a lot of different community health interventions” and that this was an
advantage in responding.
The respondent stated “we selected [the HWTS option] because it’s easy on transportation and has easy instructions
so shortly after the earthquake we made a purchase,” although also noted that the “hardest things would probably be
logistics for getting things in country and getting things around where they need to go.” When asked if they felt HWTS
was appropriate in this emergency, they stated “I think it depends on the situations and the exact context that the
people are living in. There’s a lot of difference between urban and rural and camps and outside of the camp. But I do
think it’s appropriate because a lot of people in Haiti are used to treating the water and the point of use. And people
are used to using chlorine and so this is something that fits into the local context.”
This organization plans to continue to follow-up, train, monitor, and work with the rural households who received
HWTS options in the emergency to see if there is “long term behavior change of families who have not been treating

Page 150 of 178
before, motivating them to treat now.” Because they are not sure the emergency distribution is “sufficient to make this
[HWTS treatment] work long term.”
Numerous respondents noted that they distributed products in the first week after the earthquake, before
establishment of tanker truck water distributions, and they felt these distributions were critical. Once tanker truck
distribution was established they felt HWTS options were of less utility. In one situation, actually, the NGO is
planning to collect distributed product and redistribute them to populations without tanker truck access). However,
the respondents expect greater utility of HWTS in future once tanker truck water distribution is phased out as the
emergency evolves.
One manufacturer a HWTS option expressed frustration that “the most difficult task has been to find organizations to
distribute and manage programs,” echoing the push that manufacturers exerted on the response in Indonesia. Another
respondent expressed frustration that they would like to purchase filters that could be provided to families before the
NGO left the country, but that they could not find a manufacturer anywhere who had enough filters in stock to meet
their anticipated order of tens of thousands.
Lastly, one respondent stated providing Aquatabs to all people allows them control and to treat their own water, and
that is a human rights issue to provide HWTS to all people in the emergency, whether or not they are receiving tanker
truck water.
!"#$ Survey results
Survey results are presented in Table 64 for the entire survey population and stratified by program. Differences in
programs were quantified in dichotomous variables using the chi-squared test (p-values of <0.05 indicate a statistical
significant difference between survey populations, but does not say which populations are different). As in other data,
the denominator for total percentages is noted in the row variable description. Denominators for the program column
percentages are not presented.
A total of 442 surveys were completed by five enumerators, with between 29-182 households per program. Slightly
over 60% of the survey respondents were women, and the average respondent age was 38.2 with a range from 7-78
years. Respondent gender was inversely correlated with enumerator gender (p=<0.001) indicating the respondents
preferentially interviewed someone of the opposite sex, rather than approach the female head of household, as
requested. Respondents in spontaneous settlements were younger (34.7 years) on average than those not (39.7)
(p<0.001). If the respondent was female, 77.4% had attended any school. The average school attendance was 9.2
years for those women who had attended, and 7.1 for the total female respondent population. In addition, 70.8% of
female head of households could read the newspaper. There was a statistically significant higher rate of female HOH
ability to read in urban Port-au-Prince areas compared to rural areas.
Over half of respondents (54.9%) reported paying for water before the emergency. This number decreased after the
emergency to 39.0%. At an exchange rate of 40.25 Gourdes to 1 USD, the average monthly cost of water before the
emergency was 0.62 USD, and after 0.65 USD. The maximum paid was 3.11 USD per month.

Page 151 of 178
Overall, 93.7% of families had water available within 30 minutes of their home, and 98.7% covered stored
household water. Adult women were responsible for collecting water in 47.7% of households, followed by girls
(42.7%), boys (24.7%), and adult men (22.2%). Buckets were the preferred storage container in this environment,
with 78.0% of the total survey population using them, and a higher percentage of the rural than urban population
using them.
Respondents reported a significant amount of damage to homes and displacement, as 80.7% of homes were reported
damaged, and 70.7% of the survey population had moved and created a new home after the emergency. People
outside of Port-au-Prince and in rural areas were less likely to report damage to their home or moving after the
earthquake.
While most respondents reported having received at least one HWTS option, survey eligibility was based on program
participation.

Page 152 of 178
Table 64: Survey results by program (Haiti)
DSI
AT/bucket
(Leogane)
HRC
Aquatabs
(PaP camps)
Ceramic
filters (Jacmel)
CWH BSF
filters
(PaP)
Klorfasil
camp (PaP)
GOW
program
(rural)
Total p-value
Number of households surveyed (n=442) 182 (41.2) 87 (19.7) 43 (9.7) 51 (11.5) 50 (11.3) 29 (6.6) 442 (100)
Number (%) female respondents (n=440) 125 (68.7) 56 (64.4) 22 (52.4) 21 (41.2) 32 (64.0) 10 (35.7) 266 (60.5) <0.001
Average respondent age in years (min-max) (n=441) 38.6 (15-75) 25.5 (7-70) 36.6 (17-69) 42.4 (19-78) 33.3 (15-56) 46.4 (17-76) 38.2 (7-78)
Number (%) female respondents attend school (n=266) 95 (76.0) 46 (82.1) 16 (72.7) 20 (95.2) 24 (75.0) 5 (50.0) 206 (77.4) 0.095
If FR school, average (min-max) years school (n=203) 9.2 (1-19) 9.3 (2-18) 8.3 (1-15) 11.8 (4-20) 7.6 (1-17) 7.4 (3-12) 9.2 (1-20)
All FR average (min-max) years school (n=263) 6.9 (0-19) 7.6 (0-18) 6.0 (0-15) 11.2 (0-20) 5.7 (0-17) 3.7 (0-12) 7.1 (0-20)
Number (%) female HOH who can read newspaper (n=442) 129 (73.3) 68 (81.9) 26 (65.0) 41 (87.2) 34 (69.4) 15 (55.6) 313 (70.8) 0.015
Number (%) paid for water before emergency (n=426) 61 (34.7) 82 (95.3) 11 (27.5) 32 (65.3) 45 (91.8) 3 (11.5) 234 (54.9) <0.001
Average water cost (Gourdes, min-max)) (n=231) 30.8 (2-75) 19.0 (1-50) 72.0 (30-125) 26.1 (1-50) 18.0 (4-70) 6.7 (5-10) 25.0 (1-125)
Number (%) paid for water after emergency (n=428) 46 (25.8) 55 (64.7) 11 (27.5) 29 (59.2) 24 (49.0) 2 (7.4) 167 (39.0) <0.001
Average water cost (Gourdes, min-max) (n=164) 34.1 (2-75) 16.9 (2-50) 70.5 (20-125) 25.0 (1-50) 15.8 (2-60) 5 (5-5) 26.0 (1-125)
Hours spent daily collecting water (n=435) 1.7 (0.0-12) 0.9 (0.0-10) 0.40 (0.0-2.5) 0.5 (0.0-2.5) 2.4 (0.2-10) 1.9 (0.0-8.0) 1.4 (0.0-12)
Number (%) with water in 30 minutes of house (n=442) 173 (95.1) 81 (93.1) 43 (100) 51 (100) 39 (78.0) 27 (93.1) 414 (93.7)
Number (%) homes damaged by earthquake (n=441) 151 (83.0) 82 (94.3) 17 (40.5) 41 (80.4) 50 (100) 15 (51.7) 356 (80.7) <0.001
Number (%) moved after earthquake (n=434) 115 (65.0) 84 (96.6) 7 (16.7) 38 (77.6) 50 (100) 13 (44.8) 307 (70.7) <0.001
Number (%) with no household stored water (n=442) 1 (1.1) 29 (33.3) 5 (11.6) 10 (19.6) 3 (6.0) 10 (34.5) 59 (13.3)
Number (%) with covered stored water (n=378) 179 (98.9) 57 (98.3) 36 (100) 40 (97.6) 46 (97.9) 15 (100) 373 (98.7) 0.919
Number (%) using buckets (n=378) 161 (91.0) 28 (48.3) 27 (71.1) 32 (78.1) 29 (64.4) 18 (94.7) 295 (78.0) <0.001
Number (%) received HWTS option (n=442) 176 (96.7) 83 (95.4) 43 (100) 51 (100) 45 (90.0) 27 (93.1) 425 (96.2)

Page 153 of 178
The 442 households surveyed included a total of 2,528 people (average 5.8 people per household, min=1, max=24), including 287 children under 5
(average 0.6 children per household, min=0, max=5) (Table 65). Diarrhea was self-reported for 14.7% of adults, and 44.3% of children under 5.
Overall, there was a small number of children per household in this emergency compared to the others.
Table 65: Survey population and reported diarrhea in last 24 hours (Haiti)
DSI
AT/ bucket
(Leogane)
HRC Aquatabs
(PaP camps)
Ceramic
filters
(Jacmel)
CWH BSF
filters
(PaP)
Klorfasil
camp (PaP)
GOW
program
(rural)
Total
Total population (by household) 6.1 (1-24) 5.6 (1-18) 5.1 (1-10) 5.7 (1-13) 5.2 (1-11) 6.3 (2-18) 5.8 (1-24)
Under 5 population (by household) 0.9 (0-4) 0.6 (0-5) 0.2 (0-1) 0.4 (0-3) 0.7 (0-3) 0.6 (0-3) 0.6 (0-5)
% over 5 females with diarrhea 12.4 24.4 15.4 21.3 23.5 7.7 16.9
% over 5 males with diarrhea 9.7 15.8 4.8 21.8 17.3 5.6 12.1
% over 5 with diarrhea 11.1 20.7 10.0 21.5 20.5 6.5 14.7
% under 5 females with diarrhea 30 (41.1) 10 (43.5) 2 (40.0) 5 (50.0) 9 (50.0) 3 (42.9) 59 (44.4)
% under 5 males with diarrhea 37 (43.0) 10 (40.0) 2 (50.0) 7 (58.3) 8 (44.4) 4 (44.4) 68 (44.2)
% under 5 with diarrhea 67 (42.1) 20 (41.7) 4 (44.4) 12 (54.5) 17 (41.5) 7 (43.8) 127 (44.3)
Survey respondents were asked about their water source three times: 1) what source they used before the emergency; 2) if there was a change in
source after the emergency, what source they used now; and, 3) in the last part of the survey, what source the actual current stored household water
came from. In this emergency, as can be seen in Table 66, there was almost no difference in the use of improved sources before and after the
emergency. Respondents in urban areas in Port-au-Prince and Jacmel were more likely to use improved sources than those in rural areas of Leogane.
Table 66: Improved water sources reported before, reported after, and actual in the emergency (Haiti)
DSI
AT/ bucket
(Leogane)
HRC
Aquatabs
(PaP camps)
Ceramic
filters
(Jacmel)
CWH BSF
filters
(PaP)
Klorfasil
camp (PaP)
GOW
program
(rural)
Total p-value
Before emergency improved sources (n=432) 89 (49.4) 83 (96.5) 37 (88.1) 47 (94.0) 34 (72.3) 15 (55.6) 305 (70.6) <0.001
After emergency improved sources (n=436) 92 (50.6) 83 (96.5) 35 (83.3) 45 (90.0) 36 (73.5) 15 (55.6) 306 (70.2) <0.001
Actual use of improved sources (n=383) 96 (53.3) 57 (98.3) 34 (89.5) 35 (85.4) 40 (85.1) 13 (68.4) 275 (71.8) <0.001

Page 154 of 178
As can be seen from the tables below, the reason the percentage using improved sources stayed the same is that households replaced using bottled or
community source improved sources (that they paid for) with provided tanker truck supplies. Thus the tanker truck distribution did not improve
improved source access, it kept that percentage at the same level and decreased the financial burden on the household. The actual sources used in
household stored water at the time of the unannounced survey visit are described in the water quality section later in this report.
Table 67: Reported water sources before the emergency (Haiti)
DSI
AT/bucket
(Leogane)
HRC
Aquatabs
(PaP camps)
Ceramic
filters
(Jacmel)
CWH BSF
filters
(PaP)
Klorfasil
camp (PaP)
GOW
program
(rural)
Total
Community source (number (%)) 71 (39.4) 42 (48.8) 18 (42.9) 32 (64.0) 11 (23.4) 12 (44.4) 186 (43.1)
Well (number (%)) 1 (0.6) 3 (3.5) 2 (4.8) 4 (8.0) 2 (4.3) 0 (0) 12 (2.8)
Open well (number (%)) 7 (3.9) 0 (0) 0 (0) 1 (2.0) 2 (4.3) 0 (0) 10 (2.3)
River (number (%)) 4 (2.2) 0 (0) 0 (0) 0 (0) 0 (0) 0 (0) 4 (0.9)
Bottled water (number (%)) 8 (4.4) 13 (15.1) 1 (2.4) 3 (6.0) 6 (12.8) 1 (3.7) 32 (7.4)
Unimproved spring (number (%)) 80 (44.4) 3 (3.5) 5 (11.9) 2 (4.0) 11 (23.4) 12 (44.4) 113 (26.2)
Trucked water (number (%)) 3 (1.7) 21 (24.4) 0 (0) 5 (10.0) 10 (21.3) 0 (0) 39 (9.0)
Improved spring (number (%)) 6 (3.3) 4 (4.7) 16 (38.1) 2 (4.0) 4 (8.5) 2 (7.4) 34 (7.9)
Rainwater (number (%)) 0 (0) 0 (0) 0 (0) 1 (2.0) 1 (2.1) 0 (0) 2 (0.5)
Total (n=432) (number (%)) 180 (100) 86 (100) 42 (100) 50 (100) 47 (100) 27 (100) 432 (100)
Table 68: Reported water sources after the emergency (Haiti)
DSI
AT/bucket
(Leogane)
HRC
Aquatabs
(PaP camps)
Ceramic
filters
(Jacmel)
CWH BSF
filters
(PaP)
Klorfasil camp
(PaP)
GOW
program
(rural)
Total
Community source (number (%)) 70 (38.5) 33 (38.4) 17 (40.5) 26 (52.0) 7 (14.3) 12 (44.4) 165 (37.8)
Well (number (%)) 2 (1.1) 3 (3.5) 2 (4.8) 4 (8.0) 4 (8.2) 0 (0) 15 (3.4)
Open well (number (%)) 7 (3.8) 0 (0) 0 (0) 3 (6.0) 2 (4.1) 0 (0) 12 (2.8)
River (number (%)) 5 (2.7) 0 (0) 0 (0) 0 (0) 0 (0) 0 (0) 5 (1.1)
Bottled water (number (%)) 7 (3.8) 8 (9.3) 0 (0) 4 (8.0) 4 (8.2) 1 (3.7) 24 (5.5)
Unimproved spring (number (%)) 78 (42.9) 3 (3.5) 7 (16.7) 2 (4.0) 11 (22.4) 12 (44.4) 113 (25.9)
Trucked water (number (%)) 4 (2.2) 35 (40.7) 0 (0) 8 (16.0) 19 (38.8) 0 (0.0) 66 (15.1)
Improved spring (number (%)) 9 (4.9) 4 (4.7) 16 (38.1) 2 (4.0) 2 (4.1) 2 (7.4) 35 (8.0)
Rainwater (number (%)) 0 (0) 0 (0) 0 (0) 1 (2.0) 0 (0) 0 (0) 1 (0.2)
Total (n=432) (number (%)) 182 (100) 86 (100) 42 (100) 50 (100) 49 (100) 27 (100) 436 (100)

Page 155 of 178
As can be seen below, the rural programs with DSI and GOW targeted populations with a higher percentage of unimproved sources.
Figure 44: Before (left) and after (right) emergency reported water sources (Haiti)
Respondents were asked if they felt their water was safe to drink. The results were not significant by improved or unimproved source (p=0.151), but
were significant by program (<0.001 comparing safe to unsafe) (Table 69).
Table 69: Percent of respondents who perceive their water source as safe (Haiti)
DSI
AT/ bucket
(Leogane)
HRC Aquatabs
(PaP camps)
Ceramic
filters
(Jacmel)
CWH BSF
filters
(PaP)
Klorfasil
camp (PaP)
GOW
program
(rural)
Total
Perceived safe (number (%)) 139 (76.4) 40 (46.5) 34 (79.1) 30 (58.8) 25 (50.0) 21 (72.4) 289 (65.5)
Perceived unsafe (number (%)) 22 (12.1) 25 (29.1) 3 (7.0) 5 (9.8) 14 (28.0) 2 (6.9) 71 (16.1)
Don’t know (number (%)) 21 (11.5) 21 (24.4) 6 (14.0) 16 (31.4) 11 (22.0) 6 (20.7) 81 (18.4)

Page 156 of 178
The majority of respondents who perceived their water as safe did so because the water was treated (Table 70). Respondents were more likely to
answer with this response if they had been part of or exposed to the DSI or GOW program before the earthquake (p=0.029).
Table 70: Reasons respondents perceive water as safe (multiple answers possible) (Haiti)
All All
Water treated (number (%)) 153 (53.3) People tell me to use (number (%)) 3 (1.0)
Free of microbes (number (%)) 102 (35.5) I buy it (number (%)) 3 (1.0)
Water clear (number (%)) 10 (3.5) From tap (number (%)) 2 (0.7)
Good taste / not salty (number (%)) 2 (0.7)Have always used it / familiar /
everyone uses (number (%))
7 (2.4)
No other water (number (%)) 1 (0.3)
Doesn’t make sick (number (%)) 3 (1.0) It comes from ground (%)) 1 (0.3)
Totals (number) 287
The majority of respondents who perceived their water as unclean did so because the “water was dirty” or it “had bacteria” (Table 71).
Table 71: Reasons respondents perceive water as unsafe (multiple answers possible) (Haiti)
All All
Water dirty (number (%)) 20 (22.5) Tastes bad (number (%)) 4 (4.5)
Has bacteria (number (%)) 20 (22.5) Don’t trust (number (%)) 4 (4.5)
Is not treated (number (%)) 14 (15.7)
Source is bad (number (%)) 11 (12.4)
Makes belly hurt / makes sick /
gives diarrhea (number (%))
10 (11.2)
Water truck, radio show, “clear is
not clean”, people died in water,
salty, makes itch (number (%))
1 each
(1.1% each)
Total: 89
Page 157 of 178
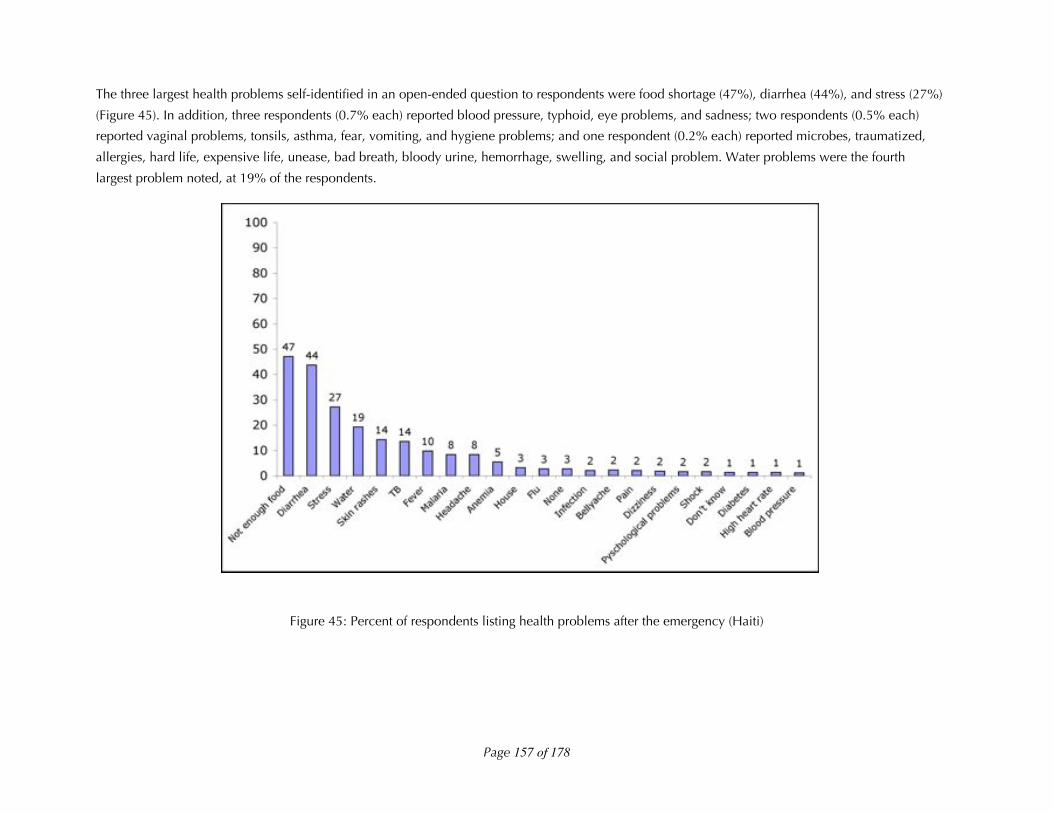
The three largest health problems self-identified in an open-ended question to respondents were food shortage (47%), diarrhea (44%), and stress (27%)
(Figure 45). In addition, three respondents (0.7% each) reported blood pressure, typhoid, eye problems, and sadness; two respondents (0.5% each)
reported vaginal problems, tonsils, asthma, fear, vomiting, and hygiene problems; and one respondent (0.2% each) reported microbes, traumatized,
allergies, hard life, expensive life, unease, bad breath, bloody urine, hemorrhage, swelling, and social problem. Water problems were the fourth
largest problem noted, at 19% of the respondents.
Figure 45: Percent of respondents listing health problems after the emergency (Haiti)

Page 158 of 178
There was high knowledge of HWTS in this context before the emergency, with the average family reporting knowing 1.9 options, including 1.2
chlorine-based options. However, less than half of the respondents who knew the options reported using them every day. Jik and Klowoks are liquid
bleach solutions and/or calcium hypochlorite sold in the market used to treat household water. Racket is a cactus sliced open and stirred in the water
that is a natural flocculant. A total of 392 (88.7%) of 442 respondents self-reported knowing at least one HWTS option before the emergency.
Table 72: HWTS options known before emergency (Haiti)
Report using (n=know)Know
(n=442) Never Use Rarely Once per week Daily
Aquatabs (number (%)) 322 (72.9) 84 (26.3) 105 (32.9) 12 (3.8) 118 (37.0)
Boiling (number (%)) 218 (49.3) 64 (29.4) 110 (50.5) 9 (4.1) 35 (16.1)
Jik / Klowoks (number (%)) 148 (33.5) 19 (13.1) 73 (50.3) 9 (6.2) 44 (30.3)
Add citrus (number (%)) 61 (13.8) 12 (19.7) 35 (57.4) 3 (4.9) 11 (18.0)
Gadyen Dlo (number (%)) 49 (11.1) 9 (18.4) 15 (30.6) 5 (10.2) 20 (40.8)
Add racket (number (%)) 24 (5.4) 10 (41.7) 13 (54.2) 1 (4.2) 0 (0)
Dlo Lavi (number (%)) 17 (3.8) 10 (58.8) 3 (17.6) 2 (11.8) 2 (11.8)
PuR (number (%)) 12 (2.7) 8 (66.7) 2 (16.7) 0 (0) 2 (16.7)
Filter (number (%)) 9 (2.0) 3 (33.3) 3 (33.3) 0 (0) 3 (33.3)
Table 73: Average number of HWTS options known before emergency (Haiti)
DSI
AT/ bucket
(Leogane)
HRC Aquatabs
(PaP camps)
Ceramic
filters
(Jacmel)
CWH BSF
filters
(PaP)
Klorfasil
camp (PaP)
GOW
program
(rural)
Total
Average total options known (min-max) 2.1 (0-7) 1.7 (0-4) 2.0 (0-9) 2.1 (0-6) 1.5 (0-4) 2.0 (0-4) 1.9 (0-9)
Average chlorine options known (min-max) 1.3 (0-4) 1.1 (0-3) 1.2 (0-5) 1.3 (0-3) 1.1 (0-3) 1.4 (0-2) 1.2 (0-5)

Page 159 of 178
!"#$ Coverage
The size of the affected population in the Haiti earthquakes was estimated at three million people (517,241
households). Despite the high interest from organizations and manufacturers in HWTS use in the emergency, and
large stocks of certain products available, distribution of HWTS options in the acute emergency was quite low, as
only 4,618 families were confirmed by the field researcher to be reached with HWTS (Table 74). This includes 2,880
DSI systems, 350 ceramic filters, 238 biosand filters, 350 Klorfasil families, and 800 (assuming 200 families in each of
the 4 GOW communities) reached with Gadyen Dlo. This is 0.77% of the 3,000,000 affected population, assuming a
family size of 5. It must be noted this number is conservative, as there were Aquatabs and PuR distributions by HRC
and other organizations that were unable to be quantified, as well as programs we might not have identified.
However, it is clear that HWTS was not a significant response for providing safe drinking water to the affected
population in the Haiti earthquake. In fact, tankering water was the primary, priority response, especially for
spontaneous settlements in the Port-au-Prince area, reaching an estimated 876,000 of 900,000 people in need during
the acute situation. HWTS did play a role in reaching some rural populations outside the tanker truck distribution
networks drinking unimproved water sources during the acute emergency context. Also, as of this writing, the DSI
program has reportedly distributed over 10,000 systems, reaching 80-90% coverage in the Leogane rural communes,
and ceramic and biosand filters distributions are continuing. This suggests that modest gains in the acute emergency
can lead to longer-term gains as the emergency progresses.
Table 74: Coverage of HWTS (Haiti)
Households reached
DSI Aquatabs/bucket systems (Leogane urban and rural households) 2,880
HRC Aquatabs distribution (Port-au-Prince spontaneous settlements) Unknown
Ceramic filters (Jacmel households) 350
Biosand filters (Port-au-Prince households) 238
Klorfasil distribution (Port-au-Prince spontaneous settlements) 350
Gadyen Dlo liquid solution to former GOW communities (rural) 800
Total: 4,618 (0.77%)
Overall, 425 (96.2%) of the 442 respondents received at least one HWTS option. There were only five families (in the
Klorfasil camp) who received two options – in each case they received Aquatabs and Klorfasil). The amount of water
treatment varied by program, with the DSI Aquatabs and GOW Aquatabs and Gadyen Dlo provided on a rolling
basis, varying amounts targeted for the HRC Aquatabs distribution, one filter provided in the ceramic and biosand
filter distributions, and one bottle of Klorfasil provided for five families in the Klorfasil distribution. One bottle of
Klorfasil treats 20,206 Liters of water, or enough water for a family using 20 Liters of water per day for 510 days (1.4
years). Sharing a bottle between five families leads to each family having access to treated water for 102 days.

Page 160 of 178
Table 75: Percent of respondents who received each HWTS option (Haiti)
DSI AT/
bucket
(Leogane)
HRC
Aquatabs
(PaP camps)
Ceramic
filters
(Jacmel)
CWH BSF
filters
(PaP)
Klorfasil
camp (PaP)
GOW
program
(rural)
Number (%) received Aquatabs 169 (92.9) 83 (95.4) 24 (48.0) 1 (3.5)
Number (%) received Gadyen Dlo 7 (3.9) 25 (86.2)
Number (%) received Klorfasil 26 (52.0)
Number (%) received ceramic filters 43 (100)
Number (%) received biosand filters 51 (100)
Number (%) received at least one product 176 (96.7) 83 (95.4) 43 (100) 51 (100) 45 (90) 26 (89.7)
!"#$ Correct use
To describe knowledge and use of the HWTS options described in Haiti we will present the results by option:
Aquatabs, other chlorine options, and filters.
!"#$#! Aquatabs
The majority of respondents (249 of 259 (96.1%)) received 67-mg tablets meant for treating 20 Liters at a dosage of 2
mg/L chlorine (Table 76). A few 8.5-mg tablets (4 of 259 (1.5%)) and 33-mg tablets (6 of 259 (2.3%)) meant for
treating 1 Liter and 10 Liters, respectively, at a dosage of 5 mg/L chlorine were also reported by respondents. DSI and
HRC only distributed the 67-mg tablets, but respondents obtained the other tablets through alternate distributions or
by purchasing the Aquatabs.
Respondents reported receiving an average of 29.3 tablets (treating 586 Liters of water, or enough for one family for
approximately 1 month), with a minimum of 2 and a maximum of 400 tablets received an average of 15.2 days before
survey. The Aquatab use rate, calculated by subtracting the remaining from the received and dividing by the days ago
received, was on average 1.72 tabs/day. Slightly over half (55.2) of respondents received group training on how to use
Aquatabs, while slightly over one quarter (26.4%) received household level training. Another 15.2% reported other
training (such as radio spots), and 17 respondents (6.1%) reported receiving no training.
The majority of respondents (68.4%) reported the fully correct way to use Aquatabs – adding 1 tablet to 20 Liters of
water and waiting 30 minutes before drinking. If the percent of people reporting incorrect, but adequate, treatment is
included, treatment knowledge rises to 83.4%. There was a higher rate of correct knowledge in the DSI rural and
GOW rural programs than the urban programs (p<0.001).
Overall 80.4% reported they are still using the tablets, and 66.1% reported Aquatabs treated water on the day of the
unannounced survey visit. There was variation (7-50%) in Aquatab use in the six HRC spontaneous settlements. If the
respondents who reported running out of Aquatabs were subtracted from the denominator, the reported today use of
Aquatabs rises to 90.2%. A correct FCR of between 0.2-2.0 mg/L was maintained in 76.5% of reported Aquatabs

Page 161 of 178
treated water, and a FCR of greater than or equal to 0.2 mg/L was maintained in 84.3% of reported Aquatabs treated
water. Again, higher rates of correct and adequate treatment were seen in the DSI rural programs.
The main reason for use of the product is that it cleans the water (89.0% of respondents), and the main reason for
disuse was due to running out of product (71.7%) (Table 77). No respondent reported objections to the chlorine taste
and smell. Six respondents did not report receiving the Aquatabs, but indicated they had treated water with Aquatabs,
indicating that they had purchased them, and this explains the disparity between the denominator of 183 respondents
reporting treated and 185 respondents having FCR tested (as six who reported purchase had FCR tested and four
recipients were not tested for FCR).
Table 76: Aquatabs knowledge and use (Haiti)
DSI
AT/bucket
rural
DSI
AT/bucket
urban
HRC
Aquatabs
camps
Klorfasil
camp
GOW
rural
Total
Number (%) received Aquatabs (n=442) 104 (93.7) 65 (91.6) 83 (95.4) 24 (48.0) 1 (3.5) 277 (62.7)
Number tablets (min-max) received (n=271) 17.6 (10-70) 31.7 (10-400) 42.9 (2-360) 29.1 (10-60) 50 29.3 (2-400)
Number of days ago (min-max) received (n=239) 10.6 (1-30) 10.8 (0-36) 24.2 (1-60) 22.9 (2-50) -- 15.2 (0-60)
Number (%) reporting group training (n=277) 71 (68.3) 31 (47.7) 40 (48.2) 10 (41.7) 1 (100) 153 (55.2)
Number (%) reporting household training (n=277) 29 (27.9) 15 (23.1) 24 (28.9) 5 (20.8) 0 (0) 73 (26.4)
Number (%) reporting other training (n=277) 4 (3.8) 21 (32.3) 12 (14.5) 5 (20.8) 0 (0) 42 (15.2)
Number (%) reporting no training (n=277) 0 (0) 5 (7.7) 7 (8.4) 5 (20.8) 0 (0) 17 (6.1)
Number (%) fully correct use knowledge (n=275) 85 (81.7) 41 (63.1) 43 (53.1) 19 (79.2) 0 (0) 188 (68.4)
Number (%) incorrect but adequate (n=275) 87 (83.7) 50 (76.9) 64 (79.0) 20 (83.3) 0 (0) 221 (83.4)
Report current use (n=275) 100 (96.2) 59 (92.2) 45 (54.9) 16 (66.7) 1 (100) 221 (80.4)
Report Aquatabs treated water today (n=277) 97 (93.3) 51 (78.5) 18 (21.7) 16 (66.7) 1 (100) 183 (66.1)
AT respondents reporting other treated water (n=277) 0 (0) 0 (0) 2 (2.4) 1 (4.2) 0 (0) 3 (1.1)
Correct FCR in AT treated water (n=185) 85 (86.7) 33 (61.1) 13 (76.5) 10 (62.5) -- 141 (76.2)
FCR !0.2 mg/L in AT treated water (n=185) 94 (95.9) 37 (68.5) 13 (76.5) 12 (75.0) -- 156 (84.3)
Number (%) report Aquatabs treated water today if
product was not finished (n=245)100 (97.1) 59 (90.8) 45 (78.9) 16 (84.2) 1 (100) 221 (90.2)

Page 162 of 178
Table 77: Reasons for use and disuse of Aquatabs (Haiti)
Total
Use because (n=357 reasons, 218 respondents)
Cleans water (number (%)) 194 (89.0)
Prevents disease (number (%)) 117 (53.7)
Instructed to do so or was given (number (%)) 23 (10.6)
Water dirty after flooding (number (%)) 5 (2.3)
Combats microbes (number (%)) 15 (6.9)
Protects health (number (%)) 3 (1.4)
Do not use because (n=46 reasons for 46 respondents)
Product finished (number (%)) 33 (71.7)
Received too recently (number (%)) 7 (15.2)
Haven’t bought (number (%)) 2 (4.3)
Didn’t do, no information, not ready, not necessary (number (%)) 1 each (2.2)
!"#$#% Other chlorine options
Two other chlorine options were distributed in this emergency: 1) Gadyen Dlo, a bottle of liquid sodium hypochlorite
solution where users add one cap to a 20-Liter bucket and wait 30 minutes before drinking distributed to families who
were familiar with the product before the emergency; and, 2) Klorfasil powdered sodium dichloroisocyanurate in a
bottle with a dispensing cap that is manipulated to obtain the correct number of grains for the 20-Liter bucket
distributed in one spontaneous settlement in Port-au-Prince by the promoter of Klorfasil who flew to Haiti with
bottles.
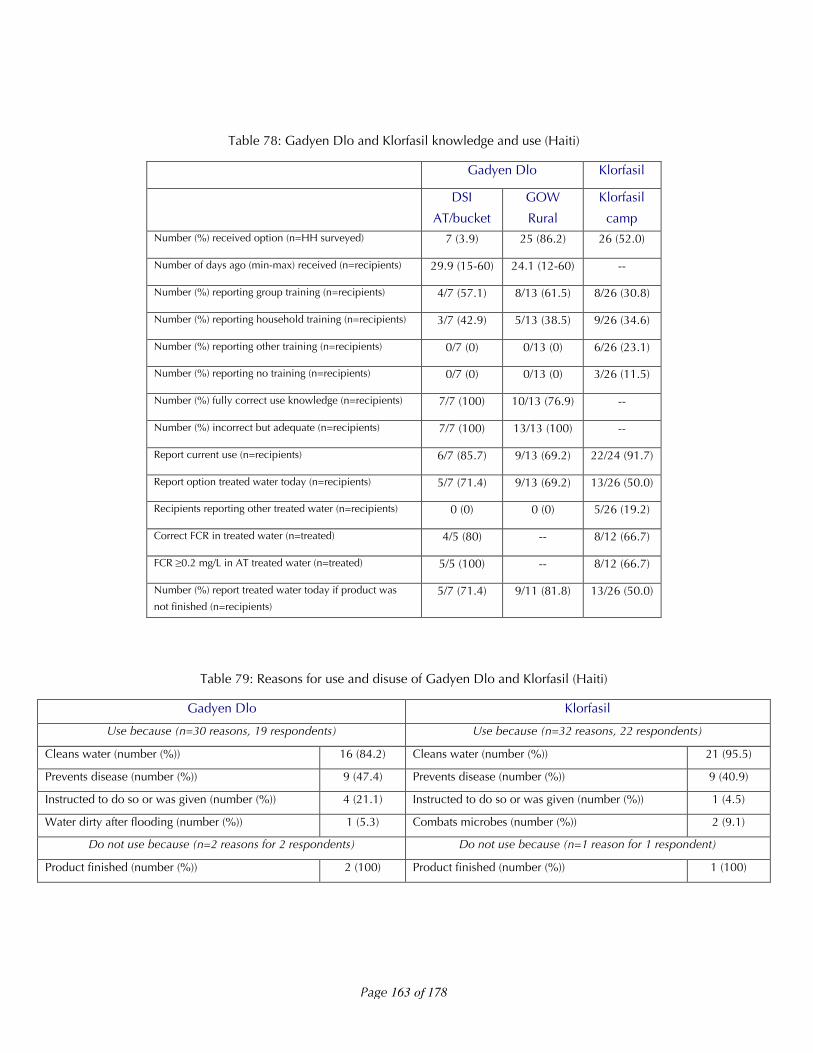
For the Gadyen Dlo, all respondents reported receiving some training, and all had adequate knowledge of how to use
the product (Table 78). The majority reported current use (69.2-85.7%), and using the product today (69.2-71.4%),
and all reported users had adequate FCR. Please note that FCR for users of Gadyen Dlo in the GOW community is not
reported because the users filter the water after chlorination, which removes the FCR. Also, it must be stated that the
sample size here becomes quite small, and not representative.
For the Klorfasil respondents, 11.5% received no training, and while 91.7% reported current use, only 50% reported
using the product to have stored treated household water today. Five (19.2%) of respondents were using Aquatabs for
treating water instead. Eight (66.7%) of 12 reported users had correct FCR in their drinking water. Again, the sample
size here is quite small.
The majority of respondents for both Gadyen Dlo (84.2%) and Klorfasil (95.5%) use the products because they treat
the water, and the non-users reported the product was finished (Table 79).
Page 163 of 178
Table 78: Gadyen Dlo and Klorfasil knowledge and use (Haiti)
Gadyen Dlo Klorfasil
DSI
AT/bucket
GOW
Rural
Klorfasil
campNumber (%) received option (n=HH surveyed) 7 (3.9) 25 (86.2) 26 (52.0)
Number of days ago (min-max) received (n=recipients) 29.9 (15-60) 24.1 (12-60) --
Number (%) reporting group training (n=recipients) 4/7 (57.1) 8/13 (61.5) 8/26 (30.8)
Number (%) reporting household training (n=recipients) 3/7 (42.9) 5/13 (38.5) 9/26 (34.6)
Number (%) reporting other training (n=recipients) 0/7 (0) 0/13 (0) 6/26 (23.1)
Number (%) reporting no training (n=recipients) 0/7 (0) 0/13 (0) 3/26 (11.5)
Number (%) fully correct use knowledge (n=recipients) 7/7 (100) 10/13 (76.9) --
Number (%) incorrect but adequate (n=recipients) 7/7 (100) 13/13 (100) --
Report current use (n=recipients) 6/7 (85.7) 9/13 (69.2) 22/24 (91.7)
Report option treated water today (n=recipients) 5/7 (71.4) 9/13 (69.2) 13/26 (50.0)
Recipients reporting other treated water (n=recipients) 0 (0) 0 (0) 5/26 (19.2)
Correct FCR in treated water (n=treated) 4/5 (80) -- 8/12 (66.7)
FCR !0.2 mg/L in AT treated water (n=treated) 5/5 (100) -- 8/12 (66.7)
Number (%) report treated water today if product was
not finished (n=recipients)5/7 (71.4) 9/11 (81.8) 13/26 (50.0)
Table 79: Reasons for use and disuse of Gadyen Dlo and Klorfasil (Haiti)
Gadyen Dlo Klorfasil
Use because (n=30 reasons, 19 respondents) Use because (n=32 reasons, 22 respondents)
Cleans water (number (%)) 16 (84.2) Cleans water (number (%)) 21 (95.5)
Prevents disease (number (%)) 9 (47.4) Prevents disease (number (%)) 9 (40.9)
Instructed to do so or was given (number (%)) 4 (21.1) Instructed to do so or was given (number (%)) 1 (4.5)
Water dirty after flooding (number (%)) 1 (5.3) Combats microbes (number (%)) 2 (9.1)
Do not use because (n=2 reasons for 2 respondents) Do not use because (n=1 reason for 1 respondent)
Product finished (number (%)) 2 (100) Product finished (number (%)) 1 (100)

Page 164 of 178
!"#$#% Filtration options
Haiti was the only emergency where we documented filtration options being distributed, and although the relative
numbers were small, we were pleased to include these options in the study. All recipients of both the ceramic and
biosand filters received some type of training, and 95.2% and 90.2%, respectively, reported they were still using the
filters. However, 72.1% and 52.9%, respectively, were using the filters on the day of the unannounced survey visits.
No recipient of a filter was using another option to treat their water. The main reason for use was cleans water (94.9%
and 73.0%) and the disuse was due one of the ceramic filters breaking and the biosand filter families not having
water. In addition, during the household visits some families who received the biosand filter complained of sand
running through into the water, which will be discussed in the next section.
Table 80: Filter knowledge and use (Haiti)
Ceramic filters Biosand filters
Number (%) received filter (n=program) 43 (100) 51 (100)
Number of days (min-max) ago received No data No data
Number (%) report group training (n=recipients) 36 (83.7) 28 (54.9)
Number (%) report household training (n=recipients) 7 (16.3) 18 (35.3)
Number (%) report other training (n=recipients) 0 (0) 5 (9.8)
Number (%) report no training (n=recipients) 0 (0) 0 (0)
Number (%) report currently still using (n=recipients) 40/42 (95.2) 46/51 (90.2)
Number (%) report filter treated water today (n=recipients) 31/43 (72.1) 27/51 (52.9)
Number (%) filters recipients reporting other treatment (n=recipients) 0 (0) 0 (0)
Table 81: Reasons for filter use and disuse (Haiti)
Ceramic Filters Biosand Filters
Use because (n=51 reasons, 39 respondents)) Use because (n= 63 reasons, 46 respondents)
Cleans water (number (%)) 37 (94.9) Cleans water (number (%)) 46 (100)
Prevents disease (number (%)) 8 (20.5) Prevents disease (number (%)) 11 (23.9)
Instructed to do so or was given (number (%)) 1 (2.6) Instructed to do so or was given (number (%)) 2 (4.3)
Combats microbes (number (%)) 4 (10.3) Combats microbes (number (%)) 2 (4.3)
Protects health (number (%)) 1 (2.6) Water dirty after flooding (number (%)) 2 (4.3)
Do not use because (n=1 reasons for 1 respondent) Do not use because (n=3 reasons for 3 respondents)
Product broke (number (%)) 1 (100) Don’t have water (number (%)) 3 (100)
Page 165 of 178
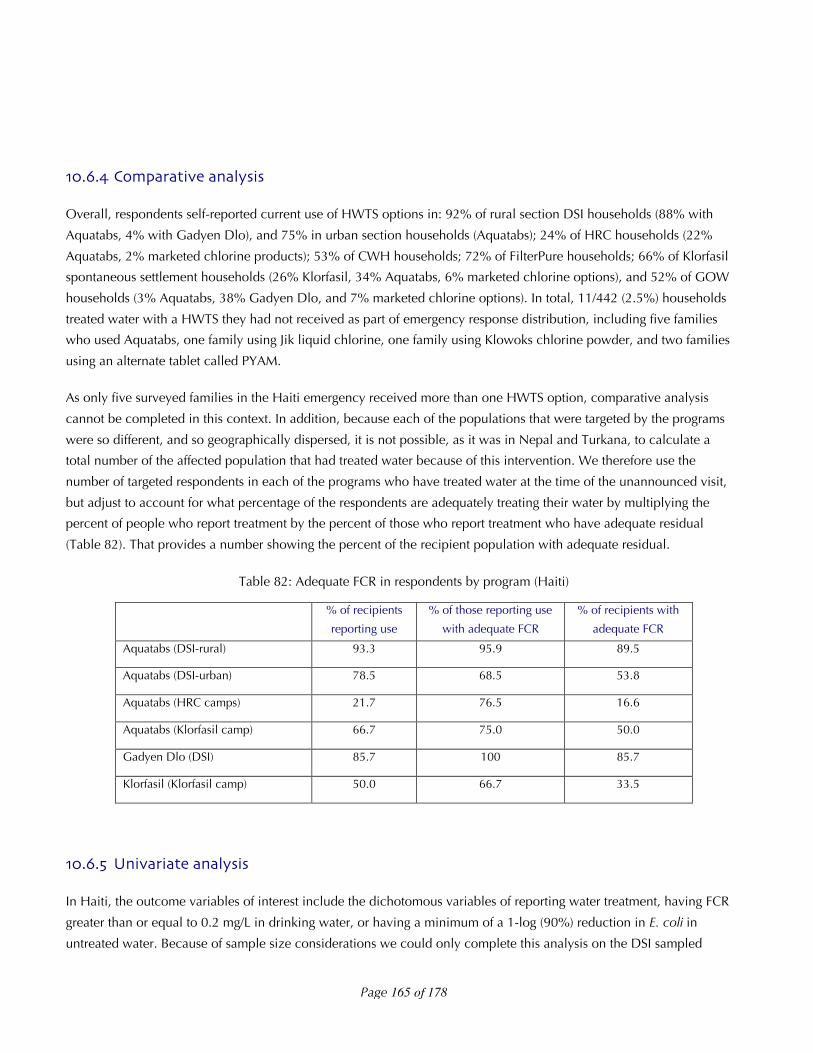
!"#$#% Comparative analysis
Overall, respondents self-reported current use of HWTS options in: 92% of rural section DSI households (88% with
Aquatabs, 4% with Gadyen Dlo), and 75% in urban section households (Aquatabs); 24% of HRC households (22%
Aquatabs, 2% marketed chlorine products); 53% of CWH households; 72% of FilterPure households; 66% of Klorfasil
spontaneous settlement households (26% Klorfasil, 34% Aquatabs, 6% marketed chlorine options), and 52% of GOW
households (3% Aquatabs, 38% Gadyen Dlo, and 7% marketed chlorine options). In total, 11/442 (2.5%) households
treated water with a HWTS they had not received as part of emergency response distribution, including five families
who used Aquatabs, one family using Jik liquid chlorine, one family using Klowoks chlorine powder, and two families
using an alternate tablet called PYAM.
As only five surveyed families in the Haiti emergency received more than one HWTS option, comparative analysis
cannot be completed in this context. In addition, because each of the populations that were targeted by the programs
were so different, and so geographically dispersed, it is not possible, as it was in Nepal and Turkana, to calculate a
total number of the affected population that had treated water because of this intervention. We therefore use the
number of targeted respondents in each of the programs who have treated water at the time of the unannounced visit,
but adjust to account for what percentage of the respondents are adequately treating their water by multiplying the
percent of people who report treatment by the percent of those who report treatment who have adequate residual
(Table 82). That provides a number showing the percent of the recipient population with adequate residual.
Table 82: Adequate FCR in respondents by program (Haiti)
% of recipients
reporting use
% of those reporting use
with adequate FCR
% of recipients with
adequate FCR
Aquatabs (DSI-rural) 93.3 95.9 89.5
Aquatabs (DSI-urban) 78.5 68.5 53.8
Aquatabs (HRC camps) 21.7 76.5 16.6
Aquatabs (Klorfasil camp) 66.7 75.0 50.0
Gadyen Dlo (DSI) 85.7 100 85.7
Klorfasil (Klorfasil camp) 50.0 66.7 33.5
!"#$#& Univariate analysis
In Haiti, the outcome variables of interest include the dichotomous variables of reporting water treatment, having FCR
greater than or equal to 0.2 mg/L in drinking water, or having a minimum of a 1-log (90%) reduction in E. coli in
untreated water. Because of sample size considerations we could only complete this analysis on the DSI sampled

Page 166 of 178
households that received Aquatabs. The variables we postulated might impact the outcome variables in this
circumstance include: whether or not the female respondent had gone to school or the female head of household
could read, whether the household was damaged in the earthquake, if the family lived in the same place as before the
earthquake, in the household used improved water sources, if the respondent knew a chlorine option before the
emergency, if diarrhea was reported in the household or in children in the household, whether diarrhea was
considered a health problem after the emergency, whether the household believes drinking water is safe, whether the
household covered their storage container, whether the household received group training or household training, and
the socio-economic status of the household.
Results from a univariate analysis shows that respondents in the whole dataset were more likely to report treated
water if: 1) they had moved after the earthquake; 2) they used an unimproved source; and, 3) they felt their water was
safe (the causality on this is likely the other way – they felt their water was safe because it was treated).
The only data set we had sample size on was the DSI distributions to calculate relationships between the outcomes of
FCR, microbiological effectiveness, and inputs. Being in lower SES quintiles and using unimproved sources was
associated with having FCR in drinking water, indicating correct targeting to at-risk populations in the DSI program.
Households with at least a 90% (1-log) reduction of E. coli from untreated to treated drinking water reported less
diarrhea in the household as well (although the confidence interval of this result crossed over 1).
Socio-economic status quintiles were developed using principal component analysis based on household assets
(including beds, bicycles, motorcycles, car/trucks, radios, televisions, mobile phones, refrigerators, generators,
poultry, donkey, cow, and sheep/goat ownership and having part of your house (roof, walls, or floor) constructed out
of non-natural non-temporary materials in the DSI sub-population only. We will continue to work to develop this
model further to predict behavior, however further development is outside the scope of this report.

Page 167 of 178
Table 83: Univariate analysis results (Haiti)
Reported treated
(whole dataset)
FCR
(DSI only)
E. coli improved
(DSI only)
Female respondent attend school 0.807 0.913 0.859
Female HOH able to read 0.857 0.721 0.359
Home damaged in earthquake 0.411 0.430 0.210
Live in the same place as before earthquake 0.001
OR: 2.16 95% CI: 1.3-3.5
0.502 0.777
Use improved source <0.001
OR: 0.16 95% CI: 0.1-0.4
0.003
OR: 0.20 95% CI: 0.1-0.7
0.111
Knew chlorination before emergency 0.642 0.969 0.142
Diarrhea reported in household 0.754 0.194 0.045
OR: 0.53 95% CI: 0.2-1.4
Diarrhea reported in children in household 0.148 0.831 0.347
Believe drinking water is safe <0.001
OR: 2.88 95% CI: 1.6-5.0
0.156 0.738
Covered household drinking water 0.499 0.693 0.453
Received household training 0.437 0.467 0.953
Socio-economic status quintiles (5x2) -- 0.003
5x2 – not shown
0.212
!"#$ Microbiological improvement
In Haiti, FCR, turbidity, and E. coli microbiological samples were collected and analyzed.
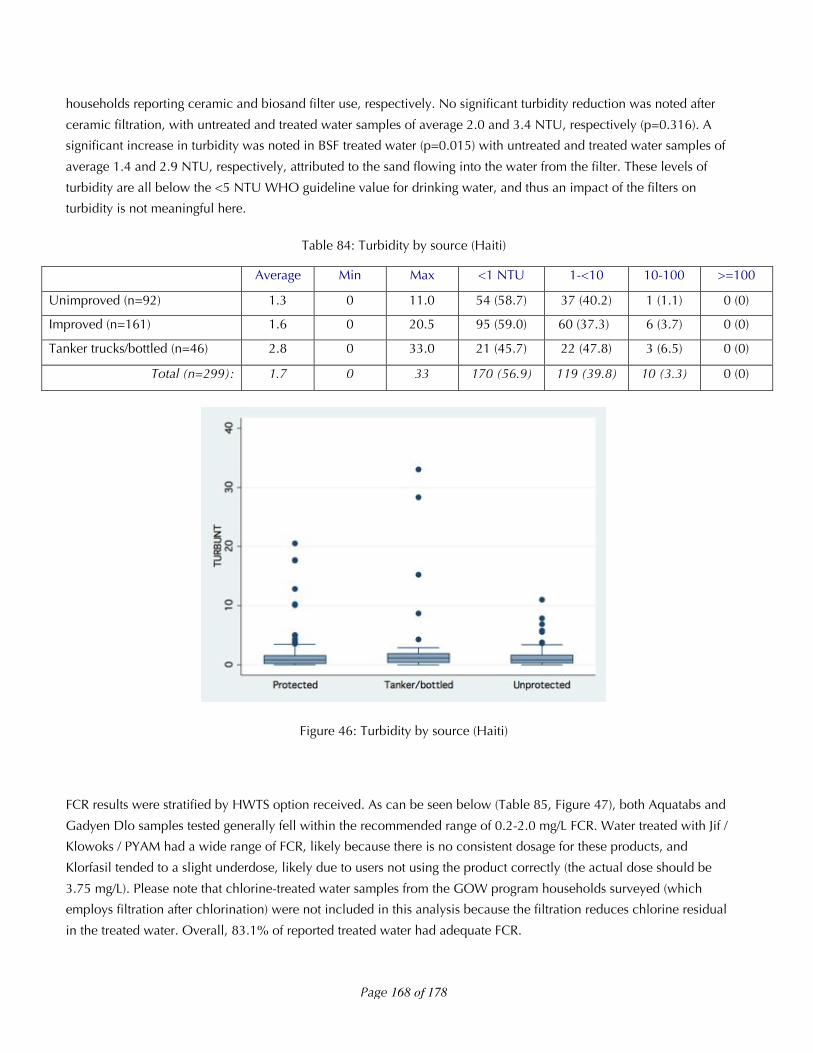
Water turbidity was low across all sources used for drinking water in this emergency (Table 84, Figure 46). Untreated
water samples were obtained from 316 of 442 (71.5%) of surveyed households. Of the 128 households surveyed
without an untreated water sample collected, 35 (27.3%) were because there was only treated water in the
household, 59 (46.1%) were because there was no water at all in the households, and 34 (26.6%) were because the
enumerator did not collect the untreated sample if there was not a matched treated sample and/or the household did
not provide an untreated sample. It is possible that in these 34 households there was no water in the house at the time
of the visit, but that should have been marked differently on the survey form.
Turbidity was sampled in 299 of the 316 collected untreated samples (67.6% of total households surveyed). Only 10
samples were above 10 NTU (3.3%), indicating the need for either a double chlorine dosage or filtration prior to
disinfection. These ten higher turbidity levels were from tanker trucks (3), improved spring (1), unimproved springs (1),
and community sources (4). Treated-untreated sample pairs were available for 29/31 (93.5%) and 23/27 (85.2%)
Page 168 of 178
households reporting ceramic and biosand filter use, respectively. No significant turbidity reduction was noted after
ceramic filtration, with untreated and treated water samples of average 2.0 and 3.4 NTU, respectively (p=0.316). A
significant increase in turbidity was noted in BSF treated water (p=0.015) with untreated and treated water samples of
average 1.4 and 2.9 NTU, respectively, attributed to the sand flowing into the water from the filter. These levels of
turbidity are all below the <5 NTU WHO guideline value for drinking water, and thus an impact of the filters on
turbidity is not meaningful here.
Table 84: Turbidity by source (Haiti)
Average Min Max <1 NTU 1-<10 10-100 >=100
Unimproved (n=92) 1.3 0 11.0 54 (58.7) 37 (40.2) 1 (1.1) 0 (0)
Improved (n=161) 1.6 0 20.5 95 (59.0) 60 (37.3) 6 (3.7) 0 (0)
Tanker trucks/bottled (n=46) 2.8 0 33.0 21 (45.7) 22 (47.8) 3 (6.5) 0 (0)
Total (n=299): 1.7 0 33 170 (56.9) 119 (39.8) 10 (3.3) 0 (0)
Figure 46: Turbidity by source (Haiti)
FCR results were stratified by HWTS option received. As can be seen below (Table 85, Figure 47), both Aquatabs and
Gadyen Dlo samples tested generally fell within the recommended range of 0.2-2.0 mg/L FCR. Water treated with Jif /
Klowoks / PYAM had a wide range of FCR, likely because there is no consistent dosage for these products, and
Klorfasil tended to a slight underdose, likely due to users not using the product correctly (the actual dose should be
3.75 mg/L). Please note that chlorine-treated water samples from the GOW program households surveyed (which
employs filtration after chlorination) were not included in this analysis because the filtration reduces chlorine residual
in the treated water. Overall, 83.1% of reported treated water had adequate FCR.

Page 169 of 178
Table 85: FCR by treatment option (Haiti)
Average (mg/L) Min (mg/L) Max (mg/L) <0.2 mg/L 0.2-2.0 mg/L >2.0 mg/L
Aquatabs (n=185) 1.0 0.0 3.5 29 (15.7) 141 (76.2) 15 (8.1)
Gadyen Dlo (n=5) 1.2 0.5 2.5 0 (0) 4 (80.0) 1 (20.0)
Klorfasil (n=12) 0.5 0 1.5 4 (33.3) 8 (66.7) 0 (0)
Jif / Klowoks / PYAM (n=5) 1.5 0 3.5 2 (40.0) 1 (20.0) 2 (40.0)
Total (n=207) 1.0 0 3.5 35 (16.9) 154 (74.4) 18 (8.7)
Figure 47: FCR by treatment option (Haiti)
E. coli contamination in improved sources (average 88 CFU/100 mL, min=0, max=1000, stdev=187) was significantly
lower (p<0.001) than unimproved sources (323 CFU/100 mL; min=0, max=1800, stdev=503) (Table 86, Figure 48).
The 14 of 25 tanker truck samples with E. coli contamination ranged from 14-1000 CFU/100 mL. FCR was 0 mg/L in
17 of 22 (77.3%) untreated tanker truck water samples. Overall, 27.5% of samples had no E. coli contamination.

Page 170 of 178
Table 86: E. coli concentrations by source water (Haiti)
CFU/100 mL <1 1-<10 10-<100 100-<1000 >=1000
Community source (number (%)) (n=80) 22 (27.5) 17 (21.2) 21 (26.3) 16 (20.0) 4 (5.0)
Well (number (%)) (n=5) 1 (20.0) 0 (0) 2 (40.0) 2 (40.0) 0 (0)
Open well (number (%)) (n=3) 1 (33.3) 0 (0) 1 (33.3) 0 (0) 1 (33.3)
River (number (%)) (n=1) 0 (0) 0 (0) 1 (100) 0 (0) 0 (0)
Unimproved spring(number (%)) (n=33) 6 (18.2) 5 (15.2) 10 (30.3) 5 (15.2) 7 (21.2)
Trucked water (number (%)) (n=17) 6 (35.3) 1 (5.9) 5 (29.4) 3 (17.7) 2 (11.8)
Improved spring (number (%)) (n=13) 6 (46.2) 4 (30.8) 2 (15.4) 1 (7.7) 0 (0)
Rainwater (number (%)) (n=1) 0 (0) 0 (0) 1 (100) 0 (0) 0 (0)
Improved (number (%))(n=116) 35 (30.2) 22 (19.0) 31 (26.7) 22 (19.0) 6 (5.2)
Unimproved (number (%)) (n=37) 7 (18.9) 5 (13.5) 12 (32.4) 5 (13.5) 8 (21.6)
Total (number (%)) (n=153) 42 (27.5) 27 (27.7) 43 (28.1) 27 (17.7) 14 (9.2)
Figure 48: E. coli contamination in source waters (Haiti)
A total of 143 treated/untreated water pairs were analyzed for E. coli contamination. Five samples were completed in
Jik or PYAM or unknown water treatment, which leaves 138 samples remaining. First, the percent of samples treated
with HWTS options that were uncontaminated before treated, as well as the percent of samples that became <1
CFU/100 mL after treatment, and that moved from above 10 CFU/100 mL before treatment to below 10 CFU/100 mL
Page 171 of 178
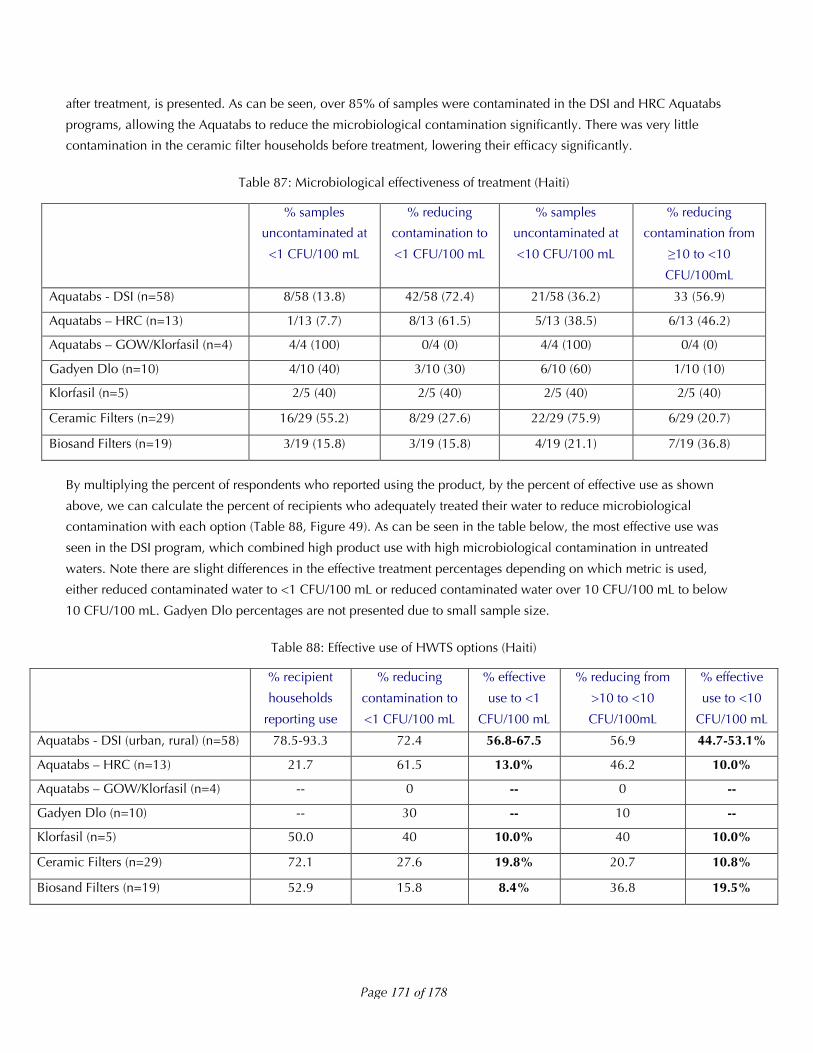
after treatment, is presented. As can be seen, over 85% of samples were contaminated in the DSI and HRC Aquatabs
programs, allowing the Aquatabs to reduce the microbiological contamination significantly. There was very little
contamination in the ceramic filter households before treatment, lowering their efficacy significantly.
Table 87: Microbiological effectiveness of treatment (Haiti)
% samples
uncontaminated at
<1 CFU/100 mL
% reducing
contamination to
<1 CFU/100 mL
% samples
uncontaminated at
<10 CFU/100 mL
% reducing
contamination from
!10 to <10
CFU/100mL
Aquatabs - DSI (n=58) 8/58 (13.8) 42/58 (72.4) 21/58 (36.2) 33 (56.9)
Aquatabs – HRC (n=13) 1/13 (7.7) 8/13 (61.5) 5/13 (38.5) 6/13 (46.2)
Aquatabs – GOW/Klorfasil (n=4) 4/4 (100) 0/4 (0) 4/4 (100) 0/4 (0)
Gadyen Dlo (n=10) 4/10 (40) 3/10 (30) 6/10 (60) 1/10 (10)
Klorfasil (n=5) 2/5 (40) 2/5 (40) 2/5 (40) 2/5 (40)
Ceramic Filters (n=29) 16/29 (55.2) 8/29 (27.6) 22/29 (75.9) 6/29 (20.7)
Biosand Filters (n=19) 3/19 (15.8) 3/19 (15.8) 4/19 (21.1) 7/19 (36.8)
By multiplying the percent of respondents who reported using the product, by the percent of effective use as shown
above, we can calculate the percent of recipients who adequately treated their water to reduce microbiological
contamination with each option (Table 88, Figure 49). As can be seen in the table below, the most effective use was
seen in the DSI program, which combined high product use with high microbiological contamination in untreated
waters. Note there are slight differences in the effective treatment percentages depending on which metric is used,
either reduced contaminated water to <1 CFU/100 mL or reduced contaminated water over 10 CFU/100 mL to below
10 CFU/100 mL. Gadyen Dlo percentages are not presented due to small sample size.
Table 88: Effective use of HWTS options (Haiti)
% recipient
households
reporting use
% reducing
contamination to
<1 CFU/100 mL
% effective
use to <1
CFU/100 mL
% reducing from
>10 to <10
CFU/100mL
% effective
use to <10
CFU/100 mL
Aquatabs - DSI (urban, rural) (n=58) 78.5-93.3 72.4 56.8-67.5 56.9 44.7-53.1%
Aquatabs – HRC (n=13) 21.7 61.5 13.0% 46.2 10.0%
Aquatabs – GOW/Klorfasil (n=4) -- 0 -- 0 --
Gadyen Dlo (n=10) -- 30 -- 10 --
Klorfasil (n=5) 50.0 40 10.0% 40 10.0%
Ceramic Filters (n=29) 72.1 27.6 19.8% 20.7 10.8%
Biosand Filters (n=19) 52.9 15.8 8.4% 36.8 19.5%

Page 172 of 178
Overall, when calculated by program looking at all the different options recipients used in each of the programs 59%
of DSI-rural, 50% of DSI-urban, 15% of HRC, 8% of CWH, 20% of FilterPure, 10% of Klorfasil, and 13% of GOW
surveyed households were using the HWTS option they received to reduce E. coli to international standards in their
drinking water at the time of the unannounced survey.
Figure 49: Treated / untreated water pairs for HWTS options (Haiti)

Page 173 of 178
!"#$ Resistance to sub%optimal use
The only sub-optimal use issue seen in the Haiti earthquake response was the respondents who mentioned they had
stopped using their biosand filter due to sand flowing out of the filter. Upon investigation, we found that the filters
were installed incorrectly, with no standing water level to allow the development of a schmutzdecke for increased
microbiological performance compared to normal sand filters. This would explain the lack of microbiological
reduction seen. In addition, the user complaints about sand flowing out of the tap is probably due to incorrect
installation of the screen or gravel layer. This is not the users using the product sub-optimally, but the installers failing
to assembly the product properly. Because the recipients were over such a large geographical area and the product
requires some technical precision in assembly, it was not possible to for them to fix the product on their own or
obtain technical support.
Figure 50: Improperly installed biosand filter (Haiti)
!"#& Cost analysis
Cost data was generally unavailable within the context of the Haiti earthquake response. Equipment and supplies for
all of the HWTS projects – the Aquatabs order from Ireland that DSI purchased and provided to HRC, the ceramic
filters from the DR, the Klorfasil, the additional generators to make Gadyen Dlo – were all flown into the emergency
via volunteer small planes landing on makeshift airstrips throughout the country. Transportation and logistics costs
were high, but not especially able to be accounted. DSI estimates installation of one system is 15 USD and the cost of
one filter from FilterPure is about 25 USD. An NGO reported tanker truck water cost of 29 USD/1000 Liters of
delivered water. Assuming that a HWTS option can produce 20 Liters of water per day, it becomes more cost-efficient
to use HWTS after 25.9 days in the case of a DSI system (excluding consumable costs of 10 US cents per month after
the initial three month supply including in the 15 USD installation cost) or 43.1 days for the ceramic filter. However,
this does not account for the benefits of centrally treated water, rather than depending on each individual family to
treat their own water.