Few-Shot Learning for Post-Earthquake Urban Damage ...
20
Citation: Koukouraki, E.; Vanneschi, L.; Painho, M. Few-Shot Learning for Post-Earthquake Urban Damage Detection. Remote Sens. 2022, 14, 40. https://doi.org/10.3390/rs14010040 Academic Editors: Masashi Matsuoka and Fumio Yamazaki Received: 28 October 2021 Accepted: 20 December 2021 Published: 23 December 2021 Publisher’s Note: MDPI stays neutral with regard to jurisdictional claims in published maps and institutional affil- iations. Copyright: © 2021 by the authors. Licensee MDPI, Basel, Switzerland. This article is an open access article distributed under the terms and conditions of the Creative Commons Attribution (CC BY) license (https:// creativecommons.org/licenses/by/ 4.0/). remote sensing Article Few-Shot Learning for Post-Earthquake Urban Damage Detection Eftychia Koukouraki * ,† , Leonardo Vanneschi and Marco Painho NOVA Information Management School (NOVA IMS), Universidade Nova de Lisboa, Campus de Campolide, 1070-312 Lisbon, Portugal; [email protected] (L.V.); [email protected] (M.P.) * Correspondence: [email protected] † Current address: Institute for Geoinformatics, University of Münster, Heisenbergstraße 2, 48149 Munster, Germany. Abstract: Among natural disasters, earthquakes are recorded to have the highest rates of human loss in the past 20 years. Their unexpected nature has severe consequences on both human lives and material infrastructure, demanding urgent action to be taken. For effective emergency relief, it is necessary to gain awareness about the level of damage in the affected areas. The use of remotely sensed imagery is popular in damage assessment applications; however, it requires a considerable amount of labeled data, which are not always easy to obtain. Taking into consideration the recent developments in the fields of Machine Learning and Computer Vision, this study investigates and employs several Few- Shot Learning (FSL) strategies in order to address data insufficiency and imbalance in post-earthquake urban damage classification. While small datasets have been tested against binary classification problems, which usually divide the urban structures into collapsed and non-collapsed, the potential of limited training data in multi-class classification has not been fully explored. To tackle this gap, four models were created, following different data balancing methods, namely cost-sensitive learning, oversampling, undersampling and Prototypical Networks. After a quantitative comparison among them, the best performing model was found to be the one based on Prototypical Networks, and it was used for the creation of damage assessment maps. The contribution of this work is twofold: we show that oversampling is the most suitable data balancing method for training Deep Convolutional Neural Networks (CNN) when compared to cost-sensitive learning and undersampling, and we demonstrate the appropriateness of Prototypical Networks in the damage classification context. Keywords: few-shot learning; data balancing; image classification; remote sensing; damage assessment; imbalanced learning 1. Introduction Earthquakes are events of episodic nature, which can have a grave impact on human life and cause immense property loss. The Centre for Research on the Epidemiology of Disasters (CRED) and UN Office for Disaster Risk Reduction (UNDRR) [1] report on the cost of disasters for the period 2000–2019 declared earthquakes as the deadliest type of disaster for the first two decades of the 21st century, and highlight their potential for massive damage to infrastructure. Given that earthquakes are unpredictable, both in terms of time and magnitude, responding appropriately after the event is often critical to minimize the number of casualties. The success of emergency response operations relies on efficient organizational management and rapid reaction. A mandatory precondition to fulfill these requirements is to gain Situational Awareness: to know what has happened, when and where. The suitability of Machine Learning (ML) [2] techniques in different phases of disaster mitigation has been exhibited in recent studies. Harirchian et al. [3] assess the seismic vulnerability given a set of quantifiable parameters. The regional seismicity can also be monitored using ML if the automatically captured ambient noise data are subjected to Convolutional Neural Network (CNN)-based classifiers in order to detect earthquake Remote Sens. 2022, 14, 40. https://doi.org/10.3390/rs14010040 https://www.mdpi.com/journal/remotesensing
-
Upload
khangminh22 -
Category
Documents
-
view
4 -
download
0
Transcript of Few-Shot Learning for Post-Earthquake Urban Damage ...

�����������������
Citation: Koukouraki, E.; Vanneschi,
L.; Painho, M. Few-Shot Learning for
Post-Earthquake Urban Damage
Detection. Remote Sens. 2022, 14, 40.
https://doi.org/10.3390/rs14010040
Academic Editors: Masashi
Matsuoka and Fumio Yamazaki
Received: 28 October 2021
Accepted: 20 December 2021
Published: 23 December 2021
Publisher’s Note: MDPI stays neutral
with regard to jurisdictional claims in
published maps and institutional affil-
iations.
Copyright: © 2021 by the authors.
Licensee MDPI, Basel, Switzerland.
This article is an open access article
distributed under the terms and
conditions of the Creative Commons
Attribution (CC BY) license (https://
creativecommons.org/licenses/by/
4.0/).
remote sensing
Article
Few-Shot Learning for Post-Earthquake UrbanDamage Detection
Eftychia Koukouraki *,† , Leonardo Vanneschi and Marco Painho
NOVA Information Management School (NOVA IMS), Universidade Nova de Lisboa, Campus de Campolide,1070-312 Lisbon, Portugal; [email protected] (L.V.); [email protected] (M.P.)* Correspondence: [email protected]† Current address: Institute for Geoinformatics, University of Münster, Heisenbergstraße 2,
48149 Munster, Germany.
Abstract: Among natural disasters, earthquakes are recorded to have the highest rates of human loss inthe past 20 years. Their unexpected nature has severe consequences on both human lives and materialinfrastructure, demanding urgent action to be taken. For effective emergency relief, it is necessary togain awareness about the level of damage in the affected areas. The use of remotely sensed imagery ispopular in damage assessment applications; however, it requires a considerable amount of labeleddata, which are not always easy to obtain. Taking into consideration the recent developments in thefields of Machine Learning and Computer Vision, this study investigates and employs several Few-Shot Learning (FSL) strategies in order to address data insufficiency and imbalance in post-earthquakeurban damage classification. While small datasets have been tested against binary classificationproblems, which usually divide the urban structures into collapsed and non-collapsed, the potentialof limited training data in multi-class classification has not been fully explored. To tackle this gap,four models were created, following different data balancing methods, namely cost-sensitive learning,oversampling, undersampling and Prototypical Networks. After a quantitative comparison amongthem, the best performing model was found to be the one based on Prototypical Networks, and it wasused for the creation of damage assessment maps. The contribution of this work is twofold: we showthat oversampling is the most suitable data balancing method for training Deep Convolutional NeuralNetworks (CNN) when compared to cost-sensitive learning and undersampling, and we demonstratethe appropriateness of Prototypical Networks in the damage classification context.
Keywords: few-shot learning; data balancing; image classification; remote sensing; damage assessment;imbalanced learning
1. Introduction
Earthquakes are events of episodic nature, which can have a grave impact on humanlife and cause immense property loss. The Centre for Research on the Epidemiology ofDisasters (CRED) and UN Office for Disaster Risk Reduction (UNDRR) [1] report on the costof disasters for the period 2000–2019 declared earthquakes as the deadliest type of disasterfor the first two decades of the 21st century, and highlight their potential for massivedamage to infrastructure. Given that earthquakes are unpredictable, both in terms of timeand magnitude, responding appropriately after the event is often critical to minimize thenumber of casualties. The success of emergency response operations relies on efficientorganizational management and rapid reaction. A mandatory precondition to fulfill theserequirements is to gain Situational Awareness: to know what has happened, when andwhere. The suitability of Machine Learning (ML) [2] techniques in different phases ofdisaster mitigation has been exhibited in recent studies. Harirchian et al. [3] assess theseismic vulnerability given a set of quantifiable parameters. The regional seismicity canalso be monitored using ML if the automatically captured ambient noise data are subjectedto Convolutional Neural Network (CNN)-based classifiers in order to detect earthquake
Remote Sens. 2022, 14, 40. https://doi.org/10.3390/rs14010040 https://www.mdpi.com/journal/remotesensing

Remote Sens. 2022, 14, 40 2 of 20
events [4]. In the post-disaster phase, ML approaches have been employed to locateand measure post-earthquake urban damage, confirming the relevance of this field forsuch kinds of applications [5–15]. Pre-event seismic vulnerability assessment, earthquakemagnitude evaluation and post-event damage detection are complementary aspects ofdisaster mitigation and, if combined, can provide valuable insights to local stakeholdersfor traffic network disruption modeling, restoration planning and cost estimation [16].
To identify the locations that require immediate relief, remotely sensed data are com-monly used because they can provide an overview of a large region at once, and acquiringthem does not pose the same risks as collecting ground-truth data [11]. In the context ofemergency mapping, remotely sensed data usually refer to imagery acquired via satellite,Unmanned Aerial Vehicles (UAVs) or other aerial platforms [17]. As the availability ofthis kind of data and the processing power of modern computational systems have beenconstantly increasing, the possibility of automating the identification and assessment ofpost-disaster damage is also being explored [18]. For this reason, computer vision methodsare employed, aiming to minimize the time overhead and the error that is introduced bythe human factor [9]. Recent studies have demonstrated that ML algorithms outperformtraditional Remote Sensing techniques in image classification tasks [19]. One of the mainobstacles to overcome in the identification of earthquake damage is the small number oftraining samples [6]. The methodology that we follow in this study is based on Few-ShotLearning (FSL), which is a type of ML method, where the available data for the target classi-fication task contains only a limited number of examples with supervised information [20].Since destructive seismic events rarely happen but reacting quickly in such cases is crucial,FSL is competent when it comes to extracting knowledge from a narrow amount of data,and thus, the required effort for data gathering is also reduced. However, an FSL problemis not easy to solve. The lack of data requires a different approach than other ML problems,which rely on having a plethora of samples to train the model. The suggested solutionsmay vary in terms of algorithm, model parameters and data handling [20].
Related research papers that have incorporated FSL for locating ravaged buildingsfocus on binary classification rather than further dividing buildings into different wreckagelevels [5,6,8,10,12]. Multi-class categorization, though, can emphasize or even create classimbalances within the data. The present study seeks to fill this gap by leveraging FSL totackle data deficiency for certain classes in a multi-class problem. There are several meansof dealing with data deficiency [20,21] and imbalance [22]. Applications that track disaster-related damage with ML can benefit from the existence of pre-event data, but on someoccasions, this kind of data may be impossible to acquire. For this reason, we examine howefficient can a model be that is based only on post-event data. The purpose of this study isto implement and evaluate the effect of different FSL approaches on an imbalanced dataset.More precisely, we explore how can the supervised classification of a highly imbalanceddataset be elaborated, to what extent are the representatives of the majority and minorityclasses successfully detected and how indicative is the map overlay of the predictions forthe severity of damage suffered by a geographic region.
The rest of the document is organized as follows. Section 2 reviews related studies,considers the applied research approaches and analyzes the theoretical background that isnecessary to follow the present study. Section 3 presents the data and the methodologicalworkflow. Section 4 explains the results of the study and is followed by Section 5, whichdiscusses the results and proposes future research directions. Finally, Section 6 concludesthe work.
2. Related Work2.1. Remote Sensing in Emergency Mapping
Boccardo and Tonolo [17] have created a systematic review concerning the role ofRemote Sensing in post-disaster damage mapping. Based on their paper, optical imagery isfavored over Synthetic Aperture Radar (SAR) imagery for damage estimation, as it permitsfiner spatial resolution and is semantically richer, which is crucial in operational conditions.

Remote Sens. 2022, 14, 40 3 of 20
Nevertheless, Ge et al. [23] emphasize on the key role of SAR data when the atmosphericconditions do not allow optical sensors to capture imagery of quality. The existence ofpre-event data is mentioned to add up to the quality of collapsed building detection [17].According to Cooner et al. [5], ML algorithms gain popularity in damage assessmentapplications, due to outperforming traditional methods for change detection and imageclassification and due to being capable of dealing with non-linear datasets. The authorscompared Random Forest (RF), Artificial Neural Network (ANN) and Radial Basis FunctionNeural Network (RBFNN) algorithms on panchromatic and multispectral VHR imageryobtained by the satellites WordView1 and QuickBird2. The study concluded that ANNdemonstrates the lowest Error of Omission and the shortest training time, while the modelcould be produced with only panchromatic imagery.
Li et al. [24] performed an extensive survey about object detection in optical RemoteSensing images. As stated in the paper, Deep Learning algorithms are currently the predom-inant approach for visual recognition tasks, including object detection related to the fields ofComputer Vision and Earth Observation. Although in Computer Vision, the employed meth-ods can be region proposal-based or regression-based, Earth Observation applications favorthe first approach [24]. The study also proposed a new benchmark dataset, characterizedby low inter-class and high intra-class variability and tested it with different combinationsof backbone and object prediction architectures, stating that deeper backbone networksdemonstrate a higher Overall Accuracy.
Different incident types affect urban structures differently [11]. However, we assumethat earthquake and wind-induced damages are comparable because they impact thestructural materials in a similar way, causing lateral damage to the constructions [25,26].For this reason, hurricane-related studies are also included in the literature review.
2.2. Deep Learning for Urban Damage Assessment
Anniballe et al. [8] analyzed multispectral and panchromatic, bi-temporal imagesof a small geographic region with the Bayesian Maximum A Posteriori (MAP) criterionand the Support Vector Machine (SVM). The study followed a five-level scale for damageassessment, but the results reported are grouped in heavy damaged buildings (damagegrade = 5) and less damaged buildings (damage grade < 5). SVM demonstrated betterperformance than the MAP classifier for this study case.
Ji et al. [6] applied a CNN architecture called SqueezeNet on single-temporal post-earthquake VHR QuickBird imagery. The study divided the buildings in the city of Port-au-Prince after the Haiti 2010 incident into two categories: collapsed and non-collapsed. As thenon-collapsed buildings outnumbered the completely destroyed ones, the researchersused three different data balancing methods, namely random oversampling, randomundersampling and cost-sensitive, to improve the accuracy.
Ji et al. [12] have shown the potential of pre-trained CNN (VGGNet) models for post-earthquake damage identification. Two models were compared, one trained from scratchand one pre-trained on the benchmark dataset ImageNet [27], with the accuracy resultsgreatly favoring the latter. Both models were fed with labeled bi-temporal VHR imageryand were responsible for binary classification of the buildings: collapsed and non-collapsed.The study also points out the risk of overfitting when the data are limited and makes useof data augmentation to figuratively expand the dataset. Li et al. [10] have also derivedsimilar results when comparing a fine-tuned pre-trained model of Single-Shot MultiboxDetector (SSD) with one trained from scratch for identifying post-hurricane structuraldamage. In contrast with Ji et al. [12], this study used single post-event aerial imagery forclassifying the damage at two different levels: damaged and debris.
Xu et al. [9] performed a comparative study of four different models using the Haiti2010 dataset. Three of the models were built using both pre and post-disaster-labeledimages, and one was built using single post-earthquake data. The study tested the general-ization ability of the best-performing model and found it more competent as the numberof earthquake incidents that are included in the training increases. The reason is the

Remote Sens. 2022, 14, 40 4 of 20
low variability that characterizes each individual incident dataset, a fact that can lead tooverfitting [9].
The need for a common framework for building damage assessment after differentkinds of natural disasters (earthquakes, floods, hurricanes, wildfires, volcanic eruptions,etc.) has been highlighted by Gupta et al. [11]. The study discusses the need for having abenchmark dataset that is compliant with the requirements of ML algorithms taking intoaccount the rarity of occurrences of a large-scale natural disaster and hence the relevantdata shortage. The study’s main contribution is a dataset that consists of bi-temporal VHRlabeled satellite imagery from various disaster incidents. The produced xBD dataset hasalready been used to train and evaluate ML classifiers for damage in the works of otherresearchers [14,15,28]. Valentijn et al. [14] have trained Inception-v3-based CNN models,trying to simulate operational conditions, while Bai et al. [15] developed a combinationof a semi-Siamese network with a pyramid-pooling module. The aforementioned studiesfollow an end-to-end approach for damage localization and classification, meaning that thebuilding extraction is part of the ML pipeline. Touzani and Granderson [29] have outlinedthe necessity for creating accurate Deep Learning models that recognize urban structuresand propose a method for automatic extraction of buildings in openly available datasetsbased on semantic segmentation in order to create a unified training dataset with highvariability that contains them all.
The transferability of pre-trained CNN models to new disaster occasions was alsoexamined by Vetrivel et al. [7]. The study integrated 3D point cloud data on top of verticaland oblique aerial photography. Among the models that were employed, the authorsrecommend the use of a pre-trained CNN as a feature extractor with no further weighttuning because it can achieve Overall Accuracy of the same levels without being as costlyin terms of data and computation. However, the inclusion of site-specific samples canpositively impact the model’s performance [7].
Li et al. [13], taking into consideration the amount of time that labeled data needsto be produced, have employed an unsupervised domain adaptation model based onunlabeled post-hurricane imagery. The model, despite its complexity, as it consists of severalGenerative Adversarial Networks (GANs), a classifier and a self-attention module, wasevaluated by the authors as successful with regards to the transfer learning tasks that wereassigned to it.
2.3. Comparative Analysis
The aforementioned studies concern related applications, where post-disaster urbandamage is tracked with ML. The approaches vary greatly with regards to the methodsemployed. The input imagery and the number of the predicted classes are parameters thataffect the design of the learning pipeline. The input imagery and the number of the predictedclasses are parameters that affect the design of the learning pipeline. Table 1 summarizes theparameters that were encountered in the literature and were evaluated as fundamental for thecreation of the predictive model, namely data source (satellite/airborne, single/bi-temporal),dataset size, ML approach and number of output classes.
The most common incident among earthquake-related studies is the Haiti 2010 earth-quake and has often been the unique data source of the analysis [5,6,12]. Given that themodels built on very specific data have a poor generalization ability [9], newer studies areincorporating more earthquake incidents [7,9] or do not distinguish between the damagecause, especially the ones utilizing the dedicated xBD dataset [11,14,15]. The preferredimagery type in the relevant ML applications is of VHR, acquired either by satellite (usuallyWorldView and QuickBird) or by aerial platforms. Additional data sources, such as 3Dpoint cloud features [7], can be used collaterally, but the basis for the learning processremains optical imagery, which is also meaningful to human vision.

Remote Sens. 2022, 14, 40 5 of 20
Table 1. Data parameters that affect the architecture design. Dataset size refers to building instances.
Study Data Source Dataset Size ML Approach Classes
Cooner et al. [5] Satellite—Bi-temporal 897 RF, ANN, RBFNN 2Ji et al. [6] Satellite—Single post-event 3928 SqueezeNet, data balancing 2
Vetrivel et al. [7] Airborne—Bi-temporal 12,544 CNN, pre-trained CNN 2Anniballe et al. [8] Satellite—Bi-temporal 1667 SVM, MAP 2
Xu et al. [9] Satellite—Single post-event 75,468 AlexNet 2Li et al. [10] Airborne—Single post-event 757 SSD, data augmentation 2
Gupta et al. [11] Satellite—Single post-event 632,228 Shallow CNN and ResNet50 4
Ji et al. [12] Satellite—Bi-temporal 1789 VGGNet, pre-trained VGGNet,data augmentation 2
Li et al. [13] Airborne—Single post-event 34,000 GANs and classifierand self-attention module 3
Valentijn et al. [14] Satellite—Bi-temporal 850,736 Inception-v3 CNN 4
Bai et al. [15] Satellite—Bi-temporal >850,000 Pyramid Pooling Module andSemi-Siamese Network 4
To overcome a possible data shortage and accelerate the creation of a competent pre-dictive model, a plethora of approaches have been put to use. Pre-trained models cantransfer knowledge and save time and computational resources [7,12]. Data augmenta-tion is necessary for small datasets [10] and data balancing for non-linear datasets [6,15].Unsupervised classification is also gaining popularity [24], as it minimizes the effort forlabeling the training data. All the aforementioned strategies are possible solutions to anFSL problem. FSL has already been introduced as a means of dealing with emergencysituations [30–32]. However, the related studies do not address post-disaster emergencymapping explicitly but rather focus on video surveillance [32], tweet classification [30] orindoors safety [31].
As observed in the literature, there is a proportional relationship between the amount ofinput data and the number of output classes. The studies that utilize small-scale datasets fordamage classification categorize the buildings into two classes: damaged/undamaged [5,7],collapsed/non-collapsed [6,12], debris/mild damage [10]. On the other hand, studies basedon larger datasets further split the wreckage level into more categories [11,13]. A finer divisionis beneficial for prioritizing the emergency response in the affected areas. However, multi-class classification problems formed upon a few available data with low inter-class variationcan highlight data imbalances, as shown in the case of Anniballe et al. [8], resulting in aproblem that is difficult to solve. In this study, we explore mechanisms for overcoming theobstacles that are encountered in multi-class damage classification tasks with small datasets.
2.4. Few-Shot Learning (FSL)
FSL is a family of ML approaches, where the target classification task is solved withonly a limited number of available labeled examples [20]. The efforts to systematize FSLas a distinct branch of ML are very recent. The proposed definitions for FSL converge toit being a family of methods for solving ML problems that are characterized by a smallquantity of available labeled data. Since the human brain is capable of learning only from afew examples, FSL can be seen as a way for Artificial Intelligence to approximate humanlearning even more [20]. According to the taxonomy proposed by Kadam and Vaidya [21],the coping strategies can be divided into two categories: data-bound and learning-bound.Data-bound strategies focus on attaining more data so that the sample is big enough toleverage standard Deep Learning network architectures. This can be achieved by transform-ing the existing data, by creating artificial new data or by incorporating similar datasets.Data augmentation is the most common example of a data-bound strategy. Wang et al. [20]further divides the learning-bound methods depending on how the error rate of the learn-ing process is minimized into model and algorithm-based. The model-based approachesaim to narrow down the hypothesis space so that new unlabeled data can be identified

Remote Sens. 2022, 14, 40 6 of 20
based on similarity. This is also called metric learning [21]. Algorithm-based approachesmake use of knowledge acquired by similar learning problems and adjust it accordingly.Pre-trained models are relevant examples that were encountered in the literature.
3. Data and Methodology3.1. Dataset
The data used in this research has been proposed by Gupta et al. [11] and can befound at https://xview2.org/ (last accessed on 14 January 2021). This dataset is basedon Maxar/DigitalGlobe’s Open Data program [33] and consists of imagery that has beenacquired with WorldView and GeoEye satellites. The mean technical specifications of theimagery, as declared in the dataset’s metadata, are presented in Table 2.
The complete xBD dataset refers to multiple disaster categories: volcanic eruption,hurricane, earthquake, fire, flood, monsoon, tornado and tsunami. The dataset is composedof three different file types: (1) VHR satellite imagery (pan-sharpened), (2) JSON fileswith metadata and labels about the buildings of the region and (3) building polygons. Allthree categories contain both pre and post-disaster data. The images referring to prior tothe disaster have plain building labels, while the post-disaster building labels are furtherclassified into four levels of damage: (1) No damage, (2) Minor damage, (3) Major damage and(4) Destroyed. The proposed damage scale is a modification of the EMS-98 standard [34],based on the level of destruction that can be observed from a vertical angle.
The present research is primarily concerned with earthquake-related urban damage,so, for the creation of the predictive models, the earthquake incidents were initially isolated.This led to the collection of 386 images in total, all of which refer to the Mexico City 2017earthquake. As this amount of data is insufficient to train a deep network, data fromhurricane incidents were also incorporated, and the total amount of images increasedto 4432. The reason for this inclusion is that wind and earthquake-related damage issimilar [25,26]. All images are of the same standard dimensions (1024 × 1024 pixels) andspatial resolution; thus, the pre-processing effort is minimized. The disaster incidentsreferred to by the VHR imagery eventually collected from xBD are presented in Figure 1.
Figure 1. The disaster incidents in the training dataset.

Remote Sens. 2022, 14, 40 7 of 20
Table 2. Imagery technical specifications.
Parameter Value
Sensor Resolution 0.66 mGSD 2.65 m
Off-nadir angle 28.4 degreesSun azimuth angle 143.6 degrees
Image Width 1024 pixelsImage Height 1024 pixels
3.2. Methodology
The aim of this study is to implement and compare different FSL approaches. For thispurpose, four models were developed. In Figure 2, we provide an overview of the workflow,from the stage of pre-processing the labeled satellite imagery to the stage of producing mapswith damage predictions. Given the theoretical fundamentals clarified in Section 2, the elab-orated methodology is targeted to tackle models for imbalanced datasets. The followingsubsections describe in detail the methodological components.
Figure 2. Methodology overview.
3.2.1. Data Preparation
Pre-processing includes the preparation of the data for training and testing the models.Images of dimensions 1024 × 1024 are not only extensive for our available computational

Remote Sens. 2022, 14, 40 8 of 20
resources, but they also contain multiple examples of possibly every class per image.Therefore, building instances were cropped, as in the example of Figure 3, using thepolygon coordinates in the respective JSON files and then mapped to the correspondinglabel using a .csv file.
Figure 3. Isolation of labeled building instances.
The resulting dataset was further split into three parts: train, validation and test.The test division was forced to have an equal number of representatives for each class sothat the performance evaluation gives a reliable picture of the model’s accuracy for eachone of the classes, independently from the number of instances of that class in the trainingset. The derived number of examples per class is summarized in Table 3.
Table 3. Number of examples per class in train, validation and test subsets.
Class Train Validation Test
No damage 64.722 21.502 1.000Minor damage 15.575 5.304 1.000Major damage 13.116 4.370 1.000
Destroyed 3.487 1.125 1.000
The subsequent analysis follows two distinct FSL paths: data-bound and learning-bound.All architectures require 3-channel 128 × 128 images as the input. To ensure that the inputimages comply with the appropriate format, downscaling was enforced where necessary.
3.2.2. Data-Bound FSL
As mentioned in Section 2, data-bound methods aim to extend the dataset so thattraditional Deep Learning architectures can be leveraged. In this context, three modelswere developed, with the baseline CNN architecture being the same for all of them. Everymodel utilizes a different data balancing method.
Baseline Architecture
This architecture exploits the framework proposed by Gupta et al. [11], focusing oncreating new observations on how the performance changes according to the data balancingmethod. For the training procedure, batches of 64 images of dimensions 128 × 128 × 3,

Remote Sens. 2022, 14, 40 9 of 20
are fed to a Deep Neural Network that consists of two main components: a shallow CNNand a ResNet50 [35] model. The shallow CNN is composed of six alternating layersof convolutional and pooling blocks. The ResNet50 block is initialized with ImageNetweights. Finally, the outputs of the two chunks are concatenated and fed to three adjacentfully-connected layers. The output of the last fully-connected layer holds the predictedclasses and is compared to the corresponding labels to eventually compute the performancemetrics. The convolutional and the fully-connected layers are ReLu activated. A graphicalinterpretation of the network’s architecture can be observed in Figure 4.
Figure 4. Deep Neural Network baseline architecture.
Method 1—Cost-Sensitive Learning
The first model we implemented aims to smooth the differences among the classesby balancing the training weights as a means of normalizing their importance during thelearning process. This is achieved by weighting the classes according to a cost matrix thatis derived by estimations made on the training data [36]. The importance of the majorityand minority objects is tuned based on this matrix. In this present study, the weight wi ofclass i is normalized based on Equation (1):
wi =|S|
m× |Si|(1)
where m is the number of classes, |S| is the number of examples in the dataset and |Si| isthe number of representatives for this specific class [37]. The calculated class weights areshown in Table 4.
Table 4. Input class weights for Model 1.
Class Weight
no-damage 0.37minor-damage 1.56major-damage 1.85
destroyed 6.95
The train subset of Table 3 is further subjected to batch-wise real-time data augmenta-tion, using Keras ImageDataGenerator class. The gradient optimization was handled by anAdam optimizer. The Adam’s parameters where initially set to α = 0.001 (learning rate),β1 = 0.9 and β2 = 0.99, as suggested for ML problems by Kingma and Ba [38]. After pre-liminary testing experiments, where the training loss was not dropping, the learning ratewas finally tuned to 0.0001.
Method 2—Undersampling
In the second model considered for damage classification, we try to overcome the dataimbalance undersampling all non-minority classes. Examples from the initial dataset are
Remote Sens. 2022, 14, 40 10 of 20
randomly selected so that each class remains with the same number of representatives forthe learning process. The undersampling resulted in 4.600 examples per class, 0.3 of whichcreated the validation set. The learning rate was at first set to 0.0001, as in Method 1, but thetraining loss was increasing and eventually, the learning rate was set to 0.00001. The rest ofthe Adam optimizer’s parameters were kept the same (β1 = 0.9, β2 = 0.99) [38].
Method 3—Oversampling
In the same manner as undersampling, but from the opposite perspective, oversam-pling’s purpose is to balance the classes by creating more examples of the non-majorityclasses. In this case, the oversampling is handled by creating copies of the original examplesand then applying simple transformations to these copies. The possible transformationsare horizontal flipping, vertical flipping, horizontal and vertical flipping and clockwiserotation and counterclockwise rotation. The process was repeated for all the instances ofthe non-majority classes until each class had 1/4 of the final dataset’s instances. The over-sampled dataset contained 340,180 building instances in total, where 0.3 of every classmade the validation set. Following the same steps for Method 1, the learning rate for thetraining process was set to 0.0001, and the Adam optimizer parameters were set to β1 = 0.9and β2 = 0.99.
3.2.3. Learning-Bound FSL: Method 4—Prototypical Networks
The last candidate follows a different FSL strategy. While deep networks, such asResNet, can be predictive powerhouses when there are plenty of training data, optingfor a deep architecture when there is not enough data may not be the most reasonableoption. Among state-of-the-art FSL-specific algorithms, Prototypical Networks (ProtoNets),initially introduced by Snell et al. [39], have shown to be able to detect even new classesthat are not part of the training data.
Prototypical Networks combine elements from the fields of Meta-learning and Metriclearning. Meta-learning, being the subfield of ML that leverages experience acquired bysimilar tasks to accelerate the learning process of new tasks, is also referred to as “learningto learn” [40]. In Prototypical Networks, this is achieved by measuring distances betweenfeatures, hence learning the metric space. The basic idea is to create a prototype (i.e., avector mean) of each class and categorize the input feature based on the distance betweenthe two. This distance is actually the “metric” in metric learning.
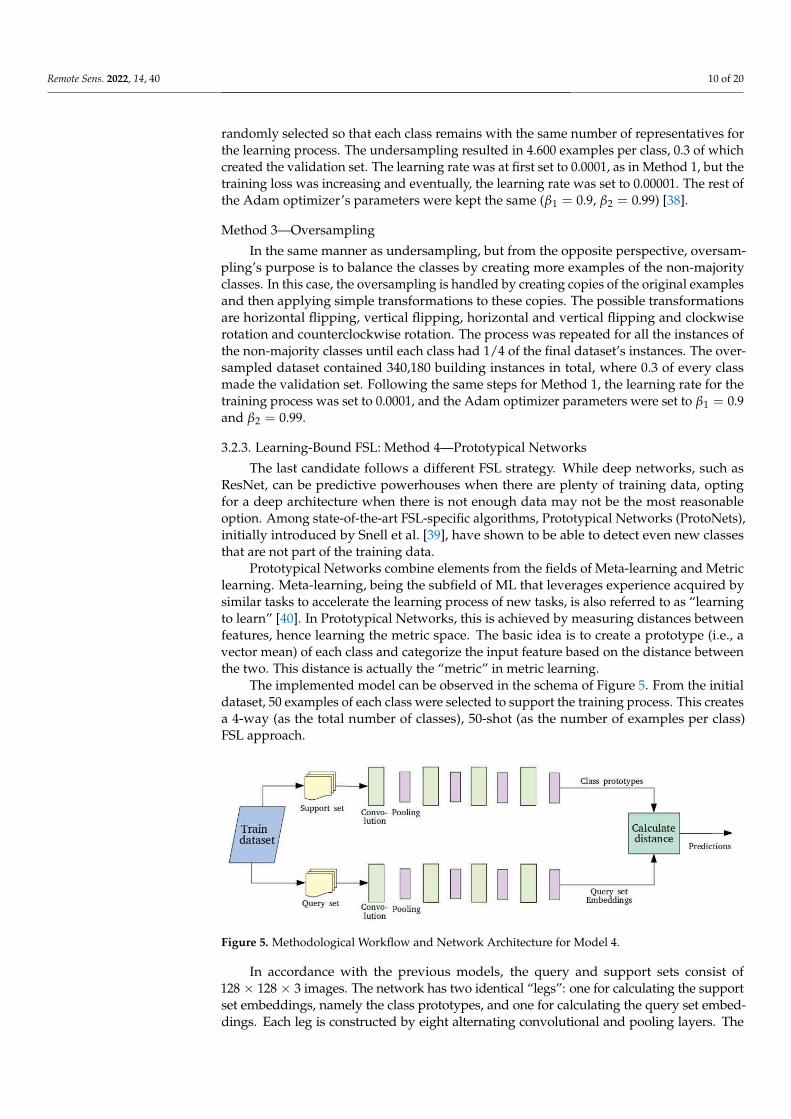
The implemented model can be observed in the schema of Figure 5. From the initialdataset, 50 examples of each class were selected to support the training process. This createsa 4-way (as the total number of classes), 50-shot (as the number of examples per class)FSL approach.
Figure 5. Methodological Workflow and Network Architecture for Model 4.
In accordance with the previous models, the query and support sets consist of128 × 128 × 3 images. The network has two identical “legs”: one for calculating the supportset embeddings, namely the class prototypes, and one for calculating the query set embed-dings. Each leg is constructed by eight alternating convolutional and pooling layers. The

Remote Sens. 2022, 14, 40 11 of 20
convolutional blocks are ReLu activated. Finally, the Euclidean distance between the queryembedding and every class prototype is calculated in order to compute the class prediction.The learning rate was set to 0.001 [39] and the decay was handled by an Adam optimizer withbeta parameters set to β1 = 0.9 and β2 = 0.99 [38].
4. Results
Following the methodological designs described, this section presents the resultsacquired by the experimental process and carries out a comparative analysis of the models’training duration and their performance on unseen data. The selected best model is alsotested against RGB pan-sharpened satellite images to infer damage assessment maps.The trained models, the pre-processed training and validation datasets and the code areavailable in the links provided in Supplementary Materials.
4.1. Training Time
The models were trained until the loss became less than 1%. A summary of the trainingtime that was required to achieve the best model of each architecture is provided in Table 5.All training processes took place on a Linux Ubuntu 18.04 machine, equipped with IntelCore [email protected] GHz CPU and 16 GB RAM.
Table 5. Training time for the best model of each method.
Model Epochs Training Time/Epoch (Mean) Total Training Time
Balance weights 57 47 min 44 h, 40 minUndersampling 55 6.5 min 6 hOversampling 40 2 h, 13 min 88 h, 40 min
ProtoNets 21 13.5 min 4 h, 45 min
Models 1, 2 and 3 use the same baseline, so we can observe how the size of the traindataset affects the time that is required to create one epoch and, eventually, to conclude thelearning process. This is expected, as one epoch has to iterate through all data, and thus,more data will demand more time for the same network. In fact, the two variables appearto be almost linearly related. On the other hand, the Prototypical Networks implementationdepends on a completely different architecture, which apparently needs more time to trainan equivalent amount of data. As observed in Table 5, Model 3, based on the oversamplingstrategy, took the longest to train (88 h and 40 min) and Model 4, based on PrototypicalNetworks, had the shortest total training time (4 h and 45 min). Model 2, based on theundersampling strategy, had the shortest training time per epoch but needed more epochsfor the training process to reach the target loss of 1%.
4.2. Performance Metrics
The result image classification in Remote Sensing applications is usually evaluated withOverall Accuracy, which represents the fraction of correctly classified instances or pixels ina map [41]. However, Overall Accuracy is by definition biased against the minority/non-majority classes and relying entirely on this metric can lead to ambiguous conclusions [22,42].For this reason, for the evaluation of the elaborated models, we have used Precision, Recalland F-score metrics. The formulas for calculating these metrics are as following:
Precision =TP
TP + FP(2)
Recall =TP
TP + FN(3)
where TP stands for the sum of True Positives, FP stands for the sum of False Positives andFN stands for the number of False Negatives. F-score is a combination of precision andrecall. It ranges between 0 (worst) and 1 (best) and is defined accordingly:

Remote Sens. 2022, 14, 40 12 of 20
F-score =2 · Recall · PrecisionRecall + Precision
(4)
4.2.1. Model 1—Cost-Sensitive Learning
As reported in Table 6, all metrics for Destroyed are equal to 0, confirming that noexamples of this class are detected. This is due to the train and validation subsets beingextremely imbalanced, while the test subset has been designed to have an equal number ofexamples for every class. As such, a model that favors the majority class but ignores theminority class can still achieve good performance metrics if not tested against a balanceddataset. Additionally, the class Minor damage is the most favored one, attracting examplesfrom all other classes, as indicated by the highest demonstrated recall in combination withthe lowest precision value. A recall value equal to 0.69 means that among the total instancesof the class in the dataset, 69% were correctly classified. Major damage precision is 0.49,indicating that almost half of the predicted instances for this class are correct predictions.All the other results achieved by the model seem rather poor.
Table 6. Performance metrics for Model 1 (cost-sensitive learning strategy).
Precision Recall F-Score
No damage 0.33 0.30 0.31Minor damage 0.30 0.69 0.42Major damage 0.49 0.38 0.43
Destroyed 0 0 0
4.2.2. Model 2—Undersampling
The results returned by this method are presented in Table 7. The effect of balancingthe dataset that was used for training is immediately visible since all classes are detectedby this model. Consistent with Model 1, Minor damage is favored, as indicated by thehigh recall value. The precision for Minor damage is the lowest, which means that the totalpredictions are much more than the relevant predictions. For the other three classes, theprecision scores are over 50%. On the other hand, recall achieves a high value for Destroyed,resulting in a respectively high f-score value. The precision is higher than Model 1 forall classes and, only Major damage shows significantly lower values for recall and f-score.Overall, Model 2 performs much better than Model 1 but stills shows poor predictioncapabilities for certain classes.
Table 7. Performance metrics for Model 2 (undersampling strategy).
Precision Recall F-Score
No damage 0.55 0.35 0.43Minor damage 0.40 0.70 0.51Major damage 0.58 0.29 0.39
Destroyed 0.69 0.74 0.71
4.2.3. Model 3—Oversampling
In Table 8, the performance results of the CNN model that was trained with the over-sampled dataset are reported. Observing this table, we can immediately have an intuitionthat this data-balancing strategy is better than the previous ones because the obtained f-scorevalues are consistently higher for all classes, with values ranging from 0.52 (No damage) to 0.75(Destroyed). Apart from the precision of Minor damage, all performance metrics demonstrate anupward trend relative to how many times the class representatives were oversampled in thetraining dataset. It can be observed that the more times a class was oversampled, the highestthe metrics that were achieved, with class Destroyed, initially the minority class, exhibitingthe highest values. Additionally, the recall for No damage is below 0.50, which indicates that

Remote Sens. 2022, 14, 40 13 of 20
less than half of the undamaged buildings were identified correctly. Minor damage exhibitsborderline precision but relatively high recall, which means that attracts examples from otherclasses. Nevertheless, all classes achieve their best performance so far.
Table 8. Performance metrics for Model 3 (oversampling strategy).
Precision Recall F-Score
No damage 0.60 0.46 0.52Minor damage 0.49 0.59 0.53Major damage 0.69 0.63 0.66
Destroyed 0.72 0.78 0.75
4.2.4. Model 4—ProtoNets
Table 9 clearly shows that Model 4 succeeds in identifying more than half of all classes’representatives. Precision, recall and f-score exhibit values higher than 50% for all classes,indicating a reliable model. Precision is higher than recall for all classes, except for Nodamage. This indicates a relatively low possibility for Minor damage, Major damage andDestroyed to attract examples from other classes since an instance is classified as such onlywhen there are clear indications that it indeed belongs to this class. Minor damage andMajor Damage, which represent the middle levels in the classification scale, show lowerperformance metrics than the other two classes (No damage and Destroyed), with Majordamage values being slightly higher than Minor damage. Noteworthily, No damage andDestroyed performance are better than all previous Models, and class Destroyed has the bestclass performance for Model 4 across all metrics.
Table 9. Performance metrics for Model 4 (ProtoNets).
Precision Recall F-Score
No damage 0.60 0.69 0.64Minor damage 0.55 0.52 0.54Major damage 0.59 0.57 0.58
Destroyed 0.83 0.75 0.79
To summarize, cost-sensitive learning (Model 1) is immediately excluded, as it is un-able to detect one class and has an overall performance that is the poorest of all candidates.Undersampling (Model 2) seems relatively efficient in detecting Destroyed buildings, but thevery low precision of No damage and Minor damage and the low recall of No damage and Majordamage make it a questionable candidate for this type of problem. Oversampling (Model 3)and ProtoNet (Model 4) show a comparably adequate overall performance. However, Pro-toNet is much more competent in detecting No damage buildings and is much faster to train.Therefore, based on the evaluation of the computed performance metrics on the testingdataset, ProtoNet is more appropriate to fulfill the requirements of a structural damageclassification problem and, thus, Model 4 is selected to infer damaged building maps.
4.3. Inference
To enrich our results with a practical context, three test cases were selected to visualizethe model inference in terms of mapping the assessed polygons. For each of these examples,the predictions were collated with the polygon labels, and the difference between thesetwo images was calculated. Since the output classes represent a damage gradient, wedefined the misclassification difference from label as the interval between the prediction andthe true class of every polygon, to quickly assess how far the prediction is from reality.For example, a No damage building that was falsely identified as Minor damage, Majordamage or Destroyed will have a misclassification difference of 1, 2 or 3, respectively. Amisclassification difference equal to zero means that the prediction was correct.

Remote Sens. 2022, 14, 40 14 of 20
4.3.1. Dense Urban Area, Hardly Affected
The first test case that we considered was extracted from the Mexico 2017 earthquake;whose reported magnitude was 7.1 on the Richter scale [43]. It represents a dense urbanarea that was merely affected by the incident, so almost all polygons are expected to belongto class No damage (see Figure 6b). As illustrated in Figure 6a, the model detects almostequal examples from all four classes.
Figure 6. Application of ProtoNet model on a test case from Mexico 2017. Satellite image overlaidwith: (a) the predictions, (b) the labels and (c) the difference between the two.
Comparing Figure 6a,b, and also consulting Figure 6c, we can see a tendency formisclassification, especially in the top left corner of the region (North–Northwest), wherethe majority of the instances have been identified as Major damage or Destroyed. In the rest ofthe image, most of the buildings are classified as No damage or Minor damage, with the sparsepresence of Major damage buildings and even fewer Destroyed. Likewise, the misclassificationdifferences are higher towards the top and left of the image. This depiction is explained bythe No damage recall and the Minor damage and Major damage precision, which leave spacefor such misclassifications. Overall, the general impression of the severity of damage for thewhole area can be misleading.
4.3.2. Urban Area, Severely Affected
The second test case is a snapshot of the tornado Joplin’s aftermath in Joplin, Missouri,USA. The tornado’s maximum winds reached over 200 miles per hour [44]. In contrastwith the first test case, this area is highly affected. According to the ground truth (seeFigure 7b), all building labels belong to Destroyed or Major damage categories, except forfour buildings in the lower right corner. Nevertheless, the model classifies instances ofall classes across the entire region (see Figure 7a). Moving to the bottom of the image,the structures tend to be classified more as Major damage and Destroyed, eventually givingthe broader look of a region severely attacked by the natural disaster. In a similar fashion,the misclassification differences appear to be higher in the top half of the image (seeFigure 7c). The misclassifications appear less in Figure 7 than in Figure 6, a fact that issupported by the higher performance metrics of Model 4 for Destroyed, which is the mostfrequent class in this region.

Remote Sens. 2022, 14, 40 15 of 20
Figure 7. Application of ProtoNet model on a test case from tornado Joplin. Satellite image overlaidwith: (a) the predictions, (b) the labels and (c) the difference between the two.
4.3.3. Coastal Area, Moderately Affected
The last case considers a coastal line from Panama City, Florida, USA, after the hur-ricane Michael, which recorded maximum sustained wind speeds equal to 161 miles perhour [45], stroke the area. The region contains examples of all four classes (see Figure 8b).Again, we can observe a relatively high rate of misclassifications, as the model misses halfof the classified items. The two Destroyed buildings in the top section of the image werecategorized as Major damage and Minor damage. The main dissonance between the groundtruth in Figure 8b and the predictions in Figure 8a are the three No damage structures thatwere classified as Destroyed. Aside from these, the misclassified instances have a distanceof 1 or 2 from the correct class, meaning that they were assigned to a neighboring class ofthe correct one. In this example, we observe a tendency for smaller misclassification differ-ences. A possible explanation is that the buildings of larger areas in Figure 8 (comparedto the smaller building sizes in Figures 6 and 7) contain more pixels and, thus, hold moreinformation that is important for the classification process.
Figure 8. Application of ProtoNet model on a test case from Hurricane Michael. Satellite imageoverlaid with: (a) the predictions, (b) the labels and (c) the difference between the two.
Remote Sens. 2022, 14, 40 16 of 20
5. Discussion
Previous work indicates that the common trend for urban damage assessment withRemote Sensing is to use Deep Learning. The data shortage is mostly addressed withdata augmentation, but pre-trained models and unsupervised learning have also been putto the test. All these approaches are considered Few-Shot Learning, demonstrating theapplicability of this Machine Learning family of strategies in relevant problems. In thisstudy, we took into consideration the type of input imagery (labeled optical imagery) andthe intended number of output classes (four-level damage scale) to select the appropriatemethodological components. According to the conclusions drawn by the literature review,we confronted the data shortage in two distinct ways: (1) balancing and augmenting thedataset to make it suitable for training a Deep Architecture and (2) metric Few-Shot Learn-ing with Prototypical Networks. More data from hurricane incidents were incorporatedin the analysis as a first step of expanding the dataset with data from related problems.Subsequently, four different models were developed and compared.
As revealed by the quantitative evaluation to which the models were subjected, over-sampling achieved the highest precision and f-score values for all classes and the highestrecall values for all classes except Minor damage, amongst all three data-balancing strategiesfor Deep Learning architectures. This outcome is consistent with related studies that haveused the xBD dataset for model training. Valentijn et al. [14] have compared cost-sensitivelearning with a combination of over and undersampling and conclude that the latter ismore effective in the classification outcome. Bai et al. [15] mention that after preliminaryexperiments, they chose to use oversampling to train their models. Contrarily Ji et al. [6]used a different dataset to train a binary CNN-based classifier and found cost-sensitivelearning more effective as a balancing operation.
The comparison of the four models demonstrates that Prototypical Network modelscan outperform Deep Learning models in damage classification problems with data scarcity.However, in accordance with other studies from the literature, it was not easy to acquirevery high accuracy results for a small dataset with slight inter-class disparities in a multi-class classification task. Furthermore, although the xBD dataset is not uncommon in therecent damage classification studies, its use of it in research that focuses on FSL has notbeen encountered in the literature. As a consequence, similar studies exploit the entirety ofthe xBD for model training. Valentijn et al. [14], who trained a model based on Inception-v3with xBD, report on recall as the following: No damage: 0.867, Minor damage: 0.541, Majordamage: 0.607 and Destroyed: 0.679. As shown in Table 9, the recall of the ProtoNets modelis 0.69 for No damage, 0.52 for Minor damage, 0.57 for Major damage and 0.75 for Destroyed.The results are not only comparable but also can surpass the performance of a model trainedwith the entire dataset. Bai et al. [15], who also trained their proposed architecture with xBD,report on the same evaluation metrics as the present paper, namely precision, recall andf-score, and distinguish between localization and classification metrics, so the comparisonwith the values of Table 9 is more straight-forward. For No damage, the results for precision,recall and f-score are 90.64%, 87.07% and 89.85%, respectively, and are significantly higherthan the respective values in Table 9. On the contrary, the calculated metrics for Minordamage (precision: 35.51%, recall: 49.50%, f-score: 41.36%) are significantly lower thanthe values of Table 9. For Major damage, the Bai et al. [15] performance metrics (precision:65.80%, recall: 64.93%, f-score: 65.36%) are higher than Model 4. Finally, for Destroyed,the precision in Bai et al. [15] is 87.08%, which is higher than Model 4, but the other twometrics (recall: 57.87%, f-score: 69.55%) are lower than Model 4. As a general remark,Model 4, which is based on ProtoNets, exhibits more consistent behavior across the fourclasses, but it performs significantly lower for No damage.
Based on the intuitive interpretation gained by the visual mapping of the predictionsof Model 4 compared to the ground truth, we can deduce that the tested model has plentyof room for improvement but seems promising for tackling the problem of post-earthquakeurban damage assessment. The most confounding aspect of the results is when No damagebuildings are misinterpreted as Destroyed and vice versa because in a real case scenario it

Remote Sens. 2022, 14, 40 17 of 20
could lead to consuming critical resources and time for assisting the wrong locations. Itmust be stated that such misclassifications seem to be more rare as the area of the polygonincreases. In the broader context of emergency response, the significance of the damageclassification output should be validated by other data sources. Seismic vulnerability reports,smart building structural monitoring [46] and earthquake magnitude measurements basedon environmental noise [4] can be ancillary information to earth observation-based damageclassification. The aforementioned information sources, along with ground-truth verification,should be taken into account for the response planning by the local authorities, as the trafficnetwork capacity and the citizen mobility demands change dramatically during the recoveryprocess [16].
While the obtained results from Model 4 seem promising, there are certain limitationsto the extent a 50-shot metric-learning approach on satellite imagery of this resolution canreach. Randomly picking 50 representatives of each class to train a ProtoNet model mayhave led to excluding important information carried by the data. Additionally, satelliteimagery of higher resolution is usually private, and thus, very difficult to acquire. Themodel’s ability to assess damage is also limited to disasters of a magnitude similar to theevents in the training data set.
Since the outcome is encouraging, further research on this subject is recommended.Although remotely sensed imagery of higher resolution is difficult to obtain, we anticipatethat a similar study with satellite or UAV imagery of higher resolution should be pursued.UAVs can also provide oblique perspectives of the buildings, which may hold importantinformation in the context of structural damage and have been already applied in similarapplications [7]. Furthermore, instead of picking at random a few examples from theavailable data, certain data sampling techniques, such as Near-Miss and Condensed NearestNeighbor Rule, can be employed to determine the most useful samples to train a model.We strongly believe that Prototypical Networks in the context of urban damage assessmentdeserve more exploration. The number of shots, the prototyping function and the distancefunction are parameters to experiment with, and that could improve the existing results.
6. Conclusions
This study employed Very-High Resolution pan-sharpened satellite imagery andMachine Learning in order to identify the level of structural destruction induced by acatastrophic earthquake incident. Aiming to approximate a real case scenario, wherethe available labeled post-event data are limited, and the pre-event data are possiblynonexistent, the different explored possibilities tackle data insufficiency and imbalance byimplementing Few-Shot Learning strategies and pave the way for a new approach to thedifficult problem of multi-class damage classification that is formulated upon limited data.
The classification of an imbalanced dataset can be solved either by adjusting the weightmatrix, in a way trying to normalize the number of examples for every class (cost-sensitivelearning) or by selecting the same number of representatives for each class to build thetraining set. For a balanced Deep CNN training, three different models were created:Model 1 with cost-sensitive learning, Model 2 with undersampling and Model 3 withoversampling. For Model 4, a 50-shot ProtoNet was trained. This process resulted in fourmodels, each having been trained with a different dataset in terms of the total numberof examples and the class proportions. Nevertheless, all models were evaluated basedon the same balanced set of completely unseen data. The first method was eventuallyinefficient in our case while using a balanced dataset when training image classificationmodels immediately added up to the overall performance. Undersampling may cause aloss of decisive information for the classification process, and thus, it is not as considerableas oversampling for training a Deep CNN model. However, for Prototypical Networks,randomly picking a few samples per class was enough for creating the most effective andefficient model.
The four models were compared using precision, recall and f-score. Model 4, builtupon Prototypical Networks, showed the most consistent performance according to the

Remote Sens. 2022, 14, 40 18 of 20
three metrics, although Model 3 (data oversampling in the pre-processing stage) exhibitedalmost equally good results for most classes. Taking a closer look, all four approaches havea different impact on each class. It can be argued that such an eminently imbalanced datasetcannot fully support the training of a multi-class predictive model with cost-sensitivelearning since Model 1 is entirely unable to detect the minority class. As stated before,undersampling also leads to dismissing valuable information and hence, the resultingModel 2 has a limited predictive ability over certain classes but performs very well for theminority class. Oversampling seems to be more competent for creating a Deep CNN-basedpredictive model but has a borderline performance for the majority class. Model 4 seems toachieve a robust performance for all classes, being able to correctly predict more than halfof their instances. Consequently, Model 4 was used for creating damage assessment mapsto provide an idea of the model’s practical applicability.
The predictions of Model 4 were overlaid with the satellite imagery and comparedwith the true polygon labels to obtain a qualitative impression of how close the output of themodel is to reality. Even though the model is in the right direction for damage assessment,it would not be advisable to base on it an estimation about how gravely an area was affected(Figures 6–8). Improvements must still be made so that the possible misinterpretationsbetween No damage and Destroyed buildings are eliminated. This phenomenon seems lessfrequent for polygons of a larger area.
Supplementary Materials: Supplementary materials supporting the study, including pre-processeddata and trained models, can be accessed at https://doi.org/10.17605/osf.io/zvdgw.
Author Contributions: Conceptualization: E.K. and L.V.; Methodology: E.K., L.V. and M.P.; Investi-gation, Software, Formal analysis, Writing—original draft preparation, Visualization: E.K.; Validation,Writing—review and editing, Supervision, Funding acquisition: L.V. and M.P. All authors have readand agreed to the published version of the manuscript.
Funding: This study was partially supported by FCT, Portugal, through funding of projects BINDER(PTDC/CCI-INF/29168/2017) and AICE (DSAIPA/DS/0113/2019).
Institutional Review Board Statement: Not applicable.
Informed Consent Statement: Not applicable.
Data Availability Statement: Research data supporting this publication were accessed on 14 January2021 at https://xview2.org/ under the license CC BY-NC-SA 4.0.
Acknowledgments: E.K. would like to acknowledge the Erasmus Mundus scholarship program,for providing the context and financial support to carry out this study, through the admission to theMaster of Science in Geospatial Technologies.
Conflicts of Interest: The authors declare no conflict of interest.
AbbreviationsThe following abbreviations are used in this manuscript:
ANN Artificial Neural NetworkCNN Convolutional Neural NetworkCRED Centre for Research on the Epidemiology of DisastersFSL Few Shot LearningGAN Generative Adversarial NetworkGSD Ground Sampling DistanceMAP Maximum A PosterioriML Machine LearningProtoNets Prototypical NetworksRBFNN Radial Basis Function Neural NetworkReLu Rectified Linear unitRF Random Forest

Remote Sens. 2022, 14, 40 19 of 20
SAR Synthetic Aperture RadarSSD Single-Shot Multibox DetectorSVM Support Vector MachineUAV Unmanned Aerial VehicleUNDRR UN Office for Disaster Risk ReductionVHR Very High Spatial Resolution
References1. Centre for Research on the Epidemiology of Disasters (CRED); UN Office for Disaster Risk Reduction (UNDRR). Human Cost of
Disasters: An Overview of the Last 20 Years (2000–2019); Technical Report; CRED: Brussels, Belgium; UNDRR: Geneva, Switzerland, 2020.2. Mitchell, T. Machine Learning, 1st ed.; McGraw-Hill: New York, NY, USA, 1997.3. Harirchian, E.; Kumari, V.; Jadhav, K.; Rasulzade, S.; Lahmer, T.; Raj Das, R. A Synthesized Study Based on Machine Learning Approaches
for Rapid Classifying Earthquake Damage Grades to RC Buildings. Appl. Sci. 2021, 11, 7540. [CrossRef]4. Mezyk, M.; Chamarczuk, M.; Malinowski, M. Automatic Image-Based Event Detection for Large-N Seismic Arrays Using a
Convolutional Neural Network. Remote Sens. 2021, 13, 389. [CrossRef]5. Cooner, A.J.; Shao, Y.; Campbell, J.B. Detection of urban damage using remote sensing and machine learning algorithms:
Revisiting the 2010 Haiti earthquake. Remote Sens. 2016, 8, 868. [CrossRef]6. Ji, M.; Liu, L.; Buchroithner, M. Identifying collapsed buildings using post-earthquake satellite imagery and convolutional neural
networks: A case study of the 2010 Haiti Earthquake. Remote Sens. 2018, 10, 1689. [CrossRef]7. Vetrivel, A.; Gerke, M.; Kerle, N.; Nex, F.; Vosselman, G. Disaster damage detection through synergistic use of deep learning
and 3D point cloud features derived from very high resolution oblique aerial images, and multiple-kernel-learning. ISPRS J.Photogramm. Remote Sens. 2018, 140, 45–59. [CrossRef]
8. Anniballe, R.; Noto, F.; Scalia, T.; Bignami, C.; Stramondo, S.; Chini, M.; Pierdicca, N. Earthquake damage mapping: An overallassessment of ground surveys and VHR image change detection after L’Aquila 2009 earthquake. Remote Sens. Environ. 2018,210, 166–178. [CrossRef]
9. Xu, J.Z.; Lu, W.; Li, Z.; Khaitan, P.; Zaytseva, V. Building Damage Detection in Satellite Imagery Using Convolutional NeuralNetworks. arXiv 2019, arXiv:1910.06444.
10. Li, Y.; Hu, W.; Dong, H.; Zhang, X. Building damage detection from post-event aerial imagery using single shot multibox detector.Appl. Sci. 2019, 9, 1128. [CrossRef]
11. Gupta, R.; Hosfelt, R.; Sajeev, S.; Patel, N.; Goodman, B.; Doshi, J.; Heim, E.; Choset, H.; Gaston, M. xBD: A Dataset for AssessingBuilding Damage from Satellite Imagery. arXiv 2019, arXiv:1911.09296.
12. Ji, M.; Liu, L.; Zhang, R.; Buchroithner, M.F. Discrimination of earthquake-induced building destruction from space using apretrained CNN model. Appl. Sci. 2020, 10, 602. [CrossRef]
13. Li, Y.; Lin, C.; Li, H.; Hu, W.; Dong, H.; Liu, Y. Unsupervised domain adaptation with self-attention for post-disaster buildingdamage detection. Neurocomputing 2020, 415, 27–39. [CrossRef]
14. Valentijn, T.; Margutti, J.; van den Homberg, M.; Laaksonen, J. Multi-Hazard and Spatial Transferability of a CNN for AutomatedBuilding Damage Assessment. Remote Sens. 2020, 12, 2839. [CrossRef]
15. Bai, Y.; Hu, J.; Su, J.; Liu, X.; Liu, H.; He, X.; Meng, S.; Mas, E.; Koshimura, S. Pyramid Pooling Module-Based Semi-SiameseNetwork: A Benchmark Model for Assessing Building Damage from xBD Satellite Imagery Datasets. Remote Sens. 2020, 12, 4055.[CrossRef]
16. Costa, C.; Figueiredo, R.; Silva, V.; Bazzurro, P. Application of open tools and datasets to probabilistic modeling of road trafficdisruptions due to earthquake damage. Earthq. Eng. Struct. Dyn. 2020, 49, 1236–1255. [CrossRef]
17. Boccardo, P.; Tonolo, F.G. Remote sensing role in emergency mapping for disaster response. In Engineering Geology for Societyand Territory—Volume 5: Urban Geology, Sustainable Planning and Landscape Exploitation; Springer International Publishing: Cham,Switzerland, 2015; pp. 17–24. [CrossRef]
18. Kakooei, M.; Baleghi, Y. Fusion of satellite, aircraft, and UAV data for automatic disaster damage assessment. Int. J. Remote Sens.2017, 38, 2511–2534. [CrossRef]
19. Maxwell, A.E.; Warner, T.A.; Fang, F. Implementation of machine-learning classification in remote sensing: An applied review.Int. J. Remote Sens. 2018, 39, 2784–2817. [CrossRef]
20. Wang, Y.; Yao, Q.; Kwok, J.; Ni, L.M. Generalizing from a Few Examples: A Survey on Few-Shot Learning. ACM ComputingSurveys (CSUR) 2020, 53, 1–34. [CrossRef]
21. Kadam, S.; Vaidya, V. Review and analysis of zero, one and few shot learning approaches. In Proceedings of the 18th InternationalConference on Intelligent Systems Design and Applications (ISDA 2018), Vellore, India, 6–8 December 2018; Volume 940,pp. 100–112. [CrossRef]
22. Branco, P.; Torgo, L.; Ribeiro, R. A Survey of Predictive Modelling under Imbalanced Distributions. arXiv 2015, arXiv:1505.01658.23. Ge, P.; Gokon, H.; Meguro, K. A review on synthetic aperture radar-based building damage assessment in disasters. Remote Sens.
Environ. 2020, 240, 111693. [CrossRef]24. Li, K.; Wan, G.; Cheng, G.; Meng, L.; Han, J. Object detection in optical remote sensing images: A survey and a new benchmark.
ISPRS J. Photogramm. Remote Sens. 2020, 159, 296–307. [CrossRef]

Remote Sens. 2022, 14, 40 20 of 20
25. Taher, R. General Recommendations for Improved Building Practices in Earthquake and Hurricane Prone Areas; Technical Report;Architecture for Humanity: San Francisco, CA, USA, 2010.
26. Fannela, D.A.; Munshi, J.A. Design of Concrete Buildings for Earthquake & Wind Forces According to the 1997 Uniform Building Code,1st ed.; Portland Cement Association: Skokie, IL, USA, 1998.
27. Deng, J.; Dong, W.; Socher, R.; Li, L.J.; Li, K.; Li, F.-F. ImageNet: A large-scale hierarchical image database. In Proceedings of the2009 IEEE Conference on Computer Vision and Pattern Recognition, Miami, FL, USA, 20–25 June 2009; pp. 248–255. [CrossRef]
28. Weber, E.; Kané, H. Building Disaster Damage Assessment in Satellite Imagery with Multi-Temporal Fusion. Remote Sens. 2019,11, 2765. [CrossRef]
29. Touzani, S.; Granderson, J. Open Data and Deep Semantic Segmentation for Automated Extraction of Building Footprints. RemoteSens. 2021, 13, 2578. [CrossRef]
30. Choi, W.G.; Lee, K.S. Conceptual representation for crisis-related tweet classification. Comput. y Sist. 2019, 23, 1523–1531.[CrossRef]
31. Balamurugan, A.; Zakhor, A. Online Learning for Indoor Asset Detection. In Proceedings of the 2019 IEEE 29th InternationalWorkshop on Machine Learning for Signal Processing (MLSP), Pittsburgh, PA, USA, 13–16 October 2019. [CrossRef]
32. Liu, K.; Liu, W.; Ma, H.; Huang, W.; Dong, X. Generalized zero-shot learning for action recognition with web-scale video data.World Wide Web 2019, 22, 807–824. [CrossRef]
33. Maxar. Open Data Program|Disaster Response Geospatial Analytics. Available online: https://www.maxar.com/open-data(accessed on 9 October 2021).
34. Grünthal, G.; Musson, R.; Schwarz, J.; Stucci, M. European Macroseismic Scale 1998 (EMS-98); Technical Report; European Centrefor Geodynamics and Seismology: Luxembourg, 1998.
35. He, K.; Zhang, X.; Ren, S.; Sun, J. Deep residual learning for image recognition. In Proceedings of the IEEE Conference onComputer Vision and Pattern Recognition, Las Vegas, NV, USA, 27–30 June 2016; pp. 770–778. [CrossRef]
36. Fernández, A.; García, S.; Galar, M.; Prati, R.C.; Krawczyk, B.; Herrera, F. Learning from Imbalanced Data Sets; Springer InternationalPublishing: Cham, Switzerland, 2018. [CrossRef]
37. Sklearn API Documentation. Available online: https://scikit-learn.org/stable/modules/generated/sklearn.utils.class_weight.compute_class_weight.html (accessed on 22 March 2021).
38. Kingma, D.P.; Ba, J. Adam: A Method for Stochastic Optimization. arXiv 2017, arXiv:1412.6980.39. Snell, J.; Twitter, K.S.; Zemel, R.S. Prototypical Networks for Few-Shot Learning. In Proceedings of the 31st International
Conference on Neural Information Processing Systems, Long Beach, CA, USA, 4–9 December 2017.40. Vanschoren, J. Meta-Learning: A Survey. arXiv 2018, arXiv:1810.03548.41. Waldner, F.; Chen, Y.; Lawes, R.; Hochman, Z. Needle in a haystack: Mapping rare and infrequent crops using satellite imagery
and data balancing methods. Remote Sens. Environ. 2019, 233, 111375. [CrossRef]42. Sokolova, M.; Japkowicz, N.; Szpakowicz, S. Beyond Accuracy, F-Score and ROC: A Family of Discriminant Measures for
Performance Evaluation. In AI 2006: Advances in Artificial Intelligence; Sattar, A., Kang, B.H., Eds.; Springer: Berlin/Heidelberg,Germany, 2006; pp. 1015–1021.
43. USAID. Mexico Earthquake Fact Sheet #1—09-21-2017; Technical Report; USAID: Washington, DC, USA, 2017.44. Wagenmaker, R.; Weaver, J.; Garnet, G.; Perry, B.; Spinney, J. NWS Central Region Service Assessment; Technical Report; National
Oceanic and Atmospheric Administration, U.S. Department of Commerce: Kansas City, MO, USA, 2011.45. NOAA’s National Weather Service, US Department of Commerce. Catastrophic Hurricane Michael Strikes Florida Panhandle October
10, 2018; Technical Report; Weather Forecast Office: Tallahassee, FL, USA, 2018.46. Serrano, W. iBuilding: Artificial Intelligence in Intelligent Buildings. Neural Comput. Appl. 2021. [CrossRef]