Pairwise likelihood inference for multilevel latent Markov models
Upload
khangminh22Category
view
3download
0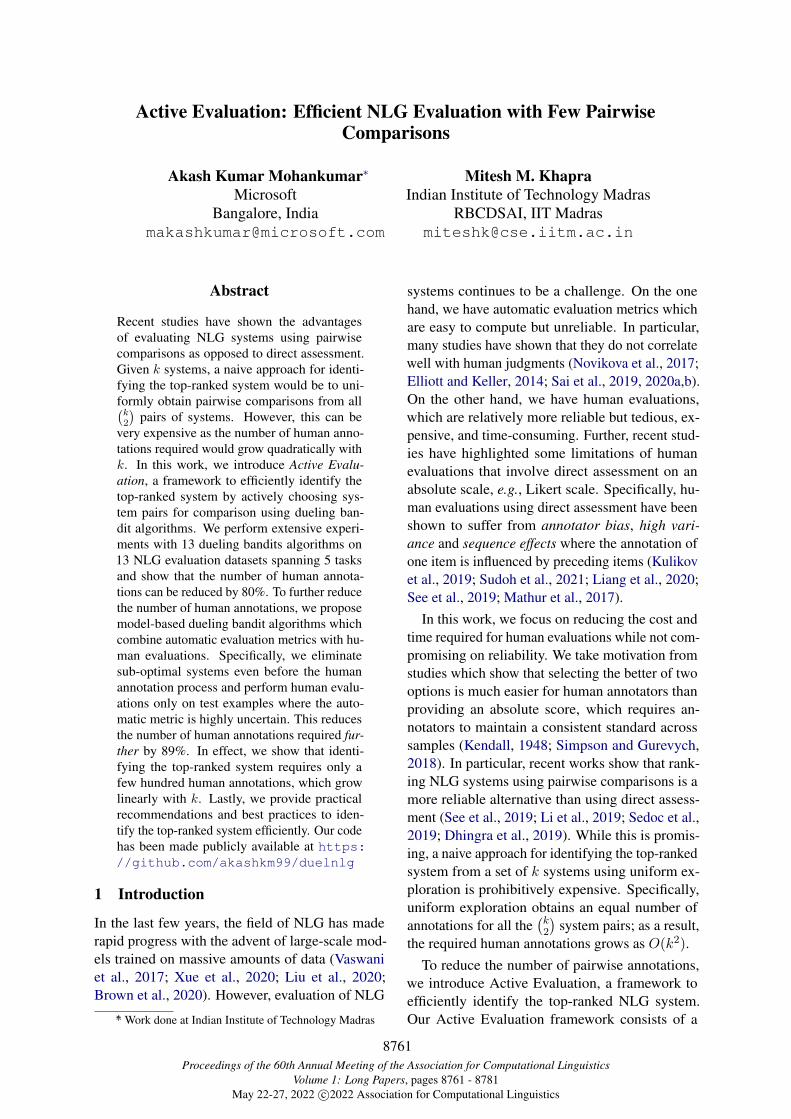
Proceedings of the 60th Annual Meeting of the Association for Computational LinguisticsVolume 1: Long Papers, pages 8761 - 8781
May 22-27, 2022 c©2022 Association for Computational Linguistics
Active Evaluation: Efficient NLG Evaluation with Few PairwiseComparisons
Akash Kumar Mohankumar∗Microsoft
Bangalore, [email protected]
Mitesh M. KhapraIndian Institute of Technology Madras
RBCDSAI, IIT [email protected]
Abstract
Recent studies have shown the advantagesof evaluating NLG systems using pairwisecomparisons as opposed to direct assessment.Given k systems, a naive approach for identi-fying the top-ranked system would be to uni-formly obtain pairwise comparisons from all(k2
)pairs of systems. However, this can be
very expensive as the number of human anno-tations required would grow quadratically withk. In this work, we introduce Active Evalu-ation, a framework to efficiently identify thetop-ranked system by actively choosing sys-tem pairs for comparison using dueling ban-dit algorithms. We perform extensive experi-ments with 13 dueling bandits algorithms on13 NLG evaluation datasets spanning 5 tasksand show that the number of human annota-tions can be reduced by 80%. To further reducethe number of human annotations, we proposemodel-based dueling bandit algorithms whichcombine automatic evaluation metrics with hu-man evaluations. Specifically, we eliminatesub-optimal systems even before the humanannotation process and perform human evalu-ations only on test examples where the auto-matic metric is highly uncertain. This reducesthe number of human annotations required fur-ther by 89%. In effect, we show that identi-fying the top-ranked system requires only afew hundred human annotations, which growlinearly with k. Lastly, we provide practicalrecommendations and best practices to iden-tify the top-ranked system efficiently. Our codehas been made publicly available at https://github.com/akashkm99/duelnlg
1 Introduction
In the last few years, the field of NLG has maderapid progress with the advent of large-scale mod-els trained on massive amounts of data (Vaswaniet al., 2017; Xue et al., 2020; Liu et al., 2020;Brown et al., 2020). However, evaluation of NLG
∗* Work done at Indian Institute of Technology Madras
systems continues to be a challenge. On the onehand, we have automatic evaluation metrics whichare easy to compute but unreliable. In particular,many studies have shown that they do not correlatewell with human judgments (Novikova et al., 2017;Elliott and Keller, 2014; Sai et al., 2019, 2020a,b).On the other hand, we have human evaluations,which are relatively more reliable but tedious, ex-pensive, and time-consuming. Further, recent stud-ies have highlighted some limitations of humanevaluations that involve direct assessment on anabsolute scale, e.g., Likert scale. Specifically, hu-man evaluations using direct assessment have beenshown to suffer from annotator bias, high vari-ance and sequence effects where the annotation ofone item is influenced by preceding items (Kulikovet al., 2019; Sudoh et al., 2021; Liang et al., 2020;See et al., 2019; Mathur et al., 2017).
In this work, we focus on reducing the cost andtime required for human evaluations while not com-promising on reliability. We take motivation fromstudies which show that selecting the better of twooptions is much easier for human annotators thanproviding an absolute score, which requires an-notators to maintain a consistent standard acrosssamples (Kendall, 1948; Simpson and Gurevych,2018). In particular, recent works show that rank-ing NLG systems using pairwise comparisons is amore reliable alternative than using direct assess-ment (See et al., 2019; Li et al., 2019; Sedoc et al.,2019; Dhingra et al., 2019). While this is promis-ing, a naive approach for identifying the top-rankedsystem from a set of k systems using uniform ex-ploration is prohibitively expensive. Specifically,uniform exploration obtains an equal number ofannotations for all the
(k2
)system pairs; as a result,
the required human annotations grows as O(k2).To reduce the number of pairwise annotations,
we introduce Active Evaluation, a framework toefficiently identify the top-ranked NLG system.Our Active Evaluation framework consists of a
8761

learner that selects a pair of systems to compareat each time step. The learner, then, receives afeedback signal indicating the (human) preferencebetween the selected systems on one input con-text, randomly sampled from the test dataset. Thelearner’s objective is to reliably compute the top-ranked system with as few human annotations aspossible. We adopt algorithms from the stochasticdueling bandits literature (Bengs et al., 2021) todecide which pair of NLG systems to compare ateach time step. To check if existing dueling banditsalgorithms can indeed provide reliable top-rank es-timates with minimal annotations, we evaluate 13such algorithms on 13 NLG evaluation datasetsspanning five tasks viz., machine translation, sum-marization, data-to-text generation, paraphrase gen-eration, and grammatical error correction. We showthat the best performing dueling bandit algorithmcan reduce the number of human annotations by80% when compared to uniform exploration.
To further reduce human annotations, we lever-age automatic evaluation metrics in our ActiveEvaluation framework. We utilize existing au-tomatic metrics such as BLEU (Papineni et al.,2002), BertScore (Zhang et al., 2020), etc for pair-wise evaluations by converting the direct evaluationscores into preference probabilities using pairwiseprobability models. We also develop trained pair-wise metrics that directly predict the comparisonoutcome given pairs of generated texts and con-text or reference as input. To incorporate suchevaluation metrics in our Active Evaluation frame-work, we propose three model-based dueling ban-dits algorithms, viz., (i) Random Mixing: humanannotations and evaluation metric predictions arerandomly mixed, (ii) Uncertainty-aware selection:human annotations are obtained only when the pre-dictions from the evaluation metric is highly un-certain, (iii) UCB Elimination: poorly perform-ing NLG systems are eliminated using an UpperConfidence Bound (UCB) on the evaluation metricscores. Through our experiments, we show thatthe number of human annotations can be furtherreduced by 89% on average (this reduction is overand above the 80% reduction that we got earlier).In effect, we show that given k systems, we canfind the top-ranked NLG system efficiently withjust a few hundred comparisons that vary as O(k).Lastly, we provide practical recommendations to ef-ficiently identify the top-ranked NLG system basedon our empirical study on various design choices
and hyperparameters.
2 Active Evaluation Framework
We introduce the problem and our Active Evalua-tion setup in section 2.1. Later in section 2.2, wedescribe the different approaches to decide whichpairs of NLG systems to compare at each time step.Finally, in section 2.3, we formalize the notion oftop-ranked system.
2.1 Problem Formulation and SetupWe consider the problem of finding the top-rankedNLG system from a given set of k systems, de-noted by S = {1, 2, . . . , k}. Our Active Evalua-tion framework consist of a learner which at eachtime step t, chooses a pair of systems s(t)1 , s
(t)2 ∈ S
for comparison. Then, we ask human annotatorsto compare the outputs of the chosen systems ona randomly sampled input context and provide thecomparison outcome as feedback to the learner.Specifically, we first sample an input context X(t)
from the test dataset and obtain the generated textsY
(t)1 , Y
(t)2 from the chosen systems s
(t)1 , s
(t)2 . We
then display the generated texts Y(t)1 , Y
(t)2 along
with the context X(t) to human annotators and ob-tain a comparison outcome w(t) = 1, 0, or 0.5
denoting whether Y (t)1 is of better, worse, or equal
(tie) quality as Y (t)2 . Note that the feedback w(t) in-
dicates the preference on only one input sample andnot the entire test dataset. The overall frameworkis depicted in figure 1. The learner’s objective isto find the top-ranked system with as few pairwisecomparisons as possible.
2.2 Choosing System Pairs for ComparisonThe learner should decide the pair of systems(s
(t)1 , s
(t)2 ) to compare at each time step t. The naive
approach is to uniformly explore all the(k2
)system
pairs. Specifically, the probability of selecting apair (i, j), i = j at time t is given by
Puniform((s(t)1 , s
(t)2 ) = (i, j)) =
1(k2
)However, as we show in our experiments, the num-ber of human annotations required to find the top-ranked system by this approach is very expensiveand grows quadratically with the number of sys-tems since we equally explore all
(k2
)pairs. To
reduce the number of annotations, we use duelingbandit algorithms to actively choose pairs of sys-tems to compare based on the history of previous
8762
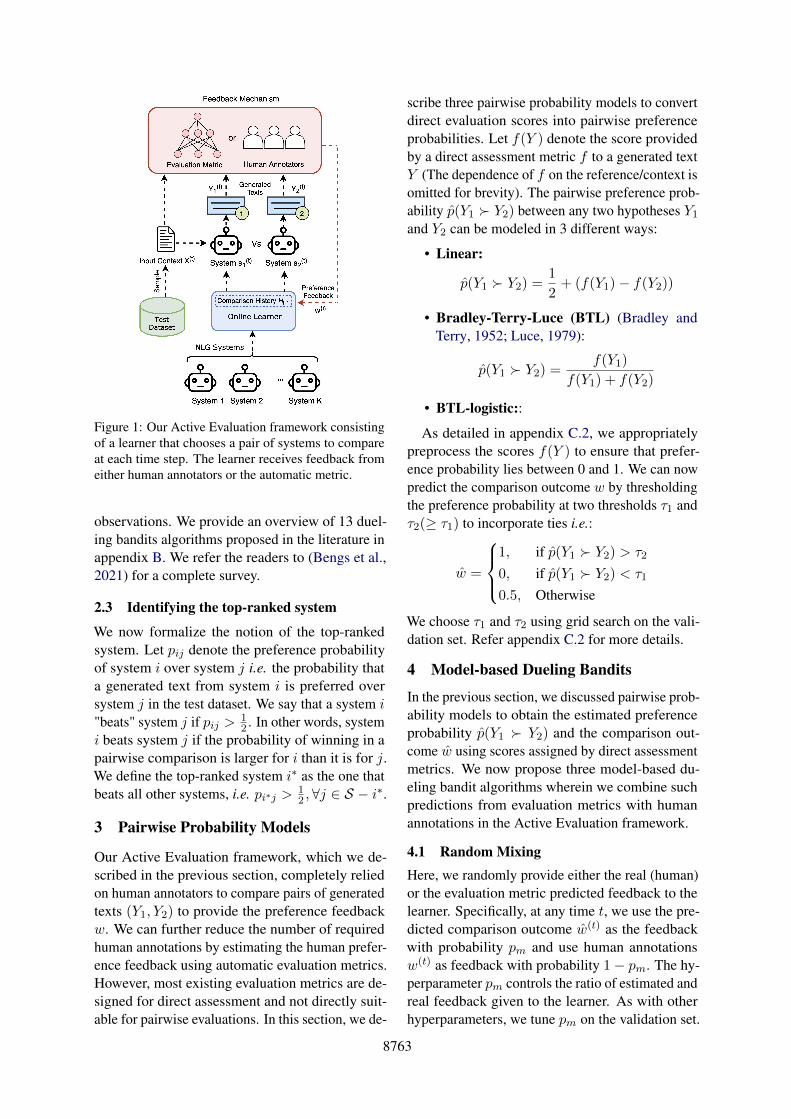
Figure 1: Our Active Evaluation framework consistingof a learner that chooses a pair of systems to compareat each time step. The learner receives feedback fromeither human annotators or the automatic metric.
observations. We provide an overview of 13 duel-ing bandits algorithms proposed in the literature inappendix B. We refer the readers to (Bengs et al.,2021) for a complete survey.
2.3 Identifying the top-ranked system
We now formalize the notion of the top-rankedsystem. Let pij denote the preference probabilityof system i over system j i.e. the probability thata generated text from system i is preferred oversystem j in the test dataset. We say that a system i"beats" system j if pij > 1
2 . In other words, systemi beats system j if the probability of winning in apairwise comparison is larger for i than it is for j.We define the top-ranked system i∗ as the one thatbeats all other systems, i.e. pi∗j > 1
2 ,∀j ∈ S − i∗.
3 Pairwise Probability Models
Our Active Evaluation framework, which we de-scribed in the previous section, completely reliedon human annotators to compare pairs of generatedtexts (Y1, Y2) to provide the preference feedbackw. We can further reduce the number of requiredhuman annotations by estimating the human prefer-ence feedback using automatic evaluation metrics.However, most existing evaluation metrics are de-signed for direct assessment and not directly suit-able for pairwise evaluations. In this section, we de-
scribe three pairwise probability models to convertdirect evaluation scores into pairwise preferenceprobabilities. Let f(Y ) denote the score providedby a direct assessment metric f to a generated textY (The dependence of f on the reference/context isomitted for brevity). The pairwise preference prob-ability p(Y1 ≻ Y2) between any two hypotheses Y1and Y2 can be modeled in 3 different ways:
• Linear:
p(Y1 ≻ Y2) =1
2+ (f(Y1)− f(Y2))
• Bradley-Terry-Luce (BTL) (Bradley andTerry, 1952; Luce, 1979):
p(Y1 ≻ Y2) =f(Y1)
f(Y1) + f(Y2)
• BTL-logistic::
As detailed in appendix C.2, we appropriatelypreprocess the scores f(Y ) to ensure that prefer-ence probability lies between 0 and 1. We can nowpredict the comparison outcome w by thresholdingthe preference probability at two thresholds τ1 andτ2(≥ τ1) to incorporate ties i.e.:
w =
1, if p(Y1 ≻ Y2) > τ2
0, if p(Y1 ≻ Y2) < τ1
0.5, Otherwise
We choose τ1 and τ2 using grid search on the vali-dation set. Refer appendix C.2 for more details.
4 Model-based Dueling Bandits
In the previous section, we discussed pairwise prob-ability models to obtain the estimated preferenceprobability p(Y1 ≻ Y2) and the comparison out-come w using scores assigned by direct assessmentmetrics. We now propose three model-based du-eling bandit algorithms wherein we combine suchpredictions from evaluation metrics with humanannotations in the Active Evaluation framework.
4.1 Random MixingHere, we randomly provide either the real (human)or the evaluation metric predicted feedback to thelearner. Specifically, at any time t, we use the pre-dicted comparison outcome w(t) as the feedbackwith probability pm and use human annotationsw(t) as feedback with probability 1− pm. The hy-perparameter pm controls the ratio of estimated andreal feedback given to the learner. As with otherhyperparameters, we tune pm on the validation set.
8763
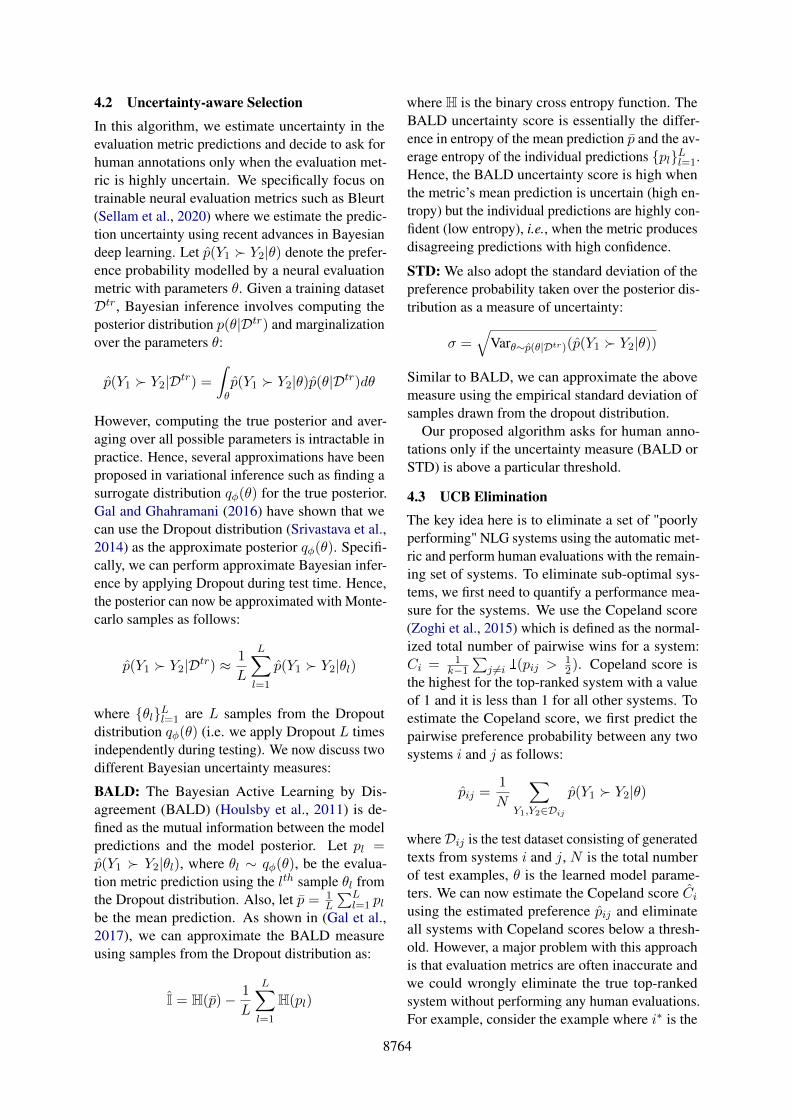
4.2 Uncertainty-aware SelectionIn this algorithm, we estimate uncertainty in theevaluation metric predictions and decide to ask forhuman annotations only when the evaluation met-ric is highly uncertain. We specifically focus ontrainable neural evaluation metrics such as Bleurt(Sellam et al., 2020) where we estimate the predic-tion uncertainty using recent advances in Bayesiandeep learning. Let p(Y1 ≻ Y2|θ) denote the prefer-ence probability modelled by a neural evaluationmetric with parameters θ. Given a training datasetDtr, Bayesian inference involves computing theposterior distribution p(θ|Dtr) and marginalizationover the parameters θ:
p(Y1 ≻ Y2|Dtr) =
∫θp(Y1 ≻ Y2|θ)p(θ|Dtr)dθ
However, computing the true posterior and aver-aging over all possible parameters is intractable inpractice. Hence, several approximations have beenproposed in variational inference such as finding asurrogate distribution qϕ(θ) for the true posterior.Gal and Ghahramani (2016) have shown that wecan use the Dropout distribution (Srivastava et al.,2014) as the approximate posterior qϕ(θ). Specifi-cally, we can perform approximate Bayesian infer-ence by applying Dropout during test time. Hence,the posterior can now be approximated with Monte-carlo samples as follows:
p(Y1 ≻ Y2|Dtr) ≈ 1
L
L∑l=1
p(Y1 ≻ Y2|θl)
where {θl}Ll=1 are L samples from the Dropoutdistribution qϕ(θ) (i.e. we apply Dropout L timesindependently during testing). We now discuss twodifferent Bayesian uncertainty measures:
BALD: The Bayesian Active Learning by Dis-agreement (BALD) (Houlsby et al., 2011) is de-fined as the mutual information between the modelpredictions and the model posterior. Let pl =p(Y1 ≻ Y2|θl), where θl ∼ qϕ(θ), be the evalua-tion metric prediction using the lth sample θl fromthe Dropout distribution. Also, let p = 1
L
∑Ll=1 pl
be the mean prediction. As shown in (Gal et al.,2017), we can approximate the BALD measureusing samples from the Dropout distribution as:
I = H(p)− 1
L
L∑l=1
H(pl)
where H is the binary cross entropy function. TheBALD uncertainty score is essentially the differ-ence in entropy of the mean prediction p and the av-erage entropy of the individual predictions {pl}Ll=1.Hence, the BALD uncertainty score is high whenthe metric’s mean prediction is uncertain (high en-tropy) but the individual predictions are highly con-fident (low entropy), i.e., when the metric producesdisagreeing predictions with high confidence.
STD: We also adopt the standard deviation of thepreference probability taken over the posterior dis-tribution as a measure of uncertainty:
σ =√
Varθ∼p(θ|Dtr)(p(Y1 ≻ Y2|θ))
Similar to BALD, we can approximate the abovemeasure using the empirical standard deviation ofsamples drawn from the dropout distribution.
Our proposed algorithm asks for human anno-tations only if the uncertainty measure (BALD orSTD) is above a particular threshold.
4.3 UCB EliminationThe key idea here is to eliminate a set of "poorlyperforming" NLG systems using the automatic met-ric and perform human evaluations with the remain-ing set of systems. To eliminate sub-optimal sys-tems, we first need to quantify a performance mea-sure for the systems. We use the Copeland score(Zoghi et al., 2015) which is defined as the normal-ized total number of pairwise wins for a system:Ci = 1
k−1
∑j =i 1(pij > 1
2). Copeland score isthe highest for the top-ranked system with a valueof 1 and it is less than 1 for all other systems. Toestimate the Copeland score, we first predict thepairwise preference probability between any twosystems i and j as follows:
pij =1
N
∑Y1,Y2∈Dij
p(Y1 ≻ Y2|θ)
where Dij is the test dataset consisting of generatedtexts from systems i and j, N is the total numberof test examples, θ is the learned model parame-ters. We can now estimate the Copeland score Ci
using the estimated preference pij and eliminateall systems with Copeland scores below a thresh-old. However, a major problem with this approachis that evaluation metrics are often inaccurate andwe could wrongly eliminate the true top-rankedsystem without performing any human evaluations.For example, consider the example where i∗ is the
8764
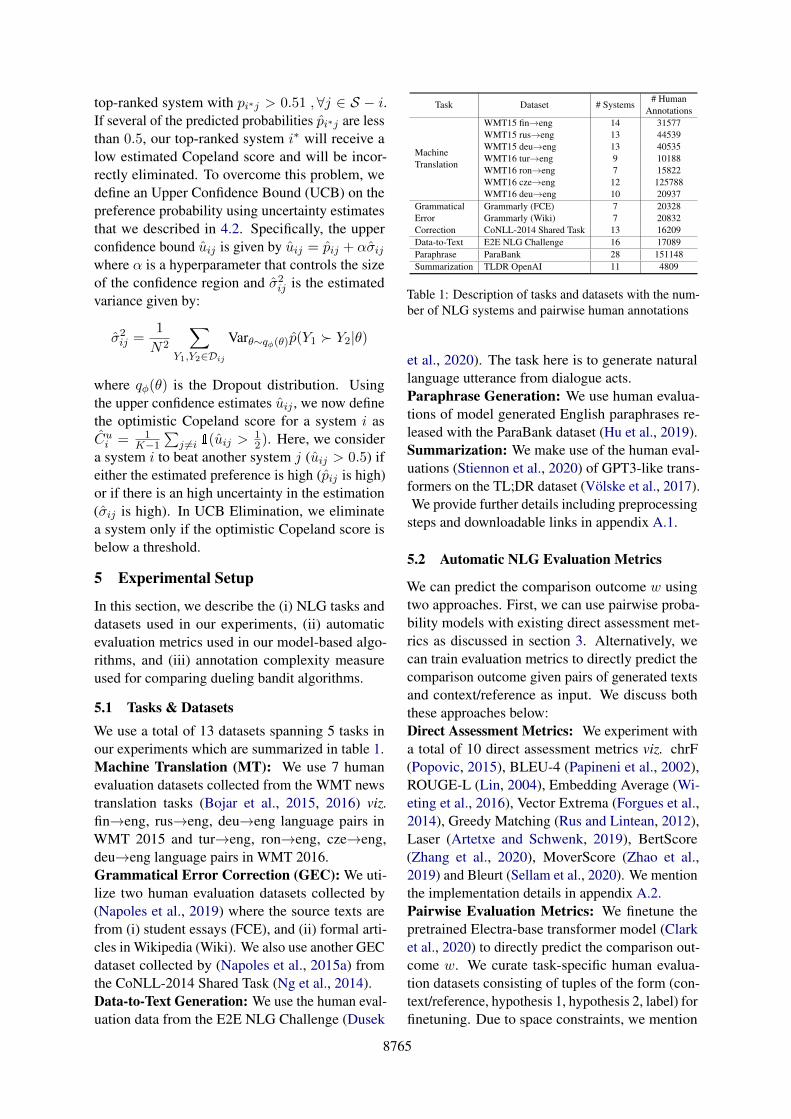
top-ranked system with pi∗j > 0.51 ,∀j ∈ S − i.If several of the predicted probabilities pi∗j are lessthan 0.5, our top-ranked system i∗ will receive alow estimated Copeland score and will be incor-rectly eliminated. To overcome this problem, wedefine an Upper Confidence Bound (UCB) on thepreference probability using uncertainty estimatesthat we described in 4.2. Specifically, the upperconfidence bound uij is given by uij = pij + ασijwhere α is a hyperparameter that controls the sizeof the confidence region and σ2
ij is the estimatedvariance given by:
σ2ij =
1
N2
∑Y1,Y2∈Dij
Varθ∼qϕ(θ)p(Y1 ≻ Y2|θ)
where qϕ(θ) is the Dropout distribution. Usingthe upper confidence estimates uij , we now definethe optimistic Copeland score for a system i asCui = 1
K−1
∑j =i 1(uij > 1
2). Here, we considera system i to beat another system j (uij > 0.5) ifeither the estimated preference is high (pij is high)or if there is an high uncertainty in the estimation(σij is high). In UCB Elimination, we eliminatea system only if the optimistic Copeland score isbelow a threshold.
5 Experimental Setup
In this section, we describe the (i) NLG tasks anddatasets used in our experiments, (ii) automaticevaluation metrics used in our model-based algo-rithms, and (iii) annotation complexity measureused for comparing dueling bandit algorithms.
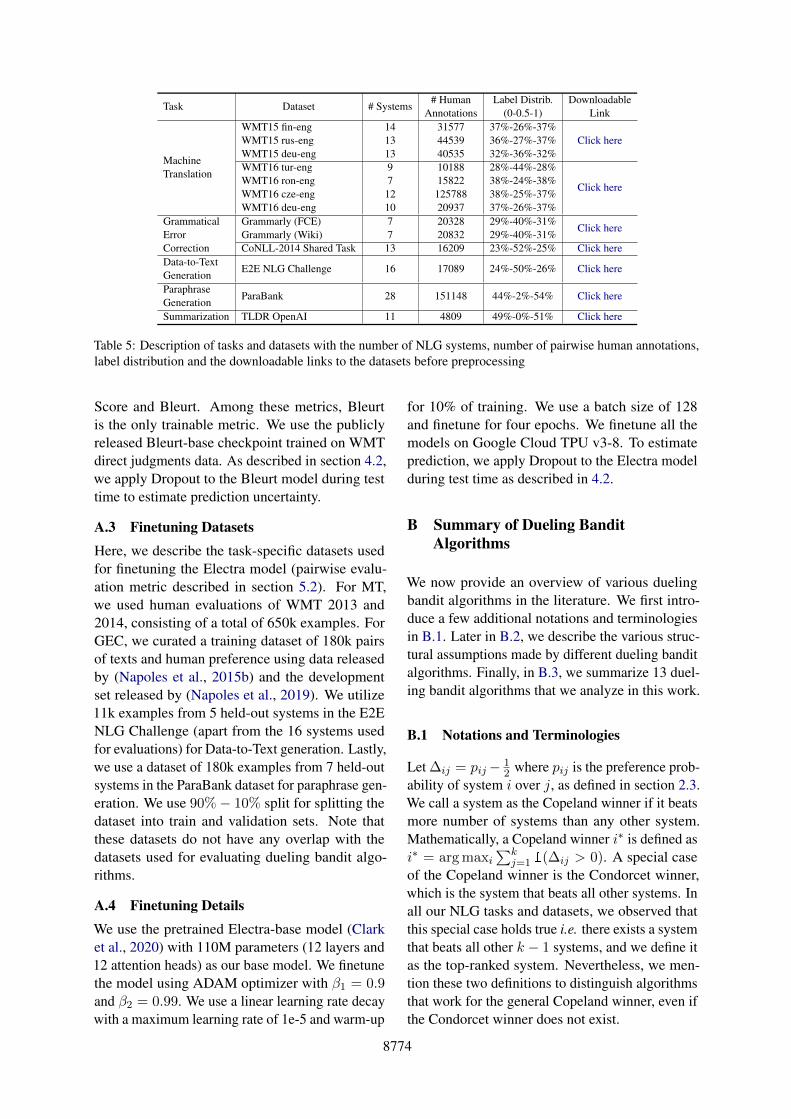
5.1 Tasks & DatasetsWe use a total of 13 datasets spanning 5 tasks inour experiments which are summarized in table 1.Machine Translation (MT): We use 7 humanevaluation datasets collected from the WMT newstranslation tasks (Bojar et al., 2015, 2016) viz.fin→eng, rus→eng, deu→eng language pairs inWMT 2015 and tur→eng, ron→eng, cze→eng,deu→eng language pairs in WMT 2016.Grammatical Error Correction (GEC): We uti-lize two human evaluation datasets collected by(Napoles et al., 2019) where the source texts arefrom (i) student essays (FCE), and (ii) formal arti-cles in Wikipedia (Wiki). We also use another GECdataset collected by (Napoles et al., 2015a) fromthe CoNLL-2014 Shared Task (Ng et al., 2014).Data-to-Text Generation: We use the human eval-uation data from the E2E NLG Challenge (Dusek
Task Dataset # Systems# Human
Annotations
MachineTranslation
WMT15 fin→eng 14 31577WMT15 rus→eng 13 44539WMT15 deu→eng 13 40535WMT16 tur→eng 9 10188WMT16 ron→eng 7 15822WMT16 cze→eng 12 125788WMT16 deu→eng 10 20937
GrammaticalErrorCorrection
Grammarly (FCE) 7 20328Grammarly (Wiki) 7 20832CoNLL-2014 Shared Task 13 16209
Data-to-Text E2E NLG Challenge 16 17089Paraphrase ParaBank 28 151148Summarization TLDR OpenAI 11 4809
Table 1: Description of tasks and datasets with the num-ber of NLG systems and pairwise human annotations
et al., 2020). The task here is to generate naturallanguage utterance from dialogue acts.Paraphrase Generation: We use human evalua-tions of model generated English paraphrases re-leased with the ParaBank dataset (Hu et al., 2019).Summarization: We make use of the human eval-uations (Stiennon et al., 2020) of GPT3-like trans-formers on the TL;DR dataset (Völske et al., 2017).We provide further details including preprocessing
steps and downloadable links in appendix A.1.
5.2 Automatic NLG Evaluation Metrics
We can predict the comparison outcome w usingtwo approaches. First, we can use pairwise proba-bility models with existing direct assessment met-rics as discussed in section 3. Alternatively, wecan train evaluation metrics to directly predict thecomparison outcome given pairs of generated textsand context/reference as input. We discuss boththese approaches below:Direct Assessment Metrics: We experiment witha total of 10 direct assessment metrics viz. chrF(Popovic, 2015), BLEU-4 (Papineni et al., 2002),ROUGE-L (Lin, 2004), Embedding Average (Wi-eting et al., 2016), Vector Extrema (Forgues et al.,2014), Greedy Matching (Rus and Lintean, 2012),Laser (Artetxe and Schwenk, 2019), BertScore(Zhang et al., 2020), MoverScore (Zhao et al.,2019) and Bleurt (Sellam et al., 2020). We mentionthe implementation details in appendix A.2.Pairwise Evaluation Metrics: We finetune thepretrained Electra-base transformer model (Clarket al., 2020) to directly predict the comparison out-come w. We curate task-specific human evalua-tion datasets consisting of tuples of the form (con-text/reference, hypothesis 1, hypothesis 2, label) forfinetuning. Due to space constraints, we mention
8765

AlgorithmWMT 2016 WMT 2015 Grammarly CoNLL
’14 TaskE2ENLG
Para-Bank
TL;DRtur-eng ron-eng cze-eng deu-eng fin-eng rus-eng deu-eng FCE Wiki
Uniform 19479 24647 10262 3032 2837 12265 17795 8115 34443 61369 65739 825211 5893SAVAGE 10289 18016 6639 2393 2675 12806 12115 5767 22959 39208 41493 255208 4733DTS 10089 9214 8618 4654 4850 13317 16473 4355 11530 18199 19940 170467 1354CCB 7017 11267 5389 2884 4092 11548 10905 4386 10020 21392 16960 87138 2518Knockout 3415 7889 4723 3444 5104 5809 5956 3134 3777 8055 7708 17418 4953RUCB 3125 5697 3329 1636 1655 4536 6222 2732 5617 19024 10924 41149 1647RCS 2442 3924 3370 1537 2662 3867 5296 1816 4606 12678 7263 34709 1903RMED 2028 5113 1612 864 1707 1929 4047 2093 5647 9364 3753 24132 1162
Table 2: Annotation complexity of the top 7 best performing dueling bandit algorithms along with the uniformexploration algorithm on 13 datasets spanning 5 NLG tasks
details on the datasets and finetuning in appendixA.3 and A.4. For the summarization task alone, wecouldn’t find any pairwise human judgment datasetsufficient for finetuning the Electra model.
5.3 Annotation Complexity MeasureTo evaluate the performance of dueling bandit al-gorithms, we define annotation complexity as theminimum number of human annotations neededby an algorithm to identify the top-ranked NLGsystem with high confidence. Let i∗ be the actualtop-ranked system, and i∗(n) denote the estimatedwinner by the algorithm after n human annotations,then annotation complexity is defined as:
minn′ : ∀n ≥ n′, P (i∗(n) = i∗) > 1− δacc
where δacc is the allowable failure probability i.e.the learner can make a mistake with at most δaccprobability. To compute the annotation complexity,we run each dueling bandit algorithm with 200 dif-ferent random seeds and find the minimum numberof human annotations after which the algorithmcorrectly returns the top-ranked NLG system in atleast 190/200 runs (we set δacc = 0.05).
6 Results & Discussion
We discuss the performance of dueling bandits al-gorithms in 6.1, automatic metrics in 6.2 and ourproposed model-based algorithms in 6.3. Lastly in6.4, we analyze the variation of annotation com-plexity with the number of NLG system.
6.1 Analysis of Dueling Bandit AlgorithmsWe report the annotation complexity of the top 7dueling bandit algorithms along with uniform ex-ploration on 13 datasets in table 2. We observethat the annotation complexity of uniform explo-ration is consistently high across all 13 datasets. Inparticular, the required human annotations becomeprohibitively expensive when the number of NLG
0 1000 2000 3000 4000Number of Human Annotations
0.00
0.25
0.50
0.75
1.00
Pred
ictio
nA
ccur
acy
UniformRUCBRCSRMED
Figure 2: Top-rank prediction accuracy v/s number ofhuman annotations used on WMT 16 tur-eng dataset
systems is high, e.g. E2E NLG (16 systems) andParaBank (28 systems) datasets. On the other hand,dueling bandit algorithms such as RUCB (Zoghiet al., 2014b), RCS (Zoghi et al., 2014a), RMED(Komiyama et al., 2015) are able to effectively iden-tify the top-ranked system with much fewer annota-tions. In particular, RMED performs the best witha reduction of 80.01% in human annotations com-pared to uniform exploration. We also examine analternative approach to assess the performance ofdueling bandit algorithms. Here, we fix the numberof human annotations (fixed annotation budget) andcompute the accuracy in predicting the top-rankedsystem. As we show in figure 2, RMED achievesthe highest top-rank prediction accuracy for anygiven number of human annotations. We providethe complete results in appendix F.2.
6.2 Performance of Evaluation Metrics
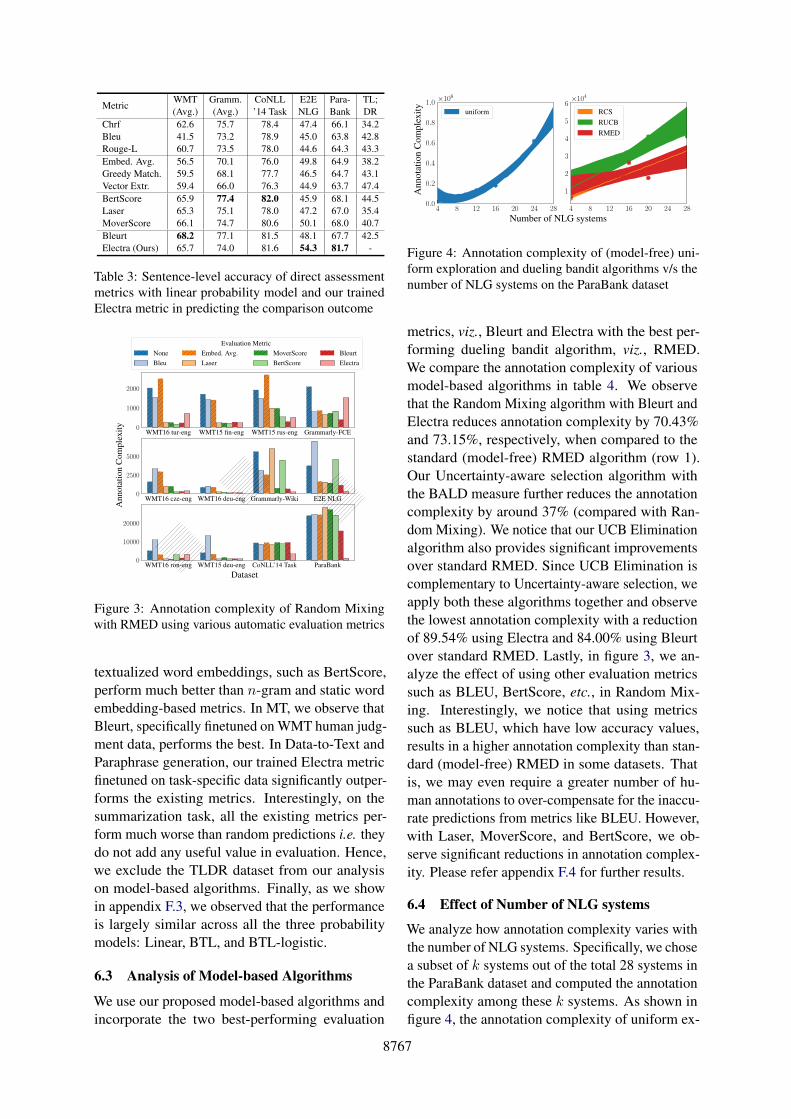
Before we utilize automatic evaluation metrics us-ing our proposed model-based algorithms, we ana-lyze the effectiveness of these metrics for pairwiseNLG evaluations. In table 3, we report the sentence-level accuracy in predicting the comparison out-come w using direct assessment metrics with theLinear probability model (as discussed in section3) along with our trained Electra metric. Acrossthe tasks, we observe that metrics that utilize con-
8766
MetricWMT(Avg.)
Gramm.(Avg.)
CoNLL’14 Task
E2ENLG
Para-Bank
TL;DR
Chrf 62.6 75.7 78.4 47.4 66.1 34.2Bleu 41.5 73.2 78.9 45.0 63.8 42.8Rouge-L 60.7 73.5 78.0 44.6 64.3 43.3Embed. Avg. 56.5 70.1 76.0 49.8 64.9 38.2Greedy Match. 59.5 68.1 77.7 46.5 64.7 43.1Vector Extr. 59.4 66.0 76.3 44.9 63.7 47.4BertScore 65.9 77.4 82.0 45.9 68.1 44.5Laser 65.3 75.1 78.0 47.2 67.0 35.4MoverScore 66.1 74.7 80.6 50.1 68.0 40.7Bleurt 68.2 77.1 81.5 48.1 67.7 42.5Electra (Ours) 65.7 74.0 81.6 54.3 81.7 -
Table 3: Sentence-level accuracy of direct assessmentmetrics with linear probability model and our trainedElectra metric in predicting the comparison outcome
WMT16 tur-eng WMT15 fin-eng WMT15 rus-eng Grammarly-FCE0
1000
2000
WMT16 cze-eng WMT16 deu-eng Grammarly-Wiki E2E NLG0
2500
5000
Evaluation MetricNoneBleu
Embed. Avg.Laser
MoverScoreBertScore
BleurtElectra
WMT16 ron-eng WMT15 deu-eng CoNLL’14 Task ParaBank0
10000
20000
Dataset
Ann
otat
ion
Com
plex
ity
Figure 3: Annotation complexity of Random Mixingwith RMED using various automatic evaluation metrics
textualized word embeddings, such as BertScore,perform much better than n-gram and static wordembedding-based metrics. In MT, we observe thatBleurt, specifically finetuned on WMT human judg-ment data, performs the best. In Data-to-Text andParaphrase generation, our trained Electra metricfinetuned on task-specific data significantly outper-forms the existing metrics. Interestingly, on thesummarization task, all the existing metrics per-form much worse than random predictions i.e. theydo not add any useful value in evaluation. Hence,we exclude the TLDR dataset from our analysison model-based algorithms. Finally, as we showin appendix F.3, we observed that the performanceis largely similar across all the three probabilitymodels: Linear, BTL, and BTL-logistic.
6.3 Analysis of Model-based Algorithms
We use our proposed model-based algorithms andincorporate the two best-performing evaluation
4 8 12 16 20 24 280.0
0.2
0.4
0.6
0.8
1.0 ×10⁶
uniform
4 8 12 16 20 24 28
1
2
3
4
5
6×10⁴
RCSRUCBRMED
Number of NLG systems
Ann
otat
ion
Com
plex
ity
Figure 4: Annotation complexity of (model-free) uni-form exploration and dueling bandit algorithms v/s thenumber of NLG systems on the ParaBank dataset
metrics, viz., Bleurt and Electra with the best per-forming dueling bandit algorithm, viz., RMED.We compare the annotation complexity of variousmodel-based algorithms in table 4. We observethat the Random Mixing algorithm with Bleurt andElectra reduces annotation complexity by 70.43%and 73.15%, respectively, when compared to thestandard (model-free) RMED algorithm (row 1).Our Uncertainty-aware selection algorithm withthe BALD measure further reduces the annotationcomplexity by around 37% (compared with Ran-dom Mixing). We notice that our UCB Eliminationalgorithm also provides significant improvementsover standard RMED. Since UCB Elimination iscomplementary to Uncertainty-aware selection, weapply both these algorithms together and observethe lowest annotation complexity with a reductionof 89.54% using Electra and 84.00% using Bleurtover standard RMED. Lastly, in figure 3, we an-alyze the effect of using other evaluation metricssuch as BLEU, BertScore, etc., in Random Mix-ing. Interestingly, we notice that using metricssuch as BLEU, which have low accuracy values,results in a higher annotation complexity than stan-dard (model-free) RMED in some datasets. Thatis, we may even require a greater number of hu-man annotations to over-compensate for the inaccu-rate predictions from metrics like BLEU. However,with Laser, MoverScore, and BertScore, we ob-serve significant reductions in annotation complex-ity. Please refer appendix F.4 for further results.
6.4 Effect of Number of NLG systems
We analyze how annotation complexity varies withthe number of NLG systems. Specifically, we chosea subset of k systems out of the total 28 systems inthe ParaBank dataset and computed the annotationcomplexity among these k systems. As shown infigure 4, the annotation complexity of uniform ex-
8767

Model-basedAlgorithm
EvaluationMetric
WMT 2016 WMT 2015 Grammarly CoNLL’14 Task
E2ENLG
Para-Banktur-eng ron-eng cze-eng deu-eng fin-eng rus-eng deu-eng FCE Wiki
None (Model free) None 2028 5113 1612 864 1707 1929 4047 2093 5647 9364 3753 24132
Random MixingBleurt 237 1222 315 161 275 304 771 406 671 9584 1151 15874Electra 728 3213 385 152 236 512 650 1529 237 3302 326 1044
Uncertainty-awareSelection (STD)
Bleurt 103 1012 192 84 204 239 530 270 185 9356 1291 22876Electra 978 7251 478 210 388 962 1259 477 234 4708 199 2137
Uncertainty-awareSelection (BALD)
Bleurt 101 653 136 48 181 162 405 204 128 9356 1167 22619Electra 737 1648 223 114 207 538 488 281 75 1557 67 858
UCB ElimininationBleurt 711 2684 1131 573 419 843 3556 967 1115 8382 2005 14098Electra 264 649 1131 414 294 1126 3556 3970 1115 2943 1112 9870
Uncertainty(BALD) + UCB Elim.
Bleurt 31 415 376 25 59 82 305 162 39 9995 256 4570Electra 721 736 144 51 76 288 280 312 45 782 40 2247
Table 4: Annotation complexity of model-based algorithms when used with RMED and Bleurt/Electra metric.
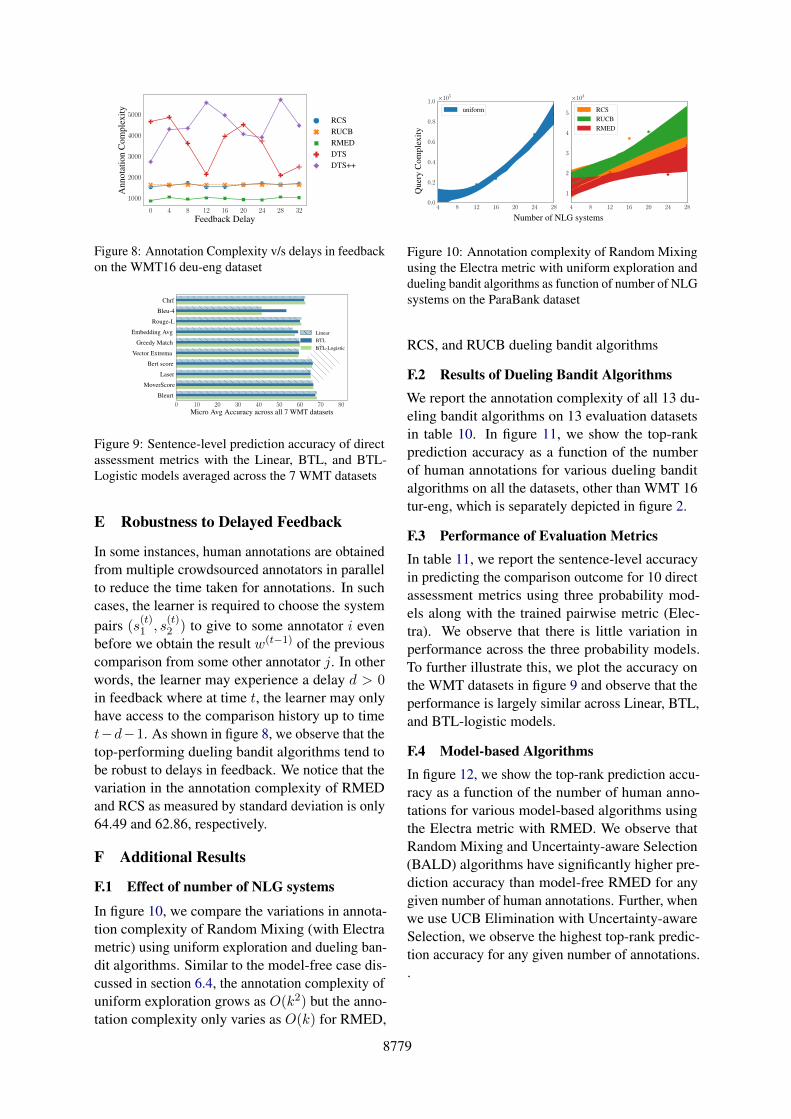
ploration grows quadratically with k as it exploresall system pairs equally. However, for (model-free)dueling bandit algorithms such as RMED, the an-notation complexity is much lower and only variesas O(k). As shown in appendix F.1, we observedsimilar trends with model-based algorithms.
7 Practical Recommendations
We summarize the key insights from this study andprovide practical recommendations on efficientlyidentifying the top-ranked NLG system.
1. Use RMED dueling bandit algorithm to ac-tively choose system pairs for comparison.
2. If human evaluation datasets are available,train a metric to predict the comparison out-come directly. Otherwise, use Bleurt with anyof the Linear, BTL, BTL-logistic models.
3. Manually annotate a few examples from thetest dataset and evaluate the sentence-levelaccuracy of the metric. If the performance ispoor (e.g., accuracy near the random baseline),do not use model-based approaches, obtainfeedback only from human annotators.
4. If the metric is reasonably accurate, use UCBElimination with Uncertainty-aware Selection(BALD). Tune the hyperparameters of thesealgorithms, if possible. Otherwise, refer ap-pendix D for best practices developed basedon analyzing the sensitivity of model-basedalgorithms to hyperparameters.
5. We can reduce the annotation time if we usemultiple annotators in parallel. We observedthat dueling bandit algorithms, though origi-nally proposed for sequential annotations, arerobust to asynchronous feedback from multi-ple annotators (Refer appendix E for details).
8 Related Work
Several works (Bojar et al., 2014, 2015; Sakaguchiet al., 2014, 2016) in Machine translation andGrammatical Error Correction adopt the TrueSkillalgorithm (Herbrich et al., 2006), originally usedfor ranking Xbox gamers, to efficiently rank NLGsystems from pairwise annotations. A recent work(Sakaguchi and Durme, 2018) proposes an onlinealgorithm to rank NLG systems when we receivepairwise preference feedback in the form of a con-tinuous scalar with bounded support. The key dif-ference in our work is that we focus on the problemof identifying the top-rank system instead of rank-ing all the systems. Experimental study of duelingbandit algorithms have been limited to syntheticsimulations in a few works (Yue and Joachims,2011; Urvoy et al., 2013). Most others (Zoghi et al.,2014b,a; Komiyama et al., 2015; Zoghi et al., 2015;Wu and Liu, 2016) focus on information retrievalapplications that involve evaluating search retrievalalgorithms (Radlinski et al., 2008). To the best ofour knowledge, ours is the first work to extensivelystudy the effectiveness of dueling bandit algorithmsfor NLG evaluation.
9 Conclusion & Future work
In this work, we focused on the problem of identify-ing the top-ranked NLG system with few pairwiseannotations. We formulated this problem in an Ac-tive Evaluation framework and showed that duelingbandit algorithms can reduce the number of humanannotations by 80%. We then proposed model-based algorithms to combine automatic metricswith human evaluations and showed that human an-notations can be reduced further by 89%; therebyrequiring only a few hundred human annotationsto identify the top-ranked system. In future work,we would like to extend our analysis to the generalproblem of finding the top-k ranked systems.
8768
Discussion on Ethics & Broader Impact
Evaluating Natural Language Generation (NLG)models accurately and reliably with few human an-notations is an important aspect of NLG researchand its real-world applications. Our work showsthat we can significantly reduce the number of hu-man annotations required to find the top-rankedNLG system with high confidence. We envisionthat our work will benefit a wide range of appli-cations such as translation systems, grammaticalcheckers, etc., where practitioners can find the bestNLG model among a set of candidates more accu-rately and with fewer human annotations. Despitethese improvements, there are still several chal-lenges towards reliable NLG evaluation. For exam-ple, our model-based approaches, which use auto-matic metrics, may be subject to biases and otherundesirable mistakes, depending on the metric andhow they are trained in practice. Our approach maybe used to evaluate models that generate fake news,toxic content, or other harmful applications, eventhough it is not specifically designed for such cases.
Acknowledgments
We thank the Department of Computer Science andEngineering, IIT Madras, and the Robert BoschCenter for Data Science and Artificial Intelligence,IIT Madras (RBC-DSAI), for providing us re-sources required to carry out this research. Wealso wish to thank Google for providing access toTPUs through the TFRC program. We thank theanonymous reviewers for their constructive feed-back in enhancing the work.
ReferencesMikel Artetxe and Holger Schwenk. 2019. Mas-
sively multilingual sentence embeddings for zero-shot cross-lingual transfer and beyond. Trans. Assoc.Comput. Linguistics, 7:597–610.
Peter Auer, Nicolò Cesa-Bianchi, and Paul Fischer.2002. Finite-time analysis of the multiarmed ban-dit problem. Mach. Learn., 47(2-3):235–256.
Viktor Bengs, Róbert Busa-Fekete, Adil El Mesaoudi-Paul, and Eyke Hüllermeier. 2021. Preference-basedonline learning with dueling bandits: A survey. J.Mach. Learn. Res., 22:7:1–7:108.
Ondrej Bojar, Christian Buck, Christian Federmann,Barry Haddow, Philipp Koehn, Johannes Leveling,Christof Monz, Pavel Pecina, Matt Post, Herve Saint-Amand, Radu Soricut, Lucia Specia, and Ales Tam-chyna. 2014. Findings of the 2014 workshop on
statistical machine translation. In Proceedings ofthe Ninth Workshop on Statistical Machine Transla-tion, WMT@ACL 2014, June 26-27, 2014, Baltimore,Maryland, USA, pages 12–58. The Association forComputer Linguistics.
Ondrej Bojar, Rajen Chatterjee, Christian Federmann,Yvette Graham, Barry Haddow, Matthias Huck, An-tonio Jimeno-Yepes, Philipp Koehn, Varvara Lo-gacheva, Christof Monz, Matteo Negri, AurélieNévéol, Mariana L. Neves, Martin Popel, MattPost, Raphael Rubino, Carolina Scarton, Lucia Spe-cia, Marco Turchi, Karin M. Verspoor, and MarcosZampieri. 2016. Findings of the 2016 conference onmachine translation. In Proceedings of the First Con-ference on Machine Translation, WMT 2016, colo-cated with ACL 2016, August 11-12, Berlin, Ger-many, pages 131–198. The Association for ComputerLinguistics.
Ondrej Bojar, Rajen Chatterjee, Christian Federmann,Barry Haddow, Matthias Huck, Chris Hokamp,Philipp Koehn, Varvara Logacheva, Christof Monz,Matteo Negri, Matt Post, Carolina Scarton, LuciaSpecia, and Marco Turchi. 2015. Findings of the2015 workshop on statistical machine translation. InProceedings of the Tenth Workshop on StatisticalMachine Translation, WMT@EMNLP 2015, 17-18September 2015, Lisbon, Portugal, pages 1–46. TheAssociation for Computer Linguistics.
R. Bradley and M. E. Terry. 1952. Rank analysis ofincomplete block designs: I. the method of pairedcomparisons. Biometrika, 39:324.
Tom B. Brown, Benjamin Mann, Nick Ryder, MelanieSubbiah, Jared Kaplan, Prafulla Dhariwal, ArvindNeelakantan, Pranav Shyam, Girish Sastry, AmandaAskell, Sandhini Agarwal, Ariel Herbert-Voss,Gretchen Krueger, Tom Henighan, Rewon Child,Aditya Ramesh, Daniel M. Ziegler, Jeffrey Wu,Clemens Winter, Christopher Hesse, Mark Chen, EricSigler, Mateusz Litwin, Scott Gray, Benjamin Chess,Jack Clark, Christopher Berner, Sam McCandlish,Alec Radford, Ilya Sutskever, and Dario Amodei.2020. Language models are few-shot learners. In Ad-vances in Neural Information Processing Systems 33:Annual Conference on Neural Information Process-ing Systems 2020, NeurIPS 2020, December 6-12,2020, virtual.
Kevin Clark, Minh-Thang Luong, Quoc V. Le, andChristopher D. Manning. 2020. ELECTRA: pre-training text encoders as discriminators rather thangenerators. In 8th International Conference onLearning Representations, ICLR 2020, Addis Ababa,Ethiopia, April 26-30, 2020. OpenReview.net.
Bhuwan Dhingra, Manaal Faruqui, Ankur P. Parikh,Ming-Wei Chang, Dipanjan Das, and William W. Co-hen. 2019. Handling divergent reference texts whenevaluating table-to-text generation. In Proceedingsof the 57th Conference of the Association for Compu-tational Linguistics, ACL 2019, Florence, Italy, July28- August 2, 2019, Volume 1: Long Papers, pages
8769
4884–4895. Association for Computational Linguis-tics.
Ondrej Dusek, Jekaterina Novikova, and Verena Rieser.2020. Evaluating the state-of-the-art of end-to-endnatural language generation: The E2E NLG chal-lenge. Comput. Speech Lang., 59:123–156.
Desmond Elliott and Frank Keller. 2014. Comparingautomatic evaluation measures for image description.In Proceedings of the 52nd Annual Meeting of the As-sociation for Computational Linguistics, ACL 2014,June 22-27, 2014, Baltimore, MD, USA, Volume 2:Short Papers, pages 452–457. The Association forComputer Linguistics.
Moein Falahatgar, Yi Hao, Alon Orlitsky, Venkatad-heeraj Pichapati, and Vaishakh Ravindrakumar.2017a. Maxing and ranking with few assumptions.In Advances in Neural Information Processing Sys-tems 30: Annual Conference on Neural InformationProcessing Systems 2017, December 4-9, 2017, LongBeach, CA, USA, pages 7060–7070.
Moein Falahatgar, Alon Orlitsky, Venkatadheeraj Picha-pati, and Ananda Theertha Suresh. 2017b. Maximumselection and ranking under noisy comparisons. InProceedings of the 34th International Conference onMachine Learning, ICML 2017, Sydney, NSW, Aus-tralia, 6-11 August 2017, volume 70 of Proceedingsof Machine Learning Research, pages 1088–1096.PMLR.
Gabriel Forgues, Joelle Pineau, Jean-MarieLarchevêque, and Réal Tremblay. 2014. Bootstrap-ping dialog systems with word embeddings. InNeurIPS, modern machine learning and naturallanguage processing workshop, volume 2.
Yarin Gal and Zoubin Ghahramani. 2016. Dropoutas a bayesian approximation: Representing modeluncertainty in deep learning. In Proceedings of the33nd International Conference on Machine Learning,ICML 2016, New York City, NY, USA, June 19-24,2016, volume 48 of JMLR Workshop and ConferenceProceedings, pages 1050–1059. JMLR.org.
Yarin Gal, Riashat Islam, and Zoubin Ghahramani. 2017.Deep bayesian active learning with image data. InProceedings of the 34th International Conference onMachine Learning, ICML 2017, Sydney, NSW, Aus-tralia, 6-11 August 2017, volume 70 of Proceedingsof Machine Learning Research, pages 1183–1192.PMLR.
Ralf Herbrich, Tom Minka, and Thore Graepel. 2006.Trueskilltm: A bayesian skill rating system. In Ad-vances in Neural Information Processing Systems19, Proceedings of the Twentieth Annual Conferenceon Neural Information Processing Systems, Vancou-ver, British Columbia, Canada, December 4-7, 2006,pages 569–576. MIT Press.
Neil Houlsby, Ferenc Huszar, Zoubin Ghahramani,and Máté Lengyel. 2011. Bayesian active learning
for classification and preference learning. CoRR,abs/1112.5745.
J. Edward Hu, Rachel Rudinger, Matt Post, and Ben-jamin Van Durme. 2019. PARABANK: monolin-gual bitext generation and sentential paraphrasing vialexically-constrained neural machine translation. InThe Thirty-Third AAAI Conference on Artificial Intel-ligence, AAAI 2019, The Thirty-First Innovative Ap-plications of Artificial Intelligence Conference, IAAI2019, The Ninth AAAI Symposium on EducationalAdvances in Artificial Intelligence, EAAI 2019, Hon-olulu, Hawaii, USA, January 27 - February 1, 2019,pages 6521–6528. AAAI Press.
M. Kendall. 1948. Rank correlation methods.
Junpei Komiyama, Junya Honda, Hisashi Kashima, andHiroshi Nakagawa. 2015. Regret lower bound andoptimal algorithm in dueling bandit problem. InProceedings of The 28th Conference on LearningTheory, COLT 2015, Paris, France, July 3-6, 2015,volume 40 of JMLR Workshop and Conference Pro-ceedings, pages 1141–1154. JMLR.org.
Ilia Kulikov, Alexander H. Miller, Kyunghyun Cho,and Jason Weston. 2019. Importance of search andevaluation strategies in neural dialogue modeling. InProceedings of the 12th International Conference onNatural Language Generation, INLG 2019, Tokyo,Japan, October 29 - November 1, 2019, pages 76–87.Association for Computational Linguistics.
Margaret Li, Jason Weston, and Stephen Roller. 2019.ACUTE-EVAL: improved dialogue evaluation withoptimized questions and multi-turn comparisons.CoRR, abs/1909.03087.
Weixin Liang, J. Zou, and Zhou Yu. 2020. Beyonduser self-reported likert scale ratings: A compari-son model for automatic dialog evaluation. ArXiv,abs/2005.10716.
Chin-Yew Lin. 2004. ROUGE: A package for auto-matic evaluation of summaries. In Text Summariza-tion Branches Out, pages 74–81, Barcelona, Spain.Association for Computational Linguistics.
Yinhan Liu, Jiatao Gu, Naman Goyal, Xian Li, SergeyEdunov, Marjan Ghazvininejad, Mike Lewis, andLuke Zettlemoyer. 2020. Multilingual denoising pre-training for neural machine translation. Trans. Assoc.Comput. Linguistics, 8:726–742.
R. Luce. 1979. Individual choice behavior: A theoreti-cal analysis.
Nitika Mathur, Timothy Baldwin, and Trevor Cohn.2017. Sequence effects in crowdsourced annotations.In Proceedings of the 2017 Conference on EmpiricalMethods in Natural Language Processing, EMNLP2017, Copenhagen, Denmark, September 9-11, 2017,pages 2860–2865. Association for ComputationalLinguistics.
8770
Soheil Mohajer, Changho Suh, and Adel M. Elmahdy.2017. Active learning for top-k rank aggregationfrom noisy comparisons. In Proceedings of the34th International Conference on Machine Learning,ICML 2017, Sydney, NSW, Australia, 6-11 August2017, volume 70 of Proceedings of Machine Learn-ing Research, pages 2488–2497. PMLR.
Courtney Napoles, Maria Nadejde, and J. Tetreault.2019. Enabling robust grammatical error correctionin new domains: Data sets, metrics, and analyses.Transactions of the Association for ComputationalLinguistics, 7:551–566.
Courtney Napoles, Keisuke Sakaguchi, Matt Post, andJ. Tetreault. 2015a. Ground truth for grammaticalitycorrection metrics. In ACL.
Courtney Napoles, Keisuke Sakaguchi, Matt Post, andJ. Tetreault. 2015b. Ground truth for grammaticalitycorrection metrics. In ACL.
Hwee Tou Ng, Siew Mei Wu, Ted Briscoe, ChristianHadiwinoto, Raymond Hendy Susanto, and Christo-pher Bryant. 2014. The conll-2014 shared task ongrammatical error correction. In Proceedings of theEighteenth Conference on Computational NaturalLanguage Learning: Shared Task, CoNLL 2014, Bal-timore, Maryland, USA, June 26-27, 2014, pages1–14. ACL.
Jekaterina Novikova, Ondrej Dusek, Amanda CercasCurry, and Verena Rieser. 2017. Why we need newevaluation metrics for NLG. In Proceedings of the2017 Conference on Empirical Methods in NaturalLanguage Processing, EMNLP 2017, Copenhagen,Denmark, September 9-11, 2017, pages 2241–2252.Association for Computational Linguistics.
Jekaterina Novikova, Ondrej Dusek, and Verena Rieser.2018. Rankme: Reliable human ratings for naturallanguage generation. In Proceedings of the 2018Conference of the North American Chapter of theAssociation for Computational Linguistics: HumanLanguage Technologies, NAACL-HLT, New Orleans,Louisiana, USA, June 1-6, 2018, Volume 2 (ShortPapers), pages 72–78. Association for ComputationalLinguistics.
Kishore Papineni, Salim Roukos, Todd Ward, and Wei-Jing Zhu. 2002. BLEU: a method for automatic eval-uation of machine translation. In Proceedings of the40th Annual Meeting of the Association for Compu-tational Linguistics, pages 311–318, Philadelphia,Pennsylvania, USA. Association for ComputationalLinguistics.
R. Plackett. 1975. The analysis of permutations. Jour-nal of The Royal Statistical Society Series C-appliedStatistics, 24:193–202.
Maja Popovic. 2015. chrf: character n-gram f-scorefor automatic MT evaluation. In Proceedings of theTenth Workshop on Statistical Machine Translation,
WMT@EMNLP 2015, 17-18 September 2015, Lis-bon, Portugal, pages 392–395. The Association forComputer Linguistics.
Filip Radlinski, Madhu Kurup, and Thorsten Joachims.2008. How does clickthrough data reflect retrievalquality? In Proceedings of the 17th ACM Conferenceon Information and Knowledge Management, CIKM2008, Napa Valley, California, USA, October 26-30,2008, pages 43–52. ACM.
Vasile Rus and Mihai C. Lintean. 2012. A comparisonof greedy and optimal assessment of natural languagestudent input using word-to-word similarity metrics.In Proceedings of the Seventh Workshop on BuildingEducational Applications Using NLP, BEA@NAACL-HLT 2012, June 7, 2012, Montréal, Canada, pages157–162. The Association for Computer Linguistics.
Ananya B. Sai, Mithun Das Gupta, Mitesh M. Khapra,and Mukundhan Srinivasan. 2019. Re-evaluatingADEM: A deeper look at scoring dialogue responses.In The Thirty-Third AAAI Conference on ArtificialIntelligence, AAAI 2019, The Thirty-First Innova-tive Applications of Artificial Intelligence Conference,IAAI 2019, The Ninth AAAI Symposium on Educa-tional Advances in Artificial Intelligence, EAAI 2019,Honolulu, Hawaii, USA, January 27 - February 1,2019, pages 6220–6227. AAAI Press.
Ananya B. Sai, Akash Kumar Mohankumar, SiddharthaArora, and Mitesh M. Khapra. 2020a. Improvingdialog evaluation with a multi-reference adversarialdataset and large scale pretraining. Trans. Assoc.Comput. Linguistics, 8:810–827.
Ananya B. Sai, Akash Kumar Mohankumar, andMitesh M. Khapra. 2020b. A survey of eval-uation metrics used for NLG systems. CoRR,abs/2008.12009.
Keisuke Sakaguchi and Benjamin Van Durme. 2018.Efficient online scalar annotation with bounded sup-port. In Proceedings of the 56th Annual Meeting ofthe Association for Computational Linguistics, ACL2018, Melbourne, Australia, July 15-20, 2018, Vol-ume 1: Long Papers, pages 208–218. Association forComputational Linguistics.
Keisuke Sakaguchi, Courtney Napoles, Matt Post, andJoel R. Tetreault. 2016. Reassessing the goals ofgrammatical error correction: Fluency instead ofgrammaticality. Trans. Assoc. Comput. Linguistics,4:169–182.
Keisuke Sakaguchi, Matt Post, and Benjamin VanDurme. 2014. Efficient elicitation of annotations forhuman evaluation of machine translation. In Proceed-ings of the Ninth Workshop on Statistical MachineTranslation, WMT@ACL 2014, June 26-27, 2014,Baltimore, Maryland, USA, pages 1–11. The Associ-ation for Computer Linguistics.
João Sedoc, Daphne Ippolito, Arun Kirubarajan, JaiThirani, Lyle Ungar, and Chris Callison-Burch. 2019.
8771

Chateval: A tool for chatbot evaluation. In Proceed-ings of the 2019 Conference of the North AmericanChapter of the Association for Computational Lin-guistics: Human Language Technologies, NAACL-HLT 2019, Minneapolis, MN, USA, June 2-7, 2019,Demonstrations, pages 60–65. Association for Com-putational Linguistics.
Abigail See, Stephen Roller, Douwe Kiela, and JasonWeston. 2019. What makes a good conversation?how controllable attributes affect human judgments.In Proceedings of the 2019 Conference of the NorthAmerican Chapter of the Association for Computa-tional Linguistics: Human Language Technologies,NAACL-HLT 2019, Minneapolis, MN, USA, June 2-7,2019, Volume 1 (Long and Short Papers), pages 1702–1723. Association for Computational Linguistics.
Thibault Sellam, Dipanjan Das, and Ankur P. Parikh.2020. BLEURT: learning robust metrics for textgeneration. In Proceedings of the 58th Annual Meet-ing of the Association for Computational Linguistics,ACL 2020, Online, July 5-10, 2020, pages 7881–7892.Association for Computational Linguistics.
Edwin D. Simpson and Iryna Gurevych. 2018. Findingconvincing arguments using scalable bayesian pref-erence learning. Trans. Assoc. Comput. Linguistics,6:357–371.
Nitish Srivastava, Geoffrey E. Hinton, Alex Krizhevsky,Ilya Sutskever, and Ruslan Salakhutdinov. 2014.Dropout: a simple way to prevent neural networksfrom overfitting. J. Mach. Learn. Res., 15(1):1929–1958.
Nisan Stiennon, L. Ouyang, Jeff Wu, D. Ziegler, Ryan J.Lowe, Chelsea Voss, A. Radford, Dario Amodei, andPaul Christiano. 2020. Learning to summarize fromhuman feedback. ArXiv, abs/2009.01325.
Katsuhito Sudoh, Kosuke Takahashi, and Satoshi Naka-mura. 2021. Is this translation error critical?:Classification-based human and automatic machinetranslation evaluation focusing on critical errors. InHUMEVAL.
Balázs Szörényi, Róbert Busa-Fekete, Adil Paul, andEyke Hüllermeier. 2015. Online rank elicitation forplackett-luce: A dueling bandits approach. In Ad-vances in Neural Information Processing Systems 28:Annual Conference on Neural Information Process-ing Systems 2015, December 7-12, 2015, Montreal,Quebec, Canada, pages 604–612.
Tanguy Urvoy, F. Clérot, R. Féraud, and Sami Naamane.2013. Generic exploration and k-armed voting ban-dits. In ICML.
Ashish Vaswani, Noam Shazeer, Niki Parmar, JakobUszkoreit, Llion Jones, Aidan N. Gomez, LukaszKaiser, and Illia Polosukhin. 2017. Attention is allyou need. In Advances in Neural Information Pro-cessing Systems 30: Annual Conference on NeuralInformation Processing Systems 2017, December 4-9,2017, Long Beach, CA, USA, pages 5998–6008.
Michael Völske, Martin Potthast, Shahbaz Syed, andBenno Stein. 2017. Tl;dr: Mining reddit tolearn automatic summarization. In Proceedingsof the Workshop on New Frontiers in Summariza-tion, NFiS@EMNLP 2017, Copenhagen, Denmark,September 7, 2017, pages 59–63. Association forComputational Linguistics.
John Wieting, Mohit Bansal, Kevin Gimpel, and KarenLivescu. 2016. Towards universal paraphrastic sen-tence embeddings. In 4th International Conferenceon Learning Representations, ICLR 2016, San Juan,Puerto Rico, May 2-4, 2016, Conference Track Pro-ceedings.
Huasen Wu and Xin Liu. 2016. Double thompson sam-pling for dueling bandits. In Advances in NeuralInformation Processing Systems 29: Annual Con-ference on Neural Information Processing Systems2016, December 5-10, 2016, Barcelona, Spain, pages649–657.
Linting Xue, Noah Constant, Adam Roberts, MihirKale, Rami Al-Rfou, Aditya Siddhant, Aditya Barua,and Colin Raffel. 2020. mt5: A massively multi-lingual pre-trained text-to-text transformer. CoRR,abs/2010.11934.
Yisong Yue, Josef Broder, Robert Kleinberg, andThorsten Joachims. 2012. The k-armed dueling ban-dits problem. J. Comput. Syst. Sci., 78(5):1538–1556.
Yisong Yue and Thorsten Joachims. 2011. Beat themean bandit. In Proceedings of the 28th Interna-tional Conference on Machine Learning, ICML 2011,Bellevue, Washington, USA, June 28 - July 2, 2011,pages 241–248. Omnipress.
Tianyi Zhang, Varsha Kishore, Felix Wu, Kilian Q.Weinberger, and Yoav Artzi. 2020. BERTScore:evaluating text generation with BERT. In 8th Inter-national Conference on Learning Representations,ICLR 2020, Addis Ababa, Ethiopia, April 26-30,2020. OpenReview.net.
Wei Zhao, Maxime Peyrard, Fei Liu, Yang Gao, Chris-tian M. Meyer, and Steffen Eger. 2019. Moverscore:Text generation evaluating with contextualized em-beddings and earth mover distance. In Proceedingsof the 2019 Conference on Empirical Methods inNatural Language Processing and the 9th Interna-tional Joint Conference on Natural Language Pro-cessing, EMNLP-IJCNLP 2019, Hong Kong, China,November 3-7, 2019, pages 563–578. Association forComputational Linguistics.
Masrour Zoghi, Zohar S. Karnin, Shimon Whiteson,and Maarten de Rijke. 2015. Copeland dueling ban-dits. In Advances in Neural Information ProcessingSystems 28: Annual Conference on Neural Informa-tion Processing Systems 2015, December 7-12, 2015,Montreal, Quebec, Canada, pages 307–315.
8772
Masrour Zoghi, Shimon Whiteson, Maarten de Rijke,and Rémi Munos. 2014a. Relative confidence sam-pling for efficient on-line ranker evaluation. In Sev-enth ACM International Conference on Web Searchand Data Mining, WSDM 2014, New York, NY, USA,February 24-28, 2014, pages 73–82. ACM.
Masrour Zoghi, Shimon Whiteson, Rémi Munos, andMaarten de Rijke. 2014b. Relative upper confidencebound for the k-armed dueling bandit problem. InProceedings of the 31th International Conference onMachine Learning, ICML 2014, Beijing, China, 21-26 June 2014, volume 32 of JMLR Workshop andConference Proceedings, pages 10–18. JMLR.org.
A Further Details on Experiments
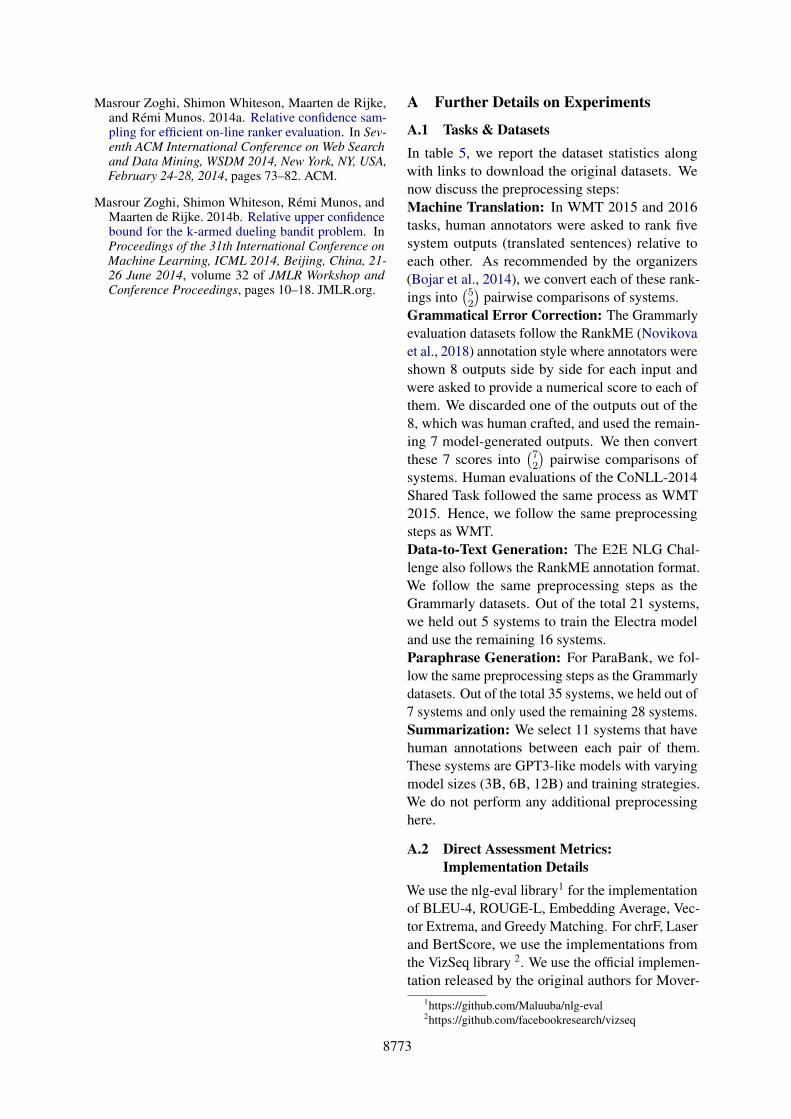
A.1 Tasks & DatasetsIn table 5, we report the dataset statistics alongwith links to download the original datasets. Wenow discuss the preprocessing steps:Machine Translation: In WMT 2015 and 2016tasks, human annotators were asked to rank fivesystem outputs (translated sentences) relative toeach other. As recommended by the organizers(Bojar et al., 2014), we convert each of these rank-ings into
(52
)pairwise comparisons of systems.
Grammatical Error Correction: The Grammarlyevaluation datasets follow the RankME (Novikovaet al., 2018) annotation style where annotators wereshown 8 outputs side by side for each input andwere asked to provide a numerical score to each ofthem. We discarded one of the outputs out of the8, which was human crafted, and used the remain-ing 7 model-generated outputs. We then convertthese 7 scores into
(72
)pairwise comparisons of
systems. Human evaluations of the CoNLL-2014Shared Task followed the same process as WMT2015. Hence, we follow the same preprocessingsteps as WMT.Data-to-Text Generation: The E2E NLG Chal-lenge also follows the RankME annotation format.We follow the same preprocessing steps as theGrammarly datasets. Out of the total 21 systems,we held out 5 systems to train the Electra modeland use the remaining 16 systems.Paraphrase Generation: For ParaBank, we fol-low the same preprocessing steps as the Grammarlydatasets. Out of the total 35 systems, we held out of7 systems and only used the remaining 28 systems.Summarization: We select 11 systems that havehuman annotations between each pair of them.These systems are GPT3-like models with varyingmodel sizes (3B, 6B, 12B) and training strategies.We do not perform any additional preprocessinghere.
A.2 Direct Assessment Metrics:Implementation Details
We use the nlg-eval library1 for the implementationof BLEU-4, ROUGE-L, Embedding Average, Vec-tor Extrema, and Greedy Matching. For chrF, Laserand BertScore, we use the implementations fromthe VizSeq library 2. We use the official implemen-tation released by the original authors for Mover-
1https://github.com/Maluuba/nlg-eval2https://github.com/facebookresearch/vizseq
8773
Task Dataset # Systems# Human
AnnotationsLabel Distrib.
(0-0.5-1)Downloadable
Link
MachineTranslation
WMT15 fin-eng 14 31577 37%-26%-37%Click hereWMT15 rus-eng 13 44539 36%-27%-37%
WMT15 deu-eng 13 40535 32%-36%-32%WMT16 tur-eng 9 10188 28%-44%-28%
Click hereWMT16 ron-eng 7 15822 38%-24%-38%WMT16 cze-eng 12 125788 38%-25%-37%WMT16 deu-eng 10 20937 37%-26%-37%
GrammaticalErrorCorrection
Grammarly (FCE) 7 20328 29%-40%-31%Click here
Grammarly (Wiki) 7 20832 29%-40%-31%CoNLL-2014 Shared Task 13 16209 23%-52%-25% Click here
Data-to-TextGeneration
E2E NLG Challenge 16 17089 24%-50%-26% Click here
ParaphraseGeneration
ParaBank 28 151148 44%-2%-54% Click here
Summarization TLDR OpenAI 11 4809 49%-0%-51% Click here
Table 5: Description of tasks and datasets with the number of NLG systems, number of pairwise human annotations,label distribution and the downloadable links to the datasets before preprocessing
Score and Bleurt. Among these metrics, Bleurtis the only trainable metric. We use the publiclyreleased Bleurt-base checkpoint trained on WMTdirect judgments data. As described in section 4.2,we apply Dropout to the Bleurt model during testtime to estimate prediction uncertainty.
A.3 Finetuning DatasetsHere, we describe the task-specific datasets usedfor finetuning the Electra model (pairwise evalu-ation metric described in section 5.2). For MT,we used human evaluations of WMT 2013 and2014, consisting of a total of 650k examples. ForGEC, we curated a training dataset of 180k pairsof texts and human preference using data releasedby (Napoles et al., 2015b) and the developmentset released by (Napoles et al., 2019). We utilize11k examples from 5 held-out systems in the E2ENLG Challenge (apart from the 16 systems usedfor evaluations) for Data-to-Text generation. Lastly,we use a dataset of 180k examples from 7 held-outsystems in the ParaBank dataset for paraphrase gen-eration. We use 90%− 10% split for splitting thedataset into train and validation sets. Note thatthese datasets do not have any overlap with thedatasets used for evaluating dueling bandit algo-rithms.
A.4 Finetuning DetailsWe use the pretrained Electra-base model (Clarket al., 2020) with 110M parameters (12 layers and12 attention heads) as our base model. We finetunethe model using ADAM optimizer with β1 = 0.9and β2 = 0.99. We use a linear learning rate decaywith a maximum learning rate of 1e-5 and warm-up
for 10% of training. We use a batch size of 128and finetune for four epochs. We finetune all themodels on Google Cloud TPU v3-8. To estimateprediction, we apply Dropout to the Electra modelduring test time as described in 4.2.
B Summary of Dueling BanditAlgorithms
We now provide an overview of various duelingbandit algorithms in the literature. We first intro-duce a few additional notations and terminologiesin B.1. Later in B.2, we describe the various struc-tural assumptions made by different dueling banditalgorithms. Finally, in B.3, we summarize 13 duel-ing bandit algorithms that we analyze in this work.
B.1 Notations and Terminologies
Let ∆ij = pij− 12 where pij is the preference prob-
ability of system i over j, as defined in section 2.3.We call a system as the Copeland winner if it beatsmore number of systems than any other system.Mathematically, a Copeland winner i∗ is defined asi∗ = argmaxi
∑kj=1 1(∆ij > 0). A special case
of the Copeland winner is the Condorcet winner,which is the system that beats all other systems. Inall our NLG tasks and datasets, we observed thatthis special case holds true i.e. there exists a systemthat beats all other k − 1 systems, and we define itas the top-ranked system. Nevertheless, we men-tion these two definitions to distinguish algorithmsthat work for the general Copeland winner, even ifthe Condorcet winner does not exist.
8774

B.2 Assumptions
All the dueling bandit algorithms that we analyzein this work assume a stochastic feedback setup inwhich the feedback is generated according to anunderlying (unknown) stationary probabilistic pro-cess. Specifically, in our Active Evaluation frame-work, this is equivalent to assuming that the anno-tator preference is stationary over time and is givenby some fixed distribution pa(w|Y (t)
1 , Y(t)2 ). Fur-
ther, many dueling bandit algorithms make variousassumptions on the true pairwise preferences andexploit these assumptions to derive theoretical guar-antees (Bengs et al., 2021). In table 6, we describethe various commonly used assumptions by duel-ing bandit algorithms. For example, the stochastictriangle inequality assumption (STI), described inrow 4 of table 6, assumes that the true preferenceprobabilities between systems obey the triangle in-equality. We note here that one cannot verify thevalidity of these assumptions apriori since we donot have access to the true preferences.
B.3 Algorithms
In table 7, we describe the various dueling banditalgorithms along with the assumptions (used toprovide theoretical guarantees) and the targetwinner. We summarize these algorithms below:
IF: Interleaved Filtering (IF) (Yue et al., 2012) algo-rithm consists of a sequential elimination strategywhere a currently selected system si is comparedagainst the rest of the active systems (not yet elimi-nated). If the system sj beats a system si with highconfidence, then si is eliminated, and sj is com-pared against all other active systems. Similarly, ifthe system si beats sj with high confidence, then sjis eliminated, and si is continued to be comparedagainst the remaining active systems. Under theassumptions of TO, SST, and STI, the authors pro-vide theoretical guarantees for the expected regretachieved by IF.
BTM: Beat The Mean (BTM) (Yue and Joachims,2011), similar to IF, is an elimination-based algo-rithm that selects the system si with the fewestcomparisons and compares it with a randomly cho-sen system from the set of active systems. Basedon the comparison outcome, a score and confidenceinterval are assigned to the system si. BTM elimi-nates a system as soon as there is another systemwith a significantly higher score.
Knockout, Seq Elim, Single Elim: Knockout(Falahatgar et al., 2017b), Sequential Elimination(Falahatgar et al., 2017a), Single Elimination (Mo-hajer et al., 2017) are all algorithms that proceed ina knockout tournament fashion where the systemsare randomly paired, and the winner in each duelwill play the next round (losers are knocked out)until the overall winner is determined. During aduel, the algorithm repeatedly compares the twosystems to reliably determine the winner. The keydifference between the three algorithms is the as-sumptions they use and how they determine thenumber of comparisons required to identify thewinning system in a duel with high probability.Plackett Luce: Plackett Luce Condorcet winneridentification algorithm (Szörényi et al., 2015) as-sumes that the true rank distribution follows thePlacket-Luce model (Plackett, 1975). The algo-rithm is based on a budgeted version of QuickSort.The authors show that it achieves a worst-time an-notation complexity of the order k log k under thePlacket-Luce assumption.RUCB: Relative Upper Confidence Bound (RUCB)(Zoghi et al., 2014b) is an adaptation of the well-known UCB algorithm (Auer et al., 2002) to thedueling bandit setup. Similar to UCB, RUCB se-lects the first system s
(1)t based on "optimistic" es-
timates of the pairwise preference probabilities i.e.based on an upper confidence bound of preferenceprobabilities. The second system s
(2)t is chosen to
be the one that is most likely to beat s(1)t .RCS: Relative Confidence Sampling (RCS) (Zoghiet al., 2014a) follows a Bayesian approach by main-taining a posterior distribution over the preferenceprobabilities. At each time step t, the algorithmsamples preference probabilities from the posteriorand simulates a round-robin tournament among thesystems to determine the Condorcet winner. Theestimated Condorcet winner is chosen as the firstsystem s
(1)t and second system s
(2)t is chosen such
that it has the best chance of beating s(1)t .
RMED: Relative Minimum Empirical Divergence1(RMED) algorithm (Komiyama et al., 2015) main-tains an empirical estimate of the “likelihood” thata system is the Condorcet winner. It then uses thisestimate to sample the first system s
(1)t and then
selects the second system s(2)t that is most likely to
beat s(1)t .SAVAGE: Sensitivity Analysis of VAriables forGeneric Exploration (SAVAGE) (Urvoy et al.,
8775

Assumption Name Condition
Total Order (TO)∃ a total order ≻ over S:i ≻ j ⇐⇒ ∆ij > 0
Strong stochastictransitivity (SST)
∆ij > 0,∆jk > 0 =⇒∆ik ≥ max(∆ij ,∆jk)
Relaxed stochastictransitivity (RST)
∃γ ≥ 1: ∆ij > 0,∆jk > 0=⇒ γ∆ik ≥ max(∆ij ,∆jk)
Stochastic triangleinequality (STI)
∆ij > 0,∆jk > 0 =⇒∆ik ≤ ∆ij +∆jk
Condorcet winner (CW) ∃i∗: ∆i∗,j > 0, ∀j ∈ S − i∗
PL modelThe underlying rank distributionfollows the Plackett-Luce (PL)model (Plackett, 1975; Luce, 1979)
Table 6: Various assumptions made by dueling banditalgorithms in the literature
Algorithm Assumptions TargetIF (Yue et al., 2012) TO+SST+STI CondorcetBTM (Yue and Joachims, 2011) TO+RST+STI CondorcetSeq-Elim. (Falahatgar et al., 2017a) SST CondorcetPlackett Luce (Szörényi et al., 2015) PL model CondorcetKnockout (Falahatgar et al., 2017b) SST+STI CondorcetSingle Elim.(Mohajer et al., 2017) TO CondorcetRUCB (Zoghi et al., 2014b) CW CondorcetRCS (Zoghi et al., 2014a) CW CondorcetRMED (Komiyama et al., 2015) CW CondorcetSAVAGE (Urvoy et al., 2013) - CopelandCCB (Zoghi et al., 2015) - CopelandDTS (Wu and Liu, 2016) - CopelandDTS++ (Wu and Liu, 2016) - Copeland
Table 7: Summary of dueling bandits algorithms in theliterature along with their theoretical assumptions andthe target winner of the learner
2013) is a generic algorithm that can be adopted forvarious ranking problems such as Copeland winneridentification. SAVAGE (Copeland) algorithm, ateach time step, randomly samples a pair of systemsfrom the set of active system pairs (not yet elimi-nated) and updates the preference estimates. A sys-tem pairs (si, sj) is eliminated if either (i) the resultof comparison between si and sj is already knownwith high probability, or (ii) there exists some sys-tem sk where the estimated Copeland score of skis significantly higher than si or sj .
CCB: Copeland Confidence Bound (CCB) (Zoghiet al., 2015) is similar to the RUCB algorithm butis designed to identify the Copeland Winner (a gen-eralization of the Condorcet winner). The CCB al-gorithm maintains optimistic preference estimatesand uses them to choose the first system s
(1)t and
then selects the second system s(2)t that is likely
to discredit the hypothesis that s(1)t is indeed theCopeland winner. The algorithm successively re-moves all other systems that are highly unlikely tobe a Copeland winner.
DTS, DTS++: The Double Thompson Sampling(DTS) algorithm (Wu and Liu, 2016) maintainsa posterior distribution over the pairwise prefer-ence matrix, and selects the system pairs s(1)t , s
(2)t
based on two independent samples from the poste-rior distribution. The algorithm updates the poste-rior distributions based on the comparison outcomeand eliminates systems that are unlikely to be theCopeland winner. DTS++ is an improvement pro-posed by the authors, which differs from DTS inthe way the algorithm breaks ties. Both have thesame theoretical guarantees, but DTS++ has beenempirically shown to achieve better performance(in terms of regret minimization).
C Hyperparameters Details
We discuss the details of the hyperparameters andthe tuning procedure used for dueling bandit algo-rithm in C.1, pairwise probability models in C.2and our model-based algorithm in C.3. In all threecases, we use the validation split of the finetuningdatasets described in A.3 as our validation dataset.For example, the validation split of the finetuningdatasets for MT consists of 10% of the WMT 2013and 2014 datasets. We use this dataset to tune thehyperparameters for WMT 2015 and 2016 datasets.
C.1 Dueling Bandit Algorithms
For all algorithms other than Knockout and SingleElimination, we use the hyperparameters recom-mended by the original authors for all the datasets.For example, in the RMED algorithm, describedin algorithm 1 of (Komiyama et al., 2015), we usef(K) = 0.3K1.01 as suggested by the authors. Forthe RCS algorithm, described in algorithm 1 of(Zoghi et al., 2014a), we use α (exploratory con-stant) = 0.501. For RUCB (algorithm 1 of (Zoghiet al., 2014b)), we use α = 0.51. Similarly, for allalgorithms other than Knockout and Single Elimi-nation, we use the recommended hyperparametersmentioned in the original paper. For knockout andSingle Elimination, we found that the performancewas very sensitive to the hyperparameters. Forthese two algorithms, we manually tuned the hy-perparameters on the validation set. In Knockout,algorithm 3 of (Falahatgar et al., 2017b), we useϵ = 0.2, δ = 0.05, γ = 1.0 for WMT’16 ron-engand TLDR OpenAI datasets. We use ϵ = 0.2, δ =0.05, γ = 0.6 for ParaBank and Grammarly-Wikidatasets and ϵ = 0.2, δ = 0.09, γ = 0.6 for allother datasets. In Single Elimination, we use m
8776
(number of pairwise comparisons per duel) = 1000for WMT’16 ron-eng, E2E NLG, Grammarly-FCE,m = 1500 for CoNLL’14 shared task and m = 500for all other datasets.
C.2 Pairwise Probability Models
Let f(Y ) be the unnormalized score given anautomatic evaluation metric for an hypothesis Y .We preprocess the score f(Y ) to obtain f(Y ) to en-sure that the pairwise probability scores is alwaysa valid i.e. lies between 0 and 1. To preprocess thescores, we use the validation dataset consistingof tuples of the form {Y (i)
1 , Y(i)2 , w(i)}Ni=1 where
Y(i)1 , Y
(i)2 represent the ith generated texts and
w(i) is the corresponding comparison outcomeprovided by human annotators.
Linear: Let ∆i = |f(Y (i)1 ) − f(Y
(i)2 )| and
∆ = maxi∆i. We divide the unormalized f(Y )scores by 2∆ i.e.
f(Y ) =f(Y )
2∆
.BTL: Let fm
i = max{f(Y (i)1 ), f(Y
(i)2 )}, fm =
maxi fmi . We now subtract the scores by fm to
ensure that the scores are non-negative i.e.
f(Y ) = f(Y )− fm
BTL-Logistic: BTL-Logistic model always pro-vides a score between 0 and 1. However, wefound that dividing the scores by a temperatureco-efficient γ can provide better results i.e.
f(Y ) =f(Y )
γ
We tune γ using grid search between 0.005 and1 on the validation set to minimize the cross-entropy loss between the preference probabilitiesp(Y1 ≻ Y2) and the human labels w.
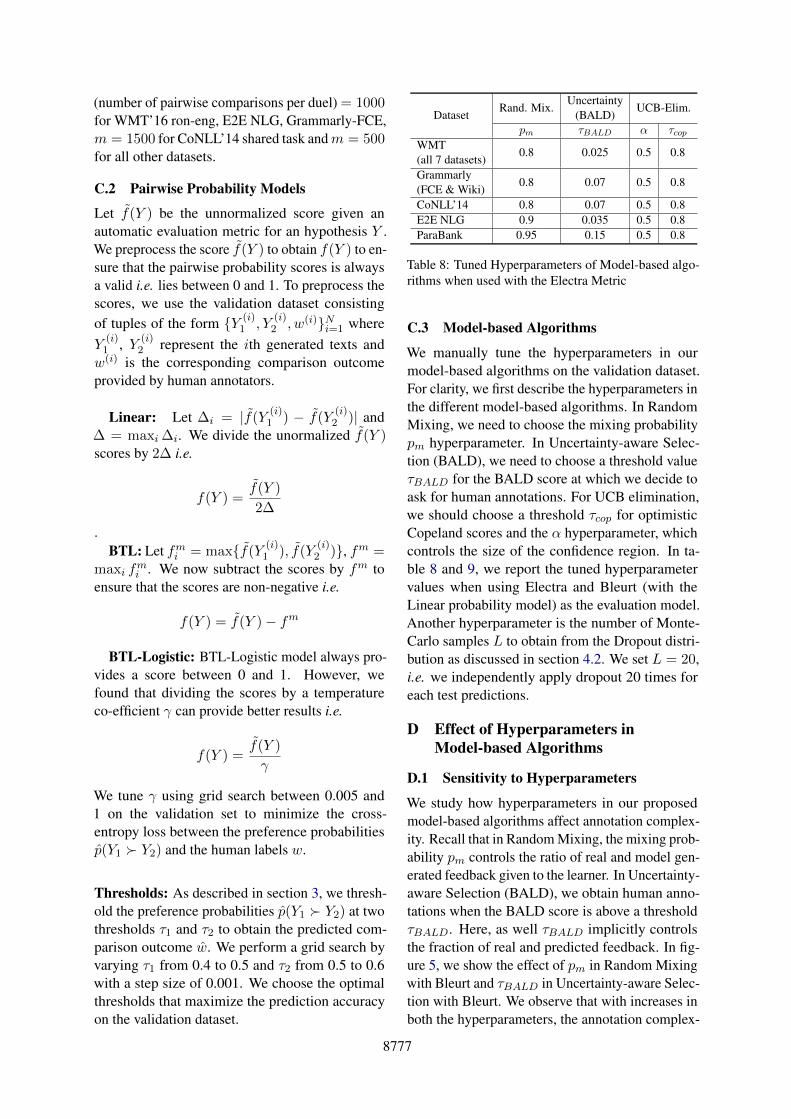
Thresholds: As described in section 3, we thresh-old the preference probabilities p(Y1 ≻ Y2) at twothresholds τ1 and τ2 to obtain the predicted com-parison outcome w. We perform a grid search byvarying τ1 from 0.4 to 0.5 and τ2 from 0.5 to 0.6with a step size of 0.001. We choose the optimalthresholds that maximize the prediction accuracyon the validation dataset.
DatasetRand. Mix.
Uncertainty(BALD)
UCB-Elim.
pm τBALD α τcopWMT(all 7 datasets)
0.8 0.025 0.5 0.8
Grammarly(FCE & Wiki)
0.8 0.07 0.5 0.8
CoNLL’14 0.8 0.07 0.5 0.8E2E NLG 0.9 0.035 0.5 0.8ParaBank 0.95 0.15 0.5 0.8
Table 8: Tuned Hyperparameters of Model-based algo-rithms when used with the Electra Metric
C.3 Model-based Algorithms
We manually tune the hyperparameters in ourmodel-based algorithms on the validation dataset.For clarity, we first describe the hyperparameters inthe different model-based algorithms. In RandomMixing, we need to choose the mixing probabilitypm hyperparameter. In Uncertainty-aware Selec-tion (BALD), we need to choose a threshold valueτBALD for the BALD score at which we decide toask for human annotations. For UCB elimination,we should choose a threshold τcop for optimisticCopeland scores and the α hyperparameter, whichcontrols the size of the confidence region. In ta-ble 8 and 9, we report the tuned hyperparametervalues when using Electra and Bleurt (with theLinear probability model) as the evaluation model.Another hyperparameter is the number of Monte-Carlo samples L to obtain from the Dropout distri-bution as discussed in section 4.2. We set L = 20,i.e. we independently apply dropout 20 times foreach test predictions.
D Effect of Hyperparameters inModel-based Algorithms
D.1 Sensitivity to Hyperparameters
We study how hyperparameters in our proposedmodel-based algorithms affect annotation complex-ity. Recall that in Random Mixing, the mixing prob-ability pm controls the ratio of real and model gen-erated feedback given to the learner. In Uncertainty-aware Selection (BALD), we obtain human anno-tations when the BALD score is above a thresholdτBALD. Here, as well τBALD implicitly controlsthe fraction of real and predicted feedback. In fig-ure 5, we show the effect of pm in Random Mixingwith Bleurt and τBALD in Uncertainty-aware Selec-tion with Bleurt. We observe that with increases inboth the hyperparameters, the annotation complex-
8777

DatasetRand. Mix.
Uncertainty(BALD)
UCB-Elim.
pm τBALD α τcopWMT(all 7 datasets)
0.8 0.005 0.5 0.8
Grammarly(FCE & Wiki)
0.8 0.0005 0.5 0.8
CoNLL’14 0.01 0.00005 1 0.7E2E NLG 0.7 0.0025 0.5 0.8ParaBank 0.4 0.0005 0.5 0.8
Table 9: Tuned Hyperparameters of Model-based algo-rithms when used with the Bleurt Metric
0.0 0.2 0.4 0.6 0.8
Mixing Probability pm
0
2000
4000
6000
Ann
otat
ion
Com
plex
ity
Random Mixing
0.000 0.002 0.004 0.006 0.008
BALD Threshold τBALD
0
2000
4000
6000
Uncertainty-aware SelectionWMT16 tur→eng
WMT16 ron→eng
WMT16 cze→eng
WMT16 deu→eng
WMT15 fin→eng
WMT15 rus→eng
WMT15 deu→eng
Figure 5: Variation in annotation complexity with Mix-ing probability in Random Mixing with Bleurt on theleft and with BALD threshold in Uncertainty-aware Se-lection (BALD) with Bleurt on the right
ity decreases, i.e., with a greater amount of feed-back received from Bleurt, the number of requiredhuman annotations is lower. However, as shown infigure 6, we observe the opposite trend when weuse metrics such as BLEU, which are highly inac-curate. In these cases, we require a greater numberof human annotations to compensate for the highlyerroneous feedback received from the evaluationmetric. Therefore, the optimal mixing probabil-ity pm in such cases is close to 0 i.e. equivalentto the model-free case. For moderately accuratemetrics such as Laser, we observed the optimal pmwas close to 0.4 to 0.6. The key insight from theseobservations is that the higher the accuracy of themetric, the higher amount of feedback can be ob-tained from the metric to identify the top-rankedsystem. In figure 7, we analyze how the annota-tion complexity of UCB Elimination with Bleurtvaries with the optimistic Copeland threshold τcophyperparameter. We fixed α hyperparameter to 0.6.We observed that UCB Elimination is much morerobust to τcop and a general value of τcop = 0.8worked well across all datasets and metrics.
D.2 Best Practices in ChoosingHyperparameters
The optimal approach to choose hyperparametersis usually to tune them on a validation set. But, at
Figure 6: Prediction accuracy v/s number of humanannotations collected for Random Mixing with Bluertand BLEU for different mixing probability pm on theWMT 15 deu-eng dataset
0.0 0.2 0.4 0.6 0.8Copeland Threshold τcop
2000
4000
6000
Ann
otat
ion
Com
plex
ity WMT16 tur→engWMT16 ron→engWMT16 cze→engWMT15 fin→engWMT15 rus→engWMT15 deu→eng
Figure 7: Annotation complexity of UCB Eliminationwith Bleurt v/s the Copland threshold for α = 0.6
times, it may not be possible either because of com-putational reasons or because a human-annotatedvalidation dataset may not be available. In suchcases, we provide a few heuristics based on ourprevious analysis to choose hyperparameters in ourmodel-based algorithms:
1. Choose the mixing probability pm in RandomMixing proportionately with the accuracy ofthe metric. For example, we observed that formetrics with sentence-level prediction accu-racy greater than 70%, pm = 0.8 tend to workwell. For accuracy between 65% to 70%, pmin the range of 0.5-0.7 worked well.
2. Once we choose a value of pm, we can findan appropriate BALD threshold τBALD where100×pm% of BALD scores are above τBALD
and 100×(1−pm)% of BALD score are belowτBALD. Choosing the BALD threshold thisway ensures that we can directly control thedesired amount of model-predicted feedbackgiven to the learner.
3. For UCB Elimination, we recommend usingthe default values of α = 0.6 and τcop = 0.8,which we found to work well across tasks andmetrics.
8778
0 4 8 12 16 20 24 28 32
Feedback Delay
1000
2000
3000
4000
5000A
nnot
atio
nC
ompl
exity
RCSRUCBRMEDDTSDTS++
Figure 8: Annotation Complexity v/s delays in feedbackon the WMT16 deu-eng dataset
0 10 20 30 40 50 60 70 80Micro Avg Accuracy across all 7 WMT datasets
Chrf
Bleu-4
Rouge-L
Embedding Avg
Greedy Match
Vector Extrema
Bert score
Laser
MoverScore
Bleurt
LinearBTLBTL-Logistic
Figure 9: Sentence-level prediction accuracy of directassessment metrics with the Linear, BTL, and BTL-Logistic models averaged across the 7 WMT datasets
E Robustness to Delayed Feedback
In some instances, human annotations are obtainedfrom multiple crowdsourced annotators in parallelto reduce the time taken for annotations. In suchcases, the learner is required to choose the systempairs (s
(t)1 , s
(t)2 ) to give to some annotator i even
before we obtain the result w(t−1) of the previouscomparison from some other annotator j. In otherwords, the learner may experience a delay d > 0in feedback where at time t, the learner may onlyhave access to the comparison history up to timet−d−1. As shown in figure 8, we observe that thetop-performing dueling bandit algorithms tend tobe robust to delays in feedback. We notice that thevariation in the annotation complexity of RMEDand RCS as measured by standard deviation is only64.49 and 62.86, respectively.
F Additional Results
F.1 Effect of number of NLG systems
In figure 10, we compare the variations in annota-tion complexity of Random Mixing (with Electrametric) using uniform exploration and dueling ban-dit algorithms. Similar to the model-free case dis-cussed in section 6.4, the annotation complexity ofuniform exploration grows as O(k2) but the anno-tation complexity only varies as O(k) for RMED,
4 8 12 16 20 24 280.0
0.2
0.4
0.6
0.8
1.0×10⁵
uniform
4 8 12 16 20 24 28
1
2
3
4
5
×103
RCSRUCBRMED
Number of NLG systems
Que
ryC
ompl
exity
Figure 10: Annotation complexity of Random Mixingusing the Electra metric with uniform exploration anddueling bandit algorithms as function of number of NLGsystems on the ParaBank dataset
RCS, and RUCB dueling bandit algorithms
F.2 Results of Dueling Bandit AlgorithmsWe report the annotation complexity of all 13 du-eling bandit algorithms on 13 evaluation datasetsin table 10. In figure 11, we show the top-rankprediction accuracy as a function of the numberof human annotations for various dueling banditalgorithms on all the datasets, other than WMT 16tur-eng, which is separately depicted in figure 2.
F.3 Performance of Evaluation MetricsIn table 11, we report the sentence-level accuracyin predicting the comparison outcome for 10 directassessment metrics using three probability mod-els along with the trained pairwise metric (Elec-tra). We observe that there is little variation inperformance across the three probability models.To further illustrate this, we plot the accuracy onthe WMT datasets in figure 9 and observe that theperformance is largely similar across Linear, BTL,and BTL-logistic models.
F.4 Model-based AlgorithmsIn figure 12, we show the top-rank prediction accu-racy as a function of the number of human anno-tations for various model-based algorithms usingthe Electra metric with RMED. We observe thatRandom Mixing and Uncertainty-aware Selection(BALD) algorithms have significantly higher pre-diction accuracy than model-free RMED for anygiven number of human annotations. Further, whenwe use UCB Elimination with Uncertainty-awareSelection, we observe the highest top-rank predic-tion accuracy for any given number of annotations..
8779
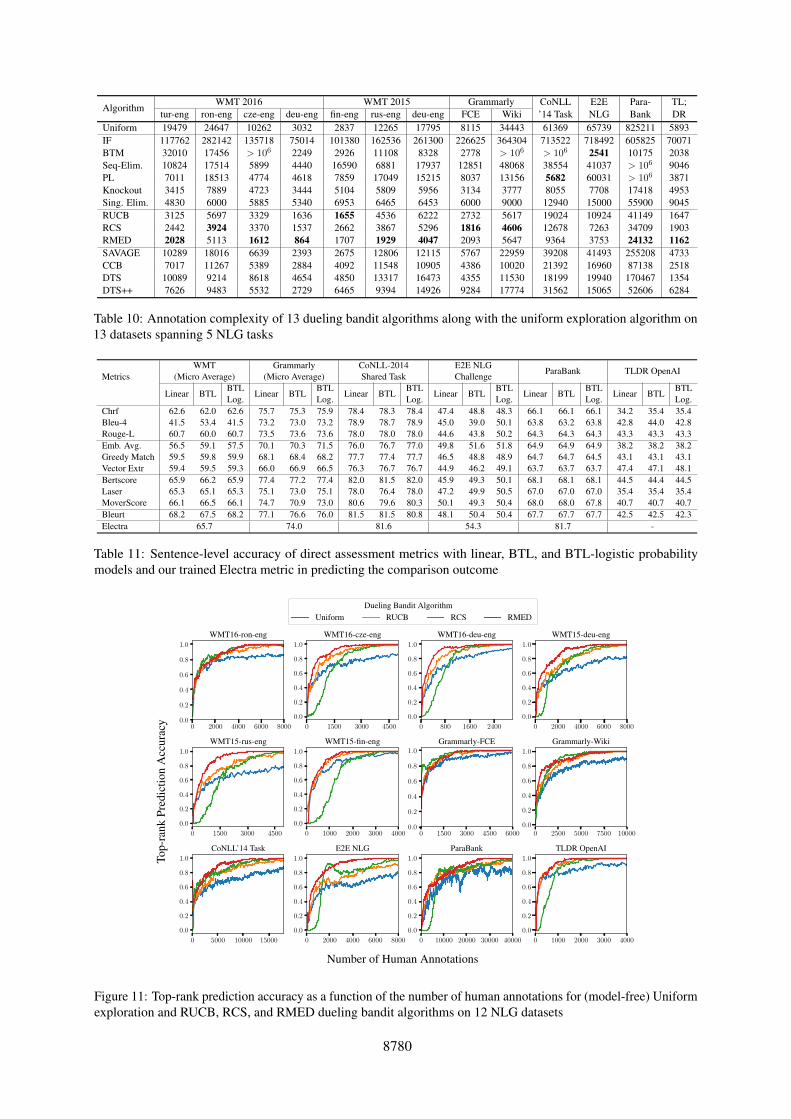
AlgorithmWMT 2016 WMT 2015 Grammarly CoNLL
’14 TaskE2ENLG
Para-Bank
TL;DRtur-eng ron-eng cze-eng deu-eng fin-eng rus-eng deu-eng FCE Wiki
Uniform 19479 24647 10262 3032 2837 12265 17795 8115 34443 61369 65739 825211 5893IF 117762 282142 135718 75014 101380 162536 261300 226625 364304 713522 718492 605825 70071BTM 32010 17456 > 106 2249 2926 11108 8328 2778 > 106 > 106 2541 10175 2038Seq-Elim. 10824 17514 5899 4440 16590 6881 17937 12851 48068 38554 41037 > 106 9046PL 7011 18513 4774 4618 7859 17049 15215 8037 13156 5682 60031 > 106 3871Knockout 3415 7889 4723 3444 5104 5809 5956 3134 3777 8055 7708 17418 4953Sing. Elim. 4830 6000 5885 5340 6953 6465 6453 6000 9000 12940 15000 55900 9045RUCB 3125 5697 3329 1636 1655 4536 6222 2732 5617 19024 10924 41149 1647RCS 2442 3924 3370 1537 2662 3867 5296 1816 4606 12678 7263 34709 1903RMED 2028 5113 1612 864 1707 1929 4047 2093 5647 9364 3753 24132 1162SAVAGE 10289 18016 6639 2393 2675 12806 12115 5767 22959 39208 41493 255208 4733CCB 7017 11267 5389 2884 4092 11548 10905 4386 10020 21392 16960 87138 2518DTS 10089 9214 8618 4654 4850 13317 16473 4355 11530 18199 19940 170467 1354DTS++ 7626 9483 5532 2729 6465 9394 14926 9284 17774 31562 15065 52606 6284
Table 10: Annotation complexity of 13 dueling bandit algorithms along with the uniform exploration algorithm on13 datasets spanning 5 NLG tasks
MetricsWMT
(Micro Average)Grammarly
(Micro Average)CoNLL-2014Shared Task
E2E NLGChallenge
ParaBank TLDR OpenAI
Linear BTLBTLLog.
Linear BTLBTLLog.
Linear BTLBTLLog.
Linear BTLBTLLog.
Linear BTLBTLLog.
Linear BTLBTLLog.
Chrf 62.6 62.0 62.6 75.7 75.3 75.9 78.4 78.3 78.4 47.4 48.8 48.3 66.1 66.1 66.1 34.2 35.4 35.4Bleu-4 41.5 53.4 41.5 73.2 73.0 73.2 78.9 78.7 78.9 45.0 39.0 50.1 63.8 63.2 63.8 42.8 44.0 42.8Rouge-L 60.7 60.0 60.7 73.5 73.6 73.6 78.0 78.0 78.0 44.6 43.8 50.2 64.3 64.3 64.3 43.3 43.3 43.3Emb. Avg. 56.5 59.1 57.5 70.1 70.3 71.5 76.0 76.7 77.0 49.8 51.6 51.8 64.9 64.9 64.9 38.2 38.2 38.2Greedy Match 59.5 59.8 59.9 68.1 68.4 68.2 77.7 77.4 77.7 46.5 48.8 48.9 64.7 64.7 64.5 43.1 43.1 43.1Vector Extr 59.4 59.5 59.3 66.0 66.9 66.5 76.3 76.7 76.7 44.9 46.2 49.1 63.7 63.7 63.7 47.4 47.1 48.1Bertscore 65.9 66.2 65.9 77.4 77.2 77.4 82.0 81.5 82.0 45.9 49.3 50.1 68.1 68.1 68.1 44.5 44.4 44.5Laser 65.3 65.1 65.3 75.1 73.0 75.1 78.0 76.4 78.0 47.2 49.9 50.5 67.0 67.0 67.0 35.4 35.4 35.4MoverScore 66.1 66.5 66.1 74.7 70.9 73.0 80.6 79.6 80.3 50.1 49.3 50.4 68.0 68.0 67.8 40.7 40.7 40.7Bleurt 68.2 67.5 68.2 77.1 76.6 76.0 81.5 81.5 80.8 48.1 50.4 50.4 67.7 67.7 67.7 42.5 42.5 42.3Electra 65.7 74.0 81.6 54.3 81.7 -
Table 11: Sentence-level accuracy of direct assessment metrics with linear, BTL, and BTL-logistic probabilitymodels and our trained Electra metric in predicting the comparison outcome
0 2000 4000 6000 80000.0
0.2
0.4
0.6
0.8
1.0
WMT16-ron-eng
0 1500 3000 4500
0.0
0.2
0.4
0.6
0.8
1.0
WMT16-cze-eng
0 800 1600 2400
0.0
0.2
0.4
0.6
0.8
1.0
WMT16-deu-eng
0 2000 4000 6000 8000
0.0
0.2
0.4
0.6
0.8
1.0
WMT15-deu-eng
Dueling Bandit AlgorithmUniform RUCB RCS RMED
0 1500 3000 4500
0.0
0.2
0.4
0.6
0.8
1.0
WMT15-rus-eng
0 1000 2000 3000 4000
0.0
0.2
0.4
0.6
0.8
1.0
WMT15-fin-eng
0 1500 3000 4500 60000.0
0.2
0.4
0.6
0.8
1.0
Grammarly-FCE
0 2500 5000 7500 100000.0
0.2
0.4
0.6
0.8
1.0
Grammarly-Wiki
0 5000 10000 15000
0.0
0.2
0.4
0.6
0.8
1.0
CoNLL’14 Task
0 2000 4000 6000 8000
0.0
0.2
0.4
0.6
0.8
1.0
E2E NLG
0 10000 20000 30000 40000
0.0
0.2
0.4
0.6
0.8
1.0
ParaBank
0 1000 2000 3000 4000
0.0
0.2
0.4
0.6
0.8
1.0
TLDR OpenAI
Top-
rank
Pred
ictio
nA
ccur
acy
Number of Human Annotations
Figure 11: Top-rank prediction accuracy as a function of the number of human annotations for (model-free) Uniformexploration and RUCB, RCS, and RMED dueling bandit algorithms on 12 NLG datasets
8780
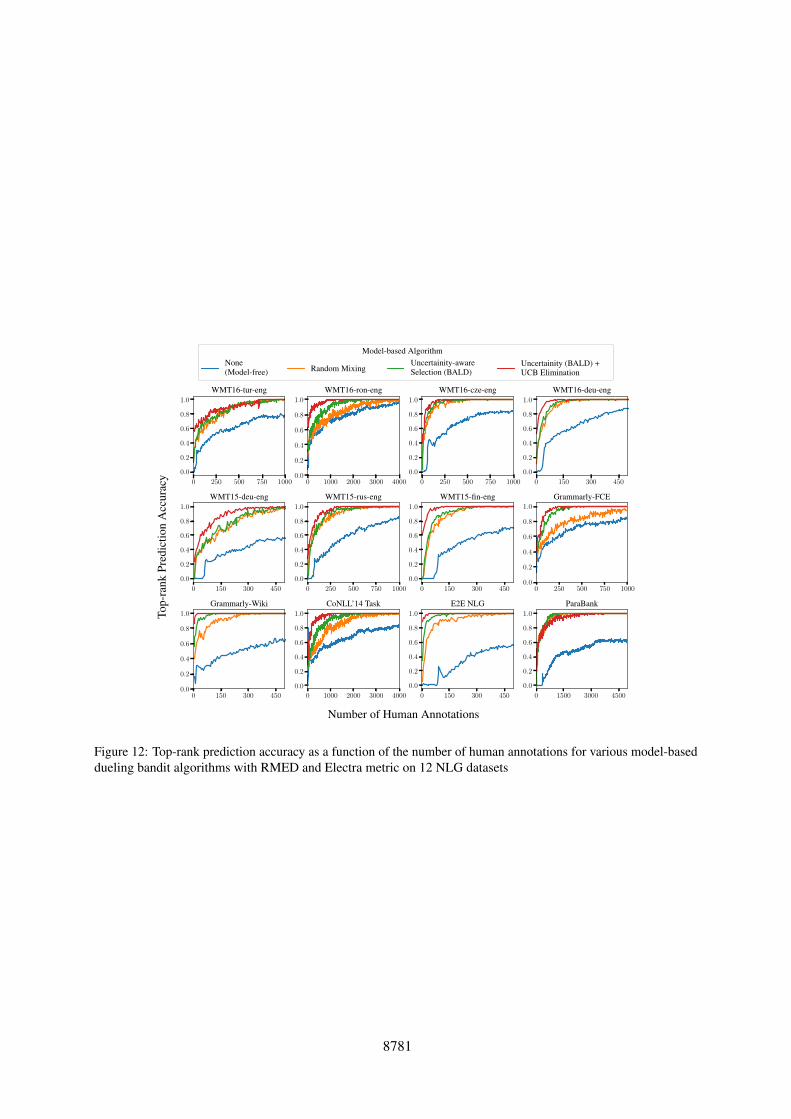
0 250 500 750 1000
0.0
0.2
0.4
0.6
0.8
1.0
WMT16-tur-eng
0 1000 2000 3000 40000.0
0.2
0.4
0.6
0.8
1.0
WMT16-ron-eng
0 250 500 750 1000
0.0
0.2
0.4
0.6
0.8
1.0
WMT16-cze-eng
0 150 300 450
0.0
0.2
0.4
0.6
0.8
1.0
WMT16-deu-eng
Model-based AlgorithmNone(Model-free) Random Mixing
Uncertainity-awareSelection (BALD)
Uncertainity (BALD) +UCB Elimination
0 150 300 450
0.0
0.2
0.4
0.6
0.8
1.0
WMT15-deu-eng
0 250 500 750 1000
0.0
0.2
0.4
0.6
0.8
1.0
WMT15-rus-eng
0 150 300 450
0.0
0.2
0.4
0.6
0.8
1.0
WMT15-fin-eng
0 250 500 750 10000.0
0.2
0.4
0.6
0.8
1.0
Grammarly-FCE
0 150 300 4500.0
0.2
0.4
0.6
0.8
1.0
Grammarly-Wiki
0 1000 2000 3000 4000
0.0
0.2
0.4
0.6
0.8
1.0
CoNLL’14 Task
0 150 300 450
0.0
0.2
0.4
0.6
0.8
1.0
E2E NLG
0 1500 3000 4500
0.0
0.2
0.4
0.6
0.8
1.0
ParaBank
Top-
rank
Pred
ictio
nA
ccur
acy
Number of Human Annotations
Figure 12: Top-rank prediction accuracy as a function of the number of human annotations for various model-baseddueling bandit algorithms with RMED and Electra metric on 12 NLG datasets
8781
Copyright © 2022 FDOKUMEN