Knowledge Enriched Learning by Converging Knowledge Object & Learning Object

For Peer Review O
nly
Hybrid Approach for Land Use /Land Cover Mapping using
High Resolution Imagery
Journal: International Journal of Geographical Information Science
Manuscript ID: IJGIS-2009-0269.R2
Manuscript Type: Special Issue Paper
Keywords:
Hybrid classification, Stability map, Land use and land cover < Keywords Relating to Theory, Remote sensing < Keywords Relating to Application, Object-oriented approach < Keywords Relating to Theory
http://mc.manuscriptcentral.com/tandf/ijgis
International Journal of Geographical Information Science
For Peer Review O
nly
Abstract Traditionally, remote sensing has employed pixel-based classification techniques to deal
with Land Use/Land Cover (LULC) studies. Pixel-based approaches have proven to
work generally well with low resolution imagery (e.g., LANDSAT, SPOT). Now, the
commercially available high resolution images (e.g., aerial Leica ADS40, Vexcel
UltraCam series and satellite IKONOS, Quickbird, GeoEye, World-View series) are
posing their limitations, driving the research towards object-based approaches.
The paper proposes a hybrid method with the aim of incorporating the advantages of
supervised pixel-based classification into object-based approaches. The method has been
developed for the LULC mapping at medium scale (1:10.000) using ADS40 imagery
with 1 m Ground Sampling Distance (GSD).
First, spatial information is incorporated into a pixel-based classification (AdaBoost
classifier) by means of additional texture features (Haralick, Gabor, Law features), which
can be selected “ad hoc” according to optimal training samples (“Relief-F” approach,
Mahalanobis distances). Then a rule-based approach sorts segmented regions into
CORINE Land Cover (CLC) thematic classes in terms of membership class percentages
(a modified Winner-Takes-All approach) and shape parameters. Lastly, ancillary data
(roads, rivers, etc.) are exploited to increase classification accuracy.
The experimental results show that the proposed hybrid approach allows extracting more
LULC classes than the conventional pixel-based methods, while improving considerably
classification accuracy. Another major contribution of this paper is the assessment of
classification reliability by the implementation of a stability map in addition to confusion
matrixes.
Keywords: Hybrid classification, Texture, LULC, CORINE Land Cover, ADS40, Stability map.
Introduction
Land cover is a fundamental environmental variable for understanding causes
and trends of human and natural processes, and, consequently, for supporting a proper
environment management and monitoring. Qualitative and quantitative information
on existing land use is essential for organizations that have to deal with land
management decisions, such as governmental agencies and research institutions.
There are many options for Land Use /Land Cover (LULC) mapping. Data
gathering methods ranging from field survey to conventional photointerpretation of
aerial photographs were used for mapping purpose. Technical advances in the last
three decades have completely changed the picture. High spatial resolution imagery
from satellite sensors (IKONOS, Quickbird, etc.) or digital aerial platforms (Leica
ADS40 and Vexcel UltraCam camera series, etc.) provide new opportunities for
detailed LULC mapping at very fine scales.
Deleted: Hybrid Approach for Land
Use /Land Cover Mapping using High
Resolution Imagery¶¶
Deleted: or
Deleted: to extract
Deleted: , while improving
considerably classification accuracy, in
comparison with
Deleted: and a must
Deleted: of our environment
Deleted: several
Deleted: such as governmental
agencies and research institutions
Deleted: monitoring and
Deleted:
Deleted: and
Page 1 of 48
http://mc.manuscriptcentral.com/tandf/ijgis
International Journal of Geographical Information Science
123456789101112131415161718192021222324252627282930313233343536373839404142434445464748495051525354555657585960

For Peer Review O
nly
Automated LULC mapping can now keep up with the development pace and
be an integral part of Geographical Information Systems (GIS). As LULC map
updating must be carried out on a regular basis, automatic classification algorithms
become more and more desirable to reduce the high costs of photo-interpretation.
However, these automatic approaches require sophisticated digital image processing
and computer vision techniques that raise several challenges, especially because their
performance strongly depends on many factors, such as remote sensing data quality,
landscape complexity, training data collection , classification method, etc. (Lu and
Weng 2007, Gao and Mas 2008).
Automatic and semi-automatic classification starting from multi-spectral data
can be divided into two major approaches: pixel-based and object/region-based
(Shackelford and Davis 2003; Sims and Mesev 2007).
Pixel-based classification approaches try to identify the class of each pixel
from its multispectral values and/or texture measures computed over a
neighbourhood. Object-based approaches operate on sets of pixels (objects/regions)
that have been grouped together by an image segmentation technique. Shape
characteristics and neighbourhood relationships can then be added to spectral/textural
information to perform the classification. Both approaches have drawbacks: the
object-based approach is heavily influenced by the quality of segmentation results
while the pixel-based approach, which can exploit only spectral features, might result
in errors when the same land cover type does not have unique spectral characteristics
and the same spectral response is characterizing many different natural objects.
Comparisons between the two approaches (Matinfar et al. 2007) show that
object-based classification generally performs better, in addition to have the
advantage of being more readily integrable in vector GIS.
Deleted: training data collection
Deleted: remote sensing data quality
Deleted: ,
Deleted: ,
Deleted: ,
Deleted: ,
Deleted: channel
Deleted: objects/regions
Deleted: based on homogeneity
Deleted: ¶Comparisons between the two approaches
(Matinfar et al, 2007) show that object-
based classification generally performs
better due to more useful features (like
shape factors and topology) and its
advantage of being more readily
integrable in vector GIS. However, b
Page 2 of 48
http://mc.manuscriptcentral.com/tandf/ijgis
International Journal of Geographical Information Science
123456789101112131415161718192021222324252627282930313233343536373839404142434445464748495051525354555657585960

For Peer Review O
nly
During recent years, many techniques (e.g., fuzzy and neural c1assifiers,
stepwise optimization approaches), some of which embedded in commercial software,
allowed to greatly improve the accuracy of automatic classification, but the
integration of object- and pixel-based classification seems the right way to follow
(Shackelford and Davis 2003, Wang et al. 2004, Yuan and Bauer 2006). An
integration of segmentation techniques and pixel-based classification with the aim of
assigning a class to each segment (hybrid approach) may be more efficacious than
traditional approaches when classes are not homogeneous in terms of spectral and
textural characteristics.
This paper presents a new hybrid approach that takes advantage of
spectral/textural values, form factors and of a rule-based system (Zingaretti et al.
2009). First, different image datasets are provided to an AdaBoost supervised
classifier to yield pixel-based classification results. These results are then integrated
with the segmented map obtained from an object-based classification. This last
process is performed using the Winner Takes All (WTA) algorithm, as derived from
other research fields (Ascani et al. 2008). Finally, heterogeneous classes are integrated
in a decision rule system, taking into account both percentages of classified pixels
(resulting from the pixel-based classification) and additional information, such as
context, shape and proximity to a certain land cover type.
The proposed automatic approach provides quick, GIS-ready, LULC maps
from high spatial resolution imagery with higher accuracy than conventional pixel-
and object-based methods.
Another major contribution of this paper is the accuracy assessment by means
of a stability map that, in addition to the well known confusion matrices, helps the
Deleted: ,
Deleted: ;
Deleted: ,
Deleted: ;
Deleted: ,
Deleted: 
Deleted: (Shackelford et al, 2003;
Wang et al, 2004, Yuan et al, 2006)
Deleted: ,
Deleted: used
Deleted: in
Deleted: such as mobile robot
localization by particle filters
Deleted: ,
Page 3 of 48
http://mc.manuscriptcentral.com/tandf/ijgis
International Journal of Geographical Information Science
123456789101112131415161718192021222324252627282930313233343536373839404142434445464748495051525354555657585960

For Peer Review O
nly
users to recognize regions where the classification result should be verified before
being used (Stehman et al. 2003, Wickham et al. 2004, Woodcock and Gopal 2000).
The paper is organized as follows: Section 2 introduces the case study area
and the available data set. Section 3 describes each procedure of the supervised hybrid
classification methodology developed for this research: feature set identification and
selection, pixel-based classification, image segmentation and object rule-based
processing. Advantages and limitations of this hybrid approach are presented in
Section 4, which also includes the analysis of the classification results in comparison
with the pixel-based ones. Lastly, conclusions are drawn in Section 5.
2. Study site and datasets
The case study refers to an area of approximately 16 km2 located near the city
of Ancona (Italy) comprising both urban and rural environments and with a
topography that includes flat areas but also the Natural Park of the Conero mountain.
Figure 1 gives an overview of the study image and its geographic location.
The dataset is composed of high resolution multi-spectral Leica ADS40
images integrated with ancillary information. The ADS40 imagery is mono-temporal
(July, 2007) and with only 4 spectral bands (Red, Green, Blue and NIR).
For this research the CORINE Land Cover (CLC) standard classification
system, which was derived from a European Project (EEA 1994) led by the European
Environmental Agency (EEA), is used. In particular this work follows the CLC
nomenclature to its second and third level (EEA 2007) and adopts a Minimum
Mapping Unit (MMU) of 5mm×5mm, corresponding to 0.25 ha, which better fits the
image resolution of a map scale 1:10.000 (Knight and Lunetta, 2003).
Deleted: J.D.,
Deleted: Stehman S.V., J.H. Smith and
L. Yang,
Deleted: ;
Deleted: C.E.,
Deleted: S.,
Deleted: e
Deleted: 1985
Page 4 of 48
http://mc.manuscriptcentral.com/tandf/ijgis
International Journal of Geographical Information Science
123456789101112131415161718192021222324252627282930313233343536373839404142434445464748495051525354555657585960

For Peer Review O
nly
Figure 1. ADS40 strips of the Marche region block (centre) and test imagery (right).
In green the strip from which the test image is extracted.
3. Methodology
The proposed hybrid classification schema is presented in Figure 2.
Figure 2. Workflow diagram describing the hybrid classification schema
Due to its high image spatial resolution, the ADS40 imagery lacks of spectral
information and shows a high degree of spectral variation. This might lead to
problems in the class information extraction, especially using pixel-based image
classification methods, in which spatial information existing between a pixel and its
neighbours is not used. Trying to overcome these drawbacks and achieve reliable and
accurate results, spectral and texture information are first combined together in the
classification schema we developed.
Many parameters influence the generation of texture features, starting from the choice
of ADS40 bands to process. In particular, 33 different texture features are generated
according to three different texture approaches: Grey Level Co-occurrence Matrix,
Gabor-energy and Law’s texture features. The best suited feature set is then chosen by
means of the Mahalanobis separability criteria and the Relief-F feature selection
algorithm: the 33 texture features are thus reduced to 8.
The selected feature set (8 texture features+ 4 ADS40 spectral bands + NDVI feature
= 13 features) is used to run a pixel-based supervised classification by means of an
AdaBoost classifier. These pixels, partitioned into broad categories, represent the
Deleted: center
Deleted: s
Deleted: and then augmented by the
four ADS40 spectral bands and the NDVI
feature
Deleted: RGBNiR+ NDVI
Page 5 of 48
http://mc.manuscriptcentral.com/tandf/ijgis
International Journal of Geographical Information Science
123456789101112131415161718192021222324252627282930313233343536373839404142434445464748495051525354555657585960

For Peer Review O
nly
input to the following object rule-based post classification processing. In particular, a
fuzzy object classifier, implemented on the basis of a Winner-Takes-All (WTA)
approach, is employed to exploit the pixel-based results in classifying the objects
coming from a previous image segmentation, thus providing a refined object
classification.
In this hybrid context, image segmentation represents the first step of the object based
image analysis and directly affects the quality of results. The double arrow in Figure 2
points out the possibility of using, in an iterative approach, the obtained object-
oriented classification and its non meaningful classified polygons to refine the image
segmentation step.
3.1 Texture Generation
To avoid increasing the feature space dimensionality and redundancy, and due to the
strong correlation between the ADS40 RGB and NIR spectral bands, significant
texture features are generated by selecting only Red and NIR bands, which show the
lowest correlation and the highest variance for the different land cover classes.
The following three feature generation methods were preferred for texture description.
• Grey level co-occurrence matrix statistical texture features. The second order
image histogram, referred to as the Grey Level Co-occurrence Matrix
(GLCM) of an image, offers much information about inter-pixel relationships
and spatial grey level dependencies. The assumption that no land cover
exhibits a preferential directionality is adopted and the grey scale quantization
level is set to 64 to have a better computational and statistical performance and
to reduce processing time. To avoid texture features highly correlated with
each other not all texture descriptors derivable from GLCM (Haralick et al.
Formatted: Bulleted + Level: 1 +Aligned at: 18 pt + Tab after: 0 pt+ Indent at: 36 pt
Deleted: to
Deleted: e
Deleted: exture features could be
calculated for each band of ADS40 data
but with the disadvantage of
Deleted: . Furthermore there is a
Deleted: i
Deleted: . To generate
Deleted: i
Deleted: are selected because they
Deleted: and lowest correlation
Deleted: are more
Deleted: Hence these features are
extracted.
Deleted: based
Deleted: :
Deleted: greater
Deleted: the
Deleted: ,
Deleted: periodicity
Deleted: This matrix is a source of 14
meaningful texture descriptors (Haralick
et al., 1973) but a combination of only
four measures (Entropy, Mean, Variance
and Homogeneity) is adopted to avoid the
texture features that are highly correlated
with each other. For reducing the degrees
of freedom of the GLCM texture
generation, the distance between pixels
for the co-occurrence matrix
computations is maintained constant at
one and the average of the four main
inter-pixel angles (0°, 45°, 90° and 135°)
is used, based on t
Deleted: . T
Deleted:
Deleted: a
Page 6 of 48
http://mc.manuscriptcentral.com/tandf/ijgis
International Journal of Geographical Information Science
123456789101112131415161718192021222324252627282930313233343536373839404142434445464748495051525354555657585960

For Peer Review O
nly
1973) are used, but only four of them are computed for the Red and NIR bands
and for five window sizes (ranging from 3x3 to 7x7), leading up to the
generation of 4 x 5= 20 GLCM texture features.
• Laws` spectral texture features. Law`s 1D kernels are popular analysis tools
for classifying the different texture patterns based on regularity homogeneity.
Twenty-five 2D masks are generated by convolving five 1D kernels (L5, E5,
S5, W5 and R5) with each other (Laws 1980). Each of these 1D kernels
performs local averaging and edge, spot and wave detection on the sub-image.
Only two of the 25 generated NIR-texture energy measures are chosen by
visual examination, looking for a better discrimination between permanent
crops and background.
• Gabor Wavelet`s spectral texture features. The Gabor Transform reveals the
frequency distribution of a signal or an image using a bank of filters. The
magnitude response is extracted to capture the texture homogeneity (Idrissa
and Acheroy 2002). Its frequency response is Gaussian in shape and the
central frequency of each filter was selected to correspond to a peak in the
texture power spectrum. The parameters involved are: the radial frequency (f),
the standard deviation (σ) of the Gaussian curve and the orientation (θ). For
the purpose of simplicity, the Gaussian curve is assumed symmetrical. The
filter bank is created with different orientations (0º, 45º, 90º and 135º),
standard deviation σ =1 and different frequencies (f=0.2, f=0.5, f=1). Once the
filters are applied, 11 such Gabor magnitudes are extracted.
Formatted: Font: (Default) Times
New Roman, 12 pt, Complex ScriptFont: Times New Roman, 12 pt
Deleted: ¶The four selected GLCM measures
(MEAN, VAR, ENT and HOM)
Deleted: i
Deleted: espectively
Deleted: , 5x5 and
Deleted: for the Red band and 3x3 and
5x5 for the NiR band
Deleted: :
Deleted: A number of
Deleted: ,
Deleted: ,
Deleted: detection and
Deleted: detection
Deleted: These 25 2D masks are
convolved with the image and the
horizontal energy function of the filtered
image is used as a texture feature after
normalization. In particular
Deleted: o
Deleted: 2
Deleted: (R5L5T, R5E5T)
Deleted: i
Deleted: based
Deleted: :
Deleted: coefficients
Deleted: localized
Deleted: Its frequency response is
Gaussian in shape and the central
frequency of each filter was selected to
correspond to a peak in the texture power
spectrum.
Deleted: images are filtered using the
Gabor filter bank and
Page 7 of 48
http://mc.manuscriptcentral.com/tandf/ijgis
International Journal of Geographical Information Science
123456789101112131415161718192021222324252627282930313233343536373839404142434445464748495051525354555657585960

For Peer Review O
nly
In short, 33 texture features are generated and selected along with the original four
spectral bands (Red, Green, Blue and NIR) and the NDVI band to build the feature set
(to the amount of 38 bands) summarized in Table 1.
Table 1. Available feature set (ADS40 spectral bands and texture features)
Texture features, differing only by some parameters, are expected to be highly
correlated. Using all 38 available features as input and always taking into account
their correlation, the Relief-F approach and Mahalanobis measures are carried out for
feature selection.
In order to guarantee that each source (spectrum, texture and NDVI) makes the same
contribution to the feature space and to avoid scale effects, each source of data is
scaled to the same range of grey levels (floating point values from 0 to 1) before
running the classification schema. This range is chosen in order to minimize the
information loss (especially for the 16-bit spectral data).
3.2 Feature Selection
The feature selection is necessary to reduce the feature space dimension and
correlation of the generated feature set (a total of 37 plus NDVI). Many approaches
are available (Liu and Motoda 2008), mostly aiming to evaluate class separability by
means of cost function or metrics (i.e., Jeffrey-Matusita and Mahalanobis distances).
To make a more reliable supervised feature selection, Mahalanobis separability
distances, computed for each training class combination, are integrated with other
weights coming from the data-mining branch. In particular the Relief-F algorithm, a
modified scheme of the classical Relief (Liu and Motoda 2008), is carried out.
Deleted: Finally
Deleted: 5
Deleted: i
Deleted: available
Deleted: 7
Deleted: 7
Deleted: a
Deleted: ,
Page 8 of 48
http://mc.manuscriptcentral.com/tandf/ijgis
International Journal of Geographical Information Science
123456789101112131415161718192021222324252627282930313233343536373839404142434445464748495051525354555657585960

For Peer Review O
nly
The following parameters are necessary to set-up the algorithm: the number n of
nearest instances from each class, the maximum distance teq between two feature
values to still consider them equal, the minimum distance tdiff between feature values
to still consider them different and the sampling parameter m (less than the number M
of training instances).
In all the tests n is varied from n=1 to n=10 with m=M while teq and tdiff are calculated
according to the following equations:
( ) ( )( )( ) ( )( )
max min 0.05
max min 0.10
eq i i
diff i i
t F F
t F F
α α
β β
= − =
= − =
where Fi is the i-th feature. The values of α and β are set by different simulation
runs, according to the literature.
One of the main drawbacks of Relief-F is the computational complexity estimated in
O(mMN). To solve the feature selection problem and reduce the computation time
(number of training instances over 170,000), the algorithm is executed exploiting a
computer cluster architecture available at our university.
A 2-D matrix DIS of size k l⋅ with ( )( )1 / 2k N N= − and l N= is generated where N
is the feature space dimension. A generic ij
DIS element is calculated as the distance
between the ith combination (e.g. first combination is represented by classes 1-2, last
one by classes N-1, N) over jth features.
A minmax principle is adopted to maximize distances and/or Relief-F weights and
minimize bands correlation. This principle is implemented by a normalized ranking
vector giving more priority to the distance maximization.
A subset of 13 bands was selected for the classification stage.
Deleted: , three parameters are
necessary
Deleted: <
Deleted: M that is
Deleted: 1, ,i N= K and
Deleted: through
Deleted: complex
Deleted: (ClusterUNIVPM)
Deleted: The weights obtained by the
Relief-F algorithm are shown in Figure 3,
where the features are labelled according
to Table 1.
Figure 3. Results coming from the Relief-
F algorithm applied to the generated
feature set (37 features). The parameter n
in the legend represents the number of
nearest instances from each CLC class.
Deleted: s summarized in Figure 4, a
Deleted: is
Deleted: Figure 4. Feature selection
process
Page 9 of 48
http://mc.manuscriptcentral.com/tandf/ijgis
International Journal of Geographical Information Science
123456789101112131415161718192021222324252627282930313233343536373839404142434445464748495051525354555657585960

For Peer Review O
nly
3.3 Pixel-based Classification: AdaBoost classifier
After having selected the feature set to process, a supervised classification is
performed by means of the Adaptive Boosting classifier (often known as AdaBoost)
whose key idea is to iteratively focus on difficult patterns increasing the weights of
misclassified training patterns. The first problem formulation (Schapire and Singer
1999) is extended in this work using the Real AdaBoost boosting variant to create
strong hypothesis from weak classifiers’ combinations and the One Against All
(OAA) technique to obtain a multi-class classification.
OAA works as follows: given C discrete classes (e.g., the CLC codes), the multi-class
problem is decomposed into C binary problems to be solved with the Real AdaBoost.
A class c is assigned to a given pattern x if it has the greatest positive value while in
case of all negative weights the sample is considered unclassified. However is
possible to avoid this behaviour choosing the minimum of all negative values.
In order to eliminate ‘salt and pepper’ noise due to the intrinsic spectral variability
characterizing the images, the pixel-based classified output is post-processed by
means of “smoothing” techniques to improve the spatial coherency of pixel-based
classifications taking into account the spatial context . In particular techniques of
majority analysis, sieving and clumping are carried out before going on with the rule
based object processing.
In this paper a Classification And Regression Tree (CART) was adopted as weak
learner (Breiman et al. 1984); the number T of iterations was set at 35 according to a
series of simulation runs that evidenced overfitting with T>35.
Deleted: et
Deleted: ,
Deleted: ,
Page 10 of 48
http://mc.manuscriptcentral.com/tandf/ijgis
International Journal of Geographical Information Science
123456789101112131415161718192021222324252627282930313233343536373839404142434445464748495051525354555657585960

For Peer Review O
nly
3.4 Ancillary Data Integration
In order to improve classification results from image analysis, it is of high importance
to be able to integrate ancillary geographical knowledge in the overall classification
system. In this work builds, roads and rivers can be extracted from the Regional
Technical Map (CTR) and added to the pixel-based classification by means of raster
operation implemented in a stand-alone code (C++ working environment). It is
instrumental in the pixel-based classification refinement and especially in preparation
for the following object rule based processing.
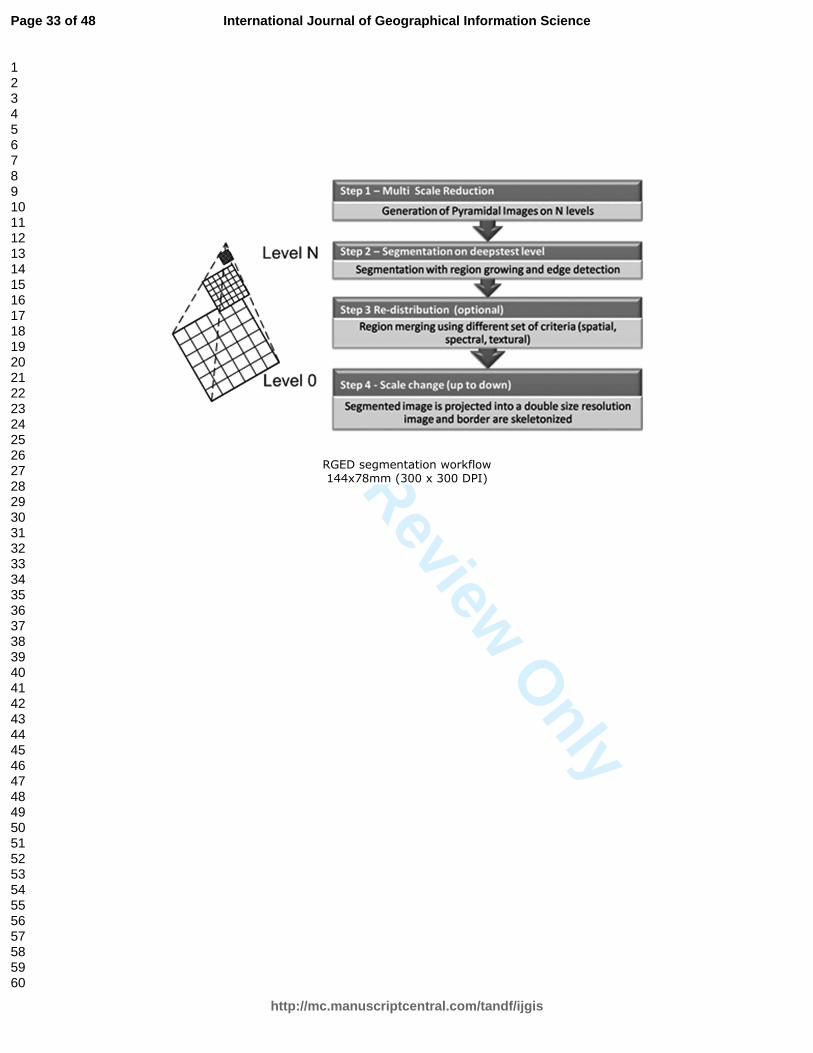
3.5 Image Segmentation: RGED (Region-Growing and Edge-Detection) with
merging rules
An accurate and precise segmentation is the prerequisite to extract a set of meaningful
objects, such as regions with closed contours (polygons), useful for thematic mapping.
The developed segmentation algorithm (Figure 3), derived from Yu and Wang (1999),
uses the ADS40 imagery as input and is based on an image pyramid combining edge-
detection (Difference In Strength, Sobel, Scharr etc) with region-growing techniques,
in order to obtain a segmentation that outlines the real objects localized into the image
with small computation time and strong accuracy.
Furthermore the use of edges during the region growing step allows the correct
recognition of strong region boundaries and assures robustness with respect to the
noise inside the regions (e.g., spikes, small trees, canopies). Another great advantage
of this algorithm is that the growing process stops when regions reach strong
boundaries.
After this segmentation phase, the extraction of too many and not realistic small
regions can lead to an over-segmentation situation. To overcome this problem a re-
distribution process is then carried out on the basis of specific spectral and spatial
Deleted: 5
Deleted: i-Wei
Deleted: Jung-Hua
Page 11 of 48
http://mc.manuscriptcentral.com/tandf/ijgis
International Journal of Geographical Information Science
123456789101112131415161718192021222324252627282930313233343536373839404142434445464748495051525354555657585960

For Peer Review O
nly
parameter (i.e., compactness, convexity, etc.) in order to increase the connectivity
degree between adjacent regions. Starting from regions with an area less than the
MMU, neighbouring regions with same characteristics are grouped together into new
regions.
Figure 3. RGED segmentation workflow
It is important to realize the proper set of working parameters in order to make the
algorithm as efficient as possible (Tabb and Ahuja 1997). In particular the developed
segmentation algorithm takes into account compactness, convexity, solidity and
roundness parameters after having investigated them carrying out several tests with
different images and pyramid levels.
Finally, selecting a proper set of these parameters and the useful input image (single
band, ratio or Principal Component image) a vector file is produced containing all the
information characterizing the regions (Zingaretti et al. 1998). A sample of the
attribute values resulting from the segmentation process is shown in Figure 4. In this
step land cover class assignment is still unaccomplished.
Figure 4. Extract of segmentation attributes needful for the merging step
3.6 Object Rule-based processing: a modified Winner Take All approach
An object rule-based processing is performed to improve the pixel-based
classification result in terms of spatial consistency, semantic representation and
number of extracted classes. In particular the pixel based classification is combined
Deleted: Minimum Mapping Unit (
Deleted: )
Deleted: 5
Deleted: M.;
Deleted: N.,
Deleted: The
Deleted: vector
Deleted: of
Deleted: Figure 6, with the associated
attribute Table in
Deleted: 7
Deleted: ¶Figure 6. Polygons extracted by the
RGED segmentation 
Deleted: 7
Page 12 of 48
http://mc.manuscriptcentral.com/tandf/ijgis
International Journal of Geographical Information Science
123456789101112131415161718192021222324252627282930313233343536373839404142434445464748495051525354555657585960

For Peer Review O
nly
with the segmentation result through the overlay technique and Winner Takes All
(WTA) approach in order to turn it into meaningful and realistic GIS-ready objects.
The WTA algorithm classifies image segments adopting a voting scheme which
assigns the segment to its winner class, counting the pixels classified for each class in
a generic region. At the end of the process for each region the winner wi and the
second si are assigned respectively to the first two classes collecting the majority of
votes. From the ratio of these values comes out the stability/Confusion Index(CI):
i
i
iw
sCI =
A low CI value confirms the absolute presence of a dominant class while a high CI
value underlines mixed polygons as unstable.
Afterwards this core WTA procedure is improved with other rules in order to enhance
the performance of the object classifier and correctly underline critical regions as
heterogeneous areas and discontinuous/continuous urban areas.
3.6.1 Hybrid rules based to define the CORINE third level
The necessity to obtain a classification according to the CLC nomenclature at the 3rd
level requires a rule system’s aid. This nomenclature is in fact strongly related to the
image interpretation process and, to assign detailed legend levels to complex patterns,
other kind of rules going over simple spectral signature identification are needed.
When the spectral response is not homogeneous spatial information (i.e., geometrical
segment attributes coming from the segmentation algorithm including size, shape etc)
and WTA land cover presence percentage over the segment’s area are used to build a
new learning system. These obtained context relations allow to know when a cover
class is a “part of” a different cover class, giving the possibility to obtain a multi-scale
database, strongly related to the segments’ quality (MMU setting).
Field Code Changed
Deleted: ) :
Page 13 of 48
http://mc.manuscriptcentral.com/tandf/ijgis
International Journal of Geographical Information Science
123456789101112131415161718192021222324252627282930313233343536373839404142434445464748495051525354555657585960

For Peer Review O
nly
In particular the developed approach fits to recognize heterogeneous agricultural areas
belonging to class 2.4.2 (Complex cultivation patterns) and to differentiate the urban
fabric class according to its density (Continuous Urban fabric -1.1.1 and
Discontinuous Urban fabric-1.1.2).
The decision rules employed are represented below in their logical expressions:
IF(conditions) THEN (decision class), where the conditions consist of some attribute
hypothesis and the decision class is the class to which the segment is assigned to.
• Rule 1: IF Winner is Class 1.1 and PERC-AREA > 80% THEN Class = 1.1.1
Continuous Urban Fabric
• Rule 2: IF Winner is Class 1.1 and PERC-AREA > 40% and < 80% THEN
Class = 1.1.2 Discontinuous Urban Fabric
• Rule 3: IF Winner is Class 1.1 and Second not Class 2.2. and PERC-AREA <
40% THEN Class = 1.1.2 Discontinuous Urban Fabric
• Rule 4: IF Winner is Class 1.1 and Second is Class 2.2 and PERC-AREA
Class 1.1 < 40% THEN Class = 2.4.2 Complex cultivation patterns
• Rule 5: IF Winner is Class 2.2. and Second is Class 1.1 and PERC-AREA
Class 1.1 > 20% THEN Class = 2.4.2 Complex cultivation patterns
The buildings’ density is the main criteria to label the segment as belonging to the
built-up or to the agricultural areas. A cultivated segment (permanent crops) with a
built-up presence inside of at least 40 percent is labelled as complex cultivation
pattern (class 2.4.2).
In dense urban areas, the land cover class confusion is low. The continuous urban
fabric class (class 1.1.1) is assigned when urban structures and roads occupy more
than 80 percent of the surface area. Misunderstandings can arise only in the case of
Page 14 of 48
http://mc.manuscriptcentral.com/tandf/ijgis
International Journal of Geographical Information Science
123456789101112131415161718192021222324252627282930313233343536373839404142434445464748495051525354555657585960

For Peer Review O
nly
bare soil with similar spectral responses, but they can be limited by checking the
segments’ dimensions: the segmentation procedure over urban fabrics gives mostly
small regions.
The discrimination between continuous and discontinuous urban fabric is performed
computing houses and roads area percentages and setting a threshold (between 40
percent and 80 percent) to underline a green areas presence. As the density of urban
objects decreases, the confusion arises between urban and other land cover classes
(especially crop fields) having the spectral signature similar to the urban fabric: there
is in fact no vegetation cover on the fields.
Lastly, the appearance of a heterogeneous urban land cover class is closely related to
the image spatial resolution. Using high resolution images it is necessary a more
complex rule system than the fuzzy membership function that could be sufficient, in
case of coarse resolutions.
4. Tests and Results
The classification results are displayed in Figures 5, 6, 7 and 8.
After having augmented the multispectral ADS40 bands with the selected texture
features the pixel-based classification accuracy is improved and it is reasonably good
(Figure 5), even if insufficient in terms of homogeneity. A first improvement, by
means of the WTA object classification, is shown in Figure 6 where the ‘salt and
pepper’ noise is overcome and a GIS-ready quality is reached but to the detriment of
the number of CLC classes extracted: class 1.2.1 (Industrial and/or Commercial units)
disappears because it never wins. Further improvements are shown in Figure 7 where
the rule-based WTA approach allows extracting complex cultivation patterns (class
2.4.2) and distinguishing between continuous and discontinuous urban fabric
(respectively, class 1.1.1 and class 1.1.2).
Deleted: 8
Deleted: 9
Deleted: 10
Deleted: 11
Deleted: 8
Deleted: 9
Deleted: 10
Deleted: to extract complex cultivation
patterns (class 2.4.2) and distinguish
Page 15 of 48
http://mc.manuscriptcentral.com/tandf/ijgis
International Journal of Geographical Information Science
123456789101112131415161718192021222324252627282930313233343536373839404142434445464748495051525354555657585960

For Peer Review O
nly
Figure 5. AdaBoost pixel-based classification result and its CLC legend
Figure 6. WTA object classification result and its CLC legend
Figure7. Rule-based WTA classification result and its CLC legend
In order to carry out an unbiased assessment of the accuracy of different approaches,
confusion matrices are extracted and the maps derived from classification are
compared with a set of control data.
Hereafter in Tables 2 and 3, the developed hybrid classification approach is assessed
in comparison with the classic pixel-based approach.
The final rule-based WTA classification reaches good results in terms of overall
accuracy (89.02%) and single Producer/User accuracy (10 CLC classes with Producer
accuracy higher than 80%) giving a legend more detailed than the other
classifications.
Table 2. AdaBoost pixel-based accuracy assessment
Table 3. Object classification accuracy assessment: WTA (a) and Rule-based WTA(b)
Table 2 confirms the utility to add texture images in the classification per-pixel
approach. By incorporating texture features it is possible to achieve a higher
classification accuracy compared to the classification of the only original ADS40
Deleted: 8
Deleted: 9
Deleted:
Deleted: 10
Page 16 of 48
http://mc.manuscriptcentral.com/tandf/ijgis
International Journal of Geographical Information Science
123456789101112131415161718192021222324252627282930313233343536373839404142434445464748495051525354555657585960

For Peer Review O
nly
bands: the overall accuracy increases (from 74.31% to 86.33%) and the Producer’s
accuracies for the different classes increase as well.
Lastly, ancillary data integration allows a further refinement of the land use map
nomenclature adding Water courses (class 5.1.1) and Road and rail networks (class
1.2.2). Comparing a visual inspection of the final CLC map (Figure 8) confirms that
the results of this automatic developed classification schema are reasonably good.
Figure 8. Ancillary data integration and Final CLC land use map
4.1 Stability assessment
The accuracy assessment shown above simply assures that, for example, the pixel-
based classification can be considered correct at 86%, but it is not possible to know
where correct and erroneously classified regions are really located in the whole
dataset. In this context, the proposed hybrid classification schema provides a stability
map, coming from the confusion index (CI), to distinguish stable segments from
instable ones whose classification result should be verified before being used.
The stability map becomes in this way a valid instrument that drives the user in the
LULC map consultation, showing which polygons are critical areas in terms of
heterogeneity and providing the segments candidate to improve the CLC levels.
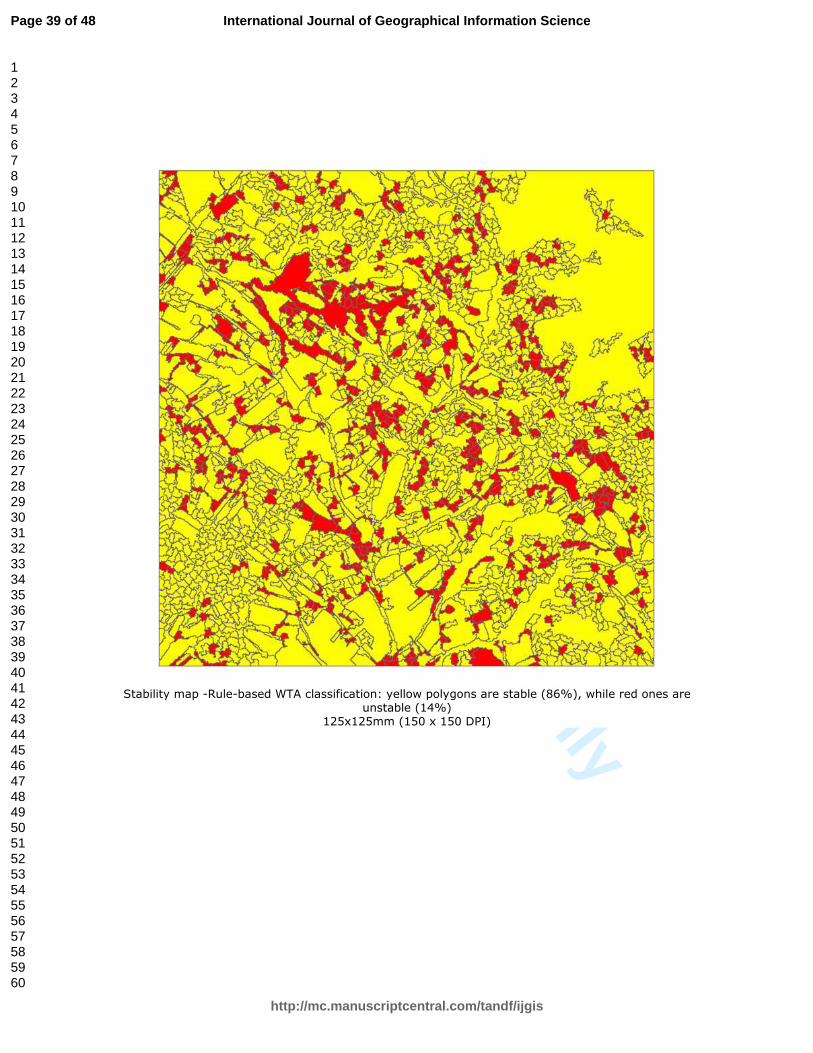
The following thematic stability map (Figure 9) is obtained putting a threshold to the
CI value equal to 0.65 and a minor percentage of 40% for the dominant class. Red
polygons are unstable (CI>0.65) while the yellow ones are stable with a rate of the
86% of the total study area.
Deleted: 11
Deleted: 11
Deleted: 12
Page 17 of 48
http://mc.manuscriptcentral.com/tandf/ijgis
International Journal of Geographical Information Science
123456789101112131415161718192021222324252627282930313233343536373839404142434445464748495051525354555657585960

For Peer Review O
nly
Figure 9. Stability map -Rule-based WTA classification: yellow polygons are stable
(86%), while red ones are unstable (14%)
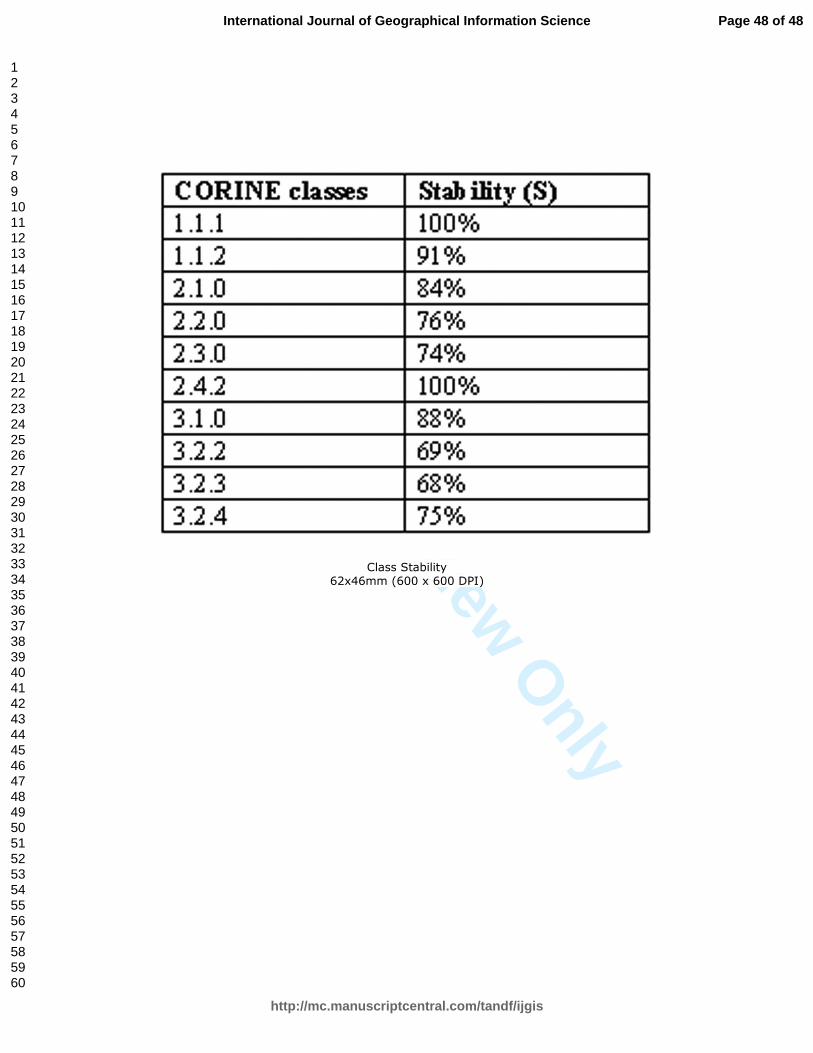
The stability mean value of each class is a good way to show the classification
accuracy trend and underline which classes require more attention (Fig. 10).
Figure 10. Stability mean value for each CLC class
Table 4. Class Stability
The stability of 100% for the class 2.4.2 seems to be in contrast with the other
consideration, but it comes from the comparison with the third winner inside each
segment (because of the legend refinement) that is very mixed and composed by
classes giving low percentage contribution.
While the confusion index CI quantifies local characteristics, a Global Stability Index
(GSI) can be computed for every region (Ri) to have a global overview:
( )( )∑
=
=
N
i i
i
RArea
RStGSI
1
( ) ( )
>
≤=
THCIif
THCIifRAreaRSt
i
i0
GSI is optimum when tends to be one for low TH values. A parametric analysis of the
GSI trend for every class is shown in Figure 11.
Field Code Changed
Field Code Changed
Deleted:
Deleted: 12
Deleted: 3
Deleted: 13
Deleted: 4
Page 18 of 48
http://mc.manuscriptcentral.com/tandf/ijgis
International Journal of Geographical Information Science
123456789101112131415161718192021222324252627282930313233343536373839404142434445464748495051525354555657585960

For Peer Review O
nly
Figure 11. Trend of Global Stability Index for each CLC class
A further analysis derives from the intersection between the stability map and the
control data set (Figure 12).
Figure 12. Crossing between the stability map and the control data set (red ground
data don’t give good results in the WTA rule based accuracy-assessment)
About 90% of the control data is shown to be stable, and this corresponds to the
overall accuracy of the confusion matrix obtained crossing the WTA rule based map
and the control data set. The unstable regions in great part belong to the
heterogeneous class, which has in general a low value of accuracy (max 54%, in
Table 3). It is clear that more rules and other information are necessary to avoid
misclassification.
5. Conclusions
In this paper, a new method for high spatial resolution image classification is
proposed. It integrates a pixel-based classification method (Adaboost classifier) with
an object-based classification one, based on a WTA system augmented with rules.
The classification output shows a LCLU map with 12 cover classes (CLC second and
third level). The accuracy is improved through different stages.
First, the per-pixel classification accuracy increases from 74.31% to 86.33%
involving textural analysis in the classification schema. Then in the object WTA
classification the “salt and pepper“ noise is removed and the accuracy has a further
Deleted: 14
Deleted: 5
Deleted: 15
Page 19 of 48
http://mc.manuscriptcentral.com/tandf/ijgis
International Journal of Geographical Information Science
123456789101112131415161718192021222324252627282930313233343536373839404142434445464748495051525354555657585960

For Peer Review O
nly
improvement to 89.41%. A refinement is proposed by means of a rule-based WTA
approach that allows extracting new third level CLC classes and achieving an
accuracy of 89.02%, by crossing with a different object-based control set of data.
Figure 13 shows the control data set used for the pixel-based accuracy assessment and
the bigger and more exhaustive object-based one derived by photointerpretation of the
segmented image.
Figure 13. Pixel-based (a) and object-based (b) ground control data
A last result is the stability map proposed as useful tool that helps the user to
recognize stable regions from the instable ones which should be verified before being
used. In this way he/she can decide to charge a photo-interpreter to only verify the
classification for these instable segments. Otherwise, only according to accuracy
assessment, the user cannot totally trust the LULC map because is not able to know
where erroneously classified regions are located!
The proposed method gives comfortable results that can be used for different
applications and different potential users (i.e., urban planner, environmental agencies
and so on) could take advantage of it. Moreover the final product is a GIS-ready map
that can easily enhance other thematic databases.
Future research work may focus on the DTM that can be extracted out of the ADS40
data and used as additional information improving the classification result.
Formatted: English U.K.
Deleted: to extract new third level CLC
classes and achieve
Deleted: 6
Deleted: 16
Page 20 of 48
http://mc.manuscriptcentral.com/tandf/ijgis
International Journal of Geographical Information Science
123456789101112131415161718192021222324252627282930313233343536373839404142434445464748495051525354555657585960

For Peer Review O
nly
References
Ascani, A., Frontoni, E., Mancini, A., Zingaretti, P., 2008. Feature group matching for
appearance-based localization. In: International Conference on Intelligent
Robots and Systems (IROS 2008), 3933–3938.
Breiman, L., Friedman, J.H., Olshen, R.A., Stone, C.J., 1984. Classification and
Regression Trees. Pacific Grove, CA: Wadsworth.
European Environment Agency (EEA), 1994. CORINE Land cover - Part 1:
Methodology. Available from: http://www.eea.europa.eu/publications/COR0-
part1 [Accessed 10 October 2010].
European Environment Agency (EEA), 2007. CLC2006 technical guidelines -
Technical report. Available from:
http://www.eea.europa.eu/publications/technical_report_2007_17 [Accessed
10 October 2010].
Friedman, T.H. and Tibshirani, R., 2000. Additive logistic regression: A statistical
view of boosting. The Annals of Statistics, 38(2), 337–374.
Gao, Y., Mas, J.F., 2008. A Comparison of the Performance of Pixel Based and
Object Based Classifications over images with various Spatial Resolution, On
Line Journal of Earth Science, 27-35.
Matinfar, H.R., Sarmadian, F., Alavi Panah S.K., Heck, R.J., 2007. Comparisons of
Object-Oriented and Pixel-Based Classification of Land Use/Land Cover
Types Based on Lansadsat7, Etm+ Spectral Bands (Case Study: Arid Region
of Iran). American-Eurasian J. Agric. & Environ. Sci., 2(4), 448-456.
Haralick R., Shanmugam K., Dinstein I, 1973. Texture features for image
classification. IEEE Transactions On Systems, Man. and Cibernetics. Smc-3,
610-621.
Idrissa M. and Acheroy M., 2002. Texture classification using Gabor Filters. Pattern
Recognition Letters, 23, 1095-1102.
Knight J.F. and Lunetta R.S., 2003. An Experimental Assessment of Minimum
Mapping Unit Size. IEEE Trans. on Geoscience and Remote Sensing, 41(9).
Laws K.I, 1980. Textured image segmentation. PhD Dissertation, University of
Southern California. Los Angeles, California.
Liu, H. and Motoda, H., 2008. Computational Methods of Feature Selection.
Chapman and Hall/CRC.
Lu, D. and Weng Q., 2007. A survey of image classification methods and techniques
for improving classification performance. International Journal of Remote
Sensing, 28(5), 823-870.
Formatted: Font: Italic
Formatted: Font: Italic
Formatted: Font: Italic
Formatted: Font: Italic
Formatted: Font: Italic
Formatted: Font: Italic
Formatted: Font: Italic
Formatted: Font: Italic
Formatted: Font: Italic
Formatted: Font: Italic
Formatted: English U.K.
Formatted: Font: Italic
Formatted: Font: Italic
Formatted: Font: Italic
Deleted: pp. …, 2008
Deleted: :
Deleted: ,…Wadsworth, … (1984)
Deleted: Burrough P.A., 1989. Fuzzy
mathematical methods for soil survey and
land evaluation. Journal of Soil Science,
40, p. 477-492.
Cluster UNIVPM http://cluster.univpm.it
(last access May 2010)
Congalton, R.G., 1991, A review of
assessing the accuracy of classifications
of remotely sensed data. Remote Sensing
of Environment, 37, 35-46
Deleted: project…,…, 1994…,
Deleted: Curran, P. J. and Williamson,
H. D., 1985. The accuracy of ground data
used in remote-sensing investigations-
International Journal of Remote Sensing,
6 (10), 1637-1651.
EEA.
http://www.eea.europa.eu/publications/te
chnical_report_2007_17, …,
Deleted: Freund Y., Schapire R.E.: A
Deleted: Vol. … No. …pp …, 2000
Deleted: Foody G.M., 2002. Status of
Deleted: …:…, 2007
Deleted: ,
Deleted: :
Deleted: J. F. …R. S. …,
Deleted: actions
Deleted: vol. …, no. …, september
Deleted: Landgrebe, D.A.: Signal
Deleted: ,
Deleted: ,
Deleted: Q. …(…)
Deleted: Vol. …:
... [1]
... [3]
... [2]
... [4]
... [12]
... [10]
... [7]
... [9]
... [8]
... [5]
... [13]
... [11]
... [6]
... [14]
Page 21 of 48
http://mc.manuscriptcentral.com/tandf/ijgis
International Journal of Geographical Information Science
123456789101112131415161718192021222324252627282930313233343536373839404142434445464748495051525354555657585960

For Peer Review O
nly
Shackelford, A.K. and Davis, C.H., 2003. A combined fuzzy pixel-based and object-
based approach for classification of high-resolution multispectral data over
urban areas. IEEE Transactions on Geoscience and Remote Sensing, 41(10),
2354-2363.
Schapire R.E. and Singer Y., 1999. Improved boosting algorithms using confidence-
rated predictions. Machine Learning. 37(3), 297–336.
Sims, F.M. and Mesev, V., 2007. Use of Ancillary Data in Object Based
Classification of High Resolution Satellite Data. In: Urban Remote Sensing
Joint Event. 1-10.
Stehman, S.V., Wickham, J.D., Smith J.H., Yang, L., 2003. Thematic Accuracy of the
1992 National Land-Cover Data for the Eastern United States: Statistical
Methodology and Regional Results. Remote Sensing of Environment, 86, 500-
516.
Sutton C.D., 2005. Handbook of Statistics, 24, cap. 11: Classification and regression
trees, bagging, and boosting. Elsevier.
Tabb, M. and Ahuja, N., 1997. Multiscale image segmentation by integrated edge and
region detection. IEEE Transactions on Image Processing. 6(5), 642-655.
Wang, L., Sousa, W., Gong, P., 2004. Integration of object-based and pixel-based
classification for mangrove mapping with IKONOS imagery. Int. J. of Remote
Sensing, 25(24), 5655-5668.
Wickham, J.D., Stehman, S.V., Smith J.H., Yang, L., 2004. Thematic Accuracy of the
1992 National Land-Cover Data for the Western United States, Remote
Sensing of Environment, 91: 452-468.
Woodcock C.E. and Gopal S., 2000. Fuzzy set theory and thematic maps: accuracy
assessment and area estimation. International Journal of Geographical
Information Systems, 14(2), 153-172.
Yu, Y.W. and Wang, J.H., 1999. Image segmentation based on region growing and
edge detection. In: Proceedings of IEEE International Conference on Systems,
Man, and Cybernetics, 6, 798-803.
Yuan, F. and Bauer, M.E., 2006. Mapping impervious surface area using high
resolution imagery: A comparison of object-based and per pixel classification.
In: Proceedings of ASPRS 2006 Annual Conference, Reno, Nevada.
Zingaretti, P., Frontoni, E., Malinverni, E.S., Mancini, A., 2009. A Hybrid Approach
to Land Cover Classification from Multi Spectral Images. In: 15th
International Conference on Image Analysis and Processing (ICIAP), 8-11
September 2009 Vietri sul Mare (Italy).
Zingaretti, P., Gasparroni, M., Vecci, L., 1998. Fast Chain Coding of Region
Boundaries. IEEE Trans. Pattern Anal. Mach. Intell., 20(4), 407-415.
Formatted
Formatted
Formatted
Formatted
Formatted
Formatted
Formatted
Formatted
Formatted
Formatted
Formatted
Formatted
Formatted
Formatted
Formatted
Formatted
Formatted
Formatted
Formatted
Formatted
Deleted: Richards, J. A. (1995), Remote
Deleted: ,…:…,
Deleted: pp.… (2003)
Deleted: ,
Deleted: (…):…,
Deleted: ,…pp.
Deleted: Schapire R., The strength of
Deleted: ,…:
Deleted: ,…pp. … (2007)
Deleted: J.D. …J.H. …and L. …‘…’,
Deleted: :
Deleted: :
Deleted: vol. …,… (2005)
Deleted: Swain, P. H. (1978),
Deleted: , vol.…, no.…pp.…, May
Deleted: :
Deleted: pp. … (2004)
Deleted: S.V. …J.H. …and…L. …‘…’
Deleted: Wood, J.: Invariant pattern
Deleted: p.
Deleted: Yan Gao, Jean François Mas,
Deleted: ,…:
Deleted: vol. …pp.… (1999)
Deleted: ,…:
Deleted: ; (2006)
Deleted: To appear i
Deleted: 8-11,…,
Deleted: Zingaretti, P., Frontoni, E.,
Deleted: ,
Deleted: Vol.…pp.
... [21]
... [38]
... [17]
... [39]
... [23]
... [40]
... [18]
... [41]
... [19]
... [42]
... [16]
... [24]
... [43]
... [25]
... [44]
... [26]
... [45]
... [27]
... [22]
... [28]
... [20]
... [29]
... [48]
... [30]
... [49]
... [31]
... [46]
... [50]
... [15]
... [32]
... [51]
... [33]
... [52]
... [34]
... [53]
... [35]
... [54]
... [36]
... [47]
... [55]
... [37]
... [56]
Page 22 of 48
http://mc.manuscriptcentral.com/tandf/ijgis
International Journal of Geographical Information Science
123456789101112131415161718192021222324252627282930313233343536373839404142434445464748495051525354555657585960

For Peer Review O
nly
Table of Figures
Figure 1. ADS40 strips of the Marche region block (centre) and test imagery (right).
In green the strip from which the test image is extracted.
Figure 2. Workflow diagram describing the hybrid classification schema
Figure 3. RGED segmentation workflow
Figure 4. Extract of segmentation attributes needful for the merging step
Figure 5. AdaBoost pixel-based classification result and its CLC legend
Figure 6. WTA object classification result and its CLC legend
Figure7. Rule-based WTA classification result and its CLC legend
Figure 8. Ancillary data integration and Final CLC land use map
Figure9. Stability map -Rule-based WTA classification: yellow polygons are stable
(86%), while red ones are unstable (14%)
Figure 10. Stability mean value for each CLC class
Figure 11. Trend of Global Stability Index for each CLC class
Figure 12. Crossing between the stability map and the control data set (red ground
data don’t give good results in the WTA rule based accuracy-assessment)
Figure 13. Pixel-based (a) and object-based (b) ground control data
Table of Tables
Table 1. Available feature set (ADS40 spectral bands and texture features)
Table 2. AdaBoost pixel-based accuracy assessment
Table 3. Object classification accuracy assessment: WTA (a) and Rule-based WTA(b)
Table 4. Class Stability
Formatted: English U.K.
Formatted: English U.K.
Formatted: English U.K.
Deleted: (1998)
Page 23 of 48
http://mc.manuscriptcentral.com/tandf/ijgis
International Journal of Geographical Information Science
123456789101112131415161718192021222324252627282930313233343536373839404142434445464748495051525354555657585960

For Peer Review O
nly
Page 21: [1] Deleted DIIGA 10/11/2010 11:33:00 AM
pp.
Page 21: [1] Deleted DIIGA 10/11/2010 11:33:00 AM
, 2008
Page 21: [2] Deleted DIIGA 10/11/2010 11:37:00 AM
,
Page 21: [2] Deleted DIIGA 10/11/2010 11:37:00 AM
Wadsworth,
Page 21: [2] Deleted DIIGA 10/11/2010 11:35:00 AM
(1984)
Page 21: [3] Deleted DIIGA 10/11/2010 11:36:00 AM
Burrough P.A., 1989. Fuzzy mathematical methods for soil survey and land evaluation.
Journal of Soil Science, 40, p. 477-492.
Cluster UNIVPM http://cluster.univpm.it (last access May 2010)
Page 21: [3] Deleted DIIGA 10/11/2010 11:41:00 AM
Congalton, R.G., 1991, A review of assessing the accuracy of classifications of remotely
sensed data. Remote Sensing of Environment, 37, 35-46
Page 21: [4] Deleted DIIGA 10/11/2010 11:49:00 AM
project
Page 21: [4] Deleted DIIGA 10/11/2010 11:49:00 AM
,
Page 21: [4] Deleted DIIGA 10/11/2010 11:49:00 AM
, 1994
Page 21: [4] Deleted DIIGA 10/11/2010 11:42:00 AM
,
Page 21: [5] Deleted DIIGA 10/11/2010 11:42:00 AM
Curran, P. J. and Williamson, H. D., 1985. The accuracy of ground data used in remote-
sensing investigations- International Journal of Remote Sensing, 6 (10), 1637-
1651.
EEA. http://www.eea.europa.eu/publications/technical_report_2007_17,
Page 21: [5] Deleted DIIGA 10/11/2010 11:47:00 AM
,
Page 21: [6] Deleted DIIGA 10/11/2010 11:51:00 AM
Freund Y., Schapire R.E.: A decision-theoretic generalization of on-line learning and an
application to boosting, J. of Computer and System Sciences, 55(1), pp. 119–139,
(1997)
Page 21: [6] Deleted DIIGA 10/11/2010 11:51:00 AM
Page 24 of 48
http://mc.manuscriptcentral.com/tandf/ijgis
International Journal of Geographical Information Science
123456789101112131415161718192021222324252627282930313233343536373839404142434445464748495051525354555657585960

For Peer Review O
nly
Page 21: [6] Deleted DIIGA 10/11/2010 11:51:00 AM
astie,
Page 21: [6] Deleted DIIGA 10/11/2010 11:51:00 AM
R.
Page 21: [6] Deleted DIIGA 10/11/2010 11:52:00 AM
,
Page 21: [7] Deleted DIIGA 10/11/2010 11:52:00 AM
Vol.
Page 21: [7] Deleted DIIGA 10/11/2010 11:52:00 AM
No.
Page 21: [7] Deleted DIIGA 10/11/2010 11:52:00 AM
pp
Page 21: [7] Deleted DIIGA 10/11/2010 11:51:00 AM
, 2000
Page 21: [8] Deleted DIIGA 10/11/2010 11:58:00 AM
Foody G.M., 2002. Status of land cover classification accuracy assessment. Remote
Sensing of Environment, 80, p. 185-201.
H.R.
Page 21: [8] Deleted DIIGA 10/11/2010 11:58:00 AM
F.
Page 21: [8] Deleted DIIGA 10/11/2010 11:59:00 AM
S.K.
Page 21: [8] Deleted DIIGA 10/11/2010 12:02:00 PM
and R.J.
Page 21: [8] Deleted DIIGA 10/11/2010 12:00:00 PM
,
Page 21: [9] Deleted DIIGA 10/11/2010 11:59:00 AM
Page 21: [9] Deleted DIIGA 10/11/2010 11:59:00 AM
:
Page 21: [9] Deleted DIIGA 10/11/2010 11:59:00 AM
, 2007
Page 21: [10] Deleted DIIGA 10/11/2010 12:10:00 PM
J. F.
Page 21: [10] Deleted DIIGA 10/11/2010 12:10:00 PM
R. S.
Page 21: [10] Deleted DIIGA 10/11/2010 12:18:00 PM
,
Page 21: [11] Deleted DIIGA 10/11/2010 12:10:00 PM
vol.
Page 21: [11] Deleted DIIGA 10/11/2010 12:10:00 PM
, no.
Page 25 of 48
http://mc.manuscriptcentral.com/tandf/ijgis
International Journal of Geographical Information Science
123456789101112131415161718192021222324252627282930313233343536373839404142434445464748495051525354555657585960

For Peer Review O
nly
Page 21: [11] Deleted DIIGA 10/11/2010 12:10:00 PM
, september 2003
Page 21: [12] Deleted DIIGA 10/11/2010 12:13:00 PM
Landgrebe, D.A.: Signal Theory Methods in Multispectral Remote Sensing. John Wiley
& Sons, Inc., Hoboken, New Jersey (2003)
Page 21: [12] Deleted DIIGA 10/11/2010 12:13:00 PM
Page 21: [13] Deleted DIIGA 10/11/2010 12:16:00 PM
Q.
Page 21: [13] Deleted DIIGA 10/11/2010 12:16:00 PM
(
Page 21: [13] Deleted DIIGA 10/11/2010 12:16:00 PM
)
Page 21: [14] Deleted DIIGA 10/11/2010 12:16:00 PM
Vol.
Page 21: [14] Deleted DIIGA 10/11/2010 12:16:00 PM
:
Page 22: [15] Deleted DIIGA 10/11/2010 12:37:00 PM
Richards, J. A. (1995), Remote Sensing Digital Image Analysis. An Introduction, 2nd ed.,
Springer-Verlag, Berlin.
Page 22: [16] Formatted DIIGA 10/11/2010 12:40:00 PM
Font: Italic
Page 22: [17] Deleted DIIGA 10/11/2010 12:18:00 PM
,
Page 22: [17] Deleted DIIGA 10/11/2010 12:18:00 PM
:
Page 22: [17] Deleted DIIGA 10/11/2010 12:18:00 PM
,
Page 22: [18] Formatted DIIGA 10/11/2010 12:40:00 PM
Font: Italic
Page 22: [19] Deleted DIIGA 10/11/2010 12:18:00 PM
pp.
Page 22: [19] Deleted DIIGA 10/11/2010 12:18:00 PM
(2003)
Page 22: [20] Formatted DIIGA 10/11/2010 12:40:00 PM
English U.K.
Page 22: [21] Formatted DIIGA 10/11/2010 12:40:00 PM
English U.K.
Page 22: [22] Deleted DIIGA 10/11/2010 12:20:00 PM
(
Page 26 of 48
http://mc.manuscriptcentral.com/tandf/ijgis
International Journal of Geographical Information Science
123456789101112131415161718192021222324252627282930313233343536373839404142434445464748495051525354555657585960

For Peer Review O
nly
Page 22: [22] Deleted DIIGA 10/11/2010 12:20:00 PM
):
Page 22: [22] Deleted DIIGA 10/11/2010 12:20:00 PM
,
Page 22: [23] Formatted DIIGA 10/11/2010 12:40:00 PM
Font: Italic
Page 22: [24] Deleted DIIGA 10/11/2010 12:20:00 PM
,
Page 22: [24] Deleted DIIGA 10/11/2010 12:20:00 PM
pp.
Page 22: [25] Deleted DIIGA 10/11/2010 12:20:00 PM
Schapire R., The strength of weak learnability, Machine Learning, 5, pp. 197–227 (1990)
Page 22: [26] Formatted DIIGA 10/11/2010 12:40:00 PM
Font: Italic
Page 22: [27] Deleted DIIGA 10/11/2010 12:21:00 PM
,
Page 22: [27] Deleted DIIGA 10/11/2010 12:21:00 PM
:
Page 22: [28] Formatted DIIGA 10/11/2010 12:40:00 PM
Font: Italic
Page 22: [29] Deleted DIIGA 10/11/2010 12:21:00 PM
,
Page 22: [29] Deleted DIIGA 10/11/2010 12:21:00 PM
pp.
Page 22: [29] Deleted DIIGA 10/11/2010 12:21:00 PM
(2007)
Page 22: [30] Deleted DIIGA 10/11/2010 12:22:00 PM
J.D.
Page 22: [30] Deleted DIIGA 10/11/2010 12:22:00 PM
J.H.
Page 22: [30] Deleted DIIGA 10/11/2010 12:22:00 PM
and L.
Page 22: [30] Deleted DIIGA 10/11/2010 12:23:00 PM
‘
Page 22: [30] Deleted DIIGA 10/11/2010 12:23:00 PM
’,
Page 22: [31] Formatted DIIGA 10/11/2010 12:40:00 PM
Font: Italic
Page 22: [32] Formatted DIIGA 10/11/2010 12:40:00 PM
Font: Italic
Page 22: [33] Deleted DIIGA 10/11/2010 12:23:00 PM
Page 27 of 48
http://mc.manuscriptcentral.com/tandf/ijgis
International Journal of Geographical Information Science
123456789101112131415161718192021222324252627282930313233343536373839404142434445464748495051525354555657585960

For Peer Review O
nly
vol.
Page 22: [33] Deleted DIIGA 10/11/2010 12:24:00 PM
,
Page 22: [33] Deleted DIIGA 10/11/2010 12:24:00 PM
(2005)
Page 22: [34] Deleted DIIGA 10/11/2010 12:25:00 PM
Swain, P. H. (1978), Fundamentals of pattern recognition in remote sensing. In Remote
Sensing: The Quantitative Approach (P. H. Swain and S. M. Davis, Eds.),
McGraw-Hill, New York, pp. 136–187.
Page 22: [34] Deleted DIIGA 10/11/2010 12:25:00 PM
;
Page 22: [34] Deleted DIIGA 10/11/2010 12:26:00 PM
,
Page 22: [35] Formatted DIIGA 10/11/2010 12:40:00 PM
Font: Italic
Page 22: [36] Deleted DIIGA 10/11/2010 12:25:00 PM
, vol.
Page 22: [36] Deleted DIIGA 10/11/2010 12:25:00 PM
, no.
Page 22: [36] Deleted DIIGA 10/11/2010 12:26:00 PM
pp.
Page 22: [36] Deleted DIIGA 10/11/2010 12:25:00 PM
, May 1997
Page 22: [37] Formatted DIIGA 10/11/2010 12:40:00 PM
Font: Italic
Page 22: [38] Deleted DIIGA 10/11/2010 12:26:00 PM
pp.
Page 22: [38] Deleted DIIGA 10/11/2010 12:26:00 PM
(2004)
Page 22: [39] Deleted DIIGA 10/11/2010 12:27:00 PM
S.V.
Page 22: [39] Deleted DIIGA 10/11/2010 12:27:00 PM
J.H.
Page 22: [39] Deleted DIIGA 10/11/2010 12:27:00 PM
and
Page 22: [39] Deleted DIIGA 10/11/2010 12:27:00 PM
L.
Page 22: [39] Deleted DIIGA 10/11/2010 12:27:00 PM
‘
Page 22: [39] Deleted DIIGA 10/11/2010 12:27:00 PM
’
Page 28 of 48
http://mc.manuscriptcentral.com/tandf/ijgis
International Journal of Geographical Information Science
123456789101112131415161718192021222324252627282930313233343536373839404142434445464748495051525354555657585960

For Peer Review O
nly
Page 22: [40] Formatted DIIGA 10/11/2010 12:40:00 PM
Font: Italic
Page 22: [41] Deleted DIIGA 10/11/2010 12:27:00 PM
Wood, J.: Invariant pattern recognition: a review, Pattern Recognition, 29(1), pp. 1-17
(1996)
Page 22: [41] Deleted DIIGA 10/11/2010 12:28:00 PM
,
Page 22: [42] Formatted DIIGA 10/11/2010 12:40:00 PM
Font: Italic
Page 22: [43] Deleted DIIGA 10/11/2010 12:28:00 PM
Yan Gao, Jean François Mas, A Comparison of the Performance of Pixel Based and
Object Based Classifications over images with various Spatial Resolution, On
Line Journal of Earth Science, 27-35, 2008
Page 22: [44] Formatted DIIGA 10/11/2010 12:40:00 PM
Font: Italic
Page 22: [45] Deleted DIIGA 10/11/2010 12:29:00 PM
,
Page 22: [45] Deleted DIIGA 10/11/2010 12:29:00 PM
:
Page 22: [46] Formatted DIIGA 10/11/2010 12:40:00 PM
Font: Italic
Page 22: [47] Deleted DIIGA 10/11/2010 12:30:00 PM
vol.
Page 22: [47] Deleted DIIGA 10/11/2010 12:30:00 PM
pp.
Page 22: [47] Deleted DIIGA 10/11/2010 12:30:00 PM
(1999)
Page 22: [48] Deleted DIIGA 10/11/2010 12:30:00 PM
,
Page 22: [48] Deleted DIIGA 10/11/2010 12:30:00 PM
:
Page 22: [49] Formatted DIIGA 10/11/2010 12:40:00 PM
Font: Italic
Page 22: [50] Formatted DIIGA 10/11/2010 12:40:00 PM
English U.K.
Page 22: [50] Formatted DIIGA 10/11/2010 12:40:00 PM
English U.K.
Page 22: [50] Formatted DIIGA 10/11/2010 12:40:00 PM
English U.K.
Page 22: [51] Formatted DIIGA 10/11/2010 12:40:00 PM
Font: Italic
Page 29 of 48
http://mc.manuscriptcentral.com/tandf/ijgis
International Journal of Geographical Information Science
123456789101112131415161718192021222324252627282930313233343536373839404142434445464748495051525354555657585960

For Peer Review O
nly
Page 22: [52] Deleted DIIGA 10/11/2010 12:32:00 PM
8-11,
Page 22: [52] Deleted DIIGA 10/11/2010 12:32:00 PM
,
Page 22: [53] Deleted DIIGA 10/11/2010 12:33:00 PM
Zingaretti, P., Frontoni, E., Forlani, G., Nardinocchi, C.: Automatic extraction of LIDAR
data classification rules. In: 14th Int. Conference on Image Analysis and
Processing - ICIAP. IEEE Computer Society, pp. 273-278 (2007)
Page 22: [54] Formatted DIIGA 10/11/2010 12:40:00 PM
English U.K.
Page 22: [54] Formatted DIIGA 10/11/2010 12:40:00 PM
English U.K.
Page 22: [54] Formatted DIIGA 10/11/2010 12:40:00 PM
English U.K.
Page 22: [55] Formatted DIIGA 10/11/2010 12:40:00 PM
Font: Italic
Page 22: [56] Deleted DIIGA 10/11/2010 12:33:00 PM
Vol.
Page 22: [56] Deleted DIIGA 10/11/2010 12:33:00 PM
pp.
Page 30 of 48
http://mc.manuscriptcentral.com/tandf/ijgis
International Journal of Geographical Information Science
123456789101112131415161718192021222324252627282930313233343536373839404142434445464748495051525354555657585960

For Peer Review O
nly
ADS40 strips of the Marche region block (centre) and test imagery (right). In green the strip from which the test image is extracted.
136x74mm (300 x 300 DPI)
Page 31 of 48
http://mc.manuscriptcentral.com/tandf/ijgis
International Journal of Geographical Information Science
123456789101112131415161718192021222324252627282930313233343536373839404142434445464748495051525354555657585960

For Peer Review O
nly
Workflow diagram describing the hybrid classification schema 133x102mm (300 x 300 DPI)
Page 32 of 48
http://mc.manuscriptcentral.com/tandf/ijgis
International Journal of Geographical Information Science
123456789101112131415161718192021222324252627282930313233343536373839404142434445464748495051525354555657585960
For Peer Review O
nly
RGED segmentation workflow 144x78mm (300 x 300 DPI)
Page 33 of 48
http://mc.manuscriptcentral.com/tandf/ijgis
International Journal of Geographical Information Science
123456789101112131415161718192021222324252627282930313233343536373839404142434445464748495051525354555657585960

For Peer Review O
nly
Extract of segmentation attributes needful for the merging step 131x47mm (300 x 300 DPI)
Page 34 of 48
http://mc.manuscriptcentral.com/tandf/ijgis
International Journal of Geographical Information Science
123456789101112131415161718192021222324252627282930313233343536373839404142434445464748495051525354555657585960

For Peer Review O
nly
AdaBoost pixel-based classification result and its CLC legend 176x121mm (150 x 150 DPI)
Page 35 of 48
http://mc.manuscriptcentral.com/tandf/ijgis
International Journal of Geographical Information Science
123456789101112131415161718192021222324252627282930313233343536373839404142434445464748495051525354555657585960

For Peer Review O
nly
WTA object classification result and its CLC legend 176x118mm (150 x 150 DPI)
Page 36 of 48
http://mc.manuscriptcentral.com/tandf/ijgis
International Journal of Geographical Information Science
123456789101112131415161718192021222324252627282930313233343536373839404142434445464748495051525354555657585960

For Peer Review O
nly
Rule-based WTA classification result and its CLC legend 176x120mm (150 x 150 DPI)
Page 37 of 48
http://mc.manuscriptcentral.com/tandf/ijgis
International Journal of Geographical Information Science
123456789101112131415161718192021222324252627282930313233343536373839404142434445464748495051525354555657585960

For Peer Review O
nly
Ancillary data integration and Final CLC land use map 98x154mm (300 x 300 DPI)
Page 38 of 48
http://mc.manuscriptcentral.com/tandf/ijgis
International Journal of Geographical Information Science
123456789101112131415161718192021222324252627282930313233343536373839404142434445464748495051525354555657585960
For Peer Review O
nly
Stability map -Rule-based WTA classification: yellow polygons are stable (86%), while red ones are unstable (14%)
125x125mm (150 x 150 DPI)
Page 39 of 48
http://mc.manuscriptcentral.com/tandf/ijgis
International Journal of Geographical Information Science
123456789101112131415161718192021222324252627282930313233343536373839404142434445464748495051525354555657585960

For Peer Review O
nly
Stability mean value for each CLC class 134x80mm (600 x 600 DPI)
Page 40 of 48
http://mc.manuscriptcentral.com/tandf/ijgis
International Journal of Geographical Information Science
123456789101112131415161718192021222324252627282930313233343536373839404142434445464748495051525354555657585960

For Peer Review O
nly
Trend of Global Stability Index for each CLC class 290x330mm (300 x 300 DPI)
Page 41 of 48
http://mc.manuscriptcentral.com/tandf/ijgis
International Journal of Geographical Information Science
123456789101112131415161718192021222324252627282930313233343536373839404142434445464748495051525354555657585960

For Peer Review O
nly
Crossing between the stability map and the control data set (red ground data don’t give good results in the WTA rule based accuracy-assessment)
93x93mm (300 x 300 DPI)
Page 42 of 48
http://mc.manuscriptcentral.com/tandf/ijgis
International Journal of Geographical Information Science
123456789101112131415161718192021222324252627282930313233343536373839404142434445464748495051525354555657585960

For Peer Review O
nly
Pixel-based (a) and object-based (b) ground control data 145x54mm (300 x 300 DPI)
Page 43 of 48
http://mc.manuscriptcentral.com/tandf/ijgis
International Journal of Geographical Information Science
123456789101112131415161718192021222324252627282930313233343536373839404142434445464748495051525354555657585960

For Peer Review O
nly
Available feature set (ADS40 spectral bands and texture features) 61x43mm (600 x 600 DPI)
Page 44 of 48
http://mc.manuscriptcentral.com/tandf/ijgis
International Journal of Geographical Information Science
123456789101112131415161718192021222324252627282930313233343536373839404142434445464748495051525354555657585960

For Peer Review O
nly
AdaBoost pixel-based accuracy assessment 83x73mm (300 x 300 DPI)
Page 45 of 48
http://mc.manuscriptcentral.com/tandf/ijgis
International Journal of Geographical Information Science
123456789101112131415161718192021222324252627282930313233343536373839404142434445464748495051525354555657585960

For Peer Review O
nly
70x59mm (600 x 600 DPI)
Page 46 of 48
http://mc.manuscriptcentral.com/tandf/ijgis
International Journal of Geographical Information Science
123456789101112131415161718192021222324252627282930313233343536373839404142434445464748495051525354555657585960

For Peer Review O
nly
Object classification accuracy assessment: WTA (a) and Rule-based WTA(b) 70x68mm (600 x 600 DPI)
Page 47 of 48
http://mc.manuscriptcentral.com/tandf/ijgis
International Journal of Geographical Information Science
123456789101112131415161718192021222324252627282930313233343536373839404142434445464748495051525354555657585960
For Peer Review O
nly
Class Stability 62x46mm (600 x 600 DPI)
Page 48 of 48
http://mc.manuscriptcentral.com/tandf/ijgis
International Journal of Geographical Information Science
123456789101112131415161718192021222324252627282930313233343536373839404142434445464748495051525354555657585960
Copyright © 2022 FDOKUMEN