Extreme Earthquake and Earthquake Perceptibility Study in ...
36
Natural Hazards 32: 277–312, 2004. © 2004 Kluwer Academic Publishers. Printed in the Netherlands. 277 Extreme Earthquake and Earthquake Perceptibility Study in Greece and its Surrounding Area PAUL W. BURTON 1 , CHANGYUAN QIN 1 , G.-AKIS TSELENTIS 2 and ETHIMIOS SOKOS 2 1 School of Environmental Sciences, University of East Anglia, Norwich NR4 7TJ, UK, E-mail: [email protected]; 2 Seismological Laboratory, University of Patras, Rio 261 10, Greece, E-mail: [email protected] (Received: 26 August 2001; accepted: 22 May 2003) Abstract. The sample interval for the selection of extreme magnitudes plays an important part in the quality of Gumbel model fitting. A short sample interval can produce many observations, which is helpful in obtaining a reliably fitting model. However a short sample interval can bring many dummy “observations”, a condition which adversely biases the fitting. The short sample interval also increases the chance to introduce non- independent observations as well, which violates a ba- sic requirement of the Gumbel model. On the other hand, a large time interval not only reduces the number of observations, but also enlarges the observation error. Thus, for Greece, the most suitable parameters of the third Gumbel extreme model are obtained by using a sample interval which produces minimum error. In consideration of the reliability of the seismic data, earthquakes with magnitude M ≥ 5.5 in Greece and its surrounding region after 1900 are used mainly in the present paper. In order to obtain well resolved contour maps with smooth changes a 2 ◦ × 2 ◦ cell with half-degree overlap strategy was used to scan the region. The most expected largest earthquake for the next fifty, one hundred and two hundred years are estimated for each cell. Likewise, the events with magnitude at a probability of 90% of non-exceedance over the next fifty, one hundred and two hundred years are estimated for each cell. In parallel to this procedure we also analyze the 67 shallow seismic zones outlined by Papazachos and his colleagues and detail individual zone results where these are obtained. The most perceptible earthquake magnitude for the range of intensities I = VI, VII and VIII are also calculated. All results show that the areas around the Hellenic Arc and the Cephalonia Transform Fault for Greece have comparatively high frequency of destructive earthquakes accompanied by a high occurrence probability of moderate earthquakes (M ≥ 5.5). Key words: Gumbel model, earthquake, extreme value, perceptibility, Greece. 1. Introduction Statistical methodology plays a major role in estimating the return period, viz, the average inter-event time, the size and the location of seismic activity since no successful physical method yet proves to be effective. Many memoryless models require a complete data set, a demand which proves to be difficult to realize in practice, especially for the data of small events before the installation of the World Wide Seismological Stations Network (WWSSN) in 1964 (Pacheco and Sykes, 1992). However, the extreme value theory described by
-
Upload
khangminh22 -
Category
Documents
-
view
0 -
download
0
Transcript of Extreme Earthquake and Earthquake Perceptibility Study in ...

Natural Hazards 32: 277–312, 2004.© 2004 Kluwer Academic Publishers. Printed in the Netherlands.
277
Extreme Earthquake and Earthquake PerceptibilityStudy in Greece and its Surrounding Area
PAUL W. BURTON1, CHANGYUAN QIN1, G.-AKIS TSELENTIS2 andETHIMIOS SOKOS2
1School of Environmental Sciences, University of East Anglia, Norwich NR4 7TJ, UK, E-mail:[email protected]; 2Seismological Laboratory, University of Patras, Rio 261 10, Greece, E-mail:[email protected]
(Received: 26 August 2001; accepted: 22 May 2003)
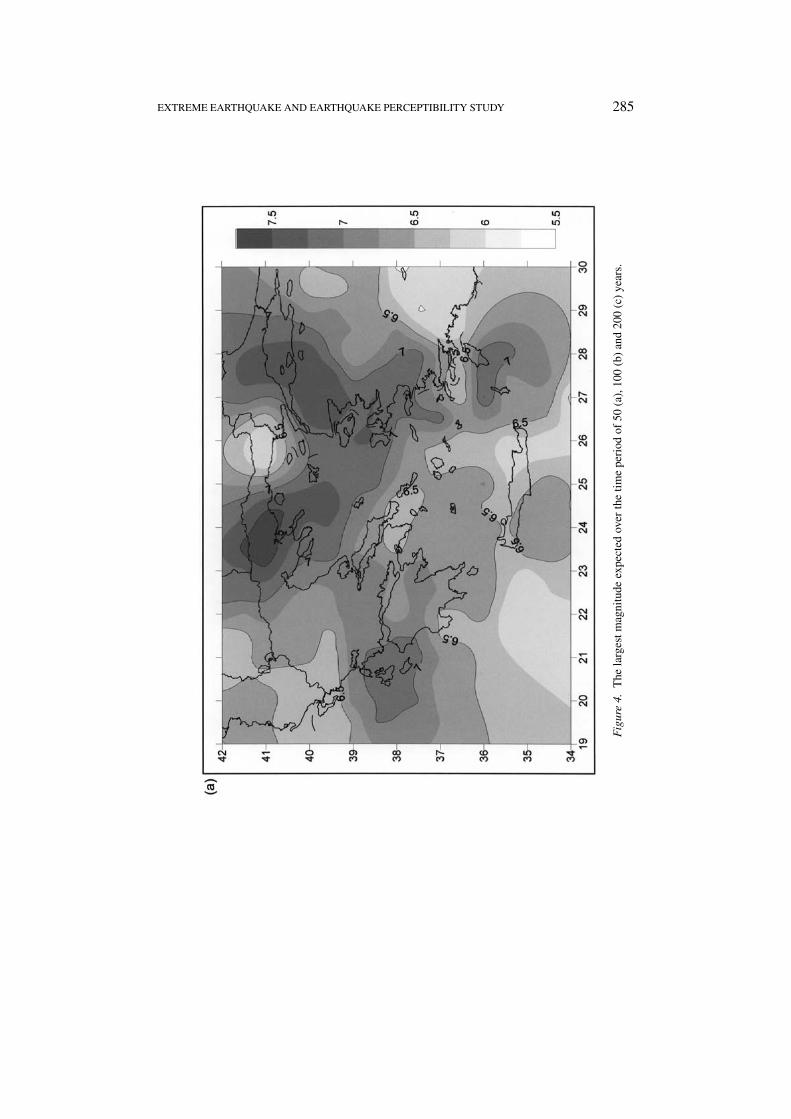
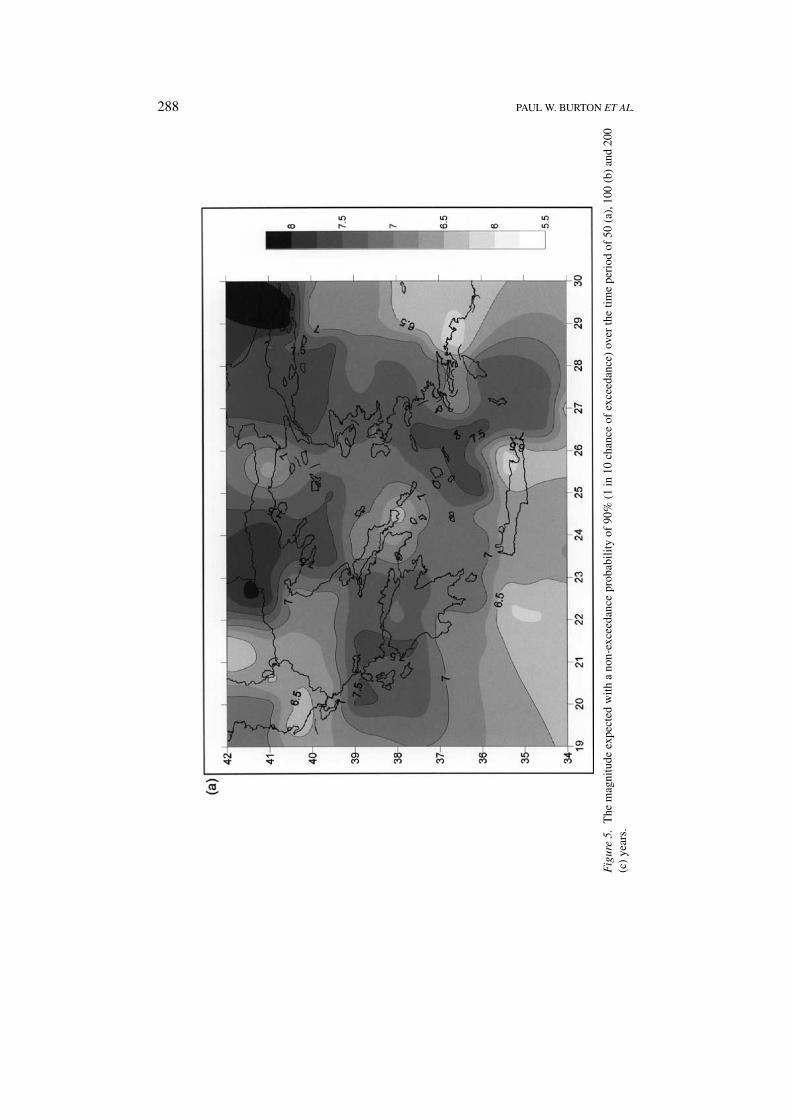
Abstract. The sample interval for the selection of extreme magnitudes plays an important part inthe quality of Gumbel model fitting. A short sample interval can produce many observations, whichis helpful in obtaining a reliably fitting model. However a short sample interval can bring manydummy “observations”, a condition which adversely biases the fitting. The short sample intervalalso increases the chance to introduce non- independent observations as well, which violates a ba-sic requirement of the Gumbel model. On the other hand, a large time interval not only reducesthe number of observations, but also enlarges the observation error. Thus, for Greece, the mostsuitable parameters of the third Gumbel extreme model are obtained by using a sample intervalwhich produces minimum error. In consideration of the reliability of the seismic data, earthquakeswith magnitude M ≥ 5.5 in Greece and its surrounding region after 1900 are used mainly in thepresent paper. In order to obtain well resolved contour maps with smooth changes a 2◦ ×2◦ cell withhalf-degree overlap strategy was used to scan the region. The most expected largest earthquake forthe next fifty, one hundred and two hundred years are estimated for each cell. Likewise, the eventswith magnitude at a probability of 90% of non-exceedance over the next fifty, one hundred andtwo hundred years are estimated for each cell. In parallel to this procedure we also analyze the 67shallow seismic zones outlined by Papazachos and his colleagues and detail individual zone resultswhere these are obtained. The most perceptible earthquake magnitude for the range of intensitiesI = VI, VII and VIII are also calculated. All results show that the areas around the Hellenic Arcand the Cephalonia Transform Fault for Greece have comparatively high frequency of destructiveearthquakes accompanied by a high occurrence probability of moderate earthquakes (M ≥ 5.5).
Key words: Gumbel model, earthquake, extreme value, perceptibility, Greece.
1. Introduction
Statistical methodology plays a major role in estimating the return period, viz,the average inter-event time, the size and the location of seismic activity since nosuccessful physical method yet proves to be effective.
Many memoryless models require a complete data set, a demand which provesto be difficult to realize in practice, especially for the data of small events beforethe installation of the World Wide Seismological Stations Network (WWSSN) in1964 (Pacheco and Sykes, 1992). However, the extreme value theory described by

278 PAUL W. BURTON ET AL.
Gumbel (1958) has the advantage that it does not depend excessively on a completerecord of earthquake occurrence, but instead on the sequence of earthquakes con-structed from the largest values of magnitude over a set of predetermined intervals(i.e., the sample interval) (Burton, 1979). The extreme values are usually betterknown than the smaller events in a catalogue. This is a simple but important advant-age. Also, selection of the extreme values will largely eliminate most significantaftershocks from the analysis and maintain emphasis on what are held to be in-dependent events (Makropoulos and Burton, 1985). Therefore, Gumbel theory hasbeen used in earthquake research by many seismologists (Yegulalp, 1974; Yegulalpand Kuo, 1974; Burton, 1978, 1979, 1981; Makropoulos and Burton, 1985).
Nordquist (1945) demonstrated that the ‘Theory of Extreme Values’ is applic-able to the estimation of the probability of occurrence of maximum magnitudeearthquakes. The theory of extreme values is generally formulated under the fol-lowing assumptions: the prevailing conditions should be valid in the future and theobserved largest values be independent of each other (Yegulalp and Kuo, 1974).Distribution of extreme values, like Poisson’s law, are linked to small probabilities.Poisson’s law gives the number of rare events, while the theory of extreme valuesconsiders their size.
There are three kinds of Gumbel model, labeled for convenience: Gumbel I,Gumbel II and Gumbel III. Yegulalp and Kuo (1974) and Burton (1979) claimedthat the third asymptotic distribution has a clearer and better physical interpretationfor a probabilistic model describing earthquake magnitude occurrence than eitherthe first or the second distribution. The present paper uses the Gumbel III theory(i.e., the third asymptotic distribution) to study the seismicity pattern in Greeceand its surrounding area. The parameters of the third asymptotic distribution ofextreme values are estimated throughout the region with a scanning cell of 2◦ × 2◦degrees, within which the largest earthquakes and those with 90% probability ofnon-exceedance over the next fifty, one hundred and two hundred years are es-timated. The magnitude of the most perceptible earthquake at different intensitylevels (VI, VII and VIII) is also calculated. In order to obtain detailed informa-tion throughout the study region, a scheme with half degree overlap between cellsis adopted. The method thus develops the capabilities of a zone-free analysis ofseismicity; this has also been developed elsewhere in relation to a peak groundacceleration seismic hazard analysis (Burton et al., 2003). In parallel to this zone-free analysis we also adopt for analysis the 67 shallow seismic zones outlinedby Papazachos and Papazachou (1997) and Papaioannou and Papazachos (2000).These zones were delineated in an attempt to maintain a degree of seismotectonichomogeneity (Papazachos, 1990).
2. Data and Tectonic Setting
In consideration of the reliability and completeness of regional seismic data, thedata for the present study, except where stated otherwise, are shallow earthquakes

EXTREME EARTHQUAKE AND EARTHQUAKE PERCEPTIBILITY STUDY 279
(depth h ≤ 60 km) with magnitude M ≥ 5.5 (M is surface wave magnitude) inGreece and its surrounding regions that have occurred since 1900. The current cata-logue is mainly developed on the foundation studies of Makropoulos and Burton(1981), Engdahl et al. (1998) and Papazachos et al. (2000), and is described in fullin Burton et al. (in press). This earthquake catalogue has already been used suc-cessfully elsewhere to develop a peak ground acceleration seismic hazard analysisfor Greece (Burton et al., 2003). Although the major target is to achieve a zone-free methodology for the analysis of seismicity, 67 shallow seismic zones (depthh < 60 km) around the Aegean Sea, as described by Papazachos and Papazachou(1997) and Papaioannou and Papazachos (2000), were also unequivocally adopted.
Greece and its surrounding area is located in the Eurasian-Melanesian zoneof the continental fracture system and the Hellenic arc (Ionian islands – Crete– Rhodos), toward which the Eurasian plate and the African plate converge(Papazachos and Papazachou, 1997). Specifically, due to the southwestward mo-tion of the southern Aegean relative to Europe, the active Hellenic subduction inthe south, the westward push of Anatolia in the east and the continental collisionbetween northwestern Greece and the Apulian platform in the west, Greece and itssurrounding area experiences the highest seismicity in Europe (Figure 1).
The low angle thrust faults of shallow earthquakes, which are located alongthe Hellenic Trench, mark the southern boundary of the Aegean plate. A strike slipdextral fault belt dominates the northern part of the Aegean plate. The northwesternedge of the Aegean plate is delineated by the Cephalonia Transform Fault (Scordiliset al., 1985). The boundary in the eastern part of the Aegean plate is dominated bya broad zone of east-west extensional normal faults (Papazachos and Papazachou,1997).
3. Methodology
3.1. EVALUATION OF THE PARAMETERS
The third asymptotic model for the unit-interval (i.e., the basic sample-interval,here taken to be one year so that each extreme magnitude can be treated asindependent) takes the form (i.e., probability function):
GIII(m) = exp
[−
(ω − m
ω − µ
)1/λ]
, (1)
where GIII(m) is the third Gumbel cumulative probability of magnitude less thanor equal to m, ω the upper limit of earthquake magnitude, µ the characteristicextreme magnitude, λ the shape parameter and m the extreme magnitude value.When m tends to its upper limit ω, the function GIII(m) → 1, whereas when m
decreases, the function GIII(m) → 0.In order to reduce possible correlation between the extreme magnitudes and to
minimize the number of dummy observations (extreme interval with null entry) in

280 PAUL W. BURTON ET AL.
Figure 1. The earthquake distribution with magnitude M ≥ 5.5 during 1990–1999 and thetectonic setting of the study region.
the data sequence for a lower seismicity region, a relatively large sample-intervalis preferred. A larger sample-interval makes the observational data more evenlydistributed and will tend to improve the model fitting. Take the following exampleto illustrate this (Figure 2): If the time sequence is divided into twelve intervals (i.e.,twelve observations), the meaningful extreme observations above the thresholdwill be four out of twelve; eight out of the twelve will be dummy observations,the efficiency of observation is four to twelve. If divided into six intervals (i.e.,

EXTREME EARTHQUAKE AND EARTHQUAKE PERCEPTIBILITY STUDY 281
Figure 2. Formation of the extreme value with different time-intervals. The “+” sign indicatesthe interval with meaningful observation (above the threshold), whereas the “−” sign indic-ates any interval with dummy observation. (A) illustrates the case with only four meaningfulobservations out of twelve samples (i.e., eight dummy observations); (B) four out of six; (C)three out of four and (D) three out of three. The efficiency of the four cases increases in theorder A, B, C and D.
six observations), the efficiency will be four to six. If divided into four intervals(i.e., four observations), the efficiency will further increase to three to four, andso on. The increasing “efficiency” of the observations, therefore the uniformity ofthe data, will tend to increase the fitting quality if the number of observations issufficiently large.
However, it must be borne in mind that this increasing efficiency is at the costof a sharp reduction in the number of observations, which will adversely influencethe fitting quality. Additionally, due to the limited magnitude space, the larger thesample interval then the larger will be the extreme magnitude and the less willbe the magnitude range of the data set. These factors will eventually bias themodel fitting. Therefore there exists an optimum sample interval which leads tobest model fitting (Burton, 1981). Taking T -year as a sample interval and furtherassuming that the annual extreme magnitudes are independent of each other, thenthe T -year Gumbel III probability function can be written as (Yegulalp and Kuo,1974):
GIIIT (m) =T∏
GIII(m) = exp
[−T
(ω − m
ω − µ
)1/λ]
. (2)
The above relation can be rewritten as:
m = ω − (ω − µ)[− ln GIIIT (m)/T ]λ. (3)
Gringorten (1963) has shown that the plotting position of the extreme probabilityfollows:
GIIIT (mi) = (i − 0.44)/(n + 0.12) i = 1, . . . , n, (4)
282 PAUL W. BURTON ET AL.
where i is the order when the extreme magnitude mi is ranked in ascending order,n the number of the extreme events. This plotting position is thus an approximationto the extreme probability calculated directly from the ranked sequence of extremesprior to curve fitting. In order to obtain the parameters ω, µ and λ of the relation(3), nonlinear model fitting is used to minimize χ2
T value (Burton, 1979; Press etal., 1992),
χ2T (ω,µ, λ) =
∑wi(mi − m̃i)
2, (5)
here wi is the weight associated with the observation, mi the magnitude and m̃i
the model of relation (3). Briefly (see above references for full description), tominimize relation (5),
AX = B, (6)
where
A = a11 a12 a13
a21 a22 a23
a31 a32 a33
, aij = 1
2
∂2χ2T
∂xi∂xj
, i, j = 1, 2, 3
B = b1
b2
b3
, bi = −1
2
∂χ2T
∂xi
, i = 1, 2, 3
X = ω
µ
λ
.
Note that the second derivative of relation (5) is ignored because of its negligibleinfluence when compared to the terms involving the first derivative. Inclusion of thesecond-derivative term can actually be destabilizing if the model fits poorly or iscontaminated by outlier points that are unlikely to be offset by compensating pointsof opposite sign (Press et al., 1992).
To efficiently solve the matrix (6), the Levenberg-Marquardt method (alsocalled Marquardt method) (Marquardt, 1963) is used for the required nonlinearleast-squares fitting. This method readjusts the diagonal elements of matrix A ofthe relation (6), i.e.:
a′jj = ajj (1 + ξ)
a′jk = ajk, (j �= k),

EXTREME EARTHQUAKE AND EARTHQUAKE PERCEPTIBILITY STUDY 283
where ξ is an adjustable number. When ξ is very large, the matrix is forced intobeing diagonally dominant so that the solution of (6) can be written as:
xj = bj
ξajj
.
On the other hand, as ξ approaches negligibly small (i.e., ξ → 0), the solution isthe same as that of relation (6). At first, ξ is set to a small but non-negligible valueand a trial solution set (ω̃, µ̃, λ̃) of (6) adopted in order to estimate the startingvalue χ2
T (ω̃, µ̃, λ̃). This procedure is repeated with a new ξ value so that the newvalue of χ2
T decreases until the decrement is not significant. As discussed abovein relation to data efficiency, the above procedure is repeated for different extremetime intervals to find
χ2min = min(χ2
1 , . . . , χ2T ), (7)
i.e., which interval has the smallest error, in a chi-squared sense.
3.2. PERCEPTIBILITY
Earthquake perceptibility is defined to be the probability that a site perceivesground shaking at least of intensity I arising from, i.e., conditional on, anearthquake occurrence of magnitude M (Burton, 1978, 1990), i.e.:
P(I | M) = Pc(I )Pe(M). (8)
The term Pc(I ) estimates the probability of perceiving intensity level I from amagnitude M earthquake, will increase with magnitude, and can be considered asa ratio of the felt area at intensity I or greater to that of the given area investigated.The felt area at intensity I can be obtained from the local macroseismic attenuationrelationship. Papazachos and Papaioannou (1997), on the basis of macroseismicfield investigation of the shallow earthquakes in the Balkan area using a largesample of macroseismic data, suggested that the macroseismic intensity at a siteis a result of anisotropic radiation at the seismic source, geometrical spreading andanelastic attenuation along the wave path. They suggested the following attenuationrelation for shallow earthquakes:
I = 1.43M − 3.59 log(R + 6) + 2.26, (9)
where I is the intensity on the MM scale, M is the corresponding moment mag-nitude and R the epicentral distance in kilometer (Papaioannou and Papazachos,2000). The term Pe(M) is the derivative (probability density) of the third asymp-totic law (2) and estimates the probability of a magnitude M occurrence. Themagnitude which is most probably felt at a site at intensity level I or highercorresponds to the largest value of Equation (8) (Figure 3), i.e., where:

284 PAUL W. BURTON ET AL.
Figure 3. The definition of perceptibility: (a) the probability density curve of the GumbelIII model [Pe(M) in (8)], (b) the probability of perceiving or feeling intensity I or greaterwhen a magnitude M earthquake has occurred [Pc(I )) in (8)] and (c) the perceptibility curve[P(I | M) in (8)].
d[P(I | M)]dM
= 0. (10)
This is the condition that defines the “most perceptible earthquake”. In other words,this determines the earthquake that is most likely to be perceived or felt at any levelof ground motion at a site or in a region and is therefore a characteristic propertyof the region (Burton, 1990).
3.3. THE MOST PROBABLE MAGNITUDE
The most expected extreme magnitude of a T -year interval is the one where the
corresponding probability density is largest, i.e., d2GIIIT(ω,µ,λ)
dm2 = 0 from which itfollows that:
mT = ω − (ω − µ)[(1 − λ)/T ]λ. (11)
And the earthquake with probability P of being a maximum or not being exceededin a T -year interval can be obtained from Equation (3):
mT (P ) = ω − (ω − µ)[− ln P)/T ]λ. (12)
The magnitude error σm, however, can be estimated from the following equation:
σ 2m = σ 2
ω
(∂M
∂ω
)2
+ σ 2µ
(∂M
∂µ
)2
+ σ 2λ
(∂M
∂λ
)2
+ 2σ 2ωµ
(∂M
∂ω
)(∂M
∂µ
)+ · · · , (13)
where ∂M∂ω
, ∂M∂µ
and ∂M∂λ
are the partial derivatives of Equation (1), and σω, σµ and σλ
the square root of the diagonal elements of the covariance matrix (Burton, 1979;Burton and Makropoulos, 1985; Makropoulos and Burton, 1985).
EXTREME EARTHQUAKE AND EARTHQUAKE PERCEPTIBILITY STUDY 285
Fig
ure
4.T
hela
rges
tmag
nitu
deex
pect
edov
erth
eti
me
peri
odof
50(a
),10
0(b
)an
d20
0(c
)ye
ars.

286 PAUL W. BURTON ET AL.
Fig
ure
4.C
onti
nued
.

EXTREME EARTHQUAKE AND EARTHQUAKE PERCEPTIBILITY STUDY 287
Fig
ure
4.C
onti
nued
.
288 PAUL W. BURTON ET AL.
Fig
ure
5.T
hem
agni
tude
expe
cted
with
ano
n-ex
ceed
ance
prob
abili
tyof
90%
(1in
10ch
ance
ofex
ceed
ance
)ov
erth
etim
epe
riod
of50
(a),
100
(b)
and
200
(c)
year
s.

EXTREME EARTHQUAKE AND EARTHQUAKE PERCEPTIBILITY STUDY 289
Fig
ure
5.C
onti
nued
.

290 PAUL W. BURTON ET AL.
Fig
ure
5.C
onti
nued
.

EXTREME EARTHQUAKE AND EARTHQUAKE PERCEPTIBILITY STUDY 291
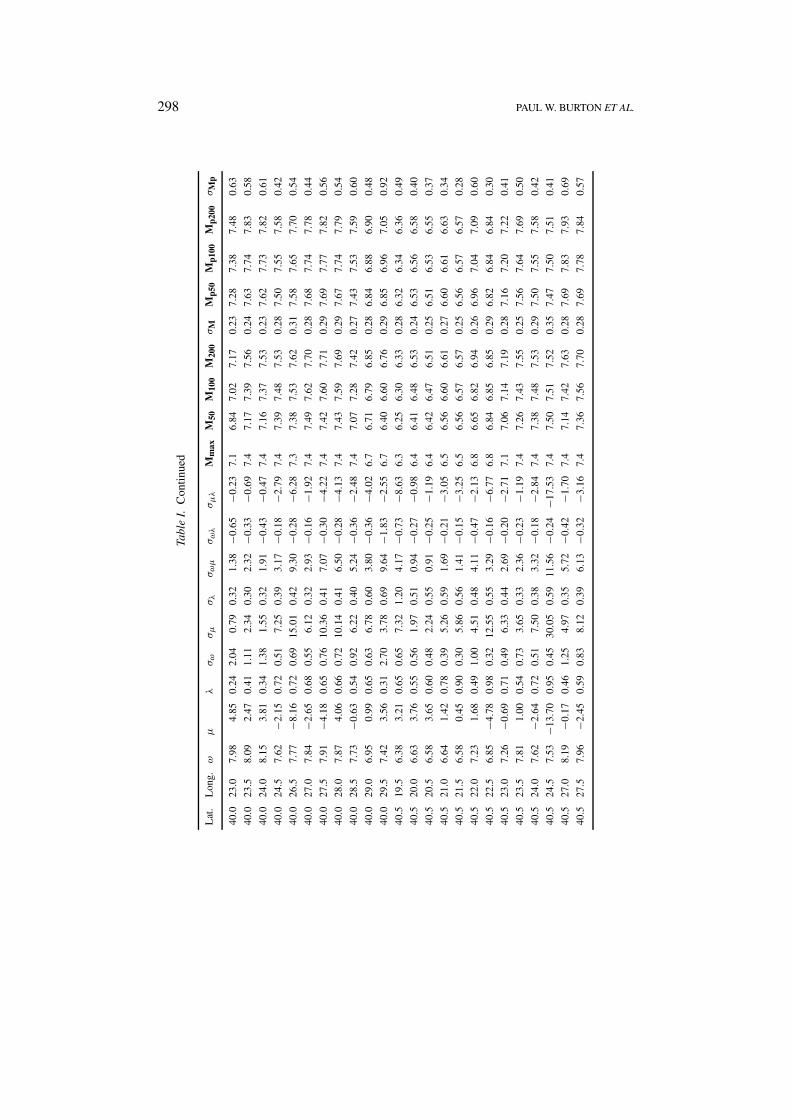
Tabl
eI.
ω,σ
ω,µ
,σµ
,λ,σ
λar
eth
eth
ree
para
met
ers
ofth
eG
umbe
lII
Im
odel
and
the
corr
espo
ndin
ger
rors
and
σωµ
,σωλ
and
σµ
λar
eth
eco
rres
pond
ing
cova
rian
ces
ofth
epa
ram
eter
s.M
max
isth
em
axim
umea
rthq
uake
obse
rved
inth
ece
ll.M
50,M
100,
M20
0an
dM
p50,
Mp1
00,
Mp2
00ar
eth
em
axim
umm
agni
tude
and
the
mag
nitu
dew
ith
90%
prob
abil
ity
ofbe
ing
am
axim
um(1
in10
chan
ceof
bein
gex
ceed
ed)
inth
ene
xt50
,100
and
200-
year
sre
spec
tivel
y.σ
Man
dσ
Mp
are
the
unce
rtai
ntie
son
thes
em
agni
tude
fore
cast
s.
Lat
.L
ong.
ωµ
λσω
σµ
σλ
σω
µσω
λσµ
λM
max
M50
M10
0M
200
σM
Mp5
0M
p100
Mp2
00σ
Mp
34.0
23.5
7.01
1.16
0.53
1.20
9.00
0.77
10.0
0−0
.90
−6.8
76.
66.
516.
666.
770.
286.
786.
856.
900.
73
34.0
24.0
6.90
−2.9
60.
670.
9318
.13
0.79
15.4
2−0
.70
−14.
266.
66.
556.
686.
760.
306.
746.
806.
840.
66
34.0
24.5
6.93
0.52
0.56
1.08
10.3
90.
7810
.29
−0.8
1−7
.97
6.6
6.48
6.62
6.72
0.28
6.73
6.79
6.84
0.68
34.0
25.0
6.93
0.52
0.56
1.08
10.3
90.
7810
.29
−0.8
1−7
.97
6.6
6.48
6.62
6.72
0.28
6.73
6.79
6.84
0.68
34.0
25.5
6.53
−0.3
30.
670.
8615
.92
1.03
12.4
4−0
.84
−16.
226.
36.
296.
386.
440.
316.
426.
466.
490.
62
34.0
26.0
6.65
1.39
0.53
1.26
10.4
60.
9612
.23
−1.1
8−9
.99
6.3
6.22
6.35
6.44
0.28
6.45
6.51
6.56
0.76
34.0
26.5
7.18
2.24
0.35
3.13
7.23
0.86
21.7
4−2
.66
−6.1
46.
56.
086.
326.
500.
216.
606.
726.
821.
11
34.0
27.0
6.79
3.42
0.31
3.27
5.22
1.01
16.3
9−3
.29
−5.2
36.
55.
916.
086.
220.
006.
306.
406.
481.
03
34.5
22.5
6.33
0.52
0.78
0.63
19.7
51.
4611
.00
−0.8
6−2
8.61
6.2
6.25
6.28
6.30
0.33
6.28
6.30
6.31
0.51
34.5
23.0
6.62
2.56
0.59
0.74
5.82
0.79
3.84
−0.5
5−4
.51
6.5
6.38
6.46
6.51
0.27
6.51
6.55
6.57
0.52
34.5
23.5
6.70
−0.0
70.
880.
348.
030.
642.
26−0
.20
−5.0
86.
66.
676.
686.
690.
276.
676.
686.
690.
31
34.5
24.0
6.68
−2.7
60.
970.
3313
.41
0.71
3.64
−0.2
1−9
.35
6.6
6.67
6.68
6.68
0.29
6.66
6.67
6.67
0.31
34.5
24.5
6.71
−0.5
50.
880.
357.
920.
592.
23−0
.18
−4.6
46.
66.
676.
696.
700.
276.
686.
696.
700.
32
34.5
25.0
6.72
0.28
0.80
0.40
7.24
0.61
2.44
−0.2
2−4
.33
6.6
6.65
6.68
6.70
0.28
6.67
6.69
6.71
0.35
34.5
25.5
6.42
1.82
0.69
0.56
7.58
0.86
3.73
−0.4
6−6
.43
6.3
6.29
6.34
6.37
0.29
6.36
6.38
6.40
0.45
34.5
26.0
7.22
4.38
0.22
3.87
1.72
0.63
6.25
−2.4
3−1
.05
6.3
6.08
6.24
6.38
0.18
6.48
6.59
6.68
0.87
34.5
26.5
8.96
3.41
0.19
5.02
1.72
0.34
8.17
−1.7
2−0
.58
7.2
6.47
6.78
7.06
0.32
7.28
7.49
7.68
0.96
34.5
27.0
8.55
2.48
0.28
2.79
2.45
0.34
6.46
−0.9
3−0
.81
7.2
6.66
6.99
7.26
0.10
7.44
7.63
7.79
0.83
34.5
27.5
8.08
0.15
0.41
1.64
5.13
0.39
7.90
−0.6
2−1
.95
7.2
6.81
7.12
7.36
0.22
7.45
7.61
7.73
0.78
35.0
22.5
6.80
4.43
0.26
3.47
2.71
0.96
8.87
−3.3
2−2
.55
6.2
6.00
6.13
6.24
0.21
6.32
6.40
6.46
0.93
35.0
23.0
7.33
4.26
0.24
3.37
2.01
0.61
6.36
−2.0
4−1
.20
6.5
6.21
6.38
6.52
0.29
6.63
6.74
6.83
0.87
35.0
23.5
6.75
0.24
0.80
0.39
6.51
0.55
2.13
−0.2
0−3
.55
6.6
6.67
6.71
6.72
0.27
6.70
6.72
6.73
0.34
35.0
24.0
6.68
−2.7
60.
970.
3313
.41
0.71
3.64
−0.2
1−9
.35
6.6
6.67
6.68
6.68
0.29
6.66
6.67
6.67
0.31
35.0
24.5
6.71
−0.5
50.
880.
357.
920.
592.
23−0
.18
−4.6
46.
66.
676.
696.
700.
276.
686.
696.
700.
32
35.0
25.5
6.51
3.43
0.51
0.83
3.81
0.77
2.85
−0.6
1−2
.86
6.3
6.23
6.31
6.37
0.26
6.38
6.42
6.45
0.54

292 PAUL W. BURTON ET AL.
Tabl
eI.
Con
tinu
ed
Lat
.L
ong.
ωµ
λσω
σµ
σλ
σω
µσω
λσµ
λM
max
M50
M10
0M
200
σM
Mp5
0M
p100
Mp2
00σ
Mp
35.0
26.0
6.55
3.51
0.49
0.88
3.25
0.69
2.55
−0.5
9−2
.21
6.3
6.22
6.32
6.38
0.26
6.40
6.44
6.47
0.55
35.0
26.5
8.59
3.03
0.24
3.72
2.37
0.38
8.33
−1.4
1−0
.88
7.2
6.56
6.88
7.14
0.26
7.33
7.52
7.69
0.93
35.0
27.0
8.55
2.48
0.28
2.79
2.45
0.34
6.46
−0.9
3−0
.81
7.2
6.66
6.99
7.26
0.10
7.44
7.63
7.79
0.83
35.0
27.5
8.08
0.15
0.41
1.64
5.13
0.39
7.90
−0.6
2−1
.95
7.2
6.81
7.12
7.36
0.22
7.45
7.61
7.73
0.78
35.5
22.0
6.49
2.79
0.49
1.49
9.16
1.25
12.7
8−1
.82
−11.
336.
26.
096.
216.
290.
276.
316.
366.
400.
81
35.5
22.5
6.28
0.26
0.91
0.38
13.3
31.
084.
14−0
.36
−14.
216.
26.
266.
276.
270.
306.
266.
276.
270.
34
35.5
23.0
6.79
3.66
0.44
1.05
2.90
0.64
2.72
−0.6
5−1
.79
6.5
6.36
6.47
6.56
0.26
6.58
6.64
6.68
0.59
35.5
23.5
7.28
4.35
0.26
2.24
1.29
0.46
2.67
−1.0
1−0
.57
6.5
6.30
6.46
6.60
0.26
6.69
6.79
6.87
0.71
35.5
24.0
6.80
2.60
0.55
0.74
4.08
0.59
2.69
−0.4
2−2
.35
6.5
6.48
6.58
6.65
0.26
6.66
6.70
6.73
0.51
35.5
24.5
7.18
3.81
0.32
1.70
1.89
0.47
2.96
−0.7
9−0
.86
6.5
6.34
6.51
6.64
0.21
6.72
6.81
6.88
0.67
35.5
25.0
7.04
3.32
0.35
2.08
3.91
0.70
7.66
−1.4
5−2
.71
6.5
6.23
6.41
6.55
0.15
6.61
6.71
6.78
0.82
35.5
25.5
6.23
−0.7
60.
820.
6326
.29
1.55
14.6
2−0
.91
−40.
446.
16.
166.
196.
210.
356.
196.
216.
220.
52
35.5
26.0
6.29
2.64
0.64
0.64
6.60
0.97
3.72
−0.5
8−6
.29
6.1
6.14
6.19
6.23
0.28
6.22
6.25
6.26
0.48
35.5
26.5
8.11
1.90
0.33
2.45
4.31
0.46
9.99
−1.1
1−1
.94
7.2
6.64
6.95
7.19
0.20
7.32
7.48
7.61
0.89
35.5
27.0
8.49
3.48
0.23
2.88
1.37
0.29
3.67
−0.8
4−0
.39
7.2
6.61
6.90
7.14
0.16
7.31
7.49
7.64
0.75
35.5
27.5
8.09
2.28
0.33
1.84
2.57
0.34
4.41
−0.6
1−0
.84
7.2
6.72
7.00
7.23
0.20
7.35
7.50
7.62
0.73
35.5
28.0
7.65
−6.7
50.
660.
9518
.78
0.56
16.4
5−0
.51
−10.
417.
27.
137.
327.
440.
317.
417.
507.
550.
68
36.0
21.0
6.99
0.47
0.52
1.29
10.2
00.
7612
.32
−0.9
6−7
.71
6.7
6.42
6.60
6.72
0.25
6.73
6.81
6.87
0.75
36.0
21.5
7.40
3.04
0.33
2.51
4.26
0.65
10.1
3−1
.61
−2.7
26.
76.
356.
566.
740.
226.
836.
957.
040.
90
36.0
22.0
7.00
1.33
0.57
0.83
6.13
0.59
4.56
−0.4
6−3
.54
6.7
6.61
6.74
6.82
0.27
6.83
6.88
6.92
0.56
36.0
22.5
7.69
2.20
0.40
1.43
3.58
0.43
4.75
−0.6
0−1
.50
7.0
6.76
6.99
7.16
0.25
7.23
7.34
7.43
0.70
36.0
23.0
7.27
3.05
0.44
0.87
1.94
0.35
1.51
−0.3
0−0
.66
7.0
6.68
6.84
6.95
0.24
6.99
7.06
7.12
0.51
36.0
23.5
7.69
2.92
0.36
1.75
3.14
0.46
5.11
−0.8
0−1
.42
7.0
6.68
6.90
7.08
0.20
7.16
7.28
7.37
0.73
36.0
24.0
7.56
2.50
0.40
1.31
3.04
0.41
3.68
−0.5
3−1
.22
7.0
6.71
6.91
7.07
0.23
7.14
7.24
7.32
0.65
36.0
24.5
7.02
1.17
0.50
1.17
6.92
0.63
7.51
−0.7
2−4
.32
6.5
6.45
6.62
6.74
0.25
6.76
6.84
6.89
0.69
36.0
25.0
8.43
−1.2
20.
402.
408.
780.
4920
.14
−1.1
5−4
.22
7.4
6.81
7.20
7.50
0.27
7.62
7.82
7.97
1.03
36.0
25.5
9.90
2.47
0.18
9.46
3.70
0.47
34.0
3−4
.46
−1.7
37.
46.
406.
827.
180.
237.
497.
788.
031.
38
36.0
26.0
7.83
3.53
0.26
2.59
1.73
0.38
4.20
−0.9
8−0
.64
7.4
6.41
6.64
6.84
0.15
6.97
7.12
7.23
0.77

EXTREME EARTHQUAKE AND EARTHQUAKE PERCEPTIBILITY STUDY 293
Tabl
eI.
Con
tinu
ed
Lat
.L
ong.
ωµ
λσω
σµ
σλ
σω
µσω
λσµ
λM
max
M50
M10
0M
200
σM
Mp5
0M
p100
Mp2
00σ
Mp
36.0
26.5
9.57
3.57
0.19
3.92
0.99
0.22
3.62
−0.8
7−0
.21
7.4
6.80
7.14
7.44
0.22
7.69
7.92
8.12
0.78
36.0
27.0
7.43
−8.0
50.
830.
5418
.20
0.52
8.47
−0.2
6−9
.44
7.2
7.29
7.35
7.38
0.33
7.33
7.38
7.40
0.46
36.0
27.5
7.43
−8.0
50.
830.
5418
.20
0.52
8.47
−0.2
6−9
.44
7.2
7.29
7.35
7.38
0.33
7.33
7.38
7.40
0.46
36.0
28.0
7.69
−3.3
20.
620.
829.
570.
437.
08−0
.33
−4.0
27.
27.
167.
347.
460.
297.
457.
537.
590.
58
36.5
21.0
7.02
2.91
0.51
0.71
2.61
0.43
1.63
−0.3
0−1
.11
6.7
6.64
6.75
6.83
0.25
6.85
6.90
6.93
0.48
36.5
21.5
7.77
4.21
0.24
2.83
1.37
0.41
3.62
−1.1
5−0
.55
6.7
6.45
6.65
6.82
0.28
6.94
7.07
7.18
0.77
36.5
22.0
7.40
3.75
0.32
1.93
2.15
0.48
3.83
−0.9
1−1
.01
6.7
6.46
6.64
6.79
0.27
6.88
6.98
7.06
0.74
36.5
22.5
7.77
2.94
0.35
2.12
4.10
0.55
8.17
−1.1
6−2
.23
7.0
6.70
6.93
7.11
0.19
7.20
7.33
7.42
0.81
36.5
23.0
7.69
2.24
0.36
1.82
3.49
0.43
5.93
−0.7
8−1
.49
7.0
6.56
6.81
7.00
0.23
7.10
7.23
7.33
0.77
36.5
23.5
7.77
−1.6
30.
461.
8310
.44
0.55
18.1
6−0
.99
−5.7
27.
06.
626.
947.
170.
227.
237.
387.
490.
92
36.5
26.0
10.0
41.
460.
209.
115.
090.
4945
.22
−4.4
5−2
.47
7.4
6.33
6.81
7.23
0.20
7.57
7.89
8.17
1.49
36.5
26.5
9.16
2.43
0.24
4.23
2.65
0.35
10.7
0−1
.46
−0.9
17.
46.
657.
037.
350.
307.
597.
838.
031.
02
36.5
27.0
7.28
3.47
0.31
2.17
2.54
0.52
5.16
−1.1
2−1
.29
6.7
6.27
6.47
6.62
0.14
6.72
6.83
6.91
0.76
36.5
27.5
7.58
3.15
0.29
3.43
4.32
0.69
14.1
8−2
.34
−2.9
26.
76.
316.
546.
730.
096.
856.
997.
091.
01
36.5
28.0
6.98
1.70
0.49
1.19
6.04
0.63
6.61
−0.7
3−3
.76
6.7
6.41
6.57
6.69
0.27
6.72
6.79
6.85
0.69
36.5
28.5
6.19
−3.9
50.
990.
4949
.48
1.88
20.8
5−0
.84
−92.
716.
26.
196.
196.
190.
406.
176.
186.
180.
44
36.5
29.0
6.23
−3.8
20.
940.
5341
.20
1.60
19.1
9−0
.79
−65.
696.
26.
216.
226.
220.
386.
206.
216.
220.
47
37.0
19.5
7.31
−1.2
70.
571.
1111
.69
0.64
11.9
6−0
.69
−7.4
36.
96.
756.
937.
060.
307.
067.
147.
200.
71
37.0
20.0
7.49
2.55
0.40
1.27
2.98
0.41
3.45
−0.5
1−1
.20
6.9
6.67
6.87
7.02
0.25
7.08
7.18
7.26
0.64
37.0
20.5
7.67
3.82
0.30
1.95
1.82
0.41
3.25
−0.7
9−0
.72
6.9
6.60
6.80
6.96
0.21
7.06
7.17
7.27
0.70
37.0
21.0
7.36
4.17
0.37
1.17
1.66
0.44
1.71
−0.5
0−0
.70
6.9
6.74
6.88
6.99
0.25
7.04
7.11
7.17
0.58
37.0
21.5
7.54
4.52
0.25
1.83
0.68
0.30
1.10
−0.5
5−0
.19
6.7
6.46
6.63
6.77
0.21
6.88
6.98
7.07
0.59
37.0
22.0
7.68
4.18
0.25
2.75
1.51
0.44
3.84
−1.1
9−0
.64
6.7
6.44
6.63
6.80
0.27
6.92
7.04
7.14
0.79
37.0
22.5
7.49
2.86
0.41
1.15
2.54
0.39
2.63
−0.4
4−0
.96
7.0
6.72
6.91
7.05
0.23
7.11
7.20
7.27
0.59
37.0
23.0
7.66
1.44
0.40
1.70
4.78
0.47
7.63
−0.7
8−2
.20
7.0
6.59
6.85
7.04
0.22
7.12
7.25
7.35
0.77
37.0
26.0
9.02
2.15
0.24
4.67
3.46
0.41
15.5
2−1
.90
−1.3
97.
46.
536.
917.
240.
377.
477.
717.
911.
10
37.0
26.5
7.84
−0.1
90.
530.
915.
350.
374.
38−0
.33
−1.9
77.
47.
157.
367.
510.
267.
537.
627.
690.
58
37.0
27.0
7.66
3.44
0.33
1.56
1.68
0.35
2.38
−0.5
3−0
.56
7.0
6.63
6.84
7.00
0.24
7.10
7.21
7.30
0.65

294 PAUL W. BURTON ET AL.
Tabl
eI.
Con
tinu
ed
Lat
.L
ong.
ωµ
λσω
σµ
σλ
σω
µσω
λσµ
λM
max
M50
M10
0M
200
σM
Mp5
0M
p100
Mp2
00σ
Mp
37.0
27.5
7.69
3.74
0.31
1.66
1.43
0.34
2.15
−0.5
6−0
.47
7.0
6.62
6.83
6.99
0.22
7.09
7.21
7.30
0.64
37.0
28.0
7.64
2.58
0.37
1.52
2.90
0.40
4.05
−0.6
0−1
.15
7.0
6.66
6.88
7.05
0.26
7.14
7.25
7.34
0.70
37.0
28.5
6.49
3.51
0.43
1.54
5.73
1.10
8.25
−1.6
6−6
.23
6.2
6.06
6.17
6.25
0.24
6.28
6.34
6.38
0.77
37.0
29.0
6.56
3.13
0.43
2.00
8.30
1.29
15.8
0−2
.55
−10.
606.
26.
056.
186.
280.
166.
316.
386.
420.
92
37.5
19.5
7.44
0.60
0.53
0.88
4.96
0.42
3.97
−0.3
5−2
.03
6.9
6.86
7.04
7.16
0.26
7.18
7.26
7.31
0.57
37.5
20.0
7.79
3.54
0.39
0.83
0.96
0.22
0.69
−0.1
8−0
.21
7.3
7.02
7.20
7.34
0.23
7.40
7.49
7.56
0.46
37.5
20.5
8.22
4.27
0.27
1.44
0.61
0.21
0.76
−0.2
9−0
.12
7.3
6.95
7.17
7.35
0.22
7.47
7.60
7.70
0.54
37.5
21.0
7.84
4.01
0.37
0.94
1.01
0.26
0.81
−0.2
4−0
.25
7.3
7.07
7.24
7.38
0.23
7.44
7.53
7.60
0.49
37.5
21.5
8.41
4.32
0.25
1.57
0.52
0.19
0.71
−0.2
9−0
.09
7.3
6.98
7.21
7.40
0.20
7.53
7.67
7.79
0.54
37.5
22.0
7.84
4.17
0.30
1.30
0.83
0.26
0.94
−0.3
3−0
.20
7.2
6.84
7.03
7.18
0.22
7.28
7.38
7.47
0.54
37.5
22.5
8.10
4.32
0.28
1.60
0.83
0.26
1.13
−0.4
1−0
.20
7.2
6.93
7.13
7.30
0.25
7.41
7.53
7.63
0.60
37.5
23.0
8.19
4.20
0.26
1.61
0.69
0.22
0.97
−0.3
6−0
.15
7.2
6.87
7.09
7.28
0.22
7.40
7.53
7.64
0.57
37.5
23.5
7.46
3.46
0.38
1.12
1.58
0.34
1.59
−0.3
7−0
.52
7.0
6.69
6.86
7.00
0.23
7.06
7.15
7.22
0.56
37.5
24.0
7.33
1.92
0.46
1.11
4.14
0.47
4.21
−0.5
1−1
.91
7.0
6.67
6.85
6.98
0.25
7.02
7.10
7.17
0.63
37.5
26.0
9.16
2.23
0.23
5.18
3.35
0.41
16.6
7−2
.10
−1.3
57.
46.
516.
907.
230.
267.
487.
737.
941.
13
37.5
26.5
8.16
1.77
0.39
1.34
2.82
0.31
3.47
−0.4
1−0
.86
7.4
7.03
7.30
7.50
0.22
7.59
7.73
7.83
0.65
37.5
27.0
7.61
1.29
0.49
0.89
3.54
0.35
2.83
−0.3
0−1
.23
7.0
6.95
7.14
7.28
0.26
7.31
7.39
7.46
0.55
37.5
27.5
7.44
−0.2
40.
600.
675.
310.
393.
15−0
.25
−2.0
27.
07.
027.
167.
260.
277.
257.
327.
360.
49
37.5
28.0
7.30
−2.5
50.
750.
529.
400.
484.
22−0
.23
−4.4
77.
07.
117.
197.
230.
307.
207.
247.
270.
43
37.5
28.5
7.88
1.65
0.34
2.87
5.54
0.56
15.2
0−1
.58
−3.0
57.
06.
426.
726.
960.
277.
097.
267.
391.
03
37.5
29.0
6.79
4.15
0.27
3.67
3.76
1.07
13.1
8−3
.88
−3.9
46.
25.
976.
116.
230.
426.
316.
396.
461.
07
37.5
29.5
6.64
1.51
0.51
1.52
12.0
21.
1117
.21
−1.6
5−1
3.27
6.4
6.16
6.30
6.40
0.23
6.42
6.49
6.53
0.85
38.0
19.5
7.21
0.14
0.68
0.51
5.21
0.42
2.30
−0.2
0−2
.16
6.9
6.98
7.07
7.12
0.27
7.10
7.14
7.17
0.41
38.0
20.0
7.83
4.02
0.36
0.79
0.56
0.19
0.38
−0.1
4−0
.10
7.3
7.02
7.20
7.34
0.22
7.41
7.50
7.57
0.43
38.0
20.5
7.73
3.76
0.41
0.77
1.10
0.26
0.72
−0.1
9−0
.27
7.3
7.09
7.25
7.37
0.23
7.41
7.49
7.55
0.45
38.0
21.0
8.01
4.34
0.31
1.27
0.91
0.27
1.00
−0.3
3−0
.23
7.3
7.04
7.23
7.38
0.23
7.47
7.57
7.66
0.54
38.0
21.5
8.24
4.29
0.27
1.40
0.61
0.21
0.75
−0.2
8−0
.12
7.3
7.00
7.21
7.39
0.22
7.51
7.63
7.74
0.53
38.0
22.0
8.82
4.57
0.16
4.33
0.57
0.25
2.24
−1.0
8−0
.13
7.2
6.57
6.80
7.01
0.25
7.19
7.36
7.51
0.72

EXTREME EARTHQUAKE AND EARTHQUAKE PERCEPTIBILITY STUDY 295
Tabl
eI.
Con
tinu
ed
Lat
.L
ong.
ωµ
λσω
σµ
σλ
σω
µσω
λσµ
λM
max
M50
M10
0M
200
σM
Mp5
0M
p100
Mp2
00σ
Mp
38.0
22.5
8.80
4.59
0.16
3.97
0.56
0.24
1.99
−0.9
6−0
.13
7.2
6.62
6.85
7.06
0.19
7.24
7.40
7.55
0.68
38.0
23.0
8.36
4.48
0.20
2.58
0.62
0.25
1.42
−0.6
3−0
.14
7.2
6.69
6.91
7.10
0.19
7.26
7.40
7.53
0.62
38.0
23.5
7.31
4.24
0.29
1.81
1.41
0.44
2.32
−0.7
8−0
.60
6.6
6.42
6.58
6.72
0.23
6.80
6.89
6.97
0.65
38.0
24.0
7.13
4.10
0.30
2.59
3.00
0.76
7.30
−1.9
4−2
.22
6.5
6.30
6.45
6.58
0.26
6.66
6.75
6.82
0.88
38.0
24.5
6.30
−3.1
40.
910.
5028
.91
1.27
12.4
9−0
.58
−36.
326.
26.
276.
286.
290.
356.
276.
286.
290.
44
38.0
26.0
7.44
−2.1
50.
610.
849.
310.
487.
08−0
.38
−4.3
97.
06.
947.
117.
230.
287.
227.
297.
340.
59
38.0
26.5
7.67
1.05
0.50
0.87
3.58
0.34
2.82
−0.2
9−1
.20
7.0
7.00
7.19
7.33
0.25
7.36
7.45
7.51
0.55
38.0
27.0
7.41
−1.0
70.
700.
464.
790.
331.
87−0
.14
−1.5
57.
07.
187.
277.
320.
277.
307.
347.
370.
38
38.0
27.5
7.36
−0.1
50.
680.
494.
680.
371.
96−0
.17
−1.6
87.
07.
127.
217.
270.
277.
257.
297.
320.
40
38.0
28.0
7.48
−0.2
20.
580.
806.
300.
444.
53−0
.34
−2.7
47.
06.
997.
157.
260.
277.
267.
337.
380.
55
38.0
28.5
7.34
−2.8
30.
610.
9713
.21
0.59
11.8
2−0
.56
−7.7
87.
06.
837.
017.
120.
297.
117.
197.
240.
66
38.0
29.0
6.69
0.23
0.61
0.90
11.1
60.
829.
14−0
.70
−9.0
06.
56.
366.
486.
550.
286.
546.
596.
630.
62
38.0
29.5
6.67
2.63
0.44
1.69
7.00
0.95
11.1
4−1
.57
−6.5
76.
46.
106.
256.
360.
266.
406.
476.
520.
84
38.0
30.0
6.93
3.00
0.33
3.62
7.08
1.09
24.7
4−3
.91
−7.6
16.
45.
966.
166.
320.
336.
406.
516.
591.
18
38.5
19.5
7.16
−1.2
30.
750.
529.
500.
574.
23−0
.27
−5.3
56.
97.
017.
077.
110.
307.
087.
117.
130.
43
38.5
20.0
8.08
3.32
0.34
1.37
1.56
0.29
1.90
−0.3
9−0
.43
7.3
7.00
7.23
7.41
0.22
7.50
7.62
7.72
0.61
38.5
20.5
7.84
3.39
0.39
0.94
1.38
0.27
1.13
−0.2
5−0
.36
7.3
7.05
7.24
7.38
0.23
7.44
7.54
7.61
0.50
38.5
21.0
7.84
3.39
0.39
0.94
1.38
0.27
1.13
−0.2
5−0
.36
7.3
7.05
7.24
7.38
0.23
7.44
7.54
7.61
0.50
38.5
21.5
9.24
4.36
0.18
3.54
0.67
0.22
2.11
−0.7
7−0
.14
7.3
6.89
7.16
7.40
0.21
7.61
7.80
7.97
0.69
38.5
22.0
7.95
4.23
0.29
1.33
0.70
0.23
0.82
−0.3
0−0
.15
7.2
6.86
7.06
7.22
0.23
7.32
7.44
7.53
0.54
38.5
22.5
8.15
4.50
0.25
2.44
1.29
0.38
2.86
−0.9
1−0
.47
7.2
6.88
7.09
7.26
0.23
7.38
7.50
7.61
0.73
38.5
23.0
7.95
4.24
0.30
1.26
0.74
0.24
0.81
−0.3
0−0
.17
7.2
6.92
7.12
7.27
0.22
7.37
7.48
7.57
0.53
38.5
23.5
7.57
4.60
0.26
1.70
0.82
0.33
1.22
−0.5
6−0
.26
6.8
6.60
6.76
6.90
0.19
6.99
7.09
7.17
0.58
38.5
24.0
6.86
2.28
0.65
0.55
4.76
0.61
2.24
−0.3
2−2
.85
6.7
6.68
6.74
6.79
0.28
6.78
6.81
6.83
0.43
38.5
24.5
7.16
1.12
0.57
0.72
4.66
0.45
2.98
−0.3
1−2
.05
6.9
6.76
6.89
6.98
0.27
6.98
7.04
7.08
0.50
38.5
25.0
7.14
−19.
480.
960.
5346
.29
0.67
21.1
7−0
.32
−30.
886.
97.
117.
127.
130.
397.
077.
107.
120.
47
38.5
26.0
7.26
−6.6
60.
990.
299.
550.
372.
23−0
.09
−3.4
97.
07.
267.
267.
260.
267.
237.
247.
250.
28
38.5
26.5
7.28
−4.4
70.
920.
317.
420.
351.
85−0
.10
−2.5
97.
07.
257.
267.
270.
267.
247.
267.
270.
29

296 PAUL W. BURTON ET AL.
Tabl
eI.
Con
tinu
ed
Lat
.L
ong.
ωµ
λσω
σµ
σλ
σω
µσω
λσµ
λM
max
M50
M10
0M
200
σM
Mp5
0M
p100
Mp2
00σ
Mp
38.5
27.0
7.29
−3.1
90.
930.
285.
360.
311.
19−0
.08
−1.6
47.
07.
267.
287.
280.
247.
257.
277.
280.
26
38.5
27.5
7.44
0.65
0.61
0.58
3.93
0.35
1.98
−0.1
9−1
.36
7.0
7.09
7.21
7.29
0.26
7.28
7.34
7.37
0.44
38.5
28.0
7.85
2.77
0.35
1.47
2.01
0.32
2.72
−0.4
6−0
.62
7.0
6.73
6.97
7.16
0.23
7.26
7.39
7.49
0.64
38.5
28.5
8.15
2.68
0.28
3.25
3.25
0.46
10.0
2−1
.48
−1.4
67.
06.
476.
777.
010.
217.
177.
347.
480.
95
38.5
29.0
7.02
1.42
0.53
0.87
5.00
0.51
3.96
−0.4
3−2
.52
6.7
6.55
6.70
6.80
0.26
6.81
6.87
6.92
0.57
38.5
29.5
7.09
0.23
0.55
0.99
7.96
0.59
7.23
−0.5
7−4
.66
6.7
6.59
6.75
6.86
0.27
6.86
6.94
6.99
0.64
38.5
30.0
7.00
−3.0
70.
680.
7814
.78
0.66
10.4
5−0
.49
−9.6
46.
76.
686.
806.
880.
306.
856.
916.
940.
58
39.0
19.5
7.63
2.90
0.34
1.84
2.57
0.41
4.40
−0.7
4−1
.03
6.9
6.52
6.75
6.93
0.25
7.03
7.15
7.25
0.74
39.0
20.0
8.60
3.71
0.25
2.21
1.02
0.24
2.03
−0.5
2−0
.23
7.3
6.86
7.13
7.36
0.25
7.53
7.69
7.84
0.67
39.0
20.5
8.33
3.75
0.27
1.80
1.08
0.25
1.74
−0.4
5−0
.26
7.3
6.90
7.15
7.35
0.25
7.49
7.63
7.76
0.64
39.0
21.0
8.40
3.86
0.26
1.98
1.05
0.26
1.87
−0.5
0−0
.26
7.3
6.89
7.14
7.35
0.24
7.49
7.64
7.77
0.65
39.0
21.5
8.36
4.05
0.27
1.78
0.97
0.25
1.55
−0.4
5−0
.23
7.3
6.98
7.22
7.41
0.19
7.54
7.68
7.80
0.61
39.0
22.0
8.18
4.21
0.27
1.66
0.77
0.24
1.15
−0.3
9−0
.18
7.2
6.89
7.11
7.29
0.21
7.41
7.54
7.65
0.58
39.0
22.5
8.13
4.65
0.25
1.58
0.52
0.22
0.70
−0.3
5−0
.11
7.2
6.91
7.10
7.26
0.19
7.38
7.50
7.60
0.53
39.0
23.0
7.90
4.95
0.26
1.35
0.43
0.23
0.48
−0.3
1−0
.09
7.2
6.91
7.07
7.21
0.20
7.30
7.40
7.48
0.50
39.0
23.5
7.07
3.89
0.49
0.55
1.10
0.32
0.51
−0.1
6−0
.33
6.8
6.74
6.84
6.90
0.23
6.92
6.96
6.99
0.38
39.0
24.0
6.89
1.50
0.81
10.
344.
610.
521.
25−0
.16
−2.3
66.
86.
836.
866.
870.
256.
856.
876.
880.
30
39.0
24.5
7.15
−0.0
70.
720.
454.
940.
401.
88−0
.16
−1.9
36.
96.
977.
047.
080.
277.
067.
107.
120.
37
39.0
25.0
7.17
−12.
340.
870.
5730
.46
0.63
15.3
5−0
.34
−19.
176.
97.
067.
117.
140.
367.
087.
127.
140.
49
39.0
26.0
7.28
−8.4
70.
940.
3613
.85
0.43
4.03
−0.1
3−5
.83
7.0
7.25
7.26
7.27
0.29
7.23
7.25
7.27
0.33
39.0
26.5
7.44
−2.9
10.
720.
506.
940.
362.
97−0
.17
−2.4
57.
07.
207.
297.
350.
287.
327.
377.
400.
41
39.0
27.5
7.55
0.51
0.50
0.96
4.65
0.39
4.06
−0.3
6−1
.77
7.0
6.86
7.06
7.21
0.26
7.23
7.33
7.39
0.59
39.0
28.0
7.76
2.97
0.31
2.29
2.85
0.45
6.14
−1.0
2−1
.26
7.0
6.50
6.75
6.94
0.19
7.06
7.20
7.31
0.81
39.0
28.5
7.42
−1.8
30.
561.
2713
.16
0.66
15.6
5−0
.81
−8.5
77.
06.
766.
977.
110.
287.
127.
227.
280.
78
39.0
29.0
6.97
0.68
0.61
0.77
7.40
0.61
5.10
−0.4
5−4
.46
6.7
6.64
6.75
6.83
0.28
6.82
6.87
6.91
0.54
39.0
29.5
7.20
2.13
0.45
1.88
9.36
0.94
16.7
2−1
.74
−8.7
36.
76.
526.
706.
830.
276.
886.
967.
030.
91
39.5
19.5
7.63
3.56
0.26
3.70
2.95
0.60
10.4
1−2
.19
−1.7
26.
76.
256.
486.
660.
156.
796.
937.
050.
97
39.5
20.0
7.49
4.51
0.22
2.92
1.06
0.43
2.87
−1.2
5−0
.44
6.7
6.29
6.46
6.61
0.13
6.72
6.83
6.92
0.71

EXTREME EARTHQUAKE AND EARTHQUAKE PERCEPTIBILITY STUDY 297
Tabl
eI.
Con
tinu
ed
Lat
.L
ong.
ωµ
λσω
σµ
σλ
σω
µσω
λσµ
λM
max
M50
M10
0M
200
σM
Mp5
0M
p100
Mp2
00σ
Mp
39.5
20.5
7.66
4.68
0.19
3.92
0.99
0.45
3.62
−1.7
6−0
.43
6.7
6.29
6.45
6.60
0.24
6.72
6.84
6.94
0.78
39.5
21.0
9.27
4.74
0.11
10.4
00.
700.
356.
78−3
.60
−0.2
36.
76.
346.
556.
750.
266.
947.
117.
270.
89
39.5
21.5
8.45
4.91
0.13
7.61
0.86
0.43
6.01
−3.2
8−0
.35
6.7
6.38
6.56
6.72
0.32
6.88
7.02
7.14
0.90
39.5
22.0
7.25
3.66
0.42
1.00
2.04
0.43
1.81
−0.4
2−0
.86
6.8
6.69
6.83
6.93
0.25
6.97
7.04
7.09
0.55
39.5
22.5
6.96
1.59
0.64
0.53
4.48
0.49
2.05
−0.2
5−2
.15
6.8
6.73
6.81
6.87
0.26
6.86
6.89
6.92
0.42
39.5
23.0
7.60
2.86
0.43
1.05
2.67
0.39
2.52
−0.4
0−1
.01
7.1
6.90
7.08
7.21
0.24
7.26
7.35
7.41
0.57
39.5
23.5
8.16
2.72
0.38
1.28
2.27
0.32
2.65
−0.4
0−0
.70
7.4
7.15
7.39
7.57
0.25
7.65
7.77
7.86
0.63
39.5
24.0
7.73
2.15
0.52
0.66
2.41
0.30
1.39
−0.1
9−0
.71
7.4
7.24
7.39
7.49
0.25
7.51
7.58
7.62
0.45
39.5
24.5
7.53
−6.6
10.
870.
3911
.50
0.40
3.75
−0.1
4−4
.55
7.4
7.45
7.48
7.50
0.29
7.46
7.49
7.51
0.35
39.5
25.0
7.77
−2.7
70.
620.
767.
920.
385.
39−0
.28
−3.0
17.
47.
257.
437.
550.
297.
547.
627.
670.
55
39.5
25.5
7.26
−6.4
80.
910.
4014
.49
0.51
4.76
−0.1
8−7
.28
7.0
7.22
7.24
7.25
0.31
7.21
7.23
7.25
0.36
39.5
26.5
7.27
−8.4
10.
990.
3111
.91
0.39
2.96
−0.1
1−4
.58
7.0
7.27
7.27
7.27
0.28
7.23
7.25
7.26
0.29
39.5
27.0
7.47
−4.3
10.
920.
316.
760.
331.
66−0
.09
−2.1
97.
47.
447.
457.
460.
267.
437.
457.
460.
28
39.5
27.5
7.50
−7.7
80.
890.
4215
.48
0.47
5.53
−0.1
8−7
.25
7.4
7.43
7.46
7.48
0.31
7.44
7.47
7.48
0.38
39.5
28.0
8.01
0.33
0.44
1.33
4.76
0.37
5.86
−0.4
8−1
.73
7.4
6.96
7.24
7.44
0.26
7.51
7.64
7.74
0.70
39.5
28.5
8.37
1.07
0.36
1.92
3.86
0.35
6.97
−0.6
6−1
.33
7.4
6.86
7.20
7.46
0.22
7.59
7.76
7.90
0.80
39.5
29.0
6.88
−3.3
40.
860.
4212
.06
0.57
4.24
−0.2
2−6
.84
6.7
6.81
6.84
6.86
0.30
6.83
6.85
6.86
0.37
39.5
29.5
7.46
3.52
0.29
2.97
3.19
0.62
8.99
−1.8
1−1
.93
6.7
6.30
6.51
6.68
0.27
6.79
6.91
7.01
0.94
39.5
30.0
6.93
−3.4
60.
680.
9119
.66
0.80
16.5
1−0
.70
−15.
686.
76.
596.
726.
800.
316.
776.
836.
870.
66
40.0
20.0
6.59
2.89
0.61
0.54
3.29
0.57
1.53
−0.2
9−1
.83
6.4
6.40
6.46
6.51
0.26
6.50
6.53
6.55
0.41
40.0
20.5
6.68
3.81
0.48
0.80
2.40
0.59
1.70
−0.4
6−1
.38
6.4
6.35
6.45
6.51
0.25
6.53
6.57
6.60
0.50
40.0
21.0
6.64
−0.2
00.
810.
428.
910.
673.
14−0
.26
−5.9
26.
56.
576.
606.
620.
296.
596.
616.
630.
37
40.0
21.5
6.78
1.69
0.75
0.39
4.45
0.53
1.43
−0.1
9−2
.32
6.7
6.69
6.72
6.75
0.26
6.73
6.75
6.76
0.34
40.0
22.0
7.75
4.30
0.25
2.55
1.28
0.40
2.96
−1.0
1−0
.49
6.8
6.52
6.71
6.88
0.26
6.99
7.11
7.21
0.75
298 PAUL W. BURTON ET AL.
Tabl
eI.
Con
tinu
ed
Lat
.L
ong.
ωµ
λσω
σµ
σλ
σω
µσω
λσµ
λM
max
M50
M10
0M
200
σM
Mp5
0M
p100
Mp2
00σ
Mp
40.0
23.0
7.98
4.85
0.24
2.04
0.79
0.32
1.38
−0.6
5−0
.23
7.1
6.84
7.02
7.17
0.23
7.28
7.38
7.48
0.63
40.0
23.5
8.09
2.47
0.41
1.11
2.34
0.30
2.32
−0.3
3−0
.69
7.4
7.17
7.39
7.56
0.24
7.63
7.74
7.83
0.58
40.0
24.0
8.15
3.81
0.34
1.38
1.55
0.32
1.91
−0.4
3−0
.47
7.4
7.16
7.37
7.53
0.23
7.62
7.73
7.82
0.61
40.0
24.5
7.62
−2.1
50.
720.
517.
250.
393.
17−0
.18
−2.7
97.
47.
397.
487.
530.
287.
507.
557.
580.
42
40.0
26.5
7.77
−8.1
60.
720.
6915
.01
0.42
9.30
−0.2
8−6
.28
7.3
7.38
7.53
7.62
0.31
7.58
7.65
7.70
0.54
40.0
27.0
7.84
−2.6
50.
680.
556.
120.
322.
93−0
.16
−1.9
27.
47.
497.
627.
700.
287.
687.
747.
780.
44
40.0
27.5
7.91
−4.1
80.
650.
7610
.36
0.41
7.07
−0.3
0−4
.22
7.4
7.42
7.60
7.71
0.29
7.69
7.77
7.82
0.56
40.0
28.0
7.87
4.06
0.66
0.72
10.1
40.
416.
50−0
.28
−4.1
37.
47.
437.
597.
690.
297.
677.
747.
790.
54
40.0
28.5
7.73
−0.6
30.
540.
926.
220.
405.
24−0
.36
−2.4
87.
47.
077.
287.
420.
277.
437.
537.
590.
60
40.0
29.0
6.95
0.99
0.65
0.63
6.78
0.60
3.80
−0.3
6−4
.02
6.7
6.71
6.79
6.85
0.28
6.84
6.88
6.90
0.48
40.0
29.5
7.42
3.56
0.31
2.70
3.78
0.69
9.64
−1.8
3−2
.55
6.7
6.40
6.60
6.76
0.29
6.85
6.96
7.05
0.92
40.5
19.5
6.38
3.21
0.65
0.65
7.32
1.20
4.17
−0.7
3−8
.63
6.3
6.25
6.30
6.33
0.28
6.32
6.34
6.36
0.49
40.5
20.0
6.63
3.76
0.55
0.56
1.97
0.51
0.94
−0.2
7−0
.98
6.4
6.41
6.48
6.53
0.24
6.53
6.56
6.58
0.40
40.5
20.5
6.58
3.65
0.60
0.48
2.24
0.55
0.91
−0.2
5−1
.19
6.4
6.42
6.47
6.51
0.25
6.51
6.53
6.55
0.37
40.5
21.0
6.64
1.42
0.78
0.39
5.26
0.59
1.69
−0.2
1−3
.05
6.5
6.56
6.60
6.61
0.27
6.60
6.61
6.63
0.34
40.5
21.5
6.58
0.45
0.90
0.30
5.86
0.56
1.41
−0.1
5−3
.25
6.5
6.56
6.57
6.57
0.25
6.56
6.57
6.57
0.28
40.5
22.0
7.23
1.68
0.49
1.00
4.51
0.48
4.11
−0.4
7−2
.13
6.8
6.65
6.82
6.94
0.26
6.96
7.04
7.09
0.60
40.5
22.5
6.85
−4.7
80.
980.
3212
.55
0.55
3.29
−0.1
6−6
.77
6.8
6.84
6.85
6.85
0.29
6.82
6.84
6.84
0.30
40.5
23.0
7.26
−0.6
90.
710.
496.
330.
442.
69−0
.20
−2.7
17.
17.
067.
147.
190.
287.
167.
207.
220.
41
40.5
23.5
7.81
1.00
0.54
0.73
3.65
0.33
2.36
−0.2
3−1
.19
7.4
7.26
7.43
7.55
0.25
7.56
7.64
7.69
0.50
40.5
24.0
7.62
−2.6
40.
720.
517.
500.
383.
32−0
.18
−2.8
47.
47.
387.
487.
530.
297.
507.
557.
580.
42
40.5
24.5
7.53
−13.
700.
950.
4530
.05
0.59
11.5
6−0
.24
−17.
537.
47.
507.
517.
520.
357.
477.
507.
510.
41
40.5
27.0
8.19
−0.1
70.
461.
254.
970.
355.
72−0
.42
−1.7
07.
47.
147.
427.
630.
287.
697.
837.
930.
69
40.5
27.5
7.96
−2.4
50.
590.
838.
120.
396.
13−0
.32
−3.1
67.
47.
367.
567.
700.
287.
697.
787.
840.
57

EXTREME EARTHQUAKE AND EARTHQUAKE PERCEPTIBILITY STUDY 299
Tabl
eI.
Con
tinu
ed
Lat
.L
ong.
ωµ
λσω
σµ
σλ
σω
µσω
λσµ
λM
max
M50
M10
0M
200
σM
Mp5
0M
p100
Mp2
00σ
Mp
40.5
28.0
7.89
−3.2
10.
630.
759.
040.
406.
09−0
.29
−3.6
07.
47.
407.
577.
680.
287.
677.
757.
800.
54
40.5
28.5
7.71
−1.0
20.
570.
886.
890.
425.
48−0
.35
−2.8
47.
47.
127.
317.
440.
277.
447.
537.
590.
59
40.5
29.0
9.63
0.84
0.28
4.06
4.84
0.38
18.8
4−1
.54
−1.8
37.
86.
967.
437.
820.
308.
078.
358.
581.
14
40.5
29.5
10.9
30.
950.
219.
035.
100.
4244
.95
−3.7
9−2
.13
7.8
6.64
7.21
7.70
0.20
8.09
8.46
8.78
1.49
41.0
19.0
7.35
2.57
0.42
1.20
3.20
0.45
3.53
−0.5
2−1
.40
7.0
6.63
6.81
6.95
0.24
7.00
7.09
7.15
0.63
41.0
19.5
7.59
3.93
0.30
1.70
1.42
0.37
2.20
−0.6
1−0
.50
7.0
6.58
6.77
6.93
0.24
7.02
7.13
7.22
0.65
41.0
20.0
8.02
4.70
0.21
3.07
1.06
0.39
2.98
−1.1
9−0
.40
7.0
6.65
6.84
7.01
0.28
7.13
7.25
7.36
0.76
41.0
20.5
6.51
2.57
0.78
0.40
6.33
0.89
2.10
−0.3
3−5
.55
6.4
6.45
6.48
6.49
0.27
6.48
6.49
6.50
0.35
41.0
21.0
6.58
−0.7
30.
950.
3210
.48
0.75
2.73
−0.2
1−7
.77
6.5
6.57
6.58
6.58
0.28
6.56
6.57
6.57
0.30
41.0
22.0
7.75
0.55
0.47
1.18
5.16
0.41
5.61
−0.4
7−2
.10
7.1
6.91
7.14
7.31
0.26
7.36
7.47
7.55
0.67
41.0
22.5
8.93
1.56
0.32
2.06
2.71
0.28
5.22
−0.5
7−0
.74
7.8
7.10
7.47
7.76
0.25
7.93
8.13
8.29
0.78
41.0
23.0
8.03
−1.0
60.
580.
755.
710.
353.
85−0
.25
−1.9
57.
87.
477.
657.
780.
277.
787.
867.
920.
53
41.0
23.5
8.15
−4.1
40.
680.
597.
400.
313.
81−0
.17
−2.2
97.
87.
757.
907.
990.
297.
968.
038.
080.
46
41.0
24.0
8.27
−2.2
40.
590.
735.
890.
313.
83−0
.21
−1.7
87.
87.
667.
878.
000.
278.
008.
098.
150.
52
41.0
24.5
7.77
−8.6
60.
740.
6817
.68
0.47
10.7
3−0
.30
−8.2
37.
47.
457.
587.
660.
327.
607.
677.
710.
54
41.0
25.5
7.72
3.60
0.21
8.34
5.00
0.99
40.6
4−8
.22
−4.8
96.
66.
006.
246.
440.
006.
606.
756.
881.
40
41.0
26.0
8.71
3.08
0.19
11.0
84.
840.
7652
.37
−8.4
4−3
.65
6.9
6.08
6.40
6.68
0.63
6.91
7.13
7.32
1.64
41.0
26.5
9.97
2.67
0.17
11.2
53.
560.
5038
.96
−5.5
6−1
.74
7.3
6.30
6.70
7.06
0.00
7.38
7.66
7.92
1.17
41.0
27.0
8.46
1.64
0.35
1.67
2.69
0.29
4.16
−0.4
7−0
.76
7.4
6.99
7.31
7.56
0.26
7.69
7.85
7.99
0.72
41.0
27.5
7.96
−2.4
50.
590.
838.
120.
396.
13−0
.32
−3.1
67.
47.
367.
567.
700.
287.
697.
787.
840.
57
41.0
28.0
7.96
−2.4
50.
590.
838.
120.
396.
13−0
.32
−3.1
67.
47.
367.
567.
700.
287.
697.
787.
840.
57
41.0
28.5
7.74
−0.7
70.
550.
936.
540.
415.
54−0
.37
−2.6
67.
47.
097.
307.
440.
277.
457.
547.
600.
60
41.0
29.0
9.65
−1.3
10.
333.
617.
090.
3924
.70
−1.4
0−2
.73
7.8
6.96
7.50
7.94
0.15
8.18
8.48
8.71
1.15
41.5
19.0
7.78
2.68
0.33
2.21
3.52
0.48
7.30
−1.0
5−1
.67
7.0
6.58
6.83
7.03
0.28
7.13
7.27
7.37
0.86

300 PAUL W. BURTON ET AL.
Tabl
eI.
Con
tinu
ed
Lat
.L
ong.
ωµ
λσω
σµ
σλ
σω
µσω
λσµ
λM
max
M50
M10
0M
200
σM
Mp5
0M
p100
Mp2
00σ
Mp
41.5
19.5
7.74
3.33
0.32
2.01
2.40
0.43
4.48
−0.8
5−1
.00
7.0
6.60
6.82
7.00
0.25
7.11
7.23
7.33
0.75
41.5
20.0
8.04
4.18
0.24
2.38
1.12
0.33
2.46
−0.7
7−0
.35
7.0
6.65
6.87
7.05
0.22
7.18
7.32
7.43
0.69
41.5
20.5
6.88
4.27
0.43
0.78
1.38
0.45
0.94
−0.3
4−0
.60
6.6
6.50
6.60
6.67
0.23
6.70
6.74
6.78
0.47
41.5
21.0
6.51
1.00
0.86
0.37
8.47
0.81
2.58
−0.2
7−6
.79
6.4
6.47
6.49
6.50
0.28
6.48
6.49
6.50
0.33
41.5
21.5
6.53
1.76
0.75
0.52
9.60
1.00
4.28
−0.4
8−9
.45
6.4
6.44
6.47
6.50
0.29
6.48
6.50
6.51
0.43
41.5
22.0
7.76
2.35
0.38
1.88
4.53
0.52
8.00
−0.9
7−2
.34
7.1
6.73
6.97
7.15
0.24
7.23
7.35
7.45
0.81
41.5
22.5
9.01
−0.3
50.
372.
416.
090.
3913
.94
−0.9
2−2
.31
7.8
7.13
7.55
7.88
0.26
8.03
8.25
8.42
0.95
41.5
23.0
8.74
−1.2
20.
421.
867.
030.
3912
.37
−0.7
1−2
.70
7.8
7.21
7.59
7.88
0.21
7.99
8.18
8.32
0.86
41.5
23.5
8.13
−8.8
60.
680.
9018
.65
0.47
15.4
5−0
.41
−8.7
17.
87.
577.
787.
910.
317.
877.
968.
030.
65
41.5
24.0
8.26
−4.3
40.
551.
2612
.72
0.47
15.0
2−0
.57
−5.8
97.
87.
337.
637.
830.
277.
847.
988.
070.
76
41.5
27.0
7.92
−3.3
90.
581.
0410
.86
0.46
10.4
8−0
.46
−4.9
27.
37.
207.
447.
600.
267.
607.
707.
770.
67
42.0
19.0
8.08
1.85
0.32
3.20
5.27
0.55
16.1
9−1
.74
−2.8
67.
06.
486.
807.
050.
267.
207.
377.
511.
05
42.0
19.5
7.74
2.66
0.35
1.93
3.37
0.46
6.07
−0.8
7−1
.51
7.0
6.62
6.86
7.05
0.23
7.15
7.27
7.37
0.78
42.0
20.0
7.74
2.66
0.35
1.93
3.37
0.46
6.07
−0.8
7−1
.51
7.0
6.62
6.86
7.05
0.23
7.15
7.27
7.37
0.78
42.0
20.5
7.41
4.63
0.23
3.37
1.65
0.61
5.19
−2.0
4−0
.97
6.6
6.34
6.50
6.63
0.07
6.73
6.83
6.92
0.79
42.0
21.0
6.37
−0.0
50.
870.
5021
.79
1.47
9.35
−0.6
7−3
1.75
6.3
6.34
6.35
6.36
0.34
6.34
6.35
6.36
0.43
42.0
21.5
6.29
−0.3
20.
920.
5032
.32
1.98
13.9
2−0
.90
−63.
626.
26.
276.
286.
280.
356.
276.
286.
280.
44
42.0
22.0
7.50
−1.2
00.
571.
1312
.04
0.65
12.5
6−0
.71
−7.7
57.
16.
947.
127.
250.
307.
257.
337.
390.
73

EXTREME EARTHQUAKE AND EARTHQUAKE PERCEPTIBILITY STUDY 301
4. Application
In order to give a detailed description of zone-free seismic activity, a 2◦×2◦ degreecell with half degree overlap is used to scan smoothly throughout the region. Theminimum extreme sample dataset was never less than six to ensure stability whenthe minimum “chi-square” was found (Equation (7)). Analysis of the 67 shallowseismic zones of course did not include a 2◦×2◦ cell scan but was predetermined bythe zone geometry and shape (Papazachos and Papazachou, 1997; Papaioannou andPapazachos, 2000), otherwise analysis procedures were identical to the zone-freeprocedure and results obtained where data sufficiency permitted it.
The zone-free maximum magnitudes expected over the next 50, 100 and 200years are calculated on the basis of relation (11) and displayed in Figure 4. Earth-quake magnitudes with 90% probability of being a maximum or not being exceededover the same time periods are also estimated, using equation (12), see Figure 5.Full corresponding numerical results are listed in Table I.
On the basis of Equation (8), earthquake perceptibility is also calculated in re-spect to different intensity levels (I = VI, VII and VIII). Then the magnitude of themost perceptible earthquake corresponding to the highest probability (illustrated inFigure 3) is contoured throughout the study region (Figure 6).
5. Discussion and Conclusion
The extreme model should only be used under the assumption that the sampling in-terval is taken in a way so that the occurrence of an extreme magnitude earthquakeis a random independent event and that the distribution of the extremes will repeatitself in the future (Yegulalp and Kuo, 1974). Based on the fitting theory alone,sufficient observational data are needed to produce a reliable and stable result if thesolution exists, that is to ensure the fitting converges. So far as the present fittingis concerned, the number of extreme values can be increased by cutting shorter thetime span interval (such as a half year or a few months) at the risk of introducingmore foreshocks or aftershocks (non-independent observation). However, when thesample time interval is increased, the actual number of extreme observations mustdecrease, which also biases the fitting result. Furthermore, when extreme mag-nitudes are selected from increasingly longer time windows they inevitably tendtowards higher values, so the magnitude range for the fitting will become narrower.The narrow magnitude span can lead to an increase of multi-values at one position(tied values) based on the plotting position relation (4), which can also lower thefitting quality. Therefore, selection of the sample interval plays an important role indetermining the fitting precision. In the present paper, we calculated the parametersby choosing the minimum fitting error from a range of sample intervals.
The parameter ω provides a statistical bound to the largest size of the earth-quakes for each seismic cell or zone. Most of the values are reasonable andacceptable except for the few cases with comparatively high values. These highvalues with large uncertainties, corresponding to little curvature, i.e., low λ, im-

302 PAUL W. BURTON ET AL.
Fig
ure
6.T
hem
ost
perc
eptib
leea
rthq
uake
mag
nitu
deco
rres
pond
ing
toth
epe
akof
the
perc
eptib
ility
curv
esfo
rin
tens
ities
VI
(a),
VII
(b)
and
VII
I(c
)re
spec
tivel
y(a
lso
see
Fig
ure
3an
dE
quat
ion
(8))
.

EXTREME EARTHQUAKE AND EARTHQUAKE PERCEPTIBILITY STUDY 303
Fig
ure
6.C
onti
nued
.

304 PAUL W. BURTON ET AL.
Fig
ure
6.C
onti
nued
.

EXTREME EARTHQUAKE AND EARTHQUAKE PERCEPTIBILITY STUDY 305
ply that the upper value limits should not be regarded as reliable estimates of theupper bounds to magnitude. They are simply the best statistical fit to the presentdata (Burton, 1979, 1990). Yegulalp and Kuo (1974) thought an upper limit largerthan 9.17, a so-called global upper limit, was simply indicative of deficiency inthe data. It is anticipated that with an increase of independent observations, thesehigh values will decrease to a reasonable magnitude. Small upper limit values,however, can simply imply the cell or zone either has low seismogenic potential oran insufficiency of observations.
The largest magnitudes expected over the next 50, 100 and 200 years are estim-ated using Equation (11) and zone-free cell results shown contoured throughoutthe study area in Figure 4. The earthquake magnitudes with 90% probability of notbeing exceeded (p.n.b.e.) over the next 50, 100 and 200 years are also calculated,mapped and contoured, illustrated in Figure 5. This sequence of maps brings outregional differences in seismicity and emphasizes differences in regional potentialfor large magnitude strong earthquake. The 50-year map (Figure 4a) immedi-ately indicates well-known zones of large earthquake potential associated with: theCephallonia Transform Fault of western Greece, a zone northeast of Thessalonikinear the Bulgarian border, high potential near south Rhodes, and extensive zonesin northwest Turkey. When the time interval is incremented through to the next100- and 200-years in Figures 4b–c, the regions of large earthquake potential tendto expand, for example, the high potential near Istanbul and association with thetrend of the North Anatolian Fault becomes clearer in Figure 4c, and the areain north Greece near the Bulgarian border becomes more dominant. Progressionthrough the sequence of maps for 50-, 100- and 200-years at the 90% p.n.b.e. levelin Figures 5a–c develops further trends in earthquake potential as high seismicitycharacteristics of regions move at a decreasing rate (the hazard curves do not pro-gress in equal increments but are curved through the shape parameter λ) towardstheir regional upper-bound magnitude specified statistically as the parameter ω:for instance, high earthquake potential becomes even more closely associated withthe Corinth Gulf and central Greece, and the zone in north Greece now emergesas two adjacent regions prone to large earthquake straddling the Bulgarian-Greek-Macedonian borders. This latter observation is entirely compatible with the p.g.a.seismic hazard analysed separately (Burton et al., 2003).
These forecasts or “predictions” are compatible with the general spatial dis-tribution of seismicity (Figure 1) and with the ones estimated individually forthe seismic activity within the 67 seismic zones outlined by Papazachos and hiscolleagues (zones defined in Figure 7 insets). Analysis of all 67 zones was notrewarded by a full list of parameters, largely because some zones are relativelysmall, lack data, and proved intractable. Figure 7a illustrates the 50-year 90%p.n.b.e. earthquake magnitude for 17 zones (also see Table IIa). These calculationswere made using a completeness magnitude of 5.5M, as standard in this paper.Relaxing this threshold to 5.0M, and the data indicate that this is a reasonablestep whereas 4.5M would not be, produces similar results for a further 32 zones,

306 PAUL W. BURTON ET AL.
49 zones in all (Figure 7b and Table IIb). Comparing the 50-year 90% p.n.b.e.value of M (Mp50 in the tables) for the 17 zones producing results with eitherthreshold reveals: an average shift in Mp50 of −0.02, i.e., → 0.0 and a range ofshifts spanning ±0.30, indeed over 50% show no change in Mp50. The pattern andlevel of forecasts illustrated in Figures 5a and 7b are, like the comparison withseismicity in Figure 1, also compatible.
The most perceptible magnitude can be used as an earthquake selection criterionfor anti-seismic design of noncritical structures (Burton, 1990) because it describestheoretically the earthquake which is most likely to cause a particular level of dam-age and destruction (intensity). On the basis of (8), the earthquake perceptibilitycurves at the different intensity levels VI, VII and VIII were obtained as a functionof magnitude as illustrated generally in Figure 3. The magnitude of the most per-ceptible earthquake identifies that earthquake with highest probability of causingdamage at a specific intensity level in a cell or zone – this magnitude, the mostperceptible magnitude, corresponds to the peak of the probability curve in schem-atic Figure 3c. The most perceptible magnitude is determined cell-by-cell at thethree separate intensity levels VI, VII and VIII, and the contoured results produceFigures 6a–c respectively. First note that perceptibility is deliberately calculated atintensities VI, VII and VIII MSK (EMS) because VI is the threshold of damageand VII is the threshold of damage to reinforced concrete structures (VIII repres-ents the onset of more serious damage). Note also that there is a low-magnitudethreshold or cutoff in the function Pc(I ), hence also in perceptibility Pc(I | M), asillustrated in Figure 3. The cutoff magnitudes, based on the attenuation relation (9)are 4.57 M, 5.27 M and 5.97 M for intensity VI, VII and VIII respectively. This isreasonable because it cannot be expected that a low-magnitude event can normallycause high levels of ground motion and, secondly, because of the form of (9). Theperceptibility curves at higher intensities are systematically shifted towards largerevents and the most perceptible magnitude realistically follows this trend. It shouldalso be noted that there is a high-magnitude cutoff in perceptibility Pc(I | M)
because the form of the function Pe(M) describing seismicity has an upper limitto magnitude (in this case the parameter ω). The shape of the perceptibility curvewith its “most perceptible earthquake” where maximum probability of perceptionexists, emphasizes the fact that it is these earthquakes, rather than the considerablyrarer ones close to a conceptual maximum magnitude of diminishing probability,which are more likely to cause substantial damage.
In the case of a seismic hazard analysis directed at scenario earthquake selectionfor the city of Potenza, Italy final results included: magnitude of the most percept-ible earthquake at intensity VII was about 7.0 M; maximum credible earthquakefrom strain energy analysis was within 7.0-7.5 M with waiting time within circa72–118 years; the statistical upper bound ω was ∼7.7 M (Burton, 2003). Potenza iseffectively equivalent to one cell, albeit in detail, of the current analysis – contouredFigures 4, 5 and perceptibility Figure 6 condense and simplify an enormous amountof seismicity and hazard information. For instance, in Cephallonia in the west

EXTREME EARTHQUAKE AND EARTHQUAKE PERCEPTIBILITY STUDY 307
Figure 7. Zoned analysis. The magnitude expected with a non-exceedance probability of 90%(1 in 10 chance of exceedance) over a time period of 50-years estimated for the 67 zonesoutlined by Papazachos and his colleagues. (a) results for 17 zones (obtained using a mag-nitude threshold of 5.5M as standard in this paper, (b) results for 49 zones (using a magnitudethreshold of 5.0M). There are insufficient data to obtain results for all zones.

308 PAUL W. BURTON ET AL.
Tabl
eII
a.Z
oned
anal
ysis
.Res
ults
(cat
alog
ue19
00–1
999,
M≥
5.5)
for
the
Papa
zach
osan
dco
llea
gues
’zo
nes
show
nin
Fig
ure
7a.ω
,σω
,σµ
,λ,σ
λar
eth
eth
ree
para
met
ers
ofth
eG
umbe
lIII
mod
elan
dth
eco
rres
pond
ing
erro
rsan
dσωµ
,σωλ
and
σµ
λar
eth
eco
rres
pond
ing
cova
rian
ces
ofth
epa
ram
eter
s.M
max
isth
em
axim
umea
rthq
uake
obse
rved
inea
chzo
ne.M
50,M
100,
M20
0,an
dM
p50,
Mp1
00,M
p200
are
the
max
imum
mag
nitu
dean
dth
em
agni
tude
with
90%
prob
abili
tyof
bein
ga
max
imum
(1in
10ch
ance
ofbe
ing
exce
eded
)in
the
next
50,
100
and
200-
year
sre
spec
tivel
y.σ
Man
dσ
Mp
are
the
unce
rtai
ntie
son
thes
em
agni
tude
fore
cast
s.
Lat
.L
ong.
ωµ
λσω
σµ
σλ
σωµ
σωλ
σµ
λM
max
M50
M10
0M
200
σM
Mp5
0M
p100
Mp2
00σ
Mp
38.6
020
.35
7.38
2.33
0.39
1.92
5.30
0.63
9.58
−1.1
9−3
.30
6.7
6.48
6.69
6.86
0.29
6.93
7.03
7.12
0.68
38.2
020
.60
7.70
−2.9
20.
600.
838.
890.
416.
71−0
.33
−3.6
47.
37.
127.
327.
450.
207.
447.
537.
590.
49
37.8
220
.90
7.60
1.28
0.41
1.70
5.04
0.48
8.02
−0.8
0−2
.38
6.9
6.55
6.81
7.00
0.24
7.08
7.21
7.30
0.64
37.6
020
.20
6.68
−10.
870.
950.
5345
.18
0.99
20.9
4−0
.48
−44.
676.
56.
666.
676.
670.
286.
636.
656.
670.
43
35.1
323
.90
6.96
1.75
0.49
1.21
6.75
0.70
7.58
−0.8
2−4
.64
6.5
6.42
6.58
6.69
0.21
6.71
6.78
6.83
0.57
35.1
727
.58
8.42
1.79
0.26
5.65
5.91
0.62
32.4
3−3
.50
−3.6
36.
96.
206.
576.
870.
217.
087.
307.
490.
91
37.6
421
.98
5.86
2.92
0.75
0.71
20.0
92.
9312
.83
−1.9
6−5
8.29
5.8
5.80
5.83
5.84
0.22
5.83
5.84
5.85
0.49
35.7
025
.67
6.22
−3.0
80.
900.
5738
.98
1.64
19.6
9−0
.87
−63.
516.
16.
196.
206.
210.
256.
186.
206.
210.
45
40.6
923
.44
7.33
−14.
990.
860.
6234
.39
0.61
18.8
0−0
.35
−20.
827.
17.
197.
257.
290.
237.
227.
277.
300.
46
39.2
822
.66
7.02
−12.
640.
940.
4831
.61
0.66
12.9
7−0
.29
−20.
716.
86.
987.
007.
010.
276.
966.
997.
000.
39
38.2
522
.30
7.70
0.57
0.45
1.46
5.93
0.47
8.07
−0.6
7−2
.74
7.2
6.75
7.00
7.19
0.23
7.25
7.37
7.46
0.62
38.0
322
.90
6.94
−4.6
50.
700.
8720
.74
0.75
16.6
1−0
.63
−15.
516.
66.
616.
746.
810.
226.
786.
846.
880.
55
37.6
527
.05
7.81
2.22
0.33
2.64
4.52
0.54
11.3
3−1
.40
−2.3
97.
06.
476.
746.
960.
207.
087.
237.
350.
72
37.7
528
.80
8.94
2.56
0.20
9.47
5.04
0.66
46.5
3−6
.24
−3.2
97.
06.
166.
526.
840.
467.
097.
337.
541.
11
39.5
223
.84
6.85
−1.9
20.
710.
8421
.77
1.04
16.7
2−0
.83
−22.
416.
66.
636.
716.
770.
246.
746.
786.
810.
54
40.5
227
.24
7.97
−3.0
40.
580.
918.
550.
397.
14−0
.34
−3.2
97.
47.
287.
517.
660.
207.
667.
767.
830.
52
40.4
529
.00
9.65
−1.3
10.
333.
617.
090.
3924
.70
−1.4
0−2
.73
7.8
6.96
7.50
7.94
0.35
8.18
8.48
8.71
0.85

EXTREME EARTHQUAKE AND EARTHQUAKE PERCEPTIBILITY STUDY 309
Tabl
eII
b.Z
oned
anal
ysis
.R
esul
ts(c
atal
ogue
1900
–199
9,M
≥5.
0)fo
rth
ePa
paza
chos
and
coll
eagu
es’
zone
ssh
own
inF
igur
e7b
.A
naly
sis
and
nota
tion
isid
enti
calt
oTa
ble
IIa
exce
ptfo
rth
elo
wer
mag
nitu
deth
resh
old
used
of5.
0M
inea
chzo
ne.
Lat
.L
ong.
ωµ
λσω
σµ
σλ
σωµ
σωλ
σµ
λM
max
M50
M10
0M
200
σM
Mp5
0M
p100
Mp2
00σ
Mp
42.1
719
.20
8.57
−1.2
50.
352.
705.
710.
3614
.71
−0.9
5−2
.02
7.0
6.38
6.85
7.21
0.28
7.41
7.65
7.85
1.00
41.4
219
.65
6.42
3.10
0.43
1.09
2.79
0.58
2.77
−0.6
1−1
.58
6.1
5.93
6.06
6.15
0.26
6.18
6.24
6.29
0.60
40.5
519
.65
6.58
2.11
0.45
1.10
3.60
0.51
3.60
−0.5
5−1
.81
6.1
5.99
6.15
6.26
0.25
6.30
6.37
6.43
0.61
39.7
020
.17
6.31
4.64
0.18
6.75
2.27
1.46
14.6
0−9
.81
−3.2
35.
75.
535.
625.
710.
295.
785.
845.
901.
1238
.60
20.3
57.
533.
360.
301.
481.
020.
261.
36−0
.38
−0.2
56.
76.
366.
586.
760.
216.
876.
997.
090.
5838
.20
20.6
09.
443.
150.
193.
230.
760.
182.
25−0
.57
−0.1
37.
36.
606.
967.
270.
237.
537.
767.
970.
7137
.82
20.9
07.
972.
970.
272.
191.
490.
293.
01−0
.62
−0.4
26.
96.
396.
666.
880.
207.
037.
207.
330.
7137
.13
21.4
17.
963.
260.
213.
811.
460.
355.
21−1
.31
−0.4
96.
75.
996.
266.
490.
226.
676.
857.
000.
8336
.02
22.5
26.
64−1
.04
0.58
0.90
8.65
0.56
7.13
−0.4
9−4
.82
6.2
6.17
6.33
6.43
0.28
6.43
6.50
6.55
0.61
37.6
020
.20
7.08
2.53
0.40
1.02
1.78
0.31
1.62
−0.3
1−0
.54
6.5
6.31
6.50
6.64
0.25
6.70
6.79
6.86
0.55
36.8
120
.98
7.51
1.85
0.27
5.35
6.03
0.73
31.3
0−3
.89
−4.3
56.
15.
685.
996.
240.
166.
426.
606.
761.
2935
.71
22.0
86.
24−0
.59
0.65
0.83
12.7
40.
869.
63−0
.68
−10.
856.
05.
976.
076.
130.
306.
126.
166.
190.
6035
.13
23.9
06.
982.
440.
440.
791.
560.
281.
08−0
.21
−0.4
26.
56.
356.
526.
640.
246.
686.
766.
820.
4834
.90
25.5
06.
824.
080.
203.
771.
160.
524.
07−1
.96
−0.5
86.
15.
625.
775.
910.
276.
026.
126.
210.
8134
.76
23.6
98.
282.
520.
253.
292.
070.
336.
43−1
.08
−0.6
76.
66.
236.
556.
820.
317.
027.
217.
380.
8934
.46
25.5
17.
314.
040.
194.
111.
150.
454.
33−1
.84
−0.4
96.
35.
836.
016.
180.
206.
316.
436.
540.
8135
.54
27.4
19.
762.
890.
166.
541.
300.
268.
03−1
.69
−0.3
37.
26.
176.
556.
880.
367.
187.
457.
690.
9735
.17
27.5
88.
400.
950.
293.
464.
240.
4113
.99
−1.3
9−1
.70
6.9
6.25
6.65
6.97
0.28
7.17
7.39
7.58
1.06
36.0
529
.17
6.11
−1.5
50.
750.
5612
.41
0.76
6.08
−0.4
0−9
.34
5.9
5.97
6.03
6.06
0.30
6.04
6.07
6.08
0.46
40.9
020
.65
6.51
−0.6
80.
930.
329.
130.
682.
34−0
.19
−6.1
06.
46.
496.
506.
510.
276.
496.
506.
500.
3039
.80
21.0
46.
322.
410.
411.
504.
410.
696.
18−1
.02
−3.0
15.
95.
705.
855.
970.
266.
016.
096.
150.
7437
.64
21.9
85.
863.
040.
730.
362.
970.
720.
86−0
.24
−2.0
75.
85.
805.
825.
840.
255.
835.
845.
850.
3136
.81
23.2
39.
18−1
.44
0.31
4.08
6.72
0.40
26.4
7−1
.60
−2.6
37.
06.
326.
877.
310.
397.
587.
898.
131.
2635
.70
25.6
76.
332.
280.
530.
773.
580.
562.
44−0
.41
−1.9
46.
15.
986.
096.
160.
266.
176.
226.
250.
5136
.11
27.2
46.
26−4
.19
0.77
0.64
18.9
60.
7810
.90
−0.4
7−1
4.73
6.0
6.09
6.16
6.20
0.32
6.17
6.21
6.23
0.52

310 PAUL W. BURTON ET AL.
Tabl
eII
b.C
onti
nued
.
Lat
.L
ong.
ωµ
λσω
σµ
σλ
σωµ
σωλ
σµ
λM
max
M50
M10
0M
200
σM
Mp5
0M
p100
Mp2
00σ
Mp
41.9
125
.30
11.8
02.
200.
1219
.53
2.53
0.37
47.9
6−7
.30
−0.9
37.
15.
846.
316.
740.
007.
167.
527.
861.
25
41.9
422
.80
10.9
71.
760.
195.
241.
560.
207.
76−1
.04
−0.3
07.
86.
697.
207.
660.
378.
048.
408.
710.
95
41.1
522
.15
8.54
−0.5
00.
304.
216.
630.
4626
.95
−1.9
4−3
.04
6.8
6.05
6.52
6.90
0.28
7.13
7.40
7.62
1.24
40.6
923
.44
8.83
0.86
0.29
3.13
3.76
0.34
11.2
0−1
.06
−1.2
77.
16.
556.
977.
310.
227.
537.
777.
960.
98
40.1
122
.52
7.07
1.26
0.42
1.34
4.12
0.44
5.12
−0.5
8−1
.78
6.5
6.20
6.42
6.59
0.23
6.65
6.75
6.84
0.68
39.2
822
.66
7.85
1.54
0.38
1.20
1.90
0.24
2.06
−0.2
8−0
.44
6.8
6.65
6.93
7.14
0.25
7.24
7.38
7.49
0.60
38.7
223
.13
6.20
1.44
0.45
1.90
10.1
71.
0718
.40
−2.0
1−1
0.82
5.8
5.59
5.75
5.87
0.13
5.91
5.99
6.05
0.92
38.3
023
.58
6.26
4.00
0.94
0.34
11.2
00.
563.
10−0
.17
−6.1
56.
16.
246.
256.
250.
286.
236.
246.
250.
31
38.2
221
.48
6.09
4.41
0.22
4.39
2.10
1.23
8.75
−5.3
6−2
.53
5.6
5.41
5.51
5.59
0.27
5.65
5.71
5.77
0.97
38.2
522
.30
8.26
2.95
0.27
2.03
1.18
0.23
2.19
−0.4
7−0
.27
7.2
6.53
6.82
7.07
0.26
7.23
7.40
7.55
0.68
38.0
322
.90
7.10
0.18
0.51
0.98
5.34
0.44
4.74
−0.4
1−2
.29
6.6
6.46
6.65
6.78
0.26
6.81
6.89
6.96
0.61
36.8
527
.10
8.07
1.87
0.25
5.05
4.42
0.54
21.5
7−2
.70
−2.3
56.
75.
916.
256.
540.
306.
756.
967.
141.
20
37.0
828
.30
7.23
1.58
0.33
3.14
5.93
0.65
17.8
3−2
.03
−3.8
26.
25.
866.
146.
360.
256.
496.
646.
761.
07
37.1
029
.45
5.39
3.54
0.51
1.29
9.06
2.46
10.9
0−3
.08
−22.
005.
35.
225.
275.
310.
295.
315.
345.
350.
75
37.6
527
.05
7.81
2.22
0.33
2.64
4.52
0.54
11.3
3−1
.40
−2.3
97.
06.
476.
746.
960.
197.
087.
237.
350.
95
37.7
528
.80
8.04
3.00
0.23
3.10
1.54
0.32
4.47
−0.9
7−0
.47
7.0
6.14
6.43
6.67
0.23
6.85
7.03
7.18
0.80
38.4
026
.00
9.62
0.67
0.22
7.23
4.76
0.43
33.4
1−3
.06
−2.0
07.
06.
056.
566.
990.
257.
337.
657.
931.
37
39.5
223
.84
6.75
−1.7
30.
790.
426.
670.
442.
29−0
.17
−2.8
76.
66.
636.
686.
710.
286.
686.
716.
730.
36
39.2
626
.33
8.32
2.14
0.31
1.67
1.64
0.23
2.51
−0.3
9−0
.37
7.0
6.72
7.03
7.29
0.25
7.43
7.61
7.75
0.67
39.2
727
.80
6.26
−5.8
50.
840.
6027
.92
0.94
14.9
0−0
.53
−26.
186.
16.
166.
216.
230.
356.
196.
226.
240.
51
39.2
929
.30
7.04
−4.4
70.
660.
9518
.81
0.70
16.4
5−0
.64
−13.
066.
76.
626.
786.
870.
316.
856.
926.
960.
67
40.2
624
.60
7.75
−34.
020.
930.
5542
.71
0.40
20.4
4−0
.20
−16.
857.
47.
667.
707.
730.
387.
627.
687.
710.
48
40.5
227
.24
8.87
1.04
0.33
1.67
2.04
0.21
3.14
−0.3
5−0
.42
7.4
6.99
7.38
7.68
0.22
7.85
8.06
8.23
0.68
40.4
529
.00
9.70
−1.6
70.
332.
905.
560.
3115
.40
−0.8
8−1
.68
7.8
7.00
7.56
8.00
0.24
8.24
8.54
8.78
1.01

EXTREME EARTHQUAKE AND EARTHQUAKE PERCEPTIBILITY STUDY 311
intensities VI and VII are most likely to arise from a most perceptible earthquakearound 6.5 M, but this rises near to 7.0 M for intensity VIII to be reached. This con-trasts to the situation in north-east Greece, near the Bulgarian-Greek-Macedonianborder, where the most perceptible earthquake has magnitude 7.5 M at intensityVI, VII and VIII, and the area affected thus characterized grows with increasingintensity level. In the Shields earthquake early warning study area near Athens andthe eastern Corinth Gulf (Burton and Tselentis, 2002), the most perceptible earth-quake has magnitude 6.5 M at intensity VIII inside the early warning shield near toAthens and 6.5–7.0 M further west in the Corinth Gulf – these are the earthquakemagnitudes likely to cause "-“alert signals” of interest to the early warning system.Selection of reference earthquakes should depend on possible event consequencesrather then extreme rarity of an isolated event and Goretti (2003) has extended theperceptibility concept to building collapse, economic loss and building usability(unusability corresponding to homelessness).
Acknowledgements
We thank George Karakaisis and Christos Papaioannou for providing some of thedata and Willy Aspinall for helpful comments. We are also appreciative of C. B.Papazachos and G. F. Karakaisis for their critical review and suggestions whichimproved the paper significantly. Thanks are also extended to another anonymousreviewer for their comments. This publication forms part of the SHIELDS projectwhich is supported by EC contract No. NNE5/1999/381.
References
Burton, P. W.: 1978, Perceptible earthquakes in the United Kingdom, Geophys. J. Roy. Astrom. Soc.54, 475–479.
Burton, P. W.: 1979, Seismic risk in southern Europe through to India examined using Gumbel’s thirddistribution of extreme values, Geophys. J. Roy. Astrom. Soc. 59, 249–280.
Burton, P. W.: 1981. Variation in seismic risk parameters in Britain, Proceedings of the 2nd Inter-national Symposium on the Analysis of Seismicity and on Seismic Hazard, 18–23 May, Liblice,Czechoslovakia, pp. 495–530.
Burton, P. W.: 1990, ‘Pathways’ to Seismic Hazard Evaluation: Extreme and Characteristic Earth-quakes in Areas of Low and High Seismicity, Natural Hazards 3, 275–291.
Burton, P. W.: 2003, Seismic hazard and selection of scenario earthquakes (in the ENSeRVES pro-ject), In: M. Dolce, A. Masi, and M. Marino (eds.) Proceedings of the International Workshop onSeismic Risk and Earthquake Scenarios of Potenza, European Commission XII Science Researchand Development, Edizioni Lamisco della Spes sas, Potenza, Italy, pp. 9–22.
Burton, P. W. and Makropoulos, K. C.: 1985, Seismic Risk of Circum-Pacific Earthquakes: II.Extreme Values Using Gumbel’s Third Distribution and the Relationship with Strain EnergyRelease, Pure Appl. Geophys. 123, 849–869.
Burton, P. W. and Tselentis, G.-A.: 2002, Trans-Aegean seismicity, seismic hazard and defences, In:N. Gorur, G. A. Papadopoulos, and N. Okay (eds.), Integration of Earth Science Research onthe Turkish and Greek 1999 Earthquakes, NATO Science Series, IV: Earth and EnvironmentalSciences, Vol. 9, pp. 175–196.
312 PAUL W. BURTON ET AL.
Burton, P. W., Xu, Y., Tselentis, G.-A., Sokos, E., and Aspinall, W.: 2003, Strong ground accelerationseismic hazard in Greece and neighbouring regions, Soil Dynamics & Earthquake Engng. 23,159–181.
Burton, P. W., Xu, Y., Qin, C., Tselentis, G.-A., and Sokos, E.: A catalogue of seismicity in Greeceand the adjacent areas for the twentieth century, Tectonophysics (in press).
Engdahl, E. R., Hilst, R. V. D., and Buland, R.: 1998, Global teleseismic earthquake relocation withimproved travel time and procedure for depth determination, Bull. Seism. Soc. Amer. 88, 722–743.
Goretti, A.: 2003, The perceptibility in the selection of the reference earthquake. An application to thetown of Potenza, In: M. Dolce, A. Masi, and M. Marino (eds.), Proceedings of the InternationalWorkshop on Seismic Risk and Earthquake Scenarios of Potenza, European Commission XIIScience Research and Development, Edizioni Lamisco della Spes sas, Potenza, Italy, pp. 71–82.
Gringorten, I. I.: 1963, A plotting rule for extreme probability paper, J. Geophys. Res. 68, 813–814.Gumbel, E. J.: 1958, Statistics of Extremes, Columbia University Press, New York and London.Makropoulos, K. C. and Burton, P. W.: 1981, A catalogue of seismicity in Greece and adjacent areas,
Geophys. J. Roy. Astrom. Soc. 65, 741–762.Makropoulos, K. C. and Burton, P. W.: 1985, Seismic hazard in Greece. I. Magnitude recurrence,
Tectonophysics 117, 205–257.Marquardt, D. W.: 1963, An algorithm for least-squares estimation of nonlinear parameters, J. Soc.
Ind. Appl. Math. 11, 431–441.Nordquist, J. N.: 1945. Theory of largest values applied to earthquake magnitude, Eos, Trans. Amer.
Geophys. Union 26, 29–31.Pacheco, J. F. and Sykes, L. R.: 1992, Seismic moment catalog of large shallow earthquakes, 1900
to 1989, Bull. Seism. Soc. Amer. 82, 1,306–1,349.Papaioannou, Ch. A. and Papazachos, B. C.: 2000, Time-independent and time-dependent seismic
hazard in Greece based on seismogenic sources, Bull. Seism. Soc. Amer. 90, 22–33.Papazachos, B. C.: 1990, Seismicity of the Aegean and surrounding area, Tectonophysics 178, 287–
308.Papazachos, B. C., Comninakis, P. E., Karakaisis, G. F., Karakostas, B. G., Papaionnou, Ch. A.,
Papazachos, C. B., and Scordilis, E. M.: 2000, A Catalogue of Earthquakes in Greece andSurrounding Area for the Period 550 BC–1999, Publication of the Geophysical Laboratory,University of Thessaloniki, Greece.
Papazachos, B. C. and Papazachou, C.: 1997, The Earthquakes of Greece, Editions ZITI, Thes-saloniki.
Papazachos, B. C. and Papaioannou, Ch. A.: 1997, The macroseismic field in the Balkan area, J.Seismology 1, 181–201.
Press, W. H., Teukolsky, S. A., Vetterling, W. T., and Flannery, B. P.: 1992, Numerical Recipes inFORTRAN: The Art of Scientific Computing, Cambridge University Press, Cambridge.
Scordilis, E. M., Karakaisis, G. F., Karakostas, B. G., Panagiotopoulos, D. G., Comninakis, P. E.,and Papazachos, B. C.: 1985, Evidence for transform faulting in the Ionian Sea. The Cephaloniaisland earthquake sequence of 1983, Pure Appl. Geophys. 123, 388–397.
Yegulalp, T. M.: 1974, Forecasting for largest earthquakes, Mangmt. Sci. 21, 418–421.Yegulalp, T. M. and Kuo, J. T.: 1974. Statistical prediction of the occurrence of maximum magnitude
earthquakes, Bull. Seism. Soc. Amer. 64, 393–414.