
Diesel or Electric Jeepney? A Case Study of Transport ... - MDPI
17
Article Diesel or Electric Jeepney? A Case Study of Transport Investment in the Philippines Using the Real Options Approach Casper Boongaling Agaton 1,2, * , Charmaine Samala Guno 3 , Resy Ordona Villanueva 4 and Riza Ordona Villanueva 4 1 Copernicus Institute of Sustainable Development, Utrecht University, Princetonlaan 8a, 3584 CB Utrecht, The Netherlands 2 Utrecht University School of Economics, Kriekenpitplein 21, 3584 EC Utrecht, The Netherlands 3 Mindoro State College of Agriculture and Technology, Masipit, Calapan City 5200, Philippines 4 St. Paul University, Manila, 680 Pedro Gil St, Malate, Manila 1004, Philippines * Correspondence: [email protected]; Tel.: +31-30-253-7397 Received: 5 May 2019; Accepted: 20 August 2019; Published: 22 August 2019 Abstract: The Philippines is moving towards a more sustainable public transport system by introducing a public utility vehicle (PUV) modernization program with electric jeepneys (e-jeepneys) and modernized diesel jeepneys. Despite its potential to address problems related to air pollution, traffic congestion, dependence on fuel imports, and carbon emissions, transport groups show resistance to the adoption of the government program due to costs and investment risk issues. This study aims to guide transport operators in making investment decisions between the modernized diesel jeepney and the e-jeepney fleet. Applying the real options approach (ROA), this research evaluates option values and optimal investment strategies under uncertainties in diesel prices, jeepney base fare price, electricity prices, and government subsidy. The optimization results reveal a better opportunity to invest in the e-jeepney fleet in all scenarios analyzed. Results also show a more optimal decision strategy to invest in the e-jeepney immediately in the current business environment, as delaying or postponing investment may incur opportunity losses. To make the adoption of the e-jeepney more attractive to transport operators, this study further suggests government actions to increase the amount of subsidy and base fares, establish public charging stations, and continue efforts to rely on cleaner, cheaper, and renewable sources of electricity. Keywords: electric vehicle; jeepney; Monte Carlo simulation; optimization; investment under uncertainty; real options 1. Introduction In order to address the global problems of greenhouse gas (GHG) emissions, air pollution, and dependence on fossil fuels, different countries and regions are finding cleaner and more sustainable modes of transportation. Currently, the transport sector accounts for 23% of global energy-related CO 2 emissions and is continuously growing due to increasing passenger and freight activity [1]. As aviation, shipping, and heavy-duty roads are the most difficult modes to decarbonize, the electrification of passenger cars and public utility vehicles (PUVs) appears to have the potential to reduce GHG emissions and other pollutants [2,3]. Developed countries put considerable effort into making electric mobility more attractive by providing fiscal incentives, subsidy schemes, and public charging infrastructure. This resulted in a record 1.1 million electric vehicles (EVs) sold worldwide in 2017, which is expected to increase to 11 million in 2025 and surge to 30 million in 2030 [4]. Meanwhile, developing countries adopt World Electric Vehicle Journal 2019, 10, 51; doi:10.3390/wevj10030051 www.mdpi.com/journal/wevj
-
Upload
khangminh22 -
Category
Documents
-
view
2 -
download
0
Transcript of Diesel or Electric Jeepney? A Case Study of Transport ... - MDPI
Article
Diesel or Electric Jeepney? A Case Study of TransportInvestment in the Philippines Using the RealOptions Approach
Casper Boongaling Agaton 1,2,* , Charmaine Samala Guno 3 , Resy Ordona Villanueva 4
and Riza Ordona Villanueva 4
1 Copernicus Institute of Sustainable Development, Utrecht University, Princetonlaan 8a, 3584 CB Utrecht,The Netherlands
2 Utrecht University School of Economics, Kriekenpitplein 21, 3584 EC Utrecht, The Netherlands3 Mindoro State College of Agriculture and Technology, Masipit, Calapan City 5200, Philippines4 St. Paul University, Manila, 680 Pedro Gil St, Malate, Manila 1004, Philippines* Correspondence: [email protected]; Tel.: +31-30-253-7397
Received: 5 May 2019; Accepted: 20 August 2019; Published: 22 August 2019�����������������
Abstract: The Philippines is moving towards a more sustainable public transport system byintroducing a public utility vehicle (PUV) modernization program with electric jeepneys (e-jeepneys)and modernized diesel jeepneys. Despite its potential to address problems related to air pollution,traffic congestion, dependence on fuel imports, and carbon emissions, transport groups showresistance to the adoption of the government program due to costs and investment risk issues.This study aims to guide transport operators in making investment decisions between the modernizeddiesel jeepney and the e-jeepney fleet. Applying the real options approach (ROA), this researchevaluates option values and optimal investment strategies under uncertainties in diesel prices, jeepneybase fare price, electricity prices, and government subsidy. The optimization results reveal a betteropportunity to invest in the e-jeepney fleet in all scenarios analyzed. Results also show a moreoptimal decision strategy to invest in the e-jeepney immediately in the current business environment,as delaying or postponing investment may incur opportunity losses. To make the adoption of thee-jeepney more attractive to transport operators, this study further suggests government actions toincrease the amount of subsidy and base fares, establish public charging stations, and continue effortsto rely on cleaner, cheaper, and renewable sources of electricity.
Keywords: electric vehicle; jeepney; Monte Carlo simulation; optimization; investment under uncertainty;real options
1. Introduction
In order to address the global problems of greenhouse gas (GHG) emissions, air pollution,and dependence on fossil fuels, different countries and regions are finding cleaner and more sustainablemodes of transportation. Currently, the transport sector accounts for 23% of global energy-related CO2
emissions and is continuously growing due to increasing passenger and freight activity [1]. As aviation,shipping, and heavy-duty roads are the most difficult modes to decarbonize, the electrification ofpassenger cars and public utility vehicles (PUVs) appears to have the potential to reduce GHG emissionsand other pollutants [2,3]. Developed countries put considerable effort into making electric mobilitymore attractive by providing fiscal incentives, subsidy schemes, and public charging infrastructure.This resulted in a record 1.1 million electric vehicles (EVs) sold worldwide in 2017, which is expected toincrease to 11 million in 2025 and surge to 30 million in 2030 [4]. Meanwhile, developing countries adopt
World Electric Vehicle Journal 2019, 10, 51; doi:10.3390/wevj10030051 www.mdpi.com/journal/wevj
World Electric Vehicle Journal 2019, 10, 51 2 of 17
electric mobility that suits the local circumstances such as electric scooters in India, electric “tuk-tuks”in Thailand and Kenya, second-hand electric cars in Jordan, and e-jeepneys in the Philippines.
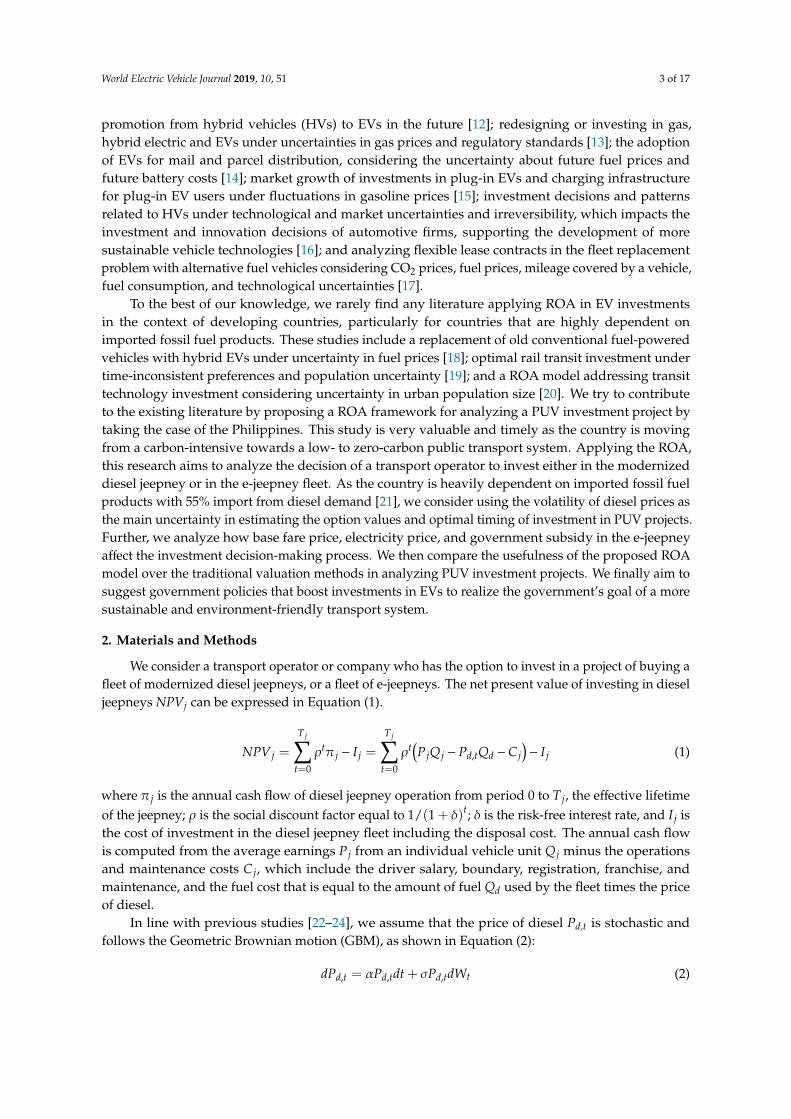
Jeepneys, refurbished American vehicles left after the Second World War, are the Philippines’ mostpopular mode of transportation, providing cheaper rides and allowing millions of passengers to hopon and off anywhere. There are around 270,000 franchised jeepney units on the road across the country,with some 75,000 units in Metro Manila alone. With the country’s fast development and economicgrowth, old-model jeepneys have become the main contributor to air pollution and traffic congestion inthe cities. According to the Manila Aerosol Characterization Experiment (MACE 2015) study, jeepneys,which account for 20% of the total vehicle fleet, are responsible for 94% of the soot particle massin Metro Manila, with 2000 times higher emissions compared to the EURO 6 standard for diesel inEurope [5]. To address this problem, the government recently launched the “Public Utility Vehicle(PUV) Modernization Program”, which aims to make the country’s public transportation systemefficient and environment-friendly by phasing out jeepneys, buses, and other PUVs that are at least15 years old and replacing them with safer, more comfortable and more sustainable alternatives [6].Replacement PUVs, such as e-jeepneys and modernized diesel jeepneys, are required to have at leasta Euro 4-compliant engine or an electric engine and must contain safety features like speed limiters,accessibility features like ramps and seatbelts, closed-circuit television cameras, Wi-fi and USB ports,GPS, and a dashboard camera (see Figure 1) [7]. Currently, the government provides a 5% subsidy toevery e-jeepney unit, which costs between USD 64.19 M and USD 73.36 M/unit, payable within 7 yearsat a 6% interest rate. This e-jeepney investment cost is three times the average price of a brand newmodernized diesel jeepney, which only costs USD 18.34 M to USD 27.51 M/unit. Regardless of thepotential to solve traffic conditions and air pollution, provide new jobs, enhance the tourism industry,and streamline public transport, the modernization program has faced numerous protests from driversand operator organizations due to financing issues. This gives an impetus to conduct a study thatanalyzes the economic viability of adopting the modernized PUV and suggests investment strategiesmaking the e-jeepney more attractive than the diesel jeepney.
World Electric Vehicle Journal 2019, 10, x FOR PEER REVIEW 2 of 17
in 2017, which is expected to increase to 11 million in 2025 and surge to 30 million in 2030 [4]. Meanwhile, developing countries adopt electric mobility that suits the local circumstances such as electric scooters in India, electric “tuk-tuks” in Thailand and Kenya, second-hand electric cars in Jordan, and e-jeepneys in the Philippines.
Jeepneys, refurbished American vehicles left after the Second World War, are the Philippines’ most popular mode of transportation, providing cheaper rides and allowing millions of passengers to hop on and off anywhere. There are around 270,000 franchised jeepney units on the road across the country, with some 75,000 units in Metro Manila alone. With the country’s fast development and economic growth, old-model jeepneys have become the main contributor to air pollution and traffic congestion in the cities. According to the Manila Aerosol Characterization Experiment (MACE 2015) study, jeepneys, which account for 20% of the total vehicle fleet, are responsible for 94% of the soot particle mass in Metro Manila, with 2000 times higher emissions compared to the EURO 6 standard for diesel in Europe [5]. To address this problem, the government recently launched the “Public Utility Vehicle (PUV) Modernization Program”, which aims to make the country’s public transportation system efficient and environment-friendly by phasing out jeepneys, buses, and other PUVs that are at least 15 years old and replacing them with safer, more comfortable and more sustainable alternatives [6]. Replacement PUVs, such as e-jeepneys and modernized diesel jeepneys, are required to have at least a Euro 4-compliant engine or an electric engine and must contain safety features like speed limiters, accessibility features like ramps and seatbelts, closed-circuit television cameras, Wi-fi and USB ports, GPS, and a dashboard camera (see Figure 1) [7]. Currently, the government provides a 5% subsidy to every e-jeepney unit, which costs between USD 64.19 M and USD 73.36 M/unit, payable within 7 years at a 6% interest rate. This e-jeepney investment cost is three times the average price of a brand new modernized diesel jeepney, which only costs USD 18.34 M to USD 27.51 M/unit. Regardless of the potential to solve traffic conditions and air pollution, provide new jobs, enhance the tourism industry, and streamline public transport, the modernization program has faced numerous protests from drivers and operator organizations due to financing issues. This gives an impetus to conduct a study that analyzes the economic viability of adopting the modernized PUV and suggests investment strategies making the e-jeepney more attractive than the diesel jeepney.
(a) (b) (c)
Figure 1. Most common public utility vehicles in the Philippines: (a) traditional diesel jeepney; (b) modernized diesel jeepney with Euro 4-compliant engine; (c) air-conditioned e-jeepney. Source: Land Transportation Franchising and Regulatory Board (LTFRB).
Traditional valuation methods for transportation investment projects in the Philippines include return on investment (ROI), payback period, net present value (NPV), internal rate of return (IRR), and cost-benefit analysis (CBA) [8–10]. However, these methods do not account for possible uncertainties that affect investment decisions such as fuel prices, demand and prices of products, fare prices, government policies, and technological advancement. The real options approach (ROA) overcomes these limitations by combining uncertainty and risk with flexibility in making investment decisions, as potential factors that give additional value to the project [11]. Several literature works analyze investment decisions, particularly for electric vehicles, using this approach. Among these studies include a choice between hybrid vehicles and EVs, while considering the option to change
Figure 1. Most common public utility vehicles in the Philippines: (a) traditional diesel jeepney;(b) modernized diesel jeepney with Euro 4-compliant engine; (c) air-conditioned e-jeepney. Source:Land Transportation Franchising and Regulatory Board (LTFRB).
Traditional valuation methods for transportation investment projects in the Philippines includereturn on investment (ROI), payback period, net present value (NPV), internal rate of return (IRR),and cost-benefit analysis (CBA) [8–10]. However, these methods do not account for possibleuncertainties that affect investment decisions such as fuel prices, demand and prices of products,fare prices, government policies, and technological advancement. The real options approach (ROA)overcomes these limitations by combining uncertainty and risk with flexibility in making investmentdecisions, as potential factors that give additional value to the project [11]. Several literature worksanalyze investment decisions, particularly for electric vehicles, using this approach. Among thesestudies include a choice between hybrid vehicles and EVs, while considering the option to change
World Electric Vehicle Journal 2019, 10, 51 3 of 17
promotion from hybrid vehicles (HVs) to EVs in the future [12]; redesigning or investing in gas,hybrid electric and EVs under uncertainties in gas prices and regulatory standards [13]; the adoptionof EVs for mail and parcel distribution, considering the uncertainty about future fuel prices andfuture battery costs [14]; market growth of investments in plug-in EVs and charging infrastructurefor plug-in EV users under fluctuations in gasoline prices [15]; investment decisions and patternsrelated to HVs under technological and market uncertainties and irreversibility, which impacts theinvestment and innovation decisions of automotive firms, supporting the development of moresustainable vehicle technologies [16]; and analyzing flexible lease contracts in the fleet replacementproblem with alternative fuel vehicles considering CO2 prices, fuel prices, mileage covered by a vehicle,fuel consumption, and technological uncertainties [17].
To the best of our knowledge, we rarely find any literature applying ROA in EV investmentsin the context of developing countries, particularly for countries that are highly dependent onimported fossil fuel products. These studies include a replacement of old conventional fuel-poweredvehicles with hybrid EVs under uncertainty in fuel prices [18]; optimal rail transit investment undertime-inconsistent preferences and population uncertainty [19]; and a ROA model addressing transittechnology investment considering uncertainty in urban population size [20]. We try to contributeto the existing literature by proposing a ROA framework for analyzing a PUV investment project bytaking the case of the Philippines. This study is very valuable and timely as the country is movingfrom a carbon-intensive towards a low- to zero-carbon public transport system. Applying the ROA,this research aims to analyze the decision of a transport operator to invest either in the modernizeddiesel jeepney or in the e-jeepney fleet. As the country is heavily dependent on imported fossil fuelproducts with 55% import from diesel demand [21], we consider using the volatility of diesel prices asthe main uncertainty in estimating the option values and optimal timing of investment in PUV projects.Further, we analyze how base fare price, electricity price, and government subsidy in the e-jeepneyaffect the investment decision-making process. We then compare the usefulness of the proposed ROAmodel over the traditional valuation methods in analyzing PUV investment projects. We finally aim tosuggest government policies that boost investments in EVs to realize the government’s goal of a moresustainable and environment-friendly transport system.
2. Materials and Methods
We consider a transport operator or company who has the option to invest in a project of buying afleet of modernized diesel jeepneys, or a fleet of e-jeepneys. The net present value of investing in dieseljeepneys NPVj can be expressed in Equation (1).
NPV j =
T j∑t=0
ρtπ j − I j =
T j∑t=0
ρt(P jQ j − Pd,tQd −C j
)− I j (1)
where π j is the annual cash flow of diesel jeepney operation from period 0 to T j, the effective lifetimeof the jeepney; ρ is the social discount factor equal to 1/(1 + δ)t; δ is the risk-free interest rate, and I j isthe cost of investment in the diesel jeepney fleet including the disposal cost. The annual cash flowis computed from the average earnings P j from an individual vehicle unit Q j minus the operationsand maintenance costs C j, which include the driver salary, boundary, registration, franchise, andmaintenance, and the fuel cost that is equal to the amount of fuel Qd used by the fleet times the priceof diesel.
In line with previous studies [22–24], we assume that the price of diesel Pd,t is stochastic andfollows the Geometric Brownian motion (GBM), as shown in Equation (2):
dPd,t = αPd,tdt + σPd,tdWt (2)
World Electric Vehicle Journal 2019, 10, 51 4 of 17
where Wt is a Wiener process, and the percentage drift, α, and the percentage volatility, σ, are constant.We apply Ito’s formula to solve Equation (2) and obtain:
lnPd,t
Pd,0=
(α−
σ2
2
)t + σWt (3)
Using Equation (3), we apply the Augmented Dickey–Fuller (ADF) unit root test to determine thedrift and variance of diesel prices, as shown in regression Equation (4):
lnPd,t
Pd,0= g(1) + g(2)lnPd,0 +
L∑j=1
λ j∆lnPd,t− j + εt (4)
where g(1) =(α− σ2
2
)t, g(2) is a coefficient estimated in the unit root test, λ j is a coefficient for L
number of lags for ∆lnPd,t = lnPd,t − lnPd,0, and εt = σWt. From the ADF test result, we estimate thefuture diesel prices, as shown in Equation (5):
Pd,t+1 = Pd,t + αPd,t + σPd,tεt (5)
where α and σ are the drift and variance parameters representing the mean and volatility of the priceprocess, and εt ∼ N(0, 1), a random number.
On the other hand, the net present value of investing in e-jeepneys NPVej is expressed in Equation (6):
NPVej =
Tej∑t=0
ρtπej + s− Iej =
Tej∑t=0
ρt(PejQej − PeQe −Cej
)+ s− Iej (6)
where πej is the annual cash flow of e-jeepney operation from period 0 to Tej; s is the governmentsubsidy for jeepney modernization; and Iej =
∑ρtI(1 + i) +Dej is the e-jeepney investment cost, which
can be loaned at i interest rate with I monthly amortization up to a certain number of years and incur adisposal cost at the end of its lifetime Tej. The annual cash flow is calculated from the average annualearnings Pej of each e-jeepney Qej minus the cost of electricity Pe consumed by the fleet Qe and theoperations and maintenance cost Cej, as described in Equation (1).
The investor’s problem is to maximize the value of the investment subject to stochastic prices ofdiesel fuel, as shown in Equation (4):
max{NPVej, E
[NPV j
]∣∣∣∣Pd,t}
(7)
where the expected NPV of diesel jeepney E[NPV j
]≈
1M
M∑m=1
NPV j,m is calculated using Monte
Carlo simulations at a sufficiently large number of times M, subject to stochastic prices of diesel.From Equation (7), investment option values at each initial price of diesel V
(Pd,t
)are solved using the
optimization, as shown in Equation (8):
V(Pd,t
)= max
{NPVej, E
[NPV j
]∣∣∣∣Pd,t}
(8)
We describe the optimal timing of investment in e-jeepneys P∗d as the minimum price of diesel fuel,where the maximized option value VPd,t at the initial diesel price t is equal to the maximized optionvalue VPd,t+1 at the initial diesel price t + 1, as shown in Equation (9):
P∗d = min{Pd,t
∣∣∣∣VPd,t
(Pd,t
)= VPd,t+1
(Pd,t
)}(9)
World Electric Vehicle Journal 2019, 10, 51 5 of 17
Comparing P∗d with the current price of diesel yields various strategies, as described in Equation (10),
where no investment should be made if V(P∗d
)< 0; otherwise, invest in:
e− jeepney, i fdiesel− f ueled jeepney
indi f f erent, i f, i f
Pcurd > P∗d
Pcurd < P∗d
Pcurd = P∗d
(10)
To estimate the real option values, we create a dynamic optimization program using Matlabdivided into four segments. The first segment estimates the stochastic prices of diesel fuel andfollows GBM using Equation (5). In the second segment, we incorporate these prices into the NPV j inEquation (1). The third segment includes the Monte Carlo simulation to calculate the expected NPV ofthe diesel jeepney E
[NPV j
]. The last segment is the dynamic optimization to calculate the maximized
value of either investing in the e-jeepney or in the diesel jeepney, at each initial price of diesel. We plotall estimated values of NPVs and optimization results using Excel, as shown in the following section.
We finally compare the ROA estimations with traditional valuation methods including the NPV,payback period (PBP), returns on investment (ROI), and internal rate of return (IRR), using Equations (1),(6), and (11–13) as shown below. The PBP refers to the amount of time it takes to recover the cost of aninvestment. This is equal to the cost of the investment divided by the annual net cash flow, as describedin Equation (11):
PBP =investment cost
annual net cash f low(11)
The ROI is the benefit to an investor resulting from an investment and is described usingEquation (12):
ROI =net income− expenses
total investment× 100 (12)
The IRR is the discount rate that makes the NPV equal to zero, as shown in Equation (13).We calculate the IRR using MS Excel Solver.
IRR = NPV =T∑
t=1
annual net cash f low
(1 + IRR)t − I = 0 (13)
In this research, we use data from various government agencies to estimate the parameters forthe optimization problem. Investment data, including the costs, fare prices, electricity price, subsidyschemes, operations and maintenance cost, proposed driver salary, franchising, diesel consumptionfor a jeepney, and electricity consumption for an e-jeepney, are estimated using the data from thePhilippines’ Department of Transportation (DoTr), Land Transportation Franchising and RegulatoryBoard (LTFRB), and Department of Energy (DOE). 26-period average annual price data from WorldBank -development indicators are used to run the Augmented Dickey–Fuller unit root test for thestochastic process of diesel (see Supplementary Material Table S2). The test result confirms that Pd,tfollows GBM with α = 0.01143 and σ = 0.02608. These parameters are then used to generate stochasticprices of diesel, as described in Equation (2). The optimization results are tested for sensitivity analysiswith respect to fare prices, electricity prices, and government subsidy. Six jeepney fares are analyzed:USD 21.81c (PHP 10) current base fare; a proposed higher fare, USD 26.17c (PHP 2 addition); and somereductions in fare prices, USD 17.45c (reduced by PHP 2), USD 15.27c (by PHP 3), USD 13.09c (byPHP 4), and USD 10.91c (by PHP 5). For the electricity price scenario, the current USD 22.20c (PHP10.18/kWh) electricity rate is adjusted to a possible PHP2 decline in prices to USD 17.45c/kWh, andPHP3 and PHP5 increases to USD 28.35c/kWh and USD 32.72/kWh. Finally, proposed 10% and 0%subsidies are analyzed along with the current government subsidy of 5% of the investment. All dataand variables, including the description and estimation, are summarized as shown in SupplementaryMaterial Table S1.
World Electric Vehicle Journal 2019, 10, 51 6 of 17
3. Results
3.1. Traditional Valuation Methods
Table 1 summarizes the financial estimation results for PUV modernization projects using thetraditional valuation methods. The results show that NPVs for both the e-jeepney and the modernizeddiesel jeepney projects are positive, which indicates positive returns for investing in any of thealternatives. Despite the high investment cost for each e-jeepney unit, results reveal a better investmentopportunity for the e-jeepney fleet, with USD 4.892 million NPV rather than USD 3.138 million forthe modernized diesel jeepney fleet. The main reasons for this include the more energy efficiente-jeepney, higher earnings from the larger seating capacity of the e-jeepney, and the high fuel cost forthe traditional jeepney. This result supports previous claims that investing in electric PUVs is moreprofitable than combustion vehicles in the Philippines due to higher passenger capacity, lower fuelconsumption, and safer body design [8,9].
Table 1. Financial estimation results using traditional valuation methods.
Valuation Method E-Jeepney Modernized Diesel Jeepney
Net present value (NPV) (USD) 4.892 million 3.138 million
Payback period (PBP) (years) 4.09 3.28
Return on investment (ROI) (30 years) 373% 490%
Internal rate of return (IRR) 32.36 43.89
On the other hand, other traditional valuation methods favor investment in the diesel jeepneyfleet with shorter PBP, higher ROI, and higher IRR. The PBP estimation shows that an investment in themodernized diesel jeepney fleet can be recovered in 3.28 years, while it is 4.09 years for the e-jeepneyfleet. Over the 30-year lifetime of jeepney operation, the diesel project returns the investment by 5 timeswhile it is quadruple for the e-jeepney project. These results are due to higher investment costs forthe e-jeepney, which are triple the cost for the diesel jeepney. Further, the IRRs for both projects arealso higher than the hurdle rate of 15% set by the Philippine government [25], which implies that bothprojects are profitable.
While the traditional financial tools are already practical methods for PUV project valuation,these all-or-nothing strategies, outsetting all future outcomes as fixed, pose several potential problems.These include a constant nature of weighted average cost of capital through time, undervaluing theinvestment, the estimation of economic life, which forecasts errors in creating the future cash flows,and insufficient tests for the plausibility of the final results [26]. In a stochastic world, there wouldbe fluctuations in business conditions that would change the value of the project [26]. Meanwhile,ROA can mitigate some of these problematic areas by combining risks and uncertainties in the futurecash flow, with managerial flexibility in making investment decisions that give additional value to theproject [11].
3.2. Baseline Scenario
The baseline scenario in Figure 2 describes different investment values under the business as usualenvironment. This figure compares the NPVs for the e-jeepney (green curve) and the diesel jeepney(yellow curve), expected net present value (ENPV) for the diesel jeepney (blue curve), considering thevolatility of diesel fuel prices, and the maximized option values (dotted black curve) for the investmentproject at different initial prices of diesel. Initial results show a higher NPV for the e-jeepney, indicatinga more profitable project than the diesel jeepney. This result supports the NPV results from the previoussubsection, showing a better investment project for the e-jeepney.
World Electric Vehicle Journal 2019, 10, 51 7 of 17
World Electric Vehicle Journal 2019, 10, x FOR PEER REVIEW 6 of 17
Table 1. Financial estimation results using traditional valuation methods.
Valuation method E-jeepney Modernized diesel jeepney Net present value (NPV) (USD) 4.892 million 3.138 million
Payback period (PBP) (years) 4.09 3.28 Return on investment (ROI) (30 years) 373% 490%
Internal rate of return (IRR) 32.36 43.89
On the other hand, other traditional valuation methods favor investment in the diesel jeepney fleet with shorter PBP, higher ROI, and higher IRR. The PBP estimation shows that an investment in the modernized diesel jeepney fleet can be recovered in 3.28 years, while it is 4.09 years for the e-jeepney fleet. Over the 30-year lifetime of jeepney operation, the diesel project returns the investment by 5 times while it is quadruple for the e-jeepney project. These results are due to higher investment costs for the e-jeepney, which are triple the cost for the diesel jeepney. Further, the IRRs for both projects are also higher than the hurdle rate of 15% set by the Philippine government [25], which implies that both projects are profitable.
While the traditional financial tools are already practical methods for PUV project valuation, these all-or-nothing strategies, outsetting all future outcomes as fixed, pose several potential problems. These include a constant nature of weighted average cost of capital through time, undervaluing the investment, the estimation of economic life, which forecasts errors in creating the future cash flows, and insufficient tests for the plausibility of the final results [26]. In a stochastic world, there would be fluctuations in business conditions that would change the value of the project [26]. Meanwhile, ROA can mitigate some of these problematic areas by combining risks and uncertainties in the future cash flow, with managerial flexibility in making investment decisions that give additional value to the project [11].
3.2. Baseline Scenario
The baseline scenario in Figure 2 describes different investment values under the business as usual environment. This figure compares the NPVs for the e-jeepney (green curve) and the diesel jeepney (yellow curve), expected net present value (ENPV) for the diesel jeepney (blue curve), considering the volatility of diesel fuel prices, and the maximized option values (dotted black curve) for the investment project at different initial prices of diesel. Initial results show a higher NPV for the e-jeepney, indicating a more profitable project than the diesel jeepney. This result supports the NPV results from the previous subsection, showing a better investment project for the e-jeepney.
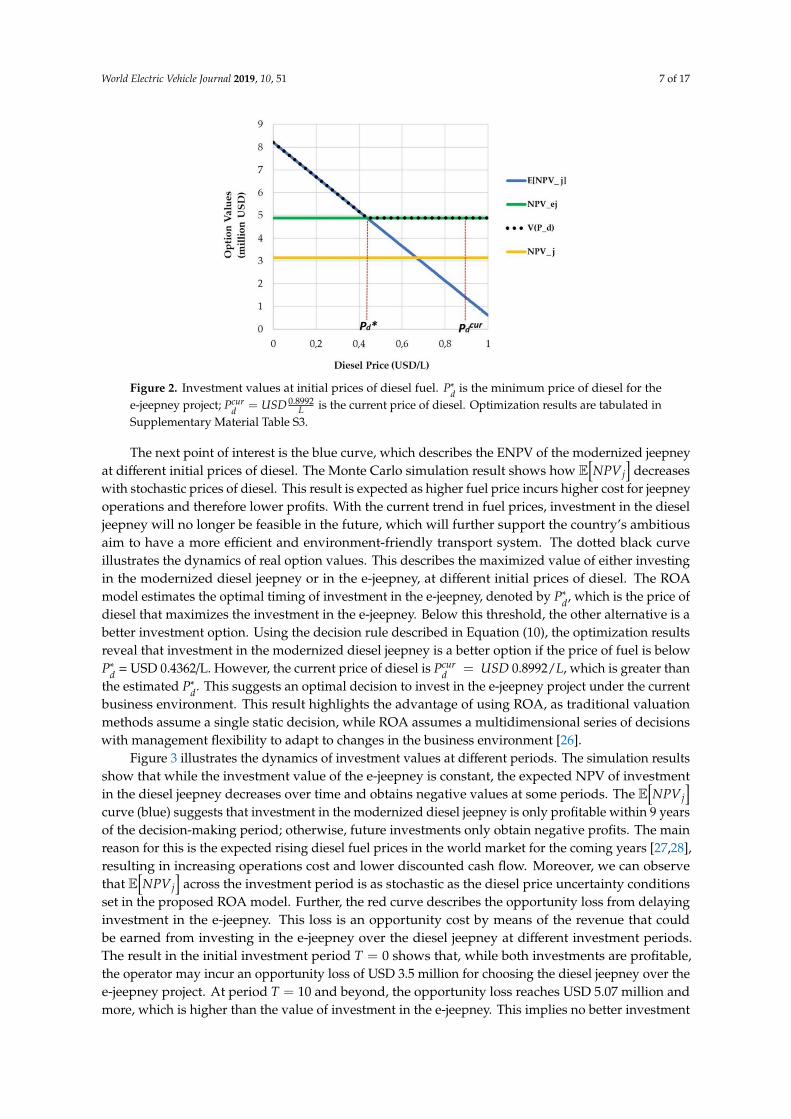
Figure 2. Investment values at initial prices of diesel fuel. 𝑃∗ is the minimum price of diesel for the e-jeepney project; 𝑃 = 𝑈𝑆𝐷 . is the current price of diesel. Optimization results are tabulated in Supplementary Material Table S3.
Figure 2. Investment values at initial prices of diesel fuel. P∗d is the minimum price of diesel for thee-jeepney project; Pcur
d = USD 0.8992L is the current price of diesel. Optimization results are tabulated in
Supplementary Material Table S3.
The next point of interest is the blue curve, which describes the ENPV of the modernized jeepneyat different initial prices of diesel. The Monte Carlo simulation result shows how E
[NPV j
]decreases
with stochastic prices of diesel. This result is expected as higher fuel price incurs higher cost for jeepneyoperations and therefore lower profits. With the current trend in fuel prices, investment in the dieseljeepney will no longer be feasible in the future, which will further support the country’s ambitiousaim to have a more efficient and environment-friendly transport system. The dotted black curveillustrates the dynamics of real option values. This describes the maximized value of either investingin the modernized diesel jeepney or in the e-jeepney, at different initial prices of diesel. The ROAmodel estimates the optimal timing of investment in the e-jeepney, denoted by P∗d, which is the price ofdiesel that maximizes the investment in the e-jeepney. Below this threshold, the other alternative is abetter investment option. Using the decision rule described in Equation (10), the optimization resultsreveal that investment in the modernized diesel jeepney is a better option if the price of fuel is belowP∗d = USD 0.4362/L. However, the current price of diesel is Pcur
d = USD 0.8992/L, which is greater thanthe estimated P∗d. This suggests an optimal decision to invest in the e-jeepney project under the currentbusiness environment. This result highlights the advantage of using ROA, as traditional valuationmethods assume a single static decision, while ROA assumes a multidimensional series of decisionswith management flexibility to adapt to changes in the business environment [26].
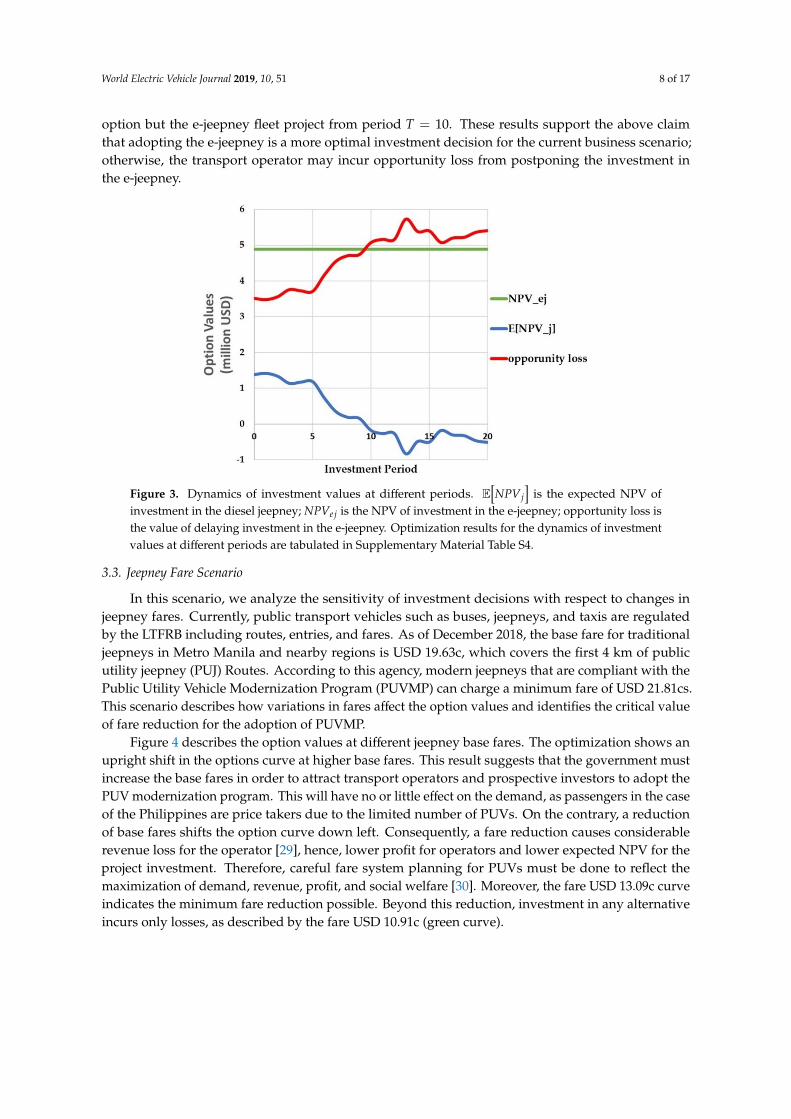
Figure 3 illustrates the dynamics of investment values at different periods. The simulation resultsshow that while the investment value of the e-jeepney is constant, the expected NPV of investmentin the diesel jeepney decreases over time and obtains negative values at some periods. The E
[NPV j
]curve (blue) suggests that investment in the modernized diesel jeepney is only profitable within 9 yearsof the decision-making period; otherwise, future investments only obtain negative profits. The mainreason for this is the expected rising diesel fuel prices in the world market for the coming years [27,28],resulting in increasing operations cost and lower discounted cash flow. Moreover, we can observethat E
[NPV j
]across the investment period is as stochastic as the diesel price uncertainty conditions
set in the proposed ROA model. Further, the red curve describes the opportunity loss from delayinginvestment in the e-jeepney. This loss is an opportunity cost by means of the revenue that couldbe earned from investing in the e-jeepney over the diesel jeepney at different investment periods.The result in the initial investment period T = 0 shows that, while both investments are profitable,the operator may incur an opportunity loss of USD 3.5 million for choosing the diesel jeepney over thee-jeepney project. At period T = 10 and beyond, the opportunity loss reaches USD 5.07 million andmore, which is higher than the value of investment in the e-jeepney. This implies no better investment
World Electric Vehicle Journal 2019, 10, 51 8 of 17
option but the e-jeepney fleet project from period T = 10. These results support the above claimthat adopting the e-jeepney is a more optimal investment decision for the current business scenario;otherwise, the transport operator may incur opportunity loss from postponing the investment inthe e-jeepney.World Electric Vehicle Journal 2019, 10, x FOR PEER REVIEW 8 of 17
Figure 3. Dynamics of investment values at different periods. 𝔼 𝑁𝑃𝑉 is the expected NPV of investment in the diesel jeepney; 𝑁𝑃𝑉 is the NPV of investment in the e-jeepney; opportunity loss is the value of delaying investment in the e-jeepney. Optimization results for the dynamics of investment values at different periods are tabulated in Supplementary Material Table S4.
3.3. Jeepney Fare Scenario
In this scenario, we analyze the sensitivity of investment decisions with respect to changes in jeepney fares. Currently, public transport vehicles such as buses, jeepneys, and taxis are regulated by the LTFRB including routes, entries, and fares. As of December 2018, the base fare for traditional jeepneys in Metro Manila and nearby regions is USD 19.63c, which covers the first 4 km of public utility jeepney (PUJ) Routes. According to this agency, modern jeepneys that are compliant with the Public Utility Vehicle Modernization Program (PUVMP) can charge a minimum fare of USD 21.81cs. This scenario describes how variations in fares affect the option values and identifies the critical value of fare reduction for the adoption of PUVMP.
Figure 4 describes the option values at different jeepney base fares. The optimization shows an upright shift in the options curve at higher base fares. This result suggests that the government must increase the base fares in order to attract transport operators and prospective investors to adopt the PUV modernization program. This will have no or little effect on the demand, as passengers in the case of the Philippines are price takers due to the limited number of PUVs. On the contrary, a reduction of base fares shifts the option curve down left. Consequently, a fare reduction causes considerable revenue loss for the operator [29], hence, lower profit for operators and lower expected NPV for the project investment. Therefore, careful fare system planning for PUVs must be done to reflect the maximization of demand, revenue, profit, and social welfare [30]. Moreover, the fare USD 13.09c curve indicates the minimum fare reduction possible. Beyond this reduction, investment in any alternative incurs only losses, as described by the fare USD 10.91c (green curve).
Figure 3. Dynamics of investment values at different periods. E[NPV j
]is the expected NPV of
investment in the diesel jeepney; NPVej is the NPV of investment in the e-jeepney; opportunity loss isthe value of delaying investment in the e-jeepney. Optimization results for the dynamics of investmentvalues at different periods are tabulated in Supplementary Material Table S4.
3.3. Jeepney Fare Scenario
In this scenario, we analyze the sensitivity of investment decisions with respect to changes injeepney fares. Currently, public transport vehicles such as buses, jeepneys, and taxis are regulatedby the LTFRB including routes, entries, and fares. As of December 2018, the base fare for traditionaljeepneys in Metro Manila and nearby regions is USD 19.63c, which covers the first 4 km of publicutility jeepney (PUJ) Routes. According to this agency, modern jeepneys that are compliant with thePublic Utility Vehicle Modernization Program (PUVMP) can charge a minimum fare of USD 21.81cs.This scenario describes how variations in fares affect the option values and identifies the critical valueof fare reduction for the adoption of PUVMP.
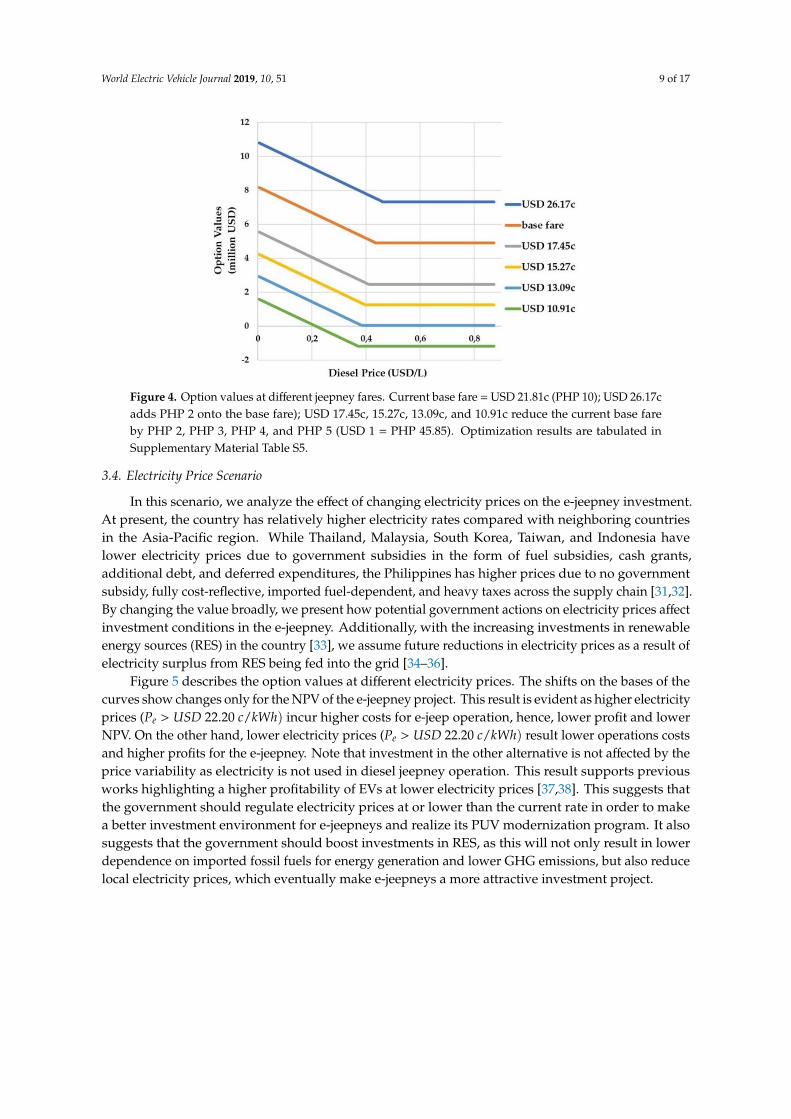
Figure 4 describes the option values at different jeepney base fares. The optimization shows anupright shift in the options curve at higher base fares. This result suggests that the government mustincrease the base fares in order to attract transport operators and prospective investors to adopt thePUV modernization program. This will have no or little effect on the demand, as passengers in the caseof the Philippines are price takers due to the limited number of PUVs. On the contrary, a reductionof base fares shifts the option curve down left. Consequently, a fare reduction causes considerablerevenue loss for the operator [29], hence, lower profit for operators and lower expected NPV for theproject investment. Therefore, careful fare system planning for PUVs must be done to reflect themaximization of demand, revenue, profit, and social welfare [30]. Moreover, the fare USD 13.09c curveindicates the minimum fare reduction possible. Beyond this reduction, investment in any alternativeincurs only losses, as described by the fare USD 10.91c (green curve).
World Electric Vehicle Journal 2019, 10, 51 9 of 17World Electric Vehicle Journal 2019, 10, x FOR PEER REVIEW 9 of 17
Figure 4. Option values at different jeepney fares. Current base fare = USD 21.81c (PHP 10); USD 26.17c adds PHP 2 onto the base fare); USD 17.45c, 15.27c, 13.09c, and 10.91c reduce the current base fare by PHP 2, PHP 3, PHP 4, and PHP 5 (USD 1 = PHP 45.85). Optimization results are tabulated in Supplementary Material Table S5.
3.4. Electricity Price Scenario
In this scenario, we analyze the effect of changing electricity prices on the e-jeepney investment. At present, the country has relatively higher electricity rates compared with neighboring countries in the Asia-Pacific region. While Thailand, Malaysia, South Korea, Taiwan, and Indonesia have lower electricity prices due to government subsidies in the form of fuel subsidies, cash grants, additional debt, and deferred expenditures, the Philippines has higher prices due to no government subsidy, fully cost-reflective, imported fuel-dependent, and heavy taxes across the supply chain [31,32]. By changing the value broadly, we present how potential government actions on electricity prices affect investment conditions in the e-jeepney. Additionally, with the increasing investments in renewable energy sources (RES) in the country [33], we assume future reductions in electricity prices as a result of electricity surplus from RES being fed into the grid [34–36].
Figure 5 describes the option values at different electricity prices. The shifts on the bases of the curves show changes only for the NPV of the e-jeepney project. This result is evident as higher electricity prices (𝑃 > 𝑈𝑆𝐷 22.20 𝑐/𝑘𝑊ℎ) incur higher costs for e-jeep operation, hence, lower profit and lower NPV. On the other hand, lower electricity prices (𝑃 > 𝑈𝑆𝐷 22.20 𝑐/𝑘𝑊ℎ) result lower operations costs and higher profits for the e-jeepney. Note that investment in the other alternative is not affected by the price variability as electricity is not used in diesel jeepney operation. This result supports previous works highlighting a higher profitability of EVs at lower electricity prices [37,38]. This suggests that the government should regulate electricity prices at or lower than the current rate in order to make a better investment environment for e-jeepneys and realize its PUV modernization program. It also suggests that the government should boost investments in RES, as this will not only result in lower dependence on imported fossil fuels for energy generation and lower GHG emissions, but also reduce local electricity prices, which eventually make e-jeepneys a more attractive investment project.
Figure 4. Option values at different jeepney fares. Current base fare = USD 21.81c (PHP 10); USD 26.17cadds PHP 2 onto the base fare); USD 17.45c, 15.27c, 13.09c, and 10.91c reduce the current base fareby PHP 2, PHP 3, PHP 4, and PHP 5 (USD 1 = PHP 45.85). Optimization results are tabulated inSupplementary Material Table S5.
3.4. Electricity Price Scenario
In this scenario, we analyze the effect of changing electricity prices on the e-jeepney investment.At present, the country has relatively higher electricity rates compared with neighboring countriesin the Asia-Pacific region. While Thailand, Malaysia, South Korea, Taiwan, and Indonesia havelower electricity prices due to government subsidies in the form of fuel subsidies, cash grants,additional debt, and deferred expenditures, the Philippines has higher prices due to no governmentsubsidy, fully cost-reflective, imported fuel-dependent, and heavy taxes across the supply chain [31,32].By changing the value broadly, we present how potential government actions on electricity prices affectinvestment conditions in the e-jeepney. Additionally, with the increasing investments in renewableenergy sources (RES) in the country [33], we assume future reductions in electricity prices as a result ofelectricity surplus from RES being fed into the grid [34–36].
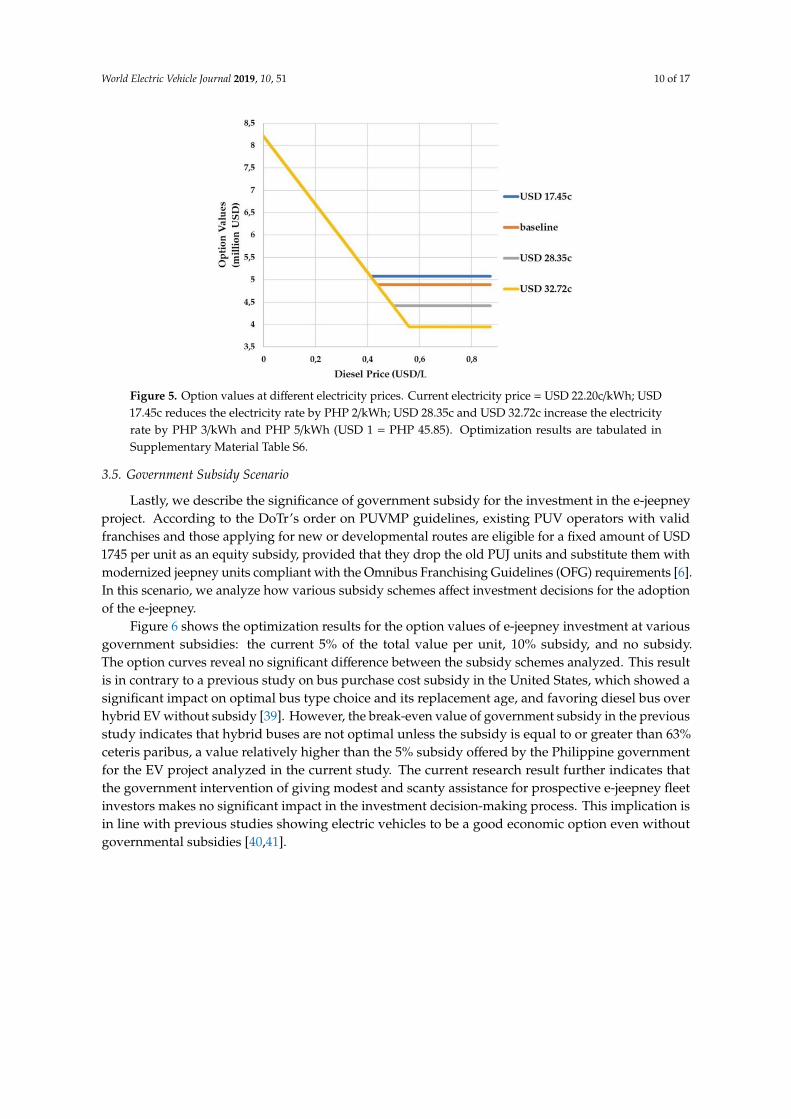
Figure 5 describes the option values at different electricity prices. The shifts on the bases of thecurves show changes only for the NPV of the e-jeepney project. This result is evident as higher electricityprices (Pe > USD 22.20 c/kWh) incur higher costs for e-jeep operation, hence, lower profit and lowerNPV. On the other hand, lower electricity prices (Pe > USD 22.20 c/kWh) result lower operations costsand higher profits for the e-jeepney. Note that investment in the other alternative is not affected by theprice variability as electricity is not used in diesel jeepney operation. This result supports previousworks highlighting a higher profitability of EVs at lower electricity prices [37,38]. This suggests thatthe government should regulate electricity prices at or lower than the current rate in order to makea better investment environment for e-jeepneys and realize its PUV modernization program. It alsosuggests that the government should boost investments in RES, as this will not only result in lowerdependence on imported fossil fuels for energy generation and lower GHG emissions, but also reducelocal electricity prices, which eventually make e-jeepneys a more attractive investment project.
World Electric Vehicle Journal 2019, 10, 51 10 of 17World Electric Vehicle Journal 2019, 10, x FOR PEER REVIEW 10 of 17
Figure 5. Option values at different electricity prices. Current electricity price = USD 22.20c/kWh; USD 17.45c reduces the electricity rate by PHP 2/kWh; USD 28.35c and USD 32.72c increase the electricity rate by PHP 3/kWh and PHP 5/kWh (USD 1 = PHP 45.85). Optimization results are tabulated in Supplementary Material Table S6.
3.5. Government Subsidy Scenario
Lastly, we describe the significance of government subsidy for the investment in the e-jeepney project. According to the DoTr’s order on PUVMP guidelines, existing PUV operators with valid franchises and those applying for new or developmental routes are eligible for a fixed amount of USD 1745 per unit as an equity subsidy, provided that they drop the old PUJ units and substitute them with modernized jeepney units compliant with the Omnibus Franchising Guidelines (OFG) requirements [6]. In this scenario, we analyze how various subsidy schemes affect investment decisions for the adoption of the e-jeepney.
Figure 6 shows the optimization results for the option values of e-jeepney investment at various government subsidies: the current 5% of the total value per unit, 10% subsidy, and no subsidy. The option curves reveal no significant difference between the subsidy schemes analyzed. This result is in contrary to a previous study on bus purchase cost subsidy in the United States, which showed a significant impact on optimal bus type choice and its replacement age, and favoring diesel bus over hybrid EV without subsidy [39]. However, the break-even value of government subsidy in the previous study indicates that hybrid buses are not optimal unless the subsidy is equal to or greater than 63% ceteris paribus, a value relatively higher than the 5% subsidy offered by the Philippine government for the EV project analyzed in the current study. The current research result further indicates that the government intervention of giving modest and scanty assistance for prospective e-jeepney fleet investors makes no significant impact in the investment decision-making process. This implication is in line with previous studies showing electric vehicles to be a good economic option even without governmental subsidies [40,41].
Figure 5. Option values at different electricity prices. Current electricity price = USD 22.20c/kWh; USD17.45c reduces the electricity rate by PHP 2/kWh; USD 28.35c and USD 32.72c increase the electricityrate by PHP 3/kWh and PHP 5/kWh (USD 1 = PHP 45.85). Optimization results are tabulated inSupplementary Material Table S6.
3.5. Government Subsidy Scenario
Lastly, we describe the significance of government subsidy for the investment in the e-jeepneyproject. According to the DoTr’s order on PUVMP guidelines, existing PUV operators with validfranchises and those applying for new or developmental routes are eligible for a fixed amount of USD1745 per unit as an equity subsidy, provided that they drop the old PUJ units and substitute them withmodernized jeepney units compliant with the Omnibus Franchising Guidelines (OFG) requirements [6].In this scenario, we analyze how various subsidy schemes affect investment decisions for the adoptionof the e-jeepney.
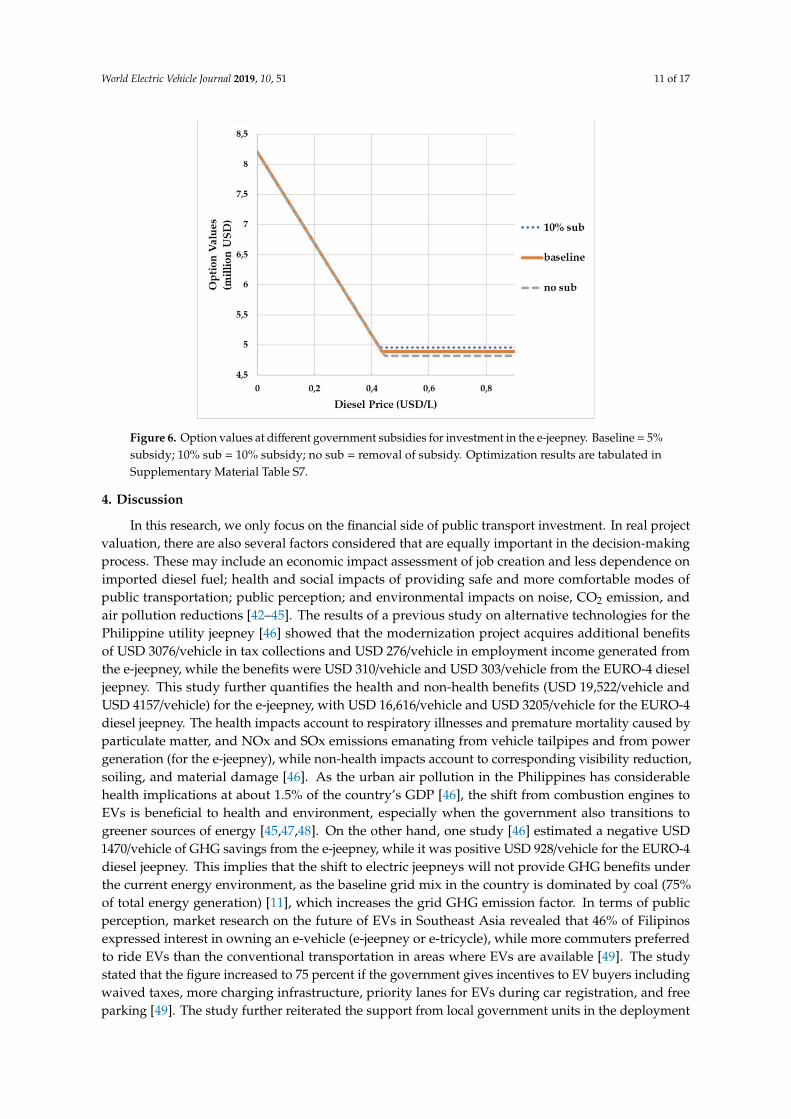
Figure 6 shows the optimization results for the option values of e-jeepney investment at variousgovernment subsidies: the current 5% of the total value per unit, 10% subsidy, and no subsidy.The option curves reveal no significant difference between the subsidy schemes analyzed. This resultis in contrary to a previous study on bus purchase cost subsidy in the United States, which showed asignificant impact on optimal bus type choice and its replacement age, and favoring diesel bus overhybrid EV without subsidy [39]. However, the break-even value of government subsidy in the previousstudy indicates that hybrid buses are not optimal unless the subsidy is equal to or greater than 63%ceteris paribus, a value relatively higher than the 5% subsidy offered by the Philippine governmentfor the EV project analyzed in the current study. The current research result further indicates thatthe government intervention of giving modest and scanty assistance for prospective e-jeepney fleetinvestors makes no significant impact in the investment decision-making process. This implication isin line with previous studies showing electric vehicles to be a good economic option even withoutgovernmental subsidies [40,41].
World Electric Vehicle Journal 2019, 10, 51 11 of 17
World Electric Vehicle Journal 2019, 10, x FOR PEER REVIEW 11 of 17
Figure 6. Option values at different government subsidies for investment in the e-jeepney. Baseline = 5% subsidy; 10% sub = 10% subsidy; no sub = removal of subsidy. Optimization results are tabulated in Supplementary Material Table S7.
4. Discussion
In this research, we only focus on the financial side of public transport investment. In real project valuation, there are also several factors considered that are equally important in the decision-making process. These may include an economic impact assessment of job creation and less dependence on imported diesel fuel; health and social impacts of providing safe and more comfortable modes of public transportation; public perception; and environmental impacts on noise, CO2 emission, and air pollution reductions [42–45]. The results of a previous study on alternative technologies for the Philippine utility jeepney [46] showed that the modernization project acquires additional benefits of USD 3076/vehicle in tax collections and USD 276/vehicle in employment income generated from the e-jeepney, while the benefits were USD 310/vehicle and USD 303/vehicle from the EURO-4 diesel jeepney. This study further quantifies the health and non-health benefits (USD 19,522/vehicle and USD 4157/vehicle) for the e-jeepney, with USD 16,616/vehicle and USD 3205/vehicle for the EURO-4 diesel jeepney. The health impacts account to respiratory illnesses and premature mortality caused by particulate matter, and NOx and SOx emissions emanating from vehicle tailpipes and from power generation (for the e-jeepney), while non-health impacts account to corresponding visibility reduction, soiling, and material damage [46]. As the urban air pollution in the Philippines has considerable health implications at about 1.5% of the country’s GDP [46], the shift from combustion engines to EVs is beneficial to health and environment, especially when the government also transitions to greener sources of energy [45,47,48]. On the other hand, one study [46] estimated a negative USD 1470/vehicle of GHG savings from the e-jeepney, while it was positive USD 928/vehicle for the EURO-4 diesel jeepney. This implies that the shift to electric jeepneys will not provide GHG benefits under the current energy environment, as the baseline grid mix in the country is dominated by coal (75% of total energy generation) [11], which increases the grid GHG emission factor. In terms of public perception, market research on the future of EVs in Southeast Asia revealed that 46% of Filipinos expressed interest in owning an e-vehicle (e-jeepney or e-tricycle), while more commuters preferred to ride EVs than the conventional transportation in areas where EVs are available [49]. The study stated that the figure increased to 75 percent if the government gives incentives to EV buyers including waived taxes, more charging infrastructure, priority lanes for EVs during car registration, and free parking [49]. The study further reiterated the support from local government units in the deployment of EV units, while more cooperatives and operators are becoming involved by replacing their old units and obtaining new franchises with the help of the DoTr [49]. While the public
Figure 6. Option values at different government subsidies for investment in the e-jeepney. Baseline = 5%subsidy; 10% sub = 10% subsidy; no sub = removal of subsidy. Optimization results are tabulated inSupplementary Material Table S7.
4. Discussion
In this research, we only focus on the financial side of public transport investment. In real projectvaluation, there are also several factors considered that are equally important in the decision-makingprocess. These may include an economic impact assessment of job creation and less dependence onimported diesel fuel; health and social impacts of providing safe and more comfortable modes ofpublic transportation; public perception; and environmental impacts on noise, CO2 emission, andair pollution reductions [42–45]. The results of a previous study on alternative technologies for thePhilippine utility jeepney [46] showed that the modernization project acquires additional benefitsof USD 3076/vehicle in tax collections and USD 276/vehicle in employment income generated fromthe e-jeepney, while the benefits were USD 310/vehicle and USD 303/vehicle from the EURO-4 dieseljeepney. This study further quantifies the health and non-health benefits (USD 19,522/vehicle andUSD 4157/vehicle) for the e-jeepney, with USD 16,616/vehicle and USD 3205/vehicle for the EURO-4diesel jeepney. The health impacts account to respiratory illnesses and premature mortality caused byparticulate matter, and NOx and SOx emissions emanating from vehicle tailpipes and from powergeneration (for the e-jeepney), while non-health impacts account to corresponding visibility reduction,soiling, and material damage [46]. As the urban air pollution in the Philippines has considerablehealth implications at about 1.5% of the country’s GDP [46], the shift from combustion engines toEVs is beneficial to health and environment, especially when the government also transitions togreener sources of energy [45,47,48]. On the other hand, one study [46] estimated a negative USD1470/vehicle of GHG savings from the e-jeepney, while it was positive USD 928/vehicle for the EURO-4diesel jeepney. This implies that the shift to electric jeepneys will not provide GHG benefits underthe current energy environment, as the baseline grid mix in the country is dominated by coal (75%of total energy generation) [11], which increases the grid GHG emission factor. In terms of publicperception, market research on the future of EVs in Southeast Asia revealed that 46% of Filipinosexpressed interest in owning an e-vehicle (e-jeepney or e-tricycle), while more commuters preferredto ride EVs than the conventional transportation in areas where EVs are available [49]. The studystated that the figure increased to 75 percent if the government gives incentives to EV buyers includingwaived taxes, more charging infrastructure, priority lanes for EVs during car registration, and freeparking [49]. The study further reiterated the support from local government units in the deployment
World Electric Vehicle Journal 2019, 10, 51 12 of 17
of EV units, while more cooperatives and operators are becoming involved by replacing their old unitsand obtaining new franchises with the help of the DoTr [49]. While the public perception of EVs isrelatively low in other countries due to concerns about high battery costs, safety, reliability, rangeper charge, and poor public charging infrastructures [50,51], Filipinos’ environmental awareness isnow increasing with the adoption of more sustainable modes of public transport. While the GHGsavings and the traditional valuation methods favor modernized jeepneys with shorter PBP, higherROI, and higher IRR; other analyses including economic impacts on employment and additional taxcollection, health and non-health impacts, and public perception favor the e-jeepney project, whichfurther complements our analysis using the proposed ROA model.
In the jeepney fare scenario, we analyze how the changing base fare affects investment decisionsfor the PUV project. We assume that the USD 2.18c (PHP 1) fare difference between modern andtraditional jeepneys has no or little effect on the demand, as passengers in the case of the Philippinesare price takers due to the limited number of PUVs. In the medium to long-run, this assumption is trueas traditional jeepneys will be phased out in 10 to 15 years [6]; hence, there will be a uniform price forall types of jeepney. It should be noted that in the short-run, fare differences may affect the demand asconsumers may prefer traditional jeepneys with lower fares. In this case, future studies may includethe cross-price elasticity of demand, which reflects the substitution pattern between the traditional andmodernized jeepneys [52]. Moreover, cross-price elasticity may also include the availability of chargingstations; charging prices of the stations; and PUV substitutes such as hybrid, hydrogen-fueled, andother modes of public transportation [53,54].
The context of the decision-making analyses in this study focuses on the transport operator whowill adopt PUVMP with the e-jeepney; hence, we assume that charging stations for e-jeepneys arelocated at company and public terminals. We recognize that our results can further be influencedby a supporting project from the government to establish charging infrastructures, which can beplaced in strategic places. This can be planned by utilizing PUV recharging information like frequency,amount and time to estimate the distances between the stations [55,56]. However, this is in contrastwith a study which suggests that the charging of electric PUVs should be coordinated to minimizepotential energy losses and maximize the main grid load factor [57]. Using the same recharginginformation, operators can manage the charging schedule of the units in their respective terminals.While individual charging may not affect the distributions systems, simultaneous charging of an entirefleet may incur potential problems in old transformers and excessive voltage drops [58]. Moreover,for the last 10 years, there was an average of 11% annual increase in the production of electricityusing coal [59]. This indicates that there was an observable increase in the demand for electricity evenbefore the dawn of charging e-jeepneys. It should be noted that emissions from burning fossil fuelslike coal release GHGs, which affect the environment. While we are sure that the GHG emissions ofthe e-jeepney are Euro-4 compliant, the production of electricity that powers these vehicles is not.Therefore, the government should increase its efforts to develop infrastructures that generate electricityfrom RES.
This study compares the economic attractiveness of investment in the e-jeepney and the modernizeddiesel jeepney. Future studies may also consider other environment-friendly alternatives such asbiofuel vehicles, hydrogen-fueled vehicles, and hybrid vehicles. While this study analyzes the case ofPUV investment in the Philippines, future studies may consider applying the proposed model for PUVprojects in developing countries such as electric tricycles, electric tuk-tuks, e-scooters, electric watertaxis, and other sustainable modes of public transportation that fit with the local setting.
Finally, this study analyzes an investment setting with stochastic diesel fuel prices, while assumingall other variables are constant through time. We acknowledge other uncertainties that affect investmentdecisions, particularly for public transport, including the prices of electricity, jeepney fares, operationand maintenance costs, demand for more environment-friendly PUVs, technological innovations,investment costs, and other relevant variables. These uncertainties can also be incorporated in themodel to better capture a more realistic investment setting relevant to market and climate change
World Electric Vehicle Journal 2019, 10, 51 13 of 17
policy. Despite these limitations, we believe that the ROA framework proposed in this study could bea good benchmark for further analysis of investment decisions for cleaner and more sustainable modesof public transportation.
5. Conclusions
This study discusses an investment case for adopting the modernized diesel jeepney or thee-jeepney in the Philippines. We apply the real options approach under uncertainty in diesel fuel pricesto evaluate the option values and optimal investment strategies in PUV projects. We characterizevarious scenarios where the e-jeepney is a more favorable investment than the modernized dieseljeepney and analyze how sensitivity to electricity prices, jeepney fares, and government subsidy inthe e-jeepney affect the investment decisions for PUVs. We also compare the decision usefulness ofthe proposed ROA model over the traditional financial tools for analyzing PUV investment projects.Our analysis highlights the advantages of ROA by combining risks, uncertainties, and managerialflexibility in making investment decisions.
Our analyses conclude that there is a better investment opportunity for the e-jeepney over thediesel jeepney. Results are robust with all scenarios investigated. Results also show a more optimaldecision strategy to invest immediately under the current business environment, as delaying orpostponing investment may incur opportunity losses. While environmental impacts and traditionalfinancial tools such as PBP, ROI, and IRR favor the modernized jeepney project, other investmentanalyses including public perception, health and non-health benefits, and economic impacts on taxand employment favor the e-jeepney project, which complements the result of our analysis using theproposed ROA. To make the adoption of the e-jeepney more attractive, this study further suggestsgovernment actions to increase the amount of subsidy with flexible payment terms; increase jeepneybase fares for quick and higher ROI; establish charging infrastructures optimally located in strategicplaces while considering the driver’s spontaneous adjustments, and the interactions of travel andcharging decisions; and continue efforts to rely on cleaner, cheaper, and renewable sources of electricity.
Supplementary Materials: The supplementary material is available online at http://www.mdpi.com/2032-6653/10/3/51/s1.
Author Contributions: Conceptualization, C.B.A., C.S.G., Re.O.V. and Ri.O.V.; Data curation, C.S.G. and Re.O.V.;Formal analysis, C.B.A.; Investigation, Re.O.V.; Methodology, C.B.A.; Project administration, C.S.G.; Software,C.B.A.; Supervision, C.B.A.; Validation, C.S.G., Re.O.V. and Ri.O.V.; Writing—original draft, C.B.A., C.S.G., Re.O.V.and Ri.O.V.; Writing—review & editing, Ri.O.V.
Funding: This research received no external funding.
Acknowledgments: The authors acknowledge Utrecht University, the Philippines’ Department of Energy (DoE),Department of Transport (DoTr), and the Land Transportation Franchising and Regulatory Board (LTFRB).
Conflicts of Interest: The authors declare no conflict of interest.
Nomenclature
Acronyms DescriptionADF Augmented Dickey–FullerCBA Cost-Benefit AnalysisDOE Department of EnergyDoTr Department of TransportationEV Electric VehiclesIRR Internal Rate of Return
GBM Geometric Brownian MotionGHG Greenhouse GassesGPS Global Positioning SystemHV Hybrid VehicleIRR Internal Rate of Return
LTFRB Land Transportation Franchising and Regulatory Board
World Electric Vehicle Journal 2019, 10, 51 14 of 17
MACE Manila Aerosol Characterization ExperimentNPV Net Present ValueOFG Omnibus Franchising GuidelinesPBP Payback PeriodPUJ Public Utility JeepneyPUV Public Utility VehiclePHP Philippine Peso
PUVMP Public Utility Vehicle Modernization ProgramRES Renewable Energy SourcesROA Real Options ApproachROI Return on Investment
Symbols Description Unitα gradient of diesel pricesσ standard deviation of diesel pricesρ discount factor
Pej average annual earnings from e-jeepney PHP/yrQej number of e-jeepney units per fleet; minimum set by the government unitPe price electricity PHP/kWhQe average annual electricity consumed by the fleet kWhCej average annual operations and maintenance cost for e-jeepney PHP/yrs government subsidy for e-jeepney fleet PHPI annual amortization for e-jeepney fleet PHP/yr
Tej effective lifetime of e-jeepney YrENPV Expected Net Present Value PHPNPVej net present value of e-jeepney fleet project PHP
Pj average annual earnings from diesel jeepney PHP/yrQj number of diesel jeepney units per fleet unitQd average annual fuel consumption of diesel jeepney fleet L/yrCj average annual operations and maintenance cost for diesel jeepney PHP/yrIj average investment cost for diesel jeepney PHPTj effective lifetime of diesel jeepney YrT Decision-making period
Pd,0 initial diesel price PHP/LPcur
d current price of diesel PHP/LNPVj net present value of diesel jeepney fleet project PHP
References
1. IPCC. Climate Change 2014: Mitigation of Climate Change. Contribution of Working Group III to the Fifth AssessmentReport of the Intergovernmental Panel on Climate Change; Edenhofer, O.R., Pichs-Madruga, Y., Sokona, E.,Farahani, S., Kadner, K., Seyboth, A., Adler, I., Baum, S., Brunner, P., Eickemeier, B., et al., Eds.; CambridgeUniversity Press: Cambridge, UK, 2014; Available online: https://www.ipcc.ch/site/assets/uploads/2018/02/
ipcc_wg3_ar5_frontmatter.pdf (accessed on 30 March 2019).2. The International Energy Agency (IEA). Tracking Clean Energy Progress 2017. Available online: https:
//www.iea.org/publications/freepublications/publication/TrackingCleanEnergyProgress2017.pdf (accessed on30 March 2019).
3. Ajanovic, A. The future of electric vehicles: Prospects and impediments. WIREs Energy Environ. 2015, 4,236–521. [CrossRef]
4. BNEF, Electric Vehicle Outlook. 2018. Available online: https://about.bnef.com/electric-vehicle-outlook/
(accessed on 30 March 2019).5. Kecorius, S.; Madueño, L.; Vallar, E.; Alas, H.; Betito, G.; Birmili, W.; Cambaliza, M.O.; Catipay, G.;
Galvez, M.C.; Lorenzo, G.; et al. Aerosol particle mixing state, soot number size distributions, and emissionfactors in a polluted urban environment: Case study of Metro Manila, Philippines. Atmos. Environ. 2017,170, 169–183. [CrossRef]
World Electric Vehicle Journal 2019, 10, 51 15 of 17
6. Department of Transportation (DoTr). Guidelines on the Availment of the Equity Subsidy under the PublicUtility Vehicle (PUV) Modernization Program. 2018. Available online: https://drive.google.com/file/d/
1Sq8JbgN1E4hF4a6gbslFdk7DwbX7ulhB/view (accessed on 30 March 2019).7. Philippine Information Agency (PIA). Makati-Mandaluyong eSakay Route Launched. Available online:
https://pia.gov.ph/news/articles/1017399 (accessed on 30 March 2019).8. Lopez, N.S.; Soliman, J.; Biona, J.B.M. Life Cycle Cost and Benefit Analysis of Low Carbon Vehicle Technologies.
In Sustainable Energy Technology and Policies; De, S., Bandyopadhyay, S., Assadi, M., Mukherjee, D., Eds.;Green Energy and Technology Springer: Singapore, 2018; pp. 131–146.
9. Balaria, F.E.; Pascual, M.P.; Santos, M.D.; Ortiz, A.F.; Gabriel, A.G.; Mangahas, T.L.S. Sustainability of E-Trikeas Alternative Mode of Public Transportation System: The Case of Cabanatuan City, Philippines. Open J.Civ. Eng. 2017, 7, 362–377. [CrossRef]
10. Sarsalejo, L.F.C.; Preciados, L.S. Comparative Profitability Analysis of Electric, Pedicab, and Gasoline-FuelledTricycles. J. Educ. Hum. Resour. Dev. 2018, 6, 1–11.
11. Agaton, C.B. A Real Options Approach to Renewable and Nuclear Energy Investments in the Philippines; Logos VerlagBerlin: Berlin, Germany, 2019; Volume 71.
12. Nishihara, M. Hybrid or electric vehicles? A real options perspective. Oper. Res. Lett. 2010, 38, 87–93.[CrossRef]
13. Kang, N.; Bayrak, A.; Papalambros, P.Y. Robustness and Real Options for Vehicle Design and InvestmentDecisions Under Gas Price and Regulatory Uncertainties. J. Mech. Des. 2018, 140, 10140401–10140411.[CrossRef]
14. Kleindorfer, P.R.; Neboian, A.; Roset, A.; Spinler, S. Fleet Renewal with Electric Vehicles at La Poste. INFORMSJ. Appl. Anal. 2012, 42, 465–477. [CrossRef]
15. Yamashita, D.; Niimura, T.; Takamori, H.; Wang, T.; Yokoyama, R. Plug-in Electric Vehicle Markets and TheirInfrastructure Investment Policies under Fuel Economy Uncertainty. Int. J. Real Options Strategy 2013, 1,39–60. [CrossRef]
16. Avadikyan, A.; Llerena, P. A real options reasoning approach to hybrid vehicle investments. Technol. Forecast.Soc. Chang. 2010, 77, 649–661. [CrossRef]
17. Ansaripoor, A.H.; Oliveira, F.S. Flexible lease contracts in the fleet replacement problem with alternative fuelvehicles: A real-options approach. Eur. J. Oper. Res. 2018, 266, 316–327. [CrossRef]
18. He, H.; Fan, J.; Li, Y.; Li, J. When to switch to a hybrid electric vehicle: A replacement optimisation decision.J. Clean. Prod. 2017, 148, 295–303. [CrossRef]
19. Guo, Q.W.; Chen, S.; Schonfeld, P.; Li, Z. How time-inconsistent preferences affect investment timing for railtransit. Transp. Res. Part B Methodol. 2018, 118, 172–192. [CrossRef]
20. Li, Z.C.; Guo, Q.W.; Lam, W.H.; Wong, S.C. Transit technology investment and selection under urbanpopulation volatility: A real option perspective. Transp. Res. Part B Methodol. 2015, 78, 318–340. [CrossRef]
21. Department of Energy (DOE). Oil Supply/Demand Report FY 2018 vs FY 2017. Available online: https://www.doe.gov.ph/downstream-oil (accessed on 28 March 2019).
22. Fonseca, M.N.; de Oliveira Pamplona, E.; de Mello Valerio, V.E.; Aquila, G.; Rocha, L.C.S.; Junior, P.R.Oil price volatility: A real option valuation approach in an African oil field. J. Pet. Sci. Eng. 2017, 150,297–304. [CrossRef]
23. Guedes, J.; Santos, P. Valuing an offshore oil exploration and production project through real options analysis.Energy Econ. 2016, 60, 377–386. [CrossRef]
24. Agaton, C.B.; Karl, H. A real options approach to renewable electricity generation in the Philippines.Energy Sustain. Soc. 2018, 8, 1. [CrossRef]
25. National Economic and Development Agency (NEDA). Updated Social Discount Rate for the Philippines.2016. Available online: http://www.neda.gov.ph/wp-content/uploads/2017/01/Revisions-on-ICC-Guidelines-and-Procedures-Updated-Social-Discount-Rate-for-the-Philippines.pdf (accessed on 13 August 2019).
26. Mun, J. Real options analysis versus traditional DCF valuation in layman’s terms. In Managing EnterpriseRisk: What the Electric Industry Experience Implies for Contemporary Business; Leggio, K.B., Taylor, M.L., Eds.;Elsevier: Amsterdam, The Netherlands, 2006; pp. 75–106.
27. US Energy Information Administration. Annual Energy Outlook 2019 with Projections to 2050. Availableonline: https://www.eia.gov/outlooks/aeo/pdf/aeo2019.pdf (accessed on 23 April 2019).
World Electric Vehicle Journal 2019, 10, 51 16 of 17
28. International Energy Agency (IEA). World Energy Outlook. 2018. Available online: https://www.iea.org/
weo2018/ (accessed on 23 April 2019).29. White, P.R. Public Transport: Its Planning, Management and Operation; Routledge: New York, NY, USA, 2017.30. Borndoerfer, R.; Karbstein, M.; Pfetsch, M.E. Models for fare planning in public transport. Discret. Appl. Math.
2012, 160, 2591–2605. [CrossRef]31. Agaton, C.B. Real Options Analysis of Renewable Energy Investment Scenarios in the Philippines.
Renew.‘Energy Sustain. Dev. 2017, 3, 284–292. [CrossRef]32. Fernandez, L. Power Prices: Where We Are and How Do We Reduce the Bill; Philippines’ Department of Trade
and Industry (DTI): London, UK, 2015. Available online: http://industry.gov.ph/wp-content/uploads/2015/08/
Power-Prices-Where-We-Are-and-How-Can-We-Reduce-Our-Bill-by-Lawrence-Fernandez-MERALCO1.pdf (accessed on 23 April 2019).
33. Agaton, C.B. Use coal or invest in renewables: A real options analysis of energy investments in the Philippines.Renewables 2018, 5, 1. [CrossRef]
34. Sáenz de Miera, G.; del Río González, P.; Vizcaíno, I. Analysing the impact of renewable electricity supportschemes on power prices: The case of wind electricity in Spain. Energy Policy 2008, 36, 3345–3359. [CrossRef]
35. Sorknæs, P.; Djørup, S.R.; Lund, H.; Thellufsen, J.Z. Quantifying the influence of wind power and photovoltaicon future electricity market prices. Energy Convers. Manag. 2019, 180, 312–324. [CrossRef]
36. Hirth, L. What caused the drop in European electricity prices? A factor decomposition analysis. Energy J.2018, 39, 143–157. [CrossRef]
37. De Schepper, E.; Van Passel, S.; Lizin, S. Economic benefits of combining clean energy technologies: The caseof solar photovoltaics and battery electric vehicles. Int. J. Energy Res. 2015, 39, 1109–1119. [CrossRef]
38. Hoarau, Q.; Perez, Y. Interactions between electric mobility and photovoltaic generation: A review.Renew. Sustain. Energy Rev. 2018, 94, 510–522. [CrossRef]
39. Feng, W.; Figliozzi, M. Vehicle technologies and bus fleet replacement optimization: Problem properties andsensitivity analysis utilizing real-world data. Public Transp. 2014, 6, 137–157. [CrossRef]
40. Bubeck, S.; Tomaschek, J.; Fahl, U. Perspectives of electric mobility: Total cost of ownership of electricvehicles in Germany. Transp. Policy 2016, 50, 63–77. [CrossRef]
41. Nian, V.; Hari, M.P.; Yuan, J. A new business model for encouraging the adoption of electric vehicles in theabsence of policy support. Appl. Energy 2019, 235, 1106–1117. [CrossRef]
42. Ji, S.; Cherry, C.R.; Bechle, M.J.; Wu, Y.; Marshall, J.D. Electric Vehicles in China: Emissions and HealthImpacts. Environ. Sci. Technol. 2012, 46, 2018–2024. [CrossRef]
43. Hawkins, T.R.; Singh, B.; Majeau-Bettez, G.; Strømman, A.H. Comparative environmental life cycle assessmentof conventional and electric vehicles. J. Ind. Ecol. 2013, 17, 53–64. [CrossRef]
44. Yong, J.Y.; Ramachandaramurthy, V.K.; Tana, K.M.; Mithulananthan, N. A review on the state-of-the-arttechnologies of electric vehicle, its impacts and prospects. Renew. Sustain. Energy Rev. 2015, 49, 365–385.[CrossRef]
45. Buekers, J.; Holderbeke, M.V.; Bierkens, J.; Panisa, L.I. Health and environmental benefits related to electricvehicle introduction in EU countries. Transp. Res. Part D Transp. Environ. 2014, 33, 26–38. [CrossRef]
46. Biona, J.B.; Mejia, M.; Tacderas, M.; dela Cruz, N.; Dematera, K.; Romero, J. Alternative Technologies forthe Philippine Utility Jeepney: A Cost-Benefit Study; Blacksmith Institute and Clean Air Asia: Pasig City,Philippines, 2017.
47. Holland, S.P.; Mansur, E.T.; Muller, N.Z.; Yates, A.J. Are there environmental benefits from driving electricvehicles? The importance of local factors. Am. Econ. Rev. 2016, 106, 3700–3729. [CrossRef]
48. Ziefle, M.; Beul-Leusmann, S.; Kasugai, K.; Schwalm, M. Public perception and acceptance of electric vehicles:Exploring users’ perceived benefits and drawbacks. In International Conference of Design, User Experience, andUsability; Marcus, A., Ed.; Springer: Cham, Switzerland, 2014; Volume 8159, pp. 628–639.
49. Frost & Sullivan. The Future of Electric Vehicles in Southeast Asia: Position Paper. 2018.Available online: https://asia.nissannews.com/en/releases/release-568d250ed392364df4a81d7c61017eee/
images/074b20d9e25174eab8146462b7be1932083d9d3a (accessed on 14 August 2019).50. Sovacool, B.K.; Kester, J.; Heida, V. Cars and kids: Childhood perceptions of electric vehicles and sustainable
transport in Denmark and the Netherlands. Technol. Forecast. Soc. Chang. 2019, 144, 182–192. [CrossRef]51. She, Z.Y.; Sun, Q.; Ma, J.J.; Xie, B.C. What are the barriers to widespread adoption of battery electric vehicles?
A survey of public perception in Tianjin, China. Transp. Policy 2017, 56, 29–40. [CrossRef]
World Electric Vehicle Journal 2019, 10, 51 17 of 17
52. Xing, J.; Leard, B.; Li, S. What Does an Electric Vehicle Replace? No. w25771; National Bureau of EconomicResearch: Cambridge, MA, USA, 2019.
53. Springel, K. Network Externality and Subsidy Structure in Two-Sided Markets: Evidence from Electric VehicleIncentives; United States Environmental Protection Agency: Washington, DC, USA, 2016.
54. Luo, C.; Huang, Y.F.; Gupta, V. Stochastic dynamic pricing for EV charging stations with renewable integrationand energy storage. IEEE Trans. Smart Grid 2017, 9, 1494–1505. [CrossRef]
55. He, F.; Yin, Y.; Zhou, J. Deploying public charging stations for electric vehicles on urban road networks.Transp. Res. Part C Emerg. Technol. 2015, 60, 227–240. [CrossRef]
56. Wang, C.; He, F.; Lin, X.; Shen, Z.J.M.; Li, M. Designing locations and capacities for charging stationsto support intercity travel of electric vehicles: An expanded network approach. Transp. Res. Part CEmerg. Technol. 2019, 102, 210–232. [CrossRef]
57. Clement-Nyms, K.; Haesen, E.; Driesen, J. The Impact of Charging Plug-In Hybrid Electric Vehicles on aResidential Distribution Grid. IEEE Trans. Power Syst. 2010, 25, 371–380. [CrossRef]
58. Richardson, P.; Flynn, D.; Keane, A. Optimal Charging of Electric Vehicles in Low-Voltage DistributionSystems. IEEE Trans. Power Syst. 2012, 27, 268–279. [CrossRef]
59. DOE. Summary of Installed Capacity, Dependable Capacity, Power Generation and Consumption. 2018.Available online: https://www.doe.gov.ph/sites/default/files/pdf/energy_statistics/01_2018_power_statistics_as_of_29_march_2019_summary.pdf (accessed on 23 April 2019).
© 2019 by the authors. Licensee MDPI, Basel, Switzerland. This article is an open accessarticle distributed under the terms and conditions of the Creative Commons Attribution(CC BY) license (http://creativecommons.org/licenses/by/4.0/).