Factors Affecting the Change of Agricultural Land Use ... - MDPI
Upload
khangminh22Category
view
1download
0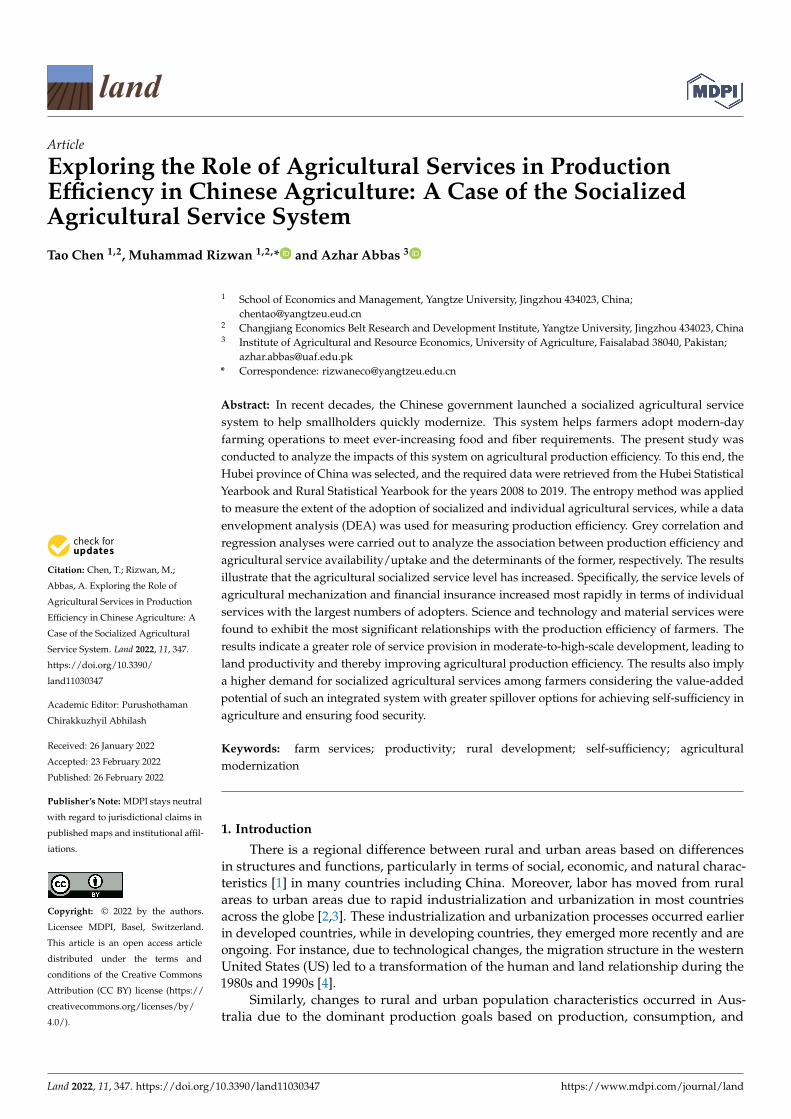
�����������������
Citation: Chen, T.; Rizwan, M.;
Abbas, A. Exploring the Role of
Agricultural Services in Production
Efficiency in Chinese Agriculture: A
Case of the Socialized Agricultural
Service System. Land 2022, 11, 347.
https://doi.org/10.3390/
land11030347
Academic Editor: Purushothaman
Chirakkuzhyil Abhilash
Received: 26 January 2022
Accepted: 23 February 2022
Published: 26 February 2022
Publisher’s Note: MDPI stays neutral
with regard to jurisdictional claims in
published maps and institutional affil-
iations.
Copyright: © 2022 by the authors.
Licensee MDPI, Basel, Switzerland.
This article is an open access article
distributed under the terms and
conditions of the Creative Commons
Attribution (CC BY) license (https://
creativecommons.org/licenses/by/
4.0/).
land
Article
Exploring the Role of Agricultural Services in ProductionEfficiency in Chinese Agriculture: A Case of the SocializedAgricultural Service SystemTao Chen 1,2, Muhammad Rizwan 1,2,* and Azhar Abbas 3
1 School of Economics and Management, Yangtze University, Jingzhou 434023, China;[email protected]
2 Changjiang Economics Belt Research and Development Institute, Yangtze University, Jingzhou 434023, China3 Institute of Agricultural and Resource Economics, University of Agriculture, Faisalabad 38040, Pakistan;
[email protected]* Correspondence: [email protected]
Abstract: In recent decades, the Chinese government launched a socialized agricultural servicesystem to help smallholders quickly modernize. This system helps farmers adopt modern-dayfarming operations to meet ever-increasing food and fiber requirements. The present study wasconducted to analyze the impacts of this system on agricultural production efficiency. To this end, theHubei province of China was selected, and the required data were retrieved from the Hubei StatisticalYearbook and Rural Statistical Yearbook for the years 2008 to 2019. The entropy method was appliedto measure the extent of the adoption of socialized and individual agricultural services, while a dataenvelopment analysis (DEA) was used for measuring production efficiency. Grey correlation andregression analyses were carried out to analyze the association between production efficiency andagricultural service availability/uptake and the determinants of the former, respectively. The resultsillustrate that the agricultural socialized service level has increased. Specifically, the service levels ofagricultural mechanization and financial insurance increased most rapidly in terms of individualservices with the largest numbers of adopters. Science and technology and material services werefound to exhibit the most significant relationships with the production efficiency of farmers. Theresults indicate a greater role of service provision in moderate-to-high-scale development, leading toland productivity and thereby improving agricultural production efficiency. The results also implya higher demand for socialized agricultural services among farmers considering the value-addedpotential of such an integrated system with greater spillover options for achieving self-sufficiency inagriculture and ensuring food security.
Keywords: farm services; productivity; rural development; self-sufficiency; agriculturalmodernization
1. Introduction
There is a regional difference between rural and urban areas based on differencesin structures and functions, particularly in terms of social, economic, and natural charac-teristics [1] in many countries including China. Moreover, labor has moved from ruralareas to urban areas due to rapid industrialization and urbanization in most countriesacross the globe [2,3]. These industrialization and urbanization processes occurred earlierin developed countries, while in developing countries, they emerged more recently and areongoing. For instance, due to technological changes, the migration structure in the westernUnited States (US) led to a transformation of the human and land relationship during the1980s and 1990s [4].
Similarly, changes to rural and urban population characteristics occurred in Aus-tralia due to the dominant production goals based on production, consumption, and
Land 2022, 11, 347. https://doi.org/10.3390/land11030347 https://www.mdpi.com/journal/land
Land 2022, 11, 347 2 of 18
protection factors [5]. The same changes were observed in the United Kingdom (UK) andNew Zealand [6,7]. Subsequently, developing countries began to follow this trend at thesame pace (e.g., in the 1980s in Poland and other countries) [8]. The fast development ofindustrialization and urbanization in China has also led to the rapid displacement of therural population since the 21st century. Consequently, rural decline has created a globalchallenge for food production to feed the planet’s growing population [9]. In addition, thecountry’s agricultural economic status has contracted and the service system has increaseddue to the movement of labor from rural to urban areas and the restructuring of economicand social systems [10].
On the other hand, the population is increasing. It is anticipated that the globalpopulation will expand from 7.2 billion to 10 billion [11,12]. In addition, changes to theclimate and overexploitation in agriculture continuously contribute to losses in arableland, resulting in food production, consumption, and distribution imbalances [13–18]. Thissituation demands the better use of land and more efficient crop production. Studiesrevealed the substantial impact of these changes on farm income due to the impacts onagricultural production. This situation demands better technologies and services, whichare crucial to enhance the efficiency of crops and food [19–22].
According to the existing research, labor migration from rural to urban areas hasnegatively impacted production, which affects food security [23–25]. Agricultural socialservices and mechanisms are considered very important for agricultural sustainability andfood security. This entails the usage of various types of equipment, machinery and services,such as information input, land-preparation harvesting, and other basic processes knownas services and mechanisms [25–27]. There is currently a trend of moving away from usingagricultural mechanisms to improve the techniques and services to help the agriculturalsystem [27]. Evidence shows that, in terms of farm-labor supply and demand, the landscapeand profit [28] can improve the economic situation and efficiency of production.
China’s economic development is strongly supported by the agricultural sub-sectorthrough its contributions to industrial raw material provisions, as well as providing func-tional employment to the peasant population [29,30]. An earlier study revealed that agri-culture historically dominated China and succeeded in maintaining food self-sufficiency,especially food grains in the last few decades [31]. Adekola and Alabadan stated thatChinese agriculture could also be understood in terms of an increased quality and quantityof agricultural products, the competitiveness of products on the global market, improvedecological and environmental protection, etc. [32]. Additionally, China’s 14th Five-YearPlan highlights the direction of agricultural and rural development, by promoting rural re-vitalization and improving agricultural quality and efficiency comprehensively. To continuesuch performance, modern and commercialized rural services must be built, especiallyto promote agriculture at the traditional level [33]. Social services are also consideredimportant for improving agriculture and increasing its efficiency [34–36].
1.1. Social Services in Agriculture and Public Intervention for Value Co-Production
The Chinese Ministry of Agriculture and Rural Affairs, along with the country’sMinistry of Finance, issued a notice in 2020 on further improving socialized servicesfor agricultural production to promote a healthy and positive association between smallfarmers and the development of modern agriculture. Socialized agricultural services areclassified into different categories, such as agricultural infrastructure, production sources,science and technology, finance, mechanization, and informatization [37]. These servicesplay a crucial role in improving agricultural production efficiency, promoting high-qualityrural development, and ensuring food security. The subsidy policy for the purchase ofagricultural machinery has also had an extensive impact on the promotion and develop-ment of agricultural mechanization. Wang et al. [38] argued that agricultural machineryservices are an important source of effective farm mechanization via the provision of farm-machinery-purchase subsidy policies to improve the level of agricultural mechanization.A sound subsidy policy for the purchase of agricultural machinery has a positive effect
Land 2022, 11, 347 3 of 18
on farmers’ income [39] and, at the same time, is conducive to increasing the number ofcustomized farm machinery units, as well as the level and extent of modernization inagricultural mechanization [40].
Postner [41] calculated the promotion effect of socialized services on agriculturalproduction using secondary data from 1967 to 1977 alongside input–output variablesamong Canadian farmers, revealing a positive association. Li and Liu [42] analyzedthe correlation between socialized services and agriculture and revealed that China’sproduction service system is relatively underdeveloped, thereby hindering the developmentof agriculture. Shuqi et al. [43] identified gaps in agricultural development in China,although there has been considerable progress. Ming [44] used linear and power functioncurve methods to estimate the correlation between agriculture and producer servicesand illustrated a spatial synergy between them. Another study used the grey correlationmodel to measure the correlation between socialized agricultural services and agriculturalproduction efficiency [45]. The result of their study indicated that the correlation betweenagricultural machinery services and agricultural production efficiency was significantlypositive. Ji et al. [46] conducted a study on socialized services, labor force, and landfragmentation in the agricultural sector using survey data. In their research, the authorsfound that socialized agricultural services are conducive to alleviating the adverse impactof the rural aging population and feminization on agricultural production.
Moreover, previous research revealed that purchasing socialized agricultural servicesis crucial to improving agricultural production efficiency [47]. Additionally, agriculturalmachinery operation services can significantly enhance agrarian production efficiency.Likewise, Yang et al. [48] illustrated the role of socialized agricultural services in improvingagricultural production efficiency in the following three ways: the division of labor, substi-tution, and technology. Moreover, social services in farming have been garnering attentiondue to their significant impact on the agricultural sector. According to data from Shandongprovince, the improvement of socialized services could effectively provide upgrades toagricultural and industrial structures [45]. These upgrades would indirectly play a signifi-cant role in enhancing the efficiency of agricultural production. Similarly, another studywas conducted by Lu et al. [49], who analyzed the impact of socialized services in differentlinks on agricultural technical efficiency based on the degree of land fragmentation. Theauthors applied microdata and beyond logarithm stochastic frontier models to estimate theresults.
1.2. Need for Socialized Agricultural Services and Scope of Sustainable Agriculture
China plays a vital role in agricultural production by feeding not only its huge pop-ulation but also that of other countries. Hubei province is the leading grain-producingprovince in China and plays an essential role in realizing the “rise of central China,” whichis vital not only for the national economy but also for people’s livelihoods [50]. However,this province is under pressure from significant uncertainties. For example, extreme climateevents, urban migration, old-age labor at farms, and shortages of rural labor are becomingincreasingly serious [51]. These issues affect the development of modern agriculture. It is,therefore, an urgent task for the province to comprehensively promote rural revitalizationand modern agricultural development. Agricultural socialized services are a healthy wayto associate small farmers with agricultural modernization [52]. Previous studies focusedon social farming in terms of a lack of capital, but in this study, we considered socializedservices related to labor migration and climate change. This aspect is quite novel in termsof the prevailing issues of rural–urban migration and cities’ concentration. Looking atthe efficiency vis à vis a publicly facilitated service provision provides further insightsfor effective policy formulation. In contrast, as shown by [53–55], service availability, itsuse and dynamics can either complement or promote rural–urban migration with littlefocus on various aspects of efficiency—allocative as well as technical ones. The workat hand goes beyond these injunctions, as we show how socialized service delivery canimprove farmers’ efficiency and reduce their search and procurement costs. Nevertheless,
Land 2022, 11, 347 4 of 18
given the nature of scale operations and input costs, more and more smallholder farmershave begun to choose outsourced agricultural machinery services [38,56]. Another motivebehind the uptake of this topic for research is that investment in agricultural machinery is arelatively large expenditure for smallholders, and the sunk costs of machinery are relativelyhigh. Therefore, small-scale farmers usually have no incentive to purchase self-ownedmachinery [39,57]. To manage agricultural production more efficiently, smallholders aremore inclined to outsource labor-intensive production processes [58,59]. On the otherhand, Ref. [60] explicitly reveal the implications of rural–urban migration for structuraltransformation of rural society, taking Sub-Saharan Africa as an example. Such an outcomehas a wide-ranging impact on land-ownership as well as its profitable or at least sustainableuse [61]. Given this scenario, socialized service provision has its own potential for initiation,but the evaluating its impact on farm-level operations and output results makes a strongcase for further study.
Hence, this study sought to determine whether socialized agricultural services influ-ence production efficiency and whether there is any correlation between the agriculturalsector and socialized agricultural services. For this purpose, it is essential to understandthe socialized service demand for agriculture and the correlation between agriculture andsocialized services. Therefore, the present study objectively investigated the impact ofsocialized services on production efficiency in the agriculture sector. This work also ana-lyzed the correlation between socialized agricultural services and agricultural productionefficiency and contributes to the existing literature by providing new insights in terms ofvariables and methodology. Because problems of rural population outflow, populationaging, land abandonment, and rural labor shortages are becoming increasingly serious,the role of interventions such as socialized agricultural services needs to be explored. Thefindings of this study provide improved benchmarking of the targets, tipping points, andhotspots for greater efficacy, leading to sustainable agriculture. In addition, the type ofintervention introduced in the study area can provide valuable insights in terms of researchfindings as to which effects and dynamics are linked with the program if implementedelsewhere in the world. This reasoning explains the interest of international readers in thetopic of this work.
2. Methodology2.1. Study Area Selection
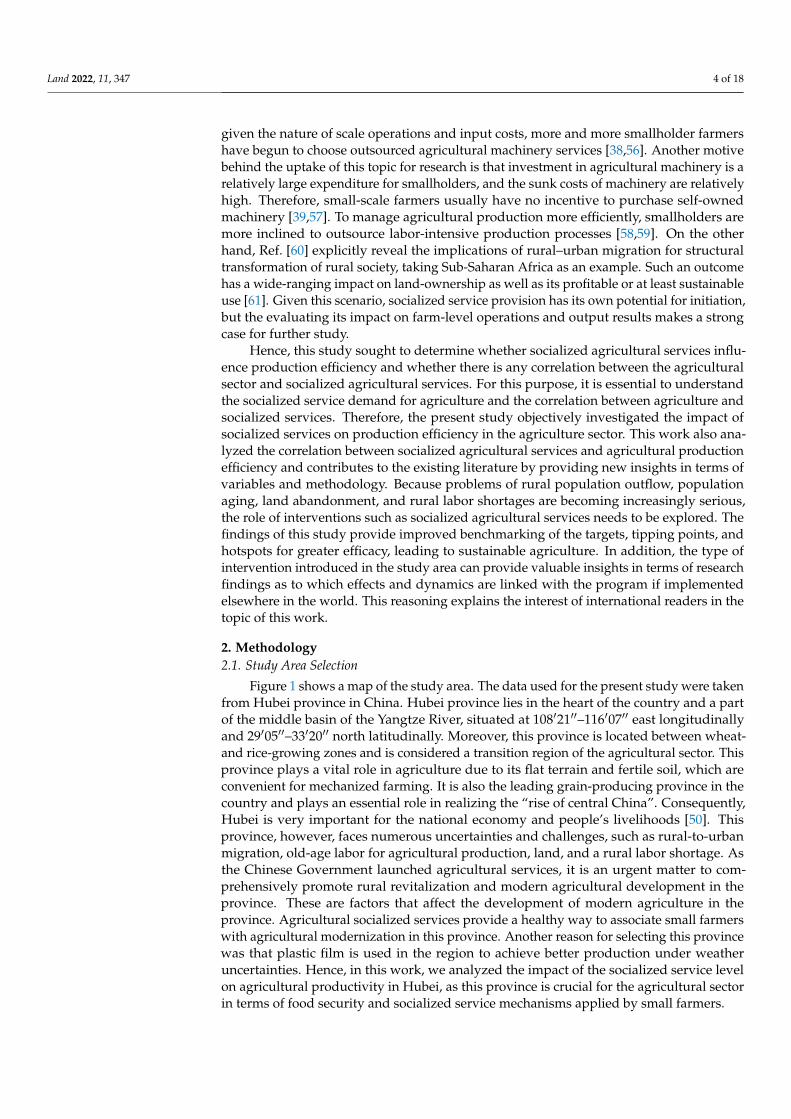
Figure 1 shows a map of the study area. The data used for the present study were takenfrom Hubei province in China. Hubei province lies in the heart of the country and a partof the middle basin of the Yangtze River, situated at 108′21′′–116′07′′ east longitudinallyand 29′05′′–33′20′′ north latitudinally. Moreover, this province is located between wheat-and rice-growing zones and is considered a transition region of the agricultural sector. Thisprovince plays a vital role in agriculture due to its flat terrain and fertile soil, which areconvenient for mechanized farming. It is also the leading grain-producing province in thecountry and plays an essential role in realizing the “rise of central China”. Consequently,Hubei is very important for the national economy and people’s livelihoods [50]. Thisprovince, however, faces numerous uncertainties and challenges, such as rural-to-urbanmigration, old-age labor for agricultural production, land, and a rural labor shortage. Asthe Chinese Government launched agricultural services, it is an urgent matter to com-prehensively promote rural revitalization and modern agricultural development in theprovince. These are factors that affect the development of modern agriculture in theprovince. Agricultural socialized services provide a healthy way to associate small farmerswith agricultural modernization in this province. Another reason for selecting this provincewas that plastic film is used in the region to achieve better production under weatheruncertainties. Hence, in this work, we analyzed the impact of the socialized service levelon agricultural productivity in Hubei, as this province is crucial for the agricultural sectorin terms of food security and socialized service mechanisms applied by small farmers.
Land 2022, 11, 347 5 of 18
Land 2022, 11, 347 5 of 19
province was that plastic film is used in the region to achieve better production under
weather uncertainties. Hence, in this work, we analyzed the impact of the socialized ser‐
vice level on agricultural productivity in Hubei, as this province is crucial for the agricul‐
tural sector in terms of food security and socialized service mechanisms applied by small
farmers.
Figure 1. Map of the study area.
The study was divided into four parts. In the first section, the entropy method was
used to measure the socialized agricultural service level. Previous research categorized
socialized agricultural services into seven categories and analyzed 24 specific variables.
In the second part, the data envelopment analysis (DEA) model was applied to measure
agricultural production, as well as technical and scale efficiencies. In the third part, grey
correlation analysis was used to evaluate the linkages between the single service level and
agricultural production efficiency, and in the fourth part, factors were used to determine
production efficiency.
2.2. Model Setting
2.2.1. Measurement of Socialized Agricultural Services and Data
Various researchers have adopted different classification methods of socialized agri‐
cultural services. For instance, Wenhui [62] divided socialized agricultural services into
six types according to farmers’ needs; this study analyzed the supply of agricultural ma‐
terials, machinery, technology, processes, information, and financial insurance. Moreover,
Lu et al. [49] examined animal and plant disease prevention and control services, quality
supervision, and agricultural product circulation services. The authors linked three di‐
mensions of service content with industry. Similarly, another study divided socialized
services into three categories, namely, public welfare, quasi‐public welfare, and opera‐
tional services, and then subdivided these three categories into 12 services [52].
Hence, to elaborate on the existing literature, the present study categorized socialized
agricultural services into the seven following themes: (i) agricultural materials, (ii) finan‐
cial and insurance, (iii) science and technology, (iv) information, (v) mechanization, (vi)
infrastructure, and (vii) social public service levels. Several variables were selected for
each category, and data were obtained from the Hubei Statistical Yearbook and Hubei
Rural Statistical Yearbook from 2009 to 2020. After selecting the index, we used the en‐
tropy method [49,52,63,64] to measure the agricultural socialized service level.
Figure 1. Map of the study area.
The study was divided into four parts. In the first section, the entropy method wasused to measure the socialized agricultural service level. Previous research categorizedsocialized agricultural services into seven categories and analyzed 24 specific variables.In the second part, the data envelopment analysis (DEA) model was applied to measureagricultural production, as well as technical and scale efficiencies. In the third part, greycorrelation analysis was used to evaluate the linkages between the single service level andagricultural production efficiency, and in the fourth part, factors were used to determineproduction efficiency.
2.2. Model Setting2.2.1. Measurement of Socialized Agricultural Services and Data
Various researchers have adopted different classification methods of socialized agri-cultural services. For instance, Wenhui [62] divided socialized agricultural services into sixtypes according to farmers’ needs; this study analyzed the supply of agricultural materials,machinery, technology, processes, information, and financial insurance. Moreover, Luet al. [49] examined animal and plant disease prevention and control services, quality super-vision, and agricultural product circulation services. The authors linked three dimensionsof service content with industry. Similarly, another study divided socialized services intothree categories, namely, public welfare, quasi-public welfare, and operational services,and then subdivided these three categories into 12 services [52].
Hence, to elaborate on the existing literature, the present study categorized social-ized agricultural services into the seven following themes: (i) agricultural materials,(ii) financial and insurance, (iii) science and technology, (iv) information, (v) mechanization,(vi) infrastructure, and (vii) social public service levels. Several variables were selectedfor each category, and data were obtained from the Hubei Statistical Yearbook and HubeiRural Statistical Yearbook from 2009 to 2020. After selecting the index, we used the entropymethod [49,52,63,64] to measure the agricultural socialized service level.
Entropy is a mathematical approach that is used to analyze the probabilities for givenoutcomes of variables. The method is widely used in impact assessments of interventionsinvolving temporal as well as interval-based actions [65,66]. The entropy method is consid-ered a highly powerful tool in cross-efficiency evaluation for a range of options involving aset of decision-making units [67]. However, the use of the entropy method in conjunctionwith Data Envelopment Analysis (DEA) is justified due to the latter’s shortcoming of totalweight flexibility, which can treat many decision-making units (DMUs) as DEA-efficient,
Land 2022, 11, 347 6 of 18
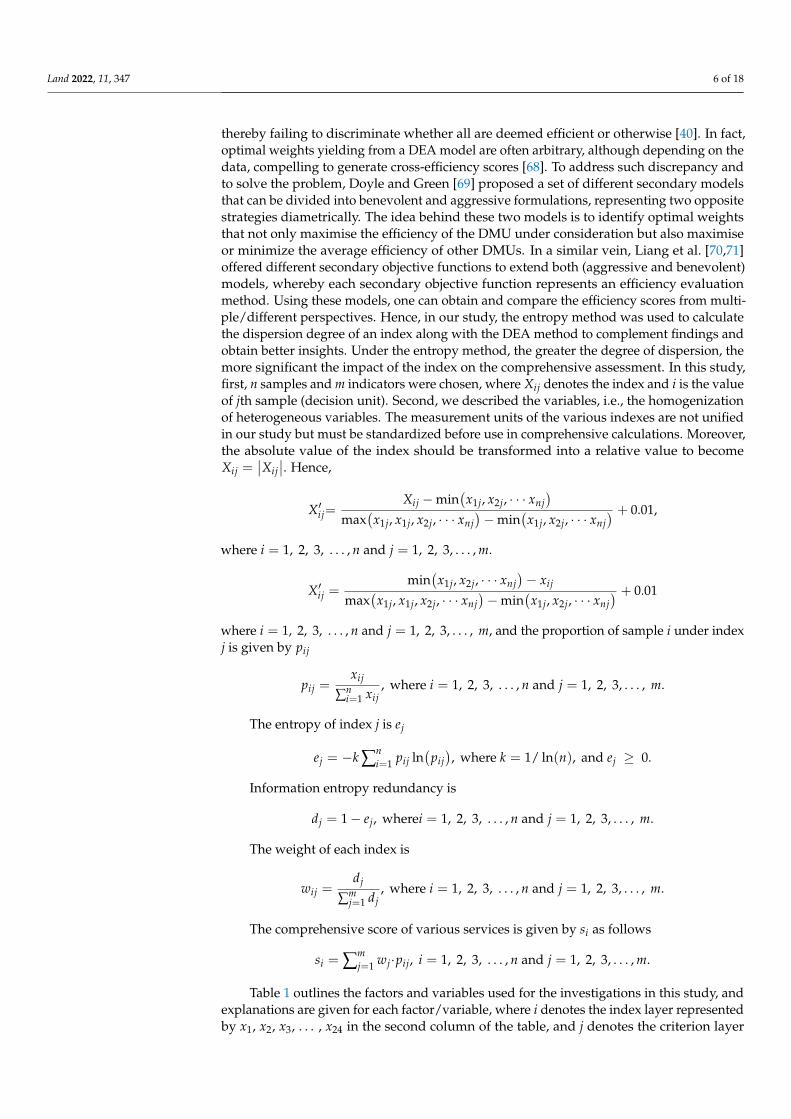
thereby failing to discriminate whether all are deemed efficient or otherwise [40]. In fact,optimal weights yielding from a DEA model are often arbitrary, although depending on thedata, compelling to generate cross-efficiency scores [68]. To address such discrepancy andto solve the problem, Doyle and Green [69] proposed a set of different secondary modelsthat can be divided into benevolent and aggressive formulations, representing two oppositestrategies diametrically. The idea behind these two models is to identify optimal weightsthat not only maximise the efficiency of the DMU under consideration but also maximiseor minimize the average efficiency of other DMUs. In a similar vein, Liang et al. [70,71]offered different secondary objective functions to extend both (aggressive and benevolent)models, whereby each secondary objective function represents an efficiency evaluationmethod. Using these models, one can obtain and compare the efficiency scores from multi-ple/different perspectives. Hence, in our study, the entropy method was used to calculatethe dispersion degree of an index along with the DEA method to complement findings andobtain better insights. Under the entropy method, the greater the degree of dispersion, themore significant the impact of the index on the comprehensive assessment. In this study,first, n samples and m indicators were chosen, where Xij denotes the index and i is the valueof jth sample (decision unit). Second, we described the variables, i.e., the homogenizationof heterogeneous variables. The measurement units of the various indexes are not unifiedin our study but must be standardized before use in comprehensive calculations. Moreover,the absolute value of the index should be transformed into a relative value to becomeXij =
∣∣Xij∣∣. Hence,
X′ij=Xij −min
(x1j, x2j, · · · xnj
)max
(x1j, x1j, x2j, · · · xnj
)−min
(x1j, x2j, · · · xnj
) + 0.01,
where i = 1, 2, 3, . . . , n and j = 1, 2, 3, . . . , m.
X′ij =min
(x1j, x2j, · · · xnj
)− xij
max(
x1j, x1j, x2j, · · · xnj)−min
(x1j, x2j, · · · xnj
) + 0.01
where i = 1, 2, 3, . . . , n and j = 1, 2, 3, . . . , m, and the proportion of sample i under indexj is given by pij
pij =xij
∑ni=1 xij
, where i = 1, 2, 3, . . . , n and j = 1, 2, 3, . . . , m.
The entropy of index j is ej
ej = −k ∑ni=1 pij ln
(pij), where k = 1/ ln(n), and ej ≥ 0.
Information entropy redundancy is
dj = 1− ej, wherei = 1, 2, 3, . . . , n and j = 1, 2, 3, . . . , m.
The weight of each index is
wij =dj
∑mj=1 dj
, where i = 1, 2, 3, . . . , n and j = 1, 2, 3, . . . , m.
The comprehensive score of various services is given by si as follows
si = ∑mj=1 wj·pij, i = 1, 2, 3, . . . , n and j = 1, 2, 3, . . . , m.
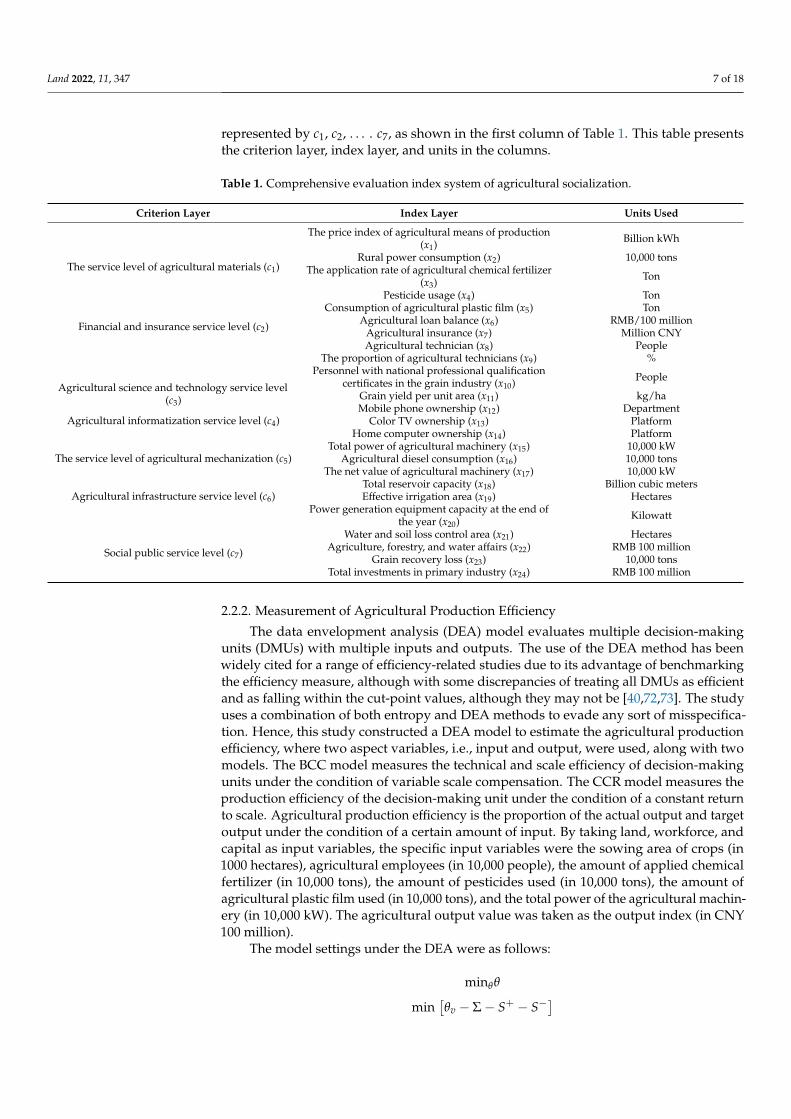
Table 1 outlines the factors and variables used for the investigations in this study, andexplanations are given for each factor/variable, where i denotes the index layer representedby x1, x2, x3, . . . , x24 in the second column of the table, and j denotes the criterion layer
Land 2022, 11, 347 7 of 18
represented by c1, c2, . . . . c7, as shown in the first column of Table 1. This table presentsthe criterion layer, index layer, and units in the columns.
Table 1. Comprehensive evaluation index system of agricultural socialization.
Criterion Layer Index Layer Units Used
The service level of agricultural materials (c1)
The price index of agricultural means of production(x1) Billion kWh
Rural power consumption (x2) 10,000 tonsThe application rate of agricultural chemical fertilizer
(x3) Ton
Pesticide usage (x4) TonConsumption of agricultural plastic film (x5) Ton
Financial and insurance service level (c2) Agricultural loan balance (x6) RMB/100 millionAgricultural insurance (x7) Million CNY
Agricultural science and technology service level(c3)
Agricultural technician (x8) PeopleThe proportion of agricultural technicians (x9) %
Personnel with national professional qualificationcertificates in the grain industry (x10) People
Grain yield per unit area (x11) kg/ha
Agricultural informatization service level (c4)Mobile phone ownership (x12) Department
Color TV ownership (x13) PlatformHome computer ownership (x14) Platform
The service level of agricultural mechanization (c5)Total power of agricultural machinery (x15) 10,000 kW
Agricultural diesel consumption (x16) 10,000 tonsThe net value of agricultural machinery (x17) 10,000 kW
Agricultural infrastructure service level (c6)Total reservoir capacity (x18) Billion cubic metersEffective irrigation area (x19) Hectares
Power generation equipment capacity at the end ofthe year (x20) Kilowatt
Social public service level (c7)
Water and soil loss control area (x21) HectaresAgriculture, forestry, and water affairs (x22) RMB 100 million
Grain recovery loss (x23) 10,000 tonsTotal investments in primary industry (x24) RMB 100 million
2.2.2. Measurement of Agricultural Production Efficiency
The data envelopment analysis (DEA) model evaluates multiple decision-makingunits (DMUs) with multiple inputs and outputs. The use of the DEA method has beenwidely cited for a range of efficiency-related studies due to its advantage of benchmarkingthe efficiency measure, although with some discrepancies of treating all DMUs as efficientand as falling within the cut-point values, although they may not be [40,72,73]. The studyuses a combination of both entropy and DEA methods to evade any sort of misspecifica-tion. Hence, this study constructed a DEA model to estimate the agricultural productionefficiency, where two aspect variables, i.e., input and output, were used, along with twomodels. The BCC model measures the technical and scale efficiency of decision-makingunits under the condition of variable scale compensation. The CCR model measures theproduction efficiency of the decision-making unit under the condition of a constant returnto scale. Agricultural production efficiency is the proportion of the actual output and targetoutput under the condition of a certain amount of input. By taking land, workforce, andcapital as input variables, the specific input variables were the sowing area of crops (in1000 hectares), agricultural employees (in 10,000 people), the amount of applied chemicalfertilizer (in 10,000 tons), the amount of pesticides used (in 10,000 tons), the amount ofagricultural plastic film used (in 10,000 tons), and the total power of the agricultural machin-ery (in 10,000 kW). The agricultural output value was taken as the output index (in CNY100 million).
The model settings under the DEA were as follows:
minθθ
min[θv − Σ− S+ − S−
]
Land 2022, 11, 347 8 of 18
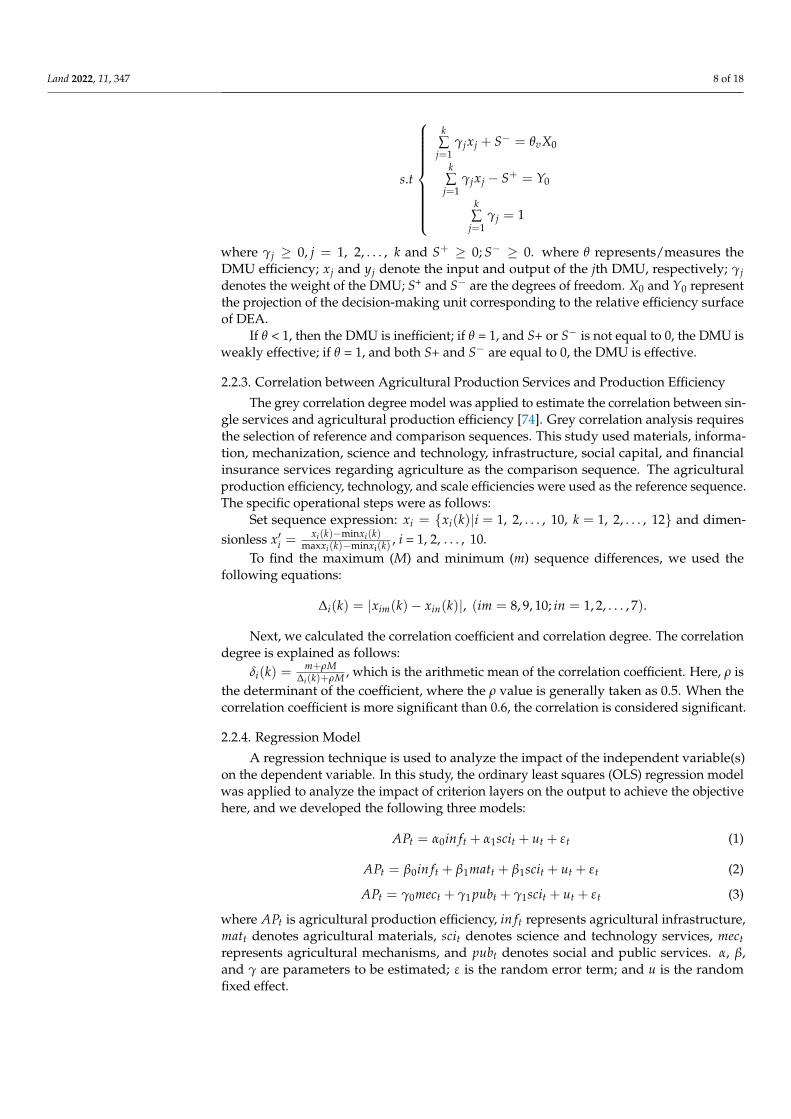
s.t
k∑
j=1γjxj + S− = θvX0
k∑
j=1γjxj − S+ = Y0
k∑
j=1γj = 1
where γj ≥ 0, j = 1, 2, . . . , k and S+ ≥ 0; S− ≥ 0. where θ represents/measures theDMU efficiency; xj and yj denote the input and output of the jth DMU, respectively; γjdenotes the weight of the DMU; S+ and S− are the degrees of freedom. X0 and Y0 representthe projection of the decision-making unit corresponding to the relative efficiency surfaceof DEA.
If θ < 1, then the DMU is inefficient; if θ = 1, and S+ or S− is not equal to 0, the DMU isweakly effective; if θ = 1, and both S+ and S− are equal to 0, the DMU is effective.
2.2.3. Correlation between Agricultural Production Services and Production Efficiency
The grey correlation degree model was applied to estimate the correlation between sin-gle services and agricultural production efficiency [74]. Grey correlation analysis requiresthe selection of reference and comparison sequences. This study used materials, informa-tion, mechanization, science and technology, infrastructure, social capital, and financialinsurance services regarding agriculture as the comparison sequence. The agriculturalproduction efficiency, technology, and scale efficiencies were used as the reference sequence.The specific operational steps were as follows:
Set sequence expression: xi = {xi(k)|i = 1, 2, . . . , 10, k = 1, 2, . . . , 12} and dimen-sionless x′i =
xi(k)−minxi(k)maxxi(k)−minxi(k)
, i = 1, 2, . . . , 10.To find the maximum (M) and minimum (m) sequence differences, we used the
following equations:
∆i(k) = |xim(k)− xin(k)|, (im = 8, 9, 10; in = 1, 2, . . . , 7).
Next, we calculated the correlation coefficient and correlation degree. The correlationdegree is explained as follows:
δi(k) =m+ρM
∆i(k)+ρM , which is the arithmetic mean of the correlation coefficient. Here, ρ isthe determinant of the coefficient, where the ρ value is generally taken as 0.5. When thecorrelation coefficient is more significant than 0.6, the correlation is considered significant.
2.2.4. Regression Model
A regression technique is used to analyze the impact of the independent variable(s)on the dependent variable. In this study, the ordinary least squares (OLS) regression modelwas applied to analyze the impact of criterion layers on the output to achieve the objectivehere, and we developed the following three models:
APt = α0in ft + α1scit + ut + εt (1)
APt = β0in ft + β1matt + β1scit + ut + εt (2)
APt = γ0mect + γ1 pubt + γ1scit + ut + εt (3)
where APt is agricultural production efficiency, in ft represents agricultural infrastructure,matt denotes agricultural materials, scit denotes science and technology services, mectrepresents agricultural mechanisms, and pubt denotes social and public services. α, β,and γ are parameters to be estimated; ε is the random error term; and u is the randomfixed effect.
Land 2022, 11, 347 9 of 18
3. Model Results and Analysis3.1. Analysis of the Agricultural Socialized Service Level
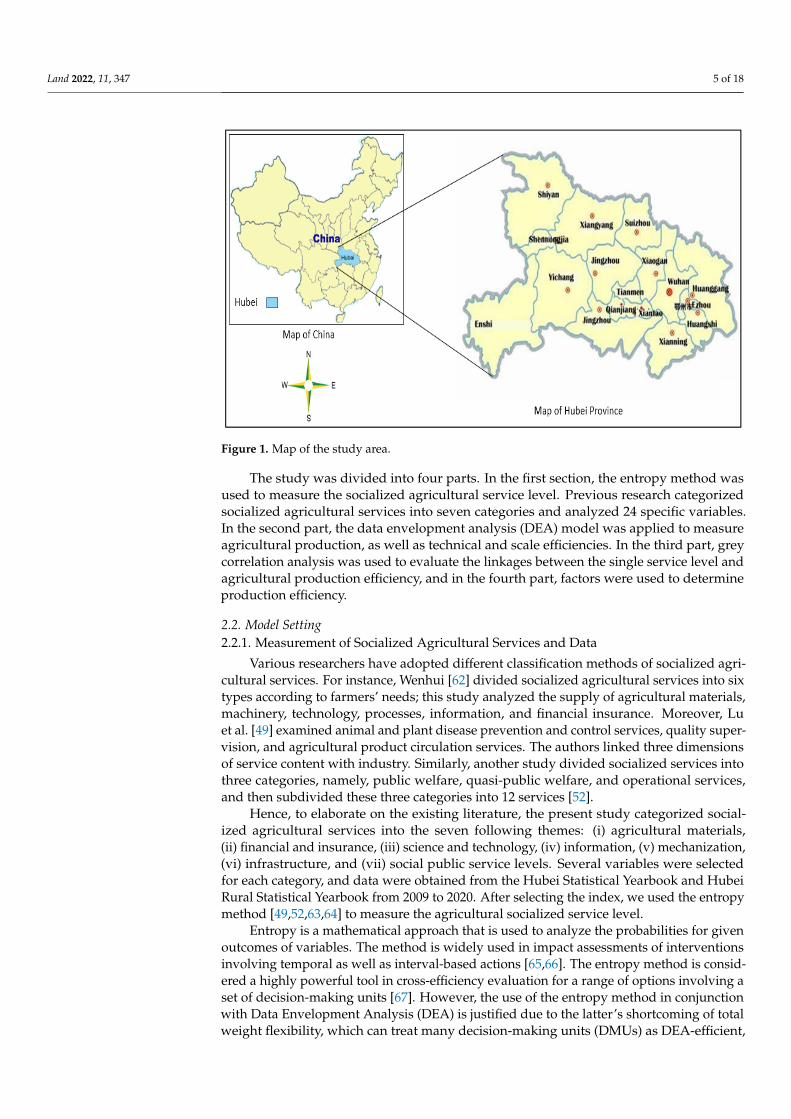
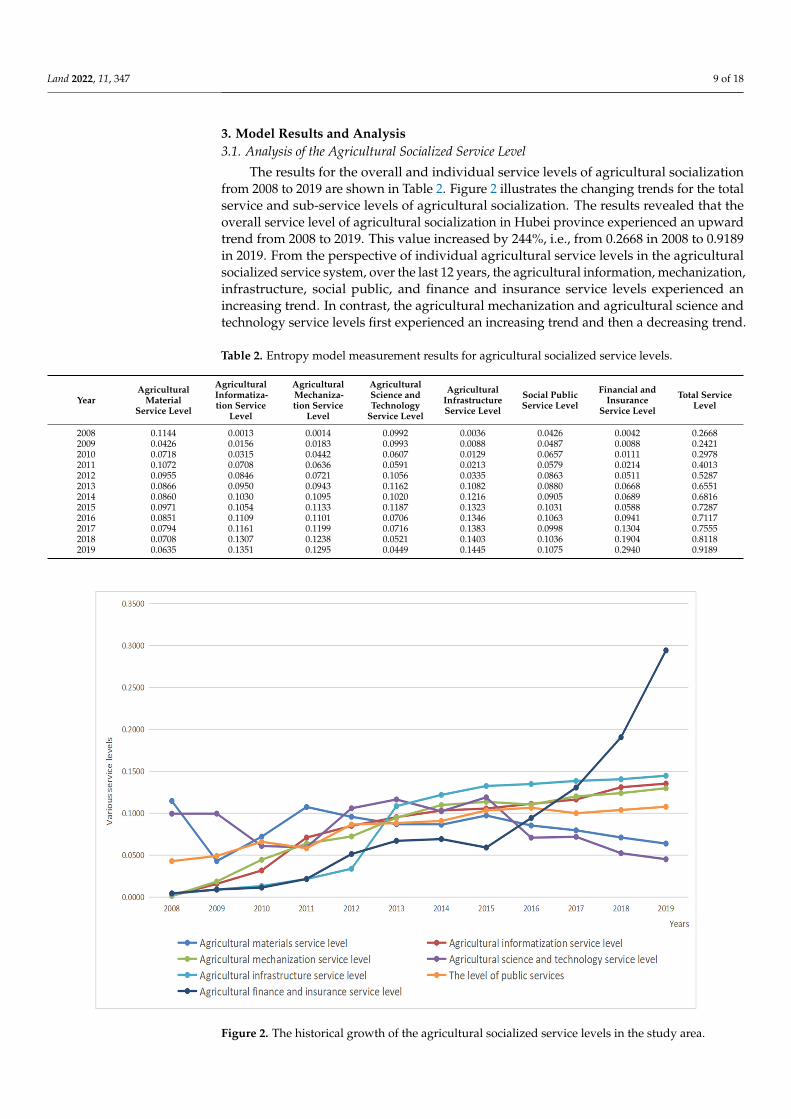
The results for the overall and individual service levels of agricultural socializationfrom 2008 to 2019 are shown in Table 2. Figure 2 illustrates the changing trends for the totalservice and sub-service levels of agricultural socialization. The results revealed that theoverall service level of agricultural socialization in Hubei province experienced an upwardtrend from 2008 to 2019. This value increased by 244%, i.e., from 0.2668 in 2008 to 0.9189in 2019. From the perspective of individual agricultural service levels in the agriculturalsocialized service system, over the last 12 years, the agricultural information, mechanization,infrastructure, social public, and finance and insurance service levels experienced anincreasing trend. In contrast, the agricultural mechanization and agricultural science andtechnology service levels first experienced an increasing trend and then a decreasing trend.
Table 2. Entropy model measurement results for agricultural socialized service levels.
YearAgricultural
MaterialService Level
AgriculturalInformatiza-tion Service
Level
AgriculturalMechaniza-tion Service
Level
AgriculturalScience andTechnology
Service Level
AgriculturalInfrastructureService Level
Social PublicService Level
Financial andInsurance
Service Level
Total ServiceLevel
2008 0.1144 0.0013 0.0014 0.0992 0.0036 0.0426 0.0042 0.26682009 0.0426 0.0156 0.0183 0.0993 0.0088 0.0487 0.0088 0.24212010 0.0718 0.0315 0.0442 0.0607 0.0129 0.0657 0.0111 0.29782011 0.1072 0.0708 0.0636 0.0591 0.0213 0.0579 0.0214 0.40132012 0.0955 0.0846 0.0721 0.1056 0.0335 0.0863 0.0511 0.52872013 0.0866 0.0950 0.0943 0.1162 0.1082 0.0880 0.0668 0.65512014 0.0860 0.1030 0.1095 0.1020 0.1216 0.0905 0.0689 0.68162015 0.0971 0.1054 0.1133 0.1187 0.1323 0.1031 0.0588 0.72872016 0.0851 0.1109 0.1101 0.0706 0.1346 0.1063 0.0941 0.71172017 0.0794 0.1161 0.1199 0.0716 0.1383 0.0998 0.1304 0.75552018 0.0708 0.1307 0.1238 0.0521 0.1403 0.1036 0.1904 0.81182019 0.0635 0.1351 0.1295 0.0449 0.1445 0.1075 0.2940 0.9189Land 2022, 11, 347 10 of 19
Figure 2. The historical growth of the agricultural socialized service levels in the study area.
The trends shown in Figure 2 can be attributed to the following reasons. First, these
results were due to the subsidy policy for purchasing agricultural machines and tools and
the comprehensive promotion of agricultural mechanization. Previous studies found that
agricultural machinery services played a prominent and positive role in improving agri‐
cultural production efficiency [42,47–75], thereby increasing farmers’ income and promot‐
ing rural revitalization. Second, agriculture is the primary sector that impacts the stability
of the country’s national economy. In recent years, the state has rectified and built a finan‐
cial market system and guided funds for investing in agricultural infrastructure. Third,
the technical level of agricultural production in Hubei province is high, and the govern‐
ment is paying increasingly more attention to agricultural production. However, the ser‐
vice levels of farming materials and agricultural science and technology trends were
found to decline, possibly due to the influence of national policies. For instance, there re‐
mains a weak diffusion rate of research results between scientific researchers and farmers
because farmers are more willing to believe their own practical experience, which hinders
the process of agricultural modernization in the country to a certain extent.
3.2. Analysis of Agricultural Production Efficiency
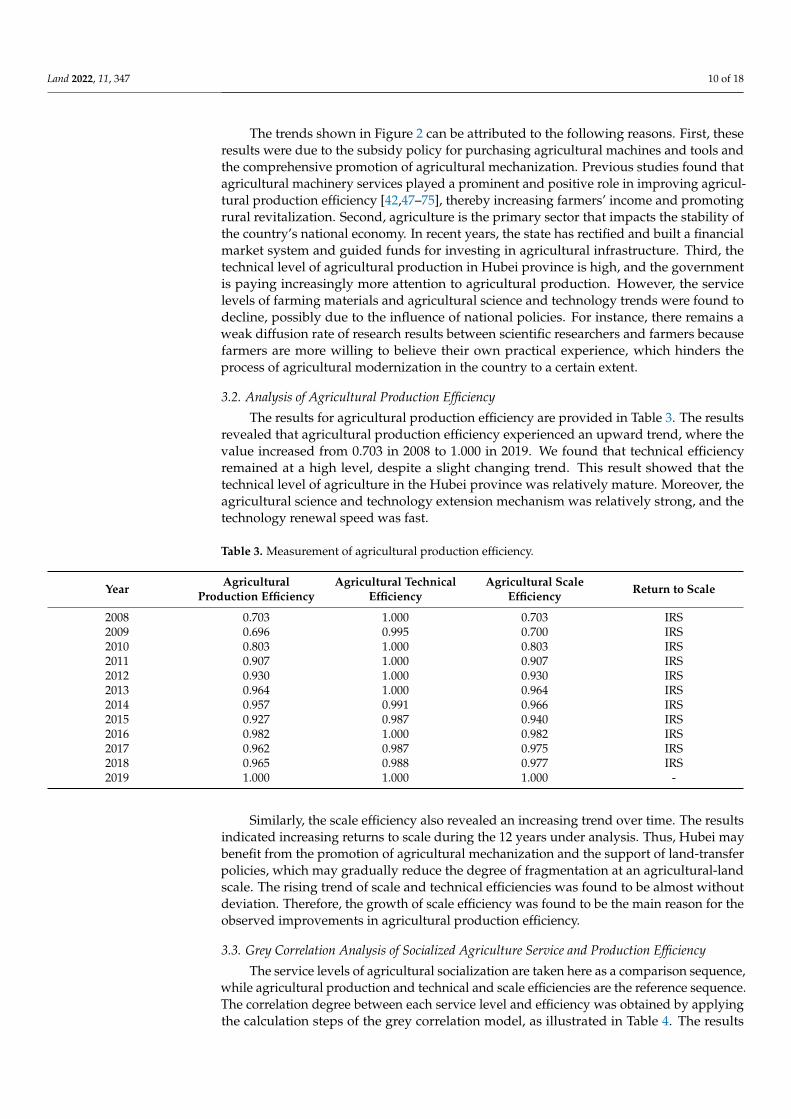
The results for agricultural production efficiency are provided in Table 3. The results
revealed that agricultural production efficiency experienced an upward trend, where the
value increased from 0.703 in 2008 to 1.000 in 2019. We found that technical efficiency
remained at a high level, despite a slight changing trend. This result showed that the tech‐
nical level of agriculture in the Hubei province was relatively mature. Moreover, the ag‐
ricultural science and technology extension mechanism was relatively strong, and the
technology renewal speed was fast.
Similarly, the scale efficiency also revealed an increasing trend over time. The results
indicated increasing returns to scale during the 12 years under analysis. Thus, Hubei may
benefit from the promotion of agricultural mechanization and the support of land‐transfer
Figure 2. The historical growth of the agricultural socialized service levels in the study area.
Land 2022, 11, 347 10 of 18
The trends shown in Figure 2 can be attributed to the following reasons. First, theseresults were due to the subsidy policy for purchasing agricultural machines and tools andthe comprehensive promotion of agricultural mechanization. Previous studies found thatagricultural machinery services played a prominent and positive role in improving agricul-tural production efficiency [42,47–75], thereby increasing farmers’ income and promotingrural revitalization. Second, agriculture is the primary sector that impacts the stability ofthe country’s national economy. In recent years, the state has rectified and built a financialmarket system and guided funds for investing in agricultural infrastructure. Third, thetechnical level of agricultural production in Hubei province is high, and the governmentis paying increasingly more attention to agricultural production. However, the servicelevels of farming materials and agricultural science and technology trends were found todecline, possibly due to the influence of national policies. For instance, there remains aweak diffusion rate of research results between scientific researchers and farmers becausefarmers are more willing to believe their own practical experience, which hinders theprocess of agricultural modernization in the country to a certain extent.
3.2. Analysis of Agricultural Production Efficiency
The results for agricultural production efficiency are provided in Table 3. The resultsrevealed that agricultural production efficiency experienced an upward trend, where thevalue increased from 0.703 in 2008 to 1.000 in 2019. We found that technical efficiencyremained at a high level, despite a slight changing trend. This result showed that thetechnical level of agriculture in the Hubei province was relatively mature. Moreover, theagricultural science and technology extension mechanism was relatively strong, and thetechnology renewal speed was fast.
Table 3. Measurement of agricultural production efficiency.
Year AgriculturalProduction Efficiency
Agricultural TechnicalEfficiency
Agricultural ScaleEfficiency Return to Scale
2008 0.703 1.000 0.703 IRS2009 0.696 0.995 0.700 IRS2010 0.803 1.000 0.803 IRS2011 0.907 1.000 0.907 IRS2012 0.930 1.000 0.930 IRS2013 0.964 1.000 0.964 IRS2014 0.957 0.991 0.966 IRS2015 0.927 0.987 0.940 IRS2016 0.982 1.000 0.982 IRS2017 0.962 0.987 0.975 IRS2018 0.965 0.988 0.977 IRS2019 1.000 1.000 1.000 -
Similarly, the scale efficiency also revealed an increasing trend over time. The resultsindicated increasing returns to scale during the 12 years under analysis. Thus, Hubei maybenefit from the promotion of agricultural mechanization and the support of land-transferpolicies, which may gradually reduce the degree of fragmentation at an agricultural-landscale. The rising trend of scale and technical efficiencies was found to be almost withoutdeviation. Therefore, the growth of scale efficiency was found to be the main reason for theobserved improvements in agricultural production efficiency.
3.3. Grey Correlation Analysis of Socialized Agriculture Service and Production Efficiency
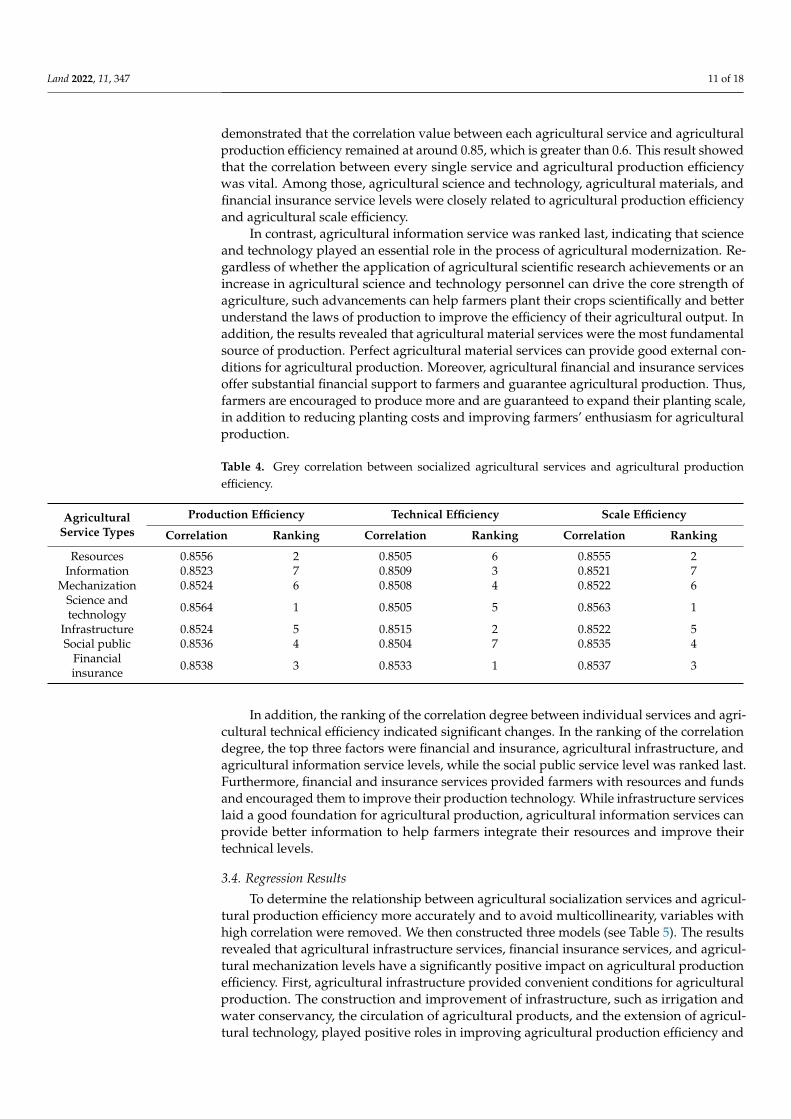
The service levels of agricultural socialization are taken here as a comparison sequence,while agricultural production and technical and scale efficiencies are the reference sequence.The correlation degree between each service level and efficiency was obtained by applyingthe calculation steps of the grey correlation model, as illustrated in Table 4. The results
Land 2022, 11, 347 11 of 18
demonstrated that the correlation value between each agricultural service and agriculturalproduction efficiency remained at around 0.85, which is greater than 0.6. This result showedthat the correlation between every single service and agricultural production efficiencywas vital. Among those, agricultural science and technology, agricultural materials, andfinancial insurance service levels were closely related to agricultural production efficiencyand agricultural scale efficiency.
In contrast, agricultural information service was ranked last, indicating that scienceand technology played an essential role in the process of agricultural modernization. Re-gardless of whether the application of agricultural scientific research achievements or anincrease in agricultural science and technology personnel can drive the core strength ofagriculture, such advancements can help farmers plant their crops scientifically and betterunderstand the laws of production to improve the efficiency of their agricultural output. Inaddition, the results revealed that agricultural material services were the most fundamentalsource of production. Perfect agricultural material services can provide good external con-ditions for agricultural production. Moreover, agricultural financial and insurance servicesoffer substantial financial support to farmers and guarantee agricultural production. Thus,farmers are encouraged to produce more and are guaranteed to expand their planting scale,in addition to reducing planting costs and improving farmers’ enthusiasm for agriculturalproduction.
Table 4. Grey correlation between socialized agricultural services and agricultural productionefficiency.
AgriculturalService Types
Production Efficiency Technical Efficiency Scale Efficiency
Correlation Ranking Correlation Ranking Correlation Ranking
Resources 0.8556 2 0.8505 6 0.8555 2Information 0.8523 7 0.8509 3 0.8521 7
Mechanization 0.8524 6 0.8508 4 0.8522 6Science andtechnology 0.8564 1 0.8505 5 0.8563 1
Infrastructure 0.8524 5 0.8515 2 0.8522 5Social public 0.8536 4 0.8504 7 0.8535 4
Financialinsurance 0.8538 3 0.8533 1 0.8537 3
In addition, the ranking of the correlation degree between individual services and agri-cultural technical efficiency indicated significant changes. In the ranking of the correlationdegree, the top three factors were financial and insurance, agricultural infrastructure, andagricultural information service levels, while the social public service level was ranked last.Furthermore, financial and insurance services provided farmers with resources and fundsand encouraged them to improve their production technology. While infrastructure serviceslaid a good foundation for agricultural production, agricultural information services canprovide better information to help farmers integrate their resources and improve theirtechnical levels.
3.4. Regression Results
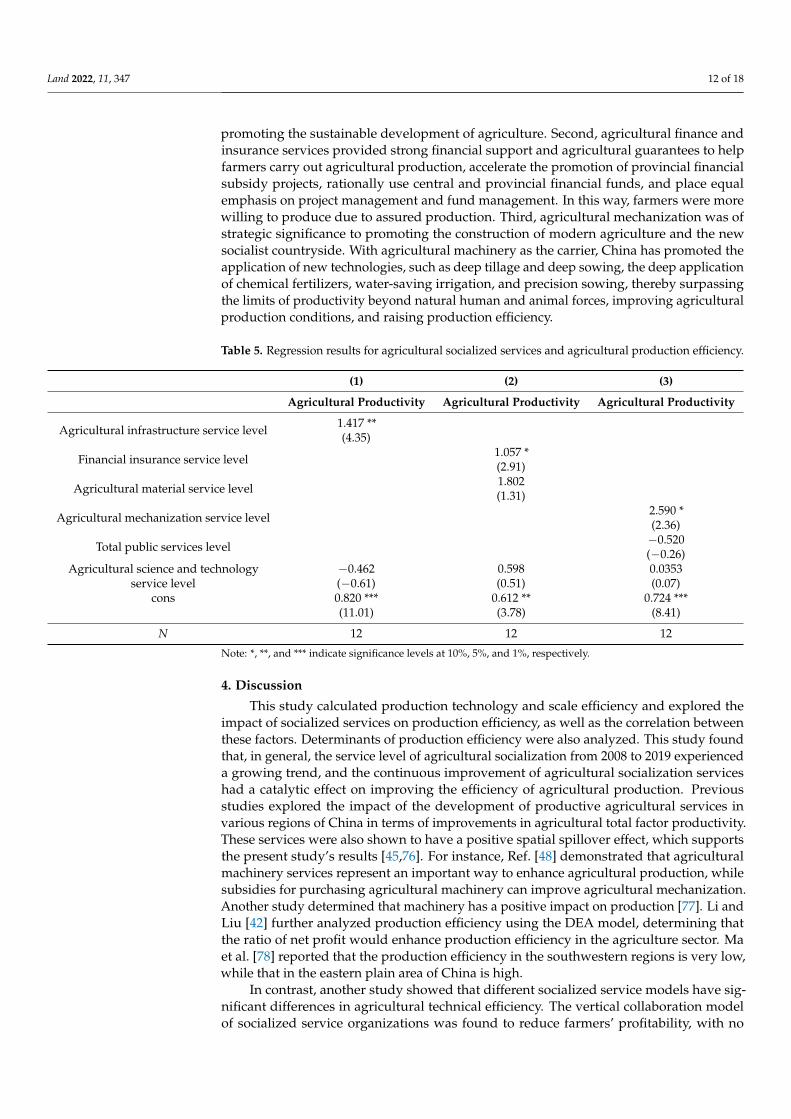
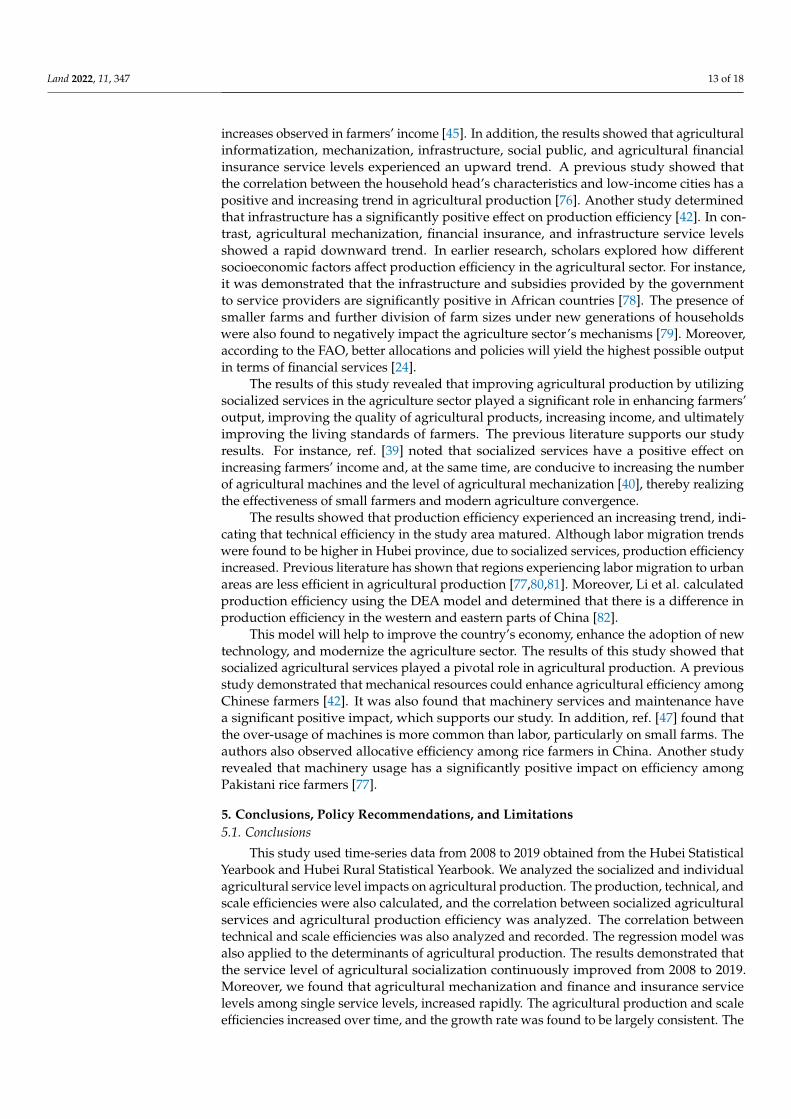
To determine the relationship between agricultural socialization services and agricul-tural production efficiency more accurately and to avoid multicollinearity, variables withhigh correlation were removed. We then constructed three models (see Table 5). The resultsrevealed that agricultural infrastructure services, financial insurance services, and agricul-tural mechanization levels have a significantly positive impact on agricultural productionefficiency. First, agricultural infrastructure provided convenient conditions for agriculturalproduction. The construction and improvement of infrastructure, such as irrigation andwater conservancy, the circulation of agricultural products, and the extension of agricul-tural technology, played positive roles in improving agricultural production efficiency and
Land 2022, 11, 347 12 of 18
promoting the sustainable development of agriculture. Second, agricultural finance andinsurance services provided strong financial support and agricultural guarantees to helpfarmers carry out agricultural production, accelerate the promotion of provincial financialsubsidy projects, rationally use central and provincial financial funds, and place equalemphasis on project management and fund management. In this way, farmers were morewilling to produce due to assured production. Third, agricultural mechanization was ofstrategic significance to promoting the construction of modern agriculture and the newsocialist countryside. With agricultural machinery as the carrier, China has promoted theapplication of new technologies, such as deep tillage and deep sowing, the deep applicationof chemical fertilizers, water-saving irrigation, and precision sowing, thereby surpassingthe limits of productivity beyond natural human and animal forces, improving agriculturalproduction conditions, and raising production efficiency.
Table 5. Regression results for agricultural socialized services and agricultural production efficiency.
(1) (2) (3)
Agricultural Productivity Agricultural Productivity Agricultural Productivity
Agricultural infrastructure service level 1.417 **(4.35)
Financial insurance service level 1.057 *(2.91)
Agricultural material service level 1.802(1.31)
Agricultural mechanization service level 2.590 *(2.36)
Total public services level −0.520(−0.26)
Agricultural science and technologyservice level
−0.462(−0.61)
0.598(0.51)
0.0353(0.07)
cons 0.820 *** 0.612 ** 0.724 ***(11.01) (3.78) (8.41)
N 12 12 12
Note: *, **, and *** indicate significance levels at 10%, 5%, and 1%, respectively.
4. Discussion
This study calculated production technology and scale efficiency and explored theimpact of socialized services on production efficiency, as well as the correlation betweenthese factors. Determinants of production efficiency were also analyzed. This study foundthat, in general, the service level of agricultural socialization from 2008 to 2019 experienceda growing trend, and the continuous improvement of agricultural socialization serviceshad a catalytic effect on improving the efficiency of agricultural production. Previousstudies explored the impact of the development of productive agricultural services invarious regions of China in terms of improvements in agricultural total factor productivity.These services were also shown to have a positive spatial spillover effect, which supportsthe present study’s results [45,76]. For instance, Ref. [48] demonstrated that agriculturalmachinery services represent an important way to enhance agricultural production, whilesubsidies for purchasing agricultural machinery can improve agricultural mechanization.Another study determined that machinery has a positive impact on production [77]. Li andLiu [42] further analyzed production efficiency using the DEA model, determining thatthe ratio of net profit would enhance production efficiency in the agriculture sector. Maet al. [78] reported that the production efficiency in the southwestern regions is very low,while that in the eastern plain area of China is high.
In contrast, another study showed that different socialized service models have sig-nificant differences in agricultural technical efficiency. The vertical collaboration modelof socialized service organizations was found to reduce farmers’ profitability, with no
Land 2022, 11, 347 13 of 18
increases observed in farmers’ income [45]. In addition, the results showed that agriculturalinformatization, mechanization, infrastructure, social public, and agricultural financialinsurance service levels experienced an upward trend. A previous study showed thatthe correlation between the household head’s characteristics and low-income cities has apositive and increasing trend in agricultural production [76]. Another study determinedthat infrastructure has a significantly positive effect on production efficiency [42]. In con-trast, agricultural mechanization, financial insurance, and infrastructure service levelsshowed a rapid downward trend. In earlier research, scholars explored how differentsocioeconomic factors affect production efficiency in the agricultural sector. For instance,it was demonstrated that the infrastructure and subsidies provided by the governmentto service providers are significantly positive in African countries [78]. The presence ofsmaller farms and further division of farm sizes under new generations of householdswere also found to negatively impact the agriculture sector’s mechanisms [79]. Moreover,according to the FAO, better allocations and policies will yield the highest possible outputin terms of financial services [24].
The results of this study revealed that improving agricultural production by utilizingsocialized services in the agriculture sector played a significant role in enhancing farmers’output, improving the quality of agricultural products, increasing income, and ultimatelyimproving the living standards of farmers. The previous literature supports our studyresults. For instance, ref. [39] noted that socialized services have a positive effect onincreasing farmers’ income and, at the same time, are conducive to increasing the numberof agricultural machines and the level of agricultural mechanization [40], thereby realizingthe effectiveness of small farmers and modern agriculture convergence.
The results showed that production efficiency experienced an increasing trend, indi-cating that technical efficiency in the study area matured. Although labor migration trendswere found to be higher in Hubei province, due to socialized services, production efficiencyincreased. Previous literature has shown that regions experiencing labor migration to urbanareas are less efficient in agricultural production [77,80,81]. Moreover, Li et al. calculatedproduction efficiency using the DEA model and determined that there is a difference inproduction efficiency in the western and eastern parts of China [82].
This model will help to improve the country’s economy, enhance the adoption of newtechnology, and modernize the agriculture sector. The results of this study showed thatsocialized agricultural services played a pivotal role in agricultural production. A previousstudy demonstrated that mechanical resources could enhance agricultural efficiency amongChinese farmers [42]. It was also found that machinery services and maintenance havea significant positive impact, which supports our study. In addition, ref. [47] found thatthe over-usage of machines is more common than labor, particularly on small farms. Theauthors also observed allocative efficiency among rice farmers in China. Another studyrevealed that machinery usage has a significantly positive impact on efficiency amongPakistani rice farmers [77].
5. Conclusions, Policy Recommendations, and Limitations5.1. Conclusions
This study used time-series data from 2008 to 2019 obtained from the Hubei StatisticalYearbook and Hubei Rural Statistical Yearbook. We analyzed the socialized and individualagricultural service level impacts on agricultural production. The production, technical, andscale efficiencies were also calculated, and the correlation between socialized agriculturalservices and agricultural production efficiency was analyzed. The correlation betweentechnical and scale efficiencies was also analyzed and recorded. The regression model wasalso applied to the determinants of agricultural production. The results demonstrated thatthe service level of agricultural socialization continuously improved from 2008 to 2019.Moreover, we found that agricultural mechanization and finance and insurance servicelevels among single service levels, increased rapidly. The agricultural production and scaleefficiencies increased over time, and the growth rate was found to be largely consistent. The
Land 2022, 11, 347 14 of 18
continuous increase in scale efficiency was due to an increase in agricultural productionefficiency.
Furthermore, agricultural technical efficiency maintained a high level over the 12 yearsanalyzed. The highest degree of correlation with agricultural production and scale efficiencywas found for science and technology, materials, and financial insurance service levels.Financial insurance services had the highest degree of correlation with technical efficiency inagriculture. The appropriate large-scale development of land scale can improve agriculturalproduction efficiency and, at the same time, stimulate demand for socialized agriculturalservices. Financial, insurance, agricultural science and technology services were found to beclosely related to agricultural production efficiency, but the level of correlation between thetwo categories showed a downward trend. According to the regression results, agriculturalinfrastructure, financial insurance, and agricultural mechanization service levels had apositively significant impact on production efficiency.
The work also makes significant contributions on the theoretical front using theperspective of community-based services and their role in the productivity of agriculture.It is evident from the findings that provision of farm services would theoretically equipfarm households with a leverage to aim for added investment in the farm of non-serviceinputs such as seed, fertilizer and chemicals that would indirectly mediate the increase inproductive efficiency of the farmers participating in the program. The socialized servicesare deemed to theoretically improve economies of scale as well as can lead to demonstrationeffect on those who are not part of such programs. On international front, many developingcountries as well as developed one can benefit from the findings of this study to focus ofprovision of such services instead of concentrating the direct payment of subsidies. Thestudy confirms that there is a potential benefit by participating in the commonly providedfarm-based services—at least farm machinery—instead of completely relying on outsourcedor rented services. Agricultural socialized services (ASS) have progressed at a fair pacein most parts of China, for which, the findings of this study provide valuable insights forinternational benchmarking on such moves. However, there are potential options for thepiloting of ASS in many African and South Asian countries chiefly dependent on arableagriculture and often constrained by availability and affordability issues linked with farmservices, particularly farm-related machinery.
5.2. Policy Recommendations
Considering the study results, the following policies are recommended.Agricultural financial and insurance services should be improved and strengthened
and credit support should be increased for agricultural development. Stakeholders andpolicymakers should devote their full attention to the leading role played by large nationaland commercial banks in supporting the agriculture sector. For instance, the number ofbank outlets in township areas should be increased, and the quality of services should beimproved. In addition, the interest rates of agricultural loans should be reduced, the smallagricultural loan system should be improved, and farmers should be encouraged to obtaingood credit services. Moreover, agricultural insurance needs to be publicized and its typesshould be increased to reduce risk in agricultural production.
Moreover, the transformation of agricultural scientific and technological achievementsshould be accelerated, and a cooperative scientific research system should be establishedbetween farmers and academia to create a professional agricultural development model.These provisions will help to enhance agricultural production through the applicationof agricultural scientific research achievements and promote the process of agriculturalmodernization. Ultimately, the agricultural socialized service industry is a knowledge-intensive industry that required high-quality and highly skilled professionals to providecomplete services to farmers and improve production efficiency.
Policymakers and stakeholders should promote an appropriate scale of rural landand encourage innovative land transfer. As urbanization continues to accelerate, resultingin land wastage, a land transfer policy should also be developed. Large-scale rural land
Land 2022, 11, 347 15 of 18
could help stimulate farmers’ demands for socialized agricultural services and promotecontinuous improvement in the sector. At the same time, these measures would reducefarmers’ production costs, improve scale and production efficiency, and alleviate theproblems caused by the reduction in the rural population.
This study provides insight into the socialized mechanisms in use among farmers inChina and the impacts of these mechanisms on agricultural output efficiency. Althougheach country has its policies and resources, the findings of the present study may help othercountries and regions to adopt this system and similar models. These results and policyrecommendations may be especially helpful for other countries that have small farmingsystems and high urban migration rates.
5.3. Limitations
Although this study covered different aspects of the topic, the following limitationsremain. This study did not consider data on precipitation, which is important for productionin terms of environmental impacts. Moreover, agricultural plastic film and subsidy policiesfor agriculture variables were not calculated in this analysis; therefore, future researchshould consider these variables. Furthermore, household socio-economic variables, suchas the number of households, education, and dependent children, were unaccounted for.Thus, future studies should consider integrating a primary survey with the present study’sfactors to more deeply understand aspects that influence production efficiency.
Author Contributions: Conceptualization, T.C. and M.R.; methodology, T.C. and M.R.; software,T.C.; validation, A.A. and M.R.; formal analysis, T.C.; investigation, T.C.; resources, M.R. and T.C.;data curation, A.A.; writing—original draft preparation, T.C.; writing—review and editing, M.R. andA.A.; visualization, A.A.; supervision, M.R.; funding acquisition, T.C. All authors have read andagreed to the published version of the manuscript.
Funding: This research was supported by Hubei Provincial Government Project Nos. HBZZ-2018-18and HBZZ-2019-10, as well as the Doctor Initiative Fund, Yangtze University.
Institutional Review Board Statement: Not applicable.
Informed Consent Statement: Informed consent was obtained from all subjects involved in the study.
Data Availability Statement: Data will be available from the first author on demand.
Acknowledgments: We appreciate the four anonymous reviewers of this journal for their valuablecomments to improve this study. We are also thankful to Gama Rivas Dahro for helping withmanaging the publishing process according to the journal requirements and instructions.
Conflicts of Interest: The authors declare no conflict of interest.
References1. Liu, Y.; Zhou, Y.; Li, Y. Rural regional system and rural revitalization strategy in China. Acta Geogr. Sin. 2019, 74, 2511–2528.2. Liu, Y. Research on the geography of rural revitalization in the new era. Geogr. Res. 2019, 38, 461–466.3. Liu, Y.; Li, Y. Revitalize the world’s countryside. Nature 2017, 548, 275–277. [CrossRef]4. Nelson, P.B. Rural restructuring in the AmericanWest: Land use, family and class discourses. J. Rural Stud. 2001, 17, 395–407.
[CrossRef]5. Holmes, J. Impulses towards a multifunctional transition in rural Australia: Gaps in the research agenda. J. Rural Stud. 2006, 22,
142–160. [CrossRef]6. Wilson, O.J. Rural restructuring and agriculture-rural economy linkages: A New Zealand study. J. Rural Stud. 1995, 11, 417–431.
[CrossRef]7. Lobley, M.; Potter, C. Agricultural change and restructuring: Recent evidence from a survey of agricultural households in England.
J. Rural Stud. 2004, 20, 499–510. [CrossRef]8. Bañski, J.; Stola, W. Transformation of the spatial and functional structure of rural areas in Poland. J. Rural Stud. 2002, 3, 13.9. Liu, Y. Introduction to land use and rural sustainability in China. Land Use Policy 2018, 74, 1–4. [CrossRef]10. Long, H. Land consolidation and rural spatial restructuring. Acta Geogr. Sin. 2013, 68, 1019–1028.11. FAO. Food and Agricultural Organisation, Data Base Results; Retrieved June; FAO: Rome, Italy, 2015.12. Dolgonosov, B.M. Knowledge production and world population dynamics. Technol. Forecast. Soc. Chang. 2016, 103, 127–141.
[CrossRef]
Land 2022, 11, 347 16 of 18
13. Foley, J.A.; DeFries, R.; Asner, G.P.; Barford, C.; Bonan, G.; Carpenter, S.R.; Chapin, F.S.; Coe, M.T.; Daily, G.C.; Gibbs, H.K.; et al.Global consequences of land use. Science 2005, 309, 570–574. [CrossRef] [PubMed]
14. Guerra, C.A.; Metzger, M.J.; Maes, J.; Pinto-Correia, T. Policy impacts on regulating ecosystem services: Looking at the implicationsof 60 years of landscape change on soil erosion prevention in a Mediterranean silvo-pastoral system. Landsc. Ecol. 2016, 31,271–290. [CrossRef]
15. Li, P.; Wu, J.; Qian, H. Regulation of secondary soil salinization in semi-arid regions: A simulation research in the Nanshantaiziarea along the Silk Road, northwest China. Environ. Earth Sci. 2016, 75, 1–12. [CrossRef]
16. Saina, K.; Murgor, K.; Murgor, C. Climate change and food security. In Environmental Change and Sustainability, 1st ed.; Silvern, S.,Young, S., Eds.; InTechOpen: London, UK, 2013; pp. 235–257.
17. Prosdocimi, M.; Burguet, M.; Di Prima, S.; Sofia, G.; Terol, E.; Comino, J.R.; Cerdà, A.; Tarolli, P. Rainfall simulation andStructure-from-Motion photogrammetry for the analysis of soil water erosion in Mediterranean vineyards. Sci. Total Environ.2017, 574, 204–215. [CrossRef]
18. Yang, F.; An, F.; Ma, H.; Wang, Z.; Zhou, X.; Liu, Z. Variations on soil salinity and sodicity and its driving factors analysis undermicrotopography in different hydrological conditions. Water 2016, 8, 227. [CrossRef]
19. Amjath-Babu, T.S.; Krupnik, T.J.; Aravindakshan, S.; Arshad, M.; Kaechele, H. Climate change and indicators of probable shiftsin the consumption portfolios of dryland farmers in Sub-Saharan Africa: Implications for policy. Ecol. Indic. 2016, 67, 830–838.[CrossRef]
20. Graveline, N. Economic calibrated models for water allocation in agricultural production: A review. Environ. Model. Softw. 2016,81, 12–25. [CrossRef]
21. Grundy, M.J.; Bryan, B.A.; Nolan, M.; Battaglia, M.; Hatfield-Dodds, S.; Connor, J.D.; Keating, B.A. Scenarios for Australianagricultural production and land use to 2050. Agric. Syst. 2016, 142, 70–83. [CrossRef]
22. Zhang, Q.; Sun, Z.; Wu, F.; Deng, X. Understanding rural restructuring in China: The impact of changes in labor and capitalproductivity on domestic agricultural production and trade. J. Rural. Stud. 2016, 47, 552–562. [CrossRef]
23. United Nations Industrial Development Organization. Agricultural Mechanization in Africa . . . Time for Action: Planning Investmentfor Enhanced Agricultural Productivity; Food and Agriculture Organization of the United Nationsrome: Rome, Italy, 2008.
24. FAO. Agricultural Mechanization in Mali and Ghana: Strategies, Experiences and Lessons for Sustained Impacts; FAO: Rome, Italy, 2010.25. Manta, I.H.; Aduba, J.J. Mechanization practice: A tool for agricultural development in nigeria: A case study of Ifelodun local
government area of Kwara State. Int. J. Basic Appl. Sci. 2013, 2, 98–106.26. Akinbamowo, R.O. A review of government policy on agricultural mechanization in Nigeria. J. Agric. Ext. Rural. Dev. 2013, 5,
146–153. [CrossRef]27. Mrema, G.; Soni, P.; Rolle, R.S. A Regional Strategy for Sustainable Agricultural Mechanization: Sustainable Mechanization across
Agri-Food Chains in Asia and the Pacific Region; RAP Publication: Bangkok, Thailand, 2014.28. Schmitz, A.; Moss, C. Mechanized agriculture: Machine adoption, farm size, and labor displacement. AgBioForum 2015, 18,
278–296.29. Ma, L.; Long, H.; Zhang, Y.; Tu, S.; Ge, D.; Tu, X. Agricultural labor changes and agricultural economic development in China and
their implications for rural vitalization. J. Geogr. Sci. 2019, 29, 163–179. [CrossRef]30. Yu, J.; Wu, J. The Sustainability of Agricultural Development in China: The Agriculture–Environment Nexus. Sustainability 2018,
10, 1776. [CrossRef]31. Li, Y.; Zhang, W.; Ma, L.; Wu, L.; Shen, J.; Davies, W.J.; Oenema, O.; Zhang, F.; Dou, Z. An analysis of China’s grain production:
Looking back and looking forward. Food Energy Secur. 2014, 3, 19–32. [CrossRef]32. Adekola, K.A.; Alabadan, B.A. China Agricultural Mechanization Development Experience for Developing Countries. J. Agric.
Innov. Res. 2014, 3, 654–658.33. Chen, W. Challenges and Opportunities for Chinese Agriculture the Environmentz: Feeding Many While Protecting Environment; Palgrave
Macmillan: New York, NY, USA, 2020; ISBN 9789811535352.34. Di Iacovo, F.; O’Connor, D. Supporting Policies for Social Farming in Europe. Progressing Multifunctionality in Responsive Rural Areas;
ARSIA: Firenze, Italy, 2009.35. Renting, H.; Rossing, W.A.H.; Groot, J.C.J.; Van der Ploeg, J.D.; Laurent, C.; Perraud, D.; Stobbelaar, D.J.; Van Ittersum, M.K.
Exploring multifunctional agriculture. A review of conceptual approaches and prospects for an integrative transitional framework.J. Environ. Manag. 2009, 90, S112–S123. [CrossRef] [PubMed]
36. Van Huylenbroeck, G.; Vandermeulen, V.; Mettepenningen, E.; Verspecht, A. Multifunctionality of agriculture: A review ofdefinitions, evidence and instruments. Living Rev. Landsc. Res. 2007, 1, 1–43. [CrossRef]
37. Geng, S.; Ren, T.; Wang, M. Technology and Infrastructure Considerations for E-Commerce in Chinese Agriculture. Agric. Sci.China 2007, 6, 1–10. [CrossRef]
38. Wang, S.J.; Ma, J.K.; Li, N. How does the scale of farmland management affect farmers’ choice of agricultural mechanization?Rural Econ. 2021, 4, 111–118.
39. Zhou, X.; Ma, W.; Li, G.; Qiu, H. Farm machinery use and maize yields in China: An analysis accounting for selection bias andheterogeneity. Aust. J. Agric. Resour. Econ. 2020, 64, 1282–1307. [CrossRef]
40. Wang, Y.M.; Chin, K.S.; Jiang, P. Weight determination in the cross-efficiency evaluation. Comput. Ind. Eng. 2011, 61, 497–502.[CrossRef]
Land 2022, 11, 347 17 of 18
41. Postner, H.H. Factor Content of Canadian International Trade: An Input-Output Analysis. J. Int. Econ. 1977, 2, 209–211.42. Li, Z.; Liu, X. The Effects of Rural Infrastructure Development on Agricultural Production Technical Efficiency: Evidence from the
Data of Second National Agricultural Census of China. Technology 2009, 2009, 1–19. [CrossRef]43. Shuqi, S.; Jiasheng, W.; Dongwei, W. Development of Agricultural Mechanization in China and Its Current Strategic Focus. Agric.
Mach. Technol. 2019, 13, 4–7. [CrossRef]44. Ming, H. Study on the synergistic development effect of producer services and agriculture in China. Agric. Econ. Issues 2013, 34,
25–30+110.45. Zhang, K. Grey correlation analysis of agricultural socialized service and agricultural production efficiency—Taking Xinjiang as
an example. Pract. Underst. Math. 2021, 51, 52–62.46. Ji, Y.; Wang, X.; Lu, W. Characteristics of agricultural labor force, land fragmentation and socialized service of agricultural
machinery. Res. Agric. Mod. 2016, 37, 910–916.47. Shi, M.; Paudel, K.P.; Chen, F. Mechanization and efficiency in rice production in China. J. Integr. Agric. 2021, 20, 1996–2008.
[CrossRef]48. Yang, Z.; Zhang, J.Z.P. Can agricultural socialized services promote small farmers to connect with agricultural modernization—
from the perspective of technical efficiency. Agric. Technol. Econ. 2019, 6, 16–26.49. Hua, L.; Hao, H.G.X. Impact of agricultural socialized service on agricultural technical efficiency. J. Cent. South Univ. Econ. Law
2020, 69, 159–160.50. Zhang, D.; Wang, H.; Lou, S.; Zhong, S. Research on grain production efficiency in China’s main grain producing areas from the
perspective of financial support. PLoS ONE 2021, 16, e0247610. [CrossRef] [PubMed]51. Qian, L.; Xiao, R.Y.G. Evaluation of agricultural production efficiency in Anhui Province Based on DEA model. Ind. Technol. Econ.
2010, 29, 121–126.52. Zhong, L.; Jinjie, T.; Shubin, Z.K.X. Measurement of agricultural socialized service level and Deconstruction of restrictive factors
in Jiangxi Province. Guangdong Agric. Sci. 2014, 41, 199–204.53. Qain, L.; Lu, H.; Gao, Q.; Lu, H. Household-owned farm machinery vs. outsourced machinery services: The impact of agricultural
mechanization on the land leasing behavior of relatively large-scale farmers in China. Land Use Policy 2022, 115, 106008. [CrossRef]54. Chen, Q.; Hu, R.; Sun, Y.; Zhang, C. How Does Rural–Urban Migration Experience Affect Arable Land Use? Evidence from 2293
Farmers in China. Land 2020, 9, 400. [CrossRef]55. Cai, B.; Shi, F.; Huang, Y.; Abatechanie, M. The Impact of Agricultural Socialized Services to Promote the Farmland Scale Manage-
ment Behavior of Smallholder Farmers: Empirical Evidence from the Rice-Growing Region of Southern China. Sustainability 2022,14, 316. [CrossRef]
56. Paudel, G.P.; Kc, D.B.; Khanal, N.P.; Justice, S.E.; McDonald, A.J. Smallholder farmers’ willingness to pay for scale-appropriatefarm mechanization: Evidence from the mid-hills of Nepal. Technol. Soc. 2019, 59, 101196. [CrossRef] [PubMed]
57. Zheng, H.; Ma, W.; Guo, Y.; Zhou, X. Interactive relationship between non-farm employment and mechanization serviceexpenditure in rural China. China Agric. Econ. Rev. 2021. [CrossRef]
58. Belton, B.; Win, M.T.; Zhang, X.; Filipski, M. The rapid rise of agricultural mechanization in Myanmar. Food Policy 2021, 101,102095. [CrossRef]
59. Qiu, T.; Luo, B. Do small farms prefer agricultural mechanization services? Evidence from wheat production in China. Appl. Econ.2021, 53, 2962–2973. [CrossRef]
60. De Brauw, A.; Mueller, V.; Lee, H.L. The Role of Rural-Urban Migration in the Structural Transformation of Sub-Saharan Africa.World Dev. 2014, 63, 33–42. [CrossRef]
61. Hazell, P.; Poulton, C.; Wiggins, S.; Dorward, A. The Future of Small Farms: Trajectories and Policy Priorities. World Dev. 2010, 38,1349–1361. [CrossRef]
62. Wenhui, Z. Study on the impact of agricultural socialized services on agricultural industrial structure in Shandong Province.Shandong Univ. Technol. 2020, 3, 157–168.
63. Sun, X. Green city and regional environmental economic evaluation based on entropy method and GIS. Environ. Technol. Innov.2021, 23, 101667. [CrossRef]
64. Jianbo, R.; Xiaohong, L.; Jingfeng, Y.L.Y. Enlightenment of domestic and foreign experience in the construction of agriculturalsocialized service system to Guangxi. Trop. Agric. Sci. 2021, 41, 125–130.
65. Wu, J.; Sun, J.; Liang, L.; Zha, Y. Determination of weights for ultimate cross efficiency using Shannon entropy. Expert Syst. Appl.2011, 38, 5162–5165. [CrossRef]
66. Wu, J.; Sun, J.; Liang, L. DEA cross-efficiency aggregationmethod based upon Shannon entropy. Int. J. Prod. Res. 2012, 50,6726–6736. [CrossRef]
67. Su, C.-H.; Lu, T. An Entropy-Based Cross-Efficiency under Variable Returns to Scale. Entropy 2019, 21, 1205. [CrossRef]68. Despotis, D.K. Improving the discriminating power of DEA: Focus on globally efficient units. J. Oper. Res. Soc. 2002, 53, 314–323.
[CrossRef]69. Doyle, J.; Green, R. Efficiency and cross-efficiency in DEA: Derivations, meanings and uses. J. Oper. Res. Soc. 1994, 45, 567–578.
[CrossRef]70. Liang, L.; Wu, J.; Cook, W.D.; Zhu, J. Alternative secondary goals in DEA cross-efficiency evaluation. Int. J. Prod. Econ. 2008, 113,
1025–1030. [CrossRef]
Land 2022, 11, 347 18 of 18
71. Liang, L.; Wu, J.; Cook, W.D.; Zhu, J. The DEA game cross-efficiency model and its Nash equilibrium. Oper. Res. 2008, 56,1278–1288. [CrossRef]
72. Hou, Q.; Wang, M.; Zhou, X. Improved DEA Cross Efficiency Evaluation Method Based on Ideal and Anti-Ideal Points. Discret.Dyn. Nat. Soc. 2018, 2018, 1604298. [CrossRef]
73. Lim, S.; Zhu, J. DEA cross-efciency evaluation under variable returns to scale. J. Oper. Res. Soc. 2015, 66, 476–487. [CrossRef]74. Qin, D.; Shao, H.; Zhao, D. Situation analysis of agricultural internal structure optimization based on grey correlation analysis
model. Stat. Decis. Mak. 2015, 2015, 104–107.75. Rizwan, M.; Ping, Q.; Saboor, A.; Ahmed, U.I.; Zhang, D.; Deyi, Z.; Teng, L. Measuring rice farmers’ risk perceptions and attitude:
Evidence from Pakistan. Hum. Ecol. Risk Assess. 2019, 26, 1832–1847. [CrossRef]76. Guo, B.; He, D.; Zhao, X.; Zhang, Z.; Dong, Y. Analysis on the spatiotemporal patterns and driving mechanisms of China’s
agricultural production efficiency from 2000 to 2015. Phys. Chem. Earth Parts A/B/C 2020, 120, 102909. [CrossRef]77. Rizwan, M.; Qing, P.; Saboor, A.; Iqbal, M.A.; Nazir, A. Production risk and competency among categorized rice peasants:
Cross-sectional evidence from an emerging country. Sustainability 2020, 12, 3770. [CrossRef]78. Ma, L.; Long, H.; Tang, L.; Tu, S.; Zhang, Y.; Qu, Y. Analysis of the spatial variations of determinants of agricultural production
efficiency in China. Comput. Electron. Agric. 2021, 180, 105890. [CrossRef]79. Kokieva, G.E.; Voinash, S.A.; Sokolova, V.A.; Gogolevski, A.S. Livestock Machinery Maintenance Efficiency. Sci. Inf. Database
2009, 11, 39. [CrossRef]80. Fei, R.; Lin, Z.; Chunga, J. How land transfer affects agricultural land use efficiency: Evidence from China’s agricultural sector.
Land Use Policy 2021, 103, 105300. [CrossRef]81. Yunju, L.; Kahrl, F.; Jianjun, P.; Roland-Holst, D.; Yufang, S.; Wilkes, A.; Jianchu, X. Fertilizer use patterns in Yunnan Province,
China: Implications for agricultural and environmental policy. Agric. Syst. 2012, 110, 78–89. [CrossRef]82. Li, N.; Jiang, Y.; Mu, H.; Yu, Z. Efficiency evaluation and improvement potential for the Chinese agricultural sector at the
provincial level based on data envelopment analysis (DEA). Energy 2018, 164, 1145–1160. [CrossRef]
Copyright © 2022 FDOKUMEN