Agricultural Situation in India
64
AGRICULTURAL SITUATION IN INDIA AGRICULTURAL SITUATION IN INDIA SEPTEMBER, 2015 GENERAL SURVEY OF AGRICULTURE FARM SECTOR NEWS ARTICLES Gaps in Estimation of Area, Production and Productivity of Horticulture Crops in Himachal Pradesh Importance of Livestock Services for Sustainability in Livestock Production:The Next Food Revolution in India Regional Disparities in the Levels of Agricultural Development in India: Comparision of Pre and Post Reform Periods AGRO ECONOMIC RESEARCH Relationship between Wholesale Prices,Retail Prices and Details of Contributing Factors for the Price Difference of Onion in Gujarat COMMODITY REVIEWS Foodgrains Commercial Crops TRENDS IN AGRICULTURE:Wages & Prices
-
Upload
khangminh22 -
Category
Documents
-
view
0 -
download
0
Transcript of Agricultural Situation in India

AGRICULTURAL
SITUATION IN INDIA
AGRICULTURAL
SITUATION IN INDIASEPTEMBER, 2015
GENERAL SURVEY OF AGRICULTURE
FARM SECTOR NEWS
ARTICLES
Gaps in Estimation of Area,Production and Productivity ofHorticulture Crops inHimachal Pradesh
Importance of LivestockServices for Sustainability inLivestock Production:The Next FoodRevolution in India
Regional Disparities in theLevels of Agricultural Development inIndia: Comparision of Pre andPost Reform Periods
AGRO ECONOMIC RESEARCHRelationship between WholesalePrices,Retail Prices and Details ofContributing Factors for thePrice Difference of Onion in Gujarat
COMMODITY REVIEWSFoodgrainsCommercial Crops
TRENDS IN AGRICULTURE:Wages & Prices

Agricultural Situationin India
VOL. LXXII September, 2015 No. 6
CONTENTS
PAGES
GENERAL SURVEY OF AGRICULTURE 1
FARM SECTOR NEWS 4
ARTICLES
Importance of Livestock Health Services for Sustainability inLivestock Production: The Next Food Revolution in India—Pushpa, Punit Agarwal, B.S. Chandel, Bulbul G. Nagrale
Regional Disparities in the Levels of Agricultural Develop-ment in India:Comparison of Pre Reform and Post ReformPeriods—Jaskaran Singh
Gaps in Estimation of Area, Production and Productivity ofHorticulture Crops in Himachal Pradesh— D.N. Bajpai,Meenakshi Sharma and Ranveer Singh
AGRO-ECONOMIC RESEARCH
Relationship between Wholesale Prices, Retail Prices andDetails of Contributing Factors for the Price Difference ofOnion in Gujarat—S.S. Kalamkar and M. Makwana, AERC,Sardar Patel University, Anand, Gujarat.
COMMODITY REVIEWS
Foodgrains 49
Commercial Crops : 51Oilseeds and Edible Oils 51
Fruits and Vegetables 51
Potato 51Onion 51
Condiments and Spices
Raw Cotton 51Raw Jute 51
Editorial Board
ChairmanSangeeta Verma
EditorP. C. Bodh
Asstt. Economic AdviserYogita Swaroop
Economic OfficerProsenjit Das
Officials Associated in Preparation of thePublication
D.K. Gaur — Tech. Asstt.S.K. Kaushal — Tech. Asstt. (Printing)
Uma Rani — Tech. Asstt. (Printing)V.M. Shobhana — P.A.
Cover Design By:Yogeshwari Tailor— Asstt. Graph
Publication DivisionDIRECTORATE OF ECONOMICS
AND STATISTICS
DEPARTMENT OF AGRICULTURE, COOPERATION
AND FARMERS WELFARE
MINISTRY OF AGRICULTURE & FARMERS
WELFARE
GOVERNMENT OF INDIA
C-1, HUTMENTS, DALHOUSIE ROAD,NEW DELHI-110 011PHONE : 23012669
(Email: [email protected])
SubscriptionInland Foreign
Single Copy : `40.00 £ 2.9 or $ 4.5Annual : `400.00 £ 29 or $ 45
Available fromThe Controller of Publications,
Ministry of Urban Development,Deptt. of Publications,
Publications Complex (Behind Old Secretariat),Civil Lines, Delhi-110 054.
Phone : 23817823, 23819689, 23813761,23813762, 23813764, 23813765
(Email:[email protected])
©Articles Published in the Journal cannot bereproduced in any form without the permission ofEconomic and Statistical Adviser.
17
25
32
39

STATISTICAL TABLES
PAGES
Wages
1. Daily Agricultural Wages in Some States—Category-wise.1.1. Daily Agricultural Wages in Some States—Operation-wise.
Prices
2. Wholesale Prices of Certain Important AgriculturalCommodities and Animal Husbandry Products atSelected Centres in India.
3. Month-end Wholesale Prices of Some ImportantAgricultural Commodities in International Marketduring the year, 2015.
Crop Production
4. Sowing and Harvesting Operations Normally in Progress during October, 2015.
Abbreviations used
N.A. — Not Available.N.Q. — Not Quoted.N.T. — No Transactions.N.S. — No Supply/No Stock.R. — Revised.M.C. — Market Closed.N.R. — Not Reported.Neg. — Negligible.Kg. — Kilogram.Q. — Quintal.(P) — Provisional.Plus (+) indicates surplus or increase.Minus (–) indicates deficit or decrease.
The Journal is brought out by the Directorateof Economics and Statistics, Ministry ofAgriculture and Farmers Welfare, it aims atpresenting a factual and integrated pictureof the food and agricultural situation in indiaon month to month basis. The viewsexpressed, if any, are not necessarily thoseof the Government of India.
NOTE TO CONTRIBUTORS
Articles on the State of Indian Agriculture andallied sectors are accepted for publication in theDirectorate of Economics & Statistics,Department of Agriculture, Cooperation andFarmers Welfare’s monthly Journal “AgriculturalSituation in India”. The Journal intends to providea forum for scholarly work and also to promotetechnical competence for research in agriculturaland allied subjects. Good articles in Hard Copyas well as Soft Copy ([email protected])in MS Word, not exceeding five thousand words,may be sent in duplicate, typed in double spaceon one side of foolscap paper in Times NewRoman font size 12, addressed to the Editor,Publication Division, Directorate of Economicsand Statistics, M/o Agriculture & Farmers Welfare,C-1, Hutments Dalhousie Road, New Delhi-110011 along with a declaration by the author(s) thatthe article has neither been published norsubmitted for publication elsewhere. The author(s) should furnish their e-mail address, Phone No.and their permanent address only on theforwarding letter so as to maintain anonymity ofthe author while seeking comments of the refereeson the suitability of the article for publication.
Although authors are solely responsible forthe factual accuracy and the opinion expressed intheir articles, the Editorial Board of the Journal,reserves the right to edit, amend and delete anyportion of the article with a view to making itmore presentable or to reject any article, if notfound suitable. Articles which are not foundsuitable will not be returned unless accompaniedby a self-addressed and stamped envelope. Nocorrespondence will be entertained on the articlesrejected by the Editorial Board.
An honorarium of Rs. 2000/- per article ofatleast 2000 words for the regular issue andRs. 2500/- per article of at least 2500 words forthe Special/Annual issue is paid by the Directorateof Economics & Statistics to the authors of thearticles accepted for the Journal.
Disclaimer: Views expressed in the articles andstudies are of the authors only and may notnecessarily represent those of Government ofIndia.
Soft copy of the journal may be seen in PDF at thefollowing URL: eands.dacnet.nic.in/publication.htm
5353
55
57
59
September, 2015 1
SERVER3\E\AGRICULTURE 2015\2588AGRI (SEPT, 2015)
4th Advance Estimates of Production of FoodgrainsFor 2014-15
The 4th Advance Estimates of production of major cropsfor 2014-15 have been released by the Department ofAgriculture & Cooperation on 17.08.2015. The productionof kharif crops during 2014-15 suffered due to badmonsoon. Unseasonal rains/hailstorm during Feb-March2015 had significant impact on production of rabi crops.As a result of setback in kharif as well as rabi seasons, theproduction of most of the crops in the country has declinedduring 2014-15 (See Table-1). As per 4th AdvanceEstimates, the production of major crops during 2014-15is as under:
Total foodgrains production in the country is estimated at252.68 million tonnes which is lower by 12.36 milliontonnes than the last year's record foodgrains production of265.04 million tonnes. Total production of rice is estimatedat 104.80 million tonnes which is lower by 1.85 milliontonnes than the last year's record production of 106.65million tonnes.Production of wheat estimated at 88.94million tonnes is lower by 6.91 million tonnes than therecord production of 95.85 million tonnes achieved during2013-14.Total production of coarse cereals estimated at41.75 million tonnes is also lower by 1.54 million tonnesthan their production during 2013-14.Production of pulsesestimated at 17.20 million tonnes is lower by 2.05 milliontonnes than their production during the last year. With adecrease of 6.07 million tonnes over the last year, totalproduction of oilseeds in the country is estimated at 26.68million tonnes. Production of sugarcane is estimated at359.33 million tonnes which is higher by 7.19 milliontonnes as compared to last year.Total production of cottonestimated at 35.48 million bales (of 170 kgs. each) ismarginally lower than last year but higher by 3.01 millionbales than the average production of last5 years. Production of jute &mesta is estimated at 11.45million bales (of 180 kg. each) which are marginally lowerthan their production during the last year.
Trends in Foodgrain Prices
During the month of July, 2015 the All India Index Numberof Wholesale Price (2004-05=100) of foodgrains increasedby 0.98 percent from 244.6 in June, 2015 to 247.0 in July,2015.The Wholesale Price Index (WPI) Number of cerealsincreased by 0.43 percent from 230.9 to 231.9 and WPI ofpulses increased by 2.88 percent from 308.9 to 317.8 duringthe same period.The Wholesale Price Index Number of
wheat increased by 1.19 percent from 210.4 to 212.9 whilethat of rice increased by 0.34 percent from 236.9 to 237.0during the same period.
Weather, Rainfall and Reservoir Situation duringAugust, 2015
Rainfall Situation
Cumulative Rainfall for the country as a whole during theperiod 1st June to 26th August, 2015 was 12% lower thanLong Period Average (LPA). Rainfall (% departure fromLPA) in the four broad geographical divisions of the countryduring the above period was lower by 20% in SouthPeninsula, 15% in Central India and 6% in East & NorthEast India and North West India respectively. Out of 36met sub-divisions, 21 met sub-divisions have receivedexcess/normal rainfall and 15 met sub-divisions receiveddeficient rainfall.Out of 613 districts, 88 districts (14%)received excess, 256 districts (42%) received normal, 244districts (40%) received deficient and 26 districts (4%)received scanty rainfall during the above period.
Water Storage in Major Reservoirs
Central Water Commission monitors 91 major reservoirsin the country which have a total live capacity of 157.80BCM at Full Reservoir Level (FRL). Live storage in thesereservoirs as on 27th August, 2015 has been 91.84 BCMas against 105.11 BCM on 27.08.2014 (last year) and104.72 BCM of normal storage (average storage of thelast 10 years). Current year's storage as on 27.08.2015 hasbeen 13% lower than last year's and 12% higher than thenormal storage.
Sowing Position during Kharif 2015
As per latest information available on sowing of crops,around 91.4% of the normal area under kharif crops hasbeen sown upto 28.08.2015. Area sown under all kharifcrops during current year has been 967.83 lakh hectare(ha.) at All India level as compared to 956.93 lakh ha. inthe corresponding period of last year.
As compared to normal kharif area, the area coverageduring current kharif season is higher by 3.4 lakh ha.underurad, 1.6 lakh ha. undermoong, 7.3 lakh ha.undersoyabean, 1.9 lakh ha. Under sesamum and 1.5 lakhha.under maize. Area coverage is lower by 4.6 lakh ha.Under jowar, 4.9 lakh ha.under bajra, 2.6 lakh ha. Undertur, 6.3 lakh ha.under groundnut, 1.1 lakh ha. undersunflower and 1.6 lakh ha. under cotton.
General Survey of Agriculture

2 Agricultural Situation in India
SERVER3\E\AGRICULTURE 2015\2588AGRI (SEPT, 2015)
TAB
LE-1
FO
URT
H A
DVA
NC
E ES
TIM
ATES
OF P
RO
DU
CTI
ON
OF O
ILSE
EDS &
OTH
ER C
OM
MER
CIA
L CR
OPS
FO
R 2
014-
15
AS O
N 1
7.08
.201
5

September, 2015 3
SERVER3\E\AGRICULTURE 2015\2588AGRI (SEPT, 2015)
TAB
LE-2
FO
URT
H A
DVA
NC
E ES
TIM
ATES
OF P
RO
DU
CTI
ON
OF F
OO
DG
RA
INS F
OR 2
014-
15
AS O
N 1
7.08
.201
5

4 Agricultural Situation in India
SERVER3\E\AGRICULTURE 2015\2588AGRI (SEPT, 2015)
Salient Features of Crop Insurance Schemes
Agriculture Insurance Company of India (AIC), 10 privateGeneral Insurance Companies namely, ICICI-Lombard,IFFCO-TOKIO, HDFC-ERGO, Cholamandalam-MS,Tata-AIG, Future Generali India, Reliance, Bajaj Allianz,SBI and Universal Sompo General Insurance companiesare chosen for implementation of crop insuranceprogramme. Share of AIC in terms of coverage of farmershas decreased during last three years.
Salient features of National Crop Insurance Programme(NCIP), and Modified National Agricultural InsuranceScheme (MNAIS) are as follows:
Actuarial premium rates are charged with aprovision of subsidy upto 75%, which is sharedby the Central and State Governments on50 : 50 basis;
Entire liability of claims is on the implementinginsurance companies;
It is compulsory for loanee farmers and optionalfor non-loanee farmers;
Risk coverage for pre-sowing/prevented sowingand post harvest losses due to cyclone in coastalareas;
On account payment up to 25% advance of likelyclaims as immediate relief in the areas whichsuffered atleast 50% crop yield loss;
More proficient basis for calculation of thresholdyield;
Two higher indemnity levels of 80% & 90%instead of earlier 70%, 80% & 90%;
Reduction in Unit Area of Insurance to village/village Panchayat level; and
Private insurance companies have been involvedto provide the benefits of competition.
Weather Based Crop Insurance Scheme (WBCIS):
Provide coverage against weather deviation from thenotified standards on the basis of weather data receivedfrom the notified Automatic Weather Stations (AWSs) and
Automatic Rain-gauges (ARGs);
Actuarial premium rates are charged with aprovision of subsidy upto 50%, which is sharedby the Central and State Governments on50 : 50 basis;
Entire liability of claims is on the implementinginsurance companies;
It is compulsory for loanee farmers and optionalfor non-loanee farmers;
Add on coverage in respect of hailstorm andcloud burst on individual assessment basis;
Private insurance companies have beeninvolved to provide the benefits of competition.
Coconut Palm Insurance Scheme (CPIS):
Individual farmer/planter/grower offering atleast5 healthy nut bearing palms in a contiguous area/plot is eligible for insurance;
Provide coverage against total loss of palm onaccount of happening of peril insured leadingto death of the insured palm or its becomingunproductive;
Fixed premium rates ranging from Rs. 9/- toRs. 14/- per palm depending upon the age ofpalm. However, Government is providingsubsidy upto 50% by GOI and 25% by StateGovernment;
Sum insured per palm is ranging from Rs. 900/-to Rs. 1750/-;
Scheme is being implemented by AIC.
Pradhan Mantri Krishi Sinchai Yojana
Krishi Sinchayee Yojana with an outlay of Rs.50,000 croresfor a period of 5 years (2015-16 to 2019-20) to achieveconvergence of investments in irrigation at the field level.
Pradhan Mantri Krishi Sinchayee Yojana (PMKSY) hasbeen formulated by amalgamating ongoing schemes viz.Accelerated Irrigation Benefit Programme (AIBP) ofMinistry of Water Resources, River Development & GangaRejuvenation; Integrated Watershed ManagementProgramme (IWMP) of Department of Land Resources;and On Farm Water Management (OFWM) component of
Farm Sector News

September, 2015 5
SERVER3\E\AGRICULTURE 2015\2588AGRI (SEPT, 2015)
National Mission on Sustainable Agriculture (NMSA) ofDepartment of Agriculture and Cooperation. PMKSY isto be implemented in an area development approach,adopting decentralized state level planning and projectisedexecution, allowing the states to draw their irrigationdevelopment plans based on district/blocks plans with ahorizon of 5 to 7 years. States can take up projects basedon the District/State Irrigation Plan.
All the States and Union Territories including NorthEastern States are covered under the programme.
The National Steering Committee (NSC) of PMKSYunder the chairmanship of Hon'ble Prime Minister, willprovide policy direction to programme framework and aNational Executive Committee (NEC) under thechairmanship of Vice Chairman of NITI Aayog will overseethe programme implementation at national level.
Provision has been made under PMKSY during2015-16 for carrying out extension activities in the fieldwith special focus on water harvesting, water managementand crop alignment for farmers and grass root level fieldfunctionaries.
Encouraging the Production of Organic Manure fromBio-waste
Government is encouraging the production of organicmanure from bio-waste under the Capital InvestmentSubsidy Scheme (CISS) of "National Mission forSustainable Agriculture (NMSA)" programme. Under thisscheme, financial assistance is provided @ 100% upto amaximum limit of Rs.190 lakh to State Govt./Govt.Agencies and @ 33% upto a maximum limit of Rs.63.00lakh per unit to individuals/private agencies throughNABARD as capital investment for setting up ofmechanized Fruit/Vegetable market waste/Agro wastecompost production unit of 3000 TPA production capacity.
Government is encouraging the use of organic/biofertilizer through various schemes/programmes viz:National Mission for sustainable Agriculture (NMSA)/Paramparagat Krishi Vikas Yojana (PKVY), RashgtriyaKrishi Vikas Yojana (RKVY), Mission for IntegratedDevelopment of Horticulture (MIDH), National Missionon Oilseeds & Oil Palm (NMOOP), National Biogas andManure Management Programme (NBMMP), NetworkProject on Organic Farming of Indian Council ofAgricultural Research (ICAR) and National Programmeon Organic Production (NPOP) of Agricultural &Processed Food Products Export Development Authority(APEDA).
Ministry of New & Renewable Energy isimplementing a scheme namely, National Biogas andManure Management Programme (NBMMP) using cowdung, kitchen waste material etc., as mix feed to produceBiogas for cooking gas and organic enriched bio manure
through the implementing Agencies such as State NodalDepartments/State Nodal Agencies and Khadi & VillageIndustries Commission and Biogas Development andTraining Centers (BDTCs).
Web Portals for Farmers
The Government of India has recently launched threeportals namely Participatory Guarantee System-India(PGS-India), Fertilizer Quality Control System (FQCS) andSoil Health Card (SHC).
PGS-India portal:
PGS is a process of certifying organic products inaccordance with the laid down standards and with activeparticipation of stakeholders including producers/farmers,traders and consumers in the certification system. The PGS-India portal is a web based application having online facilityfor (i) Registration (ii) Approval (iii) Documentation (iv)Record of inspection and (v) Certification. It can beaccessed at the URL www.pgsindia-ncof.gov.in. The portalenables small and marginal farmers to have easy access tothe organic certification system. It also promotestransparency in the certification process and results increation of a database of (i) Organic producers and (ii)area under PGS certification with due traceability.
Fertilizer Quality Control System (FQCS) portal:
The FQCS portal is a web based and configurable workflowapplication developed for processing of fertiliser samplecollection, testing and generation of analysis reports. It canbe accessed at the URL www.fqcs.dac.gov.in. Theapplication leads to automation of most of the manualactivities involved in quality control of fertilisers and thus,helps in improving the overall quality control system.
Soil Health Card (SHC) portal:
The SHC portal is a web based workflow application withfollowing major modules; (i) Soil Samples Registration(ii) Test Result Entry by Soil Testing Labs (iii) FertilizerRecommendations based on STCR and GFR (iv) SoilHealth Card generation along with FertilizerRecommendation and micronutrient suggestions (v) MISmodule for monitoring progress. It can be accessed at theURL www.soilhealth.dac.gov.in. The system aims togenerate Soil Health Cards automatically based on eitherSoil Test-Crop Response (STCR) formulae developed byICAR or General Fertilizer Recommendations providedby State Governments. It has sample tracking feature andprovides alerts to farmers about sample registration andgeneration of Soil Health Card through SMS and Email.The system envisages building up a single national databaseon soil health for future use in research and planning.
The portals are funded under the centrally sponsoredscheme National e-governance Plan in Agriculture (NeGPA),which aims at development and implementation of ICT

6 Agricultural Situation in India
SERVER3\E\AGRICULTURE 2015\2588AGRI (SEPT, 2015)
enabled projects for ensuring timely access to agriculturerelated information for the farmers of the country.
PGS-India and Soil Health Card (SHC) portals areweb based applications available in the public domain. Theinformation on the portals, which is relevant to the farmers,can be accessed by them. Fertilizer Quality Control System(FQCS) portal is for official use by the fertilizer qualitycontrol laboratories.
Increasing Knowledge and Awareness Among Farmersto Enhance the Production and Productivity
To increase knowledge and awareness among farmers toenhance the production and productivity of various crops,the Government of India has initiated various programmessuch as Front Line Demonstrations and Extension throughnetwork of Krishi Vigyan Kendras (KVKs), NationalMission of Agricultural Extension & Technology(NMAET), National Food Security Mission (NFSM), SoilHealth Management Scheme, Mission for IntegratedDevelopment of Horticulture (MIDH), Bringing GreenRevolution to Eastern India (BGREI) and Rashtriya KrishiVikas Yojana (RKVY) as per details given below:-
NMAET
The aim of this Mission is to restructure and strengthenAgricultural Extension to enable delivery of appropriatetechnologies and improved agronomic practices to thefarmers. NMAET is implemented with four Sub-Missionsnamely - Sub-Mission on Agricultural Extension (SMAE);Sub-Mission on Seed & Planting Material (SMSP); Sub-Mission on Agricultural Mechanization (SMAM) and Sub-Mission on Plant Protection & Plant Quarantine (SMPP).
SMAE focusses on awareness creation and enhanceduse of appropriate technology in agriculture and alliedsectors. Agricultural Technology Management Agency(ATMA) is the main scheme under SMAE of NMAET.The Scheme is implemented in 652 districts of 29 Statesand 3 UTs of the country. It promotes decentralized farmer- driven and farmer - accountable extension system fortechnology dissemination. ATMA encourages multi-agencyand broad-based extension strategies, adopt group approachto extension and facilitates convergence of programmes inplanning, execution and implementation at district level.Under the Scheme grant is released to State Govts. Forrevitalizing their extension system and making availablethe latest agricultural technologies in different thematicareas to increase production and productivity of cropsthrough farmers training, demonstrations, exposurevisits,exhibitions, kisan melas, farmer-scientist-interactions, mobilization of farmers interest groups andsetting up of farm schools on the field of progressivefarmers. Govt. also creates awareness among farmersthrough print & electronic media.
The Kisan Call Centre (KCC) Scheme is alsoimplemented across the country for the benefits of farmers.The main aim of the Scheme is to answer queries of farmerson telephone calls in their own dialect. A countrywidecommon 11 digit toll free number 1800-180-1551 has beenallotted for Kisan Call Centre.
A Central Sector Scheme "Establishment of AgriClinics & Agri Business Centres (ACABC)" supplementsthe efforts of public extension, supports agriculturedevelopment and creates gainful self employmentopportunities to unemployed youths with qualification inagriculture and allied sectors. It promotes agri-preneurstrained under the ACABC Scheme in providing advisoryand extension services to the farmers.
Sub-Mission on Agricultural Mechanization(SMAM) promotes Agricultural Mechanization in thecountry through Training, Testing and Demonstration.Under Sub-Mission on Plant Protection and PlantQuarantine (SMPP), Central Integrated Pest ManagementCentres (CIPMCs) have been established in 28 States and1 UT. These centres conduct Farmer Field Schools (FFSs)in fields to create awareness among farmers. Sub-Missionon Seeds & Planting Material (SMSP) covers the entiregamut of seed chain from nucleus seed supply to farmersfor sowing and also to the major stakeholders in the seedchain. It promotes adoption of quality seeds for increasingAgricultural Production & Productivity.
NFSM
This Mission includes cluster demonstration of rice, wheat,pulses on improved package of practices, demonstrationon cropping system, cropping system-based training offarmers, seed distribution of high-yielding varieties andother agri inputs. The Govt. of India has approved cropsdevelopmental programme on cotton, jute and sugarcanefor enhancing production and productivity of thesecommercial crops from 2014-15. Demonstration on HighDensity Planting System (HDPS) in cotton on inter-cropping with pulses, oilseeds & cereals with sugarcaneare also conducted under the Scheme to enhance productionand productivity.
The programme 'Bringing Green Revolution toEastern India' (BGREI) was initiated to address theconstraints linking the productivity of Rice based croppingsystem in eastern India comprising 7 States namely - Assam,Bihar, Chhattisgarh, Jharkhand, Orissa, Eastern U.P. andWest Bengal. The programme provided a more focusedapproach on medium and long-term strategies for assetbuilding activities of water conservation and utilizationalong with short-term strategies pertaining to Transfer ofTechnologies (ToTs) of major cereals in BGREI districts.Under Soil Health Management Scheme farmers are trainedfor judicious use of fertilizers.

September, 2015 7
SERVER3\E\AGRICULTURE 2015\2588AGRI (SEPT, 2015)
Mission for Integrated Development of Horticulture(MIDH)
Capacity building programmes of farmers & techniciansare carried out under the Mission for adopting improvedtechnologies.
Indian Council of Agricultural Research (ICAR)
It has established a network of 642 Krishi Vigyan Kendras(KVKs) in the country aiming at assessment anddemonstration of technologies/products and itsdissemination through number of extension programmesincluding training of farmers to update their knowledgeand awareness to increase the productivity of crops.
Due to the training programmes conducted by KVKson improved technologies related to agriculture and alliedfields benefited the farmers in terms of increased cropproduction and improved farm income. The successfultechnological interventions identified by KVKs throughOn-farm testing (OFTs) and frontline demonstrations(FLDs) are up-scaled with the help of Department ofAgriculture and other line departments for the spread ofthe technologies to large number of farmers in the districtby the respective KVK and also organizing the extensionactivities like technology week in the demonstration farmof KVK for exposure of farmers to the improvedtechnologies of agriculture.
ATMA under NMAET provides generic extensioncovering all the crops and allied sectors through extensionactivities/capacity building programmes like FarmersTraining, Demonstrations, Exposure Visits, Kisan Melas,Farmer-Scientist-Interaction, Mobilization of FarmersInterest Groups (FIGs) and Farm Schools, etc. NFSMcarries out counselling of farmers through clusterdemonstrations and FFSs for Rice, Wheat, Pulses, Cotton,Jute, and Sugarcane Crops. MIDH imparts capacitybuilding programme for farmers in horticultural cropsnamely - fruits, vegetables, roots & tuber crops, mushroom,spices, flowers, aromatic plants, coconut, cashew, cocoa& bamboo, etc.
ICAR
The major crops covered were rice, wheat, maize and barley(Cereals); barnyard millet, finger millet, pearl millet(Millets); groundnut, sesame, soybean, sunflower, linseed,mustard, castor (Oilseeds); black gram, cowpea, field pea,green gram, lentil, pigeon pea, rajmash (Pulses); sugarcane,cotton, betel leaf, guar seed (Commercial Crops); berseem;cowpea, maize, Lucerne, napier, oat, sorghum (FodderCrops); vegetables, fruits, flowers, spices and condiments,tuber crops and plantation crops (Horticultural Crops).
Strengthening Agricultural Market Infrastructure
In order to create an integrated agricultural market atnational level, Government has formulated a Central Sector
Scheme for "Promotion of National Agriculture Marketthrough Agri-Tech Infrastructure Fund (ATIF)" to beimplemented with a budgetary outlay of Rs.200.00 croreduring 2015-16 to 2017-18. Under the scheme, anappropriate common e-market platform would be deployedin 585 selected regulated wholesale markets in states acrossthe country. Department of Agriculture and Cooperation(DAC) will meet expenses on software and itscustomisation for the States and in addition will also givegrant as one time fixed cost subject to the ceiling ofRs.30.00 lakhs per Mandi for related hardware includingequipment/infrastructure. The selection of the mandis willbe based on proposals from States that have carried outprior reforms in their marketing laws in respect of (i) asingle license to be valid across the State, (ii) single pointlevy of market fee and (iii) provision for electronic auctionas a mode for price discovery. It is envisaged that at least585 mandis will be integrated with the common e-platformover three years during 2015-16 to 2017-18.
In order to modernise the existing mandis andstrengthen the agriculture market infrastructure in thecountry, including in rural areas, the Government has beenproviding financial assistance through various central sectorand centrally sponsored schemes which include inter-aliathe schemes of Department of Agriculture & Cooperation(DAC) such as the Integrated Scheme for AgriculturalMarketing (ISAM) and its sub-schemes of AgriculturalMarketing Infrastructure (AMI), Marketing Research andInformation Network (MRIN) and Venture CapitalAssistance (VCA), the Rashtriya Krishi Vikas Yojana(RKVY) and the Mission for Integrated Development ofHorticulture (MIDH) as well as the scheme of Ministry ofFood Processing Industries (MoFPI) on Cold Chain, ValueAddition and Preservation Infrastructure.
The Government has also been advocating to theStates/ Union Territories to reform their agri-marketinglaws to promote development of alternative marketingchannels other than the market yards of AgricultureProduce Market Committee (APMC) to promote inter-alia private investment in development of agri marketinginfrastructure.
Implementation of Sub-Mission on AgriculturalMechanization
Sub-Mission on Agricultural Mechanization (SMAM) isbeing implemented w.e.f. 2014-15 under the NationalMission on Agricultural Extension and Technology. TheSMAM has following Components:-
Promotion and Strengthening of AgriculturalMechanization through Training, Testing andDemonstration:
Aims to ensure performance testing of agricultural machineryand equipment, capacity building of farmers and end usersand promoting farm mechanization through demonstrations.

8 Agricultural Situation in India
SERVER3\E\AGRICULTURE 2015\2588AGRI (SEPT, 2015)
Demonstration, Training and Distribution of Post HarvestTechnology and Management (PHTM):
Aims at popularizing technology for primary processing,value addition, low cost scientific storage/transport and thecrop by-product management through demonstrations,capacity building of farmers and end users. Providesfinancial assistance for establishing PHT units.
Financial Assistance for Procurement of AgricultureMachinery and Equipment:
Promotes ownership of various agricultural machineryequipments as per norms of assistance.
Establish Farm Machinery Banks for Custom Hiring:
Provides suitable financial assistance to establish FarmMachinery Banks for Custom Hiring for appropriatelocations and crops.
Establish Hi-Tech, High Productive Equipment Hub forCustom Hiring:
Provides financial assistance to set up hi-tech machineryhubs for high value crops like sugarcane, cotton etc.
Promotion of Farm Mechanization in Selected Villages:
Provides financial assistance to promote appropriatetechnologies and to set up Farm Machinery Banks inidentified villages in low mechanised states.
Financial Assistance for Promotion of MechanizedOperations/hectare Carried out Through Custom HiringCentres:
Provides financial assistance on per hectare basis to thebeneficiaries hiring machinery/equipments from customhiring centers in low mechanized areas.
Promotion of Farm Machinery and Equipment in North-Eastern Region:
Extends financial assistance to beneficiaries in high-potential but low mechanized states of north-east.
Encouraging Kitchen Gardening
For improving the crop productivity and efficiency in thevalue chains of horticulture crops, the Mission forIntegrated Development of Horticulture (MIDH) has beenassisting the farmers under various programmes likeproduction of hybrid seeds, production of quality plantingmaterial, promotion of integrated nutrient management andintegrated pest management, micro irrigation, protectedcultivation, organic farming, post harvest management etc.
The Vegetable Initiative for Urban Cluster (VIUC)under Rashtriya Krishi Vikas Yojana (RKVY) which waslaunched in 2011-12 encouraged kitchen gardening as wellas organic farming in urban and peri-urban areas. Underthis scheme, extensive training programmes were alsoimparted to city dwellers giving thrust to organic farmingand promotion of vegetable cultivation.
The Government of Kerala has submitted a project on"Open Cultivation of Vegetables" during 2015-16 to theMIDH which has been sanctioned.
State-wise allocation under Soil Health Card Scheme
Under the Soil Health Card (SHC) Scheme, Governmentof India provides assistance to State Governments to issueSHCs to all farmers in the country at an interval of 3 years.Under the scheme, Soil Health Card portal has beendeveloped for registration of soil samples, recording testresults of soil samples and generation of Soil Health Card(SHC) along with fertilizer recommendations. This issingle, generic, uniform, web based software accessed atthe URL www.soilhealth.dac.gov.in. The System envisagesbuilding up a single national database on soil health forfuture use in research and planning.
Under the scheme about 2.53 crore samples will becollected and tested to generate 14 crore SHCs for farmersonce in a cycle of 3 years. The scheme has been approvedwith a total outlay of Rs. 568.54 crore (with Governmentof India share of Rs. 426.41 crore.).
From the current, year the sharing pattern of fundsfor the project between Government of India and the Statesis in ratio of 50:50.
Crops Notified Under NAIS during Kharif & Rabi
National Agricultural Insurance Scheme (NAIS) envisagescoverage of all food crops (cereals, millets & pulses),oilseeds and annual commercial/horticultural crops inrespect of which past yield data is available for adequatenumber of years and States have the capacity to conductrequisite number of crop cutting experiments to assess theyield of notified crop in notified area.
Comprehensive risk insurance is provided due tonon-preventable risks including failure of seeds underNAIS. As the scheme is being implemented on areaapproach basis, the admissible claims are settled on thebasis of final yield data furnished by the State Governmentfor the notified area and crop.
Resources made available to States for Developmentof Agriculture
The Department of Agriculture & Cooperation isimplementing five Centrally Sponsored Schemes (CSS)namely: (i) Mission for Integrated Development ofHorticulture (MIDH), (ii) National Food Security Mission(NFSM), (iii) National Mission of Oilseeds and Oil Palm(NMOOP), iv) National Mission on Agricultural Extensionand Technology (NMAET), (v) National Mission forSustainable Agriculture (NMSA); Five Central SectorSchemes (CS) namely: i) Integrated Scheme on AgricultureMarketing (ISAM), (ii) Integrated Scheme on AgricultureCooperation (ISAC), (iii) Integrated Scheme on AgricultureCensus, Economics & Statistics (ISACE&S),

September, 2015 9
SERVER3\E\AGRICULTURE 2015\2588AGRI (SEPT, 2015)
(iv) Secretariat Economic Services, (v) National CropInsurance Programme (NCIP); and 1 State Plan RashtriyaKrishi Vikas Yojana (RKVY).
All the above schemes/ missions have now beenregrouped under 4 main schemes namely: (a) National CropInsurance Programme (NCIP); (b) Krishi Unnati Yojana;(c) Rashtriya Krishi Vikas Yojana (RKVY); and (d) PradhanMantri Krishi Sinchai Yojana (PMKSY) to ensure growthin agriculture sector and for the betterment of farmers.
The Department of Agriculture & Cooperation(DAC) is providing financial support to the States foragricultural development through the above schemes/missions as per the approved Annual Action Plans of theStates. Further, through these schemes/ missions, resourcesin different forms, like quality seeds; farm machineries,such as, self propelled paddy transplanter, chiseller,rotavator, laser land leveler, plant protection equipment(manual/power sprayer), chaff cutter, sprinkler/pump set,seed treating drum, seed drill/zero till, multi crop planter/ridge furrow planter/raised bed planter, groundnut digger,power weeder, water carrying pipes, mobile rain gun, multicrop thresher; plant protection chemicals; micro nutrients& soil ameliorants; chemical fertilizers; bio-fertilizers etc.are made available to the farmers at subsidized rates. Otherresources like storage godowns, cold storage facilities,marketing infrastructure etc. are also created for benefit ofthe farmers.
The State-wise allocation under the various schemes/missions of DAC has progressively increased during theyears 2012-13, 2013-14 and 2014-15.
With the acceptance and adoption of therecommendations of the 14th Finance Commission, thefinancial devolution to the States has risen from 32 percentto 42 percent of the central tax revenue. With this, thesharing pattern of the funds for CSS has been changed.The States would now share the funding by a largermargin relative to pre-devolution period. The budgetaryallocation of the DAC for the Centrally SponsoredSchemes has been accordingly provided for.
Productivity of Foodgrains, Oilseeds and Pulses
Details of productivity/yield of foodgrains, oilseeds andpulses in the country during 2014-15 vis-à-Vis 2010-11are as under:—
Crop Productivity (Kg./hectare)2010-11 2014-15*
Foodgrains 1930 2082Oilseeds 1193 1060Pulses 691 753
* As per 3rd Advance Estimates.
In order to improve production and productivity ofagricultural crops including foodgrains, oilseeds & pulsesin the country, the Government of India is implementingthrough State Governments, several Crop DevelopmentSchemes/Programmes such as Rashtriya Krishi VikasYojana (RKVY), National Food Security Mission (NFSM),National Mission on Oilseeds and Oil Palm (NMOOP),Bringing Green Revolution in Eastern India (BGREI),National Mission for Sustainable Agriculture (NMSA) etc.
Under these Schemes/Programmes, funds areprovided to States for implementation of State-specificagricultural strategies including incentives to farmers foruse of quality seeds, Integrated Nutrient Management(INM), Integrated Pest Management (IPM), farmmechanization, etc. The States are also provided supportfor creation of agricultural infrastructure for optimal useof water and other natural resources.
To achieve higher productivity of agricultural crops,Indian Council of Agricultural Research (ICAR) is alsoconducting basic and strategic research relating to cropimprovement, production and protection technologiessuitable to different situations including development oflocation-specific varieties/hybrids and technologies.
As a result of various initiatives taken by theGovernment, production and productivity of variousagricultural crops has been generally increasing except forthe years with unfavourable rainfall, weather conditionsetc.
Steps to Raise the Production of Pulses
Household consumption of goods and services in thecountry is assessed through Household ConsumerExpenditure Surveys conducted by National Sample SurveyOffice (NSSO) of Ministry of Statistics & ProgrammeImplementation. Based upon per capita monthly quantityof consumption as per Household Consumer ExpenditureSurvey:2011-12 (latest available), the details of totalconsumption vis-à-vis production of pulses in the countryduring 2013-14 and 2014-15 are as under:-
(Million Tonnes)Year Production Consumption
2013-14 19.25 12.10
2014-15 17.38 12.26
NOTE: 1.Production figures for 2014-15 are as per3rd Advance Estimates.
2.Consumption figures only relate to consumptionby household and do not include indirectconsumption.

10 Agricultural Situation in India
SERVER3\E\AGRICULTURE 2015\2588AGRI (SEPT, 2015)
Shortfall in production of pulses is met throughimport. The details of import of pulses in terms of quantityand value during the last two years are as under:-
Year Import of PulsesQuantity Value('000 tonne) (Rs. in crore)
2013-14 3177.89 11036.75
2014-15 4584.85 17062.94
In order to raise production of pulses and attain self-sufficiency, Government of India has been implementingNational Food Security Mission (NFSM)-Pulses in thecountry since 2007-08. Presently, around 50% of the fundsunder the umbrella scheme of NFSM is allocated forpromoting cultivation of pulses. During 2014-15, NFSM-Pulses is being implemented in 622 districts of 27 Statesincluding all districts of North-Eastern and hill States.
Under NFSM-Pulses, an Accelerated PulsesProduction Programme (A3P) was also implementedduring 2010-11 to 2013-14. From 2014-15 onwards, theabove programme has been subsumed under NFSM-Pulses.
Further, since 2010-11 "Bringing Green Revolutionin Eastern India (BGREI)" Scheme is being implementedin Eastern States of Assam, Bihar, Odisha, Chhattisgarh,Jharkhand, West Bengal and Eastern Uttar Pradesh. Inorder to increase production of pulses in the country, pulseshave been included under BGREI from 2015-16 as part ofdemonstrations under cropping system based approach totarget rice fallow areas.
Steps to Make Farming Competitive and Profitable
To give new dimension to the condition and direction ofagriculture in the country, Government has taken severalsteps. With the objective of making farming competitiveand profitable and to make the country self-sufficient inproviding food for a growing population, the Governmenthas in the last one year embarked upon a number ofinitiatives that address the multiple concerns affecting thefarming as an enterprise. The emphasis of the Governmentis on:
(i) production activities with a view to enhancingproductivity on a sustainable basis;
(ii) on post-production activities, that takes care ofmarketing concerns; and
(iii) credit facilitation.
The emphasis is on sustained growth based onreduced cost of cultivation, rejuvenation of soil health,efficient use of water resources and remunerative priceson the produce of a farmer. Further, the emphasis is on riskmitigation through insurance scheme.
In consonance with the above, the Government hasrolled out the following new initiatives:
(1) Paramparagat Krishi Vikas Yojana (PKVY)
(2) Soil Health Card Scheme
Promoting Contract Farming
Agricultural marketing is regulated by the States'Agricultural Produce Marketing Regulation (APMR) Acts.In order to regulate and develop practice of contractfarming, Government has been actively advocating to theStates/Union Territories (UTs) to reform their agrimarketing laws to provide a system of registration ofcontract farming sponsors, recording of their agreementsand proper dispute settlement mechanism for orderlypromotion of contract farming in the country. So far, 21States (Andhra Pradesh, Arunachal Pradesh, Assam,Chhattisgarh, Goa, Gujarat, Haryana, Himachal Pradesh,Jharkhand, Karnataka, Maharashtra, Madhya Pradesh,Mizoram, Nagaland, Odisha, Punjab (separate Act),Rajasthan, Sikkim, Telangana, Tripura and Uttarakhand)have amended their Agricultural Produce MarketingRegulation (APMR) Acts to provide for contract farmingand of them, only 13 States (Andhra Pradesh, Chhattisgarh,Goa, Gujarat, Haryana, Himachal Pradesh, Jharkhand,Karnataka, Maharashtra, Madhya Pradesh, Odisha,Rajasthan and Telangana) have notified the rules toimplement the provision.
The Government does not provide financialassistance either to States or directly to the farmers topromote contract farming.
Assistance for Reclamation of Soil Health
Government of India, Ministry of Agriculture launched aNational Project on Management of Soil Health & Fertility(NPMSH&F) in 2008-09 to promote soil test basedbalanced & judicious use of fertilizers in conjunctionwith organic manures and Bio-fertilizers to increase soilfertility and productivity across the country. NPMSH&Fhas been subsumed under Soil Health Management (SHM)as one of the components of National Mission forSustainable Agriculture (NMSA) launched in April, 2014,being implemented across the country including Karnataka.SHM aims at promotion of integrated nutrient managementthrough judicious use of chemical fertilizers includingsecondary and micro nutrients in conjunction with organicmanures for improving soil health and its productivity;including strengthening of soil testing facilities to providesoil test based recommendations to farmers for improvingsoil fertility.
Department of Agricultural Research & Education—Indian Council of Agricultural Research (ICAR),Government of India, Ministry of Agriculture hasconducted various studies and reported that inadequate andimbalanced use of nutrients and low use of organic manures

September, 2015 11
SERVER3\E\AGRICULTURE 2015\2588AGRI (SEPT, 2015)
have lead to deterioration of soil health including multi-nutrient deficiencies affecting crop yields. Accordingly,State governments have been provided Central Assistanceunder NPMSH&F/SHM for setting-up static & mobilesoil testing laboratories across the country to ensure soiltest based balanced use of both inorganic and organicfertilizers for management of soil health and fertility.
Production of Fruits and Vegetables
To boost the production and productivity of vegetablesand fruits in the country, Government is implementingHorticulture Mission for North East and Himalayan States(HMNEH) including Uttarakhand and NationalHorticulture Mission (NHM) in the remaining statesunder Mission for Integrated Development ofHorticulture (MIDH). These schemes provide supportfor production of planting material, high yield varietyvegetable seed production, vegetable cultivation,rejuvenation of senile orchards, protected cultivation,creation of water resources, creation of infrastructure toprevent post harvest losses of horticultural crops andfor adoption of Integrated Nutrient Management (INM)/Integrated Pest Management (IPM).
Production of Horticulture Crops
To boost the productivity of vegetables and fruits in thecountry, Government is:—
1. Implementing Horticulture Mission for North East andHimalayan States (HMNEH) and NationalHorticulture Mission (NHM) in the remaining statesunder Mission for Integrated Development ofHorticulture (MIDH). These schemes provide supportfor production of planting material, high yield varietyvegetable seed production, vegetable cultivation,rejuvenation of senile orchards, protected cultivation,creation of water resources and for adoption ofIntegrated Nutrient Management (INM)/IntegratedPest Management (IPM).
2. The Government is also promoting research throughICAR and associated Institutes to undertake basicstrategic, applied and adaptive research onhorticultural crops in the country, including protectedcultivation for nursery production and vegetableproduction, use of micronutrient formulation anddevelopment of crop-specific micronutrients indifferent vegetables and fruits production.
Government has Approved Setting-up of 109 MoreKVKs in the Country During 12th Plan
The Indian Council of Agricultural Research (ICAR) hasestablished a network of 642 Krishi Vigyan Kendras(KVKs) aiming at assessment and demonstration oftechnologies/products and its dissemination throughnumber of extension programmes. The activities andprogrammes of KVKs include testing and demonstration
of agricultural technologies in farmers' field; training ofyouth and farmers; creation of awareness among farmerson improved technologies through various extensionprogrammes. The extension programmes/activities are inthe form of advisory services, diagnostic and clinic services,exhibitions, exposure visits, farm science club, farmers'seminar, farmers' visit to KVK, field days, film shows,group meetings, Kisanghosthi, Kisan melas etc. Further,the Government has approved for setting-up of 109 moreKVKs in the country during 12th Plan.
Setting up of Vermicompost Plants
Under Soil Health Management of National Mission forSustainable Agriculture, Financial assistance is beingprovided @ 50% of cost subject of a limit of Rs.5000/ha.and Rs.10,000 per beneficiary for promotion of OrganicInputs including Vermi-compost on farmer's field.
Under Mission for Integrated Development ofHorticulture (MIDH) assistance is provided for establishingvermi compost units @50% of cost subject to a maximumof Rs.50,000/- per beneficiary for a unit having size of30' x 8' x 2.5'. For smaller units, assistance is determinedon pro-rata basis. For HDPE Vermi bed of 96 cft. size(12'x4'x2'), the assistance is @50% of cost subject to amaximum of Rs.8,000/- per bed.
Under Paramparagat Krishi Vikas Yojana is beingimplemented w.e.f. 2015-16 in cluster of 50 acres of land,where in financial assistance is being provided to clustermembers @ Rs.5000/- per unit for procurement of earthworms, preparation of pits, construction of brick wall,labour charges and other raw materials required forconstruction of vermi-composting units.
Small Farmers Agri-Business Consortium
Department of Agriculture and Cooperation (DAC) havemandated Small Farmers' Agri Business Consortium(SFAC), which is a registered society of DAC, to act as theLead promoter of National Agriculture Market (NAM).SFAC will select a Strategic Partner through open tenderto develop, operate and maintain the NAM e-platform.SFAC will implement the NAM with budgetary grantsupport from DAC and technical support by the StrategicPartner.
NAM is envisaged as a pan-India electronic tradingportal which seeks to primarily network 585 AgricultureProduce Market Committee (APMC) market yards to createa national e-market for agricultural commodities. Inaddition, big private markets will also be allowed accessto the software to enable better price discovery. DAC willprovide the software free of cost to the States for settingup of NAM and for its customization to State specificrequirements. In addition, a one time grant of upto Rs.30lakhs per mandi towards fixed costs of equipment/infrastructure will also be provided.

12 Agricultural Situation in India
SERVER3\E\AGRICULTURE 2015\2588AGRI (SEPT, 2015)
The functions of the consortium as mentioned inBye-Laws of SFAC are given below.
The Government's decision to appoint SFAC as theLead promoter of NAM is based on its experience in similaractivity of setting up of a Kisan Mandi at Alipore, Delhi.The decision was approved by the Cabinet Committee onEconomic Affairs (CCEA).
As per the States' Agricultural Produce Market(Regulation) Acts/Rules, market fee is not levied on farmersbut levied normally on buyers in terms of percentage ofthe value of the produce transacted.
Extract from the Bye-Laws of the Small Farmers' Agri-business Consortium (SFAC)
Functions & Activities:
In furtherance of the Aims & Objects of the Societyindicated in the Memorandum of Association, the SFACmay undertake itself and/or cause to be undertaken by theconcerned Departments/Agencies/Units one or more of thefollowing task or activities in addition to any other tasksor activities as may be considered to be appropriate andnecessary:
(i) Organise, assist and help initiatives forimproving the production; and productivitylevels of identified agricultural produce.
(ii) Organise, assist and help establishment ofappropriate link/integral arrangementsbetween production and marketing.
(iii) Facilitate development of a sound marketinginfrastructure covering inter-aliaestablishment of processing units, qualitycontrol arrangement, market intelligence andinformation, transportation and storage andsuch other arrangements as may be necessary.
(iv) Arrange/promote market studies and/orspecific commodity surveys at the field levels,both at home and abroad, with a view toidentify the agricultural products which havepotential for exports and export development,quality standards and specifications,competitive price levels, trading channels,delivery schedules, promotional measure etc.
(v) Arrange/facilitate the formulation ofintegrated commercial developmentprogrammes or projects preferably firm orunit-wise, setting out, inter alia, products forexport targets, the import needs of rawmaterials, etc., processing arrangementsbetween the producers and exporters,marketing etc.
(vi) Assist/organize mounting of ExportPromotion Programmes including the
sponsoring of marketing teams, participationin specialized fairs and exhibitions, holdingof Department Stores promotions, exclusiveIndia Show.
(vii) Facilitate identification and establishment ofarrangements for undertaking production forexports and help in meeting the import needs,ensuring quality stands, reaching suitablemarketing tie-ups.
(viii) Facilitate/monitor transport arrangement,under the specific programmes and projectsthat may be formulated.
(ix) Facilitate/monitor storage arrangement underthe specific programmes and projects that maybe formulated.
(x) Facilitate/monitor the conclusion ofcontractual arrangements according toestablished commercial practices and norms.
Strengthening of Agricultural Research
Department of Agricultural Research & Education(DARE)/Indian Council of Agricultural Research (ICAR)is geared to strengthen, agricultural research in the countryputting emphasis on increasing production, productivityand resource use efficiency in agriculture sector to shoreup farm revenue. Several region specific technologies havebeen developed and introduced by institutes of ICAR andcenters of All India Coordinated Research Projects(AICRPs) located at different State agricultural Universities(SAUs) to achieve sustainable enhanced productivity andprofitability of different farming systems to shore-up thefarm revenue. The details of funds during last 3 years isgiven below:
(Rs. in crore)
Year Budget Revised EstimatesEstimates (allocation)
2012-13 3220.00 2520.00
2013-14 2415.00 2600.00
2014-15 3715.00 2500.00
The National Agricultural Research and EducationSystem (NARES) under Indian Council of AgriculturalResearch (ICAR) comprising of a network of 100 researchinstitutes, 73 Agricultural Universities and 642 KrishiVigyan Kendras (KVKs) is geared to meet the challengeof Indian agriculture under new WTO regime, enhance thecompetitiveness of Indian farming to make farming a viable,self-sustaining and internationally competitive enterprise.The efforts initiated towards re-orientation of R&D systemby ICAR which include development of quality humanresource through quality agricultural education, need-based

September, 2015 13
SERVER3\E\AGRICULTURE 2015\2588AGRI (SEPT, 2015)
training in India and abroad, harnessing ICT in agriculturedevelopment, strengthening social science skills, promotingpublic-private sector partnership, strengthening policyanalysis and vision-oriented market-led intelligenceanalysis skills, strengthening agri-business developmentand IPR management. Further, research and developmentefforts are focused on high value processed products,linking production with processing and marketing withfocus on small and marginal farmers and farm workers,establishment of quality testing/ referral labs, developinghigh yielding varieties combining with high protein contentand other characteristics demanded by the importingcountries.
ICAR works in close collaboration with various otherdepartments and institutes engaged in research and/ordevelopment in agricultural sector. The Department ofAgriculture and Cooperation, Govt. of India, Departmentof Animal Husbandry Dairy and Fisheries and Ministry ofFood processing Industries are also partnering with ICARtowards meeting the twin objectives of food self-sufficiencyand boosting income for a market-driven scenario.
In addition, ICAR is also partnering with theinternational agencies and institutes including CGIARinstitutions in frontier areas of research to ascertain greaterdividends to Indian agriculture.
ICAR is committed to solving the existing problemsof Indian agriculture and enhancing agricultural productionand productivity in the country through science-led andtechnology-driven farming systems approach rather thancommodity based approach.
The ICAR is giving a special thrust on integratedfarming systems, conservation agriculture, climate resilientagriculture, abiotic stress management, solid wastemanagement, and improving water and nutrient useefficiencies. In order to ensure site-specific balancefertilization and thereby improving soil health and cropproductivity in the country. Considering the presentscenario of climate change, the resources like soil, water,biodiversity etc. are likely to be under much more stress.A number of technological, institutional and policyinterventions including development of suitable cropvarieties and natural resource management practices suchas efficient agriculture, research programmes on increasingwater productivity, nutrient use efficiency, improving soilhealth, minimization of soil and environment pollutants,access to mechanization, post-harvest management, valueaddition and food safety are given more focus.
Total Chemical Pesticide Consumption
Registration Committee (RC) has registered 260 technicalgrade pesticides and 585 pesticide formulations. The listof such pesticides and the details of approved use isavailable in website www.cibrc.nic.in/mup.htm.
Central Government from time to time alerts StateGovernments to adhere to the crop pest combination intheir package of practices as approved by RC.
Pesticides Action Network India has submitted astudy report titled "Conditions of Paraquat Use in India".This chemical has already been included in the list ofpesticides taken up for expert review to assess desirabilityof its continuance as a weedicide in India. The Governmentof West Bengal has been apprised to have the matterinvestigated and appropriate action taken as per law.
The total chemical pesticide consumption is asfollows:
Year Quantity (Unit: MT Technical Grade)
2012-13 45619
2013-14 60282
2014-15 57353
Source: States/UTs Zonal Conference on inputs (Plant Protection)
Indian Council of Agricultural Research Vision-2050
The Indian Council of Agricultural Research (ICAR) isconstantly upgrading its research agenda to meet the futurechallenges and prepared a 'Vision-2050'. The document isavailable on ICAR website (http://www.icar.org.in).
The steps taken for providing new technologies tothe farmers across the country include setting up of642 Krishi Vigyan Kendras (KVKs) and 652 AgriculturalTechnology Management Agencies (ATMAs) at districtlevel. In addition the farmers are provided informationthrough Focused Publicity Campaigns, Kisan Call Centres(KCCs), Agri-Clinics and Agri-Business Centres (ACABC)of entrepreneurs, Agri Fairs and exhibitions, Kisan SMSPortal , DD Kisan TV Channel and Community RadioStations.
Besides, assistance to State Governments is providedfor boosting the agriculture production under variousschemes of Department of Agriculture and Cooperationviz. National Mission of Agricultural Extension andTechnology (NMAET), Parampragat Krishi Vikas Yojana,Mission for Integrated Development of Horticulture(MIDH), National Mission for Sustainable Agriculture(NMSA), Integrated Scheme on Agriculture Cooperation(ISAC), Rashtriya Krishi Vikas Yojana (RKVY), NationalFood Security Mission (NFSM), National Mission onOilseeds and Oil Palm (NMOOP), National HorticultureMission (NHM), Soil Health Card Scheme (SHC),Agriculture Technology Infrastructure Fund (ATIF) andPradhan Mantri Krishi Sinchai Yojana (PMKSY).
In addition to generation of new technologies, thelarge network of ICAR Institutes and AgriculturalUniversities across the country also provides information

14 Agricultural Situation in India
SERVER3\E\AGRICULTURE 2015\2588AGRI (SEPT, 2015)
to farmers regarding techniques and best practices forgetting higher production through various outreach andextension education programmes.
The project-wise details are as follows:
Farmers FIRST: The objectives of the 'FarmerFIRST' initiative is to move beyond the productionand productivity and to privilege the complex,diverse & risk prone realities of the farmers throughenhancing farmers-scientists contact with multistakeholders participation for technologydevelopment and application. The project has beenconceptualized with focus on Enriching Farmers -Scientist interface; Technology Assemblage,Application and feedback; Partnership andInstitutional Building and Content Mobilization.
ARYA: The ICAR has initiated a program on"Attracting and Retaining Youth in Agriculture(ARYA) in selected districts through KVKs with anobjective for entrepreneurial development of Youthin Rural Areas to take up various Agriculture, alliedand service sector enterprises for sustainable incomeand gainful employment. The identified youth aretrained on entrepreneurship development skills byproviding a basket of options to start agricultureventures for self employment.
Mera Gaon Mera Gaurav: The "Mera Gaon MeraGaurav" has been conceptualized in which scientistsof ICAR and Agricultural Universities will identifyvillages in the vicinity of the Institutions for providingadvisories and consultations to farmers for increasingfarm productivity and production.
Decisions for meeting Situation of Deficit Rainfall
The Cabinet Committee on Economic Affairs, chaired bythe Prime Minister Shri Narendra Modi, has approved theproposal of the Department of Agriculture & Cooperation,Ministry of Agriculture for initiating a series of farmerfriendly interventions in the wake of deficient rainfall asper IMD forecast of below average monsoon. This willhelp in dealing with challenges posed by delayed andaberrant monsoon. Immediate remedial measures are tobe initiated to save standing agricultural crops and perennialorchards.
CCEA approved following interventions/measuresto be initiated by State governments in the eventuality ofdrought deficit rainfall situation:
(a) Implementation of Diesel Subsidy Scheme forprotective irrigation of crops with an allocationof Rs. 100 crore;
(b) Enhancement of ceiling on seed subsidy topartially recompenstate the farmer for the
additional expenditure incurred in resowing andpurchasing appropriate varieties of seeds;
(c) Implementation of drought mitigatinginterventions on perennial horticulture cropswith an additional allocation of Rs. 150 croreunder Mission for Integrated Development ofHorticulture (MIDH);
(d) Implementation of Additional FodderDevelopment Programme (AFDP) as a sub-scheme of Rashtriya Krishi Vikas Yojana(RKVY) with an allocation of Rs. 50 croreduring 2015-16 for ensuring availability offodder;
These measures have been sanctioned with anadditional allocation of Rs. 300 crore during currentfinancial year. Actual expenditure may vary depending uponthe drought situation. These interventions/measures willbe applicable in all rainfall deficit areas of the country.
As a result of the above interventions, farmers willbe better equipped to deal with challenges posed by delayedand aberrant monsoon, as State governments will be ableto initiate immediate remedial measures to save standingagricultural crops and perennial orchards in rainfalldeficient districts. Besides, farmers will be able procureseeds for contingent cropping where normal sowingwindow is no longer available or resowing is required.Appropriate measures to ensure availability of fodder andfeed for livestock will be possible because of theseinterventions. These interventions will help in minimizingthe adverse impact of deficient rainfall on agricultureproduction.
Establishment and Strengthening Farmer'sParticipatory Seed Production System in Bihar SpecialPackage of Rs. 300 Crore for the Scheme
Union Agriculture Minister, Sh.Radha Mohan Singh hassaid that a project for Establishment and Strengthening ofFarmer's Participatory Seed Production System in Biharwill be take-up soon.
He said that it is proposed to have 50 number farmersparticipatory seed production system involving 12500farmers across the State of Bihar convering all districts.The location of the units is proposed in the State Seed Farmsacross the State. Bihar is having 244 State Seed Farms.Out of this, 7 SSF are having more than 50 ha. land. Whileselecting the location, it should not be vulnerable to flood(based on data of Kosi Flood and other flood years) andthe land/location should be in the elevated higher land, sothat threat of flood damage be avoided seed units, he added.
Through the farmers participatory seed production,the newly released varieties and the latest technology willbe disseminated to the farmers of Bihar through the scientistof Agriculture Universities.

September, 2015 15
SERVER3\E\AGRICULTURE 2015\2588AGRI (SEPT, 2015)
It is expected from each unit minimum 2000 tons ofseed is proposed to be produced and total of 10 lakh qtls.Seed its proposed to be produced and distributed to farmersof Bihar. If any surplus seeds, will be provided to thefarmers of Jharkhand. The productivity of crops will beenhanced over the years.
As the Submission on Seeds and Planting Material(SMSP) is having insufficient funds, it is proposed toprovide this funds from a special package for the state as aspecial case in the interest of the 10 crores people of Bihar.
Seeds are the critical inputs for enhancingproductivity, hence efforts are essential in ensuring theirtimely availability.
The MID-TERM Appraisal of XIIth Plan, it wasstated that the participatory seed production programmewith adequate pricing and marketing facilitation is requiredto infuse new varieties in the seed chain.
In Bihar, the productivity of Rice is 1753 kg/ha. in2013-14 against the national average of 2416 kg/ha. and394.3 kg/ha. in Punjab. In case of Wheat, the productivityof Bihar is 2427 kg/ha against the National average of 3123kg/ha. and 4710 kg/ha. in Haryana. In Maize, theproductivity in Bihar is 3287 kg/ha. against the highestproductivity 4745 kg/ha. in Tamilnadu. in Ragi, theproductivity in Bihar is 900 kg/ha. against the highestproductivity achieved in Tamilnadu 2360 kg/ha. Eventhough Bihar is in the Indo-Gangetic plain, the productionof crops is well below its potential yield when comparedto Punjab & Haryana.
The seed production system is very weak in Bihar.During Rabi 2014-15 the certified seed production andavailability by State Seed Corporation is only 126153 qtls.(12%) and State agency 78470 qtls. (7.46%) against theState requirement of 1050860 qtls.
Similarly during Kharif-2015, the certified seedproduction and availability of State Seed Corporation is64454 qtls. (15.64%) and State agency 5000 qtls. (1.21%)against the State requirement of 3,33,965 qtls. The State isnot all producing the seeds of Maize, Arhar, Moong, Urd,Dhaincha even though the State have huge technicalmanpower in State Department of Agriculture, BRBN andState Agriculture University.
National Research Centre on Integrated Farming atEast Champaran District Bihar
The foundation stone laying ceremony of NationalResearch Centre on Integrated Farming (ICAR-NRCIF)was held in Pipra Kothi, East Champaran district, Bihar.Union Minister of Agriculture, Shri Radha Mohan Singhwas the Chief Guest on the occasion.
Inaugurating the National Integrated AgricultureResearch Centre, Shri Radha Mohan Singh said that the
new institute will be dedicated to the welfare of the farmersin the region. The mandate of the institute will be to conductresearch on the development of location specific integratedfarming system models for diverse agro-ecologicalconditions specially flood and wetland situation withemphasis on rice, sugarcane and banana which require morewater. Agriculture Minister expressed hope that the institutewill bear the responsibility of developing integrated modelsfor whole of the region so that the food and nutritionalsecurity of people is secured. He declared that KVKs willbe strengthened across the country for accelerating the labto land programme.
Progressive farmers and entrepreneurs from theregion including seven women farmers, who have excelledin cultivation of mushroom, banana cultivation and riceproduction were felicitated by the Minister. On theoccasion, Dr S. Ayyappan, DG, ICAR and Secretary, DAREwelcomed all dignitaries and farmers and apprised aboutthe mandate of the newly established institute.
On this occasion, a Kishan Gosthi on IntegratedFarming and one Exhibition on agriculture were alsoorganised by ICAR. The programme was attended by morethan 3000 farmers from East Champaran and neighbouringdistricts and a large numbers of entrepreneurs, scientistsand social workers.
First Training Program on Pradhan Mantri KrishiSinchai Yojna for all India Services Officers held on24th August, 2015
The Inauguration program of the First Training Programon Pradhan Mantri Krishi Sinchai Yojna(PMKSY) for AllIndia Services Officers (IAS/IFS) , was held at NationalWater Academy (NWA), Pune on Monday, 24 August, 2015.
The Training Programme was inaugurated by Dr.D.K. Jain, Additional Chief Secretary(Agriculture),Government of Maharashtra and Dr. Amita Prasad, JointSecretary (Ministry of Water Resources), Govt. of Indiadelivered the key Note Address. Dr. Sanjeev Chopra, JointSecretary (Agriculture) gave the overview of the PMKSYand the expectation from PMKSY. He also released theTraining Manual and Reading Materials on PMKSY forDistrict Irrigation Plan (DIP).
Under the recently launched Central Scheme PradhanMantri Krishi Sinchai Yojna (PMKSY). It has been decidedto organize Training Programs for all India ServicesOfficers (IAS/IFS) of recent three Batches. The Nationalwater Academy (NWA) has been designated as ResourceInstitute for organizing the first Training programs of theseries with Western States of the country namely fromMaharashtra, Goa, Gujarat and Rajasthan States, whereinabout 20 IAS/IFS officers are participating.
In the key Note Speech, Dr. Amita Prasad stressedthe need for new ways of irrigation practices, Keeping in
16 Agricultural Situation in India
SERVER3\E\AGRICULTURE 2015\2588AGRI (SEPT, 2015)
view the Pressure on water resources and reviving sometraditional water conservation practices, if they provebeneficial. Dr. Jain stressed on the water use and efficiencyand crop change to judiciously use the scarce waterresources.
Union Agriculture and Farmers Welfare MinisterInaugurate Skills Training Centers in ThreeMadarasas as a Pilot Project for Skill Development ofthe Minority Community in Bihar
Union Agriculture and Farmers Welfare Minister, ShriRadha Mohan Singh inaugurated the skill training centersat three Madarasas located in Patna, Motihari and Kesariyain Patna, Bihar, on 31st August, 2015. On the occasionShri Singh said that these projects are on the line of ModiGovernment vision "Sabka Sath Sabka Vikas." Shri Singhinformed that Rs 3.60 crore has been provided to the3 Madarasas, which will be spent on skill development of
minority community. These centers run as pilot project andwill be extended to others madarasas, after this they willget certificate and loan will be provided at lower interestrates. Union Agriculture and Farmers Welfare Minister alsoannounced to setting up of R.O. plants in these Madarasasto make available clean drinking water for students.
On the occasion, Minister of Minority Affairs, Dr.Najma A. Heptullah said that "the launch of the skill trainingcenters through traditional educational institutions is animportant milestone towards achieving the objective ofskilling minorities' community across the country. Thisscheme will bring together specialized training providers,leading industry bodies and trainees. The core objectiveof the scheme is to provide top quality skill training at theneighbourhood as per the demand of the market to thestudents who are currently enrolled with traditionaleducational institutions like Madarasas, Maktabs etc, orhave dropped out."

September, 2015 17
SERVER3\E\AGRICULTURE 2015\2588AGRI (SEPT, 2015)
ARTICLESImportance of Livestock Health Services for Sustainability in Livestock Production: The Next Food Revolution
in India
PUSHPA*,PUNITAGARWAL*, B.S. CHANDEL**,BULBUL G. NAGRALE*The sector supports the livelihood of over 200 million
rural poor in India. A large majority of livestock owninghouseholds comprise of small and marginal farmers andlandless households. Overall, the distribution of livestockhas been found to be much more equitable than that ofland, leading to more equitable distribution of gains fromlivestock production.
Livestock is also one of the most importantproductive assets in the rural areas and an insurancemechanism to cope with household related crisis (Ahuja etal. 2000; World Bank, 1999; LID, 1999; de Haan, et al.,2001). India has been making a steady progress in thissector with index of meat and milk production havingincreased to about 170 in 2005 from the base of 100 in1991, a sustained annual growth rate of more than 3.5 percent. The value of livestock output has also grown at thesame rate, and there are expectations of faster growth indemand for livestock products due to expectations of risingincomes combined with high income elasticity of demandfor livestock products. The gross value of output fromlivestock sector at current prices was estimated at aboutRs.130233 million during 1999-00, which was about 27per cent of the total value of agricultural output (GOI,2011a), as shown in table 1. Similarly, at the global level,the consumption of livestock products is growing fasterthan the cereals. Milk consumption has grown by over 3per cent per year since the early 1980s and is forecasted togrow even faster through 2020. Meat consumption has beengrowing about 5 per cent per year and is expected to growa little less than 3 percent per year through 2020 (Delgadoet al., 1999). Due to faster population growth, increasingurbanization, growing health concerns and overall risingincomes, future growth in demand for foods of animalorigin is primarily expected to come from the developingcountries. These developments are likely to have significantinfluence on global economy in general and the economyof developing countries in particular. In view of thesedevelopments, the process has been described as the'livestock revolution'. Given the size and distribution ofIndia's livestock population, these developments presentsignificant opportunity for India to boost rural incomes andaccelerate the pace of poverty reduction. But successfulcapitalization of these opportunities requires a policyregime that facilitates growth in productivity at the farm
Abstract
The importance of Livestock Sector in Agricultural Sectoris evident from its rising share in Agricultural GDP.However, the growth of Livestock Sector is conditionedby livestock support services, wherein the performance ofservices is judged from the efficiency and effectiveness oflivestock support services. The present study is targeted atthis crucial component of development. The efficientdelivery of livestock services has become a subject of risingconcern to many national and international organisationssuch as FAO, World Bank and ILRI In India, recognisingthe importance of livestock for the rural poor and theirlimited financial access to these livestock support, thecentral and state governments have been extending theseservices at a huge subsidy. There is a vast network ofveterinary institution in the public sector that offersveterinary and breeding services to the farmers at very lowprices. On one side, government is subsidising theseservices so that farmers can easily avail these services andon the other side, due to high subsidy the quality of servicesare not maintained by the Govt. agencies as they arecharging a very nominal fee for delivering these services.Initiative policy aimed at increased cost recovery, whichcould alleviate these financial difficulties, is often deferredby the policy makers on the assumption that the farmerswould not be willing to pay for these services.
Introduction
India has a fast growing livestock sector and it is takingsteps to achieve self-sufficiency in production of animalproducts. India ranks first in the world in production of milk,seventh in production of egg and eighth in export of meat. Itis projected that by 2020, meat, egg and milk productionwill increase by 50%, 35% and 25%, respectively.Effectivemeasures to guarantee animal health through exclusion and/or containment of emerging as well as trans-boundary orexotic animal diseases is a prerequisite for sustained livestockproduction. There is a growing threat of use of biologicalagents by terrorists to deliberately cause animal diseases inorder to destroy animal wealth and to cripple the economyof a country. In a conducive environment organisms used inbiological weapons can multiply and self perpetuate and incourse of time they may naturally mutate and frustratecurrently available protective measures.
*Ph.D. Scholars, **Principle Scientist, Department of Dairy Economics, Statistics & Management, National Dairy Research Institute, Karnal-132 001,Haryana, India

18 Agricultural Situation in India
SERVER3\E\AGRICULTURE 2015\2588AGRI (SEPT, 2015)
as well as in the processing sector, builds institutions thatencourage integration of small scale producers in the valuechain, and effectively regulates markets to minimize failuresand the negative external effects. The productive potentialof animals depends crucially on the animal health system,and, on this count, India has a poor record. The quality oflivestock support services remains poor and diseasesurveillance, control, diagnostics and reporting continueto be weak.
India has the largest population of cattle and buffaloesin the world, accounting for 56.7% of world's buffaloes,12.5% cattle, 20.4% small ruminants, 2.4% camel, 1.4%equine, 1.5% pigs and 3.1% poultry. The country is atnumber one in the world in terms of milk production,number seventh in egg production and top eighth countryin meat production. From 1950-51 to 2010-11, milkproduction increased from around 17 million tons to 122million tons, egg production from 1.8 billion to 65.5 billionand wool production from 27.5 million kgs. to 44.4 millionkgs. The production of meat has also shown increase inthe past decade, increasing more than two-fold from 1.9million tonnes in 2000-01 to about 5 million tonnes in 2011-12.
TABLE 1 MILK PRODUCTION, EGG PRODUCTION AND
WOOL PRODUCTION IN INDIA
Year Milk Egg Wool MeatProduction Production Production Production
(Million (Million (M. Kgs) (Milliontonnes) Number) tonnes)
1 2 3 4 5
1950-51 17 1832 27.5 -
1960-61 20 2881 28.7 -
1980-81 31.6 10060 32 -
1990-91 53.9 21101 41.2 -
2000-01 80.6 36632 48.4 1.9
2011-12 127.3 65480 44.4 5.1
Currently, India has over 50,000 veterinaryinstitutions run by various state governments. Theseinstitutions mostly provide clinical veterinary and breedingservices and together employ over 100,000 veterinariansand paraveterinary staff. Over 75 per cent of the staff arecommitted to delivery of curative veterinary care. Theprofessional staff responsible for disease investigation andcontrol is a meager 3.5 per cent of the total, supplementedby limited vaccination input in the field. As a result, animaldiseases like Foot and Mouth Disease, HS, and Brucellosis,continue to inflict economic losses on livestock producersand restrict opportunities for trade. The recent Avian Fluoutbreak also exposed critical weaknesses in the existinganimal health systems from both the productivity andzoonotic disease standpoints. While efforts to developvaccines and treatments should continue to be supported,the capacity and infrastructure of the existing institutionsto implement disease eradication programs, respond tooutbreaks, and establish effective surveillance programsneed considerable improvement. In the light of theforegoing, this paper attempts to explore key issues inanimal health. More specifically, the paper attempts to(i) identify the major animal diseases that are affectinglivestock in India, (ii) review the systems which are in placeto deal with surveillance, prevention and control of majoranimal diseases.
TABLE 2 SHARE OF AGRICULTURE AND LIVESTOCK SECTOR IN GDP (AT CONSTANT PRICES)
Year GDP- Total GDP-Agriculture GDP-Livestock(Rs in (Rs. in % to total (Rs. in % to total % toBillion) Billion) GDP Billion) GDP Agri.
(at 1999-00 prices)1999-2000 17865 4097 22.93 947 5.30 23.122000-01 18643 4072 21.84 986 5.29 24.232001-02 19726 4335 21.97 1019 5.16 23.502002-03 20483 3982 19.44 1067 5.21 26.812003-04 22228 4414 19.86 1078 4.85 24.43(at 2004-05 prices)2004-05 29715 4766 16.04 1193 4.02 25.042005-06 32531 5030 15.46 1268 3.90 25.202006-07 35644 5237 14.69 1333 3.74 25.462007-08 38966 5570 14.29 1414 3.63 25.392008-09 41587 5554 13.36 1532 3.68 27.592009-10 45076 5594 12.41 1614 3.58 28.862010-11 48860 6029 12.34 1645 3.37 27.28Source: National Accounts Division, Central Statistical Office, M/O Statistics & Programme Implementation
1 2 3 4 5

September, 2015 19
SERVER3\E\AGRICULTURE 2015\2588AGRI (SEPT, 2015)
TABLE 3: VALUE OF EXPORT OF LIVESTOCK AND LIVESTOCK
PRODUCTS DURING 2008-09 & 2009-10.Lakh (Rs)
Broad Groups 2009-10 2010-11
Livestock 8,013 5,544
Meat and Edible Meat Offal's 624,531 871,368
Dairy and Poultry Products and Honey 91,470 105,375
Animal Fodder and Feed 819,168 1,117,459
Raw hide and skins & Leather 304,303 371,024
Raw Wool and Animal Hair 56,159 70,116
All Groups(Total) 1,903,644 2,540,886
India's Total Export 84,553,364 114,264,897
Source - Directorate General of Statistics & Commercial Intelligence,Calcutta,(DGCIS, Calcutta)
TABLE 4 INDIA'S EXPORT SCENARIO OF DAIRY PRODUCTS (2011)(Quantity in Million MT.)
Serial Country Total Import India's Status as ExporterNo Quantity Value Quantity Value %age Share Rank
in value 1 Egypt 332875.65 628.28 9747.41 14.58 2.32 11
2 Bhutan 5265.91 14.28 5249.28 14.26 99.86 1
3 Nepal 12762.73 13.29 11538.38 9.80 73.74 1
4 Singapore 307932.85 990.11 2306.73 5.04 0.51 21
5 Oman 170818.35 417.86 841.81 4.01 0.96 9
6 Morocco 67630.76 282.35 863.15 3.78 1.34 11
7 USA 115670.24 1579.24 338.08 2.80 0.18 32
8 Saudi Arabia 489570.45 1804.98 459.00 2.51 0.14 29
9 Bahrain 80897.79 206.77 487.38 2.42 1.17 11
10 Australia 148271.31 637.83 899.42 2.40 0.38 16
Source: UNCOMTRADE, as reported by the Importing countries (updated as on 15-July-2014)
MAJOR EXPORTING COUNTRIES
(Percentage share in Value)
New Zealand (31.29) USA (15.03) Germany (8.04) Denmark (6.39) Netherlands(6.26)
India (99.79) Thailand (0.14) Bangladesh (0.07) Austria (0.00) Nepal (0.00)
India (73.80) Bangladesh (7.68) New Zealand (6.78) Belgium (3.39) China (1.73)
New Zealand (30.67) Australia (23.92) USA (6.22) France (5.72) Malaysia (5.61)
Denmark (29.64) United Arab Emirates Saudi Arabia (11.56) Australia (11.42) Netherlands(14.84) (8.67)
New Zealand (25.56) USA (22.83) Netherlands (16.66) France (11.13) Belgium (4.33)
Italy (20.64) New Zealand (18.40) France (12.53) Netherlands (5.21) Canada (4.64)
New Zealand (21.49) Netherlands (10.35) United Arab Emirates Denmark (7.99) USA (6.08)(8.91)
Saudi Arabia (30.88) New Zealand (22.10) Ireland (9.89) Australia (7.87) USA (5.50)
New Zealand (61.13) USA (8.86) Italy (6.20) Denmark (4.44) France (3.18)
Source: UNCOMTRADE, as reported by the Importing countries (updated as on 15-July-2014)

20 Agricultural Situation in India
SERVER3\E\AGRICULTURE 2015\2588AGRI (SEPT, 2015)
Livestock-led DiversificationLivestock output in India is growing faster than any otheragricultural sub-sector. In the early 50's, livestockaccounted for less than about 1/5 of the total agriculturaloutput, which remained more or less same till the 1980-81. In the past two decades due to faster growth of thelivestock sector than the crop sector, its share in total valuesof agricultural output rose and now stands at over 1/4,clearly showing that livestock activities have been aninstrument of diversification in the agricultural sector.Across states, the contribution of livestock sector to totalagricultural output has been grater or equals to 30% inseveral states, Haryana, Punjab, Rajasthan, Tamil Nadu,Andhra Pradesh, Bihar, Jharkhand, etc. This shows that inthe scenario of shrinking size of agricultural holding,diversification of agricultural activities towards livestockwould hold the key for sustaining farm incomes.
Diversification within Livestock sub-sector
Within livestock sector, the dairy sub-sector has thepredominant role, followed by meat, eggs among edibleproducts and dung among non-edible products. There isvast potential in several parts of the country fordiversification towards livestock other than dairy animals,especially the small ruminants.
Small Ruminants
The small ruminants provide livelihood support to the poorunderprivileged landless, and marginal farm households.The goat and sheep production systems are mainlysubsistence-oriented, but in view of the rising demand formeat and wool, there is a great scope for theircommercialization. The population of sheep has stagnatedexcept a marginal increase between 2003 and 2007. Thewool production has declined to around 44 million kg, ofwhich fine wool is only 10 per cent. Although goatpopulation grew faster than any other species of livestock,yet is potential for enhancing livestock growth remainsuntapped.
In the western part of Haryana,the net profit marginin sheep rearing was about 17% and for goat rearing, itwas much higher at 34%. The goats of different breeds arereared in the state. Beetal and its grades are mainly foundin the districts of Hisar, Sirsa, Bhiwani, Rohtak, Karnal
and Kurukshetra whereas Jakhrana and its grades are foundin Narnaul, Gurgaon, Bhiwani and Rohtak .Barbari goatsare mainly confined along Jamuna River in the districts ofMewat, Palwal, Faridabad and Gurgaon. The StateGovernment of Haryana has recently launched a schemefor improving the productivity of goats. Under the scheme,the animals of identified and registrated goat owners willsubject to mass deworming, vaccination, supply of mineralmixture and supply of concentrated feed @ 250 gm. perday for 60 days.
Emerging Diseases
India's huge livestock population is besieged by a largenumber of endemic infectious(bacterial, viral andprotozoan) and parasitic diseases which causeconsiderable economic losses to predominantly poor,marginal and landless farming community. The diseaserelated economic losses arise through morbidity, mortality,decreased production, reduced fertility, inefficient feedutilization resulting inadequate weight gain and impaireddraught power. Further, some of these diseases arezoonotic and have significant impact on public healthespecially among women who traditionally work withanimals.Unpredictable agrarian conditions influenced byweather, draught, floods, live stock migratory habits, pooranimal nutrition, zoo-sanitary and health care practicesinvariably have resulted in high incidence and prevalenceof livestock and poultry diseases, often round the year.Also, regional animal husbandry management practicesand diverse agro-climatic conditions play pivotal role insustenance of location specific livestock diseases in thecountry. In the Indian context, most livestock diseasesare highly location-specific although FMD is truly‘Transboundary’ and outbreaks occur round theyear inmost parts of the country.India's performance in controlof diseases has been and continues to be less thansatisfactory. While the country has been declaredprovisionally free from Rinderpest by OIE, a number ofother diseases like FMD, BQ, HS etc, continue to persistwith high and some time growing intensity. In smallruminants the outbreak of diseases like Peste DespetitsRuminant (PPR) and Blue tongue is quite frequent andso is the case of New CastleDisease, Infectious BursalDisease (IBD) and chronic respiratory disease, in the caseof poultry.

September, 2015 21
SERVER3\E\AGRICULTURE 2015\2588AGRI (SEPT, 2015)
TABLE 3: INCIDENCE OF LIVESTOCK DISEASES IN INDIA
Disease 2005 2006 2007Outbreak Attack Death Outbreak Attack Death Outbreak Attack Death
1 2 3 4 5 6 7 8 9 10Foot & Mouth Disease 2270 81909 2797 1646 65073 428 1547 51101 1338Haemorrhagic Septicaemia 775 4753 2229 770 5143 1983 470 3563 1252Black Quarter 519 2396 956 534 2261 1062 467 2037 768Anthrax 119 668 569 113 616 453 111 490 452Fascioliasis 67 311252 96 66 527668 22 85 391632 29Enterotoxaemia 521 9806 3158 461 3974 1932 462 6782 1969Sheep & Goat Pox 529 21292 2834 1389 19935 5357 777 18261 3681Cow Pox .. .. .. 1 10 0 2 3 0Buffalo Pox .. .. .. 17 181 0 9 34 0Blue Tongue 1183 280788 64086 154 4951 651 302 3856 545C.C.P.P. 12 1067 305 1 45 19 2 163 87Amphistomiasis .. .. .. 12 375 54 17 772 4Schistosomiasis .. .. .. .. .. .. .. .. ..Swine Fever 54 4697 2539 40 4519 2327 93 2996 950Salmonellosis .. .. .. .. .. .. .. .. ..Coccidiosis 313 85864 4199 335 23763 11763 204 11407 4612Ranikhet (New Castle) Disease 391 72741 13125 391 36416 10120 280 75726 14423Fowl Pox 79 2574 3131 44 1566 388 72 3787 388Fowl Cholera 1 2 2 4 284 152 6 307 294Marks Disease .. .. .. 6 925 925 - - -I.B.D. 249 112392 11402 260 20198 12117 177 28048 7292Duck Plague 17 611 168 34 1177 546 20 364 177Salmonellosis 158 250668 3886 7 599 180 3 30 10Glanders .. .. .. .. .. .. .. .. ..Chronic Respiratory Disease 119 108511 7980 122 21778 20369 165 29046 16194Canine Distemper .. .. .. 34 825 29 94 1282 72Rabies 33 84 84 17 43 43 43 301 301Babesiosis 26 3648 10 26 1233 6 45 1670 13Mastitis .. .. .. 35 11907 0 53 10631 0Trypanismiasis 22 425 26 26 321 9 27 309 14Mange 3 48 0 536 7413 0 290 4817 0Marex .. .. .. .. .. .. .. .. ..Peste Des Petits Ruminant 1071 65820 15864 577 28075 7059 434 18328 4025Anaplasmosis 13 317 1 14 73 1 13 86 0Brucellosis 3 13 0 6 551 6 - - -Coryza 17 6762 300 2 500 13 5 10200 18Highly Pathogenic Avian Influenza .. .. .. 2 - 104834* 2 134 133Avian Influenza .. .. .. .. .. .. .. .. ..Equine Influenza .. .. .. .. .. .. .. .. ..Glander Disease .. .. .. 2 23# 23@ .. .. ..* Figures pertains to number of poultry destroyed.# 1702 samples tested out of which 23 found positive and destroyed.@ Figures pertains to number of animals destroyed.

22 Agricultural Situation in India
SERVER3\E\AGRICULTURE 2015\2588AGRI (SEPT, 2015)
TABLE 4: INCIDENCE OF LIVESTOCK DISEASES IN INDIA
Disease 2008 2009Outbreak Attack Death Outbreak Attack Death
1 2 3 4 5 6 7
Foot & Mouth Disease 449 12753 278 902 26527 473Haemorrhagic Septicaemia 359 2519 1082 296 3729 1595Black Quarter 294 883 365 322 1109 481Anthrax 68 916 701 60 1627 478Fascioliasis 84 375347 6 115 345348 67Enterotoxaemia 283 2970 888 153 2167 533Sheep & Goat Pox 63 2279 689 105 2006 592Buffalo Pox 3 22 0 2 50 0Blue Tongue 132 2903 342 73 2999 688C.C.P.P. 3 405 40 0 0 0Amphistomiasis 49 1393 0 150 9497 20Schistosomiasis 1 1 0 1 87 0Swine Fever 95 2027 894 136 5267 1646Salmonellosis 18 2952 87 67 120923 7129Coccidiosis 203 16213 2859 383 110617 14808Ranikhet (New Castle) Disease 230 72959 10317 412 185114 16273Fowl Pox 90 6944 1122 122 16702 1816Fowl Cholera 8 2727 871 26 2158 1789Marks Disease 0 0 0 1 300 1I.B.D. 93 17348 5605 127 33458 7594Duck Plague 5 385 0 13 35982 110Glanders 1 132 0 4 4 4Chronic Respiratory Disease 52 10468 5779 224 76900 38881Canine Distemper 97 1024 47 188 3494 355Rabies 47 98 98 97 324 324Babesiosis 48 1781 33 130 2694 28Mastitis 64 7546 0 117 26333 0Trypanismiasis 26 1185 108 90 283 53Trypanismiasis (Surra) 6 280 99 .. .. ..Mange 346 6186 4 458 9238 12Marex 0 0 0 0 0 0Peste Des Petits Ruminant 165 4496 1092 184 9271 2577Goat Pox 0 0 0 .. .. ..Anaplasmosis 14 97 8 16 1911 0Brucellosis 3 61 7 4 94 0Coryza 14 5650 36 2 3150 6Avian Influenza 60 130626 130619* 10 1065 854Equine Influenza 25 19431 16 17 250 5SOURCE:Department of Animal Husbandry & Dairying, Ministry of Agriculture* 4861979 birds culled.

September, 2015 23
SERVER3\E\AGRICULTURE 2015\2588AGRI (SEPT, 2015)
Mortality data on account of these diseases is notavailable, but scattered studies suggest substantial loss ofproduction and value due to these diseases. According toone study, diseases cause an annual loss of INR 132 billion.Among cattle the most widespread disease is foot andmouth disease.Exotic DiseasesThere has been always a risk of introduction of newdiseases/pathogenic organisms into a country causingserious animal health problems in terms of mortality andmorbidity. Exotic (non native) pathogens, once introducedinto a country, can escalate into an epidemic due to theabsence of vaccine or effective drugs, lack of resistance inhost animals and limited resources to diagnose and restrictthe spread of these pathogens. Hence, there is a need totake extra permitted countries to exercise their sovereignrights to protect their livestock industry from such diseases.Diagnosis and Control MeasuresLaboratory facilitiesIn India, facilities are available to diagnose and controlexisting animal diseases. Apart from laboratories at the stateand district levels, there are referral diagnostic facilitiesincluding national and regional laboratories with advancedtechnologies. In 1998, a containment laboratory of Bio-safety Level-4 (BSL-4) High Security Animal DiseaseLaboratory (HSADL) has been established with state-of-the-art facilities at Bhopal. This is one of the ten suchcontainment laboratories in the world. It is safe for handlinghigh risk (risk group-IV) and exotic animal pathogens. And,it has been authorized by the Government to diagnose andsuggest suitable control measures for exotic and emerginganimal diseases, which might gain entry into the countrythrough international borders.Research and Diagnostic CapabilitiesIn India, technology is available to diagnose and controlexisting animal diseases. The High Security Animal DiseaseLaboratory at Bhopal is involved in diagnosis and controlof exotic and emerging animal diseases. It is well equippedfor research and diagnosis of diseases using conventionaland latest molecular biological techniques. The scientificmanpower is well trained and adequate.
In India, technology has been developed for diagnosisof exotic diseases using OIE recommended tests and latestmolecular techniques like PCR, gene cloning andsequencing. Facilities are also available for monoclonalantibody production against various exotic animalpathogens. Presently projects are being undertaken forresearch and diagnosis of avian influenza, rabbithemonhagic disease, Bovine viral diarrhea, Bovineimmune deficiency, Aujeszky's disease, porcinereproductive and respiratory syndrome, transmissiblegastroenteritis, African swine fever, malignant Catarrhalfever, caprine arthritis and encephalitis.While undertakingsurveillance on these diseases, Aujeszky's disease, bovine
immunodeficiency and malignant Catarrhal fever have beendiagnosed by serology, PCR and gene sequencing. Thesediseases are yet to be confirmed by isolation of theetiological agents. Base line data generated over the lastfive years has indicated the absence of highly pathogenicavian influenza, rabbi thaemorrhagic disease, porcinereproductive and respiratory syndrome,transmissiblegastroenteritis and African Swine fever. In addition, thelaboratory has developed recombinant antigen and monoclonal antibody based competitive ELISA kits for diagnosisof bovine viral diarrhoea and bovine immuno-deficiency.The later is the first diagnostic kit of its kind inthe world.
In 2001, the High Security Animal DiseaseLaboratory diagnosed highly immediately and the entry ofthis disease to India could be prevented. Since thensurveillance work on avian influenza has been carried outall over the country and more than thousand birds fromdifferent parts of the country including western and easternstates have been tested so far. In spite of the fact that severalAsian countries are affected with H5Nl subtype of the virus,also pathogenic to humans, no case has been detected inIndia. India has so far remained free from highly pathogenicavian influenza because of the prompt action taken by theGovernment through the ban imposed on import of poultry,poultry products and biological.Besides, internationalborders were sealed and strict surveillance was carried outin states adjoining international borders. The High SecurityAnimal Disease Laboratory played a vital role in preventingthe entry of this disease to the country.The laboratory iswell equipped for diagnosis of avian influenza using OIErecommended tests including pathogenicity test and sub-typing of the virus. Facilities are also available forsequencing of the viral genomes. In 2001, rabbits importedinto the country for breeding program were diagnosed forrabbit hemorrhagic disease and their destruction during thequarantine period saved the country from the ingress ofthis disease.
Future Strategies
1. Improving Effectiveness and Sustainability ofGovernment Services
Balancing the role of government and encouraging privateproviders are the objectives under this option. This, in theshort term, would require:
• Improving the effectiveness and financialsustainability of government services throughoperational and financial autonomy of veterinarycentres and cost recovery;
• Creating the enabling environment for greater privatesector participation in the delivery of livestockservices; and
• Establishing the regulatory framework to ensurequality of service delivery.

24 Agricultural Situation in India
SERVER3\E\AGRICULTURE 2015\2588AGRI (SEPT, 2015)
2. Fostering greater financial autonomy of veterinaryinstitutionsRestructuring the veterinary services delivery network,enabling each of the veterinary hospitals, dispensaries todevelop into financially autonomous entities would ensuretheir sustainability. This would require full cost recoveryfor all curative veterinary and other private good servicesdelivered at the centre as well as at home. The full costsrecovered will include:
• Cost of materials and supplies such as drugs andconsumables for veterinary care,
• Transport cost in the case of home delivery; and anappropriate share of salaries and establishment costs.Under this option, the service unit should be allowed
to retain the revenues from recovering the cost of the (i)materials and supplies (drugs, consumables, frozen semen,liquid nitrogen,etc.), and (ii) an appropriate share of theestablishment costs. These revenues would be used to buildup a revolving fund to ensure financial sustainability overthe longer term. To minimize the current establishmentcosts, revaluation of the government staffing structure andthe adoption of mechanisms (e.g., early retirement and re-assignment to neglected localities) will be needed in parallelto improve the cost effectiveness of the existing systemwhile promoting broader coverage in neglected areas. Thiswould lead to a reduction in the fiscal subsidy requirementof government services and improvement in the quality ofservice that government centres could provide to farmers,particularly in ensuring the availability of essential drugsand other supplies as well as expansion of areas covered.
The future progress in animal disease diagnosisdepends largely on the development of more accuratelaboratory tests. The enormous progress in biomedicalscience including that of biotechnology during the lasttwo decades made the development of novel tests possible.However, harmonization of test methodologies is necessaryfor uniformity in diagnosis and subsequent controlmeasures.India is developing diagnostic technologies formost of the exotic diseases, which might pose a threat. Stepsare also being taken to disseminate technology in advanceareas of disease diagnosis and control for the benefit ofthe animal industry. The appearance of a potentiallydisastrous animal disease or even suspicion of the existenceof such a disease is considered as a disease emergency andIndia is in a position to handle such emergencies.Organizational structures to enact statutes and providedirectives necessary to contain such situations have been apriority of the Government. The country is committed toestablish a comprehensive national campaign for diagnosisand control of emergency diseases similar to that developedfor the control of Rinder Pest, Foot and Mouth diseaseand Avian Influenza.REFERENCES
Ahuja, V. (1999). Animal and Health BreedingServices in Gujarat: A profile of Service Providers. In
Ahuja, V. (Ed.), Workshop on Commercialization ofLivestock and Breeding Services in India: Paper andProceedings: IIM, Ahmedabad, The world Bank,Washington DC and SDC, Bern.
Ahuja, V., Mc Connell, K.E., Umali D., and Haan,C. (2003a).Are the Poor Willing to Pay for LivestockServices? Evidences From Rural India. Indian Journal ofAgricultural Economics, 58 (1), 84-100.
Ahuja, V., Morrenhof, J. and Sen, A. (2003b). TheDelivery of Veterinary Services to Poorer Communities:The Case of Rural Orissa, India. Scientific and TechnicalReview, OIE, France, 22 (3), 931-948.
Bachhe, V.L. (1980). A Study of Economic Aspectsof A.I. Programmes in the ICDP of Pune. UnpublishedM.Sc. Dissertation, National Dairy Research Institute,Karnal, India.
Ahuja, Vinod (Editor). 2004. Livestock andLivelihoods:Challenges and Opportunities for Asia in theEmerging Market Environment, National DairyDevelopment Board of Indian and Food andAgricultureOrganization of the United Nations 372p.
Ahuja, Vinod; P.S.George, Sunil Ray, M.P.G.Kurupand Vasant Gandhi. 2000. Agricultural Services and thePoor: Case of Livestock Health and Breeding Services inIndia, IIM Ahmedabad, The World Bank, and SDC, Bern.
Ahuja, Vinod. 2004. "Economic Rationale for Public-Private Delivery of Livestock Services" OIE Scientificand Technical Review, 23(1):33-45. Ahuja, Vinod, JanMorrenhof and Arindam Sen. 2003."Veterinary ServicesDelivery and the Poor: Case of Rural Orissa, India" OIEScientific and Technical Review, Vol. 22, Number 3,December 2003.
Ahuja, Vinod, Dina Umali-Deininger and Cees deHaan.2003. "Market Structure and the Demand forVeterinary Services in India" Agricultural Economics,29:27-42.
Ahuja, Vinod; Kenneth E. McConnell, Dina Umali-Deininger and Cees de Haan. 2000. "Are the Poor Willingto Pay for Livestock Services? Evidence from Rural India"Indian Journal of Agricultural Economics, (58)1:84-99.
Ahuja, Vinod; PS George; Sunil Ray; Kenneth McConnell; Vasant Gandhi; Dina Umali Deininger and Ceesde Haann. 2000. Agricultural Services and the Poor: Caseof Livestock Health and Breeding Services in India, IndianInstitute of Management, Ahmedabad; The World Bank, andSwiss Agency for Development and Cooperation.
Annual Report 2012, Department of AnimalHusbandry, Dairying & Fisheries Ministry of AgricultureGovernment of India New Delhi.
Animal Husbandry Statistics Part VII, 2012. Animalhealth division, Department of Animal Husbandry &Dairying & Fisheries.

September, 2015 25
SERVER3\E\AGRICULTURE 2015\2588AGRI (SEPT, 2015)
Regional Disparities in the Levels of Agricultural Development in India: Comparison ofPre Reform and Post Reform Periods
JASKARAN SINGH*
Abstract
This research paper measures and analyzes the extent andvariations of regional disparities in agriculturalperformance during two policy regimes pre-reform (1971-73 to 1991-93) and post-reform period (1991-93 to 2008-11). The immediate effect of the process of economicreform initiated in India during 1991 not only led to seriousdeceleration in Indian agriculture but it also led to wideningof inter-state disparities. Spatial and temporal analysis ofthe level of agricultural development shows that whilegrowth rate agricultural output picked up in the recentdecade yet regional disparities are still at higher level.Theonly positive development of the post reform period wasreduction in inter-state disparities in the use of moderninputs like fertilizer, tractors, tubewells, and electrification.The use of agricultural inputs and expansion ofinfrastructure after reforms improved significantly but thisfailed to dampen the inter-regional disparities in growth ofagricultural production across states.This suggests thatgrowth in input use and output growth is not that stateforward in agriculture. Some other factors like agro-climaticconditions and technological developments along withpolicies and programmes of the government still playcrucial role in agricultural performance and bridging ofregional divides.
Introduction
Indian agricultural witnessed remarkable changes duringpost- independence period from a food deficit country oneve of independence, India became self-sufficient so faras its food security is concerned. This overall wellrecognized achievement notwithstanding; Indianagriculture is still marked by variations in its temporal andspatial performance. Neither the growth was samethroughout the post-independence period nor it is uniformacross all the regions and states in the country. While thetemporal variations are mainly associated with the differentpolicy regimes, the spatial deviations are the combinedresult of state specific policies, natural and human resourcesendowments, and various constraints operating at statelevels. During early 1990s, sweeping economic reformswere undertaken in India and most of the developing world.Though almost all of these reforms were initiated in non-agriculture sector, but they were expected to go a long wayto affect agriculture through various linkages. Another
major development during 1990s was acceptance of theUruguay Round of GATT agreement and signing of WTOin 1995. Policy initiatives under structural reforms andWTO agreement significantly affected Indian agriculture.For a decade as so it lead to deceleration in agriculturalgrowth. The serious problem of indebtedness and farmers'suicides during this period indicated the poor plight of thefarming community and agricultural sector in the country.Some researchers attributed these adverse outcomes asbacklash of WTO and new economic policy regimes.Consequently, agriculture assumed the central stage andsubsequently it received increased attention of Governmentand policy-makers.
These changing policy regimes and economicsituations are likely to impact various regional unitsdifferently. This is mainly so because agriculture is a statesubject and many agricultural development initiatives areundertaken by the respective state Governments. Similarly,because of very big size of the country, varied agro-climaticconditions, and different cropping pattern in variousregions, impact of different policy regimes are likely tohave differential impact on performance of agricultureacross states in the country.
From past many years, a large numbers of studieshave been conducted to investigate the disparities orinequalities in agricultural sector and causes thereof. Aftergreen revolution period there was a tendency ofexclusiveness in the development of Indian agriculture. Toinvestigate this exclusiveness, there were several studies,which dealt with regional variation in agriculture sector.Studies like Birthal et.al (2011), Bhalla and Singh (2010).Mukherjee and Kuronda (2003) and Sawant (1997) findthat there is a steady rise in the regional disparities in thedevelopment of agriculture sector.They investigated maincause behind these disparities were differences ininfrastructure, technology and policy making.
Recent studies of Deokar and Shetty (2014) andBalaji and Pal (2014) on the performance of agricultureshow decline in variation and improvement in productivitygrowth. This paper attempts to investigate (i) regional andtemporal variations in the levels of agriculturaldevelopment across major states in India and (ii) the extentof spatial disparities across states and regions overtimeduring these policy regimes.
*Ph. D Research Scholar, Punjabi University, Patiala.

26 Agricultural Situation in India
SERVER3\E\AGRICULTURE 2015\2588AGRI (SEPT, 2015)
Concept and Methodology
The analysis of agricultural performance in present studyis based on the land and worker productivity derived from'Net State Domestic Product'(NSDP) agriculture (includinglivestock)' for the 17 major states in India for the fourdecades from 1971/72 to 2010/11 and these states togetheraccount for more than 90 percent agricultural productionand area of the country. Four, newly created statesviz.Uttrakhand, Chhattisgarh, Jharkhand and Telangana aremerged into their parent states of UttarPradesh, MadhyaPradesh,Bihar, and Andhra Pradesh respectively becauseof unavailability of data of these states in the previous years.To trace out any pattern in agricultural growth and regionaldisparities the states are further grouped into fourgeographical regions.
Northern Region: Haryana, Himachal Pradesh,Jammu and Kashmir, Punjab, and Uttar Pradesh (includingUttrakhand).
Eastern Region: Assam, Bihar (includingJharkhand),Orissa, and West Bengal.
Western Region: Gujarat, Madhya Pradesh(including Chhattisgarh), Maharashtra and Rajasthan.
Southern Region:Andhra Pradesh, Karnataka,Kerala and Tamil Nadu.
The level of agricultural development can be broadlymeasured in two ways. First, by using the method of partialfactor productivity which includes land productivity andlabour productivity. Second is multifactor productivity ortotal factor productivity which requires detailed informationon all the inputs and outputs used but because of non-availability of authentic and consistent data series, thismethod cannot be used efficiently. Most of the studies undertaken in developing countries preferred land productivitywhereas labour productivity index for analysis ofagricultural development was preferred in the developedcountries. Basic reason behind this seems to be scarcity ofland in developing and labour in developed countries. Thefact cannot be denied that India is a developing country
and labour is abundant here. But, on the other hand, it alsocannot be denied that there is no absolute scarcity of landin India. Some states still have the potential to increasearea under cultivation. Therefore, in the present study, it ispreferred to use both-land productivity and labourproductivity for analysis the levels of agriculturaldevelopment in India.
In this analysis output per hectare of net sown areawas used to define the level of agricultural development.Since this analysis both the temporal and regional, the valueof output is estimated in the form of Net State DomesticProduct at 1993-94 constant prices.Values at constant 1993series were derived by using old and new series.
Land productivity = Total value of output (NSDP in agriculture)
Net Sown Area
Labour productivity is derived from total output(NSDP) from agriculture divided by total numbers ofagricultural workers (male+female and main+marginal).
Labour productivity= Total value of agricultural output (NSDPin agriculture)
Total number of agricultural workers
Disparities are measured by using coefficient ofvariation (C.V.) and gap between the most developed andother regions with respect to the indicators of development.Data on agricultural inputs and infrastructure had beentaken from various government publications. Compoundannual growth rate (CAGR) measured growth across statesand regions at different time periods.
Agricultural Performance in India: RegionalVariations
This section will bring out significant inter-state variationsin the growth of agricultural productivity in Indianagriculture. These variations are analyzed through thespatial and temporal disparities in pre-and the post-reformperiod in Tables 1 and 2.
TABLE 1 STATE AND REGION-WISE LAND PRODUCTIVITY
States/Years Per-Hectare Land Productivity Compound Annual Growth Rate
1971/73 1981/83 1991/93 2001/03 2008/11 1971/73 1981/83 1981/93 2001/03 1971/73 1991/93 1971/73to to to to to to
1981/83 1991/93 2001-03 2008/11 1991/93 2008/11 2008/11
1 2 3 4 5 6 7 8 9 10 11 12 13
Haryana 10325 13947 22739 27164 34440 3.05 5.01 1.79 3.45 4.03 2.47 3.06Himachal Pradesh 12994 15859 20328 29825 30136 2.01 2.51 3.91 0.15 2.26 2.34 2.13Jammu & Kashmir 14385 19287 23114 35062 41352 2.98 1.83 4.25 2.39 2.40 3.48 2.68Punjab 12943 18491 30011 35751 41446 3.63 4.96 1.77 2.13 4.29 1.92 2.95Uttar Pradesh 8602 12277 16075 20934 23758 3.62 2.73 2.68 1.82 3.18 2.32 2.57Northern region 9758 13766 19475 24700 28639 3.50 3.53 2.41 2.14 3.52 2.29 2.73Assam 13271 14790 18257 18455 21097 1.09 2.13 0.11 1.93 1.61 0.85 1.17Bihar 13696 15129 17462 22730 32186 1.00 1.45 2.67 5.09 1.22 3.66 2.16

September, 2015 27
SERVER3\E\AGRICULTURE 2015\2588AGRI (SEPT, 2015)
states was less than one percent and at least four of them hadnegative growth rate. The gap between northern region toother three regions for agricultural labour productivityincreased during this period and it stood at 27.4 percent withrespect to eastern region which was quite close to the northernregion in the case of land productivity(table-3). Overallgrowth of agricultural labour productivity was less than onepercent per annum compare to 2.6 percent in case of landproductivity which indicated continuing population pressureon agriculture sector.
Period of Initiation of the Reforms (1990-93)
Economic reforms were initiated when the results of maturedgreen revolution were also seen in Indian agriculture. Duringthis period, Punjab progressed and recorded the highest levelof land productivity followed by Kerala. Infact almost allstates witnessed increased land productivity on the eve ofreform period. However, Rajasthan was again at the lowestlevel of productivity as during pre-reform period along withsome other states such as Odisha, Madhya Pradesh andMaharashtra. These states together had only one thirdproductivity compared to Punjab and Kerala. The C.V. stoodat 42.0 percent and was almost equal to the initial (1971-73)period 41.6 percent
1 2 3 4 5 6 7 8 9 10 11 12 13
Odisha 8072 9074 9109 9862 13739 1.18 0.04 0.80 4.85 0.61 2.45 1.34West Bengal 10184 13949 25579 36677 41857 3.20 6.25 3.67 1.91 4.71 2.94 3.60Eastern region 11252 13140 17130 22210 28144 1.56 2.69 2.63 3.44 2.12 2.96 2.32Gujarat 7031 10849 10929 14447 20317 4.43 0.07 2.83 4.99 2.23 3.71 2.69Madhya Pradesh 4749 5849 7785 8521 11513 2.11 2.90 0.91 4.39 2.50 2.33 2.24Maharashtra 4252 6178 9253 13860 19103 3.81 4.12 4.12 4.69 3.96 4.36 3.83Rajasthan 3680 5056 6544 8785 11633 3.23 2.61 2.99 4.09 2.92 3.44 2.92Western region 4687 6523 8347 10964 14984 3.36 2.50 2.77 4.56 2.93 3.50 2.95Andhra Pradesh 8635 12053 14574 19472 27901 3.39 1.92 2.94 5.27 2.65 3.89 2.98Karnataka 6250 8622 11616 11563 16934 3.27 3.03 -0.05 5.60 3.15 2.24 2.52Kerala 19514 18972 26996 33296 35691 -0.28 3.59 2.12 1.00 1.64 1.66 1.52Tamil Nadu 12928 13469 20218 22294 31367 0.41 4.15 0.98 5.00 2.26 2.62 2.24Southern region 9521 11624 15544 18178 25040 2.02 2.95 1.58 4.68 2.48 2.84 2.45India# 7738 10003 13293 16778 21531 2.60 2.88 2.36 3.63 2.74 2.44 2.59C.V(States) 42.3 35.6 42.0 45.3 38.9C.V(Regions) 32.4 29.2 31.7 31.6 26.2
SOURCES. (i) EPWRF (2003): Domestic Product of States of India 1960-61 to 2000-01 (ii)Ministry of Statistics, Planning and Implementation, (Variousissues).and (iii) Statistical Abstract of India (Various issues).#India here means 17 major states only.
Pre-reform period (1971-73 and 1981-83)
Results of table-1 reveal that more thanfivefold differencebetween higher and lower per hectare productivity statesresulted in high level of disparities in the triennium 1971-73 which is beginning of the green revolution period.Significant improvement was noticed in second thetriennium 1981-83 and value of coefficient of variation(C.V.) decelerated from 42.3 percent to 35.6 percent. Atregional level northern region took over eastern region in1981-83 in per hectare productivity. The gap betweennorthern continued and western region continued to be atmore than 50 percent. It shows a wide range of regionalinequalities in land productivity growth at regional level.During this phase growth of nine states was more thanaverage growth of 2.60 percent. On the other hand extentof disparities in agricultural labour productivity acrossstates and regions was remained higher consistently in bothof the trienniums (table-2). Though in initial phase of greenrevolution Punjab and Haryana were at top even far abovefrom other northern states. This indicated the existence ofintra-regional disparities across states. Disparities in labourproductivity in agriculture were growing and the C.V. in1981-83 was more than six percentage point from 1971-73 at both state and regional levels. Growth rate of eight
TABLE 2 STATE AND REGION-WISE AGRICULTURAL LABOUR PRODUCTIVITY
States/Years Per-Hectare Land Productivity Compound Annual Growth Rate
1971/73 1981/83 1991/93 2001/03 2008/11 1971/73 1981/83 1981/93 2001/03 1971/73 1991/93 2001/03to to to to to to to
1981/83 1991/93 2001-03 2008/11 1991/93 2008/11 2008/11
1 2 3 4 5 6 7 8 9 10 11 12 13Haryana 20666 22371 27771 22372 30263 0.80 2.19 -2.14 4.41 1.49 0.51 0.96Himachal Pradesh 7411 8591 9261 7926 7422 1.49 0.75 -1.55 -0.93 1.12 -1.29 0.00Jammu & Kashmir 10497 12653 11008 14202 16890 1.89 -1.38 2.58 2.51 0.24 2.55 1.20

28 Agricultural Situation in India
SERVER3\E\AGRICULTURE 2015\2588AGRI (SEPT, 2015)
stood at slightly below Rs. 10,000. Annual growth rate ofper worker productivity for the period 1981/83 to 1991/93was remained same as in previous decade but six statesrealized negative growth rate during this decade. The gapbetween the northern region and other regions was veryhigh and it grew from previous triennium except in thecase of southern region. C.V. for states reached to a newhigh rising from 49.5 percent in 1981-83 to 63.6 percentin 1991-93 which was an indicator of exceeding disparitiesof labour productivity. All these evidences explain thatproductivity in agriculture was not at that level which couldcounter the high population pressure in the sector and thatultimately it led to serious disparities in labour productivity.
1 2 3 4 5 6 7 8 9 10 11 12 13
Punjab 20398 26611 37102 42622 48985 2.69 3.38 1.40 2.01 3.04 1.65 2.21Utter Pradesh 6931 8566 9078 9708 10191 2.14 0.58 0.67 0.70 1.36 0.68 0.97Northern region 9207 11331 12906 13254 14520 2.10 1.31 0.27 1.31 1.70 0.70 1.15Assam 10449 10277 11069 10064 10287 -0.17 0.75 -0.95 0.31 0.29 -0.43 -0.04Bihar 7762 7323 6133 5862 6834 -0.58 -1.76 -0.45 2.22 -1.17 0.64 -0.32Odisha 8644 8510 7428 6059 7307 -0.16 -1.35 -2.02 2.71 -0.76 -0.10 -0.42West Bengal 7841 8877 12273 15036 14888 1.25 3.29 2.05 -0.14 2.27 1.14 1.62Eastern region 8199 8231 8372 8418 9096 0.04 0.17 0.05 1.11 0.10 0.49 0.26Gujarat 11754 15525 12494 12361 17142 2.82 -2.15 -0.11 4.78 0.31 1.88 0.95Madhya Pradesh 7035 7056 7773 6274 7493 0.03 0.97 -2.12 2.57 0.50 -0.22 0.16Maharashtra 5966 7328 8743 10580 13111 2.08 1.78 1.92 3.11 1.93 2.41 1.99Rajasthan 9106 10527 10434 9051 11090 1.46 -0.09 -1.41 2.95 0.68 0.36 0.49Western region 7751 8985 9250 9032 11275 1.49 0.29 -0.24 3.22 0.89 1.17 0.94Andhra Pradesh 7570 8247 7995 9196 12677 0.86 -0.31 1.41 4.69 0.27 2.75 1.30Karnataka 9019 9695 11084 8878 12853 0.73 1.35 -2.19 5.43 1.04 0.87 0.89Kerala 14244 14559 19870 31649 36054 0.22 3.16 4.76 1.88 1.68 3.57 2.35Tamil Nadu 8688 6205 8499 8155 11322 -3.31 3.20 -0.41 4.80 -0.11 1.70 0.66Southern region 8828 8423 9627 9849 13284 -0.47 1.34 0.23 3.04 0.43 1.91 1.03India 8451 9153 9906 9957 11807 0.80 0.79 0.05 2.46 0.80 0.88 1.69C.V% (States) 42.6 49.5 63.6 73.5 71.6C.V% (Regions) 7.6 15.5 19.7 21.3 19.7
Source: As in Table 1
signifying consistent disparities during the pre-reformperiod. Western region was still far away from other threeregions with respect to per hectare productivity of landand the gap percentage (table-3) of northern regioncompared to other regions infact increased. Though onlyfour states recorded less than two percent of annual growththroughout the pre-reform period (1971-73to1991-93) yetthe level of higher productivity states was unmatchable tolower ones because high productivity states grew fromhigher initial levels. But widening of disparities in the levelof labour productivity continued even on the eve of reformperiod. For instance Punjab and Haryana recorded perworker productivity at Rs.37102 and Rs.27771respectively, where as 9 out of a total of 17 states, recordedless than the overall average of the country which itself
TABLE: 3. GAP (PERCENT) WITH RESPECT TO NORTHERN REGION
Per-Hectare Land Productivity Labour Productivity
Regions/Years 1971/73 1981/83 1991/93 2001/03 2008/11 Regions/ Years 1971/73 1981/83 1991/93 2001/03 2008/11
Eastern region 15.3 4.5 12.0 10.1 1.7 Eastern region 10.95 27.36 35.13 36.49 37.36Western region 52.0 52.6 57.1 55.6 47.7 Western region 15.81 20.71 28.32 31.85 22.35Southern region 2.4 15.6 20.2 26.4 12.6 Southern region 4.12 25.66 25.41 25.69 8.51
SOURCE: As in Table 1
Post-reform Period (2001-2003 and 2008-2011)
The triennium 2001-03 of post-reform period reflects theimpact of economic reforms on agricultural performance.There were four states that crossed the per hectareproductivity figure of Rs.30000. West Bengal recorded thehighest level of productivity of Rs.36847, followed byPunjab. Three states namely: Rajasthan, Madhya Pradeshand Odisha were at the bottom with less than as Rs. 10000
per hectare productivity during post-reform period. Butthe triennium 2008-10 reflects the growth in landproductivity of backward states (Rajasthan, MadhyaPradesh, Odisha and Bihar) and developed states were attheir minimum level as annual growth rate of West Bengaland Kerala which were otherwise high productivity stateswas less than two percent. Even though some western statesdid well but still western region continued to grow at a

September, 2015 29
SERVER3\E\AGRICULTURE 2015\2588AGRI (SEPT, 2015)
slow pace and its land productivity was 55.6 per cent lessthan that of the northern region.The C.V. for this time perioddecreased both at state and regional levels.Rapid growthof some under-developed states and relatively slowdevelopment of developed states led to decrease indisparities across states.On the opposite, disparities in levelof labour productivity were persistently at higher levelcompare to pre-reform period.Regional gap percentage inland productivity with respect to northern region remainedhigh in case of eastern region. Ten states recorded negativegrowth rate in labour productivity during period 1991-93to 2001-03 which can be interpreted as negative effect ofeconomic reform on Indian agriculture. Punjab and Keralatopped in the list of 17 states in both the trienniums (2001-03 & 2008-11) of post-reform period with respect to labourproductivity. However, Himachal Pradesh and MadhyaPradesh consistently remained backward during this period.Inter- regional situation also presented the same picture.Northern region dominated all regions in the level of labourproductivity but western region performed well in term ofgrowth rate of labour productivity (3.22 per cent) duringthis periods compare to other regions.Presence of intra-regional disparities in labour productivity was also noticedfrom huge difference between Punjab and HimachalPradesh and Gujarat and Madhya Pradesh in north and eastrespectively. On the wholelabour productivity analysisshows higher level of disparities in both pre and post-reformperiods and only a minimal reduction was noticed in theC.V. from 73.5 per cent in 2001-03 to 71.6 per cent 2008-11.
No doubt disparities dipped in the recent decade butthe trend remained different for the land productivity and
the labour productivity at regional level and state level.Where the disparities in the labour productivities werehigher at the state level, on the other hand disparities in theland productivity were more at regional level.
Disparities in Growth of Inputs and Infrastructure
Table 4 & 5 present the use of modern inputs in Indianagriculture since 1971. One thing is clear that high growthstates in India have done so with the help of high doses offertilizer and by broadening the irrigation network. Theessence of the new Technology in fact is that the new highyield variety (HYV) seeds enabled the use of modern inputlike, fertilizers, irrigation and modern machines like tractorsand tubewells. (Bhalla & Singh, 2010). As far as thedisparities are concerned in the level of infrastructure andinput use; a sharp reduction is noticed in the post reformperiod especially in recent decade. Values of the C.V.decreased both at state and regional level and it indicatesthat definitely there was extension in agriculturalinfrastructure and input used throughout the states. Use offertilizer continues to be exceptionally high in agriculturallyleading states of Punjab and Haryana whereas its use onper hectare basis is abysmally low in agriculturally laggingstates like Rajasthan, Uttar Pradesh and Madhya Pradesh.At the all India level, growth rate of irrigation madeprogress but at very slow rate. Total net sown area underirrigation was 22.2 per cent during 1971 which increasedup to 45.6 in 2010-11. States like Punjab and Haryana havemade remarkable progress in irrigation followed by UttarPradesh, Andhra Pradesh and Tamil Nadu Which crossed
TABLE 4 STATE-WISE GROWTH FERTILIZERS USE AND IRRIGATION
States/Years Per-Hector Consumption of Fertilizer (in Kg.) Percentage of Net Area Sown Irrigated1972 1981 1991 2001 2011 1971 1981 1991 2001 2011
1 2 3 4 5 6 7 8 9 10 11
Haryana 22.8 42.5 128.3 155.7 213.8 43 59.2 72.7 83.9 82.1Himachal Pradesh 7.8 17.4 33.9 42 59.2 16.7 16.1 17 22.7 20Jammu & Kashmir 16.3 21.4 45.3 63.1 105.9 39.5 42.5 40.8 41.6 43.9Punjab 58.5 111.9 171.2 170 242.7 71.3 80.7 92.7 95 97.9Uttar Pradesh 20.2 49.4 90.1 131.7 172.6 45.8 58.4 66.1 75.9 80.4Northern region 26.2 57 105.8 137.2 185 41.6 54.9 60.9 72.8 79.2Assam 3.5 2.8 10.5 34.6 67.6 25.7 21.5 21.1 6.1 5.8Bihar 9.1 17.8 56.8 98.2 165.5 25.6 35.5 43.5 46 49.7Orissa 8.9 9.6 20.9 20.5 59.1 18.8 19.8 30.7 33.2 27.4West Bengal 13.6 35.9 90.3 120.5 164.9 26.9 26.2 35.8 43.5 59.2Eastern region 9.7 18.3 49 75 124.3 24 27.4 35.2 36.9 40.1Gujarat 21.3 34.4 64.9 85.3 174.1 12.8 20.9 31.6 31.6 41.1Madhya Pradesh 6.7 9.2 35.4 40.3 90.5 8.1 12.5 22.1 26.4 42.9Maharashtra 14.9 21.2 66.4 75.4 152.8 7.8 10.5 11.4 16.6 18.7Rajasthan 4.4 8 28.9 37.9 60.6 14.1 19.5 23.8 30.9 36.3Western region 10.7 16.4 46.9 56.5 111.7 10.2 15 20.9 25.5 34.4Andhra Pradesh 22.2 45.9 133.3 160.6 278.4 28.2 32.3 39.1 40.7 50.4Karnataka 17.7 30.1 66.3 107.1 163.9 11.1 13.8 20.4 25.4 33.2Kerala 28.1 33.4 84.4 59.2 106.2 19.8 10.9 14.8 17.3 20Tamil Nadu 44.6 63.2 115.1 150.7 220.6 42 48 42.5 54.5 58.8

30 Agricultural Situation in India
SERVER3\E\AGRICULTURE 2015\2588AGRI (SEPT, 2015)
Southern region 26 42.7 102.3 131.9 211.3 24.6 27.1 31.2 36 43India 21.3 45.3 89 119.1 169 22.2 27.7 33.7 39 45.6CV ( States) 76.3 80.7 60.8 54.5 45.3 62.1 65 59.6 59.9 54.9
CV (Regions) 50.7 58.6 42.7 40.4 30.2 51.1 54.4 45.9 48.3 41.4
(i) The .Fertilizer Association of India (ii). Statistical Abstract of India (Various issues)
1 2 3 4 5 6 7 8 9 10 11
TABLE 5 STATE-WISE GROWTH OF TECHNICAL INPUTS
States/Years Pump sets (tubewells)/0000 Hectare Tractors/000Hectare Percentage of Village Electrification1972 1982 1992 2003 1972 1982 1992 2003 1971 1981 1991 2001 2011
Haryana 32 71 143 155 52 170 444 549 100 100 100 100 100Himachal Pradesh 0 3 4 20 5 16 45 130 22.5 59.4 100 99.4 99.5Jammu & Kashmir 0 1 5 8 7 11 18 70 10.4 72.6 94.4 97.2 98.2Punjab 80 158 170 170 104 254 508 704 51.7 100 100 100 100Utter Pradesh 18 64 132 191 16 82 201 397 18.4 37.6 71.4 79.3 89.8Northern region 29 77 133 175 34 118 274 451 24.8 49.1 79 84.8 92.4Assam 0 1 2 0 2 1 3 5 2.9 25.6 77 77.1 90.9Bihar 12 47 89 117 7 18 19 130 11.4 31.8 68.4 71 82.2Orissa 1 3 6 19 3 2 4 28 3.7 40 64.6 75 76.5West Bengal 1 37 54 119 1 3 12 34 7.7 37.5 69.4 78.2 99.5Eastern region 5 27 46 76 4 8 11 62 7.5 34.5 68.7 74.4 85.6Gujarat 46 59 67 92 9 29 70 150 21 68.5 100 100 99.8Madhya Pradesh 6 22 47 107 3 13 24 130 9.8 35.8 84.1 97.1 97.1Maharashtra 21 33 46 62 3 12 50 60 34 77.2 100 92.3 99.8Rajasthan 35 28 54 88 8 35 90 184 9.1 45.4 74.9 96.1 95.1Western region 16 32 57 88 5 21 55 128 16.5 51 87.7 96 97.6Andhra Pradesh 23 62 57 148 6 19 52 85 29.8 65.5 99.9 100 100Karnataka 20 30 58 79 6 20 37 60 48 62.6 100 98.9 100Kerala 13 45 88 196 7 6 9 10 76 100 100 100 100Tamil Nadu 140 211 212 210 9 26 52 102 79.1 95.1 99.9 100 100Southern region 47 78 106 137 6 20 44 73 47.9 71.6 99.9 99.6 100India 23 36 86 167 11 47 78 111 19.9 47.9 81 86.7 92.7CV ( States) 136.2 108.4 83.8 64.8 177 161.8 156.5 118.6 93.8 41.7 16 11.7 7.3CV (Regions) 74.5 51.9 48 38.4 118.6 122.6 125.1 103.1 71.6 29.6 15.8 12.9 6.8
(ii).Statistical Abstract of India (Various Years),(iii) Centre for Monitoring Indian Economy
1972 declined consistently to 64.8 per cent in 2003 forstate level. So is true about the tractor use as its inter-stateCV declined from 177.0 to 118.6 over the same period.But use of these machines continues to be very high is somestates and very low in some others. For instance in postreform period in 2003 in Punjab and Haryana use of pumpsets for irrigation was 170 and 155 per 10000 per hectaresrespectively. On the other hand, in Odisha and Rajasthantheir use is just 19 and 88 per 10000 hectares. This suggeststhe need for diffusion of these modern machines formodernization of agriculture in lagging states in thecountry.Other infrastructural facilities include villageelectrification, which made substantial progress in the postreform period.
Conclusion
Hence disparities in both productivities (land and labour)remained high in both the policy regimes i.e. pre-and-postreform periods. Improvement noticed in agriculture sectorin the second decade (2001-03 to 2008-11) after reformperiod influenced land productivity in much better way ascompared to labour productivity. Thus, the chances ofimprovement in land productivity still exist because somestates progressed after reform period. But low growth inlabour productivity even in higher land productivity statessuch as West Bengal, Himachal Pradesh, Jammu &Kashmir, Tamil Nadu is an indicator of population pressurein agriculture sector even after economic reforms.
also experienced significant growth in Indian agriculture.The dipping values of coefficient of variation in the use ofthese two main mechanical components show significantgrowth and more equalization use across states andregions.C.V which was 136.2 for pumpsets during
the mark of 50 per cent net areas irrigated. Value of C.Vcame down from 62.1 per cent in 1971 to 54.9 per cent in2010-11. This indicates that disparities in irrigation havedecreased from pre reform period but at a slow rate.Technical inputs in agriculture like tractors and pumpsets
September, 2015 31
SERVER3\E\AGRICULTURE 2015\2588AGRI (SEPT, 2015)
The other positive development of the post reformperiod was reduction in inter-state disparities in use ofmodern inputs like fertilizers, irrigation, tractors,pumpsets, and electrification of villages and decelerationof disparities in land and labour productivities across statesand regions in second decade after economic reforms. Theuse of agricultural inputs and expansion of infrastructureafter reforms improved significantly and regionaldisparities declined significantly. However,it failed todampen the inter-regional disparities in the level of labourproductivity across states. This suggests that therelationship between the growth of input use and thegrowth of output is not that straight forward in agriculture.Some other factors like agro-climatic conditions andtechnological developments along with policies andprogrammes of the government still play a crucial role inagricultural performance and bridging of regionaldivides.Some of the policy initiatives in this context thatemerge from this state and regional level study in the pre-and post-reform period are:(i) High disparities in the levelsof labour productivity even in higher land productivitystates are the result of under-development of non-farmsector of the rural economy for employment creationoutside agriculture sector. Thus diversification of ruraleconomy is the need of the hour especially in the stateslike Punjab and Haryana where land productivity hasreached a plateau. (ii) The recent growth in agriculturalgrowth seems to be mainly due to public sector investmentsin agriculture (Deokar and Shetty ,2014). There is a needto enhance allocation of public sector investment in generalin backward regions or states in particular to provide ruralinfrastructure facilities. Since most of the states in thecountry are facing financial crisis, the Central Governmentmust fill the gap in public sector investments in agriculture.(iii) Apart from public sector investment and infrastructuredevelopment, there is a need to tackle the problem of floodsand droughts in many other regions exposed to thesenatural disasters periodically. Eastern and Central regionstates are special cases in this context. Consequently, thesetwo problems need to be addressed on priority basis tohandle these constraints in the modernization of agriculturein these regions.(iv) Besides poor infrastructure, floodsand droughts, there is an urgent need to reduce excessivedependence of people on agriculture. This is mainlybecause the share of agriculture in overall income declinedto about 14 per cent whereas more than half of the Indianwork force still depends on agriculture for employment
and livelihood. As widening regional and state leveldisparities is a matter of serious concern, therefore, agro-climatic region specific agricultural research anddevelopment and policy initiatives is the need of the hour.
REFERENCES
Birthal P.S, Singh H., Kumar S. (2011),"Agriculture,Economic Growth and Regional Disparitiesin India", Journal of International Development, Vol.23,pp.119-131.
Bhalla G. S. and Singh Gurmail (2010),Growth of IndianAgriculture: A district Level Study, New Delhi, Centre forstudy of Regional Development, Planning CommissionReport.
Chand R. And Chauhan S. (1999), Are Disparities in IndianAgriculture Growing, Policy Brief No.8, New Delhi, IndianCouncil of Agricultural Research.
Deokar B.K, Shatty S.L (2014),"Growth of IndianAgriculture:Responding to Policy Initiatives since 2004-05" Economic and Political Weekly, Vol.49 , No. 26 &27.pp. 101-104.
GOI (Various Years), Census of India, New Delhi, Ministryof Home Affairs, Government of India.
EPW (2003),Domestic Product of States of India 1960-61to 2000-01,Mumbai, Economic and Political WeeklyResearch Foundation.
GOI (Various Issues), Statistical Abstract, New Delhi,Central Statistical Organisation, Government of India.
GOI (Various Years), Tables on NSDP, New Delhi, Ministryof Statistics, Planning and Implementation,Government ofIndia, available at http://www.msoipi.nic.in
GOI (Various Years), Tables on Irrigation and Fertilizers,New Delhi, Ministry of Agriculture andCooperation,Government of India, available at http://www.agricoop.nic.in
Sawant S.D. (1997), "Performance of Indian Agriculturewith special reference to regional variations",Indian Journalof Agricultural Economics, Vol. 52, No.3.
Singh Gurmail (2007),Performance of Indian Agriculture:Variation across States and Policy Regimes,UGC-SAPDiscussion Paper Series, No. 0001/07.

32 Agricultural Situation in India
SERVER3\E\AGRICULTURE 2015\2588AGRI (SEPT, 2015)
Gaps in Estimation of Area, Production And Productivity of Horticulture Crops inHimachal Pradesh
A.D. N. BAJPAI*, MEENAKSHI SHARMA** AND RANVEER SINGH***
Introduction
Horticultural sector in India has emerged as an importantsector contributing to the country's economy in a greatmanner through increased productivity, generatingemployment and enhancing exports apart from providingprotective food, household nutritional security, andprecious raw materials for various processing and ancillaryindustries. Therefore, thrust has been given to this sectorwith reasonable investments under Five Year Plans andspecial programmes. As a result, the area, production,productivity, exports and its contribution to the GDP ofagriculture has increased over the period of time. The areaunder horticultural crops has increased from 127.70 lakhhectares in 1991-92 to 208.76 lakh hectares in 2009-2010,and production from 965.62 lakh tons to 2230.89 lakh tonsduring the same period of time. The annual growth ratewas more than 6.5 per cent, contributing about 30 per centof the GDP of agricultural sector. The contribution ofhorticultural crops in the hilly states of North East regionand Himalayan states is very significant compared to otheragricultural crops. However, the data collected in thesestates have some discrepancies in terms of non-inclusionof important crops, irregular enumeration and faultymethodology, etc. Therefore, collection of proper andaccurate data on area, production and productivity ofimportant horticultural crops of the respective statesbecomes extremely important for further development ofthis sector. Despite impressive development in horticulturalsector in recent years, there is a general feeling that data-base of horticultural crops is not comprehensive and reliablein the country. The situation is still worse in the case ofHimalayan states. This poses a serious problem inunderstanding the real development of horticulture sectorin these states. Besides, there is no systematic data on somemarginal and minor horticultural crops in these states. Tofill this gap, it is necessary to identify the methodologyfollowed in collection of horticultural statistics, identifyproblems faced in data collection of horticultural crops byvarious agencies and take some remedial measures in orderto make data on horticultural sector more scientific andfactual. Keeping in view of these facts an attempt has beenmade in this paper to compare the data collected on area,production and yield of horticultural crops with the baselinedata collected by Horticulture, Agriculture and Revenue
Department of Himachal Pradesh, to identify the problemsin estimation of horticultural crops and to suggest policymeasures.
Methodology and Data Source
The required data and information for this paper has beenobtained from the study "Base Line Data on Area,Production and Productivity of Horticulture Crops inHimachal Pradesh" conducted by Agro-Economic ResearchCentre, Shimla. Both secondary and primary data wascollected to achieve the objectives specified above. TheState agencies that collect data on horticultural crops belongto Departments of Horticulture, Agriculture, and Revenue.Additional information was collected from the officials onmethodology adopted, verification process carried out incollection of horticultural data and problems encounteredby them in compilation of horticultural statistics.Information on area, production and yield of horticulturalcrops/crop groups was collected for the village andhousehold level from the above mentioned state agenciesfor the latest three years.
One district in the State, one block in the district andone village in the block was selected having highest areaunder each horticulture crop (fruits, vegetables, flowersand spices). In this way, four villages namely Dhali forfruits,Dharesh Gawech for vegetables in district Shimlaand Sargaon for flowers and Toru-Bhaila for spices indistrict Sirmaur were selected. Acomplete enumeration wascarried out in the village for those households who aregrowing horticultural crops and for a particular household,area, production and yield data was collected for allhorticultural crops grown by the household during thereference year 2011-12. Thereafter, a verification exercisewas carried out to match the household as well as villagelevel data of the horticultural crops grown in the villageobtained from the primary survey with the data providedby the state agencies.
Results and Discussions
In the surveyed villages, 61 per cent growers belong tomarginal category according to their size of landholding.Out of total land, the proportion of land under
*Vice Chancellor, Himachal Pradesh University, Shimla-171005 **Statistical Assistant, Agro-Economic Research Centre, Himachal Pradesh University, Shimla-171005***Officer Incharge, Agro-Economic Research Centre, Himachal Pradesh University, Shimla-171005

September, 2015 33
SERVER3\E\AGRICULTURE 2015\2588AGRI (SEPT, 2015)
irrigation was relatively higher in the flower growing villageas compare to other villages under study. Tank is the onlysources of irrigation in vegetable and flower growingvillages, whereas in the case of spice growing villages,farmers irrigated crops through Kuhls. The average size of
holding is maximum in the category of spice growers(1.37 ha.), followed by vegetable growers (1.26 ha.) fruitgrowers (0.73 ha.) and flower growers (0.61 ha.) Overall,the average size of holding comes out to be1.11 hectares(seeTable-1).
TABLE 1 GENERAL FEATURES OF FARM HOUSEHOLDS IN SELECTED VILLAGES
Particulars Dhali Dharesh-Gawech Sargaon Toru-Bhaila TotalNo. of Farm households 63 114 46 111 334- Marginal 45 64 39 57 205- Small 14 25 7 26 72-Medium 4 19 - 22 45-Large - 6 - 6 12Total land (ha.) 46.23 144.15 28.16 151.75 370.29Irrigated land (%) 0 6.35 89.20 28.06 20.76Source of Irrigation -Tank (%) - 100.00 100.00 - 44.60-IPH Kuhl (%) - - - 100.00 55.40Average size of holding (ha.) 0.73 1.26 0.61 1.37 1.11
Growth of Horticulture Crops in Himachal Pradesh
The area has increased significantly under fruits from67.531 thousand hectares in 2007-08 to 79.024 thousandhectares in 2009-10 and under flowers from 0.583 thousandhectares to 0.682 thousand hectares in the same years.Thearea of spices in the State was almost same during thisperiod i.e. 7.490 and 7.096 thousand hectares respectively,whereas the area of vegetables has slightly decreased from35.764 thousand hectares to 35.672 thousand hectares. Asfar as yield is concerned, the yield of spices, vegetablesand flowers has increased significantly. The yield of spicesand vegetables was1919 and 2909 kg.per hectare in theyear 2007-08 which increased to 2150 and 3381kg.perhectare in the year 2009-10, respectively. The yield offlowers has also increased from 98044 sticks per hectareto 150959 sticks per hectare and the yield of fruits hasdecreased from 1056 kg. per hectare to 484 kg. per hectare.
Area, Production and Yield of Horticultural CropsObtained through Survey Fruit Crops (Apple)
Apple is the main fruit crop in temperate region of theState. The area under apple orchards in the surveyed villageDhali has been divided into bearing and non bearing plants.Accordingly, fruit bearing plants covered 34.39 hectares(80 per cent) area of the total orchards, while area undernon bearing plants is 8.38 hectares. The entire area of42.77 hectares under this crop is rainfed. The totalproduction of apple is 10408 quintals and yield is estimatedto be 24335 kg. per hectare (seeTable-2).
TABLE 2 AREA, PRODUCTION AND YIELD OF APPLE INDHALI VILLAGE
Particulars Area (ha.) Production(qtl.) Yield (kg./ha.)
Bearing 34.39 10408 30266Non- Bearing 8.38 0 0
Total 42.77 10408 24335
Vegetable Crops
Himachal Pradesh has vast potential for production of offseason vegetables which have great demand in the plainareas of country (Singh and Vaidya, 2005). The area,production and productivity of vegetable crops grown inthe surveyed village Dharesh-Gawech are given in Table-3.The gross cropped area (GCA) under vegetables was62.44 hectares.The irrigated area in both seasons (Kharifand Rabi) was 15.04 hectares, whereas 47.40 hectares areawas un-irrigated Out of irrigated GCA of 15.04 hectares,thearea under peas, cauliflower, beans and cabbage was6.08(40%), 3.92(26%) , 3.08(20%), and 0.92(6%)hectaresrespectively. The capsicum was grown only in Kharifseason and occupied about 0.68(5%) hectare area ofirrigated GCA. In un-irrigated conditions during bothKharif and Rabi seasons the area of peas was relativelyhigher 12.84(27%)followed by cabbage 10.20(21%),cauliflower 9.76(20%) and beans 8.64(18%)hectares. Atthe overall level, out of 62.44 hectares GCA, peas occupied18.92(30%) followed by cauliflower 13.68 (22%), beans11.72(19%) and cabbage 11.12(18%) hectares.The averageyield per hectare of capsicum, peas, cauliflower, cabbage,beans, potato and tomato estimated to be 7689, 5013,28685, 23387, 7088, 14345 and 12500 kg.in Kharif seasonrespectively. The average yield per hectare of peas,cauliflower, cabbage, beans and potato worked out to be4600, 20019, 23693 and 11000 kg. in Rabi seasonrespectively.

34 Agricultural Situation in India
SERVER3\E\AGRICULTURE 2015\2588AGRI (SEPT, 2015)
TABLE 3AREA, PPRODUCTION AND YIELD OF VEGETABLE CROPS IN DHARESH-GAWECH VILLAGE
(Area in hectares, Production in quintals, Yield in kilograms)
Crops Irrigated Un-Irrigated TotalArea Production Yield Area Production Yield Area Production Yield
KharifCapsicum 0.68 56 8235 1.96 147 7500 2.64 203 7689Peas 2.88 165 5729 4.8 220 4583 7.68 385 5013Cauliflower 1.88 555 29521 6.64 1889 28449 8.52 2444 28685Cabbage 0.32 78 24375 6.44 1503 23339 6.76 1581 23387Beans 2.04 152 7451 4.52 313 6925 6.56 465 7088Potato 0.32 48 15000 3.80 543 14289 4.12 591 14345Tomato 0.04 5 12500 0 0 0 0.04 5 12500RabiPeas 3.20 155 4844 8.04 362 4502 11.24 517 4600Cauliflower 2.04 415 20343 3.12 618 19808 5.16 1033 20019Cabbage 0.60 145 24167 3.76 888 23617 4.36 1033 23693Beans 1.04 67 6442 4.12 256 6214 5.16 323 6260Potato 0 0 0 0.20 22 11000 0.20 22 11000Gross cropped area 15.04 47.40 62.44
Flowers (Chrysanthemum)
Chrysanthemum is the only flower crop grown by farmersin the surveyed village Sargaon.The entire 9.48 hectaresarea under Chrysanthemums is irrigated, out of which, in91 per cent area this is grown as a sole crop and in the rest9 percent area it is grown as mixed crop with maize. Thetotal production of Chrysanthemums is worked out to be3826159 sticks. The contribution of sole crop in totalproduction is 91 per cent and remaining 9 per centproduction worked out with maize cultivation. The perhectare yield is 406512 sticks from mono crop as againstof 375181 sticks from mixed crop giving an average yieldof 403603 sticks per hectare (Table-4).
TABLE 4 AREA, PRODUCTION AND YIELD OF FLOWERS INSARGAON VILLAGE
Name of Area Production Yield (No. ofthe Crop (ha.) (No. of sticks) sticks /ha.)
Chrysanthemum 8.60 3496000 406512
Chrysanthemum +Maize 0.88 330159 375181
Total 9.48 3826159 403603
Spices(Ginger):
Among spices, ginger is the major crop grown in thesurveyed village Toru-Bhaila. The total area of 26.61hectares under ginger is irrigated, out of this 54 percent areais under sole crop and in the rest of the area it is grown withcalocasia, chillies, turmeric, bhang jeera (local grain) andmaize as a mixed crop. Out of total production of 2096quintals, the ratio of the production from sole crop and mixedcrop is 64:36.The per hectare yield of ginger is 9377 kg.
from sole crop as against 6139 kg.from mixed crop givingan average yield of 7877kg.per hectare (Table-5).
TABLE 5 AREA, PRODUCTION AND YIELD OF SPICES INTORU-BHAILA VILLAGE
Crops Area Production Yield(ha.) (qtl.) (kg./ha.)
Ginger 14.28 1339 9378Ginger +Calocasia 2.16 121 5601Ginger +Chilies 2.08 117 5625 Ginger +Turmeric 5.04 334 6626 Ginger +Bhangzeera 1.13 70 6195Ginger.+Maize 1.92 115 5990
Total 26.61 2096 7877
Area, Production and Yield of Horticultural CropsEstimated by Different Agencies
The state agencies involved in estimation of area,production and productivity of horticulture crops inHimachal Pradesh are (i) department of revenue forvegetable crops, fruit crops and ginger,(ii) department ofhorticulture for flower crops, fruit crops and (iii)departmentof agriculture for ginger and vegetable crops. The yield ofapple is estimated by observation for which an HorticultureExtension Officer visits area during harvesting season andcontacts some fruit growers to obtain area and productionof crops. The area under vegetable is recorded by revenueofficial at village level. The yield is estimated by fieldobservation of crop condition by the officials of agriculturedepartment. The area, production and yield of a flower cropis estimated by the department of horticulture. The areaunder ginger is recorded by the village revenue official.

September, 2015 35
SERVER3\E\AGRICULTURE 2015\2588AGRI (SEPT, 2015)
The yield is estimated by the agriculture department throughcrop cutting experiment under the scheme of General CropEstimation Survey (GCES).
The area and production under mixed crops are notrecorded by any state agency at village or block level.However, there is a large quantity of mixed and inter cropsproduced in all the four surveyed villages. Inter croppingsystem in fruit crops is also in practice which is not recordedby any state agency involved in estimation of area andproduction of fruits. In case of flower crops, systematic/proper recording of area, production and productivity iscompletely missing. The estimation of area, production andyield of various crops by different agencies are discussedbelow:
Village Level Area, Production and Yield of Apple
The area under apple recorded by village revenue officialis 42.77 hectares in Dhali village. The yield of apple isestimated by observation for which an Extension Officerof Horticulture Department visits the area during harvestingseason and contacts some fruit growers for the same.Production of apple is calculated by multiplying yieldestimated with the area of village obtained from villageofficial. The average yield of apple estimated by thedepartment of horticulture is 5121 kg per hectare and thusthe total production comes out to be1761 qtls in the village(Table-6).
TABLE 6 AREA, PRODUCTION AND YIELD ESTIMATES OF APPLE
Estimates Bearing Non-bearing TotalArea(ha) Production Yield Area Area Production Yield
(qtls) (kg/ha) (ha) (ha) (qtls) (kg/ha)
By survey 34.39 10408 30266 8.38 42.77 10408 24335By Horticulture department 34.39 1761 5121 8.38 42.77 1761 5121Gaps over Survey - 8647 25145 - - 8647 19214% gaps - 491 491 - - 491 375
Village Level Area, Production and Yield of Vegetables
The area under vegetable crops recorded by villagerevenue official in Kharif and Rabi seasons is 36.32 and26.12 hectares respectively in the village Dharesh-Gawech.Total area under vegetable crops in both the seasons is62.44 hectares in the village. The production is calculatedin the same way as that of apple. The yield of vegetablecrops is estimated by field observation of crop conditionby the officials of agriculture department. The yield ofcapsicum, peas, cauliflower, cabbage, beans, potato and
tomato grown in Kharif season estimated by the departmentof agriculture is 15000, 10480, 23000, 36000, 10000,15000 and 32000 kg per hectare respectively. The yield ofpeas, cauliflower, cabbage, beans and potato grown in Rabiseason is 10480, 23000, 36000, 10000 and 15000 kg perhectare respectively. Among all the vegetables, theestimated production of cabbage was highest i.e. 2433.6quintals and lowestof tomato i.e. 12.80 quintals duringKharif season. Again, in Rabi season, highest production(1569.6 qtls.) was observed in case of cabbage whereaslowest (30 qtls.) in case of potato (Table-7).
TABLE 7AREA, PRODUCTION AND YIELD ESTIMATES OF VEGETABLE CROPS
Name of By Survey By Agriculture Departmentthe Crop Area(ha.) Production(qtl) Yield(kg./ha.) Area(ha.) Production(qtl.) Yield(kg./ha.)
Kharif SeasonCapsicum 2.64 203 7689 2.64 396.00 15000Peas 7.68 385 5013 7.68 804.86 10480Cauliflower 8.52 2444 28685 8.52 1959.60 23000Cabbage 6.76 1581 23387 6.76 2433.60 36000Beans 6.56 465 7088 6.56 656.00 10600Potato 4.12 591 14345 4.12 618.00 15000Tomato 0.04 5 12500 0.04 12.80 32000
Rabi SeasonPeas 11.24 517 4600 11.24 1178.63 10480Cauliflower 5.16 1033 20019 5.16 1186.80 23000Cabbage 4.36 1033 23693 4.36 1569.60 36000Beans 5.16 323 6260 5.16 516.00 10000Potato 0.20 22 11000 0.20 30.00 15000

36 Agricultural Situation in India
SERVER3\E\AGRICULTURE 2015\2588AGRI (SEPT, 2015)
TABLE 8 DIFFERENCE IN YIELD OF VARIOUS VEGETABLES
Crops Yield gaps (kg./ha.) %Kharif Season
Capsicum 7311 48.74Peas 5467 52.16Cauliflower 5685 24.71Cabbage 12613 54.84Beans 3512 33.13Potato 655 4.37Tomato 19500 60.94
Rabi SeasonPeas 5880 56.11Cauliflower 2981 12.96Cabbage 12307 34.19Beans 3740 37.40Potato 4000 26.67
Village Level Area, Production and Yield ofChrysanthemum
The estimation of area, production and yield is carried outby the department of horticulture. Area underChrysanthemum recorded by the horticulture departmentis 7.52 hectares in the surveyed village Sargaon. The totalproduction of this flower is 60,91,200 sticks with averageyield of 810000 sticks per hectare (Table-9).
TABLE 9 AREA, PRODUCTION AND YIELD ESTIMATES OF
FLOWER CROPS
Estimates ChrysanthemumArea Production Yield (No. of(ha.) (No. of sticks) (sticks/ha.)
By Survey 9.48 3826159 403603By Horticulture 7.52 6091200 810000DepartmentGaps over survey 1.96 2265041 406397% gaps 26.06 37.18 50.17
Village Level Area, Production and Yield of Ginger
The area under ginger recorded by the village revenueofficial is 26.61 hectares in the village Toru-Bhaila. Theyield is estimated by the agriculture department throughcrop cutting experiment under the scheme GCES. Theaverage yield estimated through this method is 7501 kg.per hectare. Hence, the production of ginger in the villageis 1996 quintals.
TABLE-10: AREA, PRODUCTION AND YIELD ESTIMATES OF
GINGER BY VARIOUS AGENCIES
Estimates GingerArea Production Yield(ha.) (qtl.) (kg./ha.)
By Survey 26.61 2096 7877
By Agriculture Department 26.61 1996 7501
Gaps over survey - 100 376
% gaps - 5.01 5.01
Difference between Survey and Agencies Estimates ofHorticulture Crops
Large gaps have been observed in estimation of productionand productivity of horticultural crops between survey andstate agencies which are analyzed and presented inTables 6, 8, 9 and 10. The area of all the horticulture cropsexcept chrysanthemum is the same, while variation isobserved in yield estimation in the surveyed villages andof the agencies.
In apple, average yield estimated by survey issignificantly higher than that of horticulture department.The gap in yield of survey and state agency worked out tobe 19214 kg per hectare. The yield estimated by survey is375 percent higher than that of yield estimated byhorticulture department.The average yield of apple wasestimated to 14000 kg./ha. to 8534 kg./ha. under differentmarketing systems in district Shimla (Singh, et al., 2011).
In case of kharif season vegetable crops, yieldestimated by the department of agriculture for capsicum,peas, cabbage, beans, potato and tomato is higher than thatof yield measured by survey. The difference is 7311, 5467,12613, 3512, 655 and 19500 kg. per hectare in capsicum,peas, cabbage, beans, potato and tomato respectively. Theseyield gaps ranged between 4.37 per cent in case of potatoto 60.94 per cent in case of tomato. The yield of cauliflowermeasured by survey data is 5685 kg. (24.71 %) higher thanthat of state agency. The analysis reveals that the estimatedyield of vegetable crops namely capsicum, peas,cauliflower, cabbage, beans and potato grown in Rabiseason is higher than that of yield of these crops measuredby survey data. The gap is 5880, 2981, 12307, 3740 and4000 kg. per hectare for these crops. The yield gaps rangedbetween 12.96 per cent in case of cauliflower to 56.11 percent in case of peas.
The area under chrysanthemums measured by surveyis 9.48 hectares while horticulture department estimatedas 7.52 hectares which is 1.96 hectares more than that ofsurvey. The area measured by survey is 26 percent higherthan estimated by state agency. The yield of chrysanthemumis 403603 sticks per hectare as per survey data and 810000sticks per hectare measured by department of horticulture.Thus, yield of this flower estimated by state agency is morethan double as compared to survey data.
The yield of ginger estimated by agriculturedepartment by crop cutting method is 7501 kg. per hectareswhich is lesser than the yield of 7877 kg. per hectaremeasured by survey with agap of376 kg. per hectare. Thus,yield measured by survey is 5.01 percent higher than theState agency estimation. The yield of ginger at overall levelwas estimated to be 12150 kg./ha. in 2010 (Sharma etal.,2011) and 13914 kg. /ha. in 2012 (Sood, 2012) inSirmaur district.

September, 2015 37
SERVER3\E\AGRICULTURE 2015\2588AGRI (SEPT, 2015)
Difficulties Faced by the Different Agencies inEstimation of Horticulture Crops Data
Many difficulties are faced by the officials of differentagencies at different levels due to which it is difficult toget reliable data in a stipulated time.There is shortage ofthe trained staff in all the departments due to which theyhave heavy load of work of collection, and compilation ofthe data and there is no provision of honorarium/ incentivesfor the work in off- hours.The non willingness inparticipation and lack of coordination between themselvesto arrange the data systematically after its collection isanother problem. The Revenue Department compile thestatistics of crop area with the help of the revenue official(commonly known as Patwari). In the State, a completeenumeration of all fields called girdawari is made in everyvillage during each crop season to compile land use,irrigation and crop area statistics by revenue department.The Patwari (revenue official) is overburdened withmultifarious functions and has to cope with a largegeographical jurisdiction, extending over more than10 villages. With an increasing range of functions assignedto the Patwari time to time, the girdawari tended to receivelow priority.Due to hilly terrain,the officials face theproblems in measuring the area, production and yield ofcrops on small and scattered land holdings in the state.Errors also occur as there is no proper format to estimatethe separate area of individual crop under mixed croppingsystem and the area of some crops is not listed separatelybut clubbed together under "other crops". Further, cropsgrown on encroached Government land are not includedin Girdawari.
The Agriculture Department estimates the productionand yield of the vegetables along with cereal crops in theState. Estimates of crop production are obtained bymultiplying the area under crop and the yield. The yieldestimates (Potato and Ginger) are based on scientificallydesigned crop cutting experiments conducted under theGeneral Crop Estimation Survey (GCES). The agricultureextension officers use to visit the villages, in their circle(headed by ADO), to record the data regarding area andproduction of vegetables on the basis of field observationand interviewing the farmers. The method of crop cuttingexperiments if properly followed provides reliableestimates of yield. In practice, however, the field staff doesnot strictly follow the prescribed procedures and therebythe survey estimates are subject to a variety of non-samplingerrors. The officials face the problems in measuring theproduction and yield of crops on small and scattered landholdings due to hilly/ contour topography of the State.It isdifficult for the staff to be present at time of every harvestingof many vegetables is done in a number of harvesting
extending over several weeks.Short duration crops ofvegetables which are sown and harvested between twoGirdawari periods are missed and therefore their area andproduction goes unreported.
The Horticulture Department officials also face someproblems in estimation of the area, production and yieldof fruit crops.There is no method to estimate the area,production and yield of crops under inter- croppingsystem.Total area under fruit crops is not recorded by thevillage level primary workers as fruits are also grown oncanal banks, field bunds, road sides and backyard of houses.
Conclusions and Policy Implications
The major reason for the poor quality of area statistics isthe failure of the revenue official (Patwari) to devoteadequate time and attention to the girdawari. The fact isthat the Patwari is overburdened with multifariousfunctions and has a large geographical jurisdictionextending to over more than 10 villages in the state. It issuggested to declare the girdawari as a programme of highpriority and the Patwari be mandated to carry out the cropinspection according to the prescribed time schedule, ifnecessary, by sparing him from other duties during thatperiod. To reduce the burden of the Patwari, his jurisdictionof villages should be reduced. The systematic and periodictraining should be imparted to Patwari and the fieldworkshould be subjected to intensive supervision by thetechnical staff. There should be strict supervision offieldwork by higher-level revenue and agricultural officialsand appropriate action taken against those whoseperformance is consistently bad. For proper and timelyconduct of the girdawari, the concerned supervisory staffshould be made accountable. Financial difficulties alsohamper the collection and compilation of data, in particularthere is no specific allocation of funds for different activitiesinvolved in data development and its management. Thereshould be provision of honorarium/incentives for work inoff-hours. There should be direct interaction between theImprovement of Crop Statistics (ICS) staff and the higherlevel officials of revenue and agricultural departments toget more accurate statistics.
References
Pratap, Meenakshi, Vaidya C. S. and Singh Ranveer. 2013.Baseline Data on Area, Production and Yield ofHorticulture Crops in Himachal Pradesh, Agro-Economic Research Centre Himachal PradeshUniversity, Shimla (Mimeo).
Sharma K D, Kumar V, Kumar A and Gupta M. 2011. Costof cultivation of ginger in Himachal Pradesh.Himachal Journal of Agricultural Research 37(2):210-219
38 Agricultural Situation in India
SERVER3\E\AGRICULTURE 2015\2588AGRI (SEPT, 2015)
Singh Ranveer and Vaidya C.S.2005. Production MarketingStorage and Transportation Losses of SelectedVegetables in Shimla and Solan Districts. Agro-Economic Research Centre Himachal PradeshUniversity, Shimla (Mimeo).
Singh Ranveer, Vaidya C.S, Meenakshi, Singh Pratap.2011.Impact of Emerging Marketing Channels inAgriculture Marketing-Benefit to Producer-
Sellers and Marketing Costs and Margins of Appleand Tomato in Himachal Pradesh. Agro-EconomicResearch Centre Himachal Pradesh University,Shimla (Mimeo), P 80-81.
Sood Pallavi.2012. Economics of Production andMarketing of Ginger In Sirmaur District ofHimachal Pradesh. M.Sc. Thesis, Department ofAgricultural Economics, CSK Himachal PradeshKrishi Vishvavidyalaya, Palampur, India. p54-70.

September, 2015 39
SERVER3\E\AGRICULTURE 2015\2588AGRI (SEPT, 2015)-2
AGRO-ECONOMIC RESEARCH
Relationship between Wholesale Prices, Retail Prices and Details of Contributing Factors forthe Price Difference of Onion in Gujarat*
S.S. KALAMKAR** 'AND M. MAKWANA***
1. Background
Agricultural marketing in India is handled both by privatetrade as well as government intervention though major partof the agricultural produce is handled by private traders.The objectives and form of government intervention,however, change over time with the intention of protectingthe interest of producers and consumers. However, barringdirect intervention by the government in some commodities,marketing in most others is dominated by the private sector.According to some sources, the quantity of agriculturalproduce handled by government agencies has not beenmore than 10 per cent of the total value of marketed surplus.Another 10 per cent of the marketed surplus is handled bythe cooperatives. Thus, rest of the 80 per cent marketedsurplus comes in the ambit of private trade. As large partof agricultural produce is marketed through private trade,there are a number of functionaries operating in differentactivities of marketing of various commodities. Apart fromwholesalers and retailers, processors enter the market asbulk buyers and sellers. In the case of fruits and vegetables,only 2 per cent of total production is processed and rest98 per cent is traded as fresh farm products in the fruit andvegetable markets. However, Indian food policy andagricultural commodity trade, till the early 1990s, wasbased on government interventions to protect consumerand producer interests through regulation of markets,limitation of private stocking, restricted movement of foodgrains, prohibition of private sector in the international tradeof food grains and the dominance of large governmentparastatals like FCI, NAFED, etc.
In the aftermath of structural adjustment programmes(SAP), liberalization of other sectors of the economy raisedreservations about government regulations of severalspheres of agricultural sector. It was felt that the APMCact has become obsolete and no longer serves its purpose.The regulated markets mainly created a privileged groupof licensed traders who blocked entry of new players thusdefeating the aim of competition and inhibiting privateinvestment to benefit marketing. A Model Market Act 2003was passed to reform the market by allowing morecompetition and encouraging innovative methods to evolve.
Private cooperatives, direct marketing and contract farmingwere to be promoted to bring the producers closer to theprocessors and the consumers. A system of warehousereceipts that supported grain storage was introduced andthe Forward Market Act 1952 was amended in 2007 toallow futures trading in cereals.
Owing to a widening of the production base of theagricultural sector, the market orientation of the farm sectorhas considerably increased. However, these institutionalreforms have not been successful in terms of coverage overthe whole of India. Market imperfections continue tooperate in most of the areas where an agriculturalbreakthrough has not taken place. In the backward regionsmarkets continue to be dominated by the trader-cum-moneylender nexus. Due to the lack of market infrastructure, themarketing system is highly, inadequate and consequentlythe system continues to be non-competitive and dominatedby monopolistic interests. Till date, the most commonmethod of sales of agricultural commodities has remainedthrough regulated markets. However, with amendments inAPMC, a number of corporates are entering into the retailsegment especially with respect to fruits and vegetables.They provide crop specific and soil specific advisoryservices to farmers, to build brand loyalty, enhance qualityof produce and thus increase farm production. They alsocater to export markets.
A number of government organizations such as FoodCorporation of India (FCI) are involved in agriculturalmarketing mainly to procure food grains at minimumsupport prices from producers and maintain a publicdistribution system. Similarly government corporations alsoexist for other crops such as cotton and jute. Further, thereare also specialized marketing boards for rubber, coffee,tea, tobacco, etc. and a network of cooperatives at the local,state and national level. The National AgricultureCooperative Marketing Federation (NAFED) of Indiahandles domestic as well as export marketing for itsmember organizations. The Directorate of Marketing andInspection (DMI) under Ministry of Agriculture,Government of India, is responsible for administeringfederal statutes concerned with marketing of agricultural
*This study is funded by DAC & executed by AERC, Sardar Patel University, Anand, Gujarat.**Director and Professor.***Research Associate.

40 Agricultural Situation in India
SERVER3\E\AGRICULTURE 2015\2588AGRI (SEPT, 2015)-2
produce. In order to improve the marketing system of farmproducts, wholesale agricultural produce markets beganto be regulated in the 1950s and 1960s, when each statebegan implementing its Agricultural Produce MarketingCommittee (APMC) Act. The APMCs were established ineach state by the respective state governments with a viewto regulate the marketing of agricultural produce in marketareas. The regulation of markets had several positivefeatures such as sale through auction method, reliableweighing, standardized market charges, payment of cashto farmers without undue deductions, dispute settlementmechanism, reduction in physical losses of produce andavailability of several amenities in market yards. Theagricultural markets have never been favorable to thefarmers and often the traders and traders-lobby dominatedthe market enterprises. As a result, even though thewholesale price index shows a small growth rate, the actualprices received by the farmers is far below the indicationsgiven by the wholesale prices. Market imperfections arenot only relative in the product market but have also spreadin the factor market. All this leads to the farmers andconsumers being at the receiving end in the process ofmarketing.
Price Volatility in Agricultural Commodities
Regular price fluctuations - "day-to-day" or "normalvolatility" - is both typical and requisite for competitivemarket functioning. However the high price variability inthe case of primary products affects both producers as wellas consumers through a spillover effect to the other sectors,thereby leading to high inflation in the economy. The pricesof the agricultural commodities are normally more volatilethan those of the non-farm commodities due to biologicalnature of production, low price and income elasticity ofdemand and risk in production due to exogenous shocksfrom weather. Such high volatility of prices in agriculturalcommodities can have a disproportional impact on theeconomies that endure exceptional shocks, and that impactsare nonlinear, typically being asymmetric. This arisesbecause governments and households are well-adapted tonormal volatility but neither anticipates nor considersmaking worthwhile provisions against extreme shocks, andassign low probability to the risk of such events. Howeverthe high inflation of food commodities cannot always beattributed to risks, exogenous shocks and mismatch ofdemand and supply, it can also be caused by marketinefficiencies, weak supply chains and monopolies in themarket. Particularly, price spikes in onion could not beexplained fully by the fundamentals of demand-supply andthat underscores the need to delve into the agro-marketstructures and identify the real causes of price volatility.
Against this backdrop and given that marketstructure, degree of competition and efficiency at thevarious levels of the supply chain has impact on the finalprices paid by the end consumers with respect to agriculture
products; the study proposes to examine relationshipbetween wholesale prices, retail prices, and details ofcontributing factors for the price difference of onion inGujarat. Irrational speculative driven bubbles andhoardings by trader lobbies have sometimes been blamedfor episodes of high price volatility in India, but with noclear implications in terms of which possible policies couldeffectively prevent repetition of such crisis. This study aimsto find out the factors contributing for same.
Agricultural Marketing in Gujarat
Gujarat has historically been known for business acumenof its people. Gujarat state has made rapid strides in itsagricultural sector including the agribusiness sub sectorduring recent past. Agriculture in Gujarat has beentransforming over time from traditional to high value addedcommercial crops which can be seen from a shift in itscropping pattern from food grains crops to high value cashcrops such as oilseeds, fruits, vegetables and spices. Thetrend in shifting of cropping pattern paved ways for manyancillary industries in the areas of processing, packing,storage, transformation, etc. Agricultural growth in the stateis favored by the prevailing eight agro-climatic zones,enterprenuring farming community, policy support fromthe government, wealth of livestock population, extendedcoast line and contribution by the agricultural scientist anddedicated NGOs. The Gujarat government has aggressivelypursued an innovative agriculture development programmeby liberalizing markets, inviting private capital, reinventingagricultural extension, improving roads and otherinfrastructure. The mass-based water harvesting and farmpower reforms in dry Saurashtra and Kachchh, and NorthGujarat have helped energise Gujarat's agriculture. Thesesemiarid regions have outperformed the canal irrigatedSouth and Central Gujarat. The shift in agriculture to 8 percent growth rate during last decade was mainly responsiblefor the shift of the overall state economy to higher growthpath with 10.6 per cent annual growth rate (Dholakia,2010). For ensuring systematic and coordinated approachto all around development of its agriculture sector, theGovernment of Gujarat had prepared in the year 2000 a10 year plan called 'Gujarat Agro-vision 2010'. Acomprehensive New Agro-industrial Policy was alsoannounced in 2000. In the new industrial policy, the statehas indentifies agro-industries as the major thrust area. Thepolicy aims to spur investment in agro-processing, agro-infrastructure and hi-tech agriculture by monetaryincentives. There were 207 market committees in 26districts of the state, which includes 195 main yards and206 sub-market wards as on March 31, 2011. The totalwarehousing capacity under Gujarat State WarehousingCorporation (GSWC) has come down from 2.1 lakh tonnesin 2006-07 to 1.5 lakh tonnes in 2010-11. It is astonishingto find that the level of utilization of the existingwarehousing capacity has been very low.

September, 2015 41
SERVER3\E\AGRICULTURE 2015\2588AGRI (SEPT, 2015)-2
Onion is the important vegetable crop grown in thestate. It is generally grown as late kharif or rabi crop. Itaccounts for about 5.3 per cent of total area under vegetablecrops and 6.7 per cent of total vegetable production in thestate. Though, state has shared hardly 2.7 per cent areaand 4.2 per cent production of the Country, the highestproductivity level (24415 kg/ha.) was recorded as comparedto all India average of 15989 kg/ha. in 2012-13. The topfive major onion growing districts in the state areBhavnagar, Rajkot, Junagarh, Amreli and Jamnagar.
With this background, the present study wasundertaken with following specific objectives:
(a) To study the relationship between movementsin market arrivals and market prices at importantmandis, and
(b) To study the divergence among farm harvestprices, wholesale prices, retails prices and exportprices and the relationship between thesemovements.
2. Data and Methodology
The study has been carried out by utilizing both secondaryas well as field survey data collected from Gujarat. Thesecondary level data has been used to find out the majoronion growing districts in Gujarat, wholesale and retailprices of the onion in major markets in Gujarat. Thesecondary data on area and production of onion has beengathered from publication and related websites. Theprovisional data were collected through visiting agricultureand horticulture departments of Gujarat.
The primary survey was carried out in three largestonion producing districts of Gujarat, i.e. Bhavnagar, Rajkotand Junagadh. Primary survey was carried out with astructured questionnaire for farmers and marketintermediaries for the year 2013-2014. Data were collectedfrom 50 farmer households from each district; this makesa total of 150 farmers households (Table 1). Besides datawere collected from other stakeholders such as exporters(07), wholesalers (10) and retailer/local vendors (13).
A focus group discussion with the committeemembers of APMC, and with market functionaries was alsoheld in order to get a clear picture of market charges, marketpractices, etc. Tabulation of the data is carried out by usingsimple statistical tools. The intra-year variability inwholesale and retail prices for each year was calculatedas = S. D. [log (Pt / Pt-1)] Where, S.D. is the standarddeviation, Pt is price in month ‘t’ and Pt-1 is the price inprevious month t-1, t=2,............,12 in each year.
Simple average of prices is used in analysis. The percentage markup (PERMARK) was calculated as follows:
Farmer- PERMARK= (Sale Price-Cost ofCultivation 100, Cost of Cultivation Markup of RP/EPover WP & WP over RP was estimated as follows:
Markup of RP/EP over WP -PERMARK = [(RP orEP - WP) WP]*1 00
Markup of WP over RP- PERMARK = [(RP-WP) WP]*1 00.
TABLE 1: DISTRICT-WISE SELECTED SAMPLE ONION FARMERS IN GUJARAT
Distribution as per Operational Land holdingsDistrict/State Taluka/Blocks MF SF MDF LF TotalRajkot Gondal 4 11 8 3 26
Ralkot 4 12 5 3 24Total 8 23 13 6 50
Junagadh Una 0 16 7 3 26Junagadh 0 15 6 3 24Total 0 31 13 6 50
Bhavnagar Talaja 5 15 6 3 29Mahuva 3 8 7 3 21Total 8 23 13 6 SO
Gujarat state Grand Total 16 77 39 18 150
Notes: MF=Marginal farmer (1> ha.), SF= Small farmer (1-2 ha.), MDF=Medium farmer (2-4 ha.), LF= Large farmer (> 4 ha.)

42 Agricultural Situation in India
SERVER3\E\AGRICULTURE 2015\2588AGRI (SEPT, 2015)-2
3. Findings:
3.1 Demographic Profile and Cropping Pattern
• The average family size of selected households was6.4, wherein more than 78 per cent were adultmembers and remaining were children. The largestsize of family was found in case of large farm sizecategory (10.6), followed by medium size category(6.1).
• On an average, more than one third of householdshead were found educated up to the level ofsecondary and above. More than one quarter ofhouseholds head from marginal and small farmcategory had taken education up to higher secondaryschool level. At the same time, the highestproportions of heads were found illiterate in thesetwo categories only (i.e. marginal and small).
• Among the selected sample households, the socialcategorization of households indicated that majorityof households were from other/General category. Inall farm size categories, more than 75 per cent ofhouseholds were from general/other category. Thehighest proportion of this category was found in largefarm category (88.9 per cent). The other backwardclasses category accounts for around 20 per cent intotal sample households followed by a very meagerproportion of Scheduled Caste category households(0.7 per cent). No household from Scheduled Tribecategory was included in selected sample households.
• On an average, owned land holding size of samplehouseholds was 2.64 ha and about 0.4 ha land wastaken on leased-in. Thus, on an average per household2.78 ha land was under operation/cultivation. Themarginal farmers had put all his cultivated area underthan two crops (as area sown more than once) andtherefore, cropping intensity was found to be morethan 200 per cent which was the highest one amongfarm categories. The lowest cropping intensity wasfound around 150 per cent in large farm category,whereas average cropping intensity was about 162per cent. Thus, it indicates that selected farmhouseholds had put half of their operated land undersecond crop cultivation. Also it was observed that asland holding increases, cropping intensity decrease.
• On an average more than 99 per cent land of selectedhouseholds was irrigated, mainly through well andtubewell. The other source of irrigation was canal,which accounted for very meager share of around 5per cent in total irrigation. Tank and other sources ofirrigation were not available in selected study area.Thus, groundwater was the dominant source ofirrigation for selected sample households.
• The cropping pattern of selected households showsthat onion was the major crop grown which
accounted for about 26 per cent of gross croppedarea. The highest share in GCA under this crop wasfound in marginal farm group (30.65 %) followedby small (29.02 %) farm category. The nextimmediate major crop grown by selected householdwas groundnut which occupied about 25.37 per centof GCA, followed by cotton crop (20.63%). Wheat,maize and sesamum were other major crops grownin study area. Besides, selected farmers had alsogrown jowar, tur, gram, cumin, vegetables and fruitsduring year under report, which are included underother crops group. Thus, three major crops grownby selected households were onion, cotton andgroundnut which together had accounted for about72 per cent in gross cropped area.
• The distribution of total area under onion in differentfarm groups shows that small farmers accounted formore than 36 per cent area followed by large farmcategory (31.00 %) and medium size farm category(27.71 %).
• Majority of the households had grown Nashik Red/Nashik 53 variety of onion (35.91 %), followed byRed Patti (local name), Nashik white and localvarieties. The other varieties grown by the selectedfarm households were Pillipatti/Yellow and NHRDF.
• Except marginal farmer group, all other groupfarmers had grown onion crop during two seasons,i.e. kharif and rabi, having more than two third area(66-86 per cent) in rabi season and remaining inkharif season. Thus, rabi season was the main oniongrowing season. Whereas in case of group ofmarginal farmers, they had grown onion crop duringall three seasons, having almost 50 per cent area inkharif season, about 42 per cent in rabi season andremaining area in summer season.
3.2 Economics of the Study Crop
• Most of the farmers had sold their more than 90 percent of output and very few had retained somequantity of output for consumption and for futuresale purpose, however, share of same was verymeager. Also the share of wastage in total productionwas very minimum, ranged from nil to 4.05 per cent,with an average of 0.28 per cent of total produce.For consumption purpose, pilli patti and red pattivarieties were preferred, whereas for storage, pillipatti and local varieties produce was retained. Amongthe varieties, the wastage was found more in pillipatti variety followed by local varieties.
• Among the group of farmers, the medium size groupof farmers had used onion more for consumptionpurpose, whereas large farmer had retained morequantity of onion for future sell and also morewastage of onion was recorded in this category.

September, 2015 43
SERVER3\E\AGRICULTURE 2015\2588AGRI (SEPT, 2015)-2
• The total cost of cultivation for onion at overall levelwas estimated to be Rs. 139106 per hectare, in whicharound 86 per cent was input cost and remaining wasstorage, transportation and marketing cost. Amongthe input cost, highest share was of labour cost(around 52 per cent) followed by seed (around 14per cent), manure and fertiliser (around 11 per cent).While transportation and bagging share around 43per cent each in total storage, transportation andbagging cost.
• Almost same trend in cost pattern as recorded atoverall level was observed in case of cost ofcultivation of each variety. At overall level, labourcost accounted for around 44 per cent, followed byseed cost (around 9-11 per cent) and manure andfertiliser (9-10 per cent), except in case of NHRDF.In case of NHRDF, share of cost on manure andfertiliser was estimated to be 18.1 per cent whereasshare of cost on labour was about 35 per cent. Thus,onion crop was found labour intensive crop.
• At overall level, on an average selected farmerhouseholds had received net returns of Rs. 68329per hectare or Rs. 285 per quintal (Table 2). Amongthe farm category, the net returns were estimated tobe the highest in case of marginal farmer (Rs. 1 02536per ha or Rs. 453 per quintal) followed by largefarmers (Rs. 75686 per ha or Rs. 335 per quintal),medium farmers (Rs. 66443 per ha or Rs. 260 perquintal) and the lowest was in case of small farmers(Rs. 59081/ha or Rs. 244/qt1s). Across the varieties,it was observed that except NHRDF variety (whichwas grown by one large farmer and had faced loss incultivation), all other crop variety cultivation wasprofitable venture for selected farmers. The highestreturns per quintal of production of onion wasrecorded in case of cultivation of red patti variety(Rs. 375/qt1), closely followed by Nashik White (Rs.373/qt1), Nashi Red (Rs. 348/qt1) and the lowestwas in case of Red patti (Rs. 185/qt1). The largefarmer, who had grown NHRDF variety of onion hadto bear loss of Rs. 37 per quintal, which was mainlydue to low production (153 qtl/ha).
TABLE 2: PER HECTARE & PER QUINTAL PROFITABILITY OF FARMING: ONION- ALL
Sr. Farm Per Hectare & Per Quintal Profitability of Farming: Onion-All varietiesNo. Size Yield/ Per ha Gross Per ha Net Per quintal Per quintal Per ha Value
ha Return (Rs.) Returns Gross Return Net Return of Marketed(Rs.) (Rs.) (Rs.) Surplus (Rs.)
1 MF 227.0 233095 102536 1029 453 2252532 SF 243.5 194073 59081 801 244 1898573 MDF 249.8 202943 66443 794 260 1994084 LF 240.0 210211 75686 931 335 205861
Total 243.0 203387 68329 847 285 199148Source: Field survey data.
3.3 Marketing of Onion
• At overall level, on an average more than 93 per centof selected households had sold their produce innearby APMC/regulated market, while 5.3 per centfarmers had sold their output to private trader andremaining had sold to village trader. Among the farmsize category sale, it was observed that 12.5 per centmarginal famers followed by 11.1 per cent largefarmers had sold their output to private traders. Incase of Nashik red variety, 40 per cent of farmerssold their output to private traders, while remainingfarmers had sold their output in APMC. In case ofRed patti variety, except 33.3 per cent large farmerswho had sold output to village traders, all other farmcategories farmers had sold all output in APMCmarket. In case of local variety onion, all output byfarm categories were sold in APMC market. Thus,
most of the selected farmers had chosen APMCmarket as sale point for their output.
• In case of per quintal price received, on an averageRs.899 per quintal price was released by the selectedfarmers. The highest price was realized by mediumfarm group farmers (Rs. 1066/ qtl) followed bymarginal farmers (Rs. 1026/qt1). Across the placesof sale of Output, the price per quintal realized byfarmers was the highest in case of village sale,followed by private trader and then APMC. The salethrough village trader was very meager and that toin off period and therefore the price realized wasthe highest.
• The selected farmers had sold their maximum outputduring the three months of January, February andMarch, in which March month sale was the highestone. In case of prices, October and May prices wererelatively higher than other months.

44 Agricultural Situation in India
SERVER3\E\AGRICULTURE 2015\2588AGRI (SEPT, 2015)-2
• Majority of wholesalers had purchased the onionfrom farmers and some of them had procured fromcommission agent. During the year 2013, thepurchase price of onion fluctuated from as low asRs. 722.32 per quintal in May 2013 to Rs. 3275 perquintal in October 2013. Thus, prices of onion werelower in the beginning of calendar year which hadincreased then during the post monsoon season andin winter season. Also same trend was observed inthe year 2014. Whereas price released by thewholesaler through sale of onion was relatively betterthan procurement price, which resulted in significantprofit to the wholesaler.
• Majority of retailers had purchased the onion fromcommission agents, while remaining had procuredfrom farmers. As observed in case of wholesaler,almost same trend in purchase price of onion hadprevailed in case of retailers as well. It was observedthat during the months of June to September, thepurchase price was at the highest level, while mixedpicture was noted during other months of the year.Thus, mostly before kharif onion comes into themarket, prices had gone up. There was huge deviationin the prices of onion across the months in the year.It was very interesting to note here that the averageprice got by retailer for the sale of onion was veryhigh as compared to purchase price. Therefore,except in the month of April 2014, retailers hadreceived the profit on purchase price more than 150per cent. The highest level of markup was 297 percent in the month of December. Thus, retailer hadmade almost double the profit on purchase price. It
can be concluded that no effect of supply of onion inmarket was found on level of profit of retailer.
• The exporters had purchased the onion from twosources, i.e. commission agents and onion growers.They preferred to purchase the onion fromcommission agent as well as from wholesalers. Thepurchase price of onion paid by the exporter was athigher level during the months of 2012 and 2013 ascompared to the prices during the months of year2014. The total quantum exported by the sevenexporters was the lowest in the month of August2012 and was the highest in the month of May 2014.No fixed trend could be observed from the data aboutthe onion prices. The exporter realized the profitwhich ranges from as low as 50 per cent on purchaseprice to as high as 450 per cent on purchase price.Thus, level of profit varies as per local availabilityand demand for onion as well as demand and exportprice of onion during that particular month.
3.4 Price Patterns over the Time and Space• The average retail prices were always found higher
than the wholesale prices. The average wholesaleprice on onion during last one decade period wasestimated to be Rs. 842 per quintal whereas retailprice during corresponding period was about Rs.1483 per quintal. Thus, retail price was more than76 per cent higher than the wholesale price. However,the deviation was found higher in retail prices thanwholesale prices. During the year 2013, both theprices reached the highest level as well as thedeviation across the month was also recorded at thehighest level (Fig. 1 to 4).

September, 2015 45
SERVER3\E\AGRICULTURE 2015\2588AGRI (SEPT, 2015)-2

46 Agricultural Situation in India
SERVER3\E\AGRICULTURE 2015\2588AGRI (SEPT, 2015)-2
• Across the months, the average markup range ofprices was between 43 per cent to 104.4 per cent, with anaverage of 76.1 per cent. While across the years, the
corresponding figure ranges from 50.5 per cent to 113.6 percent. Thus, it is very much clear that increase in prices wasvery high when it reaches through the retailer (Fig. 5 to 6).
3.5 Profitability and Markup• On an average Rs. 336 per quintal net return was
realized by the selected farmers (Fig. 7). Themarginal farmers had received the highest level ofreturns (Rs. 489 per quintal) and the lowest was incase of medium farmers (Rs. 292 per quintal). Thus,markup per centage was same as observed in case ofnet returns.
• The export and retail prices were found higher thanthe wholesale prices, while except in one month, theexport prices were found higher than retail prices.Thus, markup per centage was higher in exporter overwholesale prices followed by retailer over wholesaleprice.

September, 2015 47
SERVER3\E\AGRICULTURE 2015\2588AGRI (SEPT, 2015)-2
3.6 Perceptions of Stakeholders
• More than 69 per cent of selected farmer householdshad opined that they grew onion crop due toprofitability (rank 1). Among the farm size groups,more than 87 per cent of farmers from marginal farmgroup preferred growing onion for its profitability,followed by large farm group (83.33 per cent). Atoverall level, more than 29 per cent of farmers opinedthat for growing onion crop, their farm soil is suitable.Few farmers from large farm group only had mentionabout their preference growing crop for homeconsumption.
• The major problems faced by the selected farmerhouseholds in cultivating onion crop were distancemarket, lack of market information, poorunderground water, collusion among traders/trademalpractices, poor road network for transportation,poor refrigeration facilities, non-availability of goodquality of seed and lack of government procurementsupport.
• Among the various problems faced by the wholesalerduring purchase and sale of onion, the problemranked one was competition from imports followedby competition from large organized retail chains andcompetition from other wholesalers. Besides, theproblems such as non-remunerative price due tolower demand, lower supply and poor infrastructurewere ranked second. The poor quality of product,Government Interventions in the form of minimumintervention price and sometime through EssentialCommodity Act also acted as constraint in businessof wholesalers.
• The problems which were ranked 1 by retailers werepoor infrastructure followed by competition fromimports, and competition from other retailers. Themajority of retailers ranked second the competitionfrom large organized retail chains. The otherproblems faced by the retailers were labour problem,non- remunerative price due to lower demand andgovernment intervention in price (M1P).
• The exporters had also faced problems in purchasingand exporting the onion. The poor road network andother related infrastructure followed by competitionfrom other exporters, poor port facilities, and lowdomestic demand were the major problems faced bymajority of exporters. High port charges/taxes,competition from other wholesalers mixing ofdifferent varieties as well as lengthy governmentprocedures were other major problems were facedby the wholesalers.
4. Policy Suggestions:
• The adequate return on agricultural output is one ofthe driving forces for better agricultural growth. Thus,better marketing channels and warehouse facilitiesare essential for ensuring adequate returns onagricultural output of famers. The available regulatedmarkets are inefficient to handle the buffer produceof onion. Also inadequate facilities at market andinappropriate steps at APMC level for efficientmarketing of produce are the major difficulties forfarmers to sell out their produce. Therefore, theappropriate policy decision and arrangement shouldbe made for remunerative prices to onion growingfarmers in order to safeguard their interest inproduction of onion.

48 Agricultural Situation in India
SERVER3\E\AGRICULTURE 2015\2588AGRI (SEPT, 2015)-2
• The quality seed (suitable to soil and weathercondition) should be made available to farmer atreasonable rate by the concern State AgriculturalUniversity/State Seed Corporation.
• It was observed in the study that most of the onioncrop is sold in APMC and farmers preferred thischannel because they were familiar with the systemwhich was practiced over the years and they receivedtimely payments. Marketing infrastructure in theMahua market was very good, whereas at otherplaces, infrastructure up-gradation is required as perrequirement.
• Marketing information is needed by farmers inplanning production and marketing and equallyneeded by other market participants in arriving atoptimal trading decisions. Therefore, agriculturalmarketing extension system needs to be strengthened.
• Onion dry product needs to be promoted in themarket. The adequate number of processing/dehydration units needs to be created/installed toincrease the onion demand in market. The awarenessabout use of dried/dehydrated onion among theconsumer needs to be made though consumerawareness programme.
• The advance information on weather should be madeavailable to the farmers by the nearby Meteorologydepartment of Agricultural University. Also cropinsurance facility should be provided to the farmers.
• Farmers suggested that in case price of onion falls tounduly levels, the government must step in andpurchase the produce to avoid distress sales. MarketIntervention Scheme should be implemented in timeas and when prices drastically fall below theminimum level.
• The difference in freight charges at different portshould be removed. Proper storage facility at porton minimal rate should be provided. The loanarrangement at subsidies rate on the basis of quantumof export should be provided to the exporters. Alsoinsurance facility should be provided to exporters inorder to cover the loss due to cancellation of orderand delay in delivery in respective countries.
• A visit was made to Mahua APMC and discussionswere held with concerned market functionaries. Itwas quite clear from the discussions that some tradersalso stored onions in anticipation of higher prices.After making purchases from farmers, theysometimes stored the onions instead of immediatesales. These commission agents also indicated thatthey stored onions. However, when an attempt wasmade to find out the quantity stored by them, theywere very reluctant to disclose the quantity stored
and only complained of transport bottlenecks becauseof which they were forced to store.
• The discussion with wholesaler and exporters revealthat even the media plays a role in causing suddenrise or downfall in prices by publishing certain newsfor which they are paid. For example, there may be asudden news of very high auction prices in upcountrymarkets which immediately lead to spiraling of pricesin urban centres. In reality only one transaction mayhave been at very high price, but the media hypes itup, and wholesalers and retailers jack up the prices.Conversely, the media may talk about falling demandfor onions and low prices prevailing in severalmarkets. This acts as a downward pressure on pricesand onion growers may have to make distress sales.
• Meeting with traders revealed that it is mostly theretailers who charge higher prices than warranted tothe consumers. There is no regulation on pricescharged by retailers and at times their rates areexorbitant, especially when the produce is in shortsupply.
• A meeting with wholesalers and exporters revealedthat there are several bottlenecks in onion trade,transportation is major one. Another major problemfacing traders is the export ban which is sometimesimposed when onion prices show an upward trend.Exporters lose their credibility in export markets asirregular suppliers in international markets. Addedto this is the practice of fixing Minimum ExportPrices (MEP) for onions. At times the MEP is fixedat very high levels and exporters actually sell at pricesbelow MEP though the L/C (letter of credit) isprepared at MEP. Therefore, the profit realized byexporters shows an inflated figure leading to highertax liability. Also fixation of MEP makes exportersreluctant to export which sometimes leads to excesssupplies in domestic markets, leading to fall in prices.Farmers also loose when prices show downwardtrend. In view of these difficulties, export ban ononions coupled with fixation of MEP must bediscouraged.
• A large number of exporters meet their exportrequirements from APMCs in Bhavnagar, junagarh.However, their produce is often not cleared at portfor 3 to 4 days. They, therefore, refrain from enteringthe local markets till their export commitments aredispatched. Since supply is choked up, exporters donot enter the market till their consignments aredispatched leading to price fall. Hence, if exportorders are timely dispatched, it is possible thatvolume of exports may increase which will benefitfarmers.

September, 2015 49
SERVER3\E\AGRICULTURE 2015\2588AGRI (SEPT, 2015)-2
• Farmers normally store onions in onion meda/chawls(temporary storage structure) to benefit from leanseason rise in prices. However, this method of storageleads to deterioration in quality, spoilage andshrinkage. Often storing of onions leads to losses of30-40 per cent. Traders, therefore, stated that storingof onions in meda/chawls is a very rudimentarymethod of storage and there is urgent need fortechnology such as well designed cold storage whichwill enable the crop to remain in the same condition
without spoilage or shrinkage. This will help to evenout supplies throughout the year and also lead tobetter production planning of the crop and morestability in prices.
• Onion cooperatives must be encouraged to form andwork in study area because presence of cooperativeswould help the farmers to receive better prices andhelp to prevent collusion amongst traders not to bidbeyond a certain price and also discipline prices.

50 Agricultural Situation in India
SERVER3\E\AGRICULTURE 2015\2588AGRI (SEPT, 2015)-2
During the month of August,2015 the Wholesale PriceIndex (Base 2004-05=100) of pulses increased by 2.58%,
COMMODITY REVIEWS
Foodgrains
cereals increased by 0.52% &foodgrains increased by0.97% respectively over the previous month.
INDEX NUMBER OF WHOLESALE PRICES
(Base: 2004-2005=100)
Commodity Weight WPI for WPI for WPI Percentage Changethe month the month A year during
(%) of August, of July, ago2015 2015 A month A year
(1) (2) (3) (4) (5) (6) (7)Rice 1.793 238.2 237.7 246.8 0.21 -3.48Wheat 1.116 214.5 212.9 210.2 0.75 2.05Jowar 0.096 274.3 276.6 299.4 -0.83 -8.38Bajra 0.115 248.6 243.0 256.4 2.30 -3.04Maize 0.217 253.5 249.3 249.3 1.68 1.68Barley 0.017 220.8 219.0 222.9 0.82 -0.94Ragi 0.019 324.1 321.1 330.7 0.93 -2.00Cereals 3.373 233.1 231.9 237.0 0.52 -1.65Pulses 0.717 326.0 317.8 239.0 2.58 36.40Foodgrains 4.09 249.4 247.0 237.3 0.97 5.10Source: Office of the Economic Adviser, M/o Commerce and Industry.
The following Table indicates the State wise trend of Wholesale Prices of Cereals during the month of August, 2015.
Commidity Main Rising Falling Mixed SteadyTrend
Rice Falling Assam A.P. Jharkhand KeralaWest Bengal Gujarat U.P. Karnataka
HaryanaWheat Rising Karnataka Gujarat Haryana
M.P. U.P.Maharashtra
RajasthanJowar Steady Maharashtra A.P. Gujarat Karnataka
RajasthanBajra Mixed A.P. Karnataka Haryana
Gujarat MaharashtraRajasthan
Maize Falling &Steady Karnataka Haryana Rajasthan Gujarat
U.P. M.P.

September, 2015 51
SERVER3\E\AGRICULTURE 2015\2588AGRI (SEPT, 2015)-2
PROCUREMENT OF RICE
(in Thousand Tonnes)
Marketing Season Corresponding Marketing YearState 2014-15 Period of last Year (October-September)
(upto 31.07.2015) 2013-14 2013-14 2012-13
Procurement Percentage Procurement Percentage Procurement Percentage Procurement Percentage to Total to Total to Total to Total
(1) (2) (3) (4) (5) (6) (7) (8) (9)
Andhra Pradesh 3524 11.11 3676 11.73 3722 11.76 6464 19.00
Chhatisgarh 3355 10.58 4290 13.69 4290 13.56 4804 14.12
Haryana 2013 6.35 2406 7.68 2406 7.60 2609 7.67
Maharashtra 199 0.63 161 0.51 161 0.51 192 0.56
Punjab 7782 24.54 8106 25.88 8106 25.62 8558 25.16
Tamil Nadu 951 3.00 682 2.18 684 2.16 481 1.41
Uttar Pradesh 1698 5.35 1127 3.60 1127 3.56 2286 6.72
Uttarakhand 465 1.47 454 1.45 463 1.46 497 1.46
Others 11725 36.97 10425 33.28 10678 33.75 8129 23.89
Total 31712 100.00 31327 100.00 31637 100.00 34020 100.00
Source: Department of Food & Public Distribution.
Procurement of Rice 0.209 million tonnes of rice (including paddy convertedinto rice) was procured during August 2015 as against0.211 million tonnes of rice (including paddy convertedinto rice) procured during August 2014. The total
procurement of rice in the current marketing season i.e2014-2015, up to 31.08.2015 stood at 31.92 million tonnes,as against 31.53 million tonnes of rice procured, duringthe corresponding period of last year. The details are givenin the following table :
Procurement of WheatThe total procurement of wheat in the current marketingseason i.e 2015-2016 up to July, 2015 is 28.09 million
tonnes against a total of 27.17 million tonnes of wheatprocured during last year. The details are given in thefollowing table :
PROCUREMENT OF WHEAT
(in Thousand Tonnes)
Marketing Season Corresponding Marketing YearState 2015-16 Period of last Year (April-March)
(upto 13.07.2015) 2014-15 2014-15 2013-14
Procurement Percentage Procurement Percentage Procurement Percentage Procurement Percentage to Total to Total to Total to Total
(1) (2) (3) (4) (5) (6) (7) (8) (9)
Haryana 6778 24.13 6414 23.61 6495 23.20 5873 23.41
Madhya Pradesh 7309 26.02 7188 26.46 7094 25.34 6355 25.33
Punjab 10344 36.83 10775 39.66 11641 41.58 10897 43.43
Rajasthan 1300 4.63 2155 7.93 2159 7.71 1268 5.06
Uttar Pradesh 2267 8.07 628 2.31 599 2.14 683 2.72
Others 90 0.32 6 0.02 6 0.02 16 0.06
Total 28088 100.00 27166 100.00 27994 100.00 25092 100.00
Source: Department of Food & Public Distribution.

52 Agricultural Situation in India
SERVER3\E\AGRICULTURE 2015\2588AGRI (SEPT, 2015)-2
Oilseeds and Edible OilsThe Wholesale Price Index (WPI) of nine major oilseedsas a group stood at 212.8 in August, 2015 showing anincrease of 0.3% over the previous month. However, it islower by 2.5% over the previous year. The WPI of copraincreased by 7.8%, niger seed by 6.7%, sunflower seedby 3.4%, cotton seed by 2.8%, groundnut seed by 1.7%,sunflower seed by 1.0% and rape & mustard seed by 0.8%over the previous month. However, the WPI of soyabean6.0% and gingelly seed by 3.3% decreased over theprevious month. the wholesale price index (WPI) of edibleoils as a group stood at 147.9 in August, 2015 showing adecrease of 0.6% over the previous month. However, it ishigher by 1.4% over the previous year. The WPI ofsoyabean oil decreased by 2.1%, gingelly oil by 1.7%,sunflower oil by 0.7%, mustard & rapeseed oil by 0.4%,copra oil by 0.4% and cotton seed oil by 0.1% over theprevious month. However, the WPI of groundnut oil by0.5% over the previous month.
Fruits & VegetableThe Wholesale Price Index (WPI) of fruits & vegetableas a group stood at 265.8 in August, 2015 showing anincrease of 9.5% over the previous month. However, it islower by 12.4% over the previous year.
Potato
The Wholesale Price Index (WPI) of potato stood at 179.3in August, 2015 showing an increase of 2.8% over the
Commercial Crops
previous month. However, it is lower by 51.7% over theprevious year.
Onion
The Wholesale Price Index (WPI) of onion stood at 662.8in August, 2015 showing an increase of 63.1% and 65.3%over the previous month and year, respectively.
Condiments & Spices
The Wholesale Price Index (WPI) of condiments & spices(Group) stood at 336.0 in August, 2015 showing anincrease of 0.7% and 8.8% over the previous month andyear, respectively. The WPI of chillies (dry) and blackpepper increased by 0.7 percent and 0.1% respectively,over the previous month. However, WPI of turmericdecreased by 1.8% over the previous month
Raw Cotton
The Wholesale Price Index (WPI) of raw cotton stood at192.3 in August, 2015 showing a decrease of 1.7% and13.0% over the previous month and year, respectively.
Raw Jute
The Wholesale Price Index (WPI) of raw jute stood at362.0 in August, 2015 remained unchanged over theprevious month. However, it is higher by 35.6% over theprevious year.

September, 2015 53
SERVER3\E\AGRICULTURE 2015\2588AGRI (SEPT, 2015)-2
WHOLESALE PRICE INDEX OF COMMERCIAL CROPS
Commodity Latest Month Year % Variation Over
August, 2015 July, 2015 August, 2014 Month Year
OIL SEEDS 212.8 212.1 218.3 0.3 -2.5
Groundnut Seed 254.0 249.8 208.5 1.7 21.8
Rape & Mustard Seed 220.8 219.1 191.1 0.8 15.5
Cotton Seed 178.0 173.2 188.5 2.8 -5.6
Copra (Coconut) 159.5 148.0 213.5 7.8 -25.3
Gingelly Seed (Sesamum) 336.1 347.5 460.0 -3.3 -26.9
Niger Seed 353.6 331.3 195.3 6.7 81.1
Safflower (Kardi Seed) 153.5 148.4 125.6 3.4 22.2
Sunflower 190.6 188.7 185.1 1.0 3.0
Soyabean 191.7 203.9 231.6 -6.0 -17.2
EDIBLE OILS 147.9 148.8 145.8 -0.6 1.4
Groundnut Oil 194.5 193.6 161.8 0.5 20.2
Cotton Seed Oil 179.7 179.9 178.1 -0.1 0.9
Mustard & Rapeseed Oil 180.3 181.1 155.8 -0.4 15.7
Soyabean Oil 146.0 149.2 154.6 -2.1 -5.6
Copra Oil 154.0 154.6 136.9 -0.4 12.5
Sunflower Oil 127.4 128.3 126.8 -0.7 0.5
Gingelly Oil 165.9 168.7 178.7 -1.7 -7.2
FRUITS & VEGETABLES 265.8 242.7 303.4 9.5 -12.4
Potato 179.3 174.5 371.3 2.8 -51.7
Onion 662.8 406.5 401.0 63.1 65.3
CONDIMENTS & SPICES 336.0 333.8 308.8 0.7 8.8
Black Pepper 730.5 730.1 770.2 0.1 -5.2
Chillies(Dry) 323.3 321.1 289.5 0.7 11.7
Turmeric 244.3 248.9 219.4 -1.8 11.3
Raw Cotton 192.3 195.7 221.0 -1.7 -13.0
Raw Jute 362.0 362.1 267.0 0.0 35.6

54 Agricultural Situation in India
SERVER3\E\AGRICULTURE 2015\2588AGRI (SEPT, 2015)-2
STATISTICAL TABLES
Wages1 DAILY AGRICULTURAL WAGES IN SOME STATES (CATEGORY-WISE)
(In Rs)
State District Centre Month & Daily Field Labour Other Agri. Herdsman Skilled LabourYear Normal Labour Carpen- Black Co-
Working ter Smith bbler
Hours M W M W M W M M M
Andhra Pradesh Krishna Ghantasala April,15 8 300 250 325 NA 200 NA 300 NA NA
Guntur Tadikonda April,15 8 283 200 275 NA 250 NA NA NA NA
Telangana Ranga Reddy Arutala March,15 8 260 190 300 NA NA NA NA NA NA
Karnataka Bangalore Harisandra Nov,14 8 250 200 300 250 300 250 350 330 NA
Tumkur Gidlahali Nov,14 8 160 160 180 180 180 180 180 180 NA
Maharashtra Nagpur Mauda Sep, 14 8 100 80 NA NA NA NA NA NA NA
Ahmednagar Akole Sep, 14 8 NA NA NA NA NA NA NA NA NA
Jharkhand Ranchi Gaitalsood June,12 8 100 100 90 90 58 58 170 150 NA
1.1DAILY AGRICULTURAL WAGES IN SOME STATES (OPERATION-WISE)(In Rs.)
Skilled Labours
State District Centre Month Type Normal Ploug- Sow- Weed- Harve- Other Herd- Carpenter Black Cobbler& Year of Daily hing ing ing sting Agri sman Smith
Labour Working LabourHours
Assam Barpeta Laharapara May,15 M 8 250 250 250 250 250 200 300 250 250W 8 NA NA NA NA NA NA NA NA NA
Bihar Muzaffarpur BhaluiRasul June,14 M 8 310 210 210 260 250 210 350 360 310W 8 NA NA NA 250 210 NA NA NA NA
Shekhpura Kutaut June,14 M 8 220 NA NA NA 220 NA 280 NA NAW 8 NA NA NA NA NA NA NA NA NA
Chhattisgarh Dhamtari Sihaba May,15 M 8 NA NA NA 150 100 100 250 100 NAW 8 NA NA NA 120 80 80 150 80 80
Gujarat* Rajkot Rajkot Apr,15 M 8 221 213 160 183 150 190 442 442 350W 8 NA 169 150 180 138 125 NA NA NA
Dahod Dahod Apr,15 M 8 186 157 157 157 129 NA 257 207 207W 8 NA 157 157 157 129 NA NA NA NA
Haryana Panipat Ugarakheri May,15 M 8 NA 400 400 400 400 NA NA NA NAW 8 NA 300 300 300 300 NA NA NA NA
Himachal Mandi Mandi Dec,13 M 8 NA 162 162 162 162 NA 260 240 240Pradesh W 8 NA 162 162 162 162 NA 650 NA NA
Kerala Kozhikode Koduvally Apr,15 M 4-8 1030 610 NA 660 820 NA 710 NA NAW 4-8 NA NA 460 510 510 NA NA NA NA
Palakkad Elappally Apr,15 M 4-8 500 500 NA 500 466.66 NA 600 NA NAW 4-8 NA NA 300 300 300 NA NA NA NA
Madhya Hoshangabad Sangarkhera May,15 M 8 NA NA NA NA NA NA NA NA NAPradesh W 8 NA NA NA NA NA NA NA NA NA
Satna Kotar May,15 M 8 200 150 200 200 200 200 450 450 450W 8 NA 150 200 200 200 200 NA NA NA
Shyopurkala Vijaypur May,15 M 8 NA NA NA NA NA NA NA NA NAW 8 NA NA NA NA NA NA NA NA NAW 8 NA 200 NA NA NA NA NA NA NA
Odisha Bhadrak Chandbali May,15 M 8 250 250 NA 250 250 200 400 300 200W 8 NA 200 NA 200 150 200 NA NA NA
Ganjam Aska Apr,15 M 8 300 200 200 250 200 200 400 400 200W 8 NA 200 100 250 100 100 NA NA NA

September, 2015 55
SERVER3\E\AGRICULTURE 2015\2588AGRI (SEPT, 2015)-2
Punjab Ludhiyana Pakhowal July,14 M 8 300 300 300 NA 365 NA 395 395 NAW 8 NA NA NA NA NA NA NA NA NA
Rajasthan Barmer Kuseep May,15 M 8 NA NA NA NA NA 300 700 500 NAW 8 NA NA NA NA NA 200 NA NA NA
Jalore Sarnau May,15 M 8 NA NA NA NA NA NA NA NA NAW 8 NA NA NA NA NA NA NA NA NA
Tamil Nadu* Thanjavur Pulvarnatham March,15 M 8 NA 317 NA NA 316 NA NA NA NAW 8 NA NA 123 117 122 NA NA NA NA
Tirunelveli Malayakulam May 15 M 8 NA 287 NA 375 471 NA NA NA NAW 8 NA 135 158 155 300 NA NA NA NA
Tripura State Average Apr, 14 M 8 287 263 264 277 261 270 305 212 285W 8 NA 197 201 209 197 200 NA NA NA
Uttar Pradesh* Meerut Ganeshpur Dec,14 M 8 275 263 261 263 260 NA 378 NA NAW 8 NA 198 202 197 203 NA NA NA NA
Aurraiya Aurraiya Dec,14 M 8 150 150 150 160 150 NA 250 NA NAW 8 NA NA NA 160 150 NA NA NA NA
Chandauli Chandauli Dec,14 M 8 NA 200 200 200 200 NA 350 NA NAW 8 NA NA NA NA NA NA NA NA NA
1.1 DAILY AGRICULTURAL WAGES IN SOME STATES (OPERATION-WISE)-Contd.(In Rs.)
Skilled Labours
State District Centre Month Type Normal Ploug- Sow- Weed- Harve- Other Herd- Carpenter Black Cobbler& Year of Daily hing ing ing sting Agri sman Smith
Labour Working LabourHours
M-ManW-WomanNA-Not Available*States reported district average daily wages.
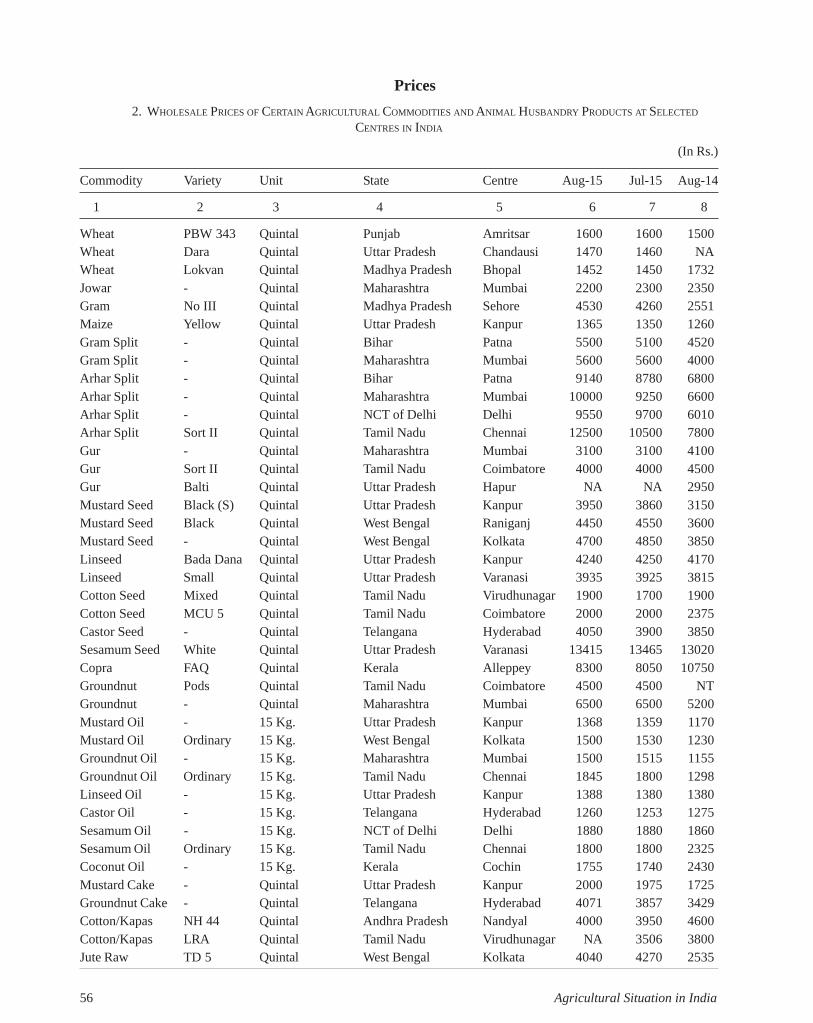
56 Agricultural Situation in India
SERVER3\E\AGRICULTURE 2015\2588AGRI (SEPT, 2015)-2
Prices2. WHOLESALE PRICES OF CERTAIN AGRICULTURAL COMMODITIES AND ANIMAL HUSBANDRY PRODUCTS AT SELECTED
CENTRES IN INDIA
(In Rs.)
Commodity Variety Unit State Centre Aug-15 Jul-15 Aug-14
1 2 3 4 5 6 7 8
Wheat PBW 343 Quintal Punjab Amritsar 1600 1600 1500Wheat Dara Quintal Uttar Pradesh Chandausi 1470 1460 NAWheat Lokvan Quintal Madhya Pradesh Bhopal 1452 1450 1732Jowar - Quintal Maharashtra Mumbai 2200 2300 2350Gram No III Quintal Madhya Pradesh Sehore 4530 4260 2551Maize Yellow Quintal Uttar Pradesh Kanpur 1365 1350 1260Gram Split - Quintal Bihar Patna 5500 5100 4520Gram Split - Quintal Maharashtra Mumbai 5600 5600 4000Arhar Split - Quintal Bihar Patna 9140 8780 6800Arhar Split - Quintal Maharashtra Mumbai 10000 9250 6600Arhar Split - Quintal NCT of Delhi Delhi 9550 9700 6010Arhar Split Sort II Quintal Tamil Nadu Chennai 12500 10500 7800Gur - Quintal Maharashtra Mumbai 3100 3100 4100Gur Sort II Quintal Tamil Nadu Coimbatore 4000 4000 4500Gur Balti Quintal Uttar Pradesh Hapur NA NA 2950Mustard Seed Black (S) Quintal Uttar Pradesh Kanpur 3950 3860 3150Mustard Seed Black Quintal West Bengal Raniganj 4450 4550 3600Mustard Seed - Quintal West Bengal Kolkata 4700 4850 3850Linseed Bada Dana Quintal Uttar Pradesh Kanpur 4240 4250 4170Linseed Small Quintal Uttar Pradesh Varanasi 3935 3925 3815Cotton Seed Mixed Quintal Tamil Nadu Virudhunagar 1900 1700 1900Cotton Seed MCU 5 Quintal Tamil Nadu Coimbatore 2000 2000 2375Castor Seed - Quintal Telangana Hyderabad 4050 3900 3850Sesamum Seed White Quintal Uttar Pradesh Varanasi 13415 13465 13020Copra FAQ Quintal Kerala Alleppey 8300 8050 10750Groundnut Pods Quintal Tamil Nadu Coimbatore 4500 4500 NTGroundnut - Quintal Maharashtra Mumbai 6500 6500 5200Mustard Oil - 15 Kg. Uttar Pradesh Kanpur 1368 1359 1170Mustard Oil Ordinary 15 Kg. West Bengal Kolkata 1500 1530 1230Groundnut Oil - 15 Kg. Maharashtra Mumbai 1500 1515 1155Groundnut Oil Ordinary 15 Kg. Tamil Nadu Chennai 1845 1800 1298Linseed Oil - 15 Kg. Uttar Pradesh Kanpur 1388 1380 1380Castor Oil - 15 Kg. Telangana Hyderabad 1260 1253 1275Sesamum Oil - 15 Kg. NCT of Delhi Delhi 1880 1880 1860Sesamum Oil Ordinary 15 Kg. Tamil Nadu Chennai 1800 1800 2325Coconut Oil - 15 Kg. Kerala Cochin 1755 1740 2430Mustard Cake - Quintal Uttar Pradesh Kanpur 2000 1975 1725Groundnut Cake - Quintal Telangana Hyderabad 4071 3857 3429Cotton/Kapas NH 44 Quintal Andhra Pradesh Nandyal 4000 3950 4600Cotton/Kapas LRA Quintal Tamil Nadu Virudhunagar NA 3506 3800Jute Raw TD 5 Quintal West Bengal Kolkata 4040 4270 2535

September, 2015 57
SERVER3\E\AGRICULTURE 2015\2588AGRI (SEPT, 2015)-2
Jute Raw W 5 Quintal West Bengal Kolkata 3990 4220 2485Oranges Big 100 No. Tamil Nadu Chennai 500 520 650Banana - 100 No. NCT of Delhi Delhi 375 332 333Banana Medium 100 No. Tamil Nadu Kodaikkanal 495 497 477Cashewnuts Raw Quintal Maharashtra Mumbai 65000 64000 57000Almonds - Quintal Maharashtra Mumbai 72000 72000 64000Walnuts - Quintal Maharashtra Mumbai 70000 70000 67000Kishmish - Quintal Maharashtra Mumbai 19000 21000 17000Peas Green - Quintal Maharashtra Mumbai 4100 4100 4600Tomatoes Ripe Quintal Uttar Pradesh Kanpur 1370 2550 3000Ladyfinger - Quintal Tamil Nadu Chennai 1200 1500 2500Cauliflower - 100 No. Tamil Nadu Chennai 1500 1500 1400Potatoes Red Quintal Bihar Patna 780 820 1730Potatoes Desi Quintal West Bengal Kolkata 640 680 1780Potatoes Sort I Quintal Tamil Nadu Mettuppalayam NA 2022 3193Onions Pole Quintal Maharashtra Nashik 4500 3200 1600Turmeric Nadan Quintal Kerala Cochin 12500 12000 10000Turmeric Salam Quintal Tamil Nadu Chennai 8100 8100 9600Chillies - Quintal Bihar Patna 9100 8900 9200Black Pepper Nadan Quintal Kerala Kozhikode 63000 62000 66000Ginger Dry Quintal Kerala Cochin 22000 23000 29000Cardamom Major Quintal NCT of Delhi Delhi 131500 135000 135000Cardamom Small Quintal West Bengal Kolkata 110000 110000 120000Milk Buffalo 100 Liters West Bengal Kolkata 3600 3600 3600Ghee Deshi Deshi No 1 Quintal NCT of Delhi Delhi 30015 29348 30015Ghee Deshi - Quintal Maharashtra Mumbai 47000 46000 35000Ghee Deshi Desi Quintal Uttar Pradesh Kanpur 34550 34575 32860Fish Rohu Quintal NCT of Delhi Delhi 7100 8200 9000Fish Pomphrets Quintal Tamil Nadu Chennai 35000 36000 33000Eggs Madras 1000 No West Bengal Kolkata 3950 4350 4200Tea - Quintal Bihar Patna 21100 21100 21300Tea Atti Kunna Quintal Tamil Nadu Coimbatore 33000 33000 13000Coffee Plant-A Quintal Tamil Nadu Coimbatore 31000 31500 30000Coffee Rubusta Quintal Tamil Nadu Coimbatore 13000 13500 15500Tobacco Kampila Quintal Uttar Pradesh Farukhabad NA 4550 4875Tobacco Raisa Quintal Uttar Pradesh Farukhabad NA 3500 3750Tobacco Bidi Tobacco Quintal West Bengal Kolkata 3900 3900 3900Rubber - Quintal Kerala Kottayam 9800 11000 11500Arecanut Pheton Quintal Tamil Nadu Chennai 31500 31500 29700
Commodity Variety Unit State Centre June-15 May-15 June-14
1 2 3 4 5 6 7 8

58 Agricultural Situation in India
SERVER3\E\AGRICULTURE 2015\2588AGRI (SEPT, 2015)-2
3. MONTH END WHOLESALE PRICES OF SOME IMPORTANT AGRICULTURAL COMMODITIES IN INTERNATIONAL MARKETS DURING YEAR, 2015
Commodity Variety Country Centre Unit Jan. Feb. Mar. Apr. May June Jul Aug
1 2 3 4 5 6 7 8 9 10 11 12 13
CARDAMOM Gautmala Bold Green U.K. - Dollar/MT 12000.00 12000.00 12000.00 12000.00 12000.00 12000.00 12000.00 12000.00Rs./Qtl 74160.00 74100.00 75396.00 75948.00 76596.00 76212.00 76944.00 79272.00
CASHEW Spot U.K. 320s U.K. - Dollar/lbs 3.60 3.62 3.64 3.68 3.85 3.75 3.70 3.72KERNELS Rs./Qtl 49034.59 49267.11 50405.74 51332.75 54162.31 52491.02 52288.58 54161.80
Dollar/MT 7877.32 7932.59 7644.65 8194.35 8431.63 8251.98 8257.78 8050.66Rs./Qtl 48681.84 48983.74 48031.34 51862.04 53819.09 52408.32 52948.89 53182.66
CASTOR OIL Any Origin ex tank Netherlands - Dollar/MT 1700.00 1525.00 1434.00 1434.00 1434.00 1575.00 1539.00 1540.00Rotterdam Rs./Qtl 10506.00 9416.88 9009.82 9075.79 9153.22 10002.83 9868.07 10173.24
CHILLIES Birds eye 2005 crop Africa - Dollar/MT 4100.00 4100.00 4100.00 4100.00 4100.00 4100.00 4100.00 4100.00Rs./Qtl 25338.00 25317.50 25760.30 25948.90 26170.30 26039.10 26289.20 27084.60
CLOVES Singapore Madagascar - Dollar/MT 10500.00 10500.00 10500.00 10500.00 11200.00 11200.00 11200.00 11200.00Rs./Qtl 64890.00 64837.50 65971.50 66454.50 71489.60 71131.20 71814.40 73987.20
COCONUT OIL Crude Phillipine/ Netherlands - Dollar/MT 1080.00 1140.00 1040.00 1085.00 1125.00 1105.00 1070.00 950.00Indonesia, cif Rotterdam Rs./Qtl 6674.40 7039.50 6534.32 6866.97 7180.88 7017.86 6860.84 6275.70
COPRA Phillipines cif Phillipine - Dollar/MT 679.50 726.00 657.00 682.50 714.00 701.50 679.50 597.00Rotterdam Rs./Qtl 4199.31 4483.05 4127.93 4319.54 4557.46 4455.23 4356.95 3943.78
CORRIANDER India - Dollar/MT 2000.00 2000.00 2000.00 2000.00 2000.00 2000.00 2000.00 2000.00Rs./Qtl 12360.00 12350.00 12566.00 12658.00 12766.00 12702.00 12824.00 13212.00
CUMMIN SEED India - Dollar/MT 2250.00 2250.00 2250.00 2250.00 2250.00 2250.00 2250.00 2380.00Rs./Qtl 13905.00 13893.75 14136.75 14240.25 14361.75 14289.75 14427.00 15722.28
GINGER Split Nigeria - Dollar/MT 2250.00 2250.00 2250.00 2250.00 2250.00 2250.00 2250.00 2250.00Rs./Qtl 13905.00 13893.75 14136.75 14240.25 14361.75 14289.75 14427.00 14863.50
GROUNDNUT US 2005, 40/50 European - Dollar/MT 1350.00 1350.00 1350.00 1320.00 1250.00 1250.00 1270.00 1280.00kernels Ports Rs./Qtl 8343.00 8336.25 8482.05 8354.28 7978.75 7938.75 8143.24 8455.68
GROUNDNUT Crude Any Origin U.K. - Dollar/MT 1200.00 1200.00 1200.00 1200.00 1200.00 1200.00 1200.00 1200.00OIL cif Rotterdam Rs./Qtl 7416.00 7410.00 7539.60 7594.80 7659.60 7621.20 7694.40 7927.20MAIZE U.S.A. Chicago C/56 lbs 373.25 375.75 395.00 372.50 349.50 366.50 367.75 361.75
Rs./Qtl 906.53 911.86 975.34 926.52 876.73 914.76 926.70 939.16
OATS CANADA Winnipeg Dollar/MT 365.75 341.64 352.54 315.21 297.89 313.24 325.14 286.62Rs./Qtl 2260.34 2109.63 2215.01 1994.96 1901.43 1989.39 2084.80 1893.41
PALM KERNAL Crude Malaysia Netherlands - Dollar/MT 945.00 1070.00 980.00 990.00 945.00 880.00 850.00 650.00OIL /Indonesia, cif Rotterdam Rs./Qtl 5840.10 6607.25 6157.34 6265.71 6031.94 5588.88 5450.20 4293.90PALM OIL Crude Malaysian/Sumatra, - Dollar/MT 630.00 678.00 658.00 655.00 648.00 670.00 625.00 480.00
cif Rotterdam Netherlands Rs./Qtl 3893.40 4186.65 4134.21 4145.50 4136.18 4255.17 4007.50 3170.88
PEPPER (Black) Sarawak Black lable Malaysia - Dollar/MT 10000.00 11000.00 11000.00 11000.00 12000.00 12000.00 12000.00 11200.00Rs./Qtl 61800.00 67925.00 69113.00 69619.00 76596.00 76212.00 76944.00 73987.20
RAPESEED Canola CANADA Winnipeg Can Dollar/MT 449.80 458.50 460.60 445.10 468.90 511.90 493.30 469.70Rs./Qtl 2204.02 2264.53 2319.12 2318.97 2408.74 2636.29 2431.97 2333.00
UK delivered rapeseed, U.K. - Pound/MT 242.00 240.00 233.00 242.00 247.00 238.00 243.00 230.00delivered Erith(buyer) Rs./Qtl 2254.96 2285.04 2175.06 2305.29 2414.92 2380.00 2431.22 2352.21
RAPESEED OIL Refined bleached and U.K. - Pound/MT 577.00 586.00 601.00 587.00 607.00 639.00 611.00 565.00deodorised ex-tanks, Rs./Qtl 5376.49 5579.31 5610.34 5591.76 5934.64 6390.00 6113.06 5778.26broker price
SOYABEAN UK produced 49% oil U.K. - Pound/MT 334.00 319.00 317.00 306.00 294.00 280.00 278.00 273.00MEAL & protein ('hi-pro') Rs./Qtl 3112.21 3037.20 2959.20 2914.96 2874.44 2800.00 2781.39 2791.97
ex-mill seaforth UK bulk
SOYABEAN OIL U.S.A. - C/lbs 30.34 31.71 31.04 31.56 31.73 33.27 30.21 26.12Rs./Qtl 4132.53 4315.64 4298.34 4402.34 4463.82 4657.00 4269.29 3802.97
Refined bleached and U.K. - Pound/MT 756.00 611.00 593.00 558.00 595.00 590.00 564.00 539.00deodorised ex-tanks, Rs./Qtl 7044.41 5817.33 5535.66 5315.51 5817.32 5900.00 5642.82 5512.35broker price
SOYABEANS U.S.A. - C/60 lbs 970.25 1007.75 978.75 970.50 927.00 981.75 983.00 877.75Rs./Qtl 2200.59 2283.79 2256.86 2254.22 2171.55 2288.28 2313.20 2128.02
US NO.2 yellow Netherlands Chicago Dollar/MT 420.90 409.40 418.00 392.80 380.90 397.30 387.20 363.80Rs./Qtl 2601.16 2528.05 2626.29 2486.03 2431.28 2523.25 2482.73 2403.26
SUNFLOWER Refined bleached and U.K. - Pound/MT 664.00 656.00 665.00 672.00 715.00 694.00 686.00 700.00

September, 2015 59
SERVER3\E\AGRICULTURE 2015\2588AGRI (SEPT, 2015)-2
SEED OIL deodorised ex-tanks, Rs./Qtl 6187.15 6245.78 6207.78 6401.47 6990.56 6940.00 6863.43 7158.90broker price
TALLOW High grade delivered U.K. London Pound/MT 295.00 295.00 290.00 330.00 335.00 335.00 350.00 310.00Rs./Qtl 2748.81 2808.70 2707.15 3143.58 3275.30 3350.00 3501.75 3170.37
Wheat U.S.A. Chicago C/60 lbs 505.25 497.75 519.00 498.75 487.75 518.00 496.25 489.75Rs./Qtl 1145.94 1128.01 1196.74 1158.47 1142.58 1207.36 1167.78 1187.35
Source - Publice Ledger
Foreign Exchange Rates
Currency Jan. Feb. Mar. Apr. May Jun Jul. Aug.
Can Dollar 49.00 49.39 50.35 52.10 52.93 51.50 49.30 50.06
UK Pound 93.18 95.21 93.35 95.26 98.73 100.00 100.05 102.71
US Dollar 61.80 61.75 62.83 63.29 64.08 63.51 64.12 66.06
3. MONTH END WHOLESALE PRICES OF SOME IMPORTANT AGRICULTURAL COMMODITIES IN INTERNATIONAL MARKETS
DURING YEAR 2015-Contd...
Commodity Variety Country Centre Unit Jan. Feb. Mar. Apr. May June Jul Aug
1 2 3 4 5 6 7 8 9 10 11 12 13

CROP PRODUCTION4. SOWING AND HARVESTING OPERATIONS NORMALLY IN PROGRESS DURING THE MONTH OF OCTOBER, 2015
State Sowing Harvesting(1) (2) (3)
Andhra Pradesh Paddy, Jowar, Maize, Tobacco, Groundnut, Mesta and Paddy, Ragi, Groundnut, SeasmumLinseed. and Ginger.
Assam Paddy, Gram, Pulses, Potato and Linseed, Paddy and Mesta.Bihar Wheat, Barley, Gram, Rapeseed & Mustard, Linseed Paddy, Jowar, Bajra, Maize, Ragi and
and Potato Sesamum.Gujarat Paddy, Gram, Pulses and Potato. Paddy, Jowar, Groundnut, Bajra and
Cotton.Himachal Pradesh Wheat, Barley, Gram, Rapeseed & Mustard and Paddy, Bajra, Maize, Pulses, Potato
Linseed. and GroundnutJammu & Kashmir Wheat, Barley, Rapeseed & mustard and Onion. Paddy, Bajra, Maize, Small Millets
Pulses, Potato and Chillies.Karnataka Jowar, Potato, Tobacco, Linseed, Sweet Potato and Kharif, Jowar, Ragi, Small Millets,
Onion. Chillies and GroundnutKerala Paddy, Pulses and Sesamum Paddy, Sweet Potato and lemongrass.Madhya Pradesh Wheat, Barley, Gram, Jowar, Rabi Pulses, Potato, Paddy, Ragi, Kharif Pulses Potato,
Chillies, Rapeseed & Mustard and Onion. Ginger, Chillies and Groundnut.Maharashtra Wheat, Gram, Jowar, Barley and Pulses. Kharif Paddy, Jowar, Bajra, Maize,
Groundnut and Sesamum.Manipur Wheat Potato and Rapeseed & Mustard. Sugarcane and late Paddy.Orissa Wheat, Jowar, Gram, Rapeseed & Mustard and Linseed. Paddy, Kharif, Jowar and Sesamum.Punjab Wheat and Gram. Paddy, Cotton, Pulses and Early
Sugarcane.Rajasthan Wheat, Barley, Rapeseed & Mustard and Linseed. Jowar, Bajra, Maize, Cotton and
Sannhemp.Tamil Nadu Paddy, Jowar, Groundnut, Small Millets, Kharif Paddy, Jowar, Maize, Cotton,
Tapiocam Mesta and Ginger.Tripura Pulses and Potato. TilUttar Pradesh Wheat, Barley, Gram, Linseed and Rapeseed & Mustard Paddy, Jowar, Bajra, Sesamum and
Groundnut.West Bengal Wheat, Barley, Rapeseed & Mustard, Tobacco, Chillies, Paddy, Jute and Red Chillies.
Til, Potato and Pulses.Delhi Wheat, Barley and Pulses. Paddy Jowar, Bajra, Maize and
Sugarcane.
(K)—Kharif. (R)— Rabi
GMGIPMRND—2588AGRI(S3)—28.10.2015—450Copies.
60 Agricultural Situation in India

PRINTED BY THE MANAGER GOVERNMENT OF INDIA PRESS, MINTO ROAD, NEW DELHI-110002AND PUBLISHED BY THE CONTROLLER OF PUBLICATIONS, DELHI-110054-2015
Copies are available at:The Controller of Publications, Civil Lines, Delhi-110054
ISSN 0002-167Regn.No.:840
P. Agri. 21-09-2015450
List of other Publications of the Directorate
Periodicals
Agricultural Prices in India
Agricultural Statistics at a Glance
Agricultural Wages in India
Cost of Cultivation of Principal Crops in India
District-wise Area and Production of Principal Crops in India
Farm Harvest Prices of Principal Crops in India
Glimpses of Indian Agriculture
Land Use Statistics at a Glance
PRINTED BY THE MANAGER GOVERNMENT OF INDIA PRESS, MINTO ROAD, NEW DELHI-110002AND PUBLISHED BY THE CONTROLLER OF PUBLICATIONS, DELHI-110054-2015
Copies are available at:The Controller of Publications, Civil Lines, Delhi-110054
ISSN 0002-1679Regn.No.:840
P. Agri. 21-09-2015450
List of other Publications of the Directorate
Periodicals
Agricultural Prices in India
Agricultural Statistics at a Glance
Agricultural Wages in India
Cost of Cultivation of Principal Crops in India
District-wise Area and Production of Principal Crops in India
Farm Harvest Prices of Principal Crops in India
Glimpses of Indian Agriculture
Land Use Statistics at a Glance