agricultural situation in india
54
AGRICULTURAL SITUATION IN INDIA AGRICULTURAL SITUATION IN INDIA DECEMBER, 2020 Since 1948 AGRO - ECONOMIC RESEARCH Market Analysis of Bamboo Products in Assam COMMODITY REVIEWS Foodgrains Commercial Crops TRENDS IN AGRICULTURE Wages & Prices FARM SECTOR NEWS GENERAL SURVEY OF AGRICULTURE ARTICLES Dynamics of Castor Production and Instability in Major States of India Green Economics towards Rural Development: A Study of Ashwagandha Cultivation in Deccan Plateau
-
Upload
khangminh22 -
Category
Documents
-
view
0 -
download
0
Transcript of agricultural situation in india

ISSN 0002-1679
Regn.No.:840
Other Publications of
the Directorate AGRICULTURAL
SITUATION IN INDIA
AGRICULTURAL
SITUATION IN INDIA
DECEMBER, 2020
*Copies are available at:The Controller of Publications, Civil Lines, Delhi-110054
Agricultural Prices in India
Glimpses of Indian Agriculture
Agricultural Statistics at a Glance*
State of Indian Agriculture
Cost of Cultivation of Principal Crops in India
Farm Harvest Prices ofPrincipal Crops in India*
Land Use Statistics at a Glance*
Agricultural Wages in India
Since 1948
AGRO - ECONOMIC RESEARCH
Market Analysis ofBamboo Products in Assam
COMMODITY REVIEWSFoodgrainsCommercial Crops
TRENDS IN AGRICULTUREWages & Prices
P. Agri. 21-12-2020
450
FARM SECTOR NEWS
GENERAL SURVEY OF AGRICULTURE
ARTICLES
Dynamics of CastorProduction and Instability in MajorStates of India
Green Economics towards RuralDevelopment: A Study of AshwagandhaCultivation in Deccan Plateau
Rakm
o P
ress P
vt. L
td., G
reate
r N
oid
a, U
ttar
Pra
desh

AGRICULTURALSITUATION IN INDIA
Editorial BoardChairman
Dr. Srabani Guha
EditorMs. Promodita Satish
Asstt. Economic AdviserDr. Ramesh Kumar Yadav
Economic OfficerAnimesh Kumar
Officials Associated in Preparation of thePublication
D. K. Gaur — Sub-EditorS. K. Kaushal — Tech. Asstt. (Printing)
Uma Rani — Tech. Asstt. (Printing)Sanjay Raj — Tech. Asstt. (Economics)Anupama — Junior Statistical Officer
Sachin Mittal — Tech. Asstt.Manju Singh — Asstt. Graph
Shripal Singh — MTS
Cover Design By:Yogeshwari Tailor— Asstt. Graph
Publication Division
Directorate of Economicsand Statistics
Department of Agriculture,Cooperation & Farmers Welfare
Ministry of Agriculture & Farmers WelfareGovernment of India
102A, F-Wing, Shastri Bhawan,New Delhi-110 001
Phone: 23382769(Email: [email protected])
Soft copy of the journal is also available at: eands.dacnet.nic.in/publication.htm
Subscription Inland Foreign Single Copy : ` 40.00 £ 2.9 or $ 4.5 Annual : ` 400.00 £ 29 or $ 45
Available fromThe Controller of Publications,
Ministry of Urban Development,Deptt. of Publications,
Publications Complex (Behind Old Secretariat),Civil Lines, Delhi-110 054.
Phone : 23813761, 23813762, 23813764, 23813765(Email: [email protected])
© Articles Published in the Journal cannot be reproduced in any form without the permission of Economic and Statistical Adviser.For article submission see last page.
VOL. LXXVII December, 2020 No. 09
Contents Prices
Farm seCtor news 1
General survey oF aGriCulture 6
artiCles
Dynamics of Castor Production and Instability in major States of India – Gajavalli Saisri and Dhandhalya M. G.
8
Green Economics towards Rural Development: A Study of Ashwagandha Cultivation in Deccan Plateau - Pankaj Choudhary, Mudit Mishra, S.P.Singh, D.K. Verma, R.S. Sharma, R.K. Srivastava and Sanjay Kumar.
17
aGro-eConomiC researCh
Market Analysis of Bamboo Products in Assam - Dr. (Mrs) Moromi Gogoi - Agro-Economic Research Centre for North-East India, Assam Agricultural University, Jorhat.
24
Commodity reviews
Foodgrains 30
Commercial Crops 34
statistiCal tables
Wages
1. Daily Agricultural Wages in Some States- Category-wise.
37
1.1. Daily Agricultural Wages in Some States-Operation-wise.
38
Prices
2. Wholesale Prices of Certain Important Agricultural Commodities and Animal Husbandry Products at Selected Centres in India.
43
Crop produCtion
Sowing and Harvesting Operations Normally in Progress during January, 2021.
46

This issue of ‘Agricultural Situation in India’ gives an overview of current agricultural policy initiatives and schemes of the Government in the farm sector, recent agricultural scenario; two academic research articles, one on dynamics of castor production in major states of India; and second on green economics of ashwagandha cultivation in Deccan plateau and an agro-economic research study report on market analysis of bamboo products in Assam.
Important farm sector news shared in this issue are virtual meet on ‘Value Chain Creation for Kiwi Fruit- Farm to Fork’ organized by the Ministry of Agriculture and Farmers Welfare; interaction of representatives of farmer organizations from Punjab with the Union Ministers; release of interest sub-vented loan from Micro-Irrigation Fund (MIF); Sahakar Pragya unveiled by Union Minister of Agriculture and Farmers Welfare to impart training to primary cooperatives societies in rural areas; inauguration of Honey Farmer Producer Organizations and MSP operations during Kharif Marketing Season 2020-21.
So far as the agricultural scenario is concerned, the Wholesale Price Index (WPI) of pulses, vegetables and paddy increased by 15.93 percent, 25.23 percent and 0.61 percent, respectively, in October, 2020 as compared to that in October, 2019. The 2020 cumulative monsoon season rainfall in the country has been 5 percent lower than the long period average during 1st October, 2020 to 25th November, 2020. Current live storage in 128 major water reservoirs in the country was 139.35 BCM as against 117.53 BCM of normal storage based on the average storage of last 10 years.
In academic column’s first article, the authors analyzed the growth and instability in area, production and productivity of castor from 1976-77 to 2017-18 based on the secondary data collected from Directorate of Economics and Statistics, Ministry of Agriculture and Farmers Welfare. For this purpose, compound growth rates (CGRs) of area, production and productivity of castor in India as well as across major castor producing States were calculated using the exponential production function and agricultural instability was calculated using the coefficient of variation (CV), dispersion, Cuddy Della Valle Index (CDV), etc. The analysis reveals that Gujarat and Rajasthan experienced higher growth in area, production and productivity during the last four and half decades. This is mainly due to the release of hybrid castor varieties like GAUCH-1 in 1973 and GCH-2 in 1985. However, Andhra Pradesh, Karnataka and Odisha could not explore the benefits of hybrid/HYV technology. Further, instability in overall study period revealed that, medium instability was found in area and productivity while high instability was found in production. Rajasthan recorded the highest instability. Based on the findings, it has been suggested that Andhra Pradesh, Karnataka and Odisha may focus on further refinement of castor hybrid technology to increase castor cultivation. Since, the world
economy is facing the energy crisis and environmental degradation problems, the potential for bio-feed stock like castor oil could be a good source for eco-friendly fuel. This will also increase farm income.
In the second article, authors, Pankaj Choudhary, Mudit Mishra, S.P. Singh, D.K. Verma, R.S. Sharma, R.K Srivastava and Sanjay Kumar, examine the green economics of ashwagandha cultivation in Deccan plateau. The study is primarily based on socio-economic status and profile of resources used, costs and return behavior, input-output relationship and resource use efficiency. The authors’ analysis was based on primary data collected from study area. The findings of the study revealed that the Cost-Benefit ratio of ashwagandha crop cultivation was observed 1:3.08. The resource use efficiency of ashwagandha was also estimated using multiple linear regression method. The R2 value was found 0.967 and the yield of ashwagandha was statistically significant and influenced by all the independent variables except one or two variables like plant protection, etc. The degree of correlation between the yield of ashwagandha and inputs found that the yield of ashwagandha is highly correlated with all inputs used in cultivation of ashwagandha except to irrigation and plant protection. It may be due to the fact that cultivation of ashwagandha is basically in the rain-fed area. Authors suggest the need to address challenges like non-availability of the regulated market, lack of storage facilities and instability in the market price of the produce. Further, focus on encouraging contractual cultivation of ashwagandha cultivation in PPP (public private partnership) mode, establishing new processing units, scientific storage facilities, and arrangement of forward linkage may also be encouraged.
Agro-economic research section brings out a report on market analysis of bamboo products in Assam prepared by Agro-Economic Research Centre for North-East India, Assam Agricultural University, Jorhat. The prime objectives of the report inter-alia, include, study the potentialities of bamboo products in Assam; to study the National Bamboo Mission (NBM) programs in Assam; to find out the marketing channels and to identify the critical issues encountered by the producers in marketing of bamboo products and suggest ameliorative policy measures, etc. For this purpose, both primary and secondary data were collected from two sample districts, Jorhat and Sivasagar. Based on the findings of the study and field observations, the report, inter-alia, suggest promoting campaign to make the artisans educated and aware of various schemes & programmes launched by the Government; to modernize product-process and upgradation of techniques to meet the changing requirements of the customers; to exempt the bamboo products from excise duty and other taxes to promote its export; training the artisans and help them create bamboo-based industries; developing adequate infrastructure and positive environment to attract younger generations, etc.
From Editor’s Desk
Promodita Satish

Farm Sector NewS
December, 2020 | Agricultural Situation in India | 1
Agriculture Ministry organized a virtual meet on ‘Value Chain Creation for Kiwi Fruit – Farm to Fork’ to Strengthen Prime Minister’s vision of Atmanirbhar Bharat & Vocal for Local
The Ministry of Agriculture along with Central Institute of Horticulture, Nagaland, on 11th November, 2020, organized a virtual meeting on ‘Value Chain Creation for Kiwi fruit – Farm to Fork’ keeping in mind the popularity of the fruit due to its tremendous commercial potential. The meeting was chaired by the Union Minister of Agriculture and Farmers Welfare, Shri Narendra Singh Tomar in presence of Minister of State for Agriculture, Shri Parshottam Rupala, Secretary, Department of Agriculture and Farmers Welfare and other officials of the Ministry and State of Nagaland.
Addressing the gathering, the Union Minister of Agriculture and Farmers Welfare, Shri Narendra Singh Tomar said that the entire north east due to difficult terrain is lagging behind and all ministries including agriculture ministry are working towards ensuring a progressive north east. He said that this lag needs to be removed and can only be done through a comprehensive vision along with stable policy planning and balanced growth across the region as envisioned by Prime Minister Shri Narendra Modi.
Shri Tomar stated that the Himalayan sub-temperature climate is suitable for kiwi production and there is a need to introduce high yielding cultivars. With extensive research and development support, the commercial cultivation of kiwi fruit has been extended from the Sub-Himalayan regions of India to the mid hills of Himachal Pradesh, Sikkim, Meghalaya, Arunachal Pradesh, Nagaland and Nilgiri Hills. Presently, India is producing 13,000 MT of kiwi in an area of about 4,000 ha in Arunachal Pradesh, Nagaland, Mizoram and Himachal Pradesh.
India currently imports 4,000 tonnes of kiwis from New Zealand, Italy and Chile. Shri Tomar said that to strengthen Prime Minister Shri Narendra Modi’s vision and mission of creating an Atmanirbhar Bharat, the Ministry of Agriculture is trying to provide handholding support to kiwi farmers across the country. This is also in line
with the call of ‘Vocal for Local’ which will help in reducing dependence on imports and building a sustainable market for locally produced kiwi fruit variants.
The Union Agriculture Minister further said that the entire nation is witness that Prime Minister Shri Narendra Modi has focused on agriculture and allied sector right from the beginning and his leadership has guided all to look threadbare and in-depth into all aspects of agriculture especially the gaps which need to be filled in order to ensure that farmers can reap the benefits of their toil. He said that a new chapter is being introduced in the agricultural history of Nagaland which will be highly beneficial to the kiwi farmers of the State. He said that this programme of kiwi Production enhancement will prove to be a milestone in the years to come.
Shri Tomar also elaborated the problems faced by the farmers in the north-east region namely lack of good planting material, productivity issues, lack of packaging facilities and marketing networks for farmers. Considering the problems faced, he said that centre is working hand in hand with state governments and especially the Central Institute of Horticulture, Nagaland and the Department of Agriculture and Farmers Welfare has taken key steps to ensure proper training and capacity building of farmers in production as well as packaging of kiwi products is done. The government is also ensuring that farmers are connected to the market so that they can reap a fair price for their produce. The institute in Nagaland has also conducted training and exposure visit of farmers from Phek District of Nagaland for helping them understand how to reap good returns through kiwi production. Shri Tomar added that persistent efforts should be made by all to ensure Nagaland can emerge as the ‘Kiwi State’ of India.
Union Agriculture Minister and Minister of Railways, Consumer affairs, Food and Public Distribution interact with representatives of Farmers Organizations from Punjab in New Delhi
The Agriculture Minister Shri Narendra Singh Tomar, Minister of Railways Shri Piyush Goyal and Shri Som Prakash MoS Ministry of Commerce & Industries interacted with the representatives of
Farm Sector News*
*Source: www.pib.nic.in

Farm Sector NewS
2 | Agricultural Situation in India | December, 2020
farmers organizations of Punjab on 13th November, 2020 in Vigyan Bhavan, New Delhi.
At the outset, the Agriculture Minister cordially welcomed the representatives of farmers organizations of Punjab and briefed about the reforms made in the agriculture sector to empower the farmers. It was emphasized that agriculture is always on the top priority for Government of India to boost rural economy. He mentioned that the Government is taking several measures for the welfare of farmers with a specific focus on ‘Aatmnirbhar Bharat’. The new farm acts would not only provide freedom of choice to the farmers to sell their produce at remunerative price but also safeguard the interest of farmers.
During the interaction, the ministers also informed the representatives of farmer organizations that procurement of farm produce on MSP and the Mandi system will continue as before. The new farm act will encourage Mandis to provide better services to the farmers.
The representatives of the farmers’ unions expressed their views on new farm acts.The farmer’s representatives were also apprised with other initiatives taken by the Government such as Agriculture Infrastructure Fund and formation of 10,000 farmer producer organizations aiming towards income enhancement of farmers and creating employment opportunities for youth in rural areas.
During the interaction various issues related to farmer’s welfare were discussed at length. It was assured that the Government of India is always committed to protect the interest of farmers and is always open for discussions for the welfare of farmers. The talks were held in a cordial atmosphere and both sides agreed to continue to hold further discussions.
Release of Interest Sub-vented Loan from Micro-Irrigation Fund (MIF)
Micro Irrigation Fund with a corpus of ` 5000 crore created with NABARD was operationalised in 2019-20. The objective of the Fund is to facilitate the states in availing an interest subvented loan for expanding coverage of micro irrigation by taking up special and innovative projects and also for incentivising micro irrigation beyond the provisions available under
PMKSY-Per Drop More Crop to encourage farmers to install micro irrigation systems.
Steering Committee of MIF has approved projects for loan of ` 3971.31 crore comprising ` 764.13 crore for Gujarat, ` 1357.93 crore for Tamil Nadu, ` 616.13 crore for Andhra Pradesh, ` 276.55 crore for West Bengal, ` 790.94 crore for Haryana, ` 150.00 crore for Punjab and ` 15.63 crore for Uttarakhand.
NABARD released loan of ` 659.70 crore to Haryana, Tamil Nadu and Gujarat. Thereby a total amount of ` 1754.60 crore has been released so far, comprising ` 616.13 crore to Andhra Pradesh, ` 937.47 crore to Tamil Nadu, ` 21.57 crore to Haryana and ` 179.43 crore to Gujarat.
Shri Narendra Singh Tomar unveiled Sahakar Pragya
Union Minister of Agriculture and Farmers Welfare, Rural Development, Panchayati Raj and Food Processing Industries, Shri Narendra Singh Tomar, on 24th November, 2020, unveiled Sahakar Pragya. The 45 new training modules of Sahakar Pragya of the National Cooperative Development Corporation (NCDC) will impart training to primary cooperative societies in rural areas of the country along with Lakshmanrao Inamdar National Cooperative Research and Development Academy (LINAC). Sahakar Pragya embodies enhancing NCDC’s training capacity by eighteen fold through an elaborate network of 18 regional training centres across the country by the dedicated Laxmanrao Inamdar National Academy for Cooperative Research and Development (LINAC) set up and fully funded by NCDC.
On this occasion, Mr. Tomar called upon the cooperative sector to play a role in making the village-poor-farmers AtmaNirbhar. Shri Tomar said that today India boasts a huge network of over 8.50 lakh cooperative societies with about 290 million members and around 94% of the farmers in India are member of at least one cooperative society. He said that cooperatives have a major role in AtmaNirbhar Bharat and it lends strength to farmers to minimize risks in agriculture and allied sectors and act as shield against exploitation by unscrupulous traders.
Shri Tomar further added that there are more than 2.53 lakh gram panchayats in the country,

Farm Sector NewS
December, 2020 | Agricultural Situation in India | 3
through which the Government is working to ensure that every household has access to basic amenities like toilets, electricity, water, cooking gas, etc. He further said that there are 86 percent small farmers in the country, who cannot invest in farming on their own, the government is focusing on developing facilities like cold storage at village level for them, so that farmers are not forced to sell their produce at low prices.
Shri Tomar said that NCDC has emerged as a financial powerhouse giving the client cooperatives a wide range of products and services. So far it has advanced loans to the tunes of ` 1.58 lakh crores to cooperative societies of various categories across the country. Sahakar Pragya is the latest in the series of farmer focused steps by NCDC.
These 45 training modules of Sahakar Pragya to be delivered at LINAC and its countrywide network of regional training centres will address the need for training of primary cooperatives, FPO-cooperatives and self-help groups federating. The training programmes will be supported under NCDC schemes, 10000 FPO formation scheme of Government of India, Agri Infra Fund scheme of Government of India, PM-FME scheme of Ministry of Food Processing Industry, Dairy Infrastructure Development Fund scheme of Government of India, Fisheries Infrastructure Development Fund scheme of Government of India, PM Matsya Sampada Yojana of Government of India, Ministry of Rural Development schemes State/UT schemes, other organizations’ schemes.
NCDC has been created for the purpose of planning and promoting programmes for the production, processing, marketing, storage, export and import of agricultural produce, foodstuffs, industrial goods, livestock, certain other commodities and services like hospital & healthcare and education, etc., on cooperative principles. It extends financial assistance to cooperatives at all the three tiers, Primary, District and Apex/Multi-State.
Known for hand-holding cooperatives across the country with funding and project ideas, NCDC has been proactive in delivering innovative solutions for the cooperative sector. In the series of initiatives by NCDC had earlier launched the Sahakar Cooptube NCDC Channel with the aim to involve youth in the cooperative movement. Formation of new cooperatives is a prerequisite for bringing new
life and dedication in the realm of cooperative movement. NCDC’s guidance videos in different languages covering local requirements of 18 States on Sahakar Cooptube strengthens the major initiative of Government of India to promote and form 10,000 FPOs.
Working with the ideals mooted by Prime Minister Shri Narendra Modi for doubling the farmers’ income, Stand Up India and Skilling India, NCDC has earlier launched various initiatives and programmes like SAHAKAR-22 to develop cooperatives in Focus 222 districts, including aspirational districts, nurturing primary level cooperatives, SAHAKAR MITRA–scheme on internship programme, YUVA SAHAKAR-Start-up scheme in cooperatives and AYUSHMAN SAHAKAR- for creation of healthcare infrastructure and services.
Union Agriculture Minister inaugurated Honey Farmer Producer Organizations by NAFED
The Honey FPO Programme of National Agricultural Cooperative Marketing Federation of India Limited (NAFED) was inaugurated by Minister of Agriculture and Farmers Welfare Shri Narendra Singh Tomar on 26th November, 2020. The inauguration programme was hosted online and attended by the new Honey FPOs, farmers and FPOs from various parts of the country.
Inaugurating the programme, the Minister stated that “Beekeeping in India is highly predominant in the unorganized sector among the rural and tribal population. Despite having a huge potential of honey production in the country, the beekeeping industry is still underdeveloped. The adoption level of beekeeping is also quite less due to various constraints. NAFED will address these issues by acting as an intermediary and filling up the gaps between the elements of the beekeeping supply chain and also ensure price remuneration to the beekeeping farmers. Through these Honey FPOs, NAFED will also work for promotion of beekeeping as an occupation for unemployed women and tribal populations and uplift their livelihood”. Shri Tomar also said that honey beekeeping will change the lifestyle of small and marginal farmers and help in achieving the goal of increasing farmer’s income.
Government of India is promoting the creation of FPOs in view of their significant role in fulfilling

Farm Sector NewS
4 | Agricultural Situation in India | December, 2020
the mission of implementing agricultural reforms in the country. Promotion & formation of FPOs is the first step for converting Krishi into Atma Nirbhar Krishi. For this purpose new central sector scheme for formation & promotion of new 10,000 FPOs was launched.
Under the new FPO scheme, so far National Level Project Management Advisory and Fund Sanctioning Committee (N-PMAFSC) had allocated 2200 FPO clusters for 2020-21 to all implementing agencies (IAs). N-PMAFSC allocated 500 FPOs to SFAC, 600 FPOs to NABARD & 500 FPOs to NCDC, 100 FPOs to Watershed Development Department of Karnataka, 50 FPOs to SFAC-Haryana, 50 FPOs to Tamil Nadu SFAC, 50 FPOs to North Eastern Regional Agricultural Marketing Corporation Ltd (NERAMAC), 100 FPOs to NRLM Division of MoRD for the current FY (2020-21). Additionally, specialized FPOs to be formed, 100 Organic FPOs by INM, DAC&FW, 100 Oilseed FPOs by DAC&FW and 50 commodity specific FPOs by NAFED with value chain development.
Implementing agencies had also identified the block wise clusters. FPOs will be developed by specialist ’Cluster Based Business Organizations (CBBOs)’ engaged by implementing agencies. NAFED had already empanelled the CBBOs and other IAs is in the process of empanelment of CBBOs.
National Agricultural Cooperative Marketing Federation of India Limited (NAFED) has been appointed as the 4th National Implementing Agency other than SFAC, NABARD and NCDC for the creation of 10,000 FPOs by the Department of Agriculture, Cooperation & Farmers Welfare (DAC&FW). NAFED has recently taken over the national level Federation of Indian FPOs and Aggregators (FIFA) with the aim of creating sustainable small holder institutions to enhance collective capacities, shortening of agri produce value chains for equitable returns to all stakeholders and leveraging technology for enhanced transparency, scale and seamless agri produce trading. Creation of Honey FPOs is one of the thrust areas of FIFA’s business plan.
NAFED, through its empanelled Cluster Based Business Organisation (CBBO) Indian Society of Agribusiness Professionals (ISAP) has initiated the formation and promotion of FPOs of beekeepers and honey collectors in 5 states of India. The areas
covered under the programme are Sundarbans in West Bengal, East Champaran in Bihar, Mathura in Uttar Pradesh, Morena in Madhya Pradesh and Bharatpur in Rajasthan. The First Honey FPO, Chambal FED Shahad Utpadak Sahakari Samiti, in the state of Madhya Pradesh under National Beekeeping & Honey Mission was registered on 11.11.2020 under the Cooperatives Act. The FPO will cover 5 blocks consisting of about 68 villages in Morena District of the state. The other four FPOs in the state of Bihar, Rajasthan, Uttar Pradesh and West Bengal shall cover 340 villages in these states. Through these 5 FPOs, 4000–5000 beekeepers/honey collectors would be benefitted directly.
The Honey FPOs made by ISAP under the aegis of National Bee Board (NBB) and NAFED will help its members in not only upgrading their skills in scientific bee keeping but will also help in making its members set up state of the art infrastructural facilities for processing honey and allied beekeeping products like bee’s wax, propolis, royal jelly, bee venom, etc., quality control laboratories, collection, storage, bottling and marketing centres. These FPOs will benefit by the schemes of Mini Mission–1 and Mini Mission–2 of National Beekeeping and Honey Mission (NBHM) of National Bee Board. The beekeepers/honey collectors of all the 5 states would be helped in branding and collective marketing of their honey and other allied products of bee keeping through the marketing channels of NAFED. Efforts will also be made to explore the overseas market for improving the returns to the bee keepers and honey collectors.
MSP Operations during Kharif Marketing Season 2020-21
In the ongoing Kharif Marketing Season (KMS) 2020-21, Government continues to procure kharif 2020-21 crops at its MSP from farmers as per its existing MSP Schemes.
Paddy procurement for kharif 2020-21 is continuing smoothly in the procuring States & UTs of Punjab, Haryana, Uttar Pradesh, Telangana, Uttarakhand, Tamil Nadu, Chandigarh, Jammu & Kashmir, Kerala, Gujarat, Andhra Pradesh, Odisha and Maharashtra with purchase of over 316.93 LMTs of paddy up to 29.11.2020 against the last year corresponding purchase of 267.22 LMT showing an increase of 18.60 percent over last year. Out of the total purchase of 316.93 LMT, Punjab alone has

Farm Sector NewS
December, 2020 | Agricultural Situation in India | 5
contributed 202.74 LMT which is 63.97 % of total procurement.
Upto 29.11.2020, the Government through its nodal agencies has procured 100429.81 MT of moong, urad, groundnut pods and soyabean having MSP value of ` 540.92 crores benefitting 57956 farmers in Tamil Nadu, Maharashtra, Gujarat, Haryana and Rajasthan.
Similarly, 5089 MT of copra (the perennial crop) having MSP value of ` 52.40 crore has been procured benefitting 3961 farmers in Karnataka and Tamil Nadu upto 29.11.2020 as against the last year corresponding purchase of 293.34 MT of copra. In respect of copra and urad, rates are ruling above MSP in most of the major producing states. The respective State/UTs governments are making necessary arrangements for commencement of procurement from the date as decided by the respective states based on the arrivals in respect of kharif pulses and oilseeds.
Paddy Proc. during KMS 2020-21upto 29.11.20 and corresponding
Proc. during KMS 2019-20 (in LMT)316.93
267.22 Up by18.60%
KMS 2019-20 KMS 2020-21
About 29.53 lac farmers have already been benefitted from the ongoing KMS procurement Operations with MSP value of ` 59837.31 crore.
Further, based on the proposal from the states, approval was accorded for procurement of 45.24 LMT of pulse and oilseeds of Kharif Marketing Season 2020 for the States of Tamil Nadu, Karnataka, Maharashtra, Telangana, Gujarat, Haryana, Uttar Pradesh, Odisha, Rajasthan and Andhra Pradesh under Price Support Scheme (PSS). Further, sanction for procurement of 1.23 LMT of copra (the perennial crop) for the States of Andhra Pradesh, Karnataka, Tamil Nadu and Kerala was also given. For other States/UTs, approval will also be accorded on receipt of proposals for procurement of pulses, oilseeds and copra under PSS so that procurement of FAQ grade of these crops can be made at notified MSP for the year 2020-21 directly from the registered farmers, if the market rate goes below MSP during the notified harvesting period in the respective States/UTs by the central nodal agencies through state nominated procuring agencies.
Paddy MSP and Farmer Benefitted(Upto 29.11.20)
Major Paddy Procuring States in KMS2020-21
5983731
2953000
MSP VALUE(RS. IN LAKH)
NO. OF FARMERSBENEFITTED
18%64%
2%5%3%1%
7% Punjab
Haryana
UP
Tamil Nadu
Uttrakhand
Telangana
Others
Procurement operations of seed cotton (kapas) under MSP are going on smoothly in the States of Punjab, Haryana, Rajasthan Madhya Pradesh, Maharashtra, Gujarat, Telangana, Andhra Pradesh, Odisha and Karnataka. Till 29.11.2020 a quantity of 2816255 cotton bales valuing ` 8286.91 crore has been procured benefitting 565591 farmers.
Moong, Urad and Groundnut Pods andSoyabean (Upto 29.11.20)
Copra (Upto 29.11.20)
100429
54092 57956
PROC. QUAN.(IN MT)
MSP VALUE(RS. IN LAKH)
NO. OF FARMERSBENEFITTED
5089 5240
3961
Proc. Quan.(In MT)
MSP Value(Rs. in Lakh)
No. of FarmersBenefitted
Kapas (Upto 29.11.20)
ProcuredQuantity(In Bales)
MSP Value(Rs. in Lakh)
No. of FarmersBenefitted
2816255
828691565591

General Survey of aGriculture
6 | Agricultural Situation in India | December, 2020
Trends in Foodgrain Prices
Based on Wholesale Price Index (WPI) (2011-12=100), WPI in case of foodgrains decreased by 1.68 percent in October, 2020 over October, 2019.
Among foodgrains, WPI of pulses and vegetables increased by 15.93 percent and 25.23 percent, respectively and cereals and fruits decreased by 5.24 percent and 3.87 percent in October, 2020 over October, 2019.
Among cereals, WPI for paddy increased by 0.61 percent and WPI of wheat decreased by 8.10 percent in October, 2020 over October, 2019.
Similarly, WPI in case of foodgrains decreased by 0.13 percent in October, 2020 over September, 2020.
Among foodgrains, WPI of vegetables and pulses increased by 9.24 percent and 3.73 percent, WPI of cereals and fruits decreased by 1.02 percent and 1.00 percent in October, 2020 over September, 2020.
Among cereals, WPI for paddy and wheat decreased by 0.43 percent and 1.73 percent in October, 2020 over September, 2020.
Rainfall and Reservoir Situation, Water Storage in Major Reservoirs
Cumulative post-monsoon season, 2020 rainfall for the country as a whole during the period 1st October, 2020 to 25th November, 2020 has been 5% lower than the Long Period Average (LPA). Rainfall in the four broad geographical divisions of the country during the above period has been higher than LPA by 18% in Central India but lower than LPA by 52% in North-West India, by 8% in East & North East India and by 5% in South Peninsula.
Out of 36 meteorological sub-divisions, 09 meteorological sub-divisions received large excess/excess rainfall, 09 meteorological sub-divisions received normal rainfall and 18 meteorological sub-divisions received deficient/large deficient rainfall.
Current live storage in 128 reservoirs (as on 26th November, 2020) monitored by Central Water Commission having Total Live Capacity of 172.13 BCM was 139.35 BCM as against 149.00 BCM on 26.11.2019 (last year) and 117.53 BCM of normal storage (average storage of last 10 years). Current year’s storage is 94% of last year’s storage and 119% of the normal storage.
Rabi sowing as on 27.11.2020, 348.24 lakh ha area has been sown as compared to 334.78 lakh ha during 2019-20 during the same period.
General Survey of Agriculture
all india Crop situation - rabi (2020-21) as on 27-11-2020(Area in lakh hectares)
Crop Name Normal AreaArea sown Absolute
ChangeThis Year % of Normal Last Year
Wheat 303.28 151.58 50.0 150.49 1.09
Rice 41.78 8.18 19.6 8.84 -0.66
Jowar 33.40 18.19 54.5 18.69 -0.50
Maize 17.37 4.76 27.4 5.62 -0.86
Barley 6.38 4.06 63.7 4.23 -0.17
Total Coarse Cereals 57.14 27.39 47.9 28.91 -1.52
Total Cereals 402.20 187.15 46.5 188.24 -1.09

General Survey of aGriculture
December, 2020 | Agricultural Situation in India | 7
Crop Name Normal AreaArea sown Absolute
ChangeThis Year % of Normal Last Year
Gram 92.77 69.36 74.8 60.76 8.60
Lentil 14.24 11.47 80.6 10.31 1.16
Peas 8.74 7.70 88.1 6.30 1.40
Kulthi(Horse Gram) 2.14 2.91 136.2 3.18 -0.27
Urad 8.93 2.60 29.1 2.61 -0.01
Moong 9.86 0.63 6.4 0.78 -0.15
Lathyrus 3.98 2.14 53.8 1.74 0.40
Others 4.23 2.64 62.4 2.13 0.51
Total Pulses 144.88 99.45 68.6 87.80 11.65
Total Foodgrains 547.07 286.60 52.4 276.04 10.56
Rapeseed & Mustard 59.44 57.44 96.6 53.88 3.56
Groundnut 7.24 1.68 23.2 1.87 -0.19
Safflower 1.15 0.34 29.6 0.23 0.11
Sunflower 2.37 0.46 19.4 0.60 -0.14
Linseed 2.74 1.47 53.6 1.75 -0.28
Total Oilseeds (Nine) 72.94 61.64 84.5 58.73 2.91
All- Crops 620.01 348.24 56.2 334.78 13.46
Source: Crops & TMOP Divisions, DAC&FW
all india Crop situation - rabi (2020-21) as on 27-11-2020-Contd.(Area in lakh hectares)

Articles
8 | Agricultural Situation in India | December, 2020
1. Introduction
Castor (Ricinus communis L.) is also known as the “Palm of Christ” or “Palma Christi,” that derives from castor oil’s reputed ability to heal wounds and cure aliments. Probably native to Eastern Africa and India, this species has become naturalized throughout the tropical world. Castor plants are generally grown for oil yielding seeds. Castor oil has high usage value for biodegradable lubricants, bio-fuel and many other applications, with its emission of gases complying with international environmental standards.
In India during 1950s, castor was a crop of low value and was primarily grown in dry areas of Andhra Pradesh. But over the years, the center of castor production has shifted to Gujarat. Interestingly, at present most of the increase in total castor production contributed from Gujarat, where this crop has become a major cash crop in the farmers’ portfolio (Tewari, 2012). Gujarat alone contributes
about 85 percent of the total castor seed production in India today. Also, castor yields in Gujarat have remained the highest in the world, since 1970s, even more than twice of the world average (Tewari & Rao, 1991). India is the only country in the world, where hybrid technology was commercially exploited in castor with the release of first hybrid GCH-3 in 1969 from Gujarat. This was followed by a large number of high yielding hybrids with resistance to many biotic threats. High yielding/hybrid varieties coupled with crop production and protection technologies, led to many-folds increased production in India and virtually established India as the leading country in the world, capturing international market.
The area, production and productivity of castor in India have increased steadily from 7.17 lakh ha, 6.53 lakh tonnes and 911 kg/ha in 2001-02 to 8.26 lakh ha, 15.68 lakh tonnes and 1898 kg/ha in 2017-18, respectively. However, in spite of high increase in production of castor at the state and country level,
1Post graduate student of College of Agriculture, Junagadh Agricultural University, Junagadh-362001, Gujarat.2Associate Research Scientist, Department of Agricultural Economics, Junagadh Agricultural University, Junagadh-362001, Gujarat.
ArticlesDynamics of Castor Production and Instability in major States of India
gajavalli saisri1 and dhandhalya M. g.2
Abstract
The significance of the Indian castor crop in recent years has increased, as it brings sizeable amount of foreign exchange to the country. In the present study, the dynamics of castor production and instability has been analyzed for different periods ranging from 1976-77 to 2017-18. India achieved high growth rate in area, production and yield of castor during 1986-87 to 1995-96 at the remarkable rate of 3.89, 15.42 and 11.10 percent per annum, respectively, mainly due to the notable performance of Gujarat and Rajasthan. The major reason behind this performance was the release of hybrid castor varieties like GAUCH-1 in 1973 and GCH-2 in 1985. Besides, the release of castor varieties, viz., GCH-6 in 2000 and GCH-7 in 2006 in Gujarat contributed largely in recent production of castor. It is found that during overall study period (1976-77 to 2017-18) at all India level also the growth rate of area, production and yield increased considerably. Moreover, Andhra Pradesh recorded significant growth in production and productivity of castor, but its area declined significantly in recent period. While, Karnataka and Odisha had witnessed deterioration in growth rates both in area and production. Rajasthan recorded the highest instability of 56.90 percent in area, 74.21 percent in production and 33.24 percent in yield during the study period. It is suggested that instability observed in various states during the study period needs to be reduced and yield should be improved by developing wilt resistant, short duration, location specific high yielding varieties of castor. The existence of wide variation in castor yield across growing states due to differences in climatic conditions, infrastructural developments and utilization patterns need to be focused for further improvement in yields.
Keywords: Castor, growth, instability, area, production, productivity.

Articles
December, 2020 | Agricultural Situation in India | 9
there exists wide variation in castor yield across castor-growing states due to differences in climatic conditions, infrastructural developments and input utilization patterns. These variations underline the importance of studying the growth performance and instability in castor production at the state as well as at country level. Therefore, the present study was undertaken to analyse the growth and instability in castor area, production and productivity from 1976-77 to 2017-18.
2. Methodology
The present study is based on the secondary data collected from Directorate of Economics and Statistics, Ministry of Agriculture and Farmers Welfare. The time series data on area, production and productivity of castor for five major castor growing states was collected for a period from 1976- 77 to 2017-18. The analysis of growth and instability in area, production and productivity were carried out from year 1976-77 to 2017-18, which further, split into five periods, viz., Period-I (1976-77 to 1985-86), Period-II (1986-87 to 1995-96), Period-III (1996-97 to 2005-06) and Period-IV (2006-07 to 2017-18), and overall Period-V (1976-77 to 2017-18).
Compound growth rate
The compound growth rates (CGRs) of area, production and productivity of castor in India as well as across the major castor producing states were calculated using the exponential function of the following specification,
Yt = abt ………………………….. (1)
In the log form, the above function (1) was formulated as,
log Yt = log a + t log b …………….................. (2)
Where,
Yt = Area/production/productivity of castor in the year ‘t’;
t = Time variable in years taking the value of 1, 2, 3, ...n;
a = Intercept;
b = Regression coefficient (1+r); and
r = Compound growth rate.
The value of log b in equation (2) was computed using the formula,
Where,
N = Number of years.
Subsequently, the compound growth rate (%) was computed using the formulation,
Compound growth rate (r) = [(Antilog of log b)-1]*100 ............ (4)
Student ‘t’ test was used to determine the significance of the growth rates obtained for which, the following formulation was employed,
t = log b/SE (log b) ………………….. (5)
The calculated ‘t’ values, from equation (6), was compared with the table ‘t’ values and the significance was tested for 1, 5 and 10 percent probability levels.
Instability indices
In order to study variability in export trade of castor, the instability index was used as a measure of variability. The coefficient of variation (CV) was calculated by using the following formula:
— CV(%) = S/ X *100………………(7)
The trend coefficient was tested for its significance. Whenever, the trend coefficient was found to be significant, the variation around the trend rather than variation around mean was used as an index of instability. The formula suggested by Cuddy and Della (1978) was used to compute the degree of variation around the trend.
Where,
Ix = Instability index;
CV = Coefficient of variation;–R2 = Adjusted coefficient of multiple determination;

Articles
10 | Agricultural Situation in India | December, 2020
—X = Mean value;
S = Standard Deviation.
3. Results and Discussion
3.1. Area, production and productivity of castor
India ranks first in the world in terms of castor production with an annual production of about 15.68 lakh tonnes in 2017-18. Area under castor cultivation is also maximum in India among all castor producing countries. The major castor producing states are Andhra Pradesh, Gujarat, Karnataka, Odisha, Rajasthan and Tamil Nadu (Table 1). During last four decades, Gujarat registered the highest area under
castor and highest production and productivity. In the beginning of 1970s the area under castor in Gujarat was just 63 thousand ha which increased to around 7 lakh ha in 2010s. Besides, production and productivity also increased remarkably during last five decades. Rajasthan also witnessed same trends, but Andhra Pradesh, Karnataka, Odisha and Tamil Nadu did not observe such trend. Though, Andhra Pradesh had the highest area (3.06 lakh) under castor in India during triennium ending 1972-73 it declined to around 0.8 lakh ha during triennium ending 2017-18. However, yield increased considerably in Andhra Pradesh. Figure 1 clearly shows that Gujarat had largely contributed in castor production in India, followed by Rajasthan during last four decades.
TABLE 1: area, produCtion and yield oF Castor in major states oF india
(Area ‘000’ ha, production ‘000’ tonnes & yield kg/ha)
State Particular Average TE 1972-73
Average TE 1982-83
Average TE 1992-93
Average TE 2002-03
Average TE 2012-13
Average TE 2017-18
Andhra Pradesh & Telangana
Area 306 277 308 269 217 79Production 55 50 82 100 93 45Yield 179 182 266 373 427 570
GujaratArea 63 194 354 396 706 614Production 54 232 563 558 1427 1341Yield 865 1191 1593 1410 2021 2184
KarnatakaArea 32 25 24 23 15 8.3Production 18 16 20 24 12 4.7Yield 563 643 829 1022 804 560
OdishaArea 25 43 28 17 13 8.1Production 19 24 15 7.6 8.4 5.1Yield 751 545 544 453 630 624
RajasthanArea 2.0 5.1 18 64 221 159Production 0.8 1.3 17 45 321 209Yield 393 250 991 693 1451 1319
Tamil NaduArea 9.3 15 27 24 5.9 4.1Production 3.9 4.6 8.2 7.5 1.8 1.4Yield 419 309 308 310 310 342
All IndiaArea 439 545 727 793 1195 898Production 145 287 639 653 1870 1565Yield 330 526 878 824 1565 1744
Source: Directorate of Economics and Statistics, 2019.

Articles
December, 2020 | Agricultural Situation in India | 11
3.2. Growth performance of castor in major producing states
Table 2 revealed that Andhra Pradesh recorded the highest significant growth rate in Period III in production (12.09%) and productivity (7.06%). But in Period IV, Andhra Pradesh witnessed significant negative growth rates in both area (-9.52%) and production (-8.79%). In overall study period, Andhra Pradesh recorded significant increase in growth rate of production and productivity of castor, but its area under castor crop has significantly declined.
Gujarat has positive and significant growth rates in area, production, in all the periods (Table 2), except in period III, where it showed negative but non-significant growth rates in area, production and productivity. Gujarat achieved the highest significant growth rates in castor area (13.30%), production (22.61%) and productivity (8.22%) in Period II. This is mainly due to the release of hybrid castor varieties like GAUCH-1 in 1973 and GCH-2 in 1985. Besides, the release of castor varieties, viz., GCH-6 in 2000 and GCH-7 in 2006 in Gujarat contributed significantly in increasing area, production and productivity of castor in recent decades.
Rajasthan showed the highest significant growth rates in area (24.68%) and production (46.62%) in Period II among all the major castor growing states in India as indicated in figure 2. Also, in overall
study period Rajasthan registered significantly high growth rate in area (11.91%), production (17.72%) and productivity (5.19%). Rajasthan benefited largely by growing the high yielding varieties of Gujarat. This result is similar to that of Mundinamani (1993) which showed that in Karnataka during post-green revolution period, the increase in output of oilseeds in the study area was due to expansion of area, rather than increment in yield.
During the Period III from 1996-97 to 2005-06 there was severe drought condition in most parts of India including Gujarat and Rajasthan during 1999-2000, 2000-01 and 2002-03. Castor being long duration crop required multiple irrigations after withdrawal of monsoon.
Tamil Nadu recorded the highest growth rates in Period II in area (6.07%) and production (5.76%) compared to all other periods of study, while, in Period III, Tamil Nadu showed drastic reduction in growth rates in area (-14.59%) and production (-14.36%). In overall study period also, Tamil Nadu showed significant decrease in growth rates of area (-3.22%), production (-3.38%) and yield (-0.31%).
Besides, uneven distribution of rainfall also affected sowing operations and caused reduction in yield. Solanki et al. (2007) reported similar results stated that castor area and production was unstable during 1985-86 to 2003-04 in Rajasthan. Besides,
Figure 1: Decadal Shift in Castor Production in major States of India
Source: Based on DES (2019) data.
5
Odisha Area 25 43 28 17 13 8.1
Production 19 24 15 7.6 8.4 5.1
Yield 751 545 544 453 630 624
Rajasthan Area 2.0 5.1 18 64 221 159
Production 0.8 1.3 17 45 321 209
Yield 393 250 991 693 1451 1319
Tamil
Nadu
Area 9.3 15 27 24 5.9 4.1
Production 3.9 4.6 8.2 7.5 1.8 1.4
Yield 419 309 308 310 310 342
All India Area 439 545 727 793 1195 898
Production 145 287 639 653 1870 1565
Yield 330 526 878 824 1565 1744
Source: Directorate of Economics and Statistics, 2019.
Figure 1: Decadal Shift in Castor Production in major States of India
Source: Based on DES (2019) data.
3.2. Growth performance of castor in major producing states
Table 2 revealed that Andhra Pradesh recorded the highest significant growth rate in Period III in
production (12.09%) and productivity (7.06%). But in Period IV, Andhra Pradesh witnessed significant
negative growth rates in both area (-9.52%) and production (-8.79%). In overall study period, Andhra
Pradesh recorded significant increase in growth rate of production and productivity of castor, but its area
under castor crop has significantly declined.
0
500
1000
1500
2000
AndhraPradesh +Telangana
Gujarat Karnataka Odisha Rajasthan Tamil Nadu All India
(in '000'tonnes)
Av. TE 1972-73 Av. TE 1982-83 Av. TE 1992-93
Av. TE 2002-03 Av. TE 2012-13 Av. TE 2017-18

Articles
12 | Agricultural Situation in India | December, 2020
Sonnad et al. (2011) also found that growth rates of area, production and productivity of major oilseed crops in the post-WTO period was less compared to pre-WTO period in India.
In the overall period, i.e., Period V, among all castor growing states in India, positive and significant growth rates of castor area, production and productivity were recorded only in Gujarat
and Rajasthan. The growth rates in area, production and productivity were 4.29%, 6.14% and 1.77%, respectively, in Gujarat while, the same in Rajasthan were 11.91%, 17.72%, 5.19%, respectively. At all India level, positive and significant growth rates in area (1.85%), production (5.44%) and productivity (3.52%) were found during the study period. During the overall study period, a significant increase in productivity of castor is found in Andhra Pradesh,
TABLE 2: period-wise Growth rates oF area, produCtion and produCtivity oF Castor in major states oF india
State Particular
Period 1(1976-77 to
1985-86)
Period II(1986-87 to
1995-96)
Period III(1996-97 to
2005-06)
Period IV (2006-07 to
2017-18)
Period V(1976-77 to
2017-18)
CGR (%)
SE CGR (%)
SE CGR (%)
SE CGR (%)
SE CGR (%)
SE
Andhra Pradesh & Telangana
Area 2.48 0.166 -2.13 0.121 4.69 0.214 -9.52** 0.327 -2.09*** 0.334
Production 5.73** 0.244 3.05 0.184 12.09*** 0.286 -8.79** 0.379 1.11** 0.402
Yield 3.17 0.265 5.29*** 0.103 7.06*** 0.136 0.79 0.325 3.27*** 0.231
Gujarat
Area 13.22*** 0.070 13.30*** 0.369 -2.16 0.162 6.58** 0.252 4.29*** 0.210
Production 11.71*** 0.202 22.61*** 0.429 -3.68 0.273 7.64** 0.252 6.14*** 0.382
Yield -1.33 0.161 8.22*** 0.223 -1.56 0.185 0.97*** 0.029 1.77*** 0.186
Karnataka
Area 0.54 0.095 -3.26*** 0.052 -2.08 0.190 -9.76*** 0.118 -2.30*** 0.222
Production 6.60* 0.263 -4.93** 0.172 -3.25 0.298 -12.80*** 0.228 -1.91** 0.440
Yield 6.03** 0.205 -1.72 0.148 -1.20 0.201 -3.51** 0.162 0.39 0.264
Odisha
Area 4.77** 0.156 -3.30*** 0.063 -7.27*** 0.138 -8.65*** 0.162 -3.73*** 0.215
Production 7.19*** 0.187 -3.63** 0.114 -1.79 0.173 -8.65*** 0.182 -3.19*** 0.264
Yield 2.30* 0.121 -0.33 0.073 5.91** 0.207 0.21 0.016 0.58*** 0.163
Rajasthan
Area 20.69*** 0.296 24.68*** 0.596 9.04 0.485 5.92 0.312 11.91*** 0.480
Production 14.83** 0.437 46.62** 0.992 9.14** 0.456 7.22 0.420 17.72*** 0.708
Yield -4.85 0.290 17.60* 0.532 0.09 0.502 1.22 0.197 5.19*** 0.470
Tamil Nadu
Area 4.22 0.206 6.07*** 0.158 -14.59*** 0.297 -3.72 0.269 -3.22** 0.621
Production 0.43 0.216 5.76*** 0.161 -14.36*** 0.323 -2.08 0.169 -3.38*** 0.583
Yield -3.63*** 0.010 -0.30** 0.010 0.27 0.095 -0.01 0.012 -0.31*** 0.086
All India
Area 5.50*** 0.094 3.89*** 0.117 0.84 0.176 2.49 0.233 1.85*** 0.170
Production 9.38*** 0.175 15.42*** 0.262 -1.07 0.246 6.06** 0.253 5.44*** 0.278
Yield 3.67* 0.177 11.10*** 0.164 -1.90 0.189 3.49*** 0.036 3.52*** 0.188
Source: Author’s calculation from DES (2019) data.note: *, **and *** indicates significance at 10, 5 and 1 percent levels, respectively.

Articles
December, 2020 | Agricultural Situation in India | 13
Odisha, Gujarat and Rajasthan. Whereas, Karnataka and Odisha had witnessed significantly negative growth rates in both area and production. Odisha recorded significantly positive growth rate only in productivity (0.58%). Tamil Nadu had significantly negative growth rates in area (-3.22%), production (-3.38%) and productivity (-0.31%).
Improved technologies coupled with favourable weather and low insect-pest pressure in major castor growing tracts has enabled this transformation in production and productivity. Similar results were obtained by Kachroo et al. (2010) reported that in India castor and coconut oilseeds were the only oilseeds which were showing positive growth trends during past four decades.
3.3. Instability in castor area, production and productivity
The agricultural instability can be measured by different methods, such as the coefficient of variation (CV), dispersion, Cuddy Della Valle Index (CDV), etc. The present study applies the CDV Index and CV for measuring the instability. The present study divides the CDV values into three categories, which represent a range of instability (Sihmar, 2014). The
ranges of instability are as follows:
Low instability = between 0 to 15
Medium instability = between 15 to 30
High instability = greater than 30
During Period I, castor area in Gujarat (9.16%), Karnataka (9.35%), Odisha (13.62%) and at all India level (8.61%) had shown low instability (Table 3). Whereas, Andhra Pradesh (15.76%) and Tamil Nadu (22.71%) showed medium instability in castor area. During Period I, Rajasthan had recorded high instability in area (48.73%) and highest instability in production (57.87%) and productivity (30.74%). All other states under study and India as a whole showed medium instability in production and productivity in Period I.
During Period II, very low instability in castor area was recorded in Karnataka (5.18%) and Odisha (5.99%). Medium instability in area was recorded in Andhra Pradesh (13.04%), Gujarat (20.22%), Tamil Nadu (12.5%) and at all India level (10.89%). Rajasthan also showed high instability in area (47.71) during Period II. In production of castor Andhra Pradesh (17.14%), Gujarat (20.97%),
Figure 2: Period-wise Growth Rates of Castor Production in major States of India (CGR %)
Source: Based on DES (2019) data.
8
Figure 2: Period-wise Growth Rates of Castor Production in major States of India (CGR %)
Source: Based on DES (2019) data.
During the Period III from 1996-97 to 2005-06 there was severe drought condition in most parts of
India including Gujarat and Rajasthan during 1999-2000, 2000-01 and 2002-03. Castor being long duration
crop required multiple irrigations after withdrawal of monsoon.
Tamil Nadu recorded the highest growth rates in Period II in area (6.07%) and production (5.76%)
compared to all other periods of study, while, in Period III, Tamil Nadu showed drastic reduction in growth
rates in area (-14.59%) and production (-14.36%). In overall study period also, Tamil Nadu showed
significant decrease in growth rates of area (-3.22%), production (-3.38%) and yield (-0.31%).
Besides, uneven distribution of rainfall also affected sowing operations and caused reduction in
yield. Solanki et al. (2007) reported similar results stated that castor area and production was unstable during
1985-86 to 2003-04 in Rajasthan. Besides, Sonnad et al. (2011) also found that growth rates of area, production
and productivity of major oilseed crops in the post-WTO period was less compared to pre-WTO period in
India.
In the overall period, i.e., Period V, among all castor growing states in India, positive and significant
growth rates of castor area, production and productivity were recorded only in Gujarat and Rajasthan. The
growth rates in area, production and productivity were4.29%, 6.14% and1.77% , respectively, in Gujarat
while, the same in Rajasthan were 11.91%, 17.72%, 5.19%, respectively. At all India level, positive and
significant growth rates in area (1.85%), production (5.44%) and productivity (3.52%) were found during the
study period. During the overall study period, a significant increase in productivity of castor is found in
Andhra Pradesh, Odisha, Gujarat and Rajasthan. Whereas, Karnataka and Odisha had witnessed
significantly negative growth rates in both area and production. Odisha recorded significantly positive
-20
-10
0
10
20
30
40
50
Andhra Pradesh + Telangana Gujarat KarnatakaOdisha Rajasthan Tamil NaduAll India

Articles
14 | Agricultural Situation in India | December, 2020
Karnataka (16.26%), Odisha (11.74%), Tamil Nadu (13%) and all India (17.71%) showed medium instability. The highest instability in production was seen in Rajasthan (74.01%). During Period II highest instability in productivity was also seen in Rajasthan (44.16%). Whereas, Odisha and Tamil Nadu revealed low instability in productivity during Period II.
During Period-III, production of castor in Gujarat and Odisha shown medium instability.
Whereas, Andhra Pradesh, Karnataka, Rajasthan and Tamil Nadu experienced high instability. Odisha and Rajasthan showed high instability in case of production too. Rajasthan and Andhra Pradesh during Period IV showed high instability in production. While, during the same period low instability was recorded in productivity in Gujarat (3.01%), Odisha (1.58%), Tamil Nadu (1.2%) and at all India level (3.47%).
TABLE 3: instability analysis oF Castor area, produCtion and produCtivity in major states oF india
State Particular
Period I(1976-77 to
1985-86)
Period II(1986-87 to
1995-96)
Period III(1996-97 to
2005-06)
Period IV(2006-07 to
2017-18)
Period V(1976-77 to
2017-18)
CV (%)
CDV (%)
CV (%)
CDV (%)
CV (%)
CDV (%)
CV (%)
CDV (%)
CV (%)
CDV (%)
Andhra Pradesh & Telangana
Area 16.16 15.76^ 13.04 13.04^ 24.52 22.23^ 39.42 29.53 31.74 25.84
Production 26.26 21.38 17.97 17.14^ 40.80 27.56 44.96 37.97 41.25 38.94
Yield 22.67 22.44^ 17.73 10.05 24.12 13.44 24.28 25.38^ 45.65 24.50
Gujarat
Area 37.38 9.16 36.08 20.22 16.73 16.40^ 31.24 25.86 54.90 29.35
Production 41.04 25.25 49.08 20.97 22.85 21.41^ 32.62 25.34 71.25 35.74
Yield 14.64 15.17^ 24.33 15.72 16.45 16.74^ 4.55 3.01 24.59 14.18
Karnataka
Area 8.94 9.35^ 11.31 5.18 18.84 18.96^ 36.12 11.02 28.50 16.35
Production 25.47 21.17 21.21 16.26 30.56 30.91^ 46.78 20.25 39.96 37.42
Yield 22.49 17.35 14.77 14.84^ 19.50 20.17^ 20.11 16.89 26.11 26.08^
Odisha
Area 17.71 13.62 11.70 5.99 24.70 11.24 29.74 8.29 45.37 19.03
Production 24.52 16.96 15.33 11.74 16.42 16.32^ 29.70 9.74 45.33 26.37
Yield 12.25 10.87 7.343 7.70^ 31.75 26.40 1.671 1.58^ 17.66 16.24
Rajasthan
Area 73.78 48.73 67.98 47.71 51.45 47.24^ 35.32 32.76^ 109.61 56.90
Production 70.68 57.87 92.40 74.01 51.16 40.16 42.50 39.78^ 129.22 74.21
Yield 32.76 30.74^ 52.10 44.16 36.34 38.50^ 15.26 15.59^ 56.87 33.24
Tamil Nadu
Area 24.66 22.71^ 19.96 12.53 43.68 22.95 21.17 19.95^ 63.38 59.11
Production 19.44 20.56^ 19.55 13.00 46.50 29.41 15.55 15.02^ 62.09 56.97
Yield 14.95 10.06 1.34 1.04 9.87 10.45^ 1.15 1.20^ 10.18 9.38
All India
Area 18.00 8.61 14.95 10.89 18.15 19.06^ 24.88 24.82^ 29.62 19.65
Production 32.87 19.85 39.37 17.71 19.62 20.69^ 30.21 25.67 66.15 32.03
Yield 19.09 16.92 29.97 11.59 17.73 17.67^ 12.62 3.473 42.65 15.82
Source: Author’s calculation from DES (2019) data.note: CV- Coefficient of Variation (%), CDV- Cuddy Della Valle Index (%), ^- Non- significant.

Articles
December, 2020 | Agricultural Situation in India | 15
During Period V (the overall period), high instability in area was seen in Rajasthan (56.9%) and Tamil Nadu (59.11%) Figure 3. High instability in production of castor was recorded in Andhra Pradesh (38.94%), Gujarat (35.74%), Karnataka
(37.42%), Rajasthan (74.21%), Tamil Nadu (56.97%) and all India (32.03%). Except Odisha (26.37%), all other states under study showed high instability in production.
Figure 3: Instability of Castor Area, Production and Yield in major States of India during 1976-77 to 2017-18 (CDV%)
Source: Based on DES (2019) data.
11
During Period V (the overall period), high instability in area was seen in Rajasthan (56.9%) and
Tamil Nadu (59.11%) Figure3. High instability in production of castor was recorded in Andhra Pradesh
(38.94%), Gujarat (35.74%), Karnataka (37.42%), Rajasthan (74.21%), Tamil Nadu (56.97%) and all India
(32.03%). Except Odisha (26.37%), all other states under study showed high instability in production.
Figure 3: Instability of Castor Area, Production and Yield in major states of India during
1976-77 to 2017-18 (CDV%)
Source: Based on DES (2019) data.
Instability in productivity was least in Tamil Nadu (9.38%) and highest in Rajasthan (33.24%), in
overall period under study. Thus, the Rajasthan indicated higher instability in case of area, production and
productivity in all periods under study. This might be due to the fact that Rajasthan has short monsoon
period and less availability of irrigation facilities. These results are in line with findings of Mahendradev
(1987).
4. Conclusion and Suggestions
The analysis of the growth rate in castor area, production and productivity revealed that Gujarat and
Rajasthan experienced higher growth in area, production and productivity during the last four and half
decades. The remarkable growth rate in Gujarat and Rajasthan resulted in remarkable increase in the growth
rate of castor area, production and yield at the rate of 3.89, 15.42 and 11.10 percent per annum, respectively,
at all India level during 1986-87 to 1995-96. This is mainly due to the release of hybrid castor varieties like
GAUCH-1 in 1973 and GCH-2 in 1985. At all India level also, the growth rate of area, production and yield
01020304050607080
AndhraPradesh +Telangana
Gujarat Karnataka Odisha Rajasthan Tamil Nadu All India
Area Production Yield
Instability in productivity was least in Tamil Nadu (9.38%) and highest in Rajasthan (33.24%), in overall period under study. Thus, the Rajasthan indicated higher instability in case of area, production and productivity in all periods under study. This might be due to the fact that Rajasthan has short monsoon period and less availability of irrigation facilities. These results are in line with findings of Mahendradev (1987).
4. Conclusion and Suggestions
The analysis of the growth rate in castor area, production and productivity revealed that Gujarat and Rajasthan experienced higher growth in area, production and productivity during the last four and half decades. The remarkable growth rate in Gujarat and Rajasthan resulted in remarkable increase in the growth rate of castor area, production and yield at the rate of 3.89, 15.42 and 11.10 percent per annum, respectively, at all India level during 1986-87 to 1995-96. This is mainly due to the release of hybrid castor varieties like GAUCH-1 in 1973 and GCH-2 in 1985. At all India level also, the growth rate of area, production and yield increased notably at the rate
of 1.85%, 5.4% and 3.52% per annum, respectively, during last four decades. However, Andhra Pradesh, Karnataka and Odisha could not explore the benefits of hybrid/HYV technology.
In India, instability in overall study period revealed that, medium instability was found in area and productivity and high instability was found in production. Rajasthan recorded the highest instability of 56.90 percent in area, 74.21 percent in production during the study period and the highest instability in productivity in 1986-87 to 1995-96. Besides, the higher production instability was observed in all the states during all the period under study.
Based on research done, following suggestions may be given:
i. Andhra Pradesh, Karnataka and Odisha may focus on further refinement of castor hybrid technology to increase castor cultivation.
ii. Instability needs to be reduced and yield may be improved by developing wilt resistant, short duration, location specific, high yielding

Articles
16 | Agricultural Situation in India | December, 2020
varieties of castor.
iii. Presently, the world economy is facing the energy crisis and environmental degradation problems. The potential for bio-feed stock like castor oil could be a good source for eco-friendly fuel, which may also increase farm income.
Reference
Cuddy, J. D. A. & Della, V. P. A. (1978). Measuring the instability of time series data. Oxford Bulletin of Economics and Statistics, 40(1), pp. 79-85.
DES, (2019). Directorate of Economics and Statistics. Ministry of Agriculture and Farmers Welfare, Government of India. Data rretrieved from website: www.eands.dacnet.nic.in (accessed on 20 April, 2019).
Kachroo, J., Kachroo, D. & Sharma, A. (2010). Growth and instability of major oilseeds of India based on Logistic and Coppock’s model. Agricultural Situation in India, 16(10), pp. 589-600.
Mahendradev, S. (1987). Growth and instability in food grains production: An inter-state analysis. Economic and Political Weekly, 22(39), pp. 82-85.
Mundinamani, S. M. (1993). Production and marketing performance of oilseeds in Karnataka: An econometric analysis. An unpublished Ph. D. Thesis, submitted to University of Agricultural Sciences, Dharwad.
Sihmar, R. (2014). Growth and instability in agricultural production in Haryana: A district level analysis. International Journal of Scientific and Research Publications, 4(7), pp. 1-12.
Solanki, S. S., Singh, I. & Rao, D. S. (2007). Growth analysis of production technology in castor. Journal of Oilseeds Research, 24(2), pp. 295-298.
Sonnad, J. S., Raveendran, N., Ajjan, N. & Selvaraj, K. N.(2011). Growth analysis of oilseeds crops in India during pre and post WTO periods. Karnataka Journal of Agricultural Sciences, 24(2), pp. 184-187.
Tewari, D. D. (2012). A historical policy review of success of castor revolution in Gujarat, India.
J Hum Ecol, 38(3), pp.213-222.
Tewari, D. D. & Rao, V. M. (1991). Castor economy: A profile and analysis of Indian and International market . New Delhi : Oxford and IBH, Publication.

Articles
December, 2020 | Agricultural Situation in India | 17
1. Introduction
Ashwagandha (Withania somnifera) is an important medicinal plant that has been used in Ayurvedic and indigenous medicine from the ancient time. Ashwagandha is also known as Indian ginseng, and as Indian Winter Cherry, the roots of which have been employed in Indian traditional systems of medicine, Ayurveda and Unani.(Umadevi et al., 2012).
Ashwagandha was first mentioned by sage Punarvasu Atreya over 4000 years ago. Subsequently the medicinal properties of this plant were mentioned in Ayurvedic treatises such as Charaka Samhita, Sushruta Samhita, Astanga Hridaya, Bhava Prakasha Nighantu, etc., to mention a few. Currently around 200 traditional medicinal formulas are prepared in Ayurveda, Siddha and Unani systems using this plant. All the plant parts are credited with medicinal properties (Rao et al., 2012). Ashwagandha is cultivated in different parts of country. It is drought tolerant annual, hence is cultivated under rainfed
condition in marginal soils by small and marginal farmers of Madhya Pradesh, Rajasthan, Andhra Pradesh, Karnataka and other states of India.
The cost of cultivation and high price for the roots is attracting farmers for large scale cultivation (Rao et al.,). It grows in dry parts in sub-tropical regions like Rajasthan, Madhya Pradesh, Haryana, Gujarat, Maharashtra and Uttar Pradesh states of the country (Directorate of Medicinal and Aromatic Plants Research). The demand of Ashwahgandha roots has increased in domestic market from last decade and in recent years, the demand for ashwagandha alkaloids has also increased in the international as well as the US market for the Neutraceuticals. One and half decade before it was mostly collected from forest area to meet out the domestic requirements of Ayurveda industry. The cultivation of Ashwagandha was started in late 90s and in the beginning of the 21st century. CSIR-Central Institute of Medicinal and Aromatic Plants (CIMAP) in Deccan plateau introduced the Ashwagandha cultivation one decade before through its Research
Green Economics towards Rural Development: A Study of Ashwagandha Cultivation in Deccan Plateau
Pankaj choudhary1, Mudit Mishra2, s.P. singh 3, deePak k. verMa4, r. s. sharMa5, r k srivastava6 and sanjay kuMar7
Abstract
Ashwagandha is an important medicinal plant used in the traditional system of medicine from ancient time. Central Institute of Medicinal and Aromatic Plants (Council of Scientific & Industrial Research) (CSIR-CIMAP) introduced and promoted the Ashwagandha cultivation on large-scale through bio-village mission mode approach in semi-arid tropics of Deccan Plateau. The present study was conducted in Kurnool and Anantapur districts of Andhra Pradesh. The study is based on primary data. The primary information was obtained from 100 farmers through pre-structured interview schedule in order to estimate the socio-economic status of farmers and their resource use structure. About one third of cost of cultivation was accorded to harvesting (31.70%) followed by cost incurred in intercultural operations (19.46%). The Benefit Cost ratio of Ashwagandha crop cultivation was observed as 3.08:1. The resource use efficiency of Ashwagandha crop was also calculated by using multiple linear regression method. R2 value was found to be very high. The yield of Ashwagandha was positively and significantly influenced by all the independent variables except the plant protection. The correlation between the yield and input use in Ashwagandha shows that cultivation of Ashwagandha is highly correlated with all the variables except irrigation and plant protection due to cultivation in the rainfed area.
Keywords: Socio-economic, Costs and Returns, Cobb–Douglas production function, Correlation and regression, Resource use efficiency.
1 &2 Project Assistants, 3 Research Associate, 4 Technical Assistant, 5 & 6 Senior Scientist, 7 Principal Scientist at CSIR- Central Institute of Medicnal and Aromatic Plants (CIMAP), P.O. CIMAP, Lucknow-226015.

Articles
18 | Agricultural Situation in India | December, 2020
Centre situated at Hyderabad.
The two high-yielding varieties of Ashwagandha namely Poshita and NIMTLI-118 were introduced for cultivation at farmer’s field in Kurnool and Anantpur districts of Andhra Pradesh. Later it spread in to other adjoining districts of Andhra Pradesh and Telangana. Kurnool and Anantapur districts lie in arid and semi-arid regions of Andhra Pradesh. At present, this crop is being cultivated by 6000 farmers on an area of about 4000 hectares in Deccan plateau. The buyers from Neemuch (Madhya Pradesh) and other parts of the country are purchasing the Ashwagandha roots from farmers through local traders and directly from farmers group.
1.1. Objectives
i) To study the socio-economic status and profile of resources used by Ashwagandha growers.
ii) To es t imate the costs and returns of Ashwagandha cultivation
iii) To determine the inputs-output relationship and resource use efficiency
2. Research Methodology
The present study was carried out in Kurnool and Anantapur districts of Andhra Pradesh. The study is based on primary data; collected with regard to the objectives formulated for the research work. Researchers deployed a pre-structured interview schedule. From selected districts, three villages namely Kottala, Belagallu and Lingampally were selected purposively on the basis that CSIR-CIMAP introduced Ashwagandha cultivation in these villages. A pooled list of all Ashwagandha growers was prepared for all three selected villages and thus, the numbers of 100 Ashwagandha growers were selected through Probability Proportionate Method. The data were tabulated, analyzed and interpreted in the light of the objectives by employing statistical tools. The analytical tools of data discussed in the following sections.
i. Descriptive analysis
To meet the first objective, descriptive analysis was applied to the study the socio-economic status of Ashwagandha growers and profile of their farm with respect to average landholding
size, occupation, caste, and family size, literacy rate, cropping pattern and farm assets. The simple summation, percentage and average of the values were calculated and have been presented in tabular form for better understanding.
ii. Casts and returns analysis
The cost and returns for Ashwagandha cult ivation was worked out based on Commission for Agricultural Costs and Prices (CACP) cost concept by using following various cost such as cost A1, A2, B1, B2, C1, C2 and C3.
Cost A1: It is usually considered as the cost for landowner farmer’s and generally it includes the following items as wages of hired human labours
i. Imputed value of owned machinery
ii. Charges of hired machinery
iii. Imputed value of owned seeds
iv. Market value of seed
v. Imputed value of owned manures
vi. Market value of manures and fertilizers
vii. Market value of plant protection chemicals
viii. Irrigation charges
ix. Interest on working capital
x. Depreciation charges on farm building, machinery, implements, etc.
xi. Land revenue
xii. Miscellaneous charges
Cost A2: The cost A2 is defined for tenant farmer. Mathematically cost A2 can be expressed as
Cost A2 = Cost A1 + Rent paid for leased land
Cost B1= A2 + interest on amount of owned capital invested in cultivation of Ashwagandha excluding the value of land
Cost B2 = Cost B1 + rental value of owned land- (land revenue +rent paid for leased in land)
Cost C1 = Cost B1 + imputed value of family labour

Articles
December, 2020 | Agricultural Situation in India | 19
Cost C2 =Cost B2 + imputed value of family labour
Cost C3 = Cost C2 +10% Cost of C2 as a managerial service
Cost C3 – Value of by productCost of production = —————————————— Yield
iii. Cobb-Douglas production function
The resource-use efficiency of the inputs used by the Ashwagandha growers was estimated using Cobb-Douglas production function in following form
Y= aX1b1X2
b2X3b3X4
b4X6b6X7
b7X8b8X9
b9X10b10Ut …….1
Where, Y is dependent variable (Roots and Seeds yield of Ashwagandha), a is constant term and b1, b2,.......,b10 are the regression co-efficient of Y with respective explanatory variables X1, X2,.......... X10, respectively and Ut is error term.
iv. Regression and correlation analysis
To determine the inputs-output relationship, the multiple linear regression model was used as
Y= b0+ b1X1 + b2X2+,...,+ b10X10 +U
Where,
Y = dependent variable
bi = constant term
Xi = explanatory variables
U = error term
The Pearson’s correlation coefficient is used to measure the degree or strength of the association between crop yield and inputs application.
3. Result and Discussion
The Socio-economic status of Ashwagandha growers and profile of resource used is presented in Table1. The average size of land holding was found to be 3.43 hectare. The income of Ashwagandha cultivated farmers absolutely depend on agriculture and majority of growers were reported, the agriculture as main source of income and livelihood security. The
maximum numbers of Ashwagandha growers were belonged to the schedules caste (51.52%) followed by Other Backward Class (41.41%) and tribal farmers (7.07%). The average family comprises of five family members, which may be considered as a small family. The literacy rate among the Ashwagandha growers was quite high at 84.94%, which indicated that year of schooling of grower’s positive influence the adoption of Ashwagandha cultivation as a medicinal crop. In the study area maximum numbers of (57.49%) were cultivating Ashwagandha as medicinal crop followed by traditional crops (42.51%) like cotton, castor, etc. The sampled farmers in the region had average assets of ` 1, 52,015.
TABLE 1: soCio–eConomiC status oF Farmers and proFile oF resourCe use
Particulars Value
Average size of landholding (hectare)
3.43
Main occupation Agriculture
Category (%)
OBC 41.41
SC 51.52
ST 7.07
Average family size (number of family members)
5.00
Literacy rate (%) 84.94
Cropping pattern (%)
Traditional crops (cotton, castor, etc.)
42.51
Medicinal crop’s (Ashwagandha)
57.49
Average farm assets (farm building, machinery and equipment (`)
1,52,015
Source: Primary data collected from farmer’s field survey
As evident, from table 2 on overall basis, the average total cost of Ashwagandha cultivation is ` 28,747/ha. Among the variable costs, the highest cost is being constituted by harvesting charges (34.26%) followed by intercultural operations (21.19%), land preparation (13.09%), processing and packaging (10.16%) and remaining 21.03 % cost shared by manure & fertilizers, planting material and seed sowing charge and miscellaneous charges. Moreover, Ashwagandha cultivation requires comparatively low irrigation and little threat against

Articles
20 | Agricultural Situation in India | December, 2020
infestation of insect-pest and diseases. It is revealed that only 0.28 % cost incurred in irrigation and plant protection.
The earlier study conducted by (Rao BRR et al.)6
on Ashwagandha cultivation and results revealed that the crop produces 400-1200 kg/ha dried roots and 200-500 kg seeds/ha. The growers sell good quality roots at the price of ` 100-150/kg and seeds at ` 40-100/kg. The cost of cultivation works out to ` 15,000-25,000/ha. The net profit ranges from ` 25,000-1,55,000/ha. The growers also earned the additional by selling seeds and leaves.
TABLE 2: Cost oF ashwaGandha Cultivation (` /ha)
Particulars Amount(`)
Percentage share
Land preparation 3764 13.09
Planting material 1677 5.83
Seed sowing 142 0.49
Manure & fertilizers 2368 8.24
Irrigation 50 0.17
Intercultural operations
6093 21.19
Plant protection 24 0.08
Harvesting 9849 34.26
Processing & packaging
2921 10.16
Miscellaneous charges (including transportation, etc.)
1861 6.47
Total variable cost 28749 100
Cost of depreciation of farm building, machinery and small implements (10%)
15202 -
Interest on working capital @ 7%
2012 -
Cost A1 45963 -Source: Primary data collected from farmer’s field survey
The results of yield (roots and seeds) and profitability of Ashwagandha cultivation is depicted in table 3. The average yield of Ashwagandha roots
obtained by growers was 6.91 quintal/ha. and seeds 201.80 kg./ha. By conducting the market survey, the average market price per quintal of dried roots was observed ` 14,165 and seed ` 96/kg. The net return over total variable cost was found ` 88,436 and benefit-cost ratio found to be 3.08:1. It is revealed that the profitability of Ashwagandha cultivation is almost three times the investment. It implies, growers investing ` 100 rupees in Ashwagandha cultivation and will earn profit ` 308 within 6-7 months.
TABLE 3: yield and proFitability oF ashwaGandha Cultivation
Particular Amount (`)
Main cropyield (roots)
Quantity(Quintal/ha.)
6.91
Average price(`/quintal)
14,165
Seed yieldQuantity (kg./ha) 201.8
Average price(`/kg)
96
Gross return (`/ha) 1,17,185
Total variable cost (`/ha) 28,749
Net return over the total variable cost (`/ha)
88,436
Benefit-cost ratio 3.08:1Source: Primary data collected from farmer’s field survey
Table 4 presents various costs (costs concepts given by CACP). The perusal of the table suggests that cost A1, which includes costs of 12 different items (as elaborated in ‘research methodology section’), found to be ` 45,963/ha. Cost B1 was estimated to be ` 48,795. Cost C1, which includes cost B1 and imputed value of family labour, was found to be ` 49,355 and Cost C3 was found to be ` 68,041. Another fact revealed that the per quintal cost of Ashwagandha production was ` 7, 042. The net returns over cost A1 was found highest ` 71, 222/ha; followed by net returns over cost B1, (` 68390/ha), C1, (` 67830/ha) B2, (` 55890) C2 (` 68390/ha) and C3 (` 49144/ha).
Table 5 revealed that explanatory variable included in the production function explained 96.7 percent variation in Ashwagandha yield. Regression coefficient of land preparation was positive and significant (P<0.05). It implies that the growers increase of one percent investment

Articles
December, 2020 | Agricultural Situation in India | 21
TABLE 4: Costs and returns oF Cultivation based on CaCp Cost ConCept (`/ha)
Costs Amount(`/ha)
Net returns over costsA1, A2, B1, B2, C1, C2 & C3 (`/ha)
A1 45,963 71,222
Rent paid for leased in- land 0 -
A2 45,963 71,222
Interest on fixed capital @ 7% per annum 2,832 -
B1 48,795 68,390
Rental value of land 12,500 -
B2 61,295 55,890
Imputed value of family labour 560 -
C1 (Cost B1 + Imputed value of family labour) 49,355 67,830
C2 (Cost B2 + Imputed value of family labour) 61,855 55,330
C3 (Cost C2 + 10% managerial cost of cost C2) 68,041 49,144
Value of seed produced 19,378 -
Yield (Quintal) 6.91 -
Cost of Production (`/per quintal) 7,042 -
Source: Primary data collected from farmer’s field survey
Figure 1: Costs and Returns of Ashwagandha Cultivation based on CACP Cost Concept
8
over cost A1 was found highest Rs.71, 222/ha; followed by net returns over cost B1, (Rs.
68390/ha), C1, (Rs. 67830/ha) B2, (Rs. 55890) C2 (Rs. 68390/ha) and C3 (Rs. 49144/ha).
Table 4: Costs and returns of cultivation based on CACP cost concept (Rs./ha)
Costs Amount (Rs./ha)
Net returns over costs A1,A2,B1,B2,C1,C2 &C3 (Rs./ha)
A1 45,963 71,222 Rent paid for leased in- land 0 - A2 45,963 71,222 Interest on fixed capital @ 7% per annum 2,832 - B1 48,795 68,390 Rental value of land 12,500 - B2 61,295 55,890 Imputed value of family labour 560 - C1 (Cost B1 + Imputed value of family labour) 49,355 67,830 C2 (Cost B2 + Imputed value of family labour) 61,855 55,330 C3 (Cost C2 + 10% managerial cost of cost C2) 68,041 49,144 Value of seed produced 19,378 - Yield (Quintal) 6.91 - Cost of Production (Rs./per quintal) 7,042 -
Source: Primary data collected from farmer’s field survey
Figure1: Costs and returns of Ashwagandha cultivation based on CACP cost concept
Table 5 revealed that explanatory variable included in the production function
explained 96.7 per cent variation in Ashwagandha yield. Regression coefficient of land
0
10000
20000
30000
40000
50000
60000
70000
80000
A1 A2 B1 B2 C1 C2 C3
Costs (Rs./ha)A1,A2,B1,B2,C1,C2 &C3
Net return (Rs./ha) over costsA1,A2,B1,B2,C1,C2 &C3
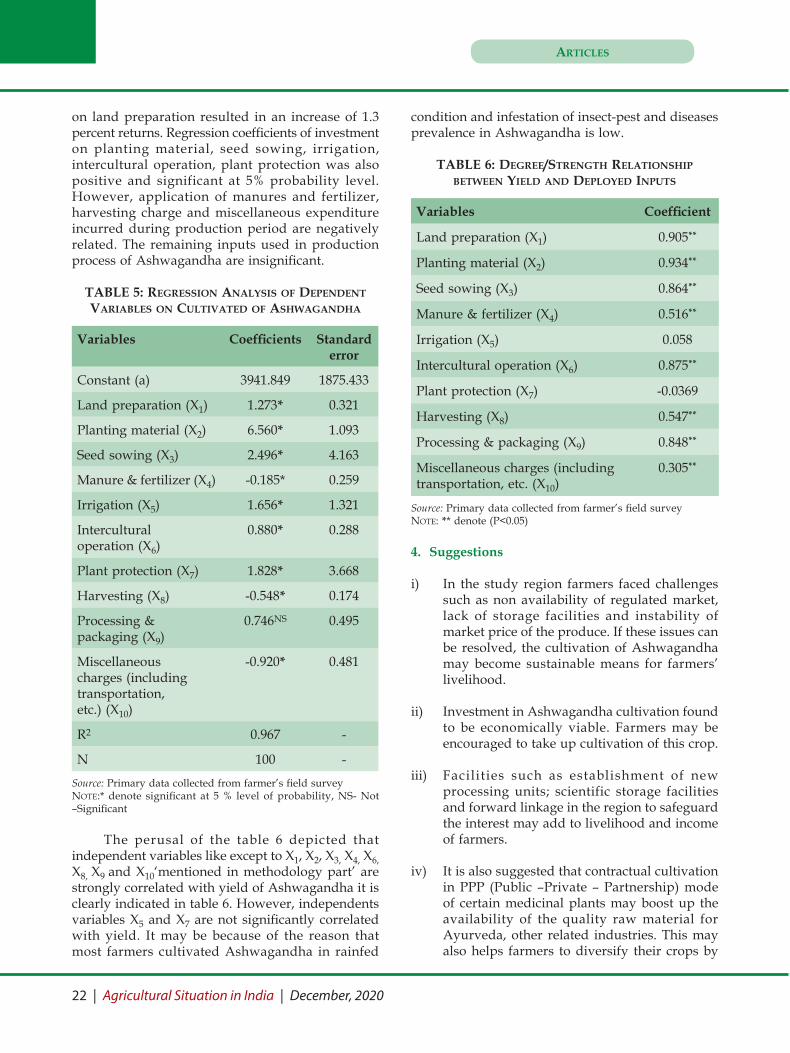
Articles
22 | Agricultural Situation in India | December, 2020
on land preparation resulted in an increase of 1.3 percent returns. Regression coefficients of investment on planting material, seed sowing, irrigation, intercultural operation, plant protection was also positive and significant at 5% probability level. However, application of manures and fertilizer, harvesting charge and miscellaneous expenditure incurred during production period are negatively related. The remaining inputs used in production process of Ashwagandha are insignificant.
TABLE 5: reGression analysis oF dependent variables on Cultivated oF ashwaGandha
Variables Coefficients Standard error
Constant (a) 3941.849 1875.433
Land preparation (X1) 1.273* 0.321
Planting material (X2) 6.560* 1.093
Seed sowing (X3) 2.496* 4.163
Manure & fertilizer (X4) -0.185* 0.259
Irrigation (X5) 1.656* 1.321
Intercultural operation (X6)
0.880* 0.288
Plant protection (X7) 1.828* 3.668
Harvesting (X8) -0.548* 0.174
Processing & packaging (X9)
0.746NS 0.495
Miscellaneous charges (including transportation, etc.) (X10)
-0.920* 0.481
R2 0.967 -
N 100 -
Source: Primary data collected from farmer’s field surveynote:* denote significant at 5 % level of probability, NS- Not –Significant
The perusal of the table 6 depicted that independent variables like except to X1, X2, X3, X4, X6, X8, X9 and X10‘mentioned in methodology part’ are strongly correlated with yield of Ashwagandha it is clearly indicated in table 6. However, independents variables X5 and X7 are not significantly correlated with yield. It may be because of the reason that most farmers cultivated Ashwagandha in rainfed
condition and infestation of insect-pest and diseases prevalence in Ashwagandha is low.
TABLE 6: deGree/strenGth relationship between yield and deployed inputs
Variables Coefficient
Land preparation (X1) 0.905**
Planting material (X2) 0.934**
Seed sowing (X3) 0.864**
Manure & fertilizer (X4) 0.516**
Irrigation (X5) 0.058
Intercultural operation (X6) 0.875**
Plant protection (X7) -0.0369
Harvesting (X8) 0.547**
Processing & packaging (X9) 0.848**
Miscellaneous charges (including transportation, etc. (X10)
0.305**
Source: Primary data collected from farmer’s field surveynote: ** denote (P<0.05)
4. Suggestions
i) In the study region farmers faced challenges such as non availability of regulated market, lack of storage facilities and instability of market price of the produce. If these issues can be resolved, the cultivation of Ashwagandha may become sustainable means for farmers’ livelihood.
ii) Investment in Ashwagandha cultivation found to be economically viable. Farmers may be encouraged to take up cultivation of this crop.
iii) Facilities such as establishment of new processing units; scientific storage facilities and forward linkage in the region to safeguard the interest may add to livelihood and income of farmers.
iv) It is also suggested that contractual cultivation in PPP (Public –Private – Partnership) mode of certain medicinal plants may boost up the availability of the quality raw material for Ayurveda, other related industries. This may also helps farmers to diversify their crops by

Articles
December, 2020 | Agricultural Situation in India | 23
introduction of medicinal plants in the country.
5. Conclusions
It can be concluded from present study that cultivation of Ashwagandha is a profitable venture for the farmers of the study area. The profit earned by farmers from Ashwagandha cultivation is much higher than traditional crop varieties. The cultivation may also open up new avenue for agri-entrepreneurship by promoting the processing of Ashwagandha roots in to powder and extraction of chemical alkaloids for export market. The cultivation of Ashwagandha also promotes conservation of natural resources, as it can be easily cultivated in rain-fed condition with limited use of plant protection chemicals.
References
Chopra RN, Nayar SL and Chopra IC (1980). Glossary of Indian Medicinal Plants. Council of Scientific & Industrial Research, New Delhi, 191-258.
Dey KL and Bahadur R (1973). Indigenous Drugs
of India. Prime Lane, Chronica Botanica, New Delhi, 670.
Dymock W, Warden CJH and Hooper D (1976). Pharmacographia Indica. Vol. II, M/s Bishen Singh Mahendra Pal Singh, Dehradun & M/s Periodical Experts, New Delhi, 566-572.
Kirtikar KR and Basu B (1980) D. Indian Medicinal Plants. 2nd ed. Vol. III, Lalit Mohan Basu, Allahabad, India, 1774-1777.
Nadkarni, A.K. (1954) Indian Materia Medica. 3rd Ed., Vol. 1, Popular Book Depot, Bombay, l292–1294.
Rajeshwara Rao B R, Rajput D K, Nagaraju G and Adinarayana G. (2012) Journal of Pharmacognosy, Vol. 3.( 2), 88-91.
Singh S and Kumar S (1998) Withania Somnifera: The Indian Ginseng Ashwagandha, pp.293.
Singh S, SPS Khanuja, Aparbal Singh, Man Singh and U B Singh (2003) Journal of Spices and Aromatic Crops, Vol. 12 (2), 101-103.

Agro-Economic rEsEArch
24 | Agricultural Situation in India | December, 2020
1. Introduction
Bamboo is one of the most important forestry species with wide distribution throughout the country. It makes significant contribution to the rural economy in many of the states of the country. It has been an important source of income for millions of rural people for sustaining their livelihood. This miracle grass has been a major source of livelihood for the poor people for centuries, for which bamboo was always referred to as a poor man’s timber. But, gradually it is becoming the rich man’s timber as well, and the global bamboo market value has touched $68.80 billion in 2018 and is expected to grow at a CAGR of 5.0% from 2019 to 2025 (Bamboos Market Size & Share, Global Industry Report, 2019-25). There exist ample opportunities to exploit the market potential by increasing its production and ensuring establishment of proper value chain system. Assam with 2.23 million hectares of bamboo plantations in North East India, can certainly open up new vistas for the country.
1.1. Importance of the study
The importance of bamboo products in Assam’s economy is very vital and its contribution is increasing steadily day by day. Today, bamboo sector is considered as the second biggest employment-creating sector after agriculture with abundant artisans engaged in craft work on a part-time basis. Bamboo occupies a predominant position in the state’s handicraft industry and a sizable section of the population is associated with it. The potential of bamboo handicrafts has not been properly tapped; for instance, ongoing export of some of bamboo products to other countries and its marketing within the country has not received adequate attention. Role of intermediaries in this section has a debilitating effect on the industry. Technological progress is also inadequate because of structural and financial constraints. Thus, the future of this industry largely depends on the resolution of all those vexed issues.
This study is a modest attempt to examine the various socio-economic problems of bamboo handicraft industry in Assam and to suggest strategies for its sustainable development. It is expected that such an intensive study might help in formulation of programs and policies for development of bamboo craftsman of the state.
1.2. Objectives of the study
Keeping in view the importance of the subject, the objectives of the present study has been framed as under:
i. To study the potentialities of bamboo products in Assam
ii. To study the National Bamboo Mission (NBM) programs in Assam
iii. To find out the marketing channels of bamboo products in the sample districts
iv. To identify the critical issues encountered by the producers in marketing of bamboo products and suggest ameliorative policy measures
2. Data and Methodology
The present study is based on both primary and secondary level data. The primary data have been collected from the respondents by using specially designed interview schedules and questionnaires for the study. The study was conducted in two districts of Assam, viz., Jorhat and Sivasagar considering the highest number of artisans commercially involved in bamboo products marketing in consultation with the office of the Commissioner of Handloom and Handicraft, Guwahati. Accordingly, the artisans’ lists were collected from the Development Commissioner (Handicraft) office, Jorhat.
In the second stage, from each selected
Agro-Economic ResearchMarket Analysis of Bamboo Products in Assam*
dr. (Mrs) MoroMi gogoi
*Agro-Economic Research Centre for North-East India, Assam Agricultural University, Jorhat (Assam)note: Detailed report is available on the website of respective Agro-Economic Research Centres

Agro-Economic rEsEArch
December, 2020 | Agricultural Situation in India | 25
district, two blocks were selected randomly. Then from each selected block, 40 numbers of bamboo artisans involved in bamboo products marketing were interviewed to collect the primary level information. Moreover, 10 numbers of bamboo products wholesalers from each district were also taken to better know the marketing aspects of the bamboo products. Thus, total 160 numbers of sample artisans and 20 bamboo products wholesaler were covered under the study. For collecting secondary level information, the relevant data were collected from the Department of Commerce and Industry, Government of India and Government of Assam, Department of Natural Resource Management, Government of India, National Bamboo Mission Cell, Economic Survey(s) of Assam, Statistical Handbook, Government of Assam and from various published and unpublished sources, research journals, news articles, research articles, etc., and related websites.
The sample artisans have been classified in to four groups based on their annual turnover from the bamboo products marketing. The groups were categorized as below ` 1 lakh, ` 1 lakh – 2 lakh, ` 2 lakh to 3 lakh and ` 3 lakh and above income group.
3. Summary of Major Finding of the Study
i. Bamboo is one of the most abundant, environment-friendly and sustainable resource in North Eastern Region (NER). More than 50% of the bamboo species in India are found in this region. The NER states harbour nearly 90 species of bamboos, of which 41 are endemic to thisregion.
ii. Total bamboo area in Assam is about 2.23 million hectares as against India’s total area of 15.70 million hectares. Out of 130 bamboo species available in India, 51 species are grown in Assam and they are being used for different purposes, mainly for buildings, furniture and diverseitems.
iii. The importance of bamboo in the NER has been widely recognized by the Government of India through numerous policies and programs. The central government through the National Bamboo Mission (NBM) scheme, is focusing on the development of the complete value chain of bamboo sector. For this purpose the Government of India releasing fund under
NBM and Restructured NBM scheme annually since the inception of the scheme (2006-07).
iv. It was observed that the highest percentage of respondents (32.50%) was found in ` 1-2 lakh income groups followed by below ` 1 lakh (28.12%), ` 3 lakh & above (24.38%) and ` 2-3 lakh income group (15.00%).
v. Of the total sample respondents, 43.13 percent were found to live in Kutcha houses, 38.74 percent in Semi-pucca houses and 18.13 percent in Pucca houses. The Kutcha houses were found to be more common among the lower income groups.
vi. Of the total 160 sample respondents, 15.37 percent population was below 15 years and 15.88 percent belonged to age group of over 60 years of age. Rest 68.75 percent population was between the age group of 15-60 years.
vii. The total owned land holding was recorded 65.94 hectares with an average size of holding being 0.41 hectare per respondent. The maximum area of land was possessed by ` 1-2 income group (21.60 hectares) closely followed by below ` 1 lakh (21.58 hectares), ` 2-3 lakh (13.26 hectares) and ` 3 lakh and above income group (9.50 hectares).
viii. Of the total gross cropped area of 122.61 hectares, the highest area was occupied by the income group of ` 1-2 lakh, closely followed by below ` 1 lakh, ` 2-3 lakh and ` 3 lakh and above income group. The overall cropping intensity was recorded at 161.90 percent.
ix. The sample respondents used to grow different crops in both kharif and rabi seasons. Krarif crops grown were paddy, pulses and vegetables while rabi crops included paddy, pulses and vegetables andoilseeds.
x. In the kharif season, the highest performance of HYV paddy with 34.25 quintal per hectare was recorded against the income group of ` 1-2 lakh and in case of local paddy the highest yield was found at 24.85 quintal against the income group of below ` 1 lakh. The average yield of HYV paddy stood at 33.75 quintal per hectare and that of local paddy was 24.13 quintal perhectare.

Agro-Economic rEsEArch
26 | Agricultural Situation in India | December, 2020
xi. In the rabi paddy, the highest yield of 35.86 quintal per hectare was found against the income group of ` 1-2 lakh with an overall average of 35.23 quintal per hectare across the incomegroups.
xii. In kharif vegetables, the highest yield rate of 16.80 quintal per hectare was found against the highest income group of ` 3 lakh & above and the lowest yield of 15.62 quintal was found against the income group ` 2-3 lakh. In rabi vegetables, the highest yield of 18.90 quintal per hectare was recorded against ` 1-2 lakh income group and the lowest yield of 16.87 quintal was found in highest income group (` 3 lakh & above) with an overall average of 17.98 quintal.
xiii. The overall average income per household from agricultural source was found at ` 38,526.88 and from subsidiary occupation, it was found at ` 74,320.25. Out of the total income, the share of agricultural income was 31.14 percent for income group below ` 1 lakh, 33.26 percent for income group of ` 1-2 lakh, 49.00 percent against the income group of ` 2-3 lakh and 26.56 percent for the income group of ` 3 lakh and above, with an overall average of 34.14 percent. In case of subsidiary source of income, the highest percentage of income was earned by the large income group (73.44 %) and lowest amount of income was obtained by the income group of ` 2-3 lakh (51.00%), with an average of 65.56 percent.
xiv. The total material costs was found at ` 55,79,885 and average per household material costs was estimated at ` 34,874. The per household expenditure was found to be highest in the income group of ` 3 lakh & above (` 47,034), followed by ` 2-3 lakh income group (` 42,490), ` 1-2 lakh income group (` 29,820) and below ` 1 lakh income group (` 26,115)
xv. Per household cost incurred on different bamboo products by the sample artisans of below ` 1 lakh income group was ` 73,597, for income group ` 1-2 lakh was ` 83,496, for ` 2-3 lakh income group, it was estimated at ` 1,51,796 and for ` 3 lakh & above income group, it was recorded at ` 1,56,834. The overall average cost was found at ` 1,08,833.
xvi. Per household gross return from the bamboo products was found highest against the income group of ` 3 lakh & above (` 3,05,419) followed by ` 2-3 lakh (` 2,29,509), ` 1-2 lakh (` 1,20,913) and below ` 1 lakh (` 97,053).
xvii. The benefit cost ratio (BCR) were found to be positive in all the income size groups. The BCR were worked out at 1.32:1 for below ` 1 lakh income group, 1.45:1 for 1-2 lakh income group, 1.51:1 for 2-3 lakh income group and 1.95:1 for 3 lakh and above income group. The overall BCR was estimated at 1.61:1.
xviii. In the study area, the sample artisans disposed-off their produce through a number of marketing channels. The common and popular marketing channels prevailed in the study area are- (i) Producer – Retailer – Consumer, (ii) Producer – Wholesaler - Retailer – Consumer and (iii) Producer -Commission Agent/Middleman –Wholesaler–Retailer – Consumer.
xix. It was found that maximum volume of bamboo products was traded through channel- III (63.59 %) followed by channel-II (28.24%) and Channel-I (8.17%).
xx. Although the maximum amount of transaction took place through channel-III, yet, channel-I could be the most efficient one because of the fact that the number of market intermediaries was less in channel-I as compared to the other channels and thus producers could earn higher margin in channel-I in the study area.
3.1. Problem areas
Based on the field level observations, the pressing problems as perceived by the sample artisans can be enumerated as follows:
i. Low level of education was perceived to the one of the most important issues, as pointed out by the artisans. Lack of proper education makes it difficult for the artisans to manage inventory, access the opportunities of Government schemes and gain market information and to bargain with traders and middlemen.
ii. Exploitation by the intermediaries was yet another crucial problem faced by the bamboo

Agro-Economic rEsEArch
December, 2020 | Agricultural Situation in India | 27
artisans in Assam. The middleman/commission agents collected the bamboo products from the producers at a very low price and they usually sold those items at a high price to the consumers. Thus, the producers get very low price for their products & were deprived of their due share.
iii. In the absence of a price mechanism the bamboo artisans were affected adversely. Due to unorganized nature of markets, same products were sold at different prices and it varied from place to place and some of the artisans were compelled to sell their produce at very low price.
iv. Large scale inflows of machine-made items at relatively lower prices competing with the handmade product with higher price tag put the bamboo artisans at a great disadvantageous position. Due to durability and appealing designs, the consumers usually preferred those items to high cost and short durable bamboo products which dampened the spirit of the bamboo artisans.
v. The study revealed that the local artisans are still using simple traditional tools and techniques of production which were very laborious and time-consuming. Availability of modern machines is either not known to them, or they might not have sufficient means to acquire those.
vi. Due to high cost of labour and materials, it became very difficult on the part of the artisans to run their family with this venture alone. Eighty percent of the sample artisans did not get any opportunity for skill development training in order to develop the quality of their products. Only 20 percent of the sample artisans had some short- term exposure training, which they considered to be beneficial.
3.2. Artisans’ perceptions
Artisans’ perceptions on various issues relating to bamboo products marketing, as emerged from the field investigation are documented below:
i. Most of the sample respondents (90%) used to run their bamboo product business because it was the family activity of their forefathers.
Forty percent respondents started the business due to the reason of low investment and 56 percent sample respondents motivated to get involved in the business because of rising demand for bamboo products.
ii. Although the Central and the State Government had taken various measures to develop the bamboo sector with timely initiatives to uplift the bamboo artisans under different components of NBM, hardly 40 percent of the sample respondents were found to aware of the NBM programme and its benefits.
iii. Only 10 percent sample artisans possessed Pehchan Card (Artisan Identity Card) with which they can get some incentives from the Ministry of Textile, Government of India. But, 90 percent of the total respondents were not aware about the benefits of the card. Seventy five percent of the respondents wanted to improve the quality and design of their products while 25 percent were satisfied with the design and quality of their products.
iv. Among the sample artisans, 82 percent took part in national and international exhibition organized by various Government organizations and NGOs and 50 percent of them considered it to be very useful.
v. Nearly 92 percent of the bamboo artisans wanted to continue producing bamboo products to make a good living through commercialization while only 8 percent of the respondents were averse to expansion of their business.
4. Suggestions and Policy implications
Based on the findings of the study and field observations, the following suggestions can be put forward for growth and development of bamboo sector and bamboo product marketing in Assam:
i. Proper promotional campaign should be undertaken to make the artisans educated and aware of various schemes & programmes launched by the Government, extending loan at concessional rates, free tools & implements, dyes and chemical, work shed- cum-housing facilities, training programme, etc.
ii. Continuous research and development efforts

Agro-Economic rEsEArch
28 | Agricultural Situation in India | December, 2020
should be undertaken for modernization of product-process and upgradation of techniques to meet the changing requirements of the customers.
iii. State and Central Government should exempt the bamboo products from excise duty and other taxes to promote its export.
iv. The dedicated machinery, like Development Commissioner (Handicrafts), may help the local units to produce various value added items in order to penetrate the local market, and can help in exporting such items to other states of the country and abroad.
v. Facilities may be created to train the artisans so that they can really make a living through bamboo craft.
vi. State Government may arrange for display of the bamboo craft items in various airports, railway stations, bus stands, commercial centers and prominent places to promote the artisans and their products.
vii. Government may promote opening of raw material shop in the vicinity of rural areas whereby the artisans can retrieve the raw materials at reasonable price on time.
viii. Rural artisans should be provided with adequate, timely and cheaper loan facilities for establishment of bamboo-based industries. Benefits of the subsidy policy, if any, also be made known to them.
ix. Adequate infrastructure faci l i t ies are prerequisite for any development process. As such, facilities like transport, communication & power supply can give a boost to the livelihood of bamboo artisans as well.
x. Dedicated effort should be made to create a positive environment to attract the younger generation to adopt the traditional handicraft practice as an additional alternative venture for livelihood. For that matter, effective measures may be taken to educate this lot on potentialities and profitability of bamboo & bamboo products.
5. Conclusions
The field study clearly indicates that there lies an immense potentiality of growing bamboo plantation in the state of Assam and so is the future of bamboo products. Activities of the NBM are found to be very limited in the entire north east region despite having vast opportunities. A comprehensive approach with restructured NBM, ably supported by government policy is must for growth and development of this sector. The critical issues as encountered by the bamboo artisans are needed to be addressed through Government intervention. A concerted effort, if made and executed in true sense of the term, it can open up a new vista for bamboo craft in the state of Assam, which in turn will uplift a large chunk of people in terms of income & employment.
References**
Acharya, S.S. & Agarwal, N.L. (2011). Agricultural Marketing in India.New Delhi: Oxford & IBH Publishing Co. Pvt. Ltd., pp. 460-466.
Das, P. (2019). Problems associated with local Artisans involved in Cane and Bamboo Craft in Dibrugarh District of Assam. International Journal of Humanities and Social Sciences, 8(2),pp.19-24. ISSN: 2319-393X
Dhurga, S. (2017). Problems and Prospects of Bamboo Market in India. Aayvagam an International Journal of Multidisciplinary Research, 5(2), pp. 86-89. ISSN: 2321-5739
Dutta, K. (2016). Natural Fibre Mission and the Current Status of Bamboo Handicrafts Industry – A Case Study of Jalphaguri district of West Bengal. International Journal of Management and Social Science Research Review, 1(3), pp. 302-306.
Forest Survey of India. (2019). Forest Report of India.
Gopalkrishna, R.(2000). Assam: land and people. New Delhi: Omsons Publications
Gopish. G. (2019). Production and Marketing Challenges of Handicraft Products with Special reference to Wood Craft. International Journal
**Complete references can be seen in the detailed report available at the website of respective AERC.

Agro-Economic rEsEArch
December, 2020 | Agricultural Situation in India | 29
of Management Studies, Vol.–VI, Issue –1(8), pp. 97-99. ISSN- 2249-0302
Government of India. (2018). Operational Guidelines of National Bamboo Mission. Ministry of Agriculture and Farmers’ Welfare, Department
of Agriculture and Cooperation.
Jyoti, H.K. (2016). Marketing of Handicraft Products in the Sivasagar District of Assam. Asian Journal of Research in Marketing, 5(3), pp.15-16. ISSN 2277-6621

Commodity Reviews
30 | Agricultural Situation in India | December, 2020
Procurement of Rice
The total procurement of rice during kharif marketing season 2020-21 up to 27.11.2020 is 20.82 million tonnes as against 17.52 million tonnes during the corresponding period of last year.
The details are given in Table 1. A comparative analysis of procurement of rice for the period of marketing season 2019-20 (up to 27.11.2020) and the corresponding period of last year is given in figure 1. The percentage share of different states in procurement of rice has been given in figure 2.
Commodity Reviews
Foodgrains
TABLE 1: proCurement oF riCe
(In thousand tonnes)
State
Marketing Season2020-21
(upto 27.11.2020)
CorrespondingPeriod of last Year
2019-20
Procurement Percentage to Total
Procurement Percentage to Total
1 2 3 4 5
Telangana 988 4.7 717 4.1
Haryana 3747 18.0 4288 24.5
Punjab 13578 65.2 10841 61.9
Uttar Pradesh 1275 6.1 949 5.4
Tamil Nadu 323 1.6 28 0.2
Uttrakhand 606 2.9 589 3.4
Others 301 1.4 108 0.6
Total 20818 100.0 17520 100.0
Source: Department of Food & Public Distribution.

Commodity Reviews
December, 2020 | Agricultural Situation in India | 31
Figure 1: State-wise Procurement of Rice(In thousand tonnes)
Source: Department of Food & Public Distribution.
Figure 2: Percentage Share of Different States in Procurement of Rice during Marketing Season 2019-20 (up to 27.11.2020)
Source: Department of Food & Public Distribution.
Figure 1: State-wise Procurement of Rice
(In thousand tonnes)
Source: Department of Food & Public Distribution.
Figure 2: Percentage Share of Different States in Procurement of Rice during Marketing Season 2019-
20 (up to 27.11.2020)
Source: Department of Food & Public Distribution.
Figure 1: State-wise Procurement of Rice
(In thousand tonnes)
Source: Department of Food & Public Distribution.
Figure 2: Percentage Share of Different States in Procurement of Rice during Marketing Season 2019-
20 (up to 27.11.2020)
Source: Department of Food & Public Distribution.

Commodity Reviews
32 | Agricultural Situation in India | December, 2020
TABLE 2: proCurement oF wheat
(In thousand tonnes)
State
Marketing SeasonRMS 2020-21
(upto 29.09.2020)
CorrespondingPeriod of last Year
RMS 2019-20
Procurement % to Total Procurement % to Total
1 2 3 4 5
Haryana 7400 19.0 9321 26.8
Madhya Pradesh 12942 33.2 7370 21.2
Punjab 12714 32.6 12921 37.1
Rajasthan 2225 5.7 1411 4.1
Uttar Pradesh 3577 9.2 3704 10.6
Others 135 0.3 63 0.2
Total 38993 100.0 34790 100.0
Source: Department of Food & Public Distribution.
Procurement of Wheat
The total procurement of wheat during rabi marketing season 2020-21 up to 29.09.2020 is 38.99 million tonnes as against 34.79 million tonnes during the corresponding period of last year. The
details are given in Table 2. The figure 3 depicts the comparison of procurement of wheat during the marketing season 2020-21 (up to 29.09.2020) with the corresponding period of last year. The percentage share of different states in procurement of wheat has been given in figure 4.

Commodity Reviews
December, 2020 | Agricultural Situation in India | 33
Figure 4: Percentage Share of Different States in Procurement of Wheat during Marketing Season 2020-21 (up to 29.09.2020)
Figure 3: State-wise Procurement of Wheat(In thousand tonnes)
Source: Department of Food & Public Distribution.
Source: Department of Food & Public Distribution.
Figure 3: State-wise Procurement of Wheat (In thousand tonnes)
Source: Department of Food & Public Distribution.
Figure 4: Percentage Share of Different States in Procurement of Wheat during Marketing Season
2020-21 (up to 29.09.2020)
Source: Department of Food & Public Distribution.
Figure 3: State-wise Procurement of Wheat (In thousand tonnes)
Source: Department of Food & Public Distribution.
Figure 4: Percentage Share of Different States in Procurement of Wheat during Marketing Season
2020-21 (up to 29.09.2020)
Source: Department of Food & Public Distribution.

Commodity Reviews
34 | Agricultural Situation in India | December, 2020
Oilseeds
The Wholesale Price Index (WPI) of nine major oilseeds as a group stood at 158 in October, 2020 showing a decrease of 1.61 percent over the previous month and increased by 4.36 percent over the previous year.
The WPI of all individual oilseeds showed a mixed trend. The WPI of rape and mustard seed (1.46 percent), copra (coconut) (2.45 percent), niger seed (0.33 percent), safflower (2.67 percent), sunflower (2.62 percent) and soyabean (2.55 percent) increased over the previous month. However, the WPI of groundnut seed (0.27 percent), cotton seed (0.13 percent), and gingelly seed (sesamum) (3.35 percent) decreased over the previous month.
Manufacture of Vegetable and Animal Oils and Fats
The WPI of vegetable and animal oils and fats as a group stood at 140.5 in October, 2020 which shows an increase of 2.78 percent over the previous month. Moreover, it also increased by 20.50 percent over the corresponding months of the previous year. The WPI of mustard oil (4.11 percent), soybean oil (4.47 percent), sunflower oil (3.95 percent), groundnut oil (1.81 percent) castor oil (4.74 percent), rapeseed oil (3.18 percent) copra oil (8.29 percent) and cotton seed oil (4.83 percent) increased over the previous month.
Fruits & Vegetable
The WPI of fruits & vegetable as a group stood at 222.3 in October, 2020 showing an increase of 5.86 percent over previous month and an increase of 14.47 percent over the corresponding month of the previous year.
Potato
The WPI of potato stood at 388.4 in October, 2020
showing an increase of 9.78 percent over the previous month. Moreover, it also increased by 107.70 percent over the corresponding months of the previous year.
Onion
The WPI of onion stood at 387.1 in October, 2020 showing an increase of 72.27 percent over the previous month and an increase of 8.49 percent over the corresponding months of the previous year.
Condiments & Spices
The WPI of condiments & spices (group) stood at 153 in October, 2020 showing an increase of 2.62 percent over the previous month and an increase of 2.82 percent over the corresponding months of the previous year. The WPI of black pepper decreased by 0.24 percent and turmeric decreased by 1.59 percent, and that of chillies (dry) increased by 9.75 percent over the previous month.
Raw Cotton
The WPI of raw cotton stood at 99.6 in October, 2020 showing a decrease of 7.95 percent over the previous month and a decrease of 12.32 percent over the corresponding months of the previous year.
Raw Jute
The WPI of raw jute stood at 238.5 in October, 2020 showing an increase of 3.43 percent over the previous month and an increase of 19.67 percent over the corresponding months of the previous year.
Wholesale Price Index of Commercial Crops is given in Table 3. A graphical comparison of WPI for the period of October, 2020 and September, 2020 is given in figure 5 and the comparison of WPI during the October, 2020 with the corresponding month of last year has been given in figure 6.
Commercial Crops

Commodity Reviews
December, 2020 | Agricultural Situation in India | 35
table 3: wholesale priCe index oF CommerCial Crops
(Base Year: 2011-12=100)
CommodityLatest
October, 2020
Month September,
2020
Year October,
2019
Percentage variation over the
month yearOilseeds 158 155.5 151.4 1.61 4.36Groundnut Seed 145.1 145.5 148.8 -0.27 -2.49Rape & Mustard Seed 166.4 164.0 144.9 1.46 14.84Cotton Seed 159.5 159.7 152.7 -0.13 4.45Copra (Coconut) 192.4 187.8 191.2 2.45 0.63Gingelly Seed (Sesamum) 176.2 182.3 177.8 -3.35 -0.90Niger Seed 215.2 214.5 174.6 0.33 23.25Safflower (Kardi Seed) 161.6 157.4 194.8 2.67 -17.04Sunflower 129.3 126.0 121.6 2.62 6.33Soyabean 168.7 164.5 160.8 2.55 4.91 Manufacture of vegetable and animal oils and fats
140.5 136.7 116.6 2.78 20.50
Mustard Oil 164.5 158.0 124.7 4.11 31.92Soyabean Oil 128.6 123.1 112.3 4.47 14.51Sunflower Oil 134.2 129.1 112.4 3.95 19.40Groundnut Oil 140.8 138.3 119.7 1.81 17.63Castor Oil 112.6 107.5 110.6 4.74 1.81Rapeseed Oil 139.4 135.1 117.2 3.18 18.94Copra oil 180.3 166.5 168.4 8.29 7.07Cotton seed Oil 130.3 124.3 112.4 4.83 15.93
Fruits & Vegetables 222.3 210.0 194.2 5.86 14.47Potato 388.4 353.8 187.0 9.78 107.70Onion 387.1 224.7 356.8 72.27 8.49 Condiments & Spices 153 149.1 148.8 2.62 2.82Black Pepper 123.2 123.5 123.8 -0.24 -0.48Chillies (Dry) 164.3 149.7 147.7 9.75 11.24Turmeric 111.7 113.5 114.9 -1.59 -2.79 Tea 221.8 262.8 138.2 -15.60 60.49Coffee 103.3 103.9 94.6 -0.58 9.20Sugarcane 189.4 189.4 169.5 0.00 11.74 Raw Cotton 99.6 108.2 113.6 -7.95 -12.32Raw Jute 238.5 230.6 199.3 3.43 19.67

Commodity Reviews
36 | Agricultural Situation in India | December, 2020
Figure 5: WPI of commercial crops during October, 2020 and September, 2020
*Manufacture of Vegetable, Animal Oils and Fats
Figure 6: WPI of commercial crops during October, 2020 and October, 2019
*Manufacture of Vegetable, Animal Oils and Fats
Figure 5: WPI of commercial crops during October, 2020 and September, 2020
*Manufacture of Vegetable, Animal Oils and Fats
Figure 6: WPI of commercial crops during October, 2020 and October, 2019
*Manufacture of Vegetable, Animal Oils and Fats
050
100150200250300350400450
Oils
eeds
Gro
undn
ut S
eed
Rap
e &
Mus
tard
See
dC
otto
n Se
edC
opra
(Coc
onut
)G
inge
lly S
eed
(Ses
amum
)N
iger
See
dSa
fflo
wer
(Kar
di S
eed)
Sunf
low
erSo
yabe
an*M
anuf
actu
re o
f veg
.M
usta
rd O
ilSo
yabe
an O
ilSu
nflo
wer
Oil
Gro
undn
ut O
ilC
asto
r Oil
Rap
esee
d O
ilC
opra
oil
Cot
ton
seed
Oil
Frui
ts &
Veg
etab
les
Pota
toO
nion
Con
dim
ents
& S
pice
sBl
ack
Pepp
erC
hilli
es (D
ry)
Turm
eric
Tea
Cof
fee
Suga
rcan
eR
aw C
otto
nR
aw Ju
te
October, 2020 September, 2020
050
100150200250300350400450
Oils
eeds
Gro
undn
ut S
eed
Rap
e &
Mus
tard
See
dC
otto
n Se
edC
opra
(Coc
onut
)G
inge
lly S
eed
(Ses
amum
)N
iger
See
dSa
fflow
er (K
ardi
See
d)Su
nflo
wer
Soya
bean
*Man
ufac
ture
of v
eg.
Mus
tard
Oil
Soya
bean
Oil
Sunf
low
er O
ilG
roun
dnut
Oil
Cas
tor O
ilR
apes
eed
Oil
Cop
ra o
ilC
otto
n se
ed O
ilFr
uits
& V
eget
able
sPo
tato
Oni
onC
ondi
men
ts &
Spi
ces
Blac
k Pe
pper
Chi
llies
(Dry
)Tu
rmer
icTe
aC
offe
eSu
garc
ane
Raw
Cot
ton
Raw
Jute
October, 2020 October, 2019

Commodity Reviews
December, 2020 | Agricultural Situation in India | 37
Statistical TablesWages
1. daily aGriCultural waGes in some states (CateGory-wise)Month: September, 2020 (In `)
State District Centre
Mon
th &
Yea
r
Dai
ly N
orm
al
Wor
king
Hou
rs
Fiel
d La
bour
Oth
er A
gri.
Labo
ur
Her
dsm
an
Skilled Labour
Car
pent
er
Blac
k Sm
ith
Cob
bler
M W M W M W M M M
Andhra Pradesh Krishna Ghantasala Aug, 20 8 600 400 NA NA NA NA NA NA NA
Guntur Tadikonda Aug, 20 8 400 300 400 NA 350 NA 400 NA NA
Telangana Ranga Reddy Arutala July, 20 8 800 267 800 NA NA NA NA 500 NA
Karnataka Bangalore Harisandra Dec, 19 8 360 340 300 300 340 330 500 400 NA
Tumkur Gidlahali Dec, 19 8 350 320 350 350 350 320 400 360 NA
Maharashtra Bhandara Adyal June, 20 8 300 200 275 200 275 200 400 350 350
Chandrapur Ballarpur June, 20 8 300 200 300 200 300 NA 350 300 200
Jharkhand Ranchi Gaitalsood June, 19 8 239 239 239 239 239 239 330 330 NA
1. daily aGriCultural waGes in some states (CateGory-wise)Month: October, 2020 (In `)
State District Centre
Mon
th &
Yea
r
Dai
ly N
orm
al
Wor
king
Hou
rs
Fiel
d La
bour
Oth
er A
gri.
Labo
ur
Her
dsm
an
Skilled Labour
Car
pent
er
Blac
k Sm
ith
Cob
bler
M W M W M W M M M
Andhra Pradesh Krishna Ghantasala Sep,20 8 550 300 800 500 400 NA NA NA NA
Guntur Tadikonda Sep, 20 8 400 300 400 NA 350 NA 400 NA NA
Telangana Ranga Reddy Arutala July, 20 8 800 267 800 NA NA NA NA 500 NA
Karnataka Bangalore Harisandra Dec, 19 8 360 340 300 300 340 330 500 400 NA
Tumkur Gidlahali Nov, 19 8 350 320 350 350 350 320 400 360 NA
Maharashtra Bhandara Adyal June, 20 8 300 200 275 200 275 200 400 350 350
Chandrapur Kothari June, 20 8 300 200 300 200 300 NA 350 300 200

Commodity Reviews
38 | Agricultural Situation in India | December, 2020
1.1. daily aGriCultural waGes in some states (operation-wise)Month: September, 2020 (In `)
State District Centre
Mon
th &
Yea
r
Type
of
Labo
ur
Nor
mal
Dai
ly
Wor
king
Hou
rs
Plou
ghin
g
Sow
ing
Wee
ding
Har
vest
ing
Oth
er A
gri L
abou
r
Her
dsm
an
Skilled Labours
Car
pent
er
Blac
k Sm
ith
Cob
bler
Assam Barpeta Howly Apr, 20M 8 300 NA 250 250 200 NA 275 280 NA
W 8 NA NA 170 170 150 NA NA NA NA
Bihar
Muzaffarpur Bhalui Rasul June, 20M 8 350 400 350 350 400 NA 500 500 NA
W 8 250 300 250 250 300 NA NA NA NA
Nawada Masahi May, 20M 8 200 200 200 250 250 NA 450 450 NA
W 8 NA 200 200 250 250 NA NA NA NA
Chhattisgarh Dhamtari Sihava Feb, 20M 8 400 NA NA NA 180 160 320 300 200
W 8 NA NA NA NA 160 140 NA 150 NA
Gujarat*
Rajkot Rajkot April, 20M 8 292 292 292 292 272 120 510 483 450
W 8 NA 292 292 292 272 100 NA NA NA
Dahod Dahod April, 20M 8 300 300 150 150 150 NA 400 350 300
W 8 NA 250 150 150 150 NA NA NA NA
Haryana Panipat Ugarakheri May, 20M 8 400 400 400 400 400 NA 550 400 NA
W 8 NA 300 300 350 300 NA NA NA NA
Himachal Pradesh Mandi Mandi Feb, 20
M 8 450 330 330 330 330 330 430 430 300
W 8 NA 330 330 330 330 330 NA NA NA
Kerala
Kozhikode Koduvally Apr, 20M 4-8 1240 850 NA 800 800 NA 950 NA NA
W 4-8 NA NA 700 700 700 NA NA NA NA
Palakkad Elappally Apr, 20M 4-8 NA 600 NA 600 720 NA 750 NA NA
W 4-8 NA NA 350 350 350 NA NA NA NA

Commodity Reviews
December, 2020 | Agricultural Situation in India | 39
State District Centre
Mon
th &
Yea
r
Type
of
Labo
ur
Nor
mal
Dai
ly
Wor
king
Hou
rs
Plou
ghin
g
Sow
ing
Wee
ding
Har
vest
ing
Oth
er A
gri L
abou
r
Her
dsm
an
Skilled Labours
Car
pent
er
Blac
k Sm
ith
Cob
bler
Madhya Pradesh
Hoshangabad Sangarkhera Aug, 20M 8 250 250 200 NA 250 150 500 500 NA
W 8 NA NA 200 NA 200 NA NA NA NA
Satna Kotar Aug, 20M 8 300 300 300 300 300 300 500 500 500
W 8 NA 300 300 300 300 300 NA NA NA
Gwalior Mohana Aug, 20M 8 300 250 250 300 250 250 500 500 500
W 8 NA 200 200 250 200 200 NA NA NA
Odisha
Bhadrak Chandbali Feb, 20M 8 450 400 400 400 400 400 500 400 350
W 8 NA 300 350 300 300 300 NA NA NA
Ganjam Aska Feb, 20M 8 300 300 300 300 350 250 500 500 500
W 8 NA 250 250 250 300 220 NA NA NA
Punjab Monga Nathoke July, 20M 8 500 500 NA NA 500 NA 500 450 NA
W 8 NA 400 NA NA 400 NA NA NA NA
Rajasthan
Barmer Kuseep May, 20M 8 NA NA 400 NA NA 500 700 500 NA
W 8 NA NA NA NA NA 300 NA 300 NA
Jalore Sarnau May, 20M 8 400 NA 300 300 NA NA 600 400 NA
W 8 NA NA 250 300 NA NA NA 350 NA
Tamil Nadu*
Thanjavur Thanjavur Aug, 20M 8 NA 375 NA NA 397 NA 494 450 NA
W 8 NA NA 173 175 177 NA NA NA NA
Tirunelveli Tirunelveli Aug, 20M 8 NA 447 NA NA 737 NA NA NA NA
W 8 NA 211 217 214 NA NA NA NA NA
Tripura State Average Aug, 19M 8 331 331 297 276 275 275 350 319 NA
W 8 NA 331 250 229 225 241 NA NA NA
1.1. daily aGriCultural waGes in some states (operation-wise)-Contd.Month: September, 2020 (In `)

Commodity Reviews
40 | Agricultural Situation in India | December, 2020
State District Centre
Mon
th &
Yea
r
Type
of
Labo
ur
Nor
mal
Dai
ly
Wor
king
Hou
rs
Plou
ghin
g
Sow
ing
Wee
ding
Har
vest
ing
Oth
er A
gri L
abou
r
Her
dsm
an
Skilled Labours
Car
pent
er
Blac
k Sm
ith
Cob
bler
Uttar Pradesh*
Meerut Meerut July, 20M 8 300 300 300 300 300 NA 500 NA NA
W 8 NA 250 250 250 250 NA NA NA NA
Jhansi Jhansi July, 20M 8 250 250 250 NA 260 NA 420 NA .NA
W 8 NA 250 250 NA 250 NA NA NA NA
Chandauli Chandauli July, 20M 8 NA NA NA NA 300 NA 500 NA NA
W 8 NA 300 NA NA 300 NA NA NA NA
M - ManW - WomanNA - Not AvailableNR – Not Reported* The State reported district average daily wage
1.1. daily aGriCultural waGes in some states (operation-wise)Month: October, 2020 (In `)
State District Centre
Mon
th &
Yea
r
Type
of
Labo
ur
Nor
mal
Dai
ly
Wor
king
Hou
rs
Plou
ghin
g
Sow
ing
Wee
ding
Har
vest
ing
Oth
er A
gri L
abou
r
Her
dsm
anSkilled Labours
Car
pent
er
Blac
k Sm
ith
Cob
bler
Assam Barpeta Howly May, 20M 8 300 NA 250 250 200 NA 275 280 NA
W 8 NA NA 170 170 150 NA NA NA NA
Bihar
Muzaffarpur Narsinghpur June, 20M 8 350 400 350 350 400 NA 500 500 NA
W 8 250 300 250 250 300 NA NA NA NA
Shekhpura Kutaut May, 20M 8 200 200 200 250 250 NA 450 450 NA
W 8 NA 200 200 250 250 NA NA NA NA
Chhattisgarh Dhamtari Sihava Feb,20M 8 400 NA NA NA 180 160 320 300 200
W 8 NA NA NA NA 160 140 NA 150 NA
1.1. daily aGriCultural waGes in some states (operation-wise)-Concld.Month: September, 2020 (In `)

Commodity Reviews
December, 2020 | Agricultural Situation in India | 41
State District Centre
Mon
th &
Yea
r
Type
of
Labo
ur
Nor
mal
Dai
ly
Wor
king
Hou
rs
Plou
ghin
g
Sow
ing
Wee
ding
Har
vest
ing
Oth
er A
gri L
abou
r
Her
dsm
an
Skilled Labours
Car
pent
er
Blac
k Sm
ith
Cob
bler
Gujarat*
Rajkot Rajkot April, 20M 8 292 292 292 292 272 120 510 483 450
W 8 NA 292 292 292 272 100 NA NA NA
Dahod Dahod April , 20M 8 300 300 150 150 150 NA 400 350 300
W 8 NA 250 150 150 150 NA NA NA NA
Haryana Panipat Ugarakheri June, 20M 8 400 400 400 400 400 NA 550 400 NA
W 8 NA 300 300 350 300 NA NA NA NA
Himachal Pradesh Mandi Mandi Feb, 20
M 8 450 330 330 330 330 330 430 430 300
W 8 NA 330 330 330 330 330 NA NA NA
Kerala
Kozhikode Koduvally May, 20M 4-8 1240 850 NA 800 800 NA 950 NA NA
W 4-8 NA NA 700 700 700 NA NA NA NA
Palakkad Elappally May,20M 4-8 NA 600 NA 600 720 NA 750 NA NA
W 4-8 NA NA 350 350 350 NA NA NA NA
Madhya Pradesh
Hoshangabad Sangarkhera Sep,20M 8 250 NA 200 250 250 150 500 500 NA
W 8 NA NA 200 200 200 NA NA NA NA
Satna Kotar Sep,20M 8 300 300 300 300 300 300 500 500 500
W 8 NA 300 300 300 300 300 NA NA NA
Gwalior Mohana Sep,20M 8 300 250 250 300 250 250 500 500 500
W 8 NA 200 200 250 200 200 NA NA NA
Odisha
Bhadrak Chandbali Feb, 20M 8 450 400 400 400 400 400 500 400 350
W 8 NA 300 350 300 300 300 NA NA NA
Ganjam Aska Feb, 20M 8 300 300 300 300 350 250 500 500 500
W 8 NA 250 250 250 300 220 NA NA NA
1.1. daily aGriCultural waGes in some states (operation-wise)-Contd.Month: October, 2020 (In `)

Commodity Reviews
42 | Agricultural Situation in India | December, 2020
State District Centre
Mon
th &
Yea
r
Type
of
Labo
ur
Nor
mal
Dai
ly
Wor
king
Hou
rs
Plou
ghin
g
Sow
ing
Wee
ding
Har
vest
ing
Oth
er A
gri L
abou
r
Her
dsm
an
Skilled Labours
Car
pent
er
Blac
k Sm
ith
Cob
bler
Punjab Monga Nathoke Aug, 20M 8 500 500 500 500 500 NA 500 460 NA
W 8 NA 400 NA 400 400 NA NA NA NA
Rajasthan
Barmer Kuseep July, 20M 8 NA NA 500 400 NA 500 700 500 NA
W 8 NA NA NA NA NA 300 NA 300 NA
Jalore Sarnau July, 20M 8 400 400 350 350 NA NA 600 450 NA
W 8 NA NA NA 250 NA NA NA 350 NA
Tamil Nadu*
Thanjavur Thanjavur Aug, 20M 8 NA 375 NA NA 397 NA 494 450 NA
W 8 NA NA 173 175 177 NA NA NA NA
Tirunelveli Tirunelveli Aug, 20M 8 NA 447 NA NA 737 NA NA NA NA
W 8 NA 211 217 214 NA NA NA NA NA
Tripura State Average Aug, 19M 8 331 331 297 276 275 275 350 319 NA
W 8 NA 331 250 229 225 241 NA NA NA
Uttar Pradesh*
Meerut Meerut Aug, 20M 8 300 300 300 300 300 NA 500 NA NA
W 8 NA 250 250 250 250 NA NA NA NA
Jhansi Jhansi Aug,20M 8 250 250 250 NA 260 NA 420 NA .NA
W 8 NA 250 250 NA 250 NA NA NA NA
Chandauli Chandauli Aug, 20M 8 NA NA 300 250 300 NA 500 NA NA
W 8 NA NA 300 250 300 NA NA NA NA
M - ManW - WomanNA - Not AvailableNR – Not Reported* The State reported district average daily wage
1.1. daily aGriCultural waGes in some states (operation-wise)-Concld.Month: October, 2020 (In `)

Commodity Reviews
December, 2020 | Agricultural Situation in India | 43
Prices2. wholesale priCes oF Certain aGriCultural Commodities and animal husbandry produCts at
seleCted Centres in india
Commodity Variety Unit State Centre Oct-20 Sep-20 Oct-19
Wheat PBW 343 Quintal Punjab Amritsar 1800 1700 2200
Wheat Dara Quintal Uttar Pradesh Chandausi 1700 1810 1975
Wheat Lokvan Quintal Madhya Pradesh Bhopal 1820 1751 2090
Jowar - Quintal Maharashtra Mumbai 3200 3000 3800
Gram No III Quintal Madhya Pradesh Sehore 4740 4770 4200
Maize Yellow Quintal Uttar Pradesh Kanpur 1250 1350 2020
Gram Split - Quintal Bihar Patna 6200 6150 6020
Gram Split - Quintal Maharashtra Mumbai 6100 5400 5700
Arhar Split - Quintal Bihar Patna 9480 8700 8150
Arhar Split - Quintal Maharashtra Mumbai 8800 8600 7500
Arhar Split - Quintal NCT of Delhi Delhi 8300 8300 7650
Arhar Split Sort II Quintal Tamil Nadu Chennai 10000 9600 8400
Gur - Quintal Maharashtra Mumbai 4500 4800 4800
Gur Sort II Quintal Tamil Nadu Coimbatore 4500 4500 4500
Gur Balti Quintal Uttar Pradesh Hapur 2900 3400 2850
Mustard Seed Black (S) Quintal Uttar Pradesh Kanpur 4940 4750 3690
Mustard Seed Black Quintal West Bengal Raniganj NA 4700 4350
Mustard Seed - Quintal West Bengal Kolkata 5800 5750 4500
Linseed Bada Dana Quintal Uttar Pradesh Kanpur 4950 5250 4600
Linseed Small Quintal Uttar Pradesh Varanasi 4900 5000 4700
Cotton Seed Mixed Quintal Tamil Nadu Virudhunagar 2100 1900 2500
Cotton Seed MCU 5 Quintal Tamil Nadu Coimbatore 3000 3000 2800
Castor Seed - Quintal Telangana Hyderabad NA NT 4400
Sesamum Seed White Quintal Uttar Pradesh Varanasi 8200 9200 9800
Copra FAQ Quintal Kerala Alleppey 12400 12250 10150
Groundnut Pods Quintal Tamil Nadu Coimbatore 5000 5500 6000
Groundnut - Quintal Maharashtra Mumbai 8500 8000 9300
Mustard Oil - 15 Kg. Uttar Pradesh Kanpur 1525 1480 1360

Commodity Reviews
44 | Agricultural Situation in India | December, 2020
Commodity Variety Unit State Centre Oct-20 Sep-20 Oct-19
Mustard Oil Ordinary 15 Kg. West Bengal Kolkata 2050 1900 1400
Groundnut Oil - 15 Kg. Maharashtra Mumbai 2050 1920 1530
Groundnut Oil Ordinary 15 Kg. Tamil Nadu Chennai 2500 2350 2120
Linseed Oil - 15 Kg. Uttar Pradesh Kanpur 1545 1500 1450
Castor Oil - 15 Kg. Telangana Hyderabad 1890 1725 1395
Sesamum Oil - 15 Kg. NCT of Delhi Delhi 2000 1880 1825
Sesamum Oil Ordinary 15 Kg. Tamil Nadu Chennai 3320 3200 3500
Coconut Oil - 15 Kg. Kerala Cochin 2565 2535 2175
Mustard Cake - Quintal Uttar Pradesh Kanpur 2100 1960 1875
Groundnut Cake - Quintal Telangana Hyderabad NA NT 3857
Cotton/Kapas NH 44 Quintal Andhra pradesh Nandyal 5000 4700 5500
Cotton/Kapas LRA Quintal Tamil Nadu Virudhunagar 3900 4200 4400
Jute Raw TD 5 Quintal West Bengal Kolkata 5775 5600 4650
Jute Raw W 5 Quintal West Bengal Kolkata 6275 5900 4700
Oranges - 100 No NCT of Delhi Delhi NA NA 708
Oranges Big 100 No Tamil Nadu Chennai NA 800 900
Banana - 100 No. NCT of Delhi Delhi 375 375 458
Banana Medium 100 No. Tamil Nadu Kodaikkanal 600 600 700
Cashewnuts Raw Quintal Maharashtra Mumbai 80000 72500 86000
Almonds - Quintal Maharashtra Mumbai 64000 58000 75000
Walnuts - Quintal Maharashtra Mumbai 70000 70000 63000
Kishmish - Quintal Maharashtra Mumbai 21000 18000 18000
Peas Green - Quintal Maharashtra Mumbai 9500 7800 6200
Tomato Ripe Quintal Uttar Pradesh Kanpur 3200 3900 2750
Ladyfinger - Quintal Tamil Nadu Chennai 2000 3200 1000
Cauliflower - 100 No. Tamil Nadu Chennai 2200 2200 2500
Potato Red Quintal Bihar Patna 3350 2980 1470
Potato Desi Quintal West Bengal Kolkata 3200 2740 1500
Potato Sort I Quintal Tamil Nadu Mettuppalayam 4187 4000 2973
2. wholesale priCes oF Certain aGriCultural Commodities and animal husbandry produCts at seleCted Centres in india-Contd.

Commodity Reviews
December, 2020 | Agricultural Situation in India | 45
Commodity Variety Unit State Centre Oct-20 Sep-20 Oct-19
Onion Pole Quintal Maharashtra Nashik 4550 2700 3100
Turmeric Nadan Quintal Kerala Cochin 11000 11000 11000
Turmeric Salam Quintal Tamil Nadu Chennai 9500 10700 11500
Chillies - Quintal Bihar Patna 14700 13800 10450
Black Pepper Nadan Quintal Kerala Kozhikode 29000 29000 28500
Ginger Dry Quintal Kerala Cochin 28000 29000 26000
Cardamom Major Quintal NCT of Delhi Delhi 100000 110000 124000
Cardamom Small Quintal West Bengal Kolkata 180000 190000 270000
Milk Buffalo 100 Liters West Bengal Kolkata 6000 6000 6200
Ghee Deshi Deshi No 1 Quintal NCT of Delhi Delhi 60030 63365 68701
Ghee Deshi - Quintal Maharashtra Mumbai 39000 42000 40000
Ghee Deshi Desi Quintal Uttar Pradesh Kanpur 40500 40350 39000
Fish Rohu Quintal NCT of Delhi Delhi 9000 16000 16700
Fish Pomphrets Quintal Tamil Nadu Chennai 35000 35000 40000
Eggs Madras 1000 No. West Bengal Kolkata 5476 5145 4120
Tea - Quintal Bihar Patna 24800 22350 21540
Tea Atti Kunna Quintal Tamil Nadu Coimbatore NT NT 42000
Coffee Plant-A Quintal Tamil Nadu Coimbatore 39500 39500 38200
Coffee Rubusta Quintal Tamil Nadu Coimbatore 29500 29500 26500
Tobacco Kampila Quintal Uttar Pradesh Farukhabad 9750 9800 8100
Tobacco Raisa Quintal Uttar Pradesh Farukhabad 4800 4600 4100
Tobacco Bidi Tobacco Quintal West Bengal Kolkata 13200 13100 13200
Rubber - Quintal Kerala Kottayam 13900 10800 11800
Arecanut Pheton Quintal Tamil Nadu Chennai 65000 68000 57500
priCe CorreCtion For the month oF july 2020, auGust, 2020 and september, 2020
Commodity Variety Unit State Centre Sep-20 Aug-20 Jul-20
Ghee Deshi Deshi No 1 Quintal NCT of Delhi Delhi 63365 70035 70035
2. wholesale priCes oF Certain aGriCultural Commodities and animal husbandry produCts at seleCted Centres in india-Concld.
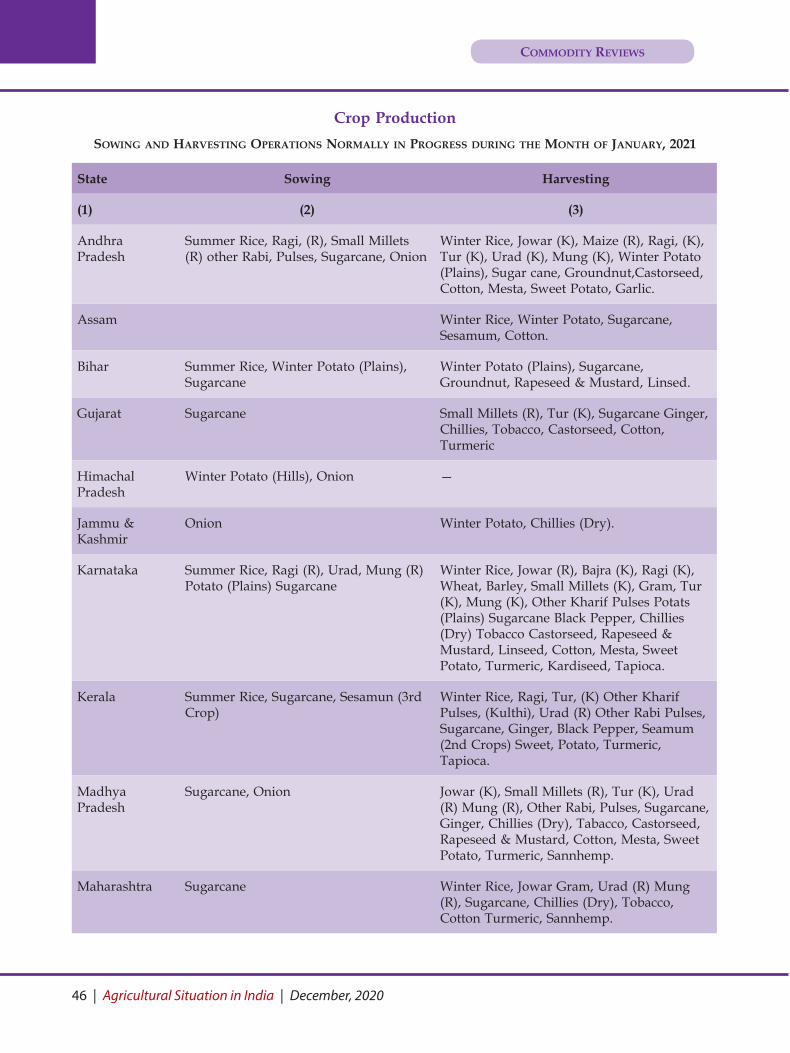
Commodity Reviews
46 | Agricultural Situation in India | December, 2020
Crop ProductionsowinG and harvestinG operations normally in proGress durinG the month oF january, 2021
State Sowing Harvesting
(1) (2) (3)
Andhra Pradesh
Summer Rice, Ragi, (R), Small Millets (R) other Rabi, Pulses, Sugarcane, Onion
Winter Rice, Jowar (K), Maize (R), Ragi, (K), Tur (K), Urad (K), Mung (K), Winter Potato (Plains), Sugar cane, Groundnut,Castorseed, Cotton, Mesta, Sweet Potato, Garlic.
Assam Winter Rice, Winter Potato, Sugarcane, Sesamum, Cotton.
Bihar Summer Rice, Winter Potato (Plains), Sugarcane
Winter Potato (Plains), Sugarcane, Groundnut, Rapeseed & Mustard, Linsed.
Gujarat Sugarcane Small Millets (R), Tur (K), Sugarcane Ginger, Chillies, Tobacco, Castorseed, Cotton, Turmeric
Himachal Pradesh
Winter Potato (Hills), Onion —
Jammu & Kashmir
Onion Winter Potato, Chillies (Dry).
Karnataka Summer Rice, Ragi (R), Urad, Mung (R) Potato (Plains) Sugarcane
Winter Rice, Jowar (R), Bajra (K), Ragi (K), Wheat, Barley, Small Millets (K), Gram, Tur (K), Mung (K), Other Kharif Pulses Potats (Plains) Sugarcane Black Pepper, Chillies (Dry) Tobacco Castorseed, Rapeseed & Mustard, Linseed, Cotton, Mesta, Sweet Potato, Turmeric, Kardiseed, Tapioca.
Kerala Summer Rice, Sugarcane, Sesamun (3rd Crop)
Winter Rice, Ragi, Tur, (K) Other Kharif Pulses, (Kulthi), Urad (R) Other Rabi Pulses, Sugarcane, Ginger, Black Pepper, Seamum (2nd Crops) Sweet, Potato, Turmeric, Tapioca.
Madhya Pradesh
Sugarcane, Onion Jowar (K), Small Millets (R), Tur (K), Urad (R) Mung (R), Other Rabi, Pulses, Sugarcane, Ginger, Chillies (Dry), Tabacco, Castorseed, Rapeseed & Mustard, Cotton, Mesta, Sweet Potato, Turmeric, Sannhemp.
Maharashtra Sugarcane Winter Rice, Jowar Gram, Urad (R) Mung (R), Sugarcane, Chillies (Dry), Tobacco, Cotton Turmeric, Sannhemp.

Commodity Reviews
December, 2020 | Agricultural Situation in India | 47
State Sowing Harvesting
(1) (2) (3)
Orissa Summer Rice, Chillies (Dry). Winter Rice, Winter Potato (Plains), Sugarcane, Chillies (Dry), Tobacco, Castorseed, Nigerseed.
Punjab and Haryana
Potato, Tabacco, Onion. Potato, Sugarcane, Sweet Potato.
Rajasthan Sugarcane, Tobacco Tur (K), Winter Potato (Plains), Sugarcane, Chillies (Dry).
Tamil Nadu Winter Rice, Jowar (R), Sugarcane, Tur (R), Tobacco, Groundnut, Sesamum, Onion, Bajra (R)
Rice, Jowar (K), Bajra (K), Ragi, Small Millets (K) Gram, Tur (K) Urad (K) Mung (K), Other Kharif Pulses Winter Potato (Hills), Sugarcane, Black Pepper, Groundnut, Castorseed, Sesamum, Cotton, Turmeric, Onion.
Tripura Summer Rice Winter Rice Gram, Winter Potato (Plains), Sugarcane, Rapeseed & Mustard, Sweet Potato.
Uttar Pradesh Summer Rice, Sugarcane, Jute Onion Tobacco (Late).
Tur (K), Winter Potato (Plains), Sugarcane, Tobacco (Early), Castorseed Rapeseed & Mustard, Cotton, Sweet, Potato, Turmeric, Tapioca.
West Bengal Summer Rice, Sugarcane. Tur (K), Urad (R), Mung (R) Other Rabi Pulses, Winter Potato (Plains), Sugarcane, Ginger, Chillies (Dry), Sesamum, Rapeseed & Mustard.
Delhi Winter Potato (Plains) Onion Summer Potato (Plains), Sugarcane, Chillies (Dry), Onion.
Andaman & Nicobar Inlands
— Winter Rice.
(K)—Kharif (R)— Rabi
sowinG and harvestinG operations normally in proGress durinG the month oF january, 2021-Contd.


The journal is brought out by the Directorate of Economics and Statistics, Ministry of Agriculture & Farmers Welfare, it aims at presenting an integrated picture of the food and agricultural situation in India on month to month basis. The views expressed are not necessarily those of the Government of India.
Note to Contributors
Articles on the State of Indian Agriculture and allied sectors are accepted for publication in the Directorate of Economics & Statistics, Department of Agriculture, Cooperation & Farmers Welfare’s monthly Journal “Agricultural Situation in India”. The Journal aims to provide a forum for scholarly work and disseminate knowledge; provide a learned reference in the field; and provide platform for communication between academic and research experts, policy makers. Articles in Hard Copy as well as Soft Copy ([email protected]) in MS Word may be sent in duplicate to the Editor, Publication Division, Directorate of Economics & Statistics, M/o Agriculture, Cooperation & Farmers Welfare, 102A, F-Wing, Shastri Bhawan, New Delhi-110001 along with a declaration by the author (s) that the article has neither been published nor submitted for publication elsewhere. The author (s) should furnish their email address, Phone No. and their permanent address only on the forwarding letter so as to maintain anonymity of the author while seeking comments of the referees on the suitability of the article for publication. The Article should be prepared according to the following guidelines:
a) Articles should not exceed five thousand words (including footnotes), typed in double space on one side of foolscap paper in Times New Roman font size 12.
b) Typescript should be arranged in the following order: title, abstract, introduction, data or methodology, text, conclusions, policy suggestions, and references.
c) Abstract (with keywords) is required and should not exceed 300 words in length.
d) The title page should contain the title, author name(s) andinstitutional affiliation (s).
e) The text should follow UK English and Number bullets should be used wherever required.
f) Reference List should be given in alphabetical order of surname. The American Psychological Association (APA) style for reference lists should be followed. For example:
i. For Books (online/Offline): Author A surname, author A Initial., & Author
B Surname, author B initial. (Year). Title (Edition). Place of Publication: Publisher.
ii. For Journal: Author Surname, Author Initial. (Year). Article
Title. Journal Title, Volume Number (Issue Number), Page Range. doi: DOI Number
Although authors are solely responsible for the factual accuracy and the opinion expressed in their articles, Editorial Board of the Journal reserves the right to edit, amend and delete any portion of the article with a view to making it more presentable or to reject any article, if not found suitable. Articles which are not found suitable will not be returned unless accompanied by a self-addressed and stamped envelope. No correspondence will be entertained on the articles rejected by the Editorial Board.
Disclaimer: Views expressed in the articles and studies are of the authors only and may not necessarily represent those of Government of India.
We are pleased to inform that our monthly journal Agricultural Situation in India has been accredited by the National Academy of Agricultural Sciences (NAAS) and it has been given a score of 3.15 out of 6. The score is effective from January, 2019 onwards. The score may be seen in the following website: www.naasindia.org
Soft copy of the journal may be seen in PDF at the following URL :
eands.dacnet.nic.in/publication.htm
Abbreviations used
N.A. — Not Available. N.Q. — Not Quoted. N.T. — No Transactions. N.S.—No Supply/No Stock. R. — Revised. M.C. — Market Closed. N.R.—Not Reported. Neg. — Negligible. Kg. — Kilogram. Q. — Quintal. (P) — Provisional. Plus (+) indicates surplus or increase. Minus (-) indicates deficit or decrease.


ISSN 0002-1679
Regn.No.:840
Other Publications of
the Directorate AGRICULTURAL
SITUATION IN INDIA
AGRICULTURAL
SITUATION IN INDIA
DECEMBER, 2020
*Copies are available at:The Controller of Publications, Civil Lines, Delhi-110054
Agricultural Prices in India
Glimpses of Indian Agriculture
Agricultural Statistics at a Glance*
State of Indian Agriculture
Cost of Cultivation of Principal Crops in India
Farm Harvest Prices ofPrincipal Crops in India*
Land Use Statistics at a Glance*
Agricultural Wages in India
Since 1948
AGRO - ECONOMIC RESEARCH
Market Analysis ofBamboo Products in Assam
COMMODITY REVIEWSFoodgrainsCommercial Crops
TRENDS IN AGRICULTUREWages & Prices
P. Agri. 21-12-2020
450
FARM SECTOR NEWS
GENERAL SURVEY OF AGRICULTURE
ARTICLES
Dynamics of CastorProduction and Instability in MajorStates of India
Green Economics towards RuralDevelopment: A Study of AshwagandhaCultivation in Deccan Plateau
Rakm
o P
ress P
vt. L
td., G
reate
r N
oid
a, U
ttar
Pra
desh