Preparation for urban situation analysis.pdf
37
1 (REPORT ON MISSION OF ) PREPARATION FOR URBAN SITUATION ANALYSIS
-
Upload
khangminh22 -
Category
Documents
-
view
0 -
download
0
Transcript of Preparation for urban situation analysis.pdf

1
(REPORT ON MISSION OF )
PREPARATION FOR URBAN SITUATION ANALYSIS

2
Table of Contents
I. INTRODUCTION ....................................................................................................4
1.1. Background ........................................................................................................................ 4
1.2. Content of Task A .............................................................................................................. 5
1.3. Purposes and requirements of urban indicators NUDS ..................................................... 6 a) Purposes of indicators NUDS ................................................................................................................................... 6 b) Requirements of indicators NUDS ........................................................................................................................... 7
II. REVIEW AND EVALUATION OF 3 INDICATORS ........................................7
2.1. Vietnam Urban indicators – Version 1 (VNM8P01 – MOC03 Project) ............................ 7 a) Purposes .............................................................................................................................................................................. 8 b) Basis of indicators ........................................................................................................................................................... 8 c) Opinions on the development of urban indicators ............................................................................................. 9 d. Structure of indicators ................................................................................................................................................ 11 e) Consideration and evaluation ................................................................................................................................. 14 g) The inheritance from Vietnam urban indicators – Version 1 for Indicators NUDS. ....................... 14
2.2. Vietnam urban Observatory system indicators (VUI) ..................................................... 15 a) Purposes ........................................................................................................................................................................... 15 b) Basis of indicators ........................................................................................................................................................ 16 c) Structure of indicators ................................................................................................................................................ 16 d) Consideration and evaluation ................................................................................................................................. 18 e) The inheritance from VUI indicators for NUDS indicators. ...................................................................... 19
2.3. Urban indicators MOC (under Decree No. 42/NĐ-CP on urban classification) ............. 20 a) Purpose and objectives .............................................................................................................................................. 20 b) Basis of indicators ........................................................................................................................................................ 20 c) Structure of indicators ................................................................................................................................................ 21 d) Consideration and evaluation ................................................................................................................................. 22 e) The inheritance of MOC indicators in the Decree No. 42-2009 for NUDS ......................................... 24
III. URBAN INDICATORS NUDS ..........................................................................25
3.1. Some requirements on the research scope and the priorities according to TOR ............. 25
3.2.Proposals of priorities for NUDS' s data update ............................................................... 27
IV. APPENDIX. ..........................................................................................................29
Appendix 1: Vietnam Urban Indicator – Version I ................................................................ 29
Appendix 2: Urban Observatory System Indicator (VUI) ...................................................... 33
Appendix 3: MOC urban indicators (under the Decree No 42/NĐ-CP/2009 on classification
of urban area) .......................................................................................................................... 36

3
ABBREVIATIONS
MOC Ministry of Construction
MONRE Ministry of Natural resources and Environment
MPI Ministry of Planning and Investment
TOR Terms of Reference
VND Vietnam dong
NUUP National Urban Upgrading Programme
NUDP National Urban Development Programme
NUDS National Urban Development Strategy
UDA Urban Development Agency
CA Cities Alliance
UN-Habitat United nations-Habitat
ACVN Association of cities of Vietnam
AMCC Academy of Managers for Construction and Cities
WB World Bank
UNFPA United Nations Fund for Population Activities
CTTOPP Center for Technology Transfer of Physical Planning

4
I. INTRODUCTION
1.1. Background
Since 1986, implementing the policy of “Innovation”, Vietnam has made significant
achievements in the process of country reconstruction. Associated with economic
integration, Vietnam has attached special importance to building urban systems, key
urbanization areas as motive force and key element and framework for national
economic development. In 1990, Vietnamese cities and towns began to flourish.
Before that, the whole country had only about 500 cities and towns (urbanization rate
was about 18%). In 2009, the Prime Minister issued Decision on adjustment of
general planning orientation of Vietnam's urban system development by 2025, vision
by 2050 (Decision No. 445/2009 dated 07/04/2009), replacing Decision No.
10/1998/QĐ-TTg and creating a basis for the development of cities and towns. In
June, 20151 the whole country had 778 cities and towns, including 2 special Grade
cities, 15 Grade I cities, 24 Grade II cities, 43 Grade III cities and towns and 74
Grade cities and IV towns and 620 Grade V towns. The urbanization rate reached
35.2%. The urban system contributes over 70% of GDP.
With the economic growth in Vietnam, poverty has been reduced significantly.
However, there are still differences in living conditions and economic advantages in
some cities/towns and regions. Some poor cities/towns or low income areas (LIAs)
still exist. These areas are densely populated and have less access to basic services
such as adequate housing, water and environmental sanitation, drainage, lighting, and
other social utilities. In order to improve the living conditions of the urban dweller,
the Government has approved the National urban upgrading program (NUUP) in the
period from 2009 to 2020 (Decision No.758/QĐ-TTg dated 8/6/2009), through the
investment plans to improve social and technical infrastructure and urban
environment. To meet the goal of policymaking, management and improvement of
development capacity - controlling of urbanization, the Government has approved a
National urban development program (NUDP) for the 2012-2020 period (Decision
No.1659/QĐ-TTg dated 07/11/2012). The program acts as a tool for the Government
to control urban development and lay the basic foundation for decisions on urban
development in the future.
Although it has achieved some positive results, basically the process of urbanization
in Vietnam also shows many unsustainable development factors. The movement of
large number of rural population to urban areas is creating challenges such as
unemployment, wealth gap, lack of funding for investment in infrastructure and
housing, lack of social security gadgets, decline in the quality of urban services,
environmental pollution, floods and depleted resources. In the future, Vietnam urban
areas will face many global arisings such as response to climate change, security and
order, social-economic risks and the requirements of renewal in line with the trend of
integration, such as improvment of the role of urban management apparatus, the
quality of public services and administrative reform...
With the responsibility for the State management of urban development, the Ministry
of Construction has studied and composed to submit indicators such as the indicators
in Circular No.34-2009 under Decree No.42-2009 of Government on urban
1 Source: Ministry of Construction

5
classification and Statistical Indicator System of Construction Sector. Also, it
coordinates with the General Statistics Office - Ministry of Planning & Investment
and UN-Habitat to study the construction of urban indicators, implemented in the
framework of a component of the project supported by UNFPA to implement
Vietnam Statistics development strategy in the 2011 - 2020 period and vision by
2030. These are quite reliable data system, a tool that helps urban areas identify and
process information, properly assess the real situation and make decisions timely
policy adjustments to cope with the challenges arising in management and urban
development. Besides, UNHABITAT and ACVN organizations completed the urban
observatory indicators in 2012, in which being associated with the national statistical
indicators of Construction sector and referring to some indicators of International
organizations. Although without legal capacity, the urban observatory indicators is
also the urban indicators used for reference by the Managers and Specialists to
monitor, evaluate and formulate development policies of Vietnam urban system.
In the world, there are a lot of indicators issued by international organizations, each
indicators meet the different requirements and purposes, such as the indicators on
housing of UNHABITAT, the indicators on decentralization of basic services in
urban areas by United Cities & Local Governments, the indicators for Asian cities,
the indicators for major cities of the WB and the urban indicators of Malaysia... In
recent years, many urban indicators, which are beginning to study for Vietnam, are
supported by international organizations such as the global indicators, the prosperous
urban indicators, Vietnam urban indicators coping with climate change and green
growth urban areas...
According to the project's objectives, it is necessary to comprehensively
analysize and assess urban development situation as credible basis for policy making
and strategy formulation of Vietnam urban development in the future. In order to
meet this requirement, it is necessary to have a urban indicators with fully updated
data for objective analysis and evaluation.
1.2. Content of Task A
a) To review the urban indicators: The consultants will conduct the collection and
review of completed and ongoing urban indicators. The urban indicators to be
reviewed include:
1. Vietnam urban indicator systemthat has been implemented by MOC
(Project:VNM8P01) in collaboration with UN-Habitat within a component
of the project supported by UNFPA to implement the Development
strategy of Vietnam Statistics period 2011 – 2020 and vision to 2030,
2. Profile of urban areas implemented by UN-Habitat and ACVN in the
project of Observing System of urban areas in Vietnam and.
3. The indicators in the Decree No. 42/NĐ-CP/2009 on urban classifications:
The data system to be collected by UDA through the project of urban type
Upgrading.
b) Based on the results of review an analysis of urban indicators, to assess the
achievements and not achievements of the urban indicators to provide the scope and
priority for work updating, improving data serving assessment of the current situation
in the following steps.
Comment [G1]: Đang thực hiện?
Comment [G2]: Dự án phân loại đô thị khác
nâng cấp đô thị - Nâng loại đô thị

6
1.3. Purposes and requirements of NUDS urban indicators
a) Purposes of NUDS indicators
According to the TOR, clause 5.4.1 of Task B which determines the scope of the
investigation, surveys, thereby building a data frame. Data frame includes data
showing the overall urban development at the locality, the advantages in comparison
among localities, ensuring the ability to collect equally in urban areas. Data frame
mainly consits of data groups according 9 fields : 1) Urban population; 2) Housing; 3)
Urban land; 4) Urban infrastructure, 5) Urban economy; 6) Social services in urban
area, 7) Labour, employment and income; 8) Urban management capacity; 9)
Responding to floods and natural disasters due to climate change. Thereby
determining the purpose of the indicators NUDS including:
Representative indicators.
With the data frame of 9 fields according to TOR, Consultants found that they are
represented for assessment of urban status quo, urbanization speed, and
development level compared among Vietnam urban areas, as well as compared to
urban areas of the developing countries and the developed countries
The indicator helps to assess achieved results compared with the objectives of
urban development mentioned in the national programs.
Up to now, our country has undertaken projects in order to mobilize large
economic resources to develop Vietnam's urban system, at the same time upgrade
urban areas and eliminate slums and low-income areas (LIAs). The projects
mentioned above had practical results. After each project, we have evaluated the
investment efficiency and spillover effects authentically. However, in order to
evaluate comprehensively and objectively, evaluate sustainable impact of the
projects, as well as to draw lessons for projects and programs in the future,
indicators are necessary to demonstrate the value needed to be observed.
The indicator helps to assess the climate change adaptation and mitigation of
disaster.
From 1994 to 20132, according to long-term risks due to climate change, Vietnam
ranked 7th
globally with an annual average of 392 people died and more than 1%
of GDP loss due to disasters relating to climate change. Vietnam was considered
as one of the 5 countries strongly affected by climate change and sea level rise.
The risk of climate change already exists and is worsening, therefore it is
necessary to have the specific plans to adapt and confront. The indicator helps to
identify timely information to solve arising problems and response to climate
change in the future.
Indicator helps to find the trends and forecast urban development.
By the survey values entered into indicators over time, we determine separated
development trends of each urban area and the common existing situation for
urban areas in our country.
Vietnam urban evaluation in the context of globalization.
2 (http://vnexpress.net/tin-tuc/khoa-hoc/trong-nuoc/viet-nam-dung-thu-7-toan-cau-ve-thiet-hai-do-bien-doi-
khi-hau-3331856.html)

7
Indicators show the development level of each urban area in the context of
globalization, compared with the criteria of "green growth" and ability to direct to
"sustainable urban development". With the values observed in the indicators, we
will find the things achieved and not achieved, thereby preparing plan and
solutions in near future.
b) Requirements of NUDS indicators
Stemming from the purpose of the indicators mentioned in Section a), indicators must
meet the following requirements:
Indicators must reflect the existing issues of Vietnam urban areas in six economic
regions. Depending on the location and classification of the urban areas located in
which geographical region or socio-economic area, the indicators will show
characteristics, reflect the level of economic and social development by regions.
Indicators must express the urban infrastructure. The level of satisfaction technical
infrastructure and social infrastructure represent the most important indicators,
representation of urban quality, social security and people's satisfaction on the
quality of the urban areas;
Indicators must express the developing management capacity of current urban
government. Also through indicators, these leaders have acknowledgement
correctly the development situation and the key points needed to be handled
promptly, as well as prepare short term, medium term and long term plans to solve
each problem towards civilized and flourished urban area.
The indicators must show tangible and intangible elements, factors collected can
associate with a specific location in the urban area in the relationship between
spatial data (maps) and property data (tables), at the same time, there are general
data for the whole urban area without a specific location in the urban area. So the
indicators must have characteristics so as to show visually by GIS technology, or
simply by tables and urban areas.
II. REVIEW AND EVALUATION OF 3 INDICATORS
2.1. Vietnam Urban indicators – Version 1 (VNM8P01 – MOC03 Project)
Project "Supporting the implementation of Vietnamese Statistics Development
Strategy in the 2011- 2020 period and use of census information in planning
construction and development plan" (referred to as VNM8P01 Project) has been
approved by the Prime Minister, in which the agency assuming the prime
responsibility for implementing the project is General Statistics Office and agencies
co-implementing the project are the Department of Labor, Culture, Social Affairs
(Ministry of Planning and Investment), Development Strategy Institute (Ministry of
Planning and Investment), Urban Development Authority (MOC). The capital of the
project comes from Nonrefundable Grants of the United Nations Population Fund
(UNFPA), UN-Habitat and counterpart expenditures, of which component
implemented by the Urban Development Agency - MOC includes: Conducting
assessment and upgrade, correcting and integration of the indicators into the
statistical indicators system of MOC to meet Sustainable Urban Development,
Millennium Development and National Development Goals.

8
In the 2012-2016 periods, UN-Habitat program supports for strengthening the
capacity of Urban Development Agency - Ministry of Construction in research,
evaluation, improvement of urban indicators and integrating it into the statistical
indicators of the Ministry of Construction to help the formulation of Vietnamese
urban development strategies. Bidding package called VNM8P01 - MOC03 Project,
referred to as MOC03 Project, has been made to compile a “Report on standardization
of Vietnam urban indicators - Version 1”
a) Purposes
Scope of work for Vietnam urban indicators - Version 1 has the following purposes:
- Based on assessment and analysis results of the current state of management,
collection and use of statistical indicators with urban nature in Vietnam, preparing
the "Report on Standardization of Vietnam urban indicators - Version 1" in line
with condition of urban management and development in Vietnam.
- The urban indicators reflect the actual situation of urban development in Vietnam
in the fields including but not limited to the following contents: Population and
labor; social economic development; development of social infrastructure, urban
infrastructure; the use of land, natural resources and urban environmental
management.
- Proposing method of data collection and calculation of statistical indicators;
- Development of data management model and implementation from Central to
local level;
- Plan for implementation of indicators preparation project, orientation of
development roadmap of indicators in the next period and proposal for financial
mechanisms implemented.
b) Basis of indicators
The proposal of Vietnam urban indicators - Version 1 was based on the review of
indicators related to urban areas issues that published and executed in the countries,
the published National programs, strategies as well as some international urban
indicators guided, namely:
- National statistical indicator system was promulgated in Decision 43/2010/QĐ-
TTg dated 02/06/2010 by the Government; Statistical Indicator System of
Construction industry was issued in Circular No.05/2012/TT-BXD dated 10
October 2012 and Circular No. 06/2012/TT-BXD dated 10 October 2012 by the
Ministry of Construction stipulating the general statistical report regime of the
Construction industry;
- Circular No. 34/2009/TT-BXD (Circular No. 34-2009) dated 30 September 2009
detailing some contents of Decree 42/2009/NĐ-CP (Decree No.42-2009) dated
07 May 2009 by the Government on urban classification.
- The programs, strategies issued by the State: 2012 – 2020 National Urban
Development Program (Decision No.1659/QĐ-TTg), National Strategy for Green
Growth in the 2020 period (Decision No. 1393/2012/TTg).

9
- Refer to some indicators guided by international organizations such as UN-
Habitat, ADB, WB, CA. The following indicators as:
Global City Indicators (GCI) of UN- Habitat
City of Prospect Indicator (CPI) of UN- Habitat
Indicators for Managing Mega Cities (IMMC) of WB
Urban Indicators for Asia’s Cities (UIAC) of ADB.
Sustainable Development Goals (SDG) of United Nations
The list of the indicators and the definition of Cities Alliance (CA)
Urban Indicators of Malaysia.
c) Opinions on Construction of urban indicators
There are 5 following opinions:
1. The urban indicators reflect the actual situation of development in Vietnam urban
areas on the basics of urban areas in urban construction and management
- Effectively prepare urban indicators in order through indicators, it is posible to
support for indicating urbanization situation, poverty levels, infrastructure
services, environmental issues, housing and urban management in the Vietnam
urban areas at the national level as well as at the local level, also through these
indicators, show the urban quality. Therefore, the Urban indicators should develop
norm groups with basic norms, but fully reflect the contents above.
2. Urban indicators are built with inheriting nature, integrated with management
policies and urban development, with reference to the international common criteria.
- Currently, the State had Indicator System for National Statistics, the indicators of
Construction sector are being applied, such as Decree 42-2009 about urban
classification and statistical indicators of Construction sector issued in Circular
No. 05/2012/TT-BXD dated 10/10/2012 and the Circular No. 06/2012/TT-BXD
dated 10/10/2012 of the Ministry of Construction on regulating regime of
synthetic statistical report of Construction sector.
- Urban indicators are integrated with the orientations, programs and strategies for
urban development such as National urban development program from 2012 to
2020, the National Strategy for Green Growth for the period of 2012- 2020 as well
as the Strategic orientation of the Sector such as the Housing strategy, water
supply and drainage etc. Thus, the indicators can integrate and inherit available
indicators of the indicators in use and consider the indicators being needed to
respond in the future under the national directions and strategies of Vietnam urban
development as well as centers as well as common international norms.
3. Urban indicators should cover the basic contents in the field of urban management
and development at the sectoral level of the Construction sector through the original
indicators. The indicators relating to other sectors and fields will be included in the
expanded indicators for the implementation in the future.
- The original indicators include basic contents: general information about the
urban areas; land and urban planning management; urban social infrastructure and

10
infrastructure management. The original indicators will be implemented
immediately after the approval of competent authorities.
- The extension of the indicators as the indicators related to other sectors and fields
will be implemented in the future according to plans, roadmaps and timelines
proposed for the implementation.
The expanded indicators of national statistical indicators or programs and
orientations should be implemented early in 2017.
With the indicators according to the international indicators may be slower to
2020.
- Norms of the urban indicators selected can include both quantitative and
qualitative indicators, but the qualitative norms that are likely to advance to
simultaneously quantify the norms selected should ensure relative stability and
have the flexibility to change according to different periods.
- In the view, the development of urban indicators have the inheritance and
integration, so the data collection should combine and use the data available from
the other indicators in order to avoid duplication and expensive cost. The
proposed new indicators should be clear and comprehensible in order there is no
misleading collection and it is imposible to collect periodically
4. The indicators need to strengthen the self-control of the urban areas, the
coordination between sectors and related parties.
- The indicators serves directly to urban areas, through the indicators, each urban
area understands the strengths and weaknesses of their urban and have conditions
to compare with other urban areas. Therefore, it is necessary to create the local
autonomy in order each urban area is responsible for the provision of information
collection as well as regular and sustainable data management. When building the
indicators, it is important to meet the needs and concerns as well as to meet the
local capacity in collecting, maintaining and managing the data. The indicators are
also the basis for management decentralization, thus the indicators building needs
the support and cooperation of the relevant agencies from the central to local
level.
5. Urban indicators should be further researched for the completion in the next
period to become an effective management tool of urban management and
development from the central to local level.
The building of the urban indicators is guided by international organizations for a
long time and based on which many countries have developed their own
comprehensive urban indicators in order to serve the urban management and
development. For our country, with the assistance of UNHABITAT and the
General Statistics Office (GSO), this is the first time that the Ministry of
Construction perform to build urban indicators reflecting comprehensively of the
urban fields, however, due to the first time, so the indicators cannot meet the
requirements of indicators with full information such as Name, definition, content,
scope and calculation methodology, information collection sources, financing
mechanisms for multiple Sectors, thus the indicators should be further studied for
the completion during the next period.

11
d. Structure of indicators
Based on the review of the Urban indicators being applied, the documents issued by
the State related to urban areas as well as the International indicators, Vietnam urban
indicators - Version 1 determined:
- Selection of indicator groups used by many indicators.
- Selection of the Indicators in the key indicator groups, reflecting fundamental
problems of each field applied by many indicators, on the other hand,
conforming to the conditions of Vietnam.
* Some proposal for indicator group selection
International indicators often include 12 indicator groups used frequently. However,
when considering the documents and indicators used by our country as the documents
of Planning Law (2009), Construction Law (2014) as well as Circular 34 in urban
classification, the technical infrastructure and social infrastructure includes a number
of fields such as housing in the social infrastructure services, transport in technical
infrastructures. According to Vietnam's practices, it often have general information
item for easy identification of the urban areas, so it can combine several indicator
groups with each other, for example, the planning is often linked to the land to
decrease the number of the group. Therefore, Vietnam urban indicators - version 1
includes 9 following indicator groups: (see Table 1).
Table 1. Commonly used International indicator groups and Proposed indicator
groups
No. Commonly used International
indicator groups
Draft of Indicators Version 1
1 Population General information
2 Labour, Employment and Poverty Population
3 Urban economy Labour, Employment and Poverty
4 Land Urban economy
5 Urban planning Land and urban planning
6 Housing Social infrastructure services
7 Traffic Technical infrastructure services
8 Urban Basic Services Urban environmental management
and coping with climate change
9 Urban Environmental Management Urban Management
10 Urban Finance
11 Urban Management
Vietnam urban indicators - Version 1 is structured as follows:
- General structure: The indicators consist of multiple key indicators (original
indicators) as the indicators used immediately; and the sub-indicators (extended
indicators) as the indicators that may perform after a period of 1 to 2 years or
longer, depending on the specific conditions of each indicator.
- The indicators for statistics at the national level, industry level and urban level.
The indicators demonstrate the synthesis and speciality;

12
- Clarify the content of each indicator and data collection methodology and data
collection cycle. Data editing process. etc.
(Details of Vietnam urban indicators - Version I in Appendix 1)
In 9 indicator groups, each indicator group includes the sectors which have a close
relationship with each other:
i. General information (4 indicators): including original indicators of: urban
type, entire urban population, natural area of entire urban area and
urbanization rate.
ii. Urban population, (5 indicators) including 3 original indicators of the
population in the inner city/urban area; Population density in the inner city/
urban area and population density in the entire urban area. Remaining 2
extended indicators are the rate of natural population growth and mechanic
population growth.
iii. Labor, Employment and Poverty (7 indicators): including 3 original indicators
of non-agricultural worker rate, unemployment rate and poverty rate in urban
areas.
4 extended indicators include: underemployment rate, income per 1 employee
who is working, employed worker rate in urban areas and trained worker rate
iv. Urban economy (4 indicators) and all indicators are original: Total revenues in
the locality, revenue and expenditure balance, per capita income, investment
capital for urban construction.
v. Land and urban planning (4 indicators) and all indicators are original: The
area of land for urban construction, urban land area, overall planning of nearest
urban construction approved and land area reserved for development under
long-term planning.
vi. Social infrastructure services (13 indicators), including 13 original indicators
divided into:
Housing (including 5 original indicators) including: The rate of permanent,
semi-permanent housing, the rate of housing in slums or low income areas; the
rate of urban land, housing development program approved by the province,
the rate of temporary housing, the rental compared to average income.
Socio-cultural public works (6 indicators) and all indicators are original: Land
for construction of public works at residential quarter level; Land for
construction of public works at city level, the number of commercial - service
centers.
Urban greenery (2 original indicators) includes Green land in entire urban
areas and public green land in the inner urban areas.
vii. Technical infrastructure services (including 29 indicators, in which, there are
22 original indicators 7 extended indicators) are divided into:
Urban transport (including 5 indicators, in which, there are 4 original
indicators): The rate of urban land for transport/ urban land area; the rate of
inner urban land for transport/ inner urban area; urban main road density and

13
the rate of public passenger transport. And only one extended indicator is
average travel time for a travel to work place.
Urban water supply (including 6 indicators, in which, there are 4 original
indicators and 2 extended indicators). 4 original indicators are: Water supply
planning for urban areas, urban water supply standards for each person, and
the rate of population supplied with clean water and the rate of water wastage.
And 2 extended indicators are: The rate of qualified water as prescribed and
interrupted water supply time during the day.
Urban drainage (6 indicators) and all indicators are original: The coverage
rate of sewerage systems in urban areas, the rate of waste water collected, the
rate of waste water treated, the rate of wastewater treated in technology zones,
export processing zones and industrial clusters and the coverage rate of
drainage system in the entire urban areas, the rate of households connected to
the sewerage system.
Electricity supply (including 4 indicators, in which, there are 2 original
indicators and 2 extended indicators). 2 original indicators are: Electricity
supply norm of urban area and the rate of illuminated alleys. And 2 extended
indicators are: Hours of interrupted electricity supply during the year and the
proportion of renewable energy used in urban areas. These are two indicators
that many international indicators mentioned, meaning to the quality of
services for citizens.
Information, post and telecommunications (including 2 indicators and both of
them are original indicators): The number of fixed subscribers and mobile
subscribers, the proportion of households connected to the Internet.
Urban solid waste (including 4 indicators, in which, there are 3 original
indicators and an extended indicator). 3 original indicators are: The proportion
of urban solid waste collected, the proportion of urban solid waste treated and
the proportion of urban solid waste recycled. And an extended indicator is the
proportion of households sorting garbage at home, this is an important
indicator as it determines the entire waste management and it is only
successful when people participate actively and urban authorities direct
drastically.
viii. Urban Environmental Management and coping with climate change
(including 5 indicators, in which, there are 4 original indicators and an
extended indicator). With 4 original indicators: The percentage of households
using hygienic latrines, Urban area has developed plans to cope with climate
change or not; The percentage of waterlogged land area/urban land area,
number of public toilets on the main street in urban center. With an extended
indicator is the level of air pollution compared with the level allowed. This is
an issue related to the health of people in the cities, especially in big cities, so
urban areas need to pay more attention in the coming years.
ix. Urban governance (including 6 indicators, in which, there are 4 original
indicators and 2 extended indicators). 4 original indicators are: Satisfaction
level of citizens and businesses for providing the basic services of urban
authorities, Urban areas have website and receive the opinion of the people;

14
Management Regulation of architectural planning, demand for knowledge on
urban management. Two extended indicators are: services provided by
government through the Website/total services provided and the urban areas
have urban database management program.
e) Consideration and evaluation
Achievements:
- Vietnam urban indicators – Version 1 with fully 81 indicators, in which, 63
original indicators reflect the fundamental problems of the fields in urban
management and among 81 indicators, 37 indicators were used in the Indicators of
MOC under Decree No.42-2009.
- Vietnam urban indicators – Version 1 has met the important requirement that:
integrating with the national statistical norms as well as statistical norms related to
the sectors' urban area: Natural Resources and Environment, Transport, Health,
Labor, Invalids and Society; some indicators in social infrastructure services
(health facilities, hospital beds) and technical infrastructure (drainage, water
supply and management of domestic solid waste). Among total 81 indicators, 21
indicators have been integrated so indicators have had interdisciplinary
collaboration to enhance the efficiency of statistical data and reduce the
expenditure in survey and data collection.
- Vietnam urban indicators – Version 1 reflected the targets of National urban
development program from 2012 to 2020 and National Strategy on Green Growth
in the period of 2012-2020. In total 81 indicators, 22 indicators have been under
the National urban development program and Strategy on Green Growth in the
period of 2012 -2020.
- Vietnam urban indicators – Version 1 referred to the international indicators to
choose some indicators being suitable with the conditions of our country to
promote international integration in assessment and development of orientations
for Vietnam urban development in the trend of globalization. So among total of 81
indicators, up to 20 indicators are the reference indicators of the international
indicators.
Limitation:
- Urban indicators although reflect comprehensively the fields of urban areas, it has
not met the requirements of a indicators with information for many sectors such
as: definitions, contents, scope and calculation methodology, information
collection sources and financial mechanisms. In the next period, it will have to
continue to improve the Indicators
g) The inheritance from Vietnam urban indicators – Version 1 for Indicators
NUDS.
- Vietnam urban indicators - Version 1 has not been approved and there are some
other requirements with NUDS indicators, however, basically, both indicators
reflect comprehensively the urban development.
(1) In total 81 indicators under 9 groups (including 7 qualitative indicators of 81
indicators)

15
+ There are 39 indicators used in the national statistics and Circular 34 on
urban classification as well as the indicators of ministries and departments
relating to urban areas
+ There are 42 new indicators proposed including: 22 indicators under the
National Programs, Strategies and Orientations and 20 indicators referring to
the International indicators.
(2) Original indicators includes 63 indicators
+ 39 indicators existed in the national statistics and Circular 34 on urban
classification
+ 24 new indicators include: 15 new indicators associated with the National
Programs, Strategies and Orientations and 9 indicators referring to the
international indicators
(3) Expanded indicators include 18 indicators: 7 indicators under National
Programs, Strategies and Orientations and 11 indicators referring to the
international indicators
- Thus, 63 original indicators are inherited into NUDS indicators, because these
indicators have interdisciplinary collaboration, will be convenient in the
investigation process of data collection. Besides, it also reflects the fields
mentioned in TOR. In the expanded 18 indicators, especially 11 international
reference indicators that will be considered to use in survey research process on
the next step.
- Vietnam Urban Indicators-Version 1 has not been approved, so urban survey and
assessment have not been performed. Therefore, the NUDS project has not
utilized the data for situation assessment of urban system.
2.2. Vietnam urban Observatory system indicators (VUI)
Vietnam urban monitoring system indicators (VUI) had performed by UN-Habitat
and ACVN in two years from 2010 to 2011.
In 2010, the urban indicators was made for the first time to evaluate the pilot in 3
cities as Viet Tri, Hai Duong and Phu Ly with 147 indicators.
In 2011, after receiving the data provided by three pilot urban areas, it is shown that
many data is incomplete. UN-Habitat and ACVN organized National Workshop in
conjunction with the Annual meeting of ACVN to talk with urban areas on the
recommendation of the draft urban indicators to collect the data of 96 urban areas of
the Association of Vietnam urban areas. Based on the comments of urban areas, the
UNHabitat and ACVN agreed to adjust the indicators from 147 indicators to only 97
indicators to collect for 96 urban areas. However, in the reality, the Consultants only
collect data from 65 urban areas.
a) Purposes
- In order to develop a data system that can observe and evaluate the operations of
Vietnam urban areas, especially the medium and small urban areas, aim towards
building a developed and equal society without poverty that Vietnam Government
signed commitments in the implementation of Millennium Development Goals.

16
- Establish model urban observation system for 96 cities and towns in Vietnam (as
member urban areas of ACVN) to collect the latest data. On the basis of the data
collected, it will be meaningful in evaluating the development of urban areas in
Vietnam, while contributing to the development of urban development policies at
the national level.
- The data collection will help urban areas get better recognition on development
situation and the limitations of their urban area, thereby preparing recovery plans.
b) Basis of indicators
With objectives mentioned above, the development of Vietnam urban indicators
based on indicators related and documents on statistical indicators in general and
urban indicators in particular including:
- Based on the 8 World Millennium Development Goals (MDG) including:
Thoroughly eliminate pauperism (extreme poverty) and malnutrition; Complete
universal primary education, Enhance gender equality, status and capacity of
women, Reduce child mortality, Improve Reproductive Health, Ensure
environmental sustainability, Strengthen global partnership for development,
Vietnam has built into 12 Vietnam Development Goals (VDGs).
- Refer to the Global city indicators
- Refer to Habitat Agenda Indicators
- Based on Decision No. 43/2010/QĐ-TTg (Decision No.43-2010) dated
02/06/2010 of the Prime Minister on promulgating the National statistical
indicator system;
- Census 2009, the data in the Statistical Yearbook of the General Statistics Office
of Viet Nam (GSO);
- Decision No. 28/2007/QĐ-BXD of the Ministry of Construction on promulgating
indicator system and general statistical report system in construction;
- Circular No. 34/2009/TT-BXD dated 30/9/2009 of the Ministry of Construction -
Detailing a number of contents of Decree No.42/2009/NĐ-CP on urban
classification.
c) Structure of indicators
The indicators of Vietnam urban observation system consist of 97 indicators divided
into 5 groups with a total of 15 topics, each topic has indicators reflecting the
characteristics of that topic and being appropriate to indicators selected in the
indicators reviewed.
Table 2. Commonly used International indicator groups and Proposed indicator
groups
No. Commonly used International
indicator groups
Draft of Indicators Version 1
1 Population General information
2 Labour, Employment and Poverty Population and Labor

17
3 Urban economy Poverty, housing and social issues
4 Land Environment and infrastructure
5 Urban planning Urban management and urban
finance
6 Housing
7 Traffic
8 Urban basic services
9 Urban Environmental Management
10 Urban Finance
11 Urban Management
The topics and the main contents of each topic are as below:
i. Overview (5 indicators): Management decentralization, classification of urban
areas, area and population density (based on indicators of urban classification
under the Circular No. 34-2009)
ii. Issues on population and labor (15 indicators, based on indicators of the
statistical sector)
Population (10 indicators) includes: General population, men and women,
urban and rural areas; the number of households; the rate of population
growth; population structure by age group; population quality; gender.
Labor (5 indicators) mostly reflects the rate of labor; quality of labor; gender.
iii. Poverty, housing and social issues (29 indicators)
Urban poverty (1 indicator) is about the poverty rate (taken according to
poverty standards);
Housing (9 indicators) includes: type of house and floor area; removal of
slums (based on indicators of the statistical sector, Circular No. 34-2009 and
the International)
Education (5 indicators): reflects the situation of students in primary schools,
secondary schools and high schools, gender indicator in students (based on
census and indicators of statistical sector).
Health (7 indicators) reflects: child mortality rate; incurable and intractable
disease situation; number of doctors and pharmacists, average life expectancy
(on the basis of referring to indicators of Statistical sector and the
International).
Culture (4 indicators) reflects: the number of theaters, cinemas, cultural houses
at district and ward level (on the basis of referring to indicators under Circular
No. 34-2009 and International indicators).
Safety (3 indicators) reflects: Social safety as firefighting, traffic accidents and
number of criminal cases (referring to International indicators and statistical
sector).
iv. Issues on environment and infrastructure (including 36 indicators)

18
Land-use (5 indicators) reflects major land types such as construction land;
green land, urban land for transport, industrial land, land in unofficial
development zones (referring to the indicators of the construction industry;
Circular No. 34-2009)
Transport (6 indicators) reflects: Transport infrastructure, means of transport
including personal cars; motorcycles, the proportion of passengers using the
public transport, traffic types, (referring to indicators of Circular No. 34-2009,
and Transport sector).
Rainwater drainage system (3 indicators) reflects: the problem of urban
flooding, Proportion of urban and suburban drainage systems (new proposal of
consultants)
Electricity supply, communication, water supply, wastewater drainage - solid
waste - cemeteries, environmental sanitation referred to: wastewater drainage
and environmental sanitation (including 22 indicators, referring to indicators
used under the Circular No. 34-2009, Indicators of Construction industry and
referring to International indicators).
v. Issues on urban governance and finance (including 12 indicators):
Economy (7 indicators) include: Gross urban product per capita, total revenues
and expenditures of local budgets, domestic and foreign investment capital, per
capita income per month, the average economic growth in 3 years (referring to
indicators of the Circular No.34-2009, National statistical norms and
International indicators).
Urban governance (5 indicators) include: people's representatives; the
implementation of the right to vote; labor in the government and gender ratio;
administrative reform (these indicators referred from the International
indicators).
(Detailed in indicators of Vietnam urban observation system - Appendix II)
d) Consideration and evaluation
Achievements:
Through the structure of urban indicators VUI mentioned above, we can draw some
following comments:
- The objective of the urban indicators VUI is to associate with the assessment of
urban areas according to MDG and VDGs, so many indicators have to meet the
key objectives of poverty reduction, health and social justice. Therefore, among
97 indicators, there are 14 indicators relating to assessment of poverty level, 7
indicators relating to gender equality, nearly 20 indicators relating to health, 11
indicators relating to culture, safety and welfare.
- The VUI indicators are surveyed according timeline coinciding with the
publication of data of the Census of population and housing in 2009. Thus it took
advantage of census results and also collects more data that the census of
population and housing did not have, to be able to establish a rich data system.
- The VUI indicators surveyed in the urban areas of all six economic and social
regions include the Northern Midland, Red River Delta, North Central and Central

19
Coast, Central Highlands, Southeast and the Mekong Delta. Therefore, urban
areas surveyed ensure the representativeness to assess the real situation of
Vietnam urban system.
- Objectively perceived at that time of 2010, this is the first time to prepare
comprehensive indicators for assessment in many fields of the urban area, in
which many indicators did not exist previously. Therefore indicators VUI can be
considered an initial important result to see the status of urban limited aspects and
in general management perspective of the industry as a reference to see an overall
picture with different regions and urban types.
Limitations
- In VUI indicators, due to the large number of indicators and areas, some
indicators of urban areas cannot be collected such as: Average economic growth
over the last 3 years, the percentage of households lacking housing, the number of
deaths due to illness and HIV infection, rate of manpower in People’s Committee
etc. The reason involves many sectors and indicators not be surveyed annually.
- Some indicators such as investment capital for infrastructure construction,
domestic investment capital, foreign investment capital etc., by capital sources
from various sources with the capital source managed by the government, with the
capital source managed by the province, without belonging to the source managed
by urban area, therefore the collection gets difficulties.
- Some indicators such as: whether urban areas have waterway airports, ports or
railways across or not, the quantity of motorcycle/ person, these indicators have
not reflected the development of urban areas, not clarified the characteristics of
urban areas, so those indicators has not been core indicators and should be
reduced.
- Important issues to our country's urban areas are impacts of climate change but
there is only an indicator, which is the proportion of urban area flooded at least 1
time/year. That is not enough to assess the level of impact of climate change on
urban areas.
- Some qualitative indicators as: There are financial resources for housing or not,
your urban area has funeral homes or not, people are allowed to involve in socio-
economic development planning or urban area has website or not. For these
indicators, mostly urban areas answer "Yes", but after the "yes" data, it does not
reflect the quality, so the value of the data is not high.
- With 97 indicators that some indicators are not collected, resulted in some urban
areas failing to send written feedback, so initially only 65 urban areas respond and
nearly 1/3 of the urban areas do not send written response. After continuing
mobilization, 12 extra urban areas send information to make the City profile of 77
cities.
e) The inheritance from VUI indicators for NUDS indicators.
- The problems learned from the VUI indicators shows NUDS goals do not focus
much on urban evaluation under Millennium Development Goals of the world
(MDG) and the Vietnam Development Goals (VDGs), but needs a comprehensive
analysis and assessment of the state of urban development for credible basis for

20
making policy and Vietnam urban developing strategy in the future. Therefore, for
the VUI indicators well as the basic goal is assessment of the Vietnam urban areas
in many ways, but further evaluating indicators of Millennium Development
Goals, thus there will be many indicators that the indicators which NUDS
Indicator can refer.
- VUI indicator also refers some indicators from the Indicators of Decree 42 on
urban classification - the indicators are currently being applied, some indicators
under Decree 42-2009 also are the indicators that NUDS will inherit in the next
study.
- Data system of VUI urban indicators surveyed since 2009 cannot be updated on
the NUDS urban indicators, the Consultant can use to evaluate the variability of
the indicator data over time, accordingly identify and assess the problems of
urbanization Vietnam more objectively.
2.3. MOC Urban indicators (under Decree No. 42/NĐ-CP on urban
classification)
a) Purpose and objectives
According to Decree No. 42-2009 on urban classification, the Government issues this
Decree for the purpose:3
- To organize, arrange and develop the national urban system.
- To prepare, approve the urban construction planning.
- To improve the urban quality and sustainable urban development.
- To develop policies and mechanisms for urban management and urban
development.
Therefore the indicators of Circular No. 34-2009 that issued by MOC aim to meet the
following objectives:
- Provide some detailed contents of Decree 42/2009/NĐ-CP of the Government on
urban classification.
- Help People's Committee at all levels and relevant agencies grounds based on
standards with specific criteria to review the status of urban development, assess
the remaining problems. On that basis, continue to invest in urban construction
towards a synchronized and sustainable urban development.
b) Basis of indicators
The development of indicators in Circular No. 34 based on the following grounds:
- Based on the requirements and contents of Decree 42/2009/NĐ-CP dated
07/5/2009 of the Government on urban classification.
3 Under Article 2 of Decree No. 42/2009/NĐ-CP on Urban classification

21
- Based on Decision No. 445/QĐ-TTg dated 07/04/2009 approved by Prime
Minister on Adjustment of overall planning orientations for development of
Vietnam urban system by 2025 and vision to 2050.
- Regulations from the documents of the State such as National statistical norms
system; Census and the data in the Statistical Yearbook of General Statistics
Office (GSO);
- The development orientations of the State on urban areas
c) Structure of indicators
Indicators of MOC under Decree No.42-2009 provide details on some contents of
Decree 42/NĐ-CP/2009 including 6 standards with 49 norms (stipulated in detailed
in MOC Urban Indicators under Decree No.42/NĐ-CP-Appendix 3) as follows:
i. Urban function standards (7 norms) include 6 quantitative norms and 1
qualitative norm.
Position and nature (1 qualitative norm)
Economy and society (4 norms) include: Total revenues in the province;
Budget revenues and expenditures balance; Per capita income in year
compared to the whole country; Average economic growth in last 3 years;
Poverty rate; Annual population growth rate.
ii. Entire urban population size (3 norms), includes: Entire urban population;
Inner urban population; the rate of urbanization.
iii. Population density (1 norm) is the density of population
iv. Proportion of non-agricultural labor (1 norm) is the proportion of non-
agricultural labor
v. Urban infrastructure project system (30 norms) is divided into sectors:
Housing (2 norms): Average housing floor area; the rate of permanent, rather
permanent, semi-permanent houses.
Public Works at urban level (8 norms): Land for construction of public works
at residential quarter level; Civil land norm; Land for construction of urban
public works; Health facilities; Education and training institutions (including
universities, colleges and vocational training centers); Cultural centers,
cinema, theaters; Sport centers; Trade and service centers.
Transport system (5 norms): Traffic hubs; the rate of land for transport in the
inner urban areas compared to construction land in the inner urban areas; Road
density in the inner urban areas (taking into account road red line width ≥ 11.5
meters); the rate of serving public passenger transport; the area of land for
transport/ inner urban population.
Water supply system (3 norms): Water supply standards in the inner urban areas;
The rate of inner urban population supplied with clean water; The rate of water
loss.

22
Drainage system (3 norms): The density of the main sewer line in inner urban
areas; the rate of domestic wastewater treated; the rate of new production bases
with wastewater treatment plants.
Electricity supply system (3 norms): Electricity supply norms of inner urban
areas; the rate of inner urban main streets illuminated; the rate of alleys
illuminated.
Information and telecommunications system (1 norm): The average telephone
subscribers/ population.
Trees, waste collection and treatment and funeral homes (5 norms): Urban green
land; Public green land of inner urban areas; The rate of solid waste collected in
inner urban areas; The rate of solid waste treated in inner urban areas; Number of
funeral homes in inner urban areas.
vi. Architecture, urban landscape (7 norms) divided into sectors:
Regulations on management of the entire urban architecture (1 qualitative norm)
New urban areas (2 norms): New urban areas; urban improvement and
embellishment.
Urban civilization streets (1 norm): The rate of urban civilization street/ total
main streets in inner urban areas;
Public space (1 norm): Number of public space at urban level.
Typical architectural and architectural work complexes (2 norms): There are
the typical architectural works, cultural and historical works, heritages; the rate
of heritage, cultural, historical and typical architectural works restored and
embellished.
Table 3. Comparison of Commonly used International indicator groups and Proposed
indicator groups
No. Commonly used International
indicator groups
Draft of Indicators Version 1
1 Population Urban functional standards
2 Labour, Employment and Poverty The scale of whole urban population
3 Urban economy Population density
4 Land The proportion of non-agricultural
workers
5 Urban planning The system of urban infrastructure
projects
6 Housing Urban architecture and landscape
7 Traffic
8 Urban basic services
9 Urban Environmental Management
10 Urban Finance
11 Urban Management
d) Consideration and evaluation
Achievements:

23
- MOC urban indicators in Decree No.42 on classification is an important tool in
assessing urban existing situation, issuing plan, spending suitable power source
for urban quality and appearance improvement.
On 7/4/2009, Prime Minister issued Decision No. 455/QĐ-TTg on approving the
adjustments of overall planning orientations for development of Vietnam urban
system by 2025 and vision to 2050 and on 07/5/2009, Prime Minister issued
Decree No. 42/2009/NĐ-CP on urban classification, then on 30/9/2009, Ministry
of Construction issued Circular No. 34 providing details on some contents of
Decree No. 42/2009/NĐ-CP, in which, evaluation indicators with 6 standards and
49 norms helped urban areas have directions to strive to achieve the criteria of
quality improvement corresponding to recognizing the urbangrade . The MOC
urban indicators in the Decree 42/NĐ-CP-2009 on the urban classification is the
legal urban indicators carried out from 2009 to present.
After 5 years of implementation, the MOC urban indicators has become a positive
tool to help Urban government assess the urban situation, promulgate plans, put
appropriate resources to enhance the urban quality and appearance. Many urban
areas after type upgrading have confirmed that the role is motivation to promote
local and regional economic restructuring.
- Among 49 norms, there are 37 norms on infrastructure project and landscape
architecture
37 norms of infrastructure works and landscape architecture express the interest of
the State and urban governments to the life quality of the people in order to improve
living conditions for all strata of the population because the urban poverty is not only
income poverty, but also multidimensional poverty in relation to urban infrastructure.
These indicators created the interest of urban leaders in recent years in upgrading
urban infrastructure.
- Being consistent with statistical data management situation
MOC urban indicators with a total of 49 criteria integrated into the 6 standard groups
reflects the general and detail information; reflect a number of important areas related
to urban development reality, consistent with the statistical data management
situation. Thus, the statistical data in the upgrade project has high reliability and is
stamped for the endorsement by the local agencies.
Non-achievements:
- MOC urban indicators do not refer to the binding in the use of statistical
indicators for monitoring sanctions and urban quality control after recognizing
urban type upgrade.
In reality, the application of the MOC indicators meets many inadequacies, many
local governments have no plan and measures to monitor and overcome the lacked
standards and criteria, aiming at a comprehensive and developed urban area.
- There is no appropriate urban indicators to regulate for the specific urban areas
Many urban areas have in-depth individual characteristics and properties in the fields
of culture, landscape and environment or mining, industrial, agricultural and forestry
production such as Hue, Ha Long, Hoi An, Dung Quat, Nhon Trach and Phu Quoc ...
during applying the MOC indicators, it will be more criteria of population, population

24
density, landscape, road sections... which are difficult to perform and have incorrect
assessment compared with the specific functions of urban areas.
- Some norms of indicators needed to be changed to meet the requirements of urban development in the new period.
The indicators on urban infrastructure facilities are only for urban areas and inner
cities, so these indicators get high scores when be considered to increase grading.
However, in fact, the suburban areas and the outskirts still lack of clean water supply,
sewerage, solid waste management and environmental sanitation. According to the
criteria of National Programs, Strategies and Orientations in the period 2012 to 2020
on urban areas, require a consideration on the scale of the whole urban area. Thus,
that this problem well done is an important solution to remove the appearance of new
low-income areas arising from too large urban expansion to ensure the norms of the
urban population that has not interested to invest in infrastructure synchronously.
The criterion for the scale of whole urban population in the provisions of the MOC
indicators is quite high. Most urban areas are failed and calculate higher than the
reality including official and unofficial population. Due to higher provisions on
population size, many localities have actively expanded urban areas, get more
population from the surrounding areas to become urban residents. The expansion of
the urban boundary has created a lot of pressure in the sustainable urban management
and development due to unreasonable land use, increase of public investment
resources to not-in-need areas and the appearance of low-income residential areas.
- Some norms should be added to meet the new situation on climate change and the
integration trend with the urban areas in the region and around the world.
Our country is one of five countries in the region severely affected by climate change.
However, the indicators of Circular No. 34-2009 have not had indicators mentioning
this very important issue. This is issue needed to be researched and added aiming at
involving the attention of urban government and people in coping with climate
change and reducing disasters.
- The MOC indicator did not mention urban governance
This issue is mentioned in all international indicators such as the CA, WB, UH-
HABITAT and ADB. Because urban governance is closely related to the enforcement
of urban government in providing services to people and it depends on the capacity of
urban governments in the administration and urban management.
At the present time, the Ministry of Construction is soliciting opinions from various
agencies and social organizations for the draft to prepare for promulgating a Decree
replacing Decree No. 42/2009/NĐ-CP of the Goverment on Urban classification.
e) The inheritance of MOC indicators in the Decree No. 42-2009 for NUDS
- The indicators in the criteria group of "Urban function" are placed in correlation
with regional and national development planning. Thus, it reflected the position,
role and function of urban areas in the national urban system.
- The indicators in the criteria group of "population" are not feasible; especially
regulations of the entire urban population in the urban areas type III, IV and V

25
showed that there is no encouragement of development to the medium and small
urban areas.
- Criteria group of "percentage of non-agricultural workers" is not consistent with
the scope of assessment in the inner city or concentrated construction area.
According to the standards of international organizations, the percentage of non-
agricultural workers aims to evaluate labor structure of a locality or compare labor
structure among urban areas and is defined within the boundaries of this locality.
- The indicators in the criteria group of "urban infrastructure" are recently defined
on urban infrastructure and urban social infrastructure, and it is lack of norms on
urban environmental sanitation aiming to assess the urban life quality in more
detail. On the other hand, it only counts inner city/urban but excludes the entire
urban area, thus leading to many difficulties in life quality of people in the
suburbs, this also makes the asynchrony in urban infrastructure system.
- MOC indicators in Decree No. 42-2009 on urban classification are the legal
indicators currently being used by urban areas for urban classification, after study
and review, it is possible to include many indicators into NUDS indicators.
- Urban data system in the MOC urban indicators is not consistent from 2008 to
2015. So, NUDS indicators can only succeed the data from MOC indicators in
2014 to 2015, the other data will be exploited for analysis and comparation.
III. URBAN INDICATORS NUDS
According to the TOR of Task A, after reviewing the urban indicators and analyzing
the achievements and non-achievements of the urban indicators, the Consultants gave
the scope and priorities for data update and improvement. This is required for the
NUDS indicators meet. With this request Consultants suggested some following
contents:
3.1. Some requirements on the research scope and the priorities according to
TOR
Based on the project's objectives and the contents of the Task B on plannings,
investigations, surveys and researches agreed in the inception report, the data frame
focus on 9 fields and issues to highlight the characteristics of urbanization in
Vietnam. The details are in the following table:
Table 4: Expected research the scope and priorities according to TOR
No. Scope Contents should be considered
I Urban population Population size,
Population density,
Urbanization rate,
Population growth rate,
II Housing Floor area of housing,
Housing price,
Rents compared with the average income of
household/ month...

26
III Urban land The land area for urban construction,
The proportion of land reserved for development
under long-term plan.
IV Urban technical
infrastructure
The proportion of land for transport,
The proportion of transportation vehicles use,
Trees,
The percentage of households using fresh water,
Electricity supply,
Telephone,
Internet,
Garbage collection and disposal,
The proportion of costs for investment and
maintenance of technical infrastructure in the
annual budget of urban areas.
V Urban economy Total budget revenue,
Economic growth rate,
Revenues and expenditures balance
Income per capita
VI Social services in the
urban areas:
The land proportion for medical works,
Education,
Culture and society,
Sports,
Number of hospital beds/ 103 people,
The percentage of students attending the school,
Garbage collection,
Service costs compared with average income
VII Labour, Employment
and Income
The average income of households,
Poverty rate,
Child labor rate,
Unemployment rate
VIII Urban management
capacity
The number of administrative procedures about
the urban fields - construction done every year,
Number of public servants in urban management
department and indicators for evaluating urban
management capacity.
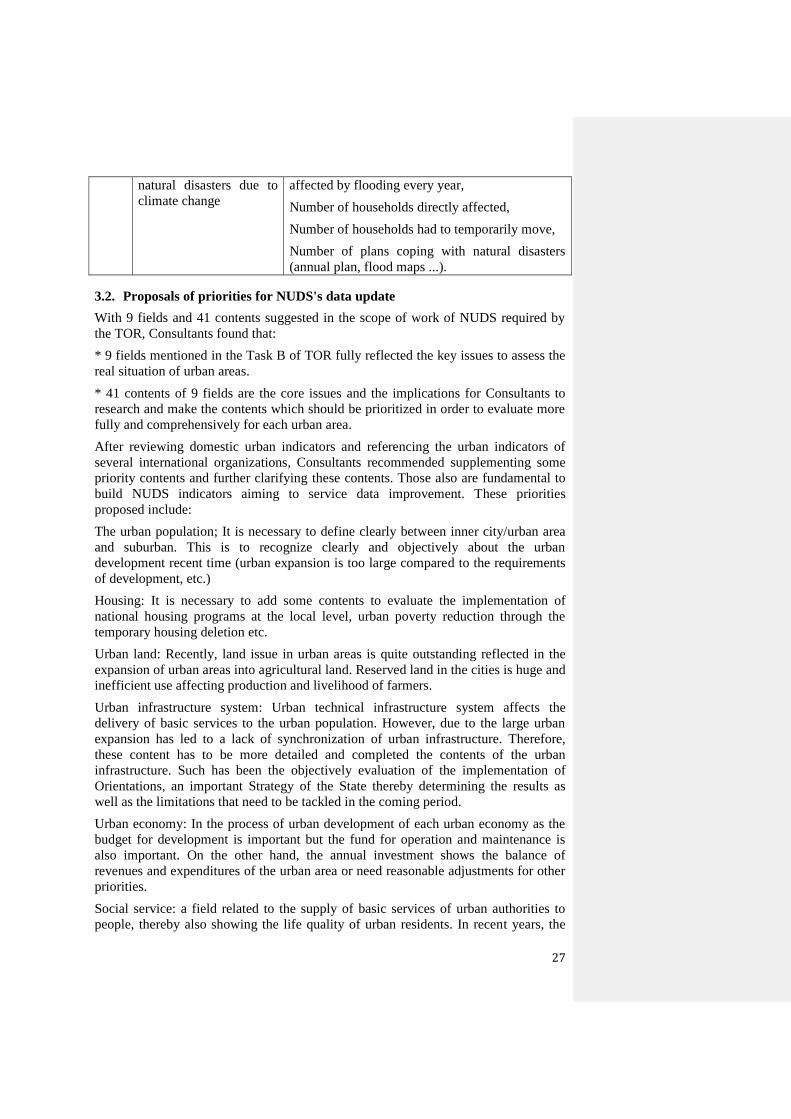
IX Coping with floods and The proportion of land area for urban construction
27
natural disasters due to
climate change
affected by flooding every year,
Number of households directly affected,
Number of households had to temporarily move,
Number of plans coping with natural disasters
(annual plan, flood maps ...).
3.2. Proposals of priorities for NUDS's data update
With 9 fields and 41 contents suggested in the scope of work of NUDS required by
the TOR, Consultants found that:
* 9 fields mentioned in the Task B of TOR fully reflected the key issues to assess the
real situation of urban areas.
* 41 contents of 9 fields are the core issues and the implications for Consultants to
research and make the contents which should be prioritized in order to evaluate more
fully and comprehensively for each urban area.
After reviewing domestic urban indicators and referencing the urban indicators of
several international organizations, Consultants recommended supplementing some
priority contents and further clarifying these contents. Those also are fundamental to
build NUDS indicators aiming to service data improvement. These priorities
proposed include:
The urban population; It is necessary to define clearly between inner city/urban area
and suburban. This is to recognize clearly and objectively about the urban
development recent time (urban expansion is too large compared to the requirements
of development, etc.)
Housing: It is necessary to add some contents to evaluate the implementation of
national housing programs at the local level, urban poverty reduction through the
temporary housing deletion etc.
Urban land: Recently, land issue in urban areas is quite outstanding reflected in the
expansion of urban areas into agricultural land. Reserved land in the cities is huge and
inefficient use affecting production and livelihood of farmers.
Urban infrastructure system: Urban technical infrastructure system affects the
delivery of basic services to the urban population. However, due to the large urban
expansion has led to a lack of synchronization of urban infrastructure. Therefore,
these content has to be more detailed and completed the contents of the urban
infrastructure. Such has been the objectively evaluation of the implementation of
Orientations, an important Strategy of the State thereby determining the results as
well as the limitations that need to be tackled in the coming period.
Urban economy: In the process of urban development of each urban economy as the
budget for development is important but the fund for operation and maintenance is
also important. On the other hand, the annual investment shows the balance of
revenues and expenditures of the urban area or need reasonable adjustments for other
priorities.
Social service: a field related to the supply of basic services of urban authorities to
people, thereby also showing the life quality of urban residents. In recent years, the

28
issue of public space, especially public spaces in residential areas and residential
complex are incomplete and do not meet requirements to serve children and the
elderly. Thus, this is the issue that should be considered as a priority.
Labor, employment and income: Along with contents of the poverty rate,
unemployment rate, per capita income and the rate of child labor/total of labor as well
as a number of issues to be considered as a priority relating to labor quality such as
percentage of workers trained, the percentage of workers employed and the rate of
non-agricultural workers.
Management capacity: Urban management capacity is a very important sector
showing the controlling ability of the urban government in the urban construction,
development and management. The management must be based on a legal basis, such
as General Urban Planning, Management Regulation of urban architecture, urban
development program approved by the authorized agencies and how non- permission
construction situation is, so on.
Coping with flood and natural disasters due to climate change. In recent years, the
issue of climate change is becoming more severe, but this field has not been
concerned by municipalities e.g. not make an action plan to respond to climate
change, urban water logging problems, relocation issues when having natural
disasters and floods plans to respond to emergencies etc. Therefore, in the preferred
content, it needs to be considered additionally to properly assess the actual situation.
IV. CONCLUSION
Based on the analysis of the scope and contents of the proposals of the Consultants, it
will be the basis for Consultants to conduct further research, review and identify the
indicators in each indicator group of NUDS urban indicatorswhich will be
implemented in Task B.

29
V. APPENDIX.
Appendix 1: Vietnam Urban Indicator – Version I
Group No. Indicators Unit
I. General
Original Indicators
GROU
P I
1 Urban grade Grade
2 Whole city population people
3 Whole city natural area ha
4 Urbanization %
II. Urban Population
Original Indicators
GROU
P II
5 Population inner city People
6 Population density inner city person/km2
7 Population density in whole city person/km2
Extended indicators
1 Natural population growth rate %/year
2 Mechanical population growth rate %/year
III. Labor, jobs and poverty
Original Indicators
GROU
P III
8 Non-agriculture labor %
9 Unemployed (%) %
10 Poor households in the city %
Extended indicators
3 Rate of employment lacking (%) %
4 Average income of employees Mil./year/perso
n
5 Rate of employee in the city %
6 Rate of trained employee %
IV. Urban Economy
Original Indicators
GROU
P IV
11 Total state budget revenue in the city Bil./year
12 Balance state budget /
13 Per capital income Mil.dong/perso
n. year
14 Urban construction capital Bil./year
V.Land and Urban Plan
Original Indicators
GROU
P V
15 Urban n construction land Area ha
16 Area inner and out of the city ha
17 Latest approved City master Plan Decision No.
18 Preserved land for development in long-term Plan Ha
Extended indicators
7 Urban construction density Person/ha
8 None-construction urban land %
9 Illegal residential land %
VI. Socio infrastructure Service
GROU
P VI
6.1.Residentital housing
Original Indicators

30
Group No. Indicators Unit
20 Rate of permanent housing %
21 Rate of slum (or low-income housing) %
22 Rate of residential land in the city %
23 Residential housing development Programme
approved by the Provinces Exist/None
24 Rate of shelter
%
25 Housing renting fee comparative with monthly
income of each household
Mil./month.Hou
seholds
6.2. Public works and socio- culture works
Original Indicators
26 Land for public works in residential area m2/person
27 Land for public works in the city m2/person
28 Health care bed/1000
people
29 Number of Education centers Number of Unit
30 Number of culture – sport centers Number of Unit
31 Number of Commercial – service Centers Number of Unit
6.3. Urban tree
32 Land for green tree in whole city (m2/person)
33 Land for green tree inner city (m2/person)
GROU
P VII
VII. Technical infrastructure
7.1. Transportation
Original Indicators
34 Rate of land for transportation /Urban land area %
35
Rate of land for transportation inner city/land area
inner city %
36 Density of main road (km/km2)
37 Rate of passenger public transportation (%) %
Extended indicators
10 Average moving in a trip from start place to office Minutes
7.2. Urban water supply
Original Indicators
38 Water supply source for city exist/None
39
Cosmetic urban water supply standard
(little/person.day&night)
Little/person.da
y&night
40 Rate of urban residents using pure water %
41 Rate of water lost (%). %
Extended indicators
11 Rate of standard domestic water %
12 Time of water supply interruption in a day Hour
7.3. Water drainage
Original Indicators
42 Rate of coverage water drainage inner city %
43 Rate of collected waste water %
44 Rate of treated domestic water %
45 Rate of treated waste water from industrial zone,
Export processing zone, industrial zone %
46 Rate of coverage waste drainage in whole city

31
Group No. Indicators Unit
47 Rate of connection works of households to the
water drainage system (%) %
7.4. Power supply
Original Indicators
48 Indicator of domestic electricity supply in urban
areas
KW/person/yea
r
49 Rate of alleys to be illuminated %
Extended indicators
13 Number of power supply interruption hour in a
year. Hour
14 Rate of recycling energy in the city %
7.5. Information and telecom system
Original Indicators
50 Number of subscribers unit/100 people
51 Rate of households connecting internet/100.000
people %
7.6. Solid waste
Original Indicators
52 Rate collected solid waste %
53 Rate of treated solid rate %
54 Rate of recycled solid rate %
Extended indicators
15 Rate of households having waste classification in
home %
7.7. Urban cemetery
Original Indicators
55 Number of funeral home and funeral in hospital
Number of
funeral
home/100.000
people
Extended indicators
16 The rate of cremation forms
Number of
cremated
people/ number
of dead
VIII. Urban environmental management
Original Indicators
56 Rate of households use sanitary latrines %
57 Built plan responding to Climate change Exist/None
GROU
P VIII
58 Rate of flooded land/city area %
59 Number of public toilet on the main street/1.5km in
urban downtown area
Num. of public
toilet/ 10.000
people
Extended indicators
17 Rate of Polluted air under standard limited %
GROU
P IX
IX. Urban management
60
Satisfaction levels of citizens and businesses to
provide the basic services of municipal
governments (of respondents satisfied on the
%

32
Group No. Indicators Unit
number of respondents)
61 City having website and collecting comments of
residents Exist/None
62 Regulations of urban architecture and plan
management Exist/None
63 Demand of urban management capacity Exist/None
Extended indicators
18 The provided service of government through
website/total provided services %
19 Data basic management of the city Exist/None

33
Appendix 2: Urban Observatory System Indicator (VUI)
Indicator Indicator description Unit
1. Overview (5)
TQ01 Management Level
TQ02 Urban grade Grade
TQ03 Total urban area Km 2
TQ04 Urban area Km 2
TQ05 Constructed urban land area Km 2
2. Population and Labour (15)
DS01 General Population People
DS02 Male People
DS03 Female People
DS04 Urban people People
DS05 Rural people People
DS06 Total households Households
DS07 Population growth rate per year %
DS08 Natural population growth rate %
DS09 Urban population growth rate %
DS10 Rural population growth rate %
LD01 Labour rate in population %
LD02 Unemployment rate %
LD03 Labour rate in population of working age %
LD04 Female labor rate (in total labor) %
LD05 Non-agricultural labor rate %
3. Poverty, Housing and social issues (29)
Ng01 Poverty rate (according to urban poverty standard) %
NO01 Rate of households with permanent housing %
NO02 Rate of households with semi-permanent housing %
NO03
Rate of households with less-permanent and simple
housing %
NO04 Floor area per capita m2 of floor / person
NO05 Floor area per capita in urban area m2 of floor / person
NO06 Rate of households lacking of housing %
NO07
% of Temporary/simple housings is cleared in 10 years
from 1999 to 2009 %
NO08 Is there financial resource for urban housing? Yes/No
NO09
How many households are likely to be displaced and
cleared? Cause for each type of household Households
GD01
Rate of female students comparing to male students in
primary school, secondary school, high school. %
GD02
Rate of female students comparing to male students in
primary school. %
GD03
Rate of female students comparing to male students in
secondary school. %
GD04
Rate of female students comparing to male students in
high school. %

34
Indicator Indicator description Unit
GD05
Number of students/teacher in primary school,
secondary school and high school. Students
YT01 Under-five mortality rate %
YT02 Number of deaths due to HIV People
YT03
Rate of infection and deaths due to malaria (/10,000
people) cases/ 10000 people
YT04
Rate of infection and deaths due to tuberculosis
(/10,000 people) cases/ 10000 people
YT05 Number of doctors/10000 people
Doctors/10000
people
YT06 Number of pharmacists/10000 people
Doctors/10000
people
YT07 Life expectancy Years-old
VH01 Number of cinemas Cinemas
VH02 Number of theaters Theaters
VH03 Number of district-level cultural houses Cultural House
VH04 Number of ward-level cultural houses Cultural House
AT01 Number of firemen/10000 people
Firemen/10,000
people
AT02 Number of fatal traffic accidents Accidents
AT03 Number of crimes/100000 people
Crimes/100,000
people
4. Environment and Urban infrastructure (36)
SDD1 Rate of land in construction land. %
SDD2 Rate of trees in construction land. %
SDD3 Land rate for urban transport in construction land. %
SDD4
Area rate of informal development areas in total urban
land area %
SDD5 Rate of land for industry in urban construction land %
GT01 Private cars/10000 people Cars/ 10000 people
GT02 Number of motorbikes per capita Motorbikes /person
GT03 Rate of passengers using public transport mean (bus) %
GT04 Is there railway in your urban center? Yes/No
GT05 Is there inland waterway in your urban center? Yes/No
GT06 Is there airport in your urban center? Yes/No
TNM1 Rate of urban roads with rainwater drainage system %
TNM2 Rate of rural roads with rainwater drainage system %
TNM3 Rate of urban area flooded at least 1 time/year %
CD01 Rate of households supplied with electricity %
CD02 Rate of urban households supplied with electricity %
CD03 Rate of rural households supplied with electricity %
CD04 Use of electricity per capita Kwh/ person/year
CD05
Rate of streets (with cross-sections from 1.5 m or
more) with artificial lighting %
TT01 Rate of Internet subscribers/100 people %
TT02 Rate of telephone subscribers/100 people %
TT03 Rate of mobile subscribers/100 people %
CN01 Rate of urban residents supplied with tap-water %
CN02 Rate of urban residents using tap-water %

35
Indicator Indicator description Unit
CN03 Rate of urban residents using other fresh water sources %
CN04 Use water per capita in family, use for living Liters/person/day
CN05 Rate of water loss %
VS01 Volume of solid waste of entire urban center Tons
VS02
% Urban population with regular collection of solid
waste %
VS03 Rate of solid waste collected %
VS04
Rate of solid waste is hygienically treated in total solid
waste %
VS05 Rate of urban households using sewage drain %
VS06 Is there sewage treatment plant in your urban center? Yes/No
VS07
Rate of industrial wastewater is collected and
processed. %
VS08 Is there funeral home in your urban center? Yes/No
VS09 Land area for cemeteries /10,000 people Ha/10.000 people
5. Urban Management and Finance (12)
KT01 Gross domestic product per capita of urban Million VND
KT02 Total local budget revenue Billion VND
KT03 Total local budget expenditure Billion VND
KT04 Domestic investment capital Billion VND
KT05 Foreign investment capital Million USD
KT06 Income per capita/month Million VND/person
KT07 Average economic growth rate in the last 3 years %
CQ01 Rate of People's Committee personnel in labor of city %
CQ02 Rate of female people in People's Committee %
CQ03 Number of average days to get a license Days
CQ04
In your urban center, Do people have right to involve
in planning economic-social development and budget? Yes/No
CQ05 Is there web in your urban center? Yes/No

36
Appendix 3: MOC urban indicators (under the Decree No 42/NĐ-CP/2009 on
classification of urban area)
No Assessment indicator
Unit
I Urban function
Location and nature of urban area
Economy and society
2 Total budget receivables in the region (billion dong/year)
3 Balance budget receivables and payables
4 Per capita income comparing to the whole country (time)
5 Average economic growth in 3 latest years (%)
6 Poverty rate (%)
7 Rate of annual population growth (%)
II Scale of the entire urban population
8 Population of the entire urban area (1000 people)
9 Urban population (1000 people)
10 Rate of urbanization (%)
III Population density
11 Population density (people/km2)
IV Rate of non-agricultural workmen
12 Rate of non-agricultural workmen (%)
V Urban infrastructure system
Housing
13 Average floor area for the urban area (m2
of floor/person)
14 Rate of permanent houses, semi-permanent houses inner city (%)
Urban public works
15 Construction land of regional public works (m2/person)
16 Target of civil land (m2/person)
17 Construction land of urban public service works (m2/person)
18 Health facilities (professional medical centers, hospital of
levels) (bed/1000 people)
19 Training and education facilities (universities, colleges,
vocational schools) (unit)
20 Cultural centers (theaters, cinemas, museums, cultural
houses) (work)
21 Sport centers (stadiums, gymnasiums, clubs) (work)
22 Commercial – Service center (market, supermarket, store...) (work)
Traffic system
23 Traffic nodes (airports, railway stations, ports, waterways,
bus station). (Level)
24 Rate of land in urban area traffic land comparing to
construction land in urban areas (%)
25 Road density in urban areas (taking into account road with
red line width ≥ 11.5 meters). (km/km
2)
26 Rate for serving public passenger transport (%) (%)
27 Traffic land area / urban population (m2/person)
Water supply system
28 Standard of domestic water supply for urban areas (litter/person/day
and night))

37
No Assessment indicator
Unit
29 Rate of urban population provided fresh water (%)
30 Rate of water loss (%)
Water drainage system
31 Density of main drains in urban areas (km/km2)
32 Rate of treated domestic wastewater (%)
33 Rate of new constructed production facilities with
wastewater treatment station (%)
Electricity supply system
34 Indicator of domestic electricity supply in urban areas (kwh/person/year)
35 Rate of main streets in urban areas to be illuminated (%)
36 Rate of alleys to be illuminated (%)
Information and telecom system
37 Number of average telephone subscribers /population (unit/100 people)
Trees, collection and treatment of waste and funeral
houses
38 Urban tree land
(m
2/people)
39 Public tree land in urban areas
(m
2/people)
40 Rate of collected solid waste in urban areas
(%)
41
Rate of treated solid waste in urban areas (appropriate
landfill, recycling, combustion technology)
(%)
42 Number of funeral houses in urban areas (house)
VI Urban architecture and landscape
Regulations of entire urban architecture management
43 Regulations of entire urban architecture management
New urban area
44 New urban area (area)
45 Urban renovation area (area)
Civilized urban streets
46 Rate of civilized urban streets/total main streets in urban
areas (%)
Public space
47 Number of urban public area (area)
6.5 Typical architecture work and architecture complex
48
Typical architecture works, history and culture works,
heritages:
a) a) to be recognized as the international /national level by
competent state agencies, professional associations or
international organizations
b) Recognized by competent state agencies or local
professional associations
49 Rate of restored and renovated typical architectural,
historical and cultural works
(%)