Identification of the current agricultural situation in Bhimphedi ...
115
Identification of the current agricultural situation in Bhimphedi (Nepal) and proposals for improvement Author: Héctor Escudero Leiva Director: Núria Cañameras 18th September 2018 Final project Agriculture engineering
-
Upload
khangminh22 -
Category
Documents
-
view
7 -
download
0
Transcript of Identification of the current agricultural situation in Bhimphedi ...

Identification of the current agricultural situation in Bhimphedi (Nepal) and
proposals for improvement
Author: Héctor Escudero Leiva
Director: Núria Cañameras
18th September 2018
Final project
Agriculture engineering
1
Resum
El present treball de fi de grau pretén esdevenir una eina per entendre l’agricultura de Bhimphedi, Nepal; on l’Escola Superior d’Agricultura de Barcelona, junt amb l’ONG Amics del Nepal, liderarà un projecte de dos anys de durada a partir d’agost del 2017.
Aquest treball es va realitzar durant la primera estada d’estudiants de l’ESAB, de l’agost de 2017 fins al Febrer de 2018. L’objectiu del qual va ser descriure l’agricultura local i factors socioeconòmics que poguessin condicionar el desenvolupament del projecte, mitjançant entrevistes a 25 famílies de la localitat triades a l’atzar amb l’ajut de fins a 5 intèrprets.
La majoria de famílies practicaven alguna mena d’agricultura i ramaderia de manera similar als seus ancestres. Tot i això, noves tecnologies, com l’ús de fertilitzants químics i pesticides, medicines comercials pels animals o eines mecàniques, estan esdevenint progressivament més accessible tant per pagesos professionals, com no professionals.
A més a més, s’han descrit diverses alternatives, de diferent durada i abast, als problemes detectats i manifestats per les famílies, com problemes amb el control de plagues o el desherbatge. Amb aquest objecte, es van visitar diferents iniciatives, tant públiques com privades, que pretenen impulsar el desenvolupament agrari al país. Es va determinar que aquestes iniciatives es poden adaptar al context i recursos de Bhimphedi, per tal de minvar els dèficits descrits.
2
Resumen
El presente trabajo de fin de grado pretende acontecer una herramienta para comprender la agricultura de Bhimphedi, Nepal; dónde la Escuela Superior de Agricultura de Barcelona (ESAB), junto con el ONG Amigos del Nepal, liderará un proyecto de dos años de duración a partir de agosto del 2017, con el objetivo de dinamizar el huerto y la agricultura de la localidad.
Este trabajo se realizó durante la estancia de los dos primeros estudiantes de la ESAB desplazados a Nepal, desde agosto de 2017 hasta Febrero de 2018. El objetivo del cual fue describir la agricultura local además de, factores socioeconómicos que pudieran condicionar el desarrollo del proyecto, mediante 25 entrevistas a familias de la localidad, realizadas al azar por el autor con la ayuda de intérpretes locales.
La mayoría de familias practicaban algún tipo de agricultura y ganadería de manera similar a sus ancestros. Aún así, nuevas tecnologías, como el uso de fertilizantes químicos y pesticidas, medicinas comerciales por los animales o herramientas mecánicas, son progresivamente más accesibles para agricultores profesionales y no profesionales.
Además, se describieron diferentes alternativas, de diferente duración y alcance, a los problemas detectados y manifestados por las familias, como problemas con plagas o desherbado. Fueron visitados diferentes iniciativas, tanto públicas como privadas, que pretende impulsar el desarrollo agrario en el país. Se determinó que dichas iniciativas se pueden adaptar al contexto y recursos de Bhimphedi, para menguar los déficits descritos.
3
Abstract
The present final project seeks to provide a tool to understand the agriculture of Bhimphedi, Nepal; where the Escola Superior d’Agricultura de Barcelona (ESAB) and the NGO Amics del Nepal, will led a two years long project together starting on August 2017 in order to improve the management of the kitchen garden held by the NGO in the village and simultaneously, improve farming management in the local households.
The present study was conducted during the first couple of ESAB students stage in Bhimphedi, from August 2017 to February 2018. The author, helped by 5 interpreters, conducted 25 random interviews in the village, in order to describe the local farming and socio-economic aspects that could conditionate the project.
Most of the families practiced some kind of farming in a similar way that they had learnt from their ancestors. However, new technologies, such as the use of chemical fertilizers and pesticides, commercial medicines for livestock or mechanical implements, are becoming of popular access among professional and non-professional farmers.
Moreover, there have been described some locally available and specific alternatives, of different duration and scope, to some of the farmers concerns like plagues or weeding. There were visited public and private agriculture development initiatives. We concluded that some initiatives could be adapted to the specific requirements and resources of Bhimphedi, in order to decline the described deficits.
4
Acknowledgments
I would like to thank Núria Cañameras and Cesar Ornat for trusting me in the wonderful project, that resulted in this academic . Thanks for sharing your knowledge with me. I would like to thank also the Centre de Cooperació pel Desenvolupament (CCD) from Universitat Politècnica de Barcelona (UPC), for the great work on international cooperation that you have been developing for more than 20 years and financing this project. I would like to extend my thanks to Montse Liesa, I hope you enjoy your retirement.
Thanks to all the team from Amics del Nepal, specially to Joan Fissé who gave us so many resources to success. Thanks for they altruist effort in translation to Kush, Arjun, Ranjita Lama and Shrawan Thapa. Special thanks to Surendra Sapkota, the director of Balmandir, for translation and opening so many doors without which this work would not have success.
Special thanks to my family, who always encouraged me and support me when things looked bad during this experience. Thanks to my closest friends, who followed my adventure with enthusiasm. Thanks to my colleagues volunteers in Bhimphedi, to Daylí Remuiñan Ackermann and specially to David Soler Pasqual who was always there and with whom I will always share many great memories.
5
Table of contents 1. Motivation of the study _______________________________________________ 12
2. Nepal ______________________________________________________________ 13
2.1. Orography and climatology ______________________________________________ 14
2.2. Climate change affectations ______________________________________________ 15
2.3. Social aspects _________________________________________________________ 16 2.3.1. Rural women state_________________________________________________________ 18 2.3.2. Religion and caste or ethnic group ____________________________________________ 20
2.4. Public agricultural research ______________________________________________ 22
3. Case of study: Bhimphedi Rural Municipality _____________________________ 23
3.1. The ward distribution ___________________________________________________ 23
3.2. Roads ________________________________________________________________ 24
3.3. Climate and geography _________________________________________________ 24
3.4. Celebrations __________________________________________________________ 25
3.5. Services ______________________________________________________________ 25 3.5.1. Local government office: Gaunpalika __________________________________________ 25 3.5.2. Agriculture office __________________________________________________________ 26 3.5.3. Banks ___________________________________________________________________ 26 3.5.4. Education ________________________________________________________________ 26 3.5.5. Health ___________________________________________________________________ 27 3.5.6. Commercial activity ________________________________________________________ 27
4. Agricultural and social aspects evaluated in Bhimphedi _____________________ 28
5. Objectives __________________________________________________________ 29
5.1. Main objective ________________________________________________________ 29
5.2. Specific objectives______________________________________________________ 29
6. Methodology _______________________________________________________ 30
6.1. References research ____________________________________________________ 30
6.2. Interviews ____________________________________________________________ 30
6.3. Analytical evaluation ___________________________________________________ 32
7. Results_____________________________________________________________ 35
7.1. Social aspects study ____________________________________________________ 35 7.1.1. Population _______________________________________________________________ 35 7.1.2. Religion, castes and ethnises _________________________________________________ 35
6
7.1.3. Languages _______________________________________________________________ 37 7.1.4. Labour and family income ___________________________________________________ 39
7.2. Diet, food preferences and restrictions _____________________________________ 43
7.3. Local land ownership regimes and fragmentation ____________________________ 44
7.4. Farm works ___________________________________________________________ 46 7.4.1. Soil preparation ___________________________________________________________ 46 7.4.2. Fertilizers ________________________________________________________________ 46 7.4.3. Irrigation ________________________________________________________________ 48 7.4.4. Pests and diseases management _____________________________________________ 49 7.4.5. Pests management and religion ______________________________________________ 52
7.5. Local crops and vegetables ______________________________________________ 53 7.5.1. Major cultivated species ____________________________________________________ 53 7.5.2. Yield ____________________________________________________________________ 56 7.5.3. Intercropping _____________________________________________________________ 57 7.5.4. Cropping calendar _________________________________________________________ 58 7.5.5. Weeding _________________________________________________________________ 59 7.5.6. Seed production and conservation problems ____________________________________ 60
7.6. Livestock _____________________________________________________________ 61
7.7. Cooperatives affiliation _________________________________________________ 63
7.8. The earthquake’s effects ________________________________________________ 65
8. Opportunities _______________________________________________________ 68
8.1. Compost production alternatives _________________________________________ 68
8.2. Intercropping _________________________________________________________ 70
8.3. Crop rotation __________________________________________________________ 71
8.4. Mulching _____________________________________________________________ 71
8.5. Mushroom greenhouses ________________________________________________ 72
8.6. Forestry ______________________________________________________________ 72
9. Conclusions _________________________________________________________ 73
10. Bibliography ______________________________________________________ 74
10.1. Bibliografia complementària ___________________________________________ 77
11. Attachment A _____________________________________________________ 78
12. Attachment B _____________________________________________________ 80
12.1. First interview model _________________________________________________ 80
12.2. Definitive interview model ____________________________________________ 83
7
13. Attachment C _____________________________________________________ 87
13.1. Major cultivated species glossary _______________________________________ 87
13.2. Crop calendar _______________________________________________________ 88
14. Attachment D _____________________________________________________ 95
14.1. Mashura ___________________________________________________________ 95
14.2. Mustard press _______________________________________________________ 96
15. Attachment E _____________________________________________________ 97
15.1. Mushroom greenhouse _______________________________________________ 97
16. Attachment F ____________________________________________________ 100
16.1. Bhimphedi Agricultural office: Interview with Bijay Chandra Responsible of the office 100
16.2. Bhimphedi local government: Interview with Hidam Lama responsible of the Gaunpalika ________________________________________________________________ 102
16.3. Interview at Shree Mahila Jagriti women cooperative of Bhimphedi _________ 103
16.4. Interview at NiC Asia bank of Bhimphedi ________________________________ 105
16.5. Interview at Century Council bank of Bhimphedi __________________________ 106
16.6. Interview with Mahen Shrestha _______________________________________ 107
16.7. Interview at Central Horticulture Centre ________________________________ 109
16.8. Interview at National Agriculture Research Centre ________________________ 110
17. Attachment G ____________________________________________________ 112
8
Figures index
Figure 1 Population pyramid of Nepal (Source: National Population Census, 2011) ___________ 13
Figure 2 Map of ecological zones with physiographic regions. Source: Lillesø et al. (2005) _____ 15
Figure 3 GDP per capita based on purchasing power parity (PPP) evolution in Nepal and its adjoining countries and Spain. Source: World Bank, 2011. __________________________________ 16
Figure 4 HDI evolution in Nepal and its adjoining countries and Spain. Source: United Nations Development Programme, 2016. ______________________________________________ 17
Figure 5 Youth literacy rate evolution in Nepal and its adjoining countries and Spain. Source: UNESCO eAtlas of Literacy ___________________________________________________ 17
Figure 6 Females as a percent of the agricultural labour force. Source: Compilation based on Dixon (1982). ___________________________________________________________________ 19
Figure 7 Population distribution in Nepal by religion. Source: Central Bureau of Statistics (2015) 20
Figure 8 Population distribution in Makwanpur district by religion. Source: Central Bureau of Statistics (2015) ____________________________________________________________ 21
Figure 9 Hierarchy of Nepalese agriculture research public system. _______________________ 22
Figure 10 Bhimphedi Rural Municipality ward distribution map __________________________ 23
Figure 11 Population by castes/ethnises in Bhimphedi studied wards _____________________ 35
Figure 12 Population by castes/ethnises in Bhimphedi Rural Municipality (Central Bureau of Statistics, 2014) ____________________________________________________________ 36
Figure 13 Population by castes/ethnises distribution among Bhimphedi studied wards _______ 37
Figure 14 Population by mother tongue in Bhimphedi Rural Municipality (Central Bureau of Statistics, 2014) ____________________________________________________________ 37
Figure 15 Population by caste/ethnise tongue in Bhimphedi Rural Municipality (Central Bureau of Statistics, 2014) ____________________________________________________________ 38
Figure 16 Population pyramid of Bhimphedi Rural Municipality (Central Bureau of Statistics, 2014) _________________________________________________________________________ 41
9
Figure 17 Number of affected households per pest ____________________________________ 49
Figure 18 Extensive crops distribution among the studied households _____________________ 53
Figure 19 Vegetable distribution among the studied households _________________________ 54
Figure 20 Fruit trees distribution among the studied households _________________________ 54
Figure 21 Relation of most important crops in the studied households. ____________________ 55
Figure 22 Proportion of households producing seeds by specie in the studied households. ____ 60
Figure 23 Number of families holding animals among the studied households ______________ 62
Figure 24 2015 earthquake damage in Bhimphedi by house and ward _____________________ 66
Figure 25 Bhimphedi Bajar and Chabeli in 2003. The ancient public school inside the blue square. Source: Moncunill et al. (2003)________________________________________________ 67
Figure 26 Visit to a beneficiary farmer in Aambhanjyang ________________________________ 69
Figure 27 Vermicopost aspect and used worms in Aambhanjyang ________________________ 70
Figure 28 Location of Nepal _______________________________________________________ 78
Figure 29 Location of Makwanpur district. Source: Web of the United Nations ______________ 78
Figure 30 Bhimphedi location: Road from Kathmandu to Bhimphedi. Source: Google maps ____ 79
Figure 31 Mashura balls on a nanglo tray. ___________________________________________ 95
Figure 33 Pesticide from mushroom farm in Panauti: G-Surakshya _______________________ 98
Figure 34 Pesticide from mushroom farm in Panauti: Pawesti ___________________________ 98
Figure 32 Decis pesticide composition and uses _______________________________________ 98
Figure 35 Pesticide from mushroom farm in Panauti: Decis _____________________________ 98
Figure 36 Pesticide from mushroom farm in Panauti: Nuvan ____________________________ 99
Figure 37 Pesticide from mushroom farm in Panauti: Formalin___________________________ 99
Figure 38. Interviewed households location maps ____________________________________ 113
10
Tables index
Table 1 Gender indexes in Nepal and its adjoining countries and Spain. Source: United Nations Development Programme, 2016. ______________________________________________ 18
Table 2 Average monthly water balances (mm) precipitation minus potential evapo-transpiration in Sub-tropical and Humid zone. Source: Lillesø et al. (2005) ________________________ 24
Table 3 Average month temperature (ºC) in Sub-tropical - Humid zone. Source: Lillesø et al. (2005) _________________________________________________________________________ 25
Table 4 Population aged 5 years and above by literacy status and sex (Central Bureau of Statistics, 2014) ____________________________________________________________________ 39
Table 5 Studied households by agriculture related products sold by sales channel and price ___ 40
Table 6 Equivalence between Nepalese surface units and International System (Cristià, 2007) _ 44
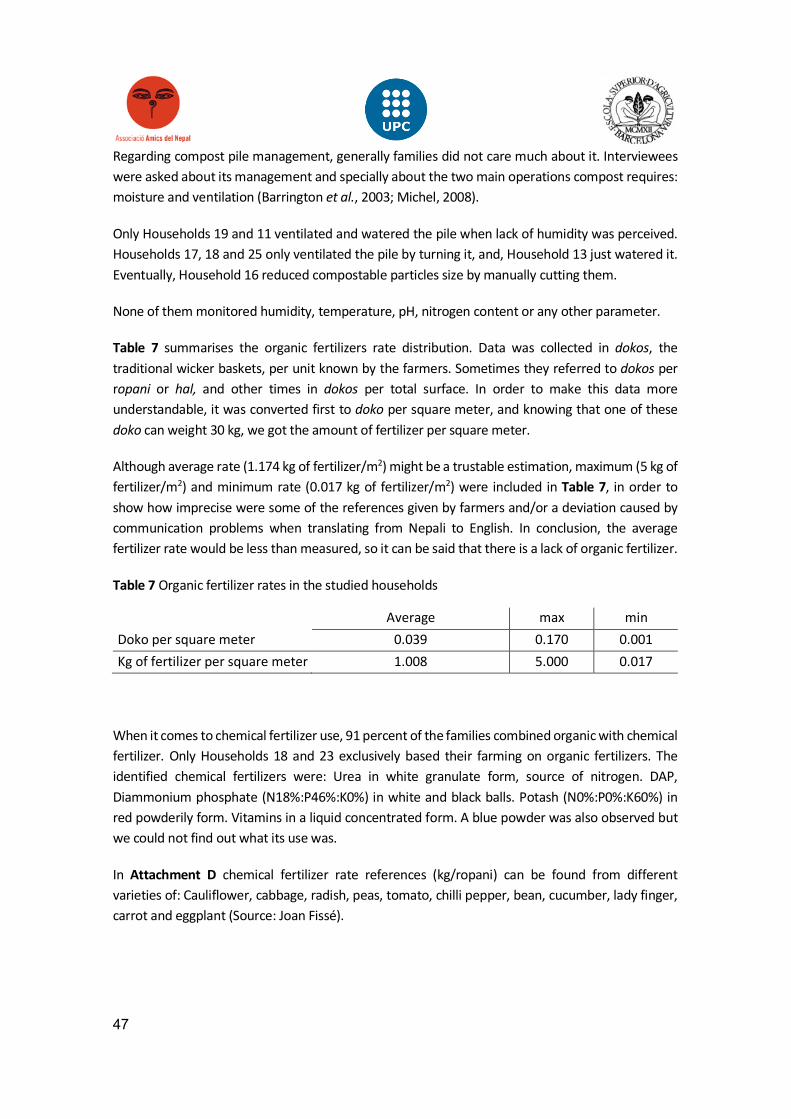
Table 7 Organic fertilizer rates in the studied households _______________________________ 47
Table 8 Usual chemical fertilizers used in the studied households ________________________ 48
Table 9 Irrigated and rain fed land distribution in the studied households by ward ___________ 48
Table 10 Yield comparative between collected and official data (Ministry of Agriculture, 2017) _ 56
Table 11 Studied households yield perception in kg/m2 (max: maximum; min: minimum) _____ 57
Table 12 Intercropping combinations found among the studied households ________________ 59
Table 13 Number and percentage of weedings per family in the studied households. ________ 60
Table 14 Number of families by seed conservation problems from the studied households. ___ 61
Table 15 Number of families rising livestock__________________________________________ 63
Table 16 Number of studied households per cooperative _______________________________ 64
Table 17 Number of studied households per services received by a local cooperative ________ 65
Table 18 Shree Mahila Jagriti women cooperative employees information ________________ 104
Table 19 Interviewed households coordinates and ward. ______________________________ 112
11
Acronyms
AN: Amics del Nepal
AWASUKA: Aawaas Sudhar Karyakram (house improvement program)
ESAB: Escola Superior d’Agricultura de Barcelona
CBS: Central Bureau of Statistics
CC: Climate change
CFUGs: Community Forest User Groups
FAO: Food and Agriculture Organization
FUGs: Forest User Groups
GDP: Gross Domestic Product
GHGs: Greenhouse gases
HDI: Human Development Index
LDCs: Least Developed Countries
NARC: National Agriculture Research Council or National Agriculture Research Centre
NCO: Nepal Children Organisation
OECD: Organisation for Economic Co-operation and Development
UNESCO: United Nations Educational, Scientific and Cultural Organization
USAID: United State Agency for International Development
UPC: Universitat Politècnica de Barcelona
12
1. Motivation of the study
This academic work emerges from a new collaboration project between “Escola Superior d’Agricultura de Barcelona” (ESAB) de la Universitat Politècnica de Catalunya (UPC) and the Catalan NGO “Amics del Nepal” (AN).
This NGO runs children home in Bhimphedi, which belongs to Nepal Children Organization. Nevertheless, the global management is carried out by AN, which has been developing educative agriculture projects in different areas of Nepal since 1995. The centre has a 7,000 square metres kitchen garden. The centre was rebuilt in 2002, partially financed by the NGO, and has been managed by them since that time with the support of Nepal Children Organisation (NCO), the governmental institution in charge of orphans.
This horticultural parcel feeds partially the children, the staff and the volunteers. The main point of the collaboration was to improve the kitchen garden’s production while respecting the local methods and resources, promoting organic agriculture and showing the children home community different ways of growing vegetables and fruits using it as a pedagogic tool.
Two students from ESAB contacted with AN in order to see if there was any collaboration opportunity. ESAB professors evaluated the possibilities with the students. Finally, four ESAB students travelled to Bhimphedi where they stayed from August 2017 to June 2018 (in two stages). The author of this TFG lived in this village from August 2017 to February 2018, at the beginning of this two year project.
Even though there were precedents of collaboration between AN and ESAB in Bhimphedi, resulting on two final projects which analysed the local situation (Moncunill et al., 2003; Cristià, 2007), we considered that this new project required an update of this two academic documents. Furthermore, the author of the present work had interest in conducting a study to get to know different methodologies of describing agricultural systems to propose locally-specific alternatives for improvement, therefore there were randomly chosen 25 households in the area of influence.
Bhimphedi is a rural municipality with 5,440 inhabitants. It is located in Makawanpur district, a 420,477 people district (Central Bureau of Statistics, 2015) which belongs to state number three, one of the seven federal provinces established by the 2015 Constitution. Bhimphedi’s location is further described in Appendix A.
To lead this project, we needed to have as much information as possible. This time, focusing the research on local crops and vegetables and varieties and their management techniques, the fertilizers used and its management, soil preparation, and locally available technology.
13
2. Nepal
The Federal Democratic Republic of Nepal is a country located in Asia (Figure 28), next to one of the main world powers such as India in the South, and China on the North. After overcoming an absolute monarchy, a ten years of civil war and different unstable governments leading the country, Nepal has apparently reached certain political stability that will benefit the country’s development.
It has an extension of 147,181 km2, and its capital is Kathmandu, the most populated city in the country with 1,744,240 inhabitants. The national currency is the Nepalese rupee (NPR).
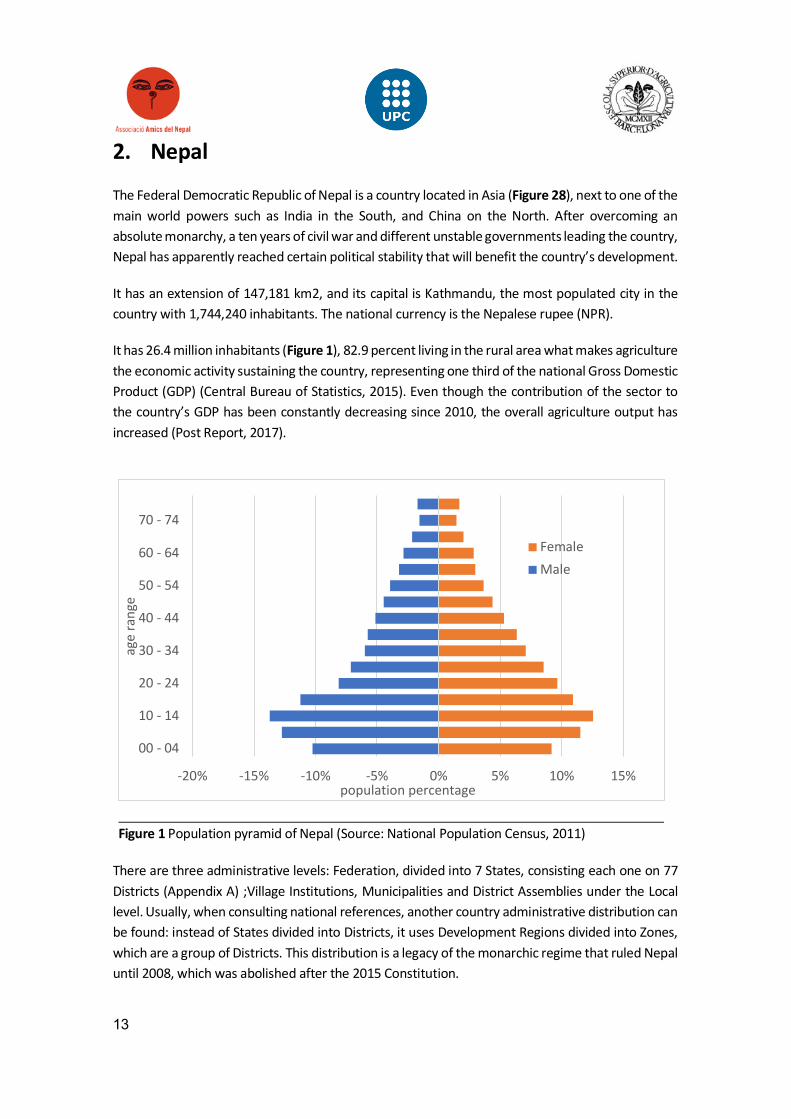
It has 26.4 million inhabitants (Figure 1), 82.9 percent living in the rural area what makes agriculture the economic activity sustaining the country, representing one third of the national Gross Domestic Product (GDP) (Central Bureau of Statistics, 2015). Even though the contribution of the sector to the country’s GDP has been constantly decreasing since 2010, the overall agriculture output has increased (Post Report, 2017).
There are three administrative levels: Federation, divided into 7 States, consisting each one on 77 Districts (Appendix A) ;Village Institutions, Municipalities and District Assemblies under the Local level. Usually, when consulting national references, another country administrative distribution can be found: instead of States divided into Districts, it uses Development Regions divided into Zones, which are a group of Districts. This distribution is a legacy of the monarchic regime that ruled Nepal until 2008, which was abolished after the 2015 Constitution.
-20% -15% -10% -5% 0% 5% 10% 15%
00 - 04
10 - 14
20 - 24
30 - 34
40 - 44
50 - 54
60 - 64
70 - 74
population percentage
age
rang
e
FemaleMale
Figure 1 Population pyramid of Nepal (Source: National Population Census, 2011)
14
2.1. Orography and climatology
Nepal is close to the Tropic of Cancer, but due to its topography, it has from hot and humid tropic climate in the Tarai region to alpine winter in the Himalayas. The country’s reach river system distributes water around the country.
Traditionally, Nepal has been classified in three different climatic regions: Mountain, Hills and Tarai (Plains) (Central Bureau of Statistics, 2015).
The Mountain region is the less populated one (6.73 percent) because of its topography and climate. It goes from 4,877 meters to 8,848 meters above the sea level. It has the highest mountain in the Globe, the Mount Sagarmatha also known as Mount Everest.
The Hills region ranges from 610 meters to 4,877 meters, and it holds the Kathmandu valley the densest area in the country, and also the Pokhara valley. 43.1 percent of Nepal’s population lives in this region.
The Tarai region is the lowest and plainest region which accommodates 52.27 percent of the population because of climate, water availability and soil fertility (Central Bureau of Statistics, 2015).
These three climatic regions share the same monsoon wind, which means that there is a wet season from May to September. Over the country there are regions with 7 to 12 dry months (Lillesø et al., 2005). In 2017, monsoon started in the second week of June (Post District, 2017).
More climatic classifications were found, for example in the 1980’s the Land Resources Mapping Project further detailed the physiographic classes into: Tarai, Siwaliks, Mid-Hills, High Mountains and High Himalayan (IUCN, 2015).
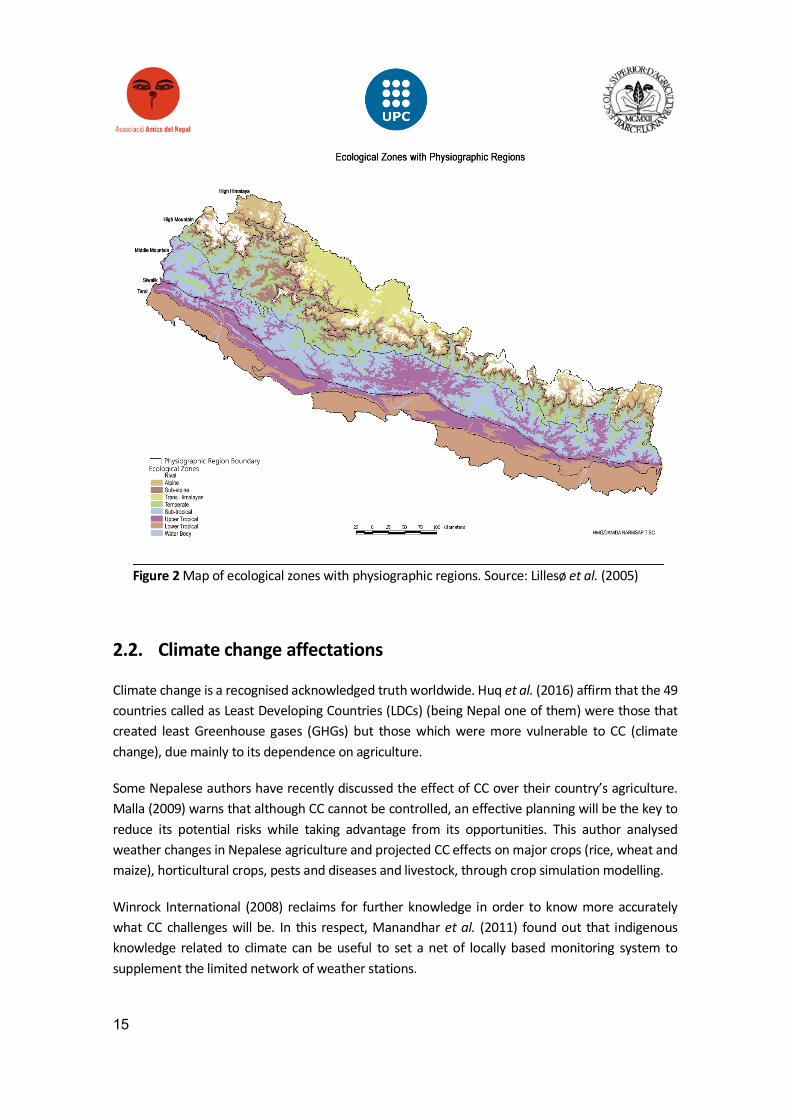
A new climatic classification was published in 2005 by the University of Copenhagen and Nepalese researchers. The aim of this work was to elaborate a map of potential vegetation of Nepal in order to establish “a good framework for understanding the tremendous variation of climate, vegetation, farming systems, and biodiversity in Nepal” to help people working in Nepal managing natural resources (Lillesø et al., 2005).
This new climatic classification of the country, resulted in “The map of potential vegetation of Nepal” which is mainly based on potential evapo-transpiration, average temperature by ecological zone, frost and moisture regions (Figure 2).
15
2.2. Climate change affectations
Climate change is a recognised acknowledged truth worldwide. Huq et al. (2016) affirm that the 49 countries called as Least Developing Countries (LDCs) (being Nepal one of them) were those that created least Greenhouse gases (GHGs) but those which were more vulnerable to CC (climate change), due mainly to its dependence on agriculture.
Some Nepalese authors have recently discussed the effect of CC over their country’s agriculture. Malla (2009) warns that although CC cannot be controlled, an effective planning will be the key to reduce its potential risks while taking advantage from its opportunities. This author analysed weather changes in Nepalese agriculture and projected CC effects on major crops (rice, wheat and maize), horticultural crops, pests and diseases and livestock, through crop simulation modelling.
Winrock International (2008) reclaims for further knowledge in order to know more accurately what CC challenges will be. In this respect, Manandhar et al. (2011) found out that indigenous knowledge related to climate can be useful to set a net of locally based monitoring system to supplement the limited network of weather stations.
Figure 2 Map of ecological zones with physiographic regions. Source: Lillesø et al. (2005)
16
This indigenous knowledge pointed by Manandhar et al. (2011) also allows Nepalese farmers to mitigate CC effects in the short term. The publication demands public policies changes to encourage locally-specific, low cost and long-term sustainable strategies out of farmers reach, and draws some proposals. In this regard, FAO (2009) alerted that smallholders adaptation to CC risks would be critical for global poverty reduction and food security while suggesting some agroecosystem changes in order to tackle this challenge.
2.3. Social aspects
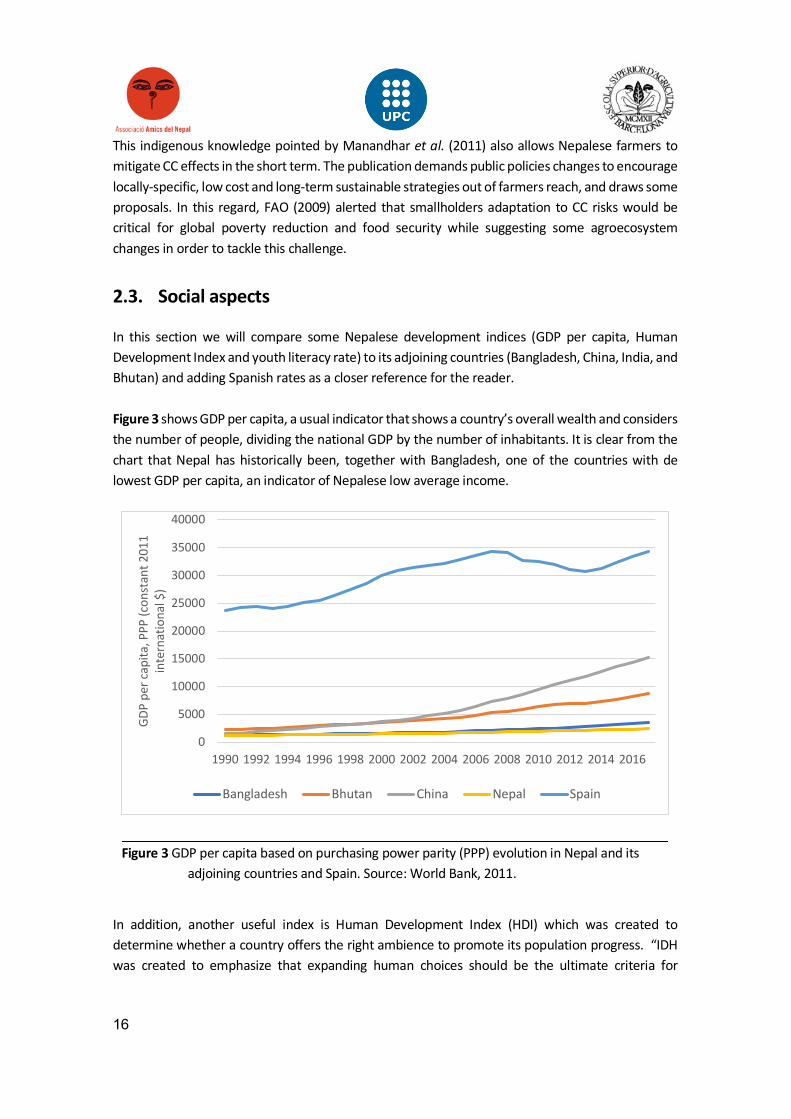
In this section we will compare some Nepalese development indices (GDP per capita, Human Development Index and youth literacy rate) to its adjoining countries (Bangladesh, China, India, and Bhutan) and adding Spanish rates as a closer reference for the reader. Figure 3 shows GDP per capita, a usual indicator that shows a country’s overall wealth and considers the number of people, dividing the national GDP by the number of inhabitants. It is clear from the chart that Nepal has historically been, together with Bangladesh, one of the countries with de lowest GDP per capita, an indicator of Nepalese low average income.
In addition, another useful index is Human Development Index (HDI) which was created to determine whether a country offers the right ambience to promote its population progress. “IDH was created to emphasize that expanding human choices should be the ultimate criteria for
Figure 3 GDP per capita based on purchasing power parity (PPP) evolution in Nepal and its adjoining countries and Spain. Source: World Bank, 2011.
0
5000
10000
15000
20000
25000
30000
35000
40000
1990 1992 1994 1996 1998 2000 2002 2004 2006 2008 2010 2012 2014 2016
GDP
per c
apita
, PPP
(con
stan
t 201
1 in
tern
atio
nal $
)
Bangladesh Bhutan China Nepal Spain
17
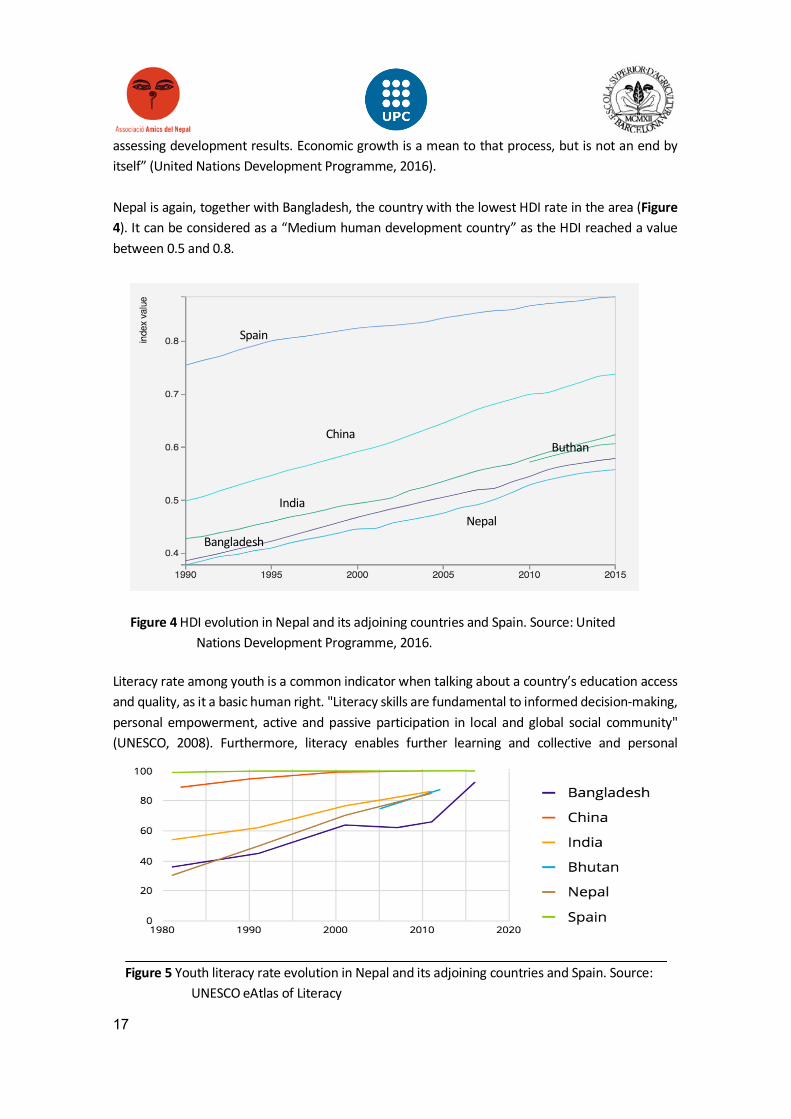
assessing development results. Economic growth is a mean to that process, but is not an end by itself” (United Nations Development Programme, 2016). Nepal is again, together with Bangladesh, the country with the lowest HDI rate in the area (Figure 4). It can be considered as a “Medium human development country” as the HDI reached a value between 0.5 and 0.8.
Literacy rate among youth is a common indicator when talking about a country’s education access and quality, as it a basic human right. "Literacy skills are fundamental to informed decision-making, personal empowerment, active and passive participation in local and global social community" (UNESCO, 2008). Furthermore, literacy enables further learning and collective and personal
Figure 5 Youth literacy rate evolution in Nepal and its adjoining countries and Spain. Source: UNESCO eAtlas of Literacy
Spain
China
India
Buthan
Bangladesh Nepal
Figure 4 HDI evolution in Nepal and its adjoining countries and Spain. Source: United Nations Development Programme, 2016.

18
progress, which is one of the porpoises of the project. Figure 5 shows that Nepal and Bangladesh have the lowest rates.
2.3.1. Rural women state
The United Nations Development program offers two indexes to understand women situation in every country, the Gender Inequality Index (GII) and the Gender Development Index (GDI) (Table 1). These indexes are important for us, as gender inequality should be taken into account in any project in order to reduce the gap between men and women rights and resources.
GII shows the negative impact of human development caused by gender inequality. There is no country with perfect genre inequality. Hence, every country’s human development is undermined when GII is considered.
Moreover, GDI explores differences between men and women on three basic human development areas: health, education and command over economic resources.
Gender Development Index Gender Inequality Index
Value Value HDI rank Country
27 Spain 0,974 0,081
131 India 0,819 0,530
132 Bhutan 0,900 -
139 Bangladesh 0,927 0,520
144 Nepal 0,925 0,497
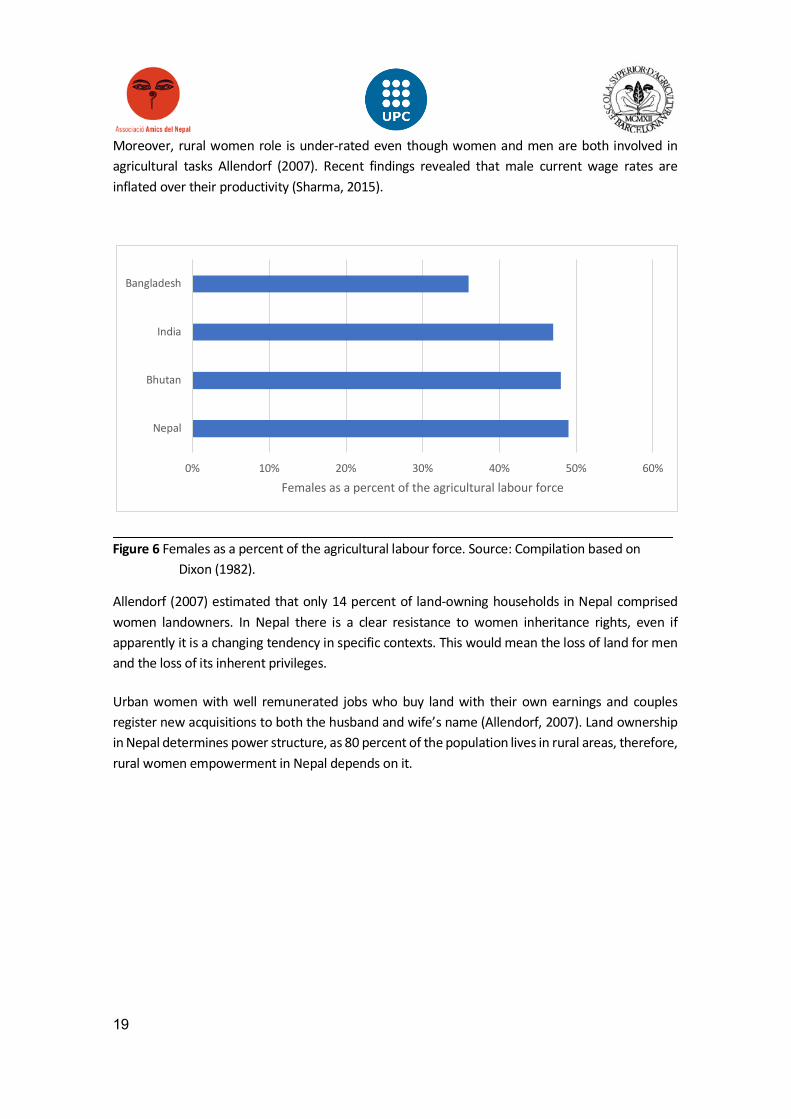
Regarding exclusively rural women in Nepal, they represent 43 percent of the total eighty three percent population living in the rural areas in Nepal. Even if they sustain the vast majority of population of the country (FAO, 2016), women labour percent in farming is usually underestimated, representing almost 50 percent (Figure 6).
Land ownership in Nepal determines power structure, as 80 percent of the population lives in rural areas, therefore rural women empowerment in Nepal depends on it and, therefore, a lack of land rights for women lowers productivity Allendorf (2007).
Table 1 Gender indexes in Nepal and its adjoining countries and Spain. Source: United Nations Development Programme, 2016.
19
Moreover, rural women role is under-rated even though women and men are both involved in agricultural tasks Allendorf (2007). Recent findings revealed that male current wage rates are inflated over their productivity (Sharma, 2015).
Allendorf (2007) estimated that only 14 percent of land-owning households in Nepal comprised women landowners. In Nepal there is a clear resistance to women inheritance rights, even if apparently it is a changing tendency in specific contexts. This would mean the loss of land for men and the loss of its inherent privileges. Urban women with well remunerated jobs who buy land with their own earnings and couples register new acquisitions to both the husband and wife’s name (Allendorf, 2007). Land ownership in Nepal determines power structure, as 80 percent of the population lives in rural areas, therefore, rural women empowerment in Nepal depends on it.
Figure 6 Females as a percent of the agricultural labour force. Source: Compilation based on Dixon (1982).
0% 10% 20% 30% 40% 50% 60%
Nepal
Bhutan
India
Bangladesh
Females as a percent of the agricultural labour force
20
2.3.2. Religion and caste or ethnic group
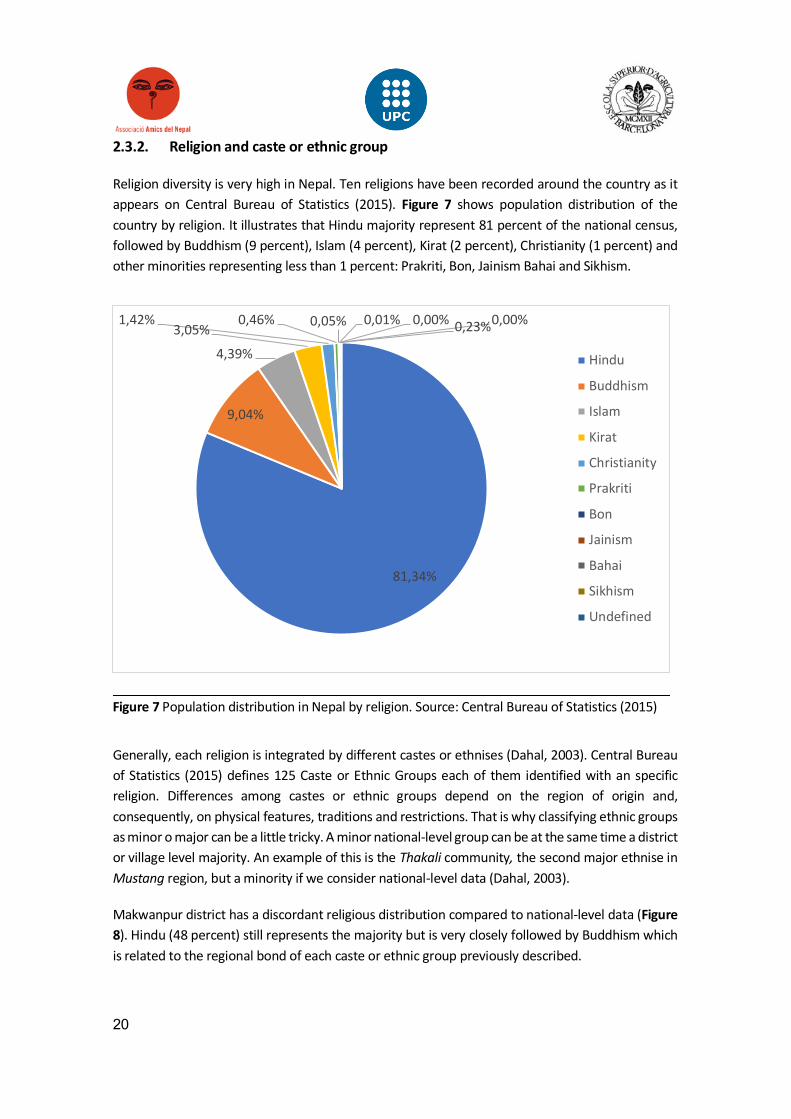
Religion diversity is very high in Nepal. Ten religions have been recorded around the country as it appears on Central Bureau of Statistics (2015). Figure 7 shows population distribution of the country by religion. It illustrates that Hindu majority represent 81 percent of the national census, followed by Buddhism (9 percent), Islam (4 percent), Kirat (2 percent), Christianity (1 percent) and other minorities representing less than 1 percent: Prakriti, Bon, Jainism Bahai and Sikhism.
Generally, each religion is integrated by different castes or ethnises (Dahal, 2003). Central Bureau of Statistics (2015) defines 125 Caste or Ethnic Groups each of them identified with an specific religion. Differences among castes or ethnic groups depend on the region of origin and, consequently, on physical features, traditions and restrictions. That is why classifying ethnic groups as minor o major can be a little tricky. A minor national-level group can be at the same time a district or village level majority. An example of this is the Thakali community, the second major ethnise in Mustang region, but a minority if we consider national-level data (Dahal, 2003).
Makwanpur district has a discordant religious distribution compared to national-level data (Figure 8). Hindu (48 percent) still represents the majority but is very closely followed by Buddhism which is related to the regional bond of each caste or ethnic group previously described.
81,34%
9,04%
4,39%
3,05%1,42% 0,46% 0,05% 0,01% 0,00% 0,00%0,23%
Hindu
Buddhism
Islam
Kirat
Christianity
Prakriti
Bon
Jainism
Bahai
Sikhism
Undefined
Figure 7 Population distribution in Nepal by religion. Source: Central Bureau of Statistics (2015)

21
Lots of festivals, related to the different religious and regional celebrations, are yearly celebrated in Nepal, which would have to be considered when elaborating any project schedule.
48,26%
45,57%
0,42%
0,05% 4,84% 0,66%0,01%0,00%0,00% 0,00% 0,19%
Hindu
Buddhism
Islam
Kirat
Christianity
Prakriti
Bon
Jainism
Bahai
Sikhism
Undefined
Figure 8 Population distribution in Makwanpur district by religion. Source: Central Bureau of Statistics (2015)
22
2.4. Public agricultural research
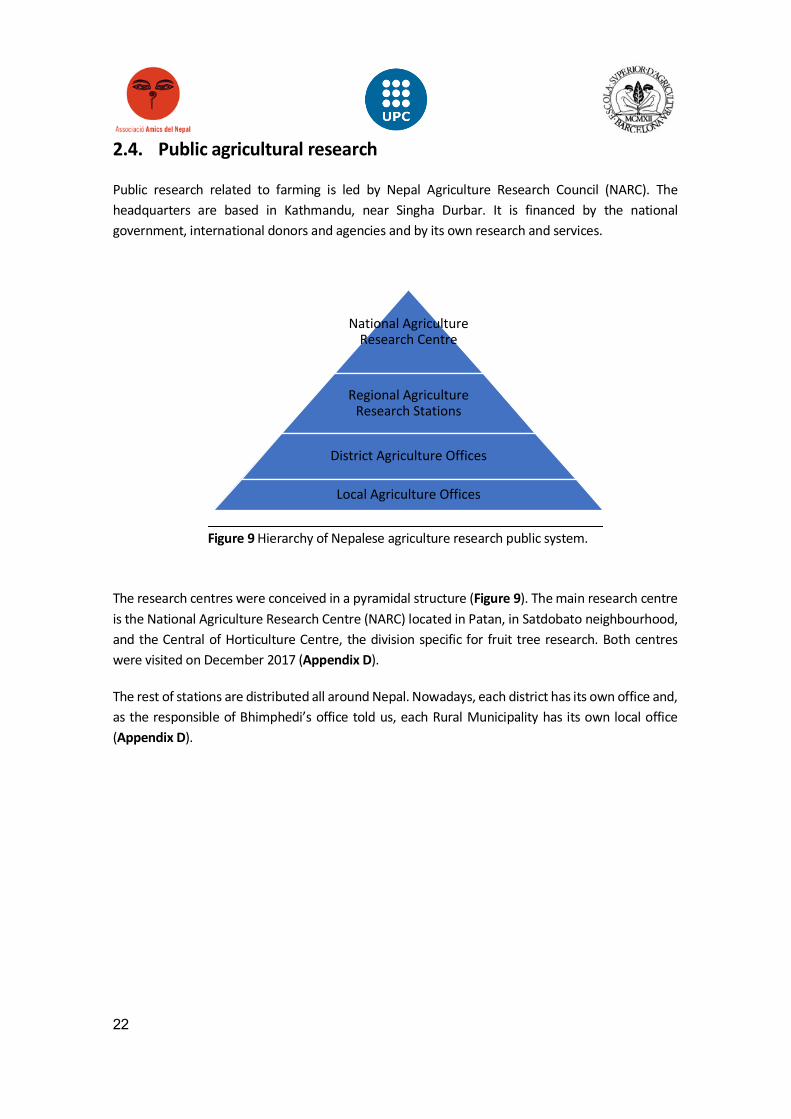
Public research related to farming is led by Nepal Agriculture Research Council (NARC). The headquarters are based in Kathmandu, near Singha Durbar. It is financed by the national government, international donors and agencies and by its own research and services.
The research centres were conceived in a pyramidal structure (Figure 9). The main research centre is the National Agriculture Research Centre (NARC) located in Patan, in Satdobato neighbourhood, and the Central of Horticulture Centre, the division specific for fruit tree research. Both centres were visited on December 2017 (Appendix D).
The rest of stations are distributed all around Nepal. Nowadays, each district has its own office and, as the responsible of Bhimphedi’s office told us, each Rural Municipality has its own local office (Appendix D).
National Agriculture Research Centre
Regional Agriculture Research Stations
District Agriculture Offices
Local Agriculture Offices
Figure 9 Hierarchy of Nepalese agriculture research public system.
23
3. Case of study: Bhimphedi Rural Municipality
3.1. The ward distribution
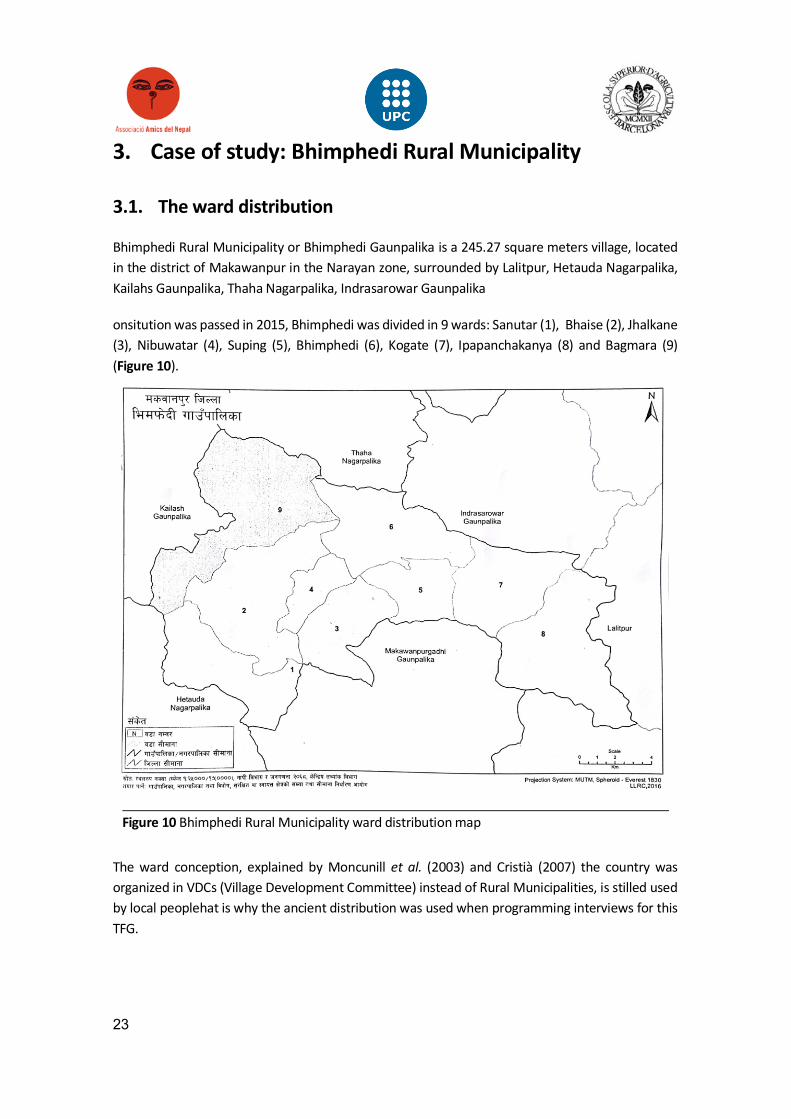
Bhimphedi Rural Municipality or Bhimphedi Gaunpalika is a 245.27 square meters village, located in the district of Makawanpur in the Narayan zone, surrounded by Lalitpur, Hetauda Nagarpalika, Kailahs Gaunpalika, Thaha Nagarpalika, Indrasarowar Gaunpalika
onsitution was passed in 2015, Bhimphedi was divided in 9 wards: Sanutar (1), Bhaise (2), Jhalkane (3), Nibuwatar (4), Suping (5), Bhimphedi (6), Kogate (7), Ipapanchakanya (8) and Bagmara (9) (Figure 10).
The ward conception, explained by Moncunill et al. (2003) and Cristià (2007) the country was organized in VDCs (Village Development Committee) instead of Rural Municipalities, is stilled used by local peoplehat is why the ancient distribution was used when programming interviews for this TFG.
Figure 10 Bhimphedi Rural Municipality ward distribution map
24
3.2. Roads
The road that crosses Bhimphedi-Bajar is A2 or Tribhuvan Highway which connects Kathmandu to Birganj on the border with India, through Hetauda, the capital of Makawanpur, combining stretches of asphalt and dust road.
3.3. Climate and geography
As shown in section 2.1 Lillesø et al., (2005) draws a new agro-ecological classification of Nepal while incorporating the potential natural vegetation and the potential for human use, such as the maps for potential distribution of fruit trees and the maps for potential distribution of food crops.
According to Lillesø et al., (2005) Bhimphedi is located in a Sub-tropical and humid area in the middle mountain physiographic region, in the Mahabharat mountain chain. Table 2 shows the water balances (mm) in humid areas. The months appearing with a negative balance, are considered as dry months.
Table 3 is a compilation of average monthly temperature for the climate corresponding to the area of study.
These conditions made agriculture practicable during rainy season, from mid-May to mid-October. The families with enough water supply were able to produce all year long due to the moderate temperature range. Some families could also grow mustard during dry season without irrigation.
Moncunill et al. (2003), in collaboration with the NGO Plan International which was working on women empowerment in Bhimphedi at that time, installed a small weather station in order to record temperature and relative humidity data. Unfortunately, we did not have access to this data.
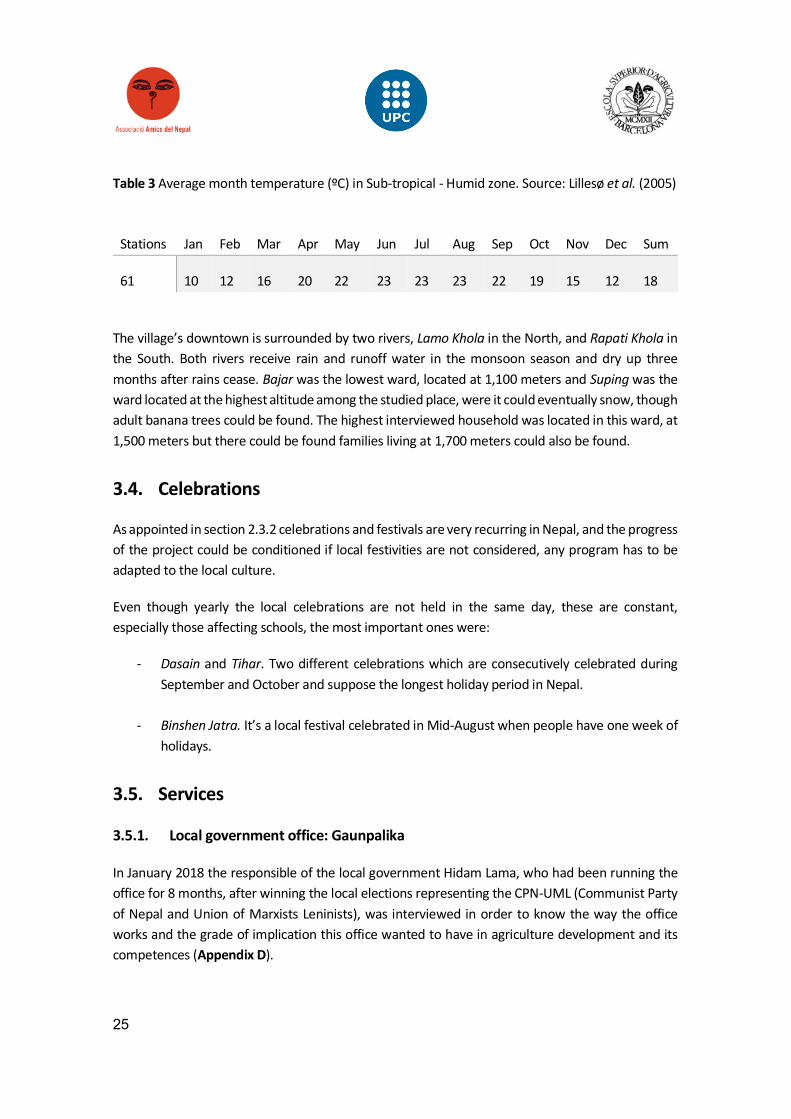
Table 2 Average monthly water balances (mm) precipitation minus potential evapo-transpiration in Sub-tropical and Humid zone. Source: Lillesø et al. (2005)
Stations Jan Feb Mar Apr May Jun Jul Aug Sep Oct Nov Dec Sum
42 -37 -50 -84 -88 -35 151 328 276 152 -11 -59 -43 480
25
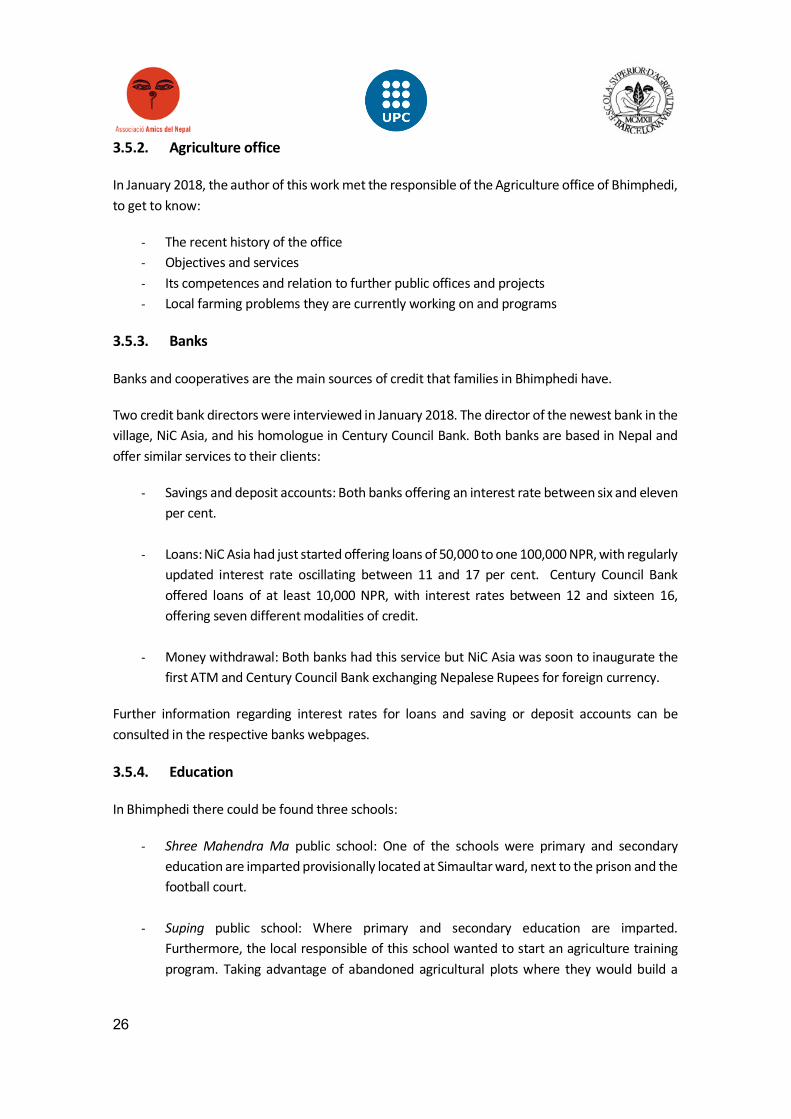
Table 3 Average month temperature (ºC) in Sub-tropical - Humid zone. Source: Lillesø et al. (2005)
The village’s downtown is surrounded by two rivers, Lamo Khola in the North, and Rapati Khola in the South. Both rivers receive rain and runoff water in the monsoon season and dry up three months after rains cease. Bajar was the lowest ward, located at 1,100 meters and Suping was the ward located at the highest altitude among the studied place, were it could eventually snow, though adult banana trees could be found. The highest interviewed household was located in this ward, at 1,500 meters but there could be found families living at 1,700 meters could also be found.
3.4. Celebrations
As appointed in section 2.3.2 celebrations and festivals are very recurring in Nepal, and the progress of the project could be conditioned if local festivities are not considered, any program has to be adapted to the local culture.
Even though yearly the local celebrations are not held in the same day, these are constant, especially those affecting schools, the most important ones were:
- Dasain and Tihar. Two different celebrations which are consecutively celebrated during September and October and suppose the longest holiday period in Nepal.
- Binshen Jatra. It’s a local festival celebrated in Mid-August when people have one week of holidays.
3.5. Services
3.5.1. Local government office: Gaunpalika
In January 2018 the responsible of the local government Hidam Lama, who had been running the office for 8 months, after winning the local elections representing the CPN-UML (Communist Party of Nepal and Union of Marxists Leninists), was interviewed in order to know the way the office works and the grade of implication this office wanted to have in agriculture development and its competences (Appendix D).
Stations Jan Feb Mar Apr May Jun Jul Aug Sep Oct Nov Dec Sum
61 10 12 16 20 22 23 23 23 22 19 15 12 18
26
3.5.2. Agriculture office
In January 2018, the author of this work met the responsible of the Agriculture office of Bhimphedi, to get to know:
- The recent history of the office - Objectives and services - Its competences and relation to further public offices and projects - Local farming problems they are currently working on and programs
3.5.3. Banks
Banks and cooperatives are the main sources of credit that families in Bhimphedi have.
Two credit bank directors were interviewed in January 2018. The director of the newest bank in the village, NiC Asia, and his homologue in Century Council Bank. Both banks are based in Nepal and offer similar services to their clients:
- Savings and deposit accounts: Both banks offering an interest rate between six and eleven per cent.
- Loans: NiC Asia had just started offering loans of 50,000 to one 100,000 NPR, with regularly updated interest rate oscillating between 11 and 17 per cent. Century Council Bank offered loans of at least 10,000 NPR, with interest rates between 12 and sixteen 16, offering seven different modalities of credit.
- Money withdrawal: Both banks had this service but NiC Asia was soon to inaugurate the first ATM and Century Council Bank exchanging Nepalese Rupees for foreign currency.
Further information regarding interest rates for loans and saving or deposit accounts can be consulted in the respective banks webpages.
3.5.4. Education
In Bhimphedi there could be found three schools:
- Shree Mahendra Ma public school: One of the schools were primary and secondary education are imparted provisionally located at Simaultar ward, next to the prison and the football court.
- Suping public school: Where primary and secondary education are imparted. Furthermore, the local responsible of this school wanted to start an agriculture training program. Taking advantage of abandoned agricultural plots where they would build a
27
residence for students and host the training parcels. This project was at a very incipient point at the time of the visit, when raise funding had just started.
- Bhim aadhar Samudayik community school: It is a school located in Bhimphedi Bajar which was built thanks to private donations and is managed by the community. Every lesson is theoretically taught in English but the level of the teacher was so low that volunteers from Balmandir had to teach the English to the teachers.
3.5.5. Health
Bhimphedi has a medical care centre, a pharmacy and a centre to assist pregnant women financed by the United States Agency for International Development (USAID). The three of them were located in Bajar.
Free visit for Nepalese and certain medicines were given by the doctor. The medicines that were not available at the care centre had to be bought by the patient at the pharmacy. For foreigners, visits were also free, but they had to pay for every medicine.
3.5.6. Commercial activity
Bhimphedi Bajar was where the majority of commerce was located. The following services could be found:
- Grocer’s shops: Where we could found from vegetables, legumes, cereals and oil to soap, razors, toilet paper or balance for national communication companies.
- Tailors and seamstresses: Where clients brought the fabrics and occidental clothing like shirts or skirts and traditional costumes like Daura suruwal for men or Sari for women were made.
- Bars: Where traditional Nepali dishes can be eaten like buff momos, chowmein, samosas, aluchops, etc. Traditional black tea (kalo chia) or milk tea (dut chia) usually are drank in these places though soft drinks as coke or soda, or alcoholic drinks like beer or the traditional raksy can also be found.
- Hotels: At the time of the visit there was only one hotel in the village, but two more were
being built as a result of a new political district intention of promoting economic activity in Bhimphedi.
- Others: Fabrics shop, electric components and tools shop a barbershop and hairdresser.
28
4. Agricultural and social aspects evaluated in Bhimphedi
As detailed in section 6, questions were grouped to simplify their interpretation. First of all, a brief population study is presented, in order to study cultural and social aspects. Secondly, diet preferences and restrictions were analysed, in order to respect local habits when programming any project.
Land tenure deals with land tenure and fragmentation as a phenomenon which conditionate agricultural production. Furthermore, agricultural operations such as soul preparation, fertilizers dose, etc. were studied.
Moreover, local crops and vegetables and livestock were also addressed. Finally, cooperatives affiliation, which are important financing and training agents, and the 2015 earthquake local effects were also considered.
We would like to point out that, interviews were done without making any appointment and we were always kindly welcomed. We found nice people, who usually offered us tea and something to eat or to try those products we had not heard about.
29
5. Objectives
5.1. Main objective
The study of the current agroecosystem in Bhimphedi area is the main purpose of this document. Local socioeconomic, agriculture and livestock factors are considered.
5.2. Specific objectives
Specific objectives are arranged in order to obtain the main objective:
• To evaluate the main economic and commercial factors of the primary sector
• To identify the social and cultural aspects affecting agricultural activity
• To get farming information from local households
• To report Nepali public agriculture research and private initiatives related to the area of study
• To suggest agricultural alternatives that allow the improvement of rural population's life quality
30
6. Methodology
6.1. References research
Different kinds of references were consulted to get information about the outer and inner conditions:
a) Scientific and academic documents b) Governmental & non-Governmental statistics c) Nepali bibliography related to: Land tenure, rural development policies, political history
and national festivals.
These references were related to:
a) Demographic, social, educational and political aspects of the country b) Rural development strategies c) Rural analysis d) Local agroecosystems
6.2. Interviews
Having read the previous research led by ESAB (Moncunill et al., 2003; Cristià, 2007) as a way to start understanding the context of the project, rural analysis methods were consulted in order to broaden Bhimphedi agriculture knowledge and its related social aspects.
A first questionnaire was designed (Attachment B), based on these authors:
- Agroecosystem analysis for research and development (Conway, 1986).
- Farming Systems Research and Development: Guidelines for Developing Countries (Shaner, W et al., 1988)
In order to reduce the interview’s duration and simplify the way of filling the answers, after the first two interviews were performed, some changes were needed, and some complex and long questions were removed (Attachment B).
Regarding the sample size, 25 households were interviewed, from November 2017 to February 2018. The distribution of the visited households in the village was the following (Attachment F specifies every household location):
- Targaung 8 interviews - Suping 6 interviews
- Dampki 4 interviews - Simaultar 4 interviews - Chabeli 3 interviews
31
The National Central Bureau of Statistics (CBS) states there were 1.161 households in 2011 (Central Bureau of Statistics, 2014). Being 25 the number of interviewed households, the compiled data cannot be considered representative as only of the 2.15 percent out of 1.161 households were interviewed.
The main problems faced when interviewing were:
- Translator availability: This research project was performed without any budget, so finding a translator who wanted to work for free was not an easy task. The first two interviews were carried out in Simaultar, with two of the oldest children in Balmandir, Kush and Arjun, whose English level was good enough to understand the questions and to translate the answers. However, due to their youth, they did not feel comfortable doing it. Then Surendr Sapkota, Balmandir’s director, agreed on helping with four interviews in Dumpki, and later with another two, in Simaultar, but he was constantly busy, so Ranjita Lama, one of the English teachers from Bhim Aadhar Community School, was asked for help and nine more interviews were conducted (8 in Targaung and 1 in Chabeli). Finally, Shrawan Thapa collaborated with another eight interviews (6 in Supping and 2 in Chabeli).
- Combination of research and AN’s project: As said previously, the main aim of the project was to improve the kitchen garden while collaborating with the rest of the children’s home activities. This required a lot of time, especially on Saturday since not only it was the only free day in the week when the translators were available, but also the day in which children required more attention. This reduced the available time for research.
- Questions format: When asking some of the questions, examples that could be familiar to the interviewees were needed so that they understood what they were being asked. An example of this is that every time they were asked for the grown vegetables we had to mention each of the possible vegetables one by one, or the asked person would not have known. This means a data loss, especially at the beginning of the process, when you do not know examples.
The following listed collectives and public institutions were also visited:
- Shiva Sakti a women cooperative of Bhimphedi - Prasiddhi Farmers Group of Aambhanjyang - National Agriculture Research Center of Khumaltar - Central Horticulture Center of Kiritpur - Mushroom farm in Dhunlikhel
32
6.3. Analytical evaluation
After the data was collected, an analysis was done by grouping related questions and looking for common patterns among families. Even though related questions groups can be found in the elaborated questionnaire, they have been rearranged to ease their analysis. The new groups were given a tittle and have been discussed in section 4: Agricultural and social evaluated aspects in Bhimphedi. The groups are the following:
Local socioeconomic factors:
- Population study o Interviewees were asked all household members age, studies and civil state.
- Religion, castes and languages
o Interviewees were asked all household members cast and religion.
- Labour and family income o Interviewees were asked about their profession. o Where does family income come from? o In which period of the year is more difficult to meet expenses? o In which period of the year is easier to meet expenses?
o Do you save money? o How do you manage the saved money?
o Do you sell vegetables in a regular way? Which ones? o In which proportion do you sell them and keep them?
o Which is the busiest period of the year? o What do you need to do during this period? o Does the period vary depending on the year? o Do you need extra human power during? Who helps you? o How often? When and what for?
- Diet and food preferences and restrictions
o Does the farm produce all the food that family needs? o What proportion (of food) do you need to buy? o Which is your main dish? o Is it always available? o Is it not available any specific time of the year? o What is your step food then?
33
- Land tenure and characteristics
o How many pieces of land do you own or rent? o What kind of land is each piece? (Tillable/Pasture/Forest) o How big is each piece of land? o Do you have water for irrigation? In which piece of land? o Do you do fallow? In which piece of land do you do it? o Which are the best and the worst pieces you work?
- Cooperatives
o Do you belong to any local association? (Farmer association, women cooperative…)
o Which association? o What for?
- Earthquake effects o How did the 2015 earthquake affect your household and family?
Local agriculture and livestock factors:
- Land preparation o What kind of fertilizer do you use? o What rate do you put? o How do you manage livestock excretion? o Do you hire machinery or ox? What is the price?
- Crops and vegetables management
o What crops, vegetables, root crops, fruit or others do you grow? o Do you grow any special thing that is not grown by anybody else? o Which are the two main crops? o Which is the most difficult crop? o Do you mix crops or vegetables? Which of them?
o Do you produce your own seeds? From which crops or vegetables? o How do you conserve them? o Do you have any pest problems during storage?
o What is the normal amount of maize you could expect in one yield?1 (The crop
could change depending on the household) o What is the maximum amount you have ever harvested? And the minimum?
1 The asked crop depended on the household usual crops
34
o What is the amount you consider enough?
o When rainy season comes, when do you prefer to plant? (Before or after it rains)
o Do you use any tool or herbicides to remove grass? o In rainy season, how much do you wait until you remove grass for the first time?2 o In rainy season, how many times will you remove grass?3
- Pests management
o What pests do you have? o Which crops do they affect? o How do you manage them? o Do you do any prevention?
- Animal species and their uses
o What species do you have? o How do you feed them? o Which is the most difficult period of the year for feeding livestock? Why? o Do you have them for selling/renting or for self-consumption/domestic use? o How many animals of each specie do you have? (Classifying them by sex? o What product do you get from the animals for food? o Do you sell any of the products in a specific moment of the year?
2 This question is related to maize
3 This question is related to maize

35
7. Results
7.1. Social aspects study
7.1.1. Population
The Rural Municipality of Bhimphedi has 17,695 inhabitants distributed among 9 wards: Sanutar,
Bhaise, Jhalkane, Nibuwatar, Suping, Bhimphedi, Kogate, Ipapanchakanya, Bagmara. The number of inhabitants was taken from Central Bureau of Statistics (2014) and it is an addition of Bhaise (6,717 people), Bhimphedi (5,440 people), Nibuwatar (4,259 people) and Kogate (1,279 people) populations, as they appeared separately in that document.
These 17,695 inhabitants are spread among 3,717 households, 25 of which, only from Bhimphedi, were interviewed in this study. These visited households had 118 living people in there, so their average size was 4.72, similar to the total average household size of the Rural Municipality which was 4.64 (Central Bureau of Statistics, 2014).
7.1.2. Religion, castes and ethnises
While Hinduism is the main religion over the country, in every Nepalese region there is a specific dominating caste or ethnise, as we pointed in previous sections. In the case of Bhimphedi, the same as the district level, the Buddhist-Tamang community occupies this social condition (Central Bureau of Statistics, 2015), something that matches with the collected data (Figure 11).
47,46%
31,36%
5,93%
5,08%4,24%3,39% 1,69% 0,85%
Tamang
Brahman-Bahun
Magar
Paudel
Newari
Shikari
Waiba
Chhetree
Figure 11 Population by castes/ethnises in Bhimphedi studied wards
36
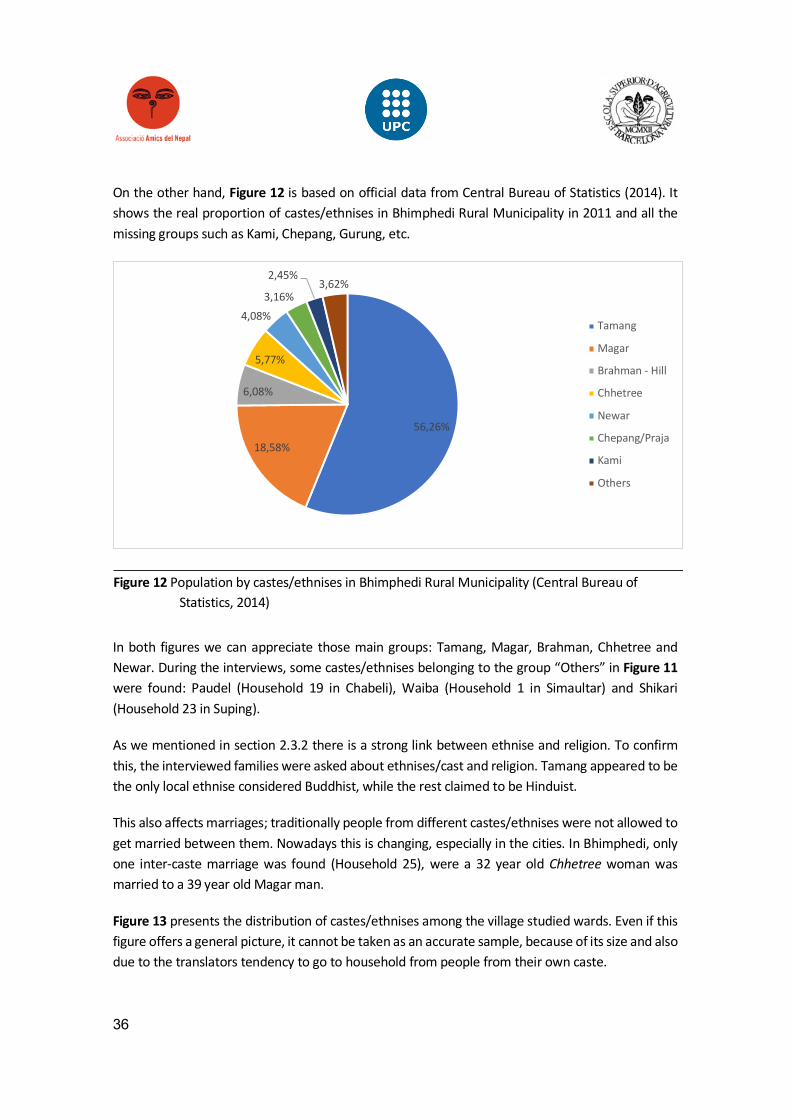
On the other hand, Figure 12 is based on official data from Central Bureau of Statistics (2014). It shows the real proportion of castes/ethnises in Bhimphedi Rural Municipality in 2011 and all the missing groups such as Kami, Chepang, Gurung, etc.
In both figures we can appreciate those main groups: Tamang, Magar, Brahman, Chhetree and Newar. During the interviews, some castes/ethnises belonging to the group “Others” in Figure 11 were found: Paudel (Household 19 in Chabeli), Waiba (Household 1 in Simaultar) and Shikari (Household 23 in Suping).
As we mentioned in section 2.3.2 there is a strong link between ethnise and religion. To confirm this, the interviewed families were asked about ethnises/cast and religion. Tamang appeared to be the only local ethnise considered Buddhist, while the rest claimed to be Hinduist.
This also affects marriages; traditionally people from different castes/ethnises were not allowed to get married between them. Nowadays this is changing, especially in the cities. In Bhimphedi, only one inter-caste marriage was found (Household 25), were a 32 year old Chhetree woman was married to a 39 year old Magar man.
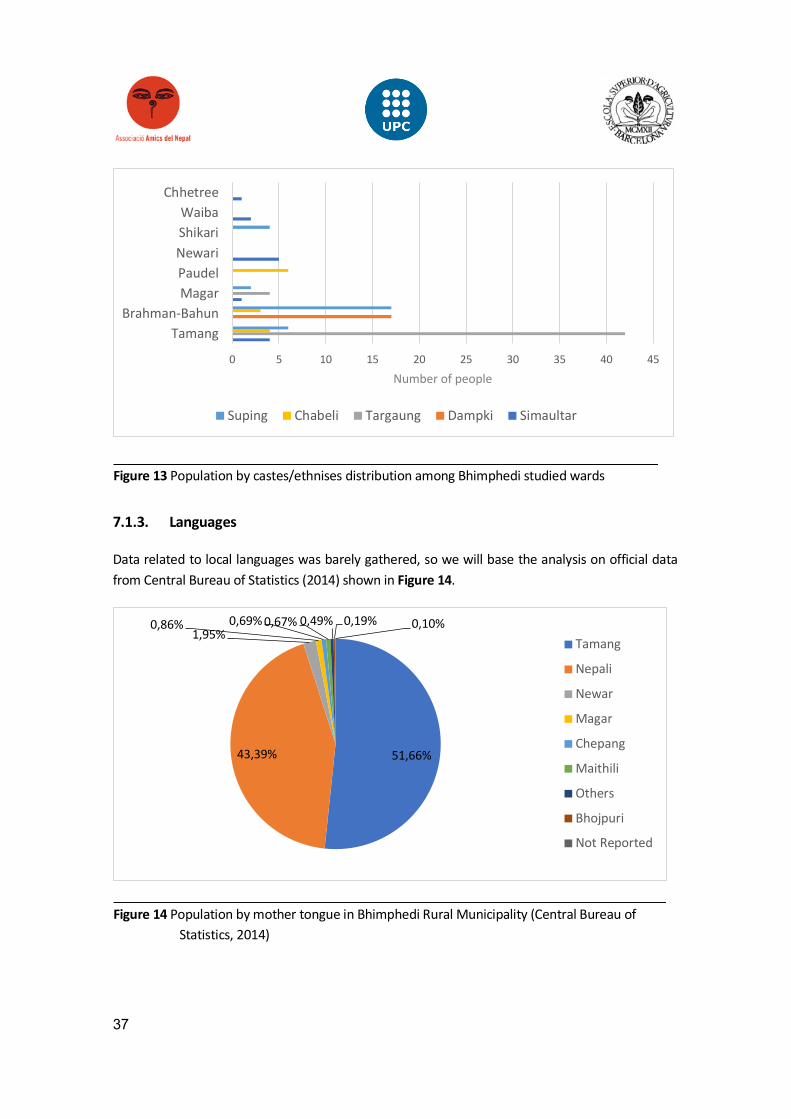
Figure 13 presents the distribution of castes/ethnises among the village studied wards. Even if this figure offers a general picture, it cannot be taken as an accurate sample, because of its size and also due to the translators tendency to go to household from people from their own caste.
56,26%
18,58%
6,08%
5,77%
4,08%3,16%
2,45%3,62%
Tamang
Magar
Brahman - Hill
Chhetree
Newar
Chepang/Praja
Kami
Others
Figure 12 Population by castes/ethnises in Bhimphedi Rural Municipality (Central Bureau of Statistics, 2014)
37
7.1.3. Languages
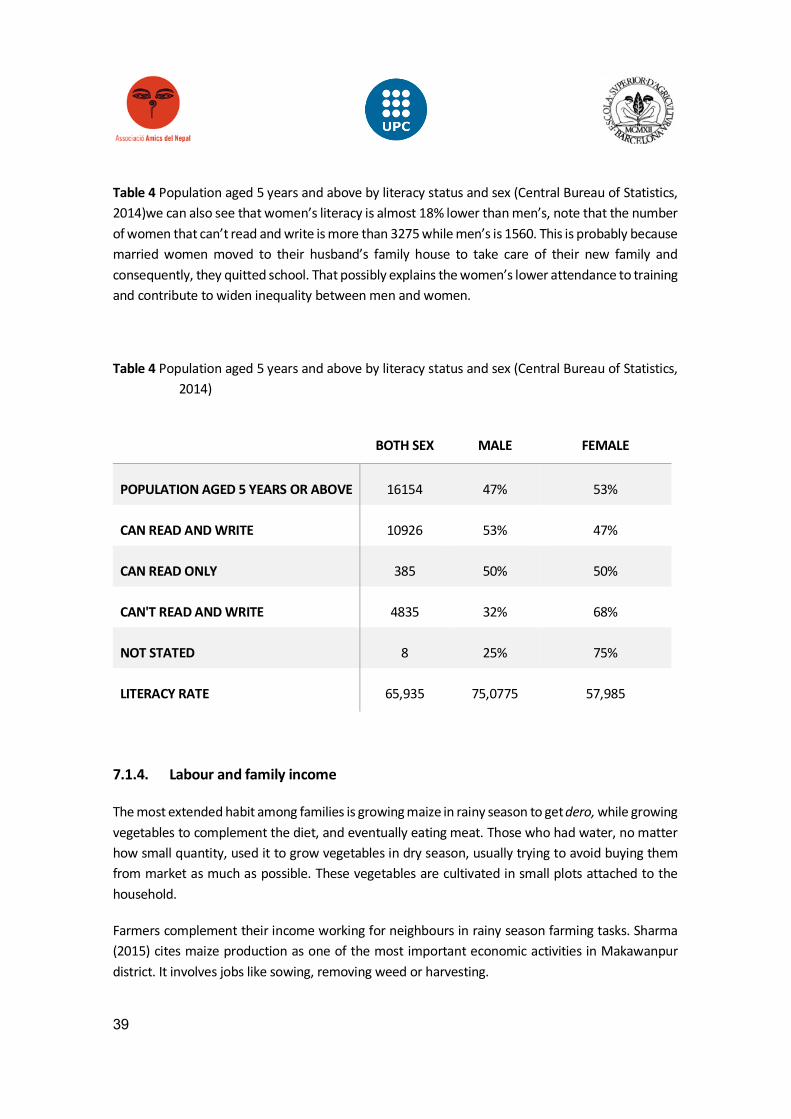
Data related to local languages was barely gathered, so we will base the analysis on official data from Central Bureau of Statistics (2014) shown in Figure 14.
51,66%43,39%
1,95%0,86% 0,69% 0,67% 0,49% 0,19% 0,10%
Tamang
Nepali
Newar
Magar
Chepang
Maithili
Others
Bhojpuri
Not Reported
Figure 14 Population by mother tongue in Bhimphedi Rural Municipality (Central Bureau of Statistics, 2014)
Figure 13 Population by castes/ethnises distribution among Bhimphedi studied wards
0 5 10 15 20 25 30 35 40 45
TamangBrahman-Bahun
MagarPaudelNewariShikariWaiba
Chhetree
Number of people
Suping Chabeli Targaung Dampki Simaultar

38
We can see how some of the languages match with the different ethnises from Figure 15. Generally, each ethnise owns a mother tongue. During interviews it was observed that young generations are losing the habit of learning and using their ethnical language.
Besides the common mother tongues something we learnt from the interviews was that the vast majority of inhabitants know Nepali, in case of starting some sort of project in the village, it would be very important to consider the literacy status.
family and consequently, they quitted school. That possibly explains the women’s lower attendance to training and contribute to widen inequality between men and women.
Table 4 Population aged 5 years and above by literacy status and sex (Central Bureau of Statistics, 2014) summarises the official data from Central Bureau of Statistics (2014) regarding this issue. The general literacy rate is a bit lower than 66%, so when preparing material for the farmers we should take this into account and prepare adapted material.
From family and consequently, they quitted school. That possibly explains the women’s lower attendance to training and contribute to widen inequality between men and women.
56,26%
18,58%
6,08%
5,77%
4,08%3,16%
2,45%3,62%
Tamang
Magar
Brahman - Hill
Chhetree
Newar
Chepang/Praja
Kami
Others
Figure 15 Population by caste/ethnise tongue in Bhimphedi Rural Municipality (Central Bureau of Statistics, 2014)
39
Table 4 Population aged 5 years and above by literacy status and sex (Central Bureau of Statistics, 2014)we can also see that women’s literacy is almost 18% lower than men’s, note that the number of women that can’t read and write is more than 3275 while men’s is 1560. This is probably because married women moved to their husband’s family house to take care of their new family and consequently, they quitted school. That possibly explains the women’s lower attendance to training and contribute to widen inequality between men and women.
Table 4 Population aged 5 years and above by literacy status and sex (Central Bureau of Statistics, 2014)
7.1.4. Labour and family income
The most extended habit among families is growing maize in rainy season to get dero, while growing vegetables to complement the diet, and eventually eating meat. Those who had water, no matter how small quantity, used it to grow vegetables in dry season, usually trying to avoid buying them from market as much as possible. These vegetables are cultivated in small plots attached to the household.
Farmers complement their income working for neighbours in rainy season farming tasks. Sharma (2015) cites maize production as one of the most important economic activities in Makawanpur district. It involves jobs like sowing, removing weed or harvesting.
BOTH SEX MALE FEMALE
POPULATION AGED 5 YEARS OR ABOVE 16154 47% 53%
CAN READ AND WRITE 10926 53% 47%
CAN READ ONLY 385 50% 50%
CAN'T READ AND WRITE 4835 32% 68%
NOT STATED 8 25% 75%
LITERACY RATE 65,935 75,0775 57,985
40
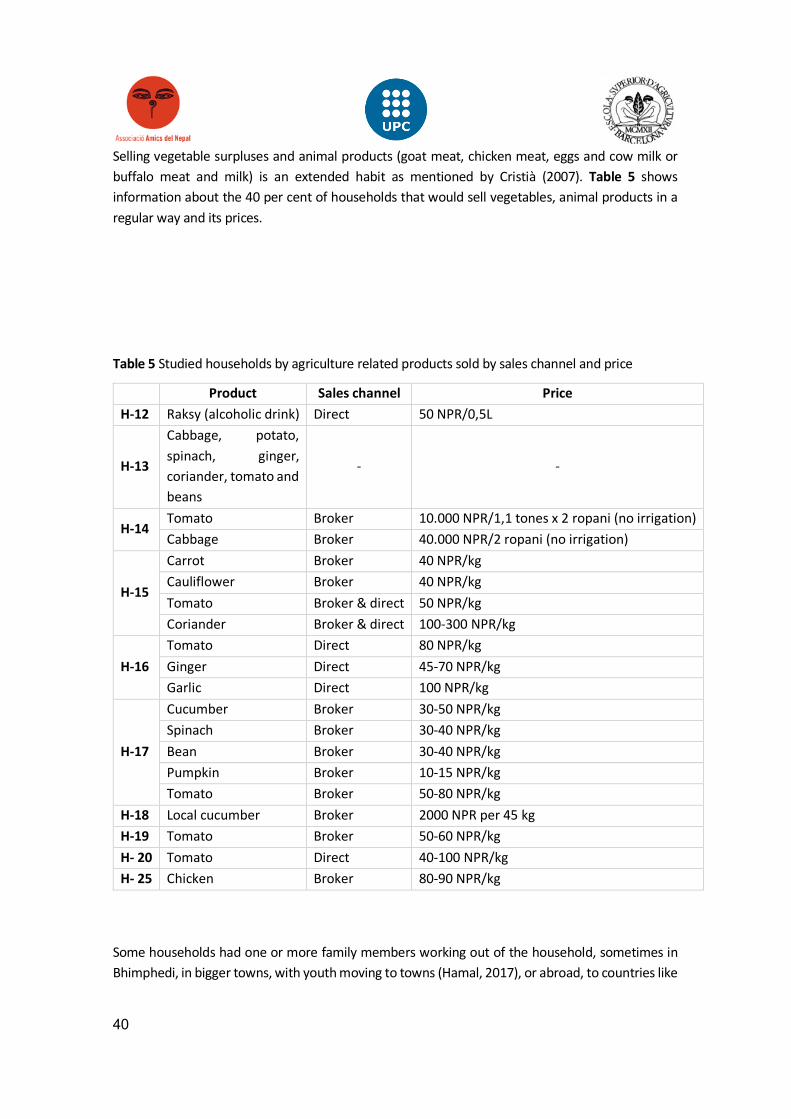
Selling vegetable surpluses and animal products (goat meat, chicken meat, eggs and cow milk or buffalo meat and milk) is an extended habit as mentioned by Cristià (2007). Table 5 shows information about the 40 per cent of households that would sell vegetables, animal products in a regular way and its prices.
Table 5 Studied households by agriculture related products sold by sales channel and price
Product Sales channel Price H-12 Raksy (alcoholic drink) Direct 50 NPR/0,5L
H-13
Cabbage, potato, spinach, ginger, coriander, tomato and beans
- -
H-14 Tomato Broker 10.000 NPR/1,1 tones x 2 ropani (no irrigation) Cabbage Broker 40.000 NPR/2 ropani (no irrigation)
H-15
Carrot Broker 40 NPR/kg Cauliflower Broker 40 NPR/kg Tomato Broker & direct 50 NPR/kg Coriander Broker & direct 100-300 NPR/kg
H-16 Tomato Direct 80 NPR/kg Ginger Direct 45-70 NPR/kg Garlic Direct 100 NPR/kg
H-17
Cucumber Broker 30-50 NPR/kg Spinach Broker 30-40 NPR/kg Bean Broker 30-40 NPR/kg Pumpkin Broker 10-15 NPR/kg Tomato Broker 50-80 NPR/kg
H-18 Local cucumber Broker 2000 NPR per 45 kg H-19 Tomato Broker 50-60 NPR/kg H- 20 Tomato Direct 40-100 NPR/kg H- 25 Chicken Broker 80-90 NPR/kg
Some households had one or more family members working out of the household, sometimes in Bhimphedi, in bigger towns, with youth moving to towns (Hamal, 2017), or abroad, to countries like
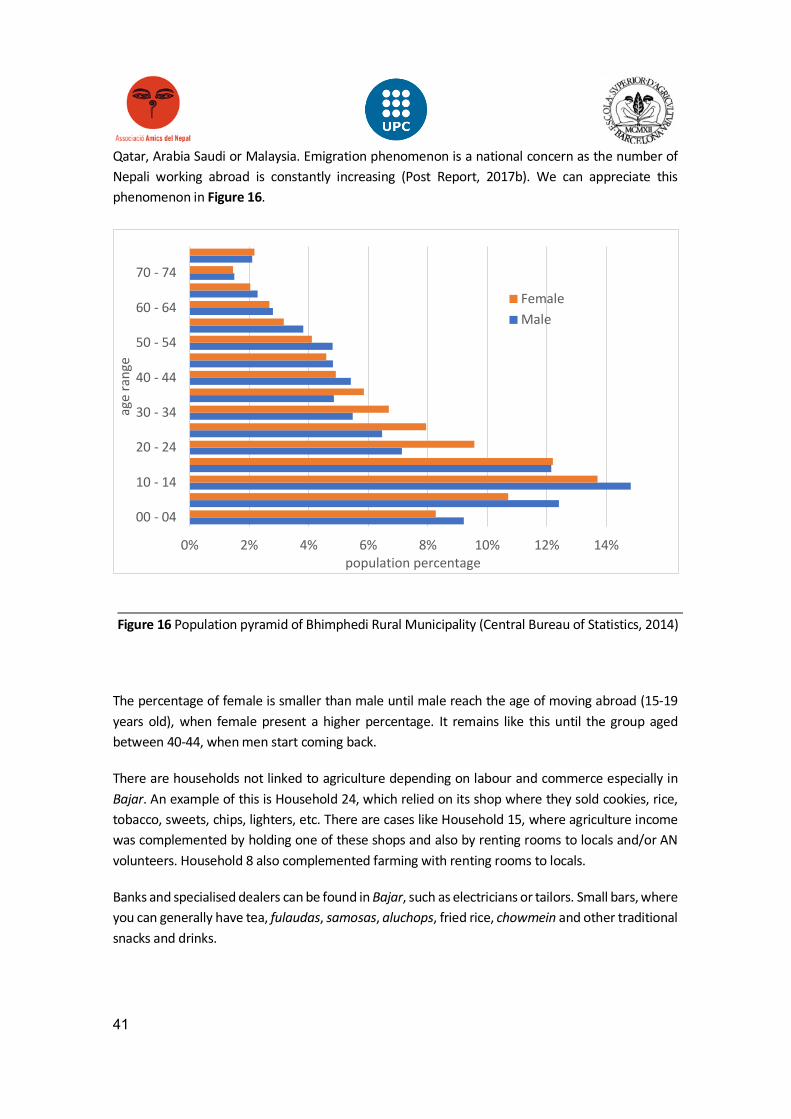
41
Qatar, Arabia Saudi or Malaysia. Emigration phenomenon is a national concern as the number of Nepali working abroad is constantly increasing (Post Report, 2017b). We can appreciate this phenomenon in Figure 16.
The percentage of female is smaller than male until male reach the age of moving abroad (15-19 years old), when female present a higher percentage. It remains like this until the group aged between 40-44, when men start coming back.
There are households not linked to agriculture depending on labour and commerce especially in Bajar. An example of this is Household 24, which relied on its shop where they sold cookies, rice, tobacco, sweets, chips, lighters, etc. There are cases like Household 15, where agriculture income was complemented by holding one of these shops and also by renting rooms to locals and/or AN volunteers. Household 8 also complemented farming with renting rooms to locals.
Banks and specialised dealers can be found in Bajar, such as electricians or tailors. Small bars, where you can generally have tea, fulaudas, samosas, aluchops, fried rice, chowmein and other traditional snacks and drinks.
0% 2% 4% 6% 8% 10% 12% 14%
00 - 04
10 - 14
20 - 24
30 - 34
40 - 44
50 - 54
60 - 64
70 - 74
population percentage
age
rang
e
FemaleMale
Figure 16 Population pyramid of Bhimphedi Rural Municipality (Central Bureau of Statistics, 2014)
42
Traditional households depending on agriculture can still be found. The case of household number 17 in Suping, which is located in the most remote area visited by the author of the present document, is an example, but also less remote households, like the number 25 in Simaultar, still strictly depend on agriculture.
43
These two households depended on domestic production in rainy season, when they consumed dero as step food and vegetables. When farmers needed to buy vegetables they used money earned from production surpluses, animal products sales and working in the neighbours fields (Household 17) or selling surpluses, chicken sets sold to a local enterprise, and other animal products (Household 25). When they had ran out of maize they both needed to buy rice and lentils, to cook dal baht, as an alternative to dero, which is also eaten with bought meat or vegetables.
7.2. Diet, food preferences and restrictions
When proposing changes one of the factors considered in FSR&D strategies is the amount of change to attempt while not disturbing local habits (Shaner et al., 1988). It is crucial to respect traditional food sources, and diet habits.
None of the visited household was self-sufficient, so all of them needed to buy some food, in different proportions, depending on their land size and their bond to agriculture and also depending on the season. In the dry season people buy more vegetables.
Regarding the proportion of bought food versus domestic production, only 7 households answered the question, because they did not know the answer. Besides that, some conclusions could be drawn.
Dal baht and dero are the two step foods. Dal baht is considered one of Nepal’s main dishes, consisting on boiled rice and a lentils soup and accompanied with seasonal vegetables and/or meat. It is usually eaten twice a day. Dero is a traditional step food, made out usually of maize powder, even thought, other crops as millet or buckwheat can be used.
Traditionally, dero was the main step food in Bhimphedi. Nowadays it is still consumed but young generations prefer dal baht. Households where Dal baht and dero consumption depended on the family daily preference are usually found, as both step foods are always available in the market.
Regarding seasonal variables, even though maize can be bought in local shops, none of the interviewees claimed to buy maize. After observing local habits and considering that families affirmed that both step foods are always available, it can be said that usually dero and other maize-based products, like popcorn, are consumed while the family has its own grain, and can be eventually bought to complement dal baht diet during dry season.
Another frequent need that households mentioned was oil. Frequently sun-flower and soya oil are used for cooking and also mustard oil, which also has cosmetic and traditional medical uses. It is applied on the babies skin, to strengthen their bodies.
44
7.3. Local land ownership regimes and fragmentation
Access to land is one of the main aspects that determines vegetable and crop production. As appointed by Thapa et al. (2007), who conducted an study in two villages of Nepal, land size conditioned yield and production efficiency. In this essay, land size, number of plots per family and ownership regimes, as well as plot distance to the nearest road, were considered as factors that could be important, therefore, they were included in the questionnaire.
Even though it was not studied it has to be mentioned that, women land low percentage ownership is a source of inequality. It is closely related to their rights and empowerment hence, is increasingly being treated by cooperation agents as a tool to promote development (Allendorf, 2007; Thapa et
al., 2007).
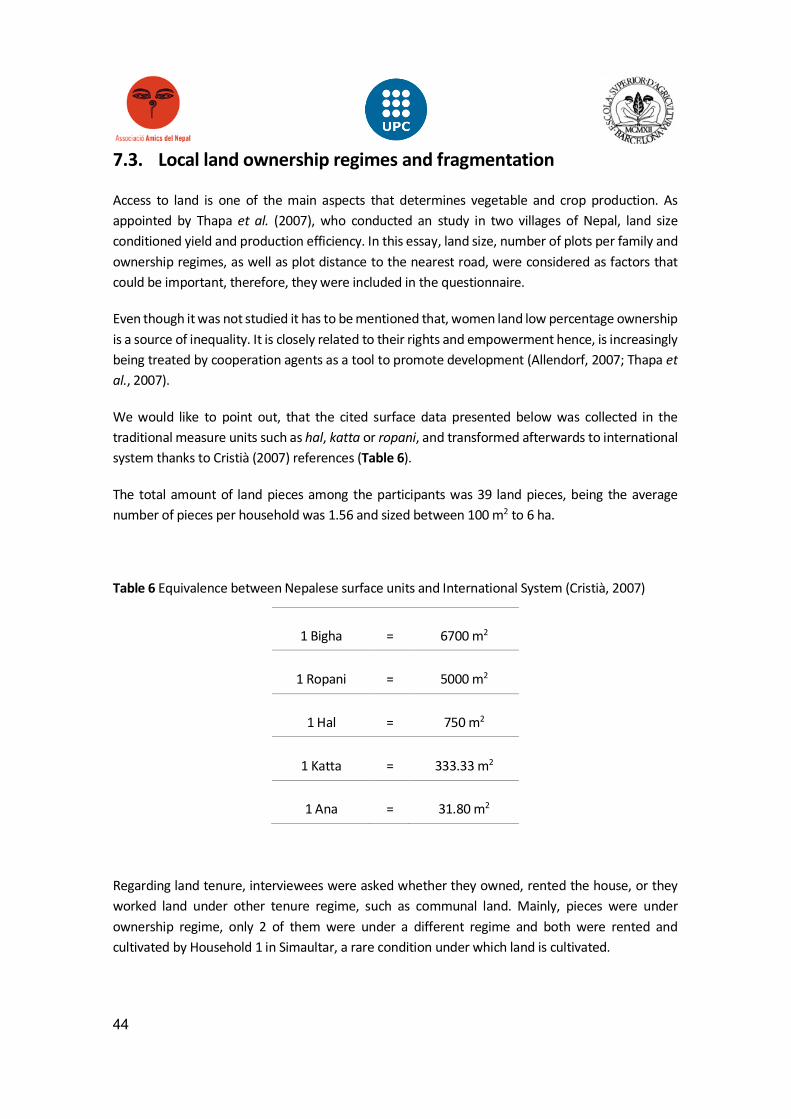
We would like to point out, that the cited surface data presented below was collected in the traditional measure units such as hal, katta or ropani, and transformed afterwards to international system thanks to Cristià (2007) references (Table 6).
The total amount of land pieces among the participants was 39 land pieces, being the average number of pieces per household was 1.56 and sized between 100 m2 to 6 ha.
Table 6 Equivalence between Nepalese surface units and International System (Cristià, 2007)
1 Bigha = 6700 m2
1 Ropani = 5000 m2
1 Hal = 750 m2
1 Katta = 333.33 m2
1 Ana = 31.80 m2
Regarding land tenure, interviewees were asked whether they owned, rented the house, or they worked land under other tenure regime, such as communal land. Mainly, pieces were under ownership regime, only 2 of them were under a different regime and both were rented and cultivated by Household 1 in Simaultar, a rare condition under which land is cultivated.
45
As well as land size, fragmentation can be related to orography and social aspects, that is why the collected data is presented ward by ward.
As appointed previously and taking Shaner, W et al. (1988) as a reference, the number of land pieces and average piece surface were analysed. Distance to the nearest usable road and all-weather road were also studied (considered a problem when it was bigger than 50 m).
Simaultar’s household did not present significant land fragmentation nor access problems. Families owned from 0 to 3 pieces. Their average size was the smallest among the studied wards (1,799 m2). There were plots sized between 64 m2 and 5,333 m2. Plot distance to roads was generally small, being insignificant for many of them. Household 25 had one piece separated 10 m to the nearest and all weather road, which was the same. Household 1 had one piece 40 m away from all-weather road but with a closer usable road.
Land fragmentation was neither significant in Targaung. Six families owned one piece of land, with the exception of Household 14 that had 5 big plots (1 ha average) and Household 13 that had 2. This ward had one of the biggest plot average (11,874 m2). However, Household 9 and 12 had only 445 m2 and 750 m2 respectively. Distance to roads was never significant being 20 m for Household 7 and 40 m in one of the Household 14.
Chabeli’s fragmentation did not seem to be problematic. The number of plots per family was one for Households 15 and 19, owning respectively 2.5 ha and 1.5 ha. Professional farmers from Household 20 had two 150 m2 pieces, one of them was the only away from the road (20 m).
The biggest plots were found in Dampki, where the average size was 3 ha. Even though the average number was higher than the other studied wards (2.25 plots per family), as plots were so big, we cannot talk about land fragmentation problem. Plot distance to roads was the main problem in this ward. Households 3 and 5 were 500 and 1,000 m away from home and the nearest usable road. This distance and monkey attacks forced families to stop using those plots.
Finally in Suping we found low land fragmentation (1.5 plots per family). Generally we observed big plots but there were also some small ones that reduced the average size which is 9.470 m2. Discounting those smaller plots, the average raises to 11.870 m2. Regarding plot distance to the nearest usable road, only Household 17 owned one plot 200 m away from the road and a second 100 m.
One common thing among families in Bhimphedi was that most of them had a small irrigated plot sized between 100 m2 and 250 m2, next to the house, and a part of a bigger rain fed or eventually irrigated plot. This might be the reason for average size deviation in some of the wards.
In general, families did not suffer from significant land fragmentation or distance to the nearest usable or all-weather road. Unequal land size ownership was the main difference among families.
46
7.4. Farm works
7.4.1. Soil preparation
Soil preparation through observation. We have to take into account that we have to distinguish between rain fed and irrigated land. Water availability during dry season meant that families could farm twice a year, while rain fed fields could only be cultivated once, during rainy season. In both cases soil preparation depended on family resources, as explained above.
Different land preparation strategies were found when preparing the soil. All of them had in common that, first of all, organic fertilizer was distributed making piles over the field using a doko, a traditional wicker basket. Whereupon, fertilizer was spread as homogeneously as possible.
Differences were observed the moment when soil was ploughed. Generally, families ploughed after it first had rained, only 40 percent of the families did this before it rained ploughed. From the second group of families, only one had irrigation (Household 16 from Chabeli). Nevertheless, they planted before it rained.
Ploughing was done using tractor (32 percent), by using ox (32 percent), alternating ox and tractor (8 per cent) or by hand (20 percent). The cost of tractor was between 1,200 and 1,800 NPR/hour and its use was more extended in Suping, where 3 out of 10 tractor users were found.
Household 25 (Simaultar) said to hire a tractor from Chabeli for 500 NPR/hour. Household 20 (Chabeli) owned a tractor and Household 15, who was involved in one of the local cooperatives (Chabeli Krisi Samuha), described their shared tractor service price: 350 Rp/hour for partners (200 NPR for petrol, plus 100 NPR for the driver, plus 50 NPR for an insurance) and 500 NPR for no-partners.
Ox hiring prices were also described by the farmers. Household 14 hired it for 1,000 NPR/ropani. Household 19 payed 100 NPR/hour and said that ox ploughed 1 hal in 5 hours (150 m2/hour). Household 25 payed 800 NPR per 6 hours of work.
7.4.2. Fertilizers
Organic fertilizers were applied by every interviewed household. However, 42 percent needed to buy compost because their livestock did not provide enough manure. The most common compost was the one made out of animal manure (buffalo, cow, goat or chicken) and straw and/or dry leaves together with other punctual products like damaged vegetables, dry crop rests (maize canes), kitchen vegetable and meat waste (chicken bones). Eventually, some families added the grass after being removed.
47
Regarding compost pile management, generally families did not care much about it. Interviewees were asked about its management and specially about the two main operations compost requires: moisture and ventilation (Barrington et al., 2003; Michel, 2008).
Only Households 19 and 11 ventilated and watered the pile when lack of humidity was perceived. Households 17, 18 and 25 only ventilated the pile by turning it, and, Household 13 just watered it. Eventually, Household 16 reduced compostable particles size by manually cutting them.
None of them monitored humidity, temperature, pH, nitrogen content or any other parameter.
Table 7 summarises the organic fertilizers rate distribution. Data was collected in dokos, the traditional wicker baskets, per unit known by the farmers. Sometimes they referred to dokos per ropani or hal, and other times in dokos per total surface. In order to make this data more understandable, it was converted first to doko per square meter, and knowing that one of these doko can weight 30 kg, we got the amount of fertilizer per square meter.
Although average rate (1.174 kg of fertilizer/m2) might be a trustable estimation, maximum (5 kg of fertilizer/m2) and minimum rate (0.017 kg of fertilizer/m2) were included in Table 7, in order to show how imprecise were some of the references given by farmers and/or a deviation caused by communication problems when translating from Nepali to English. In conclusion, the average fertilizer rate would be less than measured, so it can be said that there is a lack of organic fertilizer.
Table 7 Organic fertilizer rates in the studied households
When it comes to chemical fertilizer use, 91 percent of the families combined organic with chemical fertilizer. Only Households 18 and 23 exclusively based their farming on organic fertilizers. The identified chemical fertilizers were: Urea in white granulate form, source of nitrogen. DAP, Diammonium phosphate (N18%:P46%:K0%) in white and black balls. Potash (N0%:P0%:K60%) in red powderily form. Vitamins in a liquid concentrated form. A blue powder was also observed but we could not find out what its use was.
In Attachment D chemical fertilizer rate references (kg/ropani) can be found from different varieties of: Cauliflower, cabbage, radish, peas, tomato, chilli pepper, bean, cucumber, lady finger, carrot and eggplant (Source: Joan Fissé).
Average max min Doko per square meter 0.039 0.170 0.001 Kg of fertilizer per square meter 1.008 5.000 0.017
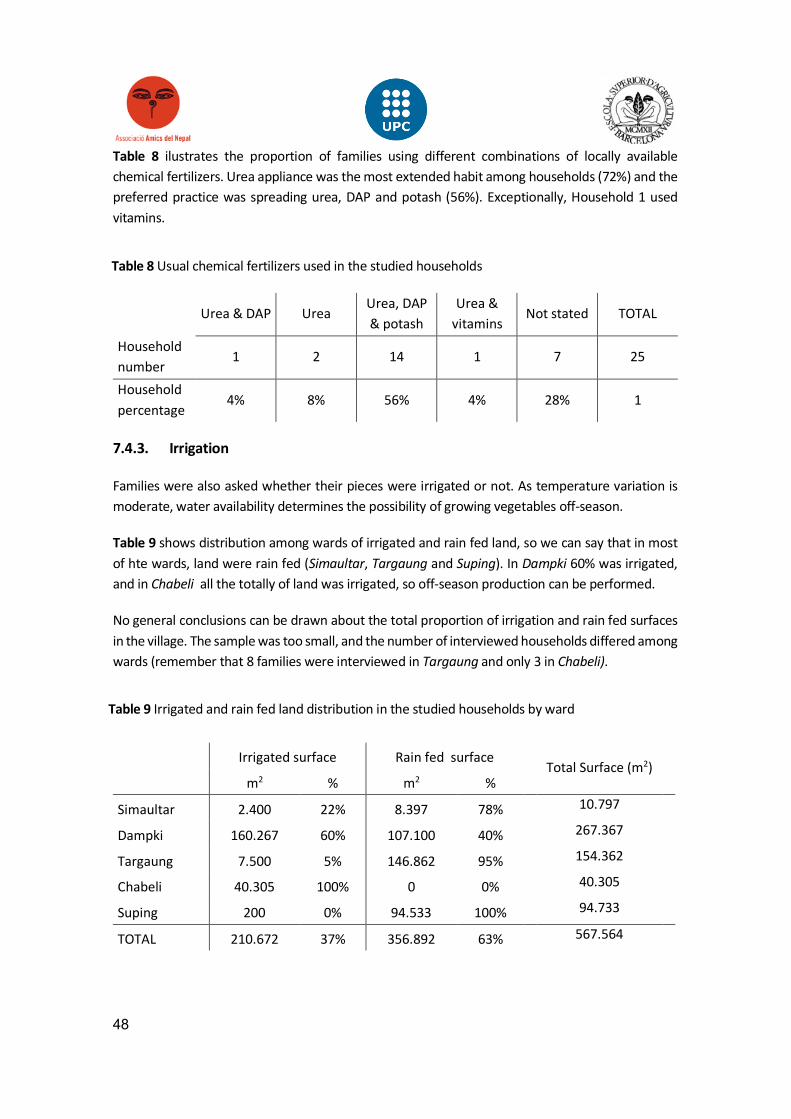
48
Table 8 ilustrates the proportion of families using different combinations of locally available chemical fertilizers. Urea appliance was the most extended habit among households (72%) and the preferred practice was spreading urea, DAP and potash (56%). Exceptionally, Household 1 used vitamins.
Urea & DAP Urea Urea, DAP & potash
Urea & vitamins
Not stated TOTAL
Household number
1 2 14 1 7 25
Household percentage
4% 8% 56% 4% 28% 1
7.4.3. Irrigation
Families were also asked whether their pieces were irrigated or not. As temperature variation is moderate, water availability determines the possibility of growing vegetables off-season.
Table 9 shows distribution among wards of irrigated and rain fed land, so we can say that in most of hte wards, land were rain fed (Simaultar, Targaung and Suping). In Dampki 60% was irrigated, and in Chabeli all the totally of land was irrigated, so off-season production can be performed.
No general conclusions can be drawn about the total proportion of irrigation and rain fed surfaces in the village. The sample was too small, and the number of interviewed households differed among wards (remember that 8 families were interviewed in Targaung and only 3 in Chabeli).
Table 8 Usual chemical fertilizers used in the studied households
Table 9 Irrigated and rain fed land distribution in the studied households by ward
Irrigated surface Rain fed surface Total Surface (m2)
m2 % m2 %
Simaultar 2.400 22% 8.397 78% 10.797
Dampki 160.267 60% 107.100 40% 267.367
Targaung 7.500 5% 146.862 95% 154.362
Chabeli 40.305 100% 0 0% 40.305
Suping 200 0% 94.533 100% 94.733
TOTAL 210.672 37% 356.892 63% 567.564
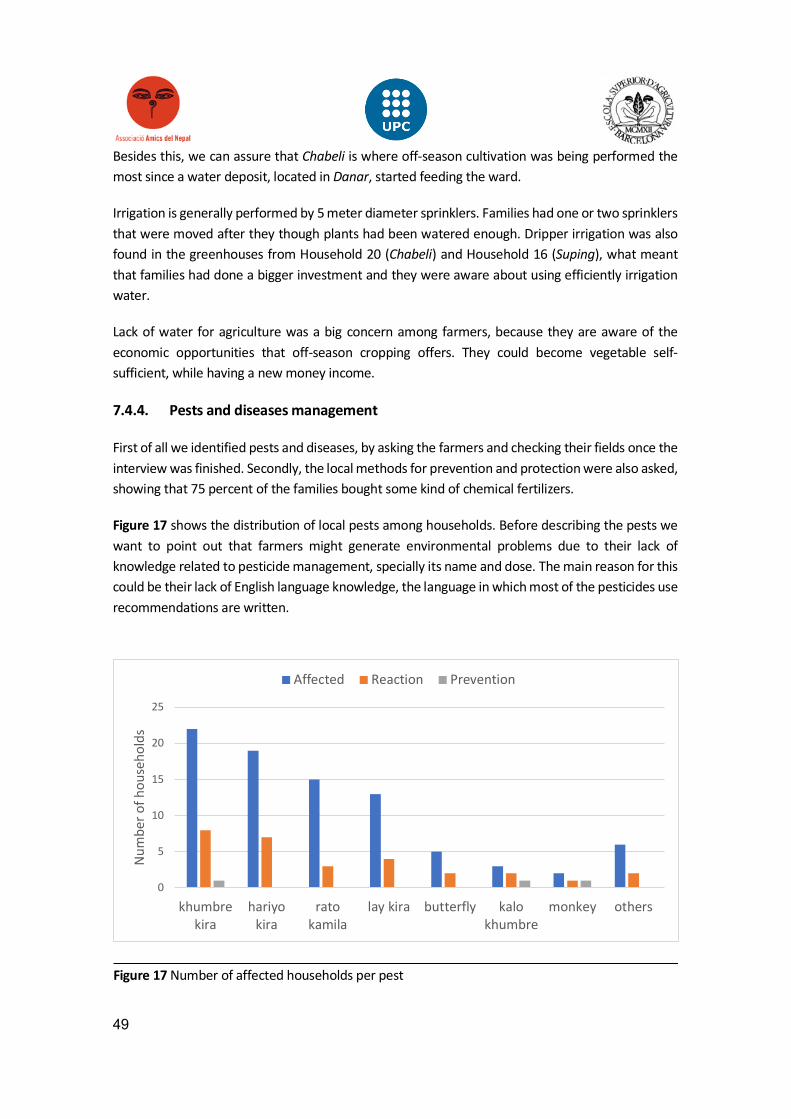
49
Besides this, we can assure that Chabeli is where off-season cultivation was being performed the most since a water deposit, located in Danar, started feeding the ward.
Irrigation is generally performed by 5 meter diameter sprinklers. Families had one or two sprinklers that were moved after they though plants had been watered enough. Dripper irrigation was also found in the greenhouses from Household 20 (Chabeli) and Household 16 (Suping), what meant that families had done a bigger investment and they were aware about using efficiently irrigation water.
Lack of water for agriculture was a big concern among farmers, because they are aware of the economic opportunities that off-season cropping offers. They could become vegetable self-sufficient, while having a new money income.
7.4.4. Pests and diseases management
First of all we identified pests and diseases, by asking the farmers and checking their fields once the interview was finished. Secondly, the local methods for prevention and protection were also asked, showing that 75 percent of the families bought some kind of chemical fertilizers.
Figure 17 shows the distribution of local pests among households. Before describing the pests we want to point out that farmers might generate environmental problems due to their lack of knowledge related to pesticide management, specially its name and dose. The main reason for this could be their lack of English language knowledge, the language in which most of the pesticides use recommendations are written.
0
5
10
15
20
25
khumbrekira
hariyokira
ratokamila
lay kira butterfly kalokhumbre
monkey others
Num
ber o
f hou
seho
lds
Affected Reaction Prevention
Figure 17 Number of affected households per pest
50
The found pests were:
Khumbre kira (Melolontha sp.): 22 households confirmed having it in their fields and showed big concern about how to manage it, Moncunill et al. (2003) also talks about this farmers worry. It affects all crops and vegetables radicular system making plants weaker and more sensible to other plagues. It is a coleopter considered by the local as a major plague, therefore, we visited NARC in Patan, to investigate the current methods to prevent and fight this specie.
Some families apply potash, metacide or an unidentified pesticide. Others picked them up while preparing the soil. Household number 16 applied potash 2 weeks before planting as a prevention technique.
Hariyo kira: This plague translated as green worm, after its visual recognition, we confirm that this name matches with two species Etiella zinckinella and Tuta absoluta. As the 19 interviewees declared, it is a plague that can affect two different families, Fabaceae (soya been, red and green beans) and Solanaceae (tomato and chilly).
We think that when Moncunill et al. (2003) was talking about Etiella zinckenella when they cited a “new and unknown plague, a green insect that ate bean plant’s leaves and pods, reducing annual yield”. But apparently, E. zinckenella only attacks pods and green tissues (Abdou et al., 2006) so the plague that ate bean’s leaves might be a different one.
Moncunill et al. (2003) mentions that in 2003, farmers did not know how to manage it and some families just had started to use pesticides against it. Nowadays, farmers said to be using effective insecticides, potash or a blue powder, both used also as a fertilizer.
Pandey et al (2000) confirms the presence of Etiella zinckinella in Nepal in 1997, refering to it as a minor insect pest that attacks pigeon peas (Cajanus cajan) a Fabacea probably original from the Indian Subcontinent (Fuller et al., 2006). Hattori (1988) affirmes that this insects infests many Fabacea.
The tomato leaf and fruit miner Tuta absoluta was officially detected for the first time in Kathmandu during 2006. The pest was found in diferent Solanacea crops such as Solanum nigrum, egg plant (Solanum melongena), pepper (Capsicum annum) and potato (Solanum tuberosum) (Shree et al., 2016).
Liriomyza huidobrensis is a potato leaf miner (Giri et al., 2013) that also matches the given description. Though other crops were punctually mentioned, as cauliflower, cabbage, spinach and other leave edible crops, an identification could not be done by nor the author nor the interviewees.
Rato kamila: This arachnid is an unidentified red ant that affected 15 households. It produces a sticky substance on the surface of any crop or vegetable. Giri et al (2013) affirms that this ant is Dorylis orantalis which can also cause tuber damage in potato.
51
Some families mentioned that the source of this plague was usually the compost, where red ants can live together with khumbre kira. 20 percent of the families applied some kind of product to treat their plants but never for prevention. An organic matter well composted should not generate this kind of problems.
Lay kira: This insect is a brown aphid which affects spinach and mustard leaves and flowers, damaging grain’s quality, reducing the number of seeds and oil performance. Farmers always get their own seeds from their own crops.
More than a 30% of interviewed families confirmed to react against it. Household 8 applied some kind of liquid pesticide diluted with water. Households 13, 14 and 25 answered that they would apply some kind of unidentified insecticide.
Potali: This butterfly was not observed during the visits, but up to 5 households were worried about its presence in storage units. García et al. (2007) mentions three main world plagues affecting stored maize, Plodia interpunctella, Sitotroga cerealella and Prostephanus truncates, all of them
found in tropical and template areas, such as Bhimphedi.
From these three, only Plodia interpunctella and Sitotroga cerealella have a butterfly stadium. Even though, the cause in maize damage is related to, in both cases, its larvae.
Plodia interpunctella affects many cereal species while they are stored, eating the grain’s embryo, leaving their excrements and producing a dense silk net (García et al., 2007). These damages were observed in some visits.
Sitotroga cerealella can attack maize corns in the fields or while they are stored, mostly in tropical and templates areas such as Bhimphedi, could together with Sitophilus zeamays, be one of the causes of the holes in maize stored grains (García et al., 2007).
Household 8 affirmed to apply some kind of insecticide to the maize grain before storing it. The rest of them did not do anything to prevent or attack the plague.
Kalo khumbre (Sitophilus zeamays): This beetle was observed in every of the 4 families who said to suffer from holes in their maize corns, probably as a consequence of this plague. Sitophilus zeamays
is Coleoptera insect that perforates maize grains at its adult stadium, to lay their eggs (up to 250 eggs per female) so that the larvae feeds from the grain’s endosperm. Once they reach the adult stadium they perforate the grain again to emerge. It can be found in tropical, subtropical and template areas, where there can be from 2 to 3 generations per year (García et al., 2007).
Household number 8 applied some kind of insecticide to the maize grain before storing it, the same than for preventing smalls butterfly proliferation.
52
Mokeys: This mammal feeds from fields near to the forest, stealing mainly maize and fruit, even though it likes every crop. It was mentioned by Household 4 in Dumpki and Household 14 in Targaung. The first family said to prevent their attack by having one or more watchdogs.
In Figure 17 the column “Others” correspond to the following plagues:
- Corn smut (Ustilago sp.): thought it was not observed alive, some vestiges were visually identified in the dried maize corns, and when the only farmer (Household 8), whose corns showed this anomaly, gave a description of the plague, this matched with corn smut. They would not treat Ustilago sp in any way, we think because of the minor relevance.
- Snails: This gastropod attacks all crops and vegetables. According to Household 7, the only family who declared to be suffering snail attacks and said to fight them by applying potash.
- Busunah: This unidentified plague was described by Household 14. It perforates cucumber
and tomato leaves and can be eradicated with pesticides.
- White carrot leaves: This symptom described by Household 15, could match with powdery mildew (Erysiphe polygoni) or oidiopsis (Leveillula taurica or Oidipsis taurica) (Pardo, 2000 and Piccolo, 2013).
- Kito kira: This unidentified plague was described by Household 21. It attacks nursery, cutting its branches and leaves by the petiole.
- Pudla kira: This unidentified plague was described by Household 25. It attacks maize in an
unknown way.
7.4.5. Pests management and religion
When it comes to religion and agriculture, a case of strong connection was found in the household number 15 in Chabeli, where an old marriage lives, who frequently hosts volunteers from AN. The man turned to be the local Lama baje, the head of the local Buddhist community, while being one of the few professional farmers in Bhimphedi.
Because of his condition of strict Buddhist, he did not use of any kind of pesticide that could kill animals, something that goes against his religion postulates. Although there were more Buddhists interviewed, nobody else showed this concern and used pesticides.
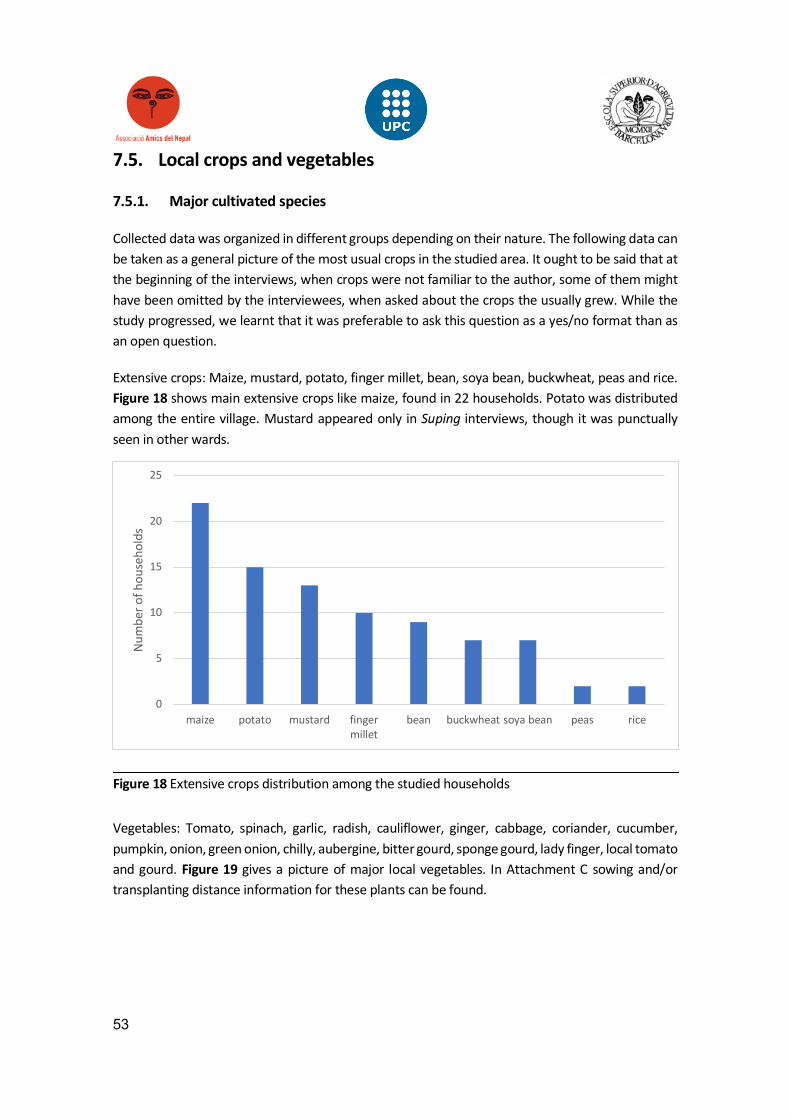
53
7.5. Local crops and vegetables
7.5.1. Major cultivated species
Collected data was organized in different groups depending on their nature. The following data can be taken as a general picture of the most usual crops in the studied area. It ought to be said that at the beginning of the interviews, when crops were not familiar to the author, some of them might have been omitted by the interviewees, when asked about the crops the usually grew. While the study progressed, we learnt that it was preferable to ask this question as a yes/no format than as an open question.
Extensive crops: Maize, mustard, potato, finger millet, bean, soya bean, buckwheat, peas and rice. Figure 18 shows main extensive crops like maize, found in 22 households. Potato was distributed among the entire village. Mustard appeared only in Suping interviews, though it was punctually seen in other wards.
Vegetables: Tomato, spinach, garlic, radish, cauliflower, ginger, cabbage, coriander, cucumber, pumpkin, onion, green onion, chilly, aubergine, bitter gourd, sponge gourd, lady finger, local tomato and gourd. Figure 19 gives a picture of major local vegetables. In Attachment C sowing and/or transplanting distance information for these plants can be found.
0
5
10
15
20
25
maize potato mustard fingermillet
bean buckwheat soya bean peas rice
Num
ber o
f hou
seho
lds
Figure 18 Extensive crops distribution among the studied households
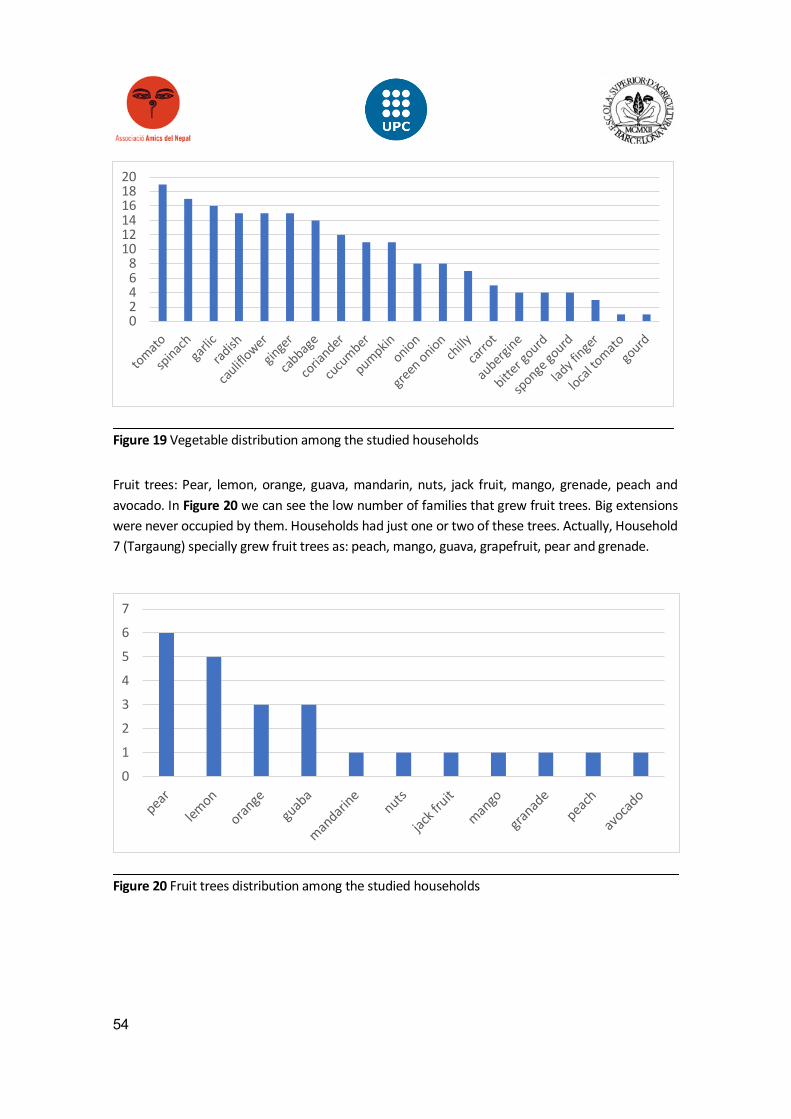
54
Fruit trees: Pear, lemon, orange, guava, mandarin, nuts, jack fruit, mango, grenade, peach and avocado. In Figure 20 we can see the low number of families that grew fruit trees. Big extensions were never occupied by them. Households had just one or two of these trees. Actually, Household 7 (Targaung) specially grew fruit trees as: peach, mango, guava, grapefruit, pear and grenade.
02468
101214161820
tomato
spinac
hga
rlicrad
ish
caulifl
owergin
ger
cabbag
e
coria
nder
cucu
mber
pumpkinonion
green
onionch
illycar
rot
aubergi
ne
bitter g
ourd
sponge
gourd
lady f
inger
local to
matogo
urd
Figure 19 Vegetable distribution among the studied households
0
1
2
3
4
5
6
7
pear
lemon
orange
guab
a
mandari
nenuts
jack f
ruit
mango
granad
epeach
avocad
o
Figure 20 Fruit trees distribution among the studied households
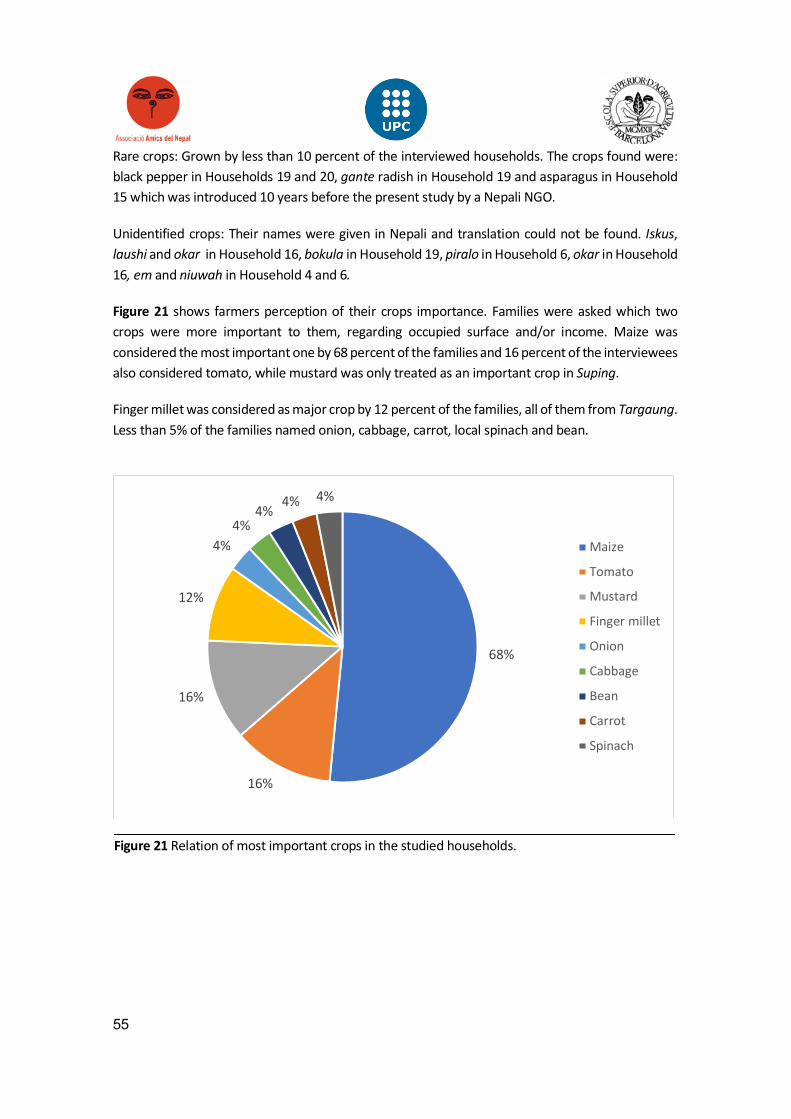
55
Rare crops: Grown by less than 10 percent of the interviewed households. The crops found were: black pepper in Households 19 and 20, gante radish in Household 19 and asparagus in Household 15 which was introduced 10 years before the present study by a Nepali NGO.
Unidentified crops: Their names were given in Nepali and translation could not be found. Iskus, laushi and okar in Household 16, bokula in Household 19, piralo in Household 6, okar in Household 16, em and niuwah in Household 4 and 6.
Figure 21 shows farmers perception of their crops importance. Families were asked which two crops were more important to them, regarding occupied surface and/or income. Maize was considered the most important one by 68 percent of the families and 16 percent of the interviewees also considered tomato, while mustard was only treated as an important crop in Suping.
Finger millet was considered as major crop by 12 percent of the families, all of them from Targaung. Less than 5% of the families named onion, cabbage, carrot, local spinach and bean.
68%
16%
16%
12%
4%4%
4%4% 4%
Maize
Tomato
Mustard
Finger millet
Onion
Cabbage
Bean
Carrot
Spinach
Figure 21 Relation of most important crops in the studied households.
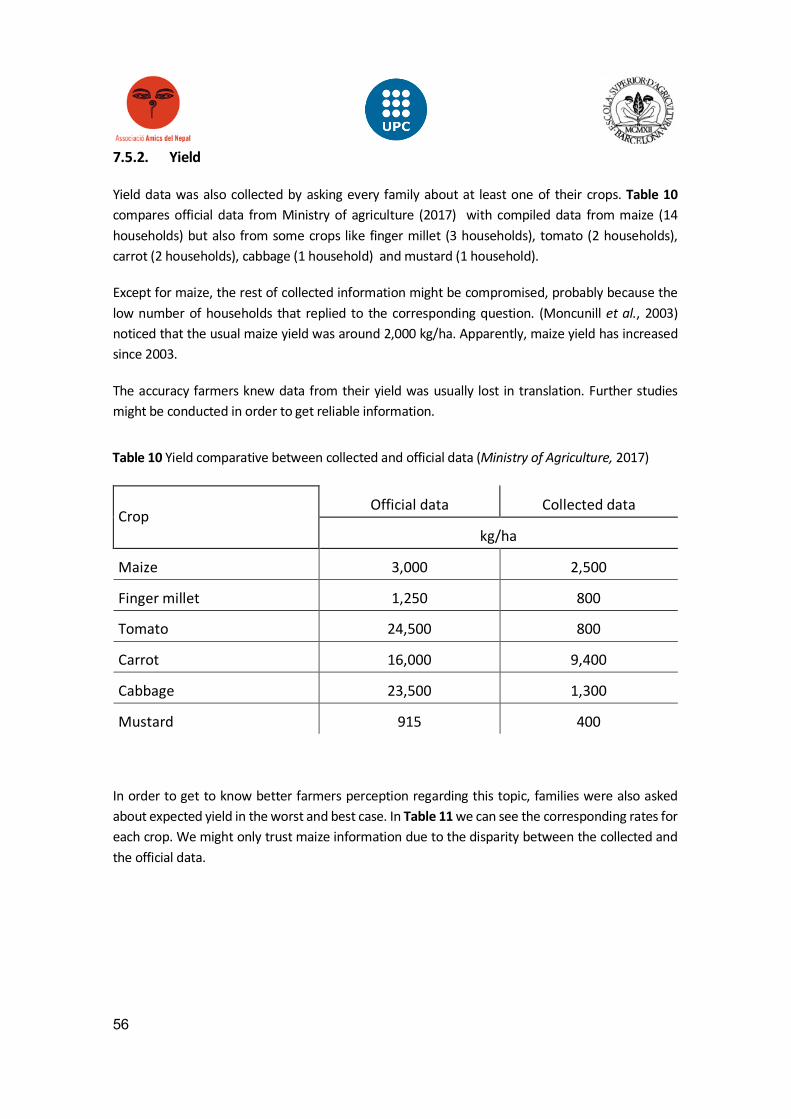
56
7.5.2. Yield
Yield data was also collected by asking every family about at least one of their crops. Table 10 compares official data from Ministry of agriculture (2017) with compiled data from maize (14 households) but also from some crops like finger millet (3 households), tomato (2 households), carrot (2 households), cabbage (1 household) and mustard (1 household).
Except for maize, the rest of collected information might be compromised, probably because the low number of households that replied to the corresponding question. (Moncunill et al., 2003) noticed that the usual maize yield was around 2,000 kg/ha. Apparently, maize yield has increased since 2003.
The accuracy farmers knew data from their yield was usually lost in translation. Further studies might be conducted in order to get reliable information.
In order to get to know better farmers perception regarding this topic, families were also asked about expected yield in the worst and best case. In Table 11 we can see the corresponding rates for each crop. We might only trust maize information due to the disparity between the collected and the official data.
Table 10 Yield comparative between collected and official data (Ministry of Agriculture, 2017)
Crop Official data Collected data
kg/ha
Maize 3,000 2,500
Finger millet 1,250 800
Tomato 24,500 800
Carrot 16,000 9,400
Cabbage 23,500 1,300
Mustard 915 400
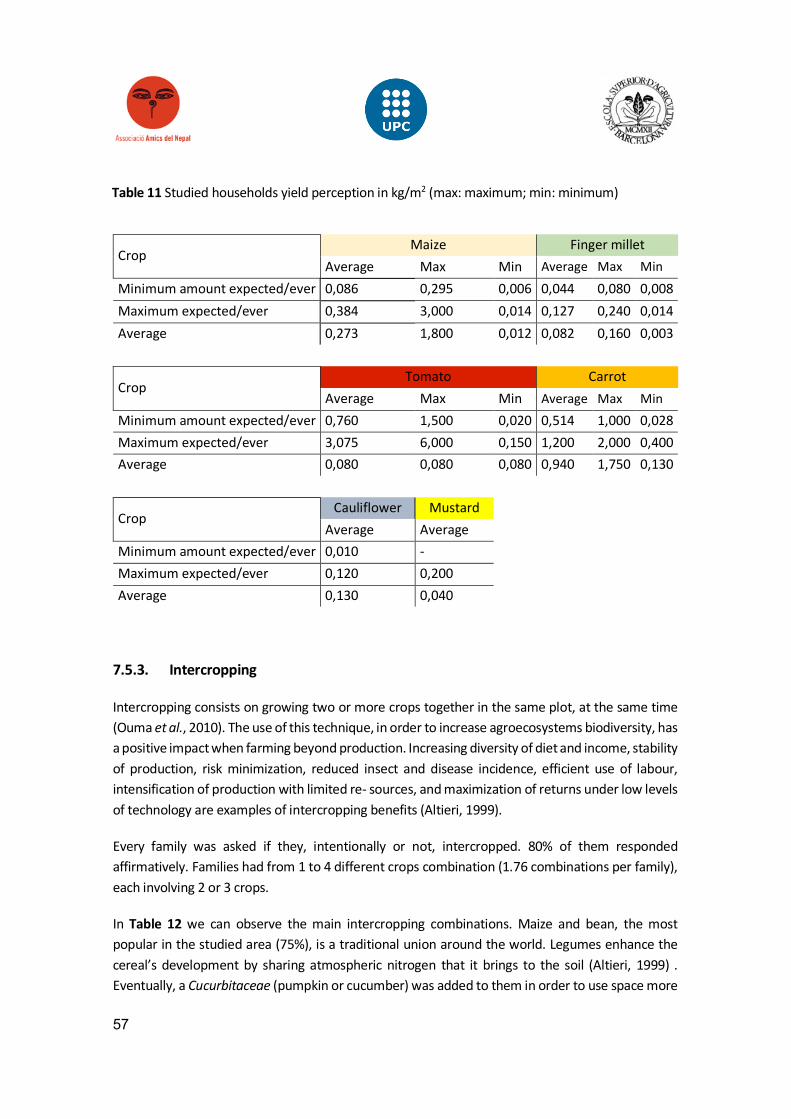
57
Crop Maize Finger millet
Average Max Min Average Max Min
Minimum amount expected/ever 0,086 0,295 0,006 0,044 0,080 0,008 Maximum expected/ever 0,384 3,000 0,014 0,127 0,240 0,014 Average 0,273 1,800 0,012 0,082 0,160 0,003
Crop Tomato Carrot
Average Max Min Average Max Min Minimum amount expected/ever 0,760 1,500 0,020 0,514 1,000 0,028 Maximum expected/ever 3,075 6,000 0,150 1,200 2,000 0,400 Average 0,080 0,080 0,080 0,940 1,750 0,130
Crop Cauliflower Mustard
Average Average
Minimum amount expected/ever 0,010 -
Maximum expected/ever 0,120 0,200
Average 0,130 0,040
7.5.3. Intercropping
Intercropping consists on growing two or more crops together in the same plot, at the same time (Ouma et al., 2010). The use of this technique, in order to increase agroecosystems biodiversity, has a positive impact when farming beyond production. Increasing diversity of diet and income, stability of production, risk minimization, reduced insect and disease incidence, efficient use of labour, intensification of production with limited re- sources, and maximization of returns under low levels of technology are examples of intercropping benefits (Altieri, 1999).
Every family was asked if they, intentionally or not, intercropped. 80% of them responded affirmatively. Families had from 1 to 4 different crops combination (1.76 combinations per family), each involving 2 or 3 crops.
In Table 12 we can observe the main intercropping combinations. Maize and bean, the most popular in the studied area (75%), is a traditional union around the world. Legumes enhance the cereal’s development by sharing atmospheric nitrogen that it brings to the soil (Altieri, 1999) . Eventually, a Cucurbitaceae (pumpkin or cucumber) was added to them in order to use space more
Table 11 Studied households yield perception in kg/m2 (max: maximum; min: minimum)
58
efficiently and promoting nutrients cycling by pumping back to the surface the percolated nutrients. This three crop association is also popular in countries like Mexico (Altieri, 1999).
In the case of soya bean, Household 16 and 20 said these crops were sown at the same time. However, Household 19 affirmed that soya bean sowing was performed later than maize’s. Concretely, soya was spread between maize’s rows after weed had been removed for the first time.
Cucumber with tree used as a cane (35 percent) allows farmers to save space. Sometimes there were too many plants climbing harmfully the same tree. Even though it does not appear in Table 12 Intercropping combinations found among the studied households, pumpkin was also planted nearby trees so that the same relation was established. Cucumber was eventually intercropped also with bean or soya bean, within a similar positive effect as the one between maize and a Fabaceae.
Mustard and wheat in Household 20, or mustard and peas in Household 19 were also considered a local traditional intercropping system by the respective families. An Indian experience led by Banik et al. (2000) confirmed the benefits of intercropping mustard (Brassica compestris Var. Toria) and pea.
Mustard was sown after rainy season along with maize dried plants by Household 1 as a way of saving labour force. Other minor intercropping was found. Household 15, in order to use its irrigated greenhouse space more efficiently, had sowed carrots between tomato rows during dry season.
7.5.4. Cropping calendar
Attachment C contains information compiled by Fisse (not published) between 2014 and 2016 regarding different vegetable and varieties planting and harvesting periods, along with sowing or planting frame and yield references. However, as appointed in section 0. Climate Change is leading towards calendar crop changes that might be considered, through temperature variation, rainy season shortening.
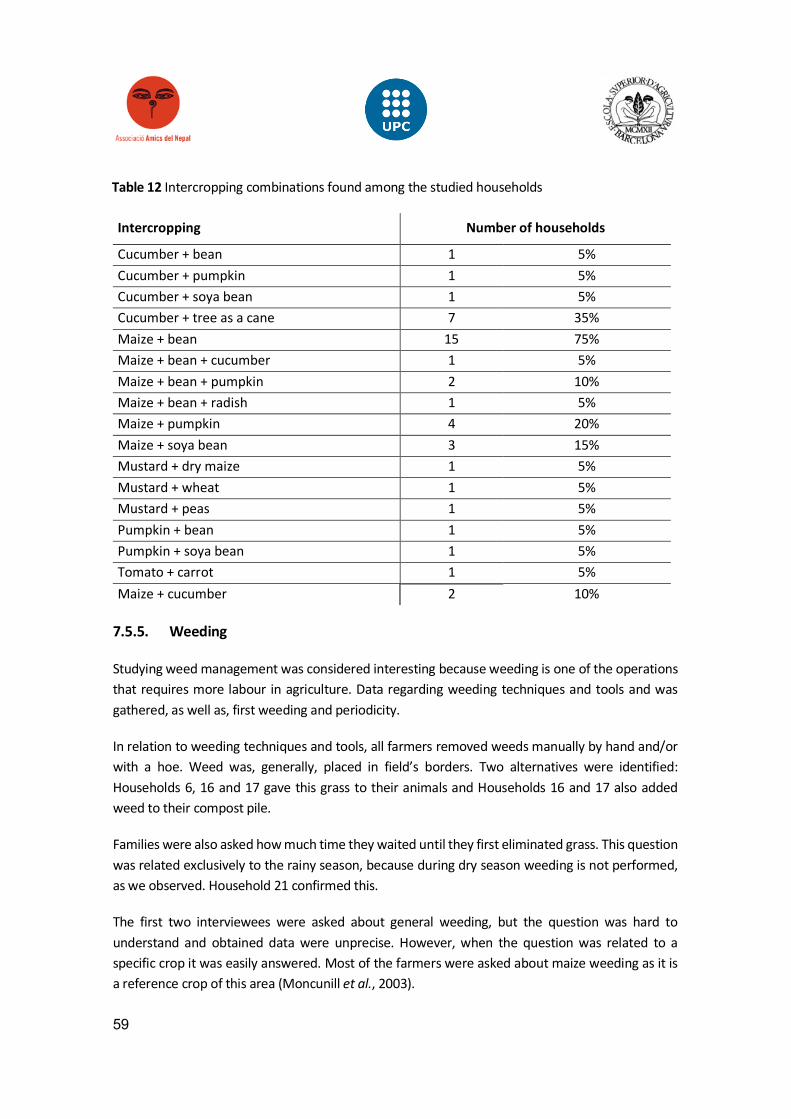
59
7.5.5. Weeding
Studying weed management was considered interesting because weeding is one of the operations that requires more labour in agriculture. Data regarding weeding techniques and tools and was gathered, as well as, first weeding and periodicity.
In relation to weeding techniques and tools, all farmers removed weeds manually by hand and/or with a hoe. Weed was, generally, placed in field’s borders. Two alternatives were identified: Households 6, 16 and 17 gave this grass to their animals and Households 16 and 17 also added weed to their compost pile.
Families were also asked how much time they waited until they first eliminated grass. This question was related exclusively to the rainy season, because during dry season weeding is not performed, as we observed. Household 21 confirmed this.
The first two interviewees were asked about general weeding, but the question was hard to understand and obtained data were unprecise. However, when the question was related to a specific crop it was easily answered. Most of the farmers were asked about maize weeding as it is a reference crop of this area (Moncunill et al., 2003).
Table 12 Intercropping combinations found among the studied households
Intercropping Number of households
Cucumber + bean 1 5% Cucumber + pumpkin 1 5% Cucumber + soya bean 1 5% Cucumber + tree as a cane 7 35% Maize + bean 15 75% Maize + bean + cucumber 1 5% Maize + bean + pumpkin 2 10% Maize + bean + radish 1 5% Maize + pumpkin 4 20% Maize + soya bean 3 15% Mustard + dry maize 1 5% Mustard + wheat 1 5% Mustard + peas 1 5% Pumpkin + bean 1 5% Pumpkin + soya bean 1 5% Tomato + carrot 1 5% Maize + cucumber 2 10%
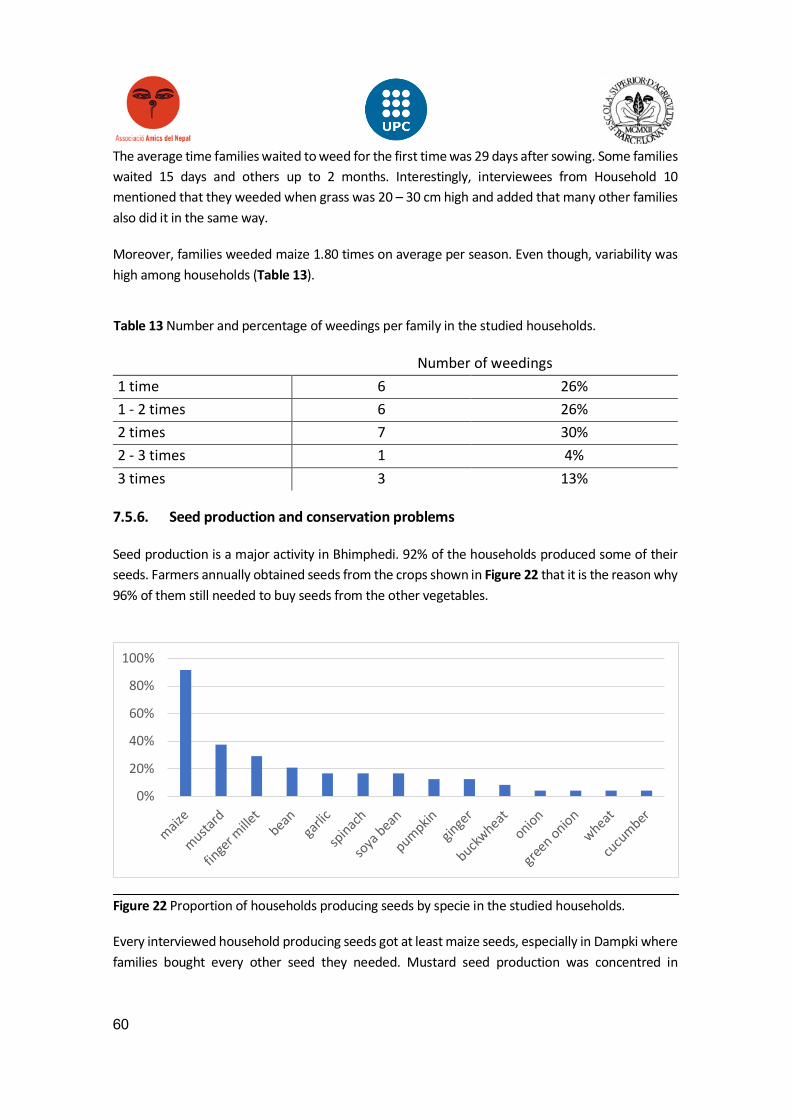
60
The average time families waited to weed for the first time was 29 days after sowing. Some families waited 15 days and others up to 2 months. Interestingly, interviewees from Household 10 mentioned that they weeded when grass was 20 – 30 cm high and added that many other families also did it in the same way.
Moreover, families weeded maize 1.80 times on average per season. Even though, variability was high among households (Table 13).
Number of weedings 1 time 6 26% 1 - 2 times 6 26% 2 times 7 30% 2 - 3 times 1 4% 3 times 3 13%
7.5.6. Seed production and conservation problems
Seed production is a major activity in Bhimphedi. 92% of the households produced some of their seeds. Farmers annually obtained seeds from the crops shown in Figure 22 that it is the reason why 96% of them still needed to buy seeds from the other vegetables.
Every interviewed household producing seeds got at least maize seeds, especially in Dampki where families bought every other seed they needed. Mustard seed production was concentred in
Table 13 Number and percentage of weedings per family in the studied households.
0%
20%
40%
60%
80%
100%
maize
mustard
finge
r mille
tbean
garlic
spinach
soya
bean
pumpkingin
ger
buckwheat
onion
green onion
wheat
cucu
mber
Figure 22 Proportion of households producing seeds by specie in the studied households.
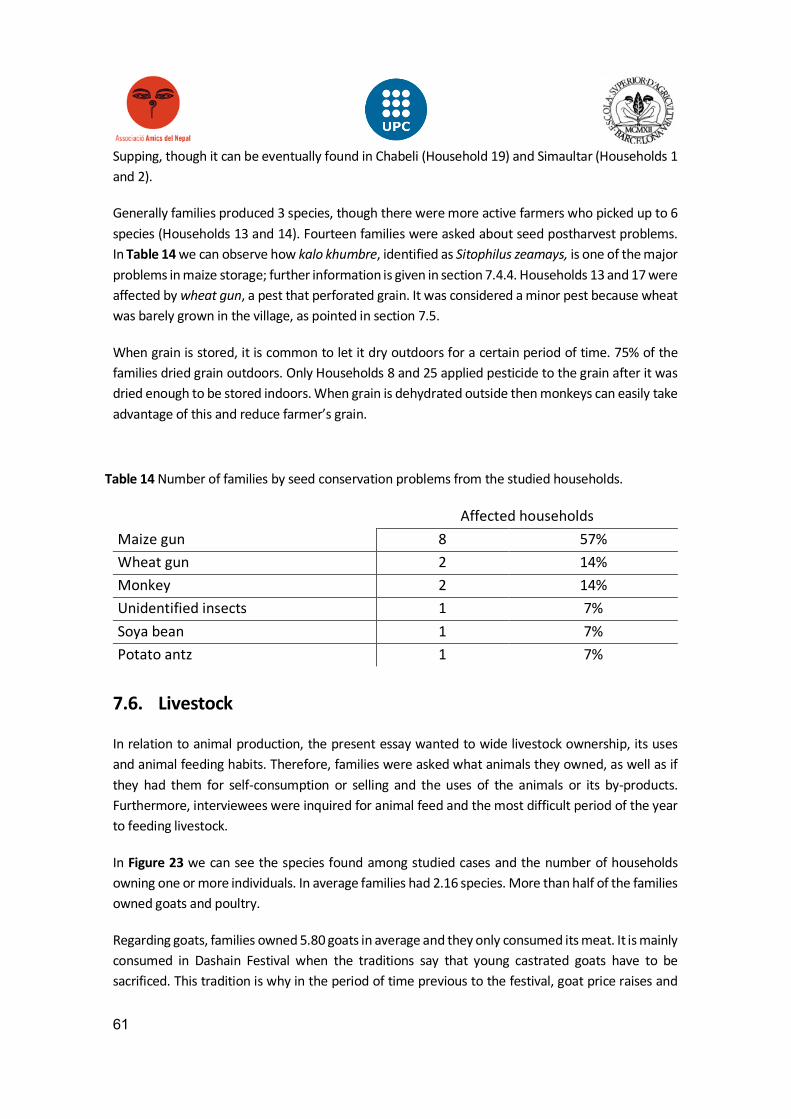
61
Supping, though it can be eventually found in Chabeli (Household 19) and Simaultar (Households 1 and 2).
Generally families produced 3 species, though there were more active farmers who picked up to 6 species (Households 13 and 14). Fourteen families were asked about seed postharvest problems. In Table 14 we can observe how kalo khumbre, identified as Sitophilus zeamays, is one of the major problems in maize storage; further information is given in section 7.4.4. Households 13 and 17 were affected by wheat gun, a pest that perforated grain. It was considered a minor pest because wheat was barely grown in the village, as pointed in section 7.5.
When grain is stored, it is common to let it dry outdoors for a certain period of time. 75% of the families dried grain outdoors. Only Households 8 and 25 applied pesticide to the grain after it was dried enough to be stored indoors. When grain is dehydrated outside then monkeys can easily take advantage of this and reduce farmer’s grain.
Affected households Maize gun 8 57% Wheat gun 2 14% Monkey 2 14% Unidentified insects 1 7% Soya bean 1 7% Potato antz 1 7%
7.6. Livestock
In relation to animal production, the present essay wanted to wide livestock ownership, its uses and animal feeding habits. Therefore, families were asked what animals they owned, as well as if they had them for self-consumption or selling and the uses of the animals or its by-products. Furthermore, interviewees were inquired for animal feed and the most difficult period of the year to feeding livestock.
In Figure 23 we can see the species found among studied cases and the number of households owning one or more individuals. In average families had 2.16 species. More than half of the families owned goats and poultry.
Regarding goats, families owned 5.80 goats in average and they only consumed its meat. It is mainly consumed in Dashain Festival when the traditions say that young castrated goats have to be sacrificed. This tradition is why in the period of time previous to the festival, goat price raises and
Table 14 Number of families by seed conservation problems from the studied households.
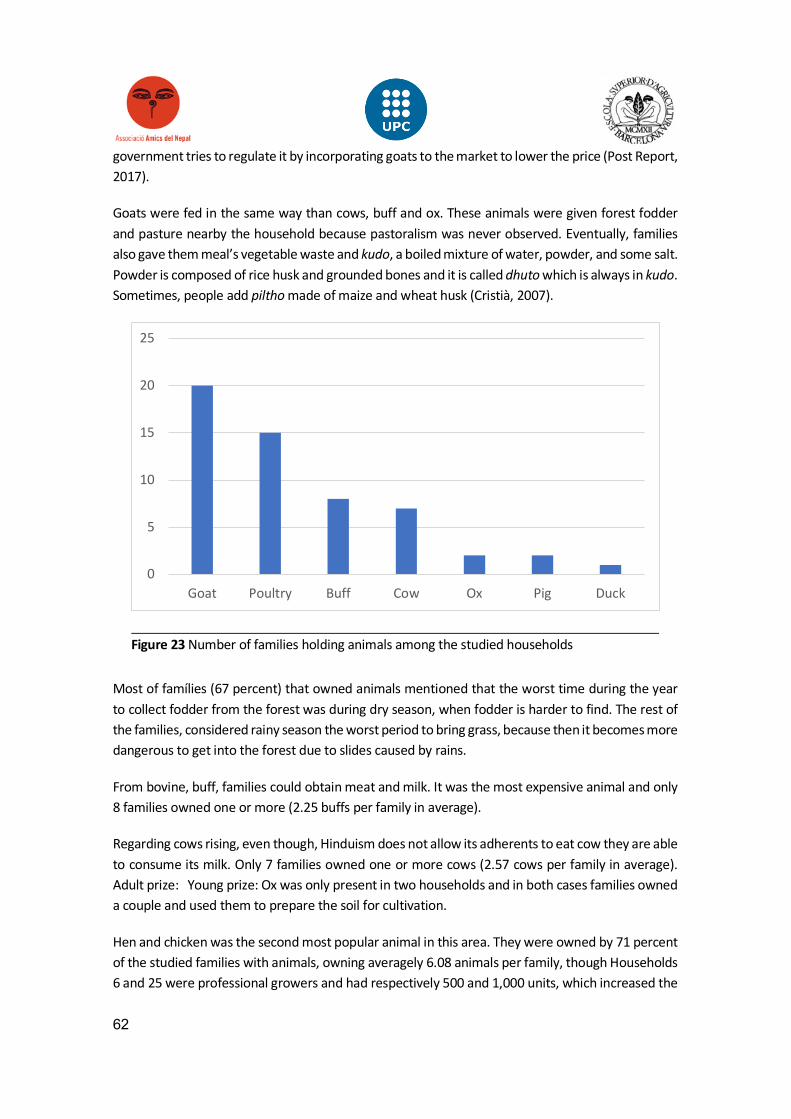
62
government tries to regulate it by incorporating goats to the market to lower the price (Post Report, 2017).
Goats were fed in the same way than cows, buff and ox. These animals were given forest fodder and pasture nearby the household because pastoralism was never observed. Eventually, families also gave them meal’s vegetable waste and kudo, a boiled mixture of water, powder, and some salt. Powder is composed of rice husk and grounded bones and it is called dhuto which is always in kudo. Sometimes, people add piltho made of maize and wheat husk (Cristià, 2007).
Most of famílies (67 percent) that owned animals mentioned that the worst time during the year to collect fodder from the forest was during dry season, when fodder is harder to find. The rest of the families, considered rainy season the worst period to bring grass, because then it becomes more dangerous to get into the forest due to slides caused by rains.
From bovine, buff, families could obtain meat and milk. It was the most expensive animal and only 8 families owned one or more (2.25 buffs per family in average).
Regarding cows rising, even though, Hinduism does not allow its adherents to eat cow they are able to consume its milk. Only 7 families owned one or more cows (2.57 cows per family in average). Adult prize: Young prize: Ox was only present in two households and in both cases families owned a couple and used them to prepare the soil for cultivation.
Hen and chicken was the second most popular animal in this area. They were owned by 71 percent of the studied families with animals, owning averagely 6.08 animals per family, though Households 6 and 25 were professional growers and had respectively 500 and 1,000 units, which increased the
0
5
10
15
20
25
Goat Poultry Buff Cow Ox Pig Duck
Figure 23 Number of families holding animals among the studied households
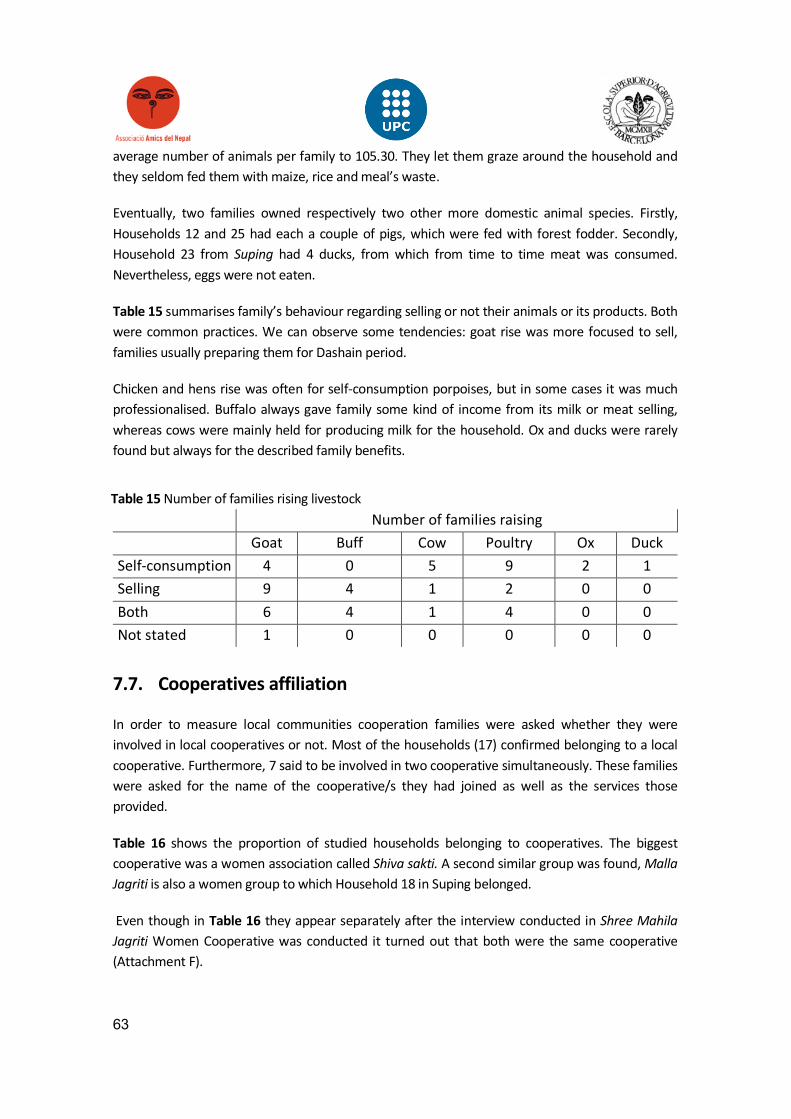
63
average number of animals per family to 105.30. They let them graze around the household and they seldom fed them with maize, rice and meal’s waste.
Eventually, two families owned respectively two other more domestic animal species. Firstly, Households 12 and 25 had each a couple of pigs, which were fed with forest fodder. Secondly, Household 23 from Suping had 4 ducks, from which from time to time meat was consumed. Nevertheless, eggs were not eaten.
Table 15 summarises family’s behaviour regarding selling or not their animals or its products. Both were common practices. We can observe some tendencies: goat rise was more focused to sell, families usually preparing them for Dashain period.
Chicken and hens rise was often for self-consumption porpoises, but in some cases it was much professionalised. Buffalo always gave family some kind of income from its milk or meat selling, whereas cows were mainly held for producing milk for the household. Ox and ducks were rarely found but always for the described family benefits.
7.7. Cooperatives affiliation
In order to measure local communities cooperation families were asked whether they were involved in local cooperatives or not. Most of the households (17) confirmed belonging to a local cooperative. Furthermore, 7 said to be involved in two cooperative simultaneously. These families were asked for the name of the cooperative/s they had joined as well as the services those provided.
Table 16 shows the proportion of studied households belonging to cooperatives. The biggest cooperative was a women association called Shiva sakti. A second similar group was found, Malla
Jagriti is also a women group to which Household 18 in Suping belonged.
Even though in Table 16 they appear separately after the interview conducted in Shree Mahila
Jagriti Women Cooperative was conducted it turned out that both were the same cooperative (Attachment F).
Table 15 Number of families rising livestock Number of families raising Goat Buff Cow Poultry Ox Duck Self-consumption 4 0 5 9 2 1 Selling 9 4 1 2 0 0 Both 6 4 1 4 0 0 Not stated 1 0 0 0 0 0
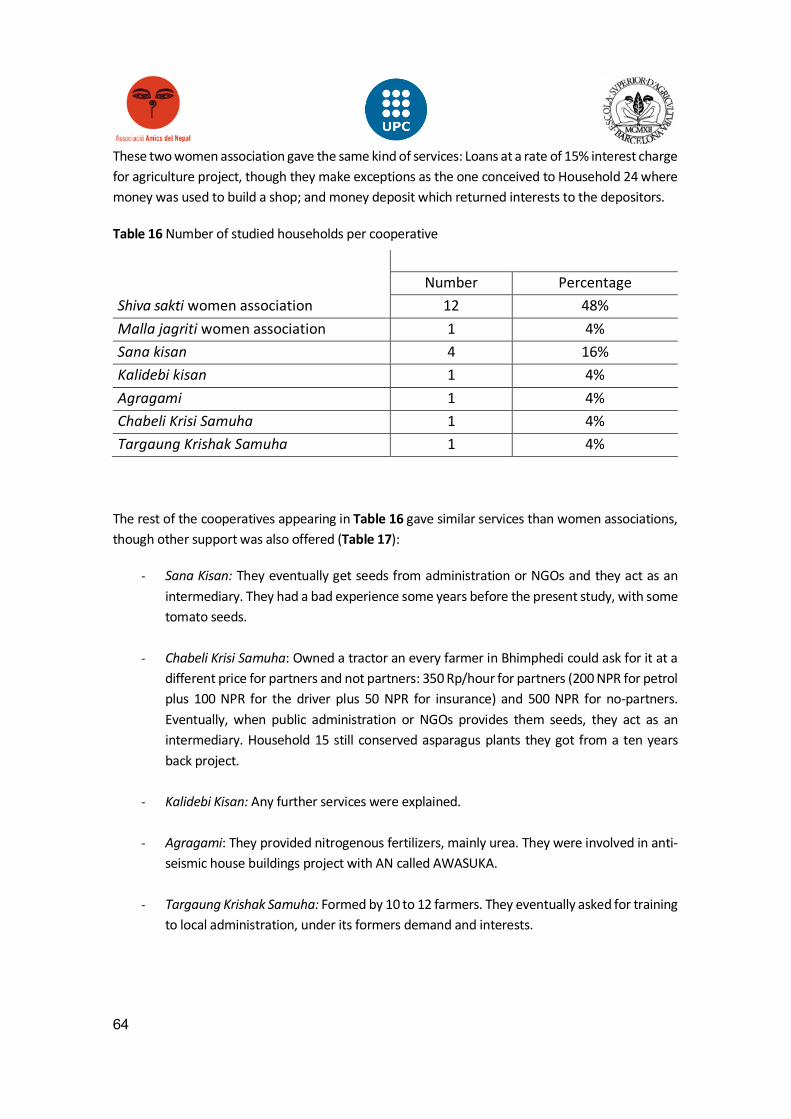
64
These two women association gave the same kind of services: Loans at a rate of 15% interest charge for agriculture project, though they make exceptions as the one conceived to Household 24 where money was used to build a shop; and money deposit which returned interests to the depositors.
Table 16 Number of studied households per cooperative
The rest of the cooperatives appearing in Table 16 gave similar services than women associations, though other support was also offered (Table 17):
- Sana Kisan: They eventually get seeds from administration or NGOs and they act as an intermediary. They had a bad experience some years before the present study, with some tomato seeds.
- Chabeli Krisi Samuha: Owned a tractor an every farmer in Bhimphedi could ask for it at a different price for partners and not partners: 350 Rp/hour for partners (200 NPR for petrol plus 100 NPR for the driver plus 50 NPR for insurance) and 500 NPR for no-partners. Eventually, when public administration or NGOs provides them seeds, they act as an intermediary. Household 15 still conserved asparagus plants they got from a ten years back project.
- Kalidebi Kisan: Any further services were explained.
- Agragami: They provided nitrogenous fertilizers, mainly urea. They were involved in anti-
seismic house buildings project with AN called AWASUKA.
- Targaung Krishak Samuha: Formed by 10 to 12 farmers. They eventually asked for training to local administration, under its formers demand and interests.
Number Percentage Shiva sakti women association 12 48% Malla jagriti women association 1 4% Sana kisan 4 16% Kalidebi kisan 1 4% Agragami 1 4% Chabeli Krisi Samuha 1 4% Targaung Krishak Samuha 1 4%
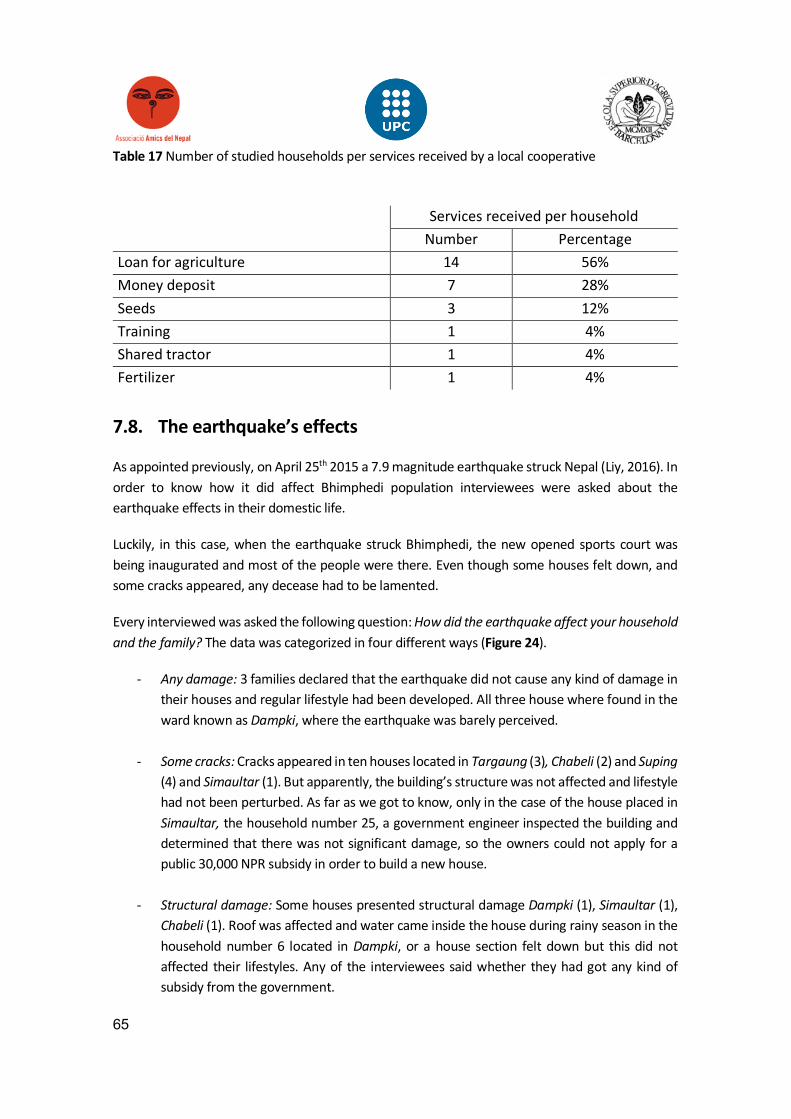
65
Table 17 Number of studied households per services received by a local cooperative
7.8. The earthquake’s effects
As appointed previously, on April 25th 2015 a 7.9 magnitude earthquake struck Nepal (Liy, 2016). In order to know how it did affect Bhimphedi population interviewees were asked about the earthquake effects in their domestic life.
Luckily, in this case, when the earthquake struck Bhimphedi, the new opened sports court was being inaugurated and most of the people were there. Even though some houses felt down, and some cracks appeared, any decease had to be lamented.
Every interviewed was asked the following question: How did the earthquake affect your household
and the family? The data was categorized in four different ways (Figure 24).
- Any damage: 3 families declared that the earthquake did not cause any kind of damage in their houses and regular lifestyle had been developed. All three house where found in the ward known as Dampki, where the earthquake was barely perceived.
- Some cracks: Cracks appeared in ten houses located in Targaung (3), Chabeli (2) and Suping
(4) and Simaultar (1). But apparently, the building’s structure was not affected and lifestyle had not been perturbed. As far as we got to know, only in the case of the house placed in Simaultar, the household number 25, a government engineer inspected the building and determined that there was not significant damage, so the owners could not apply for a public 30,000 NPR subsidy in order to build a new house.
- Structural damage: Some houses presented structural damage Dampki (1), Simaultar (1), Chabeli (1). Roof was affected and water came inside the house during rainy season in the household number 6 located in Dampki, or a house section felt down but this did not affected their lifestyles. Any of the interviewees said whether they had got any kind of subsidy from the government.
Services received per household
Number Percentage Loan for agriculture 14 56% Money deposit 7 28% Seeds 3 12% Training 1 4% Shared tractor 1 4% Fertilizer 1 4%
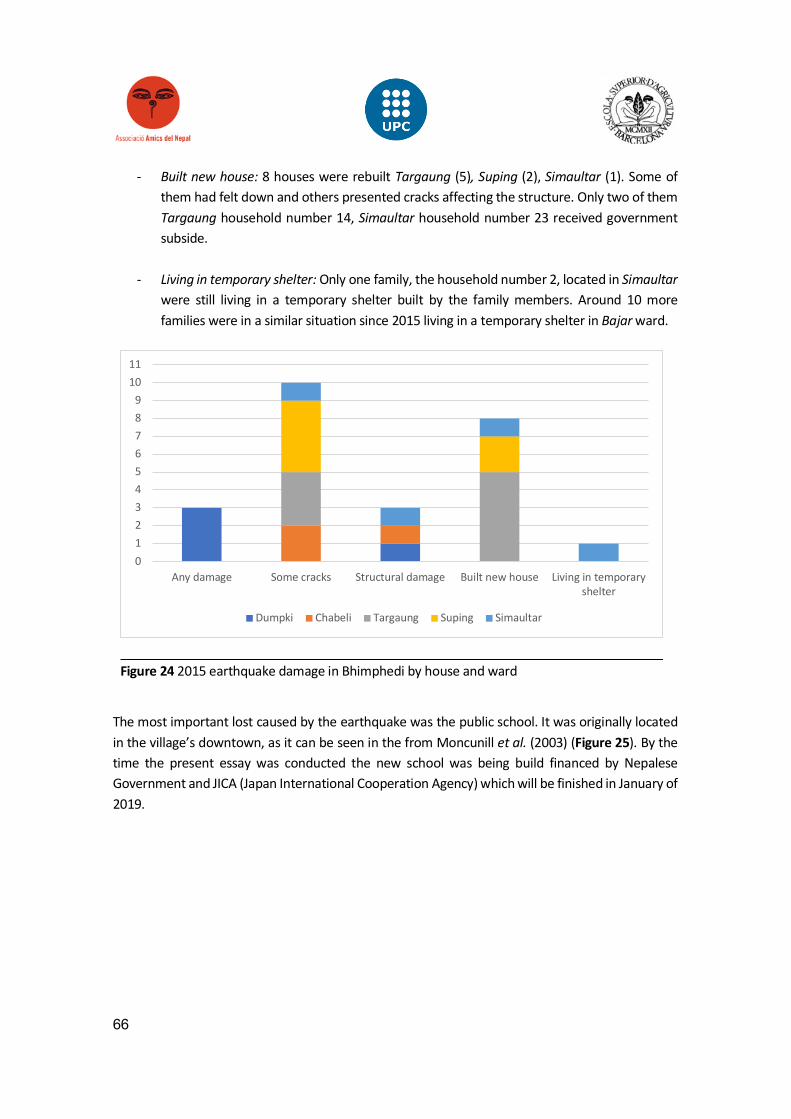
66
- Built new house: 8 houses were rebuilt Targaung (5), Suping (2), Simaultar (1). Some of them had felt down and others presented cracks affecting the structure. Only two of them
Targaung household number 14, Simaultar household number 23 received government subside.
- Living in temporary shelter: Only one family, the household number 2, located in Simaultar were still living in a temporary shelter built by the family members. Around 10 more families were in a similar situation since 2015 living in a temporary shelter in Bajar ward.
The most important lost caused by the earthquake was the public school. It was originally located in the village’s downtown, as it can be seen in the from Moncunill et al. (2003) (Figure 25). By the time the present essay was conducted the new school was being build financed by Nepalese Government and JICA (Japan International Cooperation Agency) which will be finished in January of 2019.
0123456789
1011
Any damage Some cracks Structural damage Built new house Living in temporaryshelter
Dumpki Chabeli Targaung Suping Simaultar
Figure 24 2015 earthquake damage in Bhimphedi by house and ward
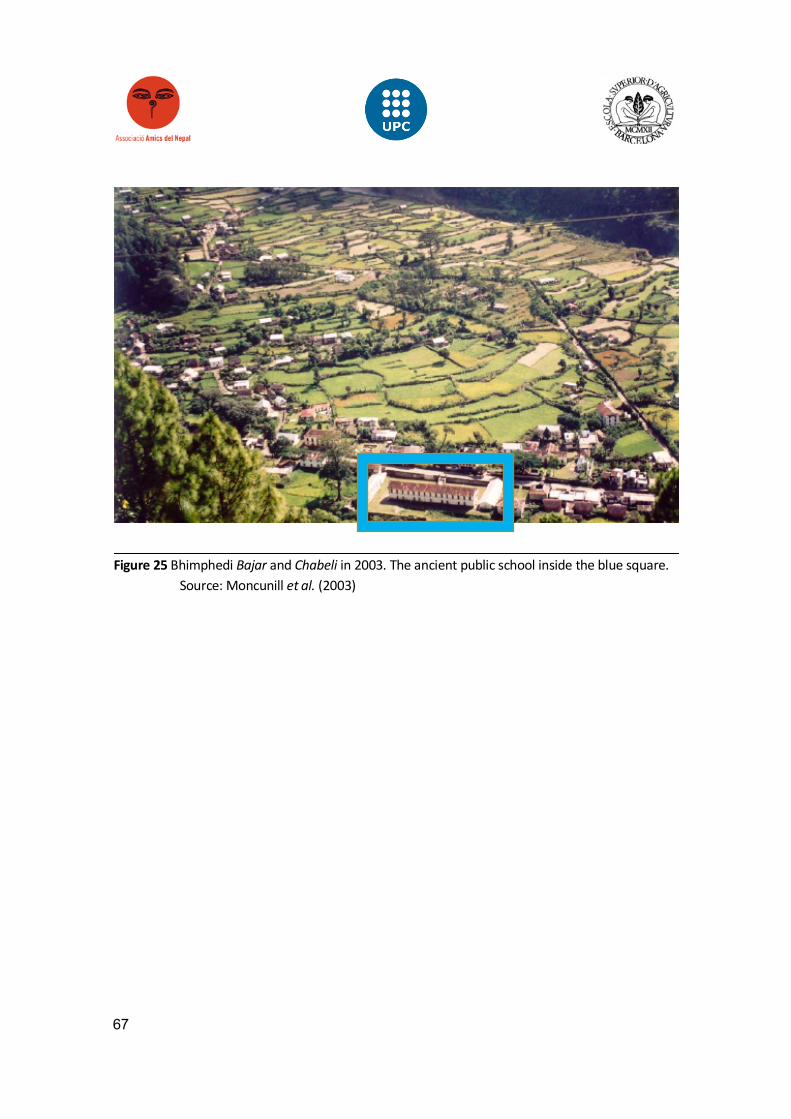
67
Figure 25 Bhimphedi Bajar and Chabeli in 2003. The ancient public school inside the blue square. Source: Moncunill et al. (2003)
68
8. Opportunities
After conducting the interviews and analysing the collected data some agricultural improvement opportunities were described. These proposals have considered the agriculture deficits detected, as well as the local socio-economic factors linked, and, the current alternatives enhanced by local initiatives and public research.
As a prerequisite, any further project has to be conducted together with a local counterpart in charge of monitoring the project. Amics del Nepal, could have this role. They have a piece of land in the children home they managed in Bhimphedi, where they were ready to try new techniques with potential to complement the villagers agriculture techniques.
Traditional farming is well established, hence any change on farming should be first tried by UPC or AN volunteers in Balmandir and showed to the families, who will not easily hand their land for trials.
Small scale trials could be a useful tool to spread profitable management changes among farmers. These trials, would allow farmers to check by themselves whether our proposals could benefit them or not, while gaining their trust as we would not be asking families for their land and to risk their yield by trying an alien technique.
However, as we pointed in the corresponding sessions, in case of organizing any kind of training or project, another interesting way of cooperation; local festivities should be considered when programming the corresponding steps or sessions. Language and literacy status, when preparing any kind of audio-visual or written support. Nepali was spoken by all of the interviewees and English was known by only three of them.
Furthermore, any plan should also rely on local cooperatives, very active collectives that have proved their viability. They would help reaching a good number of beneficiaries and monitoring the processes without forgetting those families less active in these associations.
8.1. Compost production alternatives
Local farmers manifested their worries related to khumbre kira (Melolontha sp) populations management as a limitation of their yield.
During our visit to NARC we consulted with met Sudeep K. U. An entomology specialist who recommended the promotion of better compost production techniques as a prevention strategy to reduce this pest negative impact. After observation during the interviews, we considered that introducing the alternatives Mr. Sudeep proposed, a higher quality compost free of Melolontha sp. can be obtained through farmers training.
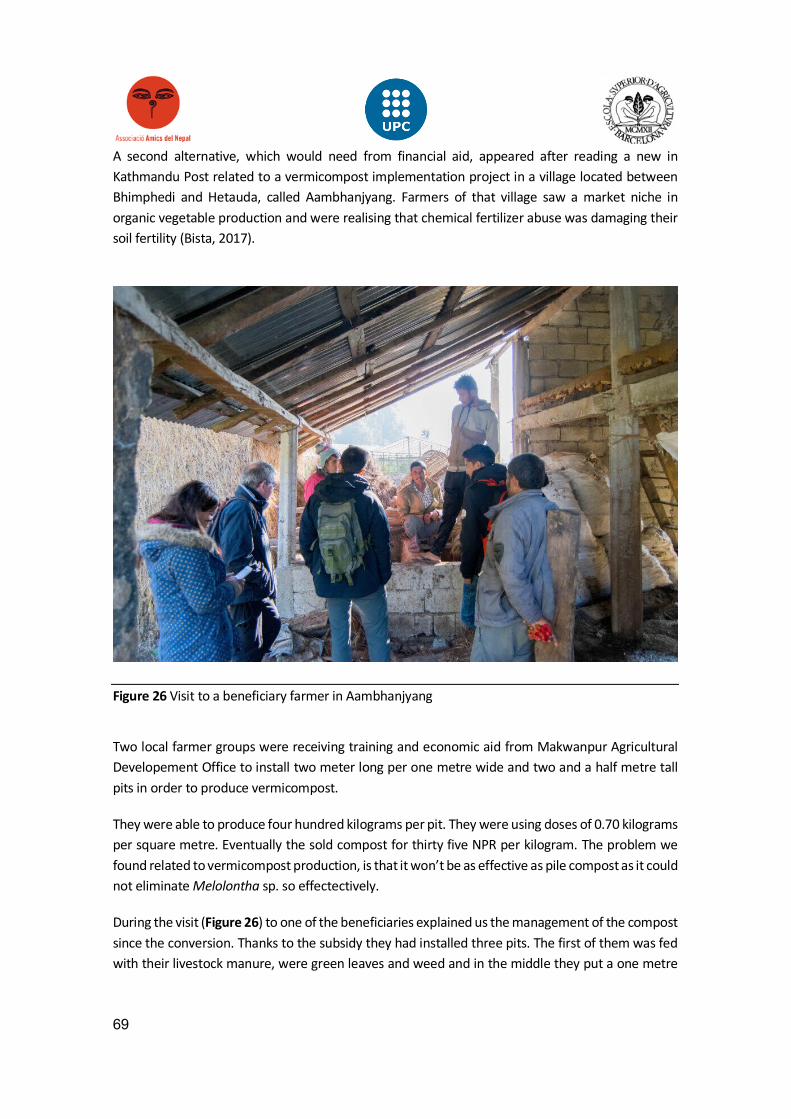
69
A second alternative, which would need from financial aid, appeared after reading a new in Kathmandu Post related to a vermicompost implementation project in a village located between Bhimphedi and Hetauda, called Aambhanjyang. Farmers of that village saw a market niche in organic vegetable production and were realising that chemical fertilizer abuse was damaging their soil fertility (Bista, 2017).
Two local farmer groups were receiving training and economic aid from Makwanpur Agricultural Developement Office to install two meter long per one metre wide and two and a half metre tall pits in order to produce vermicompost.
They were able to produce four hundred kilograms per pit. They were using doses of 0.70 kilograms per square metre. Eventually the sold compost for thirty five NPR per kilogram. The problem we found related to vermicompost production, is that it won’t be as effective as pile compost as it could not eliminate Melolontha sp. so effectectively.
During the visit (Figure 26) to one of the beneficiaries explained us the management of the compost since the conversion. Thanks to the subsidy they had installed three pits. The first of them was fed with their livestock manure, were green leaves and weed and in the middle they put a one metre
Figure 26 Visit to a beneficiary farmer in Aambhanjyang
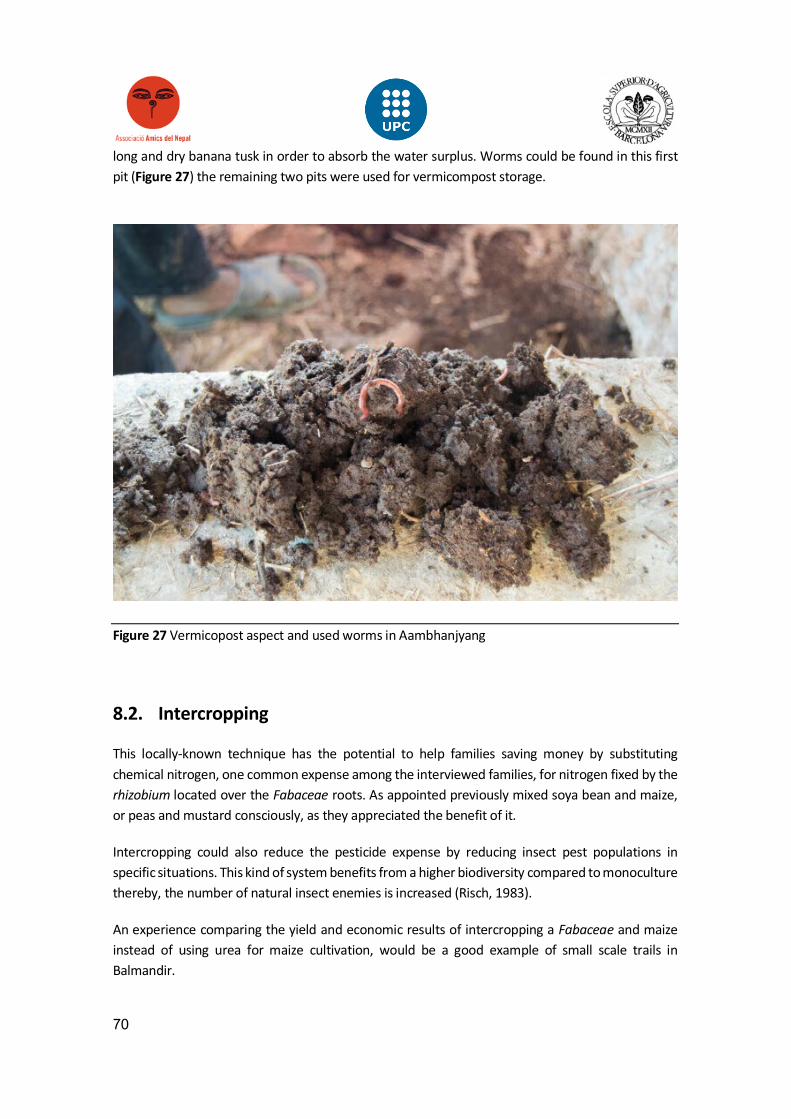
70
long and dry banana tusk in order to absorb the water surplus. Worms could be found in this first pit (Figure 27) the remaining two pits were used for vermicompost storage.
8.2. Intercropping
This locally-known technique has the potential to help families saving money by substituting chemical nitrogen, one common expense among the interviewed families, for nitrogen fixed by the rhizobium located over the Fabaceae roots. As appointed previously mixed soya bean and maize, or peas and mustard consciously, as they appreciated the benefit of it.
Intercropping could also reduce the pesticide expense by reducing insect pest populations in specific situations. This kind of system benefits from a higher biodiversity compared to monoculture thereby, the number of natural insect enemies is increased (Risch, 1983).
An experience comparing the yield and economic results of intercropping a Fabaceae and maize instead of using urea for maize cultivation, would be a good example of small scale trails in Balmandir.
Figure 27 Vermicopost aspect and used worms in Aambhanjyang
71
The idea of fruit tree and vegetable intercropping is an interesting alternative also known by some of the families, who had heard about the technique but were reluctant to try it without having seen a similar experience by themselves.
Agroforestry, as this kind of agroecosystems are usually called, is an interesting alternative to maximize land productivity in a sustainable way that also prevents loss of soil fertility due to soil erosion (Ouma et al., 2010). As appointed by a technician from the CHC, some Citrus species could be good candidates to try this, as this is a family which could live in Bhimphedi and require low management. Moringa oleifera, would be another interesting option, as it is a fast growing tree which needs low inputs and management (Nouman et al., 2014).
8.3. Crop rotation
During the interview with Mr. Chandra, responsible of Bhimphedi agriculture office, showed big concern related to soil fatigue, a problem that from his point of view, appeared after the introduction of chemical fertilizers.
On one hand, crop rotation maximizes the use of fertilizers thanks to the succession of different species with different nutrient needs, and, plants with nutrients pumping capacity. On the other hand, soil fatigue is usually related to the production of the same species in the same plot repeatedly, as the common plagues of the specific crop may be benefited (Bullock, 1992).
Crop rotation could be introduced more effectively by doing plant nursery training a minor practice among families. Generally, families did a small plot and sowed straight into the soil, without tray or any kind of physical support. When the plant was ready to transplant and aggressively pulled out, with consequential loss of plants.
8.4. Mulching
Weeding was one of the farming tasks that showed to require the most labour, techniques to reduce the number of weeding per crop, such as mulching, would probably be a well perceived practise.
As appointed by Bullock (1992), crop rotation can reduce weed development, even though it had to be combined with other techniques. Furthermore, mulching is another method that increases soil fertility, maintains soil moisture and reduces weed proliferation and soil erosion by covering the soil with organic residues as reported by several authors compiled by the Nepalese authors Atreya et al. (2008) and Gaire et al. (2013).
Mulching could be an good way of making the most of dry maize cane residue and weeds, that are usually just put aside on the plots were they are slowly degraded and have apparent no use.
72
8.5. Mushroom greenhouses
Mushroom growing is a known activity in the area of Bhimphedi. Numerous bamboo greenhouses could be observed, mainly on the way from Bhimphedi to Hetauda. A small company in Panauti, Kavrepalanchok District, was visited in order to get to know the process described in Attachement E. The visit was conducted with Júlia Yuste and Ester Daura could try this
Though it each greenhouse requires approximately a 5,000 NPR investment, out of reach of many families, it would be a good option in case any local actor decided to imitate the 3E project described by Cristià (2007) and Mahen Shrestha (Appendix F) and led by Amics del Nepal in 2007.
8.6. Forestry
Livelihoods in were closely bound to forests as they provided fodder for their animals, wood for fuel or making agricultural tools as it has been described. Chapagain et al. (2012) appointed the forest value and overviewed the Forest Users Groups (FUGs), also known by the name of Community Forest User Groups (CFUGs), which are coordinated by the Federation of Community Forestry Users NEPAL (FECOFUN) a very active organisation to link all the CFUGs around Nepal.
Mahen Shrestha is a Bhimphedi ex-resident who is worried about Bhimphedi’s environmental and social problems, showed a big concern regarding deforestation and soil erosion and the ones arising from them (Attachment E).
He confirmed that there are forestry communal areas where he proposed to develop different productive projects in order to stop soil erosion and deforestation while providing new sources of income for the village.
This project, as Mr. Shrestha conceived it, implies planting thousands of trees and shrubs and moving families living isolated in the mountains, that are nowadays, exposed to the rainy season recurrent landslides. Farmers would be taught a profession related to the sustainable use of local resources such as the making of bricks out of the river’s rocks. This is a long term proposal that would involve local government and may count with a bigger budget.
73
9. Conclusions
After the study we can conclude that that The vast majority of families in Bhimphedi performs some kind of agriculture and animal raising in a similar way like they ancestors did.
• However, new technologies, like the use of chemical fertilizers and pesticides, medicines for animals or mechanical implements, are becoming more popular among professional and non-professional farmers, promoted in most of the cases by local cooperatives.
• Several farming aspect have been studied through the 25 interviews performed and observation. Even though, further studies might be conducted in order to have more accurate information, we can say that farmers concerns and deficits have been compiled.
could
• any project development have been described such as diet habits and restrictions, festivities, religions, literacy, gender inequalities, rural exodus, etc. have been described such as diet habits and restrictions, festivals, local actors like cooperatives, government, etc.
• There have been described some locally available and specific alternatives, of different duration and scope, to some of the farmers concerns like plagues or weeding. Local government also showed concern related deforestation and soil erosion, which they will soon tackle.
• There were found public and private agriculture development initiatives, like NARC or CEC programs, which are usually opened to cooperate with other organisations. These initiatives could be adapted to the special requirements and resources of Bhimphedi, in order to mitigate the described deficits.
74
10. Bibliography
Abdou, Y. and Abdalla, E. F. (2006) ‘Evaluation of Some Selected Pesticides Against the Two Pod Borers Helicoverpa Armigera and Etiella Zinckenella Population Infesting Cowpea in the Newly Reclaimed Regions’, 2(6), pp. 578–583.
Allendorf, K. (2007) ‘Do Women ’ s Land Rights Promote Empowerment and Child Health in Nepal ?’, 35(11), pp. 1975–1988. doi: 10.1016/j.worlddev.2006.12.005.
Altieri, M. A. (1999a) AGROECOLOGIA: Bases científicas para una agricultura sustentable. Editorial Nordan–Comunidad.
Altieri, M. A. (1999b) ‘The ecological role of biodiversity in agroecosystems’, Agriculture, Ecosystems and Environment, 74(1–3), pp. 19–31. doi: 10.1016/S0167-8809(99)00028-6.
Atreya, K. et al. (2008) ‘Developing a sustainable agro-system for central Nepal using reduced tillage and straw mulching’, Journal of Environmental Management, 88(3), pp. 547–555. doi: 10.1016/j.jenvman.2007.03.017.
Banik, P. et al. (2000) ‘Evaluation of mustard (Brassica compestris var. Toria) and legume intercropping under 1:1 and 2:1 row-replacement series systems’, Journal of Agronomy and Crop Science, 185(1), pp. 9–14. doi: 10.1046/j.1439-037X.2000.00388.x.
Barrington, S. et al. (2003) ‘Compost convective airflow under passive aeration’, Bioresource Technology, 86(3), pp. 259–266. doi: 10.1016/S0960-8524(02)00155-4.
Bista, P. (2017) ‘Farmers embrace organic farming in Makwanpur’, Kathmandu Post, pp. 1–8. Available at: http://kathmandupost.ekantipur.com/news/2017-11-13/farmers-embrace-organic-farming-in-makwanpur.html.
Bullock, D. G. (1992) ‘Crop rotation’, Critical Reviews in Plant Sciences, 11(4), pp. 309–326. doi: 10.1080/07352689209382349.
Central Bureau of Statistics (2014) National Population and Housing Census 2011. Kathmandu.
Central Bureau of Statistics (2015) Statistical Year Book. Kathmandu: Government of Nepal.
Chapagain, B. and Sanio, T. (2012) ‘Forest user groups and peacebuilding in Nepal’, High-Value Natural Resources and Post-Conflict Peacebuilding, (June), pp. 562–579. doi: 10.4324/9781849775786.
Conway, G. R. (1986) ‘Agroecosystem analysis for research and development’, Winrock International Institute for Agricultural Development, p. 105.
Cristià, J. (2007) ‘Anàlisi de la gestió i producció de búfales a Bhimphedi (Nepal)’.
Dahal, D. R. (2003) ‘Social Composition of the Population: Caste/Ethnicity and Religion in Nepal’, in Population Monograph of Nepal 1, pp. 87–135. Available at:

75
http://cbs.gov.np/image/data/Population/Monograph_vol_1_2(1-10,11-21)/Chapter 03 Social Composition of the Population.pdf.
Dixon, R. B. (1982) ‘Women in Agriculture: Counting the Labor Force in Developing Countries’, Population and Development Review, 8(3), pp. 539–566. doi: 10.2307/1972379.
FAO (2009) The State of Food and Agriculture, Livestock in the Balance. doi: ISBN: 978-92-5-107671-2 I.
FAO, (Organización de las Naciones Unidas para la Alimentación y la Agricultura) (1981) China: Propagación de la azolla y tecnología del biogás a pequeña escala. Available at: http://www.fao.org/docrep/019/ar796s/ar796s.pdf.
Food and Agriculture Organization (FAO) (2016) ‘Accelerating progress towards the economic empowerment of rural women’. Kathmandu: FAO.
Fuller, D. Q. and Harvey, E. L. (2006) ‘The archaeobotany of Indian pulses: identification, processing and evidence for cultivation’, Environmental Archaeology, 11(2), pp. 219–246. doi: 10.1179/174963106x123232.
Gaire, R., Dahal, K. R. and Amgain, L. P. (2013) ‘Effect of different mulching materials on weed dynamics and yield of direct seeded rice in Chitwan , Nepal’, 3(2000), pp. 73–81.
García, S., Carrillo, E. and Bergvinson, D. J. (2007) Manual de plagas en granos almacenados y tecnologías alternas para su manejo y control. Available at: http://repository.cimmyt.org/xmlui/bitstream/handle/10883/797/90026.pdf?sequence=1&isAllowed=y.
Giri, Y. P. et al. (2013) Biology and management of potato insects pests in Nepal. Lalitpur.
Hamal, M. (2017) ‘No Respite’, Kathmandu Post, pp. 1–3. Available at: http://kathmandupost.ekantipur.com/news/2017-10-03/no-respite.html.
Hattori, M. (1988) ‘Host-plant factors responsible for oviposition behaviour in the limabean pod borer, Etiella zinckenella Treitschke’, Journal of Insect Physiology, 34(3), pp. 191–196. doi: 10.1016/0022-1910(88)90049-2.
Huq, S. et al. (2016) ‘Mainstreaming adaptation to climate change in Least Developed Countries ( LDCs ) Mainstreaming adaptation to climate change in Least Developed Countries ( LDCs )’, 3062(March), pp. 37–41. doi: 10.1080/14693062.2004.9685508.
IUCN (2015) ‘Annual Review 2015’.
Lillesø, J.-P. B. et al. (2005) The Map of Potential Vegetation of Nepal -.
Liy, M. V. (2016) ‘Un potente terremoto causa más de 1.800 muertos en Nepal’, El País, pp. 1–5. Available at: https://elpais.com/internacional/2015/04/25/actualidad/1429950325_883537.html.
Malla, G. (2009) ‘Climate Change and Its Impact on Nepalese Agriculture’, Journal of Agriculture and
76
Environment, 9(0), pp. 62–71. doi: 10.3126/aej.v9i0.2119.
Manandhar, S. et al. (2011) ‘Adapting cropping systems to climate change in Nepal: A cross-regional study of farmers’ perception and practices’, Regional Environmental Change, 11(2), pp. 335–348. doi: 10.1007/s10113-010-0137-1.
Michel, F. (2008) ‘Managing Compost Piles To Maximize Natural Aeration’, JG Press Inc., pp. 20–23.
Moncunill, J. and Tebé, J. (2003) ‘Estudi de la situació agrària i social a la zona de Bhimphedi (Nepal): Diagnosi i proposta d’alternatives’.
Nouman, W. et al. (2014) ‘Potential of Moringa oleifera L. as livestock fodder crop: A review’, Turkish Journal of Agriculture and Forestry, 38(1), pp. 1–14. doi: 10.3906/tar-1211-66.
Ouma, G. and Jeruto, P. (2010) ‘Sustainable horticultural crop production through intercropping: The case of fruits and vegetable crops: A review’, Agriculture and Biology Journal of North America, 1(5), pp. 1098–1105. doi: 10.5251/abjna.2010.1.5.1098.1105.
Pandey, S. P. et al. (2000) ‘Legumes in Nepal’, Legumes in rice and wheat cropping systems of the Indo-Gangetic Plain - constraints and opportunities, pp. 71–97. Available at: http://oar.icrisat.org/3460/.
Pardo, A. (2000) ‘Principales plagas y enfermedades que afectan al cultivo de zanahoria’, Cultivos intensivos.
Piccolo, R. (2013) ‘Enfermedades de la zanahoria’, Manual de producción de zanahoria, pp. 153–167. Available at: https://inta.gob.ar/sites/default/files/script-tmp-inta_-_prlogo_e_ndice.pdf.
Post District and Bureau (2017) ‘At least 30 killed in floods, landslides’, Kathmandu Post. Available at: http://kathmandupost.ekantipur.com/news/2017-08-13/at-least-30-killed-in-floods-landslides.html.
Post Report (2017a) ‘Contribution of agriculture in GDP plummeting constantly’, Himalayan Times, 31 May, pp. 1–2. Available at: https://thehimalayantimes.com/business/contribution-agriculture-gdp-plummeting-constantly/.
Post Report (2017b) ‘More Nepalis going abroad for employment’, Kathmandu Post, pp. 1–2. Available at: http://kathmandupost.ekantipur.com/news/2017-09-18/more-nepalis-going-abroad-for-employment.html.
Post Report (2017c) ‘NFC sets goat prices’, Kathmandu Post, pp. 1–10. Available at: http://kathmandupost.ekantipur.com/news/2017-09-21/nfc-sets-goat-prices.html.
Post Report (2018) ‘Govt to spend Rs1b to boost micro-enterprises -’, pp. 1–9. Available at: http://kathmandupost.ekantipur.com/printedition/news/2018-07-19/govt-to-spend-rs1b-to-boost-micro-enterprises.html.
Risch, S. J. (1983) ‘Intercropping as cultural pest control: Prospects and limitations’, Environmental Management, 7(1), pp. 9–14. doi: 10.1007/BF01867035.
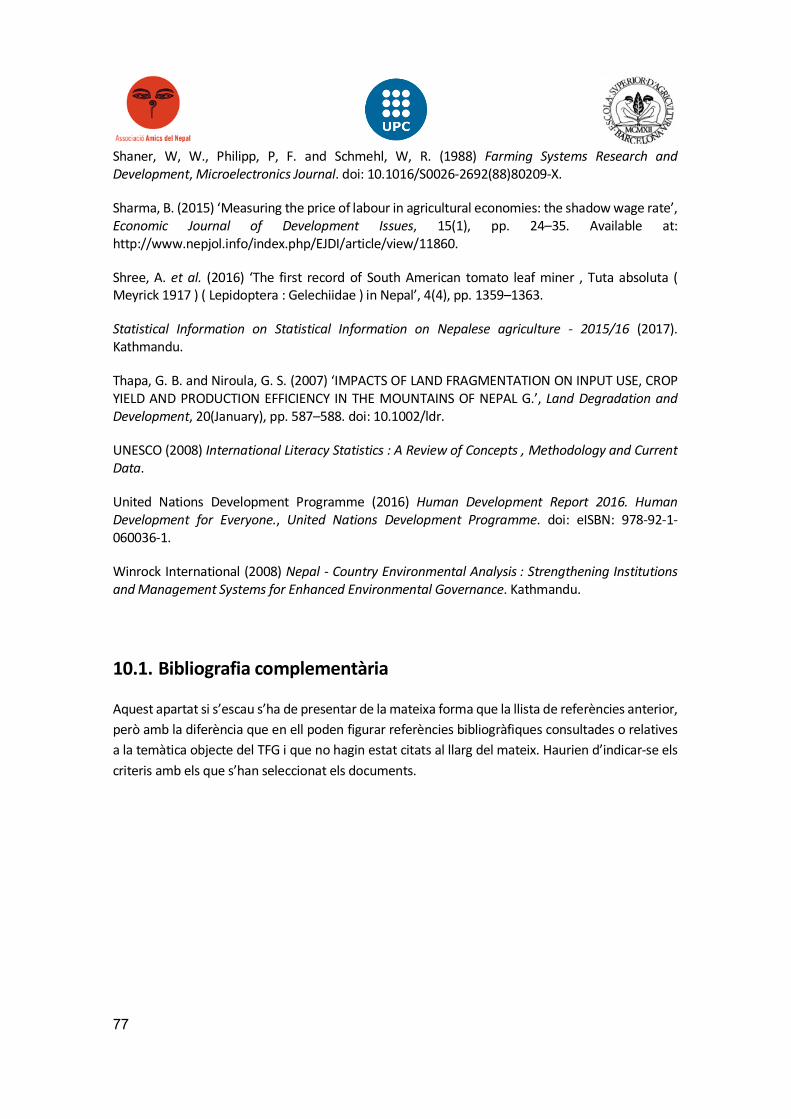
77
Shaner, W, W., Philipp, P, F. and Schmehl, W, R. (1988) Farming Systems Research and Development, Microelectronics Journal. doi: 10.1016/S0026-2692(88)80209-X.
Sharma, B. (2015) ‘Measuring the price of labour in agricultural economies: the shadow wage rate’, Economic Journal of Development Issues, 15(1), pp. 24–35. Available at: http://www.nepjol.info/index.php/EJDI/article/view/11860.
Shree, A. et al. (2016) ‘The first record of South American tomato leaf miner , Tuta absoluta ( Meyrick 1917 ) ( Lepidoptera : Gelechiidae ) in Nepal’, 4(4), pp. 1359–1363.
Statistical Information on Statistical Information on Nepalese agriculture - 2015/16 (2017). Kathmandu.
Thapa, G. B. and Niroula, G. S. (2007) ‘IMPACTS OF LAND FRAGMENTATION ON INPUT USE, CROP YIELD AND PRODUCTION EFFICIENCY IN THE MOUNTAINS OF NEPAL G.’, Land Degradation and Development, 20(January), pp. 587–588. doi: 10.1002/ldr.
UNESCO (2008) International Literacy Statistics : A Review of Concepts , Methodology and Current Data.
United Nations Development Programme (2016) Human Development Report 2016. Human Development for Everyone., United Nations Development Programme. doi: eISBN: 978-92-1-060036-1.
Winrock International (2008) Nepal - Country Environmental Analysis : Strengthening Institutions and Management Systems for Enhanced Environmental Governance. Kathmandu.
10.1. Bibliografia complementària
Aquest apartat si s’escau s’ha de presentar de la mateixa forma que la llista de referències anterior, però amb la diferència que en ell poden figurar referències bibliogràfiques consultades o relatives a la temàtica objecte del TFG i que no hagin estat citats al llarg del mateix. Haurien d’indicar-se els criteris amb els que s’han seleccionat els documents.
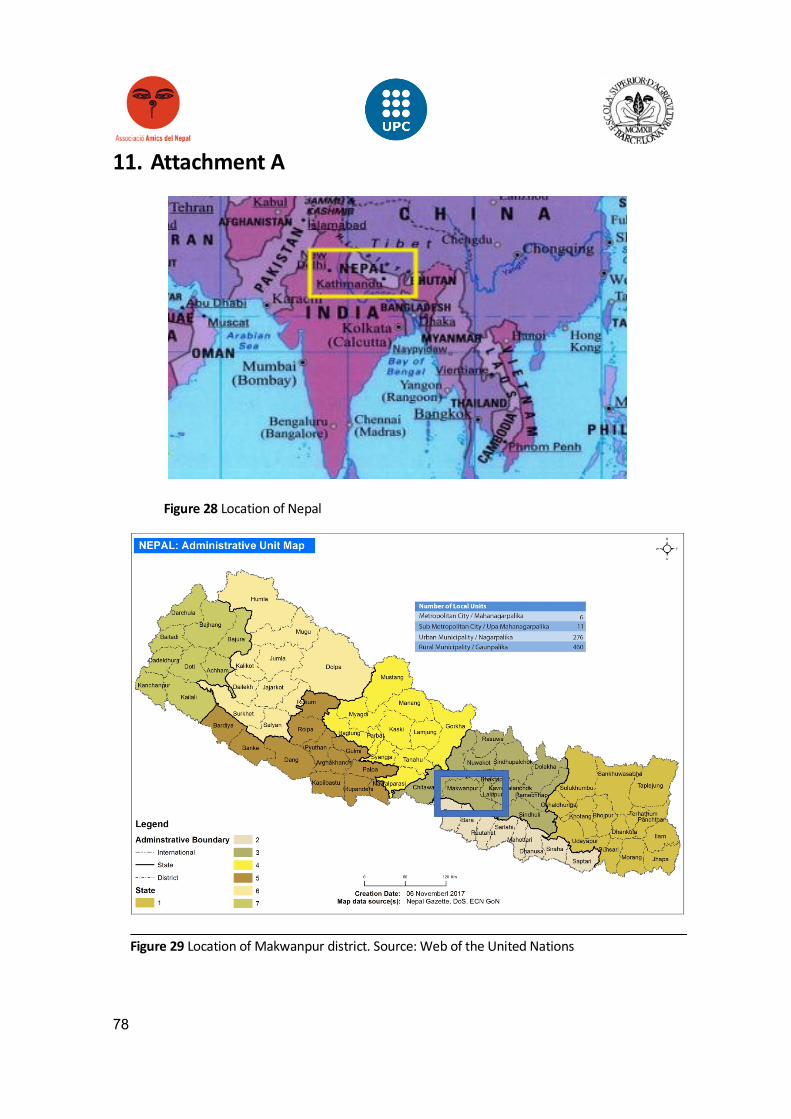
78
11. Attachment A
Figure 28 Location of Nepal
Figure 29 Location of Makwanpur district. Source: Web of the United Nations
79
Figure 30 Bhimphedi location: Road from Kathmandu to Bhimphedi. Source: Google maps
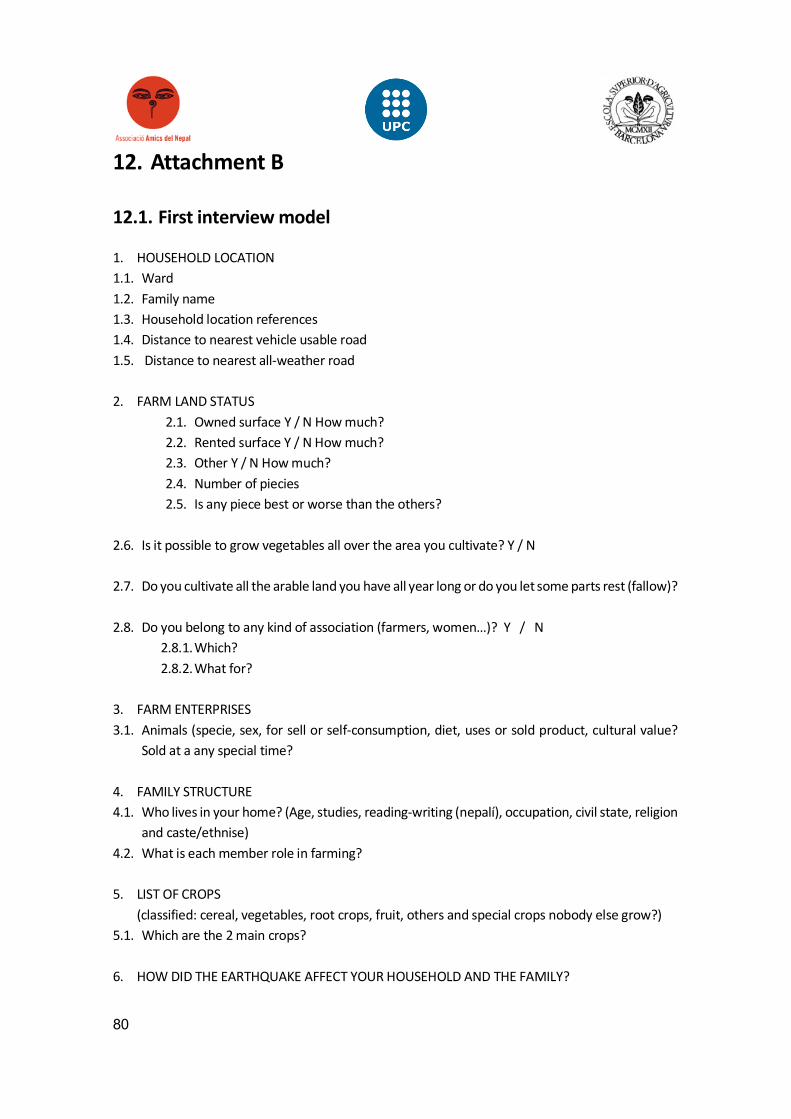
80
12. Attachment B
12.1. First interview model
1. HOUSEHOLD LOCATION 1.1. Ward 1.2. Family name 1.3. Household location references 1.4. Distance to nearest vehicle usable road 1.5. Distance to nearest all-weather road
2. FARM LAND STATUS
2.1. Owned surface Y / N How much? 2.2. Rented surface Y / N How much? 2.3. Other Y / N How much? 2.4. Number of piecies 2.5. Is any piece best or worse than the others?
2.6. Is it possible to grow vegetables all over the area you cultivate? Y / N
2.7. Do you cultivate all the arable land you have all year long or do you let some parts rest (fallow)?
2.8. Do you belong to any kind of association (farmers, women…)? Y / N
2.8.1. Which? 2.8.2. What for?
3. FARM ENTERPRISES 3.1. Animals (specie, sex, for sell or self-consumption, diet, uses or sold product, cultural value?
Sold at a any special time?
4. FAMILY STRUCTURE 4.1. Who lives in your home? (Age, studies, reading-writing (nepalí), occupation, civil state, religion
and caste/ethnise) 4.2. What is each member role in farming?
5. LIST OF CROPS
(classified: cereal, vegetables, root crops, fruit, others and special crops nobody else grow?) 5.1. Which are the 2 main crops?
6. HOW DID THE EARTHQUAKE AFFECT YOUR HOUSEHOLD AND THE FAMILY?
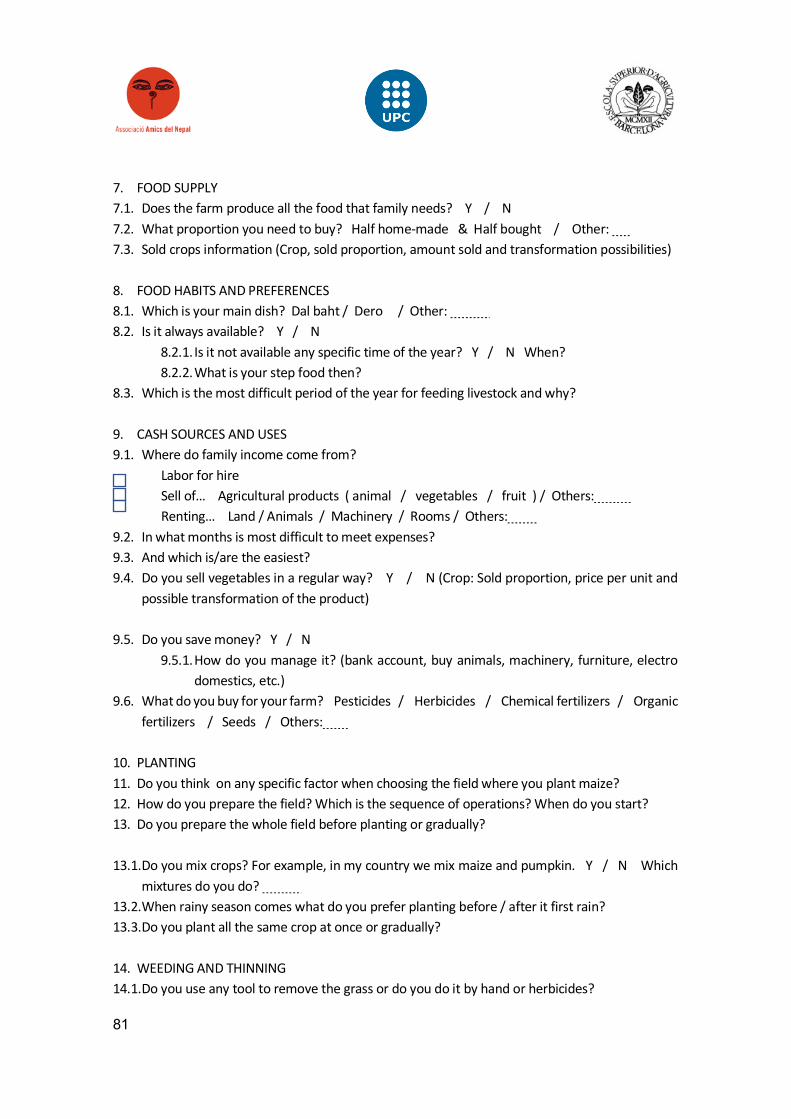
81
7. FOOD SUPPLY 7.1. Does the farm produce all the food that family needs? Y / N 7.2. What proportion you need to buy? Half home-made & Half bought / Other: 7.3. Sold crops information (Crop, sold proportion, amount sold and transformation possibilities)
8. FOOD HABITS AND PREFERENCES 8.1. Which is your main dish? Dal baht / Dero / Other: 8.2. Is it always available? Y / N
8.2.1. Is it not available any specific time of the year? Y / N When? 8.2.2. What is your step food then?
8.3. Which is the most difficult period of the year for feeding livestock and why?
9. CASH SOURCES AND USES 9.1. Where do family income come from?
Labor for hire Sell of… Agricultural products ( animal / vegetables / fruit ) / Others: Renting… Land / Animals / Machinery / Rooms / Others:
9.2. In what months is most difficult to meet expenses? 9.3. And which is/are the easiest? 9.4. Do you sell vegetables in a regular way? Y / N (Crop: Sold proportion, price per unit and
possible transformation of the product)
9.5. Do you save money? Y / N 9.5.1. How do you manage it? (bank account, buy animals, machinery, furniture, electro
domestics, etc.) 9.6. What do you buy for your farm? Pesticides / Herbicides / Chemical fertilizers / Organic
fertilizers / Seeds / Others:
10. PLANTING 11. Do you think on any specific factor when choosing the field where you plant maize? 12. How do you prepare the field? Which is the sequence of operations? When do you start? 13. Do you prepare the whole field before planting or gradually?
13.1.Do you mix crops? For example, in my country we mix maize and pumpkin. Y / N Which
mixtures do you do? 13.2.When rainy season comes what do you prefer planting before / after it first rain? 13.3.Do you plant all the same crop at once or gradually?
14. WEEDING AND THINNING 14.1.Do you use any tool to remove the grass or do you do it by hand or herbicides?
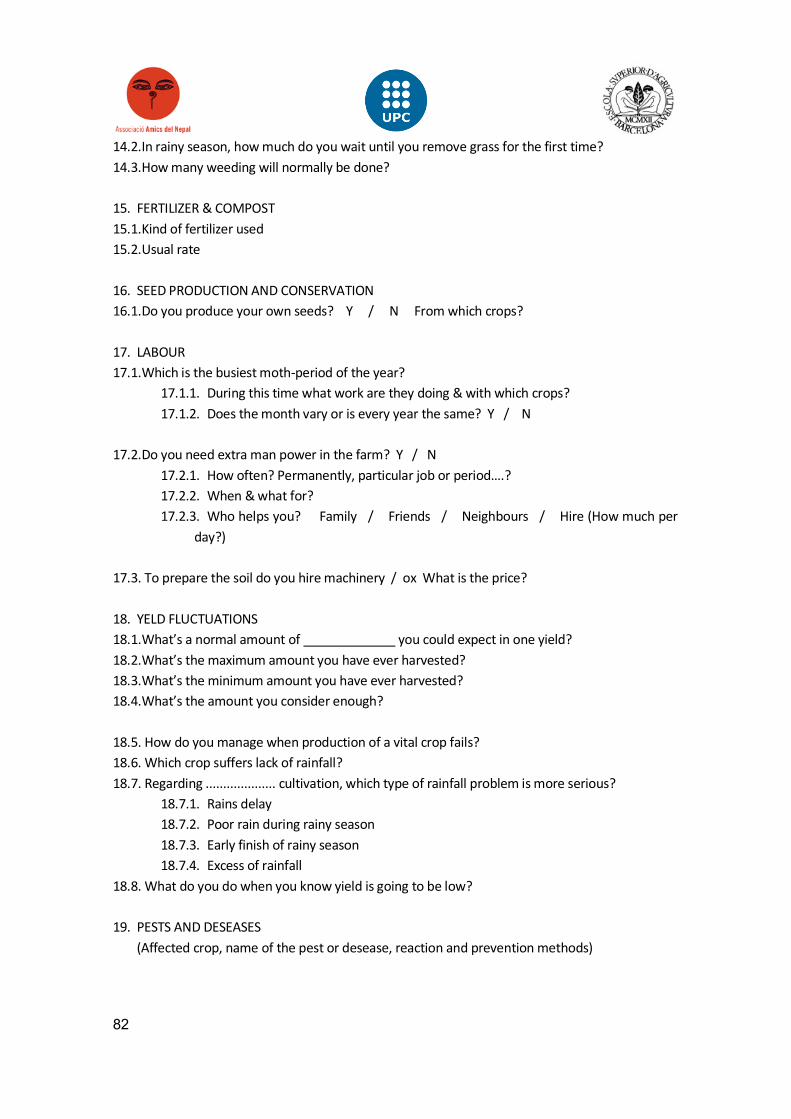
82
14.2.In rainy season, how much do you wait until you remove grass for the first time? 14.3.How many weeding will normally be done?
15. FERTILIZER & COMPOST 15.1.Kind of fertilizer used 15.2.Usual rate
16. SEED PRODUCTION AND CONSERVATION 16.1.Do you produce your own seeds? Y / N From which crops?
17. LABOUR 17.1.Which is the busiest moth-period of the year?
17.1.1. During this time what work are they doing & with which crops? 17.1.2. Does the month vary or is every year the same? Y / N
17.2.Do you need extra man power in the farm? Y / N
17.2.1. How often? Permanently, particular job or period….? 17.2.2. When & what for? 17.2.3. Who helps you? Family / Friends / Neighbours / Hire (How much per
day?)
17.3. To prepare the soil do you hire machinery / ox What is the price?
18. YELD FLUCTUATIONS 18.1.What’s a normal amount of you could expect in one yield? 18.2.What’s the maximum amount you have ever harvested? 18.3.What’s the minimum amount you have ever harvested? 18.4.What’s the amount you consider enough?
18.5. How do you manage when production of a vital crop fails? 18.6. Which crop suffers lack of rainfall? 18.7. Regarding .................... cultivation, which type of rainfall problem is more serious?
18.7.1. Rains delay 18.7.2. Poor rain during rainy season 18.7.3. Early finish of rainy season 18.7.4. Excess of rainfall
18.8. What do you do when you know yield is going to be low?
19. PESTS AND DESEASES (Affected crop, name of the pest or desease, reaction and prevention methods)
83
12.2. Definitive interview model
1. HOUSEHOLD LOCATION
19.1.Ward 19.2.Family name 19.3.Household location references
20. FARM LAND STATUS 20.1.Piece 1 Tillable / Pasture / Forest Surface: Owned / Rented / Others:
20.1.1. Distance to nearest vehicle usable road 20.1.2. Distance to nearest all-weather road 20.1.3. Ward
20.2.Which is the best piece? (1) Why? 20.3.Which is the worst piece? (2) Why?
20.4.Mark with f the piece or pieces where fallow is done.
20.5.Do you belong to any kind of association (farmers, women…)? Y / N
20.5.1. Which? 20.6.What for?
84
21. FAMILY STRUCTURE 21.1.Who lives in your home? (Age, studies, reading-writing (nepalí), occupation, civil state, religion
and caste/ethnise)
22. FARM ENTERPRISES 22.1.Animals (specie, sex, for sell or self-consumption, diet, uses or sold product, cultural value?
Sold at a any special time?
23. LIST OF CROPS (classified: cereal, vegetables, root crops, fruit, others and special crops nobody else grow?)
23.1.Which are the 2 main crops? 23.2.Which is the most difficult crop?
24. FOOD SUPPLY 24.1.Does the farm produce all the food that family needs? Y / N 24.2.What proportion you need to buy? Half home-made & Half bought / Other:
24.3.Which is your main dish? Dal baht / Dero / Other: 24.4.Is it always available? Y / N
24.4.1. Is it not available any specific time of the year? Y / N When? 24.4.2. What is your step food then?
24.5.Which is the most difficult period of the year for feeding livestock and why?
25. CASH SOURCES AND USES 25.1.Where do family income come from?
Labor for hire Sell of… Agricultural products ( animal / vegetables / fruit ) / Others: Renting… Land / Animals / Machinery / Rooms / Others:
25.2.In what months is most difficult to meet expenses? 25.3.And which is/are the easiest? 25.4.Do you sell vegetables in a regular way? Y / N (Crop: Sold proportion, price per unit and
possible transformation of the product)
25.5.Do you save money? Y / N 25.5.1. How do you manage it? (bank account, buy animals, machinery, furniture, electro
domestics, etc.) 25.6.What do you buy for your farm? Pesticides / Herbicides / Chemical fertilizers / Organic
fertilizers / Seeds / Others:
85
26. PLANTING 26.1.Do you mix crops? For example, in my country we mix maize and pumpkin. Y / N Which
mixtures do you do? 26.2.When rainy season comes, what do you prefer? To plant before it rains, after it rains, the same
day as rain falls? Others:
27. WEEDING AND THINNING 27.1.Do you use any tool to remove the grass or do you do it by hand or herbicides? 27.2.In rainy season, how much do you wait until you remove grass for the first time? 27.3.How many weeding will normally be done?
28. FERTILIZER & COMPOST 28.1.Kind of fertilizer used 28.2.Usual rate 28.3.How do you manage your livestock excretion? Do you mix it with straw or water it?
29. SEED PRODUCTION AND CONSERVATION 29.1.Do you produce your own seeds? Y / N From which crops? 29.2. Do you make to conserve them until next year? (Dry, chemical products…) 29.3.Do you have any pest problems during the storage?
30. LABOUR 30.1.Which is the busiest moth-period of the year?
30.1.1. During this time what work are they doing & with which crops? 30.1.2. Does the month vary or is every year the same? Y / N
30.2.Do you need extra man power in the farm? Y / N
30.2.1. How often? Permanently, particular job or period….? 30.2.2. When & what for? 30.2.3. Who helps you? Family / Friends / Neighbours / Hire (How much per
day?)
30.3. To prepare the soil do you hire machinery / ox What is the price?
31. YELD FLUCTUATIONS 31.1.What’s a normal amount of you could expect in one yield? 31.2.What’s the maximum amount you have ever harvested? 31.3.What’s the minimum amount you have ever harvested? 31.4.What’s the amount you consider enough?
86
32. PESTS AND DESEASES (Affected crop, name of the pest or desease, reaction and prevention methods)
33. HOW DID THE EARTHQUAKE AFFECT YOUR HOUSEHOLD AND THE FAMILY?
34. FUTURE COLABORATION 34.1.Would you like to participate in a project to improve your farm? Y / N 34.2.What would you like to get you like to get help about?
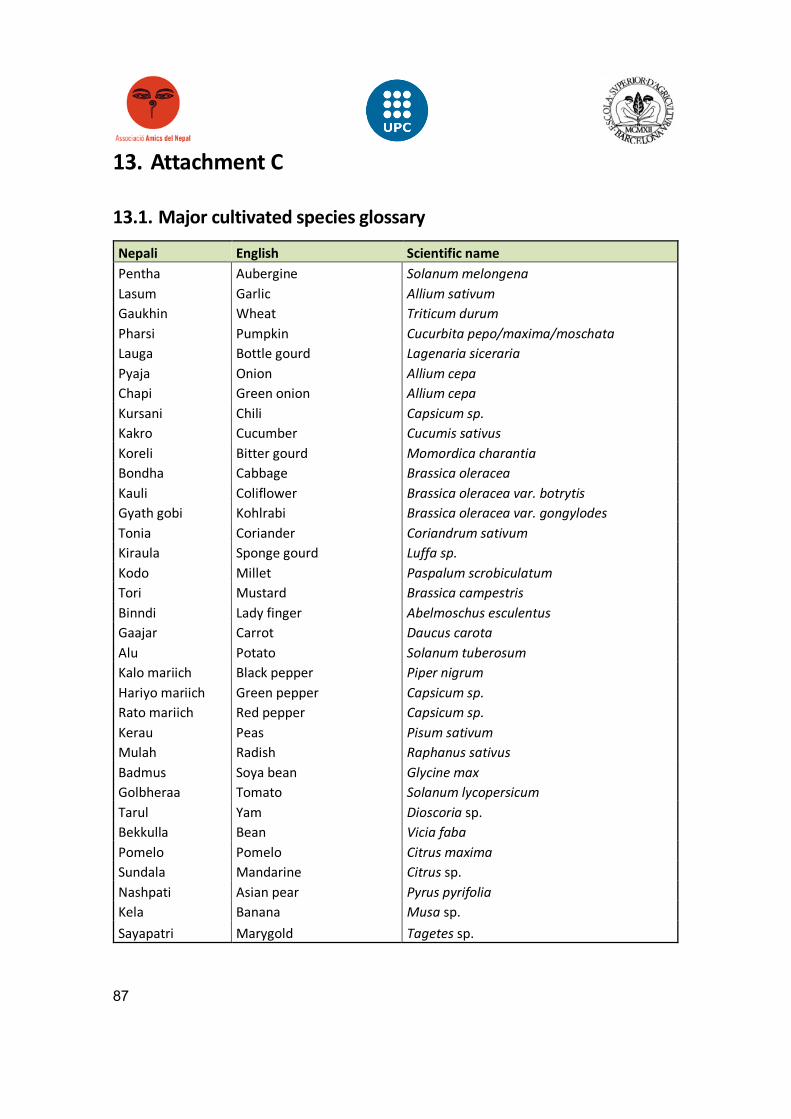
87
13. Attachment C
13.1. Major cultivated species glossary
Nepali English Scientific name Pentha Aubergine Solanum melongena Lasum Garlic Allium sativum Gaukhin Wheat Triticum durum Pharsi Pumpkin Cucurbita pepo/maxima/moschata Lauga Bottle gourd Lagenaria siceraria Pyaja Onion Allium cepa Chapi Green onion Allium cepa Kursani Chili Capsicum sp. Kakro Cucumber Cucumis sativus Koreli Bitter gourd Momordica charantia Bondha Cabbage Brassica oleracea Kauli Coliflower Brassica oleracea var. botrytis Gyath gobi Kohlrabi Brassica oleracea var. gongylodes Tonia Coriander Coriandrum sativum Kiraula Sponge gourd Luffa sp. Kodo Millet Paspalum scrobiculatum Tori Mustard Brassica campestris Binndi Lady finger Abelmoschus esculentus Gaajar Carrot Daucus carota Alu Potato Solanum tuberosum Kalo mariich Black pepper Piper nigrum Hariyo mariich Green pepper Capsicum sp. Rato mariich Red pepper Capsicum sp. Kerau Peas Pisum sativum Mulah Radish Raphanus sativus Badmus Soya bean Glycine max Golbheraa Tomato Solanum lycopersicum Tarul Yam Dioscoria sp. Bekkulla Bean Vicia faba Pomelo Pomelo Citrus maxima Sundala Mandarine Citrus sp. Nashpati Asian pear Pyrus pyrifolia Kela Banana Musa sp. Sayapatri Marygold Tagetes sp.
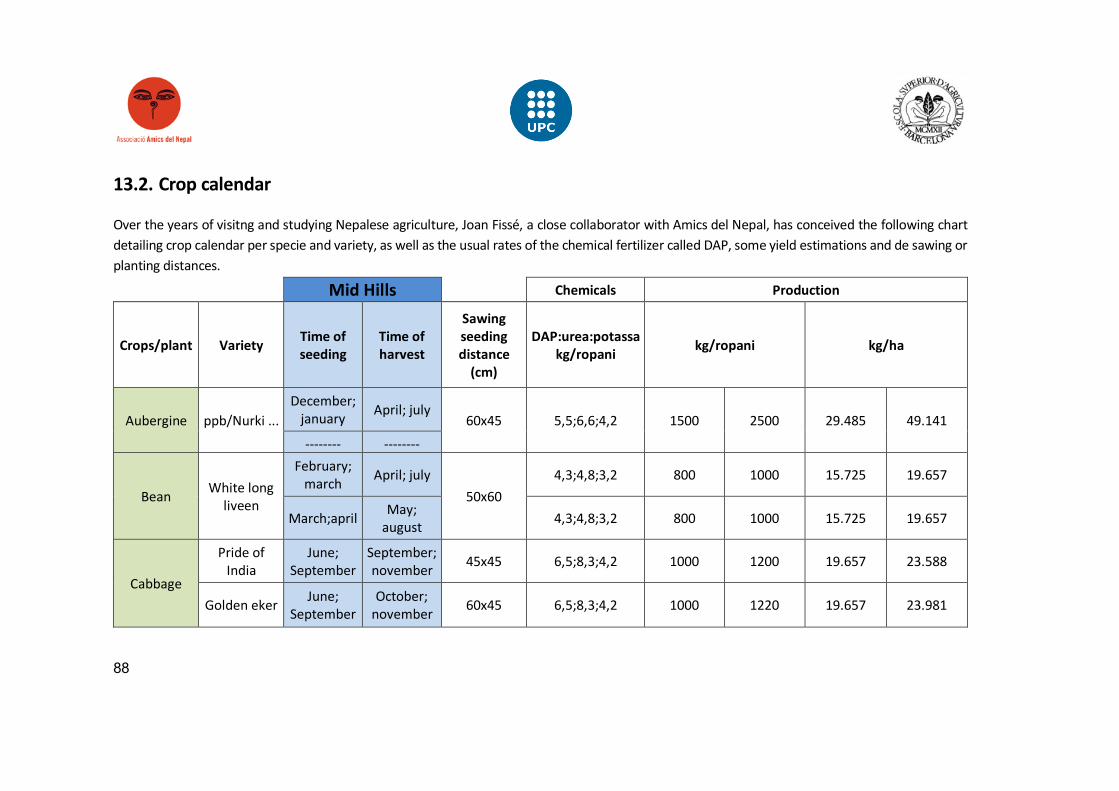
88
13.2. Crop calendar
Over the years of visitng and studying Nepalese agriculture, Joan Fissé, a close collaborator with Amics del Nepal, has conceived the following chart
detailing crop calendar per specie and variety, as well as the usual rates of the chemical fertilizer called DAP, some yield estimations and de sawing or
planting distances.
Mid Hills Chemicals Production
Crops/plant Variety Time of seeding
Time of harvest
Sawing seeding distance
(cm)
DAP:urea:potassa kg/ropani kg/ropani kg/ha
Aubergine ppb/Nurki ...
December;
january April; july
60x45 5,5;6,6;4,2 1500 2500 29.485 49.141
-------- --------
Bean White long
liveen
February;
march April; july
50x60
4,3;4,8;3,2 800 1000 15.725 19.657
March;april May;
august 4,3;4,8;3,2 800 1000 15.725 19.657
Cabbage
Pride of
India
June;
September
September;
november 45x45 6,5;8,3;4,2 1000 1200 19.657 23.588
Golden eker June;
September
October;
november 60x45 6,5;8,3;4,2 1000 1220 19.657 23.981
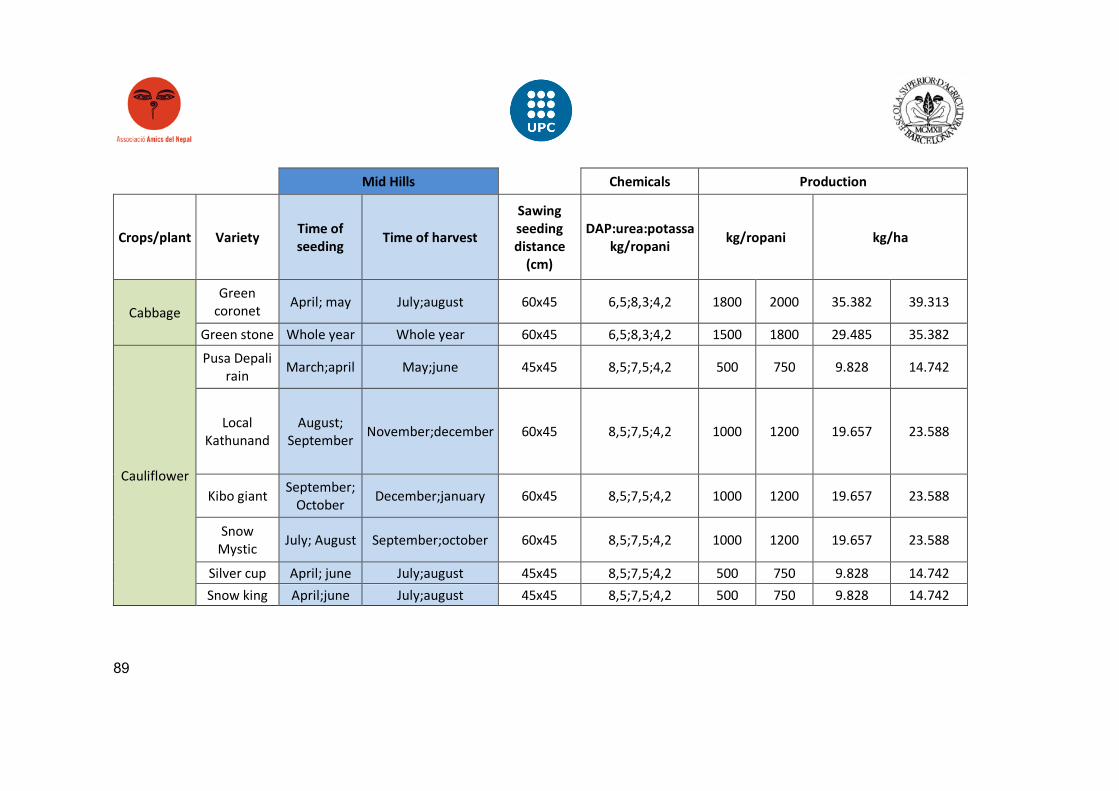
89
Mid Hills Chemicals Production
Crops/plant Variety Time of seeding Time of harvest
Sawing seeding distance
(cm)
DAP:urea:potassa kg/ropani kg/ropani kg/ha
Cabbage
Green
coronet April; may July;august 60x45 6,5;8,3;4,2 1800 2000 35.382 39.313
Green stone Whole year Whole year 60x45 6,5;8,3;4,2 1500 1800 29.485 35.382
Cauliflower
Pusa Depali
rain March;april May;june 45x45 8,5;7,5;4,2 500 750 9.828 14.742
Local
Kathunand
August;
September November;december 60x45 8,5;7,5;4,2 1000 1200 19.657 23.588
Kibo giant September;
October December;january 60x45 8,5;7,5;4,2 1000 1200 19.657 23.588
Snow
Mystic July; August September;october 60x45 8,5;7,5;4,2 1000 1200 19.657 23.588
Silver cup April; june July;august 45x45 8,5;7,5;4,2 500 750 9.828 14.742
Snow king April;june July;august 45x45 8,5;7,5;4,2 500 750 9.828 14.742
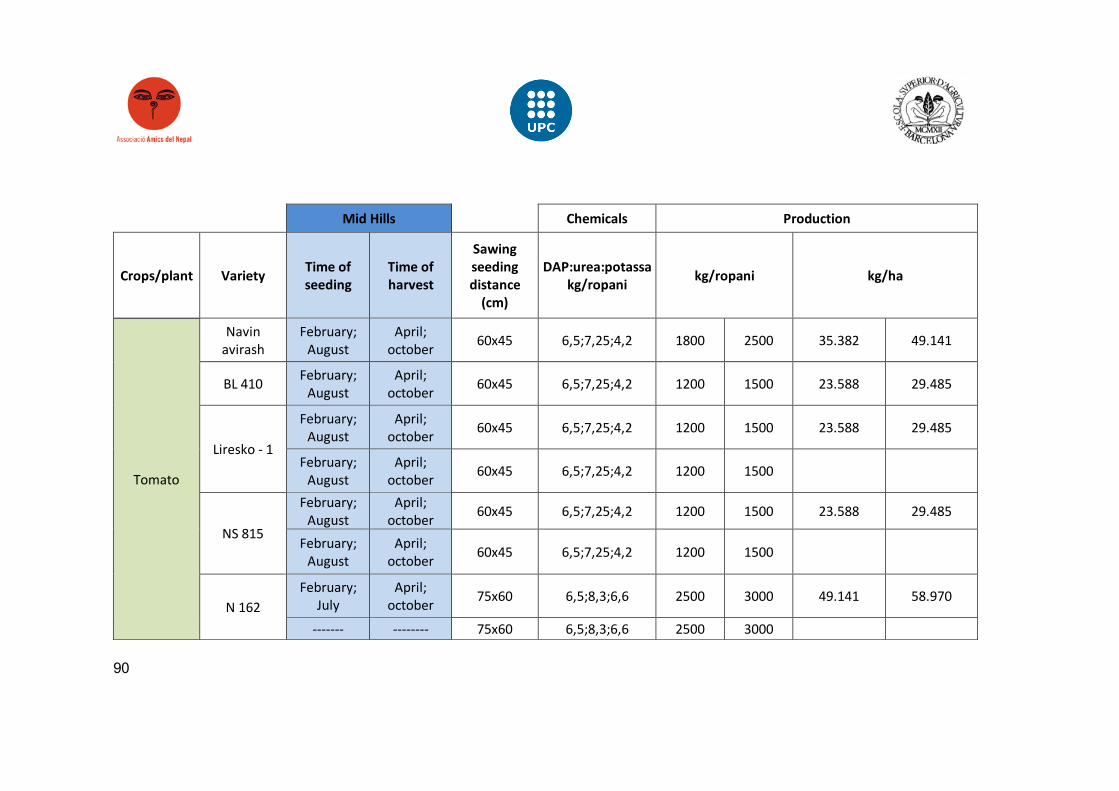
90
Mid Hills Chemicals Production
Crops/plant Variety Time of seeding
Time of harvest
Sawing seeding distance
(cm)
DAP:urea:potassa kg/ropani kg/ropani kg/ha
Tomato
Navin
avirash
February;
August
April;
october 60x45 6,5;7,25;4,2 1800 2500 35.382 49.141
BL 410 February;
August
April;
october 60x45 6,5;7,25;4,2 1200 1500 23.588 29.485
Liresko - 1
February;
August
April;
october 60x45 6,5;7,25;4,2 1200 1500 23.588 29.485
February;
August
April;
october 60x45 6,5;7,25;4,2 1200 1500
NS 815
February;
August
April;
october 60x45 6,5;7,25;4,2 1200 1500 23.588 29.485
February;
August
April;
october 60x45 6,5;7,25;4,2 1200 1500
N 162
February;
July
April;
october 75x60 6,5;8,3;6,6 2500 3000 49.141 58.970
------- -------- 75x60 6,5;8,3;6,6 2500 3000
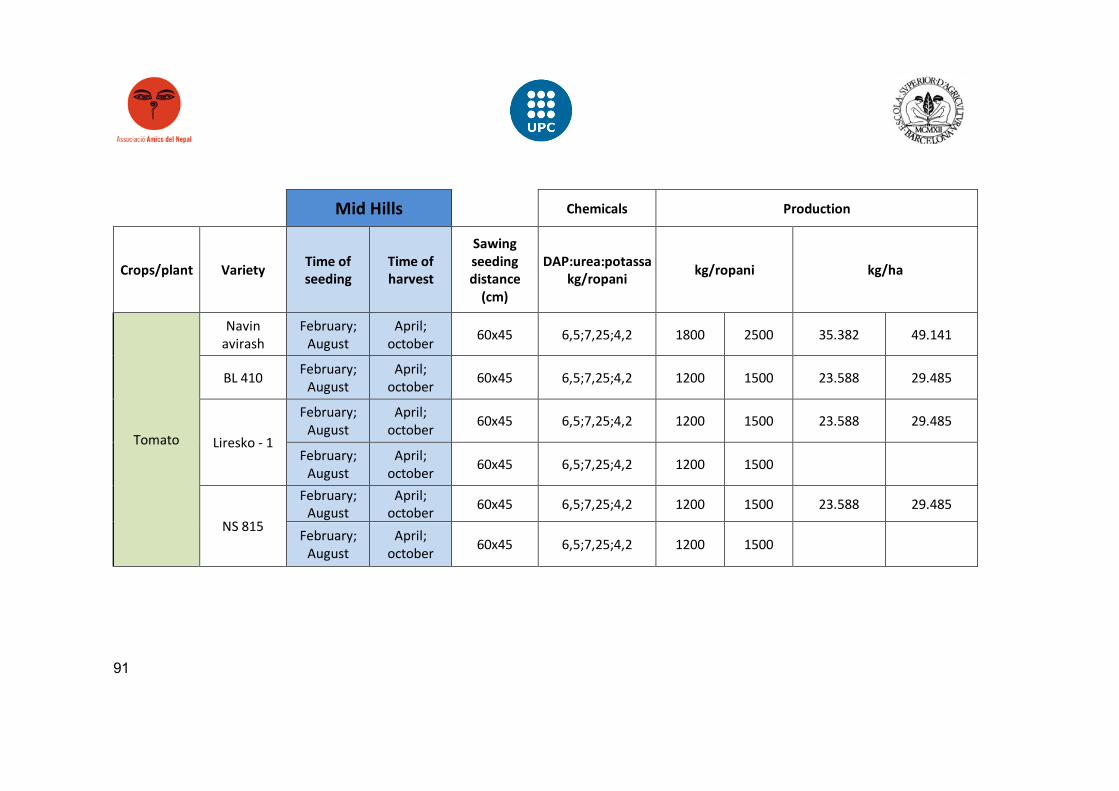
91
Mid Hills
Chemicals Production
Crops/plant Variety Time of seeding
Time of harvest
Sawing seeding distance
(cm)
DAP:urea:potassa kg/ropani kg/ropani kg/ha
Tomato
Navin
avirash
February;
August
April;
october 60x45 6,5;7,25;4,2 1800 2500 35.382 49.141
BL 410 February;
August
April;
october 60x45 6,5;7,25;4,2 1200 1500 23.588 29.485
Liresko - 1
February;
August
April;
october 60x45 6,5;7,25;4,2 1200 1500 23.588 29.485
February;
August
April;
october 60x45 6,5;7,25;4,2 1200 1500
NS 815
February;
August
April;
october 60x45 6,5;7,25;4,2 1200 1500 23.588 29.485
February;
August
April;
october 60x45 6,5;7,25;4,2 1200 1500
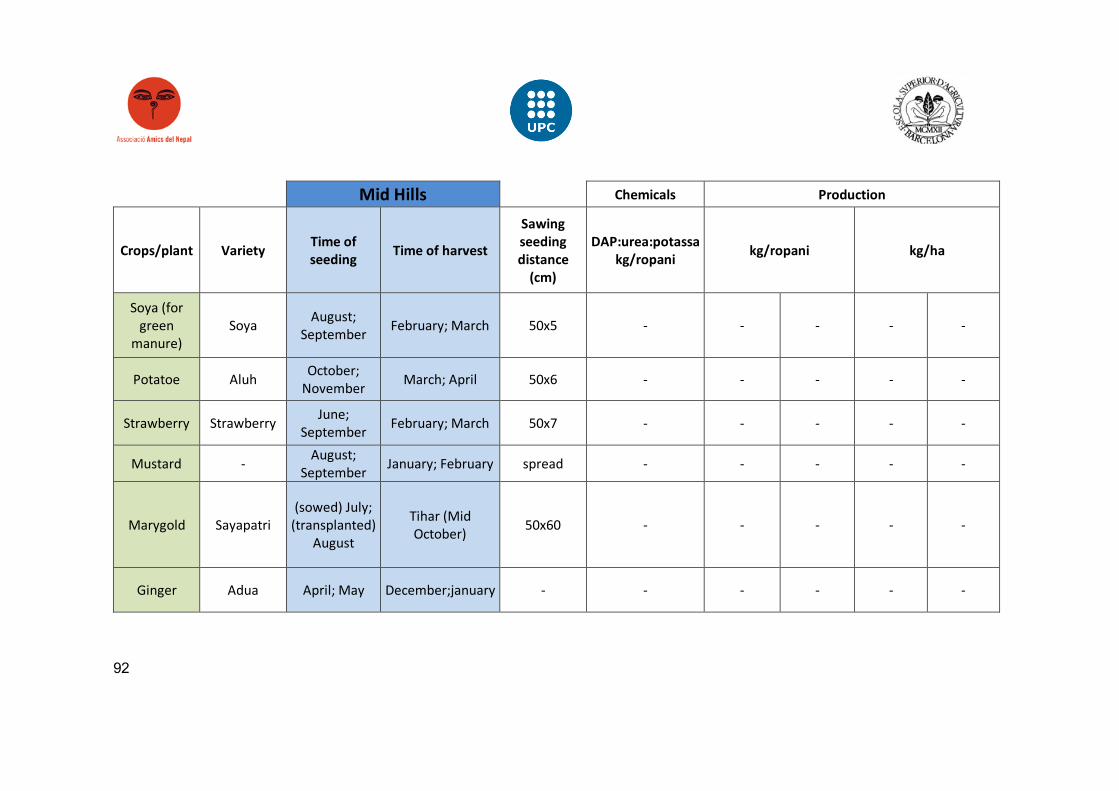
92
Mid Hills Chemicals Production
Crops/plant Variety Time of seeding Time of harvest
Sawing seeding distance
(cm)
DAP:urea:potassa kg/ropani kg/ropani kg/ha
Soya (for
green
manure)
Soya August;
September February; March 50x5 - - - - -
Potatoe Aluh October;
November March; April 50x6 - - - - -
Strawberry Strawberry June;
September February; March 50x7 - - - - -
Mustard - August;
September January; February spread - - - - -
Marygold Sayapatri
(sowed) July;
(transplanted)
August
Tihar (Mid
October) 50x60 - - - - -
Ginger Adua April; May December;january - - - - - -
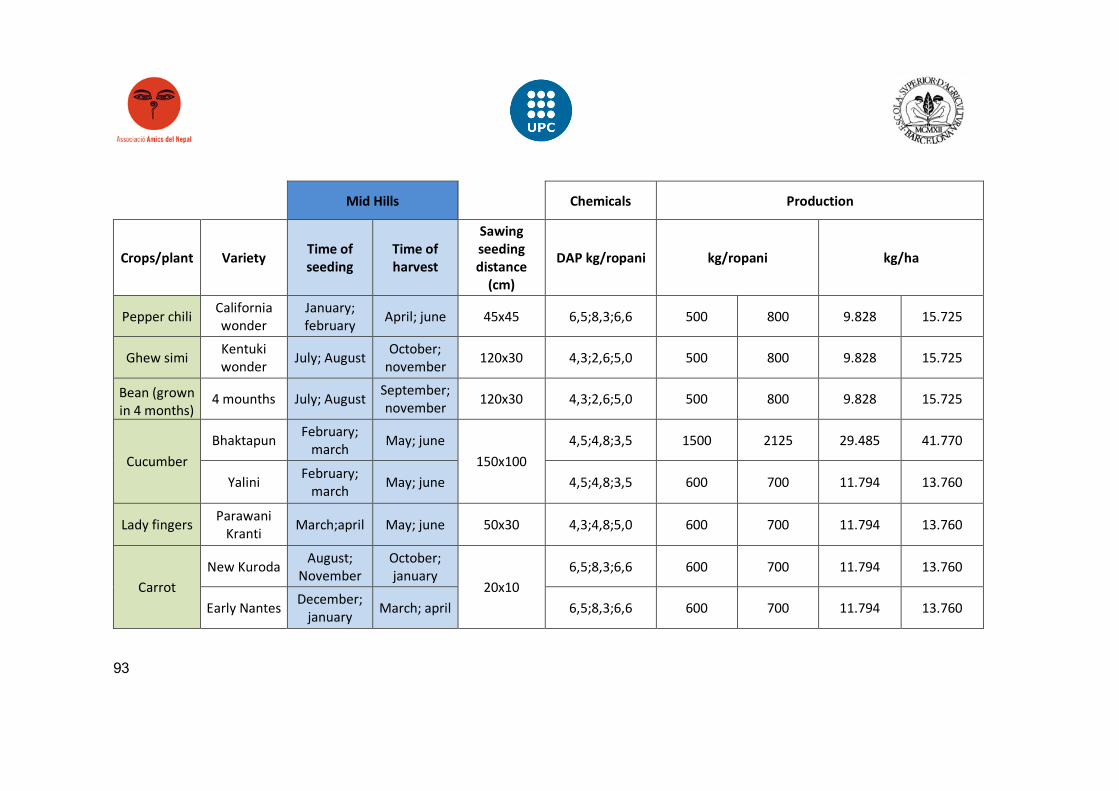
93
Mid Hills
Chemicals Production
Crops/plant Variety Time of seeding
Time of harvest
Sawing seeding distance
(cm)
DAP kg/ropani kg/ropani kg/ha
Pepper chili California
wonder
January;
february April; june 45x45 6,5;8,3;6,6 500 800 9.828 15.725
Ghew simi Kentuki
wonder July; August
October;
november 120x30 4,3;2,6;5,0 500 800 9.828 15.725
Bean (grown
in 4 months) 4 mounths July; August
September;
november 120x30 4,3;2,6;5,0 500 800 9.828 15.725
Cucumber
Bhaktapun February;
march May; june
150x100
4,5;4,8;3,5 1500 2125 29.485 41.770
Yalini February;
march May; june 4,5;4,8;3,5 600 700 11.794 13.760
Lady fingers Parawani
Kranti March;april May; june 50x30 4,3;4,8;5,0 600 700 11.794 13.760
Carrot
New Kuroda August;
November
October;
january 20x10
6,5;8,3;6,6 600 700 11.794 13.760
Early Nantes December;
january March; april 6,5;8,3;6,6 600 700 11.794 13.760
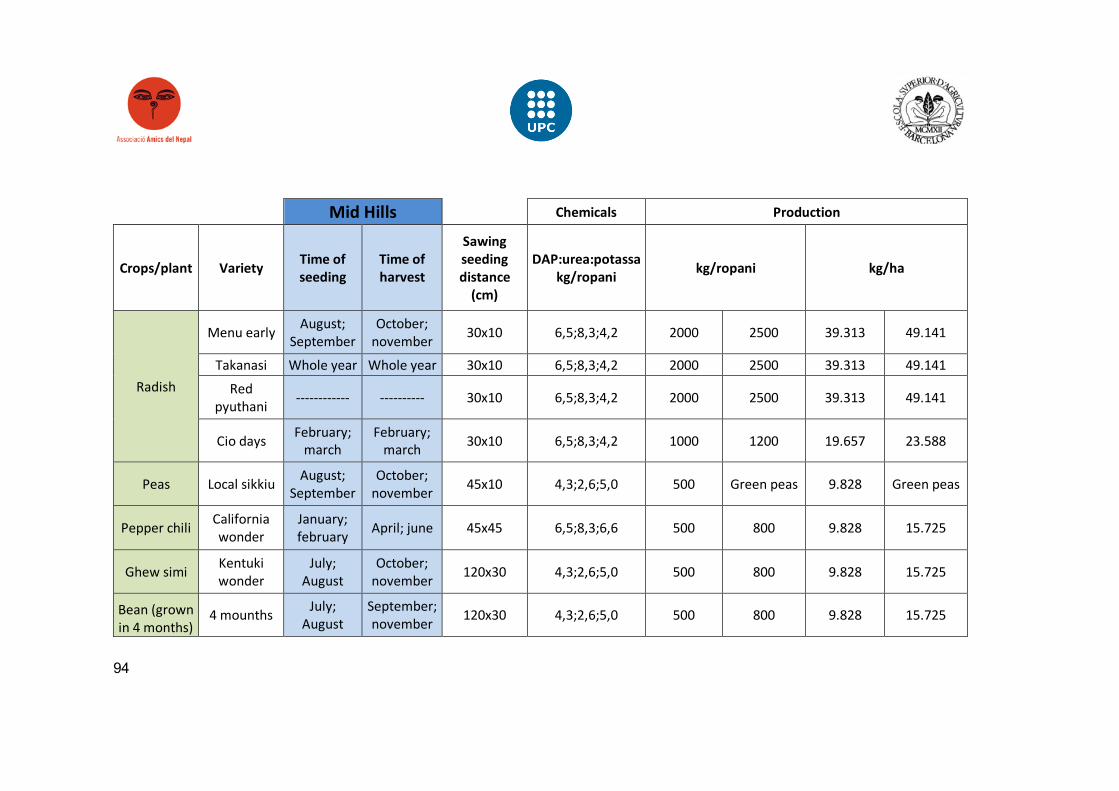
94
Mid Hills Chemicals Production
Crops/plant Variety Time of seeding
Time of harvest
Sawing seeding distance
(cm)
DAP:urea:potassa kg/ropani kg/ropani kg/ha
Radish
Menu early August;
September
October;
november 30x10 6,5;8,3;4,2 2000 2500 39.313 49.141
Takanasi Whole year Whole year 30x10 6,5;8,3;4,2 2000 2500 39.313 49.141
Red
pyuthani ------------ ---------- 30x10 6,5;8,3;4,2 2000 2500 39.313 49.141
Cio days February;
march
February;
march 30x10 6,5;8,3;4,2 1000 1200 19.657 23.588
Peas Local sikkiu August;
September
October;
november 45x10 4,3;2,6;5,0 500 Green peas 9.828 Green peas
Pepper chili California
wonder
January;
february April; june 45x45 6,5;8,3;6,6 500 800 9.828 15.725
Ghew simi Kentuki
wonder
July;
August
October;
november 120x30 4,3;2,6;5,0 500 800 9.828 15.725
Bean (grown
in 4 months) 4 mounths
July;
August
September;
november 120x30 4,3;2,6;5,0 500 800 9.828 15.725
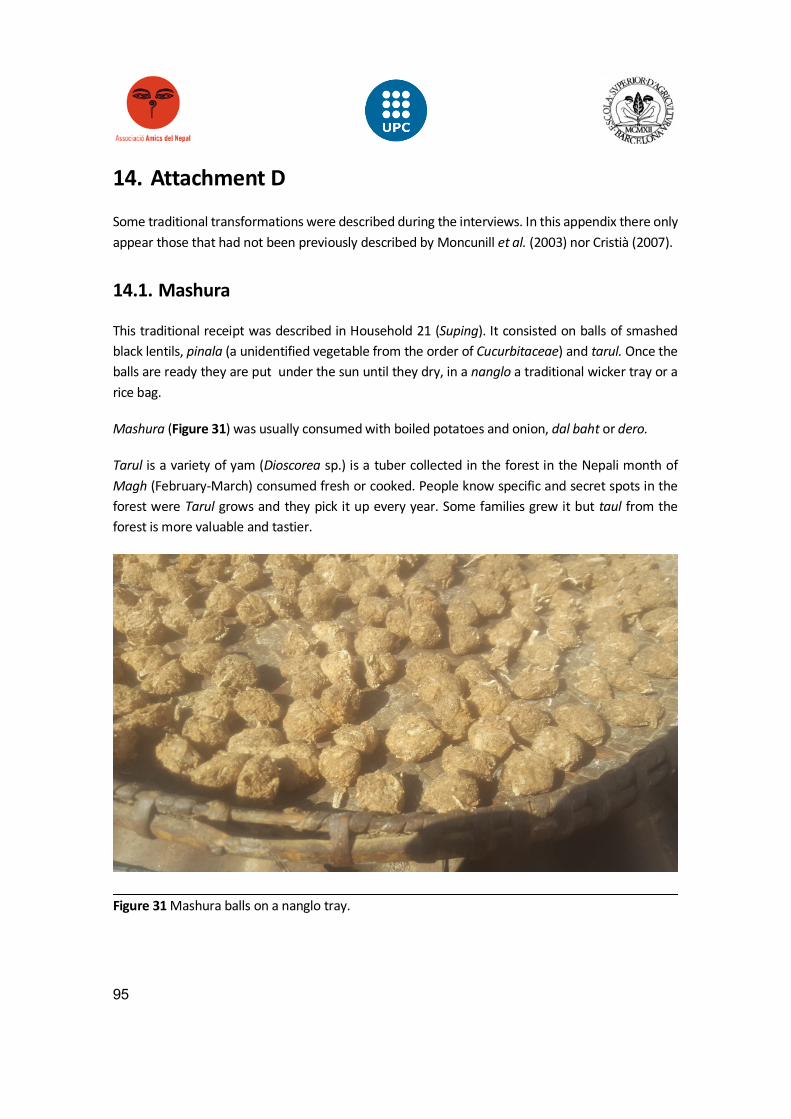
95
14. Attachment D
Some traditional transformations were described during the interviews. In this appendix there only
appear those that had not been previously described by Moncunill et al. (2003) nor Cristià (2007).
14.1. Mashura
This traditional receipt was described in Household 21 (Suping). It consisted on balls of smashed
black lentils, pinala (a unidentified vegetable from the order of Cucurbitaceae) and tarul. Once the
balls are ready they are put under the sun until they dry, in a nanglo a traditional wicker tray or a
rice bag.
Mashura (Figure 31) was usually consumed with boiled potatoes and onion, dal baht or dero.
Tarul is a variety of yam (Dioscorea sp.) is a tuber collected in the forest in the Nepali month of
Magh (February-March) consumed fresh or cooked. People know specific and secret spots in the
forest were Tarul grows and they pick it up every year. Some families grew it but taul from the
forest is more valuable and tastier.
Figure 31 Mashura balls on a nanglo tray.
96
14.2. Mustard press
After visiting Household 15 (Chabeli) we found the only mustard press in Bhimphedi Rural
Municipality next to it. The installation consisting on a mill, a grill heated with wood and a 150 years
old mustard wooden press, and the process was described by its owner.
First of all, dried mustard seeds were ground with an electric mill. This mill was also used to grind
any cereal at a rate of 3 NRP per kilogram and it could mill cereal at a speed of 25 kilograms per
hour.
Once mustard was ground, it was put on a grill heated with wood in order to toast and ease oil
extraction. During this second phase, the grain was regularly hydrated to avoid burns and the
consequent oil depreciation.
After mustard was hot it was introduced in a metallic, flexible and porous container which was
introduced in the wooden press. The press consisted on two 50 kilograms wood pieces, in between
of the metallic container was introduced and compressed thanks to a 1.50 meter diameter wheel
mechanism that got progressively the wood pieces closer and closer, obtaining the oil.
A women who had come from the ward Dhorsing, 5 kilometres away from the press, told us that
she had arrived at 11 am and she calculated to have finished at 3 pm. She had brought 21 kilograms
of mustard and she expected to obtain around 5 litres of oil. The prize for pressing 25 kilograms of
mustard was 450 NPR.
97
15. Attachment E
15.1. Mushroom greenhouse
Mushroom cultivation in greenhouse is usually found around the area of Bhimphedi, especially in
the South. We could not visit any of these greenhouse in Makawanpur, but we visited a professional
grower in Panauti, Kabhrepalanchok Distric, who owned twelve greenhouse and had hired four
people.
They bought spores from two varieties of mushroom kanechiao and patechiao in Kathmandu or
Bakhtapur. Both varieties had similar growing calendar and management. It took them from thirty
to forty days to start collecting mushrooms in winter, and twenty to thirty days in summer.
Mushrooms can be collected from the same individual during three months. Both varieties received
the same kind of pesticides when needed.
In order to prepare the substrate for mushrooms cultivation as we were shown in Panauti, we
would follow the next steps:
1- Cut straw in eight centimetres pieces.
2- Clean the pieces of straw three or four times.
3- Boil the straw during ten minutes in order to sterilize the straw inside recycled oil barrels.
4- Let cool down the straw and introduce nine kilograms into LD plastic bags.
5- Install the bags full of straw inside the greenhouse and prepare the holes in the front and
the back of the bag.
6- Inoculate two hundred grams of mushroom spores per bag, inside the holes.
The present workers at the time of the interview were not able to identify the plagues or illnesses
that could damage the mushrooms, but they were able to show us the pesticides they usually used:
- Decis: An small undetermined amount of this product is mixed with the humid straw before
filling the plastic bags (¡Error! No se encuentra el origen de la referencia.). This product
composition and uses appear on Figure 34.
- Pawestin and G-Surakshya (Cloratharoline 75%): Both used as a commercial fungicides
(¡Error! No se encuentra el origen de la referencia. and ¡Error! No se encuentra el origen de la referencia.).
- Formalin: Was the most used pesticide was hydroxymethylene (30%) (Figure 37).
- Nuvan: A commercial insecticide made of diclorvos at 76% dilution (Figure 36).
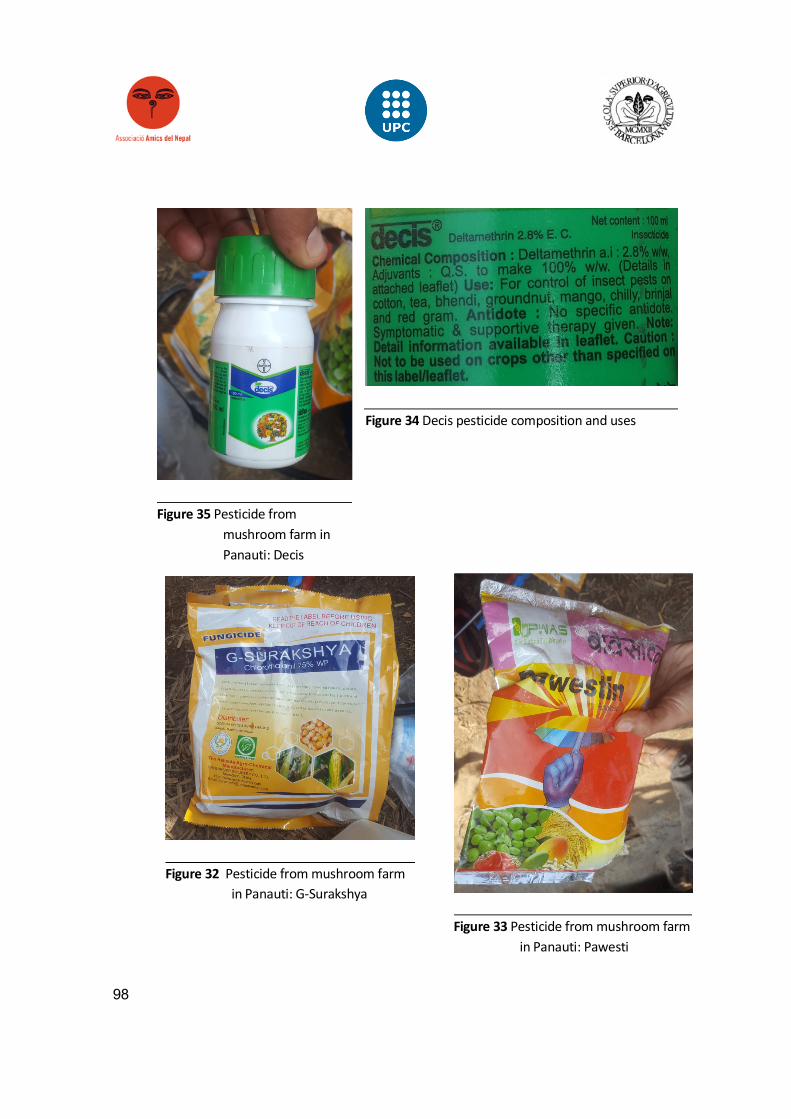
98
Figure 34 Decis pesticide composition and uses
Figure 35 Pesticide from
mushroom farm in
Panauti: Decis
Figure 33 Pesticide from mushroom farm
in Panauti: Pawesti
Figure 32 Pesticide from mushroom farm
in Panauti: G-Surakshya
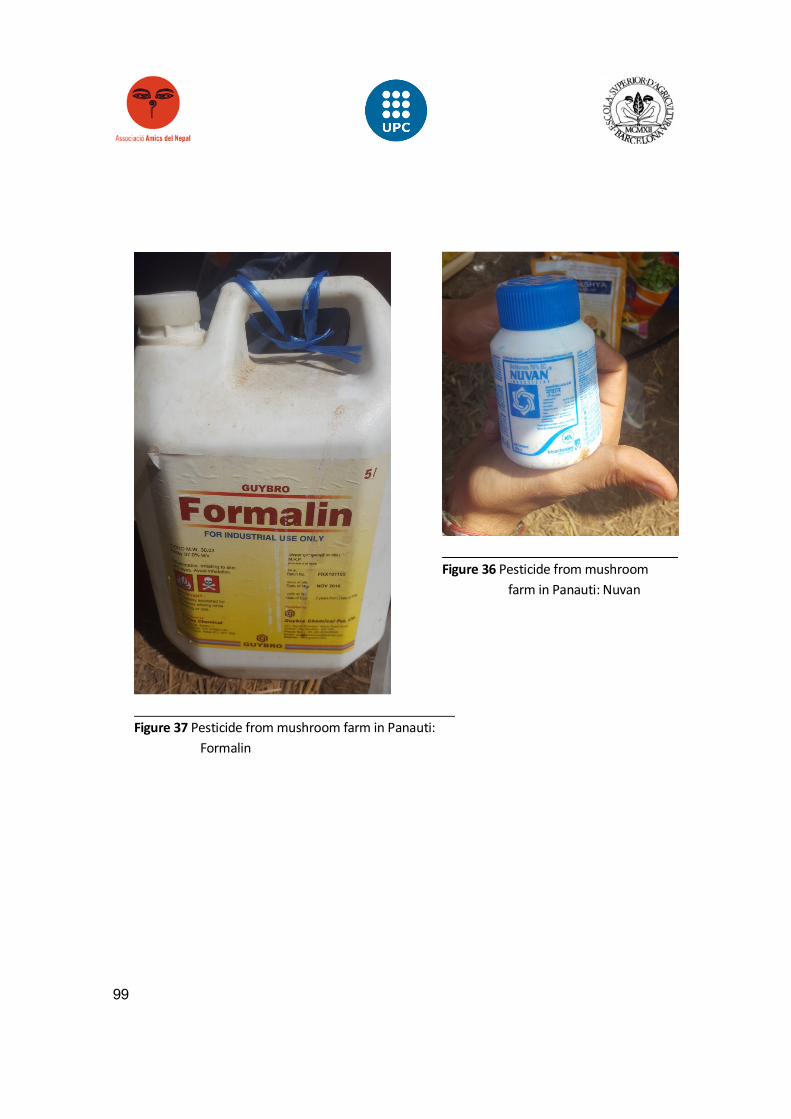
99
Figure 37 Pesticide from mushroom farm in Panauti:
Formalin
Figure 36 Pesticide from mushroom
farm in Panauti: Nuvan
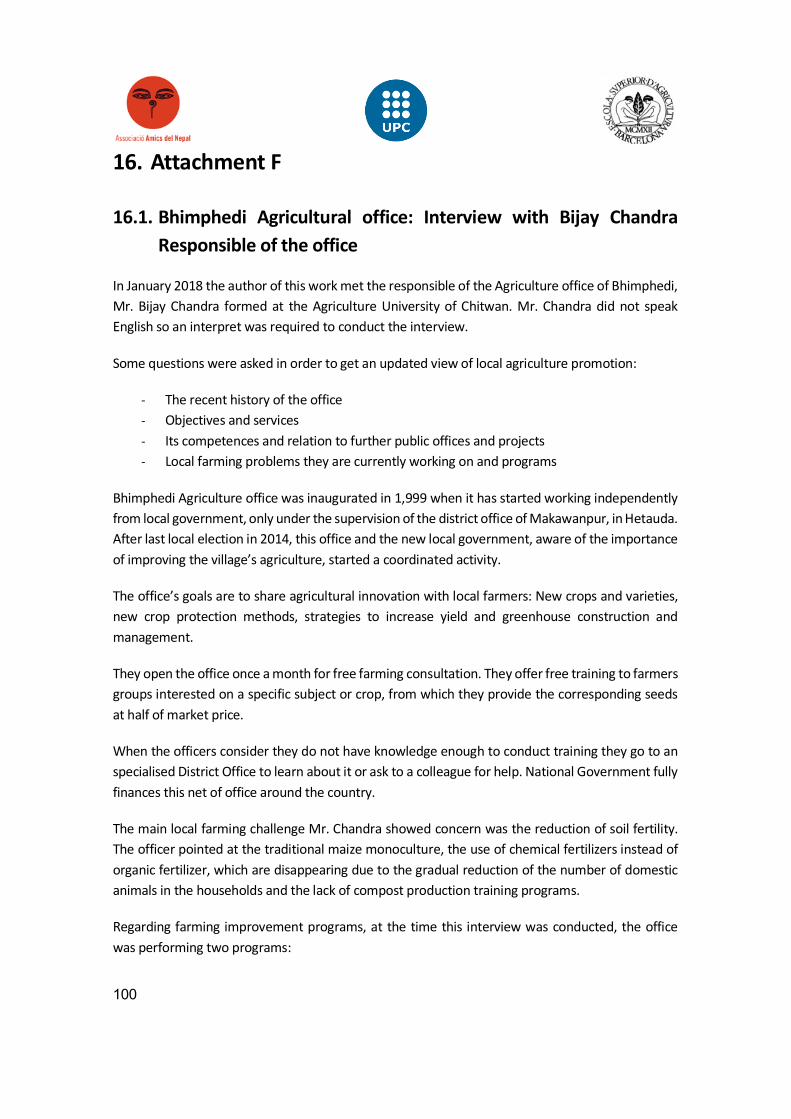
100
16. Attachment F
16.1. Bhimphedi Agricultural office: Interview with Bijay Chandra Responsible of the office
In January 2018 the author of this work met the responsible of the Agriculture office of Bhimphedi,
Mr. Bijay Chandra formed at the Agriculture University of Chitwan. Mr. Chandra did not speak
English so an interpret was required to conduct the interview.
Some questions were asked in order to get an updated view of local agriculture promotion:
- The recent history of the office
- Objectives and services
- Its competences and relation to further public offices and projects
- Local farming problems they are currently working on and programs
Bhimphedi Agriculture office was inaugurated in 1,999 when it has started working independently
from local government, only under the supervision of the district office of Makawanpur, in Hetauda.
After last local election in 2014, this office and the new local government, aware of the importance
of improving the village’s agriculture, started a coordinated activity.
The office’s goals are to share agricultural innovation with local farmers: New crops and varieties,
new crop protection methods, strategies to increase yield and greenhouse construction and
management.
They open the office once a month for free farming consultation. They offer free training to farmers
groups interested on a specific subject or crop, from which they provide the corresponding seeds
at half of market price.
When the officers consider they do not have knowledge enough to conduct training they go to an
specialised District Office to learn about it or ask to a colleague for help. National Government fully
finances this net of office around the country.
The main local farming challenge Mr. Chandra showed concern was the reduction of soil fertility.
The officer pointed at the traditional maize monoculture, the use of chemical fertilizers instead of
organic fertilizer, which are disappearing due to the gradual reduction of the number of domestic
animals in the households and the lack of compost production training programs.
Regarding farming improvement programs, at the time this interview was conducted, the office
was performing two programs:
101
- Improvement of vegetable and fruit tree yield and management. Groups of 25 farmers
around the municipality were trained and periodically visited by the office technicians in
order to improve tomato, carrot, cauliflower and cabbage yield by introducing new
varieties and lemon tree, banana, kiwi, okar, amba and jimar pruning and yield. At the
time the interview was done they had not published any report regarding these
experiences, but they were soon to be released.
- Greenhouse building. It was considered by the office as a way of improving yield. Yearly
the office selected from 2 to 5 families who received financial support to construct a
greenhouse made out of plastic and bamboo. Families were given half of the greenhouse
cost by the office.
102
16.2. Bhimphedi local government: Interview with Hidam Lama responsible of the Gaunpalika
In January 2018 the responsible of the local government Hidam Lama, who had been running the
office for 8 months, after winning the local elections representing the CPN-UML (Communist Party
of Nepal and Union of Marxists Leninists), was interviewed in order to know the grade of implication
this office wanted to have in agriculture development and its competences.
Bhimphedi local government called conforms the Bhimphedi Gaunpalika. It is formed by 49
members in total and it is voted every 5 years:
- Ward representatives: Each of the 9 ward is assigned 5 members.
- Minor ethnic groups representatives: Representing the Chepang and Katbanjan communities.
- Vice- chairman: The deputy mayor homonymous.
- Chairman: The mayor homonymous. In this case Mr. Hidam Lama.
Mr. Hidam Lama manifested his intention of promoting organic farming, through a project that they
had recently started together with the local agriculture office. Their objective was to have certain
areas of the Rural Municipality free of chemical inputs.
The major was also asked about rural exodus, a problem that Nepal was facing these days with
special repercussion on youth (Hamal, 2017). Following the example of other municipalities (Post
Report, 2018) Mr. Lama wanted to set microenterprises for youth in order to engage them to the
village and prevent exodus.
Gaunpalika is financed by national government and is in charge of monitoring every program
involving public investment in the municipality. Even though, they have fully control on electricity
taxes and net maintenance. They are not directly in charge of deforestation programs, though they
cooperate with the forestry committee in charge of the forests in the area.
103
16.3. Interview at Shree Mahila Jagriti women cooperative of Bhimphedi
An interview was conducted at the local women cooperative after detecting that so many
interviewed families had joined it. The interview was unexpectedly performed in presence of the
cooperative’s management team and was conducted by Daylí Remuñan Ackerman and the author.
1. When was the cooperative founded?
The Shree Mahila Jagriti women cooperative was founded in 1999 thanks enhanced by the NGO
Plan International. Every responsibility was trespassed to the directive team, formed by women
residing in the different wards of Bhimphedi were they operated.
2. Which wards do you operate in?
They are offering their services in every ward in Bhimphedi through the corresponding
cooperative’s representative.
3. Are there any conditions to join the cooperative?
Every of the 1,300 women who have joined the Shree Mahila Jagriti women cooperative has had
to be respect the following conditions:
- Women older than 20 years old
- The citizen card (Nepali equivalent to an ID card) has to be in order
- Respect the cooperative rules
- Attend every meeting
- Respect the corresponding payment terms and amounts
4. What services do you offer?
They offer a deposit with an annual benefit rate of 7 percent, and, they also offer loans for farming
porpoises at a 15 percent interest rate. Loans are usually asked by the beneficiaries to buy animals,
mainly cows, buffalos and goats, as they are considered expensive animals. Eventually, people ask
for smaller loans in order to buy pesticides, tools or seeds.
5. How do you organise the cooperative?
There is a 13 women management team annually chosen. There are also 6 employees (Table 18),
all of them are women. Monthly they hold a meeting with every ward representative, the directive
team and the employees.
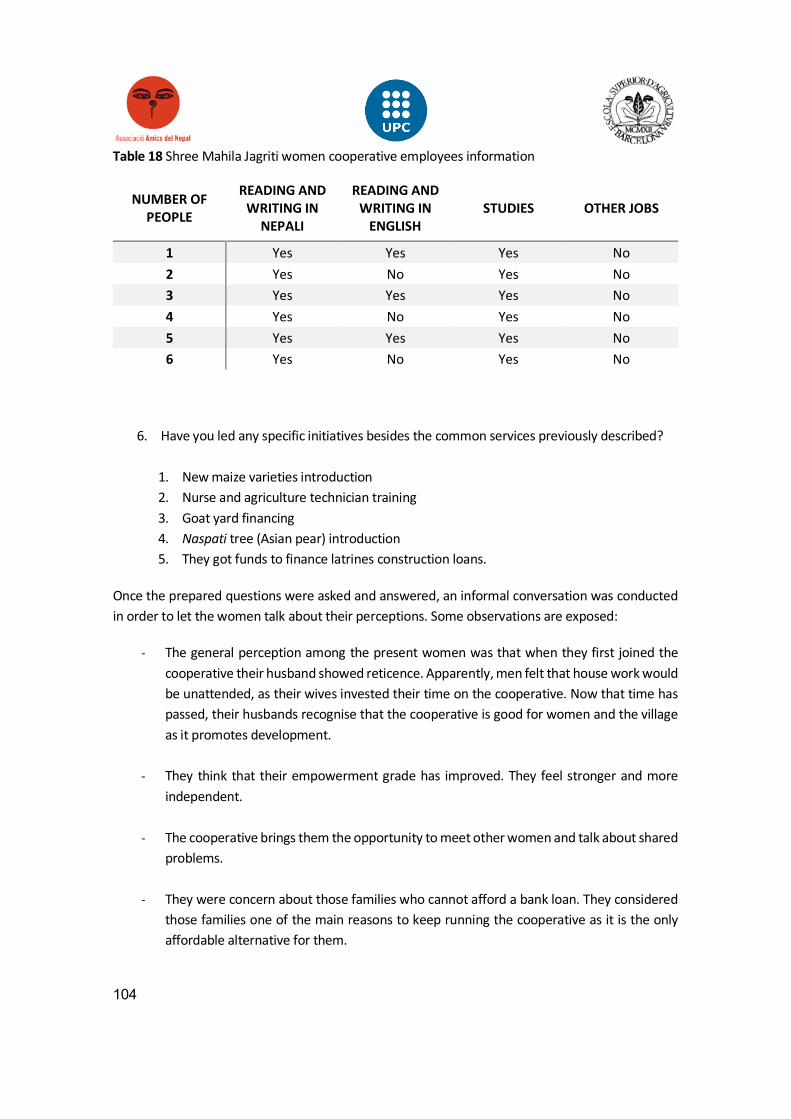
104
Table 18 Shree Mahila Jagriti women cooperative employees information
NUMBER OF PEOPLE
READING AND WRITING IN
NEPALI
READING AND WRITING IN
ENGLISH STUDIES OTHER JOBS
1 Yes Yes Yes No
2 Yes No Yes No
3 Yes Yes Yes No
4 Yes No Yes No
5 Yes Yes Yes No
6 Yes No Yes No
6. Have you led any specific initiatives besides the common services previously described?
1. New maize varieties introduction
2. Nurse and agriculture technician training
3. Goat yard financing
4. Naspati tree (Asian pear) introduction
5. They got funds to finance latrines construction loans.
Once the prepared questions were asked and answered, an informal conversation was conducted
in order to let the women talk about their perceptions. Some observations are exposed:
- The general perception among the present women was that when they first joined the
cooperative their husband showed reticence. Apparently, men felt that house work would
be unattended, as their wives invested their time on the cooperative. Now that time has
passed, their husbands recognise that the cooperative is good for women and the village
as it promotes development.
- They think that their empowerment grade has improved. They feel stronger and more
independent.
- The cooperative brings them the opportunity to meet other women and talk about shared
problems.
- They were concern about those families who cannot afford a bank loan. They considered
those families one of the main reasons to keep running the cooperative as it is the only
affordable alternative for them.
105
16.4. Interview at NiC Asia bank of Bhimphedi
1. When did you inaugurated this bank?
Century Council bank office in Bhimphedi was inaugurated on 13th December 2017.
2. Is it a Nepal based bank?
Yes, it has 162 offices and 147 ATMs around the country.
3. Which services do you offer?
Savings account, at a 8 percent interest rate. Deposit account, with a 11 percent interest rate. Loans,
remittance, insurances, ATM card, SMS information and trade book.
4. What are the conditions for loans?
As a category A bank the interest rates are periodically checked. They tend to oscillate between 11
and 17 per cent.
5. What loans amounts do you provide?
Usually loan amount are between 50,000 and 100,000 NPR. There are no restrictions regarding the
porpoise of the loan, clients can use ask a loan for building a house, buy animals, etc.
6. How many clients do you have at the moment?
As it is a recently opened office, they only have 700 depositors.
106
16.5. Interview at Century Council bank of Bhimphedi
1. When did you inaugurated this bank?
Century council bank office of Bhimphedi was inaugurated on February 2016.
2. Is it a Nepal based bank?
Yes, it is a category A commercial bank.
3. Which services do you offer?
Deposit accounts, at an interest rate between 6,5 and 11 percent. Loans, money exchange,
exclusive for clients; transfers and money withdrawal (without an ATM card).
4. What are the conditions for loans?
Loans have a variable interest rate between 12 and 16 per cent, which is periodically checked. They
have 7 different types of loans interests rates of which can be eventually negotiated with the bank’s
manager, Mr. Sanog Shiwal. The minimum amount they provide is 10,000 NPR.
5. What loans amounts do you provide?
Usually clients ask for loans for 10,000 to 100,000 NPR. For many different objectives, house
maintenance or building, to buy agriculture machinery or livestock, etc.
6. How many clients do you have at the moment?
Not answered.
107
16.6. Interview with Mahen Shrestha
In May 2017, the author attended a preparation meeting in the CCD headquarters previous to the
trip in order to coordinate the new agriculture project and an older project which was being
performed in Bhimphedi called “AWASUKA” related to anti-seismic house building and
maintenance; led by the AN, the UPC and the Catalan NGO “Base A”.
One of the meeting assistants was Mónica Sans who put in contact the author of the present work
with Mahen Shrestha, a very dynamic business man and social activist from Bhimphedi with a big
concern related to environmental and CC problems.
Three meeting were held at Mahen’s residence in Kathmandu were different topics such as human
development in Nepal, soil erosion and deforestation, and orphans social inclusion, were treated.
Mahen who was born in Bhimphedi, emigrated when he was an adolescent to the capital, but his
social implication with the village never disappeared. That is the reason why, in 2007 after Mahdov,
one of the responsible of the Bhim aadhar Samudayik community school suggested him to start a
collecting donations in order to avoid the school’s closure, as the number of children attending the
school was decreasing.
They finally led a fund raising but instead of using the collected money to pay the teacher’s salary
Mahen designed a circular economy project to generate greater benefit, while financing the school,
the 3E project:
- E of education: There was the requirement of financing the community school and attract
new students.
- E of economy: To enhance local development through promoting the local women
cooperative which was involved in the 3E project management as explained below.
- E of ecology: Local cooking depends on the wood families, especially women, collect from
the forest, which is causing soil erosion, deforestation and forcing women to spend more
time looking for wood.
The project consisted on distributing loans to the interested families, at an interest rate of 10
percent. The role of the local women cooperative was to be in charge of the loan payback in
exchange for this work they received the 2 per cent form the 10 percent families were charged, the
remaining 8 per cent was used to finance the community school.
108
Loans could be only used to buy a milking buffalo per family. According to Mahen, buffalos could
generate double benefit. Once they started milking, families would start paying the loan back, as
they would create an economic input.
Simultaneously, Mahen wanted to build bio-gas kitchens in every beneficiary family in order to use
the methane from the animals excretions and reduce deforestation. Cristià (2007), under demand
of AN, evaluated the idea, so the 3E objectives were tackled.
The project was finished on 1st January 2018. Even though, there were some loans to be returned
Mahen considered the project a great experience that had promoted Bhimphedi’s development
and he asked David Soler Pasqual and Daylí Remuiñan Ackermann, together with a Nepalese
agriculture professional. Unfortunately, due to Mahen’s health state coordination it was not
possible and the evaluation part has not been implemented.
109
16.7. Interview at Central Horticulture Centre
An arrangement was made with the office of The Central Horticulture Centre (CHC) the day before
the visit on 26th December 2017. it’s a fifty years hold research centre focused on fruit tree varieties
study, specialised on foreign varieties adaptation studies. Mr. Padmanatsatreye a fruit developer
officer presented the centre with an extension of twenty hectares and seventy workers, occupied
with different species, seventy percent of them from JICA (Japanese International Cooperation
Agency).
Farmers can buy trees from the approved varieties. Trees can be ordered and picked up at the CHC
(Citrus in June and the rest of species in December). Groups of farmers can attend different training
programs.

110
16.8. Interview at National Agriculture Research Centre
The National Agriculture Research Centre (NARC) of Nepal is the main public centre for research on
crop science in the country. It is located in Khumaltar in the city of Lalitpur and it has an extension
of two hundred hectares. It construction was financed by the USAID program.
It was visited on 27th December 2017, after recommendation of a technician from the CHC, without
an arranged meeting but this did not mean a problem to visit the research centre. We asked the
security guard about how to visit and he brought us to the centre’s main office, where we met Dr.
Bindeshwar P. Sah, who explained us the two requirements to visit the place.
We were asked to write a brief letter explaining the reason of the visit, and which of the 16 divisions
we wanted to visit, afterwards we had to pay 500 NPR per visitor. After discussing with Dr. Sah, we
agreed on visiting the Soil Science Division, the Entomology Division and the Mycology Subdivision.
Dr. Sah also explained us how they usually arrange meetings and trainings with interested groups
of peasants through district stations, when these do not have the required equipment or resources,
to treat specific topics at any of the stations, which are:
- Agronomy Division
- Plant Pathology Division
- Entomology Division
- Soil Science Division
- Agriculture Engineering Division
- Horticulture Research Division
- Agriculture Botany Division
- Commercial Crop Division
- Seed Science & Technology
Firstly, we were introduced to Mr. Pragaun Sandray who showed us the chosen divisions. We
started by the Soil Science Division. We were shown the laboratories and the Mr. Sandray belonging
to this division showed us around explain the services they offered:
- Standard analysis including: Organic matter percentage, nitrogen, phosphorus and
potassium content, pH, conductivity and soil texture. This analysis had a price of 350 NPR.
- Micronutrients analysis: In case it was demanded micronutrients such as Bohrium,
Chlorine, Copper, etc. This analysis had a price of five hundred NPR for each micronutrient.
- Compost analysis: They were able to provide nutrient content information a service
especially useful for enterprises selling compost looking for certain certifications.
111
- Rizhobium commercialisation. The sold forty grams bag at twenty NPR.
Mr. Sandray also explained us that they were currently leading some experiences with green
manure, especially with species from the family of Azollaceae that they are able to associate with
Anabeana azollae an alga able that takes enough nitrogen from the atmosphere to promote Ejola sp. growth. This symbiosis can produce up to one tone of green manure per hectare consisting on
three kilograms of fixed nitrogen (FAO, 1981).
Secondly, we visited the Division in charge of mushroom research development. We could observe
three experiences in mushroom cultivation:
- Ganoderma lucidum, a very valuable medicinal mushroom sold dry grounded and
encapsulated for 5.000 NPR per kilogram.
- Agaricus bisporus, researchers were able to obtain one hundred grams of Agaricus bisporus in trays of one metre per half a metre.
- Pleurotus ostreatus, we were shown an experience lead in order to reduce production
costs of oyster mushroom, a popular specie in Nepal. It consisted on burying vertically a
thirty centimetres trunk in a shading or covered spot, inoculating spores over its visible
surface. Soil humidity was enough to maintain a regular humidity needed by the fungus.
This mushroom can be sold at one hundred to one hundred and fifty NPR per kilogram or
for two hundred NPR if grown off-season.
Finally, we went to the Entomology Division where professor Sudeep K. U. received us. We
discussed with him some strategies to reduce Melolontha sp. negative impact on crops and he
offered us a recent publication of his Division “Biology and management of potato insect pests in
Nepal. Training guide for extension officers”. A document that mentions this insect and many others
prevention and management.
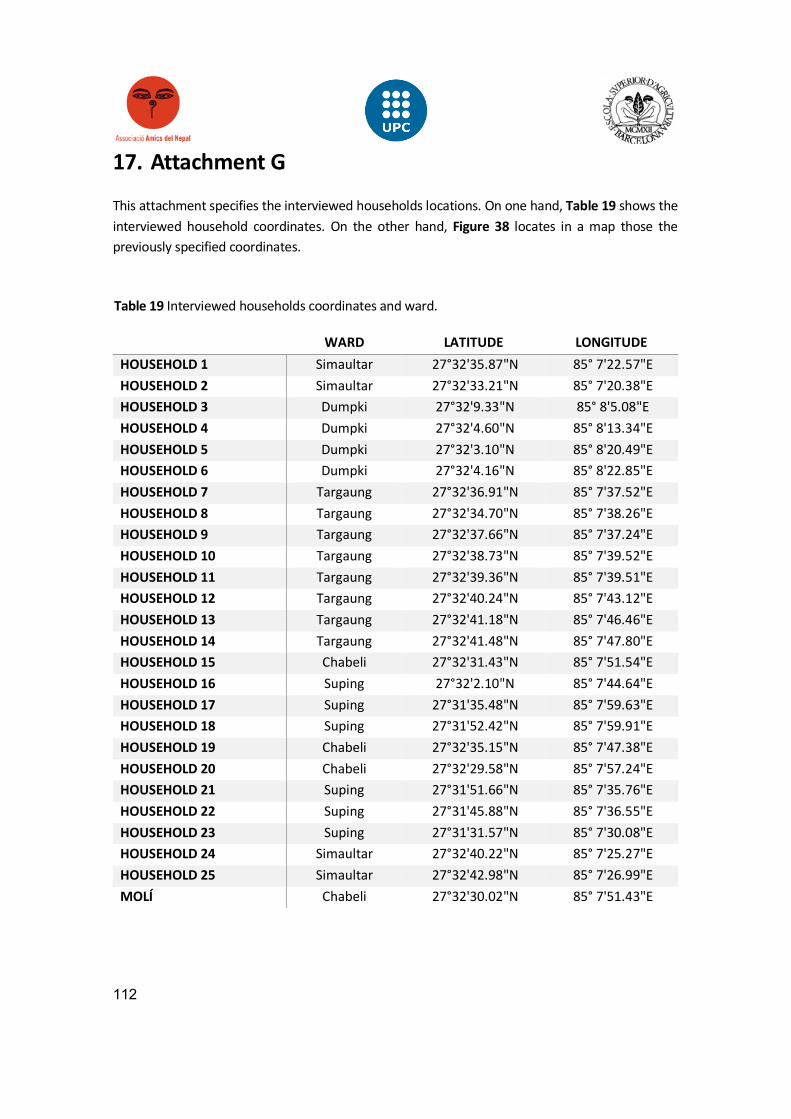
112
17. Attachment G
This attachment specifies the interviewed households locations. On one hand, Table 19 shows the
interviewed household coordinates. On the other hand, Figure 38 locates in a map those the
previously specified coordinates.
WARD LATITUDE LONGITUDE
HOUSEHOLD 1 Simaultar 27°32'35.87"N 85° 7'22.57"E
HOUSEHOLD 2 Simaultar 27°32'33.21"N 85° 7'20.38"E
HOUSEHOLD 3 Dumpki 27°32'9.33"N 85° 8'5.08"E
HOUSEHOLD 4 Dumpki 27°32'4.60"N 85° 8'13.34"E
HOUSEHOLD 5 Dumpki 27°32'3.10"N 85° 8'20.49"E
HOUSEHOLD 6 Dumpki 27°32'4.16"N 85° 8'22.85"E
HOUSEHOLD 7 Targaung 27°32'36.91"N 85° 7'37.52"E
HOUSEHOLD 8 Targaung 27°32'34.70"N 85° 7'38.26"E
HOUSEHOLD 9 Targaung 27°32'37.66"N 85° 7'37.24"E
HOUSEHOLD 10 Targaung 27°32'38.73"N 85° 7'39.52"E
HOUSEHOLD 11 Targaung 27°32'39.36"N 85° 7'39.51"E
HOUSEHOLD 12 Targaung 27°32'40.24"N 85° 7'43.12"E
HOUSEHOLD 13 Targaung 27°32'41.18"N 85° 7'46.46"E
HOUSEHOLD 14 Targaung 27°32'41.48"N 85° 7'47.80"E
HOUSEHOLD 15 Chabeli 27°32'31.43"N 85° 7'51.54"E
HOUSEHOLD 16 Suping 27°32'2.10"N 85° 7'44.64"E
HOUSEHOLD 17 Suping 27°31'35.48"N 85° 7'59.63"E
HOUSEHOLD 18 Suping 27°31'52.42"N 85° 7'59.91"E
HOUSEHOLD 19 Chabeli 27°32'35.15"N 85° 7'47.38"E
HOUSEHOLD 20 Chabeli 27°32'29.58"N 85° 7'57.24"E
HOUSEHOLD 21 Suping 27°31'51.66"N 85° 7'35.76"E
HOUSEHOLD 22 Suping 27°31'45.88"N 85° 7'36.55"E
HOUSEHOLD 23 Suping 27°31'31.57"N 85° 7'30.08"E
HOUSEHOLD 24 Simaultar 27°32'40.22"N 85° 7'25.27"E
HOUSEHOLD 25 Simaultar 27°32'42.98"N 85° 7'26.99"E
MOLÍ Chabeli 27°32'30.02"N 85° 7'51.43"E
Table 19 Interviewed households coordinates and ward.
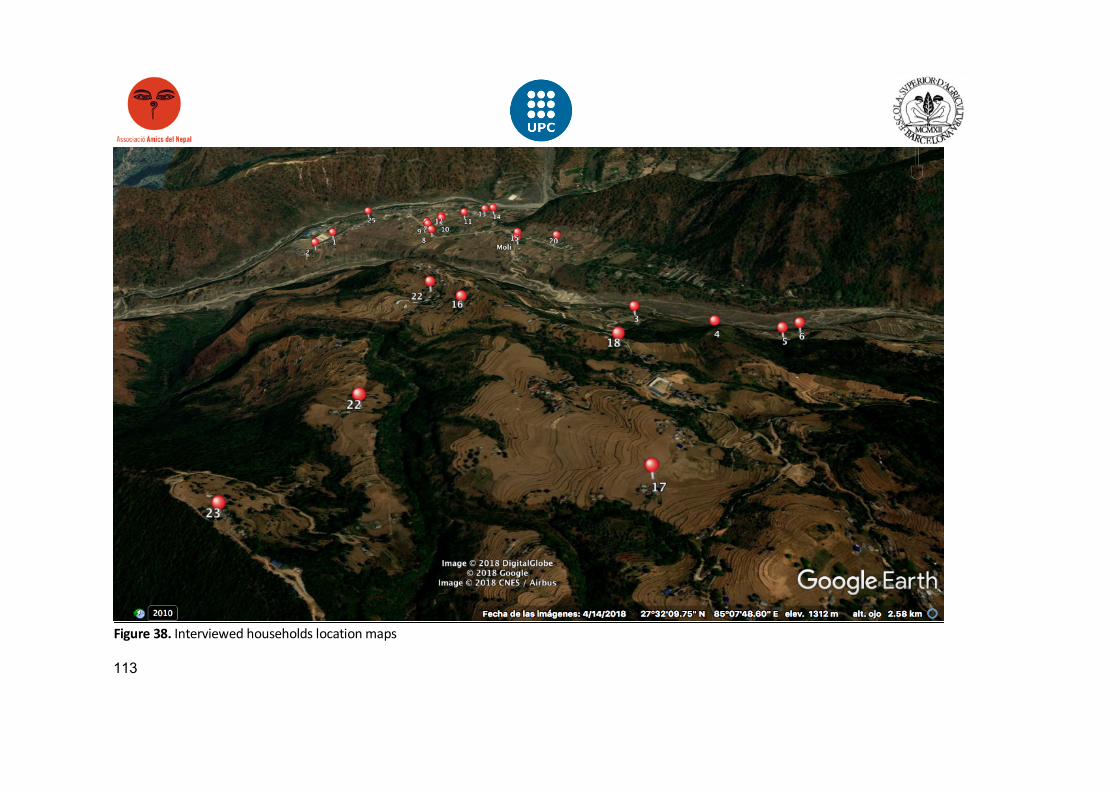
113
Figure 38. Interviewed households location maps

114