Colorado Agricultural Statistics
156
Colorado Agricultural Statistics 1937 THE COLORADO COOPERATIVE CROP ANT) LIVESTOCK REPORTING SERVICE Issued Cooperatively by United States Department of Agriculture Bureau of Agricultural Economics Division of Crop and Livestock Estimates W. F. Callander, Head Agricultural Statistician Washington F. K. Reed, Agricultural Statistician..._ Denver H. A. Swedlund, Assistant Statistician.._..._ Denver and The Colorado State Planning Commission Division of Statistics Edward D. Foster, Director Tolbert R. Ingram, Deputy (Thig volume of Colorado Agricultural Statistics Is Issued as a supplement to the Colorado Year Book.) THE ORAOF000.RODI010N (tO PTO CO., CENOEC
-
Upload
khangminh22 -
Category
Documents
-
view
0 -
download
0
Transcript of Colorado Agricultural Statistics

ColoradoAgricultural Statistics
1937
THE COLORADOCOOPERATIVE CROP ANT) LIVESTOCK
REPORTING SERVICE
Issued Cooperatively by
United States Department of Agriculture
Bureau of Agricultural Economics
Division of Crop and Livestock Estimates
W. F. Callander, Head Agricultural Statistician Washington
F. K. Reed, Agricultural Statistician..._ Denver
H. A. Swedlund, Assistant Statistician.._..._ Denver
and
The Colorado State Planning CommissionDivision of Statistics
Edward D. Foster, DirectorTolbert R. Ingram, Deputy
(Thig volume of Colorado Agricultural Statistics Is Issued as asupplement to the Colorado Year Book.)
THE ORAOF000.RODI010N (tO PTO CO., CENOEC


ColoradoAgricultural Statistics
1937
Issued Cooperatively by
United States Department of AgricultureBureau of Agricultural Economics
Division of Crop and Livestock Estimates
and
Colorado State Planning CommissionDivision of Statistics
EDWARD D. FOSTER, Director
Compiled by
F. K. REED Agricultural StatisticianH. A. SWEDLUND Assistant StatisticianR. L. GASTINEAU Junior Statistician
Denver, Colorado

INDEX
Page
INTRODUCTION.1-7
FARM LAND, ACRES, VALUE,
ETC 15. 16, 132, 133
FARMS, TOTAL NUMBER 17
1 y Size Groups 17
Iiep’’rting Crops, Livestock 18, 19
FARM INCOME, MONTHLY 14
FARM LAROR AND WAGES 111
FRUITAllies 88, 89, 101
88, 80
Peat’s 88, 91
berries 88, 92
Shipments, Rail cod Truck... 100, 101
GRAIN CROPS
Barley 21, -10. -It, 38, 59, 66, 71
Corn 20, 22, 11. 50, 11, 66, 68, 69, 102
Oats 22, 39, 39, 56, 17, 66, 72, 102
Rye 29, 74
Sorghums 28, -16, 47, 61, 66, 78, 82
Wheat, All 70, 102
Wheat, Winter. .21, 34, 21, 12, 11, 67, 71
Wheat Spring... 22, 26, 37. 14, 33, 67, 71
HAY CROPSAlfalfa 20, 18, 61, 66, 78
All Tame 30,76
Acres, by Kinds 77
Wild Hay 29, 80, 114
LIVESTOCK
Cattle, TotalAssessed 136, 141
Calves Born 123
‘ondition, Sdonthly 122
Jan. 1 Estimates 118, 121, 110
On Iced 22, 111
Value of Production 125
Milk CowsAssessed 137, 141
Jan. 1 Esthoates 119, 124, 131
HorsesAssessed 121, 141
Jan. 1 Estimates 116
MulesAssessed 133, 141
lan. 1 Estimates 117
Sheep and. LambsAssessed 138, 111
Condition, Monthly 122
Jan. 1 Bstimates 120, 124
Pu Peed 121, 141
Lamb Crop 121
Value of Production 121
WoolProduction and Value 26
HogsAssessed 2, 141
1-Tog-Corn Ratio 129
Jan. 1 Estimates 123, 124
Pig Crops 123
Value of Production 123
CluekeusAssessed 140
In Flocks, Jtnntlilv 228
Jan. 1 Estimates 127
Number Raised 127
Eggs 11:1, 127, 128
Turkeys, Prices 111
TRUCK CROPSAcreage. All 87
Dv Counties 3-99
Cahhage 81, 91
Carrots 87
Cauliflosver 86, 09
Cucumbers, fur Pickles 83, 92
Cantaloupes, fur Market 82. 93
Celery 1,
Green Peas 83, 96
Lettuce 86, 9-1
Onions 86, 94
Snap Beans 83, 87, 99
Tomatoes 84, 93
OVatermelocs 2, 98
Shipments, Truck and Rail 100-102
OTHER CROPSBroomeorn 27, 82
Sugar Bsets 27, 31, 49, 67, 79
Deans, Dry. . .26, -14, 43, 62, 63, 67, 80, 81
Potatoes .21, 42, 43, 60, 01, 67. 71, 100-1e2
Potatoes, Certified Seed 103
MISCELLANEOUS ITEMS;raltie of All Crops —13
State Crop Summary 8, 9
United States Crops. 69, 77, 81, 1-13-148
United States Livestock116—121, 123, 126, 127
Monlhly Bahttall 142-ill
Milk Production 128
Butter 113, 114, 129
Farm C-rain Stocks 102
Range, Condition Monthly 122
MONTHLY FARM PRICES
Crops 104-108, 114
Livestock 109-112, 114
Livestoclt Products 113, 114

Q)
0
000
c0
0

CO
LO
RA
DO
LE
AD
ST
HE
CO
UN
TR
YIN
TH
EP
RO
DU
CT
XO
NO
rS
UG
AR
BE
ET
S
TO
NS
TO
NS
(MIL
LIO
NS
)
(TH
OU
SA
ND
S0
0.5
1.0
1.5
2.0
2.5
CO
LO
RA
DO
NE
BR
AS
KA
CA
LIF
OR
NIA
UTA
H
MIC
HIG
AN
WY
OM
ING
MO
NT
AN
A
IDA
HO
OH
IO
AL
LO
TH
ER
ST
AT
ES
2,5
25
996
860
621
612
531
51
4
449
218
791
. . I
—
US
DE
PA
RT
ME
NT
OF
AG
RIC
UL
TU
RE
NE
G.
3401
5B
UR
EA
UO
FA
GR
ICU
LT
UR
AL
EC
ON
OM
ICS

THE COLORADO AGRICULTURAL INDUSTRYAgriculture is the state’s principal industry aad as such brings more meney
into the state and provides employment for more people than any other. Employment is provided both in the producing and processiug of agricultural products. Mining of gold, other metals, coal and the tonrist trade make large contributions to the state’s wealth and employment, but these are topped by agriculture. Cash received from the sale of Principal Farm Products and Government Payments totalled $145,723,000 in 1937, compared with $123,357,000 in 1936and $185,235,000, the high point of recent years, attained in 1929.
The Colorado agricultural industry is a very interesting one, both from thelarge variety of crops grown and the extreme variation in conditions of climateand elevation under which they are grown. In addition to raising all of thestaple crops such as wheat, corn, hay, etc., the state produces most of theprincipal truck crops in commercial quantities. These truck crops are shippedto many parts of the United States where they provide an important part of thecountry’s fresh vegetable diet. These crops are grown mostly at elevationsvarying from 3,500 to over 8,000 feet above sea level.
Four principal tree fruits, apples, peaches, pears, and cherries, are grownin commercial quantities. Colorado peaches and apples are distributed throughout the United States.
The three species cf meat animals are raised in all parts of the state. Cattleand sheep graze at both low and high elevations and turn otherwise uselessroughage into the valuable products of beef, lamb, and wool.
With approximately 3,400,000 acres, or 40 per cent of the total crop land,under irrigation, Colorado agriculture can always be counted upon to producesubstantial quantities of food necessities. The hazard of production is materially lessened in the irrigated areas of the Platte Valley of Northern Colorado,the Arkansas Valley of the Southeast, the San Luis Valley of Southcentral Colorado, and the irrigated portions of the Western Slope and mountain areas.
REVIEW OF THE 1937 CROP SEASON
The inventory value of principal crops produced in Colorado during 1937was placed at $76,911,000 compared with $99,255,000 for 1936 production. Thiswas a decrease of a little over $22,000,000, or 22 per cent. Although the valueof crops produced during 1937 was lower than the value of those produced during 1936, receipts from farm marketings during the year were considerablyhigher. The value of crops and livestock marketed (including Government payments) during 1937 totalled about $145,700,000, compared with $123,400,000 for1936 and $106,000,000 for 1935. This increase in 1937 was due largely to thecarry-over effect of crops produced in 1936 and marketed at favorahle pricesduring the first half of 1937. Returns from livestock feeding and relatively largemarketings of range livestock also swelled the 1937 cash returns and served toplace the 1937 total at the highest level since 1930, when the state’s agriculturalindustry grossed $160,200,000.
The 1937 crop season despite a late spring was generally favorable for cropproduction to mid-July, w’ith the result that acre yields of small grains werehigher than in 1936 and slightly above average. Due to lack of natural moistureand some shortage of irrigation water, late maturing crops such as corn, sugarbeets, potatoes and beans declined rapidly after August first and final acre yieldswere lower than those obtained in 1936, and below average.
The acreage of principal crops harvested in 1937 totalled 5,264,000 acres,compared with 5,081,000 acres harvested in 1936. The acreage of crops abandoned from all causes in 1937 was about 300,000 acres less than the acreageabandoned in 1936, but loss was above average. Abandonment of winter wheatvas considerably smaller in 1937 than in 1936, while abandonment of corn andsome other late maturing crops was larger.
Production of the four principal feed grains, corn (for grain), oats, barleyand grain sorghums (for grain) totalled 19,317,000 bushels in 1937, comparedwith 21,140,000 bushels in 1936. and 33,570,000 bushels the 5-year (1928-32) average. This shortage made necessary the importation of more than the usualamount of these grains, particolarly corn. Ray production in 1937 was aboutthe same as iu 1936, but supplies in the principal feeding areas were rather short.
The 1937 wheat crop of 15,155,000 bushels w’as the largest since 1931, andwas nearly 50 per cent larger than the 1936 crop of 10,691,000 bushels. Theproduction of other principal cash crops such as sugar beets, potatoes, and beauswas low’er than in 1936.

AGRICULTURAL STATISTICS
Potatoes—Production was estimated at 15,688,000 bushels, Compared with
18,500,000 bushels, the large crop of 1936, and 14,584,000 bushels the 5-year
(1928-32) average. The 1937 crop was valued at only $7,060,000, compared with
$20,535,000 for the 1936 crop, which moved at high prices. Production in 1937
was very promising to August 1, hut prospects declined thereafter due to shortage
of irrigation water and sub-normal rainfall. Yield per acre averaged 148 bushels
against 185 bushels in 1936.
Sugar Beets—Due to smaller planthigs and a yield of only 12.4 tons per
acre, production declined to 1,992,000 tons, compared with 2,234,000 tons in 1936,
and 2,525,000 tons, the 5-year average. The late spring, leaf spot and insufficient
late water resulted in sugar content lower than that of several years preceding.
Beans—Smaller plantings and adverse late summer weather curtailed pro
duction to 781,000 bags, compared with 1,091,000 bags in 1936, and 1,232,000 bags
the 5-year average. Prices were also lower and the 1937 crop was valued at
$2,702,000, compared with $4,855,000 for the 1936 crop.
Corn—Production of corn harvested for all purposes wns placed at 8,536,000
bushels, compared with 11,169,000 bushels in 1936, and 20,847,000 bushels the 5-
year average. These estimates include the grain equivalent of corn harvested
for silago and fodder as well as corn harvested for grain. The price per bushel
was about half that of a year earlier, and the entire 1937 crop was inventoried
at only $5,378,000, compared with $12,286,000 for the 1936 crop. Due to lack
of moisture and high temperatures the crop declined greatly after Augnst first.
The quantity of corn harvested for grain was estimated at 5,760,000 bushels
against 9,310,000 bushels harvested in 1936. Little 1937 Colorado corn was
available for export.
Wheat—The 1937 crop of 15,155,000 bushels was nearly 50 per cent larger
than the 1936 crop of 10,691,000 bushels. The increase was entirely in winter
wheat, The 1937 crop was valued at $1 3,848.000, compared with $10,702,000 for
the 1936 crop.
Oats and Barley—Oats production was estimated at 4,433,000 bushels against
4,256,000 bushels in 1936. Yield per acre at 31 bushels was the highest in recent
years. Barley production totalled 8,772,000 bushels compared with 7,122,000 bush
els in 1936. The inventory value of these two crops was $6,159,000 for 1937 and
$7,213,000 for 1936.
Sorghums—Production of grain sorghums for all purposes was placed at
1,521,000 bushels, compared with 1,953,000 bushels in 1936, and 2,253,000 bushels
the 5-year average. Sweet sorghums produced 148,000 tons of forage in 1937
against 140,000 tons in 1936. Values were low.
All Tame Hay—Production totalled 1,661,000 tons, compared with 1,695,000
tons in 1936, and 2,040,000 tons the 5-year average. The 1937 crop was valued at
$12,966,000 against $13,899,000 for the 1936 crop. Alfalfa production (included
with all tame hay) totalled 1,240,000 tons, compared with 1,279,000 tons in 1936,
and 1,483,000 tons the 5-year average. The crop was short in the northern Cob
i-ado area, but generally sufficient in other alfalfa growing sections.
Wild Hay—The wild hay crop was estimated at 356,000 tons, compared with
319,000 tons in 1936, and 334,000 tons, the 5-year average.
Broomcorn—During the period 1927 to 1932 Colorado ranked high among the
states as a producer of broomcorn. In 1930 the state produced 10,400 tons. Baca
county, located in the far southeastern corner of the state, is the principal
producer. Rainfall and growing conditions have been very unfavorable in that
area in recent years, and broomcorn crops have been smnll. In 1937 only 2,100
tons were produced. This was the smallest crop since 1925. The yield per acre
harvested was low and abandonment of planted acreage large. Most of the
broomcorn grown in Colorado is of the dwarf variety.
Field Peas—This crop is grown primarily in the San Luis Valley. The acre
age has declined steadily in recent years. The acreage harvested in 1937 at
29,000 acres was 20,000 acres below the 1929 area. Production in 1937 was esti
mated at 290,000 bushels. In a number of earlier years production exceeded one
half million bushels. A substantial portion of the acreage is gvazed in the field
by livestock. Tile percentage harvested for threshing grain has declined in
recent years.

SlATE 01” COLORADO 3
FRUIT
App es—Apples produced in Colorado are of excellent quality, flavor andcolor. The commercial industry is concentrated in a few counties. Delta countyon the Western Slope has nearly one-half the apple trees in the state. Fremontcounty ranks second in number of trees, but many of the orchards in this countyare small and some have been badly neglected. Mesa county, also on the WesternSlope, is third in number of trees and produces many commercial apples. Lanmer county in Northern Colorado is also important in the production of commercial apples from orchards in the vicinity of Fort Collins. Other countiesimportant in apple production are Montezuma and Montrose in Wrestern Colorado, and Boulder and Jefferson north and west of Denver.
The 1937 apple crop was small in most parts of the state. The crop inDelta county was very short, Production for the state as a whole totalled only1,457,000 bushels, compared with 2,050,000 bushels, the relatively large crop of1936, and 1,968,000 bushels, the 10-year (1927-36) average.
Peaches—The peach industry in Colorado is rather unique in that the orchards are concentrated in tw’o distinct areas, and the fact that the entire cropmoves to market in the short period of approximately six weeks, in August andSeptember. During this time Colorado peaches dominate the market supply inmany consuming centers throughout the country.
Fully two-thirds of the trees are located in Mesa county of Western Colorado. In this county most of the trees are located on the Orchard Mesa nearPalisade and Grand Junction. The balance of the commercial crop is grown inDelta county in areas near the towns of Cedaredge, Paonia, and Hotchkiss.Climate, soil, and air-drainage are favorable for peach production in all thesesections, and w’ater for irrigation is abundant. In recent years many trees infected with mosaic have been removed, but these removals have been more thanoffset hy replacement plantings and plantings of additional new orchards. Production appears to be on the up-trend, as new trees are coming in to bearingeach year.
The 1937 crop again set a new high record of production with 1,533,000 bushels. Prior to 1937 the crop of 1936 at 1,345,000 bushels was the largest everproduced. During the ten-year period, 1927 to 1936, production averaged only1,013,000 bushels, hence the 1937 crop was fifty per cent above average.
Pears—This fruit crop was much mel-c important in Colorado during theperiod from 1920 to 1929, when crops of between 500,000 and 600,000 bushelswere produced. In recent years many orchards have been pulled and productionhas ranged between 200,000 and 300,000 bushels. Disease, principally blight, lowprices, and the necessity for frequent spraying have been the principal causesof the decline of this crop.
Production of pears in 1937 totalled only 153,000 hushels, compared with220,000 bushels in 1936 and 307,000 bushels, the 10-year average.
Cherries—Cherries produced in Colorado are mostly of the sour variety,although seine sweet cherries are produced on the Western Slope, in Mesa andDelta counties. Many Colorado cherries are canned at plants located in Loveland, Fort Collins (near), Canon City, Grand Junction, and Delta.
Larimer county ordinni-ily produces nearly two-thirds of the state’s cherrycrop, follow-ed by Fremont, Mesa, Jefferson, and Delta counties in order ofimportance.
Production in 1937 totalled 3,460 tons, which was in sharp contrast with theshort 1936 crop of only 700 tons. Production dnming the 10 years, 1927 to 1936,averaged 3,300 tons.
Grapes, Apricots, Plums—Grapes are grown primarily in Mesa, Delta, Fremont, and Garfield counties, and also in the al-en tributary to Denver. In 1937,570 tons of grapes were harvested, compared w-ith 600 tons in 1936 and 477 tonsthe ten-year average. Plums are also grown ill these counties, but on a relatively small scale. Apricots are grown in the same tw’o counties which producepeaches on a commercial scale.
Strawberries, Raspberries—These two berry crops and other berries aregrown primarily in Jefferson county and in other areas tributary to Denver. Aportion of these fine quality berries is shipped to outside markets, but the bulkof them go to supply the Denver market. These small fruits are also producedin some volume in Larimer, Garfield, Fremont, Mesa, amid Delta counties.

4 .AultJ Cut/I’ URAt S’I’ATISTICS
TRUCK CROPS (Commercial Vegetables)
Colorado vegetables are known throughout the country for their fine quality
and flavor. The industry is an important one as related to the amount of labor
omployed, the gross value of the crop produced, and the high value per acre.
In 1937, 56,490 acres were devoted to commercial vegetables worth $7,612,00e.
In 1936, only 53,720 acres were harvested, hut the crop was worth $6,930,001).
These crops are grown almost entirely in tile irrigated areas, although some
crops such as lettuce and spinach are grown in the northwest and momltain
areas without irrigation.
The rank of truck crops in relation to the acreage devoted to each of them
is as follows: Green peas, cantaloupes, and honey-dew’ melons, cabbage, toma
toes, lettuce, onions (dry), snap beans, cauliflower, spinach, celery, and carrots.
tither vegetables, such as broccoli, egg plant, peppers, turnips, radishes, green
onions, in fact practically all of the common garden vegetables, are grown some
e’here in Colorado. The quantity of these vegetables in the second group is
railier small and most of them are consumed locally, but parts of these crops
reach markets outside the state through truck or express shipments.
Cantaloupes and Honey-Dew Melons—This crop is a very important one in
the Arkansas Valley, where shipments supply a large percentage of the nation’s
total consumption during the months of August and September, “Rocky Ford”
cantaloupes have been long known for their splendid flavor. Recently a large
part of the acreage has been planted to “Resistant 45’s”, which permits vhie
ripening witboot reducing shipping quality. i\lany cars are now’ being “pro-
cooled” before shipment and this, together with vine ripening is placing Colorado
cantaloupes on consumer tables with even better quality and flavor than formerlv.
The proportion of honey-dew melons has increased greatly in recent years
and a substantial percentage of these melons is also vine ripened and pro-cooled
before shipment. In most years quality and flavor is excellent. Consumersmay look forw’ard to an even better product in the future. Colorado vine-ripenedhoney-dew’s are a real treat.
Counties which lead in production are Crowley, Otero, Pueblo, Adams, Weldand Mesa.
Green Peas—This crop is grow-n to supply both the canning and fresh vege
table market. A goodly portion of the peas grow-n hi Northern Colorado, in theCanon City area, and in the San Lois Valley is canned each year, hut the fresh
crop from these areas is widely distributed. In 1937, 11,400 acres were grown
for the fresh vegetable market, and 3,690 acres were grown for canning. The
total crop was valued at $819,000. Principal producing counties are Conejos,Costilla, and Custer, where the built of the crop is shipped fresh. Prodoction in
Boulder and Larimer counties is largely canned.
Cabbage—Cabbage of the Early Domestic type supplies the summer market,beginning in July, while the Late Danish types supply the fall and winter markets. The bulk of the crop is produced in Weld, Adams, and Costilla counties.
A small quantity is canned as kraot each year. The 1937 crop of all cabbage wasgrow-n on 5,220 acres and w’as valued at $582,000. Quality and flavor of Colorado
cabbage are excellent. -
Cauliflower—The bulk of this crop is grow’n in Costilla county in the SanLois Valley, and at an elevation of 7,500 feet above sea level. This county isone of the leading counties in the United States in the production of canliflower.
Pueblo, Adams, Freniont and Custer coonties also grow- this crop in considerablevolonie. Ia 1937, 2,720 acres of cauliflower were harvested, but due to low’ pricesthe crop grossed only $359,000,
Tomatoes—About two-thirds of the acreage is grow-n for canning, either as
juice or fruit. Tile crop grown in the Arkansas Valley is canned extensively,which is also true of the crop groivn in Weld and Adams coonties. Rarvest
begins in August and continues until frost. Doe to ahundant sunshine and thevarieties grow-n, these tomatoes produce an unusually fine pack. Fresh tomatoes
trucked and shipped by rail from Colorado are a pleasing product in the
consuming markets.
In 1937, 7,100 acres of tomatoes were grow-n, of w-hich 4,700 were grow-n for
manufacture and 2,400 acres were grow-n for the fresh vegetable market. The
total crop w’as valued at $651,000.

STATE 011 COLORADO 5
Celery—Colorado giant and short strain Pascal celery is probably the mosttalked of and highly praised vegetable product. A large percentage of the cropis grown immediately north and west of Denver in Jefferson and Adams counties.Minor producing areas are in the vicinity of Canon City and just east of Pueblo.Small quantities are also grown in Otero county and in several counties on theWestern Slope.A large percentage of Colorado celery is wrapped with paper for bleachingin the field and is then placed in trenches for further bleaching and storing forthe Thanksgiving and Christmas markets. Trenched celery has a quality andflavor not exceeded anywhere. In recent years much Colorado celery has beenshipped in individual gift packages during the Holiday season. Only a smallportion of the crop moves in carloads, but shipments by express go to all partsof the country and additional quantities move by truck. In 1937, 1,200 acres ofcelery were harvested, compared with 1,300 acres in 1936. Production in 1937totalled 324,000 crates, worth $616,000. While the cost par acre of producingcelery is large, the average value of the crop per acre is the highest for anycrop grown in the state. In some years the value per acre has exceeded $500.
LIVESTOCK INVENTORY AND VALUEThe value of all livestock (excluding poultry) on Colorado farms January 1,1938, was placed at $87,756,006. This was a decrease of $4,656,000, or 5.0 percent, compared with values January 1, 1937, and a decrease of $1,002,000, or 1.0per cent, compared with values January 1, 1936.The value of all livestock January 1, 1938, at $87,756,000 compared with$92,412,000 a year earlier, $88,756,000 January 1, 1936, $4741 1,000 the low valueJanuary 1, 1933, and $130,281,000 January 1, 1930.During the year 1937 the number of horses, mules, all cattle, milk cows,stock sheep, and hogs decreased. There was an increase of 16 per cent in thenumber of sheep and lambs on feed. The average value per head of each speciesof animals was lower on January 1, 1938, than a year earlier.All Cattle—Tho number of all cattle and calves was placed at 1,554,000 head,compared with 1,570,000 bead January 1, 1936, a decrease of 1 per cent. Thetotal value January 1, 1938, was $48,987,000, compared with $50,579,000 a year
carlier. The value per head decreased from $32.20 to $31.50 during 1937. Cattlenumbers in Colorado reached the peak of recent years on January 1, 1934, with1,773,000 head.
Milk Cows—The number of milk cows (included with all cattle) decreased3 per cent during 1937, and on January 1, 1938, totalled 245,000 head, comparedwith 253,000 head January 1, 1937, and 248,000 January 1, 1936. On January 1,1934, Colorado farmers had 300,000 milk cows. Milk cows were valued at $11,-270,000 January 1, 1938, compared with $11,638,000 January 1, 1937, value perhead at $46.00 being the same on both dates.
Sheep—The number of stock sheep was placed at 1,720,000 head, comparedwith 1,737,000 January 1, 1937. Ewes were marketed in greater numbers in 1937than in 1936, and fewer ewe lambs were held. The number of sheep and lambsin feed lots January 1, 1938, totalled 1,185,000 head, an increase of 15 per cent,compared with the small number on feed January 1, 1937, of 1,030,000 head, and1,250,000 January 1, 1936. The total sheep and lamb inventory was valued at$17,741,000 on January 1, 1938, compared with $17,216,000 January 1, 1937. Valueper head was $6.10 on January 1, 1938, and $6.20 January 1, 1937.
Hogs—The Colorado hog industry lost during 1937 all of the gain made in1936. The inventory number January 1, 1938, totalled 253,000 head, against298,000 January 1, 1937, and 259,000 January 1, 1936. Values January 1, 1938,were sharply lower than a year oarlier, being $2,485,000 and $3,369,000 respectively. The value per head January 1, 1938, averaged $9.80 against $11.30 January 1, 1937.
Horses—Horse numbers continued to decline during 1937. The numberJanuary 1, 1938, was 254,000 head compared with 259,000 a year earlier. In 1920,Colorado farmers had 421,000 horses. The value per head and total value ofhorses was lower on January 1, 1938, than on January 1, 1937, the comparisonbeing $68.00, $76.00; and $17,178,000, $19,623,000.
Mules—The number of mules in Colorado has always been relatively small.January 1, 1938, numbers totalled 16,000 head against 17,000 January 1, 1937.Values January 1, 1938, and 1937 were $1,365,000 and $1,625,000. Per head valueswere also lower.

3 AGRICULTURAL STATISTICS
Lamb Crop—The number of lambs (locked or saved in 1937 wes estimated
at 1,250,000 head, compared with 1,243,000 head saved in 1936. In 1934 the
lamb crop totalled 1,270,000 head, which was the largest of record. Beginning
with 1929, lamb crops have exceeded one million head each year. In 1937 a
total of 87 lambs were saved for every 100 ew’es one year old and over on hand
at the beginning of the year. This lambing percentage was relatively large and
reflected the good condition in which ewes came through the winter and the
favorable weather at lambing time.
Wool—The 1937 wool clip totalled 13,243,000 poonds, and was the third
largest of record. Tn 1936, 13,062,000 pounds of wool were shorn, while the
record clip of 1931 totalled 13,541,000 pounds. Prices received for the 1937 clip
avenuzod 32 cents per pound, and were the highest since 1928, when the average
was 33 cents per pound. The 1937 price was sharply higher than the price of
26 cents received for the 1936 clip, and striking as related to the 7 cents per
pound received for the clip of 1932. The total value of the 1937 wool clip was
$4238000, compared with $3,396,000 for the 1936 clip, and $862,000, the low
vulue for the 1932 clip.
Calf Crop—Tn most years the number of calves born in Colorado totals
slightly over one-half million head. The number born in 1937 was estimated at
539,000 head. In the years 1933 and 1934 the number exceeded 600,000 head.
These estimates include dairy calves as well as beef calves born under farm and
range conditions.
Pig Crop—The number of pigs saved from both spring and fall litters in
1937 was estimated at 326,000 head. This was less than two-fifths the number
saved in 1931, when hog production reached the peak of recent years with
785,000 pIgs saved. The 1937 level of hog production w’as below a desirable
minimum. However, this condition was largely forced upon Eastern Colorado
farmers by short feed supplies, which forced hreeding stock to market. Colorado
is rather favorably located as related to market outlets for hogs. In addition to
the local demand and the demand of the Denver Stockyards market, hogs can be
shipped to the Pacific Coast at a good price advantage. Frequently, in recent
years, prices on the Denver market have equalled or exceeded prices paid at
Omaha. Kansas City and other Missouri River markets.
Chickens—Colorado leads the stales in the Rocky Mountain region in the
production of chickens and eggs. Of the eleven states located west of the one
hundred second meridian, only California and Washington exceed Colorado in
production. A large percentage of the chickens and eggs produced in Colorado
are produced by flocks of less than 400 hens and pullets, which are a complement
to general farm operations. There are, however, approximately 200 commercial
flocks in the state having in excess of 1,000 birds each.
There were 3,390,000 chickens on farms January 1, 1938, and 5,092,000 chick
ens were raised during 1937. Egg production in 1937 was estimated at 318
million. Clnckens on farms January 1, 1938, wore inventoried at $2,034,000,
while chickens and eggs produced during 1937 were valued at $2,953,000 and
$5,380,000 respectively. It is obvious from the size of these figures that the
chicken industry in Colorado is a desirable complement to the farm euterprise,
both as related to the farm family living, as well as a provider of ready cash.
Turkeys—The number of turkeys raised annually usually totals between
500,000 and 600,000 birds. During 1937, production w’as curtailed to 460,000 birds,
following the low’ prices received for the 1936 turkey crop. These birds are pro
duced by many experienced growers, who raise them on a commercial scale,
although a good many birds are raised in small farm flocks.
A large percentage of Colorado turkeys are of good quality and are mar
keted as dressed birds. Climate is favorable for the turkey industry. Turkeys
are raised in nearly all counties in the state, but are grown commercially pri
marily in Larimer, Weld, Jefferson, Morgan, Adams, Washington and Yuma coun
ties of Northern Colorado and in Otero and Prow’ers counties in the southeast.
Turkeys are also raised commercially on the Western Slope, where Delta, Mont
rose and La Plata counties lead.

Si’ATE OF COLORADO
LIVESTOCK FEEDINGColorado leads the coontry as a producer of grain-finished lambs, and fat
tens annually about 25 per cent of the nation’s total. The Northern Coloradosection is advantageously located as related to the soorce of feeder lambs.Feeders can be obtained directly from ranges in Colorado and other Westernsheep states, or from the Deliver stockyards, which is the largest sheep andlamb market in the country. This market also provides adequate facilities forinarlceting the finished product. Colorado lamb teeders fatten trom 1 to 1%million lambs annually. The lamb feeding industry is a natural complementof the beet sugar industry. Feeding of these animals is the most advantageousmeans of utilizing the beet tel) and beet pulp, by-products of the growing andinainifacture of sugar beets. Sugar beets are grown as a general cash ci op inthe four feeding areas of Northern Colorado, the Arkansas Valley, the WesternSlope sections and the San Luis Valley of Sonthcentral Colorado. Locally raisedfeed grains and alfalfa provide most of the additional grain and hay needed fora balanced fattening ration. (See page 121.)
Fall cuing of cattle in the four feeding sections, while (loiie on a smallerscale than lamb feeding, is none tile less an important part of the agricnltnralindustry in these sections, particnlarly the Northern Colorado area. From100,000 to 175,000 cattle are fattened in these sections annually. (See page 122.)
F. K. REED,Agricultural Statistician.

AGRICULTU1IAL STATISTICS
COLORADO CROP ACREAGE, PRODUCTION, AND VALUE, 1936
Production Farm Value?
CR01’ Acreage UnitPer Total Per Total
Acre Unit
Corn, Al) 1,111,000 9.0 11,119,000 Eu. 9 1.10 $12,206,000
Oats, fur Grain 112,000 20.0 4,210,000 Ru. .49 2,005,000
harley, fur Graia 391,000 10.3 7,122,000 Ru. .72 5,120,000
Winier Wheat 455,000 15.0 5,915,000 Eu. 1.01 5,974,000
Siring Whrat 398,000 12.0 4,770,000 Eu. .99 4,728,000
By,’, fur Gr;,ii’_ 20,000 8.0 232,000 Ru. .77 179,000
hey limes 287,000 38.0 1,091,000 100-lb. Bag 4,45 4,011,000
l’elatues 100,000 18.5 18,500,000 Bu. 1.11 20,505,000
Sugar heels 171,000 23.1 2,234,000 Short Ton 1.70 13,020,000
l;ruie SorglismsL
217,000 9.0 1,953,000 Eu. .00 1,875,000
Sweet Sorghums 151,000 .90 140.000 Ton 7.50 1,050,000
lame Hay, All Varieties 1,057,000 1.00 1,095,000 Ton 8.20 13,899,000
Wild Hay 330,000 .95 119,000 1 ‘I’uu 8.00 2,552,00e
hlruuineorn 43,000 1.40 3,000 Ton 18.00 204,000
F’irld Peas 29,000 8.0 232,000 Eu. 2.15 499,000
Alfalfa Seed 8,000 2.1 22,100 Eu. 20.00 238,sO’j
Red Clover Seed 900 4.0 3,000 liii. 12.80 40,00o
Sweet Cloeer Seed 2,000 4.0 8,000 Eu, 4.90 39,000
Apples 2,C50,000 Eu. .98 2,009.000
Peaches 1,045,900 Eu. .80 1,070,000
l’ears 220,000 Ru. .85 187,000
Cherries 700 Ton 80.00 50,000
Grapes 000 ‘Ion 12.00 31,990
Commercial Truck Crops:
Eeans, Snap, for Manufacture_..H 920 2.5 2,300 Shuet Ton 41.30 104,000
Beans, Snap, for Market 2,400 125 310,000 Eu. 1.05 315,000
Cabbage, Early (Domestic) 1,933 9.5 18,300 Short Ton 42.00 769,000
Cabbage, Late (Danish) 2,770 9.0 24,900 Short Ton 30.00 747,000
Cantaloupes and HoneydewMelons, for Market 7,800 359 1,170,000 Crate .50 581,000
Carrots 710 210 153,000 Eu. .80 122,Oso
Cauliflower 3,200 220 704,000 Crate .43 317,090
Cclery 1,300 250 125,000 Crate 1.70 112,000
Cueunsbers, for Pickles .. 1,700 204 347,000 Ru. .47 163,000
Lettuce 3,900 100 390,000 Ceate 1.30 507,000
Onions 4,200 165 093,000 100-lb. Sack .80 554,000
Peas, Green, for Manufseture.... 3,500 1,970° 3,510 Short Ton 10.80 136,009
Peas, Green, for Market 9.500 99 700,000 Eu. .86 046,000
Spinach 1,200 315 1.15,509 Eu. .45 01,009
‘I’omatses. for Manufacture 3,700 0.3 23,300 Short Ton 9.80 228,000
‘romatoes. for Market 1,900 230 475,000 Ru. .70 332,000
Watermelons 1,200 330 390,000 Melons .13 59,000
Total Truck Crops 53,720 $ 8,930,000
Toish All Crops 0,081,000 $99,255,000
Warns value based upon an annual average price received by growers obtained by weighting monthly
farm prices by estimates of monthly marketings.
Pounds.
(Includes value of tops. Prices of beets estimated.

STATE OF COLORADO
COLORADO CROP ACREAGE, PRODUCTION, AND VALUE, 1937
I Production Farm ValuetCROP Acreage Uiiit
! Per TotalUnit
Per TotalAcre
Corn, All 1,007,000 8.0
Oats, for Grain 143,000 31.0
Barley, for Grain I 408,000 20.5
Winter Wheat 774,300 13.5
Spring Wheat 382,000 13.0
Rye, for Grain 45,000 8.3
Dry Beans 244,000 320
Potatoes 106,000 148
Sugar Beets 100,000 12.4
Grain Sorghums 231,000 0.5
Sweet Sorghums 211,000 .70
‘fame Ray, All Varieties 1,822,000 1.03
Wild Hay 350,000 0.0
Broomrorn 32,000 130
Pield Peas 20,000 00.0
Alfalfa Seed 14,000 ‘ 2.5
lied Clover Seed 300 2.0
Sweet Clover Seed 2,300 4.0
Apples
Peaches
l’ears
Cherries
Grapes
Commercial Truck Crops;
Beans, Snap, for Manufacture- . 1,050 3.3
Beans, Snap, for Market 3,100 120
Cahhage, Early (Domestic) 2,120 10.5
Cabbage, Late (Danish) 3,100 10.3
Cantaloupes and Honey Dew Melons, for Market 7,000 130
Carrots 910 225
Cauliflower 2,720 220
Celery 1,200 270
Cucumbers, for Pickles 1,860 206
Lettuce 4,700 100
Onio 1,400 230
Peas, Green, for Manufactore.._J 3,600 l840
Peas, Green, for Market 11,400 85
Spinach 1,120 120
Tomatoes, for Manufacture 1,200 5.5
Tomatoes, for Market 2,400 265
Watermelons 1,320 310
Total Truck Crops I 36,400
Total All Crops 5,264,200
8,536,000
4,433,000
8,772,000
10,449,000
1,786,000
382,000
781,000
03,688,000
1,002,008
1,321,000
148,000
1,661,000
356,000
2,100
280,000
35,000
600
10,000
1,437,000
1,133,000
151,000
3,405
3,500
372,000
22,308
32,600
010,000
205,000
308,000
324,000
383,000
470,000
1,012,000
3,030
069,000
158,000
23,100
636,000
449,000
Do.
Bu.
Bu.
ho.
ho.
Ru.
100-lb. flag
Bu.
Short ‘lon
Do.
‘ton
‘Ion
‘ion
‘t’uo
Ito.
flu.
Do.
Do,
Do.
flu.
flu.
‘Con
Ton
Short Ton
Do.
Short Ton
Short Ton
Crate
Bo.
Crate
Crate
Do.
Crate
ioo-lb. Sack
Short Ton
Do.
Do.
Short Ton
Do.
Melon
.68
.40
.53
.94
.93
.60
3.65
.30
4.81
.36
6.20
7.80
7.00
50.00
1.50
14.30
16.20
4.30
.75
.90
.80
80.00
35.00
13.30
.90
10.00
11.00
1.20
.00
.80
3.00
.48
1.00
1.30
46.00
.70
.40
10.60
.60
.15
$ 5,378,800
1,685,000
4,474,000
9 .922,0t2
4,377,000
220,0s0
2,851,000
7,844,000
t10,562,000
715,000
910,000
11,900,OtO
2,402,080
110,000
390,08’)
500,000
10,800
43,000
1,093,000
1,370,000
130,001
277.000
31,080
102,000
335,000
223,000
335,000
1,138,000
133,000
359,080
616,008
384,080
470,080
1,316,080
141,000
678,800
83,000
245,00o
382,080
67,000
$ 7,012,000
$76.9t1.000’7’I
tFarm value based opon an annual average price rereived by growers obtainedfarm prirm by estimates of monthly markethngs.
*Poonda
tlnrludes value of tops.
by weighting monthly

11) AGI{ICULTUI{AL STATISTICS
FARM VALUE OF PRINCIPAL CROPS—1937(Continoed on Next Page)
COUN’IY Corn Oats Barley All Wheat e Beans Potatoes Sugart(for Grain) Beets
ChalIce $ 14,763! S 33,886 S 20,493 S 133 5 4,860: 5 2,337Clear Creek 100 I 660Eagle I 28401! 15,832 51,589 164,832Gilpin S t2t: 3,976 506! 3,9331
Grand 9,384 7,1St 6,136 5 1,021 2,412Cunnisan 0,607! 3,216 3,102; t16 20,130; 239Jackson ISP 901 280 I 9’Lake ——
ilollit 1 242 54 10 sJJ 1es996 040 5 918 40976lark ..
1,205’ 1,630 139 36,140l’itkitt ! 58,026, 1,199: 16,069: 70 99.603!Its. Itlanro, 1,130 27,077- 2,41& 68,260: 312. ! 12,375CooLS ,. .. 128,457. 66,600! 373,890’ 2,387 - 92,4121Ssn.n.it 1,864 1370 1,305 ; 742’
7’eller - - - ., 2.032 1,323 16,089
_________
‘I’oIal NorII.s. tat—-
District — ,.— 5 15.256 5 293,028 $ 150,364 $ 698,080 S 12,635 $ 1.631 5 194,6-16 S 2,476
Ilnolciry .,.._ 5 214,111 $ 64,590 $ 209,477 5 522,662 $ 1,020 5 1,106 5 441.027li_li I I 1 6 62 1(0 116 810 610 014 1 68 1 tab 5 090 4 3l,ari,ner 239,005 91.301 356,109 760,608 702 30,014 19,343 929,9121,5!PiIi — ., 419,502 18,522 076,469 00.1,129 31,378 18,232 1,083.501511 iii ll3Osa 136 2 9.. 18 94 11011 124 8 418 i6l0i1Sedgsriek 114,181 68,174 ‘°°: 102,774 4,650 808 72,410 320,374Weld .; 810,790. 210.880 1,416,811 2,127.043 38,610 1,087,624 2,033,508 4,209,168
1’otal N. Central - : ‘,
and N. E. Disi. 52,391,574 5 613,560 $2,826,744 S 5,643,139 S 88,691 $1,365,711 82.218,823 $ 6,182,94:
Adams $ 244.036’S 29,100 $ 181,079 5 3,190,795 4 7,344 5 05.690 5 5,250 8 433.5-1711 ipahoe 161 5 9 40 2 8 o 1 0 5 45 4 1 1
Cheyenne ! 43,470. - 100 —-
Desrer ! -
-
Douglas 96,488 30,802 26,727 100,700 5.772 14,001 103lOihert 146,188’ 10,1251 12,204 232.777 12.320 132,710 70El lass 143,398, 24,193 4,720 10.077 12,895 73,621 2,060 26,409Kiowa 33,43Q; 210 ,
Kit Carson 92,808 740 41,910 202,427 1,502’ 310 130 -
1,ieeola 85,070 218 10,312 70,100 2,220 10,122’ 1,180,l’hiltips 213,340 20,406 72,792’ 527,302 15,104Washingtsa 274,053 18,482 216,714 600,005’ 13,142 12,110 l30[ 27,772Ynma 418,910, 12,095 11,228 1,347,445! 23,502’ 010 2.898!
*Total F. Central !District $2,027,131 8 162,494! 8 772,121! 8 5.331,251: 5 109,305, 5 338.573 $ 13,031 5 518,871
Archuleta 5 8,51’S! 5 8,476 5 1,098 5 22,782! : 1.002 5 9,116 -
Delta 239,165 12,141 41,110 101,667 5 179, 30,027 92,700 5 120,SMI2olores 22,414 1,380, 1,217, 18,420 1,228: 108,447! 21,624,Garfield 57,260 43,120 38,819, 112,937, 2,300 9,712 293,000! 153,397Itinsdale 1,015 i 2,203la l’lata 34,279 11,072: 19,271, 269,005, 300; 10,85-1’ 14,800’Mesa 185,239: 38,739 22,i70 102,042, 460’ 333,846 222,014 46,091Montezuma 64,200: 51,249 22,014’ 174,256, 302,580 103,842Montrose 175,766- 80,119 28.811: 201,120 2,808’ 01,800, 311,136 07,361Otiray 1,224: 1,010! 4,082’ 27,327: 360 10,871San J,.a,s : !
San 011gm’1 2,954; 11,1041 12,510, 21.783: 288 7,196 10,110,
‘I’d ii 55’. Central ; :and S. 55’. 1)1st. 5 791.510 S 346,026 $109,285 $ 1.272.939 S 7.797 8 803,200 51.202,957. 5 387.891
Atitnun a - - - , -‘ ‘ 5 10,738 5 07,720 5 74,223 ;__ 5 401,901 5 22,101
(‘noel’s .,-- 5 1,980. 21,3601 11,460 71,630 5 0.160 210,000 13,031
(““tills 7,146! 17,303! 10,840 108,633 _ 20,384 20,001 18,42’Misers! ‘ 798; ! i 1,320Rio firsts!!’ —‘
I 2,300 57,630: 09,274 241,000 5 000 2,605,947, 12,701Sago!tel!e 1 43,080 12.100 51.173-
- 453.971: 3.421
Tatal S. (‘enlral -
District $ 10,926 8 199,514 $ 340,509 8 547.231 S 600 8 32,044 83.071,640 $ 70,561
Baca $ 2,888, 5 1,647, 5 3.100 ___; : -
Bent 13,410: 8 3,210 70.190 130.914__ 5 17,340 5 121,33:
Crosvley 83,181: 11,111 20,309 10.833- -————I 40,712 ,_____ 101,32
Custer 4,116 20,702 21,1:0 21,113 8 300 114 5 0-i,37 40:Fremsnt 13.078; 1.804, 7.013 15,808 300 104 0.2:3 8,03:Huerfano 15,926! 17.294! 10,224, 10.410 1.200 2,070 3.024 0.51!Las Animas i 28,987! 4,341 7,717 10. .713 020 00,370 01.00:Otero 320,140 11.709j 87,948 71,000, :03 07.017 480.20:Prowsrs 10-218! 24,468 210339; 210,077’ ‘ 3.102 150,12:Pueblo 123.840! 32,373 00,500; 3!0
-— 00.070 -
___ --: — 301,01’
Total Sontheast IDistrict S 553,799k $ 120,248! $ 406759! $673614: 8 3,235 5 270,769, $ 66,804 $ 1,400,23;
State Total 85797196! $1737662i 81.666.8021 814.168.303[ 8 222.2501 82,003.930 87,007,931! 810,562,98’
tlnclsdes valse of tops figured at SOc per ton of beets, making a value for the state of 5991,308. Government payments not included.
Indicates approximate location of District for which Gnuntieo are given above.

STATE OF COLORADO 11
FARM VALUE OF PRINCIPAL CROPS—1937(Continued from Preceding Page)
All 411 Fruit Commercial Miseel- Total AllCOUNTY Sorghuma Tan;e Hay Wild Hay Cropa Truck laneuua Prtncioal
Cropa Cropa Crops
Chaffee $ 58,752! $ O,OO $ 12,205! $ 17,477 S 10,370 S 101,100Clear Creek. 5,042 1,072 7,531Eagle I 232,512! 3,200 900 20.678 4,580 521,042Gilpin ! 400! 2,613’ 700 10,000Grand 85,583! 139,8th ‘ 52,000 4,580 300,842Gunnison —. I
140,4791 169,585’ 441 4,580] 353,515Jackson 5,916 603,911 ‘ 1,070 013,440Lake I _! 52,364 ! 159 52,514Sloffat 9 770 182,888’ 16,360] 221 12,900 408,750Park ! 26,413; 172,313 700 245,403Pitkin 93,657! 1,788 331 409 233,595Rio I3laneo 244,600 19,040 1,103 _‘ 10,670] 387,554Routt 441,800 13,952 ‘ 147.100 8,300 1.277,504Summit ‘ 54,030] 2,600, 02,817Teller —
32,700 4,442 20.000 1,120, ioo,ssoeTatal Narthsvest ! IDistrict 5 770 $ 5,612,524 5 1,212,093 5 15,201: 5 268,l35 $ 60,850 54,841.409
Boulder ! $ 1,134 5 357,23& 5 25,304 5 50,009, 5 1 15,050 5 13,730 5 2,317,810Jefferson 1,094 219,070 11,170 138,715] 107,530 41,180 1,028,117Larinser 3,091 481,194 30,993 200,321! 123,008 20.590] 3,200,093Logan 75,547 111,483 107,039 1,034’ 22.235 51,090 1,355,04)Morgan ‘ 63,352, 450,707 15,902 900 21,954 20,690! 3,004,300Sedgwick 15.958 100,923 17,170 193’ 231 7,020 1,070,255Weld 01,132 1,191,000 00,5l2 0,421 1,220.103 85,390 11.910,021
Total N. Central &N. E. District 5 245,128! $ 3,478,779 $ 297,916’ 5 464.231, 5 1.920.191 5 246,290, $30,000,596
Adams 5 42,219. 5 241,322 5 9,703 5 13,903 5 750,393 S 25,920 5 3,518,351Arapahoe 40,502 153,901 8,237 11,282’ 00,121 7,620 1,219,159Cheyenne 00.094! 2,051 720 3,050 148,351Denver . !
. ‘
Douglas 7,025, 141,307 13,010 1,214 , 0,100 021,498Elbert 45,040 90,379 19,030, 183! ‘ 10,070, 708,750El Paso 26,197 150,932 20,200’ 1,021] 8,126, 13,730! 504,991Kiowa ! 83,108! 8,755 2,520 . . 29,930,352,983Kit Carson 150,929] 28,880 5,432] 70’ 234 6,800 538,940Lincoln 70,803] 37,380 20,059] ‘ 3,050, 301,000Phillips 65,4231 83,591 231 311’ 500 21,350 1,066,088Washington 191,857! 220,704 50,058, 283, F 30,500! 1,605,810Yuma 337,557, 235,325 36.320 515] 509: 35,080 2,422,044
Total K. Central IDistrict $ 1,060,766’ 5 0.363,310, 5 172,386: 8.32,380’ $ 831,202! $ 189,860, $12,928,877
Archuleta 5 104,092] 5 15,840! 5 1,793 5 1,839! 5 205,818Delta 5 2,345 155,060] 5,892, 671,960’ 5 221,580 28,970 3,226,221Dolores 5,050, 11,813, 804 28 ! 2,200! 235,122Garfield 1,755! 775,004 11,023! 54,206 14,68& 18.000] 1,036,168Kinsdale 21,226] 9,230 ! , 33.671La Plata 1,071. 276,521 8,011’ 35,141, I 12,000’ 761,301Mesa 3,170 823,018 1,072 1,437,034, 203,471’ 39,650! 7,460,470Monteauma 1,152! 245,412 792 03,993’ 2,111 6,400 1.016,430Slontroee 1,166 611,015 4,756: 08,713 396,193 17,600 2,037,008Ouray 127,305’ 20,207! 331 ‘ 1,070. 199,297San Juan :
. ,San Miguel ___1; 71,620 iRs 552’ 1.071] 153,316
vTotal W. Central & IS. Vi. District ‘ $ 18,873, $_3,713,989 $ 76,884 $ 2.313,775] $740,057 $ 129,930 $12,058,101
Alansosa $ 184,856 5 02,021 5 39,778 5 43,460 $ 1,064,494ConDos I 1 ,J1 a e $ 16, 2’ 13’ 01060 10,0874Costilla 5 710 120,736’ 30,230! 221 627,194’ 111,320 1,156,702Mineral 15,515, 17,374! 35,047Em Grande 090,404’ 60,514! 112 279,162’ 142,130 3,782,304Saguache ‘ 100.403 206,634 83 2,765 55,300, 1,032,677
Total S. Central !District ! S 750] $ 947,558’ $ 503.834] $ 621 $1,211,181 $ 413,270, $8,353,038
Sara ! $ g7,3941 $ 7,509! $ 1,148 $ 110,560’ 5 214,252Sent : 43,440 412,087 $ 1,905 138 $ 171,352! 53,380! 1,088,660Crowley 18,804 136,508: 671, 2,197 637,801! 11,440! 1,160,588Custer 240 31,690] 116,516 345 153,176 0,860 440,571Fremont 1,106 128,138! 6,668 232,266 200,101 14.180! 082.478Huerfano 4.521] 158,932 11,662 5,213 6,447 5,340, 285,472Las Aninsas 12,670] 128,454 2,664 3.062 6,105 13,730’ 341,112Otero 4,800’ 364,650 4,679 13,372 943,872, 107,510 2 207 845Prowers 211,815 160,344 1,870 621 5,926’ 96,090 1120184Pueblo _J 111,351 0079 16,206 6L.l.O8 04.810 3:070:403
Total Sautheast Dial: 5394.1761 $ 2,174,626’ $ 155,138, $ 274,760, $ 2,726,202 5.184,800 $9,714,177
State Total ! $ 1.721.403] $13,292,980] S 2,438,251] $ 3.101.OOO $ 7,712,268 $1,525,000 $77,697,216
— lndicatea approximate location of District for which Coun1ies are given above.

12 AGRICULTURAL STATISTICS
TOTAL VALUE OF ALL PRINCIPAL CROPS—COLORADO 1927-1917
(Continued on Next Page)
COUNTY 1927 1928 1929 1920 1911 1932
Chaffee $ 581,780 $ 514,620 $ 453,840: $ 359,580, $ 185.9501 $ 138,900
Clear Creek 15,680 25,320 50,7601 9,840! 9,200 5,310
Eagle 1,006,826 880,870 563,980, 572,270’ 188,460 454,470
Gilpin 36,6901 31.730 22,000 15,800’ 11,550! 12,320
Grand 819,9201 830,710 512,110 447.950: 324.040] 323,180Gunnison : 679,7901 830,310 747,790 528,860’ 378,550: 419,450Jackson 623,2701 685,860 904,950 843,470 644,740 600,400Lake 23,940 66,950 47,280 51,580 37,110 46,020MolTat 626,520’ 965,640 823,280 624,330 314,420: 315,070Park 482,260: 463 880 500,990 408,240 215,620 215,890l’itkin 446,510 388,600 453,790 242,270 102,010 180,090ltio Illanco 925,410 874,770 844,850 629,250 360,550 456,740ltoott 2,115,090 1,897,2901 1,857,260 1,049,730 617,900, 720,200Summit 197,870 202,830 134,670 86,210 95,920 00,850‘loller
:
303,090 299,0201 230,630 234,700’ - 94,3701 103,150
“total Northwest l)ist. $ 8,881,810 $ 8,958,400 $ 8,508,180 $6,116,130 $ 3,761,130, $ 4,045,440
Iloulder $ 2,622,270 $ 2,210,300; $ 2,548,410: $ 2,074,450 $ 1,025,720! $ 823,640.fclrersoa : 1,892,280 1,896,650 1,696,630 2,224,670, 852,730 591,5601.ariaier 0,661,370 4,507,640 4,638,650’ 4,434,130’ 2,926,450 1,688,800logan 7,320,590 6,613,630 5,219,080 6,073,400’ 2,570,440! 1,623,180Morgan 5,490,990 4,849,600, 4,689,980 5,234,170, 2,507,8501 1,886,090Sedga’iek 2,652,390 2,208,3901 2,042,450 2,206,030, 810,823] 634,060Weld 20,488,670 16,413,0001 20,842,100 19,477,770 10,484,000, 6,565,150
‘Total N. Central & N- I :
K. Dist. $ 46,089,560 $ 38,700,010] $ 41,677,270 $ 40,734,620, $ 21,683,020 $ 13.813,080
Adams‘
$ 4,004,420 $ 3.674,970: $ 4,245,980’ $ 3,275,430: $ 1,887,030, $ 903,580Arapaisse 1,835,030, 1,557,920 2,027,240 1,383,930 709,050! 296,900Cheyenne 841,190 979,540 985,000 3,366,870 563,140 107,300Denver I .
Douglas 670,320 668,430 615,580 617,800 279,740 148,070Elbert 2,389,150 2,208,740 1,827,960 1,943,180 654,690 296,780El Paso 2,373,880 1,780,920 1,770,910 2,205,370 625,840 306,760Kiowa 679,740 806,480 808,240! 1,037,870 436,8:70 02,770Kit Carson
2,787,000: 2,676,820 2,419,320 3.553,520: 1,214,200 304,830Lincoln 2,019,350 2,001,160 1,999,330 2,014.100’ 673,050 107,700Phillips 3,077,150 2,116,580 2,919.070. 2,820,110, 816,670 403.950Washington 3,074,520 3,580,650 2,987.260 3,731,930 1,337,400 786,070Yoma 3,718,7101 5,539,000 5,156,090, 5,772,360, 1,795.380: 717,860
‘Total K. Central DistJ $ 28,980,860’ $ 25,692,200 $ 27,400,940’ $_29,719,370, ! io,ooa,ooo: $ 4,563,470
Archuleta : $ 363,8701 $ 440,080 $ 377,710 $ 358,110: $ 175,8801 $ 220,350Delta 2,688,290] 2,472,210 3,290,5201 1,844.610’ 1,055,480] 1,670,330Dolores 118,150, 06,570 124,460’ 67,980’ 33,610’ 38,960Garfield 2,209,420] 1,956,200, 2,122,800’ 1,516,0901 801,170 1,167,440Hinsdale ‘ 95,770. 69,000 55,710 40,860 28,720 37,490La Plata 1,277,520’ 1,098,010 1,178,670, 873,160’ 536,830 675,090Mesa 3,429,270. 3,019,140’ 4,683,1501 2,038,380 1,827,110 1,743,780Montezuma 871,420 842,320 1,118810] 764,460’ 512,500’ 601,020Montrose 2,693,810, 2,906,200 2.992,790, 1,021,430 1,055,010] 3,406,040Ouray 285,010 272,200 291,620 105,450 137,030 149,570San Joan 1
San Miguel 506,310 527,980 216,400: 162,730 87,980 106,870
‘Total W. Ceotral & 5 ! I IW. Dist.- $ 14.498,8601 $ 13,700,890 $ 06,452,640 $ 30,682.130 $ 6,851,120 $ 7,871,840
Alamosa ‘ $ 1,459,360 $ 5,398,610. $ 2,037,990 $ 1,468.200 $ 484,590 $ 644,080Conejos 2.111,010! 3,542,450 2,632,640; 1,986,950 824,830 875,800Costilla 804,980 t,148,600, 1,025,570, 820.050, 639,440’ 486,300Mineral 53,050 44.350; 31,960! 22,480’ 18,720 20,900Rio Grande 3,794,870! 2,658,090 6,356,240 3,072,760’ 072.0801 1,196,380Sagoaehe 2,356,850 1,537,270 2,727,450 1,682,940 522720: 928,320
‘Total S. Central Dist.,., $20,660,420 $ 8,327,270 $14,811,850 $ 9,053,380 $ 3,462,320 $4,156,840
Baca $ 1,466,110 $ 1,298.510, $ 3,184,990 $ 2,044,21t $ 2,300,410, $ 093,670
Bent 1,843,350 1,778,910 2,411,180, 2,128,9001 061760] 607,210Crowley 1,966,508 l,937,l60 2,113,310’ 2.136,5101 662,260 314,290
Custer 458,071 463,619’ 578,620 669.5401 368,7801 278,210Fremont 1,021,000 901,430 916,040 848,090. 594,999! 429,840Huerfano 068,320 450.110; 617,970, 385,599; 308,490! 359,830Las Animas 707,250 740,110, 1,406,100; 989,400’ 766,530’ 382,000Otero 3,386,8001 3,277,809 4,139,950 3,707,150 1,696,930; 1 601.550Proseers 2,470,570! 1,849,080, 3.388,390 2,460,710 984,870’ 880060Pueblo . 2,599,520’ 2,848,610 2,803,670 2,811,220 1,685,900 1.119:070
‘Total Ssotheoot Dist.__ $16,585,490, $ 15,541,330 $ 21,630,820’ $ 18,180,970’ $ 50,429,920] $6,837,130
State Total $125,7t0,tt0 $ 11t,920,10t $130,300,900, $114,486,600, $ 57,180,6001 $ 41,307,800
‘Indicates approximate location of District for which Counties are given above.

STATE OF COLORADO 11
TOTAL VALUE OF ALL PRINCIPAL CROPS—COLORADO 1927-1931
10-YearCOUNTY 1933 1931 1935 1936 1917 Average
1927-16
Chaffee $ 1I6,000 $ 181,600 5 253,700 $ 246,012 5 164,360 $ 305,420Clear Creek
7’930F 11,060 0,120 32,619: 7,114 11,886Eagle 467,950: 621,750 460,710 826,460 529,042 665,261Gilpin F 35,459: 14,720 13,710 25,859 10,066 19,679Grand F 326,980, 443,230 256,760: 385,580 306,642 467,246Gunnison 427,350: 662,680 269,650: 422,415 153,535 516,705Jackson 508,710: 731,650 352,260 656,467 613,449 666,364Lake 10,060 69,140 47,430 02,214 52,514 55,421Moffat 305,050 156,396 427,160 117,333 466,716 521,526Park 309,600 271,500 256,850’ 392,907 215.163 354,264Pitkin 198,060 202,070 254,020, 462,573 233,505 293,080Rio Blanro 375,740’ 644,740 372,090 484.257 387,554 566,649Routt 749,470 996,960 607,160 877,600 1,277,504 2,168,665Summit : 52,640 66,130 46,630 63,638 62,817 00,646Teller I 161,250 88,060 545,4391 175,054 106,558 103,690
°Total Northwest DisC, 5 4,174,410 65.396,020 $ 4,122,900 $ 3,063,415 5 4,811,109 $ 5,914,257Boulder 5 1,363,380’ $ 1,851,100 $ 1,444,1891 $ 2,111,323 $ 2,317,810 $ 1,861,473Jefferson 1 713,400I 1,071,100 1,051,260 1,528,121 1,828,117 1,253,054Larimer 2,183,870: 2,690,000 2,752.810! 3,446,065 3,266,063 3,493,387Logan : 2,670,500 2,320,110 3,245,470: 1,635,720 3,555,940 4,200,202Morgan 2.815.SIOF 2,301,240 2,921.048: 4,680,583 3,004,360 3,738,787Sedgwick 753,430’ 967,166 988840’ 3,297,748 1.079,251 1.448,284Weld 10,801,516 9,174.610 12,180.290 — 20,101.677 14.917,021 14.709.129
‘Total North Centraland Northeast District $ 21,329,400 5 20,546,740 5 21,505,010 $ 28,396,196 5 30,000,596 $ 30.754,543
Adams $ 1,777,020 $ 5,663,750 5 1,205,060! $ 3,393,505 $ 3,118,351 $ 1,703,109Arapahoe 650,050’ 584,700 778,270: 1,101,717 1,519,450 1,006,070Cheyenne 110,016 77,280 120,610, 312,062 248,301 080,370Denver r :Douglas 290,590: 377,430 160,610: 612,171 621,498 468,477Ribert 1,083,210. 418,070 717,810 1,170,821 700,706 1,272,128El Paso o,oso,oio1 446,810 661,010, 1.159,977 564,991 1,136,999Kiowa 150,770J 342,330 120,850’ 421,560 112,083 409,751Kit Carson 992,770’ 243,980 270,160 405,560 028,940 1,002,607Lincoln 619,370 140,740 493,180 192.005 301,006 1,170,883Phillips 632,080! 600,300 801,250 1,480,877 1,066,680 1,541,804Washington 1.412.510 490,660 1.516,890 2,288.189 1,685,810 2,218,617Yuma —- .. 1,201.010 900,780 1,196.500 1.760,478 2,421,044 2.603.021
‘Total E. Central Dist. $10,580,030 S 6,241,740 $ 9,353,020 oio.oso,soi 5 02,928.877 $ 16,983,89.1Archuleta $ 236,770’ 5 240.070 s 276,889: $ 3e3,472 $ 260.018 $ 103,090Delta 1,818,770; 1,827,270 1,848,e30 2,991,667 2,226,224, 2,171,318Dolores 81,020; 71,170 172.420 178,056 238,423’ 94,248Garfield , 1,147,102. 1,101,630 1,141.706! 1,105,070 1,636.100 1,504,150Hinsdalo : 21,600: 38.930 11,032 13,677 42,922La P]ata F 531,9301 542,200 700.530: 066,096 760,zo•l 838,202Mesa F 1,740,070 2,766,520 2.OOl,600j’ 3.373,098 7,’l00,476 2,797,117Montezuma 571,240. 571,810 903,000: 2,128,312 1,040,436 794,293Montrose ‘ 1,715,190’ 1,090,220 1,080,370: 2,106,222, 2,637,068 2,055.756Ouray ‘ 167,780 227,200 121,020 172.098 189,297 201,016San Juan F : ‘
San Miguel . 106030! 107,720 183 480 229,227 103,216 205,47(1°Total W. Central and F
Southwest Distrirt_.._ 5 7,052.060 5 9,422.930 $ 9,357,510 $ 33.829,380 $12,039,101 $ 11.018.990Alamosa 5 1,002,300 S 704,148 $ 1,131,760 $ 1,790,306 $ 1,064,481 $ 1,527,147Coneios 1,223,830, 1,683.770 1,401,770i 1,021,910 7,079,034 1,559,437Costifla 654,040 824,070 093.130. 1,147,722 1,158,702 832,116Mineral 27,020 02.148 18,380F 41,644 35,047 33,761Rio Geande 5,974,738: 1,740,760 3,881.0191 6,489,593 3702.304: 3,303,741Saguaehe 1,308,840! 1.024,300 1,711,036: 2,260,803’ 1.022,677 1,616,052
°Tnlal S. Central Dist.__ $ 7,278,760! 5 5,480,540 $ 8,837.190 $ 13,070,978 $ 8,153,008 $ 8,573,154
Baca $ 695,430 $ 539,780’ $ 440,000! $ 533,010 6 214,202 $ 2,350,600Bent F 887,470. 660,730, 060,0201 1,189,063 1,088,069 1,312,448Crowley 539,390’ 95,100 035,050 1,179,827 1.100,508 1,158.010Custer ‘ 370,830 082,720 343.460 560,355, 440,074 447,020Fremont ‘ o1B 618,840 471,730 786,720; 681,478 703,121Huerfano : 256,620! 229,280 2’15’040F 222,608, 285,472 300,465Las Animas 549,110 300.620 108.400 463,787’ 340,012. 680.027Otern ‘ 2,131.120. 1.427,900 1,660,840 2.310,416 2.207,845, 2,004,550Prowers ,,100,650 816,070 789,070 1.827.8001 1,529,184 1,601,107Pueblo
,0’920 1,221,050, 1.550.640! 2.272.871! 1.673,403, 2060,057
tTotal Southeast DFst.. $ 8,653.100 $ 6.318,030 6 7,087.160, $ 11.467.343 S 9.714.177 512.279,091
State Total ‘ $ 00,161,600, 5 33,341,000 $ 63.311.0501 $ 98,026,906 $ 77,697,218 $ 85,581,958
Slndleates approximate location of District for which Counties are given above.

11 AGRICULTURAL STATISTiCS
RECEIPTS FROM THE SALE OF PRINCIPAL FARM PRODUCTS AND GOVERNMENT
PAYMENTS—l929-1938 (Thousand Dollars)
PRINCIPAL CROPS
MONTH 1929 1931 1911 1932 1933 1914 1935 1916 1937 1938
Jan. 5,07& 4252’ 3,84& 1,076’ 713 2,282 809 1,515’ 3,512! 1,829
Feb. 1,196 3,671! 2,832! 968 526 1,627 746 1,519 2,993 1,285
Mar. 2,897 3,579’ 2,611’ 847 532 1,131 1,060 1,378 3,375 1,491
Apr. 1,961’ 2,944’ 2,265 516 579 672 566 1,532 2,554 1,092
May 5,692 3,584’ 1,432! 419 486 688 726 916 1,991 762
June 1,743 1,596 976 435’ 599 626 422 662 1,156 769
July 3,681 3,967 2,206! 566 1,466 1,112 1,072 2,653’ 3,551 2,855
Aug 1126 6768 359 198 2916 ISo] °83 43, 06 413
Sept. 9,45& 8,608 3,245 1,817! 1,475 3,278 3,067 4,995 5,352 3,977
Oct. 15,028’ 26,712. 9,077 5,810 7,605 5,419 7,282 10,004 8,578 6,919
Nov. 8,808 10,652’ 5,596’ 3,053! .5,503 5,285 8,147 6,597. .5,266Dcc. 9,320 10,0121 5,272 2,084 5,274 1,303 4,401 0,627 4,975
Total ! 75,120! 74,365! 42,705 20,406, 29,702 27,321 29,146, 42,743 19., 660
LIVESTOCK AND LIVESTOCK PRODUCTS
lap, 7,862 8,404 5,053 3,250’ 2,710’ 2,651 4,202’ 5,400 5,325 5,962
Id Cal 439 9 3], 9 9 39) lj g]7]]F 6101 Cal
Slor. ‘ 11,530 10,525 7,010 4,050 3,35] 4,760 5,742 0,205 lObS ,,o2,
1261, 10a36 826] 4 Dl 6 is 6500 8,9 Oo’S 6 ])
May 10,200 7,564 6,156 5,454 1,649 4.255 4,620 1,900 6,097 4,77]
J,,i’o 6,481 5,266 4,233 2,341’ 2,508 5,022 2,037 4,608 5,065 5,350
July 6,051 3,653 3,812 2,62F 2,502 3,031 2,810 4,226’ 4,100’ 5,552Aug 5(86 53(0 3,1 266 2 aS 30,] 527 1 16 a73 44,0Sept. 7,904 6,147 5,047 4,025 5,485 4,701 5,000’ 7,551’ b0,14& 7,617
Oct. 14,619, 0,170, 7,208 6,105 5,111 6,967 10,227, 0,026, 10,543: 10,100Nov. 12,100 7,505 7,400 4,065’ 4,492 4,773 7,723 7,777’ 5,533’Dec. 7,671 5,631 3,091 2,266 2,716 7,216 5,005, 5.502; 6,746!
Total ....‘ 110.115 85,821 66.823 43.872 39.400 49,781 64.977 75,948 90,907
GOVERNMENT PAYMENTS
Jan. J ‘ 573 1,005’ 4’ 446 515Feb. 180! 055 —2’ 701 206Mar. I ‘
.. 112 00’] 221 1,270 575Apr.
‘
‘ ‘46 1,526 506, 1,002 1,002
May i 21 53 501’ 562 520
Jone ‘‘
-22 065 625 510 1,020
July ———-‘ ioo 259 104 163 3,106
Aug. ‘, .16 701’ l6s 121 62 901
Sept. F.‘ 120 627’ 806’ 53 61 26
Oct. , 1] 2,055 1,057 315 101 117
No _F ____‘ 1,902 2,672 577 75D 267 0,157’ 013 1,590 201
Total ....‘ _H ‘ 417 8,019 51,708 4,664 5,147
CROPS, LIVESTOCK, AND LIVESTOCK PRODCC’t’S AND GOVERN5IENT PAV5IENTS
Jan. 12,558! 12,656 ,7531 4,575 3,432 5,059, 6,000 7,005 9,287 8,106
Fch, 11,850’ 11,089 4,502’ 5,300 5,199, 0,415 7,561, 9,875 6,624
Ma”. 14,227’ 14,104 9,621 9,697 5,006 6,500 7,700 9,907 14,765 9,501
Apr... 14,606 11,482’ 10,529 5,297’ 4,201 6,610 0,656 9,997 11,665 6,012
Slay . 11,092’ 9,568 7,788 5,951 4,115 4,961 5,066 6,186 9,250 6,052
6,224
6,605 5,211 2,776 2,997 5,600 4,046 0,292, 7,651 5,139‘ 0,712 7.626, o,oioF 2,189 2,066 4,560 4,151 7,105’ 8,034 9,616
A,,s’. ‘ 16,742! 10,117, 7,26& 4,4611 5,500 6,821 6,100 0,020 12,183 0,002Sri’]. ‘ 17,357’ 14,753 8,2921 5,846’ 7,070 8,606 9,805 12,507’ 15,560 11,882Dcl... ‘ 29,047 25,8011 10,285’ 12,025 12,732 14,141! 10,500, 55,3.]5F 19,225 17,266N ‘ 20,906’ 18,248 13,0651 7,157. 9,055 10,05.]: 16,742. 14,947’ 14,077Dc,’ F 17,632
15.003i9,181! 5,250’ 8,257 7,080 21,222 11,114. 11,92°
‘iota! ; 185,235: 160,196 109,528j 64,278’ 69,149 85,141 105,911 123.317: 145,723
I’KR CENT OF YEARLY EECEIPTS RECEIVED EACI1 SIONTH (COMPUTED FROMABOVE TADLR
Jan. ‘ 7.0’ 16.9 8.079I 40! 75
57!6.7! 6.11
Feb. F 6.4, 15.9, 6.9 6.71 4.0 6.l 6.0 6.3! 6.81
Mar. ‘ 7.71 27.0! 0.0 8.8 1.6, 7.6 7.3 0.0 10.1
Apr. 7.9 17.4, 9.6, 0.2 6.1! 7.6, 8.4, 8.1 0.&May 6.4, 15.0 7.1 6.1 5.0 5.8 5.3’ 5.2 6.3
June ‘ 4.4 4.2 4.7 4.3 4.3 4,4 3,9 5.] 53July ] 53! 4.6 5.5, 5.0, 5.7’ s.i ,o 5.5Aug. 9.0’ 6.3’ 6.6 6.0’ 7.2 8.0 6.1: 7.3 8.’]Sept. 9.4’ 0.2 7.6 9.1’ 10.2 10.1, os! 10.2 10.7Oct. F 10.0, 16.2 14.5 18.7, 18.1 17.0! 15.6 11.2,Nov. 11.3 11.1; 11.9: 3sf 14.11 91.61 15.5! 12.0, 10.2,Dec, 0.2 0.9 0.4 8.1 11.9 0.6 19.6’ 10.0 8.1’

STATE OF COLORADO
NUMBER OF FARMS—FEDERAL CENSUS JAN. 1. 1935
15
COUNTY
ChaffeeClear CreekEagleGilpinGrandGunnisonJacksonLakeMotfatParkFitkinRio BlancoRouttSummitToiler
Total Northwest Distrirt
BoulderJefferson1.arimrrLoganMorganScdgwirkWeld
*Tstsl N. Central and N.E. District
ArchuletaDeltaDoloresGarfieldHinsdaleLa PlataMesaMontezumaMontroseOuraySan JuanSan Miguel
*Total IV. Central and S.IV. District
AlamosaConejosCostillaMineralRio GrandeSaguache
5Tothl S. Central District
DacaBentCrowleyCusterFrensuntHuerfanoLas AnlinasOteroProwersPueblo
°Total Southeast District
State Total
62,522 17,97817,082 2,652
161,689 31,13016,322 1,167
200,342 23,519372,417 10,818298,129 44,421
16,247 3,952570,724 92,477442,171 69,98168,107 12,148
373,138 11,773442,139 114,36831,139 2,597
103,122 54,220
3,192,570 547,669
118,771 79,699191,997 64,213313,618 177,55-1628,158 370,793445,189 211,020166,369 137,632
1,226,533 7-18,273
3,310,685 1,789,184
337,119 209,132312,133 161,310350,957 161,167
2,383 1,23125-1,779 117,473096,579 337,07-1569,373 - 368,271262,146 148,818333,383 447,992773,570 457,139228,097 194,443810,126 464,014898,727 181,609
6,030,365 3,552,999
137,752 31,403160,778 57,39070,007 14,131
29-1,211 85,708D,238 320
229,760 98,813330,071 55,156153,906 67,940272,332 71,339123,030 18,549
201,358 25,716
2,028,469 529,674
201,222 66,871278,471 39,836382,204 103,26743,414 5,919
128,437 73,417405,367 81,0-12
1,442,178 376,852
780,919 415,044361,426 120,971191,718 07,509163,701 63,710307,401 46,826494,329 84,675
1,490,030 349,16517,525 90,098331,569 231,053818,718 187,461
5,470,342 1,687,485
21,494,609 8,483,863
Number of Farms Jan. 1, 1935 Acres in FarmaTotal Operated By: Tenant Operated by:
Nunsbei Farmers Owners -
of Full Part % of PartFarms Owners Owners Total Owners Tenants
Managers
Man- Tenon 1*ager
324 210 10 3 95 29,341 21 6 14 34.1
393 240 47 7 99 25.243 20 14 2 0 20.0
290 168 06 10 52 17.6524 412 55 0 51 9.7244 130 08 7 3-I 13.9
39 25 4 3 7 17.9824 484 174 1 165 20.0483 309 79 -1 91 18.0200 151 16 39 10.0432 279 71 8 72 10.7
1,09-1 593 502 11 100 28.061 43 10 1 7 10.9
205 123 40 3 97 30.0
5,274 3,217 814 75 1,138 21.6
1,105 776 152 11 106 37.02,048 1,298 191 19 510 20.42,0-17 88-1 216 37 910 1-1.31,929 405 ‘108 17 2,049 5.11,612 481 - 139 3 707 48.0
646 119 - 118 2 377 58.45,546 1,681 740 21 7,101 33.9
15,333 5,647 2,244 112 7,330 47.8
Adams 2,088 972 300 16 800 38.3Arapahoc 3,335 773 189 20 133 36.0Cheyenne 671 196 171 4 200 4-1.7Denver 279 183 17 14 45 10.1Douglas 474 199 - 72 0 ‘ 194 40.9Elbert 1,290 422 - 300 12 - 302 13.-IEl Paso 1,453 138 281 17 597 41.1Kiowa 617 213 136 1 267 -12.3Kit Carson 3,730 100 501 6 ‘17 33.0Lincoln 1,268 314 I 396 8 310 43.4Phillips 876 172 228 2 471 54.11%rashington 1,891 414 - 000 it 882 46.9Yuma 2,176 579 610 14 973 41.7
Total F. Central District ‘ 16,157 5,301 3,801 134 7,121 43.5
291 234 26 5 100 27.11,009 3,110 139 7 014 22.1
257 107 34 _ 50 21.81,108 601 315 10 322 29.1
42 39 2 1 2.45,245 691 99 10 443 35.72,823 1,810 207 21 698 21.71,358 538 122 3 370 35,41,474 711 173 6 384 19.0
229 100 18 3 48 21.0
343 248 23 3 69 20.1
10,868 6,423 1.058 69 3,318 50.5
499 202 76 1 209 -12.61,051 541 245 3 204 25.1
574 259 92 4 219 38.149 27 9 2 11 22.4
737 332 78 4 123 11.8097 197 79 19 202 29.0
3,600 1,758 579 35 1,228 34,5
1,805 511 463 7 794 44,9899 343 1-11 1 114 46.1606 118 127 4 137 53.0407 229 41 117 33.7
1,311 819 179 11 302 23.0851 509 121 0 215 25.3
1,900 921 384 7 578 30.-I1,372 570 160 0 030 41.01,472 460 252 0 755 51.31,589 820 211 9 543 34.2
12,212 5,372 2,079 56 4,705 38.5
63,644 27,718 10,605 481 2-1,840 39.0
Clndicates approximate location of District for which Counties are given above.

16 AI1I7ICUL’I’URXL SVATISTILS
FARM ACREAGE AND VALUE—FEDLEAL CENSUS JAN, 1, 1915
Crop LandFarm S aloes Land •n 1534All Land
______________________
Available
_____________
COIINTY in Value of Averae Value furFarms Farms
_________________
Crnpsi Harvested FailureAcres (Land & Per Per Acres Acres Acres
__________________________________
Buildings) Fann Acre
___________ ____________________
Chalice 80,500 $ 1,975,085 $ 0,108 $21.58 22,515 11,087 2,450Clear Creek 19,734 335,155 8,272 17.19 1,572 883 147Eagle 153,125 3,478,590 8,832 1801 33,811 25,795 3,272(lilpin 19,485 144,540 3,221 7.41 2,048 1,371 234Grand 232,801 2,483,332 8,350 10.86 41,036 26,130 2,703Gunnisan 391,275 4,352,028 8,305 11.12 61,084 50,707 3,475Jackson 342,550 2,011,935 11,046 8.50 94,703 67,069 6,650Take 20,119 222,540 5,716 11.00 5,052 3,636 320Sloliat 664,201 3,222,390 3,911 4.85 79,703 31,232 20,383lark -- . 512,552 3,453,005 7,229 6.81 55,078 11.423 7,584111km —— —. 80,855 1,394,595 0,769 17.29 18,248 17,522 1,027lii,, llliiiirii - I 429,033 3,721,823 8,038 8.68 52,597 37,521 8,365ltaiitt 506,927 5,150,911 4,950 5.80 117,010 71,506 10,099Summit - 58,130 490,505 7,070 12.07 0,035 8,335 149‘Teller -- .. 157,742 840,377 1,171 5.33 17,375 8,103 4,353
‘l’oi:il Nnrlhwest fist. 3,740,239 $ 34,545,805 $6,559 59.24 611,607 425,537 72,408
lliislilcr 218,470 $ 11,788,655 $ 7,833 $53.96 , 103,704 82,007 9,277
256,210
. 16,110,203 7,866 62.80 69,247 56,12-1 5,717I.aririi,’r 091,202 ‘ 17,557,385 8,597 25.46 190,751 131,580 28,287Logan 598,551 11,861,012 8,275 15.90 759,915 295,087 215,554Olargan 656,200 13,770,724 8,516 20.59 711,700 I 127,830 112,594Seduwiek ‘ 304,001 7,283,926 32,20-1 [ 25.93 210,303 166,180 55,505Weld 1,974,826 ‘ 47,930,431 ‘ 8,644 24,27 0.125,503 400,147 287,001
eTetal N. Central andN. E. District 5,099,869 $131,056,940 $8,547 ‘ $25.70 :l,371,042 1,182,861 718,795
Adams 546,251 $ 10,264,605 $ 0,141 $24.17 432,616 luO,343 127,161Arapahee 473,749 12,173,820 0,12626.33 323,111 67,094 77,187Cheyenne 512,424 2,22 1,507 5,259 6.62 342,372 46,543 91,507Denver 3,031 1,053,695 7,603 537.62 3,246 1,339 1,557Douglas 372,243 4,591,992 0,69i 12.31 90,892 11,717 9,772Elbert 1,033,853 6,022,028 5,311 6.70 415,000 102,933 103,509El Paso 937,814 10,401,114 7,220 11.19 322,302 50,853 70,743Kiowa 411,264 3,565,508 5,011 8.72 253,667 24,199 72,049Kit Carson 1,001,577 8,260,026 4,773 8.25 712,729 91,262 318,001Lincoln 1,230,709 1,104,515 7,188 7.41 749,362 69,547 150,106Phillips 422,540 7,160,036 8,517 17,66 327,675 115,360 113,254Washington 1,271,146 11,613,210 6,132 9.11 860,037 102,453 365,738Yuma 1,383,236 14,252,631 6,550 10.30 637,516 223,822 257,829
eTetat E. Central Dist. 0,603364 $167,482,179 $6,571 $11.19 5,435,836 1,112,353 1,759,083
Archuleta 172,155 $ 2,422,315 $ 3,630 $ 6,26 27,058 15,701 3,474Delta 224,368 7,129,501 3,756 31.78 68,337 49,766 8,086Dolores 00,201 557,503 2,170 6.18 22,062 9,288 6,901Garfield 0,919 6,147,614 2,548 16.18 71,303 42,585 16,353Hinsdsle 21,508 267,700 6,374 12.42 3,601 3,232 357La Plata 328,579 4,804,762 3,809 14.62 80,019 41 816 14 334Mesa 405,227 12,776,362 4,526 31.52 101,064 74,763 7:001Monkeouma 221,912 3,218,530 3,137 14.05 73,645 47,411 0,230Montrooe 044,671 6,309,074 4,281 18.31 77,626 64,250 3,022Qoray 142,170 1,464,005 6,481 10.42 19,124 33,021 429San JuanSan SliguoI 227,074 3,575,245 3,426 0.18 25,533 0,393 1,719
Tetsl W. Central and -
S. SI’. District 9,53g,543 $ 45,302,691 S 4,177 $17.71 569,875 574,627 71.726
Atamosa 5,605 S 4,270,703 ‘ 5 8,716 $15.75 , 72,806 52,871 8,611Conejoo 318,310 7,619,124 6,666 22.25 115,964 66,961 22,062Costilla 407,531 3,011,727 5,247 . 6.18 30,361 28,964 2,0652liaeral 49,333 546,255 I 11,160 11.11 3,031 2.003 255Rio Grande 201,854 0,025,616 13,468 49.17 , 166,841 61,200 17,059Sagoache __22±60 6,384,060 9,132 12.97 ‘ 94,231 ‘‘74,281 9,44-1
eTetal S. Central Diot. 1,819,010 $ 31,140,565 $8,650 $17.12 431,317 308,270 59,734
Dora 1,156,163 $ 9,824,167 $ 5,448 $ 6.22 855,270 , 105,002 360,445Dent 401,399 2,337,751 7,659 j 16.60 164,301 47,630 38,601Crowley 299,227 1,406,060 7,274 15.2-1 72,062 6,831 27,174Custer 227,414 2,242,103 . 5,569 0.06 44,234 I 21,432 ‘ 16,7581 iemont 3 1 7 i J 4 1.) 3 6 1 01 1 1 10 Os a 04
Huerfano 576,004 5,565,501 4,225 6.21 67,253 39,591 14,611Lao Anin,as 3,847,686 0,447,060 4,446 4.57 220,350 29219 L 67 012tltero ill 169 69 1a4 9 i1 1 J O39)
Proovero - 505,622 0,095,203 6,722 17.40 272,787 76.560 114201Pueblo J91 64162 16.06 186,963 50,627 19:061
‘Tetal Seutheast Diot. 7,127,827 $9.66 2,028,159 418,286 767,406
State Tstal 29,978,472 $118,757,555 $ 6,580 $sTh 11,647,636 3,852,748 5,389,152
‘Harvested, failure, idle, fallow in 1034, plus plowtand pasture.
‘Indicates approximate location of District for which Countiea are given above.

STATE OF’ COLO1IADO
NUMBER OF FARMS BY SIZE GROUPS, 1935 CENSUS
17
10 AcresCOUNTY
ChatfeeClear CreekEagleGilpinGrandGunnisonJacksonLakeMoffatParkPitkinRio BlancoRouttSummitTeller
5TotaI Northwest fist.
39 227 32 4
_ii8 3
O28 3
5 18 17 18 19
_i ——
137 74
293 155812 315285 189
43 23-II 21
8 8160 111
1,659 898
404 274554 169
211 -
7 311 465 39
11 98 73 7
11 520 18
1,312 567
6 8175 187
60
36 311-18 553
51 1081 16
2 2
2 5
764 915
36 968 9117 72
29 —
28 9
219 210
Baca 10 6Bent 18 15Crowley 24 18Custer 8 6Fremont 499 176Ruerfano 27 20Las Animas 83 62Otero 140 134Prowers 12 17Pueblo 224 178
STotal Southeast POst. 1,085 638
State Total 5,196 3,362
21 31 71 41 60 224 6 5 1 7 55 21 110 42 88 731 2 10 5 13 10
18 8 41 11 64 7613 24 104 46 104 124
3 1 15 9 10 742 6 2 4 138 35 54 27 214 2919 13 61 16 85 369
11 14 41 25 50 136 11 57 20 107 114
31 44 229 100 310 2202 31 6 18 18
9 ii 49 22 68 47
142 223 864 390 1,292 1,317
371 263 329 303 130 38242 131 151 53 118 82224 381 486 149 202 197
30 325 400 153 687 57049 225 391 157 588 219
9 55 365 42 170 343222 1,035 3,735 159 1,019 494
953 2,131 3,635 1,116 2,614 1,183
231 200 309 301 380 176144 71 108 10 213 i 155
3 6 53 24 284 19014 6 3 2 317 17 54 35 135 12715 39 131 76 464 35008 83 137 100 453 335
8 72 22 256 1668 19 192 53 716 4934 15 309 39 486 379
13 20 137 48 376 20518 29 182 5:1 790 52028 46 216 118 529 192
557 539 1,703 690 5,325 3,685
19 43 147 19 68 36146 309 316 106 94 50
2 15 67 38 103 41146 157 224 106 163 121
2 6 15 17111 223 368 121 209 98715 434 334 106 156 119108 379 142 112 104 54259 362 351 fl5 111 87
11 23 52 22 37 40
11 21 68 16 90 72
6,927 1,858 2,275 753 1.230 747
12 39 173 25 124 45204 169 226 95 113 47371 307 80 43 23 7
4 21 2 10 343 49 261 81 375 4325 29 208 42 154 114
455 397 971 286 599 258
06 32 109 55 753 14534 91 226 74 241 11073 128 131 47 80 1236 23 74 35 108 91
347 60 99 44 88 13373 97 166 73 176 102
160 141 226 107 474 337244 315 257 65 91 54
67 341 335 124 4-14 2012:12 17s 179
: 1±__ _21
1.072 1,200 1,802 693 2,688 1,800
5,386 6,348 11,250 3,928 33,748 9,290
iOtolO 20to49 10to99 i006o
Acres Acres : Acres Acres
177 to 260 to 100 to 1,000299 499 999 and
Acres Acres Acres Over
BoulderJeffersonLarimerLoganMorganSedgwickWeld
oTatal N. Central & N.E. fist.
AdamsArapahoeCheyenneDenverDouglasElbertEl PasoEiowaKit CarsonLincolnPhillipsWashingtonTuma
5Total E. Central fist.
ArchuletaDeltaDoloresGarfieldHinsdaleLa PlataMesaMontezumaMontrosoOuraySan JuanSan Miguel
Total IV. Central & S.IV. Dist.
AlamosaConejosCostillaMineralRio GrandeSaguache
Total S. Central Dist.
9
40
07
98
13;
100101
37
815
46124172114
52111
8-il
307
191228183
83192241
67285298
1,959
29
40581852
53
399
294016
82488
205
281
4665
113330
138
1,234
5,476
Slndicates approximate location of Diatrict for which Counties are given above.

16 AGRICULTURAL STATISTICS
NUMBER OF FARMS REPORTING SPECIFIED CROPS HARVESTED DURING 1934(Federal Census, January 1, 1915)
NUMBER OF FARMS REPORTING
COUNTY Corn Oats Barley Wheat Sagar Potatoes Dry Alfalfa So
; Beets Beans ghunss
CisalfeeClear CreekEagleGilpinGrandGunnisonJacksonLakeMall’atlark
itkinlila lllanes__ —
huntSSanunit‘loller ._
Tatal NarlhwestI)islrirt
Ilualder -
left orsonlarlinerloganMorganSedgss’irk -.
WeldTotal N. Ccntral
and N. E. Diat_
AdanssArapahoeCheyenneDenverBouglasElbertEl laceKiowalOt CarsonLincolnPhillipsWashingtonYnnsa
STotal E. CentralDistrict
ArehuletaDeltaDoloresGarfieldHinsdaleLa l’lataMesa3Iu traansaislontruseOarav
San ,TaanSan Miguel
0’l’al aI W. Centraland S. W. Disi._
AlainosaCannesCnstillaMineralRio llra1uleSagaarhe --
Total S. CentralDistrict
BaeaBentCrowleyCusterFrensantHuerfanuLas Anins.OteroProwersPueblo
Tatal SontheastDistrict
State Total
109
86
1313
34105899
275a4
724
403211533291177
911,113
2,836
19919
1926
11
-1924ii
122
30206
162
235355193471
35
18
1,702
109200
35
16099
652
44
522066
102123
8447
110
a
130656312748677661390
1,968
5,795
512365159
268737117
64509305362664
1,116
6,212
‘16767108177
2501,526
407727
7
38
3,857
58
60
65250
922
374262261372242513
2,370
18,424
14
24
09
188I
11196
379441172736603563166
2,271
5,014
319113
45
414113
131132126
1,13-1
126
134133
63113
14
26
699
129238166
18748
770
22236
41168011
279300
17
31436
7293266761-12
2,753
5,261
37233
32
52
489
266
110
115
164
693
4112
2
42
61
11611
41014
392384395
120
96
13
96
59110291
2
802
720416015357210380
2,043
5,281
551307
32
142202
206
219672
3,270
47447
340
463308370763
65
30
3,241
107428359
29418
1,373
10021
4659
313131217305158
1,447
15,416
06
20828
112176
37
400215
12263608
33303
2,4353176
10410612076
1,356
1,077
24
52
1725293377
343
8855
57613
408824409762
93
101
4,001
248522
68
264
1,660
1006432
4
1 161
183
1472
10 34
9020734
8
11 1,4296 893
10 95987 1,066
100 142374 738
9 1611,766 2,86i
2,363 7,140244 656137 118
6 6
05 197603 114558 111
17
96 252 3
78 6418 66
1,935 3,788
7 12727 1,25077 713 762
450 718
473 1,780230 538110 1,110
82
16 89
1,003 6,4767 311
149 336243 242
2 297
_________
165
401 1,3507 32
28 4377 2381 43
61 107172 305186 288273 060
13 614130 651
902 4,0096,615 22,282
1
11
171580
205608302250910
2,469
287126315
7-I38015529015520152565n
1,397
5,059
3246
02133
9827
11
387
459102
18123832
38177
377123
1,419
9,351
547 1,121
6,913 9,197
— *Indieatea approximate location of District for which Ceunties are given above.
1,446 2027,952 10,518

STATE OF COLORADO 19
NUMBER OF FARMS REPORTING SPECIFIED CLASSES OF LIVESTOCK ON RAND
(Federal Census, January 3, 1135)
NUMBER OF FARMS REPORTING
Horses,Mules,or Both
Chaffee 237 229 25Clear Creek 32 26 1Eagle 115 342 72Gilpin 18 39 1Grand 229 255 47Gunnison 333 341 101Jackson 192 195 58Lake 31 33 11Moffat 819 891 161Park 339 332 37Pitkin 141 111 55Rio Blanru 247 382 118Routt 813 879 227Summit 51 80 3Teller 218 211 6
*Total Northwest District.. 3,912 4,160 927
Boulder 3,1153 915 93Jefferson 1,159 990 39Larimer 3,656 1,129 334Logan 1,682 1,577 85Morgan 1,464 1,416 18-1Sedgwiek 813 497 21Weld 4,729 4,588 165
*Total N. Central and N.E. Distrct 12,369 11,412 1,297
Adams 1,295 1,134 59Arapahoe 922 782 41Cheyenne 598 580 61DenverDouglas 123 422 30Elbert 1,123 1,113 50El Paso 1.249 1,197 46Kiowa 562 532 20Kit Carson 1,513 1,380 73Lincoln 1,061 1001 61Phillips 722 640 51Washingtois 1,610 i 1,163 179Tuma 1.079 1,917 100
°Total East Central Dist._, 13,062 12,484 776
Archuicla 256 315 88Belta 3,450 1,341 104Dolores 202 209 22Garfield $11 I 859 380Hinsdale , 39 19La Plata I 3,018 3,050 228Men’s 2,010 1,009 200Montezuma 956 855 174Montrose 1,197 1,182 246Ouray 151 151 37San JuanSan Miguel 203 231 52
Total West Central andSouthwest Distrirt 8,203 8,202 1,410
Alamosa 422 405 102Conejos 780 846 201Costilla 175 479 101Mineral 20 19 31Rio Grande 011 604 390Saguazhe 460 450 167
5Total South Central Dist. 2,694 2.831 072
Baca 1.466 , 1,170 10Dent 752 777 liiCrowley 404 408 16
Custer 325 311 29Fremont 815 720 19Huerfano 058 720 III
Las Animas 1585 1,653 160Otero 1,072 1,113 85Prowers . 1.290 1.236 301
Pueblo 1,200 1,211 69
*Total Southeast Diatrict_* 0,660 9,471 709
State Total 40,887 18,650 6.090
COUNTYCattle, Sheep,Calves, Lambs, Hogs Chickensor Both or Both
TurkeysCows
Milk cr1in 1934
101 248 102 2082 21 3 30
189 290 114 1005 31 1 33
55 207 59 210109 208 40 316
49 141 22 1723 31 2 28
204 580 117 51877 243 48 30503 114 01 129
129 315 70 310443 774 253 774
20 38 0 5000 157 33 103
________
1,599 3,469 954 3,630
482 1,302 305 1,152390 1,550 317 3,097724 3,725 1.18 1,537
1,202 1,671 388 1,641948 1,465 370 1,442431 513 115 526
_______
2,483 4,908 1,511 4.588
________
6,660 13,163 3.611 11,080
748 1,755 458 1,210455 1,302 209 809372 385 313 569
211 417 141 380790 1,002 351 1,071714 1,211 314 1,190322 588 230 541
2,139 3,167 100 1,490750 1,035 390 1,020578 712 170 710
1,233 1,002 459 1.5721.581 1,010 567 1,921
8,916 13,697 4,072 12,591
179 313 97 250801 1,502 407 1,425101 191 21 175409 817 211 802
2 19 1 19510 1,060 101 0(12
1,049 2,140 482 1,070409 851 271 776703 1,100 479 1,118
88 145 46 141
________
86 212 11 100
________
4,575 8,475 2,492 7,901
201 ‘127 105 402084 827 245 704194 450 72 319
20
7 20400 021 284 580
__________
215 421 101 410
_______
1.854 - 2.775 06 2.461
911 1,493 209 1,462386 788 343 710279 547 216 457171 300 00 290410 1,028 245 720186 742 191 551704 1,820 351 1,377808 1,183 482 1,080784 1.201 025 1,219740 1.197 410 - 1,166
5,482 00,387 1,189 9,01329,094 51.966 15,267 47,605
*7ndtcats approximate location of District for which Counties are given above.

20 AGRICULTURAL STATISTICS
Chalice —
Clear CreekEagle 10 18GilpinGrandGunnisonJacksonLake I
Moffat 750 10ParkPitkinRio lllai,eu 60 21ltosittSummitloller
‘Total North —
semi Di%t.___ 820 16.4lluuld,r 9,010 30,lrII,r,ns 5,0201 40l,ariini’r 10,100 10I.ogau 12,130 25Morgan 17,280 20Scdgwielr 2,750 42Weld 36,110. 27
Tatal N. Cmteal and N.E. fist. 93,320 29.2
Adams 5,740 31Arapahoc 1,670; 33ClsryenneDenverDouglasElbertEl Paso 1,460 22KiowaKit CarsonLincolnPhillipsWashington 1,150; 10Yuma 450, 20
tTotal F. Central Dist.____ 19,470! 29.5
Archuleta 180 23Delta 8,840 41DoloresGarfield 2,620 30RinsdaleLa Plata 1,400; 25Mesa 8,710 31Montecuma 2,330 20Montrose 7,140 56Ouray 90 20San JuanSan Miguel 60 22
‘Total W. Central and
5•
W. fist. 31,420; 33.4Alasnosa IConejos 60 25Coatilla 490 22MineralRio Grande 120 27Saguachc
Total S. Central Dist._ 670 21.2
Dara 100 22Dent 2,960 25Crowlcy 5,650 21Custer 230 12Fremunt 3,310 22l4uerfano 450 20Las Animas 870 27Otero 5,600 20Prowers 4,420 17pueblo 6,730 27
°Talal Southeastfist. 30,360 24,0
Stata Tatal____ 167,060 29.0
ti
13,440 1,130 10.9271,500 5,480 8236,800 2,710 9303,000! 6,170 10303,250 83,090 4517,800 32,900 3115,500’ 27,460 2974,0701 61,030 4
2,722,820 219,140 3.9177,9401 30,500 —g---—
05,110 28,800 7
!
16,220 4
17,230
8
52,210
432,120 43,180 4
0,140
2
70,370
2
43,630
31 63,020 6
34,500! 129,010 30,0001 142,480 5
308.6701 654,020 4.24,140’ 730 it
351,600! 440 9I 2,830 1178,600 400 8
06,200 3,050 12276,010 240 10
40,000 3,260 12257,040 180, 8
1,800
1,2201 200 10
1,019,360 9,430’ 11.1
1,50010,7801
1,240
15,520
2,800 900, 174,000 1,100 2
118,650 90 22,760 1,560 2
72,820 200 39,000 2,110 7
23,490 2,560 7108,500 48Q 275,1401 1,470 2
181,710, 5,090 4
728,730 13,780; 4.14,818,540 898,300 4.2
2,750,9208,0301,560
31,11012,200’
12,720,2,4001
19,120’1,440
2.0SF
180 $
23,910
1,590
25,750
115,140201,150357,700615,010816,500170,420
1,210,050
CORN—ALL PUEEOSES—1937
! IRRIGATED NON-IRRIGATED TOTAL
COUNTY Acres Acres AcresHar- Av. Prod. Har- Av. Bushels
‘ Har- Prod. ValueI vested Yield Bushels vested Yield I 1”°4’lvestcd ; Bushels
180
12,000
1,260
1,090
40
126
17,952
1,138
$ 19,256
5 214,431177,639230,005-110,507413,055114.180816,790
10-
11,990 1,840!
---oI
12,310 1,950
_______ __________
41,8401 11,51024,200 0,83061,700 18,570
332,380: 05,220’98,700’ 50,160’54,520 18,210
214,120! 97,140
___________ ___________
861.020 312,460 3,585,850 $2,394,574197,500 45,240 175,440’ 5 244,038201,600 30,470! 256,7i0 166,882
64,880 16,220 64,880 43,170
137,040 17,210 137,840 96,488208,840 52,210! 208,840 1-10,188172,7201 44,6401 204,840 141,388
18,200, 9,1401 18,280 12,413140,740 70,570, 140,715 92,888130,800 43,620: 110,890 85,078378,120 62,8201 378,120 255,340387,120 sso,ooo! 421,020 274,051712,4001 142,9301 721,400 468.910
665,2801 3,058,600
_________
910 12,1709,280 357,5602,010 11,1302,020 81,800
2,510 48,0708,950 272,4105,590 85,7207,120 250,489,
90 1,800,
__________
150, 4,220
____________________
40.850; 1,154,260! $ 790,510
____oI igoo90i 10,780; 7,540
1291 3,240 2.300
670 15,520 $ 10,9261,120 3,850 5 2,8884,110 70,100 52,4105,740 118,810 83,1601,799 5,880 4,1163,610 73,720 53,0782,500 23,770, 15,9201,430 41,410; 28,0876,070; 169,2201 120,1465,8901 78,080 50,2189,820; 191,070 135,819
44,140; 785,130 $ 553,7991,065,360; 8,626,110 85,797,196
$2,027,031
5 8,519215,565
22,41157,260
34,270385,233
64,290175,763
1,224
2,95
104,990
9902,500
1803,320
00014,77017,820
9202,043
601
56,100;
3,787,570;
‘Indicates approximate location of District for which Counties are given above.

Chaffee-Clear CreekEagleGilpinGrand ‘
Gunnison 10 25JacksonLakeMoffat 150 35ParkPitkin I
Rio Blaneo I 55, 35Routt 300 37Summit oc! 26‘feller
Total North-:weat Dist.J 540, 35.4
Boulder 10,580 35JeIferaon 6,020 37Larimer 5,030 30Logan 1,150 20Morgan 560, 25Sedgwick I 59 3Weld I 22,720 26
5Totsl N. CenJtral and N.E. Blat. , 47,410 29.7
Adama 8,960 30Arapahoe 1,110 32CheyenneDenverDouglas 100 37ElbertRI Paso 100 25Kiowa I
Kit Carson ‘
LincolnPhillips I
Washington ..._.J 485 30Yoma 000 13
5TotaI E. Cen-,tral Diat._r 10,880 30.1
Arehuleta 50 25Delta 620 27Dolores 30 29Garfield 430: 25KinsdaleLa Plata 5,570; 30Mesa 2,060, 27Montezuma 100 31Montrose 3,020 27Ooray
‘ 70; 22San JuanSan Miguel 110 28
Tetal W. Central and S.W. Blat. 12,060 29.3
AlamosaConejos ICostilla 150 27MineralRio GrandeSsguaehe :
eTotal S. Cen-!tral Bist.._J 150 27.0
Baza 170 15Bent 4,780; 27Crowley 250 25Coster 410 27Fremont 190, 30Huerfano ‘ 620 30Las Animas ‘
430 30Otero 2,620, 30Prowers 10,040 26Pueblo 1,630 30
Tetsl SoutheastDial. 20.720; 27.1
Slate Total...._. 91,760; 29.0
50;
25
I 250 25250 20’ 21
m:o I:go iEo
1,750 2,740 1511,100 9,680 27
780
19,110 t9,280 22.5370,300 13,940 18222,740, 10,760 23177,900; 14,720 1823,000 90,760: 924,000, 11,660 6
1,500’ 29,670 9590,720 67,510 11
1,410,160 246,020’ 11.0268,800! 67,400 1436.480: 32,110 14
3,700 12,150 22
13,630
ii2,500’ 1,420: 10
22,730
9
8,570
4
62,480:
814,400 65,260, 8
1,300 105,080 13
127,180 392,970, 11.41,210 160, 17
16,740 so: 20870 3,780 18
10,750 490 1
167,100 1,220 1819,620 150 13
3,100 4,060 2081,540 720, 201,140 280[ 20
3,080 31O 21
341,590 11,160 18.5
4,010
4,0502,110
129,0606,250
11,07011,70018,60012,90060,600
261,04048,300
562,0702,664,190
$ 427,607
$ 3,924
$ 1,524
$ 3,106110,094
6,06212,37411,68828,67313,79162,226
217,44781,820
$ 610,24519.899,127
STATE 01” COLORADO 21
WINTER WUEAT—1937
IRRIGATED NON-IRRIGATED TOTALCOUNTY Acres ‘Acres Acres
Har- Av. Prod. Mar- , Av. ; Prod.‘ Har- Prod. Value
- vested Yield Bushels vested ; Yield Bushels vested Bushels
1.210! 10, 1,210 $ 1,000
6,230 250 6,250! 5,312420’ 30 670 603
124,260 6,690, 129,110 102,313
41,100 2,190 42,850 34,280261,360, 9,980 272,460 226,142
30;
780 662
414,640! 19,020! 451,770, $ 370,113210,920: 24,120 621.220’ $ 590,159247,480’ 16,780 470,220 446,709264,966! 20,610 442,860’ 425,146816,840’ 9t,910; 839,810 789,490111,960, 19,620, 101,960 129,162148150! 29,720’ 149,810 143,856877,630, 90,200, 1,468,350, 1,409,616
2,718,140’ 293,430 4,128,300! 63,934,098913.6001 76,360! 1,212,400! si.’oo.osu450,100 33,290, 486,580! 497,385
267,000: 12,210, 271,000, 254,740149,930! 13,630 149,930’ 140,93134,200 3,920 36,700’ 14,865
204,170 22,710! 204,570 196,38734,280 8,570: 14,28o 02,223
499,840 62,480’ 499.840, 474,848122,080 61,740 936,480: 509,618
1,066,040 101,180’ 1,367,010’ 1,312,646
4.471,940 403,750 4,799,120 64,553,3401,700 110 2,950; 9 2,2121,000. 670’ 17,740: 14,724
68,040’ 3,810 68,sio; 62,3722450: 920 13,200’ 10,692
21,960 6,790 189,060 143,6881,900 2,210 57,570 48,934
81,200 4.160; 84,306 63,22914.400; 0,740 95,940 77,711
1,600 310 7,140 1,712
7,790 420 10,800 8,809
180, 40,630, 5
260’ 770, 9
1,370, 8160. 8710’ 5
5,210. 45,150’ 7
12.740! 5.9682,070, 11.6
206,050, 23,220, 547,640
1 110, 4,000
150
4,050720 390 0,270
8,150 6,410! 137,210
250
6,210.1,820 67F 12,890’
010; 460’ 12,01010,960 . 1,990, 29,160,
1,280 990 14,1803,110 2,700, 64,110
12,840 51.150! 271,88036,090, 6,760, 84,310
75,720’ 33,460 637,7907,906,490 773,830[ 10.570,670
5lndicatsa approximate location of District for which Counties are given above.

AtJSIICIJLTI7RAL STATiST li’S
SPRING WflEAT—1937
_____________
IRRIGATED NON-IRRIGATED TOTAL
COUNTY Acres Acres AcresHar- Av. Prod. Har- Av. Prod. Har- Prod. Value
vested Yield Boshels vested Yield Boshels vested Bushels
Chattee 990 23 21,770990 22,770 $ 20,493
Clear Creek .I :
Esgle I 1,770 32 56,640 91’ 22 1,080: 1,860’ 58,620, 50,990
Gilpin 20 17 310: 28! 110 III
Grand 4e 20 995 10’ 17 170 50 970 824
Gunnison I 80’ 31 2,480: 20 18 360! 100’ 2,840 2,499
Jackson I
Lake —_—. —
Mefiat 200 27 8,100 9,1201 18 o0,l6O: 3,420 84,260’ e2,691
Park — ——
,
Pitliin 000 26 15,600 130. 23 z,ooo! 730’ 18,460 16,060
Rio 11mw,’ . 139 21 11.750 1,316 20 26,300 1,765! 13,980
Moult 6,910 26 180,180 6,930 180,180 147,748
Snn,ii,it •,,,.... 30 33 990_
30 990 842
‘Seller 70, 21 3,470 70’ 1,470’ 1,323
‘I’OtLI N,,rtli— I
Writ Dint. .,.‘ 4,260 28.9 123,130 11,700 23.1 269,720; 15,960 392,830 $ 327,767
ttool,l,’r ..7,220 33 238,260 040: 12 6,480 ‘°! 244,740 232,503
Jeliers,,u .,. 4,110 14 151,140: 1,160: 16 18,560 5.670: 171,900 163,305
1,arinier .., 11,120 30 333,600’ 1,320’ 12 15,840, 12.440: 349,410 335,482
Logan j 2,058 39 38,950 54,060: 4 136,240’ 36,150 175,150, 164,679
Morgan ‘ 1,400 15 21,000 13,620, 3 10,860j 15,020; 61,860 58,767
Scilgsvjck 710 22 16,500 6.010 4 21,040 6,760 40,510 38,918
Veld 20,260 26 526.760 36,760 6 220,560 57,020 747,320 717,427
iTotal N. Con-! ,
tral and NJE. Dtst, 47,310 28.1 1,328.410: 97,470, 4.9 182,380! 140,780 1,790,990 81.711,061
Adam 0040 6 285 915 16150 112 980 95180: 318020, S 327 13
Arapahoe 1,810 25 45,250’ 8,730’ 10 87,305! 10,540; 132.SSOj 124,597
CheyenneDenver 1Douglas 1,020 14 14,280: 1,020 11,280: 13,561
Elbcrt , 13,950 7 °°! 13,950 97,650’ 91,791
El Paso - 70 15 1,070, 2,slO 5 14,250, 2,920: 15,300 14,681
Kiowa I 50 5 250i 50 250 24
Kit Carson ‘ ‘ 1,500 4 6,360! 1,590 6,360, 6,045
Lincoln ‘ 1.1,110 2 28,580, 14.190: 28,380 27,241
Phillips 20,510 1 61.530’ 20,510’ 61,530 58,4U
Wasliingtnn 150 25 3,750’ 37,980 3 101,910’ 34,130’ 105.690: 95,3-11
Yonsa 7,250 5 36,250! 7,250! 36,250: 34,801
°Total E. Cen-,tral Dist._j 11,070 21.8 285,080 120,260 4.7 561,170 531,330 846,260; $ 797,911
Archnleta 80 22 1,760 2,510 11 22,440 2,120’ 24,205! S 20,571
Delta j 0,120 26 366.920 110 18 1.080J 6,530 168.000! 146,91:,
Dolores ‘ 100 13 7,200i 400 7,200, 6,015
Garfield 7-160 22’’ 171,580’ 510 10 5,100 7,070- 176,680 151,911
Hinsdale ‘
La Plata 6,190 22 142,780’ 040 10 9,400 7.430 152,180 126,301
Mesa “.150 25 62,390 50. 9 450 2,200 62,800 54,00
Montezuma 5,700 20 114,000’ 1.010’ 18 18,180 6,710 132,180; 111,031
Montrose 8,850 25 222,250 280, 17 4,760 9,170 227,010, 188,411
Onray 1 1,130 22 24,860 150’ 10 1,500 1,280 26,360’ 21,611
San Juan I -
San Miguel 510 27 15,770 450 25 000 960! 22,7701 18,44’
“Total VI. Cen-!
‘
tral and S.VI. Dtst,., 78,820 23.7 920,270’ 5,940 11.3 80,010 44,770! 1,000,280 $ 845,13
Alamosa 5,070 17 - 86,190, 5,070’ 86,190 5 74,121
Conejos 3,580 23 82,340 3,580: 82,310 71,63’
Costtlla 5,520 21 122,220 ,.5,820’ 122,220 185,101
ilineral ,———
Rio Crende I 11,940 23 274,620 ; 11,040 274,620: 241,66’
Sagnache 3,460 17 58,820 ‘ 3,460 58,8201 51,171
°Total S. Central flist....,, 29,870 20.9 624.190! _
29,870 624,190, $ 543,70’
Bsra 1 ‘---
Bent 150’ 20 3,000’ - 150 3,0001 $ 2,82’
Crowley , 110 22 11,220 I 110 11,220’ 18,77
Custer - 435 17 7,310 480 4 1.920 810: 9,230 8.76’
Frepiont 260 16 ‘ 4,160 10 6 180 290 4,310 4,21
Hnerfsno 270 21 6,750 220 7 1,540. 490 8,290 7,75
Las Animas 235’ 26 5.550 125 4 ‘lSO: 355! 6,4851 6,00.
Otero 710’ 18 13,320 I 740 15,320 12,65
Prswers 70 25 1.750: ___7Oj 1,750. 1,62
Puebln , 370 18 ______.i°i 350, 7 2,450’ 720! 9,110 8,74
*Tstal Southeast’flint. I 3,030 19.9 60,130 1.200 5.3 6.170j 4.230! 66,720, 8 63.39
State Total : 134,370 24.9 3,341,240, 232,370 5.9 1,380,050’ 366,940! 4,721,290 54,289,17
ejndicatm approximate location of District for which Counties arc given above.

STATE OF COLORADO 27
Chaffee — 950 37Clear CreekEagle 1,300 55GilpinGrand 780 20Gunnison 420 23Jackson 201 23Lakell1offat I 733’ 30Park IPitkin 9101 32Rio Blanco I 1,130 37Routt 150 50Summit 60 48Teller I
5Total North-’west Dist._H 6,53K 45.3
Boulder 3,020 50Jefferson 2,560 49Larimer 5,020 48Logan 2,950 38r’korgan 2,020 40Sedgwiek 1,980 55Weld I 12,860 42
°Total N. Cen-1tral and N.P. 30,410 44.7
Adams 1,560 45Arapahoe 310 45Cheyenne ‘
DenverDouglas 20 44Elbert ‘
RI Paso 200 32KiowaKit CarsonLincoln IPhillipsWashington 270 42Tuma 50 35
5Total P. Central Dist.,.__ 2,490 43.4
Arehuleta 190 41Delta 3,600 40Dolores 20, 36Garfield 3,02K 40RinsdaleLa Plata 20501 40Ifiesa 2,520k 45Kontezuma 3,210; 42rvlontrose 5,320’ 39Duray 360 35San Juan I
San Miguel 080 42°Total IV. Cen
tral and S.W. Dist. . 2l.570 40.6
Alamosa 4,0301 56Conejos 1,540 40Costilla 1,320 39Elneral 60, 35Rio Grande 4,2101 37Oaguaehe 3j201 40
5Tntal S. Central 14,880 17.8
BaeaBent 200, 45Crowley 6501 46Custer 1,290’ 25t’remont 060 22Roerfano 870 42Las Animas 220 47Dtero 650, 45Prowers 1,370 47Pueblo __9l _L
eTetal SoutheastDist. 6.730, 37.6
State TotaL,,,, 82,0101 41.8
35,150
74,800 70 28
340
3015,6001 250 25io,sool 190 15
500 40 20
37,500 1,030 30
530
1548,360 90 1963,270 310 307,500 7,490 482,080 50 30
2,770
25
296,060 13.160 38.2151,000 830 17125,440 1,500 20240,900 450 16112,100 4,190 10
80,800, 360, 10soo,oool 4,230 7540,1201 1,820’ 11
1,359,320 13,388 10.9
70,200 150’ 1717,550 3461 20
0 2
3,360
126,400 4,010 13
370
5
70,
8
8,9501
611,340, 4,290j 9
1,6501 3,910! 10
1000201 27,310, 11.17,790 1,340. 50
141,000 50 177201 1501 15
120.8001 24o 10
738000! ö’ s1101,100 201 15134,020 iso1 22207,400 2101 30
12,600, 1201 15
24.3601 170 20
874,970166,680
61,60051,480
2,100155,770124,800
562,430
9,00029,90032,25014,52036,54010,34029,25064,39027,060
253,250
3,454,050
RH 35,150 $ 14,761
1,430’ 76,760 20,401340 10,200 3,070
1,030 21,850 8,0040101 13,350 5,607
60’ 1,100’ 481
‘‘oo530’ 7,950 3,260
1,020! 50,070, 10,5201,4201 72,570’ 27,5777,610’ 367,020 120,457
110 4,380 1,6012,770; 65,250; 28,592
19,090 798,250 S 293,028
3,850 165,1101 5 61,3034,060 155440; 62,1765,470 240,160’ 94,3017,140 154,000 58,5202,580 84,400 37,1386,210 158,510! . 50,174
14,680 560,1101 240,060
43.790 1,505,700 $ 615,560
1,710 72,750 5 29,100730 24,350 9,740
3,850 77,480 50,9923,160 40,320 56,1264,210 58,550 24,583
370, 1,850 74070’ 560 218
0,050 53,700 20,4064,560 40,950 38,4821,090! 32.600 12,095
29,600 412,180 $ 162,401
1,530’ 21,000 $ 8,4703,650, 144,850 52,146
170! 2,070 1,1883,2601 123,200 43,120
3,310 121,600 51,0722,340 104,700 38,7303,560 138,120 55,2485,530 210,840 80,110
480 14,400 5,616
750 27,760 11,104
24,380 909,630 $ 346,620
4,630 166,680 8 50,3381,540 61,600 21,5601,320 51,480 17,503
60 2,100 7084,210 155,770 57,6353,120 124,000 43,680
14,880 562,430 $ 199,514
200 9,070 $ 3,265650 29,000 11,661
3,820 70,200 28,782680 14,660 5,864
1,560 45,510 17,291460 12,740 4,841650 29,250 11,700
1,570 64,300 24,4681,120 29,460 13,373
10,520 305,180 5 120,248143,060, 4,493,430, 81,737,062
OATS—.1937
IRRIGATED , NON-IRRIGATED P TOTALCOUNTY I Acres ! !
‘ Acres AcresHar- I Av. I Prod. Ear- Av. I Prod. Ear- Prod. I Value
vested I Yield Bushels I vested Yield I Bushels vested I Boshels
1,96010,200
6,2502,850
500
30,9007,9501,7109,300
559,5201,500
69,250
502,19014,11 030,000
7,20041.000
3,60029,61020,020
146,4402,5506,800
70,00040,32052,130
1,850560
50,70038,65031,040
304,16033,400
0502,2502,400
3,600500
1,3003,3601,000
3,400
34,660
70
37,950140
8,9702,400
2,400
51.930
1,039,380
2,810
10
253020
600210
300
3,790
60,450
12.3
7
157
1310
8
13.7
17.2
efndjeates approximate location of District for ‘which Counties ave given above.

21 AGRICULTURAL STATISTICS
COUNTY AcresHar
____________________vested
Chalice 2,150Clear Creek 10Eagle 670]GilpinGrand III,Gunnison 14PJackson 10lakeMotlat 150.ParkP11km 120Rio Dlaneoltautt 90,Iltinunit 40’Isllt’r
*90151 North-’west Dist.__ 5,910,
Boulder _,. 8,150:.lell’erseu 4,150:Larimer 16,510logait 11,518itlorgan 11,l5lSeilgwirlç 5,011:Weld 55,611
°Tolal N. Cen-,tral and N.a Dist. 114.500:
Adams 5,l20Arapahae 1,570;ClseyenaeDenver IDouglas 30:ElbertEl Paso 210Kiowa ‘
Kit CarsonLincoln 00Phillips i
Washington 910Yunia 20
°Tstal E. CenOral Dist.____ 7850i
Arrhuleta 30’Delta 2,020DoloresGarfield 2,060Hinsdale 60La Plata 951;!Mesa 1,590’Montezuma 1,010Mnntrese : 1,040Ouray 140’San JuanSan Miguel 570
Tstal SY. Central and S.IV, fist. 9,270
Alamosg 6,050Conejos 2,7 50’Costilla 3,520MineralRio Grande 0,920Sagoaehe 3,070
0Total S. Cen-’tral Dist.___, ,_1Oj
Daca 90]Dent 4,559,Crowley 1,730Custer 1,160,Fremsnt soo:Hoerfano I 460Las Animas 300Otere 4,650Prowers 7,220;Pueblo
,2,9391
°Tstsl Southeastfist. 22,760
State TotaL_- 179600I
29 50,450]20 290:44 29.480;
26 13,00052 4486104 1,700
si
Flu]44 5,560’41 3,690’59 1,560]
33.4 130,720‘18 396,240,47 190,15041 676,910;11 402,36016 416,866]45 129,430j43 2,594,670]
40.9 4,679.760’11 170,6S039 01,200
44 1,320
29 6,050:
24 1,920,
4.1 40,040!
31 910
36.0 282,21t39 1,17044 05,880
54 70,04036 2,160’34 12300129 40,110,15 30,35017 18,48012 4,480
31 17,670,
.589
1,1401.440
8,640;2,900’
580,680’
133,620’930
6,090’
156,600,
12,60018,24021,460
270,56042,120’70,0701
ioi,sso
8.4 616,400
‘ti 160,70012 101,640;
8 , 320,
26 21,1805 ‘ 2,050
03,200]1 16,010,5 161,700]0 , 506,160:7 ] 112.910:
0.3 1.210,12010 : 2,50011 ‘ 770
9 2,540;9 540
11 4,086!
11 3,900:11 1.650’12 6,120
15 7,150
TOTAL
_________
360,110
175,15090,000
159,680
171,600104,369
679,1902,660
158,20950,17045,18055,12010,72611,640
167,400230,200
72,410
25,940 783,280
411,360 8,909,610,
BARLEY—1937
IRRIGATED NON-IRRIGATED
Av. Prod.Yield Bushels
AcresHar- 4v.
vested Yield
AcresProd. Har- I Prod. Value
Dushels‘ vested I Bushels
20. 29
1990 16
360]’ 24100 29
20; 2920’ 143939! 34
30 31210 20
4,840 32.4
030 20760 21740 20
13,820 87,020 6
10,010 720,150 9
73,130’52,050
8,47040
2,1703,530
410
23,3005,610
20,22056.21010.130
2,050 50,150’10 2oo
690, 30,060
560 14,140230 5,920
50 1,700
510 16,090100 2,900140 5,740110 4,640
4,020 137,11070 2,400
210’ 6,
8,750 287,320
8,760 402,840’4,810 208,590
17,200 698,37049,380: 752,92018,579’ 457,92013,020 109,59075,840’ 2,576,020
187,630 5,296,160’
17,070 019,180’10,040 162,870
40. 329
2,200 ‘16.8903,530 21,080
629 8,140
23,300 03,2005,690 18,750
20.220 161,76057,150 516,25916,160 113,819
156,020 1,512.510280 3,675
2,090 80,850260 2,710
2,120 70.58060 2,160
1,240 36,3605,390 40,3101,270 39,5501.190 40,150
650 10,600
1,060 25,020
S 53,801tot
15,932
7,2115,251
901
8,2911,0375,10’2,111
08,0513,571
$ 150,361
$ 201,475116,811350,101376,46’247,277101,741
5,416,611
$2,826,744
5 166,651811,571
1(11
26,72112,284,721
41,91110,31472,794
256,7151,331
S 753,121
5 1,901‘16,015
5,21138,811
1,01519,27122,17122,0118,661
1,985
12,511
5 189,381
5 67,7215518159,541
80,27.52,151
5 318,501
S 1,61:70,10126,55;26,371
7,61119,25
7,71187,041
118,13141,281
8 406,751
54,666,88:
148.170
7°260
60
290
360150$10
490
2,440
100’
1,76080
680250
2,180
221,760
35.7
293034
2034
31.4
34352921243431
34
31.0
38.1
330,840
175,45090,000
119,680’
171,686(504,359!
670,190
3,060]158,20050,17024,36012,24015,61012,000
167,400238,260
69,020
750,440
6,844,160
12.0
6
1211
611
11
10.1
8.9
01,710
6,0502,7502,520
5,9203,676
21,310
1001,5200,7502,920
5001,118
6404,6507,2202.240’
29,290]
600]
21,120880
4,0802,7 so:
3,416]
32 ,840
2,065,450]
lndicates approximate location of District for which Counties are given above.

STATE OF COLORADO 25
POTATOES—1937
IRRIGATED NON-IRRIGATED TOTALCOUNTY Acres Acres Acres
Her- Av. Prod. Her- Av. Prod, Her- Prod. ValueI vested Yield Bushels vested Yield Bushels vested Bushels
ChelSea J 1275 9,000! 9,0001 $ 4,860Clear Creek 2& 60 1,200 1,200! 660Eagle 1,400 220 019,090 60 70 4,200 123,200 164,802Gilpin I 79, 50 3,500 3,500 1,923Grand 39 115 4,359 201 10 200 4,150 2,412Gunnison 188 150 27,000 120 80 9,600 36,600 20,130Jackson 10 180 1,800 1,800 990LakeMallet 340 140 47,600 390 80 11,200 78,800 40,970Park 96 80 7,200 890! 70 62,300 69,000 36,110Pitkin ‘ 1,010 190 I 191,900 40, 85 3,400 195,300 95,603Rio Blanco 99 200 18,000 501 90 4,500 22,500 12,375Roott
, 100 140 50,400 1.0901 120 130,800 181,2001 92,412Summit 20 70 1,400 1,400’ 712Teller 39 00 1,800 090 10 29,500 31,300 16,589
Total North-,west Dist. 2,710, 181 678,050 3.360 84 281,800 859,850 $ 484,646
Boulder‘ , , ,
Jefferson 10 140 1,400 so! 30 2,400 3,800 S 2,090Larimer 230 170 ‘ 35,700 20’ 40 800, 36,500 19,345Logan ‘ 280 110 ‘ 30,800 380’ 20 2,600! 31, 100 18,232Morgan 670 200 134,000 100 35 6,610’ 110,6.30 73,138Sedgwick 710 090 ‘ 142,500 160 15 2,100 144,900 72,450Weld ‘ 24,160 170 4,226,200 520 20 10,400! 4,236,600 2,033,568
5Total N. Cen-‘ !
Oral and N. I,
a Dist. 26,780 171 4,570,600 1,150 23 26,250 4,596,850 $2,218,023Adams 70 150 — 10,500’ 10,100 5 5,210Arapahse ICheyenne ‘
,
Denver— ,
Beagles ! 30: 10 300 300 152Rlhert I so: 15 , 150, 550 71RI Paso 20 100 2,000 120 27 2,000 5,000 2,600Kiowa , .
Kit Carson 20 50 1,000 1,000 130Lincoln 39’ 60 1,800 50 20 900 2,700! 1,401Phillips [Washington I 10 25 2101 210’ 130Yuma 40 129 4,800 20 20 4001 5,200 2,808
5Total E. Cen-, Itral Dist.......__ 180 112 20,100 220 23 5,000, 25,100 5 12,031
Arehuleta ‘ 80 00’ 900 I18,200’ S 9,110Delta , 1,140 140 159,600 220, 70 12.4001 175,000’ 92,750Dolores ‘ 530 80 42,400’ 42,400 21,624
Garfield 3,210 170 552,500 670 50 23,500’ 516,000’ 292,000Hinsdale 40 710 4,100 4,400: 2,200La Plato 710 160 213,000 160 40 6,400 120,000 61,800Mesa aOl 190 422,700 90! 10 4,100 428,200, 222,664Montecumg
‘ 1,379 100 137,000 790 70 55,000 192,300 102,842Slontrose I 4,410 170 , 716,500 00, 70 4,200 760,700 265,136Ouray 180 100 18,000 10! 71 3,750 21,750 10,875San Juan I ‘
San Miguel 110 170 18,700 180! 80 14,400 31,100 16,5505Total W. Cen-’
teal and S.’W. fist. 13,568 162 2,191,200 3,120. 61 190,950
Alamssa 6,710 131 — 901,070Conejos 7,080 90 637,200Cestilla ‘ 690 90 62,100Mineral ‘ 30, 90 2,700Rio Grands 27,620, 205 5,109,709Saguache 9,090 90 899,109:
*Totsl S. Cen-,Oral Dist.____ 52,020’ 146 7,607,650
Baca,
Bent ‘Crawley ‘ , ,
Custer 110 50 1,590 1,040 90 83,600F’remont 189 70 12.600 70 70 1.900Ruerfano 20 100 2,000 180 20 2.600Las Aninsas
‘ :Otero ‘ ,
PrawcraPueblo : I
Total Soulheast’-
fist. ‘ 210’ 65 20,100 1,290 79 102,100State Total_* 96,560! 156 15,087.700 9,140 66 60640O
120!
2011,510
50010
710980
5,95!I140
s,45920
620
7,070’
99210460860’910,
21,100
27,930’70’
3010
140
20,60,
sol60
40045°,
3,1601930!
3,920’‘10.
0702,120’2,160:4,510’
220
2901
16,6806,710’7.080
600,20,
27,620,9,890,
52,020
1,150210200
0,600105,700
$1,202,957
$ 461,984318,609
29,8081,300
9,605,947413’95
2,382,150,
_________
905,850637,200
62,1002,700
1,109,700890,100
__________
7,607,650’
___________
oo,sool17,100’
5,600’
122,200, S 66,804
15.693.8001 $7,867,901
$3,871,640
$ 54,5019,2753,024
lndicates approximate location of District for which Counties are given above.

26 AGRICULTURAL STATISTJCS
DRY BEANS—1937
Acres Av.Har- Yield
vested Pounds
Chalice 10Clear CreekEagleGilpinGrandGunnison I
JacksonLakeMoffat _____
ParkPitkinlOin BloiieoKnottSummitYeller
Tetal N artli— -
writ tiisl.___ —— 10
Doubler 50tel1 ersun 36I .arinit’r 1,900l.ngan 2030llnrg:ui 0,510Seilg;rzek 20Weld 33.010
Totsl N. Centrsl and N:F. DKt._._J 45,970 753 346.108
Adams 1,100 750 0,700Arapabse 200 000 1,6001Cheyenne __
DenverDouglasElbertEl Peso 50 300 250KiowaKit CarsonLincolnPhillips%Vastiiztgtun 200: 600 1,200Yama
5Total F. Cen-]tral Disi. ____] 0,610 730 11,756
Arehuleta I 10 050 81Delta 950 050 0,055DoloresGarfield : 210 1,050 2,621HinsdaleLa Plate 110 900 900Mesa 8,640 1,100 05,040Montezuma 2,060 710 21,450Montrsee 1,120 1,210 16.100Ouray ---
San Juan :San 51i’uel
5Tstal ST. Central and s.iW. Dist. ___. 14,140 1,024
_________
Alamesa IConejss 200 050Costilla 970 010MineralRio GrandeSaguaehe
5Total S. Central Dist.___... 1,170, 667
BaeaBent 470 800Crnss’ley 1,720 350CusterFremant 160 70Huerfano 100 100Las Animas 2,910 600Otern 0,950: 500Prowers 230 400Pueblo 0,1401 000
Tetn1 SoutheastDial. J 14.180: 480
State Total._1 77,260 753
COUNTY
TOTALIRRIGATED NON-IRRIGATED
Prnd. : Acres Av. Prod. Acres Prod.100 lb. Har- Yield 100 lb. Har- 100 lb. ValueBags vested Pounds Bags vested Bags
050 11 10 35 S 111
00
140 101 601 204 910
150 I 25 60 340 261 76 239 $ 1,011
100 250 130 100 110, 100 300 S 1,406
700 210 75 120 01 100 294 1,600
510 10,090 00 200 100 2,030 10,090 59,564
500 10,110 630 110 019 2,660 10,969 40,585
000 I 51,060 1.260 90 2.034 11,770 53,094 194,370
000 210 10 210 000
020 I 273,308 26,120 110 20,712 10.100 302,120 1,087,622
__________
30,260 100 32,799 76.230 330,967 $1,361,541
0,710 70 6,025 10,210 11,525 S 01,80012,210 70 0,047 12.410 10,147 30,520
2,120 100 : 1,020 2,120 4,020 14,00436,140 100 10,310 30,140 16,140 111,71021,320 70 1012l 25,770 10,171 73,021
200 70 140 200 140 5184,560 60 2,716 4,160 2,736 10,123
2.160 00 2,200 2,060 1,105 32,610200 110 220 200 220 660
___________
95,260 81 79.960 96,870 01,718 $ 270,573
60 250 210 70 205 3 1,06220 200 40 970 8.115 10,025
0.770 100 20,310 9,770 20,310 100,447
253
2,620 9,712
450 100 2.025 560 3,011 10.051150 235 : 345 3,700 05,501 155,8-15
20,110 200 60.720 22,070 81,700 302,180
1,32016,500 61,050
650
220 2.000 650 2,080 7,636
111,765 11,210 302 91,340 45,350 219,105 $ 005,280
5,305 _ - 200 1,000 $ 6.1600.240 - 970 0,245 26,204
W15 L170 H145 $ 32,841
7.760 300 110 110 570 3,870 $ 15,54513,020 500 80 400 4,220 13,420 48,512
50
00 50 50 30 114102 20 50 : 10 180 122 464450 040 00 ‘ 224 610 724 2,070
15,060 010 00 0191 3,420 15,873 55,57619,230 020, 00 108 3,975 10,558 00,817
920: 70 70 49 500 060 3,20216,700: 6,050 100 0,010 10.290 25.650 00,876
69,222 9.260 95 6,000 23.640 78,022 8 279,760
582,105 106,050 130 216,111 243,330 798,216 $2,883,050
*Indieates approximate location of District for which Counties are given above.

STATE OF’ COLORADO
SUGAR BEETS AND BEOOMCOEN—1937
Sugar Beets—Irrigated Drosmcorn—Irrigsted and Non-irrigated
COUNTY AcresY151d
Produc- Total Value Acres ProducHar- Acre tion Beeta and Har- Acre Don Value
vested Tone Tone Tops’ i vested Pounds Pounds
Chaffee ..._... 56 7.6 426 S 2,237 ___
Clear Creek ———
EagleGilpin ---
GrandGunnison 0 9.0 42 229Jackson ———
Lake ---
Moffat ---
ParkPitkinElo Blaneo —-—
Eoutt --- -
Summit ---
Yeller —-—
Tetsl Northwest!District 65 7.2 171 5 2,476
Boulder 6,269 13.4 04,002 5 441,027 _
Jefferson 572 12.6 7,207 37,037 —— .__ ___
Lsrimer 12,749 12.4 150,008 829,962 —— .
Logan i 16,779 12.1 206,382 1,083,105 120 220 37,500 5 1,123Morgan 19,032 12.5 237,938 1,261,071 10 250 2,500 75Sedgwick 4,545 13.3 00,448 320,371 __
Weld 59,711 13.3 794,183 1,209,169 40 200 0,000 210
5Total N. Centraland N. E. Dist. 119,662 12.9 1,548,251 5 9,182,945 200 240 48,000 5 1,440
Adams 6,554 12.6 82,180 5 433,545 50 300 15,000 5 450Araps.hoe 520 11.4 3,028 31,122 50 300 19,000 450Cheyenne ———
DenverDouglas IElbertEl Paso I 514 9.0 4,896 26,138 ———
Kiowa 300 300 150,000 4,200JOlt Carson .200 250 50,000 1,350Lincoln I —--
Phillips ..___
Washington 400 13.1 5,240 27,772Turns 140 210 29,100 853
5Total E. CentralDistrict : 8,018 12.3 98,614 5 518.077 940 276 259,400 5 7,303
Archuleta -
Belts 1,809 12.3 22,251 5 120,153Belores ___
-——
Garfield 2,202 12.9 28,406 153,392 __—
Hinsdale ---
La Plata ---
Mesa 777 11.2 8,702 46,991 ___
Mentecumr, ___
Mnntruse 990 12.6 12,474 67,360 _
Oursy __
San Juan ___
San Miguel5Total W. Central
and S. ‘SN’. Dist. 5,778 12.4 71,833 5 387,898 ,_
Alsmess 754 5.6 4,222 5 22,160Cnnejns
:
382 0.9 2,630 13,830Costills 675 5.2 2,510 13,427Mineral ———
Rio Grsnde 410 5.9 2,419 12,700Ssgusche ‘ 96 6.8 651 3,428
5Tetal S. Central,District : 2,317 5.8 03,440 $ 70,560 ‘
________
Uses 20,340 120 3,520,800 5 91,541Bent 2,101 11.0 25,311 5 121,333 50 350 17,500 612Crnwley 3,630 7.9 28,077 166,326 ..
Custer 15 5.2 78 409Fremont 247 6.2 1,531 8,038 70 200 14,000 350Huerfsun 159 7.8 1,240 6,510 40 200 0,000 200Las Animas 1,345 8.4 11,205 01,009 100 300 50,000 750Otero 7,558 12.1 01,452 489,268Prowers 3,314 8,9 25,495 156,323 1,200 270 340,200 10,206Pueblo 5,780 12.3 71,004 301,017
________
‘Total SeutheastDistrict 24,149 10.7 257,976 $ 1,400,233 30.860 127 3,930,500 $103,659
State Tetal 159,989 12.4 1,990,615 $10,562,989 32,000 132 4,237,900 $112,402
‘Bees not include Government Payments. Value of tops estimated st 5995,000 for entire state or about50 cents per ten of beets.
5lndiestes approximate location of District for which Counties are given sbns’e.

22 Al ItIC tILT tJltAL STA’l’l SIB’S
GRAIN SORGIIUMS AND SWEET SORGJIUMS—1937
GRAIN SORGHUMS SWEET SORGHUM FORAGE --
I Irrigated and Nnn-Irrigated Irrigated and Non-Irrigated
COUNTY Acres Yield Froduc- Acres Yield ProoncMar- Per Acre tion Value Mar- Per Acre tion Value
vested Bushels Bushels —- vested Tons T. us
ChaffeeClear CreekEsgleGilpin __.__
GrandGunnisonJacksan ___
Lake __
Moffat 100 7 1,400 ___
Park ---
Pitkin ———
Rio lilancoitoul 0 _—_
Susninit _ _
‘l’eller ———
_______
*‘fetal NerthwestDistrict 200 7.0 1,400 $770 __
iloulder 70 0 420 1251 200 .1 140 $ 88Jefferson . 10 0 700 108 220 .7 151 08J,arimcr I 750 5 2,750 2,250 300 .0 210 1,30Logan 10,230 4 40,520 21,552 31,750 .7 8,225 50,09Morgan 7,750 4 31,000 18,000 8,020 .0 7,214 41,75Sedgwick 00 3 100 108 0,110 .0 5,877 35,85Weld 4,030 4 18,520 11,112 10,750 .8 8,000 53,32
Tetal N. Central,and N. H. Diet. 23,520 4.0 94,970 $ 50,992 37,830 .8 70,430 $18814
Adams 5,050 8 45,010 $ 27.021 3,150 .7 2,115 $ 15,21Arapahoe 2,700 7 10,120 11,592 0,830 .8 5,104 24,07Cheyenne 15,700 0 04,500 50,710 12,500 .5 0,780 11,11Denver _—
Douglas 150 7 2,450 1,470 1,120 .8 850 5,57Elbert 2,730 5 13,050 8,100 8,010 .7 0,041 18,81El Paso 9,65Q 4 10,440 0,204 4,520 .7 1,101 19,99Kiowa 15,030 5 75,550 45,090 8,700 .7 0,132 38,01Kit Caraon 19,700 4 79,040 47.424 29410 .0 17,040 109,40Lincoln 0,730 4 20,920 10,152 17,070 .5 8,815 54,07Phillips 080 8 7,840 4,704 11,220 .7 9,954 00,71Washington 19,010 5 98,050 58,830 15,700 .0 21,450 133,07Yuma 25,750 7 180,250 108,150 2-1,080 .8 19,204 119,47
eTetal E. CentralDistrict 117,700 5.5 652,710 $391,026 167,970 .6 108,027 $66914
Archuleta _
Delta 250 17 4,250 $ 2,125 30 1.5 45 $ 21Dolores 850 14 11,000 5,050Garfield 120 13 1,500 780 150 1.3 195 91Hinsdale _
La Plata 150 1.4 210 1,07Mesa 150 18 2,700 1,150 200 1.4 304 1,81Montezuma 100 15 1,500 750 440 1.5 000 3,47Montrose 70 18 1,200 [ 030 70 1.5 101 57Ouray __
San JuanSan Miguel 10 1.5 45 27
Tetsl W. Centraland S. W. Diet.! 1,540 15.0 23,170 $ 11,383 1,130 1.4 1,621 $821
Alamosa --—
Conejos —-—
Costilla 150 1.0 150 $ 71MineralRio GrandeSagusehe --—
eTetal S. CentralDistrict
__________
110 1.0 150 $7iDaea 45,840 4 183,100 $ 00,179 280 .7 190 $ 1,21Dent 5,070 15 85,050 42,525 190 1.0 150 01Crowley 2,120 10 21,200 11,200 1,200 .9 1,131 7,14Custer 50 .8 40 21Premont 200 7 1,400 770 70 .8 50 33Hucrfano I 050 8 5,200 2,800 390 .7 273 1,60Las Animas 2,860 8 22,880 10,754 450 .7 hI 1,92Otero 300 20 0,000 8,000 300 1,0 300 1,81Prowers 31,900 14 447,440 210,297 890 1.0 890 5,51Pueblo 900 9 8,040 4,752 120 .8 96 01
tTetal SentheastDistrict 90,560 8.6 781,170 $ 372,797 3,960 .9 3,410 $ 21,31
State 233,520 6.7 1,553,420 $ 833,760 211,040 .7 143,681 9887,70
tlndieates approximate location of District for which Counties are given above.

sPATE ci’ GQI4ORADI
EYE AND WILD JIAY—1937
Rye Wild HayIrrigated and Non-Irrigated Irrigated and Non-Irrigated
COUNTYAcres Ave. Prodnc- Acres Ave. Produc- ValneHar- Yield tion Value liar- Yield tion Pervested Bnshels vested ‘ions Ton Total
$ChaffeeClear CreekEagleGilpinGrand 160Gunnison 20Jackson 10LakeMoffat 1,410Park 20Pitkin 30Rio Blonco 10Routt 310Summitieller
5Total Northwest Dist_..: 2,040
Boulder 170Jefferson 150Larimer 110Logan 6,410ilorgan 1,060Sedgwick I 1,250Weld 5,050
5Total N. Central and N.F. Dist. _ 16,920
0.dams 1,0203,rapahoe 810DheyenneJenverJouglas 1,030OlbertCI Paso 3,020(iowaCit Carson 710incoln 010‘hillips 2,210,Vashingtsn __ 2,910Coma 4,700
5Total E. Central Dist.__. 21,700
krchuletaJelta 20lolores 130arfield 200
Iinsdale-a Plato 30lesa . 40lontezumalontrose 240bray 40an Juanan Miguel 305TetaI W. Cen
tral & S. W.Dist. 730
tlansosa00005 IostillalineralJo Grande 50aguaehe5Total S. Cen
tral Dist..._ 50aeaentrowleyuster 50cemont 50uerfano 200as Animas__.... 100‘tero 20cowersueblo 505Tetal South
east Distrirt 470State Total — 41,910
—__ 1,350 1.0 1,305 0.90 9,004——_ 330 .5 165 0.50 1,072—__ __ 100 1.0 ISO 0.00 2,208-__
_ 050 .0 . 300 6.70 2,61111 1,700 $ 1,021 19,210 1.1 2ff203 0.50 139,81510 200 110 10,120 tI 20,020 6.50 100,58510 300 180 82,100 1.1 00,136 0.70 003,911
__ 8,120 1.0 8,056 0.50 02,30410 14,500 8,410 3,150 .8 2,520 ‘ 6.50 16,38012 240 173 30,520 .9 20,108 0.00 172,31312 120 I 70 250 1.1 275 0.50 1,78813 i 520 £ 312 2,840 1.0 2,1)76 0.40 19,04014 4,340 2 .317 1,1 10 1.4 2,180 0.40 13,052
——— ——-—
————
100 1.0 400 0.50 2,610000 .7 661 6.70 I 4,442
10.8 F 21,980 $ 12,631 171,240 1.08 182,013 6.66 $1,212,09510 1,700 $ 1.020 3,130 .0 3,224 7.70 5 25,30414 2,100 1,260 1,870 .8 1,196 7.00 11,370
F 1,210 302 4,050 .8 4,678 7.00 20,0528 51,440 31,378 13,520 1.0 14,103 7.00 307,6390 17,760 11,011 2.510 .8 2,000 7.70 15,8626 7,500 1,050 2,050 .9 2,260 7.60 17,17011 04,350 28,010 12,510 .9 11,625 7.70 80,512
8.6 146.060 5 88,691 41,240 .95 , 38,976 7.64 $ 207,916-iO 12,240 TTOiT J400i 1.1 1,i14 80 $ 9,70210 8,100 4,800 1,270 .8 1,056 7.80 8,237
__ 150 .0 90 8.00 720
11 58°J 1 7 30s0 10 1001 0 130108 20,580 F 12,330 I 3,120 F .8 2,504 7.60 19,0307 21,040 12,895 3.570 1.0 3,450 F 7.00 20,200
450 .7 115 I 8.00 2,5204 2,840 1,562 970 .7 870 8.00 5,4325 4,050 2,228 3,870 .7 2,708 7.70 20,8598 25,840 15,501 50 .6 50 7.70 23t8 23,120 11,642 9,650 .7 3,955 , 7.00 39,0589 42,840 p 23,562 5.310 .9 1,779 7.80 30,320
8,6 186,750 S109,305 27,260 .82 22,485 7.67 $ 172,386i 2,220 1.1 2,400 6.60 $ 15,84014 250 F
$ 179 252 1.2 291 0.50 1,89215 1,950 1.228 120 1.0 120 0.70 80118 3,000 2,180 1,628 1.0 1,761 6.00 11,0231,180 1.2 1,420 F 0.50 9,23017 510 706 1,030 1.3 1,325 0.70 8,03118 720 ‘108 110 1.5 165 6.50 1,072
_
__ 80 1.5 120 0.00F
79218 4,320 2,808 630 1.2 729 6.50 4,73815 000 360 2,120 1.3 , 3,010 0.70 20,207
m mo — moo iz mo mo
17.0 12,430 $ 7,797 9,940 1.17 , 11,625 6.81 F $ 76,888_ 10,230 .9 i 14,007 6.30 $ 02,024
—__ 13,750 1.1 15,127 F 0.30 01,288_ 3,784 1.2 1,512 0.70 30,230
2,970 .9 2,673 6.50 17,37120 1,000 5 600 10,210F 9,279 0.50 60,214
40,120
.8 12,098 8.50 208,624
20.0 1,000 $ 000 — 87,140 .90 78,292 6.44 $ 303,854
27 0 201 30 1$ 399100 .9 90 7.50 07510 100 $ 599
‘ 19850 F 14 31,030 7.80 110,51613 650 390 810 1.0 778 7.80 0,00810 2,000 1,200 1,570 1.0 1,555 7.50 11,00210 1,800 928 300 1.2 300 7.40 2,6049 180 103 { 700 .0 041 7.30 , 4,079410 .0 246 7.60 1,87010 I 500 510 1,120 1.0 1,164 7.80 9,079
11.6 5,430 $ 3,231 16,150 1.24 20,033 7.71 $ 155,1188.9 373,650 $222,259 382,970 3.00 353,424 6.84 $2,418,251
Sjnslicates approximate location of District for which Counties are given above.

20 A I it ‘UL’l’ UIIAL S’I’ATISYIt:S
ALL TAME BAY AND ALFALFA—loll
All Tame Hay AlfalfaIrrigated and Non-Irrigated Irrigated and Non-Irrigated
COUNTY Yield Acres YieldAcres Per Acre Production Value Har- Per Acre Production Value
Harvested Tons Ions vested Tons Tons
Chaffee 6,120 1.5 9,150 S 55,752 2,351 1.2 1,152 5 22,91
Clear Creek____ 625 1.4 565 5,642 20 1.7 34 22
Esgle 22,060 1.7 37,502 232,112 12,150 2.0 24,300 150,66
Gilpin 60 1.5 78 450Grand 14,050 1.0 14,030 85,593 520 1.5 780 4,85
Gunnison 21,820 1.1 21,013 110,470 1,070 2.0 2,110 13,20
Jackson .. 1,020 1.0 1,020 5,910 ___ ___
Lake [ ——
Ilollat 21,070 1.-I 29,455 182,595 14,050 1.7 23,551 147,87
l’ark 1,110 1.0 1,330 20,117 I
l’iltio 11,020 1.3 15,100 51,057 1,520 2.0 7,010 45,04
10 ii jo 2 0 1 lIla 244660 10° 4 18 ‘l 0 1 42;
l1;o,lt 12,810 1.7 72,437 411,556 11,500 2.1 24,776 150,51
S;tnneit 7,630 1.2 5,130 54,530 20 1.7 24 21
‘l’cll;’r 5,160 1.6 1,460 32,760 00 1.0 00 — 11
Total N seth—west Dist._ 184,350 1.12 261,513 $ 1,612,521 01,558 1.85 110,230 5 725,80
Il all 221°l 1 9 — 42 058 9 15 1960 ‘0 60 9 05 17
JrItrr,.or, 11,830 1.7 25,211 215,330 10,530 ‘ 2.0 21,700 115,79
Larimer 30,150 1.9 17,255 ‘151,191 25,700 1.5 51,011 155,01
Logan 110 1.4 35,010 315,193 12,530 1.7 21,101 178,92
Morgan IglOO 2.0 14,302 450,707 21,710 ‘ 2.1 15,591 752,90
Sedgwick 12,110 1.6 15,170 160,821 1,220 2.0 10,440 57,65
Weld 112,500 1.6 180,000 1,194,000 73,050 1.0 118,852 1,100,35
e’f5 N. Cm-’teal & N. N.But. 247,440 1.00 416,212 $ 3,178,779 0,0,700 1.93 229,tOO S 2,84,15
dam lb a’O 1 990 5 211 a2 10900 2 2 52 gO
Arapahoe 10,410 1.7 ‘ 17,097 , 112,901 7,910 2.1 10,104 140,22
Cheyenne 520 0.1 752 2,511 —. -. .
Denver ___-
--- I
Douglas 13,410 1.5 17,131 111,207 5,810 1.5 8,760 73,50
Elbert 11,450 .9 10,301 90.579 6,220 1.1 0,042 50,10
El Paso 11,290 1.1 19,197 150,512 5,130 1.7 0,231 90,51
Itiowa 1,110 .0 3,152 8,775 370 .7 250 2,12
Kit Caroon 1,750 .0 3,boO . 28,950 30 .5 15 11
Lincoln 7,120 .7 4,554 37,150 . 20 .0 12
Phillips 13,570 , .5 10,950 87,391 __
Woahinglon 25,010 1.0 29,040 220,704 2,010 2,1 ‘ 5,491 IYunsa 28,710 1,0 29,710 ‘215,325 700 1.0 700 J 5,74
eTetal N. Central Dist_’ 110,730 1.13 170,000 5 1,365,510 39,920 1.70 71,613 5 016,51
Archuleta 15,040 1.7 26,515 5 154,992 0,020 1.5 11,516 5 91,71
Delta ‘ 25,250 2,4 i 07,505 515,500 , 21,700 2.5 01,400 528,l
Dolorea 1,070 1.0 1,712 ‘ 13,113 110 1.7 501 4,01
Garfield 45,210 2.2 59,402 773,804 ‘ 38,670 2.3 58,541 ‘102,61
Hinodale 2,000 1.1 2,048 21,220 50 1.7 15
La Plato 22,010 1.7 15,547 270,524 15,010 1.8 25,405 ‘ 242,01
Mesa ‘ 41,820 2.4 100,308 803,018 41,420 2.4 59,408 915,1
llnnteoan;a 20,050 1.7 14,085 241,412 16,920 1.8 10,450 215,2;
Montrose 33,870 2.2 74,514 011,015 31,800 2.2 70,092 574,7i
(bray 5,410 1.8 10,974 127,305 2,000 2.0 6,020 53,21
San Juan . ---- ---
San )lig;iel.... 6,750 1.4 5,450 71,020 3,850 1.0 0,100 47,-k
Total W. Central & S. IV.Diot. , 227,600 2.00 472,848 5 3,710,509 187,550 2.20 412,437 5 3,270,2.
Ainmosa 17,120 1.5 25,080 518-1,900 10,750 1.5 21,125 5 180,9’
Cnnejos 18,760 1.1 24,188 175,501 14,830 1,4 20,702 345,4:
tlestilla ‘ 8,050 1.0 17,005 120,710 5,700 2.1 12,000 , 87,0’
Mineral 2,000 1.5 2,250 15,525 10 1.3 30 I 2
tIm Ci’ande_ 24,060 1.7 40,002 250,-l04 5,840 1.9 ‘ 15,050 114,6
Saguarlie 14,120 1.0 22,502 100,103 0,570 1.7 11,940 81,3
°TstalS.Centrot Dist. — 04,510 1.57 112,617 5 517,310 54,000 0.61 88,567 5 627,6
Dora 769 1.1 088 5 7,505 500 1.7 510 5 4,3
Dent 20,020 1.9 40,058 412,087 25,230 1.9 47,057 407,4
Crowley 7,940 2.0 11,880 130,568 7,850 2,0 15,780 155,7
Custer ‘ 3,710 1.3 4,825 25,050 1,270 1.5 1,507 15,8
Frensont 0,110 2.0 ‘ 16,220 ‘ 120,118 5,020 2.2 11,014 51,0
l{uerfano 14,370 ‘ 1.4 20,118 ‘ 158,512 12,970 1.5 19,155 151,6
Los Animno 8,130 2.0 , 10,260 128,154 ‘ 0.020 2.5 11,540 95,8
Otero 53,45Q 2.0 ‘ 42,900 364.050 20,700 2.0 11,120 012,0
Prowero ‘ 05,080 2.0 70,160 580.314 34,070 2.0 09,1.10 572,3
Pueblo 10,120 1.0 24,012 211,254 10,800 2.0 21,720 191,1
°Total Sooth-;east Diot.__’ 140,690 1.85 260,919 $ 2,174,626 123,390 1.54 239,157 5 2,020,5
Slate TotaL* 1,035,400 1.66 1,784,009 $13,202,500 037,270 , 1.07 1,238,233 510,003,4
0ndieateo approximate loration of District for svhirh Countieo ore given above.

STATE OF COLORADO 31
SUGAR BEETS, IRRIGATED AND NON-IRRIGATED-—ACRES IIARVESTED—1927-1936
COUNTY 1927 2928 1929 1938 1931 1932 1933 1931 1935 1938
Chaffee 83 35Clear Creek I IEagleGilpin IGrandGannison I
-- F IJacksonLake rMoffat 20Park
‘PLAin,
Rio B]anco I J jRoutt 33 ISummit
IToilerTatal Northwest
District___ 48 80 ____J _____‘ 35
boulder 7,883 7,600] 9,450; 9,013 10,497 4,331 7,100 7,440• 5,482 8,890Tefferson 480 970 1701 690 733 471 680 560; 524, 712Larimer 24,110 16,600 21,140 22,210 21,991] 12,811 16,460. 11,704 10,626 11,211Logan 25,170 22,720; 14,630 23,610 l8,273 12,322 19,270, 17,126’ 13,706 16,318Slorgan 26,780 23003’ 20,1 10. 26,660 22,065 23,172 22,130 19,760 11,897 26,370Sedgwick 7,670 8,260 4,740; 4,730 3,788 5,183; 3,960, 3,827 4,110Weld 86,433 53,0081 82,350 92,343 85,263, 61,393 77,233 03,020 57,212 67,455OTotal N. Centraland N. C. Dist. 173,470 132,76& 153,290 177,800 164,583 115,626 141,330: 126,100 105.240, 130,718
Odams 3,210 6,600 11,370 11,170 339j$’ 5,023 8,290 7,120 6,161’ 7,852\rapahoe 680 670 550 1,356 1.168’ 412 480 613 610Dhcyenne ‘ .. -_____:
Denver‘ : ;
DouglasI Itibert
,(I Paso 230 153 005: 1,100, 510 960 107; 576 508(low-a I, ;(it Carson ‘ ,
] ; ;1incoln :
I,‘hillips : :
N’ashington 2,500 1,673 200’ 410 253 -172 513 450 350’ 1,000(uma ; I ITotal E. Central, I IDistrict 11,220 9,020 12,240 13,500 13,901’ 6,377 10,250 0,480 7,703 10,156
trchnleta)elta 2,235 2,773 73331 2,810 2,297 2,492 3,717; 2,970 2,847 2,302)olores
‘ksrfield I 1,740 3,600 1,010 1,720 5,707 2,031 2,830 2,220 2,399 2,243tinsdale- 1 ‘a Plata 220: , I
‘:esa 2,320’ 2,350 1,399 1:090 3,735: 2,102 1,210 1410 1,077; 035lontezuma ‘ ; ‘ : Ilontrose 2,020 2,000 1,880 2,753 813 1,127. 2,700’ 1,630 1,397’ 1,121buroy 10’ ‘ :‘
ian Juan‘
an Miguel, _zzzz_* F -!°Total 7V. Central ; ;
.and 5. lv, Dist. 8,610 6,300’ 6,910 0.100 6,330; 8.320 12,450’ 8.130 7,320 6,211ilamosa 180 290’ 050 1,170 071i 483 1,370’ 023’ 1,011 720onejos
, 120: 200 260, 320 53 35 436 140: 131. 330l050illa ‘ 230 70 10 20: F 1
30 ‘lineral I 1 j 1 ;ho Graodo ; 21, 20, 200’ 10’ 78; 59 160 140 273; 519aguache ‘ 23, 20 40 20 170 00 171- 383°Tatal S. Central l i
,Di trirt 50 7001 1160 la2O 803 519 21 01 1.199 19231 5 966:aca : ;; ; :
——ent ‘ 2,770 2,100 2,050’ 5,310 2.202; 2,150 3,976 2,390: 9931 2,000ross’ley 4,083 7,010’ 0,303’ 5,310, 5,738 2,590’ 2,310 200’ 2,811 3,203uster: ‘
‘
I 126remont 93 70- 00 10: 182tuerfano ‘ 20 40 98 150j 135; 49] 107as Aniinas ; 80, 200 900; 100 1,100’ 1,747 3,430: 5,533 1,070’ 1,500tero ‘ 9,293 10,2031 12,110; 13,800 11,585; 9,183 12,070 8,013; 3,5711 6,870row-ers 2,790 2,200 7,530 7,2031 7,823: 3,810 02701 2,5701 2,7771 2,559oeblo 4,530 6,500, 0,090, 0,0231 7,17-1’ 5,818 3.013, 7,210; 1,272, 5,1005Tatal Southeast1
DistrIrt 24130 28,150 26400I 39,0401 18120] 25,068, 35,800’ 24.380 17,560 21,827State Total J 218,000’ 379,000, 2l00OO] 242,000. 224,000f 156,000. 209000] 169,040 119,948 170,982
°Indicateo approximate boratton of District for which Counties are given above,

.l,611lUULTt214AL STATISTICS
CORN (ALL PURPOSES), IRRIGATED—ACRES IIARVESTED—1927-1936
COUNTY 1927 1928 1929 1939 1931 1932 1933 1914 1931 1936
Chaffee 14
Clear CreekF F
Eagle 10 10 20 20, so: 10 101 20
Gilpin F_____:
Grand II
Gunnison . . 10
Jackson F F F
Lake
---, --
Itloffat 10 10 10F 10 10 0 10 .30 t0FPark FPitkin I
Eta Blanco II 30. 360
lloutt . .
Summit I
‘loller I
5’17IIil Northwest!I
I1)islrirt 20 20 30 30 20 60 201 41 79F 405
Itoollet’ - - 1,100 0,270 6,070: 5,600 8,610 0,160 0,060 6,700 8,828 6,010
,Iellrrsoo 2,610 2,420 2,050 2,680 2,810 2.780 3,013) 3,160 4,776 4,220
ISLeilere F 4,420 0,410 0,070, 0,720 6,700 6,040 7,600 8,020 14,262 0,320
logan .‘ 4,000 4,400 3,340 4,640 6,650 11,050 6,250 12,200 11,932 10,970
Morgan 6,400 7,000 8,200 6,6701 6,110 0,040 10,060 13,060 16,676 15,170
Sedgwick 1,300 1,310 1,360 1,160 2,230, 3,100 2,610 2,700 1,002 1,100
Weld I 15,030 10,450 17,870 16,670 20,030 29.150 26,320 25,670 21,601 34,120
°Total N. Centraland N. E. DisI.’ 40,080 46,210 40,550 43,630 33,060 72,780 69,400 72,910 90,890’ 01,900
Adams 2,050 1,650 1,060 1,710, 2,270 3,410 3,500 4,530 4,0701 4,010
Arapahoe 1,360 1,340 1,540 1,500 1,600 2,260 1,730 750 849. 700
Cheyenne:
Denver : I ‘
Douglas 300 340 530 230 110’ 320 350 320
Elbert 60 50 60 30 30. 30
El Paso 1,140 1,160 1,320 1,380 1,410 1.070 1,500 1,210 476 1,150
Kiowa I:
Kit Carson 140 100 130 130, 130 170 110 50
Lincoln 50 50 70 70 50 110 60, 60
Phillips :F __j :
Washington 1,000 3,060 520 030 690. 3,260 010 1,210 1,361 3,026
Yuma 200 . 340 210 220 240 leO 265 370 922 301
5Tetal E. Central F
District 6,600 0,510 6,660 6 160 7,030 1,950 6.760 8,520 1,538, 0,371
Arehuleta 150 150 200 2701 100, 250 260 440 2511 45(
Delta ‘ 4,510 1,170 3,430 3,406’ 4,600 6,170 4,150 4,760 7,Q33 6,901
DoloreoGarfle1d 700 690 520 560 030 1,660 1,200 1,230 2,293 2,011
Hinsdale ‘
La Plata 1,470 5,620 1,510 1,500 1,500 1,200 900 720 1,384j 1,221
Mesa F 7,850 6,090 7,920 5,500 8,660 8,400 5,100 6,210 7,221 7,041
Monteaama I 1,430 1.260 1,160 770 1,080 1,650 1,610, 1,520 2,0401 1,931
Montrooe i 4,000 0,220 1,000 3,210 4,220 .3,590 5,080 5,480 6,170 0.501
Ouray 200 150 240 220 260 60 55’ 81
San Juan !F
San Miguel F 10 60 60 50 70 100 90 60 78 81
STotal W. Centraland S. W. Dist,’ 20,130 20,200 18,710 18,700, 21,700 25,500 18,100 22,830 26,522 26,211
Alamooa :
Coneios F 70 100 160 120 110 90 60 9 21
Cootilta ‘ 60 60 10’ 50 70 60 10 100 400, 521
MineralRio Crande 60 40 31i 20 10 30 30
Saguache 20 10 10 19 10 10 20 ‘ 2’
eTotal S. Central : ‘ ‘ , FDistrict 210 210 290 230 220 190 1401 _J9 P
Baca 410 620 700 II0F 750 650 670 120 289 30’
Bent 10 IsO 192 0 19 0 50 0 111 0 10 00 00 3 100 2 035 3 28
Crowley 4,710 4,820 0,040 5,350 1,050 1,560 4,050, 3,510 5,0331 7,04
Custer . 70 50 60 100 120 100 70. 70 217 10
Frensont 2,700 2,600 2,730 2,17,0 2.000 1,930 2,3601 1,540 1,403, 2,63
Huerfanu F 600 930 1,080, 960: 1,140 610 6601 740 406 30
Las Animas F 1,950 1,560 SIlo 1,110: 1,060 2,250 2,150 1,020 1,221 95
Otero _..J 10,000 10,240 10,200i 10,720 11,210 11,760 9,260 5,610 6,7101 5,70
Proweco I 12,610 17,800 18.030 26,550 10,030 15.900 13,510.4,650 5,056, 7,10
pueblo 10,060 6,630 8,660, 7,150 6.350 6.660 10,710, 5.050 8,652 6,51
Tetal Seulheas.t I
District 55,010 69,730 60,190, 13,030, 57,570, 53,920520101
24,400312901
34,60
State Total 123,060 132,990 132,7101 124,4001 142,200, 161,410 15045o 128,804 165794[ 152,00
*Indicates approximate location of District for which Counties are given above.

S’i’ATE 01” COLORADO 33
CORN (ALL PURPOSES), IRRIGATED AND NON-IRRIGATED—ACRES UARVESTED—1927-1936
COUNTY 1927 1928 1929 1910 1931 1932 1933 1934 1935 1930
Roe
‘
i Iat Creek___i I Ib 10’ 10 20! 20 30 10 30 20)jfl
--
nd [mi Oil
——__-_--] 40kooneOat 2,0301 1,530 1,020 1,010 1,180 2,270 1,810 1,000 1,025 1,320k I(in
F --
Blanco 70, 80 ‘ I 30 3’) 360It 40 30 10amiter ‘ 10 20’ 10 20 40 40 30 20Fatal North-
‘west Dist.__ 2,180 1,670 1,030 1,070, 1,530 2,320 1,820 1,634 1655: 1,740IcIer 8,410’ 8,7001 9,060 7,780 11,210 11,440 9,930 10,630 12,023 8,162eroon 4,000 4,930 4,780 5,270 3,210 4,610, 4,120 6,823 0,070inter 11 1 0 10 aOO 101 0 lob 0 11010 11 0 12090 1° 300 ii 8’ it 90an 111,870’ 96,000 88,170 80,023 102,530 142,570 110,210 70,070 132,705 110,600‘gan 08,090 70,400’ 78,060 08,720: 73,010 61,800 80,040 40,110’ 01,580’ 04,700gwick 38,200 34,000 20,780’ 27,14i 52,830 53,060 52,080 35,570] 00,057 40,5000 910t 100000! 04 020i 820101 Sc, OoO 111630 1’O 800 99285 12200 101 o80I’otalN.Cen- ,
tral&NE. , 1Dist. 321,070 329,600’ 315.720 292,120. 325,710 420,400 426,620 272,150 407,718 352,590me 32,200 33,000 32,030 20,332’ 38,320 47,420. 48,580 25,469’ 45,252 45,H0pahoe 25,030 27,000’ 25,110 25,100 28,970 37,020 15,060 28,311 31,210yenne 66,070’ 70,100’ 74,850 83,310’ 91,330, 00,800 63,400 10,190, 28,127] 27,740vet -
——
‘
:
glee ‘ 13,090 12,740! 13,780 13,860 15,050 14,830 15,000’ 14,370] 12,226 10,000‘it 1 51,440 48,650 45,000 48,470’ 51,080 70,110 73,200 10,820’ 40,282 50,100Paso 62,150 57,850 57,260 55,422 50,580 65,050 63,210 46,470, 47,823 51,165a 10 040 5 2’O s9 740, 60 680 00 ‘10 4 90 o0 10 10 Di 20 00Carson 215,070, 151,000! 147,400 150,120 153,100 172,050 188,700 40,060 50,000 02,750coin 2,000] 81,250 70,080 83,280: 70,940 57,840 66,100 00,080’ 00,017 50,070lips 00 69200 9 SO 145 0 ilO 0 11 100 i0 ‘40 61 80 102 Oh 500 994,hington 121,100! 210,000] 124,210 118,380 145,350 180,900 189,230. 103,420 130,124 162,830‘
i96,27O 225,390! 233,450 230,470’ 243,520 202,570 270,600 100,380 104,318 370,700lotaIR.Cen- ] I ‘Oral Dbst.. 001,680’ 990,100, 972,470 940,400] 1,055,900 1,101,780 1,179,990 500,970, 756,474 792,865koleta 420 200’ 400 200 500 000 919’ 450! 846a 4,220 4,200 3,310 3,540 4,780 6,200 4,640 4,700 7,021 7,000ices 2,020 2,000’ 1,720 1,520 1,030 1,700 1,703’ 1,050 2,015’ 2,380Seld 1,110: i,ooo1 500 600’ 980 2,070 1,430 1,260 2,098’ 2,510idale I ‘
. ‘ ‘ !Plata 2,5S0 2,300’ 3,230 2,010 5,020. 3,020 2,609 1,900, 4,612 2,370a . ‘ 8,380 8,800’ 0,200 8,930 9,740’ 9,160 0,040 8,450’ 7,503’ 7,420tesuma .., 4,040 5,000, 5,030 4,170 5,180 7,190 6,330 5,200, 5,122’ 4,940itose .‘ 4,110 4,270’ 4,190 3,080 4,460 5,880 5,420 5,050’ o,sss] 6,539ay 200 420’ 210 220 201 00 55 00Joan I‘
MigueL__..’ 070 600! 200 210 540 430 430 400 288 350‘otal W. Cen I
‘.
tral&S.W. F 1Diet. 28,290 29.670’ 27,580 26,260. 39,360 37,860 29,790 30,200 37,703 34,560nosa ] : ]
.
:ojos 70’ 100! 5001 120, 010 90 60
‘ 9 20lila 80’ 60’ 90 80’ 70 00 29’ 100 400 529oral ‘ I ‘Grande____ 00 40, 20 10! 30 30 70 Isache 20 1,11 10 , tO 10 10 20 20‘otal S. Cen-’ 1 I
.
Oral JOist. 220, 210 290 220 220 090 110 100 409 560F 48,02& 60,020 68,510 02,240 94,370 91,640 34,860’ 2,890 5,772. 5,310‘ 19,840] 26,100, 27,320 22,820, 25,970 19,430 15,170 4,920 4,026. 4,030eley 8,230! 0,000, 10,120 10,170’ 8,500 5,200’ 8,200! 2,590 5,502’ 8,000er 090 730 500 580 700 000 880 400 1,812 1,720aunt , 3,890 3,500, 3,580 3,270, 2,740 2,600 3,630 3,000 4,977 4,060cfano 7,000 6,000, 0,220 5,370 5,210 5,070 5,000 4,100, 9,101. 2,820Animas____ 14,650 21,100, 22,700. 24,210, 12,110 28,520 17,080 3,250, O,52?i 2,975o ‘ 22,010, 11,005 11,720 12,510] 12,440 13,220 10,000, 3,750, 7,215’ 5,900vera . 30,550 40,700 40,920 3:1,500] 57,210 37,240 25,400: 5,310 5,322! 7,930tie ‘ 21,520’ 25.230! 24.070 20,120’ 25,210 10,070 21,080’ 6.430 - 17,701 11,260
‘Mel South ‘ , ‘ I 1 1east Dist.__ 070.350! 204,759 215,890 195,800. 246,290 216,270’ 126,710’, 37,650 63,647. 57,603ate Total 1,413,900’ 1,555,000’ 1,523,000 1,456,000] 1,660,000 1,859,000. 5,785,000, 943,704, 1,267,616, 1,240,920
*Indirates approximate location of District for which Counties are given above.

AGJI1rFL’PiERAL STATISTICS
WINTER WhEAT, IRRIGATED—ACRES JIARVESTED—1927-l 936
COUNTY 1927 1928 1929 1930 1031 I 1232 1933 1934 1035 1936
Chaffee I I 20 30’ 30 20
Clear Creek I
Eagle 20 20 910 266 156 12& 260 0 10 56
Cilpin ————,
I
Grand 370 40 10 70, 50 30] 20 10 20 20
Cunnison 20, I 10 0 46 50
JarksouLake I ‘
Muffat 130 80 501 100, 30 10 60 200 302’ 220
l’ailc -
‘ --
l’tlkin ‘ ‘ 10 70 60 10 20 180 100
Kin Illanro 220 70 10 30 10 70 60 63 56
ltsiitt 160 110 210 30 10 20 100 101 350
Summit ,•,, 10 10 20 52
‘Idler ______‘
I j
- ‘l’ot,ul N art Owest IDistrict
---600 3501 L280 620 290 290 400. 455 0027] 890
10,790
7,570 0.100 7,050, 5t60 1,420 1,220 5,200 4,593 7,520
.lu’Il’m’i’sou - 8,260 4,250 5.000 4,000 2,150 1,000 1,210 2,0101 1,550 5,830
l.uir’uuiee ‘ 6,340 4,810 0.100 0.000 5,710 1,030 000 4,110 5.512 0,510
logan I 3,630 2,000 1,110 1,100’ 400. 400 200 5991 1,051’ 2,020
Macgum, __720 980 1,100 2,820’ 400’ 160 100 620’ 780
S,’,lgwiek 2,3001 440 200 530 300’ 250 140 300; 480 250
Weld -20,050’ 10,850 20.710 17,800 10.710 8,170 0,100 12,270’ 31.023’ 22,530
‘Total N. Centraland N. E. Dist. 52,700 39,930’ 44,250 41,990 32,490 14,230 00,140 26.750 28,159. 45,440
Adonis I 0,590 0,020 5,440 5,030 1,010, 3,050 2,002 4,320 0,720, 8,500
Arapahoe ‘ 1,750 1,250 1,350 1,170 1,1 101 810 550 1,440 1,442 960
Cheyenne;
Denver1
-—
I
Douglas 00 190 210 100 00; 40 50 1561 100
ERect 300 20
El Paso ‘ 710 90 110 20 80 80 40 40 101 30
Kiowa 410 ‘ .
Kit Carson 70 _ .‘ 100 140
Lincoln I I 150 250 100
Phillips I ,
55,raslnngton 110 00 50 100’ 210! 80 loot iso 1401 410
Yumo 110; 140 210, 200’ 01’
°Totol E. Central,District
!
11,010 7.670 7.100 7,380 .1.000 4,210 3,670 6,700, 9,006 10.770
Asehuleta 00 °6 — 0’ 05 20i 140 0 00
Delta 1,700 020 120 370 350 370] 310 410 402; 530
Dolores ‘
I ‘ ! 30 40
Garfield 120 130 210 5Q 100 250 3551 480’ 395’ 550
Hinsdole ; ,
I
La Plato 3,070 750 070 1,000 170 5,2401 500, 2,100] 1.210! 0,121
Mesa 1,000 2,910 1.010 2,110 1,000, 070, 2,200, 1,640 1,004, 1,531
Monteeuma 090 540 400 100, 210] 1001 3701 010 410’ 415
Montrese 1,050 1,280 500 0501 000, 1,010] 580, 000, 811 071
Ouroy 10 20 40, ‘ 30 50; 50’ 100 01 SIC
Son Js0n ,I t
Son Miguel . 70 50 10 _ 110. 01 90 lso 110 121
‘l’ol ‘ml W. Central,suit S. W, Dist. 23,050 500 LOGO 4,700 &210 &350, 2,520 L910, GM?, 7,531
Alaus,,so ... . - ‘ 00 00 10: 50, 001 20 ss]
00
00 10’ 140 70’ 50, 851 ]t’,,slill:m 1,490’ 250 290 520 200’ iso’ ioo’ so: 010, 211
Miner,ml ... ‘ ]iii, i:-,,,i. .] 510 40 40 50, 40, 30 10. 2141 ‘ It
So sortie .. 4.250 10 10 10 50. 30 30 , 300 150
‘ii S. Central , ,
‘ ] ‘ IDistrict , I 6,580 420 460 400, 540 140 2511 42-1’ 056, 361
t’t,ueo 110 ] 1,010 280’ 110, 200’ 1.51
heat —- -: 0,910 5,230 4,500 2,050. 2.200 1.111, 1,410 1,1101 1.244 0,53’
(Drewley : 510 220 120 040 50 00 70 10 lIt
Custer 010 260 150 200’ 220 120 310 210, 150. 12’
Frentent ‘ 540 310 200 00 110, 10 100 410 170, 0
Iluerfano 350 240 210 10] 200, 170 1201 230] 00 Si
Tao Animss 450 550 1,100 1,010; 170, 200 801 270] 110 lIt
Otere 2,500 2,080 1,170 1,420’ 630 2701 1201 1,5101 1,42’
Prowers , 5,200 3,620 1.110 5.0 10] 2.070 2,540 i,00ol 2,530] 3,020] 0,01’
Pueblo 2,210 1,780 1,500 310, 540 140 210 550. 1,446’ 1,10’
°Total Southeast “
I , —- ‘
District 17,000 13,590 14,410 12.5801 7,220 7,120 3,040. 9.130, 7,966 13,92
State Total 102,060’ 69,400 72,760 67,750, 45,750’ 30,470’ 21,910 40,00O 51,351 78,91’
°Snthirstes epproxinoiste location of District for svhirh Counties ose gLen elteve.

STATE OF’ Ct)LuI{ADu
WINTER WHEAT, iRRIGATED AND NON-IRRIGATED—ACRES IIARVESTED—1927-l9:38
1027 1928 1929
o,
1010 1931 1932 19331934 1935 1971
Ic 40, to] 910] 470’ 250 200, 410: 0 10 70
nO 3791 10] 40 80 70. 60 40’ 43 100 20muon 10 30 70 50 40 20, 40 8 92 65Soon I —— -..—-
:0 —
rat 4,770 5,000 0,840, 4,210 3,010 2,440 2,040 2,293] 5,020 4,780‘1< 10 ,
iifl 60 89] 10 30 60’ 30 20 180 100Rlanco 9,3101 1,820 1,420 1,380 1,220 740 1,710] 1415 2,110 2,020
itt 2,579 2,120 1,450] 1,890 1,110 1,5201 1,990: 4,590’ 9,120 7,980smit 100 20] 30 40 20 90] 10’ 90er 470 10 10 10 20 50
Total Northwest Dist. J,i°, 9020] 10,910 8,230 7,010 3.040, 7,150, 8,361] 15,638 15,580
10cc 16,8891 17,000 13,850’ 11,700 8,001) 39791 3,790] 11,250 6,562 11,040ci on 1110 0 20 S iii) 440 0 1 0 l0 1 0 0 6 C ) a 1 11 aOlmci ii’ 0 1 flO 910) ° 00 1’<19’ 10 90 500 61’ 9100an ‘ 142,11)0 120,500. 112,780 143,090 120,180 26,050: 25340 44,477 20,133 90,000nfl 26,770 27,700 52,020 30,288 22.080 7,140; 3,510, 7,077 2,870 10,110nick 70,230 64,400 07,350 83,910 05,710 17.530 7,090) 45,882, 9,766 23,910Id 93,590 111,370 133,010 150,570 107,050 1$ .790. 22.359] 68,306 27.630 80,350
Total N-Con-’teal and N.
‘ : IE. Diatrictr 377.370 360,410 388.340: 437,610 313,270 112,250
7237Oi201,312: 75032 208,840
ms ‘19,910 59,200 81,180’ 59,110 48,100 15,270 17,920’ 38,106 19,200 35,630,pohoe 12,990 41,099 60,150 52,190 36,500 10,180’ 9,790’ 21,928 9,613 16,700ycnnc ,, 17,770, 1,780 8,070 10,890 13,230 4,350 1,750 4,737’ 200,ver ,
:glas ‘ 6,421) 7,900 7.230 9,220 4,740 2,939 2,080 6,449, 5,216 8,310cr1 ‘ 13,519] 33,200 30,940 19,740, 19,280 3,120. 1,380 8,415, 4,162 0,920Paso ‘ 4,800 2,360 1.880’ 1,710. 2,660 505 910 1,210’ 803’ 2,100
3,660]
1,310 5,579 2,720’ 15.050 1 ,39& 2,170 1,062 990’ 1,780Carson ‘ 172,410: 74,900 69.750, 99,410 60,690 13,720, 4,450 22,027 970] 11,160
coin 84,230 77,800, 71,100 41,020 43,190 10,370’ 1,590, 0,947] 5,002 7,910Hips ] 113,980 113,700: 12i,i89 143,010 109,150 21,160 27,420 69,186 21,033 92,150sbington : 163,410 ios,oos 89,370 79,210 81,670 19,530’ 9,970. 12.281! 14,015 20,980
i61,270
109,000; 112,220 154,320 126,130 12.890] so,oso] 60.010] 8,122 49,270otalE.CcnOral DuO. 854,400 621.449 665,810, 630,680 567,780 121.890] 103130] 243,177 89,522 191,160
holds 220’ 60 570 259’ 210 157 so] 140La 1,050] 605 550’ 410 390 370 310 ‘132’ 507 605Dcci
‘ 1,950, 1,1901 1,400 1,020 1,010 1,340 2,280. 2,591J 1,810 1,070Sold - - 820’ 590: 520 470 840 720 708] 601’ 700 680adale I :
‘ : :Plata 4,500 850’ 1,550 1,210 960 1,460 , 770 2,571 4,512] 9,470a , 4,930 4,160’ 2,590] 2,110 1,720, 1,530 2,140 2,590 2,916 2,390stecuma 2,820 2,1401 1,660, 1,710 1,900, 2,109 2,490 2,851 2,908: 1,290atrose 1.090 1,430 1,110’ 1,190 750 1,190 660’ 955 1,211. 1,090‘sy 460 180 200, 140 940 489 270 191 613] 280
Juan‘ F ‘ I
Migucl,,.,,.* 9,490 939, 250, 270 020 310 380 519 027, 560I’otalW.Ccn I
,
tralandS, . IVi. Dhst..,,. 20,038] 12.100] 9.750! 9,190 8.180 9,650 10190] 13,271, 15,754 15.315
roosa 60 60] 30 50 10 20eisa .. 60. 60’ 70 140 70 50, 85’tills 1,490’ 290’ 2901 320 200 180, 120, oI 350 290ccai I IGrandc__ 810, 40] 40 90 49 30] 3& 214 20
uachc 4.289, 10, 10 10 59 30] 30! 306 150I’otal SCmOral Di1t..._ 6.580 420 460 480, 540 340 230’ 424 656, 180
a ‘ 28.790] 96,600 85,443 171,280’ 257,409’ 201,279 96,100 21,845’ 516’ 150O 4,030] 5,230 4,589, 3,580 3,749 1,200 1,610 2,591! 2,785] 3,680moOcy 510: 220 120 140’ 90 60 40 70] 10] 150tcr 1,170’ 990 670 650 420 470 350 256! 150: 220asont
,. 910 370 330, 170 190 100 140 480 170’ 170clans 3,960 1,780 2,090 1,720 760 750 420 1,618 60 800Aninaas.,.,,, 8,590 3,570 4,100 4,510 5,430 2,210 1,540 948 150 170
3,180
2.236 1,550 1,590 520 720 920 1,190 1,510 1,450o’crs 14,100 10,700 22,480] 21,150 33,750 28,260 12,580 11,170 3,020] 10,190bin ‘ 0,310 9,520 7,230’ 10,820 8,629 2,770 2,260 5,805 2,410] 4,480rooalScmuh_J . :east DioO.,,, 74.010 90,810 828,790 217,810 2512201 237,810 74,890 49,864 80,791] 21,660
ate Tatah_’ 1,146,000 1095.000] 1,204,000 1,324,000 8,218,000, 487,000, 288.000; 516,739 207,393, 454,915
°Indicatcs approximate location of District for schick Coontics mire giccn shove.

,AGliItIUL’I’U 1LAl Si’ATISTICS
SPRING WHEAT, IRRIGATED—ACRES HARVESTED—l 927-1936 —
COUNTY 1927 1921 1929 1930 1931 1912 1933 1914 1911 1916
Chaffee 1,1911 1,1901 1,160 930 560 540 510 689 1,700 1,031’Clear CreekEagle 1,100 1,190 910 1,020 740 2,080 1,380 017 1,431 1,700Gilpin I ‘ 15Grand 90 90’ 20 20 20 63 40Gunnioon I 90 50 20 20 50 30; 20 60 112 100Jackson 10 I
LakeMollatt 290 3701 190 1601 130 110 190 140 273 240ParkPitkin 600 470’ 240 270 290 420 730 550 340 560Rio Dianco 220 240 110, 400 360 620 410 575 600Rontt ‘ 300 290’ 360 20’ 70 60 50 00 94 80Summit 50 59 I
Teller ;
________
l’eltl NorthwestJ)islrirt 3,860 4.060: 3,210 2,780 2,200 2,630 3,520 2,807 4,803 4,350
lboilder 10,770: 9,805 8,240 6.960 6,530 4,620 11,450 9,000 5,710 6,040Jellerson 5,270 5,820 4,520 5,310 2,020 2,600 2,680 4,140 3,034 4,310T,arimer 35,480 15,330, 9,260 7,240 4,240 6,340 7,270 10,010 12,012 10,530l.ovaa 0,150 820 620 100 460 740 980 1,580, 0,020 2,5202l,o’gan 1,000; 345 290 360 120 430 600 800 1,100 1,450Sedgwiek , 780 400, 780 140’ 380 840 410 230 380 400Weld 25,670 12,9001 23,530 22,720 10,310 16,280 22,120 21,170 23,720 19,890
“fatal N. Centraland N. E. Dist.1 62,l20 63,500 47,240 42,43& 24,790 31,940 45,870 48,320, 49,891 43,140
Adams 9,600; 7,000 5,000 1,140 1,870 2,530 6,000 6,740 1,157 8,330Arapahno i,906 2,380 2,070 1,170 800 400 710 960 828 1,160Cheyenne 1 1Denver I
Douglas 90 50 40, 20 10’ 20 20 50 72 00Elbert 20 I ‘ 10El Paso 320 300’ 440 400 00 70 70 100 101 100JCiowa 100 ioKit Carson ‘10, 47 20Lincoln 70 70 1Phillips 1
‘Washington 2401 OOi 20 70 ___ 20 220 301 220Yuma 400 ‘20: 70 ‘ .30 130 60 113 120
°Tatal E. Central I IDistrirt 12,675 10,960 L610 7,380 1830 3,090 6,930 8,160 625 10,040
Archuleta 620 620 710 590 380 470; 1,400 600 523 630Delta 4,240 4,740’ 3,510 3.150 3,430 4,560 4,170 2,710, 4,371 6,210Dolores IGarfield 6,000 4,910 ‘1,710 1,020 1,170 0,200 1,080 3,120 4,108 0,430RinodaleLa Plata 8,130 8,870 8,040 7,240 8,010 6,480 6,340 4,700: 5,112 6,710Mesa 3,780’ 3,190 3,290 2,110 2,500 3,145 1,060 1,680 1,662 2,360Montezuma 3000: 2,630 3,630 3,030 3,870 4,880: 4,030 5,010 1,614 0,000Montroso 10,410, 9,880’ 7,360 8,920, 7,020 10,790 11,060, 7,120, 10,243 12,350Ouray 1,2701 860 000 720 640 550 510 400’ 805 1,020San JuanSan Miguel 390 320, 010 400 230 690 1,090 260 446 490
‘Total IV. Central , , 1 ;and S. W. Dtst. 37,940, 36,420 33,520 31,620, 31,570 37,760 36,870 25,690: 33,000 41,320
Alamosa 2,430 2,790, 2,260’ 2,120 1,510 1,800: 4,020 2,612 4,300 1,020Conojos 6,940 7,070’ 7,000 7,050, 4,610 5,300 5,000 0,341 5,010 3,130Cootilla 2,700 2,140 2,040 2,150 2,100 2,920 3,0-10 3,030, 4,120 5,050Mineral [ 1 IRio Grando 3,980, 4,9901 4,300 4,530 3,600 4,320 9,810 0,310 13,632 11,476Sagoaoho 1,270 2,210 1,860 1,670 1,200 2,000, 2,980 2,400 0,500 3,726
Total S. Central ‘ , :District 17,320 19,800 17,540 17,520 13,200 16,300’, 26,380, 21,422 32,760 28,610
Daca ‘1
‘ ‘ 10,Dent 720 150 170 100 ‘ 320 210 310 20 00Crowley ‘ 380 430; 110 120’ 200 20 400 10 230Custer ‘ 470 901 70 130 170 100, 160 210 431 411Fremont ‘ 250 4201 170 260’ 290 240 100 210 190 211Huerfano 130 190, 150 240’ 290 260 170 90 217 161Las Animas 640 480 750’ 160 380 100 040 190 210 131Otero - 2,750 940 090 510 310 190 610 010 900 470Prow’ers ‘ 2,500 260 100 160 20 20 90 230 40 31Pueblo 1 1,260 5001 500 410 310 140 240 300 305 341
TotaI Southeast I ‘
I
District 9,100 3,520 2,770 1220, 2,080 1,895 __L° 2,026 2,281
State Total 143,010 140,260 112,890 104,950 76,770 93,090 121,980, 108,699 130,014, 131,741
9Indicates approximate location of District for which Counties aro given above.

STATE OF COLORADO 37
SPRING WHEAT, IRRIGATED AND NON-IRRIGATED—ACRES IIARVESTED—1927-1936
COUNTT 1927 1928 1929 1910 1931 1912 1931 1914 1911 1136
Chaffee 1,100 1,3101 1,160 930’ 540 510 1,251 1,700 1,030Clear Creek IIEagle 1,170 1,2101 1,010 1,060 820
1,140 1,4301 9171 1,100 1,710Gilpin 10 10 10 15’ 30 20Grand 110 o! 20, 30 20’ 70 40Gunnison 130 120 60 60 110, 100 80 108’ 140 110Jackson I 10 I I 10 10: 10LakeMollat 4,370 6,690 5,250 4,8651 3,350’ 2,620 2,780 809 2,700 2,780Park I 130 90 10 10, 201 101 30 11 30 30Pitkin 600 530, 2601 270 290 420 730’ 612 540 640Rio Blanco 3,080 2,0601 1.040: 1,920 1,530, 1,060 1,780, 1,250 1,150 850Roott 9,470 6,7401 1,670 1,200 3,920. 4,400 4,700, 3,127 4,720: 1,430Summit : I 101 10 20’ 10 so: 6 110Teller 60 ‘ ‘ 10, 301 301 34 110 100
5Tetal Nerthwest’District 20,500, 11,000, OS,360 14,370 10,660, 10,400 12,216! 0,348 12,830 8,820
Boulder 11,270 10,070 8,510 7,300 6,660 4,750 11,810 11,175 6,020 6,303Jefteraon 5,810 6,780 5,160 5,950 3,560 3,170 2,070: 5,251 4,510 4,070Larimer 11,110 16,603 10,270’ 10,040 5,160 8,240 8,000 13,742 11,100 30,003Logan : 28,350, 10,520 13,240 12,200 7.3401 9,090 32,4001 8,696 10,100 51,020Morgan 0,730 16,120 16,0701 10,810 9.1501 9,070 16,580’ 1,943 17,010 18,230Sedgwick: 1,230: 1,350 1,380, 950 250: 2,010 2,7001 1,017 6,330 8,700Weld 66,070 72,150, 60,400, 72,300’ 27,780: 43,410 11,310: 36,001 50,300 59,040
cTotal N. Central ‘ Iand N. E. Dist, 140,570 140,390 123,070: 121,550 60,300’ 79,740: 130,950 83,871: 157,050 159,065
Adams I 18,160 22,100: 17,3101 16,700 6,1901 4,540 13,320 8,853 11,460 20,130Arapahoe 8,010 14,000 11,490 11,610 0,380 2,410: 5,1001 1,103 3,600 7,470Cheyenne ‘ 010 3,020 3,370: 3,780 2,980 1,000: 630’ 844 70Denver : , IDengl0a 3,030’ 1,130: 1,740 1,660 060’ 850 1.200: 601’ 750 710Elbert 12,7201 11,460’ 12,800 10,040 7,780 8,030 11,460. 5,489 8,030 9,370El Paso 5,200 3,7001 4,470’ 4,010 3,740: 2,690 3,570 1,113 3,330 2,800Kiow’s 1,350 650 210: 210. 2301 220 270, 117. 50 70Kit Carson 4,810 21,000 29.960: 30,680 20,870, 11,120 8,0501 3,140 2,310 470Lincoln 10,200: 21,240, 16,760’ 16,010 8,010 5,370’ 10,620 2,894 9,020 13,050Phillips 2,070’ 3,140: 3,380’ 2,330: 7601 3,050’ 1,430! 4,977’ 16,670 16,300Washington 10,120’ 20,000’ 20,600 19,370 10,650’ 11,670 26,310’ 2,180 30,100 44,130Tuma 0.320 10,700 7,000 7,560 3,370 2,070 6,5901 5,712 11,560 10,620
5Total E. CentraL ‘ , ‘
District 78,910 050,240 129,170 128,590 72,720 58,410 93,460 40,513 97,110 151,310Archuleta 1 1,220 1,210 1,250, 1,910 1,500!’ 1,910 3,010’ 639 2,100 2,220Delta 4,240, 4,740 3,040 1,440 3,440! 4,720 4,710’ 2,775 4,700 6,330Dolores ‘ 1,240 1,670 1,590, 880 460! 190 1,190’ ‘ 1,750 410Garfield ‘ 6,309 6,020 5,980’ 1,900 5,800 7,050 9,919 3,236 4,620 6,860Iliosdale ‘
I ‘ : ‘
La Plata ‘ 9,180 10,370 10,230 9,400 9,039 7,840 7,740’ 5,468 7,750 7,625Nleaa ‘ 4,000 3,810 2,020 2,820: 2.500: 3,010 2,000 2,793 1,110 2,425Slontecuma ‘ 4,700 6,110’ 6,790 7,440’ 7,070, 9,910 8,490! 1.669! 8,120 6,210llontrose ‘ 20,460 9,950 7,400’ 8,910 8,500 10,830 11,650’ 7,763, 10,560 12,675Duray 1,820’ 1,580, 9391 1,020 9501 780 800! 486’ 058 1,080San Juan I
San Miguel 730 160, 170’ 410 530: 690 1,1691 726 810 861Tetal W. Central
‘
and S. W. Dist.’ 44,290 46.720 41,610 42,199 39,170, 48,090: 46,9501 26,575: 43,320 46,740klamosa 1 2,450 2,790 2.260! 2,120 1,510 1.890’ 4.0201 2,042 4,500 5,020Donejos ‘ 6,940 7,670 7,003 7,050 4,610’ 9,320, 1,910 6,141 5,010 3,350Destilla : 2,700 2,145 2,040, 2,110 2,100, 2.920! 3,610’ 3,850 4,120 1,050IlineralElm Grande ‘ 3,950 4,990 4,380 4,110 3,690 4,330 9,840j 6,319 10,600 11,470Oagoache 1,270 2,210 1,860 1,670 1,290 2,009’ 2,980’ 2,190, 5,900 3,720
Tota1 S. Central . I—. —District ‘ 17,320, 19,800 17,540, 17,520 13,200, 16,380 26,3801 21,422 32,760’ 28.610
3aca I To1 2,7901 2,110 1,760 4101 200 450‘Oeot 780’ 230 410, 170 130: 645’ 1901 389 90 60Drowley ‘ 180’ 460, 110, 120 220, 50, 630, io 230Duster ‘ 910, 500 370 340 260, 250 200 331 620 1,0250remont : 190 490 230 130 400, 310: 190’ 215 210 260Htoerfaoo : 190: 780 730 929: 780’ 1001 390 661I 310 °80As Animas I 2,670’ 740 1.4301 1.350! 9401 1201 1,110 1 012 300 450Otero ‘ 2,960! 980 720’ 010’ 400 6101 640 7351 500 470?rowex’s I 4,3801 1,300, 790 740 540j 410, 610 333! 49 9?ueblo 1 2,130 1,180’ 1,310 1,135 1,090 _& 440: 356’ 550 650
5Tetal Ssutheast1 ‘‘
District 20800 9,850’, 8,350. 7,870 5,150’ 3,980, 5,050 4273! 2,570 3,455State Tetal I 322.O00 386,0O5 335,000i 335,000’ 202,000 217,00O 315.0001 187,243, 348,0601 298,000
*Iodicates approximate location of District for which Counties are given above.

AGRICULTURAL STATISTICS
OATS, IRRIGATED—ACRES 3IARVESTED—3027-l 936
COUNTY 1927 1929 1929 1930 1931 1932 1930 1934 1930 1930
Chaffee 020 1,00d 1,010 1,4301 O4OJ 1,010 020 810’ 2,130 1,200
Clear Creek 30Eagle 1,800 3,010 2,100 1,410 1,2101 2,150 1,000 1,100’ 1,620 3,580
511pmGrand 660, 320 600 810, 700 1,120 1,120 2001 1,111 540
Cunnison 303 3701 330 90. 00 120 103’ 530 430 390
Jackson 80 43 50 80] 40 100 40T,ahe I ‘ ‘
MoO at 250 430 370 540. 420 500 350 750’ 1,175 830
lark --
IPith!! 1,070 1,530 1,700 1.510 440 1,100 1,250 070 1,020 1,000
105) Blair, 530, 1,100 1,170 1,030 2,150 1,700 1,700 1,200 1,010
110011 —— 210 1,210 510 350 210 100 00 330 110
Smsniit ... 110. 10 180 3.50 30 00 30 40 30 80
‘
,. 30
‘let at N orthwcst I IDistrict 6,430 7,880, 8,930 7,900 0,470 8.740 7,260 0,340 12,518 7,230
Ilsalder 2,570 1,5501 3.440 2.8001 5,130 1,010 3,300, 5,210] 2,745 3,210
.IO(’i’ssn 1,0701 5,020 1,540 2,0101 1,500 2,520 2,2701 3,210 3,101 2,710
0,300
5,700 5,030 4,240 4.020 5,120 4.001 0,540 0,010’ 0,010
l.ii’sii 1,220 4,130 3,070 2,730 2,310 2.500 2,100 3,020 4,020 4,270
Sloi’gan 2,200 2,050 2,200 3,340 1,200 070 1,200 1,310 2,135 3,110
Sedawiek 1,000 1,200 1,100 1,270 500 1,000 1.700 770 3,282 1,170
Weld 13,730, 5,000’ 12,010 11,030 9,600 10,000 10,210 11,200 13,721 10,070
Total N. Central’and N. S. fist.’ 32,000 26,4701 29,770 26,010, 26,210, 20,200 28,240 33,920 36,670 30.640
Adams 1,770 2,000’ 1,020 1,400’ 1,340’ 1.000 1,400 2,100’ 2,430 2,270
Arapahoe 450 400, 1,110 700 1,230 000 030’ 720 722 430
CheyenneDenver .
Douglas 30 10 10’ 20 170 220 250 40 38 35
Elbert . 40 ‘
El Paso 450 310 170 100 20 00 130 00] 101 300
Kiowa ,
Kit Carson , ‘ 10‘
‘ 60 33
Lincoln ,, ‘
Phillips ,I
XVashingtsn 110 210 00 120 230 100 250 330 200
Yams So 10 - — 10 120 215 II’
5Tetal S. CenlrsiDistrict 2,390 3,100 2,290 2,430 2,990 2.220 2,090 2.140 4,180 3,290
Arehuleta 500 0411 650 110 410 iOU 710 410 391 soc
Delta 3,140, 2,700 3,000 2,000 2,100 5,400 3,100 1,618 2,435 3,500
Dslores [ I 30 90
Garfield 2,210 1,910 2,940 2,370] 2,010 3,540 2,150 1,150 1,802 3,000
llinsdale . I 40 33 50 ‘
La Plata 3,300 2,710’ 4,330 5.850 3,360, 5,130 3,530 2,100: 3,070 2,730
Mesa 2,610 3,010 3,200 2,020 2,070 3,210 2,320 2,450’ 2,103 2.270
Slootesnma ‘0 2,200 3,710 3,005 3,060 6,350 4,310 2,500 4,377 2 551
Msntrooe 0,420 3,110 4,000 4,510, 3,300 6,030 5,000 3,050 4,760 5,330Ouray 320 600 1,070 730, 020 700 000 370 532 301
San Jsan ,
San Miguel 510 500 210 100’ 150 100 100 200 552 430
c’fotal W’. Central I Iaiid S. W. fist. 10,440 17.560 24,040 20,800, 09830 30,030 22,780 14,838 21,599’ 21,270
Alainssa 3,430’ 4,160: 4,090 0,7601 2,1801 3,230 2,010 1,450 4210 475!
Csrirjo. 5.210 3,130 5,340 4,116] 2,470 3,750 2,170 3257 2133 lOU(linlilla 700 830 1,200 1,080! 950, 1,310 1,770 651 1:sos 3420
Sileeral 180 250. ____]
‘ so iso110, llrainle 5,000 6,170 7,220 Old 3,000 5,700 4,030 3,551 5 160 3 31toile 5104100302010910 l3sosj 4140 2391
‘‘total S. Central ‘ . I , ‘
District ‘ 17,720 18,840 22,890’ 18,910] 11,870 19,430 13,930 11,630, 17,320 14,061
Darn 10 80 80 60 00’DenI ‘ 640 1,110’ 730, 2,110 820’ 530 200’ 474] 750Crowley ‘ 1,330 970 840 700 4391 100 353 I 22sCu,ter 060 1,000 410 660’ 420 990 610 050Fremont 210 250, 400 620 410 720 600 430 010’s-iHuerfano 130 620: 030’ 220 400 700 330 570 763 99
Las Animas 300 1.20 1,300 840 910 670 720 493 j.Otero 3,580 2.3601 2,620 2,000 1,700 2,090 1,610 1 009 1 020 SOcProsvers ‘ 840 3,000 1,260 1,140 1,350 090 1 270 477 1 21Pueblo ‘ 1,050 __P fl!2 _!9’ __. _L° 820 010
cTetal Southeast I —,
District 19050 10020 9,990, 9,050, 7460: 0,700, 6,420 6.003’ Slis 7.37
Stale Total 88,030 63.6701 97,910 94,100] 72,830 96,510 01,220 70,071 97,601 09,06
“Indicates approximate lerstion of District for which Counties aye given above,

STATFS OF’ COLUIIX1JO
OATS, IRRIGATED AND NON-IRRIGATED—ACRES IIARVESTED—l927-19:16
COUNTY 1027 1128 1929 1921 1031 1132 1919 1931 2999 1938
Chaft’ee 828 1,090 1,010 1,439] 650 1,038 620 1,317 2,139’ 1,260Clear Creek 110 210 so: 10 10 991 10: 310;Eagle 1,810 1,900 2,920; 1,460 1,268 2,110, 1,690: 1,124; 1,810 1,680Gilpin 100 220 30 39 70 69’ 69: 150 420Grand 700 898 609 810 7s9 1,220 1,170 210 1,260 1,150Gunnison 1,200 1,010 400 IoO 160 1401 490 817: 500 005Jackson 90 120 60 100 120 180; 100 25! 30Lake I [ _IMoffat 2,o20 3,800 4,030 2, iSO 5,720 2,730 2,370 1,212 2,750 1,800Park 1,1SO 960 170 110 110 le 100 2671 2.330! 000Pitkin 1,570 1,530 1,700 1,010 110 1,100 1,290 993! 1,020j 1,105Rio Elanee 1,350 1,140 2,670 2,130 ‘190 3,110 2,400 1,820 1,900 1,400Routt 11,350 9,600. 9,930 10,330 0,100 11,330 8,730 7,022’ 0,310’ 2,530Sommit 240 100 100 190 00 100 150 sO 250 80Teller 2510 2,560 160 460 410 110 300 66 3,s2O 2,790
°Tatal Nerthwe,t ; I IDislriet 26,020 23,460 23,190 22,710 19,720 24,540 19,070 16,224 25,870 15,390
Boulder 2,700! 1,930 3,800 0,200 1,100 4,790! 6,040 o,281 3,050 3,6o0Jefterson 3,210 3,000 3,990 4,040, 2,370 4,930 3,780 3,992 4,s20] 4,430Larimer 7,440 6,740 5,900 5,230 5,270 6,390 6,010 7,177 8,163 0,590Logan 10,100 9,410 0,400! 6,720 6,900 0,709’ 6,060 4.799J 0,200 o,480Morgan 3,810 3,700 3,0901 3,100 2,loO 1,260 1,840 2,006, 2,3s0 3,530Sedgwiek o,000’ 4,300 9,260, 4,400 4,420 70101 0,010, 1,011 o,130 6,330Weld ‘ 1,720 lo,360 22,100 16,960 13,000 14,2s0, 14,200 la,554 17,460 17,760
°Total N. Central Iand N. E. Dist. 52,870; 49,790 53.920 43,770 40,600 49.3201 44,440 40,620 40,870 50,770
Adams 3,060’ 3,230 ‘710 2,230 1,080 1,520! 1,070 2,913 3,100 2,10Arapahoe 1,220! 1,330 3,2s0 2,430 2,310 1, 10’ 1,1301 1,456] 1,112 040Cheyenne 720] iSO 1,190 780, 840 l1t 901 160,Denver IDouglas 1,790 3,oOO 5,100 6,690 7,3s6 8,010 0,200 1,929 3,750 3,790Elbert 3,800 s,8o0 6,310 7,130 6,220 6,050, 6,760 40, 4,30’) 9,470Ki Paso 11,018 11,310 9,320 11,980 9,7s0 5,880 7,870 1,473 6,038 5,000Kiowa Iso! 320 120 110 00 280 170Kit Carson 3,740’ 3,830 4,800 1,030 2,040 2,300 2,180 186 100 420Lincoln 1 200’ loSs 1,190 010 070 210] 120 138’ 210Phillips 0,30’; 6,110 10,110 7,000 6,750 0,100’ 6,10 1,647 8,720, 10,840Washington 4,3 l0[ 6,670 4,470 3,330 3,700 3,3;’O] 2,010 291 2,570, 3,058Yuma 1,460 5,410 8,130 4,010 3,050 2,180 ‘300 1,911 LiSP 3,010
°Tatal E. CentralDistrict 47.630 31,110 17.500 32.4,0 16,130 12,380 79,780 10,970 33,179 o6,723
Arehuteoa 1,810 1,030 1.010 2,400 2,270 1,030 3,2st 5s 9,910’ 1,800Delta 3,100 2,800 3,16s 2,120 2,100 3,120 3,100 1,610 3,oO& 3,678Dolores SaD 1,028 1,000 390 olO 490: 730 8’ 000 250Gorfield 2,370 2,210 3,110 2,310 2,210 3,530 2.220 1,2131 1,820 3,320Hinodale 60 100 39 ILa Plato 3,980 3,300 5,400 3,330 1,30 5,550 1.75’) ‘310 loGO 3,02)Mesa 2,050’ 3,290 3,4s0 3,210 2,270 $,los 2.540 2,150 2,350 2,310Monteouma 2,510 2,900 4,310 5,230 5,330 8,2o0 6, ‘90 2,780 1,580 2,900Montrose 2,440 3,3oo lob 4.040 3,’Oo 7,038 .3.’2e 4,012 5,010 5,330Ouroy 740 828 1,300 920 050 940 \201 324 760’ 430San JoanSan Miguel 2,080 2,330 coo 45Q1 210 332 32” 211 700 565
°Total V. Centraland S. W. DisL 23.060] 2.1.160 29.930 _L° 29,500 l5.602 25.036! 23,690
Alamooa ] 3,400! 4,100 1,600 3,700 2,10 3,230 2,040 1,430 4,210, 4,713Conejos 3,210, 5,330 1,340 4,110 2,470 3,750 2,170 3,2o, 2,160 1,600Cootilla I 700 530 1,260 l,o80 OoO 1,310 1,770 631 1,t0’ 1,420Mineral 150 200 [ I 80 190’ 90Rio Grande : 5,000 6,170 7.320 6,4o0 3,000 o,700 1,130 3,951 5,250, 3,020Saguaehe 3,170 4,100 4,380 2,910 2,370 1,350 2,920 2,661 4,140 2,320
°Total S. Central ‘ IDistrict 17,720, 1L840 2L090 38,8l0 11,870 16,460 13,930 11,630 17.3201 14,060
Baea 300 420 170 100 210 610 100 IBent 2,770 1,480 750 1,110 830 550 280 474 laO] 260Crowley 1,530 970 810 750 550 100 300 130 1,990Custer 2,630 2,160 1,540 1,380 1,S0 1,580 1,850, 981 2,130 3,705Fremont 1,190 1,020 1.220 1.6601 9,120 2,000 1,720 475 1,100 910Huerfano 3,760] 2,829 1,770 060 1,lsO 1,259 1,460 1,007 1,210] 660Lao Animas , 2,310 2,550 2,930 2.160; 2,730 1,770 2,050 1,527 930 140Otero I 3,399! 2,090 2,680 2,090 1,390 3,130 1.040 1,009 1 030 800Prowers I 1,500! 1,210 1.570] 1,170] 2,680 1,010 1,520] 1,283 ‘520’ 1 270Pueblo ] 1,920 1,720 1,300, 1,130 1,680 810 1,120 1,110 1,028! 1:620
5Total Southeast! I [ IDistrict 20,000 17,640, 14,770 12,000 13,0 It 13,050 12.400 7,956 0,070 11,165
State Total__.___j189.600l83.tot 201,000 177,000, 156,000 181.000] 160,00t 101,002! 160.430] i’oo
4lndieateo approximate location of District for which Counties are given above.

AC ILICU L’12C1’1AL STAT] 5’S’ ICC
BARLEY, IRRIGATED—ACRES IIAI1YESTED—1927-1936
COUNTY 1927 1928 1929 1910 1911 1932 1933 1934 1935 1936
ChalIce 1,720 1,000 1.900 2,040 1,130 1,640 1,250 1,160 1,009 2,160Clear Creek so]Eagle 39& 410 420 200 400 500 420’ 125 420 030
Gilpin I ----
Grand 220 370, 320 100 310 410; 200 88] $60 170Gannison 340 300 $00 00 100 399] 338] 87 130 110
Jackson 70 60 20 10 10 91,Lake ——
. _————,
Mnfl’at 90 140’ 150 70 240 100 00 109; 230 190l’ark -
l’itkiii 170 110 90 00 120 00 70 90 04
IC’, 1l],,nro 20 110 40 00 190 110 90 150 110
Ilatilt 340 260 50 150 40 270 110 150 37 20Sun,rnit ‘ 10 40 00 10 10’ 10 10 40
‘1711crI 10
°i’st’Ll NariliwesiDistrict __llP, _.2E°, 3,200 3,330 2,490 3,550, 2,100, 1,058 3,113 3,850
Ilnolder 4,140’ 4,115 8,479 7,200 0,550 6,090’ 0,070 6,070 0,795 7,250,TeII,’rson , 3,361, 2,021, 3,300 2,710 3,070 1,990. 1,6401 2,77’) 3,210 2,00’)
J,arirner 7,605 9,870 15,470 13.210 13,410 10,920 15,900 12,950 14,454 16,120
1.,,gan _.. 9,630, 13,000] 12,420 11,690 5,350 9,500 0,700j 8,970 10,500 35,330
Mor,in I a030 10100 8430 9100 ,90 90 000 0’O 1093 1100Sedgwiek 2,140, 3,310 0,919 3,180 2,390 1,050 3,100’ 845 2,811 3,51)’
Weld ‘ 23,040l 35,720’ 44,790 41,550 42,980 51,060 434991 33,570’ 18,200 59.300
Tata1N.Crntra1,
and N. E. fist. 53,800 70,190 93,850 91,070 87,680 90,940 80,450 72,740’ 102,144 104,600
Adams 3,310 3,000’ 3,010 2,970 2,790 7,100 3,870 2,090 7,370 0,040Arapahoe. 170 800’ 1,300 750 1,100 960 1,050. 090 4,374 1,480Cheyenne .
DenverDouglas 20 10] 150 90 70 90
Elbert 140 20, 11’ 302 50
El Paao 190 210 510 590 130 120 100’ sO 580 93
Kiowa 20 ‘ I
Kit Carson 130 110 100 ; .‘ 352
Lincoln ‘ 20 80 50 92 60PhClips 1
Washington 020; 1,110. 000 1)10 780 000 505, lOu 1,120 320
Yuma 420 440 30 100 —-._30 20 127 300
aTotal B. CentralDistrict
‘ 5,760 1,810 0.118 5.100 5.140 5,080 3,170; 1,980 11,050 8,630
Areholeta 20 30 170 00 110 90 90 70 40 70Delta 750 1,990 2,710 2,130 1,950 2,090 1,310 750 1,750 3,530
Dolores , I
Garfield 970 1,410 3,850 1,820 1,080 2,150: 1,059’ 500’ 900 2,220
Hinedale 10’ 30 . . 30 10
La Plata 1,510 1,480 1,400 1,310 1,810 2,210 1,150 520 1,150 950
Mesa 000 1,150. 1,270 1,100 1,590 1,840, 080] 885 847 1,010
Monteouma 000 990, 770 950 910 1,740] 1,080; 450 090 800
Montrose 1,200, 1,700. 2,170 2,470 2,130 2,810, 1,100 1,060’ 1,300 1,300
Ouray 1901 190] 120 350 140, 200 170. 550’ 171 140
San Juan ,
San Miguel 020, 740, 249 80 90’ 210 180’ 520 1,072 120
°Tetal ‘.Y. Centraland S. V. Dist. 6,820; 9,770, 11,150 10,160 10,140 13,940’ 6,8901 4,090’ 0,623 8,345
Alamosa 9,410 4.430 2,000 2,280 2,310 3,7801 2,740 1,908 ‘1,520 0,280
Conejo 1990 a0’ 8410 se Oslo ol 0 4100 02 3 ) 569Cootilla 2,540’ 2,300 2,140 2,000 3,020 3,000 3,000’ 1,521 2,500 2,530
Mineral 130i 90 ‘ 150 200Rio Grande ‘ 4,720. 0,110’ 6,810 5,020 1,750 7,060’ 5,800 4,122’ 9,010 -1,320Saguache 2,8901 2,840 2,800 2,890 1,730 3,030 2,050 1,22,, 3,500 1,810
eTetol S. CentralDistrict 17,680 21,310, 22,820 20.120 18,620 23.530; 10,220, 13112 21,150 17,700
Dara 20, ... 289 420, 220] 70’ 311 30Bent 2,800 2780 3,870 4,100 4,390 0,440’ 3,810] 2,560’ 2,132 3 459Crusvley 1,600 1,210 1,590 1,480 1,100 410] 883] L__] 330 ‘900Custer 1,040 1,000 300 360 420 290] 270 200’ 1,110 720Fremont 410 000 370 320 250 270. 180 315] 350 410Huerfana 660 300 470 170 320 2001 830 520’ 448 3701,as Animas 000 820 860 510 1,910 1,590] sso] 300’ 2.50 425Dteru 2,230 2,300 1.040 2,580 1,180 4,130 4,080 1,710 3,210 1 570I’ruw’ers 4,620 2,860, 6,710 6,320 1,300 7,710; 3,110’ 3,010. 2,200 6330Pueblo 2,100 1,950 2,020 1,510 2,210 5,090 1,180; 000 1,407 i:sso
Tetal Southeast I I
District ] 16,3201 13,970’ 19,230. 17440 18,960 22,570; 17,400] 9,1 10, 50,753 18,010
State Tatal 103,500’ 133.850, 162,460 147,860 143,230, 168,210: 137,016 107,050 l64,477 161,110
1ndirates approximate loealion of District for svhieh Counties are given gbove.

S’OATI 01” COLOIOAI)U 11
BARLEY, IRRIGATED AND NON-IRRIGATED—ACRES HARVESTED—i 927-1936
COUNTY 1927 1928 1929 1920 1931 1932 1933 1934 1935 193,1
Chatfee 1,730 1,800’ 1,980. 2,010 1,130 1,618’ 1,210, 1,301 2,2501 2,160Clear Creek 10 101Eagle 410 490 480 200 5481 5801 480 155’ 420 680Gilpin 30 20; 10 is; 161 20,Grand 240 180, 120! 400’ 560’ 470, 310 80’ 400; 520Gunnison 5351 530’ 170 200 2601 400 200; 03 170 110Jackson 501 60 20 10 40’ 001 [Lake I IMoffat I 7501 1,110, i,ioo 1,240 190; 800 700 222 460 380Park ‘ 1,120 1,260’ 10’ 30’ 28’ 30’ 20’ 37; 200; 110Pitkin 160 1701 110’ 90 60 130, 60 79 90. 130Rio Blanco 410 4001 siol 540 440 900 6001 261. 15k 240Routt ‘ 0,670 4,46k 1,080 1,570 4,210 5,000 5,120! 3,280 o°! 1,030Summit 10. 00! 40 00 80, 00 00; I 10; 40Teller
‘ 2,220: 780 120 100 80 100 00 27j 950 580°Total Nsrlhwcsl
Dktrirt 14,410 11,510 1L17O. 8,960 8,240 10,400 6,900 5,525 8,750 5,980
Boulder 4,730 4,910 6,8001 7,450 9,050 7,060. 0570’ 7,506’ 7,550, 7,505Jefferson 1,730 2,610 4,270! 1.450 1,790 2,670 2.450 3,060 4,020 4,400Larimer 6,970 10,870! 17,880’ 16,450 15.160 17,110 17,550’ 14,052’ 16,065 16,630Logan 48,750 59,470 62,100.53,180 40,270’ 40,260 so,soo; 20,152 41,450’ 45,720Morg-sn 11420 20 45 21 ItO 20210 3 305 10 1 0 1 4 0, 55 9j 34 10 lb 460Sedguirk 8,470 14,820’ 20,9001 15,500 14,110 17,770’ 12,0501 5,0121 13,0701 12,740Weld 51,400 66,790: 99,3201 88,150 67,060, 01,000 76,3101 51,275 60,250 69,810
°Total N. Ctntral.
and N. E. Dist) 135.470j 18323k 236470 204,690, i63900 100J)70 171,260 113253 156,520: 179,260
Adams 1 11,640! 18,750 27,609 18,5601 11,560’ 12,510 15,470! 6,541 11,250; 16,800Arapahor ‘ 6,500’ 8,640’ 11,9001 8.760! 9.140: 0.720 $795 1,707 6.7301 8,450Cheyoone ‘ 6,640 5,990, 14,170, 10,7401 11,240’ 9,220 3,520 2,660 260’Denver I 1
. ‘.—:
Douglas 1,460’ 1,500, 2,686: 1,750 1,200: 1,070 1,300 876: 1,520, 1,680Elbsrt 1 7.250: 0,360, 11,030; 7,2001 7,650; 10,140 6,180 $721 2,0301 2,970El Paso 1,075 1,i00 2.670 2,150! 1,270 75J 690 290! 600 210Kiowa 4,710 1,410 4,420 3,000; 4,100, 2,000 2,605 210 160Kit Carson : 32,510, 64,200’ 67,500 77,370, 55,080, 53,720 27,700, 6,804 15,135 10,130Lincoln 15050 24 1 0 05 tOo 2 320 lb 600 0 10 4601 lib 6°O 6 450Phillips 15,400, 19,010 28,000 22.480: 15.930; 9,020, 18,820; 4,906’ 16,250: 21,250Via h ngton 38550 tO Is sl OC& 0 SsO 1 tOO 1 5 38 10 1 421 3 00 62 0 0Yuma 15,060 20,650 34,400 26,6701 18,460, 26.570, 24,060; 4.101: 12,510’ 22,425
5Total B. Central , ‘ 1Distrirt : 162,860; 226,870, 277,570’ 251,470, 199,110 189,680, 129010’ 34,601, 106,680, 152,560
Archulcta ‘ 420 2501 320’ 300’ 3901 ‘110 70’ 20’Y 190Delta 790’ 2,t00 2,700 2,150, 3,970, 2,000, 1,110 704! 1,755 1,530Dolores : 410’ 620 240i 170 100; 110 200 5 200; 145G’sshold 1100 iSis 20o0 1560 1810 30 1100 5 1 360 22°0Hinsdalo : io; so .. F 20, 40La Plato I 1,9101 2,0101 1,940’ i,81o 2,300 2,530, 1,530 1,101 1,750; 1,080Mesa 820’ 1,220 1,440 1,3401 1,650 1,020 690 893 1,210, 1,0305’Iontezuma 1 1,680; 1,600, 1,125 1.26 1,040: 3,160, 1,810 557; 1,520’ 1,000Montroso 1 1,210 1,800 2,500 2,470, 2,130: 2,900 1,280 1,117’ 1,160 1,410Ouray 7801 800[ 480’ 400’ 400 560 400 200 580’ 14sSan Joan ; ‘ I I _;San Miguel . 4,340. 4,150 010 otO olD 0.0 480 002 1.45O 610
5Total W. Central ‘‘ ‘
aud 5. V.’, Dist., 13,470 36,260 13630! 12,150 13,230 17,710 9.380 5,082: 10,790’ 9,490
Alamosa 2,810: 4,430; 2,660: 2,260 2,310, 3,700, 2,740, 1.06$; 4,5201 6,280Conojo 4090 s050 5410 $80 Gel” ll0 901 11021 3 O 60Costilla 2,620 2,360’ 2,140 2,100. 3,020 3,01)0 3,060’ 1,521 2,560, 2,510Mineral 1301 00 ‘ 150. 200Rio Cr’snde tb 6110 sOlO 300 1 0 sos b5, I 22 010 4120Saguarhe 2800 2510 2S00 1800 1 30 Os) 200, j355 35 1535
°ToOalS.CrntralDistrict ‘ 17,760’ 21510 22,820 20,1201 l8,620 25,520! 18420; 13,312 24450! _M22
Daca 14,240’ 6,050, 15,560; 0,830’ 6,6O0 15.200’ 10,680! 808 350 10Dent : 3,010! 3,040’ 4,450; 4,400’ 6,710 3,0701 4.118! 3,250’ 5,450Crowley 1,660 1,250 1,620: 1,450 1,190 115 595 5351 960Custer ; 1,885 2.100; 1,100; 930, 530 8301 600 678 2,2201 2,220Fremont 1 1,0351 050; 650: 400, 370, 480 200 128 Iso! 570Huorfano ‘ 2,480, 1,410 1,15O 340 31 100 1.600 003 560: 020Las Anio,os 2,380. 1,410, 3,020 2,330 4,4i0, 3,010 2,3,0 713, 250, 430Otero 1 2,350’ 2,410; 3,010, 2,00 3,230, 4.330 4,800 5,210 3,01”Pious, 5 0 4 loOp 1 10 ‘30 10 360 1 05 1 478 0 363 2 °O0 0 o30pueblo 3,730; 2,450 3,100; 1,000 2,830 1,240 1,600 869 1,635’ 2,02))
°‘Total Southeast,.
District , 41,110; 25,600 47,010. 29,110 31,600 17,700, 40,230, 17.150, 14,350; 20,430
State Total 385,080, 112.090; 008.000 530,000, 139,000 472,000 105,000’ OL753’ 321,210 385,410
lndicatos approximate location of District for which Counties are given above.

AG lID ‘U LTUO-IAL STAYIIO’I’ICS
POTATOES, IRRIGATED—ACRES HAIOVESTED—1927-1936
COUNTY 1927 1928 1929 1910 1931 1932 1939 3934 1935 1926
Chalice 130 OlE 393 390’ 498 114’ 297’ 283 200 150Clear Creek 59[ 5Eagle 1,490 1,740 1,077 1,210 1,202 1,413 1,369 1,485 1,423 1,170GilpinGrand 210 110 33 80’ 21 85] 01’ 61] 17 40Gunnison 250 21E 107 70 73 224: 242 236] 315 250Jackson 10 10 12 10 12 6 6’ 15 10Lake 2Slolfat 20; 10 85 40 94 92 101 1041 65 228Park 10 113 ‘ 1 325 130l’itkin 1,400 1,2.20! 128 615 908 USE 951 sb: 900 1,000
lID ltlaorn 60 70 55 18’ 59 326 324 140 228 100
hoist 69 50 141 70 53 166 lOs 551 104 210
Summit 40 12 20 ‘ 20‘teller ‘ .7 isO 40
‘I’otal Northwest : ‘!
J)istrict 4,260 4,130 3,026 2,540 2,933 3,467 3,345 3,710 4,098 3,520
hloolilrr 130 180 113 10 217 207 181 50 54 16JOirerson 190 160 316 100 141 92 51 Is 25 30I mist 490 666 90 20 a4 Si .1 do 22ol.05i111 300 420 316 220 388 1,271 7771 450. 266 220
bOO 290 lii 120 l50 126 sU 66 602 60Scdgwirk 310 236 329 400’ 586 725 569’ 640 600 630
OVoid 23,250 33,010 21,410 20,160’ 26,605 24,753 16,806 19,900 22,040 23,500
“Total N. Central , ‘;
and N. E. Diet. 26,170 37,750 24,029 22,560 30,745 29,199 21,734’ 22,597 24,010 25,260
Adams 320’ 566 270 110 221 105’ 227’ 103’ 45 100Arapahoo 20’ 20 5 15 5 12 11, 5 10 50Cheyenne ‘ ‘ ‘
Denver IDouglas U ‘3 24 7 30Elbert 3 15El Paso 10 15 1 _..___ 5 30 10KiowaKit Carson ..
‘ 2s 30 20Linenin 10 j 5 15 30Phillips IWashington lOs 22 15 16 17; 11 40 10 10
Yoma 110 10 35 60 31 57 17 02 48 60
‘total R. CentralDistrict 460 946 342 200 276 253 292 269 210 240
Arrhnieta ‘ 120 143 361 84 262. 299 107 100Delta 1,500 1,190 638 720 1,354 1,829, 1,200’ 1,007] 1,610 1,020Dolores .
I 1 38Garfield 3,256 3,4101 2,446;’ 2,490 3,002 3,640 3,061’ 2,650] 2,100] 4,430
Itinodalo ‘ 50 itO] 10’ 20 1 6 6’ 16’ 20’ 20
La Plata 976 7101 146 240 1.443 1,092 991 970, 624’ 750Mesa 3,022 2,016’ 1,121’ 1,170 1,658 2,165 974 2,200 2,039 2,130Slontecuma 501 640’ 452 580 871 1,250 960 1,671, 1,446’ 1,212blsntroso 6,570 5,410 4,274’ 2,960 1,436, 7,226 5,317; 5,104’ ‘1,514 4,460
Doray 220 160 171 120 173 140 137 200 172 155Suit JuanSan Migori ‘ 130 40 42 26 21 92 106 116 62 90
‘Total W. Centraland 5. W. Dial. 18,439 12,890 9,945 9,440 14,247 18,262 13,072’ 14,047 12,349 11,363
Atioi’,sa 4,370 6,520 2,751 6,530’ 5,920 7,636 6,642 5,506 6,536 6,620
3,690
4,006 5,221 6.120 7,527 9,953 7,632 7,772 7,613 7,130tS,slilla 200 400 211 790 3,752 1,221, 873 52s 504 540Mineral 10 36’ 3 3 6 6 17 10tao Grande 18,360 18,276 19,621 21,840 15,314 19,067; 19,420 21,052’ 21,102 24,500Sagotirlie 6,350 7,360 7,313 6,430 7,451 10,057; 9,785 8,204 0,210 9,170
‘Total S. Centralliistrirt 34,990 36,600 38,277 14,330 39,015 47,939, 42,539 43,062 47,960 48,370
tIara I ‘ ;Dent 110 3 tO 6 6Urowley 16 , , 350Custer 210 190 70, 226 163, 230; 266 152 1301”remont 50 36 26 ‘ 23 46, 16, 149’ 405 350Hoeriano , 31 20 100 29, 341 31’ 35 20I,as Aitinias 2u 16 21 23’ 29; 3 2 13Otero 20 20 1 o 6 6’ 10 10Prowers 10 10 2 6 6 20 ——
Pueblo ‘ - _J9, z- ,
‘Total SoutheastDistrirt 110 320 269! 100 373 299 366 452 971 530
State Total , 84,529, 53,520 75,890 79.170; 86,594 99,418, 92,158] 84.127 89,601 92,293
lndicatos approsimate location sf District for o’tnch Conntiea are given above,

STATE OF’ COLORADO 43
POTATOES, IRRIGATED AND NON-IRRIGATED—ACRES 11 ARVESTED—1927-1936
COUNTY 1927 1928 1929 1918 1911 1932 1933 1934 1935 1936
Chaffee 790 630 398 390’ 488’ 414’ 291’ 2381 200’ 199Clear Creek 90 30 30 20 17’ 401 28 19 18,Eagle 1,550 1,700 1,133 1,220 1,2191 1,420 1,996 1,489 1,470 9,400Gulpin ‘ 120 120 76 79 81 104 124 72 90 80Grand 260 160. 30 30’ 936 936 121 100 170 00Gunnison 360; 390 2451 230 235 281) 332 2981 390 320Jackson 30 20 67 40 73 81 63 lii 20 10Lake ‘ I L I j ‘ i1 2Sloffat 020’ i,oao) 144 5401 097 977 709 798 8101 670Park 1,700’ 1,370 1,331 1,370’ 1,921 1,912 1,321 1,869 1,300’ 1,290Pitkin 0,100) 1,2201 960 690’ 908 981 991 878; 990 1,030Rio t3lanro 100; 39; 96 50 100 138 131 333 240 130Routt ‘ 197k 1,430 918 920 1,249 1,041 811 1943’ 2,020 1,080Summit ‘ 60, 40, 2& 30 31, 40 43 34 50 20Teller 1,940, 1,930. 1,313 1,290 1,368’ 1,806 1,038 1.631 1,160 800
°Total Northwest’ —) —
District ‘ 10790, 10,170, 7,278’ 6,9001 9,419 8,981 8,319 9,1471 9,237 7,040Boulder 130 200 223 10 202 265 237 16 60 20Jeftei on 90 830 110 600 63 sIb 0 160 130Larimer 640, 700’ 578 480 097’ 9g$l 191 484’ 433 230Logan 030 1,700 914 1,020 1,400 2,570 1,729 111 760 130Morgan 1,510 3,090 1,442 1,280 1,869 1,321 oIl 837 730 730Scdgoirk 10 510 400 440 , 03 Oh 9 3 000 800Weld
‘ 23,9401 34,200, 23,070 21,010, 27,423, 21,810 20,010 39,950, 22,540 23,990°Total N. Central
and N. E. fist. 27,600 41,290 27,185 25,480 33,343’ 32,436 24,322 23,041 25,599: 26,230Adams ‘ 360 700 312’ 120 292’ 218 248 103’ 10’ 100Arapahoe 10 30’ 22 10 16 17 17 1’ 1& 10Cheyenne 10 70’ 90 101 68’ 23 28 29,Denser
, ‘ I IDouglas
. 160 140 196 40, 301 288 146 19 70, 60Elbert 710 770, 509, 340, 813 079 713 96 159 10El Paso 1,010 1,000, 124: 420 004 192 7.11, 363 300, 110Kiowa 10 ‘ 81 10 10 12 31 2Kit Carson , 000 1.100j 502 300 020 207 282 10 30 20Lincoln ‘ 720 1,190 000 460 357 201 221 45 75 60Phillips 00 90 203’ 100, 111 31 101 04 30 70Washington 371 1,140 3971 420’ 362 211 214 76 100 20Ynma I _... _l 177 180 967 130 283 171 1201 200
°Total K. Central’ IDistrict 4.8.73 7,100 3,646 3,210, 4,104 2,631 3,033 1,023 935 700
Areholela 330 270. 194’ 160, 490 101 501344
430. 580Delto 1,110 1,210’ 851’ 720: 1,154 1,823 1,200 1,007 1.0701 1,140Dolores 160 300 169 180; 201 321 406 412 750 320Garfield 1 3,393 3,070, 2,616’ 2,140 3,t63 3,002 3.100 2,612 2,4001 4,010Hinsdal 10, 100: 10’ 20 1 6 0 so: 20’ 20La Plato 1,276 930’ 9491 930 1,179, 1,491 1,042 900 979 900Mesa 3,432’ 2,7901 1,363 1,410. 2,2141 2,507 1,171 2,205 2,060’ 2,190Montezuma 7061 1,030) 777 730: 1,703, 2,409 2,028 2,00-1 2,410 1,673Montrese 8,000, 5,830, 4,202’ 4,020 9,489, 7,291 1,317 5,104 4,560 4,530Ouray ; 415’ 440: 221 260 268 270 208 213, 270 200San Juan ‘-1 ‘ I ,
San Miguel 1 310 230 114 160, 300 208 349 250 2605Total W. Central ‘
‘ 1and S. XV. DisO. 20,304’ 16,840’ 11,477 10,970. 16,409 20,884 13,368 13,164 13,170. 16,429
Alamnsa 4,370 6,520. 5,704 6,330’ 0,920 7,631; 0,843 9,506 6,1301 6,620Conejos u,600 4,6001 5,221 6,920 7,533 9,953’ 7,032 7,792’ 7,610’ 7,130Costilla 200 400, 291 790, 1,753 1,210 873 523. 0001 540Mineral 10 30’ a- 5: 6 6 1 10 10Rio Grande : 18,300 19,270’ 19,655 22,046, 15,354 19,067 19,420 23,012) 24,100 24,900Sa..uaehe 0500 ,tN 53 loS, 10 Os, 8781 8204 9210 95,0
°Total S. Central IDistrict 34,890 36,600 38,277 43,330 38010 47,938 43,319 42,062, 47,960, 18,370
Baea 1 5 0 6 IBent 1 101 10, 1 161 5 0 6 ‘
Crowley 70’ 20i 5 10, 1 - 6 316Custer 1,900 1,160 1,492 1,720 3,000 1,442 2,160 802 l,e2O 1,300F’remont 420’ 420’ 338, 22K 273 357 303 430 45W 560Huerfano , 79, 50 167) 140 410, 329 168 218 350 203Las Anins ‘ 65 100 140. 170 130 131 1, 20 30Otero ‘ 30 30 3’ I 3 0 6 aol 10Prowers 10 40 5’ . 5’ 6’ 1’ 20 40Pueblo ‘ ‘
-‘Total oootheast ,‘
District 1,986’ 2,510 2,133 2,110; 4,707. 2,110 2,979’ 1,486, 2.73O 2,300State Total 100.399 114,510 90,000 94,0t0 166.000) 113,000 00.000, 92,923 101.6301 101,083
Slndicates appcoximate location of District fee which Counties are given above.

‘I AGRICULTURAL STATISTICS
DRY BEANS, IRRIGATED—AChES HARVESTED—i 927-1936
COUNTY 1927 1928 1929 1930 1931 1932 1933 1934 1935 1936
ChaSer 00 50 10’ 50 20 20 15 55Clear CreekEagle I 10Gilpin F
Grand , [Gunnison I 20 20JacksonLake IMoffat .
50l’ark ‘
I
PilkinRio lllann,Itoult ...
___-_‘
Summit J‘loller ....
‘
‘11)1 ii NsrlhsyestDistrict 60 30 40 50 20 20 00 80
20
100 100 160 110 100 100 60 90 50
20
80 00 200 40 00 100 00 103 401,ar,nier 1,410 1,040 500 110 700 000 370 070 2,700 2,020
1,140
1,150 660 1,000 350 520 920 3,400 2,470 1,91011sr;,ts . 2,210 3,790 1,670 2,400 1,210 1,200 2,300 1,050 7,060’ 0,370Se,lvsvick —- 90 130 20 110 20 40Weld 02,080 29,390 17,220 22,530 34,410 10,771’ 17,900 27,650 30,839 30,460
TotaI N. Central‘
and N. E. Dist. 38,800 86,076 20,010 26,820 16,030’ 13,230 20,810 34,110: 43,400 40,750
Adams 670 1,450 1,030 100 500’ 520 810 680’ 1,710 980Arapahoc 70 70 300 70 220 200 100 100 210 100CheyenneDenver ‘
Douglas 200 130EtheR 10 190El Paso 40! 50 110 00 450 220 ___.._ 10(’ 900’ 110KiowaKit Carson ,.....* .. 30Lincoln ‘ 1,690: p
Phillips IWashington 320 90 130 00 320 190Ynnsa 10 120 I
“Tatal E. CentralDistrict 780 3,600 2,110 710 1,260 940 1,490 1,000 3,290 1,680
Archuleta 20 10 100 10Delta 60 70 110 200 140 150 60 520 430Dolores 10 90. 55
Garfield ‘ 90 210 110 120 30 29 00 90 60 109Hinsdale . ILa Plat” .1 30 50 460 760 90 190 3,230 50 130 10)’Mesa 5,610 6,670’ 5,120 0,050 3,150 1,740 1,020 5,600 6,070 6,020Montecuma ‘ 90 120 540 520 1,450 051 310 090 2,470 2,05’)Slnntrsse 305 120 470 770 300 211’ 100 910 920Oursy 20 ! ..————.
San Juan ‘ . ,
San Miguel ‘ 440, 10’ F ,
“Total IV. Central F
and S. W. Dist. 4,680, 6,550 7,180 8,270 5.220 2,968 4,930 5,520 10,280, 0,740
Alarnosa H 58 331
Canejno 520 580 700’ 640 500 600 190 706’ 220. 270Costilla ‘ 70 750 730 600’ 470 280 722 900 709Mineral I i .—‘
Rio Grandc ‘ U 160 120,Saguacho __-__[
, 10 1.0 10’ , so:
Total S. Central , ‘
Dislriet 0, 1,330 1,730 1,5101 1,200 880 513 1,609 1,070 1,110
Baca 10 10 79 10Bent 530 870 690 410 320 200 110 110 10 ISOCruwley 1,780 3,510 1,360 1,390 370 170 1,070 92 5.400 5,990Custer 10 leFrenoont so soc 150 120 io 60 30 50’ 10 10Huerfano 110’ 180 2.0 90 10’; 110 111) 70 130 1.00Las Animas 1,590 2,410 5,700, ‘°: 3,010 2,510 0,590 580 9 030Otero 3510 IsO 00 3900 3010 3999 c9 oo 60Provers 210 150 50 270 l0O 190 91 60 230 ‘250Pueblo 4,340 5.400: 3,210 4.600 j1_99. 2.180 1,700 3,510 4,110 0,980
‘Talal SoutheastDistrirt —- 12,515 17,390 15.040 8.160 8090 13,780 6.762, 12,500 16.740
State I 1st OtO 64 940 46770 00701433101 26 450 12620 40O5t ‘I’oto
lndicates approximate location of District for winch Counties arc given above,

STATE OF’ COLORADO 45
DRY BEANS, IRRIGATED AND NON-IRRIGATED—ACRES RARVESTED—1927-1936
COUNTY 1927 1928 1929 1930 1931 1932 1933 1934 1935 3930
Chaffee 60 SW 491 50 20 321 10: 50Clear Creek F IEagle I 10Gilpin I 20’ IGrandGunnison 20 20JarksonLake
—- I IMoffat 60 10 20 60 80 110 80 32 240 10Park :PitkinRio
Blanro
j —-
—— I ____..
Routt 10 40 [ F [ [ FSnmmit J { __ITeller F :
5Total Northwest :District 70 10 80 110 140 160 100 65 270 90
Boulder 170 210 2701 180’ 400] 220 316 00’ 1001 250Jefferson 200, 300 60; 200 120: 00F 100: 171 420 290Larimer 2,240, 1,750 640: 940 1,530 1,160 1,370] 867 7,960, 5,110Logan 4,910: 8,090 6,060 7,010 5,0701 0,190 6,840: 1,712: 12,370 6,814Morgan 18,020 21,760 17,170i 22,850 17.200] 10,050 19,890 7,320’ 26,160, 18,900Sedgwick 290 200 120 130, 70 0, 110 72’ 403] 300Weld 90,180 74,580 61,740’ 74,050 oo,ooW 35,410 07.100 40,725 08.150 69.871
eTotal N. Centraland N. K. Dist. 106,040 107,400, 06,960 106,420 76,100 51,700 91,550, 59,531 135,740, 99,535
Adams 18,2201 20,030 19,500 27,800 28,0701 13,070 20,110 10,100 31,210 17,200Aropahoe : 11,200’ 14,550 16,200 25,920 22,010: 15,140 18,030, 5500 23,850, 15,500Cheyenne ‘ 430 3,050 2,800: 1,400 1,080’ 300 1,170 OW 230 100Denver I .
Douglas ‘ 910 1,120 1,050 2,550, 1,850 070 2,430: 2,088 0,200 5,120Elbert 38,330 48,350 47,080: 50,060, 55,080 40,010 58,8001 so,ossl 55,840, 55,450El Paso 50,830] 44,480, 55.3901 65,360, 44,890 32,610 47,970, 28,110, 44,660 20,170Kiowa F 480] 1,400 2501 100 400 210 260 9 30Kit Carson ‘ 060 5,200 3,740, 4,520; 3.420. 2,150 2,300 48 2,480 50Lincoln 2-1,210 40,280. 07,550 18,100’ 28,500] 11,040 52,810. 4,021 25,350 7,520Phillips 260 2901 1,020, 800, 250’ 100 5,010 11 2,100 650y,rashington ‘ 8,000 37,410: 14,920 15,000 18,020, 10,580 15,509: 1.807 22,380 20,900Yuma 620 2,090 6,020 4.710 1,220 800 5,020’ 260 6.660 1,250
°TnOal R. Central ‘H IDistrict 155,330, 199,430 -s°l 245,760 2060101 125,600 204510’ 81,428: 231,970 131,150
Archuleta I 51, 60 4W 20 170] 21F 20 90Delta 70 00 110’ 2301 17W 150 I 08 520 430Doloren 210 800 1,456 1,720, 1,180 510 5,370: 2,484 7,600 5,110Garfield ‘ itO 220 iool 120: 30 20 80 90 60 160Hinsdale ‘ ,.
.1La Plata 80 28& 880 1,330: 800’ 850 s,osW 3 iS’ 860 830Mesa 3,850 6,370’ 5,770 6,5501 3,070 2,050 1,540’ 6,281 7,140’ 6,020Montezuma : 1,000 3,490 3,100’ 5,200. 0,6401 5,710 6,610 7,761, 18,480 14,560Monts’ose F 380 ‘120 580, 820 370 200 ‘ .100, 1,800 020Ouray ‘ F 20 20; 10 F
‘ 30San Juan , I FSan Miguel : 440 400, 00, 160F 2’io 170 120’ 113 250, 420
Total IV. Central F , :, [and S. IV. Dint., 6,490 12,100 12,810, 16,210’ 16,160. 10,120 11,470, 17,6951 34,830 28,640
AlamosaF [ F
20 10 30, 380 33’ ‘
Conejoa 520’ 580 700 640 500 800 180 700, 220’ 279Contil]a 740, 790, 720 650, ‘170, 280 722 800’ 790Mineral F
‘ ,Rio Grande , io! 270 160, 1201 I 158 ‘ isoSaguarhe I - __L° _J9F _._.IP I so]eTolol S. Crnlraf I [ F
District 1.2701 1,1701 1,730’ 1,510 1,200, 880 560 1,609, 1,070, 1,210Daca 450, 1.7701 0,620, 8,820 8.710] 5,21W 3,840 soil 530Bent 840’ 2,170] 1,710 2,760 2,280, 570 530 286, 300’ 760Drowlev 7,570] 11,920’ 6.9801 8,220 5,010’ 800 5.320 82: 5,830 0,110Caster ‘ F 1’ 90 80Fremoot 120, 420. laO. . 180 40 100 00 413 80 110Huerfano 4,030’ 2,8401 2,490’ 2,200’ 1,440’ 810 2.110 1,034’ 420’ 800Las Aoimos 6,040: 7,970, 20,250 24,710 17.760 12,520 18,010 3.880 8,780 2,760Otero , 2,720, 4,640 3260 4,050, 3,170, 3,17:) 5,440 2,823: 3,520’ 4,120Prowers 260 280 380 470’ 280 250 200 7.11 2201 400Poeblo F 108101 21.290 22,190, _!!0 16.720] 9,020 17.700, 4410] 13,821] 10,200
Tetal Soolheast, I I IDistrict‘ JE° .d10 2.P 32.700 12.810, 11115 31.120] 25,780
State Total 322,000 374.000: 372,0001 410’°°°F 251.0001 221,000 385,000574,483 411,000’ 286,393
*Indicatev approximate location of District for which Counties ore given above.

46 AGRICULTURAL STATISTICS
GRAIN SORGHUMS (ALL PURPOSES), IRRIGATED AND NON-IRRIGATED-—
ACRES HARVESTED, 1927-1916
COUNTY 1927 1928 1929 1930 3931 3922 1932 1934 3935 1926
Chaffee i II
Clear CreekEagle I
Gilpin .
GrandI
GannisonJaeksanLake ——— -
-
I i
Sloffal 30! 80 110 80 20 50] 50 70 300 290
Park .. Ll’ilkia . --
I
lIla llIinc,,,_l{,’utt ...
Sununil, —-I
‘lollerL I
‘i”liI Norlhwe. tilislrirl
-
30, 80 110 80 20 50 50 70 300
Ilalilder 10! 90 30 80 103’ 50Jefferson 10 30 10 75 70 100 070 215 150
Larimer 50 110 10 110 100 550 230 900 370
l.egan 9-10 1.080 -1,240 2,400 2.140 1,910 2,510 3,520 1,273 1,5-10
Slnrgan 5,690 1,700 1,01(1 2,030 3,990 0,220 5,000 4,890 15,800 14,210
Sedgsviek - 1,840 9,200 220 1,120 370 039 520 270 50 30
W 1 ,139 2 00 a 0 00 010 00 810 1(0 1 00 3)
“Total N. CentralDistrirt 12.860 10,010 14,520 12,000 9.375 14,200 18,830 12,240 23,945 20.200
Adams , 3,750 2.710 2,055 1.9-10 3,760 3,120’ 2,520 3,310 8,100 4,560Arapahoe 2,110 3,590, 1,655 1,466 1,610 2,330 3,230 840 460 2,350Cheyenne 27,160 21,570’ 18,050 10,900 11,215 19,230 16,920 14,120 13,760, 20,120Denver ‘
Douglas —. 110 40, 40 200 350 -150’ 190 140 275, 850Elbert 1,360 1,770’ 1,370 1,520 970 3,260 1,510 1,050 420 1,960
El Papa 1,410 2.570: 4,010 2,820- 1,810 2,590 4,760 2,340 4,500 1,500Kiassa 13 HO 11680 11 65 5 949 31 10 18 10 21 0.0 17910 10 0 17 ii
Kit Carson 18,740 21,020 18,500 11,480 15,600 22,580: 20,840 16,480 27,300’ 15,420I neon 1 HO II 100 1 210 10 fi99 IsO 0 11 180 12 0 0 020 4 00 Os)
Phillips 1,490 1:90 SlOe 1,970 980 930 1,020 880 5,500 1.930\Vashinglon 15,410 10,580 15,120 14.100 6,720 19,780 15,810 1.590 16.400: 18,260
Yuma 11.-Ill 13,080 18.7-10 13.691” 11.710 16,740 22,250 23.130 27,000 27,320
“Total E. Central
.
District , 112,800 167.330 111,970 95,860 82,630 122.980 131,440 89.600 121,63& 113,766
Arehuleta : 40Delta 700 00 10 2O 10, 80 180 130Dolores 70 50 40 50 30 3 20, 220 400 970Garfield 30 10 20 20 10 85 70’ 10 -10 ‘10Hins,lale
---
l.a Plots 30 10 50 60 80 200] 100 310 50 50
Ursa 190 150 200 150 100 50 90’ 150 49 7531s’nteeama 58 100, 220 330 300 1,090, 750! 590 340 105Stnntruse -
10 28, 90 100 35
()nray - -. 19,
San Jilols ., -.‘ I
San lliisuel 230 110 lOll 35 10 30 20 20
loisl IV. Central - -
aed S. IV. Dial: 1,300 410 690 660 140 1-560’ 1.080; 1,510 970 1,055
Alam’aa -- --
[
(%lnejss — I -—.-——— 1
(i,’still,l - ‘ :—— —- , — !51111(9111 ,. ‘
lii, (i,’:,I,l,’,,. -
:.,‘
,
——,:
“‘l’alal S. CcnlraL i, i .
Dislrict I -
Dora ‘ 62,520 58,830 41,250’ 48,970’ 82,640’ 82,420] 52,200’ 22,650’ 30,000’ 35,199Ilent 11,970 9,400 12,240 16,120 11.390’ 22,190’ 15,698: 1,820’ 2,000 6,770Cralrley , 2,050 1,670: 3,020 4,120 2,500, l,260 8,715’ 430 3,550 4,120Custer 90 20 10 . 20! 70 20 120’ 190’ 156l”remsnt ‘ 20 40, 38 10: 50’ 80 250 160, 390] 230llaerfans 160 80 90, 70 lO 400[ 520 230: ‘ 200Los Anins, I 5,480 5,610 10,050 4,220, 2,450 6,170 3,650 5,530 2.200 1,760Oters 1,190 2,510 1,970 2,1501 1.760’ 5.5201 2,570[ 400 780 560Peuwers -i 28,150 29.000 22,090 22,930 21,500 40,710: 37,400, 10,030 20,000 28,910Purhia - 0.870 3.880 0.050 3,880 tOOl 0,155 1,550 5000: 3350
Total S. E. Di1: 117.210 101.870 93.578 102.190 127.tlO 165.920’ l25.30O 40,720 74.110 61,640
State Tolal : 245,000 220,000, 220,830 211,000 329,099’ 304,750, 273,080] 144,940 220,960 216,905
Gs,liest”s speraximate isrslisn of District far which C,,unties are given shave.

SlATE 01” COLORADO 47
SWEET SORGHUM (FOR FORAGE) IRRIGATED AND NON-IRRIGATED—ACRES HARVESTED 1927-1936
COUNTY 1927 1928 1929 1930 1931 1932 1933 1934 1935 1930
ffeeClear CreekEagle [GilpinGrand IGunnisonJackson
- -L-eke I -
Moffat 170 90 10 50 250 200 120: 100 10 30Park i
-P11kmRio BlaneoRoutt ISummit I ITeller
-———‘
“Total Northwest :District 170 90 50 50 250, 200 iSO. 300 40! 35
Boulder I 120 201 20: 30 so 40Jefferson 10 30; SQ 40[ 430 170 7oLarimer ‘ 70 30 20 40 310 1120 1,330; 1,990 3901 250Logan 13,050 9,640 5,200 7,220 7,010 9,000 11,030 12,724 20,190’ 15,03’)Morgan 2,980 3,250 2,090 2,300 1,750 2,940 12:170 3,020 4,300! 4,750Sedgssirk 1,0201 1,740 700 550 ‘100; 500’ 2,700 4,800 0,818 5,840Weld 5,020! 5,080 5,000 5,000 3,450i t,sso! 15,900 12,00s 22,370 11,030
“Total N. Cenlral& N F Distri I 260 19 860 13080 170 1270 910001 1310 3602 10 tOO 38210
Adams 1,510 2,140 2,900 3,020 2,520 2,5701 8,010 3,150 1,000’ 3,530Arapalioe ‘ 210. 1,270 1,290 1,010 7,450 2,420! 2,000 1,000 7,200 5,430Chesenn 0 0 isO 0 1 is 13 zOO ui.I9 0 10DenverDouglas 720! 300 155 210 370 1,038 1,170 $70 1,090 1,050Elbert 2.760! 4,440 2,000 3,010 4,710 5,040, ii,i°I 6,140 11,600, 9,020El Paso 1,400! 050 950 1,020, 1,7901 1,0701 2,700 340 5,560: 5,950Kiowa 14,120! 11,560 0,770 10,520 13,010: 10,0201 17,200 1,330 10,200’ 9,070Kit Carson ‘ 3,110! 2,970 3,500 0,250 7,610 8,200 10,810 2,530’ 11,130 9,520Lincoln 10 140 2s20 aS 1040 l0 1 210 5Q55 )0810 13610Phillips 7,110’ 3,120 4,040 3,040 5,220 5,050 10,072 10,1001 10050! 8,420Washin ton 5050 10 isO 2 630 1 slO °0 11130 15 ‘0 ‘3 1)0 9 15 21 400Yunia 35.0001 12,590 12,010 8,050 0,510 10,540 19,370 17,910 10510 39,350
‘Total East Cciitral DistricL_ 59,559 53,100 40,470 47,990 58,450 69,820 118,202 67,050 132.310 510,900
Arrliuleta I ‘ 10 IDelta 10 20 29. 591 170 00Dolores 556 100 260 50 136 030 350 60, 565 450Garfield 1 06 55 20 100 20 10’ 10 40Hinsdale I —-
___:
La Plato .. 50 00 161 10 56 250 110Slrsa 10 40 40 20 150 100, 260 logo! 270 350Montezuma 5001 350 170 30, 1601 50 20 lOt! 600 420Slontrose , : 20 70, 180 90Ouray ‘ ISan Juan ! I I I ‘
San Miguel---- 50 50 701 80; so
“Total OV. Central ‘ ,
and S. W. Dist. 440 870 550 130 120 090 510 1.570 1,950 1,580Alamosa ;Conejos ! I I ICustilla ‘ __1
7.Iineral‘
Rio GrandeSaguaehe ‘
ZrJZZz — I“Total S. Ccnlral 1 ;
District _!
,!
‘I
Bara I 520 10 650 150 200 1,170 7,010 5,250, 4,890 170Bent ‘ Ol! 150 580 100 2061 2,120 1,780 940’ 10 100Crowley 2,0001 1,060 5801 130 150 200 250 220 2,660 2,120Custer I 1 , 30 -10 120! 100Frernont loi 70 : so; 40 20 001 50 3001-tuerfano 135 730 300 420 270! 380 3,010 240 270 210Las Animas 1,690 1,190 1,000 1,750 4,020; 2,230 2,790 700 600 IsoOtero 90. 10 400 510 1191 500 1,140 00 530 250Prowers 2,110. 1,140 1,340 3,250 3,050 5,160 4,700 2,120 2,460 1.700Pueblo 120’ 830 210 130 730 810. 1.540 I1OI 790 120“Total S. E. Diet. 7.690; 5,420 4.960 6,540 9,64O 15.220 19.990 1.0.120 12,240 5,440Stato Tulal 89.6601 79,640 59,110 70.480! 81,01O 100,790 212,812, 134,402 207.288 156.160
“Indicates approximate loratien of District for svhirh Counties are given above.

-l S ,V!1tCLl,’l’uI7AI, ss’,&’.i.’is’t’ics
COUNTY
Chaffee 6,300! 6,290! 5464’Clear Creek l 20 20 11!Eagle 9,600 9,055 8,963Gilpin 20 15,Grand 940 520 341Gunnison 2,550! 2,985’ 3,327’Jackson 30’ 20 is!LakeMoltat 11,010 11,010 13,021]l’ark 10’ 30 23Pitt in 3,855’ 3,800 3,503Rio hint to. 25,230’ 18,010 37,5751Root 1 8,880 8,875 9,862S,nnntit ! 55] 50 25‘i’ellrr —- 110 155 169’
lotal S ‘rib westDistriri 68,415 62,558 63,792’
Ilotiltier 23,120 21,410 22,555Jeltrrsttt, 19,460 18,315 11,257’inn sir . 44,020, 3e,210 39,303’l.ostttn 28,148! 24,159 25,587]Slorgoo 26,205’ 25,320 28,251!Srd, trick 4,53L 4,245 4,825]Weld 116,650 300,035 101,012
Tolol 31. Centraland N. E. fist. 259,950! 231,715 236,040
Adams 10,580! 17,275 17,511Arapahoe 15,750 15,380 13905.Liteyrtlile 535 650 731Denver ‘ 185Douglas 7,880’ 7,913 9,295Elbert 12,028 12,170 12,299El Paso 7,910. 7,850 7,823Kiowa 1,2651 1,140Kit Carson 1,040. 1,870 1.880Lincoln 3,470’ 3,550’ 3,812PhiLips oSo] 720 573’Washington 3,915 ‘1,310 5,541Yuma 0 270 L791]
“Total E. CentralDistrict 76,220! 75,080, 74,622
Archuleta 5,200 5,580 5601Delta 35,510,’ 31,180 31,294Dolores , 280, 230, 352Garfield ! 39,885 40,0o0 50,153Hinsdale 20. 70La Plata 25,510 24,720, 23,888Mesa 37,630 30,780! 30,274Monteonma 10,140, 18,080 18,624Montrose 36,020’ 34,380! 33,887Ouray 3,280, 2,890’ 3,406San Juan !San Miguel 9,540! __0
“Total W. Centraland S. W. fist. 209,820’ 203,080, 197,737
Alarnooa 20,253 20,350’ 18,470Conejos 20,020 20,140 21,947Costilla 7,840 7,625 6,478Mineral ‘ 18 10Rio Grande SlOOP 12,205 12,168Sagoache 9,760 9,645 0,800
“Total S. CentralDistrict 69,495 70,105 66,977
Barn 1,030 930 1,831Bent 20,710 27,120 28,007Crosrley 15.470 15,400 14,850Custer 2,740 2,830 2,145l”romont 7,810 7,010 7,227lturrfano 34979’ 14,340 35,0221.:is Animas 18,400 14,535 17,018Utrn, 22,780 22,580 20,163t’roo’rro , 45,700 38,070 44,728l’orblo ‘ 25,690 24,825, 10,480
‘Total SsoiheaslDistrict 179,500 168,470. 170,009
State Total 863,000 811,000 810,000
2,077, 3,020 2,9103’ 10] 20
5,072! 12,350 13,050
500’, 4701.185 L°! 1,260
so c. s’is2’ 10 10
3,853! .1,120! 3,75034,754] 18,030’ 17,530
0,780 11,320 11,02022] Its] 20
_____12
55,933 64,270] 63,060
15.21 21,01021,500’12,054 13,120 32,97022,73322,22 30,51015,295’ 2 2,510 _s .11022,337 23,500 23,245
4,, 41 5.32s ‘lIne63,803 74,530, 75,730
175,574’ 189,510’ 592,070
11,2(4 12,121 11,0508,530 9,020 8,190
10 100
2,012 8,240’ 6,32s5,439 5,828 5,0503,132 5,100 3,730
317’ -IS’s! 340139 120’ 130597 050 450
71’ 00 301,973 2,350 2,1721,000 1,620 1,050
10,783 41,930 40,620
-1,043 5,780 7,11023,487 24,476 25,088
275 350 13420,078 32,700! 37,840
40 I 5019,Soo 35,545] 10,7053,397, 36,610 37,13015,041 18,235, 15,70030,450 32,000’ 32,980
2,918 3,040] 3,150
5,375 3,980 3,820
170,040’ 183,910
11,02’.’ 10,32415,215 lISle
5,130 4,055lOs, 70
OSlo, 9,5027,550’ 6,050
49,370 50,140 52,300 53,300
1,370 751 050 32020,160 23,724 24,128 23,75’s
6,760 7,732 7,530 7,8601,210 1,018 3,122’ 1,1705,010 4,030 ‘1,030 5,110
10,650 1U,2’3 11,750 12,55551,050 ‘1,050 5,0-10 5,75027,910 13,000 20,150 10,84020,025 31,101 32,110 33,12013,050 12,261 12,720’ 12,010
177,360 140,210 127,160 116,010 115,160 1t0,800 121,790
826,000 743,000 709,000 655,000 601,000 642,855 655,630
ALFALFA, IRRIGATED AND NON-IRRIGATED—ACRES HARVESTED—1927-t936
1927 1928 1529 1938 1931 1932 1933 - 1934 1935 ! 1930
5,290 4,25020 10’
591’ 8502,029 2,290
10
15,845] 13,15020’ 20,
2,705 3,140!16,540, 17,790]
9.435] 9,07039] 35
120! 160
60,835 61,460
21,0901 24,53017,319’ 15,34040,8101 40,15u20,365’ 24,15926,790’ 25,910
2,165 4,620’155,000 92,540
243,960 227,300
17,546 16,020’l2,87O 22,950
192]
7,530 9,91011,490 9,190
0,950, 5,0091,920] 1,6302,155 1,0292,59o 1,950
Sb 4103,112 3,0002,195 2,490
4,140, 3,41010] 10’
10,240] 9130!
810 790,2,930 2,070’
10.
13,900! 13,290!20’ 10
3,416] 3,349,18,609! 17,3 iS’
9,340’ 8,690’10] 49]
2°63,660 59,090]
21,7o(’ 24,22512,970 12,06830,419 31,61022,SoS 25,12024,475 23,820
4,1cc 4,2608-1,070- 79,040
210,00& 196,770’
13,250 12,100’10,740 9,149
470 415
0,110 6,5005,916 5,2203,1St’ 2,8161,155 1,300
920 730!450 340’sis iso]
2,176 2,298!1,190 1,100,
70,030 03,030, 47,790 41,000
5,040 ‘1,705’ 3,720 5,970,33,610 27,809 26,110 24,460
171 310 270 24039,471 28,450 43,705 10,760’
50 70’ so’ so!21,505’ 20,996 21,645 21,700’34,280’ 32,940 32,970 29,79819,273 13,465 22,610 22,14035,160’ 34,120’ 10,11(1 39,390
2,023, 3,500, 4,120 1,830’
5,801 4,026 4,210 3,530
204,600 191,870] 162,790
34,256 12,090’ 14, 0016,130 11,330’ 11,714
3,940 5,650 5,03426 45 129
9,129 0,570 8,9339,725 7,370 7,265
200,495 185,780
57,790 14,9102-1,860 10,210
5,900 6,02029 10
14,660 9,1289,090 8,1-10
73,320
1,17131,23916,090
3,2207,960
13,38111,37021,53045,52020,159
56,420 55,410
1,210 1,37123,916 21,920sOlo 7,9902,210 2,3907,390 5,970
SilOS 11.92013,130 12,11910.010 10.99036,110 30,99017,919 13,700
*Sndicates approximate location of District for which Counties are given above,

STATE OP COLORADO 45
COUNTY 1925 1926 1927 1928 1929 1930 1931 1912 1913 1934 1935 1936 1937Tons Tons Tons Tons Tons Tons Tons Tons Tons i Tons Tons Tons Tons
ChaffeeClear CreekEagle 0.0GilpinGrandGonnisonJacksonLakeMaffat 10.0ParkPitkinRio BlancoRoutt 10.0SummitTeller
5Total N. IV. I
District__
9.0 10.0 4.0Boulder . 12.0 12.0 12.7 12.0 12.5 12.9 11.6Jefferson 10.5 11.5 13.5 12.9 9.1 11.2 12.8Larimec 10.4 14.1 13.3 13.7 11.6 13.9 13.4Lagan 13.5 13.5 12.1 12.6 11.2 13.4 10.6Morgan 13.5 14.0 12.8 14.7 12.3 14.0 11.9Sedgwielc 11.4 12.7 12.0 12.7 10.5 13.9 13.1Weld 13.3 14J 13.3 itS fl.3 0 0
5Totsl NsrthCentral &N. E. Disl.’ 13.1 14.1 13.0 13.9 32.6 14.3 12.7
Adams 11.0 15.8 11.8 12.8 11.0 13.4 11.3Acapahoe __J 11.1 14.0 11.5 12.5 11.5 12.8 12.2CheyenneDenverDouglasElbertRl Paso 10.1 12.0 10.5 12.0 10.9 8.7KiowaKit CarsonLincolnPhillipsWashington — 12.5 14.2 13.0 12.6 14.5 13.1 12.7Yuma
5Tatal EastCentralDistrict__ 11.5 15.1 13.0 12.7 13.0 11.2 11.2
Acrlsulela IDelta 14.7 11.8 12.5 13.0 11.8 8.9 12.3DoloresGarfield 14.5 12.0 11.0 12.3 12.4 14.8 10.3Rinsdale ,_...
La Plata ‘ 10.0 9.0Mesa 13.0 9.7 9.0 10.6 12.5 8.5 11.2Mentecumallontrose .. 12.5 10.1 11.0 9.0 11.0 7.3 10.8Ourav 10.0 . 8.0San JuanSan Miguel
5TotaI WestCentral.and S. W.District 13.8 10.9 10.9 11.1 11.9 9.1 11.1
Alamosa .._.. 12.5 8.5 0.0 9.0 5.3 0.7 1.1Cenejos 11.3 0 0 8.0 0.0 9.8 0.0 6.5Costilla 11.0 0.5 8.3 9.0 12.0 7.0MineralRio Gi’andr 14.0 11.5 10.0 11.0 7.1 3.6 0.0Saguache 10.0 0.5 9.0 7.0
*Tstal SsutliCentralDistrict .,_i 12.3 9.0 9.6 9.1 9.0
BacaBent 12.5 12.2 9.5 11.0 12.8Crowley 0.0 15.0 7.0 11.0 11.2CusterFremont 9,5Jloerfano 0.5Las Aninsss.. 10.0 11.0 15.6 12.0 8.1Otero 10.5 12.0 12.1 13.5 12.3Prowers 10.5 11.5 12.0 11.5 11,1Pueblo 11.0 11.5 12.5 11.1 12.8
5Tstal S. E.District —- 10.5 12.6 11.1 12.0 19.9
State Tetsl 12.6 13.9 12.7 13.4 12.4
SUGAR BEETS, IRRIGATED AND NON-IRRIGATED—YIELD I’ER ACRE HARVESTED, 1525-1937
4.0- 8.8 70
5.08.0
7.210.4 13.5 10.5 12.2 11.4 13.4
9.4 11.6 12.6 11.5 i 11.9 12.610.1 12.1 0.9 12.5 11.5 12.410.9 12.1 9.7 14.5 12.0 12.111.7 14.5 10.1 15.0 14.0 12.511.1 10.0 5.2 13.8 03.3 13.311.0 11.1 0.0 13.5 13.0 11.1
11.6 11.2 9.0 11.0 13.4 12.911.1 12.8 9.6 13.7 12.9 12.6
7.1 11.3 10.5 10.8 10.4 11 .1
ii iT Ri iYi ïö
12.7 13.0 11.0 12.7 11.3 13.1
11.2 12.6 9.5 13.1 12.0 12.3
13.0 11.0 7.9 10.1 12.9 12.3
12.0 11.3 11.2 12.0 13.2 12.0
11.2 7.1 9.1 9.0 12.0 11.2
12.0 9.5 0.6 0.1 12.5 12.0
9.9 9.1 10.90.0 3,4 1.45.0 2.8 5.15.4 2.1
0.5 5.1 7.65.7 2.0 0.0
12.40.57.1
5.010.9
12.9
7.07.6
0.87.4
7.3
11.1110.85.07.1
10 26,8
12.611.114.2
12.111.1
0.5 4.5 7.1 6.0
12.5 7.0 10.5 10.811.1 3.5 4.0 10.3
0.3 5.80.0 11.4 11.0 10.4
12.2 30.4 81 11 012.0 78 110 12.111.5 5.0 91 100399 100 12.1 11.4
12.2 7.2 10.1 11.313.7 11.3 11.4 12.6
12.4
5.0055.2
5.00.8
5.0
11.0
520.27.98.4
ILl8.9
12.3
10.712.4
3.5 5.5
4.0 5.97.8 0.1
6.0 1279.0 12.00.5 11.05.0 7.47.8 15.0
6.8 11.29.1 13.0
5lndicatrs approximate location of District for which Counties are given above.

10 .A’lLl C PLTUIIAL S’l’ATIt4TICI4
COUNTY 1925 1926 1927 1928 1929 1939 1931 1932 1933 1834
Chatfee 15Clear Creek 20Eay.le 20 30 32 12 28 10 20 30 30 22 20 10GilpinGrand 20Gunnison 18 ——
Jarkeon Ilake
..
Ilollat 24 21 31 22 20 31 28 25 26 20 28 18 16Parkl’itkialID Ill,tneo 33 20 21llnalt.._.
‘total NW. —
District _: 25 22 32 17 28 38 27 26 28 20 30 20 16
— 23 31 34 36 30 40 27 37 33 21 25 36 30
24
00 34 32 29 32 21 22 25 19 28 27 40lslriTarr 22 31 33 35 27 40 26 26 26 17 30 28 30
30
30 37 38 30 41 28 25 23 16 28 23 2131 roafl 31 32 67 42 21 42 32 31 36 19 35 36 30Srdgwiek 32 40 39 37 43 28 31 26 17 41 32 42Weld 27 30 34 31 30 37 23 24 23 12 27 27 27
Total N. Central & N. E.District ‘ 27 30 33 36 30 30 28 26 28 16 29 29 20
Adams °8 20 I 31 35 31 36 $1 2-6 2o 36 32 30 31Arapaliee 28 28 33 32 28 36 31 11 25 16 28 30 36Cheyenne —— .
——
Denver ! —— I ——
Doaglas 31 28 48; 3930 43’ 381 27 28 20Libet 26 0 J S .11 ‘
El Pace 26 , 22 32 33 27 35 29 10 26 17 23 21 22Kiowa
15 ——
Kit Careen 27 27 31 32 30 31 29 21! 21 13 ——
Lincoln 28 ‘ 28 31 3232 39 32 16 21 13Phillips ! ! ——
7Nra_hipgtofl 30 30 31 31 37 36 30 21 32 13 33 30 30Yuma 24 3 0 2 , ‘I 0 1 1 l!’0
:.T000l E. CeotratDistriet 28 281 34j 31 32 36’ 31’ 10 29 16 30 28 30
irhuleta 6 2 17 0’ 2 l 1) s I 5o ‘3Delta 31 32 30 10 41 43 37 31 31 23 35 35’ 40Dolores -- -- ] -- ‘ -- -- ‘ -- I -- --
Garfield 26 3835 33 H 36 , 31 20 22 15 34 , soIlinedale ——
‘ . ——
I.aPlata 28 33 34 32 30 25 26’ 23 20 11! 10 28, 21Mesa 20 31 40 42 36 36 37 33 31 21 32 38 217lonteconsa 0 ‘ 34 30 33 28 21 25 22 11 24 26 , 207lontrose 31 32 ; 39 40 37 43,31, 31 32 23 30 36 36Dams’ -- ! 37 11 29 25 29 16 I 23 35 20San loanS,,o 31;gorl __ 29 59 37 33 31 16 , 33 29 23 16 ! 23 33 22
4’etat W. Ceorat & S. 34’.nt
29 N 9 30 6 26 33
Ata,nwa , —— —— ——21 ,
t’oirjos 26 23 . 2521 28 36 21 21 2-i 21 13 22 25(liii 2 ‘If 5 ‘, 20 9 4 2s 51i 3 25 ‘‘
Sliia’ral _ - rRio (ir,,,,de....___’ 25 25 27 281130133028 23 27S:LgoLctIe 22 28 25 30 31 35 11 21 2620 ——
‘i’ OtiLt S. Len—(rat Itislriet 21 23 28 26 29 37 21 21 25 21 15 23 23
Daca 30 30 36 32 34 38 27 16 28 - 10 1T 1 22Dent 32 31 40 40 34 40 21 20 32 6 15 29 25Crowley 30 27 30 41 31 42 13 10 22 6 15 26 21Custer 25 25 36 28 34 42 27 21 21 14 8 18 12Premoot 22 20 30 40 36 46 33 25 27 13 18 26 22Hnerfano , 26 27 32 28 32 27 27 38 18 7 23 36 29Las Animas_ 31 53 40 16 17 00 31 29 23 6 23 31 27Otero 21 31 40 37 35 46 18 28 31 9 28 31 30Prosvers 36 31 41 36 50 39 14 20 21 6 10 31 nPueblo 30 31 40 37 33 45 34 22 27
“Totat Sooth- Ieast District 31 _L _L _L _L JL IL 1L1 o 20 28 24
StateTotal___29 30 39 37, 32 40 26 251 28 15
1935 1926 1037
CORN, SRRIGATED—YIRLD PER ACRE HARVESTED 1925-1137(Hoshelo)
*3ndicatr approximate location of Diotr1rt for which Counties aro given abovo,

STATE OF COLORADO
CORN, NON-IRRIGATED—YIELD PER ACRE HARVESTED 1925-1937(Bushels)
COUNTY 1921 1926 1927 1929 1929 1930 1911 1932 1933 1934 1935 1936 1937
113
ii H H H H H
10 1311 13
12 12 13 20 12 30
36 13 15 22 11 1210 14 15 10 10 016 13 14 17 8 517 13 13 20 8 117 13 11 25 8 716 12 11 20 7 718 18 17 24 9 915 10 12 20 7 5
16 12 13 21 8 710 11 12 16 6 416 11 12 12 6 410 11 11 10 9 3
19 19 19 31 11 514 12 11 18 8 512 12 10 20 7 510 12 11 10 8 412 12 0 21 8 411 12 13 18 8 219 18 21 29 11 1011 12 11 20 8 715 14 19 27 10 7
14 13 11 22 9 6ii T if H1 if10 12 10 10 10 1211 12: 10 15 9 1317 15 15 I 19 12 11
H H H Ii H H10 12 11 10 8 1310 11 18 10 0 1215 13 10 17 9 12
H H H H H H
Chaffee --
Clear CreekEagleGilpinGrandGonnisonJacksonLakeMoffat 14ParkPitkinRio Blanro 15Rontt 17SummitTeller
5Total N. w.District
___:
Boulder 8Jefferson 0Larimer 10Logan 11Morgao ISSedgwirk 11Weld 12
5Total N. Cm- —-
Oral & N. If.District ___
AdamsArapahcc — 0Cheyenne 12Denver -
Dooglas 18Elbert 13El Pass I 14Kiowa 12Kit Carson 12Lincoln 13Phillips 18Washingtsa _ 12Yoma
5Tutal L Central Distrirt 34
Archolata 13Delta 12Dolores 15Garfield 15Eiosdalcl.a Plata 13Mesa 32ilootecoioa 15Montrose 10DoraySan JoanSan Migoel
Total W. Central & S. Sf.District ____
AlamosaConejssCostilla ——
Mineral ——
Rio GrandeSagoache --
5Tatal S. Central District ——
DacaDent 0Crowley 10Costar 8Fremont : 8Hoerfano 8Las Animas____ 10Otero F 0Prowers 0Pueblo
TotaI Seutheast District
State Total___ 13
9
1012
a
910
710
007
11
8401
86
Sa800
a121-I
912
119
1115
12
10
4447
051-14
I6
99
1011
161113
999
itIt12
11
12131112
12121214
13
—— 10 ——
H - H
—- —- 8
10 8 11
—Y to 89 10 98 9 101 6 .15 0 30 3 20 0 4
3 0 5 4
—i 8 53 7 (I 7O 4 5 4
4 9 10 82 7 8 42 0 8 42 3 7 22 3 3 22 5 -1 17 7 0 02 0 5 12 0 S
2 6! 6 4F 10 11
ci——. 9 95 -— 10 110 15 8 8
4 13 12 F 125 15 7 104 I 10 0 12o: is to 8
H H H H
4 12 10 11
1 4 2 02 3 0 21 4 .1 2O 5 It 25 5 10 03 7 it 72 7 tO 73 4 7 23 1 0 21 2 1) 4
I - 42 0 6 4
12 0 12 12
10 10 8 036 7 6 000 6 4 721 14 8 839 01 8 1217 11 0 913 19 8 1017 10 7 813 9 0 710 9 .1 8
!
11
it131111131014111112
ti11
12 17
14 2014 1113 1312 1111 17it 1311 14i.t ii10 12ii 12
02 11
OS 01
5lndicates approximate location of District for which Counties are given shove.

52 A(7EICULTUIOAI2 STATISTItS
WINTER WHEAT, IRRIGATED—YIELD PER ACRE HARVESTED 1925-1937(Bushels)
COUNTY 1926 1526 1927 1928 1929 1930 1031 1932 1933 1934 1035 1936 1937
Chalice 21 30 31 38 28 23 19Clear CreekEagle 34 35 34 32 20 35 20 32 30 20 30 25 ——
GilpinGrand 27 31 35 29 20 20 17 27 21 10 20 23 ——
Gunuison 30 25 18 20 25 25Jackson 28LakeMaCat 28 32 31 34 28 28 18 22 26 22 31 30 35ParkPitkin 36 33 s 27 51 21 20 25 ——
Rio Illanco 20 55 54 59 35 35 19 - 25 21 35 23 35Itoolt - 25 32 57 31 29 29 22 24 55 30 37Summit 27 32 29 25 18 27 26
27
—— —- I ——Told N. SV.
DLI rid __J 29 32 32 21 23 32 19 28 28 23 32 28 35Ilouldec -- I 23 33 35 57 25 32 29 21 27 26 25 23 55,lellersaii 22 34 24 55 26 30 26 25 25 26 27 27 37Jarimi 29 35 35 37 35 32 26 25 35 28 20 28 301ia:ari . 27 32 32 30 26 28 24 18 24 -- 22 22 205loruLrl 25 34 55 29 27 25 25 20 59 27 22 22 25Sedtuvick 28 51 35 21 29 28 25 15 25 27 25 20 30Weld 2A 34 52 34 27 50 20 25 27 24 20 22 26
Talal N. CcnIral & N. E.Diotriet. 25 35 33 55 27 30 26 23 27 26 21 24 30
Adams 20 22 33 55 25 24 55 19 54 25 58 21 50Arapahoo 23 52 52 31 25 23 26 18 26 19 27 20 32CheyenneDenver FDouglas 21 29 29 25 21 22 20 21 21 20 30 37Elbert 25 30 23 18 —— —:El Pace 25 50 29 20 25 26 25 21 21 22 50 25 SoKiowa 25Kit Corson —— ——Lincoln 32 15 26 ——Phillips ..7Vaohington __ 28 54 32 33 28 26 20 58 23 17 25 26 30Yuma 20 23 22 55 55 --
°Total E. Central Diolnet 22 32 32 38 26 21 24 15 24 21 20 22 38
Arehnleta 22 51 55 25 27 25 25 22 22 25Delta 25 32 51 35 20 32 25 32 29 29 30 28 27Dolores 25 27 21 29Gorlield 31 53 52 33 29 55 28 32 30 51 25 21 25HiusdaleLa Plots 30 34 53 25 24 22 21 28 24 25 28 22 70Moos 29 35 21 58 20 30 31 27 28 29 27 25 27Monteooma 28 32 51 25 24 26 19 24 25 24 22 21 51Montrooe 28 32 32 26 21 32 52 20 25 St 33 30 27Onray 35 32 30 29 —— 26 25 25 26 20 22 22San JuanSan Siiguel 25 52 32 26 20 27 21 22 20 19 20 20
°Tatal IV. Central K S. W.District 29 23 32 35 25 29 28 28 28 26 27 24 20
Alamoos 27 25 25 20 2.5 24 24Conejoo 27 28 27 22 27 25 27Costilla 23 35 32 50 30 31 21 25 26 28 23 14 27MineralRio Grande 23 —— 00 28 20 25 18 30 28 26 —— 16 ——Saguache 21 32 31 28 30 25 15 25 26 21 55 55 —-
°Tstal S. Central District 22 32 32 29 70 29 22 25 27 26 22 15 27
Eaca 29 28 —— 20 18 16 15 14 15Rent 28 34 34 35 31 32 30 29 53 23 20 28 27Crowley 26 34 32 31 20 20 28 15 —— 9 20 25 25Custer 16 31 51 35 27 25 26 27 24 23 22 20 27Fremont 25 31 30 52 29 25 25 25 27 18 18 26 30Huerfano 24 31 30 30 25 28 24 20 37 16 25 20 30Las Animao___ 24 54 ss 25 20 21 27 18 28 21 25 29 50Oteco _. 20 25 73 33 51 51 30 27 2’ 23 55 20 20Pcowccs 25 25 34 32 27 28 27 26 27 21 55 27 26Pueblo 26 34 33 29 25 20 26 23 25 22 25 32 50
‘Total Santhcaslllistridl 28 34 i!°2L ‘!. ±
Slate Total 25 34 33 34 27 29 26 24 27 24 22 24 29
Isdicales approximate location of District for which Counties are given above.

STATE 01’ COLORADO
WINTER WHEAT, NON-IRRIGATED—YIELD PER ACRE HARVESTED 1925-19:17
_____________ _____________
(Bushels)
________________________________________
COUNTY 1925 1926 1927 1928 1929 1939 1931 1932 1933 1934 1935 1936 1937
Chalice. 18 -— --
Clear CreekEagle 10 11 17 10 —— 19 11 17 10 13 —— 16 20GilpinGrand 12 12 18 10 11 16 9 11 —— 25Gunnison 13 II 55 19 12 14 —— 14 11 17 17 16 21JacksonLakeMoffat 17 15 16 22 15 16 11 16 14 10 11 10 19Park 12 12 12Pitkin 15 20Rio Blanco 16 17 17 22 16 17 15 12 16 11 19 12 15Routt 17 20 23 20 18 20 17 20 21 22 25 19 27Summit 50 11 52 11 8Teller 18 17 38 —— 315 11 10 0 0 —_ -— ——
°Tatal N. W.District 17 17 18 21 16 18 13 18 18 16 20 15 22
Boulder 6 15 17 21 11 75 16 9 10 10 7 14 18Jefferson 5 11 17 20 11 14 15 11 11 11 14 58 25Larimer 10 15 17 24 13 15 17 10 10 12 12 20 18Logan 12 13 17 12 30 11 8 8 8 8 5 11 0Morgan 9 50 12 11 9 12 9 7 7 0 6 0 6Sedgwick 15 15 15 15 12 19 7 8 7 7 6 5 oWDd 9 H 14 16 10 33 9 9 8 7 A 13
°Tatal N. CcnOral & N. E.Uistrict_. 11 13 53 14 10 15 10 8 8 8 6 13 11
Adams 7 11 15 15 10 10 9 8 8 6 8 12 14Arapahoe 6 15 15 15 10 10 10 7 9 6 8 9 54Cheyenne 6 5 4 10 7 10 11 7 7 5 4 —— ——
Denver — - -
Douglas 12 15 17 10 12 11 10 0 11 10 12 16 22Elbert 14 15 16 13 7 8 10 7 9 5 6 15 ——
El Paso 14 14 16 11 8 12 11 9 10 6 6 9 10Kiowa 5 5 4 S 12 12 15 4 7 4 5 5 ——
KitCarsou 9 9 7 8 9 12 11 7 7 4 5 5 9Lincoln 1 8 12 11 10 7 6 10 5 8 4 5 8 4Phillips 12 12 17 15 10 17 8 7 7 6 6 8 SWashington..j 6 5 S 6 7 13 11 7 7 4 5 6 SYoma 5° $ 7 9 5 15 11 7 7 5 8 9 32
5Total E. CentralDistrict 9 9 10 50 9 14 10 7 8 6 7 9 ii
Archuleta 33 12 15 19 —— 11 15 13 6 10 ii 17Delta 10 15 15 13 19 15 7 12 20Dolores 53 13 15 9 10 9 11 15 o 5 c 7 soGarfield 15 16 16 13 13 17 10 11 32 10 12 P 5HinsdaleLa Plata 12 16 17 8 12 13 9 15 33 6 10 12 10Mesa 10 12 12 14 14 53 13 11 12 6 6 6 13Montezuma ———-r 11 15 16 6 12 14 11 15 10 8 S 10 20Montrose 11 15 17 14 17 14 12 20 10 9 12 9 20Ouray 12 15 16 12 16 15 11 13 12 10 10 15 20San Juan -
San Miguel 14 18 17 12 55 11 13 16 14 S 12 7 255Total ‘.V. Cen
tral & S. SV.District ! L .IL JL I I 12
Alamosa --
Conejos- -
CostillaMineralRio CraodeSaguache --
I --
tTotal S. Central District
Baca 6 6 3 0 12 8 16 5 s 2 4 -- 4Bent 6 5 s I 13 5 6 4 5 5 5Crowley —— 6 7 —— 5 —— ——
Custer 6 13 16 22 14 11 15 7 9 6 —— 6 7Fremont I 6 9 10 12 11 11 13 8 p 7
—— 4 5Huerfano 5 12 11 14 11 12 15 7 5 6 —— 6 5LasAnimas._. 6 6 4 6 10 10 14 8 6 4 —— 7 SOtero 7 S 12 14 10 14 7 5 4 —— 5 5Prowers 6 6 5 11 10 10 14 S 5 4 —— 6 4Pueblo 6 1 5 16 10 12 13 5 50 5 5 9 7
°Total Sooth
______
4 4 4 16 [ + 4 4 45lndicates approximate location of District for which Counties ore given above.

Chalice 10 15 27 28Clear CreekEagle 30 28 33 31Clinic —— ——
Grand 23 24 28 28Gunnison 21 23 28 32Jackson 21 25 ——
Lakeiloltat 22 21 26 30Park 21Pittin 20 38 33 36Rio Illanre 55 21 —— 28lOots 2 22 28 29Saininit
:T,,l.l1 N. W. -
Itistriet 25 21 30 30
13
20 36 28
11
26 23 35I orient- 19 21 29 32
22
26 27 28in 26 26 28 27
Sr’I”svirts 23 25 27 21\Vrl,l 27 32
Fatal N. Central & N.E.District 23 27 28 32
Adams 11 25 27 30Araptihee 13 26 27 22CheyenneDenverhoagies 39 23 25Elbert 21 22 25 ——
El Paso 21 22 25 25Kiowa 23 ——
Kit Carson 24 ——
Lincoln 25PhillipsWashington 25 23 22Ynma 21 25 24
Tatal E. Central District 32 25 27 29
Arriniteta 23 24 53 Sj
Delta 23 27 29 ItDoterrs ——
Garfield 22 27 31 321 linsda hs — — ——
l.a Plain 21 22 28 22
21
25 31 28lieiitresnsa 95 21 25 317dontrosc 25 25 30 34Oaray 23 25 31 28San .toai_Stiti Iligarl 24 25 26 20
letal W. Central & S. W.District ._ 23 22 29 30
At:tsiosa . 20 21 25 23
17
20 25 22till;1 10 19 25 21
St mcmlItt let1 r_.._ —— 21 23 27 25S;t’;’eirhr 35 22 26 22
it S. Central District 19 21 26 22
tiara __ 30lint 27 23 27 27tresvlry 22 25 21Crntrr 19 25 25 25Frra;oot 23 22 27 20Hnerf,,no 19 19 25 19Las Aointas 15 20 25 21Otero 27 27 28 29Prossers 22 22 28 3-1Poetic 23 21 29 25
Totat Scutheast District 22 21
State Tetal_ 20 22
22 25 24 21 27 27 2-0
15 25 22 32 20 18 1721 23 23 15 17 10 2122 22 24 59 20 19 21
15 21 22 13 25 22 2314 21 21 14 25 10 17
iS 22 23 11 22 20 23
1713Hz z—— 23 25 11 10 27 2019 32 17 7 —— 25 2222 17 15 20 12 21 1723 25 22 11 3.5 24 1623 17 22 15 20 25 2526 20 23 7 16 26 2620 21 25 12 17 35 1618 21 21 12 13 22 25
I 23113 16 252022f i3H if
COUNTY
& IIIQCLYD1IAL SCATISTIe’S
SPRING WHEAT, IRRIGATED—YIELD PER ACRE HARVESTED 1925-1937(Bushels)
1525 1926 1927 1928 1229 1910 1931 1932 1932 1934 iSIS 1936 1917
22 17 1211
31 33 33
25 35
27 29
‘25 3128 1127 22
27 2627 2725 2329 2721 2725 2522 2727 25
11 20
27 30
22 1121 17
18 20
22 3520 3015 22
22 20
25 1524 1725 L 2019 1727 1523 1725 19
25
27 2025 25
25 14
27 24
22 24
30 25
20 2522 2122 2213 1020 2210 2023 , 19
10
45273525
32
271231
3321302159
202220
12 23
12 32
25 2030 21
30 21
33 2525 2510 -—
26 2913_Il21 2425 1027 1922 1520 ‘ 2223 25
28
2625
15
25
262326
23
2225202522
27
211 2627 2525 21
26 25—— 2521 26—— It
26 -—
2t 25
25
Itt 28
29 25
59 5327 2225 2520 2727 27
27 25
25 10
22 2121 17
22 1523 11
23 2222 25
25 25
22 2521 2515 2421 2722 21
22 22
21 2020 1622 15
55 17
15 11
20 15
26 16
24 22
21 17
24 1822 1010 2025 2525 23
21 15
22 23
25 2226 21
20 25
22 23
11 10
20 2121 20
25 2227 3629 30
30 25
27 21
27 2015 26
20 25
26222119
2218
21
212t9055
so55
22
25
26
2159
23
1517
20
2321272425262423
2425
28 20 2353-
5lndirntrs approximate Oration of District for svhtrh Counties are given above.

COUNTY 1925 1926 1927 1928 1929 1930
ChaffeeClear Creek 8Eagle 7 7 16 14 15 18Gilpin 8 7Grand 11 10 11Gunnison 7 8 15 15 18 19JacksonLakeMoffat 9 9 10 17 1-I 11Park 7 8 8 9 11 12Pitkin 8 18 14 ——
Rio Blanco 7 10 13 15 18 16Routt 12 12 16 21 19 13SummitTeller 7 9 10 32 ——
5Total N. W.District 11 11 14 19 17 13
Boulder 5 8 12 11 12 15Jefferson 5 7 13 11 13 12Larimer 7 8 13 15 10 11Logan 7 6 8 10 11 9Morgan 6 5 7 9 10 7Sedgwick 7 7 7 8 10 12Weld 7 8 9 10 10 9
°Total N. Central & N.E.District 7 7 9 10 10 9
Adams 6 6 8 9 9 8Arapahoe 6 8 10 10 8 7Cheyenne 5 5 2 10 6 7DenverDouglas 9 7 11 12 11 7Elbert 8 7 10 10 6 7El Paso ii 7 8 9 7 7Kiowa 7 5 2 S 5 7Kit Carson 7 5 4 5 5 7Lincoln _ 7 5 5 9 6 6Phillips 7 7 7 9 9 10Washington 5 2 4 8 5 7Yuma 7 2 4 7 6 10
Total E. Central District 6 5 7 9 6 7
Archuleta 11 9 10 9 15 12Delta 9 13Dolores 7 7 7 8 Il 12Garfield 7 9 16 11 20 15HinsdaleLa Plata 9 9 10 9 14 13Mesa 7 7 8 9 11 13Montezuma ____ 8 8 9 8 11 12Montrose 7 8 11 11 10 14Ouray 8 8 13 11 10 111San JuanSan Miguel 9 9 11 9 11 15
Total W. Central & S. W.District 8 8 10 9 14 12
AlamosaConejosCostillaMineralRio GrandeSaguache
*Total S. Central District
Baca 1 1 2 7 7 7Dent 3 4 3 9 9 8Crowley 9 —— ——
Custer 9 8 11 10 12 14Fremont 7 5 9 10 10 15Huerfano 3 7 6 7 10 9Las Animas ____I 3 5 2 7 8 - 9Otero 7 7 3 8 14 9Prowers 1 4 2 6 9 7Pueblo 4 6 5 6 50 9
5Total Southeast District 3 5 3 7 9 8
Slate TotaL_76 8 10 8 S
1932 1932 1933 1934 1935 1936 1957
11 10 9 9 22 23 2250 12 9 12 20 21 17
21
—— 179 10 9 10 15 23 18
—— 10 9 9 10 -—
9 10 7 7 10 11 1810 8 8 7 7 8 ——
11
2211 14 10 5 15 7 2010 11 13 12 17 21 2610 10 10 8 20 —— —
10 8 11 8 20 11 21
30 11 11 10 15 14 23
10 6 7 7 8 10 128 8 8 9 14 12 168 8 7 6 9 12 124 5 6 4 6 7 44 5 5 5 6 5 35 5 5 1 9 6 45 4 5 4 5 8 (7
STATE OP COLO1IAI)O
SPRING WhEAT, NON-IRRIGATED—YIELD PER ACRE HARVESTED 1925-1937(Bushels)
55
5
6II4
6a7
344‘13
41214
810
1212111410
12
4462
63
4224I3
48
1359
1112
1212
9
7 5
8 10
9 116 7
4 2
9 1111 18
9 1813 10
109 99 18
11 179 10
10 20
45
0
7
444
S966
7)
7
8
111012
811
88
545
84
0
94
0
516151111
13121316is
16
13
88
10
a0
53
1250
336664
0
15171215
158
111415
12
13
101110
9
6
96
11 8
5 25 45 27 8
-- 84 85 35 74 36 6
•1 46 5
9
77
11
11
S
I 1
4Ii
4
7
66
Ciruhicates approximate location of District for which Counties are given above.

50 A(3TTCTJLTUIIAL S’t’A’l’ISTICS
OATS, IRRIGATED-—YIELD PER ACRE HARVESTED 1925-1937
________________________________
(Husliela)
___________
-
COUNTY 1525 1926 1927 1929 1529 1930 1931 1932 1933 1934 1935 1(336 1937
Chaffee aol 38128 41 32 46 241 311 351 331 32135 17floor Cre1c. —— 35 —— —— —— —— —— ——
Earrie 11 57. 571 4S 37 33 461 31 HGilpin ——
—— —— —— —— ——
Grand 3(3.41! 41 43 38 sol 17; 37j 35! 22: 42 So 20Gunnison 29 39 so 37 36 39 17 36 I 3o 36 47Jackson $1 36 16 31 31 46 16 31 I 31 26 —— —— 2aLake
. I -- —-
-- -— -- . -- I --
SIollat 39 43 43 46 38 38 25 43 12 21 37 40 30Pork
..
-- IPitkin 13 50 51 44 32 51 35 18 42 32 32 10 12Rio tllanco 41 43 —— 46 46 31 43 47 39 16 37 48 5Roott .. Ii 13 49 46(41.50 29 38’30 14• —— 55 sOSuinnut 10
__ 34 38 40’ lii 30 30 34 35 37 4o 48‘teller -- .. 79 24 —— ——
-— I —— -—
. —— ..2_ ——
III N. V. — — — —
— III 48 49 49 37 48 9*z 2_ Si!. .t ._ -4__llool,ler .20 44 44 44 37 -15 43 49 49 15 37
74 12 42 49 38 42 10 32 37 30 41 10 49Larinier . 21 41 45 41 43 49 44 17 40 33 39 38 48logan 43 49 45 43 39 59 12 32 34 31 47 18 38Morgan 46 90 47 42 19 47 47 31 39 33 32 41 40Sedgwiek 42 41 44 38 42 30 41 43 32 33 51 50 55Weld 41 49 46 41 43 41 41 37 36 31 36 13 42
°Total N. Central & N. 14.District 37 47 43 43 43 43 42 37 38 33 40 36 45
Adorns 39 42 42 39 46 42 35 11 36 27 19 95 41Aropahoe 35 39 39 19 43 37 40 26 38 33 37 Is 45CheyenneDenver
-- -— —-
Douglas 29 16 36 35 36 30 42 23 99 31 27 4.5 41Ribert 31 —— 30El Paso 11 13 34 32 33 39 41 32 11 28 32 97 32KiowaKit Carson 13 27 22 24 ——
LincolnPhillips — ——
SVoshington _ 42 37 42 34 42 42 43 26 37 19 47 40 42Ynma 41 -- 40 31 —- -Il 32 3.5 33
‘Total K. Central District 36 10 40 37 44 40 38 30 37 29 38 33 43
Arehuleta 50 3.1 1 s 22 55 42; 41 31 13 20 37 40 .11Delta 35 41 40 41 44134347 31 30 30 45 40Dolores
8 —— —— —— —— —— . -— —— ——
—— 37 36Garfield ‘7 40 43 44 11 49 ‘ 31 40 43 49Hinsdale 31
—— ——
—— 36 40 41La Plato 32 37 37 49 38 49 I 47 . 41 37 29 33 43 40Mesa 57 37139 43 46. 421 °l 38 36 30 46 49Montezuma 29 41 41 35 38 42 35 41 33 24 29 33 42Montrose 36 38 40 43 44 45 33 49 38 11 27 42 30Ouray 37 41 48 46 41 36 41 36 32 ‘10 33Son Juan --
-- I
San Migoel 32 34 17 34 40 51 ‘ 43 46.. 39 28 42 97 2
°Total 55’. Cm- .
tral&S.W’.District 23 39 40 41 42 43 41 43 36 31 31 42 41
Alarnosa 27 36 30 37 38 Il 24 96 39 26 23 28 16Conejos 13 17 37 3 40 16 38 46 37 27 29 31 49Ceatilla 33 33 33 3-1 42 31 10 47 39 32 30 31 39Mineral 33 38 38 36 27 32 35Rio Grande 12 37 38 37 37 29 23 21 34 27 37 33 17Saguache 27 18 38 36 35 29 16 40 96 22 32 39 40
0TetaI S. Central District 30 37 37 36 38 32 26 39 36 26 30 30 38
Daeo 26 -— 13 —— 39 -— 37 23 33Dent 41 3-1 34 39 43 43 37 34 46 26 24 42 45Crowley 30 40 40 43 40 48 27 14 33 18 24 38 46Custer 30 39 39 36 38 39 32 29 34 20 21 11 25Fremont 42 41 40 44 41 40 38 12 35 17 32 32 22Kuerfano 36 41 41 38 42 47 43 27 37 18 37 45 42Los Antmos _ 34 37 37 39 34 37 38 24 39 16 42 41 47Otero 42 49 48 43 44 50 40 95 43 26 17 45 45Prowers 27 33 39 39 46 43 37 97 45 28 12 ‘10 47l’urhlo -.
53 37 99 19 40 45 13 31 37 21 37 33 33Total Ssalh
moot District 36 41 42 40 41 45 37 32 40 24 34 38 38State ‘t’otaL__ 36 42 42 41 41 42 38 39 38 38
*ind)eates approximate location of District for ss31)011 Counties are give nolove.

SlATE OF’ COLORADO 57
OATS, NON-IRRIGATED—YIELD PER ACEE BARVESTED 1925-1937(Bushels)
COUNTY 1925 1926 1927 1928 1929 1930 1931 1932 1933 1934 1935 1936 1937
Chaffee 15 14Clear Creek 17 19 17 19 20 22 13 21 22 15Esgie 24 22 29 23 20 27 17 28 23 20 24 30 28Gilpin 10 17 17 18 23 18 15 27 20 18 23 32 30Grand 22 18 19 21 —— —— 15 21 21 18 19 30 25Gunnison I 10 10 19 19 33 23 14 21 20 17 22 40 15Jackson 10 18 21 23 15 17 22 14 24 —— 20LakeMaffat 21 17 21 20 23 28 20 20 16 13 12 13 30Park 13 9 10 10 22 21 11 17 38 16 13 20 15Pitkin 21 21 19Rio Blaneo 23 17 22 25 21 27 17 29 20 10 17 22 30Roott 23 22 25 30 28 30 17 21 22 19 27 30 48Summit 14 14 17 —— 11 20 19 18 22 —— 30Teller 10 10 14 23 24 24 11 17 17 10 17 25
eTOtal N. W.District 19 18 22 29 26 29 17 23 21 17 22 24 28
Boulder 12 07 19 20 20 19 16 0 13 12 11 20 17Jefferson 11 16 18 23 23 19 11 7 13 12 18 20 20Larimer 17 20 20 22 20 20 18 8 14 10 11 20 16Logan 19 9 18 25 17 21 7 8 9 7 ii 12 10Morgan 14 10 16 21 11 17 8 9 10 8 8 10 10Sedgwiek 20 16 10 24 17 26 11 8 9 6 9 7 7Weld 15 18 18 19 16 10 0 7 7 7 8 10 11
°Tolal N. CcnOral & N. B.District 17 14 18 22 17 20 10 8 10 0 10 12 11
Adams 17 13 17 10 17 19 1 0 0 4 0 13 17Arapahoe 17 11 17 18 10 20 0 7 11 7 8 0 20Cheyenne 10 4 13 17 11 17 9 4 7 4DenverDouglas 10 10 15 19 16 22 17 7 14 7 15 17 20Elbert 18 14 10 20 17 17 8 7 15 6 11 18 12El Paso 20 12 10 19 15 16 10 9 14 7 13 20 05Kiowa 15 1 9 10 9 17 8 7 7 3Kit Carson 15 5 13 18 11 15 10 8 7 4 2 4 5Lineuln 17 4 11 18 10 15 0 4 7 4 2 12 8Phillips 10 10 19 22 18 24 11 S 7 5 13 5 0Washingtun____ 13 0 14 19 11 17 7 0 7 4 11 0 5Yuma 17 6 13 20 17 22 10 0 10 7 5 0 16
°Total E. Central District 17 10 17 19 16 19 10 8 i2 6 12 12 11
Archuleta 20 22 10 15 18 22 11 30 26 10 17 15 10Delta 20 11 18 20 10 22 __ 25 15 14 20 10 17Dolores 20 20 18 15 23 23 7 21 21 14 22 10 15Garfield I 17 21 21 22 20 23 9 30 21 15 17 17 10Hinsdale 19 20 25La Plato 20 25 22 56 59 24 12 23 22 17 21 15 10Mesa 12 12 13 17 23 20 9 20 21 10 19 10 15Montezuma ____: 18 15 20 59 25 20 14 27 55 51 14 17 22Montrase 17 10 10 19 19 21 11 10 21 15 22 —— 10Ouray 17 10 18 21 20 27 11 21 21 10 17 20 15San JuanSan Miguel 20 57 18 11 10 28 14 25 21 11 17 10 20
5Total IV. Cen-!tral & S. IV.District 20 18 18 16 28 22 12 26 22 15 19 15 12
Alamosa IConejasCostilla 14Mineral -—
Rio GrandeSaguaehe 12 13 54
°Tolal S. Cen-Oral District 12 13 14 14
Dara 0 6 7 13 13 11 14 8 11 5Bent 0 0 i 55 17 —— 11 8 7Crowley 13 5Custer 14 11 10 20 12 28 15 10 12 10 22 15 15Fremant 13 5 12 18 10 23 10 0 12 0 10 10 7Huerfano L is it 11 13 10 27 05 7 15 0 23 15 12Las Animas____ 17 4 0 12 15 24 9 7 11 6 17 12 10Otero 12 0 10 15 19 —— 14 7 11 _
Prowers 9 ii 9 14 13 10 11 10 11 6 12 —_
Poeblo 12 - 0 12 12 24 11 6 10 5 11 11 8TatalSeuth- — — — -— — —.
east District 13 8 11 15 15 21 12 8 12 8 19 15 14State Total_.J Ts 13 18 21 18 21 11 12 24 11 15 14 17
5Indieates approximate location of District for which Counties see given ahuve.

ACIRIC2tJLTURAL S’I’A’J1S1’XLS
Chaffee — 24 33 33 36 30 30Clear Creek 31Eagle 33 43 40 45 41 35GilpinGrand 23 31 35 48 35 38Gunnivon 23 35 34 37 27 32Jackson 23 31 34 30 22 23laIr 21Slnliatt 22 34 38 48 39 31[1urkIitkiii i 30 41 41 38 27ho Illaitco 30 37 43 37 31
lloutt —- 30 36 38 30 37 32Sioiisiit 12 20 29 36 34lilt
al N. W.JILl net 28 33 33 41 33 32
Ilonliler - —- 21 37 40 14 20 39
33
-10 43 31. 30 39 10 43 43 13
Iog:Lli 30 30 40 38 30 3731 organ 31 10 12 42 40 37Srth’sriek 39 31 10 11 31 39Wi-Id I 39 40 99 43 41 40
t’lstal N. Cen ——
Intl & N. E. -
District 30 38 40 42 39 39Adams 21 33 36 42 32 37Arapshse 23 33 17 42 30 30CheyenneDenverDouglas 21 29 36 ——
Elbert 21 30 ——
El Paso 27 32lhiosya 31lIlt Carson 23 30 ——
Linrelis 30PlsillilssWashington 29 34 37 38 31 31Vuma 8 34 33 34 28 30
s:Total E. Central District 24 34 36 40 32 33
Arehuleta 21 It 30 31 31 - 23Delta - 23 33 33 12 It 33Dolores -- —-
Garfield 33 35 30 40 31 35llinsdale 23 90 30 33 -— —-
La Plato 21 33 31 31 22 31Mesa 10 30 31 38 37 31Montezuma ___.j 23 31 32 32 32 29Montrase 10 30 33 41 30 39Dump F 20 35 36 41 31 30San JuanSan Miguel 25 35 3-1 38 38 32
- TsIal W. PenIntl & 8. \V.jIlistniet 26 33 34 38 37 24
Alantosa 19 27 27 31 25 28Conrjos 20 35 33 10 29 32Costilla 19 35 31 32 20 27Mineral 1 31 31 36 —— ——
ltio Grande 16 37 33 34 29 33Suguarhe 10 36 31 30 20 23
- Tslal S. Central District 19 35 32 32 20 28
tiara 21 29 —— 27 —— ——
Ilmnt 10 36 35 34 35 30Crawley 23 30 30 30 30 30Custer 23 33 31 27 32 29Fremant 31 30 30 41 33 32Huerfano 23 31 34 30 37 33Las Aninias___. 27 31 32 30 33 51Diem 30 37 30 32 36 36Prau-ers 30 36 35 38 36 32Puellu 24 35 31 30 38 37
- Tolal Southeast District 28 35 34 35 30 35
Slate TotaL._ 27 37 37 39 36 37
BARLEY, IRRIGATED—YIELD PER ACRE HARVESTED 1925-1937(Bushels)
CDUNTY 1925 1926 1527 - 1128 1929 1930 1931 1932 1933 1934 1935 1936 1937
22 26 24 20 30 29 29-- -- 44 2923 32 —— 32 50 39 44
32 37 29 27 35 10 2030 29 34 24 55 30 3221 30 31
34 33 37 21 42 33 53
32 50 29 25 30 34 4334 40 24 30 30 39 4131 38 20 23 40 30 4124 27 28 24 33 34 30--
-- I -- --
-- --
27 30 29 24 31 30: 33
33 21 32 31 32 30 4831 23 28 20 32 32 4730 36 37 39 33 32 4127 30 27 23 34 29 3139 33 23 12 32 43 3629 33 32 29 34 38 4339 34 33 27 31 37 43
37 33 34 28 32 - 33
37 - 28 32 18 30 28 34
2 30 37 4494 21 25 28 ——
28 30 31 23 30 20 29
E1
2 ;; :;36 28 21 21 30 30 36
32 21 22 23 35 34 3930 - 33 33 30 37 42 34
20 - 38 30 23 40 40 34
52
10 3030 32 31 20 33 37 3121 -12 32 31 40 30 2023 32 20 10 30 32 3532 30 31 31 35 42 3723 27 21 21 30 10 32
22 20 25 33 25 31 31
31 35 31 26 34 38 3624 30 30 23 20 20 2020 30 32 22 25 35 3020 32 30 23 20 30 34
25
2-1 --
17 29 33 23 30 23 2934 33 30 17 25 17 34
22 32 32 22 27 25 3127 24 21 14 15 28 3427 30 35 10 20 33 3523 15 28 12 20 31 2015 24 30 10 15 20 2118 21 31 20 22 25 2427 23 30 17 30 31 3425 30 31 11 20 37 3120 33 30 20 35 40 3023 32 33 22 25 33 3326 31 34 22 30 38 34
25 32 35 21 26 34 3333 33 33 26 31 34 38
lndiralrs approximate lnmalinn of District for svlsirh Cosnties are given above.

SPATE OF’ COLORADO
BARLEY, NON-IRRIGATED—YIELD PER ACRE BAEYESTED 1921-1937
_______ _________________
(Bushels)
________—
COUNTY 1925 1126 1917 1128 1121 1110 1131 1932 1131 1134 1135 1916 1937
Chaffee 12 17 -—— 13 —- ——
Clear Creek 20Eagle 14 17 18 22 20 21 12 22 20 14 —— 17 21Cilpin 16 18 26 14 14 18 12 16Grand 16 15 19 22 —— 12 20 14 5 32 14 19Gunnison 10 15 15 14 15 18 12 24 13 10 12 16Jackson 21LakeMoffat 1$ 16 22 20 22 17 13 19 26 12 12 15 21Park 9 14 35 17 17 17 12 16 10 11 14 0 29Pitkin 16 12 —— 12 21Rio Blanro 1 16 16 23 20 21 19 15 22 22 17 —— 19 04Routt 17 17 25 29 24 22 11 26 22 17 20 32 04Summit 13 21 —— 10 15 13 15 —— 51Teller J ll_ 1! h 12 13 11 15 25 13 29
5Totsl N. W.District __* 14 15 22 24 23 20 14 24 22 16 20 23 32
Boulder [ 1& f ö If 1f 1f If 13 12 12 16 20Jefferson 10 13 17 15 12 16 10 7 15 11 14 18 24Larimer 15 15 21 20 15 19 10 8 11 11 9 15 29Logan 1:1 15 13 19 14 17 6 6 7 3 9 8 8Morgan 12 11 15 16 15 13 6 7 7 3 7 9 0Sedgwiek 13 11 10 22 17 23 7 5 6 4 6 6 7Weld 14 16 17 21 12 12 7 6 7
F —p _I. ._P.5Total N. Cen
tral & N. E.District_. 14 12 16 20 14 16 7 6 7 9 8 8 8
Adams 50 9 11 10 10 51 7 5 8 4 8 8 14Arapahoe 0 9 17 17 13 10 7 6 11 5 0 0 12Cheyenne 8 6 5 18 10 12 8 7 5 3 2 —- SDenver
-
Douglas 12 6 10 23 14 17 9 7 8 7 10 18 21Elbert 14 9 16 17 0 10 7 5 30 4 3 8 0ElPaeo 14 8 12 14 9 13 7 5 11 4 5 6 5Kiowa 6 6 5 14 9 13 6 4 7 2 2 —- ——
KitCarson 10 6 12 13 10 13 7 6 5 2 3 2 4Lincoln 11 8 11 13 6 9 6 3 6 4 5 6 3Phillpo 14 11 10 21 13 20 7 6 5 4 10 0 0Washington__ 9 5 12 17 8 13 7 9 6 3 10 8 1Yuma 14 6 13 10 01 17 9 8 6 3 9 7 7
5Total E. CentralDistriel 10 6 13 16 10 14 7 7 6 3 8 8 8
Archuleta 13 16 17 22 16 20 6 13 21 11 12 7 10Delta 12 14 21 16 16 11Dolores 10 15 15 15 16 10 8 18 21 7 13 7 9Garfield 11 15 15 10 16 18 12 24 21 11 13 1Hinadale 10 14 10La Plata 12 16 17 12 18 18 8 21 21 11 20 0 11Mesa 0 12 13 14 16 17 11 17 20 10 10 7 ——
Montezuma 12 11 16 8 16 17 10 10 14 10 12 9 11Montrose 13 16 16 13 16 10 20 21 10 —— 9 11Ouroy 9 11 15 16 15 15 8 13 16 9 12 12San JuanSan Miguel 14 17 17 14 17 17 9 13 21 7 10 7 15
5Total ‘.Y. Central & S. W.District _ 13 15 16 14 16 17 9 17 10 10 14 8 12
Alamoso FConejosCostilla 8Mineral -
Rio GrandeSaguarhe
5Total S. Cen-1tral District 8
Dora 8 7 6 23 10 10 7 10 5 2 3 6Dent 9 6 6 15 14 11 6 10 13 4 4 --
Crosvley 11 6 —— —— 15 6Custer 11 12 11 12 13 14 9 10 14 5 10 11 12Fremont 11 7 14 15 14 11 7 10 18 9 —— 9 IiHuerfano 11 15 12 15 21 15 8 0 13 5 10 10 6Las Animas 10 6 6 14 11 9 7 10 6 4 —— 11Otero I 11 6 8 15 —— 10 6 8 13 —— —— 10 ——
Prowers 10 6 7 16 11 10 7 10 6 4Pueblo 11 6 11 10 32 12 6 4 16 5 6 11 11
5Total SsutheastDistriet 9 8 7 14 11 50 7 10 6 4 7 13 10
StateTstaLJ 11 9 14 17 11 14 7 7 7 5 9 8 9
5lndieates approximate location of District for which Counties are given above.

AGRICULTURAL S’l’ATI ST [ 5
POTATOES, IRRIGATED—YIELD PER ACRE HARVESTED, 1925-1937(Bushels)
COUNTY 1926 1926 1627 1928 1929 1930 1931 1932 1933 1934 1935 1936 1931
Chaffee 110 115 150 120 125 101 70 I o 75 55 100 100 75Clear Creek 130 00Eagle 200 225 220 170 260 270 150 175 195 155 200 250 220CilpinCrand 170 140 170 160 140 130 70 110 100 70 170 151 145Gunnison 509 135 100 170 110 190 70 105 100 00 180 100 150Jackson 170 110 130 110 110 80 130 100 05 109 200 180Lake 150Slollat 100 113 170 100 110 220 90 110 150 80 150 70 140Paris 130 110 99 140 85 80l’itkin 210 223 220 170 210 210 140 140 105 115 220 200 190Rio Illanen 100 120 100 100 159 215 70 130 159 80 160 130 200Iloult 200 150 190 170 150 210 05 115 100 85 220 190 140Summit 100 90 130 200 190 150loller 130 109 00
15151 N. W.District 191 198 200 160 199 230 123 lIt 171 122 189 213 183
180
120 140 150 95 199 115 79 155 10 110 150 ——
115
110 150 100 95 100 110 90 110 05 150 130 140100 159 181 159 89 175 135 130 100 100 120 175 170
l,o;;to 200 125 100 150 01 185 90 70 150 55 90 90 110SlOI5’:au 220 150 180 101 170 190 145 115 155 155 270 230 200Sr,lwiek 200 125 180 130 130 100 95 120 125 03 200 230 190Weld 199 155 170 170 120 210 123 05 159 01 190 200 179
>:Tetal N. Central & N.E.District 191 154 171 168 121 207 124 96 154 86 190 200 171
Adams 100 95 130 115 103 185 85 100 110 95 120 110 150Arapahoe 100 110 020 120 70 155 220 00 110 85 125 140 ——
CkeyennoDenverDouglas 80 51 140 85 80 150Elbert 119 200 89El Paso 100 120 120 196 50 80 120 100KiowaKit Carson 300 00 00 59Lincoln 110 70 00 00Phillips 100Washington 100 120 190 100 79 71 110 85 129 130Yuma 100 110 110 121 120 115 110 50 110 01 100 80 120
5Total E. Cmtral District 116 96 134 130 111 172 88 91 110 91 94 110 112
Archuleta 140 110 140 149 112 520 110 130 00 100 90Delta 160 110 110 100 100 100 110 115 195 110 180 100 140Dolores
—— 70 170Garfield 210 200 180 180 210 220 152 180 185 145 210 220 170Hiusdale 105 119 160 190 80 150 120 140 110 95 100 170 110La Plata 130 110 176 150 120 170 150 125 115 55 100 240 100Mesa 100 129 150 100 140 190 555 101 115 120 100 190 190Montezuma 110 110 100 125 120 175 120 155 110 45 170 199 100Moutrose 220 110 110 190 200 205 172 185 181 125 100 200 170Ouray 500 150 150 130 120 100 135 150 100 101 100 70 100San JuanSan Miguel 200 140 140 110 120 210 145 135 150 00 180 70 170
‘Total W. Cen-jOral & S. IV.District 192 151 135 158 182 202 156 170 107 115 191 190 162
Alamosa 200 150 210 170 100 205 62 102 101 50 170 171 135Conojos 210 100 200 150 185 220 75 105 110 55 100 105 90Costilla 100 140 190 119 120 220 50 07 125 05 230 180 90liberal I 110 110 110 110 00 75 100 114 05 100 140 99Rio Grando 220 200 230 180 225 190 77 123 591 75 200 210 185Saguarlse 230 190 225 100 220 171 72 107 100 50 200 105 90
°Total S. Central District 219 189 223 170 212 194 72 511 172 00 193 189 146
liaraDent 80 110 90 110 05 100Crowley 80 190 110 150Custer 110 150 180 191 70 75 150 40 100 100 501’remont 125 100 130 119 70 05 100 190 19 90 209 70Iluerfano 155 130 70 100 90 70 110 20 90 190 100Las Animas 130 _ 50 105 00 92 25 100 150Otero 100 80 120 110 40 70 80 120 50 120Prosvers 90 110 110 110 80 100 40 90Pueblo 80 110 130
5Total Southeast District 140 98 128 141 147 180 77 77 132 40 100 160 65
State TotaL._i 201 170 186 167 178 200 106 518 106 81 191 194 156
5lndicas approximate location of District for svhirh Counties arc civen ahovo.

S’l’tI’11 1.11’ .( ) l.( )I1_\ I’)
POtATOES. NON-JIIJOJGATFDD— IELI) FEll ACRE IIA11VESTIOO, 11)23-1937(Bushels)
COUNTY 1925 1926 1027 i928 1029 1030 1931 1932 1933 1934 193& 1930 1937
Chaffee I 150 --Clear Creek .._ -10 30 60 55 75 70 .10 75 50 30 50 —— 00Eagle 35 25 00 55 100 150 60 00 (0 —— 100 90 70Gilpin 30 21 96 33 SO 00 .15 50 50 10 70 100 50Grand 50 30 70 15 70 —— 35 05 60 31 70 50 10Gunnison 40 25 70 55 150 100 32 70 65 25 90 110 00Jackson °1 60 45 95 170 55 00705570_.——Lake—-
Iloffat 10 25 70 55 90 115 43 72 60 45 60 150 80Park 30 23 66 35 80 300 40 45 60 22 70 1(0 70Pitkin 50 31 —— —— 170 —— ———— 100 85Rio Blanco 35 20 80 55 105 130 40 100 90 50 50 140 90Routt 70 53 90 55 125 120 25 100 70 60 100 110 120Sunsniit
—- -- 65
—— 160 115 4(1 80 60 60 80 90 70Tefler . 55 15 80 10 85 120 40 60 110 30 170 75 SI).:.Total N. W.District _ 48 38 75 45 95 112 10 61 70 35 106 100 84
Boulder 20 21)—- 55 -10 60 2.1 50 30 ——Jefferson 30 20 70 .15 85 110 70 70 50 25 60 .10 30Larimer 30 0 00 55 gI 101’ (30 53 60 22 50 60 10Logan I 10 25 (10 45 75 120 60 :17 55 2-1 -10 20 20Iloruon -10 25 (10 45 190 125 65 1 (10 50 27 50 10 35Sc-dgsvick 40 30 (15 45 50 110 .11 55 50 15 50 13 15Weld 30 20 (10 ( -15 80 110 70 35 50 28 I 40 20
-Total N. Cm-
—Iral & N.E.District 56 22 (32 15 SO 114 61 42 52 26 44 29 23
30
20 51 I .10 70 100 51 50 50 10 .10 -- ——Arapahoe 30 30 00 I 45 45 —— 60 21 50 27Cheyenne I 30 20 60 .15 40 110 30 32 15 10Denver
—-—
. ——.. ——
.— —— ——Douglas .10 30 (10 50 60 120 30 50 .10 21 50 30 10Elbert 45 25 70 -15 55 110 55 20 :10 15 50 10 15El Paso 50 20 5(1 I 13 65 110 45 2:1 35 10 50 30 21Kiowa 45 O 50 . — 50 55 30 20 45Kit Carson 10 30 0(3 .15 40 90 .10 23 55 15Lincoln 10 20 70 30 55 90 45 18 .10 20 20 10 30Phillips .10 50 00 -10 60 120 50 50 00 11 .1(1 20 ——Washington __I 30 2(1 10 I 15 00 110 37 45 51 10 30 12 25Yoina__ 41) .10 61.1 -11 60 110 40 40 I (30 15 10 10 20
°‘rotalEcen- -— —
teal District 12 27 66 46 56 101 40 28 -11 14 36 18 23Archuleta 50 31) 70 33 55 110 60 75 70 35 30 96 20Delta 30 —- 41 I II 120 —— —- 70 70Dolores -15 20 50 ‘.35 80 00 65 92 ((5 32 60 00 50Garfield 25 23 (10 51 120 120 60 70 60 30 50 30 50Hinsdale 40 —— . —
l.a Plata 45 25 80 5)) 95 100 67 81 80 35 130 100 40Mesa 10 2(1 .10 .15 65 100 73 70 30 25 40 70 10Montezuma ____ .15 21, 65 30 00 917 (15 100 70 25 50 90 70Slontrose 4)) 3(3 .15 15 100 100 60 90 ———— 60 80 7011 (1 I 4 4 110 100 6’ I 30 10 JOSan Juan
----
. -- —-San Miguel 30 25 70 -10 115 100 74 80 60 40 70 60 80‘Total W. Cen
tral & S. W.District 42 25 60 41 00 98 66 00 66 :10 56 83 61
Alamosa.
.
—— [ —...— —--
—— ——
Conejos.
—. ..—Csstill
..
— ——lIberal-.
--R,o Graxule. i -— —Saguache
-- --
-- -- -- --
-Total S. Ccnteal District
—— —— . 1 --
————Dora 150 50 40 20Dent 30 35 00 -- 40
-Crowlev 20 Ii) .15 40 110 10 22 .15—- -— ——Custer 10 . 25 00 15 100 153 37 23 80 35 60 110 90lren,ont 35 21) (10 33 80 120 35 35 60 30 70 70 70Huerfano 35 20 00 45 80 121 59 10 50 18 50 110 20Las Animas...._ 50 35 03 45 65 —— .10 37 35 15 50 10 -—Otero 30 —— 55 45 -— —— —- ..
Prowers ‘ —- 35 50 —- 36 30 ——Pueblo 50 130 90 . 47 25 23 60Tota1 South- I
east District -10 24 78 50 93 149 38 28 74 33 58 103 79State TotaL_ 43 30 70 15 82 115 46 11 64 31 73 84 66
*lfldjcates approximate location of District for which Counties a c riven above.

62 A’; l00(.’UL’I’GSOAL STAtIST IVS
11EV BEANS, IRRIGATED—YIELD PER ACRE HAll VESTED, 1925-1931
(Pounds)
COUNTY 1925 1926 1927 1928 1929 1930 1931 1932 1933 1934 1935 1936 1937
Chatfee 730 900 460 280 310 280 360 400, 350
Clear Creek ———I
Eagle .,
; 450’
Gilpin IGrandGunnison
———, I 380’ 400:
Jackson
_——, ‘
———,
Luke ; ___:___j
___‘
Sloffat340
Park.—,
Pitkin I [
ltio Illanro-,——,
—_—,
Itanit..
———
Stininit -
p___I
°TutaI N. Vt’. Dist. 730 900 $60’ 180 340: 200 330 406 336
B a] 800 00 609’ 900 itO 960 030 460] OtO 20 000 000 500
Jefferson 700] 600 600 900, 000: 940 010: 410 540 260. 590 700 700
1,,irinit’r 600 700 700 700 790 1,030 550 490 830 410’ 670 900’ 550
logan 700 800 600] ooo] 770’, 940 480] $60’ 040 280 630’ 000, 500
Morgan 600 000 000] 000; 830 1,880: 530 43& 700, 350 920 1,000’ 600
Sedgwirk 600 600 700 665 740 SolE 840 _ 800
Weld 700 000 700, 700 000 1,160 780 560. 800 300 750 1,050. 020
*To]al N. Centraland N. E. Dist. 690 619 691] 687 800 1,140 740 969 370 770 1,020 791]
Adams 600 600 600] 900 700 1,000 010 450] 760 250 420 1,050 750
Arapahoe 600 600’ 800 700 960 700 370: 650 262 420 800 800
Cheyenne :: ___;
__i ___
Denver] :
__•___,
Douglas 750 340
Elbert 600 600‘ .J
] —-—IEl Paso 6’;O 700 500 600 750 970 630 450 570’ 230 345 650’ 550
Kiowa]
]I
-
Kit Carson 590
Lincoln 550 ‘ 550‘ __
.
Phillii I ]
—--
IWashington 700 ___‘
_ 500 790 1,060 590 950 600
Yuma 700 600 _I 90 ].
5Total E. CentralDistrict 580 612 595 652 770 1,000 630 400 680 240 410 926 730
Arrhuleta 130 795 050 ‘ 950 850
Delta 900 900 900 DoE 1,220 1,030 735 560 530 920; 1,000 850
Dolores.‘ 770 750’ 700
Garfield 900’ 600 960 900 1,036’ 760 710’ 560’ ., 130 59E 550 1,050
Hinsdale ‘-
: ‘ 680;
La Plate ‘ 800 900 1,000 1,too; 890’ 700 420’ 530 ooE 510 420’ 750 900
Slesa I 1,000 800 1,200 1,200, 1,460 1,140 930, 1,000 600. 920 920, 1,200 1,100
Montezuma 800, 1,000 1,200; 990] 950 470’ 860 890: 400 590- 700’ 750
Mantrose 1,000 800, 1,100 1,200 1,170 51401 700 660’ __ 680 67E 1,150 1,250
Ooray ‘ 980
Saa Juan ‘ ___I : ,:
San Miguel ‘ , ,
TutaI IV. Central& S. ‘SE. District 980 787 1,067 1,184; 1,350 1,090 770] 890 880 770 810’ 1,063 1,024
Alamowi I 030 600i60 60
Conejos 1,100 700 1,000 600 710 940 510. 650 940 450 670, 640 95(
Costilla . 1,100 700 1,200’ 600 680 740 620’ 560 410 670 200 t5
Mineral I,___,
‘ ___I
ltio Graode 1,200’ 930 97& oio] ———‘ 950,
Saguache, 780 820’ 650, , 360 630
CTutal S. Central ‘ i , ; i. I
District 1,101 700 1,108 600 720 840 720 620 800 420 670 636 86
Bara ‘_‘ ___‘ 400 600’ 5i0 ] j 450
Bent : 1,100 800 600, 800] 660] 740’ 050 590] 760 450. 420] ooo so;Crowley 1,100 600 600 860, 700 740 020 3.50’ 650 400 420’ 500 35]
Cooler ‘ 700’ ___I —,___‘ 450 ——
Fremont ‘ 1,000 600, 600: 700’ 740; 1,000 410 350 900 310- 500 450 7’
Huerfano 1,100 600, 800, 600 650; 760 410 330, 750 250] 420 900, 40i
Las Animas 900 700; 800 700. 900] 1,160 600 4501 980 400’ soo 050 60’
Otera 900 700’ 600 700’ 900 960 580 690 970 620 94& 1,300 50’
Prawers 1,000 700 800 700 920’ 860 570’ 530 600 300 3401 504 40-
Pueblo 0,000 600, 700 500; 900 1,060 520 090] 860 589 670 1,190 50
°TutalSeutheast ] [] ; fl I ] —
District 953 791] 667; 662] 870, 990 580 540] 890 550I 610, 855 48
State Total 749 6SF 724 727; 900, 1,080 700] 580j 860 466] 730 984 75
lndirates approximate loration of District for which Counties are given above.

SUA’UE 01’ C0014All
DRY BEANS. NONIRRIGATED—YIELD PER ACRE hARVESTED, 1925-1937(Pounds)
COUNTY 1925 1926 1927 1928 1929 1930 1931 1032 1933 1934 1035 1936 1937
330
330280
330300270330300
300
460 290500 130
120650 160380 240620 210580 150640 180
ChaffeeClear CreekEagleGilpinGrandGunnisonJacksonLakeMoffat 300ParkPitkinRio BlancoRouttSummitTeller
5TotaI N. W.District
____
Boulder 400Jelferson 400Larimer 450Logan 350Morgan 350Sedgwick 350Weld
TotaI N. Central & N.E.District ____
Adams 270Arapahoe 310Cheyenne 400DenverDouglas 420Elbert 460El Paso 380Kiowa 360Kit Carson 360Lincoln 580Phillips 360Washington ._.1 380Yuma I 400
°Total E. Cen-tral District
ArchuletaDelta IDolores 300GarfieldRinsdaleLa PlaIn 300Mesa 350Montezuma
____
350Montrose 350OuraySan JuanSan Miguel
TotaI W. Central & S. W.District
ftlamosaDone)os 220DostillilineralRio Grandelaguache
5Total S. Central District 220
Eaca 3003ent 350Drowley 350Duster 4005remont 400nluerfano 350as Animas ____ 300)tero 350?rowers 500E’ueblo 520
Total South-ieast District 2_
State Total__ 360
400
400200200200190180190100
190
140150150
150120110150120110360130140
130200
210180
580150150
150
170
230
1106070
120
200130120100100110
120140
400 200
200 210
370 210250 250200 250180 300240 260250 200200 260270 250
260 240280 240300 170300 200
250 220200 160230 170150 150120 180220 110110 150150 170130 170
230 170300300 200350 220350 200
250 500250 300250 250
200
260 250
170 150
170 150180
350 200350 200150150 130250 130190 200300 160350 120300 120
280 160240 180
290 630 190320 500 180370 500 230210 380 220
350 620 210300 630 220290 620 240200 400 200180 380 200220 450 170240 570 250220 540 180260 520 390
560 210440 420 250
580 240410 560 250330
440 400 280310 620 200480 550 270400 520 200
490 200
280 540 210
450 540 260
310 0260 280 210250 320 250
100 160320 390 200250 200 310280 540 250200 380 190220 500 140
260 360 240280 540
330 270 110 130 510 340
330 270 110 130 310 340130 250 00 250 160 100
290
160 120120 280 70 260 260 200140 270 80 180 160 130130 280 80 150 152 90150 260 60 120 120120 210 00 100 160 110
130 250 90 190 160 108130 240 00 200 120 70110 270 90 210 210 70
90 230 407070__—
130 270 160 250 350 190100 300 80 170 220 100160 290 00 160 220 70
90 160 50 120120 230 40 90 80 70100 220 60 100 100 60180 220 60 140 350170 250 50 210 120 80140 200 00 180 130 110
140 270 80 180 185 84270 280 180 210 120 350
200
300 320 190 230 200 300
530 320 190 250 120 450280 330 130 540 280 250150 210 170 240 280 100
290
310 250 90 170 240 120
340 270 170 240 269 302
150 150 10 100 100160 170 60 100 80 110100 220 10 330 80 80
110
100 60190 220 70 110 100 50110 230 60 130 200 00160 190 50 130 160 90120 280 70 170 00 90140 150 80 90 70110 260 00 130 220 100
140 220 70 130 193 95150 260 90 580 186 130
* Indicates app rex im to location of District for which Cone ties are given allUre.

\;l11:t’lTLI1_\l, S’[,.-\.’L’ISUI’S
GRAiN SORGHUMS, IRRIGATED AND NON-IRRI(;ATED
YIELD OF GRAIN PER ACRE hARVESTED, 1924-1926(Onshels)
_________________
1925 1926 1922 1928 1929 1930 1931 1912 1933 1931 1935 1916
11.0
11.012.010.015.0
7.07.06.68.0
12.0 12.0 9.0 12.0
12.0 12.0 9.0 12.0
10.0 10.0I 13.0 11.0 13.0
12.0 12.0 15.001.0 13.6 8.0 1-1.011.0 13.0 12.0 12.011.0 12.9 7.0 , 17 012.0 I 15.0 8.0 13.0
7.2 11.4 13.5 8.5 I 13.5
5.0 10 0 j 10.0 I 7.0 12.05.0 11.0 11.0 3.0 1 3.0
5.0 11.0 11.0 10.0 15.0
5.0 10.9 11.0 15.04.0 I 11.0 10.0 9.0 13.03,11 - 12.0 - 1 0.0 10.0 15.040 11.0 1 1.0 10.0 15.05.0 11.0 1 0.0 8.6 1-1.0
1.0 11.0 1 1.0 5.0 12.0
7.6 12.1) ‘ 11.0 ¶1.0 17.1’-1.0 11.0 i 10.)) (1,0 1-1.0
*z0
—±‘3:.
1.0 1 1.0 10.7 8.5 1-1.1
l iö-- 11.0 1 4.0 12.5 12.0
10,1, 11.0 14.0 17.0,12.))
10.0 13.0 12.0 11 0 12.0
10.0 11.0 35.0 17.0 - 1)3.0
10.0 12.0 11.0 0.0 13.015.0
9.0 11.0 12.0 12.0
10.1 11.5 13.8
COUNTY 1924
ChaffeeClear CreekEagleGilpin - .
GrandGunnisonJacksonLakeSlolfot ——
0.0 10.0I’ark _]Fitbis16kb Illin,’,R,,uttSun,tni). —
Icr -
‘I’otal N. W.District 5.0 10.0
llutil,l,’r 25.0.1,’Il’ei’s,,,, — -- 17.0 12.0l,arim’,’ . 20.0 12.0
18.)) 10.0Morgan —- -- 4.0 10.0Sc,lcsvick . 1.5.0 9.0Weld - 1-1.0 12.0
-Total NorthCentral &-N.E. 01st: 15.2 10.3
Adams 2.0 10.0Arapal,se .,‘ 6.0 12.0Cheyenne 6.0 12.0Denver -
Douglas__. 8.0
Elbert _
- .J 11.0 12.0El Paso 9.0 13.0Kiowa 9.0 12.0Kit Carson__H 80 12.0Lincoln 6.0 11.0Phillips 9.0 17.0
Washington — 5.0 12.0Yuma 7.0 1211
°Total EastCentralDistrict . 7.S 11.8
ArchuletaDelta 17.0Dolores 8.0 17.0Garfield - 16.0 17.0Hinsdolel.a Plata __ 10.0Mesa I 17.0 17.0M,,ntezuma — 6.0 14.0
Otiray --
San JuanSan 2! i,7uC1__.H 14.0
°‘I’olal West -
(‘ en I r a Iand S. W.Disi rid . 10.1 14.5
,l;Lnv,ca -
-
(‘on,’jio - ._.._
C,,stilli —,
MineralIll,, (‘,ir,ile_1SaguarO,’ — --
otal Soc thCentral -District -
Tlaca SM i:Rent 80 11,0Crosvlry __H 2.0 15.0Custer 10.0T”rcnsont _
Huerfano _..i 1.0 12.0Las Anin,as. 3.0 13.0Otero 10.0 1-1.0Prowrrs — - - 1211 12.0Pueblo —
5.0 12.0
aTotal S. E. -
District 8.7 12:1
State TotaL 8.6 12.5
12.0 13.0
12,0 0.0
12.0 5.011.0 - 4.010.6 5.010.0 5011.0 6.010.0 40
10.1 4.6
10.0 4.011.0 5.0
12.0 -1.0
10.0 5.010.0 -ii’10.0 1,012.0 5.012.0 5.0
0.0 4.010.0 - 8.6
9.0 7.00.2 ‘ 7.0
10.7 5.1
11.0 6.012.0 I 6.012.0 5.0
10.0 7.011.0 9.0
9.0 13.010.0 9.0
11.0 6.0
10.1
7.0
6.07.0406.05.0S-I)
6.3
5. (I6.0-i-0
1.04.07.01.07.00.0
-1.5
6.30.0
11.0
iiö10,0
9.011.0
8.9
10.0
10.0
11.010.011.810.0
9.08.0
11.0
9.512.014.010.0
11.011.011.0
9.010.0
709.0
11.09.0
9.9
12.014.012.0
11.013.011.014.0
13.2
0.0 6.340.0
9.0 2.00.0 - 8.0
12.0 6.010.0 5.0
7.0 6.011.0 ‘ 0,0
10.1 5.3
10.0 5.00.0 7.09.0 5.0
9.0 1.010.0 4.010.0 2.0
0.0 4.00.0 7.09 0 7.07.0 ‘1.0
10.0 1.010.0 2.0
9,2 -1.0
11.0 17.022.0 - -—
12.0 0.0
11.010.0 20.012.012.0 - 37.0
12.0
11.8 20.8
4.0 -1.08.0 8.07.0 1.08.07.0 7.07.0 18.05.0 5.07.0 21.06.0 0.05.0 - 4.0
1.2’ 1.-I
13.9
10.011.1)11.0
10.010.0
-
11.0 -
13.013.011.0
11.))
11.1
10.0
Zo 1:12.0 10.012.0 8.012.0 9.013.0 -1.012.0 3.011.0 11.011.0 9.013.0 11.010.0 60
12.1 10.-I
12.0 11.5
5.05.05.0
5.04.05,013.05.05.0
54)
5.5
6.5
7.07.02.06.03.06.05.08.06.0-1.0
641
7.0
12.0 12.012,0 11.01-1.0 9.0 I12.0 12.012.0 31.014.0 I 12.0 I
11.0 - 10.0 -12.0 12.0121) 10.012,0 S.0
12.012.0 I
3.0 7.00.0 0.06.0 71)5.0 11.00.0 11.0
10.03.0 9.06.0 9.04,0 7.0-1.0 13.0
1.8 7.0
0.11.’ l.a a ran,’nxin,ate incatic,n of District tin’s, bich Counties are given above.

S’l’\T12 UI” ,jl1Al)() 63
ALFALFA, 1R16lGAT AND NON1RR1T YIELD PER ACRE IOARVESTED_19261936ons
1926 1921 1921 1929 1930 1911 1932 193 1934 1955 936
iaffeeear Creekagleilpinrand0ni5Oflacksofl,akeloftat‘ark‘jtklntb BlancoouttSummitFeller
-
‘Total Northwest Dist.-—Boulder
— ‘JebtersOnLarimerLoganorganSedgViCkWeld
“Total North Central andNortheast flistriCt___——
AdamsAraPahoeCheyenneDenverougla5ElbertEl P° --—-
KiowaKit Carsonl,ineolnphillipsash,ngtonguma
‘Total E. Central Dist.__Irchuleta)elta)olorCs;arfield{nsdale
Plata,lesa,lonteZflrna,lontrose)uray1CO Juan
iguel
‘Total W. Central and S.w. District
tiamos”onejosostiltatineralho Gra,naguachesTotal s. Central District
acaentrowleyuster‘remonttuerfanoas Am’5terorOwerSueblo‘-Total Southeast District_
tate Total 2.10
1 ndiCaIe approxi male 1 eatiO1 of 1) istrict for s,’li rh r,u,tieS ,ivui above.

:313 IWIJL9’l.’IiAL S’I’A’l.’lS’l’ I P
10 YEAR (1928-37) AVERAGE YIELD PER ACRE HARVESTED (PRINCIPAL CROPS)
Grain Alfalfa
CORN OATS BARLEY Hay
COUNTY -
and and
len- Nnn- Inn- Non- Inn- Non- Nan- Non
gatad 1mm. galed Inrig. gated Innig. 1mg. 7mg.
(Ba.) (Eu.) (Be.) (Bit.) (Ba.) (Bufl IOu.) (Tans:
Chalice 11.0 .. 11.2 14.1 27.6 14.0__ j 1.7
Clear Creek 20.0 ___ 18.1 3)3.2 20.0__
1.1
Eagle 21.1 46.1 24.2 $1.1 20.1 2.2
Gilpin 22.-I 11.1 ___1.5
Grand 20.0 24.1 21.2 12.6 11.8 1.2
Gunnisan 18.0 10.6 36.1 20.2 21.6 14.2 ii)
Jackson 13.0 12.6 22.2 1.1
TakeMeffat 24.6 11.2 28.4 20.7 27.1 18.1 7.4 1.6
Park 16.9 15.2 1.0
Pitkmn . 41.9 22.0 52.9 18.0 . 1.6
lOla Blanca °-l.7 23.0 1 46.0 22.0 31.6 22.0 1.8
Reutt .. 10.7 42.0 21.2 - 36.4 24.0 0.6
Summit 18.0 20.1 31.0 17.3 ) 39
Teller 22.6 3107 34.0 1.6.1.._
‘Total Northwest District.... 11.9 41.1 24.6 30.3 21.8 0.4
Baulder 30.4 20.4 43.1 16.0 25.8 14.7 15.6 09
Jefferson 27.8 16.1 27.1 17.7 72.6 74.2 9.0 3.1
Larinter 28.5 i 9.7 41.1 16.4 27.7:11.53.8 1.1)
Logan 27.9 - 9.3 20.6 74.5 21.2 9.6 2 : 2.0
Mergan 22.4 I 8.2 42.2 11.7 26.7 I 9.1 107 2.7
Sedgwjck .35.1 I 10.2 43.5 12.4 35.2 19.2 9.0 2.1
Weld 27.1 713 5813 1113- 37.1 105 108 213
°Total N- Central & N. E.District 28.0 8.8 40.2 12.8 26.0 9.9-, 0.3 : 1.99
Adams 29.1 0.2 27.5 13.0 21.9 9.4 I 0.5 1.9
Arapahee 27.3 8.7 36.0 12.2 34.2 9.8 3.2 1.8
(‘bayonne 7.8 9.9 8.1 9.3 1.0
Tlenver .. ..
Douglas 24.6 13.2 23.3 11.7 35.2 13.4 8.0 1.1
Filbert 28.0 : 0.6 39.0 s- 26.8 7.0 8.5 1.1
El Pain 26.2 8.7 33.9 ‘ 17.9 29.6 7.9 8.8 1.1
Kiowa 15.9 7.6 - 0.6 71.0 7.1 0.0 .9
Kit Carson 25.7 7.1 25.0 0.8 21.5 6.5 0.5 1.2
Lincoln 20.2 7.8 _ , 8.9 22.0 6.1 7.6 1.1
Phillips . 12.2 12.3 10.2 9.4 1.0
29.6
9.1 29.3 10.-S 32.6 9.0 8.7 1.6
Yuma °6.9 10.0 , 2-1.4 12.4 29.4 0.2 8.7 1.8
°To(al F. Central Dhstriet__ 28.4 9.2 37.1 22.8 32.2 8.7 8.8 1.29
Archuleta 25.6 11.6 26.1 16.0 21.6 13.3 11.5 t.7
Delta 26.8 12.2 41.5 16.0 36.7 16.0 11.6 2.4
Dolores 27.9 11.2 36.0 19.1 12.7 11.4 1.-I
Garfield 23.2 : 22.2 43.4 20.6 - 34.7 15.0 J 2.1
Rinadale 39.6 22.5 26.0 10.0 - 11.7 I.e
L Plata 23.2 11.9 38.9 10.2 32.2 15.2 - 17.1 3.0
Mesa 34.1 11.2 41.6 18.9 3 i.8 2-1.1 - 19.2 2.2
Slontecuma 2-1.3 11.5 35.4 18.2 20.5 72.5 15.4 1.7
Montrnse 04.8 12.0 38.9 10.9 35.4 13.0 10.0 2.2
Ouray 28.3 39.0 19.6 26.1 12.9 1.7
San Juan---
--- ---
--- I --- ---
San Miguel 28.2 12.1 39.6 19.0 26.6 12.0 30.7 1,1
iTatal IV. Central and N. W.District 31.4 11.0 39.4 17.0 34.0 12.5 12.2 2.07
Alamosa 21.9 11.7 26.5 .. 1.5
Conejoa 23.5 25.5 19.3 1.5
Coatilla 25.1 16.8——— ! 28.5 i.e
Slineral _ 22.5 ‘ 28.3 ‘ 3.2
Rio Grande 27.1 32.7 - - 27.0 3.1
Saguaehe 24.6 31.6 24.7 1. 1
Tatal South Central Diat._ 24.4 31.1 27.7 .. .. iSO
Baca 22.6 7.7 29.9 19.7 24.1 , 7.3 8.4 1.2
Rent .26.4 7.6 58.1 11.7 21.0 0.6 0 . 1.1
Croavley 25.2 7.0 22.1. 9.9 26.0 10.5 7.9 1.6
Custer 22.9 0.0 30.4 16.0 24.4 11.1 9.8 1.1
Freniont 28.6 10.2 32.2 14.1 26.8 11.6 8.7 1.6
Huerfano 23.6 0.2 37.6 15.1 29.8 12.2 20.2 1.6
Las Anim 10.6 9.1 21.9 11.1 29.5 9.0 8.2 1.7
Otero 29.3 8.1 10.8 13.2 - 13.2 10.2 11.1 1
Pruwena 21.4 7.2 39.4 I 11.6 26.7 9.1 0.7 2.1
Pueblo 2013 847 3106 1109 32j7 913 7.7 341
‘Total Southeast Diatrirt__ I 26.1 8.5 26.9 12.9 31.2 0.2 8.5 1.04
— State Tulal 29.0 9.1 38.4 , 13.7 34.1 9.4 9.8 1.89
‘Indicates approximate location of District for mmcli Counties ore given above.

Chaffee - 23.8Clear Creek —Eagle 27.8GilpinGrand 049
Gunnison 24.1Jackeon ILakeMoffat 27.1ParkPitkin 26.7Rio Blanco 27.4Routt 23.6Summit 25.8Teller
5Total N. W. Diet..... 27.9Boulder ‘.8Jefferson 28.5Larimer 28.7Logan 23.5Morgan 21.1Sedgwick 25.5Weld 25.5
5Tatal N. Central &N. K. Dietrict.. 2&9
Adams 23.7Arapahoe 25.1CheyenneDenverDauglas 24.8I3lbert 20.5El Paso 29.1KiowgKit Carson 15.5Lincoln 20.5PhillipsWashington 25.2Vump
5Total East CentralDistrict - 24.0
Archuleta 25.4Delta 30.1Dolores 25.5Garfield 979HinsdaleLa Plata 2z.8Mesa 29.0Montezuma 24.1Mantrose 31.1Ouray 25.4San JuanSan Miguel 24.0
OTotal W. Central &S. Y. Distriet___ 28.1
Alamosa 24.9Conejos 20.7Cnstill0 26.6MineralRio Grande 25.9Saguache 2a.2
°Total Sonth CentralDistrict 26.2
Raca 16.3Rent 28.0Crawley 23.1Cnster 25.0Fremont 24.1Raerfann 20.1Las Animas 29.3Otero 28.8Prowers -— 35.7Pueblo 27.3
*Totai 5. E. Dislrict 26.8
State Total 26.6
18.0 21.7 9060
10.5 31.0 15.5 20427.0 I 14.4
14.8 23.9 19.0 12710.1 27.6 11.0 136
9.2 128
11.4 25.3 11.4 1268.9 101
17.5 29.5 16.2 18416.2 27.7 13.1 14121.2 20.1 10.5 15121.3 26.7 11.6 766
9.8 12.6 30317.7 27.6 14.3 17212.1 24.7 9.6 12714.8 25.2 11.1 13015.1 26.0 9.9 110
9.3 20.8 8.6 1068.2 21.8 1.9 1769.1 21.2 6.1 146
_JJJ .2 .J10.3 24.4 6.5 1529.9 23.7 6.3 1269.8 22.7 7.9 1157.6 2.2
1 216 9.0 1038.3 26.0 0.0 1409.5 11.9L5.9 1007.6 24.0 5.17.5 19.3 1.6 670.7 22.2 2.2 629.0 2.77.4 22.5 5.1 7189.9 20.9 5.4 106
9.1 23.4 5.0 115
12.6 21.4 11.5 10614.0 26.7 17.6 160
9.6 10.0 12011.2 25.5 12.5 169
13011.6 21.5 11.3 14611.1 23.5 10.2 16011.4 22.8 10.9 12719.7 27.4 12.6 17812.7 24.1 11.7 133
15.3 20.3 12.2 142
11.2 25.2 11.0 170
19.6 14220.6 12621.0 112
10620.6 16018.9 140
- —— 20.4 152
7.6 16.0 6.16.9 21.2 7.6 916.0 19.0 7.2 127
10.0 19.6 9.0 1076.9 20.4 9.1 909.3 21.8 8.0 1008.1 21.3 6.6 848.8 21.8 8.0 846.0 21.8 6.6 888.4 22.2 7.5 120
7.8 21.4 7.1 113
9.8 24.0 6.7 156
120 469
92 42062 2602178 39080
77 240 27861
116
90
76 i49 622 21156 645 18859 691 26349 620 23127 711 22145 798 22652 788 228
769 22851 685 20842 639 22342 ___ 168
46 545 275se eec 23442 263 23046 17144 580 15738 220 16151 21843 i48 10944 605 202
41 641 21662 614 26076 660 30568 740 30709 731 265
66076 691 30859 1,017 30267 780 31376 956 35272 785 345
72 ___ 261
68 983 309
762732670 320
790648
711 12065 487 17645 651 16352 543 16875 275 9060 531 17029 547 10441 734 18645 775 18518 602 10460 710 18070 703 187
777 221
STATE 01° COLORAnt) 61
— 10 YEAR (1928-271 AVERAGE YIELD PER ACRE HARVESTED (PRINCIPAL CROPS)
SUGAIIWINTER WHRAT SPRING WHRAT i POTATOES DRY BEANS BEETS
Irrig.COUNTY and
Irri- Nun- Irri- Non- 3rd- Non- Irri- Non— Non—gated Irrig. gated Irrig. naiad Irrig. gated Irrig. Irrig.(flu.) (flu.) (Ru.) (Bu.) (Ho.) (Ru.) (Lbs.) (Lbs.) (Tons)
8.8
5.0
10.0
10.0
7.522.311.612.212.013.212.013.0
12.8
12.311.1
9.9
13.0
12.2
11.4
12.4
10.3
10.2
11.1
6.26.76.9
6.87.4
6.4
10.28.52.17.2
10.210.111.292
12.0
16.6
12.3
*Indtcates approximate lecation of District far which Counties are given - above.

\i l1I(’[.’9l1L\ L ST
(‘(IJON—ACREAGE PRODUCTION. AND VAlVE. 080-1927
Acres Yield Production, Price ValueYear Per Acre, BuheIs Per Value Per
-Planted Harvested Bushels
-
Bushel
-
Acre
1880 24,000 185 444,000 5 7•7 $ 341.880 $14.24
1901____i 21,000 16.0 400,000 1.06 420,001 16.80
1802_* 26,000 18.6 481,000 .00 432,900 16.05
1883 26,000 19.0 494,000 .85 419,800 16.19
1884___ 28,008 21.0 589,000 .65 382,200 13.69
I881__’ 22,000 21.0 672,000 .68 456,960 14.26
1886_* 31,000 20.0 700,000 .90 150,000 10.00
1087 40,000 15.0 600,000 .03 378,000 9.41
1888 41,000 18.0 810,000 .67 461,700 10.26
1809 53,000 19.5 1,034,000 .18 999,720 11.32
I 090 18,000 19.0 1,044,000 63 687,720 11.34
1891 63,000 21.5 1,154,000 53 717620 3139
1802.____ 70,000 22.0 1,940,000 .40 616,009 6.80
1h03__ 70,009 16.0 1,120,000 .11 971,200 6.16
l094 72,000 19.5 1,404,000 .01 896,440 11.90
1099 102,000 98.0 1.030,000 .41 752,760 7,08
1890 102,000 16.0 1,612,000 .16 587,520 5.76
1097_ 100009 19.0 1,900,000 .38 722,000 7.22
1898__ 97,000 18.0 1,740,000 .40 698,400 7.20
1099 93,000 15.0 1,001,000 .43 599,810 6.41
1900__ 04,000 16.5 1,739,000 .48 034,720 8.86
iooo_: 109,000 17.0 1,852,000 .74 1,171,220 12,28
1902__l 111,000 16.5 2,102,009 .59 1,275,580 9.74
1901_ ._‘ 147,000 37.0 2,002,909 .94 3,353,080 0.45
1901 iv I.aea 09.0 3,110,030 .94 1,602,610 10.26
1008 160,003 20.0 3,099,ovo 47 1092000 940
i906_.* 193,000 19.0 3,705,000 .50 1,082,500 0.50
1907_Z 210,000 10.0 3,780,000 .65 2,407,000 11.70
1008__ 260,000 10,0 4,160,000 .71 2,993,600 11.30
1909 301,000 17.8 6,426,000 .70 4,498,200 12.40
19i0* 390,000 19.9 6,049,000 .60 3,027,000 9.30
1911 421,000 14.0 5,804,000 .78 4,597,329 13.92
1912___ 403,000 19.0 8,797,000 .50 4.398,500 9.50
1933 500,000 15.0 7.900,000 .73 5,475,000 10,05
1914_i 030,000 19.0 11,970,000 .00 7,102,000 11,49
1915 700,000 20.0 14,000,090 .55 7,709,Ocpj 51,00
1910 793,993 349 10500000 90 9450000 1
1017] 840,000 16.0 15,120,000 1.25 10,900,000 22.50
1918_ 009,000 10.0 14,000,093 1.35 19,900,000 24.90
19 090.000 13.5 12,123,000 1.42 17,214,660 19.17
1920 1,050,000 10.5 19,530,000 .70 13,075,290 12.95
1921J 1,010,000 12.0 12,432,000 .31 3,853,020 3.721922 1,120,000 34.0 15,750,000 .60 10,715,000 9.24
5933_’ 1,415,000 22.0 01,139,993 .65 20,234,390 14.301934 1,878,000 1,130,000 0.0 12,321,009 .90 10,040,000 7.401921.. 1,600,000 3,337,009 33.0 10,001.000 .70 13.000,700 9.001926_ 1,727,000 1,537,009 6.3 0.090,000 35 3,092,900 4.0119L 3,101,000 3,IN,000 00.0 29,230,000 .60 31,122.800 10.20
1928.. 0,603,000 1,110,000 13.0 20,992,000 .00 14,274,100 9.10
l929_ 1,614,000 1,933,000 14.9 22.220,000 .75 15,781,000 10.29
1930...[ 1,101,000 1,496,000 21.0 31,304,000 .49 15,020,920 10.02
1931 1,935,000 1,600,000 9.5 15,770,000 .36 5.677,200 1.42
1932. 2,980,000 1,859,000 7,5 13,942,000 .20 0,909,760 2.10
lOll.J 2,020,000 1,709,000 11.0 19,035,000 .34 6.670,900 3.74
1934_ 1,025,000 044,000 4.0 9,376,000 .97 3,274,720 3.08
1939J 5,508,090 1,266,939 0.5 10,761,000 .66 7,102,000 5.61
1936 .. 1,500,009 1,211,939 0.0 11,100,009 1.10 12.280,000 9.90
‘—— 1,060,00o 1,067,000 8.9 9,106.000 .60 0,004,900 9,11
Nute—Frior to 1929 the price per unit used is as of December 1. Beginning with 1929 theprice per unit is the average annual price per unit.

ST’e’fE OF COLOIIAI)C) 63
CORN—UTILIZATION FOR GRAIN, SILAGE, HOGGING DOWN, GRAZING AND FORAGE, 1924-1937
FOR GRAIN FOR SILAGE HoggingDown,
Year Yield Yield GrazingAcreage Per Production Acreage Per Production FHarvested Acre Bu. Harvested Acre Tons AcreageBu. Tons
COLORADO
1924 1,104,000 9.5 10,488,000 50,000 3.4 170,000 296,000
1925 1,211,000 13.5 16,348,000 31,000 4.1 127,000 205,000
1926 1,205,000 7.5 9,038,000 46,000 3.0 179,000 286,000
1927 1,212,000 15.0 18,780,000 34,000 5.5 187,000 168,800
1928 1,379,000 14.0 19,106,000 30,000 4.9 147,000 146,000
1929 1,262,000 15.0 18,930,000 46.000 5.0 250,000 225,000
1930 1,237,000 22.0 27,214,000 41,000 5.5 226,000 178,000
1931 1,350,000 10.5 14,175,000 13,000 4.0 212,000 257,000
1932 1,402,000 8.5 12,682,000 09,000 3.0 207.000 298,000
1933 1,527,000 11.5 17,560,000 57,000 5.0 285,000 201.000
1934 248,000 6.4 1,587,000 91,000 2.5 228,000 505,000
1935 931,000 9.5 8,844,000 71,000 3.0 213.000 264,000
1936 931,000 10.0 9,310,000 68,000 2.7 184,000 242,000
1937 610,000 0.6 5,760,000 75,000 33 218,000 352,000
UNITED STATES
1924 84,119,000 22.1 1,800,112,000 4,307,000 6.67 28.737,000 11,994,000
1925 86,825,000 27.4 2,382,288,000 3,081,000 797 29,313,000 10,825.000
1926 03,275,000 25.7 2,140,207,000 4,350,000 7.01 30,403,000 11,027,000
1527 85,915,000 26.4 2,218,189,000 4,268,000 7.01 29,926,000 10,174,000
1528 85,852,000 26.3 2,260,950,000 3,985,000 7.53 30,000,000 10,519,000
1929 03,194,000 25.7 2,135,030,000 4,021,000 7.10 29,335.000 10,590,000
1930 85,110,000 20.6 1,757,270,000 4,875,000 6.22 30,316,000 11,081,000
1531 91,022,000 24.5 2,227,881,000 4,714,000 7.04 55,163,000 11,038,000
1932 96,800,000 20.6 2,572,102,000 4,177,000 7.58 31,680,000 9,348,000
1933 91,790,000 22.9 2,100,292,000 4,714,000 6.87 32,375,000 9,220,000
1934 61,245,000 18.7 1,146,684,000 6,919,000 5.03 34,750,000 23,969,000
1935 82,882,000 24.2 2,005,482,000 4,672,000 7.20 34,012,000 7,887,000
1936 . 67,640,000 18.5 1,253,766,000 8.309,000 3.90 32,419,000 17,071,000
1937 81,509,000 28.7 2,343,258,000 5,140,000 6.97 35,334,000 7,161,000

7 A.G1-OICSJLTU13AL STATISTICS
ALL WHEAT—ACREAGE PRODUCTION. AND VALUE. 1880-1937
Acres Yield Production, j PriceYear Per Acre, Bushels Per Value
Harvested Bushels Bushel
ValuePer
Planted’ Acre
l890____ 68,009 17.6 1,190,000 6 .95 $ 1,130,000 $1662
l881___.J 90,000 20.0 1,600,000 1.33 2,128,000 26.60
l982____ 91,000 19.0 1,729,000 .94 1,625,260 17.861893 108,000 21.0 2,209,000 .95 2,154,600 19.961994 110,000 21.1 2,161,000 .10 1,324,400 12.04
1081 112,000 20.0 2,249,909 .12 1,836,800 10.40l086.._.. 112,000 20.0 2,240,000 .72 1,612,809 14.40l887.J 109,000 21.0 2,289,000 .75 1,710,750 15.75
l819 121,000 17.5 2,119,000 .90 1,906,200 18.75l889.J 127,000 22.4 2,945,000 .72 2,040,400 10.131090____ 143,000 18.6 2,646,000 .91 2,143,260 14.99
1891 153,000 23.0 3,119,000 .73 2,569,870 16.791892. 175,000 19.0 3,325,000 .19 1,928,900 11.020893 151,000 14,0 2,114,000 .52 1,099,280 7.211094._..j 130,000 11.0 2,340,000 .69 1,121,900 11.703196 133,000 23.6 3,126,000 .66 1,750,600 13.16l196.. 105,000 13.5 2,498,000 .61 1,123,780 1.241897 210,000 24.0 5,049,990 .70 3,528,000 16.001898 240,000 22.0 6,280,000 .56 2,856,800 12.321899 285,000 18.9 5,576,000 .57 3,178,320 10.771900 310,000 19.0 5,580,000 .30 3,292,200 10.62
1901 310,000 21.0 6,510,000 .67 4,333,700 14.07l902..._ 294,000 12.3 3,675,000 .75 2,730,230 9.381803_. 205,000 20.0 1,000,000 .66 3,194,000 13.201904_.......j 280,000 18.0 5,220,000 .91 4,750,200 16.380905 300,000 21.0 6,300,000 .70 4,410,000 14.701906..J 310,000 25.0 7,790,000 .65 9,037,500 16.251907....... 325,000 21.0 6,821,000 .78 5,323,500 10.301008....J 335,000 17.0 5,695,000 .88 5,001,600 11.06t909 341,000 22.5 7,687,000 .93 7,140,010 20.061910__.! 400,000 15.5 6,388,000 .92 5,074,100 12.601913! 470,000 13.0 6,120,000 .94 5,140,800 10.041912___ 485,000 22.3 00,810,000 .73 7,091,300 10.271913 405,000 18.0 8,363,000 73 6,523,140 14.03t914...__. 325,000 20.5 10,287,000 .87 9,819,000 18.70iois_._Z 680,000 22.0 15,380,000 .00 12,304,000 18.001916 74.5,000 17.7 13,162,000 1.50 19,728,000 26.481917 770,000 20.4 15,670,000 1.92 30,243,100 39.281911__.... 1,220,000 17.2 21,025,000 1.95 40,908,700 33.4710l9_.. 3,405,000 1,320,000 13.6 18,300,000 2.02 36,066,000 27.011020_.J 1,000,000 1,410,000 35.6 21,907,000 1.35 29,650,450 21.02
1921....... 1,887,000 1,751,000 14.6 20,374,000 .76 10,284,240 11.011922_._ 2,020,000 1,878,000 12.0 22,087,000 .89 20,102,430 10.701023.* 2,174,000 1,538,000 11.8 18,318,000 .13 15,037,040 9.701924...J 1,005,000 3,300,000 13.0 17,624,000 1.18 20,796,320 35.20
‘925H 2,040,000 1,487,000 11.5 17,122,000 1.30 23,205,920 15.66
‘926H 2,090,000 1,615,000 12.4 20,890,000 3.07 22,352,000 13.271927....__[ 2,273,000 1,668,000 13.4 22,299,000 1.03 22,967,970 13.77
1920H 2,227,000 1,481,000 14.0 20,797,000 .85 17,077,450 11.941929___. 1,809,000 1,639,000 11.7 17,034,000 .90 17,210,640 11.101930....... 2,016,000 1,609,000 13.9 23,008,000 .62 14,295,900 8.021031._ 2,670,000 1,420,000 12.0 17,040,000 .33 5,623,200 3.961932....J 1,700,000 704,000 10.6 7,447,000 .37 2,755,390 3.011933_...J 1,320,000 583,000 10.9 6,350,000 .89 3,683,000 6.321934...J 1,606,000 704.000 0.8 0,102,000 .84 5,201,280 7.30
1,388,000 653,000 11.1 6,532,000 .90 5,880,000 10.041936_.._ 1,728,000 853,000 12.5 10,091,000 1.00 10,702,000 12.5019 1,700,000 1,130,000 13.3 15,150,000 .01 14,240,000 12.54
Note—Prior to 1129 the price per unit used is as of December 1. Beginning with 1029 theprice per unit is the average annual price per unit.
‘Winter wheat is planted fall of preceding year
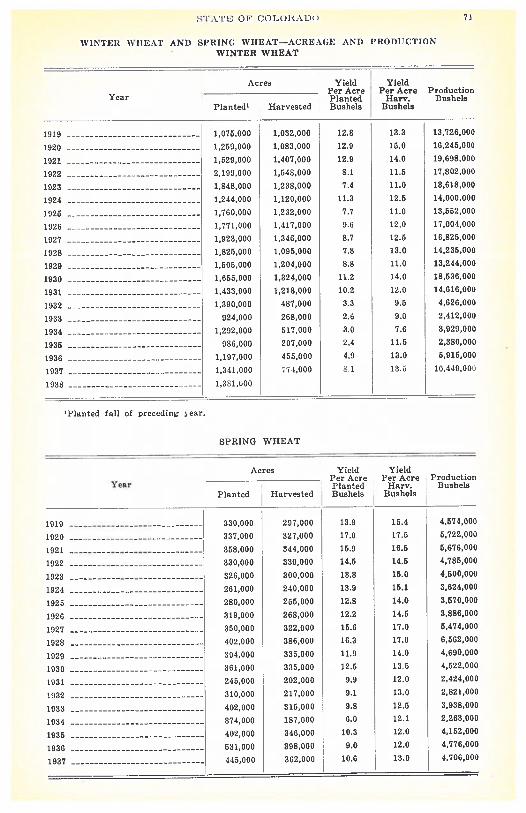
STXTN OF’ COLtJIIA1JG 71
WINTER WHEAT AND SPRING WHEAT—ACREAGE AND PRODUCTION
WINTER WHEAT
Acres Yield Yield, Per Acre Per Acre Productionear Planted Harv. Bushels
P1anted Harvested Bushels Bushels
1919 1,071,000 1,032,000 12.8 13.3 11,726,000
1920 1,259,000 1,093,000 12.9 15.0 16,245.000
1921 1,529,000 1,407,000 12.9 14.0 19,608,000
1922 2,139,000 1,048,000 8.1 11.5 17,802,000
1923 1,848,000 1,238,000 7.4 11.0 13,618,000
1824 1,244,000 1,120,000 11.1 12.0 14,000,000
1921 1,760,000 1,232,000 7.7 11.0 13,552,008
1926 1,771,000 1,417,000 9.0 12.0 17,004,000
1927 I 1,923,090 1,346,000 8.7 12.0 16,825,000
1928 1,825,600 1,095,000 7.8 13.0 14,235,080
1929 1,505,000 1,204,000 8.8 11.0 13,244,000
1930 1,655,000 1,324,000 11.2 14.0 18,536,000
1931 1,433,000 1.218,000 10.2 12.0 14,616,000
0932 1,390,000 487,000 3.3 9.5 4,626,000
1933 924,000 268,000 2.6 9.0 2,412,600
1934 1,292,000 917,000 3.0 7.6 3,929,009
1935 986,000 207,000 2.4 11.5 2,380,080
1936 1,197,000 455,000 4.9 13.0 5,916.000
1937 1,341,000 174,000 8.1 13.3 10,449,000
1938 1,381,000
‘Planted fall of preceding year.
SPRING WHEAT
Acres Yield YieldPer Acre Per Acre Production
ear Planted Hare. BushelsPlanted Harvested Bushels Bushels
1919 330,000 227,000 11.9 11.4 4.574,003
1928 337,000 327,000 17.0 17.5 5,722,000
1921 358,000 144,000 I 15.9 16.5 5,676,000
1922 330,000 330,000 14.5 14.5 4,785,099
1923 326,000 300,000 13.8 15.0 4,500,000
1924 281.000 240,000 13.9 15.1 3,624,000
1925 280,000 255,000 12.8 14.0 1,570,000
1926 019,030 260,000 12.2 14.5 1,880,000
1927 353,000 022.000 15.6 17.0 5,474,000
1928 402,000 386,000 16.3 17.0 6,562,000
1029 394,000 335,000 11.9 14.0 4.690.030
1930 361,000 135,000 12.5 13.5 4,522,000
1931 I 245.000 202,000 1.9 12.0 2,424,000
1932 110,000 217,000 9.1 13.0 2,821,000
1930 402,000 315,030 9.8 12.5 1.930,000
1934 I 374,000 187,000 6,0 12.1 2,263,000
1935 402,000 346,000 10.3 12.0 4,152,000
1936 131,000 308,000 9.0 12.0 4.776,000
1937 415,000 362,000 10.6 13.0 4,706,000

.\‘ll1l1’l.’l’1l1,-\1. i-O’l’.vl’lS’[’lt:S
1880
1881_. —
1882.._. —
1883__ —
l894......18831886_1887
188818801890
109L.... -
1899_1893181418951890____1897
1898__1899__..1900____
1001____1902..
1905____19041905190619071908
19091910
19111912
19131914191519101917
1910____I1919l920_..
19211922
1923192 l____ 273,069lll21_.. 239,000
232,00019L 197,0001926 191,0001929_ 291,0001930____ 190,000
l911__ 197,0001932__ 259,0001933___ 200,000193•l_ 107,000
1935___ 176,0001916. 197,000l917_. 106,000
OATS__ACREAGE. PRODUCTION, AND VALUE. 1800-1937
Acres \‘ieId [ Production Price ValueYear Per Acre, Bushels ‘ Per Value Per
Planted Harvested Bushels Bushel Acre
26,000 27.0 702,000 $ .05 $ 456,300 $17.65
12,000 27.5 000,000 .81 712,000 22.2850,000 54.0 1,292,000 .05 830,800 22.1044,000 20.5 1,254,000 .60 752,400 17.1048,000 12.0 1,510,000 .40 074,400 12.0058,000 12.0 1,850,050 .40 851,760 14.7266,000 29.0 1,914,000 .42 803,090 12.1879,000 27.0 2,152,000 .45 959,850 12.1580,000 24.0 1,920,000 .42 826,400 10.0888,000 28.6 2,517,000 .40 1,006,800 11.6491,000 20.0 1,820,000 .50 910,000 10.00
101,000 28.0 2,828,000 .38 1,074,849 10.64117,000 26.5 3,100,000 .34 1,054,000 9.01126,080 24.5 3,087,000 .37 1,142,190 9.06114,000 27.0 3,078,000 .46 1,415,880 12.42122,000 24.0 4,182,000 .28 1,170,960 9.52157,090 22.0 2,574,000 .30 772,200 8.80112,000 34.0 3,808,000 .32 1,218,560 10,88111,000 34.0 3,774,000 .41 1,547,240 13.94121,000 29.0 3,509,000 .42 1,473,780 12.18113,000 29.5 3,924,000 .43 1,687,320 12.69125,080 32.0 4.320,000 .50 2,180,000 16.00137,000 24.0 3,358,000 .51 1,711,560 12.49138,000 32.0 4,416,000 .41 1,810,560 13.12117,000 35.5 4,864,000 .46 2,237,440 18.33138,000 35.0 4,830,000 .41 1,990,300 14.35148,000 18.0 5,024,000 .45 2,510,800 17.10156,000 55.0 5,480,000 .50 2,730,000 17.50180,000 31.5 5,670,000 .54 3,061,800 17.01200,000 38.0 7,600,000 .53 4,028,000 20.14205,000 52.0 6,560,000 .48 3,017,600 14.72205,000 28.0 5,740,000 .48 2,755,200 11.44205,000 38.0 7,790,000 .38 2,960,200 14.44215,000 30.0 6,450,000 .44 2,838,000 13,20225,000 35.0 7,875,000 .45 3,543,750 15.75225,000 33.0 7,425,000 .41 3,044,250 13.53225,000 28.5 6,412,000 .60 3,847,200 17.10230,000 32.0 7,360,000 .76 5,591,600 24.32185,000 10.0 5,550,000 .80 4,440,000 24.00174,000 26.0 4,524,000 .90 4,071,600 23.40204,000 11.5 6,426,000 .80 3,895,600 18.90217,000 29.5 6,402,000 .33 2,112,660 9.74185,000 25.0 4,625,000 .49 2.081,250 11.25213,000 30.5 6,496,000 .46 2,988,160 14,03232.000 26.0 6,032.000 .18 3,190,160 11.00211,000 20.0 5,457,000 .10 2,728,500 12.72191,090 26.0 1,070,000 .11 2,210,800 11.1-11 89,000 29.0 1,481,000 .48 2,610,880 13.92183,000 30.0 5,490,000 .41 2,170,100 13.00203,000 29,0 5,887,000 .47 2,766,890 13.63177,000 10,0 5,310,000 .05 1,858,500 10.50156,060 24.5 3,822,000 .27 1,031,940 6.62181,000 26.0 4,706,000 .22 1,255,320 6.94180,000 25.5 4,080,000 .28 1,142,400 7.14103,000 25.0 2,575,006 .52 1,339,000 13.00160,000 28.0 4,489,000 .34 1,923,000 9.52102,000 28.0 1,210,000 .49 2,001,000 33.72143,000 33.0 -1,112,000 .40 1,773,000 12.10
Note——Prior to 1929 the prire per unit used is as of December 1. Beginning with 1929 theprice per unit is the acerage annual price per unit.

I’ t_( 11,1 )l3.\ I 73
BAFILEY——AI2IZEAGE, PSIODIJCTION. .0700) VAlUE, 1880-19:17
Acres Yield Production Price ValueYear Per Acre, Buhels • Per Value Per
Planted Harvested Bushels Bushel Acre
1880..___ 4,000 27.6 110,000 $ .00 $ 90,000 $24.76
1001 5,000 27.0 135,000 1.15 155,250 81.05
1802 39H 27.5 138.000 .92 126,900 2539
1083 3,000 27.0 102.000 .75 121,500 20.25
1884..... 7,000 27.5 152,000 .57 109,440 15.63
1885..J 8,000 27.5 220,000 .00 132,000 36.50
1880..J 12,000 27.0 324,000 .62 200,880 16.74
1887...J 11,000 27.0 297,000 .62 184,140 16.74
1808 12,000 20.0 312,000 .70 218,400 18.20
1880 12.000 27.4 323,000 .63 207,270 17.27
1890....,J 13,000 24.0 212,000 .76 237,120 18.24
ioos..... 14,000 28.0 362,000 .56 219,520 15.68
18t2J 16,000 27.0 432,000 .14 233,280 14.58
1893 18,000 25.5 459,000 .50 223,500 12.75
l894J 18,000 20.0 408,000 .58 271,440 15.08
1895 20,000 28.0 500,000 .60 336,000 16.80
1896__ 19,000 21.5 408,000 .40 187,080 9.88
1897 20,000 28.5 570,000 .51 290,700 14.54
1808 20,000 20.5 530,000 .46 243,800 12.19
1899 22,000 24.2 532,000 .05 292,600 13.30
1900 25,000 23.0 575.000 .50 287,500 11.50
1901__ 23,000 23.5 889,000 .63 434,070 16.70
1902....J 30.000 20.0 600,000 .60 360,000 12.00
1903J 31,000 27.9 852,000 .61 519,720 16.77
1904 37,000 28.5 1,054,000 .57 000,780 16.24
1905 43,000 28.5 1,228,000 .53 649,780 15.11
1906 49.000 28.0 1,372,000 .54 740,880 15.12
1907 61,080 26.0 1,580.000 .00 951,600 15.001908 02,000 23.0 1,420,000 .65 920,900 14.95
1909 71,000 20.5 1,882.000 .66 1,242,120 17.49
1910__ 70,000 20.5 1,558.000 .00 934,800 12.30
1911___: 74,000 19.9 1,443,090 .69 995,070 13.461912* 70,000 27.5 2.090,000 .50 1,045.000 13.751913 118.000 21.0 2,478,000 .50 1,387,680 11.76
5934. 112,000 20.5 2,908,000 .55 1,632,400 14.591915 125,000 20.0 3.120,000 .48 1,497,600 12.481916..._.. 100.000 20.5 3,280.090 .82 2,089,600 16.811917 108.000 24.0 4,032,000 1.04 4,193,289 24.961918 206,000 21.0 4,320,000 1.13 4,888,380 23.73
1919 153,000 58.5 2,830.000 1.20 3,396,000 22.201920 210,000 22.9 4,800,000 .75 3,045,000 16.38
1921 202.000 21.6 4.343.000 .37 1.600,910 7.961922...._j 180.000 20.5 3.813.000 .59 2,249,670 12.101023.... 223,000 22.0 4,906,000 .54 2,649,240 11.881921_... 418,000 312,000 10.0 4,992,000 .72 2,594,210 11.52
1925__ . 507,000 170,000 15.0 1,040,000 .58 3,271,200 8.701920_._ 487,090 350,000 15.5 3.425.000 .51 2,983,750 8.32
10z 418,000 385,090 20.0 7,700,800 .10 4,312,003 11.20
1920____ 341,000 312,000 23.0 11,778,000 .11 8,359,040 12.42
1920_.._ 700,058 008,000 18.0 10,944,000 .65 6.019.200 9.90
1920 58a,085 538.000 20.5 10,865.000 .40 4,436,000 8.20
1831 980,000 439,000 t5.9 6,804,000 .27 1,837,080 4.181932__ 813,000 472,000 16.5 7,788,000 .20 1,557,690 3.30
1933.... 898,000 405,000 16.0 6.480,000 .28 1,814,400 4.48
1934_..__ 480,003 192,000 19.7 3,782,000 .65 2,458.300 12.80
1935...__ 369,000 321,000 20.0 0,420,000 .44 2,825,000 8.80
2930___ 550,010 301,000 18.3 7,122,000 .72 5,128,000 13.3$
193L..__ 512,080 408,000 21.5 8,772,000 .33 4,049,080 11.30
Note—Priur to 1929 the price per unit used is as of December 1. Beginning with 1023 theprice per unit is the average annual price per unit.

,\C 11H i: LTUP,AL S’l’A’l’IS’f itS
EYE—ACREAGE, PRODUCTION, AND VALUE 1880-1937
-
Acres Yield Production Price ValueYear Planted for Harvested 1t Acre,; Bushels • Per Value Per
All Purposcs for Grain Bushels Bushel Acre
i88O____ 1,000 12.5 12,000 5 £7 $ 8,040 $ 8.041881____! 1,000 10.5 10,000 .97 11,520 15.521882__* 2,000 14.0 28,000 .90 25,200 12.001083___J 2,000 11.0 26,000 .90 20,800 10.4018S4....__ 2,000 13.0 26,000 .60 15,600 7.801885 2,000 7.5 15,000 .68 10,200 5.101886 2,000 11.5 23,000 .72 16,560 8.281887..... 2,000 7.5 15,000 .78 11,700 5.811888 2,000 0.5 13,000 .00 9,580 4.29l800...._i 5,000 11.7 58,000 .57 03,060 6.61l090..._.. 5,000 8.0 40,000 .08 26,000 5.20
1891 6,000 12.5 75,000 .62 46,500 7.75
1892_H 8,000 13.0 104,000 .52 54,080 6.761893 6,000 5.0 30,000 .50 15,000 2.501981 4,000 10.5 42,000 .66 27,720 6.93l895....r 3,000 15,0 45,000 .48 21,600 7.201896 3,000 10.0 30,000 .62 18,600 6.201997 3,000 12.8 38,000 .82 19,760 6.89l896... 3,090 10,5 46,000 .50 23,000 7.671899.........J 2,000 12.2 24,000 .48 11,520 5,761900 3,000 14.5 44,000 .54 23,760 7.921901..J 3,000 13.5 40,090 .62 24800 8.271902_* 4,000 12.0 49,000 .56 26,080 6.721909 6,000 15.0 90,000 .61 54,900 9.151904-—H 7,000 15.0 105,000 .65 68,250 9.751905 8,000 10.6 104,000 .56 58,240 7.201906... 10,000 13.0 130,000 .56 72,500 7.281907 12,000 13.0 156,000 .62 96,720 8.061908 15,000 0.0 135.000 .70 94,500 6.301909_..... 16,000 12.6 202,000 .73 147,460 9.22iolo__: 20,000 9.5 190,000 .67 127,000 6.361933..... 21,000 7.5 158,000 .70 110,600 5.271912..._.. 20.000 12.0 300,000 .55 165,000 6.601903 33,000 10,5 346,060 .60 207.600 6.291914J 71,000 12,0 952,000 .65 553,800 7.801919___* 90,000 11.0 990.000 .70 693,000 7.70
1916h 87,000 7.0 609,000 1.05 639,450 7.381917 124,090 10.0 1,240,000 1.46 1,810,400 14.601918. 166,000 8.0 1,328,000 1.40 1,859,200 11.201919 133,030 8.2 1.091,000 1.30 1,418,300 10.661920.....j 106,000 11.0 1,166,000 1.03 1,224,300 11.55192oH 107,000 11,5 1,230,000 .60 738,000 6.90i922_.. 129,000 7.5 960,000 .66 033,600 4.991923 84,000 11.0 924,000 .56 517,448 6.161924.....* 90,000 80,000 0.0 640,000 .95 144,000 6.001923..... 100,000 92,000 8.0 730,000 .67 490,120 9.301926_i 100,000 87,000 9.0 780,000 .71 655,930 0.391927.. 80,000 70,000 8.5 595,000 .70 116,500 9.931920_; 80,000 60,000 9.2 092,000 .70 380,400 6.44l929H 05,000 64,000 8.0 512,000 .73 375,700 5.811910; 90,000 74,000 0.5 629,000 .40 251,800 3.40
9935_.r 06,000 46,000 7.0 322,000 .23 74,060 1.61L932.._ 53,000 29.000 6.0 174,003 .21 36,540 1.26i930_ 00.000 25,000 6.0 150,000 .47 70,500 2.52i934_ 69,000 33,000 5.6 155,000 .71 131,350 5.90i939_._ 77,000 23,000 7.0 101,000 .92 84,000 9.65i936...__ 75,000 20.000 8.0 232,000 .77 179,000 0.511937_..[ 101,000 45,000 8,5 382,000 .60 229,000 8.091030____ 86,000 —
Note—Prior to 1929 the price per unit used is as of December 1. Beginning with 1929 theprice per unit is the average annual price per unit.
About two-thirds of this acreage is Winter Rye planted for all purposes in the fall of thpreVious year.

S’I’AYE OF COLORADO
POTATOES—ACREAGE, PRODUCTION, AND VALUE, 1880-1937
Acres Yield Production, Price i ValueYear Per Acre, Bushels Per xrslue Per
Planted Harv. Bushels Bushel Arre
bOO__H 6,009 60 360,000 $1.10 $ 396,000 066.001881____ 8,000 63 50-1,000 1.30 655,200 81.00
1882 10,000 75 750,000 .72 510,000 54.00
b883....... 12,000 75 950,005 .65 585,000 48.75
1884_._! 15,000 80 1,200,000 .60 720,000 48.00
1885 18,600 65 1,170,000 .61 713,700 19.65
isoo.......i 20,000 80 1,600,000 .57 912,000 45.60
1887_- 25,000 85 2,125,000 .56 1,190,000 47.00
1888 29,000 73 2,117,000 .45 952,650 12.85
1889_ 32,000 55 1,760,000 .50 880,000 27.50
1890.._.._ 94,000 86 2,924,000 .75 2,191,000 04.50
l891: 16,000 93 3,148,000 .28 937,440 26.04
1892... 14,000 84 2,856,000 .61 1,742,160 50.24
0893..J 17,000 90 1,330,000 .5-1 1,798,200 48.60
1894_i 39,000 101 3,939,000 .55 2,166,450 55.55
1895..* 42,000 103 4,326,000 .11 1,427,580 33.99
1896_j 40,000 78 3,120,000 .47 1,466,400 30.66
1897__ 41,500 97 3,977,000 .56 2,227,120 54.32
1898_J 44,000 99 4,356.000 .51 2,352,240 53.10
1899! 4-1,000 101 4,441,000 .55 2,441,200 55.55
l990_J 46,000 66 3,026,000 .82 2,189,520 34.12
b991..J 43,000 102 4,386,000 .00 3,947,400 91.80
190° 47,000 88 4,136,000 .51 2,109,360 44.88
1903_ 51,000 121 6,171,000 .60 3,702,600 72.60
1904.._ 55,000 134 7,370,000 .17 2,726,900 49.58
1905__ 56,000 111 6,216,000 .57 3,543,120 63.27
1906__! 55,000 102 5,610,000 .45 2.524,500 45.90
1997._H57,000 120 6,840,000 .66 4,514,400 79.20
1008____; 68,000 120 8,160,000 .60 4,896,000 72.00
1909———.. 86,000 137 11,782,000 .57 6,715,710 78.05
1019__ 90,000 101 9,360,000 .55 5,118,000 57.2°
1911__ 84,000 64 5,376,000 .99 5,322,240 63.36
1912_..._ 80,000 130 10,400,000 .41 4,264,000 53.10
1913._,__ 76,000 91 6,916,000 .65 4,495,400 59.15
1914_.... 72,000 139 10,008.000 .50 5,004,000 69.50
1915__j 68,000 101 19,268,000 .55 5,617,400 53.05
1916_._ 68,050 312 9,656,000 1.35 13,035,600 191.70
1917_ 88,000 160 14,080,000 .91 12,812,800 145.60
1918 82,000 154 12,628,000 .99 12,501,720 152.46
1919.._ 78,090 015 8,970,000 1.70 15,249,000 195.50
1920_ 73,000 135 9,855,000 .80 7,884,000 - 308.00
1921 113,000 152 14,016,000 .75 10,888,680 96.36
1922 136,000 140 19,040,000 .37 7,044,800 51.80
1920_.._J 96,000 123 01,808,000 .53 6,258,210 65.19
1924__, 72,000 145 10,440,000 .60 0,264,000 87.00
1925* 62,000 195 12,090,000 1.55 18,739,500 - 502.25
1926 86,090 76,000 145 11,020,000 1.30 14,326,000 - 188.50
1927__ 109.000 99,000 165 16,535,000 .55 8,984,250 90.75
1928......1 119,000 114,000 155 17,670,000 .15 7,951,500 69.75
1929..._._J 92,000 90,000 161 14,070,000 1.14 16,723,000 185.82
1930_.._.j 95,000 94,000 190 17,860,000 .09 12,323,400 131.10
1513l_...J 122,000 106,000 95 10,070,000 .33 3,323,100 31.35
I932___J 141,000 115,000 110 12,650,000 .24 0,036,000 26.63
3933..__.. 104,000 98,000 150 14,700,000 -18 7,056,000 72.09
3934..__J 119,000 93,000 84 7,812,000 .59 4,609,100 49.56
1935__ 107,009 100,000 180 18,000,009 .50 9,040,000 95.40
1936____ 106,000 100,000 185 18,500,000 1.11 20,535,000 205.35
1937_’ 114,000 106,000 148 15,680,000 .50 7,844,000 - 74.00
Note—Prior to 1029 the price per unit used is as of Decemher 1. Beginning with 1029 theprice per unit is the average annual price per unit.

76 Al 11Tc1:LTLIIAL Si’ AT] ST [US
TAME HAY—ACREAGE, PRODUCTION, AND VALUE, 1880-1937
Yield Production.Acres Per Acre, Tons
Tons
1880 60,000 1.55 01,000
YearPrice ValuEPer Value PerTon Acre
$25.62 $ 2,082,660 $29.71
1881 72,000 1.80 110,000 20.00 2,600,000 36.111882 73,000 1.05 131,000 13.73 1,006.210 20.411003 02,000 2.00 164,000 13.50 2,211,000 27.001004 73,000 1.90 109,000 12.00 1,660,000 22.011885 80,000 1.70 150,000 9.06 1,494,000 16.081886 115,000 1.70 196,000 0.80 1,920,000 10.701887 150,000 1.80 270,000 iO.75 2,002,500 19.211888 240,000 1.00 456,000 11.40 5,198,400 21.601889 330,000 2.90 627,000 9.10 5,705,700 17.201800 365,000 1.60 584,000 0.00 5200,000 14.40
1801 440,000 1.90 838,000 8.00 8,688,000 15.201892 520,000 2.00 1,040,000 0.50 6,760,000 13.001803 540,000 1.40 756,000 0.98 5,276,880 0.771094 540,000 1.90 1,026,000 7.54 7,736,040 14.021890 860,000 2.20 1,232,000 5.87 7,221,840 12.911896 540,000 2.00 5,000,000 6.22 6,717,600 12.441897 560,000 2.10 1,176,000 8.50 6,468,000 11.501898 180,000 2.26 1,276,000 5.40 8,890,400 11.881899 593,000 2.18 1,293,000 7.35 0,003,550 16.001900 610,000 2.28 1,572,000 7.60 10,427,200 17.01
1901 615,000 2.10 1,292,000 9.04 11,679,680 18.901002 595,000 1.75 1,041,000 9.89 10,295,490 17.301003 620,000 2.25 1,300,000 7.48 10,434,600 16.801004 670,000 1.85 1,240,000 6.71 8,920,400 12.421905 710,000 2.15 1,526,000 8.20 12,511,200 17.621906 695,000 2.01 1,421,000 9.50 11,517,500 19.181107 735,000 2.21 1,654,000 9.50 10,715,000 21.001108 745,000 1.75 1,304,000 8.75 51,410,000 15.021909 785,000 2.13 1,672,000 10.00 16,720,000 21.001910
. 800,000 1.65 1,320,000 10.80 14,256,000 17.82
1911. 825,000 1.80 1,485,000 9.30 13,810,500 16.74
1112 900,000 2.15 1,935,000 8.70 16,834,500 18.711901 945,000 1.95 0,842,000 10.00 18,430,000 10.501104 1,030,000 2.15 2,214,000 7.40 16,383,600 15.011915 1.010,000 1.95 1,170,000 7.60 14,972,000 14.025916 915,000 1.75 1,616,000 11.00 17,996,000 19.211917 980,800 2.10 2,058,000 16.60 34,162,800 54,861918 1,000,000 2.00 2,060,000 11.50 31,930,000 31.901919 1,228,000 1.92 2,558,000 18.50 40,621,000 35.521920 1,247,000 2.16 2,612,000 12.60 52,504,000 21.91
1921.. 1,254,000 1,98 2,481,000 6.90 17,118,000 13.69
1022 1,255,000 1,78 2,202,000 11.20 24,998,400 19.921923 1,281,000 1.86 2,381,000 11.30 26,030,200 21.011924 1,295,000 1.65 2,128,000 11.00 21,108,000 18.101921 1,291,000 1.71 2,205,000 12.00 26,460,600 20.601926 1,238,000 1.84 2,279,000 8.60 19,090,400 15.801927 1,203,000 1.82 2,355,000 9.20 21,666,000 18.761928 1.285,000 1.72 2,204,000 11.70 25,786,800 20.971929 1,257,000 1.77 2,230,000 10.60 23,638,000 18.801030 1,293,000 1.71 2,215,000 9.07 20,090,050 15.541931 1,239,000 1.38 1,713,000 7.85 13,447,000 10.851932 1,245,000 1.48 1,840,000 6.50 13,960,000 9.611913 1,156,000 1.52 1,757,000 5.30 9,312,000 8.061934 981,000 1.28 1,257,000 12.00 15,084,000 15.381815 1,060,000 1.60 1,712,000 6.50 11,128,000 10.411806 1,057,000 1.60 1,690,000 8.20 10,890.000 13.101937 1.022,000 1.03 1,661,00’’ 7.80 12,056,000 12.6s
Price per unit used is as of December 1.

S’i’ATE OP COLORADO
HAY (ACREAGE DY EINDS( COLORADO AND (0. 5., 1924-1937
All Clover Sweet Grains Cot Miacella- SweetYear Alfalfa •and Clover Green for neous Sorghuma WildHay Timothy Hay Hay Tame Hay’ for Forage Hay
Acres Hay’ Acres Acres Acres’ and Hays AcresAcres Acres
COLORADO
(924 890,000 162,000 37,000 88,000 136,000 83,000 362,000
925 I 872,000 362,000 14.000 100.060 143,000 84,000 360,000
926 854,000 162,000 12,080 75,000 135,000 100,O00 3 (2,000
927 863,000 179,000549991
95,0005439091
08,000 376,000
928 811,000 223,000 17,000 95,000 139,000 79,000’ 357,000
925 610,000 181,000 14,000’ 125,000 129,000 59,000, 302,000
.930 826,000 16,000 313,000 146,000 68,000 366,000
931 743,000 173,000:12,000 165,000 146,000 72,000 362,000
939 706,000 180,000 10,000 175,000 174,000, 100,000’ 360,000
933 653,000 150,000 12,000 130,000 209,000 212,000 373,000
034 601,000’ 123,000 11,000 90,000’ 150,000’ 112,000j 308,000
935 643,000 135,000 11,000 100,000 170,000 207,000 351,000
930 656,000, 122,000 22,000 138,000 119,000 155,000 336,000
027 626.000 130,000 21.0001 110.00(1 1 25.000 211.0001 330,000
UNITED STATES
924 10,352,000 34,038,000 720,000’ 3,161,000 7,004,000 1,634,000 15,166,000
925 .
‘ 10,388,000 31,677,000 728,000 3,109,030 6,166,000 1,031,000 14,661,000
926 10,721,000 29,970.000 713,000 3,863,000 6,319,003 1,664,000 13,331,000
927 11,277,000 31,163,000 821,000 3,054,000 6,192,000 2,014,000 14,527,000
928 13,123,000 28,519,000 879,000 2,042,000’ 6,065,000 1,894,000 13,172,000
929 11,519,0001 29,935,000 954,000 3,254,000’ 5,779,000 1,588,000 13,571.000
930 31,604,000 27,114,000 853,000 1,971,000’ 5,908,000 1,006,000 11,789,000
931 11,782,000 25,084,000 810,000 5,975,000 0,163,000 2,172,000 13,862,000
332 12,650,000 23,667,000 834,000 4,829,000 6,460,000 2,409,000’ 14,048,900
333 12,745,000’ 23,480,000 720,9001 5,442,000’ 6,364,0I0 3,217,000’ 12,053,000
334 11,691,000 20,146,000, 719,000 6,718,0001 6,92l,000 3,296,000’ 8,623,000
331 ‘ 13,649,000’ 20,300,000 649,000 4,348,000’ 6,910,000 1,490.000’ 12,399,000
936, 14,1(6,000 22,013,008 1.102,000 6.611,000 3,921,000 2,77,000 10,379,000
937 I 13,707,000, 19,461,000 6l9,009 1,641,0001 6,791,000’ 2,996,000 11,521,000
‘Excludes sweet clover and leapedeza hay.‘Inclodes millet, sodan, hershey, etc., cut for hay.‘Sorghum (a not ordinarily claaaified as hay and (a not included in the “All ‘lame Hay” totals givenlaewhere in thia volume.

75 AGISICULTUIIAL STATIS’l’It’S
ALFALFA BAY—ACREAGE, PRODUCTION AND VALUE, 1924-1937
YieldYear Acres per Acre Production Price Value Value
Harvested (Tons) (Tons) per ‘Ion per Acre
1024_.. 890000 3.80 1,016,000 811.70 819,258,000 821.60
1925 872,000 1.90 1.657,000 12.50 20,712,000 23.80
1026 854,000 2.10 f 1,703,000 9.20 16,496,000 19.30
19 863,000 2.05 1,769,000 9.70 17,119,000 19.90
1928 811,000 2.00 1,622,000 12.70 20,590,000 25.40
0020 810,000 2.07 1,677,000 13.20 38,782,000 23.20
1030 826,000 2.00 1,612,000 9.50 1 5,094,000 19.00
1031 743,000 1.05 1,226,000 8.40 10,208,000 13.00
1032 706,000 1.75 1,236,000 7.00 0,652,000 12.20
10:13 655,000 1.90 1,244,000 6.00 7,464,000 11.40
1024 601,000 1.57 911,000 12.50 71,800,000 19.60
11135 613,000 1.95 3,251,000 7.20 0,029,000 14.00
10:10 050,000 1.95 1,270,000 8.80 11,255,000 17.20
1037 636,050 1.95 1,240,000 8.00 10,054,000 10.00
GRAIN SORGIIU5I (FOR GRAIN) ACREAGE, PRODUCTION AND VALUE, 1924-1937
Arres YieldYear Harvcstcd per Acre Production Price Value ‘I abc
for Grain (Bushels) (Bushels) per Du. per Acre
1024 30,000 8.0 318,050 8 .00 $ 280,000 I 8 7.00
1925 50,000 12.5 025,000 , .71 , 444,000 8.90
1520 47,000 3.5 258,000 .60 155,000 3.30
1027 50,000 11.5 575,000 .05 571,000 7.50
1525 15,000 12.0 540,000 ] .00 321,000 7.20
1920 30,000 11.5 414,000 .58 240,000 0.70
1030 57,000 11.0 i 518,000 .40 207,000 [ son
1031 50,000 12.0 108,000 .20 91,000 2.40
19 31,000 , j 217.000 .10 35,000 1.10
1937 56,000 5.5 : 170,050 .35 107,000 5.00
1034 1 10.000 4.5 72,000 1.30 94,000 5,00
1035 11,000 5.0 180,000 .00 123,000 ‘1.05
1530 43,000 10.5 452,000 I .00 431,000 10,10
50 -.14,000 5.0 352,000 .17 105.000 3.00
SWEET SORGhUM (FOE FOBAGE( ACREAGE, PRODUCTION AND VALUE, 1924-1037
Acres Yield,
per Production Price - Value
Scar Acre (Tons) ,por 0’ clue per Acre
Planted Harvested (Tons) fun 0-farrcstcd
1024:
95,000 85,000 1.20 102,000
1025 90000 84,000 1.00 84,000 ..
1020 120,000 100.000 .00 90,000 ..
1027 05,000 08,000 1.30 111,000
1528 55,000 79,000 1.20 95,000 0 5.20 S 770,000 0 0.00
1920 05,000 50,000 1.10 05,000 0.00 520,000 8.80
1030 71,000 08,000 1.20 02,000 0.30 517,000 7.00
1031 58,000 : 72,000 .90 05.000 ‘1.80 312,000 ‘ 1.31
193° 154,000 100,000 .70 70,000 4,75 532,000 3.30
1033 225,000 ‘ 212,000 1.10 213,000 4.10 , 955,000 4.50
1934 251,000 113,000 .51 02,000 10.40 1 045,000 5.70
1931 270,000 ‘ 207,000 .80 100,000 5.40 890,000 4.30
1050 238,000 155,000 .90 140,000 7.10 1,050,000 0,00
1037 209,000 ‘ 211,000 .70 140,000 0,20 010,550 1,40

SU
GA
RB
EE
TP
RO
DU
CT
ION
INC
OL
OR
AD
O,
1905
TO
1937
Year
Acr
esA
ver
age
Pro
ducti
on
Farm
Val
ue
Avera
ge
To
ns
No.
of
,H
arv
est
ed
Yie
ld,
Tons
Pri
ce
Val
ues
per
Acre
Sugar
Su
gar
Facto
ries
To
ns
Co
nte
nt
Mfr
’d.
Opera
tsngt
1901
06.0
0010
.19
07
1,1
54
II
11.7
191
,608
I12
1906
111,
800
13.4
11
,40
7,3
83
14
70
167.
193
1519
0712
8,00
011
.93
1,5
23,3
00
11.3
010
9,28
716
1908
119,
500
9.28
1,1
89.0
00
F13
.85
122.
280
1519
091
21
,70
010
.33
1,2
16,7
00
—___
14.2
41
49
.405
1619
1081
.400
10.6
2864.5
00
15.1
91
03
.092
1619
118
6,4
00
11.0
79
57
.10
05.
555,3
12,0
00
61.4
611
.44
12
4,8
00
1419
1214
5,00
011
,12
1,6
42,0
00
5.96
9,7
85,0
00
67.4
916
.19
216,0
10
1719
1316
0,40
010
.91
1,9
40,7
00
5.67
10,4
37,0
00
61.9
714
.92
22
9,2
74
1419
1413
5,40
012
.60
1,7
06,3
00
5.68
9,6
92,0
00
71.5
815
.35
220
.79
913
1919
171,
200
11.0
11,8
88,9
00
5.88
11,1
06,0
00
64.8
716
.53
27
3,7
80
1419
1810
9,00
010
.70
2,0
18,3
00
6.08
12,2
31,0
00
64.8
6I
15.0
02
52,1
47
1419
1716
1,00
011
.50
1,8
57,7
00
7.28
13,5
26,0
00
83.7
519
.40
23
4.3
01
1509
1812
6,00
011
.47
1,4
44,0
00
10.0
214,4
74,0
00
114.
8316
.10
19
2.0
00
1419
1918
3,00
09.
661
,76
5,0
00
10.8
519,1
43.0
00
104.
6513
.62
19
4.0
00
1519
202
20
,00
010
.58
2,3
25,0
00
11.5
527,6
27,0
00
125.
2512
.81
294,0
00
5719
212
00
,00
011
.39
2,2
79,0
00
6.37
14.5
21.0
00
72.6
1i
15.6
62
95
,00
015
1922
146,
000
9.93
1.4
86,0
00
7.79
11,4
26,0
00
77.1
614
.66
18
3,0
00
1519
2116
4.00
012
.15
1,9
06,0
00
5.15
16,2
76,0
00
99.1
914
.59
240.0
00
1619
24221,0
00
11.3
22,0
07,0
90
7.59
19,0
25,0
00
86.1
016
.65
36
4,0
00
1619
2513
0,00
01
2.6
01,6
40,0
00
5.90
9.8
15,0
00
75
.50
14.2
5211.0
00
1619
26211,0
00
13.8
02,9
02.0
00
7.92
23
.05
0,0
00
109.
2415
.05
37
7,0
00
171q
272
38
,00
012
.70
2,7
74,0
00
7.84
21.7
58.0
00
99.8
115
.25
373.0
00
is19
2817
9,00
013
.40
2,3
94,0
00
697
16
,68
7,0
00
93.2
216
.51
384,
261
1819
29210
,00
012
.44
2,6
12,0
00
6.93
18,1
01,0
00
86.2
0i
14.5
13
48
,000
1519
30242
,00
013
.69
3,3
12,0
00
6.91
22
,87
6,0
00
94.5
114
.10
40
7,0
00
1759
31224
,00
011
.32,9
32,0
00
5.44
13,7
74,0
00
61.4
915
.50
360,0
00
1719
3215
6,00
011
.39
1,7
77,0
00
4.62
8,2
10,0
00
52.6
315
.10
277.0
00
1719
332
09.0
00
12.6
2,6
28,0
00
4.62
12,1
41,0
00
58.0
915
.74
399,0
00
1719
5416
9,00
09.
31
,56
6,0
00
5.04
7,8
93.0
00
46.7
017
.15
272,0
00
17
1935
14
0,0
00
13.0
1,8
26,0
00
5.81
ilO
609
099
75.7
8298,0
00
171q
5017
1,00
010
.12,2
34,0
00
5.70
I2.7
33
,00
07
4.4
6335,0
00
1719
3716
0,00
012
.41,1
92,0
00
4.81
9.5
87
,08
159
.70
503,0
00
17
NO
TE
—C
om
pil
edfr
om
report
sof
the
Unit
ed
Sta
tes
Depnrt
snent
of
Agri
cult
ure
and
the
Colo
rado
Co—
Oper
ativ
eC
rop
Report
ing
Ser
vic
e,D
ata
on
pri
ces
and
farm
val
uo
pri
or
to19
11not
av
ail
ab
le.
Ex
clu
siv
eof
bee
tto
ps,
whic
hhav
ea
hig
hfe
ed“a
lue.
tln
elu
din
gbari
um
by-p
roducts
pla
nt
at
Joh
nst
ow
n.
‘Excl
usi
ve
of
govern
ment
paym
ents
.-a

\; I CLTLIIAL s’OA’01S7’lt’i0
9111.1) 11;IY—ACREAGE. PRODUCTION, AND VAI,ltE, 1000—1937
DRY IIEAI4S—ACIOEACR, PRODUCTION. AND VALUE, 1911-1937
Acres Yield Pccduc- Price ValueYear per Acre, Ron, cc Cwt Value er Acre: Planted Mary. Lbs. 100 Lb. Bags
P
1914 20,000 900 180,000 $3.33 $ 600,000 $30.001915 21,000 072 204,000 3.80 775,000 30.801916 38,000 672 215,000 7.00 1,781,000 46.871917 200,000 408 1,170,000 8.00 9,300,000 37.441918 252,000 99 953,000 7,33 7,207,000 20.601919 66,000 390 257,040 0.83 1,302,500 22.76
1820 52,000 49 230,100 5.25 ‘ 1,310,000 25.591921 45,000 400 . 216,000 4.50 072,000 21.601922 106,000 300 118,000 7.33 2,330,600 21.991929 159.000 489 763,000 6.17 4,708,000 29.61
1924. 296,000 204 583,000 5.17 3,014,000 10.34
(925 332,000 420 1,304,000 4.00 5,578,050 10.80
1920 398,500 210 000,000 4.67 4,0l5,OeO £0.09
1027 322,000 530 1,005,005 4.90 4,752,050 54.05
1920 374.000 270 1,010,000 5.07 5,726,006 05.31
1920_fl 122,600 372,000 300 1,339,000 4.90 6,502,600 17.64
1 3 483 000 450,000 600 2,700.000 2.80 F 7,560,060 06.80
1 468000 331,003 I 230 906,000 1.40 1,266,000 3.61
‘ 369000 221,000 138 438,000 1.50 ‘ 036,000 2.071932
46° 000 308,000 330 1,204,000 2.65 I 3,192,000 8.74
zz: 327:000 174,000 210 376,000 5.00 2,000,000 11.08
593r 547 000 133,000 270 1,171,000 2.75 3,007M00 0.90
1 06 428000 2s7,000 300 1,001,000 1.15 4,057,000 16.07
3910)0 21 1,000 720 781,000 3.6.3 2,035,000 11.05
Note—The decline in average yield and value per acre is due almost u’helly tn the large acreage
of non-irrigated land which has been devoted to this erup in recent ycaro Mere than 80 per cent ofthe crop is now produced without irrigation.
Yield Produe- Price ValueYear Acres per Acre, Lou, per Ten Value per Acre
_____________
-.
______
rons
1003 303.000 0.93 204.000 $ $ $1010 393,000 0.00 356.0001011 395.020 0.90 330,000 . ——
191 460,000 1.10 [ 103,0001913 419,000 0.95 300,000 I1311 444,003 1.20 533,000 L 8.80 4,690,000 10.5610 460,000 1.12 513,000 F 7.90 4,060,000 0.841310 460,000 0.92 423,000 11.40 4,823,000 10.481517. 151,000 1.02 400,000 37.50 8.030,000 17.051310. 200,000 0.94 376.000 17.50 F 0,003,000 10.451919 •iii.ooo F 0.89 300,000 ‘ 10.40 6,734.000 10.501920- 411,000 1,05 432,000 14.00 6,048,000 54.721321 403,000 F 1.00 403,000 0.00 2,418,000 0.001312. 363,000 0.95 343,000 9.00 3,103,000 8.551923. 039,000 1.00 399,000 10,50 4,130,000 10.50
1921 362,000 0.95 044,000 9.70 3,337,000 9.22
1325. 300,000 1.10 300,000 10.80 4,277,000 13.85
1320 342,000 1.15 337,000 8,00 3,144,000 0.11
131 370,000 1.10 414,000 8,40 3,478,000 0.25
1026 357,000 1,00 357,000 10.30 3,677,000 10.30
1329 F 362.000 .90 320,000 10.30 3,357,030 9.28
1930 360,003 0,00 700,000 8.83 3,220,030 8.85
1531 002,000 .80 290,000 7,50 2,175,000 6.01
0932 I 066,000 .90 323,000 5.40 1,777,000 4.80
53’3 . 373,000 1.00 373.000 0,20 5,033,003 5.20
1324 . 300,000 .70 2i6,00 13.90 2,370,400 0.33
1033 j 334,000 1.00 354,000 6.00 2,324,003 0.00
1326 330,000 , .93 312.°00 SoS 2,332,000 7.10
1337 330,000 1.00 230,000 7.03 2,104,090 7.ou
Note-Data concerning price and value not available for earlier 3 ears.

Co
Co
Co
—C
Oto
—C
oC
oC
o-
Co
Co
Co
CO
to—
Co
Co
C!
Co
Co
C’
Co
C.!
COC
OC
!•C
Co
Co
!C’
Co
toCo
to
Co
=C
oC
oC
oC
!C
o!C
,C
’C
o—
Co
toto
Co
Co
Co
Co
Co
Co
Co
Co
Co
Co
Co
—C
oC
oC
oC
oC
oC
oC
oC
oC
oC
o
Co
Co
Co
Co
Co
Co
—C
oC
oC
oto
Co
Co
Co
toI
II
toC
oC
oC
oC
oC
o.0
Co
Co
Co
ICC
oC
oC
oC
)!C
oto
CC
Co
Co
Co
Co
Co
toC
oIC
-—
Co
Cl
Co
Co
Co
CO
toC
o—
1—
1C
oC
oC
o0—
Co
C!
C!
Co
Co
toC
oC
oC
oC
oC
oto
Co
Co
toC
o
(CC
oC
oC
oC
oC
oC
oC
oC
oC
oC
oC
oC
oC
oC
oC
oto
Co
Co
Co
Co
Co
C’
C’
Co
Co
Co
Co
Co
Co
Co
Co
Co
Co
Co
Co
toto
Co
Co
—C
oC
oC
oC
oC
oC
oC
oC
oC
oC
oC
oC
oC
oC
oC
!to
Co
Co
Co
Co
Co
Co
Co
Co
Co
Co
CoC
oC
oC
oC
o!-‘
Co
Co
Co
Co
Co
Co
Co
Co
Co
Co
CO
Co
Co
Co
Co
Co
Co
Co
Co
Co
Co
Co
Co
—C
oC
oC
!C
oC
oC
oC
oC
oC
oC
oC
O-O
Co
Co
Co
Co
Co
Co
Co
Co
toC
oC
oC
oC
oC
oC
oC
oto
toto
Co
Co
toC
’C
o—
toC
oC
oC
!C
!!—
!to
Co
Co
C!
Co
Co
C!
Co
Co
Co
Co
Co
Co
Co
Co
Co
Co
Co
Co
Co
Co
CC
Co
Co
COC
oto
Co
tOC
oC
’C
oC
oto
Co
Co
Co
Co
Co
Co
to
frC
oC
oC
oC
oC
o
)C
oto
Co
toC
oC
oC
oC
oC
oC
oC
oto
Co
toto
!—!
to
Co
Co
CC
o—
’C
oC
oC
oC
oC
oC
oC
oC
oC
oC
oC
ot,
,’C
oC
o
Co
CC
oC
oC
!-‘
Co
Co
Co
!CC
oC
oC
oC
OC
oC
oCO
Co
CoC
oto
Co
Co
Co
toC
oC
oC
oC
oC
oC
oC
oC
oC
oC
!C
!
Co
CI
Co
Co
Co
Co
Co
Co
Co
Co
Co
Co
toto
I-’
Co
toC
o—
IC
oC
oC
oto
Co
Co
Co
Co
—C
oC
oto
toC
oC
oC
’C
o--
ICC
oC
oC
oC
oto
Co
Co
Co
I—’C
o-
Co
Co
Co
Co
Co
Co
Co
Co
Co
Co
Co
Co
C!
—C
oC
oC
oto
Co
Co
Co
Co
Co
Co
Co
—C
oC
oC
oC
oC
o—
‘C
oto
Co
—O
Co
toC
oC
oC
oC
IC
oto
Co
—C
oC
IC
!C
oC
oC
oC
oC
oC
oC
oC
oC
oC
oC
IC
oC
oC
!C
oC
o
Co
——
Co
Co
Co
Co
Co
Co
Co
Co
Co
Co
Co
toC
oC
oC
oC
o
Co
Co
.0-’
Co
Co
Co
toC
oto
Co
Co
Co
Co
Co
Co
Co
Co
Co
Co
Co
Co
‘CC
oC
oC
oC
oC
oC
oC
oC
oC
oC
oC
oC
oC
oC
oC
oC
oC
o00
Co
—C
IC
oC
oC
oC
oC
oC
oC
oC
o—
0—
C!
toC
o
B SI B Co H C to Co
Co
Co
Co
toC
-C
oC
oC
oC
oC
oC
!Co
Co
toC
oC
oC
o
II
II
II
I
Co
Co
Co
Co
Co
Co
Co
Co
Co
Co
Co
Co
II
II
II
II
II
II
II
II
II
II
II
!I
Co
toC
oC
oC
Cto
Co
Co
IC
oC
oto
Co
Co
Co
Co
toC
oC
oC
oC
oC
oC
oC
o!
Co
Co
Co
toC
o
Co
CoC
oC
oC
oC
oC
oC
oto
Co
Co
Co
CC
CoC
otoC
oC
oC
o
II
II
II
II
II
II
II
II
I
—!
Co
Co
—C
oC
o
Co
C!!
Co
Co
Co
Co
toC
oC
Co
Co
Co
Co
toC
oC
oC
o
II
II
II
II
II
I11111111111
LI
n 0 to 0 SI to B 0
-I B B Co C B C C H C B 01 to Co
Pea
and
Med
ium
Wh
ite
Gre
at
Nort
hern
All
Oth
erW
hit
e
Tota
lW
hit
e
Red
Rid
neyC
Pin
k
Pin
to
Bla
ckE
ye
All
Oth
er
Colo
red
Tota
lC
olo
red
Sta
ndard
Lin
oa
Bab
yL
ima
Tota
lL
ima
Oth
er
and
See
d
Tota
lA
ll
Co
—C
oC
oC
oC
oto
Co
Co
Co
C!
Co
Co
toC
oC
oC
oC
oC
o
Co
—C
oto
Co
Co
Co
Co
Co
Co
Co
Co
Co
Co
Co
toC
oto
—‘‘--‘C
oC
oC
oC
oC
oC
,C
oC
oC
oC
oC
oC
oC
OC
oo

52 Ai1lOICULT ORAL Pt’ A’I’IST ES
BROOMCORN—ACRRAGE, PRODUCTION, AN!) VALUE, 1015-1037
Yield ProducYear Acrea per Acre, lion, Price Value Value
!
Pounds Tons per Ton per Acre
1510 18,010 500 4,580 $ 71.00 S 111,000 $18.711111 21,808 210 1,200 158.0) 411,800 18.181117 31,100 340 5,100 182.00 1,438,0)0 47.031118 30,000 408 1,000 171.00 1,810,000 15.0)1910 11,000 421 2,300 100.00 230,000 20.811020 7,000 420 1,100 70.00 103,000 15.001121 9,000 415 1,900 45.00 90,000 9.561921 I 10,000 380 1,800 191.00 351,000 31.101023 I 48,000 365 8,800 145.00 1,276,000 20.581024 19,000 201 2,500 00.00 100,000 7.891029 13,000 250 1,900 140.00 206,000 17.731920 30,000 225 3,400 81.00 282,000 9.401527 35,000 330 0,800 120.00 600,000 10.891578.
.53,000 300 0,000 85.00 808,000 15.25
11123 04,000 206 9,200 100.00 075,000 19.231030 , 77,000 270 10,400 50.00 920,000 6.751321 41,000 250 9,600 90.00 202,000 4.481032 51,000 220 6,600 34.00 190,000 , 3.731033 j 55,000 100 4,400 05.00 418,000 7.601034 -, 40.000 345 2,900 177.00 513,000 12.821935 - 60,000 100 3,000 47.00 141,000 21.501936 , 43,000 110 3,000 SOlo 204.000 , 0.141037 32,000 010 2,100 55.00 310,000 3.02
GRAIN SORGIIUMS (ALL PURPOSES)—AC11I2S, t’RODUCTION, ANI) VALUE, 1010-1037
Acres . .
. I
I — -___________ - Yield per Production, Price ValueYear ] Acre, Bus. Buehele per Eu. Value per Acre
Planted Harvested
1010 312,000 16 4,092,000 51.20 5 5,050,000 $19.201920 I.. 312,006 11 4,000,000 .61 3,031,000 32.001021 I 293,000 13 5,009,000 .52 1,981,000 6.761022 250,000 12 3,100,030 .70 2,170,000 6.101023 311,000 i 10 5,500,000 .60 4,470,000 34.101924 203,000 103,000 7.2 1.318,000 .00 , 1,100,200 6.181025 216,000 216,000 11.5 2,029,000 .71 2.008,500 6.301120 270,000 227,000 1.0 000,000 .60 544,800 2.401027 230,000 I 245,000 10.0 2,100,060 oS 3,192,500 6.500920 228,000 220,000 10.3 2,310,000 .60 1,300,000 6.301920 228,000 221,003 14.0 2,210,000 , .56 1,201,600 5.861130 224,000 211,000 13.0 2,743,000 .40 . 1.097,200 5.201931 272,000 ‘ 220,006 10.5 2,310,0(10 .26 ‘ 402,000 2.101032 560,000 300,000 0.3 1,694,000 .10 271,000 .881033 391,000 270,000 7.2 1,044,000 .35 050,400 2.523034 541,000 117,000 3.3 485,000 1.30 630,500 1 4.221035 480,000 221,000 4.5 904,000 , .60 056,000 2.971030 381,000 217,000 5.0 3,051,000 .00 1,675,000 , 0.0410 450,000 201,000 0.5 0,121.000 .52 852,000 2.64
Note—The acreage includes beth sorghunss threshed for grain and that portion cut for forage,both being cousidered on the basis sf grain values.
WATERMELONS—ACREAGE. PRODUCTION, AND VALUE, 1518-1937
: Yieldper Pro- Price Value
Year Acres Acre duetion, Per 1,000 Value per
Melons Melons Melons Acre
1018 [ 075 360 115,000 $150.00 $20,000 $51.331019 [ 408 075 153,000 175.00 27,000 60.17
1020 850 315 261,000 150.00 09,000 47.00
1921 780 175 202,600 200.00 50,000 74.16
1022 600 350 201,000 180.50 42,000 63.03
1923 400 235 04,000 107.00 23,000 57.50
1024 580 300 114,000 128.00 11,000 31.00
1925 380 323 17,600 168.00 ‘ 16,000 55.33
1926 - 300 361 108,000 , 93.00 ‘ 10,000 33.33
1027 ‘ 700 150 105,000 I 242.00 ‘ 25,000 55.71
1928 - 000 319 287,000 150.00 I 43,000 47.78
1529 830 500 249,000 165.00 41,000 49.40
1930 , 840 520 260,000 170.00 46,000 54.76
1031 920 300 276,000 150.00 j 41,000 44.57
1032 1,000 320 320,000 90.00 29,000 20.00
0933 040 340 320,000 100.00 32,000 34,01
1934 I 930 200 186,000 - 120.00 22,000 21.66
1035 1,040 340 354,000 100.00 35,000 33.65
1936 j 1,200 330 396,000 150.00 50,000 40.171037 1,320 040 449,000 150.00 67,000 50.76
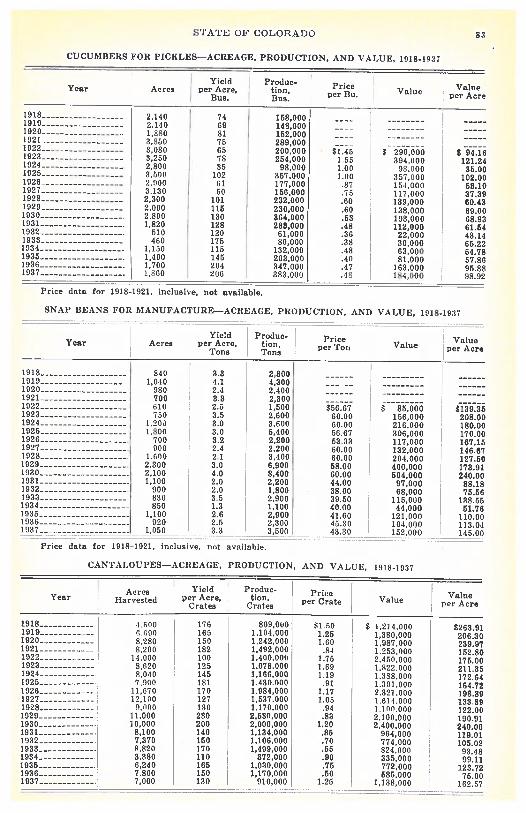
STATE OF COLORADO 83
CUCUMBERS FOR PICKLES—ACREAGE, PRODUCTION, AND VALUE, 1918-1937
Yield Produc- Price ValueYear Acres per Acre, tOn, per Bu. Value per AcreBus. Bus.
1918 2.140 74 158,0001919 2,140 69 148,0001920 1,559 81 152,0001921 1,850 75 289,000
.__1922 3,080 65 200,000 $1.45 $ 290,000 $ 94.161923 3,250 F 78 254,000 155 394,000 121.241024 2500 F 98,000 1.00 98,000 35.001925 2,500 J 102 357,000 1.00 257,000 102.001926 2,590 81 . 177,000 .87 151,000 53.101927 2,130 F 59 156,000 .75 117,000 37.301928 2,300 I 101 F 232,000 .60 139,000 60.431929 2,000 115 230,000 .60 138,000 69.001930 . 2,800 120 304,000 .53 195,000 $0.911931. 1,020 120 208,000 .46 112,000 61.541932 . 510 120 i 61,000 .36 22,000 49.141933 460 175 80,000 .30 F 50,000 65.221934 - 1,150 115 132,000 .49 63,000 ‘ 54.761935. 1,400 145 j 203,000 .40 01,000 57.861936 - 1,700 204 947,000 .47 163,000 95.8819. 1,960 206 103,000 .18 151,000 58.92
1918 810 F 3.3 2,6001918 1,040 4.1 4,3001920 980 2.4 2.4001921 700 3.3 2,3001022 610 2.5 1,5001023 750 3.5 2,6001924 1.204 3.0 F 3,0001925 1.000 3.0 5,4001926 -l 700 3.2 : 2,2001927 . 000 2.4 2,2001028 ‘ 1.600 , 2.1 2.400’1929 . 2.300 3.0 6,9001030 - 2,100 4.0 8,4001931 . 1,100 ] 2.0 2,2001032 . 000 F 2,0 1,8001033 830 3.0 2,0005034 850 r 1.2 . 1,1001035 1,100 2.5 2,9001036 920 r 2 SF2,2005017 . 1,010 3.3 1,500
Price data fur 1918—1921, inclusive, net available. — -
$56.67 0 55,000 $139.3560.00 156,000 206.0000.00 210.000 180.0056.07 306,000 170.0053.33 117,000 167.1560.00 152,000 146.6760.00 204,000 127.5058.00 400,000 173.9160.00 504,000 240.0044.00 97,000 86.1838.00 66,000 75.5629.50 115,000 128.5540.00 44000 F 51.7641.00 121,000 110.0045.10 104,000 ‘ 112.0440.30 152,000 145.00
CANTALOUPES—ACREAGE, PRODUCTION, AND VALUE, 1916-1937
Acres Yield Pr?due- Priee ValueYear 0{arc’ested per..cre, 10, per Crate Value per Acre
1918 .1.000 176 809,050 60.50 $ 1,214,000 5263.911919 6.800 165 1,104,000 1.25 1,380,000 206.301920 0,280 150 1.242,000 1.60 1,087,000 239.871021 8,200 182 5,492,000 .84 1.253,000 152.801922 14,000 100 1,400.000 1.75 5450000 F 175.001023 8.620 125 1,078.000 1.60 1,822,000 215.551924 8.040 145 1.186,000 1.10 I 1.sss.ooo ,
1925 7.000 181 1.400.000 .91 5.301,000 164.7!1026 11,670 170 1,984,000 1.17 2.321.000 I 19o.os1027 12,100 127 1,537,000 1.05 F 1.611.000 ‘ 110.381928 0.000 130 1.170,000 .04 1.150.000 122.001029 01,000 230 2.530,000 .83 2,100,000 190.911030 . 10,000 200 2,000,000 1.20 2,400,000 240.001031 - 8,100 140 1,134,000 .85 964,000 F 119.011032 7,370 150 1,106,000 .70 774,000 105.025023 - 8.820 170 1,490,000 .55 824,000 92.401034 3,580 110 372.000 i .90 315,000 F 99.111035 -: 6,240 165 1,050,000 .75 772,000 120.721026 7.800 j 150 1,170,000 .50 585,000 75.001027 - 7,005: 110 910,000 1.25 1,118,000 __
j__ 162.57
Price data for 1918-1921, inclusive, nut available.
SNAI’ DEANS FOR MANUFACTURE—ACREAGE, PRODUCTION, AND VALUE, 1918-1937
Yield Prpduc- Price ValueYear Acres per Acre, ton, per ‘fot’ ‘a1ue per AcreTons Tons
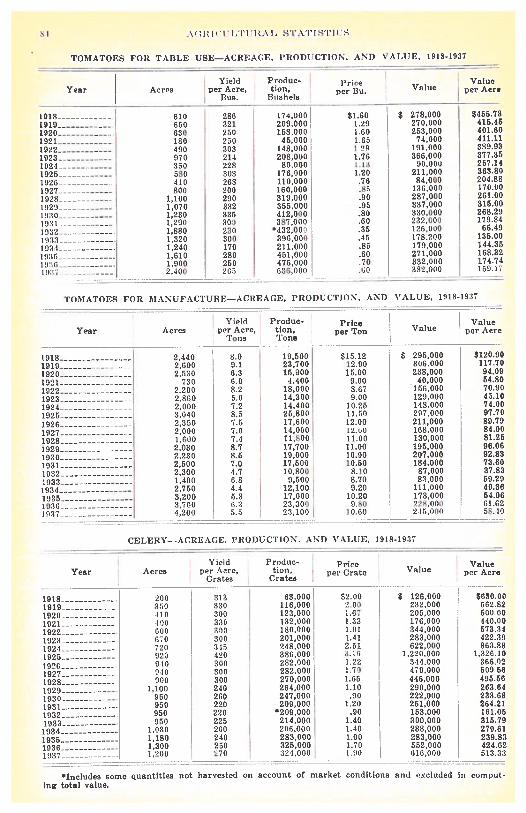
Si \(;11l(’l’l’rC1L5T S’I.’.Ai’TS’l’i(’S
TOMATOES FOR TABLE USE—ACREAGE, PRODUCTION, AND VALUE, 1918-1937
Yield Produc- Price ValueYear Acres per Acre, Ron, per Bu. Value ] per Acre
Bus. Bushels
1918 I 610 286 174,006 $1.60 $ 278,000 $455.731919 650 321 209.000 1.29 270,000 I 415.451920 630 250 110.000 1.00 233,000 481.68
1921 280 230 41,000 1.65 71,050 411.11
1022 450 303 148,000 1 29 191.000 389.93
1023 070 214 208,000 1.76 266,000 377.351924 350 228 80.000 L i.j:i 90,006 267.14
1921 580 303 176,000 1.20 211,000 163.80
1026 410 268 110,000 I .76 04,000 204.80
1927 i 809 200 160,000 .80 156,000 I 170.00
1028 1,300 290 319,000 .90 287,000 261.00
1025 1,078 332 351,000 .55 337,000 315.00
1030 1,230 336 412,000 .80 330,000 268.20
1971 .! 1,290 102 387,000 .60 132,000 179.84
15:12 1,880 230 432,000 .35 120,000 66.49
1973 1,320 000 506.000 .45 178.200 115.00
1974 . 1,240 ‘ 170 211,000 .85 170,000 144.11
1931 1,610 280 451,000 .60 271,000 168.32
1976 1,900 280 471,000 .70 352,000 174.74
I 1 400 26 6 000 (0 — S) 000 —— 1 01
‘l’OMATOES FOR 1IANUFACTUBE—ACEEAGE, PRODUCTION, AND VALUE, 1818-1917
Yield Produc- Price ValueYear Acres per Acre, Ron, per Ton Value per Acre
Tons ‘lone
1918 2,440 6.0 10,000 415.12 $ 290,600 $120.90
1910 2,600 9.1 23,700 12.90 106.000 117.70
1920 2,510 6.3 15,500 11.00 I 238,000 94.02
1021 700 6.0 ‘1.406 9.00 40,000 54.80
1012 2,200 8.2 18,000 1 8.67 [ 156,000 70.00
1923 2.800 5.0 14,300 0,00 129,000 45.10
1924 2,000 7.2 14,400 10.25 148,000 74.09
1021 3,040 8.5 21,800 11.50 297,000 97.70
1926 2,350 7.1 17,600 12.60 211,000 80.79
1927 2.000 7.0 14,060 12.00 ‘ 168,000 84.00
1928 I 1.600 I 7.4 11,800 11.00 130,000 81.25
1929 2,030 8.7 ‘ 17,700 11.00 195,600 96.06
1930 2,230 8.5 10,000 10.90 207,000 92.63
1031 j 2,000 7.0 17,600 10.00 184,060 73.60
1032 j 2,200 i 10,800 0.10 87,060 . 37.83
1013 1,400 6.0 0,000 8.70 85,000 09.20
193-0 2,710 4.4 12,100 9.20 111,000 40.36
1935 3,200 1.1 17,000 10.20 173,000 54.061016 2,700 6.0 21,100 9.80 220,000 , 61.621907 4,200 5.0 22,100 ] 10.60 211,006 58.40
CELEEV---ACEEAGE. PBODUCTION AND VOLUE, 1918-1917
Yield Produc- Price ValueYear Acres Pet5ctcc1;e
O1. per Grate Value per Acre
1918 200 113 63,000 62.00 $ 126,000 $038.000919 ‘ 100 320 116,000 2.00 232,000 662.82
1920 410 200 122,000 1.67 205,000 500.60
1921 . 400 . 116 102,000 1.21 176,000 440.00
1922 606 200 186,060 1.91 044,000 570.14
197 670 300 261,000 1.41 283,000 422.30
1924 720 115 048,000 2.11 622,000 861.88
1921 027 420 106,000 I 4.16 I 1,220.000 . 1.12610
1926 510 100 262.006. 1.22 341,000 366,02
1927 210 300 . 282.000 1.70 479,000 56956
1928 900 300 270,050 1.65 446,000 498.66
1920 1,100 240 264,000 1.10 290.000 260.64
1030 950 260 247,600 .60 222,000 233.68
1931 . 050 220 280,000 1.20 211,000 264.21
1912 . 950 220 *209,000 . .90 . 153,000 161.05
1933 . 225 214,000 I 1.40 ] 300,000 315.79
1934 1,000 200 266,000 1.40 288,000 279.61
loss 1,180 i 240 283,000 1.00 283,000 239.831936 1,300 230 325,000 1.70 ‘ 552,000 424.6210 - 1,200 470 324,000 ‘ 1.00 016.060 ‘ 513.37
*Includea aome quantities not harveated on account of market cunditiona and excluded in computing total value.

$‘l’\_’PI4 UI’’ (‘U151)IIAI)() S..
GREEN PEAS FOR TABLE CSE—ACREA(.E, PRODUCTION, AND VAlUE, 1922-1927
Yield Produc. Price ValueYear Acres per Acre, Don, per Bu. Value per Acre
Bushels Bushels
1922 300 45 14000 $1.55 $ 22,000 $ 73.8$1923 380 75 28,000 1.44 40,000 105.271924 850 80 68,000 1.85 126,000 100.00
1925 2.560 100 256 000 3.07 J 786.000 30’7.00
1926 1,840 02 120,000 1.9.1 233,000 120.10
1927 4,000 50 200,000 2.84 588.000 142.00
1928 4.900 59 289,000 1.60 462,000 94.29
1929 7.100 81 575,000 1.30 748,000 105.35
1930 . 5.820 80 466,000 1.65 769,000 132.11
1931 6.500 80 520,000 1.45 754,000 116.00
1932 . 11,050 $5 •71S 606 .59 300,090 27.15
1933 9,250 90 832,000 . .85 541,000 18.49
1934 8,970 75 673,000 1.10 740,000 82.30
1935 9,300 90 *837,000 .70 , 512,000 55.05
1936 6,300 60 760,000 .85 646,000 68.00
1937 11,100 ] 85 009,000 .70 678,000 59.47
EIlEEN PEAS 1’Olt SIAXt’FACTL’RE—ACREAEIO, l’IIODUCTION, AND VALUE, 1922-1937
Yield Froduc- Priee ValueYear Acres per Acre, lIon, per Ton Value per Acre
1Pounds Tons
1922 2,110 1,100 2,100 265.00 $116,000 $46.24
1923 3.609 1,000 1,806 69,00 12.1.000 33 ‘00
1924 3,1.10 1,603 2,500 92.0.1 129,000 41.72
1925 2,020 1.800 3,200 60.00 192,000 54.55
1926 2,570 . 1,800 2,313 60.10 139,000 54.09
1927 . 59Q1) 1,800 1.710 60.00 103.000 54.21
1928 0,010 I 1.900 I 2,890 59.5Q 112.000 47.32
1929 1,776 3,020 44.00 133,000 39.12
1530 1,709 1,220 1,370 46.00 185,000 41.89
1931 . 3,500 1,480 2,100 45.80 119,000 94.00
1932 2,770 1,230 1,700 34.80 50,000 21.50
1933 . 2,230 1,080 1,560 33.30 65,000 27.90
1924 3,770 2,050 3,800 37.40 1.1-1,000 38.20
1935 3,820 1,900 3,630 39.10 142,000 37.17
1996 3,560 1,970 3,510 58.80 136,000 36.20
2.61111
1,010 , 0.01) 16.00 141,000 , 30.21
CABBAGE—ACREAGE, PRODIJC’l’OON, AND VALUE. 1010-1937
Acres YIeld Produc- Price Av. ValueYear Harvested per Acre, 1105, per Ton Value per Acre
ions Pans
1918 4,120 9.0 , 3S,0’,hi 621.50 0 931,000 $220.611919 .1,009 10.0 1 40.0301 20.30 800,000 200,00
1920 4.390 15 0 60.109 9 0-’ 599.400 136.54
1921 3,992 ‘ 11 7 ‘ 46.730 24 55 1.147.000 287.09
1922 5,210 12,0 62.900 1.27 260,000 51.82
1923 5.270 I 1.1,3 75.400 7.10 958.000 105.91
1924 4,010 I 11.0 44.100 11.2° 502,000 125.20
1925 2.000 11.5 23,000 16)10 426.000 218.00
1922 3.220 13.6 43,800 7 29 319,000 99.08
1927 2,300 14.6 1 81,500 ‘ 13.97 468.000 203.48
11)28 2,900 14.4 45,600 12.2.1 509.000 175.52
1929 2,300 I 10.6 35,000 , 20,43 715,000 216.67
1930 3,900 12.5 48.700 J 8.62 420,000 107.69
1931 . 3,800 8.3 01,600 11.84 469,600 123.42
1032 4,150 10.6 *43.900 5,31 174,000 41.93
1933 3,700 11.4 42,100 16.41 691,000 186.76
1931 4,050 8.4 30,900 18.61 631,000 155.80
1935 - 4,800 11.1 53,200 7.31 389,000 81.04
1930 4,700 9.2 43,200 35.09 1,516,000 322.55
1937 5,220 10.5 34,000 - 10.60 382.000 111.49
lncludes aome quantitiea not harvested on account of market conditions and excluded in comput
ing total value.

SO AU1{3(’IJLTUISAL Si’Ai’iS’f K’S
LETTUCE—ACREAGE, PRODUCTION, AND VALUE. 1918-1937
Year
1910_19191920_19211922-.1923—-19241925
-
1928-
19271928
-
I 929. —
19301031....1932_
‘3:1io:i-i
IlilO-
Yield ProducAcres per Acre, tion,
Crates Crates
ValueValue per Acre
126,000 8900.00135,000 710.55320,000 449,32361,000 404.45
1.017,000 307.831,557.000 201.991,028,000 583.572.206.000 210.092,178,000 164.502.373.000 179 241,083,000 123.071,114,003 107.63
570,000 76.61777,000 116.84221,000 20.59563,000 100.00304,000 71.90320,000 I 66.47507.000 130.00470,000 100.00
CAULIFLOWER—ACREAGE, PRODUCTION, AND VALUE, 1922-1937
Year
1021921192419251020
1920192012301031193210331034193519361937
Yield Produc- Price ValueAcres per Acre, tion, per Crate Value per AcreCrates r Crates
200 277 72,000 $1.82 $ 121,000 $501.00400 160 64,000 1.11 71.000 177.00400 160 64.000 1.00 111,000 208.00
1,000 180 ‘ 160,000 .71 1 14,0C0 114.001.100 00 00,000 1.15 114,000 103.641,1.00 200 306.000 1.78 108,000 515.521,700 300 110.000 1.20 012,000 360.003,200 360 1,112,000 .70 806,000 211.582,800 320 896,000 .80 717,000 256.073,900 260 1,004,000 .70 F 710,000 182.054,480 240 F ‘1,075,000 .40 360,000 80.361.14SF 260:818,000 .40 326,400 100.057.800 200 120,OrO .15 234,000 00,002.750 250 ‘088,000 .55 000,000 112.563.200 220 704.000 .45 317,000 00.002,720 220 190,000 .60 159,000 111.99
DRY ONIONS—ACREAGE, PRODUCTION, AND VALUE, 1918-1937
Yield Produc\‘ear Acres per Acre lion, Pcice Value Value
Sacks Sacks per Sack per Acre
1918 700 139 97,000 $ 1.75 $ 170,000 $242.851919 ‘ 830 142 118,000 2.84 335,000 403.611920 760 194 147,000 ‘ 1.26 185,000 243,421021 1,300 171 222,000 2.68 525,000 456.091922 1,900 160 504,000 .01 277,000 145.791023 2,620 142 172,000 1.00 707,000 269.851024 3,410 104 525,000 1.02 516,000 157.181925 3,520 185 051,000 1.37 892,000 253.411920 3,700 117 581,000 .88 011,000 138,111927 4,300 182 783,000 .80 626,000 145.581028 3,760 188 707,000 2.40 1,760,000 468.081929 7,000 210 ‘1,470,000 .80 1,110,000 158.571030 1,000 175 ‘ 980,000 .50 540,000 08.031931 4,050 110 522,000 1.30 684,000 168.891932 1,670 165 936,000 .40 132,000 52.081930 4,150 157 052,000 .80 522,000 125.781034 4,440 120 133,000 .88 469,000 105.631915 4,000 205 020,000 .75 610,000 153.751030 4,200 101 093,000 .00 554,000 151.901937 4,100 210 1,012,000 1.30 1,310,000 200.00
Priceper Crate
140190730900
6,0006.7105.600
10,50011.24013.2400,8008,1007,4406,6508,3105,6305,4805,1003.0004,700
25523025027018811085
111110110125110
9090
1001000005
100100
56,000 83.5045,000 0.00
182,000 1.80243,000 1.50
1,080,000 1.71972,000 1.60476,000 2.16
1,306,000 1.581,523,000 1.431,456,000 1.03 F1,012,000 1.07
801,000 1.25670,000 .85198,000 1.30
‘031,000 .10563,000 1.00493,00r .80484,000 .70090,000 ! 1.10 F470,00U 1.00
‘Includes some quantities not harvested on account of market conditions and excluded in computingtotal value.

X’i’XTE 01” C(LOI1ADU 57
SNAP BEANS FOR MARKET—ACREAGE, PRODUCTION. AND VALUE. 1928-1937
ValueValue per Acre
5 228,000 $100.00
255,000 170.00
362,000 206.86
201,000 106.35
83,000 17.65
155,000 9627
162,000 100.00
24C, 000 120.00
315,000 131.25
725,000 105.0’)
CARROTS FOR MARKET—ACREAGE, PRODUCTION, AND VALUE, 1928-1937
Yield Produc- Price Valueleac Acres per Acre tlon per Bushel Vahie per Acre
Bushels) (Bushels)
1928 250 2-10 8 1,000 8 .90 8 76,000 $217.1-I
1920 -170 280 ‘ 172,000 ‘I’) 53.000 125.57
1930 400 225 101,000 .15 -bOOS 88.S9
1)112 .150 200 90,000 .00 5-1,006 120.00
1932 500 220 110,000 .35 38.0011 76.03
1933 . — .i -120 225 9-1,1100. .50 I .17,0011 1 11.00
193.1 . 5)0 1110 02,000 .65 53,000 157.92
1931.. 6)0 250 152.000 .50 76.0(10 124.50
1936 730 210 133,070 .80 122,000 167.12
910
225 207,000 .65 131,000 1-16.17
ALL COMMERCIAL TRUCK CROPS, 1921-1937
FOR MARKET FOR SIANOJFACTURE
Year Acres‘ Va)ue
AcresValue
Macvested ‘ HarvestedPer Acre Total Per Acre Total
1924 27,670 $184.53 54.375.000 9,230 5 55.11 5 601,000
1925 21)180 245.54 7.165,000 11,060 215.99 1,160,000
1926 111,420 171.77 11,206,000 8,620 73.20 031,000
19 19,400 170.43 ‘ 6,714,000 8,210 06.71 549,000
1028 31.310 186.92 6,600,000 9,510 71.71 682,000
1929 .11,570 169.76 7,566,000 11,060 87.70 ‘ 971,000
1930 -10,730 117.53 0,410,000 12,770 92.07 1,172,00:1
1931 38.750 132.54 5,136,000 10,260 75.95 571,000
193 .. 17,560 51.17 2,62-1,000 7,800 33.85 285.000
1933 10.500 103.43 1 4,180,000 5,140 , 70.07 326,000
1034 :1-1,560 101.27 1,500,000 9,840 -12.18 418,00))
1930 19,200 08.42 3,858,000 11,240 50.18 564,000
1030 .11,910 132,26 5,547,000 11,’SSO 58.66 690,00))
1037 - 45,1-10 126.96 5,731,000 12,530 78.82 737,000
Year- Yield Produc- Price
Acres per Acre tion per Bushel(Bushels) (Bushels)
1928 1.2011 200 210,000
192I
1,500 ‘ 200 100,000
1030 3,750 230 ‘102,000 -
1931 1,000 125 276,000
193’ 1,700 95 - 162,000
1933 1,610 1110 258,000
101-I 1,620 95 151,000
1935 I 2,000 110 I 300,000
3936. 2,190 125 - 300,000
1937 3,100 120 372,000
5,95
-
.87
.90 -
.85
.50 -
.60
1.05
.00

A(101UULTl’10.lL Si’.-\’rIs’rl ‘i-i
APPLES AND PEACI-1ES—PIOODUCTIOX AND VALUE, 1910-1937
APPLES
Year Produc- Price Produc- Pricetion, per flu. Value tion, per flu. ValueBus. Bus,
1910 1500000 0115 1725,000 390,000 $1.80 $ 702,0001910 2,700.000 1.22 3,294,000 410,000 1.75 718.0001912 3,100,000 SO 2.480,000 1,100,000 1.00 1,100,0001913 3,300,000 1.08 3,564,000 090,000 1.24 484,000191-1 4,700,000 - .70 3,150,000 1,025,000 .60 615,0001915 2,OSO,000 .05 2.976,000 659.000 1.25 813.0001816
- 2 041 000 .01 2.280,000 105.000 1.25 506,0001917 2.100,000 .50 - 1.712,000 1,900.000 - 2.00 2,192,0001918 2907 1100 1.78 3.514.000 0.50,000 2.00 1,918,000
3,418,000
1.85 I 6,323.000 721,000 2.50 1,803,0001920 2,030,000 1.40 3,902,000 146,000 2.50 1,365,0001921 s.088,000 ‘ 1.70 ‘ 5.290,000 700,000 1.75 1,225,0001922 4,080,000 75 3,060,000 930,000 1.00 930,0001923 3,100,000 .95 2,993,000 750,000 1.71 1,283,0001924 2,830.000 1.30 3,679,000 935,000 1.60 1,496,0001925 3,150,000 1.10 I 3,465,000 420,000 1.90 708,0001926 3,144.000 .70 2,411,000 1,104,000 1.10 1,214,0001927 2,550,000 1.10 2,816,0011 984,000 1.20 1,181.0001928 2,730,000 .65 1.775.000 720,000 1.20 864,0001929 2,251,000 1.11 2,199,000 959,000 1.45 1391,0001930 1 970,000 .86 839,000 749,000 1.46 1.086,0001931 2,000.000 .09 1,220,000 1,120,000 .50 560,0001932 2,300,000 .35 805,000 J 1,201,000 .42 504,0001933 1,000,000 .55 880,000 102,000 1.10 731,0001934
- - 5467000 .94 1,232,000 1,210,000 1.00 1,210,0001935 1,750,000 .09 1,206,000 3.293,009 I .50 1,724,00011136 750,000 .1)7 2,0011,9911 1.345,000 .00 I 1,076,0001937 5,477,00)1 .75 1,095,0011 1.773,000 I .90 500,000
CHERRIES AND PEARS—PRODUC’I’OON AND VALUE, 1910-1937
CHERRIES PEARSYear Produc- . Prudec
lion, Price Value tion, PrIce ValueTons per Ion hue. per lOu.
1910———— 121,000
I
1011 160,000 $1.50 $ 240,0001912 ‘ 193,000 .93 179,0001913 130,000 1.75 227,0001914 200,0001915
———— so,ooo ,
1016 I 99,000 - ——__
3957 320,000 2.10 072,0001918 194,000 1.50 291,0001919 4,620
. 30.1,000 2.20 669,000192)) 900 374,000 1.00 711,0001921 3,900 411,000 2.20 - 904,0001922 5,800 ‘ 477,000 , .70 358,0001923.
- 6,000 426,600 1.56 665,000192-1, 750 $115.00 86,000 064,000 5.40 1 790,0001923 3,900 125.00 488,000 515,000 1.15 592,0001026 7,600 125.00 910,000 602,000 .65 391.0001927 4,100 140.00 630,000 509,000 1.40 713,000192S, 1,650 140.00 231,000 234,000 1.05 246,0001929 5,120 120.00 614,000 000,600 1.90 - 000,0001930 3,070 90.00 321,000 178,060 1,30 - 235,0001931 2,000 70.00 173,000 398,000 .60 239,0001932 3,820 52.00 109,000 290,000 .40 116,0000933 1,800 34.00 103,000 191,000 I .05 524,000193-i 1,230 45.06 231,000 206,000 .00 124,0001935 4,010 50.00 201,000 240,000 .50 120,0001936 700 80.00 56,000 I 220,000 .85 157,0001937 3,460 80.00 277,000 153.000 .93 130,003
No prices published for 1014-15-16.

(II’ (‘Hl.Uli.\ II)
APPLES, FEDERAL CENSUS APR. 1, 1930, JAN. 1, 1935
(Number of Trees and Quantities Harvested)
1930 CENSUS 1935 CENSUS
TREES TREES1COUNTI Farms Bushels Farma us e
iteport- . Non- Harvested Report- . Non- Har
ing Bearing Bearing in 1029 ing Bearing Bearing yeatedAge, No. Age, No. Age, No. Age, No. in 1934
Dhaffee 111 10,057 751 5,841 111 7,287 221 6,982lear Creek 1 6 4 2 1 4 4
fagle 27 479 126 820 52 715 76 382jilpinrand 2 20
Sonniasn 2 320 409 4 322 19 2,200rarksun,akedoffat 44 269 311 521 19 206 217 43‘ark9itkin 21 286 2 281 30 400 53 3117th Blonre 29 620 61 570 40 573 75 128butt 13 90 40 130 10 52 10iunioiitfeller 1 28
°Total Northwest Blot... 283 12,165 1,293 8,152 300 9,781 676 10,035
3ouldrr 703 21,110 4,694 18,711 839 21,291 2,505 34,241IetIersnn 46 31,294 1,133 28,899 460 21,178 4,019 47,048Larimer 700 53,012 7,816 170,081 690 43,110 6,128 68,3197sgan 101 1,134 810 1,039 97 761 400 476Ilorgan 81 750 308 010 71 478 134 349Oedgivirk 32 163 149 239 28 137 31 23Weld 537 6,137 1,229 8,383 124 2,006 136 2,203
Total N. Central & N.!& Dtst. 3,022 111,678 20,175 267,992 2,321 89,425 13,613 133,369
kdama 230 0,463 2,447 18,910 126 3,997 2,736 11,996&rapahoe 196 4,397 771 0,006 189 3,972 1,193 4,0717heyenne 27 173 201 31 13 132 20 8Denver 10 211 300 310 46 330 56 141Douglas I 90 3,094 102 1,193 63 1,450 8 2,002Elbert 90 408 114 252 21 149 32 32El Paso 61 1,408 271 620 59 646 382 562Kiowa 11 132 70 10 11 61Kit Carson 08 327 236 57 23 122 58 24Lincoln 17 370 200 108 7 62 2 24Phillips 46 163 171 60 33 192 60 11Washington 71 489 701 763 51 308 44 39Yuo,a 371 1,199 374 1,503 53 173 77 35
‘Total E, Central Blot... 1,090 19.240 3,268 32,370 697 11,962 4,670 18,999
Archuleta 19 676 914 75 33 1,599 22 3,216Della 827 422,932 34,941 1,189,442 813 369,925 10,801 661,045Dolores 23 165 103 14 6 10 4Garfield 382 37,439 4,601 54,430 393 34,257 2,237 40,314Hinsdale ILa Plata 332 70,009 2,821 01,616 292 14,800 2,310 30,122Mesa
! 633 109,990 3,147 284,210 480 19,987 1,524 64,390Montezoma . 320 48.403 6,621 122,916 323 47,798 3,162 69,913Montroso 493 11,903 2,427 94,702 292 32,918 3,290 71,930Ouray 25 343 71 219 22 344 223San JuanSan Miguel 22 505 22 564 27 665 16 76
‘Total tV. Central & S.IT. Blot. 2,076 686.945 55.676 1,777,950 2,751 561,852 23,772 941,253
Alamose, 12 82 54 99 5 4 1Conejna 24 133 46 188 30 298 36 313Cssttlla 65 934 134 1,434 32 389 86 639MineralRio Grande 21 187 20 444 26 286 106 324Saguache 23 125 31 1,041 17 204 111 173
‘Total S. Central Blot. 145 1,863 293 3,196 106 1,181 341 1,510
Bara 102 400 474 82 105 769 225 63Bent , 515 1,906 200 754 23 240 47 42Crowley ‘ 106 8,129 2,505 6,706 51 1,631 176 20Custer 17 116 18 483 16 421 5 177Freinont 721 115,003 5,179 124,991 771 113,749 8,349 327,352Huerfano 156 4,415 136 10,672 215 4,724 380 7,976Los Anlinas 152 2,034 690 3,474 175 2,160 354 2,725Otero 190 9,530 2,903 1,358 162 5,757 1,094 671Prowers 115 3,561 428 1,054 56 461 176 20
Pueblo 33t 11.250 1,453 11,916 411 10,298 1,033 2,724
‘Total Sautheaot Blot...1 2,003 157,297 14,332 161,470 1,963 140,210 12,741 341,770
State Total 9,607 953,186 97,053 2,251,330 8,118 311,411 56,011 1,466,956
°Indirates approximate location of District for which Coonties are given above.
‘Errata--As published in “Agricultural Statistics 1935” the figures in these two columns were reversed.

\;iicu1ui’t;t.r, sc
Chaffee 1Clear Creek-Eagle 2CilpinGrandCunnisonJacksonTakeMnITat 0Parkl’itkiu Iltio ltl;Ie(’u_ 3butt —-
___
Surnrn it‘l’eller
t’l’olal Northwest Dist._ 12
Boulder 11.JelTersou 10Larimer 7logan 24Morgan 5Sedgwiek p 4Weld 20
eTotal N. Central & N.E. Dint. 89
Adams 10Arapahue 10Cheyenne 22Denver 1Douglas 1Elbert 7El Paso I 5Kiowa 18Kit Carson 60Lincoln 20Phillips I 15Washington 17Ynma 309
5Total E. Central Disl._: 299Archuleta 2Delta . 631Dolores 28Garfield 181HinsdaleLa Plata 80Mesa 726Muntezuma 209Mostrose 272DuraySan JuanSan Miguel 4
Total W, Central & S.IV. District 2,136
AlamnsaConejusCustillaMineralltio CrandeSaguarlie i
Total S. Central Dist._ 1Baca 180Bent I 79Cruwley 33CusterF’remont 44Huerfans 3Las Aninsas 36Dtero 62Prowers 96Pueblo 26
5ToWl Southeast Disl._ 558Slate Total I 3,095
2
13 12
20 3416 69
8 2111 41
52 132 6
65 186
2 86 35 296 32
3 149 325 48
16 623 608 318 32
15 54
85 402
4 18596 180,403
5 33179 5,015
38 139731 430,006204 9,287105 0,009
5 20
9 7
PEACHES, FEDERAL CENSUS APR. 1, 1930, JAN. 1, 1935(Number of Trees and Quantities Harvested)
1930 CENSUS 1935 CENSUS
COUNTY Farms Bushels FarmsTREES TREES’ i Bushels
Report- Non- Harvested Report- Non- Haring Bearing Bearing in 1929 ing Bearing Bearing vested
Age, No. Age, No Age, No. Age, No. in 1934
2 3 9
2 14
0 1
27
14 23134 80
30 710
2 2
197 112
12Si 95 6
17 1123 350 524 1
1 199
________
219 51
5 915,031 172,341
10 281,170 0,800
115 230114,785 1,007,468
3,477 11,934848 10,040
____
2 5
1 1 1
5 00 15
1 7
8 74 16
14 43 23194 20 00
9 4 4t34 114 88
14 0100 15
28 58 12
479 254 283
15 26 851 89 7
119 115 28
217 10 315 10 7
110 49 21177 205 30225 148 47
47 07 9242 19 18833 188 713
1,893 933 919
21
148,089 74,853 78,37345 179 39
5,212 2,342 2,206
208 879 247288,794 24t,401 862,110
3,893 10,240 5,2494,431 1,765 1,101
31 18 3
8 8 11
447,413 331,396 949,545
I 11 ___,__ 1
1,783 936 390075 88 514138 20 184
10 5176 103 118
14 1 688 190 47
364 159 401902 383 780
87 16 40
4,287 1,908 2,491
454,101 134,505 951,175
1.930 617,032
2
3
178 1,59811 42
4 31
114 6283 20
40 19840 04333 27729 59
452 3,496
2,518 621,129
135,443
7
18710
160
118407
0234
1,056
136,979
1,209,561
470
021
8137
10620
1,351
1,260,075
lndirstes approxinsate lseation of Bistriet for which Counties are given above.‘Errata—-As published in “Agricultural Statistics 1935” the figures in these two columns seers reversed.

W2ATZ OW COLORADO Dl
PEARS, FEDERAL CENSUS, APR. 1, 1930, JAN. 1, 1935
(Number of Trees and Quantities Harvested)
1930 CENSUS 1935 CENSUS
TREES TREES’ BushelsCOUNTY Farms Bushels Farms
Report- Non- Harvested Report- Non- Ear
ng Bearing Bearing in 1929 ing Bearing Bearing vestedAge. No. Age. No. Age, No. Age, No. in 1934
Chaffee 14 23 8 13 16 41 0 23Clear CreekEagle 3 5 6 5 8 22 34GilpinGrandGunnisonJacksonLakeMolfat 6 S 1,014 15 9 11 13larkPilkin 1 1 1 6 15 3 2Rio Blasco 2 2 2 3 4 3Routt 1 2 1SummitTeller
‘Total Narthwest Dist! 26 39 1,030 34 43 95 25 60
Boulder 23 25 15 30 35 19 11 4Jefferson 17 105 161 23 21 91 26 37Larimer 21 72 21 143 17 56 61 48Logan 22 60 51 13 16 26 16Morgan 6 60 10 6 8 19Sedgwick 8 14 14 22 6 16Weld 33 110 75 155 4 15 11
°Tslal N. Central & N.E. District 150 486 335 406 07 237 126 100
Adams 18 37 19 17 2 6 5Arapahoe 9 148 109 41 17 57 31 22Cheyenne 7 22 13 2 5 19 2Benver 7 57 3 15Bouglax 2 4 6 2 8 aElbert 9 38 30 3 5 26 1El Paso 9 15 19 21 1 1Eiowa 5 15 8 3 1 1Eit Carson 23 35 67 3 9 25 9 1Lincoln 7 12 7 1 2 2 9Phillips 10 20 24 4 14 16 56 7Washington 13 60 1 21 8 18 9Yuma 43 159 63 02 13 66 4 1
°Tatal E, Central Dist._ 155 565 360 220 86 291 93 66
Archuleta 12 26 62 58 18 92 4 341
Delta 313 9,375 2,688 18,327 261 9,355 649 19,149
Bolores 10 4 18 2 10 4Garfield 120 587 95 778 139 691 90 908HinadaleLa Plata 169 1,446 101 1,905 190 1,025 86 2,035
Mesa 588 139,114 41,977 501,167 405 101,064 35,172 176,006
Montezuma 137 998 453 1,620 161 1,336 153 1,932
Montrose 174 768 112 1,037 91 747 17 901Ouray 3 7 6 8 7 15San JuanSan Miguel 8 25 20 5 11 10
Total W. Central & S.W. Blat. 1,534 552,350 45,512 524,020 1,239 114,348 16,111 201,366
AlamosaConejoo 1 4 1Costilla 23 51 29 91 17 35 13 84MineralRio Grande 1 3Saguache 2 3 2 3 3 2 11 2
4Total S. Central Dist._[ 25 54 31 94 22 41 27 87
Baca 45 90 167 19 46 137 29Bent 29 84 15 22 3 2 6Crowley 11 30 4 3 2 5Custer 2 14 1 2 2li’remont 257 1,351 218 2,045 315 1,371 279 3,053
Huerfano 12 31 13 57 4 13 3Las Animas 12 41 11 12 21 42 20 9Otero 16 37 59 23 17 58 8 21
Prowers 29 74 58 17 23 61 8 11
Pueblo 31 54 22 28 23 74 1 8
‘Total Sautheast Diat._ 444 1,806 541 2,226 455 5,765 354 4,004
State Total 2,334 155,300 47,809 527,900 1,932 116,777 16,796 205,683
Slndicates approximate location of District for which Counties are given above.
5Errata—As published in “Agricultural Statistics 1935” the figures in these two columns were reversed.

12 \HttitUL’l’lJflAl. t$’l’A’I’li$TItS
(BERRIES, FEDERAL CENSUS APR. 1, 1930, JAN. 1, 1931(Number of Trees and Quantities Harvested)
1930 CENSUS 1939 CENSUS
COUNTY FarmsTTIEES DF TI1EES1 Bushels
Report- . Non- Harvested Report- Non- Hartog Bearing Bearing iii 1929 ing Bearing Bearing vested
Age, No. Age, No. Age, No. No. in 1934
ChatTee 43 123 46 51 41 145 27 120Clear Creek 1 1 1 2Eagle 17 84 92 25 90 122 158 80GilpinGrand 1 aGunnisou 1 6Jackson
..
TakeMiltat 21 38 103 19 23 49 59 0l’orkl’tlktn . . 1 17 0 17 47 11 32Rio llliueo 6 22 5 15 14 55 325 9(null 7 38 17 5 9 18 6 1
stiisinijt. .
1
1 _____ I
Total Narlhwest Diet._ 101 323 201 123 133 439 492 218lloildrr 350 3,166 1,012 2,217 484 4,793 4,950 2,897Jell i’rsoo 177 42,177 11,814 12,349 379 25.911 12,611 17,711l.arimrr 636 149,957 146,991 76,680 633 214,670 116,711 86,702Logan 193 1,112 795 305 134 1,272 331 184Morgan 104 1,169 217 308 104 096 127 052Sedgwiek 62 560 211 226 46 272 31 37Weld 470 3,497 5,450 - 2,900 92 4,336 5 451
‘total N. Central & N.E. Dial. 2,392 188,634 168,596 91,273 1,872 272,194 364.449 108,336
Adams 205 3,670 5,492 1,466 115 1,666 3,248 414Arapahoe - 151 1,840 909 922 159 1,105 1,587 311Cheyenne 02 224 262 55 26 122 27 31Denver 8 142 7 103 51 200 456 37Bouglas 23 63 87 13 20 74 6 26Elbert 01 940 136 595 28 108 82 74El Paso 61 1,495 207 240 74 1,055 382 280Elowa 16 541 8 77 12 72 9Hit Carson 149 891 643 253 50 500 234 82Lincoln 100 603 705 204 0 167 10 27Phillips 118 971 010 207 84 736 160 70Washington tIl 3,341 269 262 107 070 110 70Yonia 376 3,704 1,138 1.050 222 1,201 368 71
eTatal E. Central Dist. .td 18,377 8.117 6,278 846 8,335 6,299 1,582Areholeta 7 18 21 7 24 12 10Delta 501 10,416 8,729 55,014 467 15,173 4,147 16,047Dolores 25 14 222 7 9 31 78 4Garfield 246 3.193 000 3,866 263 3,794 336 2,697HtnsdaleLa Plate 119 1,446 353 1,202 132 079 228 1,216Mesa 358 3,763 5,338 3,438 060 29,860 3,518 15,306Montezoma 195 1.188 415 1,496 218 1,486 360 1,505Montrose 257 1,601 260 1,685 175 1,291 599 1,720Onray 4 12 2 11 21 soSan JoanSen Miguel 2 12 29 10 28 23
‘Ti,lal IV. Central & S.V. DLI. .1,716 21,682 16,130 26,727 1,672 52,807 9,289 38,705
Alaraesa 1 2CoOi’joo 9 17 3 5 2 7 11Cost lIla 16 15 2 21 15 22 25 22lIberalIlls ConnIe 1 1 — . 3 1 4S0000elie 6 14 0 2 1 3 14 1
5Tatal 5. Central Dist.. 29 79 10 28 21 53 41 34llaea
. 157 1,153 1,046 69 206 1,796 521 103Ilent 97 737 206 322 14 96 92 18Crowley 83 1,606 534 1,238 19 1,907 705 220Custer 4 29 16 4 12 3 4Frensont 582 36,618 28,951 47,260 656 46,459 19,221 26,288Hoerfano 21 191 22 114 59 263 76 62Las Aninsas 49 1,281 111 128 80 149 189 59Otero 126 3,609 3,829 2,617 121 8,270 4,705 768Prawers 85 720 378 191 41 114 114 21Pueblo 205 3,249 2,181 2,222 246 2,211 2,464 396
Tatal Saatheast Dist. 1,407 49,213 37,060 54,077 1,446 59,497 26,893 37,919State Total . .......r 7,141 286,111 230,218 182,606 5,992 393,102 207,463 186,775
Indieatea approximate location of District for which Counties are given above.1Errata—-Aa published in ‘Agricultural Statistics 1935’’ the figures in these two celsonis were reversed.

0002008’L09390810‘‘
‘OLl’k‘oors000’oi00011001’310L9’11(R40La4u4
039069‘99909199199309398306109909000lsuJa4SabA10401
009999Hasoaluopj
O910101910303990101‘S”:oo-ownza;uoj&j
091’001000019031031103‘021‘933091011:001, 039393Ov999301
090’9‘09020939‘0803‘093’00001909198Y6oiYo9I9j9g
069110801ILOIIRA008IIUE3f1V
——
-ojqanjjujOj
028009103Y1018099090600601807101309701oqanJ
11010907080010101‘01011‘01’siasoaj0001looo’o096‘01003310003090300630911’0991’0101’099’OJalo01930003030300101:9
10101luoulaaa0030909’00013“0933009’1090’00911’01’L’09123030’P001”0060011002030003’108910971003199010931088’1091”
011’999997099911’989023093‘971933083uasyusaIq4103pU8
iiauaqjfloJ,
093081001010910010999119010609108pja
01010909011909i°90091u02a09A3
99099001MI01:o20Iu0O’I0oo0o
,009.ZOWI1WI
810303030199
01019999UO9Jaaf
901919103010303010100999:01‘-9aOqadts
031111003‘09108109101101102030909SUIUjJ’y’
016199619961916190613061196109616361926113619361LL1’IflOD
(sa;uuojutosauzwojudausj)
1961-9361—laHlIvw11010L81IA11VflStlllI3V—SMO’]aIiIMIIUA3MOH01W811IIJOIVIMVD
0981ootl03810081000’3006110101a4u;
0801001‘09193999uasy00018usa
:———I———:olasos;uop
I
aalnzalu0900801009,090310009°w
—o7,91T9aU
1-89699091’099099993197891600606nasyILalluA800
0309’00‘_‘
9990911981olqanJ01I--039106:
189‘079001‘097—110066007970017091‘Ooo
91
191S9tUiUV‘-1
I
‘
0199iOT
013
06000308:691cajMOJQ
‘07
09‘9!,luaU
601’10360760299990999939099199119331‘060’3018’1,tasvusaI‘
‘Ii-qjaopuusaAuaqt0J,
L99:100001’070003063001’090070‘001’00600!‘P1010,9301’09
‘
0090301393091308008uu2ioj&3
9301’,
0!901‘031‘079001101308uuuo7071I0900h090!000058W1JW3
‘930393:0:oo000000uosaaja0900001000800108oor06191aapJno9j
‘0303:“010191---aoqedoa
090813933
003011019023017013033063063:9t9rnPV
10619061936199619991:3161,1169:
01616361836113699361,xa73n03
(satiunno2utanposj10010u!aa)
1961-9361—SrrlMDIJnoiUns3A11vuS311Dv—811111116103n0
96001V110’IODdOElvis

94 AGRICULTURAL STATISTICS
LETTUCE—ACRES 1IARVESTED—t926-1937(Principal Commercial Counties)
COUNTY 1926 1927 1928 1929 1939 1931 1932 1933 1934 1935 1936 1937
_— Adams 130 130, 150 255’ 245’ 2891 240 2201 200 1801 220 300Arapahoe & 5 55’ 201 20’ 1& 20 30 30; 951 60Boulder 5 101 18’ 101 1O 5 isl __l
., loJefferson 160 1701 1791 169 170 140 160 120 110 120 101 90Larimer I s so’ 10 10 ,,
IVeld 10 10 10: 401 40 40 40 30 30, 11, 20 19Totalflenver’ ‘ ‘ —
andNsrlls- I
em Area 315 235 363: 545, 485 451, 460 400 370 363 435 472
Custer 190 170 120: 75’ 100 140 410 290 270 240 1711 121F’remont 170 190 100 itS 160’ 180 180 110 110 110 100 110Huerfano ‘ 60 10 120 ‘ ___
Los Anirnos, — 15, s[ 100 190 150 50 40: 70, 50’ 30Pueblo ‘ 109 50: 10: 125, 20 15 20 20 20, 20’ 30 30
Total Pueblo& Arkansas Valley — - —
Area 510 395 2301 490. 320 Sb 760 430 440 440 2 5 32.
Alamosa—
2 85 601 70 t00 70 50 90 40 40Conejos J 2,200 2,0601 621’ 4551 380’ 270, 310; 240 150 160, 160 150Costilla 540 600 5961 611! 471’ 500, 510: 300 010 510 500: 370Rio Grande 1,500’ 1,500 1,140 2,000 1,870 1,690’ 1,850 1,300 1,420, 1,390 1,200 1,280Sagoaehe 100 100 113’ 100: io: is 20! 20 20’ 19, 15 20
Total San1Luis Valley!Area 4,140 4,110 2.613: 3,380. 2,795 2,545 2,830 1,880 1,950 1,925 1,715 1,860
Chaffee 000 700’ 815’ 4111 415 390 400, 260 123! 75Eagle 1,050 1,000 1,100 4101 270 260 260’ 160 190’ i00 00 110Garfield 270 190 120’ 75 osl 60 001 20 20’ 30 25, 20Gilpin ii 30 20 11 11’ iI 15’Grand 2,070’ 1,680 1,180 010, 760 710! i,oio’ 500, 550 580 175: 480Mesa 9 15 0 20 15 15’ 20 10’ 10 5 5 5Park 1001 50 28 20 20’ 10. 10 5 25Pitkin 140, 40 20 ___IRoutt 2,200’ 1,220 2,200 1,000 2,140 1,540’ 2,290 1,7201 1,650 1,180 7651 1,050Summit , 130 120 I
,‘‘
Teller 200 2(10 120 71 115 110 2001 150 120’ 160 175: 150
Total Moon-’ ‘ I‘ I
tam and ‘
Western; ‘ ,
Slope Area 8,040 8,002 5,198 3.625 1,810 3,110, 1.255 2,820 2,720 2,260 1,110: 1,930
Slate TotaUi 01.240 13,210 8,900, 8400 7,410 6,950’ 8410 5,910 5,480 5400 3,900’ 4,700
OIlY ONIONS—ACRES IIARVESTED—1926-1917(Principal Commercial Counties)
COUNTY 1926 1927 1928 1929 1930 1931 1932 1933 1934 1935 1536 1937
Adams 156 140: 110 105 100 150 120 120 125 180 230 390Arapahoe ,‘ 34’ 15 43. 00 30 20 20 20 25 25 25 65Boulder ‘ 11’ 15 27 20 1 5 5 5 S 10Jefferson : 60 55 81 00 00 10 00 55 40 40 60, 80Larimer ‘ 10 30 22 10 10 1 10 10 10 10 5’ 10Locran 0 5 11 10 5 5 1 1 0 5 10, 10Sedgwiek ‘ 4 2 1 15 1 5Weld , 450 420 111, 420 420 17(1170325 100 100 475 590
Tolal Denver ‘ ‘ ‘ ‘
and Nsrlh- , ‘‘
em Area 731 702 615 810 715 000 505 545 610 665 810 1,155
Bent -- ‘ 11 40 53, 200 210 200 3”O 100 143 80 80 10Ceoseley — 5 5’ 21720 181 213 230 ‘101 30 30 00 50l”reoroi,t — , 20 17 27 40 11 15 25 15 15 10 10 30Las A,,im:,s 15 10 t1 70 10 ‘Otero 195 250 683, 2,770 2,010 1,115 2,085, 1,031’ 1,750 1,330 ‘°1 1,243O’eoo’ers 2 20 12 10
,,‘ 101 21 10Pueblo 17 70 1201 217 201 501 750 400 ‘100, 140 275 240
Tolal Puehls ; I , :
& Arkan- , 1sasValley , ‘
‘ r- — , -
Area_;
1.023 3.a8a; 2/lb 2,930 3400 2/laO tZP’ J10, M_°Delta 003 1,030, 070 870 703 230, 550 470’ 500, 020 715 050Garfield I 7 0 5 I
1 ifLa Plato 0’ 10 13 ! I ———‘
Mesa I 113’ 80, 43 15 45 60, 250 80 110 120 121 521Monteouma ; 2 2: ‘ 5 l 10 1Montroso ‘ 1,7201 1,030 1,201 1,055 1,200, 6001 800’ 0001 850, 800, 750 8Sf
Tolal West-I ! “, — — —em 7! ,
, r , . I ,Are’i 2 17; 1 048 2 104’ 2, (90 2 130 915, 1 670, 13o0 1 480 1 540 1 590 1 631
Sl’ste Total 3700’ Th’öi TOO’S TOO’S TISS’ TTol Töi’ Tib 4401

S’rATE OF COLORADO
COUNTY
Adams 10, 70
Arapahoc 10 7
Boulder 10 20
Jefferson 100’ 180
Larimer 10 20
Logan 10’ 10
Morgan 10111
Weld 30 240,
Total Denverand Northern Area__: 250, 162’
Crowley 75 80
Fremont 20 15
Otero
Pueblo 20 10
Total Pueblo& Arkansas ValleyArea 115 185:
Delta 5, 10
Garfield 3
Mesa 30
Montezuma - 4.
Montrose 3
Total ‘.Vest- Iem SlopeArea 9
State TotaL 41.01
COUNTY
TOMATOES—ACRES HARVESTED FOR MANUF’ACTURE—1926-1937(Principal Producing Counties)
700
40
20
210
10
50
Adams 260 190 110 3.10 340 290 3591 160 460 270. 3711 400
Boulder 10 40 80, 125 100 19012001 110’ 100 2991 180 150
Larimer 50; 501 30
Weld 501 300, 170 320 420 370 3691 180 16cr 420 424 900
Crosvley___: ___
210, 198 350
Otero 1,090 9701 765 7801 760 920 1,040 710’ 1,220 l,480 1,965 2,130
Mesa 460; 4101 500 451 540 680 2701 170 510 560 462 550
Totalsevencounties —- 2,270: l,970 1.625 2,020 2,220 2,500 22301 1,360 2,730 3,180 3,600 4,080
State Total’ L350’ 2,000 1.6001 2,030 2,2301
TOMATOES—ACRES HARVESTED FOR MARRET—1926-1937
(Principal Commercial Counties)
1926 1927 1928 1929 1530 1931 1932 1933 1934 1035 1936 1937
75 25. 63 60 90 901 70 100’ 1001 110
10 20
10 40
400
30
25
50
530
5,175
250
100
100
250
330
2,400

AGRICULTIJIIAL STATISTICS
GREEN PEAS—ACRES HARVESTED FOR MARKET—i 926-1937
(Principal Commercial Counties)
COUNTY 1926 1927 1928 1929 1930 1931 1932 1933 1934 1935 1936 1937
Adams 20 10] 10 301 30 30 00] 70 70 80 100 180
Arapahoe __1 20, 201 201 lOi 5] 5 10 5 10 ‘l 151 10
Jefferson 160’ 320, 350 590’ 550 510; 540 470 420 420 365 300
Larimer ____I 25, 30
Weld 60 10. 751 1010 ‘
Total Denver Iand North- Iem AreaH 4601 360 450’ 640 395 555 6301 563 5201 535 530 570
Chaffee___’ 3001 400 500 360 520’ 320I 270’ 150 150 160 1251 150
Custer 220’ 1501 200 445 620 8001 2,210 1,530 1,450 1,480 1,100 1,900
Fremont 2401 220’ 240 80 140’ 160 110 120’ 1201 120] 1201 200
Huerfano _‘15’ 10 10 20 15’ 10’ 10’ 10 15’ 131 20
Las Animas 10 10 10 10’ 10 700 1,010 520 2)30 30 25 30
Otero 40 10 50 3& 15 20 40 50
Pueblo 35 40 100 70 60 SO 110 100 80 70 55’ 100
TotalPueblo i . I
& Arkan- 1sas Valley —. , .1 —
Area 860 860 1,H0 1,010 1,180 L060 40 2,470 24.0 1870; imo 2o
Alamosa 20’ 280 80 150 70 00 l,j 140 1901 izol 140 20’
Conejos ISO 1,020 1,580 2,570 iSIS 1,830 2,°70 26OOi 2,900 3,000 2,300 2,702
Costilla 100 300 400 1,100 1,081’ 2,050 1,070l 2,200, 2,359’ 2,520 3,00’)
Rio Grande___ 250 010 550 iD))., 910, 815 1,360 1,000 700 880 1,500 1,50’)
Saguache 10 ._‘ - _l ] - - 10 10 10 20’ 25 30
Total San’ - —
Luis ValleyArea 560 21101 2,610 5,3:15 35, 6,470 6,37O 6,785 7,730
Eagle 160’ 180 40 40 40 l5O 180 150 200 90 110
Routt 101 5401 300 20 20 10 10 I 200 2001 200, 230
Delta 10 751 10 5 5 051 51 sI o 10
Garfield 5 20 sd _ 10 5 5 5 5 10 10 30
Mesa 60 301 10 10 161 ___ 5 51 5, 5
Montrose 5 10, 10 ___ —H 101 5 s 1011o
Total North- Iwest andWestern,Slope Area 190 435 .f 180 195 3701 520 320 370
State TotaL 1.940; 4.00014.900{ 7,i00 5,S20 6,500 11,050 9,250 8,97O 9,300, -i;1;i i-i-:-i-1
GREEN PEAS—ACRES HARVESTED FOR MANUFACTIJRE—1826-1937
(Principal Producing Counties)
COUNTY
Adams 130 170, 2101 480 380’ 440i 220, 140
Boulder 7701 4601 410. 970; 1,190. 1,250 1,050! 859] 1,9601 1,570, 1,360 1,315
Larimer 360’ 590 650 1,210: 1,250’ 1,080, 1,050 920’ 1,085 1,530 1,100 1,350
Morgan 25,___,
10, 20,———
30 20
Weld , 1,280 880 1,670 720’ 880 450 420 460 400’ 400’ 725
Total Denver Iand Northern Area 2,365 1,900 3,000 3,400 3,700 3,500 2,7701 2,330 3,480 3,530 3,160 3,440
State TotaL 2,570 1,900 3,000’ 3,400 3,700 3,500 2,770 2,330 3,770 3,820 3,560 3,690

STATE OF COLORADO 97
CABBAGE (EARLY DOMES’TIC)—ACRES HARVESTED FOR MARKET AND KRAUT—1926-1937(Principal Commercial Counties)
COUNTY 1926 1927 1928 1929 1930 1931 1932 1933 1934 1935 1936 I 1937
Adams 6081 485 497 530’ 565 510 489 270 220 320 370 460Arapahoe 25 35 8 123’ 110. 105 90 S0 20 75 60 90Boulder 56 65 110 oo 70’ 75 80 80 60 100 75 85Jefferson 90 40 72 35 50 55!
801 60 50 75 45 55Larimer 33 5 10 10 15 15 20j 15 10 10 5 10Logan 2 3 2 1 5 5 10 10 5 10 10 10Morgan 8 4 3 5, 5 5 5 5 10 15 10 5Weld 576 370 456 380 570 495 620 54& 480 710 750 800
Totalflenver—
and Northern Area.. 1,398 987 1,158 1,144 1,380 1,265, 1,365 1,060 925 1,315 1.325 1,515
Alamosa 20 15 15 25 25’ 20Conejos s 55 70, 7 70Costilla 2’ 5 10, 10 25 25: 200 225 235, 300El Paso I 11 32 35 30 15 10 5 5 5, 10Fremont 36 35, 40 19 85 100 123’ 80 001 105’ 65’ 75Las Animas 5 4 21 35 7 3 3 ___I
Otero 5 2’ 21 2 10 10 10, 5Pueblo 20! 20, 35 93 150 135, 155 160: 100 1751 150 90
Total SanLuisValleyand Pueblo
. - - -
Area .. 68 61, 95, 189 2691 ... . .
Delta ii ———I 4 ‘ 3’ 3 s 5: 5 5 10Mesa 17 10! 7 12 101 15 10 10 10’ 15 10 5Montezuma 4 3 2 2 2 2Montrose 2 8 . 10 101 10 I 5 10
Total West- Iem SlopeArea 23 22j 7, 28 27 20 , 2O 20 25
State Total.. 1,530 1,100 1,300; L4001 1701) L600 L760 lAb o,420: L970, L930 2,120
CABBAGE (LATE DANISH)—ACRES HARVESTED FOR MARKET AND KRAUT—1926-1937(Principal Commercial Counties)
COUNTY 1926 1927 1928 1929 1930 1931 1932 1933 1914 1915 1936 1937
Adams 245 265! 200 270’ 300 315 310’ 300 400’ 3651 3251 375Arapahoe 14 10 20 42’ 50 60! 35 175’ 551 40, 50Boulder 95! 1701 90 100 85 90 80 130, 90 90. 60Jefferson 80 110 130’ 140: 525 90, 1001 90 130’ 135 110. 110Larimer 53 35! 26 31 25! 35 50 50 50, 201 20Logan 15 12 18 14 15 15: 20 20: 20 30 20Morgan 16 6 16 15 10 51 10 10] 20 25 20! 10Weld 1,240 750 776 870, 1,010 940 1,160, 11801 1,150, 1,1801 1,225 1,350
Total Denver — — .,
—
andNorth- i 1‘ IArea.. 1,670 1,283 1,364: 1.476, 1,645 1,535, 1,770, 1,745 2,175, 1,910, 1,860’ 1,995
Alamo a .. , 5’ 10 10’ 15 20 20Conejos 1 ___! 5, 5 15 10’ s! 40 75 40Costilla 7 _ 2 15 35 65’ 85 7O 110 270 500 550El Paso 23 35, 0 40, 35!
———:
, 50 20Fremont 13 4O 62! 106 105, 120! 105 90, 25 95 50 60Las Animas ___ 6 6!
_
15 1! 2! 2’ __j IOtero 7 ] 6. 15 3] 30] 15! 15! ! 50Pueblo 75 140
-
320 225 200
Total San 1 i _‘i j ILuis Valleyand Pueblo l IArea 141 155 218 331 451 82 562 50 420, 040, 83o, 940
Delta 4 2 2 5’ 2! 5 5 10 5 5Mesa 7 20 9 18! 15! 151 15! 10 5 5] s’ sMontezuma _ I . 3, 3 3 3 ,
Montroso 17 7 __ 10 11) 5’ Ip 5 10 15! 10! 20
Total West-’‘ I I ,
ernSlopel‘ I I I
Area 29 29 9 3 30 20 20 30 2o 30
State TotaL, 1,870! 1.500 l.600 1.900! 2,200, 2,200’ 2,790, 2,301) 2,630 2,810 2,770 3,100

98 AGRICULTURAL STATISTICS
WATERMELONS—ACRES HARVESTED—1926-1937(Counties Where Grown)
COUNTY 1926 1027 1928 1929 1930 1931 1932 1933 1934 1935 1936 1937
Adams 60 50 10] 20 20 20 29] 30, 60 70 55 65Arapahoe ____I 5! 5Boulder 15 15 15] 10 10 10 5
_. 25 5 5 10Jefferson 10 5] 5 10 19 10 5’ 5] 10 15 10 10Larimer 10 40 & 5, 5 5’ 5, 10Logan 20 15] io] 20’ 15 1s 15] 10 15 20 15 10Morgan 20 15’ 5 5 5’ ‘Ui 10 10 15, 10 10Weld 110 110 50’ 110] 125 140 lS0 160 170 250 175 180
Total DenverandNorth- Ies-n Area - 250 255 105 170] 185 205 225] 300 385 280; 309
Kiowa 30 20 15 10 10 25 5 ———FKit Carson_ 20 15 5 51 5 5 5 5Lincoln 20 15; _,‘
Phillips 10 10_ 5’ 5; 5 5, 10 10
Washington —- 20 20 5, 51 5 5 10 10 5
— —n — —
— — — —‘ --- —n — —
Central ] -Area 140 95 25 4 30 20 10 40 7 40 3! 2.,
l3aca 10 is’ o] is’ ijj $ ___.
Bent 25 50’ 15’ 50: ss] 65 70 50 50 60 50Crowley I 180 510 100 55, (101 60 35 40 55 50 50 60Fremont 10 10, 10 15 15 15 25 10Otero 250 160’ 120 440, 455 505 500 605, 660 720 510 5.10Prowers is] so — 15 10 10 1SF 10 20 10 10Pueblo 260. 200, 110 130 115 111 150 150 170 220 150 iSO
Total Pueblo& Arkansas ValleyAreas ,. 710 680 400 720 770 785 880 S65 940 1,055 805 860
Delta 50 45 20 30’ 30 50 25 20 10 15 15 20Garfield 5 10 10 10 10 10 5 5 5 20Mesa . 40 65 25 45 50 50 00 50 45 50 30 40Montezuma
.
2O 15. 10 25 20 20 20 20 20 00 20] 20
Total West- I Ies-n Slope IArea 95 135’ 110 110 110 95 90 80 100 70 100
State TotalJ l225I 1J65j595
1,035] 1,055 1.115 1.220 1,320’ L195’ 1,619] s,19o] ssso
CELERY—ACRES HARVESTED—1926-1937(Principal Commercial Counties)
COUNTY 1926 1927 1928 1929 1930 1931 1932 1933 1934 1935 1936 1927
Adams . 260 260 213 395 120 110 250. 300 120 .110 410 400Arapahoe 90 00 11 40 30’ so so: 10. 10 15 15 20Boulder 5 5 _ 5. 5 5 5 5] 10 10 10 —
Jefferson 280 290 295 310 510 295 260 290, 310 500 183 400Larimer.’ 15 10 4 10 5 5 5 9’ 5 5 5 5Weld 50 10 16 5 5 5 10. 10, 5 10 20 10
Total Denver — _] , —
Area 660 665 555] 775 675 650 540, 610, 670; 790 813 831
Fremont 35 50. 50 90’ 90 95’ 110 90 iso] 110 110 120Otero is] to’ 7 10 10 10 15 10 20’ 20 20 10Pueblo 93] i40 219 195 130 150 260 220 225’ 245’ 275 200
Total Pueblo’ 1and Canon ,
City Areas1 200 276’ 275 220 253 385, 325; 345 375’ 405: 330
Delta & _I 4 5] 5 5 5’ 5 5 5, 10] 5Garfield , 5’ 501 5 15] 5
..._,, ‘
‘
Mesa ss: 20: 4’ 15. 15 10, 10’ 10 10 10, 15’ 10Montrose 3j 10 4, 5 5, 5 5 ___] 10 15 5
TotalWest- , Ies-n Slope ‘ F ‘ ‘
Area 48 40 21 40 30, 20 20 15] 15] 25, 40 25
State Total — 940, 940, 900 1,100’ 950’ 950] 950 950] 1,020’ 1,180, 1,300, 1,200

STATE OF COLORADO
CAULIFLOWER—ACRES HARVESTED—1926-1 937(Principal Commercial Counties)
COUNTY 1026 1027 I 1028 1029 1030 1031 1932 1933 1934 1938 1936 1937
Adams 140 140 113220 200 210 220 590 160 200 210 210Arapahoe 151 2 s 5’ 10 15 15Boulder 10 10 13 10 5’ 5 5 5Jefferson 70 105 73 70 85 85 110 70 80 80 65 60Larimer 5 5, 6 5’‘Logan 2’ ___I
Morgan ___
Weld I’, 10 10, o 10
Total Denverand Northern Area — 252 265 216, 310 285 295 3301 288! 260, 305 305 295
Chaffee 43 2s 9 2& 20 2& 20 15 10 10 5Custer 80: 40 02’ 160 95 135 200 120 125 125 125, 25Fremont 80! 80 94 130 175 185’ 240 140 340 120 120 100Huerfano 10’. 75’ 25 5W 320 10 20 15 15 10Las Anjm
———. 40 25 25 10Otero 4, 60 20 101 ___l 5 10 PPueblo 00’ 400 628 900’ 830 1,080 1,350 675 220 240 280 200TotalPueblo
—andCanon ICity Areas 413 545 797 1,345 1,165 l,78O 1.970 995 52& 535 555 345
Alamosa 00 80 115 100 145! 160, 85 65°I
‘ sConejos 135: 40 57 2SF 195 210 33W 200 200 160, 160: 100Costilla 2501 210 525: 1,145 1,040 1430: 1,690 1,500 1,520 1,6001 1,085: 1,850Rio Grande 4W 12 54 ‘ 10 1o 2W 20 20 40,Total San -I —
Luis ValleyArea 420 322 676 1,540 1,345 9,825! 2,100, 1,855’ 1,805 1,900! 2,300 2,050
State TaL L10O L160 LTh0! 2oQ L800’ L900) o T0, , o
SNAP BEANS—ACRES HARVESTED FOR CANNING AND MARKET—1926-l937
__________________________
(Principal Commercial Counties)
COUNTY 1926 1927 1928 1929 1930 1931 1912 1939 1934 1935 1936 1937
Adams 220 24Sf 400’ 520 515 360 445! 460 4801 545 550 700Arapahoc 60. 60 90 20 20 25: 20: 20 20: 20 10 10Boulder : 70 75’ 80 320 115 223 205 180 50 160 1001 100Jefferson 00 9W 100 75 120 150 14W 150 80 150 100 00Larimcr 80 90 130 60 290 40 20 20 20 15 65 100Logan 10 10 10 __ 5 5 ——-I 70Morgan 20, 20 30 20 20 20: 20 20 30’ 10Weld 250 280, 565 1,285 1,280 830’ 735 010 69G 735 1,200 1,720
TotalDenver :and North- : IArea - 790’ S65i 1,405 2,080 2,365 1,6551 1,508 1,460 1,360, 1,635! 2,075 2,800
Crowley 30 30 40 40 10 40 10 10 50 45’ 15Fremont 00 50 100 333 380 390. 350 540 190 350 22o 300Huerfano 5 1, 5 10 10 10 25 25 90Las Animas — 30 30’ 220 10 10 10 ‘ 10 10 10 10Otero 135 140 400 565 320 225: 150 120 219 160; 175 190Pueblo 130 90 190 330 440 39O 439; 445. 415 5601 5001 600
Total Pueb!o : . I
& Arkan- , , , ,
gas Va!lev :,
Areas .f 390 145 950 1,285 1,200 1,065’ 955! 925’ 880; 1,150 950 1,120
Alamosa- — —
— — — 28Conejos,
, 40 120 O 25Costilla‘ 1 20 ___ 20, 30Rio Grande ! __: 20 50 7o 30
Total San’Luis Valley
, ,
,Area ,, 80: 170 170’ 105
Delta 40’ 45. 75 40 95 OW 15 15: 5W 25 5’Mesa , 120 130; 230 15, 15 20 5 10, 119: 65 151 5Slontrose 50’ 55 95 365 160 175, 25!151 40’ 10 30
Total West-‘em Slope,
Area 190, 210 400 4201 270’ 255, 45 40 185 130 30 35State Total
—1,420 1,4601 2,800 3,800! 3,850 2,9901 2,600! 2,440, 2,470 3,000 3,320 4,100

100 AGRICULTURAL STATISTICS
C’ — -
Cl
C’ CC C’ to CC CO CC 04 0 CC
to C- C’t C’ C b C’ Cl
C’ C) 0 tO 0 C’0 CC C’ to C’ itt
to — CC CC CC C’) to C CO CO C’ CC) CC C’ to to C’ C’ to C’)CD CC CC C’ C’ — — C’ OC — to to to — 00 0 CC CD C’CO C’ CC 0) CC CC — C) C’ C’ CO to it)°‘ t-_i it_i’ 0 Ci Ci
CD
! C’
COC’C’C’C’O toot
to C’tC’0C C’ C’C’C’0Cc.-t00400 0C’C’C)C’to
C’CC C4 0C’CCtotoC’ C’
C’ C’ C’) C’ it) I— Ci C’ C’ CC CO C’ CO C’ CO it) Ci it) CC C’CO C’ C-. CC CC C’ C’ to to iC_i CC 0 C’ C’ ‘‘ to C’ C’ to
CCC’C’’) C’ )CCto0000itC’0_iC’CO C’)OC’C’C’CC
C’- C’ C’ CO CC C) C’ C’) C’ C’— C’ C’ it) C’ C’ CC to C C’ to
C’ CC 0 C’ .4 Cl C CC CO C .-C C’ C’ CO C’ C’ itt it) Ci C’
C) C’to COC’C’C’ C’it_i —
a> C) C’ ‘Cl C’ lii C Ci C’ Ci C) = Ct_i C CC CC Ci CC I. C’ CO
C’ Ci — — it) C’ C’ C’ i CC —
a> C’ C’ — Ct to CCC tiC C’ tO .1 C’ C CC C’) CC CC IC IC CC C’
t CO CC C’ C’ CO C) — C CO C’ — C’ 0 C’ CC’) CC 0 CO 0 CCC
eq C’ C C’ C’ C’) C’toto-C’t-i CC 0 CC (40 C’ C’ C’C) C’> C C’ C’) to C’ C’ (CD C’ C’ C’ C’) C’
to C’ C’ C’ C’ C C’ — CO CCC C’ C C’ 0 .0 C’ CO C-I C C’ ,.(4
ci C’ C— it) C’ tiC C’ .0 it) CC C’ C’ C’ C C’ C’ CC) to — CIC) CO)’flC’ .C’C’C’C’C’CSliCCC’ —ii C’ — C’ C’ C’ Cl C’ C’ —
z
ii
cI’
0°
z
0
C’C’C’ CCC’C’C0C’ CCC’)
Cit C’ IC C’ C C’ C’) C’ CC C — ICC C ii) C’ I C’ I C’
041-C CCC’) .-ot C-i
it) CO C’ C’ C’ C’ C’) I-i C-i CO CC 0 I CO I I C)’ I
Cl
CiiC)
CCC’,
C
C
0
C’, CC Ct) C’ CC C’ C’ 10 C’ C-C tO I CC I C’ I CO I
Ci
I - ,. IC C
lc
OtiStD.9o.c 0C’CC’ - i_i ?“o .0 tt
OCC CC 01)0 iC’ C) 0 -— iii) CCC Ci

STATE OF COLORADO 101
FRUIT AND VEOETABLES—INSPECTED FOR ShIPMENT BY MOTOR TRUCKSçCompiled from Reports of the Fruit and Vegetable Inspection Service)
APPLES PEACHES
DISTRICT )Thouoand Poondo) (Thousand Poonds)
1114-15 1935-30 1930-17 1937-38 1934-35 1935-10 1910-17 1917-IS
Western Colorado R2,151 11539 11712 9710 9,002 14,102 14,305 20,801Denver I *1,017 1,173 0,055 8,875 4 3 448Platte Valley 509 770 209 797 9 52 10 74Arkansas Valley 20 133 413 -13 290 214 220 17San Lola Valley 5599 847 2,374 5,024 20 100 21
Total *14,193 16,062 23,363 20,455 9,361 14,452 14,734 21,401
PEARS MIXED FRUIT
Western Colorado *3,357 3,790 4,758 2,012 1,300 500Denver 98 17 193Platte Valley 7 2 33Arkansas Valley 13 17 9 13San Lois Valley 22 64 38 95 3
Total *3,264 3,835 4,841 2,757 1,125 772
CANTALOUPES BONEY DEWS and MISCELLANEOUS
Western Colorado 31 35 32 12 1 3 5 5Denver 36 9 93 211 31 30 235Platte Valley 103 300 551 34 198 349Arkansas Valley 1,909 4,545 3,875 2,756 06 706 1,035 571San Luis Valley 2 4 3
Total 2,139 4,569 4,282 3,530 101 770 1,040 1,163
WATERMELONS LETTUCE
Western Colorado 11 11 8 2 20 02 94Denver , 77 3 190 109 010 802 975 1,005Platte Valley 37 206 200 413 13 3 10Arkansas Valley 336 404 385 314 235 18 40San Lois Valley 19 381 113 348 564
Total 461 626 703 917 1,570 1,046 1.456 2,543
PEAS BEANS
Western Colorado 9 .____ 3Denver i 30 113 13 ii 39Platte Valley 6Arkansas Valley 7 9 7 , 2 4San Lois Valley 35 10 55 1
Ttal 53 122 52 371 9 3 51
CABBAGE CAULIFLOWER
Western Colorado 17 15 5 3 1Denver 174 1,188 509 1,673 24 170 21Platte Valley 3,838 3,525 2,708 4,720Arkansas Valley 967 3,333 183 732 169 153 29San Luis Valley 3,004 5,180 3,349 0,552 178 60 196 128
Total 5060 1D046 7,154 T3j 371 392 225 149
TOMATOES MIXED VEGETABLES
Western Colorado 74 11 58 71 500 633 335Denver 1 1 4 650 658Platte Valley 81 4,908 4,840Arkansas Valley 8 1 733 249 216San Lois Valley 8 5,258 5,850 5,454
Total 63 12 26 75 1 6,652 12,209 11,503
POTATOES ONIONS
Western Colorado 21,146 3,408 5,010 10,720 I 253 209 310 730Denver 315 252 3,882 2,925 12 70 28 729Platte Valley 46,605 50,493 05,064 70,379 476 474 1,222 1,400Arkansas Valley 1,708 3,030 1,914 1,363 1,006 16,057 12,250 16,730San Luis Valley 36,000 52,085 60,4c7 71,109 36 15 129
Total 100,720 161,948 134,923 156,556 11,843 16,810 13,033 19,718
epartly estimated.

102 AGRICULTURAL STATISTICS
POTATOES—MONTHLY CAELOT SHIPMENTS, BY CROP YEARS
SEASON July Aug. Sept. Oct. Nov. Dec. Jan. Feb. Mar. Apr. May June Total
1923-24 205 1,099 1,772 1,965 1,140 1,002 2,071 1,638. 1,470 739’ 664, 105 13,8701924-25 207 598 2,080 1,968 1,493 913 1,883 3,354: 835. 566 448 48’ 12,4131926-26 527 698 2,695 3,039 1,122 901 1,527 1,293 1.750 915 831: 207] 15,4151926-27 825 1,103 3,071 2,587 1,083’ 982 1,449, 1,358] 1,396 791’ 82 1] 14,1801927-28 63 788 2,748 3,207 2,173, 1,476 2,1401 1,780 1,2511 847 7111 13F 17.1261928-29 83 542 1,855 2,144 1,481] 1,281 2,160’ 1,679 1,223 747 286 33’ 13,714192940 126 1,022 2,578 2,612: 1,403] 1,508 2,065 1,416: 1,626 888 118 4’ 15,3661930—31 252 764 2,891 3,000 1,3411 1,450, 2,108 1,68& 2,175 1,3921 557] I3 18,0811981—82 189 539 075 1,012 515’ 040’ 001: 795 1,000 oso] 301: 20’ 7,1201982—83 180 421 994 1,184 740, 640 3,043] 839 ooi: 279] 128: 0 7,2001913-34 44 019 1,176 1,721 1,324 1,218 1,748: 1,024 1,817: 1,148: 479: 01’ 12,4201914-35 I 405 111J 315 270 410] 192 302, 110 10 ‘ 1,2311935-36 : 71 312 1,040 2,001, 3,088 1,210 1,545 2,005 1,100 930 229 13 12,5073916-37 253 900 2,020 3,010’ 1,173 1,903 1,013 1,410 1,191 1,007’ 132 0 10.0161937_lot 195 722 1,025 1,103’ 993 019 1.009 803 730 544 131 3 9,997
5PreliminaryGRAIN STOCKS ON FARMS
WHEAT
Oct. 1 I Jan. 1 April 1 July 1
CROP TEAR , —‘
Eu. qci Pu. c/c Eu. 9/2 Eu.
(000) (000) (000) , (000)°
1926-27 6,267 301,700 ‘ 18 1,871 8 6271927-28 7,805 31 4,400 ] 20 1,315 5 440 28928-29 7,279 10 7,071 84 2,288 11 1,248 01929-10 : 7,512 42 4,842 27 2,809 16 717 ‘ 41030-31 0,087 29 5,764 20 2,767 12 1,381 ‘ 619Sl-l2__...__—________ 9,202 54 4,942 20 2,897 17 1,363 81912-15 1 1,649 49 3,202 43 1,117 15 745 101911-14 I 1,048 48 2,667 42 . 1,334 21 ‘ 702 121934-15 3,034 49 1.796 29 1,176 , 19 ‘ 619 102915-16 2,874 44 1,960 30 1,370 28 555 81930—37 4,490 42 2,566 . 24 1,176 11 428 41937-38 4,850 31 4,092 27 2,122 14 1,301 0
OATS
-
Oct.1 Jan.1 Apr.1 , Julyl
CROP TEAR: Eu. Eu. çes Eu. 912 Bu. 912
(000) (000) e (000)e
, (000) e
1926-27..,.._,....________..._____’ 3,549 70 1,245 64 2,021 49 659 131927_28___________________: 4,385 80 3,561 65 2,085 38 822 101928-29 I 4,831 88 8,898 71 2,is 40 878 161929-10......._......____________ I 4,592 78 4,121 70 2,471 42 883 11191041 4,142 78 3,717 70 2,230 42 956 181911-32 1,050 50 2,293 00 1,529 40 497 13
1932-31 4,047 86 3,230 00 2,118 45 1,031 22
1913-14 : 1,223 79 2,652 65 1,877 40 094 17
1914-35 1,983 77 1,545 00 1,133 44 203 111935-16 1,718 03 5,002 67 2,061 40 941 211916-37 1,830 90 2,937 09 1,175 37 595 141937-38 3,591 81 3,059 09 1,590 30 621 14
CORN’
Jan. 1 , Apr. 1 July 1 Oct. 1
CROP TEAR: Eu. e. Eu. Eu. c,e , Ru. 0/
, (000),
‘ (000) (000)°
(000)
1926 : —— 5,395 33 2,943 18 1,308 8.01927 4,157 40 2,802 31 1,205 14 452 5.01928 11,272 60 4,606 25 1,870 10 751 4.01929 12,742 66 5,400 28 1,031 19 1,062 5.519I0_....__________________ 13,251 70 5,111 27 1,893 10 508 1.01931 19,554 72 10,341 38 4,899 18 1,905 7.01952 8,930 63 3,909 28 1,009 11 092 7.01931 8,877 70 3,078 29 1,122 12 444 3.11934 11,941 08 5,970 34 2,107 12 1,229 7.0
2955 , 630 40 317 20 175 31 79 5.01936 ‘ 5,525 07 2,919 33 973 11 531 0.01937 H 5,772 02 2.007 : 20 1,021 11 559 0.01938 , 3,203 57 1,302 , 24 401 I 8 ‘ 200 5.0
‘Stocks as a percentage of crop produced in current year (year of harveeC.‘Stocks as a percentage of crop produced in first preceding year (year of harvest).8Percentsg given in the table below are stocks as a percentage of the amount of corn harvested
“for grain.”

STATE OF COLORADO
CERTIFIED SEED POTATOES, 1937 (Varieties, by Ceunties)
R. McClure and Bliss Irish Brcsrn Beauty Other
COUNTYPe Peachblaw Triumph Cobbler Katahdin and Chippewa Varieties
Arres Bushels Acres Bushels Acres Bushels Acres Bushels Acres I Bushels Acres Bushels
Eagle *1 150Gunnisan 1 150Jacksan 2 300 1 25 1 150Maffat : 45 4,500 10 1,000Park 9 400 2 50Rio Blanca__ 3 625 5 825Rautt 171 19,225 6 1,100Teller 71 7,325 11 1,550 4 025 U 400 1 100
Total 93 8,330 226 26,450 11 1,515 S 1,475 5 550 2 250
Jefferson 4 505Ilurgan 35 2,500Sedgwick 115 2,600 20 .150Weld 60 14,040 25 1,100 22 10,075 57 1,630 10 2,200
Total 274 ‘ 19,640 45 7,550 32 10,675 7 1,630 10 2,200
Adams 1 330El Paso 7 550
Total 7 350 5 330
Archuleta 1 20 9 I00 U 300Dolores 11 2,000 62 10,000Garfield 3 600 1 . U. 6 950 13 9,000La Plata 00 4 350Mesa 16 2,750Mantecuma 40 8,800 41 10,400 1 300llontrase 6 500 3 309 8 800San Miguel 6 . 700 15 2,930 *2 420
Total 4 620 73 12,610 146 27,330 S 930 6 720 41 9,800
Alansasa 10 3,850 jCanejas 12 2,000 10 1,500Ria Grande____ 608 201,360 37 15,601 2 550 91 31,500Saguache 84 24,700
Total 714 231,910 37 15,606 10 1,500 2 550 91 31,500
State Total_i 808 241,230 620 74,306 215 35,205 51 13,980 168 34,400 53 12,250
Chippewa.
tBrawn Beauty.
CERTIFIED SEED POTATOES )State Totals)
. . . Prnductinn, AllPraduetian by Varieties Varieties
1937 1928-1937VARIETY
Acres Yield Per Prsductian Year BushelsAcre (Bu.) (Bushels)
Bliss Triumph 620 120 71,100 1928 18,000
Perfect Peachblow 165 299 169,355 1929 72,000
Red McClure 243 297 72,071 1910 52,600
Irish Cobbler 211 178 38,205 1911 96,000
Brown Beauty 98 329 32,200 1932 121,000
Ifatabdin 51 274 11,980 1933 506,000
Russell Burbank 31 282 8,710 1914 425,000
Rural New Yorker 17 165 2,800 1939 152,000
Chippewa 11 209 2,200 1916 471,060
Russett Rural 1 140 700 1937 414,000
1,816 414,165

101 AGRICULTURAL STATISTICS
ESTIMATED PRICE OF FARM PRODUCTS RECEIVED BY COLORADO PRODUCERSAS OF THE 15TH OF TUE MONTH
CORN(Cents per bushel)
Year Jan. Feb. Mar. April May June July Aug. , Sept Oct Nov. Dcc.
1910 70 70 68 66 72 72 70 71 70 - 64 62 581911 56; 54 53’ 54 59 62 64 68 72 75 76 761912 75: 76 74 79 88 86 85, 80 75 72 62 441911 41 44 60: 52 50 52 54’ 62 72’ 76 74 711914.. 70: 69 70’ 70. 70 72 72 71 72 72 66 621916 66 68 70 68: 66 65 66 68 66 56 52 551916 58 62 64 66 66 66 72 76 78 77 88 901917 92 92 98 120 145 161 174 186 184 155 180 1221918. 128 : 144 150 • 150 147 148 , 152 156 154 . 146 188 1401919 142 116 114 141 150 156 . 166 ‘ 168 172 164 146 1411920 133 . 120 124 144 155 160 160 150 126 98 80 611921. 48 41 42 : 48 50 48 49 42 16 88 81 821922 14 19 44 48 50 51 50 45 44 55 66 641921 61 62 66 78 84 82 78 74 71 75 70 681924 60 60 58 : s 65 62 99 95 93 94 99 1041925.. 115 115 106 87 100 110 108 99 98 92 70 701926 72 65 60 57 62 65 68 72 75 79 76 781917 70 71 72 73 79 91 97 97 94 88 70 691928 69 72 80 ‘ 87 98 94 92 85 88 80 78 781929 76 80 80 78 79 78 80 87 87 88 80 761930 71 . 71 66 68 68 71 68 77 77 70 61 551931 48 44 42 44 48 40 42 42 88 84 41 571932......... 16 35 33 33 83 32 33 32 31 28 28 211933 , 20 20 21 27 36 11 50 46 43 39 40 861934 :17 : 76 37 36 10 11 51 81 87 90 93 1021985 104 100 97 102 101 96 92 90 86 86 62 601936 i 61 I 62 64 66 66 65 86 114 110 108 107 1051937 100 113 : 122 127 117 113 105 101 74 64 601938 62 61 (1 61 62 60 3 Sli 50 43
OATS(Cents per bushel)
Year Jan. Feb. Mar. April May June July Aug. Sept. Oct. Nov. ‘ Dec.
1910 54 64 so: so 56 58 18 56 52 46 46 461911 44: 44 44 47 50 50 53, 65 52 50 49 481912 48: 47 52: 58 60 60; 57 47 41 89, 87 881913 3s 40 40 38 40! 42: 44 47 47 46: 45 451914 40 47: 48 60 50 45 42, 46 48 46 481916 49 48’ 48! 52 58 so so: 48 43 42 42 421916 42 48 50 52. 64 56’ 54 64 58 68 621917 04 64 69 84 97 98 92 86 82 72 71 ‘771918 70 80 96 101 100 90 99 92 99 84 80 861919 90 80 82 89 90 90 I 89 87 88 84 86 901920 90 92 97 99 100 110 104 90 84 74 64 561921 53 51 56 58 51 56 53 48 40 86 84 821922 32 36 40 43 44 44 44 42 88 35 48 461923 49 53 58 64 66 07 60 68 50 46 46 481924 48 47 60 48 45 49 66 56 54 50 54 551925 60 63 06 07 62 03 58 53 49 49 49 481920 40 47 47 49 48 48 47 44 48 44 48 411927 47 49 48 60 50 55 56 50 49 45 46 481928 50 50 55 58 62 60 62 47 43 44 45 471929 48 52 53 54 54 50 53 49 47 45 47 461930 46 44 45 45 45 44 39 38 37 35 85 541931 34 32 35 34 58 32 29 20 26 28 29 291932 29 30 30 30 31 29 28 24 22 20 19 181933 18 18 18 20 24 24 34 29 28 26 20 271934 28 29 29 29 10 35 57 46 49 52 55 591935 . 60 59 60 60 61 55 52 36 32 81 81 811936 : 31 31 32 31 31 30 35 43 48 43 45 491937 50 53 54 58 59 56 40 43 39 36 36 351938 35 35 15 36 36 15 32 25 25 24 20 ——

STATE OF’ COLORADO 105
ESTIMATED PRICE OF FARM PRODUCTS RECEIVED BY COLORADO PRODUCERSAS OF THE 15TH OF THE MONTH—Continued
BARLEY(Cents per bushel)
Year Jan. Feb. Mar. April May June July Aug. Sept Oct. Nov. Dec.
1910 68j 68 72 65 70 76 74’ 69 62: 60 60 631911 64; 58 56 60 62 65 68 68 68’ 66 67 681912 65 68 76 86 86 81 81 60 55 49 52 461913 46 48 44 48 49 48 48 52 56 55 54 561914 59 59 58 60 60 58 56 57 60 64 60: 561915 60 66 66 66 64 60 58 58 52 48 50 551916 58 57 62 66 64 64 62 69 76 76 81 851917 88 88 101 128 146 142 125 119 114 105 104 1111918 128 184 151 159 149 135 124 125 112 120 —— 1241919 128 ‘ 133 131 116 122 138 152 141 126 130 128 1281920 122 124 136 146 147 148 144 137 106 —— 73 651921 62 60 —— —— 62 61 —— 60 58 —— —— , 401922 41 44 46 46 46 48 50 50 45 49 58 581923 60 61 65 75 78 67 58 54 50 52 54 501924 49 51 53 52 55 57 64 68 65 70 71 761925 86 90 90 79 79 94 75 67 60 62 58 571926 57 57 56 58 61 55 56 48 55 54 54 551927 58 59 61; 64 65 69 70 62, 58 55 54 561928 19 63 67 73 75 76 74 51 46 48 52 191929 60 60 63 62 61 58 57 54 54 56 56 571930 56 52 53 53 55 53 42 44 48 41 89 861932,.,,.._. 35 34 95 85 55 32 30 23 25 22 29 291932 30 29 29 31 30 29 26 20 20 19 18 181933 17 17 17 22 25 26 36 30 20 27 30 , 271934 29 30 31 31 31 39 41 61 70 71 73 : 661935 82 82 82 91 76 67 17 41 42 43 42 451936 43 43 43 43 43 41 49 : 68 70 70 71 741937 73 81 82 87 96 82 62 30 I 52 51 49 473938 481 4747. 47 45 32 27 28 29 29 ——
WHEAT(Cents per bushel)
July Aug. Sept : Oct. Nov. Dec.Year Jan. Feb. Mar. April May June
1910,.,,.,...,., 98 99 98 97 96 98 96 94 901911 78 77 77 79 82 83 88 i 86 801912 84 84 87 92 94 94 92 ‘ 82 761913 72 75 75 75 74 73 72 72 741914 74 75 76 78 78 77 76 78 811915 107 121 118 118 120 104 95 92 821916 93 97 94 91 91 88 92 112 1281917 148 152 156 180 220 242 232 210 2001918 190 190 192 198 192 195 ‘ 200 I 198 1941919 198 195 194 201 203 206 204 196 1941920 216 212 212 215 225 234 226 212 1961921 138 138 130 108 112 118 96 86 861922 80 94 102 99 99 90 84 84 781923 95 95 99 100 100 94 80 72 791924 84 83 84 82 84 82 95 105 1001925 142 163 155 138 139 141 128 145 1381926 152 147 185 131 182 127 111 108 1051927 116 113 109 111 109 119 118 109 1071928 108 109 115 118 132 127 114 83 801929 ‘ 89 93 95 89 84 80 91 ‘ 101 1001930 96 90 84 89 84 84 68 64 631931 52 51 51 51 52 45 32, 28 301932 43 42 40 40 39 36 34 36 351933 : 32 33 42 55 55 80 66 621934 61 62 61 59 60 70 74 84 891935 92] 90 91 91’ 90 81 80 85 941936 94 92 90 87 81 79 01 103 1631937 117 116 116 118 113 109 106 93 901938 84 82 76 69 66 63 16 45 46
86 8480 8276 7074 7681 8484 83
135 145194 190192 194198 200178 152
82 7684 9084 84
115 118129 136107 110105 103
85 8598 9157 5833 4633 3257 6587 89
102 94104 104
8$ 76$6 , 48
808410709084
145192194216186
789286
127145109107
8795544280589592
10876

106 AGRICUlTURAL STATISTICS
ESTIMATED PRICE OF FARM PRODUCTS RECEIVED BY COLORADO PRODUCERS
AS OF TEE 15TH OF TEE MONTE—Continued
RYE(Cents per bushel)
Year Jan. Feb. Mar. April May June July Aug. Sept Oct. Nnv. Dec.
1910 —[ 74 74 74 71 76 79 70 78 70 68 6866
1911 ‘ 64 63 64 65 64 61 601 72 76 68 68 68
1912 68 72 80 82 78 75, 76 70 59’ 54 54 54
1913 53 52 so] 52! 57 62 64] 63 62 59 58 60
1914 62 58 56 62 64 60 62 61 59 60 62 64
1915 691 80 90 98 93! 84] 78] 78 70 64 67 72
1916 72 74 76 75 74 71 72 79 84 ‘ 94 105 100
1917 104 110 108 128 148 148 146 135 142 151 144 140
1918 136 139 162 176 163 138 138 165 160 151 141 138
1919 128 125 138 181 144 134 140 161 147 132 129 131
1920 142 136 ‘ 125 162 I 172 194 184 150 138 121 110 [ 98
1921 101 92 90’ 961 96, 90; 77, so] 70 67 60 58
1922 so] 62 66 68] 70 721 68 57] 511 00 68 67
1923 671 65, 65, 70 73 70! 50 50] 56’ 60 58 56
1924 54] 58 58] 60; 60 88 531 70] —— 83 85 95
1926 103 118 112! 89’ 82 95 82 81] 82 69 63 70
1926 . 70 71 61! 69 58 61 66 701 70’ 73 71 65
1927 1 68’ 73’ 72 70’ 72 78! 80; 72 71 68, 67 72
1928 ‘ 73 73 79 80; 89 87, 85 67 67; 70 71 71
1929 72 76 76 75, 70 66] 69‘!
73 73 71 73
1930 71 66 59’ 63] 65 57: 38 42, 46; 41 13 33
1931 31 30, 28’ 311 32 291 22 201 21 24 32 32
1932 32 321 33 301 30 28] 28 28, 26] 21 21 20
1933 21 21 211 27 32 32 62, 50’ 52] 43 47 41
1914 4) 4.1] 44! 5; 14 41 54 75 79 78 89
1935 81 78: 80 83 80 ,l 58’ 45 5Q1 59 59 531936 50 51 51’ 49j 50 60 61 78! 80 76 80 80
1917 87, 87 87 80 1)8 85 70] 63; 62 16 35 11
1938 ‘ 51 51’ 63 50’ 4b18 I 41’ 29 32 30 321 ——
POTATOES
(Cents per bushel)
Year , Jan. Feb- , Mar. , April ; May June July Aug. Sept Oct. Nov. Dec.
1910 62 59 54 35: 26 321 80 711 80 70 60 53
1911 I s 60 60 70 77 ] 122 170 162 ‘ 135 98 ] 90 94
1912 90 95 102 120 146 ] 140 115 94 ] 70 55 1 45 88
1913 ] 35 39 42 36 30] 34; 49’ 691 701 62] 63’ 62
1914 , sol 60 60 58 581 74 86 88 81] 72, 62 48
1915 1 58] 58 57 63 71 73 86] 82 64] 42! 48 58
1916 ] 70 76, 80] 98.105’ 118 133’ 230’ 10011511 130 130
1917 138 1 194 ] 220 228 258 257 244 , 186 113 1 88 99 94
1918 ‘ 106’ 104’ 85’ 64 51’ 51 120] 168] 132] 97; 88 88
1919 75 70 66 77 83 76 120 160 155 150 1 iSo , 162
1925 , 181 , 226 274 330 428 , 450 400 266 123 94 ] 76 ‘ 70
1921............’ 60; 56 84. 68 67] 81 96 110: 103 90, 81 66
1922 ] 77 80 70 84 55 62 70 so] 76, 481 41 32
1923 1 41] 40 34, 45 43 41 96 128 951 741 65 64
1924 71 65 65 1 70 71 ‘ 180 150 120 60 55 51 52
1925 63 64 80 77 85 ‘ 113 166 152 1 114 ‘ 110 . 188 173
1926 , 193 178 175 230 180 145 140 105 110 115 ) 130 125
1927 1 130 1 110 110 1 115 135 170 200 140 ‘ 85 65 1 60 60
1928 , 55’ 55 80’ 80 60 86 75 65’ 55 35’ 45 45
1929 45 48 45 45 , 45 50 100 120 115 : 110 115 115
1930 ‘ 110 , 115 120 120 140 , 150 115 105 85 ‘ 70 I 70 . 68
1931 60] 55 50 60 551 50 75] 701 35 30] 00! 50
1932 29 26 27 28 28: 32’ 40’ 28 26: 22’ 24 25
1933 24] 24 26 34 341 18 120 115, 751 481 48’ 48
1934 65’ 75 65 50 41] 42 75 60] 55’ 55 55 60
1935 60’ 57 54 66 761 95 99’ 48’ 56 02 55! 47
1936 46 ] 49 55 75 80 135 150 ‘ 115 , 105 90 108 ‘ 100
59‘
138 . 135 125 ‘ 120 115 I 100 100 45 42 41 ‘ 46 45
1938 , 44 40 45, 50 50, 60, 70, 41 41, 46, 63

STATE OF COLORADO 107
ESTIMATED PRICE OF FARM PRODUCTS RECEIVED BY COLORADO PRODUCERSAS OF TilE 15TH OF THE MONTH—Continued
ALFALFA(Dollars per ton)
Year Jan. Feb. Mar. April May June July Aug. Sept Oct Nov. Dec.
1110 I ———
1111 I19121513 ——_I1914 6.60 7.70 7.001915 8.50 7.80 8.30 8.50 9.00 7.80 7.70 7.40 j 7.50 7.50 0.70 5.101911 9.00 8.80 9.50 9.70 I: 10.50 11.50 10.20 10.50 9.60 9.70 9.55 r 11.501917 12.10 1260 11.20 14.60 20.10 19.00 13.60 14.80 15.00 15.30 17.40 18.901918 10.20 18.20 10.00 15.10 I 10.10 11.00 14.30 10.26 17.00 17.20 17.20 17.401919 17.90 18.20 20.50 21.00 22.70 20.10 18.20 18.00 18.10 18.10 17.50 19.001920 10.50 19.90 19.00 20.10 22.60 21.00 18.30 17.20 14.10 14.00 12.50 11.701921 8.50 8.00 8.80 8.50 8.75 0.50 0.00 5.50 5.00 5.70 5.00 4.761922 4.40 0.50 7.00 7.50 i 7.50 7.00 7.00 9.00 9.80 9.00 10.40 11.601923 12.30 12.20 13.40 11.80 I 16.00 14.00 12.00 11.00 10.10 10.00 12.40 12.901924 11.00 11.50 11.00 11.00 11.30 11.00 10.00 10.30 11.00 11.50 11.70 12.201925 12.50 12.80 12.90 11.40 12.00 11.70 12.20 12.60 12.40 12.00 12.60 18.401926 I 13.30 11.80 11.30 12.10 50.80 10.10 9.60 5.80 9.40 9.70 10.00 10.001927 5.00 8.30 8.50 9.00 8.70 0.50 8.50 9.00 9.10 5.50 9.60 9.801528 9.10 5.00 10.00 10.20 11.50 11.20 10.20 10.40 11.48 12.30 12.00 18.101020 13.00 14.30 14.80 14.60 14.50 13.50 12.40 11.70 12.30 12.10 12.10 11.601530 11.00 11.30 10.30 9.70 9.50 0.50 5.20 9.00 9.80 10.00 9.20 9.501931 5.00 8.20 7.80 8.00 8.20 7.60 6.80 8.10 7.40 7.20 8.00 8.701932 8.00 8.00 8.70 9.00 8.50 7.50 1.30 0.50 7.00 6.70 6.70 6.001933 6.30 5.70 6.00 6.00 6.00 6.10 6.50 6.40 6.40 6.40 6.00 6.501014 0.0 lou 1.00 0.00 0.70 0.60 1.60 11.10 12.40 12.00 12.50 13.101535 13.10 13.20 12.70 14.50 15.50 12.00 8.00 7.70 7.40 7.40 7.40 7.101930 7.20 7.10 6.90 6.70 6.50 6.50 7.30 8.90 0.30 5.30 9.20 9.101537 0.00 0.70 0.00 0.40 0.uO 0.40 8.40 0.20 j soC 9.00 I 8.00 0.801938 1.20 0.10 8.70 0.10 8.10 7.70 . 7.40 6.80 1.90 7.10 7.10
BEANS, DRY(Dollars per 103 pounds)
Year Jan. Feb. Mar. April May June July Aug. Sept Oct. Nov. Dec.
1910 ——— ———4.52 4.50 4.83 4.70
1511 4.15 5.08 4.53 4.77 4.87 5.07 8.08 5.27 5.42 4.72 5.13 4.751512 4.00 4.45 4.42 4.82 4.05 4.25 4.23 3.92 8.83 8.93 3.18 8.001518 3.50 3.58 2.88 3.00 2.80 3.33 3.30 2.92 8.17 4.08 4.17 4.001914 3.58 1.42 3.50 1.83 8.75 3.70 3.50 4.17 4.50 3.85 8.38 3.881915 1.58 4.38 4.43 3.87 4.40 4.83 3.78 3.83 1.33 8.81 8.80 4.121916 4.73 4.78 4.27 4.87 5.17 5.17 0.33 5.83 7.00 5.00 5.88 6.881517 7.50 7.50 7.02 5.00 13.07 14.33 13.17 10.50 9.87 i 8.87 8.00 7.881910 8.00 8.17 8.33 8.83 8.67 8.07 8.58 7.92 8.00 7.33 7.85 6.671919 6.07 8.92 5.33 8.00 5.00 5.33 5.33 8.03 6.17 1.50 5.83 6.001920 0.42 6.33 5.83 5.92 6.17 6.17 6.17 6.17 1.00 5.00 8.25 4.781921 3.00 3.67 3.75 4.00 3.67 4.33 4.50 4.50 4.50 4.Oo 4.50 [ 4.581922 4.50 4.83 5.50 5.58 5.83 0.00 5.83 5.42 5.35 5.42 7.33 7.831523 7.50 8.67 8.33 8.33 8.08 8.25 7.07 7.83 6.57 7.00 6.17 5.171924 5.00 4.92 4.92 4.50 4.33 4.50 4.33 4.78 5.00 5.67 5.17 4.881525 5.33 5.83 0.00 6.33 6.83 0.05 0.33 0.50 4.75 4.98 4.00 4.671520 3.70 3.98 3.80 3.90 4.20 4.50 5.00 4.70 4.30 4.40 4.80 4.901927 4.90 4.50 5.00 5.50 5.00 8.00 5.90 0.10 6.15 5.10 4.40 4.551928 4.95 5.40 5.00 6.10 6.10 0.30 0.20 5.40 4.78 5.00 8.20 5.701525 5.80 5.05 8.90 6.25 6.05 6.20 6.25 6.25 6.25 5.80 4.90 4.501930 4.30 4.20 4.30 4.15 4.30 4.30 4.00 4.25 4.40 3.20 2.45 2.151531 2.15 2.15 2.10 1.95 1.80 1.08 1.60 1.50 1.50 1.30 1.98 1.501932 1.48 1.25 1.20 1.25 1.20 1.20 1.15 1.30 1.70 1.70 1.50 1.501333 1.00 1.75 1.85 2.85 3.75 3.85 3.80 4.35 3.30 2.55 3.15 2001034 2.80 2.80 2.80 2.00 2.00 2.05 3.40 4.10 5.35 5.40 5.50 5.501935 575 5.55 5.05 5.90 5.95 5.80 5.00 3.50 3.35 2.85 2.40 2.201936 2.60 2.70 2.50 2.50 2.40 2.25 3.00 3.05 2.35 4.00 4.30 4.451037 4.00 8.30 0.30 5.30 0.10 0.20 8.10 4.01 3.75 3.00 3.25 3.401038 3.70 3.30 3.70 3.70 4.15 4.02 4.00 3.00 3.15 3.20 3.30

100 AGRICULTURAL STATISTICS
ESTIMATED PRICE OF FARM PRODUCTS RECEIVED BY COLORADO PRODUCERS
AS OF THE 15TH OF THE MONTH—Continued
RAY (LOOSE)(Dollars per ton)
Year Jan. Feb. Mar. April May June July Aug. Sept Oct. Nov. Dec.
1910 11.25 11.00 10.55 10.00 10.00 10.10 10.01 10.40 10.45 10.10 10.60 10.651911 10.75 10.60 10.55 10.40 10.70 10.50 10.20 10.05 9.15 9.95 9.61 9.40
1912 9.60 10.30 11.15 13.00 11.71 12.85 10.15 9.25 8.70 8.10 1.91 1.151913 8.85 1.50 8.30 8.30 8.90 8.60 8.70 8.46 8.11 9.30 9.61 9.801914 10.11 11.10 10.61 9.65 9.80 9.15 8.50 1.20 8.20 8.25 7.95 7.411915 7.45 7.10 7.30 7.10 7.81 8.40 8.65 8.11 7.45 7.40 7.60 7.911916 8.56 9.11 9.55 9.65 10.09 10.35 10.10 3.40 1.75 9.35 10.60 11.05
1917 11.51 12.15 13.61 35.95 18.91 19.00 16.00 13.75 14.50 15.11 16.20 16.151918 18.05 17.81 11.10 11.65 16.00 15.11 14.61 13.85 14.15 15.10 11.55 15.351919 14.73 11.75 17.79 20.05 21.80 19.40 18.50 18.60 38.25 17.10 17.71 11.001920 18.50 18.71 38.11 18.65 20.60 20.60 18.75 17.11 16.00 13.20 11.10 11.501921 10.85 10.20 9.91 9.31 8.85 9.20 8.00 8.20 7.30 6.70 7.05 6.60
1022 6.40 0.80 6.91 7.32 7.02 6.40 6.80 7.05 8.70 9.18 10.20 10.601923 10.90 12.03 12.30 13.15 14.20 13.05 10.30 9.00 9.11 9.18 10.15 12.901924 11.00 10.50 10.50 10.00 10.00 10.30 9.50 10.80 10.00 11.80 11.30 12.00
1925 12.30 12.30 13.60 11.60 11.20 12.00 13.70 12.00 11.60 10.70 12.00 12.20
1926 11.50 10.70 11.30 10.50 11.90 11.10 10.10 0.80 9.50 9.30 8.90 9.001027 8.00 7.60 7.00 8.10 9.00 8.50 8.70 8.40 8.80 9.00 9.30 9.201928 8.00 8.10 I 9.00 10.00 11.00 10.00 9.70 9.10 10.60 10.80 11.00 11.001929 11.00 12.00 13.00 12.20 12.70 I 12.70 11.70 11.70 11.00 10.90 10.00 10.601930 10.80 10.00 9.60 8.90 9.10 0.30 8.90 0.90 10.20 8.90 9.00 8.601931 9.00 8.00 7.60 7.90 8.10 7.30 7.10 7.80 7.60 7.80 7.80 8.401912 8.30 8.80 8.00 0.70 8.40 7.40 7.10 0.90 6.50 6.40 0.10 5.901913 5.80 0.80 0.70 0.80 6.40 0.90 0.40 6.20 6.00 6.00 0.90 5.901914 1.00 p 1.10 1.21 1.90 1.70 1.10 7.20 10.60 12.10 12.10 12.10 12,701035 12.90 12.70 12.10 10,00 10.90 13.00 9.10 8.10 6.70 7.00 7.00 6.701036 0.60 0.30 6.40 6.30 6.40 0.40 7.10 9.40 9.20 0.70 9.10 8.501017 1.40 0.00 7.60 0.10 9.10 8.00 0.40 7.10 7.00 8.00 0.20 7.701038 7.70 0.00 7.00 0.20 0.20 0.00 7.10 7.10 6.40 0.10 7.10
APPLES(Dollars per bushel)
Year Jan. Feb. Mar. April May June July Aug. Sept Oct. Nov. Dec.
1010 1.17 1.14 1.27 1.21 1.11 1.01 1.17 1.21 1.00 1.10 1.20
1911 1.15 1.54 1.80 2.47 2.09 2.00 1.25 1.03 .77 .96 1.17 1.27
1912 1.00 1.15 1.17 1.00 1.00 2.00 1.06 .05 .00 .97 .03 .781913 .90 .75 .90 .05 1.20 2.07 1.40 .82 .01 1.00 1.00 1.101914 1.00 1.20 1.20 1.30 1.50 1.00 ., .80 .75 .60 .75 .051015 .01 .70 i .80 1.05 1.03
———
1.30 1.00 1.00 [ .85 .95 .951910 .90 1.00 .98 1.00 1.05 1.40 2.00 1.20 .90 I .05 1.00 1.251917 1.20 1.30 1.40 1.00 2.00 3.20 I 1.20 I 1.20 .90 1.10 1.851918 1.25 1.30 1.15 1.40 2.60 1.00 1.70 1.50 1.50 1.70 2.001919 2.25 2.10 2.50 2.10 2.70 2.00 2.30 1.50 1.70 1.00 2.00 2.101020 2.20 2.10 2.30 2.28 9.00 2.40 2.70 2.00 1.80 1.00 1.70 1.921921 .65 1.00 .90 1.40 1.60 1.25 1.00 1.00 1.70 1.70 . 1.60 1.401022 1.50 i 1.50 1.80 1.80 1.00 2.20 1.90 .75 .05 .75 .70 .501023 1.00 1.10 1.18 1.10 2.38 3.20 1.00 1.76 1.20 1.24 1.23 1.20
1924 1.28 1.00 1.00 1.10 _ 1.00 2.00 .94 1.00 1.09 1.26 I 1.171920 1.41 1.49 1.62 1.71 .. 2.50 . 1.01 1.19 1.24 1.22 1.99 1.321926 1.64 1.27 1.14 1.58 _ 1.60 1.80 1.10 .80 .75 .95 .901927 p .90 .95 .90 1.00 1.05 1.50 1.00 1.25 1.10 1.15 1.20 1.501028 1.30 : 1.05 1.90 1.35 1.50 1.55 1.45 1.25 .90 .90 .85 .761929 .80 .90 .95 .90 .95 1.29 1.70 1.30 ‘ 1.10 1.10 1.05 1.101030 1.10 1.20 1.10 i 1.20 1.20 1.40 1.70 1.45 1.00 .00 .88 .951931 1.05 .85 .90 1.00 1.00 1.00 1.25 1.00 .70 .85 .55 .701912 .70 .65 .60 .60 .60 .60 .00 .40 .45 .40 .40 .401913 .40 .30 .04 .07 .10 .40 .50 .05 .60 .50 .55 .601014 .75 .71 1.00 .00 .71 .70 1.00 .01 .00 .80 .80 .801935 .80 .90 .00 1.00 1.20 1.20 1,20 .70 .70 .90 .75 .801939 .85 .80 .80 .00 .90 1.00 1.00 .85 .05 1.00 .90 .951027 1.01 1.21 1.20 1.20 1.50 1.71 1.00 .85 .00 .70 .70 .801010 .70 .60.75 1.00 L00 1.21 .90 .80 .01 5

STATE OF COLORADO 109
ESTIMATED PRICE OF FARM PRODUCTS RECEIVED BY COLORADO PRODUCERSAS OF THE 15TH OF THE MONTH—Continued
HOGS(Dollars per 100 pounds)
Year Jan. Feb. Mar. April May June July Aug. Sept- Oct. Nov. Dec.
1910 7.60 7.50 9.00 8.80 8.20 9.00 8.50 7.80 8.50 8.20 8.00 7.701911 7.60 7.60 7.20 6.30 6.20 5.60 5.70 6.90 7.00 6.20 6.00 6.101912 0.00 5.90 6.00 6.90 7.00 6.90 6.80 7.20 7.40 7.60 7.60 7.501913 7.20 7.10 7.50 7.90 7.80 7.70 7.80 7.80 7.60 7.70 7.70 7.401914 7.30 7.70 7.60 7.70 7.70 7.70 7.70 8.10 8.30 7.70 7.50 6.801915 6.90 6.40 6.50 6.60 6.80 6.90 7.00 7.20 6.80 7.10 6.50 6.101916 6.00 6.60 7.70 7.80 8.20 8.10 8.30 8.50 9.00 8.30 8.60 8.701917 9.10 10.10 12.20 14.00 14.20 14.30 13.50 14.90 16.20 17.30 15.50 15.701918 15.20 14.80 11.70 15.60 15.80 15.40 15.50 17.00 17.30 16.20 15.50 15.601919 15.30 15.00 15.20 I 17.20 17.90 17.90 19.20 19.40 16.50 14.50 12.80 12.701920 12.70 13.20 13.30 13.00 12.90 12.50 13.00 12.90 13.70 13.70 11.50 8.401921 7.30 7.80 8.60 7.80 7.10 6.60 8.00 8.60 7.10 6.80 6.80 5.801922 6.00 7.50 9.00 I 8.90 8.80 9.00 8.90 8.70 8.50 8.20 7.50 7.001923 7.30 7.20 7.10 7.10 6.50 6.00 6.30 . 6.50 7.70 7.00 6.50 6.101924 6.30 6.00 6.10 6.30 6.10 6.00 6.00 8.30 8.00 8.70 8.20 7.801925 8.80 9.30 12.20 11.50 10.00 10.40 12.20 12.10 11.70 11.20 10.60 10.301928 10.60 11.63 11.60 11.30 11.70 12.60 13.10 11.90 12.00 12.00 11.70 10.701927 10.60 10.80 10.60 10.40 9.30 8.50 8.60 9.60 10.20 10.50 9.10 8.501928 7.70 7.50 7.50 7.50 8.40 8.60 9.60 9.90 11.00 9.60 8.71) 7.801929 8.00 8.70 9.70 10.00 9.70 9.70 10.30 10.50 9.80 9.40 8.80 8.401930 8.70 9.00 9.30 8.90 8.80 8.99 8.20 8.50 9.40 8.80 8.30 7.401931 7.20 6.70 6.80 6.00 6.20 5.00 6.00 0.20 5.40 4.40 4.30 3.501932 3.40 3.20 3.70 3.40 2.60 2.60 4.10 3.80 . 3.60 3.05 2.80 2.451933 2.40 2.65 2.95 3.05 3.60 3.80 3.80 3.70 3.60 4.10 3.80 2.701934 2.8 3.70 . 3.70 3.45 2.90 1.50 3.70 4.90 6.00 1.00 5.’0 I 5,301935 7.10 7.30 8.40 ‘ 8.20 8.30 8.80 8.70 10.80 10.40 9.50 I 8.90 8.901930 9.00 9.50 9.40 9.50 8.70 9.30 9.30 10.10 9.90 9.30 8.80 9.401937 9.70 9.00 9.20 9.20 9.40 10.20 10.90 11.50 10,60 9.70 8.20 7.401938 7.50 7.00 8.60 8.00 . 7.40 8.30 9.00 8.00 8.40 7.60 7.60
BEEF CATTLE(Dollars per 100 pounds)
Year Jan. Feb. Mar. April May June July Aug. , Sept. Oct. Nov. Dec.
1910 5.70 6.00 4.80 6.00 5.80 6.20 5.50 4.00 4.50 4.00 4.50 4.201911 5.00 . 5.00 5.00 5.00 4.90 5.00 4.80 4.40 4.70 4.00 4.60 4.801912 4.80 4.90 I 5.20 5.70 6.00 5.90 5.70 5.40 5.63 5.80 5.50 6.101913 6.00 6.10 6.30 6.50 6.90 6.70 6.70 6.50 6.50 6.30 6.70 6,601914 6.50 6.90 6.70 6.90 6.90 7.00 7.00 6.50 6.70 ‘ 6.00 6.50 6.501915 6.60 6.70 6.60 6.50 7.00 I 7.00 6.60 6.60 6.20 6.20 6.30 6.001916 6.30 6.50 6.70 7.00 7.10 i 7.40 7.50 7.30 0.70 6.60 6.60 7.101917 7.80 7.80 8.40 9.30 9.30 10.20 10.00 8.50 ‘ 8.70 9.00 8.80 8.801918 8.60 9.50 9.90 11.00 12.40 11.80 11.00 10.90 9.00 9.20 9.90 9.901919 11.00 11.10 11.20 12.20 12.00 11.80 10.50 10.50 9.20 9.20 9.00 8.701920 9.00 8.90 9.20 9.20 9.40 10.00 9.50 8.80 . 8.70 6.70 7.20 6.201921 6.30 5.60 6.90 6.40 6.10 5.80 5.80 5.40 4.60 4.50 4.60 4.601922 4.90 5.50 5.80 6.00 6.20 6.40 0.30 5.80 5.70 5.60 5.50 5.701923 5.80 5.70 6.20 6.30 6.50 6.50 0.40 5.70 6.00 5.30 5.30 5.201924 6.00 5.60 6.00 6.40 6.50 6.40 6.20 5.60 5.70 5.30 5.00 5.501925 5.60 5.80 6.80 7.80 6.90 7.10 0.80 7.10 6.50 6.30 6.40 6.201926 6.50 7.10 7.30 7.70 7.00 7.40 7.10 7.10 6.80 6.50 6.60 6.501927 6.60 6.80 7.20 8.00 7.90 8.00 8.20 7.70 7.30 8.10 8.00 8.901928 9.00 9.40 8.80 9.10 10.10 9.80 9.50 10.10 10.40 10.10 9.80 9.101929 9.40 9.30 10.10 10.40 10.30 10.20 10.90 11.20 9.70 9.30 9.20 9.201930 9.30 9.10 9.20 9.20 9.10 9.00 7.90 7.00 7.10 7.20 7.10 7.301931 7.20 6.50 6.50 6.50 5.90 5.30 0.60 5.70 5.50 5.00 4.90 4.001932 3.90 3.60 4.10 4.10 3.90 4.20 I 4.90 4.50 4.30 5.00 3.65 3.401931 3.30 3.30 3.45 3.65 4.15 4.25 I 4.30 3.90 3.00 3.55 3.45 3.051934 5.50 1.05 3.00 4.30 4.40 III 4 10 3.05 9.90 1.70 4,31) 4.001935 5.10 6.80 6.90 7.30 7.50 7,59 , 6.80 0.40 6.60 6.50 6.20 6.401936 6.50 6.20 6.50 6.80 6.60 6.70 6.20 . 6.00 6.50 6.10 I 6.30 6.800937 7.00 7.10 7.40 7.10 ‘ 0.00 . 8.30 8.60 8.80 8.00 7.70 7.00 6.401930 I 6.30 6.00 6.40 . 6,80 7.10 6.90 ‘ 7.10 ! 6.70 6.90 I 6.80 ‘ 6.80
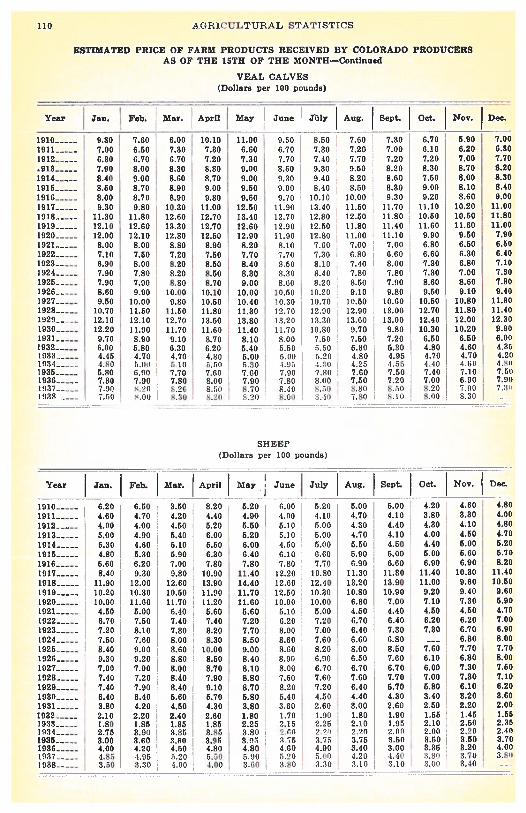
110 AGRICULTURAL STATISTICS
Year Jan. Feb. Mar. April May June JOily Aug. Sept. Oct. Nov. Dee.
1910 9.10 7.60 6.00 10.10 11.00 9.50 8.50 7.60 730 6.70 5.90 7.001911 7.00 6.50 7.30 7.30 6.60 6.70 7.30 7.20 7.00 6.10 6.20 6.801912 6.30 6.70 6.70 7.20 7.30 7.70 7.40 7.70 7.20 7.20 7.00 7.70913 7.90 8.00 8.30 8.80 9.00 8.00 9.30 9.50 8.20 8.30 8.70 8.201914 8.40 9.00 8.60 8.70 9.00 9.30 9.40 8.20 8.60 7.50 8.00 8.301915 8.50 8.70 8.90 9.00 9.50 9.00 8.40 8.50 8.30 9.00 8.10 8.401916 8.00 8.71) 8.90 9.80 9.60 9.70 10.10 10.00 9.30 9.20 8.60 9.001917 9.30 9.80 30.30 11.00 12.50 11.90 13.40 11.50 11.70 11.10 10.20 11.001918 11.30 11.80 12.60 12.70 13.40 12.70 12.80 12.30 11.80 10.50 10.50 11.801919 12.10 12.60 13,30 12.70 12.60 12.90 12.50 11.80 11.40 11.60 11.60 11.001920 12.00 12,10 12.80 12.50 12.90 11.90 12.80 11.00 01.10 9.90 9.50 7.901921 8.00 8.00 8.80 8.90 8.20 8.10 7.60 7.00 7.00 6.80 6.50 6.501922 7.10 7.50 7.20 7.50 7.70 7.70 7.30 6.80 6.60 6.60 6.30 6.401323 6.90 8,00 8.20 8.50 8.40 8.50 8,10 7.40 8.00 7.35 6.80 7.101924 7.90 7.80 8.20 8.50 8.30 8.30 8.40 7.80 7.80 7.30 7.00 7.101925 7.90 7.90 8.80 8.70 9.00 8.00 8.20 8.50 7.30 8.60 8.60 7.891926 8.60 0.90 10.00 10.10 10.00 10.00 10.20 9.10 9.80 9.50 9.10 9.491927 9.50 10.00 9.80 10.50 10.40 10.50 10.70 10.50 10.60 10.50 10.80 11.891928 10.70 11.50 11.50 11.89 11.30 12.79 12.90 12.90 11.00 12.70 11.80 11.401923 12.10 12.10 12.70 13.50 13.80 13.20 13.50 13.60 11.00 12,40 12.00 12.901930 12.20 11.90 11.70 11.60 11.40 11.70 10.80 9.70 9.80 10.50 10.20 9.901939 9.70 0.90 9.10 8.70 8.10 8.00 7.80 7.50 7.20 6.30 6.50 6.001932 6.00 5.80 6.30 6.20 5.40 , 0.50 1,50 5.30 5.30 4.80 4.60 4.351933 . 4.45 4.70 4.70 4.80 5.00 5.00 5.20 4.80 4.90 4.70 4.70 4,2)’1914 1.00 5.0) 1 10 0,00 5.50 1.95 .1.50 4.25 .1.03 4.40 4)30 401935 5.80 0.90 . 7.70 7.60 7.60 7.90 7.80 7.60 7.50 7.40 7.10 7.001936 7.80 7.90 7.80 8.00 7.90 7.80 8.00 7.50 7.20 7.00 ‘ 6.90 7.9019 . 7.90 “.2)) ‘.28 5,5)) 13.7)) 8.19 8.50 1).S0 0.10 8.20 7.1)0 ‘ 7.5’’1938 7.10 .0,) .10 8.20 0.20 1)00 8-10 7.S0 13.10 0,00 0,30
SHEEP
(Dollars per 100 pounds)
Year Jan. Feb. SOar. April May June July j Aug. Sept. Oct. Nov. Dec.
1910 , 6.20 - 6.50 - 3.50 ‘ 8.20 5.20 6.00 5.20 - 5.00 5.00 4.20 4.60 4.80
1911 4.60 4.70 4.20 4.40 4.90 4.00 4,10 - 4.70 4.10 3.80 3.10 4.00
1912 4.80 ‘ 4.00 4.50 5.20 5.50 5.10 5,00 4.30 4.40 4.30 4.10 4.80
1913 5.00 ‘ 4.90 5,40 6.00 5.20 5.10 5.00 4.70 4.10 4.00 4.50 4.701914 5.30 ‘ 4.60 5.10 5.50 6.00 4.50 5.00 5.50 4.50 4.40 5.80 5.201915 ‘ 4.80 5.30 5.90 6.30 6.40 6.10 6.60 5.90 5.00 5.00 5.60 6.70
1916 5.60 6.20 7.00 7.80 7.80 7.80 7.70 6.90 6.60 6.90 6.90 8.20
1917 8.40 9.30 9.80 10.90 11.40 12.20 10.80 11.50 51.30 11.40 10.30 11.49
1918 11.90 12.00 12.60 13.90 14.40 12.60 12.40 13.20 13.90 11.00 9.60 10.80
1919 10.20 10.30 10.50 11.90 11.70 12.50 10.30 10.80 10.90 9.20 9.40 9.601920 10.00 11.60 11.70 11.20 11.60 10.00 10.00 6.80 7.00 7.10 7.30 5.901921 4.50 5.00 6.40 - 5.60 6.60 5.10 5.00 , 4.50 4.40 4.50 4.60 4.70[922 6.70 7.50 7,40 7.40 7.20 6.20 7.20 6.70 6.40 6.20 6.20 7.00[923 7.20 8.10 7.80 8.20 7.70 , 8.00 7.00 - 6.40 7.30 7.20 6.70 6.901924 7.60 7.60 8.00 8.10 8.50 8.60 7.60 - 6.60 0.80 6.80 8.001925 8.40 i 9.00 8.60 10.00 9,00 8.60 8.20 ‘ 8.00 8.50 7.60 7.70 7.701926 9.30 9.20 - 8.80 8.50 8.40 8.00 6.90 - 6.50 7.60 6.10 6.80 8.001927 7.00 7.00 8.00 8.70 8.10 8.00 6.70 . 6.70 6.70 6.00 7.30 7.601928 7.40 7.20 9.40 - 7.90 8.80 7.60 7.00 7.60 7.70 7.00 7.80 ‘7.101929 7.40 7.90 8.40 9.10 8.70 8.20 7.20 6.40 5.70 ‘ 5.80 6.10 6.201930 6.40 6.40 - 5.60 - 5.70 5.80 5.40 4.50 - 4.40 4.30 3.40 9.20 3.601931 3.00 4.20 - 4.50 4.30 3.80 0.60 2.60 000 2.60 2.50 ‘ 2.20 2.001932 2.10 2.20 ‘ 2.40 2.60 1.80 1.70 ‘ 1.00 ‘ 1.80 1.90 . 1.55 1.45 1.551033 1.80 1.85 1.85 185 2.25 2.15 - 2,25 2.10 1.05 2.10 2.60 2.361914 2.75 3.90 5.80 ‘ 3.85 1.80 2.00 2.28 2.20 2.00 2.00 ‘ 2.20 2.401936 3.00 1.60 ‘ 3.60 3,93 3.05 9.73373 . 3.73 1.50 3.50 3.60 3.701936 , 4.00 4.20 , 4,30 4.80 4.80 4,60 4.90 1 1.40 3.00 ‘ 3,35 ‘ 3.20 4.000937 4.05 4.85 - .5.20 5.50 5.00 5.20 5.00 4.20 4.40 3.80 3,70 3.8’)1038 3.50 3.50 4.00 - 4.00 3.00 3.00 3.30 3.10 1.10 3,00 3.10 -—
ESTTh!ATED PRICE OF FARM PRODUCTS RECEIVED BY COLORADO PRODUCERSAS OF THE 15TH OF THE MONTE—Continued
VEAL CALVES(Dollars per 100 pounds)

STATE OF COLORADO 111
Year Jan. Feb. Mar. April May
1910 7.00 7.50 4.30 5.90 7.401911 6.50 5.90 4.80 5.60 6.20 5.101912 5.00 5.30 6.10 6.60 7.50 6.801913 6.70 6.60 7.00 7.30 6.60 1.001914 6.70 6.50 6.80 7.30 7.00 7.201915 I 7.20 7.20 7.10 8.10 8.40 8.001916 7.70 8.50 9.50 8.70 10.00 10.001917 11.40 12.00 12.20 12.90 14.20 15.301918 15.80 16.00 14.80 17.80 17.10 15.701919 14.20 14.30 14.50 15.70 14.60 15.201920 14.80 16.70 16.40 15.70 16.20 11.101921 8.40 7.30 8.00 7.30 7.90 8.001922 8.00 10.40 12.40 12.40 12.00 10.701923 11.20 11.50 12.30 12.00 12.70 12.001924 11.40 11.60 12.00 12.50 13.00 12.701925 14.00 14.50 14.70 12.60 12.70 12.801926 14.30 12.60 . 12.00 11.10 12.00 12.901927 11.20 11.30 j 12.40 13.00 13.00 10.501928 11.80 . 13.00 13.50 14.10 12.80 15.201929 12.90 13.40 14.00 14.60 14.20 13.101930 11.70 10.00 9.20 8.70 9.10 9.801931 7.10 7.60 7.70 7.80 8.10 7.301932 4.30 4.80 5.80 5.50 4.80 4.701933 4.70 4.40 4.40 4.45 . 5.50 3.201034 0.40 7.00 7.10 7.110 8.10 7.1111935 7.80 7.90 7.60 7.60 7.80 (1.901936 8.60 8.90 9.20 9.70 9.70 9.101937 8.60 8.90 10.10 11.00 11.40 10.001938 7.70 6.90 8.00 7.70 7.40 7.30
6.70 5.80 6.00 6.305.30 6.50 5.40 4.507.00 8.00 5.80 5.606.50 6.30 5.60 5.507.40 7.20 6.03 6.007.90 7.20 7.00 7.009.80 9.30 8.50 9.00
13.70 13.50 14.60 16.3015.70 15.50 16.60 14.3013.80 15.50 14.60 12.3013.40 11.10 11.30 11.108.10 7.00 5.50 6.00
11.10 10.50 10.30 10.8011.20 10.50 11.50 11.8011.50 11.00 11.20 11.4012.50 12.00 13.20 12.9012.60 11.50 12.00 12.0013.00 12.60 11.90 12.0012.50 12.90 12.90 12.4012.80 12.30 11.90 12.009.00
j7.60 7.30 6.50
6.20 5.90 5.40 5.004.90 4.70 4.60 4.205.20 5.50 5.50 5.406.00 5.50 4.90 4.906.80 7.00 i 8.10 8.208.40 8.40 8.00 7.909.20 9.50 9.20 9.007.50 7.20 I 7.20 7.00
MILK COWS(Dollars per bead)
Year Jan. Feb. Mar. April May June July Aug.
1910 42.00 39.70 44.70 47.00 42.80 48.00 51.00 45.001911 51.00 49.00 49.10 48.80 50.00 52.00 50.00 48.001912 49.30 51.00 52.90 54.00 55.00 55.20 55.00 57.201913 59.00 58.20 63.50 66.40 67.80 66.90 62.20 67.001914 67.50 . 68.00 19.00 I 70.00 68.60 70.00 75.00 70.001915 76.00 76.00 75.40 72.20 72.30 73.00 73.60- 72.001916 72.10 72.00 76.00 1 75.00 75.00 . 78.00 76.60 82.001917 79.00 80.20 83.40 84.00 88.50 92.00 90.00 88.801918 89.30 92.20 87.90 92.10 96.50 95.50 - 88.40 94.301919 93.00 91.33 02.00 00.20 96.00 95.00 91.00 96.001920 81.10 92.60 96.50 97.00 97.20 92.80 92.60 100.701921 69.00 64.00 69.00 68.00 63.00 62.50 63.00 63.001922 60.00 60.00 63.50 65.00 68.00 68.00 65.00 63.001923 56.00 59.20 56.70 55.50 58.50 60.00 58.00 57.201924 55.00 55.00 57.00 58.00 58.00 57.90 55.00 57.001925 50.00 48.00 54.40 33.50 53.40 52.00
-
52.50 56.601926 68.20 59.60 61.00 61.00 61.00 61.00 63.00 64.001927 61.00 64.00 68.00 71.00 70.00 69.00 69.00 69.001928 75.00 80.00 82.00 82.00 84.00 81.00 88.00 88.001929 86.00 86.00 87.00 88.00 91.00 92.00 93.00 93.001930 85.00 80.00 74.00 73.00 75.00 76.00 68.00 63.001931 58.00 56.00 56.00 56.00 52.00 50.00 49.00 48.001932 38.00 36.00 31.00 37.00 37.00 37.00 34.00 31.001933 26.00 27.00 27.00 27.00 30.00 32.00 33.00 30.001934 26.00 27.00 28.00 29.00 29.00 28.00 27.00 24.001905 30.00 311.03 39.00 41.110 44.00 .44.50 43.110
- 41.001936 45.00 47.00 48.00 49.00 49.00 49.00 47.00 49.001937 51.00 50.00 52.00 54.00 54.00 52.00 12.00 55.001938 50.00 - 52.00 - 50.00 50.00 53.00 53.00 52.00 11.00
ESTIMATED PRICE OF FARM PRODUCTS RECEIVED BY COLORADO PRODUCERSAS OF TIlE 15TH OF TEE MONTH—Continued
LAMBS(Dollars per 100 pounds)
June July Aug. Sept. Oct. Nov. Dec.
5.304.605.805.706.107.309.00
15.5013.0012.8011.10
5.8011.0011.0011.8013.4011.8012.8012.0011.70
6.704.704.10 -
5.505.308.307.708.107.60
5.605.108.205.707.407.70
10.0035.7013.6013.208.206.00
11.0011.6012.2013.4011.7011.8032.1011.400.608.804.205.105.108.607.707.90
Sept Oct. Nov. Dec.
45.00 45.50 - 46.60 I 46.0048.30 47.00 49.00 49.7055.80 56.20 57.30 59.2067.00 69.00 66.60 - 60.7073.00 77.00 76.10 72.9073.50 74.10 78.50 [ 77.1075.20 72.70 75.00 80.0090.20 87.40 90.50 91.5093.00 90.00 97.80 92.0096.40 91.70 86.50 92.8087.00 85.00 82.00 65.5060.00 62.00 60.00 58.0059.00 55.00 53.00 56.0060.00 57.50 53.00 53.1056.50 53.00 51.00 48.0051.50 55.60 54.00 52.8058.00 56.00 59.00 63.0069.00 72.00 74.00 72.0093.00 92.00 - 89.00 84.0092.00 87.00 89.00 84.0064.00 62.00 61.00 59.0045.00 42.00 40.00 38.0031.00 27.00 28.00 27.003000 20.00 29.00 26.0027.00 . 28.50 28.00 29.11043.00 41.00 44.00 45.0051.50 52.00 52.00 50.0051.00 52.00 51.00 55.0051.00 53.00 52.00

112 AGRICULTURAL STATISTICS
ESTIMATED PRICE OF FARM PRODUCTS RECEIVED BY COLORADO PRODUCERSAS OF TBE 15TH OF THE MONTH—Continued
HORSES(Dollars per head)
Tear Jan. Feb. Mar. April May June July Aug. Sept Oct. Nov. Dee.
1910 134 125 136 139 112 133 128 128 125 122 125 1151911 129 120 125 125 122 130 115 121 129 111 115 1181912 105 110 115 118 119 119 117 118 123 115 124 1221913 122 118 122 122 119 120 115 112 116 105 101 1651014 110 168 101 98 102 102 110 105 105 105 108 1101915 111 120 118 114 116 112 114 163 110 120 125 1121916 115 114 119 115 118 113 115 118 119 112 120 1251917 123 121 125 126 125 136 119 126 126 136 126 1271918 137 135 135 134 129 125 124 126 122 124 121 1221019 124 124 123 121 128 120 111 120 109 115 105 1121920 105 125 117 112 112 106 110 119 103 104 95 801921 71 77 75 82 82 80 81 70 78 68 63 601922 67 72 72 78 78 80 78 74 67 67 53 521023 60 64 66 70 70 70 65 67 70 66 60 551024 54 55 57 55 60 50 60 60 62 58 60 551925 56 63 70 75 64 62 62 60 66 53 61 581926 68 67 67 72 71 75 60 71 61 61 59 611927 60 63 70 69 72 60 65 68 63 65 60 611928 60 61 60 63 51 65 65 62 61 61 61 551029 54 55 50 62 57 62 61 63 63 60 56 551030 55 54 55 57 53 54 46 48 47 46 44 491931 45 48 48 48 50 45 42 40 40 39 37 071932 37 37 40 42 42 42 41 39 39 37 07 551933 37 40 42 41 40 48 49 50 48 47 49 501934 01 12 07 15 50 55 54 54 55 58 56 581935 61 01 67 71 77 77 75 73 60 71 75 731936 77 82 87 88 84 88 85 79 I 80 52 85 881937 90 90 02 94 58 53 02 51 01 70 70 72
68 72 72 71 75 70 65 05 05 73 67 ——
CHICKENS(Cents per pound)
Year Jan. Feb. Mar. April May June July Aug. Sept. Oct. Nov. Dec.
1910 11.0 13.3 13.5 13.4 14.1 14.6 15.0 15.0 13.6 13.5 18.2 12.41911 12.8 13.2 13.1 12.5 12.4 13.1 15.8 14.0 13.7 13.4 12.3 12.01912 12.6 12.8 13.1 13.0 12.8 13.1 15.2 13.2 12.7 12.6 12.6 12.5
1913 13.0 13.1 13.2 11.1 12.4 12.8 15.4 14.1 13.0 12.2 11.9 12.01914 11.3 12.7 12.2 12.2 12.6 12.3 15.0 12.5 13.0 12.0 11.4 10.41915 12.0 11.9 12.3 12.1 12.6 13.2 10.8 11.7 10.6 15.4 12.2 11.41916 11.5 11.6 11.8 13.6 13.6 12.8 12.6 13.3 13.1 12.1 12.0 11.71017 12.7 15.2 14.0 15.0 16.3 17.2 14.6 15.5 16.5 17.7 15.5 16.01018 16.4 19.5 17.9 19.3 20.0 21.0 21.5 22.0 22.1 21.0 19.2 17.41010 17.6 18.0 20.5 22.5 24.0 22.5 23.0 25.0 33.0 22.0 20.0 20.03020 20.0 22.0 25.8 24.6 25.4 25.1 26.5 28.0 22.0 22.0 21.0 17.01021 10.0 10.0 20.0 20.0 19.0 19.0 21.0 21.0 18.0 17.0 17.0 16.01922 17.0 36.0 17.0 18.0 18.0 18.0 17.0 17.0 16.0 • 16.0 15.0 14.01023 15.7 15.0 16.1 16.0 16.0 16.0 19.1 18.0 17.0 17.4 15.5 14.61924 15.1 15.2 16.3 17.0 18.0 17.3 19.3 18.6 17.8 15.2 15.4 14.91925 16.3 14.8 17.8 16.9 17.0 18.4 10.0 20.1 07.8 16.8 17.6 17.21926 18.5 18.1 10.6 21.3 20.3 20.3 21.7 20.7 10.4 18.5 18.4 18.91027 18.4 19.2 18.6 20.4 19.7 17.4 19.0 18.5 19.0 18.3 18.4 18.01928 17.7 17.5 17.7 18.5 20.2 18.7 20.8 18.0 20.0 10.0 19.8 18.71029 18.7 19.3 19.4 19.9 20.6 21.2 21.0 21.0 20.2 18.8 18.4 16.01930 17.2 17.2 18.0 18.6 18.0 17.1 14.9 15.2 16.5 15.2 14.0 14.11931 13.8 13.2 14.1 14.9 13.8 13.3 14.6 14.0 13.5 12.8 12.9 12.01952 12.0 11.1 11.0 12.0 11.0 10.4 10.5 10.5 9.5 9.5 8.5 7.11033 7.7 8.1 7.6 8.3 9.3 9.2 0.0 8.2 7.8 8.2 7.5 7.11934 7.5 8.2 8.0 9.6 0.1 8.7 10.1 0.0 19.0 9.0 9.0 0.01935 10.0 11.0 12.0 14.0 14.0 15.3 13.4 14.1 14.7 14.8 15.0 14.91936 15.0 15.7 15.2 16.4 15.5 15.7 15.4 13.9 13.7 12.5 11.7 11.11937 12.2 11.7 12.7 14.0 13.4 13.7 13.6 15.5 14.6 14.4 13.6 13.61038_....... 13.8 13.6 13.8 14.9 15.4 14.4 14.0 14.1 13.4 13.0 12.0

STATE 01? COLORADO 113
ESTIMATED PRICE OF FARM PRODUCTS RECEIVED BY COLORADO PRODUCERSAS OF THE 15TH OF THE MONTH—Continued
BUflER(Cents per pound)
Year Jan. Feb. Mar. April May June July Aug. Sept. Oct. Nov. Dee.
1910 33 33 32 28 28 28 28 30 31 32 32 321911 92 28 27 26 24 24 24 26 27 28 30 821912 33 32 30 29 28 27 26 27 28 10 32 311913 31 301 30] 28 27 28 28 28 29 31 32 311914 31 301 28! 28 26 25 23 26 29 30 31 321915 32 30 28 27 26 26 24 I 26 26 28 29 301916 30 28 28 28 28 27 27! 28 30 32 34 361917 36 34 34 36 38 36 30 38 41 43 44 461918 46 45 44 42 40 40 40! 42 43 31 56 581919 58 50 46 52 51 48 33 52 54 57 62 661920 63 56 57 59 56 62 03 54 56 57 58 531921 46 42 40 40 34 27 29 34 40 42 891922 32 28’ 20 30 30 29 29’ 30 32 36 42 461921 45 44 44 42 41’ 40 38 181 41 43 45 451924 45 44 42 40 36 35 38 36 33 38 36 491625 40 35 37 36 37 57 38 40 ‘ 41 43 49 431926 50 41 40 42 40 41 39 39 42 42 43 461927 45 44 45 45 43 41 40 40 42 45 44 461928 47 45 45 45 43 43 42 43 44 46 46 471929 47 46 46 45 45 44 43 44 45 45 42 421930 38 37 37 37 39 33 31 37 40 38 37 331931 29 28 29 29 26 25 24 27 29 33 29 281932 23 22 22 20 19 19 18 20 20 20 21 221933 22 18 18 10 21 22 24 21 21 22 22 191934 10 23 23 23 22 23 21 26 27 27 30 301915 31 36 31 34 29 20 26 26 28 29 32 841936 34 34 31 32 27 30 34 34 36 33 33 341037 15 34 1 10 1.3 12 12 33 34 35 16 36 381918 39 32! 31 29 27 26 28 27 27 28 29 ——
EGGS(Cents per dozen)
Year Jan. Feb. Mar. April May June July Aug. Sept Oct Nov. Dec.
19101911191219131914191519161917191819191920192119221923192419251926192719281929193019311932193319341935193619371938
66 80 24 22 22 24 24 26 2834 28 22 18 18 18 20 22 2486 30 26 22 20 20 21 23 2532 27 22 17 15 17 19 21 2238 26 20 16 16 17 20 19 2432 24 18 16 15 17 17 20 2132 301 16 15 17 20 20 22, 2740 . 37 25 27 29 31 23 34 40461 49! 30 291 29 30 32 39l 4159 36 35 33 36 35 36 42 4560 i 45 38 36 37 35 39 47 5059 30 25 20 17 19 25 25 2534 29 19 17 22 19 19 21 2537 28 20 19 19 19 20 25 3139 33 18 19 20 21 23 26 3253 32 23 24 23 25 27 33 3336 27 21 23 23 23 25 27 3037 28 20 19 18 18 21 23 2839 26 22 20 22 22 24 28 3036 32 28 22 21 22 25 28 3135 33 20 20 19 18 18 20 2521 14 15.5 15.6 11.5 12.6 14.5 17.8 18.719.0 14.0 9.0 9.0 9.2 9.9 11.3 14.1 19.023.0 10.2 8.7 8.3 12.0 9.0 10.9 12.0 14.115.0 12.0 11.0 11.4 11.0 11.0 12.9 14.6 22.023.0 23.0 17.0 ! 18.0 20.2 21.2 22.0 24.0 20.022.2 22.6 16.4 15.9 17.8 18.2 20.0 23.4 26.325.5 22.3 18.3 18.9 ‘ 10.2 16.2 18.1 20.6 23.222.9 16.0 I 19.2 11.1 10.0 16.6 10.8 19.7 ‘ 22.6
31 38 8527 31 8629 33 8429 35 8724 30 , 8827 38 ‘ 8630 , 40 4540 45 5047 54 , 6253 62 7256 60 7238 48 ! 52
I 4837 46 4836 45 5137 50 4537 47 5036 43 4335 43 4837 46 4929 34 8223.0 28.0 31.022.0 26.0 28.020.4 24.2 24.126.0 10.0 29.929.0 33.7 31.529.0 34.0 32.026.0 29.4 ‘ 29.120.5 29.6

114 AGRICULTURAL STATISTICS
EST IMATED PRICE OF FARM PRODUCTS RECEIVED DY COLORADO PRODUCERSAS OF TilE 15TH OF THE MONTH
TURKEYS(Cents per pound)
Year Jan. Feb. Mar. Apr. May June July Aug. Sept. Oct. Nov. Dec.
1912 16.5 15.2 16.11913 16.4 16.0 16.5 15.01914 15.2 ..
15.5 14.2 14.21915 15.7 14.0 15.5 14.51916 14.7 11.6 17.0 18.01917 17.0 .
..18.0 21.0 22.0
1018 21.6 ..
21.7 21.5 23.61919 21.2 26.0 27.0 28.01920 26.0 ..
——_ 29.0 27.0 26.01920 26.0 24.0 25.0 26.0102° 21.0 21.0 21.0 25.01913 21.8 ..
23.2 26.0 16.91024 17.8 18.1 10.3 19.51025 2L1 19.3 26.6 27.11926 30.3 . 22.1 20.0 22.010 01.0 26.0 20.0 21.01028 27.0 26.0 30.0 27.01029 25.0 24.0 24.0 19.01010 20.0 21.0 18.0 10.01011 20.0 .
16.0 17.0 18.01022 17.0 .
12.0 12.0 10.01933 10.0 9.0 9.1 9.4 10.0 12.0 11.0 9.61934 10.0 0.8 11.0 11.0 10.0 10.0 18.0 9.0 10.0 12.0 13.0 15.01930 15.0 15.0 35.0 16.0 10.0 20.0 14.0 23.0 10.0 57.0 21.0 21.01026 20.0 19.0 18.0 18.0 18.0 10.0 16.0 15.0 16.0 16.0 15.0 14.01057 14.0 13.0 13.0 14.0 11.0 14.0 16.0 14.0 14.0 15.0 18.0 17.01938 16.0 16.0 15.0 10.0 16.0 16.0
JIUflEHFAT(Cents per pound)
Year Jan. Feb. Mnr. Apr. May June July Aug. Sept. Oct. Nov. Dec.
1920 —— —— —— —— —— -— —— —— -— 51 57 471921 43 36 41 29 26 23 28 28 24 38 40 361922 26 27 27 27 27 29 28 25 30 35 59 451023 45 43 42 44 57 24 54 35 58 42 48 501924 50 45 41 40 ( 20 35 27 31 51 50 52 381025 37 34 35 25 26 37 56 40 39 4.5 47 441026 41 38 59 38 15 56 34 34 57 41 43 441027 44 44 47 45 39 39 37 37 38 42 42 461028 46 44 46 44 42 42 40 40 44 45 46 481020 46 45 47 43 44 42 42 42 42 43 40 361920 30 21 35 55 24 27 27 32 18 33 31 311951 21 22 25 23 17 17 18 22 25 29 23 221932 17 15 18 13 12 11 11 26 10 16 16 191933 16 12 13 1.8 18 17 21 15 16 16 17 141934 14 20 21 19 18 20 20 22 22 23 28 271935 28 35 28 32 22 21 19 20 25 26 30 221036 31 32 28 28 25 20 32 34 53 39 30 311937 35 31 34 30 20 28 29 28 32 35 33 381018 30 27 26 23 22 20 22 21 21 22 20 ——
HAY (WILD)(Dollars per ton)
Year Jan. Feb. Mar. Apr. May June July Aug. Sept. Oct. Nov. Dec.
1922 12.00 12.80 13.30 13.00 15.50 13.20 11.00 10.00 0.10 10.10 9.20 9.902921 10.00 10.80 10.03 9.00 8.70 8.50 0.00 10.60 10.00 10.20 10.20 10.801926 11.00 12.00 12.70 11.20 . 12.20 11.70 11.50 12.20 12.50 12.50 8.50 11.101026 12.90 11.90 11.90 12.80 12.40 10.70 9.10 12.00 12.00 11.00 10.20 11.001027 10.00 10.50 9.00 9.00 0.00 8.50 8.00 8.00 9.00 8.50 9.09 9.001028 9.50 8.70 9.00 8.70 10.00 10.00 9.50 9.00 9.20 11.60 10.70 10.701920 10.70 11.10 12.10 12.10 12.10 12.10 13.10 11.00 10.00 10.10 10.20 10.201930 18.20 9.10 0.00 8.50 8.00 9.00 8.00 0.80 8.70 7.09 9.30 8.301921 8 :80 7.70 7.00 0.30 7.00 6.90 7.60 7.60 7.00 7.00 7.00 7.201022 7.50 7.70 8.00 8.10 8.00 7.30 7.30 6.50 6.40 6.49 5.50 5.601923 5.70 5.00 1.00 5.50 6.40 6.00 6.40 6.20 8.10 6.00 5.60 5.301924 1.20 5.10 5.20 9.50 5.10 5.00 6.50 9.40 12.20 12.00 12.20 12.603955 12.40 22.20 32.50 11.00 16.50 15.00 11.80 8.00 6.70 6.30 7.00 7.003926 6.50 6.20 6.40 6.00 0.70 5.50 6.50 8.30 8.70 8.90 8.00 7.401937 8.00 7.90 7.50 7.20 7.70 7.10 7.30 8.40 7.50 7.50 7.50 7.101938 6.80 6.40 7.50 8.00 7.70 7.50 7.00 6.20 6.00 6.20 6.70
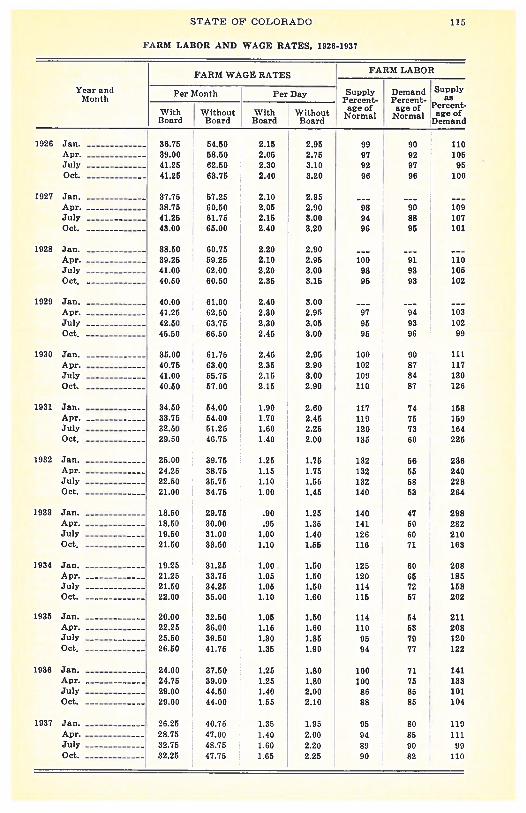
STATE OF COLORADO
FARM LABOR AND WAGE RATES, 1926-1937
115
FARM WAGE RATESFARM LABOR
Year and Per Month Per Day Supply Demand SupplyMonth Percent- Percent-
With Without With Without NorrnalP:rcent
Board Board Board Board Demand
1926 Jan. 16.76 54.60 2.15 2.95 00 90 110Apr. 99.00 58.10 2.05 2.75 97 92 105July 41.25 62.10 2.10 3.10 92 97 91Oct. 41.25 63.75 2.40 1.20 90 96 100
1927 Jan. 37.75 57.25 2.10 2.95Apr. 38.75 60.50 2.05 2.10 98 90 109July 41.25 61.75 2.15 3.00 94 88 107Oct. 43.00 05.00 ] 2.40 3.20 96 95 101
1928 Jan. 38.50 60.75 2.20 2.90 _
Apr. 39.25 59.25 2.10 2.95 100 91 110July 41.00 62.00 2.20 3.00 93 93 105Oct. 40.50 60.50 2.35 3.15 95 93 102
1929 Jan. 40.00 61.00 2.40 3.00Apr. 41.25 02.50 2.30 2.95 97 94 103July 42.50 63.75 2.30 3.05 95 93 102Oct 45.50 06.50 2.45 3.00 95 96 99
1930 Jan. 35.00 61.75 2.45 2.95 100 90 111Apr. 40.75 63.00 2.35 : 2.90 102 87 117July 41.00 55.75 2.15 3.00 109 84 130Oct. 40.50 57.00 2.15 2.90 110 87 126
1931 Jan. 34.50 54.00 1.90 2.60 117 74 118Apr. 33.75 54.00 1.70 2.45 110 75 159July 32.50 51.25 1.60 2.25 120 73 164Oct 29.50 40.75 1.40 2.00 115 60 225
1932 Jan. 25.00 39.75 1.25 1.75 132 56 236Apr. 24.25 38.75 1.15 1.75 132 55 240July 22.50 35.75 1.10 1.55 132 58 228Oct. 21.00 34.75 1.00 1.45 140 53 264
1930 Jan. 18.50 29.75 .00 1.25 140 47 298Apr. 18.50 30.00 .95 1.35 141 50 282July 19.50 31.00 1.00 1.40 126 60 210Oct. 21.50 33.50 ; 1.10 1.55 116 71 163
1934 Jan. 19.21 31.25 1.00 1.50 125 60 208Apr. 21.25 33.75 1.05 1.50 120 65 185July 21.50 34.25 1.05 1.50 114 72 158Oct. 22.00 35.00 1.10 1.60 115 5? 202
1935 Jan. 20.00 32.50 1.05 1.50 114 54 211Apr. 22.25 36.00 1.15 1.60 110 53 208July 25.50 39.50 1.30 1.85 95 79 120Oct 26.50 41.75 1.35 1.90 94 77 122
1936 Jan. 24.00 37.50 1.25 1.80 fl9 71 141Apr. 24.75 39.00 1.25 1.80 100 75 133July 29.00 44.50 1.40 2.00 80 85 i 101Oct. 20.00 44.00 . 1.55 2.10 88 85 104
1937 Jan. 26.25 40.75 0.35 1.95 05 80 119Apr. 28.75 47.00 1.40 2.00 04 85 111July 32.75 48.75 1.60 2.20 89 90 90Oct. 32.25 47.75 1.65 2.25 tO 82 110

110 AGRICULTURAL STATISTICS
HORSES AND COLTS (ON FARMS), 1880-1938(Estimated Number and Value January 1)
COLORADO i UNITED STATES
Tear Number Farm Value Number Farm ValuePer Head Tutal i Per Head Tutal
1880 44,080 [ $ 54.00 $ 2,376,000 10,903,000 $ 53.74 $ 585,910,0001881 60,000 56.00 3,360,000 11,187,000 57.91 647,847,0001882 75,000 59.00 4,425,000 11,444,000 58.71 672,354,0001883 88,000 62.00 5,450,000 11,794,000 09.92 824,580,0001684 110,000 68.00 7,260,000 12,215,000 73.80 901,434,000
1881 138,000 56.00 7,728,000 12,700,000 72.94 926,398,0001886 157,000 59.00 9,201,000 11,276,000 70.02 017,002,0001887 170,000 58.00 9,860,000 13,821,000 71.59 089,480,0001888 180,000 58.00 10,440,000 14,490,000 72.03 1,043,687,0001889 188,000 61.00 11,468,000 15,064,000 72.39 1,090,454,000
1890 195,000 55.00 10,725,000 15,732,000 69.27 1,089,794,0001891 200,000 54.00 10,800,000 16,329,000 67.19 1,007,153,0001092 205,000 52.00 10,660,000 16,046,000 64.56 1,087,578,0001893 210,000 44.00 0,240,000 17.280,000 00.72 1,040,710,0001894 215,000 30.00 6,450,000 17,700,000 46.63 825,805,000
1095 220,000 20.00 4,400,000 17,849,000 35.57 634,921,0001896 221,000 22.00 4,862,000 17,870,000 32.34 570,160,0001897 I 222,000 20.00 4,440,000 17,803,000 30.92 550,435,0001898 223,000 23.00 5.129,000 17,098,000 83.35 590,304,0001899 225,000 25.00 5,625,000 17,720,000 36.61 640,977,000
1900 227,000 20.00 6,356,000 17,056,000 43.56 777,843,0001901 230,000 33,00 7,590,000 17,955,000 53.03 952,084,0001902 235,000 40.00 0,400,000 17,968,000 10.02 1,051,452,0001903 234,000 38.00 0,802,000 10,121,000 62.27 1,120,470,0001904 232,000 42.00 9,744,000 18,331,000 67.59 1,230,957,000
1905 230,000 42.00 9,600,000 18,491,000 09.73 1,289,291,0001906 235,000 54.00 12,600,000 10,800,000 79.77 1,500,114,0001907 248,000 00.00 10,368,000 19,090,000 92.85 1,772,596,0001908 260,000 71.00 18,460,000 19,444,000 92.70 1,803,687,0001909 200,000 72.00 20,100,000 10,731,000 95.13 1,870,920,000
1910 300,000 05.00 25,500,000 19,972,000 107.70 2,050,950,0001911 315,000 09.00 28,035,000 20,418,000 111.11 2,209,677,000
1912 320,000 00.00 25,600,000 20,726,000 105.30 2,108,308,000
1913 325,000 67.00 28,275,000 21,008,000 110.58 2,028,083,000
1914_- 330,000 03.00 27,390,000 21,308,000 109.27 2,328,201,000
1915 345,000 85.00 20,325,000 21,431,000 103.23 2,212,399,0001916 365,000 90.00 32,850,000 21,334,000 101.45 2,164,300,00019 395,000 93.00 30.733,000 20,306,000 102.04 2,186,800,0051918 440,000 97.00 42,680,000 21,238,000 103.97 2,208,056,0001010 440,000 01.00 40,040,000 20,022,000 07.94 2,049,051,000
1920 421,000 79.00 33,375,000 20,091,000 96.45 ‘ 1,937.859,0001920 421,000 63.00 20,612,000 10,369,000 84.48 1,036,297,0001922 415,000 50.00 23,133,000 18,704,000 71.01 1,332,508,0001923 400,000 40.00 19,229,000 38,125,000 70.49 1,277,619,0001924 305,000 45.00 17,248,000 17,378,000 05.39 1,136,311,000
1925 ‘ 307,000 43.00 15,781,000 10,051,000 64.28 1,070,336,0001926 300,000 47.00 16,920,000 16,083,000 65.31 1,050,367,000
1927 F 846,000 44.00 15,224,000 15,388,000 63.73 000,645,0001928 343,000 43.00 14,749,000 14,792,000 66.71 086,783,000
1929 343,000 47.00 16,121,000 14,234,000 60.60 991,869,000
1930 330,000 44.00 14,872,000 13,742,000 69.98 961,664,0001931 331,000 41.00 13,571,000 13,195,000 60.64 000,198,0001932 324,000 34.00 11,016,000 12,064,000 53.48 677,211,0006933 318,000 31.00 9,858,000 12,291,000 54.12 660,118,6001934 297,000 41.00 12,062,000 12,052,000 66.88 805,994,000
1935 278,000 F 51.00 14,174,000 F 11,861,009 77.05 913,870,0001936 264,000 69.00 18,286,000 11,635,000 96.82 I 1,126,457,00019 259,000 76,00 19,623.000 11,445,000 09.16 1,124,012,0001988 254,000 68.00 17,175,000 11,103,000 90.81 1,013,060,000

STATE OF COLORADO 117
MULES AND MULE COLTS (ON FARMS), 1880-1930
(Estimated Number and Value January 1)
COLORADO UNITED STATEs - -
Year Farm Value Farm Value
Number , NumberPer Head total I Per Head I Total
1880 3,000 $ 72.00 $ 216,000 1,873,000 $ 61.74 $ 115051,000
1881 4,000 78.00 312,000 1,912,000 68.84 131,630000
1882 4,000 84.00 336,000 1,920,000 71.69 138,223,000
1883 4,000 90.00 060,000 1,975,000 77.79 153,626,000
1884 4,000 94.00 376,000 2,047,000 83.53 170,984,000
1885 4,000 75.00 300,000 2,102,000 81.88 172,112.000
1686 6,000 80.00 400,000 2,162,000 78.96 170,712,000
1887 5,000 84.00 420,000 2,213,000 78.39 173,467,000
1833 6,000 92.00 552,000 2,260,000 79.06 178,666,000
1889 6,000 95.00 570,000 2,295,000 78.96 181,191,000
1890 6,000 87.00 622,000 2,322,000 77.61 180,200,000
1891 6,000 84.00 504,000 2,377,000 76.93 182,854,000
1892 6,000 80.00 480,000 2,459,000 74.31 182,737,000
1893 7,000 71.00 497,000 2,550,000 69.18 176,405,000
1894 7,000 61.00 427,000 2,612,000 60.65 159,635,000
1896 7,000 57.00 399,000 2,708,000 47.23 127,899,000
1896 7,000 46.00 322,000 2,782,000 44.08 122,632,000
1897 7,000 43.00 301,000 2,836,000 40.49 114.840,000
1898 8,000 43.00 344,000 2,918,000 42.31 123,461,000
5899 8,000 44.00 352,000 3,012,000 43.52 131,081,000
1900 8,000 47.00 376,000 3,139,000 51.46 161,524,000
1901 8,000 47.00 376,000 3,190,000 63.47 202,480,000
1902 8,000 54.00 432,000 3,264,000 67.23 210,427,000
1903 9,000 55.00 495,000 3,353,000 71.73 240,524,000
1904 9,000 58.00 022,000 3,465,000 78.02 270,350,000
1905 9,000 63.00 567,000 3,586,000 87.06 312,188,000
1906 9,000 74.00 666,000 3,680,000 97.75 359,719,000
1907 10,000 92.00 920,000 3,814,000 113.46 425,112,000
1908 12,000 95.00 1,140,000 3,949,000 107.81 425,732,000
1909 13.000 95.00 1,235,000 4,005,000 108.20 442,014,000
1910 15,000 j 105.00 1,575,000 4,239,000 119.98 508,599,000
1911 19,000 105.00 I 1,995,000 4,429,000 125.73 556,865,000
1912 19,000 100.00 1,900,000 4,551,000 120.33 547,625,000
1913 20,000 104.00 2,080,000 4,683,000 124.10 581,161,000
1914 23,000 101.00 2,323,000 4,870,000 123.47 601,282,000
1915 26,000 100.00 2,600,000 5,062,000 112.19 167,891,000
1916 29,000 101.00 2,929,000 5,200,000 113.78 591,058,000
1917 51,000 104.00 3,224,000 5,353,000 018.45 634,073,000
1918 32,000 108.00 3.456.000 5,485,000 120.97 707,381,000
1919 32,000 107.00 3.424,000 5,568,000 135.58 754,927,000
1920 31,000 102.00 3,170,000 5,651,000 148.29 837,990,000
1921 32,000 91.00 2,912,000 5,768,000 117.37 676,970,000
1922 34,000 70.00 2,380,000 5,024,000 80.99 010,300,000
1920 36,000 62.00 2,228,000 5,093,000 86.87 611,919,000
1024 38,000 61.00 2,314,000 5,907,000 85.89 507,345,000
1925 38,000 57.00 2,166,000 5,918,000 82.91 490,668,000
1926 37,000 59.00 2,183,000 5,903,000 81.50 481,150,000
1927 35,000 55.00 1,925,000 5,804,000 74.51 432,434,000
1928 32,000 55.00 1,792,000 5,656,000 79.84 451,550,000
1929 81,000 58.00 1,798,000 5,510,000 82.45 454,300,000
1930 30,000 57.00 1,710,000 5,382,000 83.93 451,725,000
1931 I 20,000 52.00 1,406,000 5,273.000 69.23 365,049,000
1902 26,000 42.00 1,002,000 5,148,000 60.70 312,194,000
1933 24,000 39.00 936,000 5,046,000 60.42 304,895,000
1934 22,000 54.00 1,196,000 4,946,000 82.42 407,566,000
1935 19,000 66.00 1,263,000 4.822,000 99.34 478,098,000
1936 17,000 87.00 1,479,000 ‘1,004,000 120.36 563,781,000
1937 17,000 96.00 1,625,000 4,571000 129.03 093,098,000
1038 36,000 85.09 1,365,000 4,477,000 122.13 548,121,000

118 ACi11ICULTURAL STATISTICS
ALL CATTLE AND CALVES (ON FARMS), 1880-1931(Estimated Number and Value January 1)
COLORADO UNITED STATESYear Farm Value Farm ValueNumberPer Head Total
- j NumberPer Head I Total
$1980 809,000 $ 14.30 11,551,000 49,347,000 $ 17.80 $ 771,600,0001881 813,000 16.30 13,283,000 44,501,000 18.67 830,723,0001882 827,000 20.50 16,956,000 45,738.000 20.93 957,447,0001883 963,000 27.30 26,328,000 47,387,000 23.87 1,131,307,0001884 1,141,600 26.90 30,687,000 49,804,000 28.26 1,257,018,0003881 1,240,000 27.30 13,828,000 52,463,000 24.40 3,279,915,0001886 1,380,003 26.20 34,000,300 54,868,000 22.20 1,216,024,0001887 1,340,000 22.70 30,427,000 56,602,000 21.10 1,198,551,0001988 1,310,000 20.30 27,696,000 58,899,000 19.39 1,136,378,000lOS’J 1,295,000 20.60 26,620,000 59,178,000 18.77 1,110,866,000isoo 1,176,000 17.40 20,305,003 60,014,000 16.95 1,017,030,0001801 1,119,000 16.40 18,317,000 19,968,000 16.49 988,740,0001692 1,064,000 17.00 18,098,000 58,126,000 10.81 977,013,0001893 1,012,000 17.40 17,619,000 15,119,080 17.00 936,962,0001804 942,000 18.00 35,057,000 61,713,000 16.84 878,821,0001891 925,000 14.00 12,907,000 43,510,000 16.36 810,072,0001836 140,000 17.70 16,689,000 49,205,000 17.86 878,608,0001897 985,000 20.00 19,279,000 50,447,000 18.62 939,407,0001898 991,000 26.60 26,326,000 02,868,030 22.79 1,204,813,0001899 1,111,000 26.40 29,278,000 35,927,000 24.33 1,371,882,0001900 1,223,000 28.30 34,600,030 19,738,830 28.50 1,183,340,0031901 1,380,000 23.70 35,492,000 62,576,000 22.68 1,418,108,0001902 1,110,000 23.10 30,430,000 64,418,000 21.48 1,383,447,0001903 1,480,000 20.00 29,140,000 88,084,800 21.11 1,422,436,0081984 1,461,000 17.30 25,330,000 06,442,800 19.89 1,308,204,0001901 3,462,000 18.40 20.885.090 66,111,900 18.39 1,211,610,0001906 1,431.000 18.90 27,101,000 63,009,000 19.65 1,277,094,0001907 1,370,000 21.30 29,160,000 03,704,800 20.91 1,333,282,0001908 1,292,000 21.50 27,778,000 61,989,000 20.92 1,296,902,0031909 1,211,000 21.10 20,534,000 60,774,000 22.00 1,340,184,0001910 1,102,000 20.10 27,834,050 58,993,000 24.54 1,447,681,0001911 1.107,000 27.10 30,011,080 57,223,000 27.22 1,517,803,0001912 1,005,000 30.00 32,184,000 55,073,000 27.68 1,141,274,0001913 I 1,221,000 i 36.40 44,550,000 30,092,000 33.07 1,871,331,0001914 1,360,000 42.70 18,126,000 59,461,000 38.97 2,317,213,0001911 1,084,000 46.30 72,478,000 63,849,000 40.67 2,098,062,0001910 1,601,000 48.10 77,029,000 67,438,800 41.08 2,770,364,0031917 1,745,000 48.20 84,161,000 70,970,000 43.34 3,070,202,0061930 1,861,000 04.00 100.740,000 73,040,030 10.01 3,632,908,0001919 1,081,000 58.50 109,987,000 72,094,000 54.63 3,933,590,0001920 1,757,000 41.70 87,323,003 70,403,000 52.64 3,706,171,0301921 1,683,000 36.93 02,103,000 ] 68,714,000 39.07 2,681,989,0031922 1,680,000 29.43 49,392,000 68,795,000 30.39 2,093,487,0001923 1,614,030 28.30 41,676,000 07,146,000 31.66 2,138,772,0001924 3,540,000 27.70 42,058,000 65,990,000 32.11 2,119,141,0001921 1,405,000 26.00 38,010,000 63,373,000 31.72 2,009.936,0001926 1,408,000 32.00 44,992,000 60,576,000 36.80 2,229,080,0001927 1,400,000 36.20 50,897,000 58,178,000 99.98 2,321,808,0081028 1,077,030 46.70 64,300,000 07,322,000 50.03 2,902,237,0001929 1,421,000 55.30 78,581,000 58,877,000 18.47 3,442,702,0301930 1,404,000 50.90 74,009,000 61,003,000 06.36 3.430,056,0001931 1,041,003 37.80 58,250,000 63,030,000 38.39 2,407,499,0001932 1,550,000 22.50 34,988,000 65,770.000 26.40 1,736.010,0001933 3,614,000 I 16.10 25,985,000 70,214,000 19.74 1,386,107,0001934 1,773,000 14.50 25,760,000 74,262,000 17.78 1,320,340,0001935 3,590,000 16.33 25,914,000 68,529,000 20.22 1,385,948,0001936 1,510,030 30.30 45,720,000 07,929,803 34.03 3,315,847,00019 1,370,000 32.20 50,179,000 66,448.000 31.07 2,264,168,0001938 1,554,000 31.00 48,987,000 61,930,003 38.04 2,410,090,000

STATE OF COLORADO11J
COWS AND HEIFERS, 2 YEARS OLD AND OLDER, KEPT FOR MILK
(ON FARMS). 1880-1938
(Estimated Number and Value January 1)
COLORADO CNITED STATES
Year ,Farm Value
Farm Value
Is umber —
,Number
Per Head ‘total i Per Head iota1
S1880 25,000 $ 23.00 575,000 11,154,000 $ 23.31 $ 278,958,000
1881 25,000 27.00 615,000 11,977,000 23.82 285,242,000
1882 26,000 36.00 936,000 12,234,000 26.12 319,503,000
1881 27,000 39.10 1,056,000 32,571,000 00.47 883,015,000
1884 32,000 40.60 1,299,000 32,883,000 31.58 406,781,000
1885 36,000 40.00 1,440,000 13,213,000 29.88 594,834,000
1886 40,000 40.70 1,628,000 13,478,000 21.52 370,898,000
1887 43,000 38.00 1,634,000 13,888,000 26.23 864,274,000
1888 48,000 37.20 1,186,000 14,850,000 24.82 356,166,000
1889 50,000 84.40 1,720,000 14,706,000 24.03 353,333,000
1890 55,000 30.40 1,672.000 15,000,000 22.30 834,563,000
1891 55,100 28,10 1,546,000 15,133,000 21.73 328,800,000
1892 57,000 26.00 1,482,000 15,177,000 21.53 326.691,000
1893 60,000 25.50 1,530,000 15,164,000 21.90 832,073,000
1894 60,000 23.10 1,386.000 15.237.000 21.86 333,067,000
1895 61,000 23.10 1,409.000 15,230,000 22.11 316,775,000
1896 03,000 26.00 1,575,000 15,206,000 22.53 143,881,000
1897 70,000 26.10 1,827.000 15,382,000 23.08 354,982,000
1898 72,000 32.50 2,340.000 15,641,000 27.34 427,007,000
1899 78,000 35.00 2.730,000 16,094,000 29.46 474,082,000
1900 85,000 36.20 3,077,000 16,844,000 31.30 517,811,000
1901 91,000 05.90 3,267,000 16,708,000 29.88 409,212,000
1902 93,000 35.10 3,264,000 16,992,000 29.08 494,104,000
1903 100,000 83.20 3,320,000 17,217,000 30.06 517,476,000
1904 100,000 30.10 3,010,000 17.485,000 29.00 507.057,000
1905 100,000 30.50 3,050,000 17,823,000 27.19 484,508,000
1906 104,000 30.80 3,203,000 18,230,000 29.34 534,938.000
1907 110,000 36.00 3,960,000 18,629.000 30.63 570,566,000
1908 114,000 37.00 4,218,000 18,992,000 80.48 578,910,000
1909 120,000 35.50 4,260,000 19,201,000 32.09 616,118,000
1910 126,000 41.00 5,166,000 19.450,000 05.40 688,609,000
1913 130,000 44.50 5,785,000 19.422,000 40.07 I 778,331,000
1912 136,000 47.00 6,392,000 19.517.000 39.42 I 769,340,000
1913 141,000 53.80 7,586,000 19,580,000 45.04 881,791.000
1914 162,000 63.00 10,206,000 19,821,000 53.91 1,068,518,000
1915 170,000 68.00 11,560,000 20,270,000 1 55.30 [ 1,120,867,000
1916 195,000 72.00 14.040,000 20,752,000 53.81 1,116,707,000
1917 214,000 73.50 35,729,009 21,212,000 59.51 1,262,367,000
3918 224,000 82.00 18,368,000 21.537.000 70.63 1,521,072,000
1919 228,000 88.00 20.064,000 21.546,000 78.37 1,688,429,000
1920 230,000 86.00 19,780,000 21,455.000 81.51 1,748,020,000
1921 234,000 69.00 I 16,146,000 21,456,000 61.19 1,312,852,000
1922 240,000 56.00 13,440.000 21,851,000 48.68 [ 1,063,609,000
1920 245,000 52.00 12,740,000 22.138,000 48.65 1,077,117,000
1924 250.000 49.00 12,250,000 22,331,000 49.91 1,114,689,000
1925 256,000 44.00 11,264,000 22,575,000 48.34 1,091,249,000
1026 216,000 49.00 12,544,000 22,410,000 54.65 1,224,595,000
1927 257,000 56.00 14,392.000 22,251,000 59.15 1,316,226,000
1928 257,000 69.00 17,733,000 22,231,000 73.08 1,631,270,000
1929 258,000 77.00 19.866,000 22,440,000 I 83.89 1,882,558,000
1930 259,000 72.00 18.648,000 23,032,000 82.70 1,904,794,000
1931 260,000 56.00 14,560,000 23,820,000 57.03 1,358,529,000
1932 266,000 36.00 9,576,000 24,896,000 39.51 983,671,000
1931 280,000 25.00 7,000,000 25.930,000 29.18 716,846,000
1934 I 300,000 22.00 6,600,000 26,931,000 27.00 727,039,000
1935 270,000 25.00 6,750,000 26,069,000 30.17 786,012,000
1936_. 24S,000 12.00 10,410,000 25,439,000 40.27 1,253,427,000
l937_ 253,000 16.00 11,618,000 24,901,000 90.39 1,219,207,000
1038 245,000 40.00 11,270,000 24,902,000 54.45 1,355,926,005

AGRICULTURAL STATISTICS
Year Fa Value-
- - —NumberPer Head Total
1880 1,256,000 $ 2.00 $ 2,512,000ISS1 j 1,317,000 2.10 2,766,0001882 1,383,000 2.20 8,043,0001883 1,424,000 2.20 3,133,0001884 1,353,000 2.15 2,909,0001885 1,285,000 1.85 2,377,0001880 I 1,221,000 1.75 2,137,0001887 1,160,000 1.60 1,856,0001688 1,102,000 2.00 2,204,0001989 1,036,000 2.25 2,831,0001890 974,000 2.10 2,045,0001801 940,000 2.35 2,230,0003892 949,000 2.10 2,372,0001893 949,000 2.50 2,572,0009894 996,000 1.85 1,641,000
1695 1,006,000 1.50 1,505,0001896 1,016,000 1.70 1,727,0001897 1,140,000 1.75 1,095,0001898 1,290,000 2.49 3,000,0001899 1,312,000 2.70 5,542,0001900 1,430,000 2.85 4,076,0001901 1,468,000 2.95 4,331,0001902 1,532,000 2.65 4,007,0001903 1,480,000 2.20 3,256,0001904 1,450,000 2.25 3,262,0001905 1,250,000 2.70 3,575,0001906 1,172,000 3.60 4,219,0001907 1,255,000 3.55 4,455,0001908 1,294,000 3.30 4.335,0001909 1,332,000 3.10 4,129,0001910 1,435,000 3.80 5,433,0001911 1,495,000 3.60 5,382,0001912 1,250,000 3.00 3,750,0001918 1,520,000 3.60 4,752,0001914 1,300,000 3.70 4,810,0001915 1,345,000 4.40 5,916,0001916 1,520,000 5.20 6,864,0001017 1,260,000 7.50 9,450,0001918 1,350,000 12.60 17,010,0001919 1,200,000 10.90 13,080,0001920 989,000 10.40 10,286,0001921 885,000 6.50 4,872,0001922 808,000 4.90 3,955,0001923 949,000 7.90 7,535,0001924 927,000 8.00 7,394,0901925 565,000 10.50 10,100,0001926 1,090,000 11.20 12,182,0001027 1,281,000 10.10 12,888,0001928 1,440,000 10.70 15,404,0001929 1,598,000 11.50 16,307.000
1930 1,715,000 9.40 16,046,0001931 1,801,000 6.00 10,861,0001932 1,801,000 3.30 5,901,0001933 1,698,000 2.90 4,910,0001934 1,778,000 4.45 7,041,0001935 r
1,671,000 4.95 8,260,0001036 1,654,000 6.80 11,196,0001937 1,737,000 6.40 11,016.000lOIS 1,720,000 0.10 10,571,000
UNITED STATES
Farm ValueNumber
Per Head Total
44,867,000 1 $ 2.18 $ 97,024,00047,371,000 2.55 111,173,00048,883,000 2.35 114,852.60050,935,000 2.55 128,959,00051,101,000 2.40 122,824,00049.620,000 2.19 108,007,00046,054,000 1.95 51,059,00044,217,000 2.05 00,705,00043,011,000 2.06 88,765,00042,865,000 2.14 90,785,00042.693,000 2.29 97,041,00043,882,000 2.51 110,348.00044,628,000 2.60 110,057,00044,567.000 2.64 117,840,00043,414,000 1.97 85.610,00041,827,009 1.57 65,800.00039,609,000 1.71 67,915,00058,891,000 1.84 71,507,00040,097,000 2.51 100,780,00042,688,000 2.80 119,552,00045,065,000 2.97 134,046,00046,126,000 2.96 136,935,00046,105,000 2.62 521,904,00044,436.000 2.62 110,548,00041,908,000 2.55 106,961,00040,410,000 2.77 111,562,00041,965,000 3.51 147,502,00043,400,000 3.81 165,371,00045,095,000 3.67 174,050,00047,098,000 8.42 161,192,00046,939,000 4.06 150,465,00046.055,000 3.83 176,481,00042,972,000 3.42 147,118,00040,544,000 3.87 156,949,00038,059,000 0.91 148,745,00836,263,000 4.39 159,146,00036,260,000 5.10 184,856,00035,246,000 7.06 248,017,00036,704,000 11.76 431.679,00038.360,000 11.49 440,730,00037,328,000 10.59 395,285,00035,426,000 0.34 224,454,00033,365,000 4.79 159,839,00032,697,000 7.50 244,452,00032,059,000 7.94 260,819,00034,469,000 9.63 331,971,00035,719,000 10.53 376,134,00038,067.000 9.79 372,784,00040,689,000 10.36 421,582,00043,481,000 10.71 465,609,00043,577,000 9.00 410,290,00047,720,000 5.40 257,742,00047,754,000 3.45 164,628,00047,324,000 2.91 137,786,00048,454,000 3.77 182,654,00046,634,000 4.33 201,889,00046,391,000 6.34 294,261.00047,051,000 6.03 2S1.S28.00046,197,000 6.14 2S7.301,6t0
STOCOC SUEEP AND LAMBS (ON FARMS) 1880-1938(Excluding Sheep and Lambs on Feed)(Estimated Number and Value January 1)
COLORADO

STATE OF COLORADO 121
ESTIMATED NUMBER OF SHEEP AND LAMBS ON FEED JANUARY 1
Colorado Per cent of Total Unitedear Number In United States Nub5r
1914 1,300,0001915 1,116,0001916 1,150,0001917 1,250,0001918 1,135,0001919 940,0001920 950,0001921 1,283,0001922 1,040,0001923 1,500,000 34.5% 4,351,0001924 1,400,000 32.6% 4,297,0001925 1,600,000 39.7% 4,028,000
1926 1,475,000 31.7% 4,646,000
1927 770,000 18.0% 4,2S4,000
1928 1,580,000 35.2% 4,488,0001929 1,520,000 31.5% 4,822,000
1930 2,035,000 34.6% 5,886,0001931 1,550,000 28.6% 5,428,0001932 1,590,000 25.8% 6,160,0001932 1,400,000 24.6% 5,701,000
1934 1,250,000 24.0% 5,214,0001935 1,085,000 19.5% 5,561,000
1936 1,250,000 22.4% 5,581,0001937 1,030,000 18.8% 5,487,000
1938 1,195,000 19.7% 6,066,000
Note—United States estimates were not made prior to Jan. 1, 1923.
ESTIMATED NUMBER OF SHEEP AND LAMBS ON FEED JANUARY 1 OF EACH YEAR
—BY SECTIONS
MiscelYear Northern Arkansas San Luis Western laneous State
Colorado Valley Valley Slope Sections Total
1922 760,000 225,000 30,000 25,000 1,040,0001923 1,175,000 235,000 65,000 25,000 1,500,0001924 1,150,000 170,000 55,000 25,000 1,400,0001925 1,250,000 265,000 60,000 25,000 1,600,0001926 1,090,000 285,000 75,000 25,000 1,475,0001927 520,000 177,000 54,000 19,000 770,0001928 1,265,000 275,000 30,000 10,000 1,580,000
1929 1,100,000 385,000 22,000 13,000 1,520,0001930 1,490,000 475,000 45,000 25,000 2,035,0001931 975,000 360,000 90,000 80,000 45,000 1,550,0001932 1,100,000 375,000 50,000 25,000 40,000 1,590,0001933 955,000 330,000 65,000 40,000 10,000 1,400,0001934 835,000 300,000 60,000 40,000 15,000 1,250,0001935 840,000 200,000 10,000 30,000 5,000 1,085,0001936 980,000 180,000 45,000 35,000 10,000 1,250,0001937 750,000 175,000 45,000 45,000 15,000 1,030,0001938 890,000 200,000 40,000 55,000 10,000 1,195,000

133 AG1IIL’IJLTLJRAL STATISTILS
CATTLE ON GRAIN FEED FOR MARKET (ESTIMATED NUMBER JANUARY 1)(By Sections of the State)
Northern Arkansas Westeco { Other Statelear Colorado Valley Slope i Sections Total
! Nombor Nomber Number Number Number
1926 i 120,000 12,000 4,000 4,000 140,0001929 120,000 13,000 3,000 4,000 140,0003930 101,000 14,000 3,000 3,000 121,0001931 121,000 9,000 3,000 1,000 142,0001032 70,000 0.000 2.000 1,000 90,0001013 01,000 1,000 1,000 2,000 71,0001911 81,000 1,000 1,000 3,000 90,0001921 7 00,000 3,100 2,000 1,100 87.0001016 . 110,000 6,000 3,000 2,000 121,000I 9%7.. -- , 130,000 8,000 4,009 3,000 145,0001030 .
.. 130,000 0,000 3,100 1,100 143,000
CATTLE AND CALVES (CONDITION IN PERCENT OF NORMAL FIRST OF MONTH)
July Aog. Sept. Oct. Nov. Dcc.Year . Jan. Feb. . March April May June
1022- — 92 96 96 91 81 01 90 901924. . 06 90 101 90 94 02 92 911922 91 00 92 91 03 91 91 931020 98 97 98 90 91 93 100 1001027 97 90 99 98 07 92 02 971028 93 100 00 100 90 99 101 1001929 93 91 01 90 89 91 00 921930 91 93 94 95 90 94 91 911931 91 92 93 91 91 91 91 051932 02 79 00 78 76 01 84 041833 01 81 80 80 78 81 04 011934 81 85 83 82 07 84 77 701939 2 71 71 71 08 71 02 811930 85 80 84 84 81 87 87 821937 80 83 83 83 83 83 87 861938 83 84 83 81 84 87 89 90
Av. 1923-1938 89.0 89.0 89.2 88.4 87.0 88.5 80.8 89.3
104 10190 9207 Os98 9709 0000 0391 9694 9685 8582 8083 8070 7081 8160 8603 8590 91
80.9 90.1
080397
lOq
96938480846985889401
89.8
37349897
1000593928281847388878488
89.6
SIIEEP AND LAMBS (CONDITION IN PERCENT OF NORMAL FIRST OF MONTH)
1923 94 08 081924 98 08 1011923 07 03 931026 03 97 0810 07 00 901928 99 99 091020 01 01 901030 05 94 011931 92 92 011932 81 76 761933 I 86 86 853934 86 87 871035 77 77 771936 88 88 871037 89 85 851038 89 88 86
Av. 1023-I 038...* 91.3 90.7 90.4
0399008708078000
P868786
89.0
0l00
Pho88
748390
8707
90.1
03 0707 0306 9400 10806 9308 30038 0004 0100 8079 8381 8587 7978 8399 8888 0088 00
90.1 00.8
10096979998089302
86
P03
01.6
105029809039784318788887790918902
02.5
101949893989696008685887589018003
02.0
100969008
10007960581808775890090
02.1
9897
10098
1009003928286867891918880
91.6
RANGES (CONDITION IN PERCENT OF NORMAL FIRST OF MONTH)
192% . 67 801024 .. 08 ‘ 921021 84 841926 — 98 971927 04 itO1O28 . . 100 9910211 60 951030 91 001931 84 J 851932 74 701033 70 719334 77 761935 ‘ 53 031936 78 771017 78 711038 73 74
Ac. 1023- Il028. 81.8 81.8
0307929695080790887270
5275
82.6
8505919707988791887069805474
83.1
81 0691 8402 8606 10096 8795 9080 0000 0400 0173 8170 8185 7660 7177 84
P P
84.4 87.1
96 0903 8785 00
101 10194 98
101 9007 8780 8003 7683 7082 7663 5101 8378 7007 00
sO.0 01.6
106 102 0981 70 0508 98 0898 96 06
101 101 10103 02 0004 0I 0300 0l 9274 70 7375 73 7080 82 7832 12 4980 80 7702 80 8072 75 7437 50 07
03.6 . 84.7 83.0
07859893
1009l00877072785179777282
82.7

STATE OF’ COLORADO 121
1,386,000 39,004,0003,452,000 42,837,0003,369,000 42,948,0002,485.000 14,418,000
HOGS AND PIGS (ON FARMS), 1880-19:18
(Estimated Number and Value January 1)
COLORADO UNITED STATES
Year Farm Value Farm ValueNumber . Number
Per Head j Total Per Head I Total
1880 11,000 $ 6.80 $ 75,000 44,327,000 $ 4.40 $ 195,008,0001881 13,000 6.60 86,000 43,076,000 4.80 206,878,0001882 16,000 8.00 128,000 42,566,000 6.00 255,596,0001883 20,000 11.60 232,000 43,440,000 6.74 292,994,0001884 25,000 9,50 238,000 45,961,000 5.64 259,053,000
1885 30,000 8.90 267,000 47,330,000 6.06 239,548,0001886 06,000 7.40 259,000 45,457,000 4.30 195,458,0001887 43,000 6.90 297,000 42,563,000 4.60 195,964,0001888 50,000 6.50 325,000 42,134,000 5.12 215,540,0001889 65,000 7.40 466,000 44,508,000 5.80 258,240,000
1890 78,000 6.10 476,000 48,130,000 4.80 231,100,0001891 84,000 5.40 454,000 47,435,000 4.24 201,045,0001892 89,000 5.50 490,000 45,165,000 4.65 209,935,0001890 I 94,000 7.20 677,000 43,652,000 6.37 278,153,0001894 96,000 7.40 725,000 46,522,000 6.06 281,867,000
1895 102,000 5.80 592,000 47,628,000 5.09 242,659,0001896 . 102,000 5.70 581,000 49,154,000 4.50 221,278,0001897 105,000 4.55 478,000 51,232,000 4.36 223,296,0001898 107,000 5.10 546,000 53,282,000 4.70 250,188,0001899 108,000 5.00 540,000 51,558,000 4.67 240,717.000
1900 108,000 5.50 594,000 81,051,000 5.36 273,820,0001901 112,000 6.40 717,000 50,681,000 6.08 308,375,0001902 114,000 6.90 787,000 47,858,000 6.95 332,559,0001903 113,000 8.50 960,000 48,100,000 7.69 370,039,0001904 124,000 7.60 942,000 51,623,000 6.08 313,788,000
1905 113,000 7.20 958,000 53,176,000 5.89 312,941,0001906 I 150,000 6.80 1,020,000 53,633,000 6.07 325,680,0001907 165,000 8.80 1,452,000 56,543,000 7.54 426,236,0001908 165,000 8.00 1,320,000 58,388,000 5.99 349,906,0001909 160,000 7.00 1,120,000 52,508,000 6.45 338,728,000
1910 160,000 9.50 1,520,000 48,072,000 9.05 435,180,0001911 188,000 9.80 1,842,000 55,366,000 9.33 516,304,0001912 186,000 8.00 1,488,000 55,394,000 7.99 442,354,0001913 210.000 11.00 2,310,000 53,747,000 9.89 531,586,0001914 280,000 10.50 2,94li000 52,850,000 10.51 555,435,000
1915 388,000 10.50 4,074.000 56,600,000 9.95 563,289,0011916 420,000 8.20 8,444,000 60,596,000 8.48 514,138,0001917 395,000 12.00 4,740,000 57,578,000 11.82 680,599,0001918 425,000 20.00 8,500,000 62,931,000 19.69 1,219,146,0001919 458,000 22.00 10,076,000 64,326,000 22.18 1,426,499,000
1920 450,000 17.80 ‘ 8.010,000 60,159,000 20.00 1,203,052,0001921 414,000 12.20 5,051,000 58,942,000 13.63 803,544,0001922 ! 455,000 9.50 4,322,000 59,849,000 10.58 633,311,0001923 592,000 10.40 6,157.000 69,304,000 12.29 851,038,0001924 575.000 9.40 5,405,000 66,576,000 10.30 605,574,000
1925 493.000 10.90 5,374,000 55,770,000 13.15 731,220,0001926 443,000 13.60 6,025,000 52,105,000 15.66 015,720,0001927 443,000 16.00 7,088.000 55,496,000 17.19 931,974,0001928 509,000 13.10 . 6,608,000 01,873,000 13.17 814,902,0001929 650,000 12.10 6,055,000 59,042,000 12.93 763,604,000
1930 495,000 12.00 5,940,000 55,705,000 13.45 749,481,0001931 520,000 11.10 . 5,772,000 54,835,000 11.35 622,239,0001932 624,000 5.30 3,307,000 59,301,000 6.13 363,315,0001933 536,000 3.10 1,602,000 62,127,000 4.21 261,730,0001934 440,000 3.40 1,489,000 58,621,000 4.09 239,541,000
1935 268,000 5.20 6.31 246,196,0001936 259,000 13.30 12.72 544,911,0001937 298,000 11.30 11.80 510,504,0001938 253,000 0.80 11.21 498,025,000

121 AGRICULTURAL STATISTICS
LIVESTOCK ON FARMS JANUARY 1, BY CLASSES
CArrLE
Milk Cattle Other Cattle
Year Total Cows Heifers Heifer Cows Heifers Steers Bulls2± t-2 Calves 2+ 1-2 Calves i+ 1+
(Thousand Head)1924 I ——— ——— ——— ——— I1925 I 1,465 256 55 65 436 119 285 220 291926 1,406 256 15 65 411 114 [ 272 205 281927 1,406 257 55 65 406 114 281 200 281928 1,377 257 56 65 411 114 i 273 170 291919 1,421 258 57 68 431 118 286 175 301930 1,454 259 57 60 446 123 302 170 311931 1,541 200 57 08 458 144 346 170 321932 1,555 260 39 73 474 144 F 263 143 332933 1,614 280 64 71 519 146 381 119 341934 1,773 100 62 76 315 110 420 113 371933 1,590 270 57 64 492 140 395 139 331930 I 1,510 248 52 80 500 144 330 143 331937 F 1,310 231 31 02 480 143 101 173 331938’ F 1,314 245 33 02 106 113 330 170 33
‘Preliminary.
SHEEP
J Stock Sheep
YAll On Lan,bs One Year and Overear Sheep Feed
TotalEwes ‘IV. & R. Ewes Rams Wether
(Thousand head)1924 ———— ———— ———— ————
1925 2,583 1,000 969 07 9 835 27 71926 2,565 1,472 1,090 110 13 920 31 61927 2,051 770 1,281 145 14 1,080 36 61928 3,020 1,580 1,440 170 19 1,210 40 51929 3,118 1,520 1,198 208 15 1,325 45 61930 3.730 2,031 1,715 180 14 1,461 01 51931 3,351 1,050 1,801 215 28 1,500 53 51932 F 3,391 1,390 1,801 170 30 1,542 34 51933 3,093 1,400 1,693 175 20 1,443 50 51934 F 9,028 1,250 1,778 239 25 1,460 03 F 51935 2,706 1,085 1,671 220 25 1,370 01 01936 2,904 1,290 1,694 119 19 1,426 91 31937 2,767 1,030 1,737 110 20 1,470 92 11938’ 2,915 1,199 1,720 180 20 1,163 02 1
‘Prelin,inary.
HOGS
. Saws OtherYear Total 6 Mo. and 6 Mo.
F — Gilts ±
(Thousand Head)1924 F1929 493 239 76 1781926 443 215 tO 1601927 F 443 229 89 1291928 099 226 89 1881929 350 290 82 1781830 495 255 83 1371931 320 268 87 1651932 624 320 03 2061933 036 280 70 1861034 I 440 222 08 1601035 268 115 28 1251836 259 123 41 051937 298 160 37 1011838’ 293 140 35 78
‘Prelimioary.

STATE O1’ COLORADO 125
MEAT ANIMALS—AMOUNT AND VALUE OF FARM PRODUCTION, 1924-1937ALL CATTLE AND CALVES
Calf Shipped Shipped Out3 Faim Net Production (Amount and Value)!
.In1 and Local SlaughterCalendar (Calves Cattle Slaughter Cattle Cattle Calves
Year Born) and andHead Calves Cattle Calves Calves Amnnnt Value Amount ValueHead Head Head Head Pounds2 Pounds3
(All figurm in thousands—i. e. (000) omitted)1924 109 206 189 118 27 286,325 $16,121 36,171 $ 2,8161925 489 277 634 112 25 284,505 18,499 34,925 2,9311926 493 213 117 73 23 307,915 20,940 23,630 2,2941927 482 347 679 101 21 299,335 22,509 32,171 3,3461926 499 241 929 63 29 296.930 29,396 20,125 2,4391929 506 237 122 05 26 292.305 27,481 26,075 1,1291930 119 211 480 19 18 293,970 23,803 19,921 2,0631931 150 175 353 64 18 333,500 18,112 20,300 1,522193° 100 115 470 78 18 359,285 10,168 22,950 3,1481933.. 611 338 435 72 20 389,920 13,892 22,800 3,0721931 .. 606 146 537 81 25 354,690 11,870 20,525 1,560l935..... 500 138 147 71 20 317,110 20,821 23,600 1,7001936 DO 198 496 90 19 201,860 18,721 26,920 1,0601927
— 139 231 597 110 21 325,013 25,126 03,220 2,720
SHEEP AND LAMBS
Lsmh Shipped Shipped Out2 Farm Net Production (Amount and Value)‘. in’ and Local jlaughter
Calendar (L’s Sheep Slaughter Shep Sheep LambsYear Docked) and and
Hea,l lambs Sheep Lambs Lambs Amount Value Amount ValueHea’l Hrad Head r Head Pounds3 Pounds’
(All figures in thousands—i. e. (0001 omitted)924 731 1,039 98 2,141 20 —400 $ —31 72,482 $ 8,741925 701 2,002 201 2,412 18 780 09 74,116 10,006926 828 1,291 119 2,290 19 2,700 226 72,157 8,852927.. 918 2.004 51 1,662 20 5,140 170 76,029 9,123929 969 1,916 62 2,241 20 5,575 424 81,442 1 0,507929 3,021 2,209 91 2,22P 23 —3,220 —92 91,912 11.759930 1,219 1,206 361 2,192 23 7,085 , 400 92,427 7,950931 1,200 1,889 232 2,500 23 9,941 ‘ 049 89,768 5.925932 1,126 1,463 207 ‘ 2,272 28 —6,20.3 —123 91,575 4,497933 1,111 1,490 252 2,127 26 —10,900 —208 05,475 4,679024 2,270 1,312 229 2,106 24 5,100 105 94,925 0,076935 1,029 1,515 203 1,008 26 7,785 280 81,240 6,237036 1,212 1,299 189 2,209 25 2,240 121 100,050 8,704907 1,200 1,494 235 2,066 25 0,250 247 99,020 9,564
HOGS AND PIGS
Pig Crop (Pigs Saved) Shipped Net ProductionShipped Out2 Farm (Amount and Value)Calendar In’ and Local SlaughterYear First 6 . Last 9 Annual Head Slaughter HeadMonths Slonths Total Head ‘ Amount Valuehead Head Head Pounds1
(All figures in thousands—i. e. (000) omitted)924 255 224 580 20 527 ‘ 75 124,265 $ 8,413025 253 195 548 21 467 75 113,803 12,073026 248 102 540 21 398 74 100,810 11,795)27 581 200 090 20 099 73 121,195 11,877229 409 273 682 24 502 72 132,709 11,152329 376 244 920 27 501 70 132,015 12,409330 201 250 020 34 401 70 125,355 10,006131 450 355 705 20 521 85 122,10..3 9,827339 402 202 004 23 641 92 249,090 4,971323 206 259 555 40 900 86 124,648 4.206324 240 127 369 7 405 100 91,905 3,020335 134 190 264 1 194 81 54,700 4,600136 220 164 384 1 227 70 74,500 6,529127 179 147 320 2 271 77 73,620 6,020
‘Shipped in from points outside the State and purchased at the Denver stockyards.‘Shipped to points outside the State and to the Denver stockyards, plus animals slaughtered by local,tchers and at small killing plants within the State.‘Live weight.

321 AGRICULTURAL STATISTIrS
WOOL PRODUCTION
.UNITED STATES
COLORADO Production
Year Weight Value WeigiSheep Per Production Shorn, Lbs. Pulled, Lbs. PerShorn Fleece Pounds Per Total Piece
Pounds Pound Pouo(
1920 914,900 6.1 6,166,000 $ .41 $1,008,000 I 150,868,000 42,000,000 7.21921 944.000 6.7 6,125,000 .16 1,012,000 241,723,000 48,500,000 7.31922_ 930,600 6.6 6,138,000 .20 1,500,000 228,367,000 42,000,000 7.3192:) 940,000 6.9 6,486,000 .39 2,539,000 230,108.000 42,500,000 7.41021 040,000 6.9 6,406,000 .38 2,485,000 238,205,000 43,800,000 7.5
1023 040,000 7.4 6,950,000 .30 2,713,000 ‘ 253,203,000 40,800,000
1920 1,070,000 7.0 8,132,000 I .34 2,765,000 209,361,099 49,000,000 7.71927 1,216,000 7.3 8,877,000 ‘ .28 2,486,000 289,404,000 00,190,900 ‘ 7.70928 1,395,000 8.1 31,300,000 .33 3,720,000 334,820,009 51,999,099 7.03929 1,573,000 7.8 12.260,000 .20 3,558,080 327,705,000 54,500,000 7.03330 1,600,000 8.1 33,440,000 .10 2,555,000 352,120,000 61,909,990 7.0
1931 1,736,000 7.8 13,541,000 .13 1,760.000 576,301,000 06,100,000 8.01932 0,000,000 7.7 12,320,000 .07 862,000 350,096,000 67,100,000 7,83933 1,539,000 8.3 12,774,000 .10 2,427,000 374,152,000 64,200,000 8.11934 1,661,000 7.9 13,122,000 .20 2,624,000 370,229,000 60,000,000 7.9
1935 1,527,000 8.0 12,216,000 ‘ .17 I 2.077000 304,663,090 60,000,000 8.01930 0,555,000 . 8.4 11,002,000 .20 3,390,000 I 369,327,000 ‘ 00,200,000 7.01937 1,615,000 8.2 13,243,009 .32 i 4,218,000 396,344,000 60,200,000 8.0
YEAR
ANIMALS SLAUGHTERED IN UNITED STATES(Calendar Year Totals)
Sheep & Lambs Cattle Calves Hogs
19001901190219031904
19051906190711)881900
19101911191219131914
19151916191719181919
19201921192219231924
19251926192719281929
8,9409,996
10,51910,50810,046
10,02610,08510,25210,38511,343
11,40814,02014,97914,40614,229
12,21211,941
9,34510,32012,691
10,98213,00510,92911,32911,991
12,00112,90112,88313,48814,023
16,69718,07117,80917,35-010,05-5
17,64437,21617,272
12,00013,20011,78013,80013,100
13,10011,80013,79014,20013,464
15,31218,17719,13118,37518,035
15,57615,16012,12813,22015,784
13,98416,74214,37315,14615,578
15,43016,44416,11317,07617,483
21,08123,11323,1012107329,100
21,76121,35221,413
(000)
5,8016,3126,4656,7556,702
7,2597,5417,6337,2797,714
7,8087,6197,2536,9786,757
7,1538,310
10,35011,82910,091
8,6097,0088,6789,1639,593
9,85310,180
9,5208,4678,324
9,1708.1087,6258,0359,941
9,00610,97210,069
(300)
10,79211,52011,75112,20612,257
33,09013,45613,88613,56914,135
14,14013,81713,38612,93912,676
12,90113,79315,74117,09315,027
13,47012,4-2813,70614,28314,750
14,70414,76613,41312,02812,039
32,03512,03511,01013,02314,068
14,77610,00335,210
(800)
422571679792870
1,0891,6432,0241,9582,189
2,2382,1942,2781,9021,697
3,8192,3073,1433,4563,909
4,0583,8084,1824,5004,935
5,3535,1534,8704,6804,489
4,5954,7174,4024,9070,978
5,0700,0700,281
(000)
4,1054,3184,3545,0445,076
5,7310,1876,4956,7460,853
7,0176,7556,2785,4054,902
4,9295,5536,4970,8357,351
7,5667,7198,5329,2279,804
9,9309,3098,4787,0517,400
8,0007,8040,4070,010
9,57510,13810,150
(000)
29,29431,12920,37526,97130,072
31,85531,61032,88538,04331,395
20,01434,13333,05334,19932,532
38,30143,08433,91041,21441,812
38,01938,98241,11453,33452,873
43,04340,03643,63349.79548,445
41.20044,77245,24547,22043,870
20,05700,05531,643
(033)
51,88153.89148,30148,54)52,072
54,43154,69)56,5263,40154,98)
48,21157,00)95,50)57,00)55.00)
02,03)67,00’56,50’65,10’65,70
oi,so:01,8100,2077,5076,80
65,5002,5806,1372,8871,31
07,2069,1971,3073,3800,94
40,2359,1853,74
19301931193219333034
193519361937

STATE OF’ COLORADO 127
cli I
C,
,0
FC
z
o CC-COZOCOCCC,.’ICCC)ctOOC-IC OOCQCC,”lC-ICCC’,C’C)OCC p
000CCCCCCDC)0 0cCC,CCCC000CC,CCCCO
“CC0OL0CCCC0O,-.)0C000C-1OCC0CCC0O1’-CO,-C IOtCOt-t’-tOCCC)C’OCOCCCI)CC
OC’C C- CCC’C C) 0 C’.CC — C—Cl) Cl) I
COCC,CCC\fl00 CCCCrCC )0CC CC I00CC00C-C-0C-CCC000 ICCCC00,-’ICC’’CCCOOCOC,O
CCC
000CC,0CCC000C- I
>, ‘7CE= >
121C I —
i’ -‘“r-o -., o0 r — — ZFOiJ” — — t- cr CO’ Ct’0Cr
C — .0 CrCCCL =z“ oo—,C-,000I,-.uo,-p,-IcqO I C-:ooooooCCCC-Cluo.-- I
-
CO
CC
‘7
zz
Q
F,
zC!)z
C.)
C.)
z
IC
z
C’,)
zCl,)z
C.)
C.)
/) COO C-. CCC CC 1,00 0CC — I 00CC ICC — 0 10 ‘00CC CC CO C’I I
0C-.0’,tCCCOOCCCC,—IOOC I 0CC-C- q,”lC-OC-CCCCCC.l I
CCI C)CCCCCCOCOCCCVCCCSCI CCCCOCCC-C)Cfl0,-C00XCC00CC CC COOC) ‘IO0C-]0CC’ CC CCC CC ‘C’ ‘C ‘C CCCO ‘C’ CC
,-ICCCfl-C’.C’C’CC’C,-COLCC-CCCO 1CC01,OLO,—ICO,-I000.C-,_.r_ I,-CCOC-.CCCCCC—OOCCC-C’CCCOLO I 0O,ICZCICCO,’CO,C’t’COCC IL’COOO)OCC,’COL”.CCOCCC’C C00000C-.C000C000C-.. I—— 0,-IOOLO,-CC.CCC00000
It-0C-C-CCOC000000CCC) I
CC
,00
z
C,Ct
,00EC
zCI’
.01.7’
C):,z
CC
CO
tCC ,CC CC)
01010I
‘EEC
CCCCC0CC
CI CC
C) CC
o 2<—CC
<0
>1
‘C)
.7.17 .2 7-
‘C0
C
C
C
C
C
0
C
CI
‘C
CC
C
C
0
‘0CC
‘CC
0-c
IC
.01
FI.C)
C
FC
CC
‘C
C
CC)
.0
C)
I.CC),)o
CI‘C
C)CCCC
‘CC
C0
C‘CC0
z
00000 “C‘ C-C C.C C— CCC CC 111CC ] CCC 000C”O”C 0CC—CO IC-.CO0LC.00C00,IC_I1CC0 CC0OC’C-’IC-’CCO,-,OOCCC
CCC,C-CCCC)CCC’IC-CC-,C-CCCC-CC’I ‘O[’lC,.’CUO’C’ICOL’CC-C
00CC-C- C-C-CC-CC-CC-CC-CC-CC-I
OOCC’OCCCCO 000C-C-,-CC-CCCCCCSO.C-0I
00,-COCCOC.CCCOCOCCOC000
I C-CC000000CC’CflLO,-IOI
CC CCC Cl) CCC CIt ‘I’ C’) C-C C’) C-C CCC CC CCCCC CCC
O,-CCCC-C0C-OC’-CC,00’00 p OCCC-C—00000.-CLIOC--C- I
00 00 CC) CC 0
00)0
0000LOOC-C-000COCCCC’ 000CC000CC’C’C’,-IC.--CO,—1010 C-- ‘-C — 010 00CC) C— CCC) 10CC CC C- “C’ C-CO 0 Cl) C-C C-. 0,—ICE)
CCC CC CO CCC CCC CC C’) CC — C ,-C C-C CCC CCC CC C’- C— C’— 0-C’ CCC 10CC-C C-IC) Cl) CO
69C’OCCCCCCCC’CCCIC-C?”I,-IC-ICOOO
CO Cl) ‘0 CC .-‘I0 C-C If) COCC 1-0 000 C 01.0,0 C-CC -C C’) CCC CC) CC)Cr00000 Cr CCC)”)’ CO C-CC C—
CCC) CC C-I CO CC ,“COO CO CC) CC’) CC 00000CC Cr0000000CCCCCCCCCCCCCCCCCCCCC’CCOCOCO CC00’l’C)CCOOCCCCO,’CCC-
CC-CCCCCCCCC CCCC CCCCCOCCCCCC
0 “0 CCC- 000CC,) 1.00 C- C-CC C-C 1,0 CCC .000CC ,“C C- C-C’) CC,-CCCOC”CCLOC-,”C-OOCCC,’,O CCCC-C0C-LOCrOCCCCOO,-C000000000CC ‘PC-C 0,-ICC CCCII) “CC-CC C-Cl) C-ICC’ 0)1)0CC C’) C) C) CCC) 0000CC C-C CC C’C CC-CC) C- 00,—C 00=00 COO
00,”CO OC.C00000 CD C-CC)CCC)”)’ CCCCCC C) CC CCC CC C) CC Cl) C)
C,
.010
z
C’C C’Co0C O
CCC C0
- 1—’ I—C
7- I oo-o
0000000000000)0 000)00000000000

128 AGRICULTURAL STATISTICS
HENS, MILK AND EGG PRODUCTION, COLORADO, 2925-1931
HENS AND PULLETS PER FARM FLOCK’
(First Day of Each Month)
Year Jan. Feb. Mar. Apr. May June July Aug. Sept. Oct. Nov. Dee.
1925 75 74 76 74 72 68 66 64 65 65 68 72
1926 81 83 80 79 70 69 64 60 59 66 72 74
1927 I 79 80 80 79 75 69 69 65 65 70 73 78
1928 85 85 85 85 81 76 72 65 65 67 74 78
5929 85 85 82 75 75 73 70 71 69 70 75 78
1930 87 88 84 81 80 73 71 67 67 76 80 83
1231 86 86 86 84 77 74 70 68 66 66 74 81
1932 so si 78 74 73 66 66 58 19 80 63 68
1033 73 71 71 72 69 65 62 57 57 63 68 73
1234 75 79 74 72 69 63 88 59 59 60 65 69
1935 69 70 68 68 64 57 56 53 50 58 61 61
1916 66 66 66 60 56 56 53 92 93 60 08 69
1937 72 73 72 68 61 61 97 58 94 60 63 70
1939 P 68 71 70 62 65 61 57 54 37 59 61 72
EGGS LAID PER 100 HENS AND PULLETS’
(On First Day of Earl, Month)
Year Jan. Feb. Mar. Apr. May June July Aug. Sept. Oct. Nov. j Dec.
1925 7.8 15.9 40.0 51.9 53.2 49.3 41.7 37.9 56.2 23.4 14.2 9.1
1926 14.8 21.3 42.4 52.7 56.8 50.1 43.7 46.0 36.6 23.4 17.4 30.
1927 12.5 22.6 32.9 48.0 52.8 50.2 42.1 39.9 34.2 24.4 18.4 11.1
1928 15.4 25.2 36.8 50.3 55.3 50.6 45.7 38.0 35.5 27.5 25.1 9.1
1929 16.8 24.3 30.2 53.3 57.7 55,2 50.9 44.8 35.0 26.1 16.7 8.]
1930 15.1 17.5 45.2 54.2 55.9 51.5 45.7 35.3 35.1 25.5 15.0 10.1
1931 13.4 27.0 42.5 52.0 57.3 50.3 45.4 40.5 15.8 25.4 14.2 9.1
1932 14.8 22.6 37.9 48.7 54,6 10.9 45.7 40.1 34.9 25.2 13.6 10.1
1933 9.7 26.2 28.9 50.7 53.0 51.7 45.0 38.9 33.0 23.2 14.8 12.l
1934 17.9 27.7 38.3 53.2 55.7 49.2 43.5 34.7 29.1 19.5 13.7 11.:
1530 13.4 26.9 36.2 49.9 51.7 48.1 45.0 39.9 36.4 28.6 16.8 11.]
1936 18.2 24.8 33.2 54.0 57.7 84.8 49.1 38.8 34.4 26.0 11.8 11.1
1937 18.8 17.8 40.8 50.8 55.1 54.1 46.7 11.5 36.9 30.0 16.4 13.1
1938 16.3 30.3 37.9 54.4 56.6 53.1 48.2 43.8 40.6 31.5 20.1 11..
‘As reported by Crop Correspondents having flocks of less than 400 hens and pullets of laying ag
on January 1 of earls year.
SOUNDS OF MILK PRODUCED PEE MILK COW IN HERDS OF CROP CORRESPONDENTS
(First Day of Each Month)
Tear Jan. Feb. Mar. Apr. May June July Aug.L
Sept. Oct. Nov. Dee
1923 10.3 9.8 10.0 10.7 13.7 14.3 14.5 12.6 11.6 10.4 10.4 10.
1921 10.2 11.3 11.8 32.9 13.6 35.8 15.6 34.2 12.9 12.1 10.7 13.
1527 11.0 15.8 13.2 14.1 15.1 15.8 16.1 15.8 13.8 11.6 13.5 11.
1928 11.4 52.6 13.5 13.2 12.3 16.1 19.0 15.7 14.1 13.1 11.5 12.
1929 12.2 12.8 14.1 14.1 15.5 19.6 19.1 35.8 14.3 12.9 11.9 11.
1930 12.4 12.5 13.0 16.2 15.2 18.0 17.5 16.3 14.0 12.5 12.0 12.
1931 12.3 12.8 14.2 14.2 14.5 15.9 15.4 14.3 13.6 11.7 12.4 11.
1932 11.1 12.8 12.4 12.6 13.4 35.0 19.0 13.3 13.3 11.3 10.8 11.
1933 30.9 12.6 12.0 12.7 12.8 14.6 15.7 14.4 13.2 11.4 90.7 11.
1954 11.9 11.4 12.1 12.3 13.4 15.3 14.2 12.3 11.9 10.9 9.7 10.
9,9
11.0 33.1 13.3 U.2 12.8 35.4 14.6 12.8 21.8 11.5 11.
1936 12.2 12.9 13.1 14.1 15.8 15.9 16.5 13.9 13.6 12.6 11.4 11.
1937 12.1 11.1 12.2 13.0 13.6 16.8 17.1 15.3 12.6 12.4 11.5 11.
1938 12.0 12.5 13.4 14.7 15.4 27.8 18,0 17.3 14.1 11.8 13.7 13.

STATE OF COLORADO 129
ESTIMATED CREAMERY BUTTER PRODUCTION
IS
BusJ Bus. Busi Bus. Busi Bus. Bu . Bus. Bus. Bus. Bus. Bus. Bus.12.2 12.0 13.6 14.4 333l 12.9 12.2 11.71 13.0 14.2 15.1 14.0 13.315.3! 14.4 13.71 12.1 10.7 9.8 0.4 0.9 9.9 9.3 9.3 9.1 11.19.1 8.8 8.6, 9.0 8.4 8.1 8.3 9.1 10.1 12.0 13.2 14.1 9.9
11.6 13.9 14.4 14.4 12.7 12.3 12.1 11.lp 10.2 10.4 10.5 10.3 12.210.8 11.3 11.2 10.9 10.3 9.9 10.11 10.3 10.2 10.0 10.4 10.2 10.6
9.5’ 8.6 8.4 8.5 8.7 8.7 8.7 8.5] 9.2 10.8 10.6 10.1 9.29S 10.5 11.4 11.5 11.4 11.0 10.9 10.6 11.1 10.4 10.1 9.8 10.710.5 11.5 10.3 8.8 8.3 7.4 7.7 9.0 10.1 11.2 12.& 9.7
11.2 10.3 10.1 10.2 10.3 10.0 9.9 10.1 10.8, 11.0] 11.6, 11.3 10.6ii.il 11.3 11.2 11.1 10.8 10.2 13.5 10.2 9.3 0.7 9.2 9.2 10.89.3 9.2 8.9’ 8.4 7.6 7.1 7.8 8.5’ 10.1 13.0 15.0 13.2 9.8
13.5’ 13.51 14.3 13.0 12.5 11.6 13.1 14.8 14.0 15.9 16.0 15.2 14.015.4 16.5’ 15.8 15.7 15.0 14.7 14.7 13.7 13.4 13.4 12.8 11.7 14.4ii.iJ 10.9 10.2 9.8 8.8 7.9 7.51 7.7 8.5 8.8’ 8.2 9.0 9.09.0 8.5 8.6 8.6 8.5 8.1 6.71 80F 7.7, 8.7 8.7 8.28.3 8.4 10.6 11.2 10.0 9.7 11.5’ 11.4 11.6 13.4 14.1 14.9 11.8
15.8 17.2 17.5 17.5 17.8 18.7 14.7 15.8 16.2, 17.3 17.0 16.917.1 16.81 16.7’ 15.9 12.9 9.4 9.3 9.5 10.3 11.6 12.2 10.9 12.710.3 9.6 8.7 8.4 8.6 8.5 9.4 10.2 11.7 11.3 11.3 10.4 9.910.2’ 10.2 11.3 11.7 11.6 11.3 10.7 9.8 9.9 10.5 10.9 10.811.4 12.2 12.8 11.7 11.6 11.5 10.9 9.5 10.3 10.7 12.4 11.5 11.411.8, 11.6’ 12.0 12.0 11.3 10.61 11.5 12.31 12.6 14.1 11,91 10.9’ 11.911.2 10.9 12.1 11.4 9.8 9.6 14.1 18.4 13.5 15.0 15.7 14.5 12.614.0 15.21 15 6 11.4 l0.0 9.9 7.2 7.8 8.0 10.71 9. 7.0 10.57.0 8.51 8.2 0.5 6.3 0.7 6.3 7. 6. ‘ 6.7 0.9 7.08.1 8.41 9.8 9.2 9.3 10.01 10.21 12. 13.21 11.3 15.1 16.8 11.316.7 16.8 16.3 10.4 14.3 14.5 11.4 9.5 9.2 9.4 9.2 9.1 12.8
9,3’ 391 8.71 7.0 7.7 8.5 9. 11 2 11.2 10.0 17.2 Is. 11.014515.0 16.1 4.7 13.9, 15.3 15.9 16.1! 0.8 7.4, 1
1 COLORADO UNITED STATES
Year ‘ Per Cent of Per Cent ofPounds Preceding Pounds . Preceding
, Year, ,
Year
1919 1 13,144,000 ‘ . . . . 868,125,000 J .1920 12,979,000 98.7 863,577,000 99.51921 15,290,000 117.8 1,054,938,000 1 122.21922 16,410,000 107.3 1,153,515,000 , 109.31923 18,625,000 113.5 1,242,214,000 107,71924 18,130,000 97.3 1,356,080,000 109.21925 ‘ 18,794,000 103.7 1,361,526,000 100.41926 1 18,255,000 ! 97.1 1,451,766,000 106.61927 20,871,000 1 114.3 1,496,495,000 103.11928 F 21,614,000 103.6 1,487,049,000 11929 21,924,000 1 101.4 1,597,027,000 107.41930 22,643,000 1 103.3 1,595,231,000 97.41931 21,993,000 97.1 1,667,452,000 104.51932 22,011,000 100.1 1,694,132,000 , 101.61933 23,909,000 1 108.6 1,762,688,000 104.01934 22,699,300 94.9 1,694,708,000 ‘ 96.21935 18,261,000 , 80.4 1,632,380,000 96.41936 21,491,000 118.0 1,629,407,000 98.91937 21,125,000 98.3 1,623,771,00099,6
CORN AND 1-lOG RATIOS FOR TIlE UNITED STATES, 1910-1938
Number of Bushels of Corn Required to Buy 100 Pounds of Live Hogs Based on Averages ofFarm Prices of Corn ond Hogs for the Month
1 [! i I19101911191219131914191519161917191819191920192119221923192419251926152719281929193019311932193319341035191619371535

130 AGRICULTURAL STATISTICS
ALL CATTLE AND CALVES
ESTIMATED NUMBER ON FARMS JANUARY 1, 1928-1937
COUNTY 1928 1929 1930 1931 1932 1933 1934 1933 1930 1937
Chaffer 9,344 9,180 8,906 9,1091 8,257 10,575] 12,411 11,lOs 11,738 ii,o;Clear Creek.._ 479 483] 009 039 550 088 021 489 589 3’Eagle 21,564 21,741] 22,901] 24,271 23,120 23,500 25,753 232351 24,430 26,5Gilpin 710 980] 763 1,079 826 681 1,241 955 1,170 1,1(iraiid 13,418, 13,770 15,521 15,911 10,239 16,744 18,6171 16,110 18,210 17,3Gutinison 36,659 35,7931 37,659 39,643 40,160 42,006 45,611] 40,6,1; 13,579 41,1Jackson I 32.107 31,404 33,587 35,058 37,158 38,188 41,888 35,844 37,690 39,6Lake 9a8 960 1,018 1,079 1,101 1,1751 1,241 1,326 1,178 1,4Mull’at 16,053 17,635 19,338i 20,765 20,368 22,912 23,z71 21,349 20,612 20,5l’ark 16,0531 17,152! 16539 17,799 19,542 20,269 21,109 22,512 20,5a6 22,8l’itkjn 7,907 7,247; 7,634; 1,553 8,217 8,22o1 0,378 0,363 10,011 10,7
Rio lllai.c,, Ss,336 56,719 41,984 45,037 49,415 49,056 huGO 41,344 47,111 41,1Ituiitt 35,221 30,960 36,132 39,913 41,286 43,s35 44,060, 39,271 41,22s 41,4Summit 4,073 4,348 0.089i 4,585 4,404 4,700 SOul 5,030 5,308 0,6‘Idler 6,709 7,247] 0,870 7,581 8,2o7 9,100 8.088 7,739 7,930 8,0
‘iota! North— 1nest I)11. 239,600 241,570 234,450 269,680 275,240 293,750 310,280 282,344 294,430 298,3
linmilcier - 23,131 25,635 23,309 24,109 22,109 30,330 27,boO 25,884 28,010 27,0.Ieltm’rson 28,820 22,198 23,264 25,706 22.750 23.0891 23,510 19,289 17,523 18,3I .arimsmer — 43,370 46,208] 46,237 50,853 45,793 42,120 18.776] 43,291 47,792 30,0lOWOfl 46,26, 02,833. 52,344] 05,938 10,322 48,s17i 55,019 59,662 57,3o0 58,0Morgan —- 13,370 52,287’ 34,896] 44,073 37,522 37,768 41,946 39,006 38,253 47,3
Se,lgsviek 14,418] 15,6311 14,831; 20,343 10,001 13,979 18,324 16,809 17,323 17,2
Weld 97,739, 97,850. 97,703 117,640 100,748 103,715] 117,206 102,471 111,514 120,7
‘Total N. Central&N.E. 1 I
District 289,170 312,620 290,800 339,020 295,450 290,320 343,740 306.392 318,610 313,4
Adams 13,1.11’ 18,236 18,000 18,816 20,333 21,210 21,702 20,500 19.026 29,8Arapahoe 17,410 17,107 16,721 16,421 17,024 1s3’iil 19,148 20,614 18,317 12,4Cheyenne 19,112 23,131! 26,713 24,973 31,lsl 39,148 36,113 22,121 22,1Denver I 1
Douglas 21,913 22,821 23,071 20,015 20,648] 2°,757 23,101 21,467 20,Olu 20,2
Elbert 31,321 30,326 33.108 33,808 34,709 31,150 33,711 13,049 20,3.s8 31,9El Paso loll2 38,132 39,462 39,343 44,041 43,239 46,0971 42,311 33,635 39,3Kiowa 18,011 20,090 2l,O6 19.842 21,833] 21,270, 23,331 22,043 16,308 21.3KIt Carson 21,613 12,821 28,091 30,789 37,003’ 39,823 49,103 42,232 31,397 23,2lincoln 2 l’l 36883 381’4 3, 973 41820 11 22! lo 31 41, 91 390,1 28 1Phillips 9,003 8,734 8,090 9,579 10,363 10,999 13,191 11,007 11,i90 12,7Washin”ton _l 20,718 31,”02 31,780 36,947 08,189 41,313 10,637 oO,808 40,800 49,8Tuma 38,123 39,390 48,1811 48,230 49,062] 49,308 10,o72 0’,729 00,283 01,1
:.TotatE Ceo IOral 141st. _J 300,180 312.620 331,420 342,100 370.090 379,290 425,520 413,738 339.739 361,1
Archoteta I 33,384 12,789 32,737 13,818 11,382 10,107 16,808 13,s83 13 Gel 16,3Delta 52,781 29,811 29,719 32,167 33,091 34,746 39,686 32,339 33,613 33,3Dolores 2,°31 2,340 3,181 3,801 3,783 4,028 4,461 3,018 3.361 4,1Garfield 30,807 16,022 loll9 38,010 40,’iol 42,399 44,671 42,229 41,933 ‘14,0Mm dale 2,900 3,191 3,181 2,20s 2,836 2,770 2,806 5,330 3,121 3,11 iPtata °3199 3131a 0 91 la’0 2 al p366, 2s78 9 29, 3 09 943
Me a 45,952, 45,621 45,003 45,306 51,867, 53,067’ 52,239 00,419 48,3Monteesoma . 17,810, 36,413 18,044 19,209 20,3”, 22,lal l3.3o4 30,121 bIll 19,3Sluntro e ‘ 20,768’ 20,044 27,172 30,582 30,903 33,738’ 34,637 32,081 33,132 33,3Ourav 8,923 8,320 9,128, 10,191 10.630 11,590 10, l90 12,028 12,003 12,3San Juan 2231 213] 213 227 230 252] 2621 200 240 1
San Miguel _ 12.0401 10,010 8,0071 8835 9,45j1 9,810 10,490 7,293 7,443 7,1
‘TotaI3V.Cen-trat&S.3V.’
5
_
_7 9District I 993,070 2131 0 232 280 226 30 236 3601 251 780 262 400 24a 20 240 090 46
A1.,nme a .1 18,088 27,700 14,875 36,400 17,s40 16,736 17,990 16,044 15,304 17,1Cuu,’jo’ 39,554 20,590 28,481 18.67’ 10,40,1 23,336 23,651, 19,370 18,271. 39,(‘ostillo — — 0,6000,171 3,606, 4,101 3,732 3.741 4,027. 3,360 2,907 3,1
Mineral _I 1,955 2,387’ 2,164 2.OU 2,139 1,909’ 2,360 1,620 1,910 1,’ho, Cr,,nde — I 16,914 17,9091 16,497 16,643 16,’21 lo,140’ 10,907 13,064 11.119 ii;
Sa”uarhe — 00.093 56,100 34,427 21,187 03,061 30.722 37,220 30,173 30.179 34.1
Total S. Ceo , I IIral DL—t. — 97,775 99,470 90,150 92,460 03,300 98,150 102.620 91,942 83.030 89.
liar,, I 28.401; 20,190’ 30,996 32,53 34,147 39.0271 33,517 20,’Io 3 12,384 13,’l0ent —— 20,903] 20,775 21,208 22,010 23,0,0 24,917 20.098; 19,181 17,323 19,
Cruwicy 12,209 13,928 13,Ool 12,301 14,229 12,909 10,312 11,102 11,204 12,1
Custer 10.0791 11,t1 11,092 11,93a 12,230 12,309 13,049 12,570 12.171 12,1
Prensnnt 15,223 iGlOo 16,314] ilIaD 10,220 17,11 1O,sll 31,219 39,426 18,1
Ruerfano ‘ 18,177 lO,3s9; 20,121 19,256 19,3,0 21,010, 24,407 21,836 19,192 19,
La Anossa I 44 0001 0 30 67 9i. 0 I’ll 0, 1 0 i9 Oaij 81 3 8 a? 08 8 13 aS
Otcro ‘ 23,807 32,949 24,471’ 23,001 20,610 27,920 34,580 20,022 26,916 25,1
Prosvers 23,721 23.191] 35,055 27,121 21,302 54,59 37.190 28,099 21,377 23,’
Pueblo 30.074 34,045 41,057 43,038 11,261 37 016] 3,,,585 29,900 20,080 39,’
‘Total South-1 Ieast Dist.. 227.210 241.070 271.900 271,210 284,260 300.210 326.230 249.153 234,050 229,
State Total___’ 1,377,8801 1,421,000, 1,451,000 1511000] 1,551,000 1,614,000 1.773,000 1,389,509! 1.51.0,000 1,070,
tndirates approximate location of District for which Counties ore given abuse.

STAND OF COLORADO 131
MILK COWS (COWS AND BEIFERS 2 YEARS OLD AND OVER KEPT FOR MILK)ESTIMATED NUMBER ON FARMS JANUARY 1, 1928-1937
COUNTY 1928 1929 1930 1931 1932 1933 1934 1935 1930 3937
‘ 1,198 1,073 1,078 1,112 1,082’ 1,140 3,1081 999’ 1,019 1,113Clear Creek fl6 110: 113, 98 79 104 128 14O 1371 142Eagle 1,183 1,50& 1,5701 1,718 1,7121 1,740: 1,797 1,744 3,781Cilpin 1331 132 113 117; 318 14& 149 140’ 137 182Grand 1,546 1,525 1,607 1,775 1,712 1,679 1,699! i,os 1,703 1,741Gunnison 1,7891 1,716 1,740 1,833 1,832 1,782 1,917 5,9981 1,783’ 1,822Jackson ‘ 1,005: 900 940 3,9541 1,032 1,078: 1,051 3,9391 1,097 1,99:2Lake : 2321 243 246 273 295; 332’ 383 301 291 304Moffat 2,326: 2,348 2,360 2,340 2,421 2,031’ 2,878 2,498; 2,242 2,266Park 967: 904 927 995 984’ 1,098 1,278 1,199’ 1,173 1,236Pitkin 9091 516 794 780, 728 723 809 839 874 911Rio Blanco 3,429, 1,333 1,303’ 1,383; 1,397 1,471 1,427 1,719: 1,293 1,293Routt 4,713 4,670 4,709 4,680 4,8201 5,0701 5,006 4,555’ 4,6021 1,756Summit ! 525’ 517 492’ 480’ 483’ 19l 554 539’ 4901 520Teller 9091 903 910 896 185! 1,222: 1,128 1,659 980 2,092
°Total Norlhwrsl ‘ ,District 19,330 18,830 18,910 19,500 19,680 20,720 21,300, 19,960, 19,590’ 20,240
Bouldes 7o78 ,80 t804 892 5108 8216 868’ 7800 7174 1Jefferson ‘ 7,338, 6,708 6,147 6,691, o,oiol 7,441; 8,100, 8,019’ 7,239 7,087Larimer I 7,744’ 8,030 7,332 7,398, s,iosl 8,358’ 8,380 7,655 0,979’ 0,698Logan 9,032! 8,855 8,822 9,371, 9410’ 9,6911 10,452 9,914 8,022 7,802Morgan 7,596 7,513 7,463 7,610 7.8421 8,308’ 9,194 8,238 7,6351 7,802Sedgw’ick I 2,4871 2,349 2,519 2,748 2,780, 2,962 3,310 33SF 3,0001 3,127Weld ‘ 26,705 25,823 27,230 26,747 27,916’ 27,221! 29,016 27.9211 25.1751 23,358°Telal N. Central , i 1
& N. E. D;st. 68.530’ 67,080 67,860 70.460 71,290: 72,240’ 78,000’ 72,900 65,220 65,020Adams 1 7,874 7,713 8,634 7,699 8,002’ 8.088 9,997 7,866 7,674, 7,874Arapahoe 6,604 6,238 6,323 6.2061 6,697 7,137’ 7,906, 7,392 6,766: 7,269Cheyenne ‘ 4,064 4,115 4,017 3,849’ 3,827 4,099’ 4,982’ 4,349 3,902! 3,461Denver ‘ ‘ ----I
‘ ----IDouglas ‘ 6,638, 6,429 5,897’ 5,393; 5,2981 3,7l0 4,928 4,5801 4.S’16Elbert 3,5661 9,429 9,066 8,890: 8,872’ 9.9171 11,556; 9,477 6,632: 9,343El Paso ; 9,991! 10,629 10,598 10,411, 11,7421 11,992 73.321; 11,657’ 11,027: 11,853Kiowa : 3,21; 3,257 3,162 2,785 2,870 3.167 3,166 3,023 2,629 2,596Kit Carson 8,167’ 8,913 9,716 8,845 9,916’ 10,997’ 12,363’ 10,7091 6,736 8,393Lincoln 6,604 6.423 6,486 6,552 6,137 7,065 8,011 6,918’ 6,022, 6,317Phillips ; 1,367! 3,237’ 3,419 1240 3,392, 3,718 4,765 4,170; 3,8171 3,896Washington 6,498 8,743 8,803 8,699: 9,635 10,422 13,101 11.637; 50,603; 10,381I uma 938 lOol4 1013 9234 1917 3155 113 87 12414: 10132 10361
5Total E. Central 1 1 !District ‘ 84,670, 15,720 85,470 81,900 86.980! 92.960 108.3001 94,770 81,820’ 86,530Arehuleta 1,150, 1,234 1,197 1,282: 5,350’ 1,541 1,287, 1,193’ 1,121, 2.279Delta 6,157’ 6,269 6,696 7,012’ 7,127 7,656 6,864’ 6,248’ 6,018’ 6,199Dolores 440, 431, 415 377 373 494 640 620 4761 496Garfield 3,055; 3,971; 4,242 4,404 4,614 4,774: 4,290 3,626 3,80,3’ 3,825Hinadale
‘ 1701 174! 181 131 150 163 103 176 179; 177La Plata 4,803’ 3,025’ 5,183, 5,246. 5,103 5,613 5.867; 3.441 5.535; 3,667Mesa ‘ 7,104 7,475 7,7231 8,106 7,877 8,732 8.229; 7.206, 6,984’ 7,155Montezuma I 3,721 3,727, 3.607 3,996 4,031 4328 4,114 3,7361 1,568 3,790Montrooe ‘ 4,193’ 4,393, 4,829 3,052 4,839’, 3.313 5.326 4,921’ 4.757! 5,010Ouray 013 906 907 867 863 906 819 737 782 815San Juan 34, 33 36 28; II 45 ‘10, 50 53San Miguel 1,185 1.148 1,088 1,168’ 1,125, 1.3911 1.092; 8701 S63 956
°Tolal W. Central , 1 I& S. W. Dist., 3L830 34,830 3L260; 37,700 17,510 11,160 19M00 35,100 3L980 3L420
Alamooa ‘ 2,364 2,322, 2,332, 2,340, 2,373 2,587’ 2,388 2,430 2,165; 2,560Conejos ‘ 2,570 2,704 2,642 2,756, 2,766 2,822 2,508 2,4841 2,292’ 2,426Costilla ‘ 8431 805’ 629 780[ 872 911, 835, 788 782 837Mineral ‘ 93 93 104 104, 106 116’ 148 151 155’ 145Rio Grande 2,827 2,786, 2,850 2.698; 2,874, 3,152, 3,740, 1,110, 1,953! 1,205Saguarhe 1 1.583, 1,610, 1,594 1,612 1,6 19; 1,940, 1.961, 1,817’ 1,7511 1,937
4Total S. Central I ‘ ,District 10,280 10,320 10.360 10.400; 10,640 11,760 10,400 10,800 104201 11,130
Baca 6,902’ 7,378 8,904 7,007; 6,765; 7,069 7,392 6,468 6,013’ 6,204Bent 3,2091 3,215 5,151 3,203 SlOP 3,169 3,024 2.697 2.4481 2,496Crowley 1.976; 1,855, 1,846 1,922, 1,796 1,770 9,890 1,597[ 1,664Custer 1,715’ 1,699 1,405 1,401 1,476 1,646 1,818 1,438 1,461 1,629Fremont 1 2,018 1,979 1.967 1,892, 1.6761 1.979, 2,520 2,296 2.242: 2,216Huerfano 2,7011 2,156 2,328 2,202 2,115 2,181’ 2.312 2,167, 2,2081 2,218Tao Anima- I 5,650 6,142 5,911 5,606, 5,766’ 5,845, 6,174 5,540, 9,096 3,026Otero 4.016; 5,957 5,914 4,004; 4,190 4,108; 4,052 1,153 3,091 3,258Prowera 5,6501 6,100, 6,141 6,407; 6,081 8,592 6,300 5,193 4,586 4,500Pueblo I 6,418, 6,348 6,143 6,186, 6,501 6,709 6,168 3,886 5,230 5,411°Totsl Southeast I I
District 40.360; 41,220, 4.0,140 40.040, 39.960 41.160 42,000 36,450 33,870 34.660Stale Total 257,000, 238000 239,000, 260,000, 266,000 280,000 300,000’ 279,000 248,000 253,000
°Tndicateo approximate location of District for which Counties are given above.

ill AGRXCUX/PURA7 SflTXSTXCS
ASSESSED VALUE PER ACRE OF IRRIGATED FARM LAND 1925-1937
(Compiled from Reports of the Colorado Tax Commission)
COUNTY 1925 1926 1927 1928 1929 1930 1931 I 1932 1933 1994 1935 1936 1037
4NorthweslI
liist. I I i I
Chaffee 52.01 50.08 49.85 49.78 47.28 44.01 11.32 13.85 35.12 30.46 32.79 32.03 34.27Clear Creek_ I
Eagle 69.08 65.98 65.30’ 64.461 64.8& 65.08’ 47.12 51.62 46.23 52.92 45.62 46.00. 41.82Gilpin IGrand 34.78 54.84 36.72 14.41: 3493’ 3493: 27.91 28.33] 24.89 22.73 22.17 21.58 21.94Gunnison 41.11. 42.18 45991 41.70 42.551 41.54 53.34’ 31.20 26.32 30.73 30.38 30.86 30.34
Jarkson 20.00‘
_----I
Lake———-‘ ————I
Iloffat 32.80 34.32 33.30 37.22 3733] 36.21 30.07 23.51 26.63 25.30 25.21 25.32Park I
‘11km 56.00 57.20 55.41 48.00 48.17 51.33 42.20 41.21 40.82 10.27 39.63 40.68 40.36Ill,, lll,tneu.. 60.08 62.23 66.27 62.40 60.00 50.64 47.00 47.50, 40.08 39.76 37.02 35.90; 36.82llnutt 49.78 40.84 49.63 49.97 49.50; 43.01 36.02 33.98 29.24 28.84 28.10 28.64 28.27
S,,nsnut 34.86 32.58 35.10 36.49 35.00 35.00 29,34 28.00 23.42 25.70 25.00 25.42 25.42
‘l’eller -- ‘I l ,j
N.Cem-N1i.lJiol. ,
‘ 1
Boulder ‘ 109.31 108.15 108.2E 105.53 103,63 103.13 75,27; 70.18, 58.46 58.4P 58.52’ 58.61 58,61
Jefferson .* 148.00 143.00 1l3.74 113.63: 98.711 103,10 78,56’ 70.70 57.49 59.15’ 61.04 65.20 68.56Larimer ..J 120.16 112.88 106.00 104,50, 91.561 94.301 77.011 69.00, 56.10 ss.9o 55.60 55.44 55.47
Logan 74.50, 72.72 72.00’ 71.80. 71,00, 71.28 55.30’ 52.02; 45.49 41.00; 41.00 41.00 ‘11.25Morgan 80.00: 79.09 79.55, 79.55 78.35’ 78.33 62.6O 56,40, 45,63 43.031 44.95 44.90 44.92Sedgwiek 73.65, 75.61 76.88; 76.25 76.08’ 76.16 64.42’ 57.12: 49.17 48.69 49.36 50.53 49.38
Weld 96,35 94.84 91.90j 87.2L 86.05, 85,18 66.651 59.90[ 45.13, 47.93, 41.18, 47.69, 46.99
E. Central 1Dist. , . .
Adansa 150.60 94.19 93,77’ 92.55 02,58 90.41 72.32 63.68’ 53.71 59.66’ 58.43 57.69 56.93Arapahee 139.21 141.18 141.01 140.89 142.50 111.15 99.68 77.78 66.96 07.07 67.73, 67.74 67.74Cheyenne ..‘ , .
1
Denver ,“:
I
Douglas 78.89; 81.52 81.14, 81.47. 73.64 73.1O 61.57. 58.67’ 53.29 53.61 56.83 50.77 50.39Elbert ‘ I ‘ lEl Paso 75.00’ 75.00 75.00 75.00 75.00 73.00’ 60.0& 60.00, 52.67, 52.67 48.46 48.45 48.31Kiowa ,
----,:
Kit Caroon.. 49,00 40.00 39.75 40.00 30.46’ 31.991 25.60 27.01: 21.31 23.00 23.00 22.95 22.91Lincoln ,
,
Phiflipa : ‘ ..———‘ ————I‘Washington 84.96 82.97 73,77 61.10 63.82: 60.58’ 49.90 49.78 41,78 46.55 45.47 46.68 45.66Yuma ‘ 37.62 37,65 43,96 40.28, 42.26 38.70 77.13, 28.42 21.51, 21.48 24,02 23.93 22.94
14’ Cen.-S. ;W. Diat. 1 ;
Arehuleta 41.90, 41.64 41.92; 41.701 40.46 40.47, 32.57, 30.58 27,45 27.48, 27.63 27.61 27.83Delta 75.24 72.54 62.34, 60.50; 67.04 64.25 52,35 46.17 43.08 45.72 45.44 34.60 42.32Dolores 19.59 19.59 20.091 20.00; 20.00 17.36 12.04, 9.95 7,64 7.50 7.35 0.14 10.00Garfield 72.05, 70.45 70.92’ 70.52, 70.14 70,54 56.52 50.77 45.19 44.04 43,17 43.92 40.12Hiosdale 15.00; 15.00 19.001 15.00, 17.00. 24.44 20.59. 20.00 18.00. 20.00 20.00, 20.00: 20.00
La Plata____’ 42.28; 45.91 42.53; 42.05 42.22; 42.66 38.20 37.74 31.93; 51.80 28.51; 29.41; 28.79
Mesa 08.50, 72.87, 71.78 68.17; 68.54, 78.38; 77.14, 46.98 46.22 46.471 46.00 44.43Monteounsa —‘ 36,86 36.90 36.71 56.26’ 34.86; 35.18; 27.72; 27.55, 25.05’ 25.11 25.10’ 25.25 24.75Mootrose 52.391 52.92 52.41 48.52. 48,42 48.93; 39.35’ 58.92, 35.02 34.45 34,02 33.92, 33.80Ouray 51.71’ 51.50 51.10; 51.13’ 50.63 49.51, 39.54 38.61; 31.61, 31.10 30.04 31.37. 31.14San Juan I ; ISan Migoel_ 37.73’ 37.79 38.00’ 58.36; 36.50: 35,65’ 25.70 27.48, 24.51; 24.53’ 23.78’ 23.82. 23,41
*Sntral
Al,,mnsa ,, 40.00 38.00 38.00 40.00 40.00 35.00 30.00 28.00 2.7.00 25.00 25.00 25,00; 25.00(bodes 45.00 45.00 44.98 44.97 44.97 45.00, 35.78 35.78 22,19 12.19 32.20 32.20 32.31t’atilla 29.17; 29.09 28.88’ 29.10 29.37. 29.15’ 24,08. 18.81 14.46 14.35 15.05 14.30 1459Mineral 13.52 14.04 13.88 13.63 13.85; 14.24 11.461 11.23 10,17 10.24 11.00 12.27 12.76
his Grars’le_ 52.58 52.04 50,04 51.74 59.77 64.00 48.55 46.17, 38,60 17.18 57.00 37.43 37,55Saguaehs .. 44.00 44.00 44.00’ 44.00 44.00 44.5., lob bOO 2,00 2 tOO 27.00, 27,00, 27.00
*SEDist.’ I I IOhaea ‘ 12.50 12.50 12.50’ 12.50 12,50, 12.50 10.00, ‘
Dent 79 50 79 60 79 71 7952 78 94 7721 (3 90 63 ,4 35 59 40 69 41 06 42 42 91
Crowley ‘ 89.78 89.2L 89.48, 90.36, 90.11; 85.09 67.271 45.73; 36.13 35.95 25.85’ ss.sii 36.98Custer 28.55 29.84 30.00; 30.00, 30.08 30.07’ 11.94; 32.00 26,47 26.52 26.55; 27.4& 27 20Fremont 76,49. 100.27 88.55. 83.36. 80.56. 77.62 64.28, 62,46. 52.44 58.23 57.97; 57.00 5387Huerfano — : 40.001 43,58 42.76 Oo.65 43.58 42.88’ 33.46, 33.40 28.86 29.67 29.46’ 29,311 5s9
1s Aniosaa_’ 43,13 51.89 52.16] 50,44’ 51.01; 52.51 39.49 40.02 34.56 36.88 56 27 36 °0’ 3930&ero I 121.60’ 208.70 106,9t 94.111 92.52’ 87.19 09.93 62.12 62.64’ 64.85 54:96 5455,Prosvero 66.63 65.97 65.06, 64.88 67.87 63.67 51,19 52,50 41.91, 41.85 42.15 41.50’ 4575Pueblo ‘ ; 95.06; 100.24, 90.14 98.45 96.10 94.72 75.80; 76,80 68.85, 69.35 61.15 62.211 59.93
State Av. ‘ 75.87 76.87 75.51’ 73.96’ 72.52’ 70.92’ 57.3& 51.28’ 42.8& 42.66’ 42.39 42.13’ 32.11
lndirates approximate laration of District fnr svhirh Counties are given below.

STATE OF COLORADO 133
ASSESSED VALUE PER ACRE OF NON-IRRIGATED FARM LAND 1923-1937
(Compiled from Reports of the Colorado Tax Commission)
COUNTY 1926 1926 [ 1927 1928 1929 1930 1931 1932 1933 1934 1936 3936 3937
*Neflhwmlp I
Ijist.ChaFes ———‘
I
Clear Creek.. ,._J ‘ *Eagle 32.98 30.61 24.42 23.oo 21.82 21.15 21.42 21.01 22.10
Giloin II
Grand I .
Gunoison I 15,60 11.61; I
Jackson 10.05’ 8.05. 8.06, 4.50 4.38, 3.00, 3.00 3.00
Lake ——-—ISloffat 6.41. 6.37 6.601 30.36 15.18’ 30,49’ 8.91 8.16. 6.61 6.61 6.11; 1.97 5.71Park 15.00 15.00 15.02 15.00! 15.00 15.00, 12.00 12.11. 10.80 10.88 10.84 50.84 10.81
Pitkin 20.00 20.00 20.00 20.00 10.00 8.03 8.92 8,81 8.55 8.56 7.35 13.51Rio Dlanro 22.01 21.57, 21.85; 16.91, 15.74 14.62 11.00, 12.61 0.26 0.91 8.10 7.84 8.21Routt 18.17 20.17’ 20.00 20.13. 20.21 19.92, 15.93 12.07 0.70 9.10 9.21’ 9.31 8.52Summit I
Teller 10.53. 10.34 10.28 10.01 10.01 9.73 8.00’ 8,34 7.81’ 8.25’ 0.14 8.01 8.10
°N.Ceo.-N..
. •,H rBouldoi 11 10 , 34 65 34 68 83 29; 38 00 23 aS 20 35 17 18; 17 23 17 27 17 35 17 32
Jefferson .,...; 45.00, 46.00, 26.03’ 23.21! 33.74’ 21,69 16.10 14.50 12.82’ 13.86 13.97, 20.20 22.39Larimer 20.00, 20.011 18.00 19.00; 17.50] 17.10 18.62 12.26 oI 8.70 0.50 6.46 6.51Logan ‘ 16.01 19.11 15.00’ 14.76’ 14.31, 11.40 9.47’ 6.89 6.41! 5.00, 1,00, 5.20Morgan ‘ 11.45; 11.38; 11,21’ 10.73 10.7fi 9,70’ 7.72 6.93 5.05 5.69 4.71 4.68’ 4.66Sed,jn ci, 21 61 2170 21 1’) 2172 21 ° 21 o5 1710 1 ‘sO 11 0° 11 ‘so s or o 8 8 ‘0Weld ‘ 11.02 30.901 30.86’ 30.39’ 10.89, 39351 8.92 0.08, 6.901 6.711 5.22’ 5.27 4.16
E.C.entrsl1
.
Adams ‘ 11.29’ 11.371 11,10, 31.18 11.40’ 11,17’ 8,73 8.10 7.20’ 7.19 7.14 7.05 7.17Arapahoe ; 10.17’ 10.09 9.98, 9.90 10.20; 8.09 7.01] 6.48 0.11 6.11 0.01 6.36Cheyenne 31.69 11.58 10.29’ 10.38. 8.26 8.29’ 6.61 6.62 1,06 5.07 3.70 3.70 3.79Denser ‘
, ‘ ,Douglas ..‘ 17.36. 17.62] 37.59! 17.59. 15.96) 11.90! 12.75. 11.30; 9.37] 0.34’ 7,01, 7.08] 7.84Eltej’t 15.36 14.801 14.35] 14.46’ l4.44 11.8k 0.111 8.59; 7.57 7.53’ 7.54, 7.16’ 7.96El Faso 1 0 1o25 1018 la4l 1228 1174 910 92a 72° 72° 614 664 630Kiowa ‘ 10.89, 10.41; 7.92 9.92; 9.34 °°! 7.21’ 6.17’ 1.53 5.13 4.16 4.08 4.00Kit Carsoo 14.99 15,13 15.28 13.69; 11.44] 11.12’ 8.76 0.68, 7.74 7.76 5.73 5.74 3,73Lincoln 12.04 11.77 11.07 10,72! 10.11] 0.67 7.04; 6.15] 4.86 4.84 3.62 3.64 1.63Phillips 25.83 25.22 20.49, 2597] 23.90 25.81 20SF 11.44] 11.14] 1 1.53 8,70, 8.68 8.71Washington ] 12.18 12.40 11.03 9.37; 0.01 7.06 5.66; 5.72 5.15 5.11 1.91 3.89 4.01
Yuma 10.17 19.32 19.52 19.44 29.36 18.05; 13.301 11.49’ 0.27! 8.28) 6.38. 6.38 6.20
eW. Cen.-S. ‘ 114’.Dist. ‘ . ‘
Arehuleta ] 10.11, 10.11 10.39, 10.12, 9.87) 10.33 0,26 7.33, 7.52, 7.27 7.27, 7.98’ 7.43
Delta ‘ 18.37 37.50, 18,70 17.61 17.05; 16.63 14.01’ 13.12 10.66; 10.86 10.20, 10.42 10.76Dolor 4.90 4.12’ 10.20, 10.21. 9.511 6.401 0.71 6.21] 5,40] 1.40 5.50, 6.00 6.00
Garfield 21.26. 19.63 20.35 19.98’ 19.63’ 19.90’ 16.60 14.12’ 30.30 11.33’ 11.03 10.97 7.56
Hinodale 10.00, 10.00, 10.00 30.00, 16.00 10.00 9.00, 10.00 10.00;, 10.00 30.00
La Plata....J 16.93 16.09’ 14.10’ 13.90 15.15 15.33’ 12,771 12.691 11.05 10.22) 10.44; 10.00 10.32
Mesa , .i 81.29 28.56’ 12.00 11.49’ 12.83. 13.41 12.83Montezuma — 19.43, 19.76 19.61] 18.30’ 15.00 14.95 11.63; 10.59 9.59 9.04 9.31 9.11 7.31
Montrnse 16.09] 18.01 18.45 10.01 1 6.27 15.42 12.70 12.88 10,64 10.31’ 10.00 9.34 9.54
Ouray 10.00 10.00’ 10.00’ 10.00 10.00’ 10.00 8.50 8.50 7.65 7.00 6,91: 7.27’ 7.39
San Juan , ----1San Miguel 19.32 19.03. 19.40 17.69 19.12 18.07 13.81 11.26 11.70 11.66’ 11.64 11.60. 11.22
*5 Central’Diet. ‘ — I ; , I , , I
Alamnsa 15.00 laOS 15.00 15.00’ 15.09, 15.00 11.00. 9.00 7.00 7.00 7.00’ 7.00 7,00
Conejos ‘I
Costilla 3.00 8.00’ 3.00 3.00’ 3.00 3.05 2.61 5.05 ‘
Mineral _‘ . ————,————; ————I
Rio Grande_, . I ISagnorhe ;‘
S.E.Dist. ‘, r
Dora 6.25 6.25, 6.06, 6.25 6.23 6.25 3.00 5.02 4.aO 4.50, 3.89 8.37. 3,3.m
Bent 13.03! 10,87] 15.48 16.39 11.30’ 7.16 4.36, 4.28 4.03 3.56; 3.75 3.75 3.7’i
Crowley 10.02’ 9.05 9.01) 9.11 9.16 8.98 6.59, 5.59 4.63 4.96; 4.41’ 4,44 437
Custer I 20.05 10.00 16.81 14.41 19.61 14.83 9,99 9.47 10.53 10.331 9.88, 9.67 9.91
Fremont 7.09! 8.64 9.94 10.38’ 9.241 8.94 6.34’ 7.02] 5.61, 5.85 3.23, 5.22 0.25
Huerfono 7.14’ 7.15 7.23 7.61 7.13 7.20 5.09] 6.14, 3.07 3.04; 4.25 4.06 5.13
Las Animos_ 10.011 30.00) 10.00’ 10.00 10.13 10.00 8.00] 8.04, 9.90; 6.00, 6.01 5.01 3.03
Otero . 13.92. 10.16 10.13 10.62 02.53, 12.21 80.91; 10.11. 5.06; 0.69] 6.64 6.40 6.50
Prowero 6.76 6.74 6.06 5.73, 1.18 5.18] 4.12 4.15 3.71 3.81’ 3.76 3.78, 3.76
Pueblo 16.15 16.26] 16.50!16.09) 16.64, 13,43 12.35 12.35) 12.15 60.16 12.30, 11.30; 11.15
Slate Av._! 12.89’ 12.84) 12.45! 12.091 11.38) 10.84) 8.81! 7.94, 6.61 6.86) 5.34 5.32 5.29
*Indirotes approximate location of District for which Counties ore given below.

t34 ACIRXCULTURAL STATXS’JXVS
HORSES, 1930-1937(Number Assessed April 1)
COUNTY 1910 1931 1932 1933 1934 1936 1936 1937
Chalice 921 693 934 999 807 616 I 624 916Clear Creek 124 210 229 192 221 226 222 245Eagle 2,348 2,297 2,131 1,958 1,811 1,904 1,855 1,997Cilpin 125 130 125 122 126 141 135 131Grand 2,201 1,819 1,948 1,992 1,843 1,811 1.920 2,060Guonises 2,528 2,523 3,139 2,107 2,262 2,511 2,527 2,598Jeetsos 2.580 2,862 3,138 2,956 3,994 3,193 3,189 2,760I,ake 231 159 194 123 152 152 113 81MEtal - 5,281 4,571 4,123 4,326 3,904 3,802 3,638 3,343I’ark —- 1,643 1,774 1,656 1,713 1,714 1,754 1,685 1,7321111cm -- -- 547 522 779 735 758 799 919 947hi0 Illanee 2,600 2,465 2.920 2,155 2.140 2,691 2,634 2,252hull 1,638 9,399 5.288 9.050 4.912 5,071 4,608 5,192Summit 465 449 439 445 360 399 102 420‘I’,’llci’ — 689 664 614 604 713 79.3 655 697
‘ ‘Iotal NorthwestlIst. . 28,287 27,068 27.080 26.111 25.290 25,646 25,225 25,273
]tuulder . ‘ 3,473 3,591 3,274 3,439 2,923 3,142 3,047 3,054.tell’rrsc’ e .. 2.912 2,921 2,879 2,776 2,666 2.955 2,781 2,679Larinc,’e I 7,764 7,452 7,816 6.444 6,233 6,176 6,061 5,891logan 9,831 9.503 6,005 6.172 9,106 7,600 6,732 6,034Morgan - 8,167 7,596 7.277 7,620 7.406 6.869 , 6.422 6,053SeIne i 1 ° 0 2 399 2 159 96 ‘ 9 1 9$3 3 91 1Weld 22.000 31,071 35.147 1951’l 11,326 17,871 36.052 15,670
‘TelsI N. Ceo- —
Iral and N. C.Mist. 16,673 54,131 31,908 19,011 - 70,063 16.796 43,706 40,336
Adams 5,772 5,669 4,676 1,656 4,626 4,230 4,246 3,954Arapahee 2,660 2,646 2,479 2,676 2.901 2.701 2.761 2,266Cheyenne 2.601 2,370 2,167 2.616 3.496 2,134 1,670 1,430Denver —- 613 SIC’ 129 572 516 490 306 301Deugi. 1,917 1.111 , 1.547 3,5e7 . 1,613 1,356 3.267 1,367Elbert 5,926 F 1,’154 5.155 1,367 3,316 4,727 , 4,330 4,433El Paso 4,670 1.157 1,016 5.092 1.550 4,664 4.366 4,286Kiowa 1,110 557 604 ‘ Ill $66 685 469 1,511Kit Carson 7,393 7.622 9,054 8,377 7,115 1,697 4,713 3,963Lincoln 5,467 4,945 4.763 4.977 4,649 3,617 3,316 2,667Phillips .. 3,264 3,283 2,794 2.616 2,613 2.259 2,274 3.666Washington 6,728 6,378 6,038 6,477 6.706 7,162 6,990 6,620Puma 8.932 1.197 7,602 7,374 7.790 6.691 6,404 5,913
°Tolal E. Central Dist. 59.323 16,613
F31,771 53.170 33,936 47,269 43.171 F 40,791
Arehulets 1,161 1.275 . 1.231 1,243 1.277 . 1,247 9,367 3,372Delta 3.84$ 3,175 j 3,646 7.607 3,621 ‘ 2,718 2.249 3.317Dolores 464 415 496 171 133 117 470 461Garfield 4,691 5.316 5,366 4.423 ‘1, 166 4,303 4,433 4,141Hinadale 359 196 319 109 194 206 213 219La Plata 2,931 2,656 2,677 2,167 3,101 2,660 2,789 2,064llesa 1.510 9,325 4,749 1,263 3,131 1,562 5,729 9,761Monteesma 2,311 1,725 2,421 2,359 2,692 2.103 2,374 2,461Montrose 4.724 1,703 3,299 3,191 3.671 3,363 3,7 13 3,759Ouray 590 609 625 610 I 530 F 573 636 611San Juan 44 37 32 31 32 24 23 16San lliguel 609 F 713 711 633 716 754 679
Tetal ‘IV. Ceo-Oral and S WMist. 27.064 26,032 23,327 25,168 20,307 25,754 26,611
Alamosa 1,656 1.460 1,411 1,292 1,271 1,160 1,395Conrjos 2,113 2,116 2,969 2369 2,431 2,279 2,426Coshihla 1.315 1,695 3,229 1.091 ‘ 3,195 1,614 1,911Mineral 323 260 205 208 214 ‘206 I 199The Graode-_ 2.437 2.196 1,841 1,818 F 1.922 1,776 1,613Saguache 2.415 2,109 1.117 2,156 2,196 ‘ 1,046 1,946
Total S. Ceo- IOral Diet. 10,327 iPZ, 8,667 1,934 9.139 8,439 8,431llaea 6.164 7,167 6,996 7.217 6,420 2797 2 050Bent 4,412 4.267 3,978 4,291 1,999 2:738 2:824Ceosvley -- I 2.176 2,597 2,258 2,099 F 2,378 1,884 3925Custer 3,311 1,692 14.33 1,193 3.126 3.167 3 293Premont . 3,432 3,299 1.313 1.314 1,319 1,578 1,560Huerfano ‘ 1,156 1.919‘F 1,896 1,142 F 3.679 1,623 1.531t,as Aoima- 6,908 6,110 . 6.100 6,100 .9,641 3459 4:921Otero 1,157 5,201 4,906 1,639 ‘ 4,634 3,681 3 782Prowrrs 8,614 8,515 5.329 7,912 7,100 4 778 4366Pueblo , 4.405 4,241 4,263 3.695 3,785 3:185 3:016
Totol SoothesatDistrict —.. ‘ 43,933 12.431 11.034 49,236 30.981 29,101 27,001
State Total - --- 225,609 216,911 208,790 203,038 205,019 173,400 160,452
25,8151.2032,1021,148
2263,8321,957
0,7923,9473,4272.9341,1953,4763,7051,9634.269
33.453107,972
tndirstes approximate leestiocs of District for which Coooties are given above,

STATE 01? COLORADO 135
MULES, 1930-1937(Number Assessed April 1)
COUNTY 1930 1031 1932 1933 1934 1936 1936 1937
Chaffee 18 21 17 11 j 17 8 6 20Clear Creek 2 1 1 7 19 -
Eagle 62 99 87 71 17 70 57 60Gilpin 1 1Grand 18 14 14 15 14 12 11 24Gunni un °o6 9a6 i 18 210 1 181 is IaJackaun 51 27 I 20 30 11 19 8 16Lake 2 IMeffat 211 137 158 141 I 81 75 71 51Park 63 74 73 11 39 53 48 42Pitkin 14 12 25 27 27 I 29 5 21Rio Blaneo 179 172 221 217 172 197 144 94Routt 20 36 91 05 61 42 47 67Summit 1 2 2 2 2 4 2 2Teller 40 34 12 40 57 33 31 34
Tota1 NorlhwestDial. 978 881 980 949 733 700 583 589
Boulder 382 335 406 712 292 263 261 216Jefferson 144 111 115 119 121 115 121 517Larimer 819 660 634 991 500 521 907 479Logan soo coo 686 660 639 602 564 432Morgan 764 733 607 724 645 576 653 562Sedgwiek 275 251 212 197 210 200 180 141Weld 2,132 2,010 1,944 1,810 1,839 1,630 1,721 1,641
Tata1 N. Central and N. E.fist, 5,307 4,820 4,704 4,577 4,242 3,829 4,007 3,652
Adama 392 129 306 300 271 210 246 214Arapahue 200 214 164 149 115 118 114 120Cheyenne 102 242 208 241 225 118 77 77Denver 53 13 32 47 55 60 8 14Douglas 69 06 72 71 78 63 44 59Elbert I 715 720 604 141 427 367 284 316El Puso 6,124 1,119 1,142 1,111 930 686 001 487Kiowa 166 171 136 115 87 48 43 114Kit Carson 1021 811 1,006 686 453 311 231 166Lincoln 681 611 182 482 392 208 214 120Phillips 300 300 553 747 319 264 206 185Washington 628 609 476 444 341 287 26(7 286Yunia 1,226 1,116 1,130 1,018 791 608 470 506
°Tolal E. Cm-Oral fist. 6,948 6,610 6,220 5,610 4,544 3,500 2,809 2,627
Archuleta 50 58 47 66 44 56 47 55Delta 501 341 324 533 474 208 236 460Dolores 10 1.1 40 96 53 49 55 44Garfiekl 264 270 260 250 247 799 303 500Hinsdale 2 1 2 4 2 2 1La Plata I 171 167 124 145 100 108 108 101Mesa I 430 302 520 372 348 368 3:17 336Montezuma 577 249 216 538 204 253 187 161Muntruse i 3D 2a3 2s0 2s0 264 256 242 202Ouray 46 36 40 35 49 50 41 41San Juan 30 30 19 57 33 22 14 12San Miguel 31 24 41 17 55 69 69 76
CTotaI W. Central and S. W.fist. 1,858 1,787 1,752 1,832 1,968 1,750 1,674 1,795
Alames’s 147 114 111 100 118 111Conejos : 254 262 248 227 210 784 161 141Custilla 16 84 100 78 79 61 66 71Mineral 12 15 14 12 11 12 14 8Rio Grande 480 412 400 101 443 403 193 511Saguaehe 240 211 202 245 212 181 102 114
Totai S. Central Dist. 1,189 1.118 8,079 1.065 1,093 954 077 768
Daea 650 878 613 013 418 —y —
Dent 465 440 415 416 172 278 262 9417Crowley 317 389 182 330 252 184 221 167Custer 29 33 27 43 38 76 49 44Fremout 130 141 191 118 177 110 160Huerfano 416 215 217 211 111 323 125 123Las Animas 1,160 860 650 615 582 576 433 423Otero 826 064 904 112 8u 1 685 631 621Prowers 1,084 1,049 767 190 4.19 722 211 266Pueblo 396 393 417 615 328 388 so iso
eTatal Sautheast -
fist 5,653 5,572 4,73u 4.261 3,591 2,997 2,659 2 275State Tetal 21,994 20,588 19,150 16,524 i6l71Ii3.8l9 iTW 11,707
5lndicates approximate loratien of District for which Counties are given abuve.

116 AGIIICULTURAL STATISTICS
COUNTY 1930 1931 1932 1933 1934 1935 1036 1917
Chalice 5,804 6,214 5,191 7,041 8,510 7,572 7,441 7,716Clear Creek 296 442 326 302 370 421 451 482Eagle 17,532 19,396 18,453 18,768 20,914 20,218 19,678 21,270Gilpin 533 976 543 352 893 1,139 1,001 052Grand 12,035 13,304 13,064 33,650 15,607 13,577 15,913 14,561Gunnison 29,296 31,645 31,984 33,205 36,851 31,170 35,114 35,051Jackson 27,462 29,532 31,204 31,742 35,621 32,027 31,361 33,237Lake I 557 564 582 001 761 763 700 880Mollat 13,995 15,540 15,085 18,151 18,539 10 763 16,913 16,519Park 12,212 13,410 14,693 14,412 15,533 15,504 16,139 11,930l’itkin 5,331 5,532 6,051 6,130 0,250 6,712 7,157 7,066Rio lilanco 27,633 30,019 31,562 35,251 37,233 35,951 34,030 31,201llsittt 27,749 31,040 32,928 36,584 36,030 32,023 32,100 31,001Summit , 3,030 3,320 3,433 1,415 3,713 4,959 , 4,011 4,121‘feller 5,048 4,949 5.289 5.027 5.799 5,921 5,733 5,739
•‘fotal Earl liwestDistrict 389,401 207,628 210.388 225,948 242,670 232,791 228,303 228,720
Boulder 11,632 11.058 13.229 12,124 13.619 I 13,199 12,079 12,359Jefferson 13,634 14,322 14,455 13,493 13,813 14,907 12,505 12,159Imr, leer ‘ 24,593 26,213 27,138 25,099 28,052 28,400 25,264 23,980Lagan 25,425 27,944 30,270 29,091 11,928 37,010 29,925 30,035‘11 lu’si 162,9 1 “79 18 46 iSa o 24911 22 Os 11648 194Sedgss’irk 7,464 8,155 7,587 ‘ 1.449 9.422 9,122 0,301 6,672Weld 41,715 ‘ 46,250 40,514 ‘ 52.107 71,106 10,101 45,274 47,103
aTatal N. CenIra! and N. E.District 140,742 152,517 159,330 161,018 175,714 574,988 ‘ 148,858 153,787
Adams 12,297 ‘ 12,746 11.955 11,510 16,224 14,203 ‘ 13,377 14,090Arapahse 10,597 10,197 10,226 11,972 12,014 12,052 11,700 11,625Cheyenne 20,674 19,329 21,308 24,490 31,597 26,526 16,249 17,096Denver 350 337 900 211 515 472 421 390Douglas 17,173 19,218 19,713 17,145 17,040 17,573 16,371 16,389Elbert 25,314 20,080 20,130 25,711) 27,70a 23,629 22,056 28,952El Paso ‘ 28,202 28,352 , 31,168 20,540 31,220 , 30,877 25,393 30,061Eiewa 13,724 I 13,022 13,074 i 16,192 36,990 13,542 9,038 14,9471(11 Carson 22,113 ‘ 24,369 28,231 ‘ 31,167 27,147 ‘ 50,468 22,270 18,179Lincoln 28,143 20,479 30,658 10,778 34,000 31,126 27,604 24,979Phillips 6.401 0,0.28 7,244 7,121 9.440 0,379 9,107 9,122‘\\ashiugto, lJ1 0 9 4 III 399 3)311 503 3 jITuma 3 599 I p 3b 3i6 3ll6 17 )9 l008 31 4 Sn 17
5Tatal E. CenOral Distriet_ 245,851 252,961 269,307 276.750 222.756 282,728 241,779 266,060
Arehuleta 0,522 10,802 10,147 11,981 12.902 11,119 10,529 12,821Della 21,085 22,729 22,786 23,709 22.402 24,945 20,010 21,711Dolores 3,123 4,14.1 1,119 5,917 ‘ 4.917 4,243 3,421 4,110Garfield 27,970 50,950 32,100 11,073 34.371 32,204 50,170 21,705Hinsdale ‘ 1,637 1,396 1,842 1.742 1.808 2,245 1,015 2,151La Plata 14,224 15,100 15,713 16,207 10,018 16,677 15,700 16,557Mesa 39,501 39,848 40.203 44,414 45,707 35,091 41,110 39,170iolontcaonsa 11,013 12,743 13,150 15.761 56,004 14,331 12,275 13,121Montrose ‘ 18,279 20,686 20,661 23.290 22,557 21,946 21,601 20,620Onray 6,633 7,564 7,626 8,104 7,422 7,083 7,921 7,844San Juan 170 217 207 210 303 171 211 170San Miguel 1,736 0,190 6,542 0,714 9.105 7,574 6,550 0,741
Tatal W. Central and S. V,’.District I 159,992 172,468 175,445 186.153 209,509 187,329 172,715 177,944
Alansosa 7,013 8,430 8,487 8,000 8,086 0,255 7,760 — 8,520Cnnejos 11,934 11,041 11,611 15,302 11,024 14,034 12,986 13,037Csstilla ‘ 2,340 2,031 2,167 2,244 2,921 2,211 1,675 1,701Mineral 1,464 1,223 1,373 946 1.506 949 1,171 1,029Rio Grande 10,609 10,567 9.727 0,552 10,671 0,171 8,526 0,012Sagoaehe 25,923 25,997 23,034 26.191 27,416 25,309 21,085 21,447
eTatal S. Central DistricLi 59,803 60,189 57,199 62,811 67,236 60,729 52,203 57,826
lInes 23,457 20,912 26,278 34,332 30,000 18,058 10 392 0 161Bent 14,572 11,830 16,879 17,946 19,788 11,034 9016 12013Crosrley i 6,013 9,250 11,024 6,907 13,103 9,484 7,067 9747Custer 10,620 7,337 7,670 7.247 7,034 7,369 7,421 8 157Fremnnt 0,731 9,820 10,026 10,209 12,056 11,604 10,906 10,483Huerfano 12,805 12,025 12,605 12,424 11,880 10,723 10,070 11 102Las Animas 44,103 40,712 52,704 57,171 68,378 51,160 45,552 43,114Oters 14,608 14,037 14,531 15,410 10,125 12,879 11,340 12 513Prosvers 17,724 20,773 23,612 25,161 28,615 20,072 13,321 13 159Pueblo I 22.008 25.074 21,572 10,869 19,278 15,429 15,500 19.201
aTatal SautheastDistrict 177,681 187,570 198,905 205,906 211,564 172,012 142,195 149,302
State Tatal 972,560 1,033,151 1,070,581 1,118,916 1,240,459 1,111,687 988,135 1.027,648
ALL CATTLE (Less Number Fed in Transit), 1920-1937(Number Assessed April 1)
4lndieates approximate location of District for which Counties are given s,bove,

STATE 01° COLOEADO
DAIRY COWS, 1930-1937(Number Assessed April 1)
COUNTY 1910 1931 1932 1931 1914 1985 1936
Chatree 901Clear Creek 190Eagle 1,192Gilpin 39Grand 1,211Gunnison 1,209Jackson 600Lake I 103Moffat 1,400Park 692Pitkin 593Rio Blanro 711Routt 3,126Summit 160Teller 170
5Total NsrlhwestDistrict 13,134
Boulder I 5.900Jefferson 4,916Lacimer 6,618Logan 7,040Morgan 6,069Sedgwiek 2,678Weld 20,167
5Tol’d N. CenIraI and N. F.District 32.368
Adams 6,760Arapahoe 4,359Cheyenne ‘ $13Denver 550Douglas 1,585Elbert 6,352gi Paso 7,180Kiowa 167Kit Carson 5.103Lincoln 2,950Phillips 2,977Ssrashington 2.380Yuma 7,866
*TotaI E. Cm-Oral Distriei 52,798
Archulela ‘ 651Delta 4,19.5Dolores 323Garfield 3.313Hinsdale 266La Plate 2,415Mesa 6.158Stonteeuma 2,538Montrose 9,181Ouray 483San Juan 27San Miguel 619
tmTstal W. Central and S. IV.District 24,537
Alamosa . 3,164Cunejos 55$4Costilla 303Mineral 82Rio Grande 1,502Saguarhe 801
5Tatai S. Central D5strict.: 5287
Baea ‘ 1,535Bent 1,489Crowley 939Custer 603Fremont 1,664Huerfano 1,756Las Animas . 5,737Otero ‘ 5,261Prowers 2,673Pueblo 4.571
890 892 841 864 91396 105 120 120 102
1,267 1,302 1,429 3,565 1,33340 68 76 82 92
1 210 1,275 1,278 1,219 1,1621,235 1,322 1,570 1,282 1,264
722 550 779 852 781277 318 330 190 195
1,525 1,826 3,652 1,595 1,249791 955 951 835 988376 402 454 378 559702 722 742 697 657
3394 3,031 2,901 3,098 2,991301 336 380 516 520
1.005 922 937 761 915
13,998 14.024 14,440 12,561 13,462
6,572 5867 5,103 ‘ 5,2025,641 ‘ 6,453 6,342 5,475 4,9877,862 7,665 7,178 9,276 5,4247,652 9,413 9,534 7,060 6,5517,391 8,695 6,132 9,610 5,9492,463 2,822 2,854 2,429 2,473
20,035 21,487 22,234 19,251 19,280
57,022 62.877 60.141 , 51,886 49,867
15 7,511 6.656 6,189 6,4556,152 ‘ 6,116 ‘ 6,210 5,558 6,040
917 2,909 2,901
4.459 4,971 4,252 5.720 5,8857,260 7,454 ‘ 6.391 5,862 6,9959,471 10,183 0,356 9,197 9,78t
670 761 754 569 3037.096 9,243 7.677 6,015 5,5153,461 5,704 2,031 2,886 2,8977,175 4,493 3.643 3,669 3,4731,9.115 4.205 4,253 3,035 2,3076.347 9,221 9,515 5,509 9,584
61.620 70,338 61.191 55,593 55.193
066 1,160 180 1,967 . 5,15J5,257 . 5,567 . 5,213 . 4,095 i 4,709
451 ‘ 602 587 I 320 4023.454 5,432 3,097 2,849 2,769
50 59 78 88 872.277 2,992 2,278 2,396 3,5688,799 7,579 0.549 5.278 5,7927,294 3,153 3,127 2.812 2,9493,710 3,802 3,944 3,119 3,440
502 525 495 555 51235 42 40 45 51
753 791 603 016 651
29,521 29,896 27.696 26.199 26,0722,120 3,155 1,088 J 1,097 1,1491,015 1,622 1,819 1,421 1,551
475 492 140 169 50670 89 96 81 80
1.773 1,909 1.028 1,992 1,8571,052 . 1,005 1.s29 950 1,052
6.135 6.420 6,406 6.026 6,0951,731 1,027 1,122 085 1,2005,506 1.479 1,458 1,224 1,1901,110 1,419 943 909 985
018 1,012 945 1,129 1,1991,442 1,880 1,954 1,012 1,7091,724 1,262 1,598 1.740 1,2102,852 2.809 2,950 2.651 2,4415.947 3.855 3.113 2,992 3,0754.972 4.402 2,907 2.511 23054,722 ‘ 5,145 4,841 4,214 4:254
24.709
__________
1,1711,870
40282
1,250955
5,151 5488
1,759 1,9451,616 1,5521,230 1,205
808 8931,436 1,1241907 1,05.12.344 2,5283,252 3,5794.202 4,0154.454 ‘ 4.451
__________
Tatal Ssutheast I ‘
District ‘ 23.248 22,755 22,259 24,759 24.431 22,009 19,971
Slate Tatal ‘ 171,382 168,487 178,013 192,961 , 208,176 394,883 173,146
1537
137
82797
1,21044
1,2201,187
707185
1,506688415717
3,333265970
12,8520,2154.0440,0357,6050,1.112.520
21.574
35,1777,1004,770
930525
4.4795,993
10,002‘102
7,11002,8513.9063,3909,049
56,468828
5.1)23199
3,04043
2.sss
2,0223,065
‘159It
679
85471
1,21058
1,3071,232
981191
1,266731442719
3,033308549
12.6125,7744,0729,2397,3495,8362,208
20,902
53,0316.061‘1,511
978537
4,5’ll3,8452,553
5195,0033,2782,9924,1574,561
49,113011)1
4,890172
3,48178
2.5219,s212,7075,529
47542
728
25.525
1,1191,749
22584
3,296981
19,563
170,265
*Indieates approximate location of District for which Counties are given above.

A(IRICULTURAL STATIST It’S
Chaffee 1,114 1,314 4,127Clear Creek 1,117 841 119Eagle 21,813 21,721 24,44aGilpin 41Grand 24,191 13,481 10,919Gunnison 48,813 16,134 96,44sJackson 37,141 46,133 42,0GbLake 5,931 11,111 1,150Ilotlat 88,721 91,841 91,641lark . 42,040 48,903 47.068Pittin 28,219 14,991 29,200lIla Dianca 69,971 71,247 70,524Itatitt I 70,179 i 70,165 72,027Siiaiaiit 29,731 33,497 20,148‘teller __ 350 330
e’j’11 NscthwcstiIlistrirt 490,383 499.258 484,202
liotilder ._. 5.098 3,800 4,309,Jeltersus _., 3,008 1,70a 1,a29l.arinser 15,625 14,704 15,577l.upan 3,517 2,711 3,012llorgaii 1,946 2,s17 lOaDSeduwirk 3,137 427 38Weld 23,759 21,518 27.lat
Tatal N. Central and N, N.District 53,300 54,002 51,942
Adams 5,002 3.412 2,920Arapahee 7,843 7,830 4,722Cheyenne 10,414 0,715 10,421DenverDouglas 1,070 5,980 3,012Elbert 10,114 11,320 9,801El Paso 6,024 6,657 9,511Kiowa 8,400 6,078 1,100Kit Carson 4,340 3,511 4,163Linealu 10,373 11,423 11,150Phillips , 212 303 534Washington 13,541 18,206 12,683Yuma 3.121 2.117 1,041
5Tstal N. Central DistricL_ 81,0a4 86,612
Areholeta 22.369 32,765Delta 52.503 58,435Dolores 16.761 22,550Garfield . 87,854 105,057Hiosdale 01,168 4,980La Plata 51,188 10,470Mesa 08,680 63,470Montezuma 42,731 32,164Montrose I 82.660 74,757Ooray 11.746 14.414San Juan 8,999 10,874San Miguel 40,070 18.552
iTatal W. Central and S. W.District 968.281 482,537
Alamosa ‘ 8.472 15.098Conejos 82.554 85.118Costilla J 23.228 25,150Slineral 11,721 13,096lIla Grande 51.210 49,560Sagaaehe 79.210 74,361
‘I’alal S. Ccn- Itral District__i 256,024 257,295
llae;L __________ 7.580 7,520Ilent _________ 17,531 13,019Crowley ____—__ 6.089 7,23Custer ______—_——- 4,286 4.6n8Frement 2,850 2,8z8Huerfano ______ 25,420 23.819Las Animos 78,092 82.197Otero _____I 29,527 30,019Prowers____——_ 13,013 0.101Puebla ________ 12.432 10,214
Tats1 SsethcastDistrict F 190,611 190S87
State TalsI 1,640,659 1,571,510
5,612 5,799 5,683 - 5,221 5,886104 90 200 ____ 3,780
22,751 29,977 25,442 24,201 26,450
200
____ 3111,085 19,944 17,940 16,000 15,66353,086 61,751 55,406 94,257 59,17238,890 48,060 , 31,716 12,937 15,65110,990 30,644 8,460 2,110 . 2,120
114,361 101,181 ‘ 101,611 121,901 101,68043,545 42,648 41,787 34,776 43,15428,192 32,056 32,072 21,029 23,24572,201 01,644 66,508 61,095 58,51379,562 84,430 84,114 88,315 , 01,22115,883 29,895 27,180 24,449 33,317
9 625
491,090 540,944 499,669 . 188,588 499,7792,369 2,535 3,282 1,250 1,8181,712 600 2,642 1,000 1,2399,500 17,659 18.828 27,001 I 17.6712,265 2,408 3,700 . 2,488 2,6602,910 4,111 4,110 2,612 ‘ 4,568
132 228 410 185 1,32027,630 - 34.305 — 20,746 27,799 21,341
46,578 62,151 60,358 64,443 12,6403,715 6,387 5,230 6,384 9,0907,310 5.863 5.471 6,862 10,514
11.761 15,024 10,816 11,319 14,69:3
1,021 1,145 1,740 2,024 1,29011,404 17,158 14,098 19,510 21,1816,510 6,111 8.821 4.167 7.0118,120 8.238 8,172 7,121 0,0145,212 5,606 4,028 6,290 3,656
19,862 0,092 11,176 11,418 12,509180 1,221 110 075 088
14,507 17,070 11,655 15,726 14,0111,755 5,090 2.029 1,16.3 1,835
97,149 86,248 92.945 100,52424.052 25,243 26,316 26,87246,258 44,814 38,153 45,41320,707 20,688 20,289 21,44685,668 64,745 61,620 64,182
7.961 7.238 ‘ 6,624 11.26011,626 34,222 34,163 53,25164,480 98,045 48,265 45,09935,856 30,608 28,060 28,58378,959 61,310 73,701 71,61313,368 20.910 15,623 16.95 l11,487 10.718 9,524 10,152
________
42,422 40.303 39,054 40,337
STOCK SHEEP, 1930-1927(Number Assessed April 5)
COUNTY 1010 1011 1932 1933 1914:
1035 1050 1917
75.163 85,17027,770 22,8i’G69,009 48,35021,640 17,974
104,852 73,7663,070 3,606
51,110 26,10170,748 68,16635,112 32,71076,111 71,15517,312 16,6160,864 8,364
40,291 98,800
507,269 424,03812,555 16,70862,534 85,52318,196 18,38511.420 14.46340,150 36,38869,233 63,426
255,890 236,6657,458 7,632
10.335 8,3407,675 3,3023,029 3,1322,610 1,687
21,471 23,11561,384 87.74331,121 23,57710,190 5,67910,445 6,790
186,723 571,1061,341,589 1,431,555
461,98616,35579,61630.37715,55646,14468,360
245,2284,940
14.0594,9183 5751,293
22,36682,69102,792
0,627— 9,600
176,7391,584,401
419,824 406,114 410,36911,408 0,380 14,01560,214 70,228 73.06716,180 17,680 18,19215,243 15,728 15,53845,053 43,066 53,24061,029 60,413 , 66,OSi
231,227 217,395 240,7035.772 3,511 5,3954,262 11,824 10.6335,050 4,190 3,8801.032 4,285 4,162
670 430 3,90022,590 18.685 10,34562,151 51,274 55,26616,318 20,090 21.046
8,274 7,679 0,1246,819 7,515 10,190
126,138 129.221 140,134L412,564 I L398J08 1,461j48
lodieates approximate location of District for which Counties are given above.Includes animals grazed in transit, hot excludes animals fed in transit.

STATE OF’ COLORADO 139
HOGS 3930-3937(Number Assessed April 1)
COUNTY 1930 1931 1932 1933 1934 1936 1936 1937
649
337
56122
18
340
167172980
2095
2,9671,1121,3452,352
11,5537,8455,1707,129
412
353
22111
39
40540
206153737
2,527970853
2,1595,7663,7252,7334,020
1,277
506
9116772
79264
220298
1,6092967
5,1921,802
7792,619
14,0007,4014,563
11,593
42,75711,0201,8903,066
9334,1963,6171,109
15,2075,7868,454
13,18218,127
86,57656’l
2,541107
2,724
1,6793,151
8282,872
220
115
1,080
505
15513440
81349
189246
1,3004086
4.5871,9601,1193,237
28,0008,4224,587
11,378
48,72512,7661,9623,221
2,2877,9224,0761,101
20,0516,9167,658
15,48220,050
102.322
4982,493
1003,077
1,2352,6701,8912,245
366
127
Chaffee 1,459Clear CreekEagle 468GilpinCrand 160Gunniseis 227Jackson 84LakeMoffat 650Park 42Pitkin 315Rio Blanco 321Ruutt 1,428Summit 31Teller 50
tTataI NarlhwcstDistrict 5.238
Boulder 1,432Jefferson - 1,143Larimer 2,581Logan 12,479Morgan -. 9,225Sedgwirk 7,382Weld 10,716
Tota1 N. Central and N. F.District 40,958
Adams 17788Arapahse 1,357Cheyenne 2,682DenverDuuglas 744Elhert 3,698El Paso 3,127Kiowa 1,004Kit Carson 12,424Lincoln 5,264Phillips 7,901Washington 12,859Yuma I 17,496
°Tetal E. Central Dislrict 80,544
Archuleta 414Delta 2,312Dolures 134Garfield 2,711HinsdaleLa Plata 1,580Mesa ‘ 3,350Montezuma 1,021Montrose 4,000Ouray 203San JuanSan Miguel I 269
5TalaI W. Central and S. W.District 13.924
Alamosa 1.444Conejos 2,652Costilla 1,267MineralRio Crande 2.643Sagoarhe 1.190
*35151 5. Central District. 9,196
Bars 6.027Bent 1,842Crowley 1,710Custer ‘ 300Fremont I 1.088Huerfano 448Las Animas 1,167Otero 7,920Prowcrs 6.972Poehlo 3,251
Tatal SoatheastDistrict 27,046
State Tatsi 170,906
516 965
327 435
55 Si117 186
40 53
315 29647 50
198 321145 146073 837
25 2079 60
2,693 3,463756 2,012887 932
2,296 2,5465.718 5,0143.668 3,4752,2-10 1,7563,766 4,626
19,373 29,562
14.830 19,1601,270 1,509
457 280
494 5571,536 2,1821,969 1,692
334 2522,976 1,6321,894 1,3743,058 3,3955,570 4.8795,072 4,112
40,506 41.220293 444
1,815 2,276145 121
1,255 2,015
1,106 1,4021.700 2,779
843 1,1832,56 2,577
165 152
95 128
873
324
94141
32
44844
202217
1,1553155
3,626
1,2301,2042,735
12,0009,8315,2460,370
42,42410,053
1,9982,604
0553,3353,825
89572,825
4,6927,499
1553516,208
80,023444
2,367206
2,920
1,0762,6251,4452.451
250
205
13,889813
2,1701,129
2,063854
7,099
11,0073.173
1.1601,050
3201 .3504.8707.2192282
32,781
179,842
36,906 20,21515,094 14,900
1,852 0212,059 724
759 4522,895 1,9264,031 2,709
665 16011,026 3,950
1,839 1,7696,519 2,706
15.943 4,22717,081 5,268
81,763 40,003507 254
2,294 2.039154 141
1.894 1 344
482 7822,104 2,0201,187 1,0432,440 2.054
230 176
107 82
14,564 14.7051,576 9012,215 2.4511,800 5,175
2,094 1,612835 679
8,120 6,910
6.921 10.5202,550 2,2441,675 ‘ 2,296
59-I 1671,297 1,120
436 4891,150 1,4894,338 6,4815,655 8.7942.958 5.026
27,174 37.222
184.383 214,169
11,599865
1.9511,130
2,224644
7,022
5,7982,506
3011.116
770109
2,5334,0556,1352,175
25,728
165,985
10,035 10,012 13,982532 469 459
2,855 2,666 1,0471,772 1,156 1,430
1.636 1.625 2.672585 -195 549
7,381 6.413 6.9610,962 1.761 1.079
853 867 1,082628 746 756323 340 394850 900 886272 253 277
2,923 819 0592.001 2,713 3,2321,696 1,45-1 1,9041,760 1.793 2,531
12,369 11,336 12,79392,620 90,296 97,982
5lndicates approximate location of District fer which Coonties are given above.

140 AGRICULTUflAL STATISTICS
POULTRY, 1930-1937(Dozens Assessed April 1)
COUNTY 1930 1931 1932 1933 1934 1935 1936 1937
Chaffee 552 971 309 430 437 375 302 031Clear Creek 78 19 37 117 137 175 155 143Eagle 778 785 777 701 091 094 687 714GilpinGrand 513 333 314 335 311 283 231 275Gunnison 811 495 383 377 747 I 383 335 347Jackson 200 297 312 40 72 158 140 123LakeMalSat 1322 1,382 5,328 1,236 1,225 1,332 985 834lark 526 512 530l’itkin 255 242 231 210 188 258 330 391Rio lllaneo 735 691 014 594 473 I 594 449 432itc’titt .._.. 2,000 2,206 2,055 3,505 1,927 1,575 1,735 1,614Sunin,it 64 00 58 03 56 70 55 00Teller 158 155 205 258 251 256 201 277
‘lot si Karl hwestDistrict ______ 7,533 7,774 0,928 0,328 6,114 5,768 5,601 5,841
Smolder 5,673 6,279 6,863 6,711 7,247 3.980 5,329 6,192Jefferson 11,383 11,566 5,547 10,420 10,548 9,643 6,457 8,030J,arirner 8,712 8,412 7,568 7.505 8,470 6,666 7,711 7,645Logo,, 11,072 10,760 0,301 9,702 10,070 8,648 7,388 8,416Morgan 8,046 6,831 6,577 1,737 7.705 6,067 1,624 6,886Sedgwiek 3,061 2,833 ( 1,850 2,752 2,101 1,505 2,180 1,272Weld 19,584 18,134 37,588 17.156 38 805 10.241 54.968 17.057
‘Total N. Cerntral and N. K.District 68,361 64,809 59,387 53,623 04,093 55,998 52,277 55,481
Adorns 8,591 7,958 0,770 8,000 I 0,401 5,385’ 5,003 4,037Arapshoe 0,712 7,878 7,132 , 7,707 8.520 7,031 0,370 0,530Cheyenne 3,281 2,507 2,348 2,172 ‘ 2,127 2,218 I 1,013 1,7312DenverDougles 2,557 2.125 1,998 2.0117
. 2.289 2,002 1,084 1,605Elbeet 5,190 4,537 4,254 , 4,722 1,509 1,817 5,501 2,912El Paso 6,740 0,585 0,408 0,5110 5.891 5252 5,077 5,081ICiowa 2,971 2,770 1,741 2,525 2.554 1,715 5,118 1,787Kit Csrssn 0,354 8,354 8,274 7,707 8,100 5,925 4,518 1,421Lincoln 6,932 0,218 5,749 5,402 3.595 3,021 5,515 3,835Phillips 5,119 4,744 5,081 4,404 4,378 5,481 3,085 4,471Washington 9.831 9,413 8.051 8518 3,40.1 6,575 6,508 8,065Ynma 15,750 9,970 8,707 7,705 7,955 6,716 6,250 7,464
5Tetal K. Central District,J 70,789 74,376 6.1,909 65,005 68.571 51,200 48,470 54,725
Arehnleta ‘ 580 099 751 609 51,2 722 671 663Delta 4,068 4,174 3,781 2,703 3,500 3,728 3,800 4,127Dolores 255 255 271 770 482 180 307 326Garfield ‘ 5,539 5,113 2.009 2,874 2,065 2,505 2,178 2,253Hinsdale 11La Plato , 2,355 2,525 1,917 2,102 1,080 2,180 2,204 2,442Mesa 11,420 10,867 7,910 6,722 5.018 5,540 4,898 5,509Montezuma 1,975 2,295 2.209 2,284 2.017 2,120 2,991 2,515Mentense 4,094 3,715 7,958 2,513 2,492 ‘ 2,811 2,012 3,085Onray 241 255 275 ‘ 314 525 253 238 253San Jnsn .
1
San Miguel 420 342 724 178 588 ‘ 358 343 326Tstai W. Can
tral and S. W.District 29,402 28,142 22,754 21.492 , 20.648 ‘ 20.266 19,326 21,690
Alsrnosa 728 782 821 810 , 071 768 608 715Csne,iss 7,011 1,1.50 1,084 1,201 1.575 1,4-10 1,372 1,145C,,stilla 550 744 727 906 715 608 513 049Mineral -. 65 59 53 70 70 85 79 87111., Gran,l,’ ,,_,..‘ 740 683 920 1,515 1,170 1,188 5,255 1.581Sagns”l,e 768 700 045 704 807 010 472 580
‘‘I’stai S. Central District ‘ 5,808 4,118 4,154 5.226 5,290 4,914 4,389 4,561
Siaea ‘ 5,504 0,097 5,805 0.019 5,245 2,722 2,107 2,208Ilent 4,750 4,805 2,856 3,577 3,534 2,597 2,259 2,210Crowley 2,845 2,854 2,984 2.527 2,104 1,408 1,481 1,525Custes 51 51 5 1 20 19 60l”rernnnt 4,421 4,890 4,7(16 5,131 5,529 5,474 3,803 3,750Huerfano 1,226 1,109 002 1,100 1,101 1,217 823 022J,ss Animas 1 2,218 2,040 1,771 1,802 1,878 1,847 1,045 1,505Otero 0,859 0,442 5,558 5,339 5.251 4,172 3,013 5,512Proseers i 7.947 7,414 7,265 7,819 7,014 5,325 4,152 4,097Pueblo i 0,502 6.260 .7,945 4.185 2.700 2,085 2,722 2,909
Teta1 SeuthesstDistrict 42,077 42.764 38.701 37,516 35,295. 20,030 22,454 23.409
State TetsL...... 232,040 222,043j 196,826 191,900 200,821’ 1.70,176 153,577 165,114
*Indicstes approximate location of District fee which Cennties see given above.

U: s.,w4tlnauu 141
MULES
Aver.Assessed Per
Number Value Head14.277 $ 524,559 $30.7423,284 1,991,820 85.5426,280 2,303,481 87.6429,269 2,710,010 92,8029,838 2,843,990 95.3130,040 2,060,731 88.5628,682 2,476,076 86.3320,539 2,054,836 69.5631,741 1,787,209 56.3132,528 1,499,818 46.1035,325 1,490,797 42.3432,939 1,417,710 43.0431,053 1,339,301 421030,306 1,230,836 41.2726,189 1,116,295 42.6325,318 1,072,270 41.0221,994 917,187 41.7020,508 803,274 39.0219,450 692,794 33.3618.324 624,016 33.6036,171 642,376 30.7213,819 594,516 43,0232,609 581,515 46.1311,707 572,706 10.02
RANGE ORSTOCK SHEEP
SHEEP FED IN TRANSIT
Assessed — AssessedYear Number Valise Number Value1916 47.292 $ 927.660 767,466 $ 591,8701017 77,211 1,149,145 946,156 029,6505918 76,651 1,447,860 806,560 1,420,4951919 04,907 1,643,400 656,456 1,151,1553020 72,163 1,266,830 666,810 029,1501921 77,813 3,077,590 1,029,242 679,6001922 82,430 685,285 762,872 730,8051023 03,248 581,495 1,167,399 1,115,0461924 05,829 706,895 1.137.349 1,135,7101023 92,357 760,640 1,370,479 1,485,6351020 96,435 926,405 1,311,463 1,270,8471927 122,462 1,156,235 678,084 883,1561928 101,377 1,239,890 1,292,035 1,660,6251920 127,500 1,830,000 1.502,282 1,750,3005930 i23,623 1,274,369 1,063,330 1,424,8241931 136,268 1,576,450 1,302,892 597,0901932 61,201 527,400 1,306,929 764,7061913 74,086 407,600 1,193.655 684.9161934 110,066 561,433 1.162.147 792,1601933 84,308 455,461 1,007,943 566,8531936 127,826 1,026,570 1,022,334 743,7651937
....
1,106,117 032,550 709,606Note—Assessment made on April 1. Cattle Fed in Transit covers rattle in feed lots after JanuaryI. Sheep Fed in Transit covers sheep and lambs in feed lots after January 1 and also sense sheep onsummer range.
_____
COLORADO LIVESTOCK ASSESSMENTS
HORSES RANGE CATTLEAver. -
- Aver.Assessed Per Assessed PerYear Number Value Head Number Value Head1010 240,913 $7,306,000 $30.39 720,2971915 256,368 20,031,000 67.59 997,623 $37,548,000 $37.631916 308,062 21,729,000 70.54 1,003,153 41,664,000 39.3819 226,002 21,637,000 73.12 1,147,426 40,533,000 40.501908 152,794 20,836,000 76.05 1,262,616 55,236,000 43,751919 154,866 25,234,000 71.16 1,286,547 56,898,000 44.300020 137,903 22,836,000 07.65 1,187,480 51,334,000 42.381921 333,669 18,495,000 51.42 1,123,594 31,856,000 28.351022 310,800 15,150,168 46.15 1,112,209 20,710,000 20.721923 104,202 11,001,589 39.32 1,060,189 20,084,000 24.601924 200,784 10,722,327 36.97 972,384 20,619,000 21.201021 200,094 10,248,460 36.50 905,618 16,623,630 19.001026 266,346 9,634,700 35.90 826,707 17,095,126 20.6219 250,008 6,764,003 15.36 804,545 16,212,260 21.981026 239,759 8,207,666 34.23 796,725 23,622,220 20.641920 233.815 7,893,313 31.75 703,974 20,060,976 34.071930 225,609 7,204,217 32.21 800,106 27,332,372 34.131911 210,011 6,704,193 30.02 904,046 23,119,472 26.731932 208,790 5,592,064 26.76 892,229 14,030,237 16.621033 205,838 5,453,404 26.40 625,952 12,292,490 13.20toll 205.010 6.552,040 31.03 1,032,283 14,176,506 13.931935 167,972 6,463,925 34.30 936,604 13,309,287 14.521996 176,400 6,678,367 38.06 014,009 33,272,931 16.29
0,054,04340.69 051,432 14,104,170 16.66
DAIRT CATTLE
Aver. Aver.Assessed Per Assessed Per
Year Number Value Head Number Value Head1910 63,671 3,469,061 $ 2,165,636 $ 1.461915 101,097 $9,786,216 $57.26 1,157,544 4,032,950 3.461916 110,290 6,727,172 60.09 1,044,380 5,092,433 4.601917 124,342 7,919,512 63.61 1,003,166 7,182,427 7.161016 337,126 9,449,030 00.01 1,164,411 12,619,415 10.871919 143.106 10,170,007 71.06 1,009,037 11,366,972 10.461020 149,901 10,169,207 70.16 915,394 9,230,004 10.061921 145,070 7,991,501 55.02 015,873 1,216,726 1.761922 149,119 7,205,697 48.91 015,714 3,441,905 4.221913 141,163 6,245,287 43.62 830,483 4,390,920 5.571024 140,425 6.038,006 40.40 809,784 4,691,228 5.791925 147,411 5,789,318 39.27 860,600 6,168,616 7.191926 147,176 5,791,901 99.30 1,014,031 7,421,145 7.311927 162,208 6,467,021 30.06 1,212,716 0,020,761 7.451926 148,474 7,390,272 49.76 1,260,863 10,234,007 8.121929 177,656 6.505,365 47.02 1,436,105 10,644,936 7.411030 171,102 0,092,460 47.22 1,486,492 6,340,768 5.610931 166,407 6,148,619 38.87 1,509,075 5,446,916 3.141932 170,013 4,613.404 26.03 1,488,523 3,179,239 2.131933 102,004 3,712,446 19.24 1,417,020 2,875,945 2.031014 200.176 2,701,403 18.18 3.501,193 1.663.013 3.171035 194,903 3,002,727 19.53 1,305,409 9,841,136 2.771336 1,130 1.777.. 017 21.00 1,375,408 4,672,529 3.40
4,418,021 26.13 1,424.010 4.961,212 3.40
CATTLE FED 114 TRANSIT
SW INE
Aver.Assessed Per
Number Value Head60,871 $ 253,678 $ 4.16
163,141 1,183,742 7.25161,169 1,359,790 7.50165,329 1,630,154 0.86194,576 2,768,632 14.22199,986 2,955,440 15.14162,097 2,129,493 12.00175,064 1,619,404 9.37209,017 1,682,647 9.14239,917 2,211,060 8.61246,163 1,794,677 7.20183,176 1,450,864 7.02140,768 1,246,256 8.85164,058 1,637,001 9.98172,209 1,675,270 9.73164,530 1,602,889 9.77170,006 1,746,068 9.70184,183 1,652,101 8.90214,469 803,504 4.17170,842 527,302 2.92169,985 504.240 3.0492,620 466,840 5.0490,296 626,309 6.9607.902 607.871 7.02

AGRICULTURAL s1’AT1’r
SUMMARY OF MONTBLY AND ANNUAL PRECIPiTATION FOR COLORADO*Crop Reporting District No. 1. (NorthWest and Mouflt_c0Unt1!!!L
g ,0 0 .‘ + ii
Year 4 P
1961 1.06 1.48 1.59 1.61 1.89 1.08 .79 2.03 .18 .60 .49 1.38 14.031302 .60 .04 1.24 1.09 .99 .44 .88 1.19 1.25 .93 .99 1.46 12.23
1903 1.19 1.52 1.41 2.47 1.30 1.79 1.21 1.00 1.84 .64 .61 .511 15.72
1904 .85 1.22 2.55 1.02 2.40 1.91 1.41 2.82 1.53 .68 .02 .79 16.841905 1.05 1.31 1.94 2.13 1.69 .35 1.67 1.60 1.31 1.06 .71 .33 15.52
1006 1.10 .48 2.89 2.82 1.69 .48 2.25 1.87 2.78 1.52 .99 .55 19.63
1907 5.05 .91 .75 1.75 2.10 .72 1.93 1.92 1.33 .95 .18 1.40 14.95
1908 .63 .79 .92 1.15 1.84 .64 1.84 2.24 1.10 2.00 .76 1.27 14.84
1909 2.38 1.67 1.24 2.07 1.06 .68 2.32 8.67 2.53 .75 1.49 2.03 21.62
1910 1.11 1.46 .64 1.09 1.41 .72 2.04 1.29 1.47 1.21 .74 1.31 14.42
1911 1.75 1.50 1.65 1.72 .69 1.77 3.31 1.85 1.72 1.82 1.31 .60 19.64
1912 1.14 1.34 2.43 1.19 1.42 2.48 3.07 1.44 1.38 I 1.41 .49 .89 18.98
1913 1.20 1.01 1.08 1.16 .61 1.92 2.37 1.69 2.15 1.33 .94 2.04 18.17
1914 2.58 1.17 .54 1.56 2.11 1.53 5.69 2.04 1.07 1.75 .12 .78 19.53
1915 1.03 1.33 .86 1.77 1.72 1.43 .87 1.74 2.17 .59 1.51 1.36 16.35
1916 2.78 1.37 1.62 1.62 1.45 .09 2.33 2.61 1.33 2.40 .09 1.94 20.26
1917 1.14 1.23 1.31 1.95 3.26 .39 2.17 1.70 1.04 .87 .63 .92 16.48
1518 2.20 1.91 1.56 1.40 .70 1.57 2.12 1.16 2.61 1.45 1.09 1.04 19.21
1919 .19 1.30 1.20 1.64 .96 .45 2.94 1.52 1.90 1.55 2.02 .93 16.21
1920 .70 1.21 1.02 3.29 1.45 .87 1.76 2.27 1.13 1.32 1.08 1.27 17.93
1921 1.23 1.08 1.72 2.69 1.21 2.42 2.62 3.15 .49 .78 .74 1.77 20.06
1922 1.01 1.64 1.55 1.57 .07 .52 1.59 2.01 .56 .65 1.57 2.87 16.61
1923 .89 .97 2.00 1.35 1.37 1.30 3.14 3.08 1.74 1.81 .36 1.13 19.58
1924 .87 .64 2.15 .91 1.82 .31 1.17 .39 1.08 2.43 .94 1.98 13.28
1925 .96 1.08 1.07 .55 1.52 2.05 2.87 5.02 1.76 2.00 .60 1.07 18.56
1926 .88 1.06 1.81 2.42 2.13 .06 2.67 iSO .74 1.03 1.48 1.22 18.34
1927 1.04 2.17 1.72 1.55 .95 2.55 2.79 2.56 2.89 1.36 1.74 1.67 23.04
1928 .60 .75 1.94 1.16 2.53 1.58 2.17 1.11 .81 1.54 1.49 .80 16.54
1929 1.50 1.38 2.68 1.25 1.64 .40 3.51 3.38 2.77 1.36 .83 .37 20.81
1930 1.54 1.09 .98 .60 1.29 .49 3.61 5.27 1.59 .60 1.26 .34 16.91
1931 .28 5.05 1.33 1.25 t.45 1.24 1.57 1.28 1.73 1.31 1.59 .73 14.61
5932 1.15 1.75 2.19 1.66 .66 .90 2.20 2.03 .36 1.39 .57 1.25 16.16
1933 .79 1.56 2.78 1.51 .61 1.10 1.32 1.78 .21 .02 1.53 20.16
1934 .45 1.64 .71 1.01 1.44 .46 1.58 1.78 1.49 .18 1.01 1.00 12.61
1535 1 06 .45 1.09 2.74 2.64 .34 2.15 1.83 1.84 1.28 .73 .60 16.67
1936 2.05 3.67 1.06 .99 .63 1.19 2.64 2.55 1.05 .84 .38 1.23 17.71
1937 .87 1.72 1.34 1.27 1.24 1.56 2.96 1.60 1.01 1.27 1.45 1.35 17.16
5938 1.07 1.20 2.33 1.61 2.09 1.13 1.27 2.10 2.66 1.03Ave. (1900-35) 1.12 1.23 1.52 1.71 1.51 1.06 2.12 1.95 1.51 1.23 .52 1.15 17.16
1900 .17Crop Reporting
1901 .36 .47 1.37 3.03 3.23 2.30 .7 1.85 .90 .46 .08 1.14 16.01
1902 .25 .30 1.27 .85 2.46 1.60 1.33 1.29 4.19 .92 .66 .90 16.11
1903 .13 1.37 .89 1.46 1.05 2.71 1.72 1.37 1.33 1.41 .26 .15 15.8
1904 .05 .40 .93 1.04 4.85 2.37 2.58 1.93 1.65 .63 .05 .34 16.81
1905 .65 .51 1.94 5.06 5.53 .89 2.27 1.08 .66 2.19 .13 .03 19.11
1906 .20 .13 2.67 3.92 2.06 1.42 2.55 1.59 2.56 1.99 1.22 .10 20.5
1907 .27 .57 .70 2.62 2.79 .89 3.33 1.56 .95 .52 .43 .49 15.11
1508 .31 .14 .35 .66 5.65 1.27 3.22 2.98 .83 2.16 1.60 .74 17.21
1909 .40 1.28 2.78 2.03 1.74 2.32 2.11 2.70 2.56 .34 1.14 .65 20.6
1910 .22 .34 .38 .99 3.07 1.32 2.17 1.79 1.56 .79 .30 .58 I3.3
1911 .73 1.05 .70 2.29 1.06 1.56 2.22 1.55 .71 1.57 .78 .42 14.7’
1912 .65 1.62 1.87 1.64 2.95 2.69 2.90 1.67 2.77 1.77 .64 .47 21.6
1913 .41 .52 .61 1.74 1.90 1.16 2.82 1.07 2.78 1.22 .46 4.35 19.611514 .52 .44 1.01 2.95 2.36 2.20 2.67 1.71 .57 2.09 .18 .45 17.21915 .62 1.36 1.82 4.42 5.74 2.70 2.08 3.10 2.43 1.68 .31 .86 25.2
1916 .86 .53 .73 1.64 2.02 .75 2.24 2.37 .98 2.75 .78 .95 16.8
1917 .44 .83 1.47 1.65 5.28 .62 1.86 1.68 .87 .84 .25 .82 . 16.7
1918 .84 1.21 .99 2.75 1.84 1.81 4.10 2.13 2.39 .94 .79 1.00 20.4
1919 .10 .58 .94 2.01 1.01 1.40 2.55 1.41 2.30 1.19 1.39 .49 15.2
1920 .53 .80 .48 4.67 1.53 2.20 1.73 2.47 .64 1.12 .40 .73 17.2
1921 1.16 .64 1.11 3.69 1.46 4.15 2.28 2.37 .40 .98 .56 1.08 19.8
1.922 .57 .80 5.10 1.57 .91 2.05 2.03 .20 .62 1.95 .49 14.6
1923 .24 1.09 2.25 1.53 3.65 1.01 4.15 2.79 1.15 3.52 .34 .71 25.4
1924 .57 2.07 1.37 3.19 .48 .93 .36 2.02 1.50 .16 1.08 14.1
1925 .15 .08 .51 .56 1.44 2.22 2.47 2.69 1.56 2.76 .82 1.31 16.5
1926 .45 .42 1.67 2.22 2.26 1.57 2.70 1.86 .73 .92 .64 1.05 16.6
1927 .14 .65 1.75 2.40 1.12 2.91 2.61 2.40 1.37 .59 .98 .49 17.4
1928 .15 .60 1.33 1.04 3.75 3.05 2.85 .90 .30 1.53 1.35 .09 16.9
1929 .25 .73 1.38 2.36 1.40 .78 5.03 2.63 2.29 1.54 1.17 .30 17.8
1930 53 .64 .67 1.29 3.15 1.01 2.99 4.40 .93 1.00 1.05 .32 18.2
1931 .05 1.30 1.11 1.33 2.24 1.58 1.26 1.27 .53 .75 .62 , .27 12.3
1932 .43 .80 5.22 1.75 1.42 1.78 2.69 1.95 .36 .86 .27 .44 13.6
1933 .15 .27 .96 5.70 8.10 .60 1.81 2.51 2.28 .03 .19 1.02 16.6
1934 .12 1.55 .79 1.34 2.22 2.64 1.12 1.04 .78 .01 .44 .25 11.7
1955 .13 .63 .40 2.62 5.83 5.06 1.32 1.40 2.19 .75 .52 .05 16.5
1936 .42 .61 1.32 1.20 2.38 2.30 1.89 2.11 1.67 1.47 .17 .29 15.6
1937 .50 .45 .88 1.21 1.79 3.28 1.61 .58 .93 .60 I .52 1.29 15 2
1338 :461;45 3:20
3.50 1.68 1.72 1.76 4.37 .40-_
ThIncludeo allLake, Motfat, Park, Pitkin. Rio Blanco. Routt, Summit, and Teller.
2InclUdeS all statioflo reporting for Boulder. Jefferson, Larimer, Logan, Morgan. Sedgwick, and Wek
*Compiled from reports issued by the United States Weather Bureau.

SUMMARY OF MONTHLY AND ANNUAL PRECIPITATION FOR COLORADO—(Contlnued)Crop Reporting District No. 6 (East Central)3
Year Hi )1900 .13 .78 .6t 9.15 1.56 2.16 2.11 1.10 .55 .37 .33 I .34 19.181901 .20 .37 1.51 3.33 1.67 2.45 1.71 3.48 1.38 .56 .t4 .57 17.271902 .13 .45 1.15 .92 4.09 2.44 1.74 2.93 2.32 1.06 .28 .77 18.311903 .21 1.26 .44 .90 1.33 3.22 2.69 2.03 .54 .89 .31 .17 13.991004 .11 .22 .71 1.04 3.85 487 3.10 2.47 2.49 .83 .05 .28 20.421905 .40 .46 2.99 5.22 2.84 2.05 3.47 1.16 1.45 1.10 .40 .01 21.551906 .35 .33 2.03 3.72 1.84 1.74 2.65 2.16 2.21 1.82 .66 .16 19.681907 .20 .07 .40 1.68 2.06 1.71 3.05 1.83 1.08 .34 .31 .59 13.311008 .10 .60 .19 .44 2.78 1.90 3.65 2.61 .44 3.10 1.54 .27 17.711909 .27 .72 2.14 1.24 1.77 3.93 3.20 2.03 2.71 .86 1.31 .78 21.031010 .17 .25 .54 1.55 2.25 1.07 2.60 2.74 1.41 .27 .24 .33 13.361911 .24 1.02 .36 1.96 1.31 1.07 2.52 2.12 1.15 1.27 .33 .95 14.591912 .11 1.08 .86 1.27 2.32 3.36 4.01 2.92 1.54 1.12 .26 .31 18.961913 .37 .77 .63 1.44 1.23 1.01 2.14 1.67 1.59 .59 .22 3.53 16.091914 .18 .26 .52 3.25 2.79 2.22 3.85 2.10 .22 1.99 .06 .58 18.091915 .61 .82 1.30 3.89 3.51 2.96 2.49 4.47 1.70 .17 .27 .47 23.081916 .36 .04 .31 2.46 1.70 1.37 2.82 3.58 .38 .79 .49 .44 14.851917 .21 .52 .76 1.14 4.36 1.33 1.34 2.12 1.90 .61 .19 .24 14.721018 .63 .82 .92 2.03 1.23 1.83 3.07 2.07 2.06 1.37 .74 1.38 17.941919 .10 .81 .87 2.03 .99 1.81 2.78 107 1.86 .65 .94 .47 14.401020 .34 .36 .39 2.90 1.93 2.86 2.29 3.27 .97 1.34 .17 .48 17.411921 .83 .20 .70 3.15 1.27 3.61 2.47 3.58 .83 1.11 .30 .76 18.831922 .17 .32 .63 3.50 1.98 1.83 2.83 3.24 .21 .16 1.51 .20 15.731923 .02 .51 .85 1.01 3.30 3.00 3.77 3.60 1.25 3.08 .43 .75 20.961924 .24 .47 2.02 1.44 2.54 .66 1.63 1.21 1.65 1.01 .08 1.02 14.231925 .10 .22 .56 .89 2.02 1.76 3.08 2.59 1.08 1.17 .97 .60 15.051926 .66 .27 1.29 1.07 2.60 2.17 3.01 1.42 .99 .70 .43 .57 15.211927 .20 .46 1.82 1.67 .77 4.04 3.19 3.21 1.09 .23 .40 .28 17.591928 .07 .37 1.55 .63 4.18 4.23 3.29 .98 .38 1.46 1.33 .07 18.551929 .10 .46 .80 1.73 1.78 1.15 2.06 3.31 1.96 1.43 .04 .16 16.801930 .25 .21 .38 1.47 3.46 1.14 3.46 3.74 .69 1.23 1.40 .29 18.351931 .06 1.80 .85 1.06 2.38 1.77 1.18 2.03 .52 .32 .46 .09 11.831032 .37 .20 .58 1.99 1.17 2.48 2.82 1.82 .68 .54 .18 .38 13.201933 .01 .08 .76 3.26 2.41 .97 2.31 3.57 1.71 .02 .19 1.06 16.331934 .07 1.40 .45 .61 .95 1.22 1.30 1.55 .58 .03 .40 .15 8.851935 .10 .38 .51 1.82 5.07 2.03 1.23 1.40 1.70 .37 .30 .23 15.421936 .23 .23 .86 .84 2.71 1.70 2.41 2.50 1.99 .81 .15 .31 13.701937 .31 .47 .91 .91 1.30 2.77 1.26 1.82 2.32 .50 .37 .65 11.901938 .29 .27 1.25 2.43 3.28 1.55 2.50 2.16 3.35 .20Av. )1900-35) .24 .52 .93 2.15 2.31 2.23 2.66 2.42 1.26 .96 .51 .55 16.75
Crop Reporting District No. 7 (Vest Central and Southwest)11900 .31 .30 .26 2.11 .52 .31 .02 .31 1.38 .84 1.11 .04 7.511901 .88 .65 1.14 .95 1.84 .83 .40 2.10 .18 .83 .33 .54 10.631902 .55 .60 .37 .66 1.12 .31 1.17 1.45 1.11 .55 .88 .53 9.161903 .54 1.08 2.00 1.99 1.03 1.05 1.18 .36 1.81 .33 .02 .02 10.641904 .50 .77 1.47 .53 1.09 .73 .80 1.68 1.11 1.05 .00 .68 10.501905 1.34 2.42 2.15 1.69 1.89 .38 .75 .89 1.83 .52 1.60 .48 15.891006 1,15 .41 3.02 2.48 2.43 .12 2.00 1.40 2.70 .04 1.77 1.39 18.521907 1.88 1.59 1.86 1.56 2.16 1.27 1.46 2.92 1.58 1.39 .42 1.53 20.091908 .92 1.88 1.37 1.41 1.44 .53 1.67 3.20 .98 2.21 .95 2.91 19.211900 2.66 1.93 .70 1.73 .60 .35 2.06 3.59 2.58 .80 1.70 2.76 21.74[910 1.56 1.24 .72 .87 .55 .18 1.57 1.87 1.37 2.53 1.38 1.39 15.95[011 2.60 2.86 2.01 1.30 .44 1.36 3.03 1.68 2.09 3.35 1.41 .84 25.84L912 .92 .51 4.41 1.50 .51 1.61 2.20 1.71 .60 2.69 .70 .72 17.93913 1.08 1.71 1.00 .65 .34 1.51 1.67 1.50 2.35 .86 1.87 1.96 16.44.914 3.83 1.40 .76 1.98 2.22 1.67 2.76 2.24 .83 3.18 .14 1.15 22.09915 1.57 2.09 .48 2.77 2.28 .87 1.08 .95 2.20 .11 1.80 2.06 18.47.916 3.98 1.57 1.98 1.70 1.01 .02 2.88 3.27 1.28 4.55 .42 1.62 24.23.917 1.40 .85 1.05 3.26 2.17 .21 1.55 1.40 1.28 .26 .36 .27 13.73.918 2.62 1.23 2.65 .94 .20 .84 2.11 1.65 2.19 1.43 1.55 1.52 19.01919 .26 2.06 1.99 1.44 1.22 .19 3.11 1.52 1.89 1.79 2.97 1.10 19.62920 1.03 1.91 2.34 2.27 2.02 .93 .01 1.59 1.04 2.60 1.09 1.16 19.72921 1.10 1.06 1.66 1.94 1.79 2.01 2.76 3.83 .56 1.21 .97 2.62 21.51922 1.96 1.69 2.33 1.32 1.15 .47 1.18 1.87 .48 .40 2.21 1.90 17.31923 1.16 .73 1.84 1.61 1.56 .40 2.17 3.55 2.05 1.28 1.20 1.71 19.38924 .63 .58 3.12 1.29 1.21 .12 1.59 1.03 1.00 1.62 .87 2.05 16.19925 .62 1.11 2.18 .99 .89 1.80 2.15 2.94 2.80 2.92 .93 .87 20.68926 .59 1.06 1.60 3.69 2.20 .52 2.18 .99 1.76 1.43 1.54 1.74 19.52927 .97 3.41 2.13 .98 .77 3.00 1.95 2.91 5.73 1.13 1.57 1.63 27.36928 .46 1.23 1.84 .77 2.07 .81 1.30 1.94 .73 2.81 2.32 .85 17.18929 1,76 1.49 1.95 1.82 1.46 .18 3.25 2.75 3.94 1.13 .44 .26 20.62930 2.64 .07 1.23 1.11 2.02 .40 2.86 2.16 1.41 .64 1.42 .20 17.18931 .31 1.49 1.10 1.54 .65 .92 1.72 1.20 2.77 1.79 2.59 1.39 16.92932 .93 2.43 1.29 1.97 .48 .76 2.15 2.47 .73 1.20 .21 1.46 16.03033 1.09 .88 .72 1.19 1.13 .64 1.73 1.36 2.14 .85 .96 1.04 13.72934 .28 1.89 .17 .93 1.38 .49 .80 1.82 1.42 .17 1.41 1.14 12.01935 2.01 .94 2.17 2.24 2.06 .08 1.28 2.25 1.97 .03 .52 .71 17.08936 .85 2.87 1.32 .55 .65 .73 2.11 5.21 1.36 1.60 .71 2.03 16.53937 1.50 2.45 2.62 .47 .72 .12 2.15 1.59 1.58 1.21 .72 1.70 17.03038 1.61 2.07 4.18 3.49 1.38 2.22 .85 1.43 2.45 1.221v. (1800-35) 1.54 1.39 1.66 1.59 1.55 .81 1.79 1.05 1.77 1.45 1.15 1.27 17.49
5lncludes all stations reporting for Adams, Arapahoe, Cheyenne, Denver, Douglas, Elbert, El Paso,(iowa, Kit Carson. Lincoln, Phillips, Washington and Yurna.4lneludes all atationa reporting for Archulota, Delta, Dolores, Garfield, Hinsdale, La Flata, Mesa,lontezurna, Montrose, Ouray, San Juan, and San Miguel.

144 AULLItUIJ±b±utn :::z:
SUMMARY OF MONTHLY AND ANNUAL PRECIPITATION FOR COLORADO—(Continucd)
Crop Eeporting District No.8 (South Central)3
I•; . ,.
Year d U
et 94 F < F , -, 4! 0 0
1900 .31 .80 .70 2.03 1.00 .44 .60 .85 .60 .29 .51 .17 8.45
1901 .61 .47 .67 .74 1.21 .18 1.21 1.81 .01 .71 .10 .61 9.52
1902 .41 .47 .78 .11 1.44 .42 .75 2.16 .00 .82 1.03 1.04 10.31
1903 .29 1.01 .48 .93 .34 2.42 .61 .87 .79 .37 .21 .26 8.44
1904 .41 .16 1.21 .20 .29 1.11 1.28 2.91 1.81 1.14 .78 10.86
1905 1.10 1.00 2.24 1.20 1.20 .43 3.63 .90 .96 .08 .83 .01 6.99
1906 .20 .12 1.22 .73 I 1.00 . .08 2.07 1.48 1.66 2.18 1.03 .78 13.17
1007 .18 .12 .37 .70 1.66 .10 1.19 2.39 .62 .76 .41 .33 I 10.14
1908 .02 .09 .81 .40 .18 .20 .08 1.17 .31 .31 .66 .07 7.80
1909 .50 .49 .42 1.19 .94 .30 1.40 2.84 1.88 1.01 1.58 1.44 12.12
1910 1.27 1.01 .64 1.17 .44 .50 1.66 1.94 .16 1.56 .68 .77 12.22
1911 1.38 2.27 1.08 . .98 .70 1.27 4.38 2.11 2.1.5 2.54 .98 .79 21.37
1912 .74 .88 2.40 I 1.27 I .45 1.05 1.95 1.40 ! .52 1.63 .28 .59 14.28
1913 .91 1.24 1.06 .86 .13 2.27 1.73 1.78 1.69 .81 1.04 1.64 18.16
1914 1.40 .78 .60 1.96 1.61 1.29 1.63 f 2.66 1.38 1.47 .08 1.30 17.08
1915 .08 1.89 .61 3.28 1.02 .54 2.29 1.19 1.54 .33 1.14 1.76 17.55
1916 2.97 .68 1.37 1.67 .44 .04 3.09 2.79 .81 2.92 .31 1.58 18.68
1017 1.91 1.03 3.08 2.36 1.94 .20 3.96 1.49 1.18 .10 .30 .18 13.19
1918 1.10 1.49 3.86 .12 .16 1.52 2.57 1.79 1.80 .97 1.99 1.42 16.87
1919 .14 1.98 2.30 1.34 1.48 .48 3.28 1.10 1.47 1.82 2.18 1.31 17.78
1520 .62 1.71 1.91 1.65 1.09 ‘ .98 1.38 1.90 .09 2.33 .51 .96 10.24
1922 .88 .19 .00 1.07 1.14 1.08 2.71 3.46 .13 .48 .16 . 1.17 15.92
1922 1.88 1.12 1.77 .87 .89 .94 1.11 1.59 .80 .11 1.08 .00 14.08
1923 .41 .70 1.35 1.03 .77 1.07 1.48 3.01 2.21 1.79 .75 1.10 16.99
1924 .57 .57 2.82 1.40 .48 .10 1.42 .09 .54 .87 .88 1.36 11.16
1929 .13 .51 1.59 .62 .80 1.21 1.90 2.62 .98 1.12 1.05 .48 13.34
1926 .88 .83 2.78 2.26 1.61 I .42 . 1.99 1.15 .76 .86 .75 .71 16.01
1927 .41 1.52 1.87 .76 I .29 ! 2.61 1.97 1.93 3.00 . .30 .48 1.70 17.87
1928 11 1.02 1.51 . 1.38 2.23 I .28 1.59 1.88 .97 1.04 2.03 .46 15.91
1929 .90 .89 .92 .80 1.41 .05 2.64 3.25 1.89 .95 1.01 .12 14.96
1930 .13 1.09 1.65 1.20 .91 .71 1.49 1.75 1.89 .82 3.27 .77 16.0)
1031 1.84 .05 1.17 .56 1.20 .12 3.76 1.65 .76 .82 2.11 .23 16.64
1932 1.35 2.21 1.12 .79 .02 .92 1.01 1.84 .45 .02 .08 1.32 13.41
1935 1.14 .13 .53 1.37 .01 9.12 1.79 . 2.02 1.71 .70 1.17 1.10 11.11
1934 .25 1.27 .19 .76 .00 .44 1.09 I 1.51 1.28 .02 .75 .42 0.81
1935 1.16 .78 1.62 1.33 • 3.47 .11 I 1.00 2.10 I 1.41 I 1.02 .42 .28 15.81
1936 .45 1.26 .86 .62 .52 .88 1.52 4.29 I 1.97 .95 .27 .43 13.5!
1937 1.22 1.07 1.58 .42 1.20 1.09 1.15 1.65 1.42 .43 .17 .51 12.1)
1938 1.24 1.84 2.91 1.06 1.14 1.11 1.16 1.11 2.90 2.08
Ave. (1900-15) .81 .97 1.27 1.17 1.07 .81 1.92 1.94 1.18 1.05 .90 .80 13.8)
Crop_Reporting Distrirt Na. 0 (Southeast)6
1900 .11 .78 .31 7.03 2.91 2.07 j 1.26 .66 laS 1.02 ‘ .20 .45 17.7)
1901 .30 .21 1.20 2.27 9,75 1.04 1.9 2.00 .60 .40 .09 .14 24.1’
1902 .44 .61 1.33 .47 2.18 99 jul 2.28 .62 1.02 .47 .07 13.6
1903 .12 1.72 .48 1.28 .08 4.71 1.35 2.26 .30 1.03 .21 .35 14.6)
1904 .21 .19 .03 .96 1.83 1.20 2.62 2.02 3.29 .05 .10 .64 16.01
1905 .56 .11 2.14 4.96 1.44 1.31 2.21 1.95 1.06 .57 .84 .12 17.6
1906 .12 I .19 1.13 2.67 1.20 1.70 3.31 LOS 2.31 1.96 .67 .25 17.6
1907 .11 .18 .07 2.26 2.72 1.18 3.15 1.65 .72 .97 .91 .46 13.9
1908 .23 .83 .20 .93 .90 .93 1.18 2.53 .41 1.35 ‘ 1.05 .14 12.7
1909 .48 .53 1.06 1.60 1.71 0.33 1.77 2.91 3.32 .86 2.07 1.14 10.0!
1610 .40 .93 .43 2.17 1.85 1.00 2.91 1.74 .14 .89 .41 .28 12.6
1911 .28 1.60 .61 1.21 1.29 .76 5.68 2.04 I .69 2.24 1.15 1.26 17.2
1912 .11 1.26 1.90 2.01 1.96 2.91 2.72 1.87 J 1.24 .90 .21 .38 18.2
1913 .49 , 1.17 .71 179 .98 1.50 2.21 1.27 1.70 .79 .71 3.18 18.6
1914 .42 .50 1.01 3 33 5.73 2.24 4.93 1.65 .49 I 2.05 .43 19.9
1915 .49 1.18 .76 3.66 5.07 2.11 2.00 3.29 .52 ‘ 43 I .21 .62 19.6
1916 .72 .14 .89 2.83 .46 .97 1.36 4.27 .26 1.01 .66 .52 14.1
1917 .19 .96 .12 2.06 2.22 .58 1.15 2.06 1.71 .48 .26 .01 12.1
1918 1.06 .97 1.62 1.00 .82 2.00 2.41 1.23 2.42 1.09 .76 1.42 17.5
1915 .15 .97 1.92 1.00 1.11 1.71 3.59 1.48 1.72 1.37 L40 .95 19.0
1920 .23 .62 .41 1.90 1.81 1.13 2.12 2.42 1.26 2.30 ! .21 .55 34.9
1921 7 .45 .69 1.57 1 1.55 3.66 3.58 2.uo .21 .-ts .14 .68 16.2
1922 .12 .93 1.00 2.29 1.89 1.11 2.21 1.32 .40 .28 .91 .25 12.5
1921 .03 .77 .02 .99 2.09 2.91 3.36 4.73 1.90 3.48 .64 .01 22.0
1924 .25 .39 1.92 1.41 1.09 .47 .96 .02 .01 .62 .11 1.23 10.1
1925 .12 .43 .22 .34 1.01 .87 4.98 2.16 1 65 .78 1.40 .62 15.7
1926 .70 .41 2.20 1.68 2.15 1.65 1.71 1.09 .43 .52 .40 .17 15.1
1927 .20 .61 1.27 .92 .42 2.79 4.22 2.90 1.27 .19 .29 .44 11.5
1928 .01 .72 1.21 5.41 4.85 2.66 2.09 1.41 .11 1.78 1.65 .25 18.9
1929 .22 .62 .70 .89 2.01 .83 2.61 ‘ 4.18 1.73 1.01 1.14 .31 16.6
1930 .30 .28 .71 .87 2.01 1.03 3.03 2.85 1.08 2.00 1.75 .40 10.1
1931 .03 1.24 1.14 1.14 2.73 .00 1.09 .95 .99 .61 .95 .14 12.6
1032 .67 .16 .99 1.81 .52 2.60 1.14 1.73 .69 .70 .21 .46 11.1
1933 .06 .19 .72 2.46 2.09 2.67 1.77 2.08 1.22 .14 .47 .96 14.1
1914 .16 1.48 .59 .00 .68 .87 1.2.3 1.42 .93 .19 .51 .21 9.)
1915 .14 .33 .29 .37 3.13 1.08 1.69 1.62 2.39 • .57 .24 .19 12.)
1936 I .45 .19 I .22 .67 3.39 1.28 1.68 2.23 2.16 1.24 .22 .30 11.)
1937 .23 .56 1.12 .90 So 1.82 I 1.02 1.01 .91 •., 75 .29 .63 9.1
1938 .93 .73 1.49 1.77 2.74 i.o3 2.00 1.54 2.14 I .72
Ave. 11900-30) .34 .08 .97 1.92 I 1.97 1.73 2.19 2.10 1.20 . 1.02 .65 .60 15.1
5lnelodoo nil stations reporting for Alamosa, Conejos, Costilia, Mineral, Rio Crande and Sagnach
°Inclodoa all stations reporting for Ilaca, Dent, Crowloy, Coater, Frernont, Hoorfano, Laa Aninsa
Otero, Prowors, and Poohln.

STATE OF COLORADO 143
3UMMARY OF THE ACEFIAGE, PRODUCTION AND YIELD PER ACRE OF PRINCIPAL CROPS INTHE UNITED STATES, 1929-1937
Acres Yield Price Per CashDrop and Year Harvested Per Production UnitUnit’ Farm Value IncomeAcre
26.8 2,521,032,00020.5 2,080421,00024.1 2,575,61100026.5 2,931,281,00022.6 2,399,632,00015.8 1,491,123,09024.0 2,303,747,00016.2 1,107,089,00028.2 2,641,995,000
29.2 1,113,050,60032.0 1,274,698,00027.9 1,123,892,08030.0 1,250,953,00020.1 733,166,00018.4 142,306,00030.0 1,194,902,00023.5 785,506,60032.7 1,1.16,258,000
$2,013,509,000 $401,000,0001,239,861,000 317,000,000
824,543,000 154,000,000936,093,000 110,000,000
1,253,251,000 188,000,0001,190,612,000 168,000,600,1,509,147,000 124,000,0001,574,908,000 243,665,0001,497,392,000 234,385,000
465,740,000 123,000,000410,086,000 95,000,000239,109,000 49,000,000195,826,000 38,000,000249,332,000 46,000,000200,000,000 29,000,000314,590,000 48,000,000352,692,000 50,672,000350,770,000 61,522,000
150,782,000 45,000,000121,609,000 30,000,00065,306,000 . 16,000,00065,960,000 ‘ 11,000,00066,879,000 22,000,00070,994,000 26,000,000
107,997,000 28,000,000115,362,000 61,838,000122,117,000 42,042,000
852,901,000 726,000,000594,874,000 434,000,000367,1327,000 300,000.000289,096,000 378,000,000410,286,000 262,000,00’)446,368,000 345,000,000521,233,000 356,000,000643,062,000 408,200,000868,740,000 660,549,000
Corn:929 __._._; 97,805,000930 101,465,000931 106,902,000932 130,577,000933 105,963,000934 92,394,000935 95,804,000936 93,020,000937 93,810,000
Oats(Grain)
029 38,153,000930 39,850,000031 40,242,000332 41,703,000133 36,532,000334 29,455,000335 39,831,000330 33,370,000
35,079,000
Barley:329 13,526,000)30 12,595,000131 11,189,000132 13,178,000133 9.687,000134 6,553,00035 12,371,00036 8,372,00037 -. 9.859,000
All Wheat:29 62,332,00030 62,614,00031 37,681,00039 57,839,00033 49,438,00034 43,400,00035 51,229,00036 48,863,00037 64,460,000
Rye:20 3,130,00030 3,621,00031 3,162,00032 1,351,00033 2.418,00034 2,035,00035 4,141,00036 2,774,00037 3,030,000
Dry Beans:29 ‘ 1,840,00030 2,159,00031 1,947,00032 1,431,00013 1,721.00014 1,160,00035 1.885,00016 1,594,00017 1,721,000
?otatoes(White)
19 ‘ 3,018,7000 ‘ 3,102,9001 3,466,6009 3,549,3003 3,411,500
:4 3,597.0005 3,541,0006 3,063,0007 3,177,000
B u.IOu.flu.Bu.B u.IOu.flu.flu.Bu.
flu.Bu.flu.IOu.Bu.Bu.flu.flu.flu.
Bu.flu.flu.Ru.flu.flu.Bu.flu.flu.
flu.flu.flu.flu.B::.flu.flu.IOu.flu.
flu.flu.flu.flu.IOu.flu.flu.flu.flu.
100-lb. flags100-lb. flags100-lb. flags100-lb. flags100-lb. Bags100-li,. flags100-lb. Bags100-lb. Bags100-lb. Bags
Bu.flu.Eu.flu.B U.
flu.flu.flu.flu.
$ 0.799.596.320.319.022.815
1:045.551
.418
.322
.213
.157.155.480.263.449.311
.519
.405.328.221.435.606.378.784.556
1.036.671.390.382.744.040.832
1.026.994
.857
.445
.341
.281
.627
.718
.395
.809
.688
6.774.202.131.902.783.522.935.183.14
1.318.919.403.392.821.448.597
1.120.529
20.723.817.822.615.917.823.117.622.1
13.014.216.313.111.212.112.212.813.6
11.312.410.611.8
8.98.4
14.29.1
12.9
697.3614.0663.3769.0738.6780.3759.8716.0920.0
110.0109.8110.S106.1160.3112.9109.1108.4123.1
279,924,000300,205,000199,391,000298,313,900153,707,000116,680,000285,774,000147,145,000219,615,000
823,217,000886,470,000941,674,000750,927,060551,681,000526,393,000626,344,000620,766,000873,093,000
35,282,00040,068,00033,378,00039,424,00021,418,00017,070,00058,597,00025,319,00049.440,000
12,278,00014,131,00012,914,00011,005,00012,771,00011.393,00014,123,00011,405,00010,839,000
112,204,000340,572,000084,125,000376,420,000342,100,000406,105.000306,180,000331,918,000391,159,000
30,241,00020,039,00011,370,00011,005,00013,434,00012,263,00023,170,00020,483,00034,021,000
79,376,00056,633,00025,890,00020,822,00033,517,00037.966,00038,883,00061,359,00049,734,000
438,006,000313,072,000177,902,000147,400,000281,170,000181,857,000230,574,000374,735,000206,923,000
15,000,00010,000,0003,000,0002,000,0006,000,0004,000,0007,000,000
13,230,00004,604,000
72,000,00064,000,00030,000,00016,000.00024.000,00051,000,00034,000,00042,752,00’)47,437,000
208,000,000261,000,000146,000,00062,000,000
120,000,000149,000,000101,000,000214,603,000108,180,000
Note—Figures revised by United States Department of Agriculture,

116 XCII1ICULTtII1AL S’i’A’I’IS’l’It’S
SUMMARY OF TUE ACREAGE, PRODUCTION AND YIELD PEE ACRE OF PRINCIPAL CROPS F
TUE UNITED STATES, 1929-1917—(Contintted)
Crop and YearHarvested Production Unit
Preer Farm Value
Acre
I
________________________
SugarReels
1929 685,000 10.6 7,315,000 Ton 3 7.05 $ 51,801,000
1910 776,000 11.9 9,109,000 Ton 7.14 65,608,0001931 715,000 11.1 7,903,000 ‘ron 5.94 46,048.000
1932 764,000 11.0 9.670,000 Ton 5.26 47,705.000
8933 683,000 11.2 11,030,006 Ton 6.11 56.590,000
19:14 770,000 9.8 7,519,660 Ton 5.16 38,776,000
Fin 763,000 10.4 7,998,000 Ton 5,76 45,565.006
I s:io . 776,080 11.6 0.020,000 Ton 6.05 54,619,000 $ 55,682,0
759,000 11.0 8,798,000 Ton 1.88 51,732,000 52.107,0
Soy’’ l),iO)511)21) 6.394,060 12.9 82,214,000 Eu. .732 60,151,000
1 1:1)) -, 6.oso,wO 9.5 62,570.009 En. .569 95.579,100
19:11 _J 7,483,000 13.2 113,649,006 Eu. .263 29,940,000
1912 . 7,060,000 19.8 100,715,000 190. .298 12,698,000
11)23 -. . 7,307,000 11.3 82,685,01:0. En. : .510 42,168,000
1824 6,830,000 5.0 40,225,000 En. .008 49,313,000 ‘
1911 9,154,000 10.5 98,495,000 En. .565 55.210,006
1926 6.878,000 8.0 55,079,000 . Eu. .049 52,270,000 5,262,0
1957 7,379,000 11.2 97,097,500 Eu. .574 55,711,000 521Sf
SweetSorghnms :
(Forageand Hayl
1929 1,588,000 1.67 2,050,000 Ton 0.49 22,510,000
1930 1,606.000 1.15 2.327,000 ‘ron 8.71 20,258,000
933 2,172,000 1.16 3,180,000 Ton 5.67 19,176,000
193° 2,400,000 1.49 3,595,000 ‘ Ton 3.08 14,191,000
1921 3,217,000 1.45 4,121.000 Ton 5.04 22,790,009
1034 . 1,200,000 1.04 3,432,000 Ton 10.10 34,870,000
5015 3,498,000 1.45 1.058,000 Ton 5.61 28,392,000
1936 2,545,000 1.11 2,098,000 Ton 8.24 23,880.000 2,540.1
1937 2,900,000 1.40 4,378,000 Ton 6.65 29,114,000 1,740,1
All Tame IHay:
1929 55,728.000 1.37 70.163,000 Ton 12.22 950,360,000
0070 34,051.000 , 1.15 61.040,05° Ton 12.65 010,002,000
1031 35,968,000 1.10 111,361,60° Too 8.04 601.840,060
103° 56,004,000 , 1.28 70.027,050 Ton 6.70 481,201.010
1033 55,829,000 1.18 00.350,)iOO Ton 8.20 545,297.000
5934 56,017,000 .09 57,270,090 Ton 14.02 775.009,000
10 55,647,000 1.40 70.010,600 Ton 7.80 608,368,000
1950 : 57,289,000 1.11 17,556,055 Ton 11.39 723,675.000
18 I 54,752.000 1.37 71,755.000 Ton 9.13 673,057.000
Wild Hay : I
5020 11,571,000 .82 11,175,000 Ton 0.04 89.851,000
1950 10,789,000 .78 10,694,000 Ton 7.00 75.870.000
1031 11,862,000 .09 8,162,000 Ton 6.17 50.544.000
1932 I 14,048.000 .85 11.920,000 Ton 3.90 47,580,000
1915 12,053,000 .70 8,412.000 Ton 5.17 43,522,000
1934 I 8,623,000 .55 4,729,000 Ton 11.48 54,296,000
1055 52,599,000 .52 11,388,000 Ton 4.64 52,789,000
1036 I 30,579,000 .65 6,850.000 Too 7.77 55,224,000
1037 11,052,000 .81 9,302,000 Ton 5.62 52,277,000
Ernemrnrn:1929 310,000 304.5 lbs. 47,300 Ton 554.51 5,417,000
1010 I 392,000 200.Slbs. 51,100 Ton 66.26 3,180,000
1031 314.000 313.7lbs. 49,000 Ton 44.85 2,209,000
0932 315.000 261.8 lbs. 40,900 Ton 57.04 1,510,000
1831 277,000 216.5 lbs. 50,000 Ton 502.00 3,000,000
5034 305,000 108.Olbs. 28,700 Ton 504.43 4,719,000
59 497,000 247.Olhs. 61.500 Ton 75.92 4,531,000
5956 344,000 221.Slbs. 38,000 Ton 510.05 4,444,000 4,585
1937 I 542,000 296.0 lbs. 51,000 Ton 70.45 3,503,000 3,561
AlfalfaSeed:
1929 519,500 1.01 993,500 Un. 52.04 11,962,000 —- —.
l050_____. _.. 545,200 2.23 5,215,300 Un. 10.78 13,102,000
loll 436,600 2.00 874,400 ISo. 7.30 6,379.000
1932 I 349,500 1.78 620,800 Eu. 5.52 3,427,000
1933 572,100 5.88 1,073.900 Eu. 6.07 6,522,000
1034 581,500 1.80 1,102,600 En, 9.96 10.085,000
1935 486,600 2.06 1,004,200 En. 7.88 7,920,000
-- 579,000 1.51 888,000 Eu. 11.80 10,558,000 8,808
1977 —
. 493,000 1.91 044.000 150. 12.79 13.018,000 12,150
oie,——Figores revised by United States Eepartnseot of Agriculture.
‘Prices for Sweet Sarghunss, ‘fame Hay, Wild Hay and Ereotocora are as of December 1.

STATE OF COLORADO 147
JMMARY OF TIlE ACREAGE, PRODUCTION AND YIELD PER ACRE OF PRINCIPAL CROPS INTEE UNITED STATES, 1928.1937-—(Cenlinued)
‘op and YearHarvested Production Unit Price Per
Farm Value IeAcre
Clover Seed’(Red)
29 2,109,700 1.20 2,645,600 11g. $ 10.44 $ 27,633,00030 1,105,900 1.20 1,341,100 Bu. 11.63 15,606,000 —31 924,200 1.24 1,149,500 Eu. 7.22 0,293,00032 1,064,600 1.36 1,451,900 Bu. 5.02 7,280,00033 1,108.300 1.21 1,474,300 Ru. 6.23 1,187,00034 981,000 1.07 1,050,500 Bu. 30.98 11,137,00035 863,000 1.30 3,169,800 Ru. 8.81 10,399,000
1,014,000
1.12 1,172,000 Do. 14.42 16,000,000 S 12.465,000
466,000
1.68 781,000 Ru. 17.84 13,833,000 0,846,00.)PRUITSIpples39 135,092,000 flu. 1.387 187,338,000 153,000,00010 156,617,000 Ru. 1.022 160,101,000 138.000,00011 205,403,000 flu. .610 133,278,000 09,000,00012
. 246,849,000 flu. .602 85,801,000 83,000,00013.. 148,657,000 Ru. .702 112,657,000 83,000,00014 129,719,000 Ru, .894 112,400,000 87.000,00415 177,910,000 I Ru. .721 325,406,000 101.000,00416
. 107,500,000 Ru. 1.051 123,499.000 82,925,00017 211,080,000 Ru. .616 146,898,000 109,534,000Peaches:9 44,737,000 Ru. 1.370 81,300,000 47,000,000II 55,340,000 Ru. .800 45,293,000 37,000,0001 77,053,000 Ru. .586 41,059,000 31,000,0002 ‘ 43,204,000 Ru. .533 10,461,000 15,000,00’):3 45,271,000 Ru. .704 32,018,000 27,000,000:4 47,685,000 Ru. .800 30,801,000 29,000,000.5 , 54,090,000 Ru. .847 40,210,000 30,009,0006 47,650,000 Ru. .954 45,458,000 30,883,000:7 59,626,000 Ru. 1.010 00,750,000 51,719,000ears:
.9 21,600,000 Ru. 1.421 30,764,000 20,060,00’)0 20,978,000 Ru. .701 19,558,000 16,000,008.1 20,083,000 flu. .602 14.715,000 11,900,0002 23,971,000 Ru. .130 8,311,000 6,000,0003 23,520,000 Ru. .570 12,131,000 9,009,0004 27,436,000 Ru. .695 18,820,000 14,000,0005 25,299,000 lb. .036 18,003,000 11,000,0000 26,956,000 Ru. .086 18,494.000 34,540,0007 30,139,000 Ru. .658 10,831,000 16,069,000herries9 , 98,340 Ton 158.94 15,312,0000 121,850 Ton 127.75 15.324,000
126,330
Ton 73.26 8,523,0002 143,340 Ton 42.37 5,427,0003 133,840 Ton 00.96 7,288,0004 I 131,180 Ton 58.91 7,522,0000 ‘ 138,040 Ton 70.71 9,037,6006 110,160 Ton 76.91 8,857,000 6,952,0047 142,000 Ton 102.81 14,009,600 13,013,000rapes
9 2,085,220 Ton 27.3t 36,934,3000 . 2,455,740 Ton 19.47 45,020,000O 1,646,280 Ton 22.63 37,034,0002 ‘ 2,231,380 Ton 33.37 27,770,0003 1,938,760 Ton 18.03 31,943,0004 1,957,740 Ton 19.70 38,577,0000 2,487,800 ‘fun 14.94 37,181,000S I 1,910,460 ‘ Ton 23.03 41,433,000 38,432.OOo7 .. 2,732,000 Ton 39.74 53,930,000 01,471,000RUCKROPSeons,rio])
162,630
20,204,000 20,25.1,000‘ 390,530 19,518.000 19,578,0001 170,860 16,292,000 10,292,009
‘
159,180 12,712,000 12,712,0601 173,880 12,674,000 12,074,050
217.730
14,800,000 14,800,000
216.300
10,611,000 16,601,000
213,800
17,616,900 17,606,000
228,490
20,950,000 25,850,900
Note—Figures revised by United Slates Department of Agriculture.
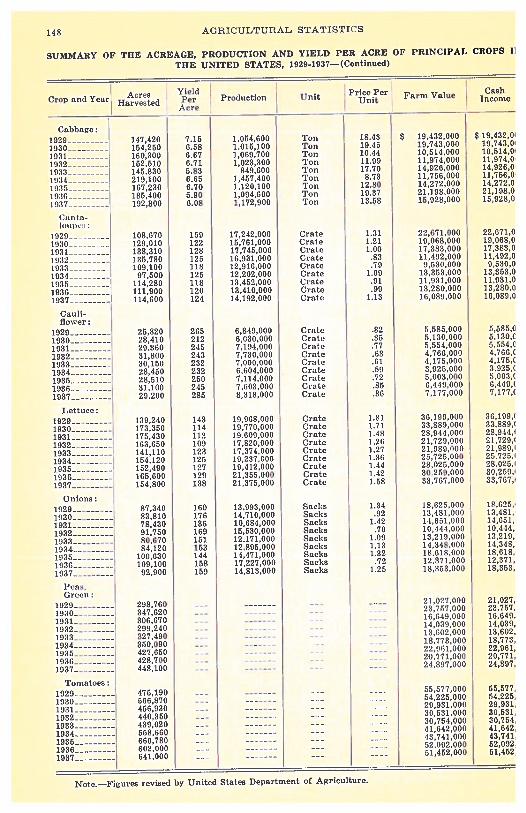
148 AGRICULTURAL STATISTICS
SUMMARY OF THE ACREAGE, PRODUCTION AND YIELD PER ACRE OF PRINCIPAL CROPS I)
TEE UNITED STATES, 1929-1937—(Continued)
Cabbage:192929303931193230232)134I 935..I 9331937_
CantaIoai,rs
1929_303019333932193319341919312937
Cauliflower:
1929 25,8201930 28,4101931 29,3601912 31,1091933 39,1161914 I 28,4101911 28,1101936 31,1001937 [ 29,200
Lettuce:1829 j 139,2401930 173,3501931 175,4301932 163,6101933 141,1101934 154,1201935 152,4503936 163,6001937 154,800
Onions:1929 87,1401930 83,8101931 78,4101922 91,7501933 80,6701931 54,1301931 100,6301030 100,1001937 91,800
Peas,Green
1929 I 298,7601930 : 347,6203931 306,670193 [ 219,2401033 327,4901934 350,0901931 427,6101936 ‘28,70010 I 448,100 i
‘l’nmatoes
1929 475,1901930 566,8701931 456,9301932 440,2501933 439,0203934 558,6603935 660,7801930 602,0001937 I 641,000
5,585,000 5,383,05,130,000 3,130,05,534,000 5.554,t4,766,000 4,766,14,170,000 4,171,03,925,000 3.925,15,003,000 5.003,16,440,000 6,449,)7,177,000 7,177,1
30,199,000 30,399,)33,880,000 33,889,120,044,000 28,944,’21,729,000 21,721,’21,989,000 23,969,125,725,000 25,725,’28,025,000 29,925,)30.239,000 30,259,’33,707,000 I 33,767,’
25,027,000 21,027,23,757,000 23,757,16,649,000 16,045.14,030,000 14,319,13,002,000 13,602,18,773,300 18,773,22,901,000 22,961,20,771,000 20,771,24,897,000 24,897,
Acres Yield Price Per CashFarm ValueCrop and Year Harvested Per Production Unit Unit Income
Acre I I
______________________
147,420 7.15 3,054,600 Ton 08.43 $ 19,432,000 $ 19,432,0’
151,230 0.56 I 0,015,100 Ton 39.45 39,743,000 19,741,0’
160,300 6.67 1,069,700 I Ton 10.44 10,514,000 I 10,514,0’
132,530 6.71 [ 1,023,300 [ Ton 11.09 13,974,000 I 11,974,0
545.830 5.83 I 849,600 I ‘ron 17,70 14,926,000 14,926,0
219,100 LOS j 1,457,400 I Ton 8.73 11,756,000 31,750,0
167,230 6.70 1,120,100 Ton 12.80 14,272,000 . 14,272,0
185,400 3.90 1,094,600 Ton 19.37 21,198,000 . 21,398,0
392,890 LOS 1,172,900 Ton I 13.58 15,928,000 J 35,928,0
308,670 159 17,242,000 Crate 1.31 22,671,000 22,671,0
129,010 122 15,761,000 Crate I 1.21 19,068,000 19,061,0
138,310 128 17,745,000 Crate 1.00 17,383,000 I 57,303,0
335,780 125 36,931,000 Crate .83 11,492,003 11,492,0
109,100 118 12,910,000 Crate .70 9,230,000 9.530,0
97,800 125 12,202,000 Crate 1.09 13,353,000 13,353,0
114,280 118 13,452,000 Crato .91 11,931,000 11,931,0
111,900 120 13,410,000 Crate .99 13,280,000 13,280,0
314,000 124 34,392,000 Crate 1.13 10,089,000 10,089,0
2032122’lS243232232250245285
140114112300123125327129138
100176136169151183144118119
6,849,0006,030,0007,194,0007,739,0007,000,0006,1304,0007,114,0007,003,0008,318.000
I 9,1118,0 0019,770,00010,1301,00037,120,00017,374,00019,237,00059,412,00021,555,00021,375,000
13,803,00014,710,00010,684,00015,530,00012.171,00012.895,00014,471,00017,227,001’14,813,000
CrateCrateCrateCrateCrateCrateCrateC rateCrate
CrateCrateCrateCrateCrateCrateCrateCrateCrate
SacksSacksSacksSacksSacksSacksSaclssSacksSacks
.82
.81
.77
.03.61.39
—9
.85
.80
3.911.731.481.201.271.361.441.421.58
1.34.92
1.42.70
1.011.131.22
.721.21
18,623,01)013,481,00014,651,00010,444,00033,2111,00014,349,00018.018,00032,371,00038,353,000
10,623.13,481,14,651,10.444,33.250,14:348,10,618.32,373,18,052,
55,577,00054,225,00021,931,00030,531,00030,734,00041,642,00033,741,00052,092,00051,452,000
55,577’54,225,29,931,30,551,30,73441,64243,74152,09251,452
Note—Figures revised by United States Department of Agriculture.

LA
ND
CL
AS
SIF
ICA
TIO
N
OF
CO
LO
RA
DO
Irri
gate
dla
nd
Fir
stc/a
ssdry
farm
ii79
Second
cla
ssdry
farm
/n9
Thir
dcla
ssdry
farm
ing
Sai7
a’h
i//s
Nati
onal
fore
sts
Nati
onal
park
s
LEJ
Gra
incro
pla
nd
Gra
zin
gla
nd
jI:
Fora
ge
oro
plo
nd
v.G
DE
PA
RT
IIrN
TO
FA
GR
ICU
L.T
fJR
EN
EG
.32989
-SL
JRE
AU
OF
AG
FIc
UL
TU
RA
LE
CO
NO
fr71
Q9