Can diaries help in improving agricultural production statistics? Evidence from Uganda
25
Policy Research Working Paper 5717 Can Diaries Help Improve Agricultural Production Statistics? Evidence from Uganda Klaus Deininger Calogero Carletto Sara Savastano James Muwonge e World Bank Development Research Group Agriculture and Rural Development Team June 2011 WPS5717 Public Disclosure Authorized Public Disclosure Authorized Public Disclosure Authorized Public Disclosure Authorized
Transcript of Can diaries help in improving agricultural production statistics? Evidence from Uganda

Policy Research Working Paper 5717
Can Diaries Help Improve Agricultural Production Statistics?
Evidence from Uganda
Klaus DeiningerCalogero CarlettoSara SavastanoJames Muwonge
The World BankDevelopment Research GroupAgriculture and Rural Development TeamJune 2011
WPS5717P
ublic
Dis
clos
ure
Aut
horiz
edP
ublic
Dis
clos
ure
Aut
horiz
edP
ublic
Dis
clos
ure
Aut
horiz
edP
ublic
Dis
clos
ure
Aut
horiz
ed

Produced by the Research Support Team
Abstract
The Policy Research Working Paper Series disseminates the findings of work in progress to encourage the exchange of ideas about development issues. An objective of the series is to get the findings out quickly, even if the presentations are less than fully polished. The papers carry the names of the authors and should be cited accordingly. The findings, interpretations, and conclusions expressed in this paper are entirely those of the authors. They do not necessarily represent the views of the International Bank for Reconstruction and Development/World Bank and its affiliated organizations, or those of the Executive Directors of the World Bank or the governments they represent.
Policy Research Working Paper 5717
Although good and timely information on agricultural production is critical for policy-decisions, the quality of underlying data is often low and improving data quality could have a high payoff. This paper uses data from a production diary, administered concurrently with a standard household survey in Uganda to analyze the nature and incidence of responses, the magnitude of differences in reported outcomes, and factors that systematically affect these. Despite limited
This paper is a product of the Agriculture and Rural Development Team, Development Research Group. It is part of a larger effort by the World Bank to provide open access to its research and make a contribution to development policy discussions around the world. Policy Research Working Papers are also posted on the Web at http://econ.worldbank.org. The author may be contacted at [email protected].
central supervision, diaries elicited a strong response, complemented standard surveys in a number of respects, and were less affected by problems of respondent fatigue than expected. The diary-based estimates of output value consistently exceeded that from the recall-based production survey, in line with reported disposition. Implications for policy and practical administration of surveys are drawn out.
Can diaries help improve agricultural production statistics?
Evidence from Uganda
Klaus Deininger1, Calogero Carletto
1, Sara Savastano
&, James Muwonge
%
* World Bank, Washington DC, USA
& University of Tor Vergata Rome, Italy % Uganda Bureau of Statistics Kampala, Uganda
JEL Codes: O13, Q12

2
1. Introduction
Even in the face of rapid global urbanization, agriculture continues to be the mainstay for the majority of
households in the developing world. Rapid development of the agricultural sector is one of the most
effective mechanisms for reducing poverty and food insecurity (Ligon and Sadoulet 2008, Ravallion and
Chen 2007). Still, data on agricultural production in most developing countries are notoriously weak and
unreliable. This can greatly undermine the scope to design and fine-tune policies that will fully realize
agriculture‟s potential strengths. For example, without high quality data, it will be difficult to assess the
effectiveness of interventions to improve access to technology, the extent to which these affect household
welfare, and the ways in which gains are distributed among different types of households or members
within the same household. All of this will reduce the ability for evidence-based policy making and quick
scaling-up or adjustment of policies and other interventions in light of the outcomes they achieve.
To explore ways that could possibly help improve the quality of information on agricultural production,
this paper draws on the large-scale implementation of diaries, aimed to be filled by a household member,
assisted by a local person, at the time of harvest, in parallel to Uganda‟s 2005/06 National Household
Survey (UNHS). Having the diary administered to households included in the regular survey allows us to
compare production estimates by the two methods and allows identification of household characteristics
that are associated with higher levels of participation and reporting of production in diaries.
The analysis reveals some useful findings. First, despite a very limited budget, with no pretest and neither
central training nor any manual for local monitors, the diary produced encouraging results. Households
remained in the sample for an average of 5 months during the reference period and made an average of
115 entries that are fairly evenly distributed over time and do not provide strong evidence of respondent
fatigue. While some 20% failed to start filling the diary altogether (many of them because no qualified
monitor could be found), the share of drop-outs, i.e. respondents who abandoned the diary before it was
collected by UNHS field staff during their second visit, was below 10%. Location-specific attributes,
including unobserved quality of supervision by the local monitor, rather than observable household
characteristics, explain 70% of the variation in drop-outs.
Second, comparing incidence of reporting and value of output (computed applying the same price vector)
points to large discrepancies across methods. Changes in the magnitude and direction of these differences
across crops can help identify ways to improve the quality of production estimates. The fact that output
value from diaries and estimates based on reported home consumption plus sales significantly differ from
those based on recall (by 70% or 40%, respectively), suggests that, in the aggregate, values of production
as estimated from the UNHS‟s recall-based production module are likely to be an underestimate. This
could have far-reaching impact on estimates of agricultural production in Uganda.

3
Third, the magnitude of discrepancies between different methods varies by crop, with larger difference for
continuous crops like cassava and bananas. Moreover, econometric analysis of the difference between
different methods to estimate output allows identification of household characteristics that tend to be
associated with systematically larger differences. We find that smaller household size, higher levels of
productivity (yields), larger cultivated areas, and to some extent higher levels of education and wealth are
all associated with lower differences between methods. As these characteristics are also associated with
higher levels of drop-out or non-response for diaries, there may be scope to exploit complementarities
between different methods, with diaries producing particularly good estimates of output for continuously
harvested crops obtained by households with limited amount of formal education at the tail end of the
distribution.
The paper is structured as follows: Section two highlights challenges and our approach by reviewing pros
and cons of different ways of collecting agricultural production data. This is used to describe why diaries
were introduced, how they were implemented, on a trial basis, in Uganda, the challenges they need to
respond to.. Section three provides empirical evidence regarding diary coverage and respondent fatigue.
Section four compares results obtained by different types of survey both at a descriptive and an
econometric level. Section five concludes by pointing towards implications for policy and research.
2. Approach and challenges
To motivate the diary approach, this section briefly reviews pros and cons of different methods used to
collect information on agricultural production in situations such as the Ugandan one where large part of
crop output is made up of continuously harvested crops. In fact, crops like cassava and banana are
generally harvested in small quantities over long periods of time, thus making recall over several months
rather difficult. We then describe the methodology used to administer the diary approach in parallel to the
2005/06 National Household survey and the potential biases it was expected to reduce.
2.1 The challenge of collecting reliable information on continuously harvested crops
Data on agricultural production can be obtained through a range of different instruments and the key issue
confronting statisticians and researchers is how to do so at an acceptable trade-off between cost and
potential measurement errors. Crop cutting, whereby enumerators actually harvest and physically weigh
output from sample plots, is generally considered to be the most reliable and precise way of measuring
agricultural output, has two disadvantages. First, the need for continued field presence by a skilled staff
increases costs to a point where broad application of this method may become unaffordable. Tightening
budgetary constraints faced by relevant line agencies do indeed often result in poorly administered crop

4
cuts. Second, in light of the time and skills required, specialized production surveys relying on crop
cutting tended to neglect broader socio-economic variables, making it difficult to analyze results as an
outcome of rational decision-making by an agricultural household. A second method that has been used
traditionally to provide production information relied on periodic reports from agricultural extension
workers. The lack of a micro orientation and the potential interest of such agents to report favorable
outcomes tend to limit the credibility of such estimates. On the other hand, remotely sensed data may be
useful for aggregate assessment of crop conditions and expected harvest amounts but too crude to provide
the micro-evidence needed to address the multitude of issues -from determinants of technology adoption,
interactions between crops, and equity impacts of improving technology across and within households-
that are of considerable interest to policy makers. Given different costs, strengths and weaknesses by each
of these methods, collecting meaningful data in a cost-effective way will invariably entail trade-offs.
Failure to understand or address these trade-offs can undermine the credibility of agricultural statistics
and the ability to generate meaningful research and policy prescriptions.
In light of these constraints, multi-purpose household surveys have emerged as a key tool to provide
agricultural production information as well as complementary information that would allow analysis of
agricultural supply, rural welfare, and links to the non-farm economy1. It is well known that a number of
factors that include inadequate training of enumerators, long lags since completion of the harvest and the
implied recall error, control of plots by people other than the respondent, use of non-standard units of
measurement, intercropping, and limited reliability of self-reported area measurements from respondents
without actual cross-checking in the field, may limit the accuracy of information provided by such
surveys. A combination of these factors can result in agricultural production data of poor quality with
large measurement errors. Surprisingly little attention has been devoted to measuring the extent of such
errors and ways in which it could be minimized, although there are some initial attempts at taking this
more seriously, for example by examining recall error more systematically (Beegle et. al. 2011).
While a number of countries, including China, routinely use diaries to obtain what are considered high
quality data on household expenditure, diaries have seldom been used for estimating crop production,
despite evidence in other fields of the potential benefits they can bring. Diaries are used in both developed
and developing countries for recording food consumption and/or expenditures in household surveys such
as Household Budget Surveys (HBS) and the Living Standards Measurement Study, or LSMS (Grosh and
Glewwe 2000). In developing countries, their use and ultimate appropriateness has been questioned on
several grounds, including the low level of literacy of respondents (Bowling 2002) and the presumption
1 Most recently, in a departure from previous methodological guidelines, the Global Strategy for Agricultural Statistics, a multi-agency effort by
the UN, World Bank, FAO and USDA, among others, advocated for integrating the collection of agricultural statistics with a multi-topic framework, as to allow for a better understanding of agricultural processes and outcomes within the broader household economy.

5
of high costs. Pictorial diaries and other methods have been proposed to partly overcome problems of
illiteracy (Wiseman et al. 2005). Also, respondent‟s fatigue raises concerns about administering extensive
(consumption) diaries, particularly in urban areas and for relatively long reference periods, potentially
resulting in selective survey compliance. In developing countries contexts, consumption diaries are being
increasingly used and their accuracy vis à vis recall methods tested (Ahmed et al. 2006, Beegle et al.
2010, Gibson 2002). However, as noted by Wiseman et al (2005) “much of the literature on diaries
focuses on empirical results as opposed to methodological insights”. Moreover, despite their potential
advantages, particularly for intercropping, crops (e.g. tubers and vegetables) where the harvest stretches
over longer spells, and for plots cultivated by different individuals within the household, diaries have
rarely been used in agricultural production. Whether they can complement or even provide an alternative
to recall or crop cutting methods is remains an empirical question.
2.2. The diary experiment and modalities of its implementation in Uganda
A high incidence of intercropping and prevalence of continuously harvested crops such as banana
(matooke), cassava, and sweet potato imply that accurately measuring crop output in Uganda has long
been a challenge. Production statistics published by international organizations such as FAO and figures
from national household surveys differ widely from each other. Such errors may be exacerbated by issues
of survey design and implementation including interviews that occur long after the reference period,
respondent fatigue, or poor enumerator training. To explore ways to improve agricultural production
statistics and analyze potential sources and magnitudes of errors in standard household surveys, the
Uganda Bureau of Statistics (UBOS) complemented the 2005/06 Uganda National Household Survey
(UNHS) with a harvest diary. The UNHS is a standard multi-purpose household survey with a sample of
some 7,500 households from 750 enumeration areas (EAs) which, in rural areas are mostly equivalent to
villages. Information on agricultural production was collected in two visits, each covering one of the
country‟s two main cropping seasons. The first and second visit collected data on agricultural production
for July to December 2004 and January to July 2005, respectively.
We expect that having a diary would significantly reduce three sources of bias that might possibly have
led to under-reporting of crop output. First, as it records output immediately upon harvest, recall bias,
whereby in interviews that occur long after the crop has been harvested respondents may under-report the
actual amount of output obtained, should be minimized. Second, diaries are expected to reduce
respondent bias that might arise from the fact that recall surveys are implemented by a dedicated team
that has limited time available for finalizing the interview and often interviews only one member of the
household. Diaries, by contrast, can be regularly reviewed together with the local monitor and the danger
that a household member other than the one responsible for production provides is asked to provide
6
responses is minimized. This issue is particularly important from a gender perspective in situations where
women are main agricultural producers or where household members cultivate their individual plots.
Finally, the fact that the crop monitor is a trusted local person will minimize enumerator bias that might
result from respondents suspecting that data will be used for taxation or other undesirable purposes.
To achieve this, the harvest diary, which complemented the standard two-round survey, was distributed to
households at the time of the first round interview, to allow recording of all outputs from crop production
at the time of harvest from that point on until the time of the next visit to the household, approximately
five to six months later. The layout of the crop diary is straightforward: following general instructions,2 it
contains six monthly tables to record harvested quantities. Columns provide space to fill in the date of
harvest, the crop name, local measurement units, quantity harvested, and any additional characteristics
e.g. whether maize or beans was harvested fresh with cobs/pods or shelled and dry.3
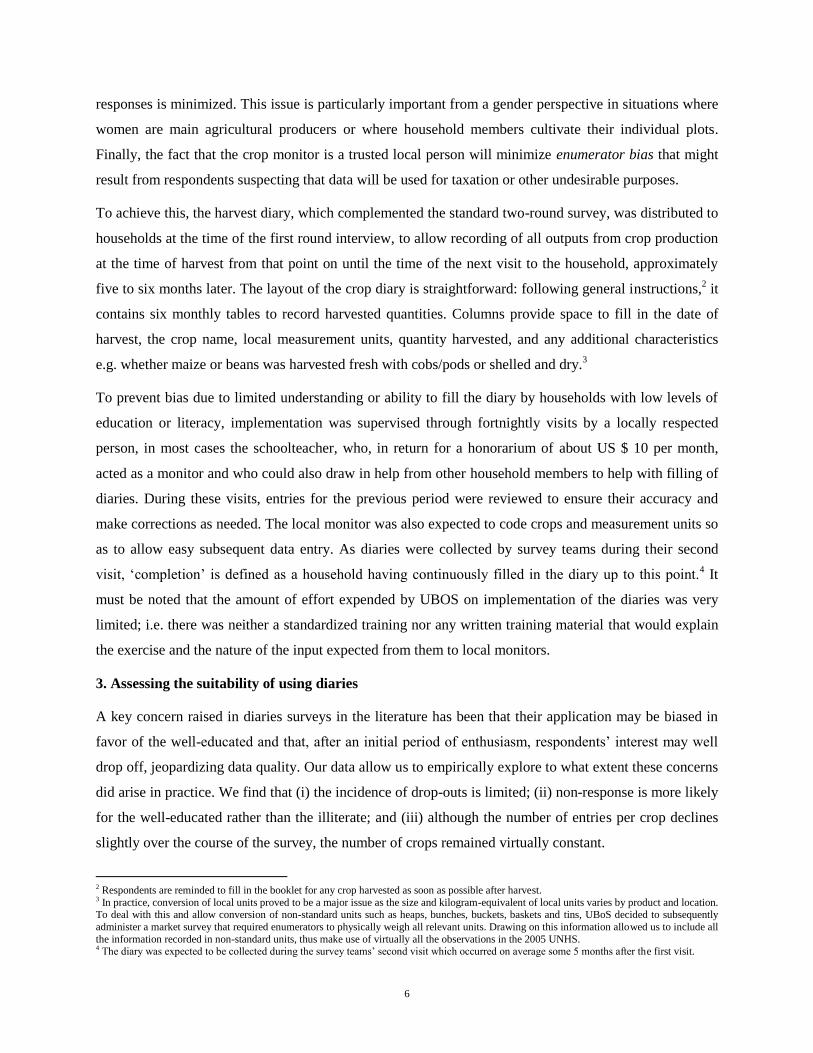
To prevent bias due to limited understanding or ability to fill the diary by households with low levels of
education or literacy, implementation was supervised through fortnightly visits by a locally respected
person, in most cases the schoolteacher, who, in return for a honorarium of about US $ 10 per month,
acted as a monitor and who could also draw in help from other household members to help with filling of
diaries. During these visits, entries for the previous period were reviewed to ensure their accuracy and
make corrections as needed. The local monitor was also expected to code crops and measurement units so
as to allow easy subsequent data entry. As diaries were collected by survey teams during their second
visit, „completion‟ is defined as a household having continuously filled in the diary up to this point.4 It
must be noted that the amount of effort expended by UBOS on implementation of the diaries was very
limited; i.e. there was neither a standardized training nor any written training material that would explain
the exercise and the nature of the input expected from them to local monitors.
3. Assessing the suitability of using diaries
A key concern raised in diaries surveys in the literature has been that their application may be biased in
favor of the well-educated and that, after an initial period of enthusiasm, respondents‟ interest may well
drop off, jeopardizing data quality. Our data allow us to empirically explore to what extent these concerns
did arise in practice. We find that (i) the incidence of drop-outs is limited; (ii) non-response is more likely
for the well-educated rather than the illiterate; and (iii) although the number of entries per crop declines
slightly over the course of the survey, the number of crops remained virtually constant.
2 Respondents are reminded to fill in the booklet for any crop harvested as soon as possible after harvest. 3 In practice, conversion of local units proved to be a major issue as the size and kilogram-equivalent of local units varies by product and location. To deal with this and allow conversion of non-standard units such as heaps, bunches, buckets, baskets and tins, UBoS decided to subsequently
administer a market survey that required enumerators to physically weigh all relevant units. Drawing on this information allowed us to include all
the information recorded in non-standard units, thus make use of virtually all the observations in the 2005 UNHS. 4 The diary was expected to be collected during the survey teams‟ second visit which occurred on average some 5 months after the first visit.

7
3.1 Coverage and its determinants
Basic characteristics of time line and participation are illustrated in Table 1 by fortnight of the May 2005
to March 2006 survey period which according to FAO covers the harvest periods for most of Uganda‟s
seasonal crops.5 Column 1 illustrates that, after a rather slow start of 45 and 194 households who received
the diary in the first or second fortnight of May 2005, some 400 households started making diary entries
in each of the subsequent fortnights to add up to 4,451 who made any diary entries overall. The
cumulative total of households reporting in any period, net of those who dropped or completed, in column
2 illustrates that we have a total of 41,673 fortnight-household combinations. The duration for which a
household starting in a given fortnight remained in the sample as well as the number of diary entries
made, as reported in col. 3 and 4, suggests that, with the exception of the initial and the last periods, the
average household made diary entries for about 10 fortnights or 5 months and that, with some 115 entries
overall (or 11.09 per fortnight), the frequency of doing so was high, i.e. almost on a daily basis. With
more than half a million entries in total, this could potentially provide quite a rich basis of information to
analyze agricultural performance, provided underlying information is of good quality.
Before making inferences from the diary on overall agricultural production in Uganda, it will be critical to
assess the extent to which certain households will be more predisposed than others to responding, thus
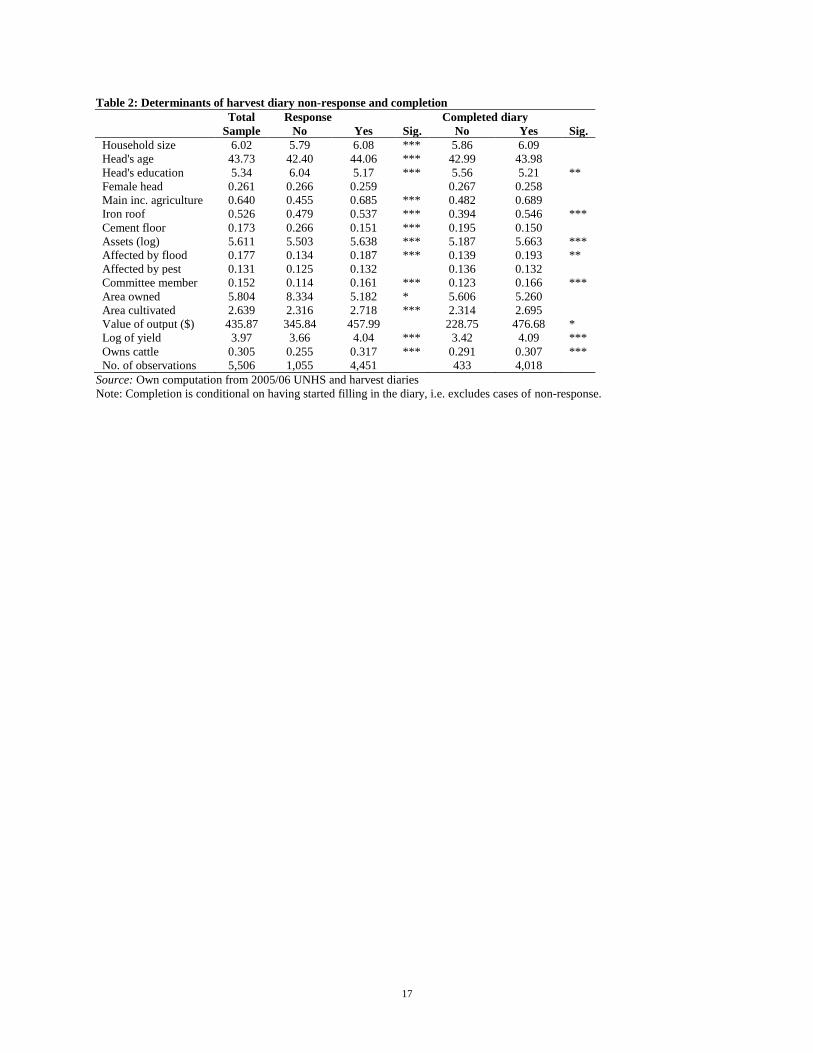
possibly leading to biased results. Table 2 presents sample composition and descriptive statistics to assess
whether some groups are more likely to respond to or complete the diary. Overall figures suggest that, out
of a total of 5,506 households who received the diary, 1,055 never made any entry, leading to a non-
response rate of slightly below 20%. For those who started, however, attrition was relatively low, i.e.
more than 90% persevered in filling the diary until it was collected during the second visit of the survey.6
Across regions, completion rates are lower in urban areas and highest in the West but lowest in the
Center. Given the very limited training effort and the modest cost of the exercise, results are encouraging.
To provide insights regarding potential biases, Table 2 compares descriptive statistics between
agricultural households who did or did not start filling the diary (col. 2 and 3) and, conditional on starting
to fill, those who completed and those who dropped out (col. 4 and 5). Three conclusions stand out. First,
those with high opportunity costs of time were less likely to either start or complete the diary. Those with
higher levels of education and a cement floor (which is less widespread and more suitable as an indication
of wealth than iron roofs) are significantly less likely to respond or complete. Second, a response is more
likely from those who are full time in agriculture, cultivate larger areas, and have higher yields (not
output). Finally, being a member of local committees or having been affected by more widespread
5 A reasonably complete crop calendar is available at http://www.fao.org/agriculture/seed/cropcalendar/searchbycountry.do. 6 Unfortunately, no record was kept of who made a particular entry or which of the household‟s plots the harvest came from. Given the interesting gender dynamics, exploring the potential for adding such information would be high on the agenda for potential future experiments of this sort.

8
calamities such as floods, increase the likelihood of a response. At a descriptive level, we are unable to
detect any bias against female headed households and the results suggest that, contrary to hypotheses of
diaries discriminating against the illiterate or uneducated (Grosh and Glewwe 2000), the assistance
provided through the monitor locally may actually help elicit a proper response from this group and
certainly bodes well for the ability to replicate such an exercise on a larger scale.
Descriptive statistics cannot distinguish between household level factors and broader local characteristics,
including low quality or motivation of the person administering the diaries. Although lack of data on this
person‟s attributes does not allow us to draw precise inferences in the regard, regressions of a linear
probability model with enumeration area fixed effects on whether a response was obtained or a diary was
completed conditional on having started, can provide some indications7. The main results of such
analysis, as reported in table 3, suggest that, with an R2
of 0.45 and 0.70, in regressions with fixed effects
only for response and completion, respectively, fixed effects explain a significant part of variation in the
data. For those who started filling in the diary, none of the household characteristics with the exception of
size and exposure to floods (which is likely to be related to contacts with the bureaucracy) is significant.
In terms of implementation, this suggests that quality of supervision is a key factor and that, with some
additional effort and support, achieving sufficient coverage to obtain representative results might be
possible.
3.2 Reporting frequency and respondent fatigue
A key substantive reason for implementing the diary was the desire to obtain more precise estimates of
production for continuously harvested crops. Achieving this objective requires that responses continue
over time and do not drop off sharply after an initial period of enthusiasm or stricter supervision.
Although Table 1 does not provide a strong reason to suspect that this may be the case, we can use the
fact that questionnaires were distributed to households at different points in time to test whether, in
addition to time varying effects that may be due to seasonality of crops, the number of entries made by a
household declines with the length of time the household has been filling the diary. To do so, we use the
fortnights defined above and estimate the following two specifications:
Eitc= α1+ α2Fit + α3 Tt + α 4 Dc + εitc (1a)
Citc = β1+ β2Fit + β3 Tt + ηitc (1b)
where Eitc or Citc is the number of entries per crop made by household i for crop c at time t or alternatively
the number of crops reported in time period t, Fit is a dummy that identifies, for every household, the
7 In the current survey, crop cards monitors are being asked to complete a questionnaire with their basic demographic and socio-economic characteristics.

9
number of periods it has been filling the diary, Tt is a dummy for the time elapsed since the start of the
survey to, among others, take care of seasonality, Dc is a crop dummy, εitc and ηitc are the error terms, and
α and β are vectors of coefficients to be estimated. If there were respondent fatigue, the magnitude of
elements in α2 (and β2) would decline significantly over time for either the regression with number of
crops or entries. Households learning of how to handle the diary over time would imply the opposite.8
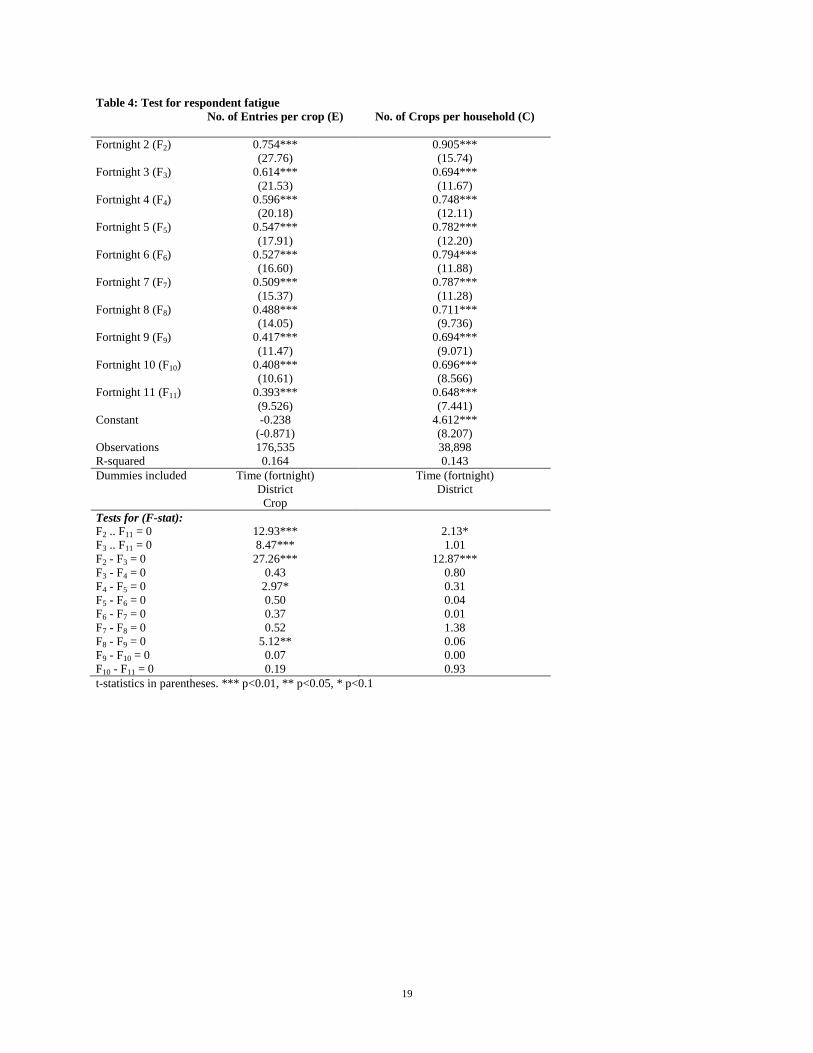
Estimating specification (1a) for the 176,535 household-fortnight-crop entries and (1b) on the 38,898
household-fortnight combinations (i.e. including households who did not complete the diary), as reported
in Table 4, provides some insights. First, coefficients are highly significant and suggest that number of
entries and crops (column 1) follows an inverted U-shaped pattern where an initial increase of about 0.75
entries per crop and fortnight, in the 2nd
fortnight, presumably as households get familiar with the diary, is
followed by a gradual decrease to 0.40 entries above the initial level in the 11th fortnight for a household.
A similar pattern is observed for the number of crops reported per household in any given fortnight
(column 2) which increases 0.9 in the 2nd
period to decline gradually to 0.65 above the initial level in the
last period, compared to an average of 3.08 entries per crop and fortnight and 3.6 crops per period.
Second, the bottom panel of table 4 contains results from F-tests to test equality of coefficients either to
each other and of the equality of all coefficients starting in the second or third fortnight for a household
equaling zero. They point to a modest but significant decline in the number of entries per fortnight and
crop per household. At the same time, we are unable to reject the hypothesis that the number of crops
reported per fortnight stabilizes after the second period at any conventional level of significance and after
the first period at 90%, possibly because households and local monitors learn how to fill the diary most
effectively. The data thus suggest that, at least as far as the number of crops is concerned, respondent
fatigue may be less of a concern than often assumed.
4. Assessing the quality of diary estimates of agricultural production
A more detailed picture of potential issues to be confronted in implementing diaries can be obtained by
comparing data from different types of sources for the same household, possibly for different types of
crops. For all except cash crops, the diary points towards higher incidence and greater output levels than
recall-based estimates. The hypothesis that the latter underestimates agricultural production in Uganda is
supported by estimates of disposition (home consumption plus sales) pointing in the same direction.
Econometric analysis suggests that discrepancies decline in respondents‟ size of operation, productivity,
and to some extent education and asset ownership. This would seem to suggest that properly implemented
8 Formally, respondent fatigue would mean that the coefficients in α2 are jointly different from zero whereas learning between period t and t+1
would imply that α2t+1 > α2
t. Also, as the number of observations drops sharply after 11 fortnights in the sample, we limit regressions to the specification with a maximum of 11 fortnights per household.

10
diaries can complement existing surveys for populations and output categories for which existing recall-
based surveys may results in considerable measurement errors.
4.1 Comparing diary and recall-based production estimates
To better appreciate the strengths and potential weaknesses of the diary, it is useful to compare the diary
estimates to what has been obtained through recall at the household level via a standard production
questionnaire. Table 5 reports the results from comparing the share of respondents who mention having
obtained any output from a given crop using each method (columns 1 and 2), the value of that production
(columns 3 and 4), and the number of entries in the diary this value corresponds to. We differentiate
between cash crops, seasonally or continuously harvested food crops, and fruits and vegetables.
First, for cash crops we find striking differences between diary and recall both in terms of a crop being
reported and the actual quantity of output recorded. With the exception of rice, reported quantities for
cash crop output and, for coffee and cotton also the incidence of a crop being mentioned, are much lower
for the diary than the recall. As this is unlikely to be due to the harvest period falling outside of the
window covered by the diary, the most reasonable explanation is that, for this type of remunerative crops,
recall may come relatively easy and that a diary, unless properly implemented, may result in under-
reporting if perceived as being associated with some form of taxation or income monitoring For coffee,
22 percent in the diary, vis a vis 32 percent in the recall survey, mention having any output from the crop
and for those who do, reported output is about two thirds lower than for those in the recall (i.e. $ 11
compared to $ 30). The difference in reporting output is more pronounced for cotton (also with a low
frequency of harvesting). While sugarcane is mentioned by more households in the diary than the recall
(and, with 6.6 entries per reporting household, at a relatively high frequency), reported output is well
below the low levels of the recall. In the aggregate, this implies that for cash crops, total output value as
reported by the diary amounts to some 56% of what emerges from the recall. While contrary to our initial
expectation (according to which error should be lowest for cash crops sales of which are discrete events
that are easy to remember, this results suggests that systematic bias in favor of over-reporting of output in
the diary is unlikely and that careful empirical study is important.
Second, the match of reported incidence and output values is much closer for most seasonal food crops. In
the diaries, reported incidence, which is almost equal for maize and beans, is much higher for field peas
and to a lesser extent groundnut (intercropped and thus more likely to be overlooked in the recall survey).
Marked differences in terms or harvesting quantity per reporting households also emerge for groundnuts,
sorghum, and millet. In some cases, the magnitude of the difference (e.g. $ 125 vs. $ 37) for beans could
be due to confusion between fresh and dried produce. At the same time, the comparatively large numbers
of entries per reporting household (e.g. 21.5 for beans and 11.4 for maize) highlights that even seasonal

11
crops are rarely harvested at once. Having a diary with flexibility to accommodate such flexibility could
provide some advantages. Overall, and in contrast to what was found for cash crops, the value of output
recorded in the diary is more than double the amount reported in the recall if beans are included and
almost 80% higher if they are excluded. The large differences for seasonal food crops point towards
considerable scope for improving estimates of agricultural output in Uganda.
Evidence for continuously harvested crops seems to support the hypothesis that had motivated adoption
of the diary in the first place: for crops in this group, the number of reporting households and the value of
production reported are consistently higher in the diary than in the recall. Large differences in the order to
30-40 percent even in terms of reporting as with cassava, sweet potatoes and banana are magnified by
sometimes significant variation between output values as reported by the two instruments, as in the case
of sweet potatoes ($ 81 in the diary vs. $ 33 in the recall)9. The number of entries per reporting household
(column 5), which ranges from 34 (i.e. more than 3 times per fortnight) for banana to 8 for yams, is much
larger in this group than in others provides at least prima facie support to such a hypothesis. For reporting
households, value of output reported by the diary is some 50% above recall figures.
The incidence with which fruit and vegetables are reported in the diary consistently exceeds that of the
recall although, with low output values overall, the implication of such differences for aggregate output is
less pronounced than was the case earlier. Discrepancies in reporting any output are particularly large for
some fruits such as papaya (32% in the diary vs. 1.7% in the recall), oranges (16% vs. 0.7%), and passion
fruit (13% vs. 0.8%). Even though the total value of reported output is, with some $15 small, this creates
an impression of production in Uganda‟s agricultural sector being far less diversified than it is in reality.
Taken together, the data from the diary suggest that, despite markedly lower reporting for cash crops, the
value of output reported here is, with $ 615.12, almost 60% higher than the $ 372.94 based on recall.
While the diary relies on a much large number of entries somewhat increases our confidence in its
reliability, it is not clear a priori which of the two sources is closer to the true value. As the survey‟s
consumption section provides independent data on consumption of own-produced food during the 7 days
preceding the interview, we can use these data, properly scaled up, together with information on sales,
10to check orders of magnitude and direction of bias. The greater detail of the consumption section
compared to the agricultural module,11
together with the shorter recall period and the fact information
refers to the period immediately preceding the survey suggest that the figures it provides should be more
9 For cassava, even the diary figures may be an underestimation as the product is often harvested over longer periods than the six months for
which diaries were collected. 10 As sales information was elicited as a part of production in the survey‟s agricultural module, figures on sales are not an independent piece of information implying that figures on disappearance essentially just involve a properly scaled up version of home consumption. 11 In contrast to the production module that just provides (17) lines on which enumerators are expected to enter produce grown from memory or
as mentioned by the household, the consumption module asks explicitly for purchases and consumption of home produce of 58 categories of food items.

12
reliable than those coming from the agricultural module. It is thus reassuring that for the main categories,
figures based on disappearance fall between those from the diary and those from the agricultural section
(see table 6). Two exceptions are of interest. One is for cash crops, where home consumption is irrelevant.
The second is for fruits and vegetables where disposition-based estimates are more than double the diary
value.
While a brief look at the data suggests that part of the inability to properly capture output of this category
is due to inconsistent diary application that may have resulted from a lack of clear guidance to monitors,
field testing would be required to determine the scope (and cost) for obtaining information on the fruits
and vegetables category through the diary. Better training of field staff to ensure that fresh and dry beans
or shelled and unshelled groundnuts will need to be properly coded could presumably also have helped to
reduce the discrepancy between diary and recall for seasonal food crops which, despite the larger scope
for sales for such crops, appears too large to be accounted for by this factor alone12
. All of this implies
that, while diaries have potential advantages to overcome some shortcomings of the agricultural module,
the extent to which this potential is realized will depend on the quality of implementation.
4.2 Econometric analysis
As production quantities suggested by diaries and disposition are markedly higher than those based on
recall, there is some promise in trying to identify characteristics that systematically affect discrepancies
between output quantities suggested by these two methods compared to standard recall for the same
household h. Formally, we estimate
ΔOh = α1+ α2Zh + α3 Mh + α4 EAh + α5 Eh + εh (2)
where ΔOh is the difference between estimates of production based on diary or disposition and recall, Zh is
a vector of household characteristics Mh is a set of dummies indicating the length for which the household
remained in the sample until the diary was collected at the time of the second visit, EAh and Eh are vectors
of dummies for enumeration areas and enumerators conducting the interview while εh is an iid error term.
Table 7 reports results from estimating this regression for the entire sample and only households with
complete diaries. As one would expect, individual coefficients on month-in-sample dummies are highly
significant for the difference between diary and recall.13
The bottom panel, which contains results from F-
tests for joint significance of different sets of dummies supports this, indicating that indeed month-in-
12 One additional factor to keep in mind in interpreting these differences for fruits and vegetables has to do with the choice of respondents. While
the diary is generally filled by a male respondent, the designated respondent in the household questionnaire is the plot manager. Thus, in the case of fruit and vegetables grown in female-controlled fields, diaries may be improperly filled by male respondents. 13 For an identical regression where the dependent variable is instead the difference between recall and disposition (results not reported), the
number of months in sample is completely insignificant, as one would expect. We also note that enumerator-dummies are jointly highly significant for the disposition-based estimates which, in contrast to the diaries, are affected by the effort exerted during enumeration.

13
sample dummies are jointly highly significant for the former and lack significance for the latter. 14
Also,
as table 7 illustrates, the variable indicating the overlap between the period during which diary
information was collected and the period covered by the recall survey is not significant in any of the
specifications, most likely because where it existed, the overlap was quite short.
This evidence might also provide the basis for substantive conclusions regarding the types of households
for which recall-based estimates of production might yield more or less reliable results.15
Differences are
estimated to consistently increase in household size, presumably because with larger size the probability
of members managing their own plots is likely to increase. Regressions also suggest that differences
decline in area cropped as well as yields plausibly because larger and more productive farmers will be
better able to keep track of production outcomes. Finally, results in columns 1 and 2 also suggest that
differences decline with the head‟s education and ownership of cattle as a major productive asset.
4.3 Implications for using diaries in practice
Taking the results from Tables 7 and 3 together, it appears that, at least in some respects, well-supervised
diaries can complement more traditional types of data collection methods. To see this, recall that in Table
3, non-response was estimated to increase with education and asset ownership and that the likelihood of
diary completion increased with household size. Table 7 suggests that all of these variables are associated
with larger differences between recall-based estimates of production and those obtained from diaries, so if
the latter are closer to the true value, the potential for improvement would be considerable.
While the above results suggests that diaries can plausibly provide more accurate information on output
quantities than recall-based surveys, a key argument against their more widespread use has been the
supposedly high cost of conducting them. The Uganda experience reported here suggests otherwise: local
monitors were paid some US$ 10 per month to assist in keeping of diaries in each ten-household cluster,
something that would translate to approximately US$12 per household per year.16
Even if this cost were
doubled to provide adequate training for monitors and account for other expenses, the cost would only
amount to slightly more than a tenth of the cost (US$ 200 per household) for the socio-economic survey.17
This suggests not only that a focus on “low-hanging fruit” could have great benefits at relatively low cost
but also that there may be scope for using harvest diaries more broadly to obtain reliable information on
agricultural production in a more participatory way.
14 We lack detailed information on enumerator characteristics except gender which can be inferred from their name. Interestingly, however, the
difference is higher for female enumerators than for male ones (not reported), a result that is consistent with the hypothesis that female enumerators exert more care and thus obtain higher figures for home consumption. Unfortunately, no information on respondents, which would
have allowed further exploration of this line of reasoning, is available. 15 The weakly significant coefficient for the share of plots managed by females in column 3 provides some support for this interpretation. 16 A full costing will have to add expenses for training and supervision of ”diary monitors” and adding these is important because, as noted
earlier, the experience reported here implies that failure to invest in these items can dramatically reduce the quality of the information obtained. 17 Although somewhat high by international standards, this cost is in line with past household surveys in Uganda. Costs seem to be increased by the need to visit households twice and the requirement to measure plots in the field.

14
While our results imply that application of diaries may provide opportunities to complement other survey
methods, they also point to ways in which training and/or supervision could help improve and thus yield
greater consistency between the results from recall-based surveys and diaries, especially regarding the
elimination of what appeared like worryingly high levels of discrepancies in reporting of any output from
a given crop. For diaries, where no training was provided at all, marginal returns to minimum efforts in
this respect to ensure consistency and alert enumerators or monitors of potential pitfalls appear to be
particularly high.18
Given the level of performance achieved even in the absence of any such effort, this
could provide scope to add some elements to the diary, e.g. the identity of the person reporting and the
plot from which output was obtained, to improve the quality of information and the scope for research.
These could include the. Some of these lessons are applied and others tested in an ongoing multi-year
survey program by the Uganda Bureau of Statistics in collaboration with the World Bank.
5. Conclusion
This paper started out from the observation that, although a number of factors have made multi-purpose
household surveys the workhorse for collection of socio-economic household-level data of many types,
the quality of implementation matters and the scope they offer to collect good agricultural information on
recurring small events such as the collection of small and seasonally varying amounts of continuously
harvested crops often for home consumption, may well be improved. Three results stand out:
First, the fact that, even in a country with a long tradition of conducting high quality surveys and a
statistical agency that is generally considered to be among the better ones in Africa, data on agricultural
output are subject to very large variation suggests that even relatively simple measures (e.g. training,
quality audits, consistent coding) to improve data quality could have significant impact on improving the
basis of data for decision-making. This points towards the need for a concerted effort to explore the
underlying reasons (e.g. reporting of outputs in fresh or dry weight, use of non-standard units), and
establish and disseminate standards (as well as monitoring) to improve quality of production surveys. In
cases where standard surveys are not the most cost-effective, ways to harness synergies and draw on
complementary methodologies will be needed. Our analysis suggests that doing so will require serious
analytical effort and reliance on hard empirical data.
Second, in the case of Uganda, a decentralized effort to administer diaries that was supported with a
minimal amount of resources and no field testing, training, or other systematic guidance, elicited good
participation and decent data quality suggests that there is scope for exploring more actively the potential
18 Clear selection criteria (possibly an entry exam), a written manual, better training, and a more incentive-compatible way of remunerating “diary
monitors” could probably go a long way and can be done at minimal cost. Supervision, e.g. through spot checks of the information obtained, may
require more imagination but could, for example, be accomplished by having regional supervisors who might also have a role in entering and transmitting the data to headquarters on a more frequent basis for further checking.

15
of decentralized mechanisms of data collection. The Uganda case implies that some of the concerns that
have traditionally been raised to caution against broader use of diaries, in particular the notion that these
might be too expensive or unsuitable for illiterate people, are not supported by the facts. The more
participatory nature of diaries could imply that, if properly designed, diaries could not only enhance our
understanding of the facts but also be combined with other data collection tools. The usefulness of
production diaries may be further enhanced if they could be used to also collect other types of data e.g. on
inputs such as labor, that are spread out over the year and thus very difficult to measure based on recall.
Third, while diaries are not a magic solution, they appear to be better suited than traditional recall-based
surveys to obtaining estimates for high frequency events with some seasonal component. These include
continuously harvested crops but possibly also use of agricultural inputs, especially labor, and output
from livestock production. More systematic analysis of the extent to which diaries could help to improve
the quality of information in these and related areas, and scaling up of its application, could potentially
have high payoffs. This is reinforced by our finding of low attrition and negligible non-response for near-
subsistence producers close to the tail-end of the distribution for whom the errors associated with
traditional surveys are often particularly large. Doing so may also have large benefits in terms better
understanding the behavioral dynamics underlying agricultural production (e.g. with respect to gender)
for a particularly vulnerable group with possibly far-reaching implications for poverty reduction.
Identifying the niche, in terms of data and respondent characteristics, for which diaries could be suitably
used will require more work but given the potential, this appears to be a worthwhile line of analysis.

16
Table 1: Harvest diary implementation structure
Fortnight Total households Duration Entries Entries per period
Starting Reporting of starters per starter total per hh
May 05 1 45 45 10.04 128.31 611 13.58
2 194 239 9.74 129.74 2,363 9.89
June 05 1 352 606 9.98 107.10 8,335 13.75
2 430 1003 9.80 105.18 14,468 14.42
July 05 1 443 1431 10.36 111.21 18,755 13.11
2 345 1652 10.18 101.97 23,666 14.33
Aug 05 1 610 2264 10.82 122.18 27,431 12.12
2 479 2608 10.42 124.95 37,772 14.48
Sept 05 1 422 2979 10.31 116.63 40,141 13.47
2 387 3234 10.25 122.60 45,876 14.19
Oct 05 1 336 3556 9.83 120.74 49,115 13.81
2 328 3723 9.78 118.36 55,696 14.96
Nov 05 1 73 3580 8.16 72.19 54,071 15.10
2 7 3332 2.86 7.57 47,417 14.23
Dec 05 1 2727 41,569 15.24
2 2509 36,598 14.59
Jan 06 1 1946 28,142 14.46
2 1702 23,900 14.04
Feb 06 1 1003 14,371 14.33
2 879 11,028 12.55
Mar 06 1 404 5,547 13.73
2 251 3,118 12.42
Total 4,451 41,673 10.41 115.50 589,990 11.09
Source: Own computation from harvest diaries
17
Table 2: Determinants of harvest diary non-response and completion Total Response Completed diary
Sample No Yes Sig. No Yes Sig.
Household size 6.02 5.79 6.08 *** 5.86 6.09
Head's age 43.73 42.40 44.06 *** 42.99 43.98
Head's education 5.34 6.04 5.17 *** 5.56 5.21 **
Female head 0.261 0.266 0.259 0.267 0.258
Main inc. agriculture 0.640 0.455 0.685 *** 0.482 0.689
Iron roof 0.526 0.479 0.537 *** 0.394 0.546 ***
Cement floor 0.173 0.266 0.151 *** 0.195 0.150
Assets (log) 5.611 5.503 5.638 *** 5.187 5.663 ***
Affected by flood 0.177 0.134 0.187 *** 0.139 0.193 **
Affected by pest 0.131 0.125 0.132 0.136 0.132
Committee member 0.152 0.114 0.161 *** 0.123 0.166 ***
Area owned 5.804 8.334 5.182 * 5.606 5.260
Area cultivated 2.639 2.316 2.718 *** 2.314 2.695
Value of output ($) 435.87 345.84 457.99 228.75 476.68 *
Log of yield 3.97 3.66 4.04 *** 3.42 4.09 ***
Owns cattle 0.305 0.255 0.317 *** 0.291 0.307 ***
No. of observations 5,506 1,055 4,451 433 4,018
Source: Own computation from 2005/06 UNHS and harvest diaries
Note: Completion is conditional on having started filling in the diary, i.e. excludes cases of non-response.

18
Table 3: Regressions for non-response and completion
Response Completion
if any entry
Household size 0.00244 0.00310***
(1.476) (2.950)
Head's age -3.58e-05 -9.74e-05
(-0.116) (-0.491)
Head's education -0.00196* 0.000553
(-1.766) (0.705)
Female head 0.0135 -0.000118
(1.248) (-0.0171)
Iron roof -0.0138 -0.0109
(-1.129) (-1.435)
Cement floor -0.0344** -0.00219
(-2.292) (-0.227)
Value of assets (log) 0.00422 -0.000501
(0.989) (-0.179)
Affected by flood -0.0115 0.0155**
(-0.946) (2.043)
Affected by pest 0.0125 -0.0137
(0.920) (-1.598)
Committee member 0.0423*** 0.00246
(3.321) (0.309)
Main occ. agriculture 0.0235** -0.00147
(2.240) (-0.220)
Total area owned -5.90e-05 -2.46e-05
(-0.709) (-0.324)
Total area rented out 8.12e-05 0.000169
(0.150) (0.177)
Total area cultivated -0.00169 0.000656
(-1.569) (0.838)
Value of output ($) -8.81e-07 -4.88e-07
(-0.443) (-0.418)
Log of yield 0.0182*** 0.00383
(3.640) (1.136)
Owns cattle 0.00255 0.00351
(0.236) (0.520)
Constant 0.703*** 0.874***
(23.48) (43.70)
No. of observations 5,319 4,307
R-squared 0.455 0.696
Note: t-statistics in parentheses. *** p<0.01, ** p<0.05, * p<0.1
19
Table 4: Test for respondent fatigue
No. of Entries per crop (E) No. of Crops per household (C)
Fortnight 2 (F2) 0.754*** 0.905***
(27.76) (15.74)
Fortnight 3 (F3) 0.614*** 0.694***
(21.53) (11.67)
Fortnight 4 (F4) 0.596*** 0.748***
(20.18) (12.11)
Fortnight 5 (F5) 0.547*** 0.782***
(17.91) (12.20)
Fortnight 6 (F6) 0.527*** 0.794***
(16.60) (11.88)
Fortnight 7 (F7) 0.509*** 0.787***
(15.37) (11.28)
Fortnight 8 (F8) 0.488*** 0.711***
(14.05) (9.736)
Fortnight 9 (F9) 0.417*** 0.694***
(11.47) (9.071)
Fortnight 10 (F10) 0.408*** 0.696***
(10.61) (8.566)
Fortnight 11 (F11) 0.393*** 0.648***
(9.526) (7.441)
Constant -0.238 4.612***
(-0.871) (8.207)
Observations 176,535 38,898
R-squared 0.164 0.143
Dummies included Time (fortnight)
District
Crop
Time (fortnight)
District
Tests for (F-stat):
F2 .. F11 = 0 12.93*** 2.13*
F3 .. F11 = 0 8.47*** 1.01
F2 - F3 = 0 27.26*** 12.87***
F3 - F4 = 0 0.43 0.80
F4 - F5 = 0 2.97* 0.31
F5 - F6 = 0 0.50 0.04
F6 - F7 = 0 0.37 0.01
F7 - F8 = 0 0.52 1.38
F8 - F9 = 0 5.12** 0.06
F9 - F10 = 0 0.07 0.00
F10 - F11 = 0 0.19 0.93
t-statistics in parentheses. *** p<0.01, ** p<0.05, * p<0.1

20
Table 5: Frequency, production value, and number of diary entries for different crops
Frequency (%) Production value ($) No. of entries Diary Recall Diary Recall Diary
Cash crops
Coffee 21.69 31.89 10.63 29.69 6.99
Rice 12.29 5.43 15.74 8.96 5.11
Cotton 0.57 9.14 0.50 6.12 2.61
Sugarcane 17.36 4.21 0.37 3.85 6.64
All cash crops 27.24 48.62
Food crops seasonal
Maize 73.93 76.80 66.45 60.38 11.41
Groundnuts 41.42 30.37 46.94 15.14 6.94
Beans 78.36 71.67 124.38 37.71 21.49
Finger millet 30.32 25.72 31.66 11.48 7.38
Sorghum 27.44 22.50 14.48 5.80 4.65
Field peas 17.21 1.87 9.59 0.34 6.34
Simsim 3.16 7.87 2.36 3.23 3.35
Soybeans 3.38 4.26 1.57 1.32 2.89
All seasonal food 297.43 135.40
.. excl beans 173.05 97.69
Food crop continuous
Banana 75.62 59.40 120.03 98.14 34.11
Sweet potatoes 83.16 59.02 81.09 33.25 28.66
Cassava 82.01 58.82 55.36 41.93 26.47
Irish potatoes 28.03 7.92 9.53 3.54 8.61
Yam 36.72 7.05 9.57 1.21 8.17
All cont. food 275.58 178.07
Fruit & Vegetables
Tomatoes 22.19 3.39 3.76 3.63 5.57
Onion 7.99 1.74 1.63 1.71 4.02
Passion fruits 13.06 0.87 1.80 0.73 4.95
Avocado 25.80 2.84 1.93 0.45 5.72
Pineapples 12.94 2.81 0.75 1.47 4.04
Cabbage 4.03 1.29 0.60 1.35 4.33
Pawpaw 32.71 1.72 1.46 0.22 7.44
Oranges 15.85 0.72 1.37 0.13 5.67
Mango 18.08 1.82 1.04 0.40 4.56
Dodo 6.57 0.65 0.24 0.50 7.20
Egg plants 4.03 1.00 0.29 0.26 4.44
All fruit & vegetable 14.87 10.85
All crops 615.12 372.94
Source: Own computation from harvest diary and 2005/06 UNHS
Only complete diaries included.

21
Table 6: Estimated values of output (in US$) from different sources, aggregate and by groups
Recall Disposition Diary Ratios
(1) (2) (3) (2)/(1) (3)/(1)
Cash crops 48.62 57.14 27.24 1.18 0.56
Food crops seasonal 135.4 164.50 297.43 1.21 2.20
Food crops continuous 178.07 270.26 275.58 1.52 1.55
Fruit & Vegetables 10.85 43.41 14.87 4.00 1.37
Total 372.94 535.31 615.12 1.44 1.65
Source: Own computation from 2005/06 UNHS and harvest diaries

22
Table 7: Household-level determinants of the difference between recall and diary
Entire sample Completed only
Household size 10.07*** 7.573**
(2.936) (2.052)
Head's education -6.639*** -6.043**
(-2.679) (-2.331)
Head's age -0.139 -0.0956
(-0.216) (-0.140)
Main occ. agriculture 41.69* 51.57**
(1.862) (2.152)
Production shock -13.40 -11.94
(-0.632) (-0.533)
Owns cattle -48.97** -69.55***
(-2.189) (-2.902)
No of parcels cultivated 5.790 8.791
(0.793) (1.141)
Total area owned -0.0436 -0.0507
(-0.175) (-0.201)
Total area cropped -66.64*** -66.46***
(-17.92) (-16.77)
Log of yield -165.0*** -165.3***
(-14.84) (-13.79)
Share of area managed by females 22.45 27.21
(0.998) (1.136)
Share of area pure stand -50.26 -57.32
(-1.390) (-1.499)
Overlap of at least 3 months -17.80 -13.61
(-0.496) (-0.357)
Months in sample = 2 145.2** 169.6**
(2.288) (2.308)
Months in sample = 3 204.9*** 214.6***
(3.213) (2.943)
Months in sample = 4 352.5*** 379.0***
(5.812) (5.459)
Months in sample = 5 508.5*** 548.4***
(8.482) (8.081)
Months in sample = 6 601.3*** 648.5***
(10.41) (9.939)
Constant 124.5 94.08
(0.209) (0.156)
Observations 4,238 3,819
R-squared 0.422 0.421
Tests (joint sig. of dummies for):
Months in sample (MIS) 20.95*** 19.41***
Enumeration area 2.91*** 2.72***
Enumerator 1.09 1.06
t-statistics in parentheses *** p<0.01, ** p<0.05, * p<0.1

23
References
Ahmed, N., M. Brzozowaski, and T. F. Crossley. 2006. "Measurement errors in recall food consumption data." Working Paper
WP06/21. London: Institute for Fiscal Studies.
Beegle, K., J. deWerdt, J. Friedman, and J. Gibson. 2010. "Methods of household consumption measurement through surveys:
Experimental evidence from Tanzania." . Washington DC: World Bank.
Beegle, K, G. Calogergo, G, and K. Himelein 2011. Reliability of recall in agricultural data, World Bank Policy Research
Working Paper series 5671. Washington, D.C.: World Bank
Bowling, A. 2002. Research methods in health. Buckingham: Open University Press.
Gibson, J. 2002. "Why does the Engel method work? Food demand, economies of size and household survey methods." Oxford
Bulletin of Economics and Statistics 64 (4): 341-60.
Grosh, M. and P. Glewwe. 2000. Designing household survey questionnaires for developing countries: Lessons from fifteen years
of the Living Standards Measurement Study. Washington, D.C.: World Bank.
Ligon, E. and E. Sadoulet. 2008. "Estimating the effects of aggregate agricultural growth on the distribution of expenditures." .
Washington DC: World Bank.
Ravallion, M. and S. H. Chen. 2007. "China's (uneven) progress against poverty." Journal of Development Economics 82 (1): 1-
42.
Wiseman, V., L. Conteh and F. Matovu. 2005. "Using diaries to collect data in resource-poor settings: questions on design and
implementation." Health Policy and Planning 20 (6): 394-404.
k