Agricultural Products in Colombia
30
Colombia - Agricultural Products 0078 - 2000 - 2017 © MARKETLINE THIS PROFILE IS A LICENSED PRODUCT AND IS NOT TO BE PHOTOCOPIED Page | 1 MarketLine Industry Profile Agricultural Products in Colombia September 2018 Reference Code: 0078-2000 Publication Date: September 2018 WWW.MARKETLINE.COM MARKETLINE. THIS PROFILE IS A LICENSED PRODUCT AND IS NOT TO BE PHOTOCOPIED A Progressive Digital Media business
-
Upload
khangminh22 -
Category
Documents
-
view
0 -
download
0
Transcript of Agricultural Products in Colombia

Colombia - Agricultural Products 0078 - 2000 - 2017
© MARKETLINE THIS PROFILE IS A LICENSED PRODUCT AND IS NOT TO BE PHOTOCOPIED Page | 1
MarketLine Industry Profile
Agricultural Products in Colombia September 2018
Reference Code: 0078-2000
Publication Date: September 2018
WWW.MARKETLINE.COM
MARKETLINE. THIS PROFILE IS A LICENSED PRODUCT AND IS NOT TO BE PHOTOCOPIED
A Progressive Digital Media business

Colombia - Agricultural Products 0078 - 2000 - 2017
© MARKETLINE THIS PROFILE IS A LICENSED PRODUCT AND IS NOT TO BE PHOTOCOPIED Page | 2
EXECUTIVE SUMMARY
Market value The Colombian agricultural products market shrank by 0.7% in 2017 to reach a value of $10.6 billion.
Market value forecast In 2022, the Colombian agricultural products market is forecast to have a value of $12.1 billion, an increase of 14.2%
since 2017.
Market volume The Colombian agricultural products market grew by 0.6% in 2017 to reach a volume of 76.5 million tonnes.
Market volume forecast In 2022, the Colombian agricultural products market is forecast to have a volume of 84.1 million tonnes, an increase of
9.9% since 2017.
Category segmentation Fruit is the largest segment of the agricultural products market in Colombia, accounting for 44.2% of the market's total
value.
Geography segmentation Colombia accounts for 2.8% of the Americas agricultural products market value.
Market rivalry In the Colombian agricultural products market, the overall rivalry is assessed as strong.

Colombia - Agricultural Products 0078 - 2000 - 2017
© MARKETLINE THIS PROFILE IS A LICENSED PRODUCT AND IS NOT TO BE PHOTOCOPIED Page | 3
TABLE OF CONTENTS
Executive Summary ....................................................................................................................................................... 2
Market value ............................................................................................................................................................... 2
Market value forecast ................................................................................................................................................. 2
Market volume ............................................................................................................................................................ 2
Market volume forecast .............................................................................................................................................. 2
Category segmentation .............................................................................................................................................. 2
Geography segmentation ........................................................................................................................................... 2
Market rivalry .............................................................................................................................................................. 2
Market Overview ............................................................................................................................................................ 7
Market definition ......................................................................................................................................................... 7
Market analysis .......................................................................................................................................................... 7
Market Data ................................................................................................................................................................... 9
Market value ............................................................................................................................................................... 9
Market volume .......................................................................................................................................................... 10
Market Segmentation ................................................................................................................................................... 11
Category segmentation ............................................................................................................................................ 11
Geography segmentation ......................................................................................................................................... 12
Market Outlook ............................................................................................................................................................. 13
Market value forecast ............................................................................................................................................... 13
Market volume forecast ............................................................................................................................................ 14
Five Forces Analysis .................................................................................................................................................... 15
Summary .................................................................................................................................................................. 15
Buyer power ............................................................................................................................................................. 16
Supplier power ......................................................................................................................................................... 17
New entrants ............................................................................................................................................................ 18
Threat of substitutes ................................................................................................................................................. 20
Degree of rivalry ....................................................................................................................................................... 21
Leading Companies ..................................................................................................................................................... 22
Cia Envasadora Del Atlantico................................................................................................................................... 22
Dole Food Company Inc .......................................................................................................................................... 23
Grupo Manuelita ....................................................................................................................................................... 24
Macroeconomic Indicators ........................................................................................................................................... 25
Colombia - Agricultural Products 0078 - 2000 - 2017
© MARKETLINE THIS PROFILE IS A LICENSED PRODUCT AND IS NOT TO BE PHOTOCOPIED Page | 4
Country data ............................................................................................................................................................. 25
Methodology................................................................................................................................................................. 27
Industry associations ................................................................................................................................................ 28
Related MarketLine research ................................................................................................................................... 28
Appendix ...................................................................................................................................................................... 29
About MarketLine ..................................................................................................................................................... 29

Colombia - Agricultural Products 0078 - 2000 - 2017
© MARKETLINE THIS PROFILE IS A LICENSED PRODUCT AND IS NOT TO BE PHOTOCOPIED Page | 5
LIST OF TABLES
Table 1: Colombia agricultural products market value: $ billion, 2013–17 ..................................................................... 9
Table 2: Colombia agricultural products market volume: million tonnes, 2013–17 ....................................................... 10
Table 3: Colombia agricultural products market category segmentation: $ billion, 2017 .............................................. 11
Table 4: Colombia agricultural products market geography segmentation: $ billion, 2017 ........................................... 12
Table 5: Colombia agricultural products market value forecast: $ billion, 2017–22 ...................................................... 13
Table 6: Colombia agricultural products market volume forecast: million tonnes, 2017–22 ......................................... 14
Table 7: Cia Envasadora Del Atlantico: key facts......................................................................................................... 22
Table 8: Dole Food Company Inc: key facts ................................................................................................................ 23
Table 9: Grupo Manuelita: key facts ............................................................................................................................. 24
Table 10: Colombia size of population (million), 2013–17 ............................................................................................ 25
Table 11: Colombia gdp (constant 2005 prices, $ billion), 2013–17 ............................................................................. 25
Table 12: Colombia gdp (current prices, $ billion), 2013–17 ........................................................................................ 25
Table 13: Colombia inflation, 2013–17 ......................................................................................................................... 26
Table 14: Colombia consumer price index (absolute), 2013–17 .................................................................................. 26
Table 15: Colombia exchange rate, 2013–17 .............................................................................................................. 26
Colombia - Agricultural Products 0078 - 2000 - 2017
© MARKETLINE THIS PROFILE IS A LICENSED PRODUCT AND IS NOT TO BE PHOTOCOPIED Page | 6
LIST OF FIGURES
Figure 1: Colombia agricultural products market value: $ billion, 2013–17 .................................................................... 9
Figure 2: Colombia agricultural products market volume: million tonnes, 2013–17...................................................... 10
Figure 3: Colombia agricultural products market category segmentation: % share, by value, 2017 ............................ 11
Figure 4: Colombia agricultural products market geography segmentation: % share, by value, 2017 ......................... 12
Figure 5: Colombia agricultural products market value forecast: $ billion, 2017–22..................................................... 13
Figure 6: Colombia agricultural products market volume forecast: million tonnes, 2017–22 ........................................ 14
Figure 7: Forces driving competition in the agricultural products market in Colombia, 2017 ........................................ 15
Figure 8: Drivers of buyer power in the agricultural products market in Colombia, 2017 ............................................. 16
Figure 9: Drivers of supplier power in the agricultural products market in Colombia, 2017 .......................................... 17
Figure 10: Factors influencing the likelihood of new entrants in the agricultural products market in Colombia, 2017 .. 18
Figure 11: Factors influencing the threat of substitutes in the agricultural products market in Colombia, 2017 ........... 20
Figure 12: Drivers of degree of rivalry in the agricultural products market in Colombia, 2017 ..................................... 21

Colombia - Agricultural Products 0078 - 2000 - 2017
© MARKETLINE THIS PROFILE IS A LICENSED PRODUCT AND IS NOT TO BE PHOTOCOPIED Page | 7
MARKET OVERVIEW
Market definition The agricultural products industry consists of the production of Cereals (such as wheat, rice, barley etc.), Nuts (almonds,
hazelnuts, pistachios etc.), Oilcrops (cottonseed, groundnuts, olives etc.), Spices & Stimulants (coffee, hops, dry chilies
etc.), Sugar (sugar cane, sugar beet etc.), Pulses (beans, peas, lentils etc.), Roots & Tubers (Potatoes, sweet potatoes,
cassava etc.), Vegetables (cabbages, tomatoes, onions etc.), and Fruit (bananas, citrus fruits, berries etc.)
All volumes are provided in tonnes and all values are calculated at producer prices.
All currency conversions use constant average 2017 exchange rates.
For the purposes of this report, the global market consists of North America, South America, Europe, Asia-Pacific, Middle
East, South Africa and Nigeria.
North America consists of Canada, Mexico, and the United States.
South America comprises Argentina, Brazil, Chile, Colombia, and Peru.
Europe comprises Austria, Belgium, the Czech Republic, Denmark, Finland, France, Germany, Greece, Ireland, Italy,
Netherlands, Norway, Poland, Portugal, Russia, Spain, Sweden, Switzerland, Turkey, and the United Kingdom.
Scandinavia comprises Denmark, Finland, Norway, and Sweden.
Asia-Pacific comprises Australia, China, Hong Kong, India, Indonesia, Kazakhstan, Japan, Malaysia, New Zealand,
Pakistan, Philippines, Singapore, South Korea, Taiwan, Thailand, and Vietnam.
Middle East comprises Egypt, Israel, Saudi Arabia, and United Arab Emirates.
Market analysis The Colombian agricultural products market has benefited from a diverse fruits segment, a strong export market and
increased global demand as other countries struggled due to adverse weather conditions which pushed up prices.
Though growth will slow over the next five years the market will remain strong.
Volume growth in the Colombian market was hindered by 52 years of conflict between the Colombian Government and
the Revolutionary Armed Forces of Colombia—People's Army, also known as FARC. However, with the peace accord
signed between the two factions in 2016, there are now opportunities for growth in market. The impact of the conflict
upon farming was substantial; many farms were destroyed during the fighting, whilst in more remote areas moving
produce became not only dangerous but also expensive. Now that has gone the market should be able to expand thanks
to improved trading and production conditions.
The Colombian agricultural products market had total revenues of $10.6bn in 2017, representing a compound annual
growth rate (CAGR) of 3.9% between 2013 and 2017. In comparison, the US market declined with a compound annual
rate of change (CARC) of -4%, and the Mexican market increased with a CAGR of 4%, over the same period, to reach
respective values of $174.8bn and $22.5bn in 2017.
Between 2014 and 2016 the market experienced strong growth in value. This is significant as damage from El Nino in
2015 was minimal, resulting in Colombia’s market benefiting from high demand while other countries in the region
struggled to supply, which pushed up prices. This continued into 2016 with 15.2% growth.
Market production volume increased with a CAGR of 5% between 2013 and 2017, to reach a total of 76.5 million tons in
2017. The market's volume is expected to rise to 84.1 million tons by the end of 2022, representing a CAGR of 1.9%
over 2017–2022.

Colombia - Agricultural Products 0078 - 2000 - 2017
© MARKETLINE THIS PROFILE IS A LICENSED PRODUCT AND IS NOT TO BE PHOTOCOPIED Page | 8
The fruit segment was the market's most lucrative in 2017, with total revenues of $4.7bn, equivalent to 44.2% of the
market's overall value. The oil crops segment contributed revenues of $1.9bn in 2017, equating to 17.8% of the market's
aggregate value.
Colombia benefits from a strong export market, especially in the fruit segment. A competitive advantage of the country in
this segment is the unique varieties of fruits cultivated. The fruit segment has been helped by a growth in banana
exports. Productivity improvements and a greater amount of land devoted to growing the fruit have helped the country to
take advantage of higher demand. Banana exports in 2017 totaled $850m, a rise of 4.6% on 2016 figures. However,
there has been some downward pressure on prices charged on exports because volumes rose slightly faster than value.
The performance of the market is forecast to decelerate, with an anticipated CAGR of 2.7% over 2017–2022, which is
expected to drive the market to a value of $12.1bn by the end of 2022. Comparatively, the US and Mexican markets will
grow with CAGRs of 2.9% and 3% respectively, over the same period, to reach respective values of $201.2bn and
$26.1bn in 2022.
The market should be buoyed by the US resuming the importing of Colombian oranges following a two year suspension.
The US Animal and Plant Health Inspection Service (APHIS) stopped shipments in 2015 on phytosanitary grounds. New
export protocols should prevent problems reoccurring, enabling growers to once again access one of the largest fruit
importing markets in the world.

Colombia - Agricultural Products 0078 - 2000 - 2017
© MARKETLINE THIS PROFILE IS A LICENSED PRODUCT AND IS NOT TO BE PHOTOCOPIED Page | 9
MARKET DATA
Market value The Colombian agricultural products market shrank by 0.7% in 2017 to reach a value of $10.6 billion.
The compound annual growth rate of the market in the period 2013–17 was 3.9%.
Table 1: Colombia agricultural products market value: $ billion, 2013–17
Year $ billion COP billion € billion % Growth
2013 9.1 26,798.9 8.1
2014 10.0 29,385.2 8.8 9.7%
2015 10.9 31,969.8 9.6 8.8%
2016 10.7 31,472.9 9.5 (1.6%)
2017 10.6 31,243.6 9.4 (0.7%)
CAGR: 2013–17 3.9%
SOURCE: MARKETLINE M A R K E T L I N E
Figure 1: Colombia agricultural products market value: $ billion, 2013–17
SOURCE: MARKETLINE M A R K E T L I N E

Colombia - Agricultural Products 0078 - 2000 - 2017
© MARKETLINE THIS PROFILE IS A LICENSED PRODUCT AND IS NOT TO BE PHOTOCOPIED Page | 10
Market volume The Colombian agricultural products market grew by 0.6% in 2017 to reach a volume of 76.5 million tonnes.
The compound annual growth rate of the market in the period 2013–17 was 5%.
Table 2: Colombia agricultural products market volume: million tonnes, 2013–17
Year million tonnes % Growth
2013 63.0
2014 67.4 7.0%
2015 68.8 2.0%
2016 76.0 10.6%
2017 76.5 0.6%
CAGR: 2013–17 5.0%
SOURCE: MARKETLINE M A R K E T L I N E
Figure 2: Colombia agricultural products market volume: million tonnes, 2013–17
SOURCE: MARKETLINE M A R K E T L I N E

Colombia - Agricultural Products 0078 - 2000 - 2017
© MARKETLINE THIS PROFILE IS A LICENSED PRODUCT AND IS NOT TO BE PHOTOCOPIED Page | 11
MARKET SEGMENTATION
Category segmentation Fruit is the largest segment of the agricultural products market in Colombia, accounting for 44.2% of the market's total
value.
The Oilcrops segment accounts for a further 17.8% of the market.
Table 3: Colombia agricultural products market category segmentation: $ billion, 2017
Category 2017 %
Fruit 4.7 44.2%
Oilcrops 1.9 17.8%
Cereals 1.6 14.8%
Roots & Tubers 1.2 10.8%
Sugar 0.7 6.3%
Vegetables 0.6 6.0%
Total 10.7 99.9%
SOURCE: MARKETLINE M A R K E T L I N E
Figure 3: Colombia agricultural products market category segmentation: % share, by value, 2017
SOURCE: MARKETLINE M A R K E T L I N E
Colombia - Agricultural Products 0078 - 2000 - 2017
© MARKETLINE THIS PROFILE IS A LICENSED PRODUCT AND IS NOT TO BE PHOTOCOPIED Page | 12
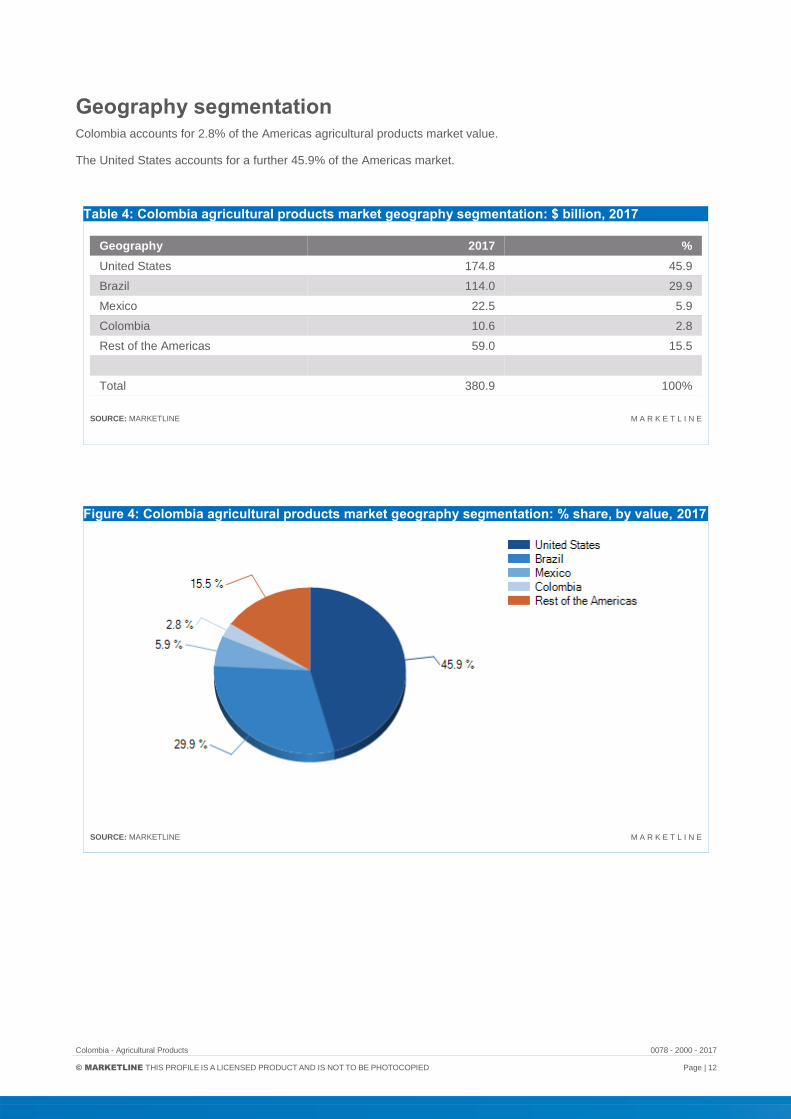
Geography segmentation Colombia accounts for 2.8% of the Americas agricultural products market value.
The United States accounts for a further 45.9% of the Americas market.
Table 4: Colombia agricultural products market geography segmentation: $ billion, 2017
Geography 2017 %
United States 174.8 45.9
Brazil 114.0 29.9
Mexico 22.5 5.9
Colombia 10.6 2.8
Rest of the Americas 59.0 15.5
Total 380.9 100%
SOURCE: MARKETLINE M A R K E T L I N E
Figure 4: Colombia agricultural products market geography segmentation: % share, by value, 2017
SOURCE: MARKETLINE M A R K E T L I N E

Colombia - Agricultural Products 0078 - 2000 - 2017
© MARKETLINE THIS PROFILE IS A LICENSED PRODUCT AND IS NOT TO BE PHOTOCOPIED Page | 13
MARKET OUTLOOK
Market value forecast In 2022, the Colombian agricultural products market is forecast to have a value of $12.1 billion, an increase of 14.2%
since 2017.
The compound annual growth rate of the market in the period 2017–22 is predicted to be 2.7%.
Table 5: Colombia agricultural products market value forecast: $ billion, 2017–22
Year $ billion COP billion € billion % Growth
2017 10.6 31,243.6 9.4 (0.7%)
2018 11.1 32,762.8 9.9 4.9%
2019 11.4 33,439.8 10.1 2.1%
2020 11.6 34,101.6 10.3 2.0%
2021 11.9 34,986.0 10.5 2.6%
2022 12.1 35,637.5 10.7 1.9%
CAGR: 2017–22 2.7%
SOURCE: MARKETLINE M A R K E T L I N E
Figure 5: Colombia agricultural products market value forecast: $ billion, 2017–22
SOURCE: MARKETLINE M A R K E T L I N E

Colombia - Agricultural Products 0078 - 2000 - 2017
© MARKETLINE THIS PROFILE IS A LICENSED PRODUCT AND IS NOT TO BE PHOTOCOPIED Page | 14
Market volume forecast In 2022, the Colombian agricultural products market is forecast to have a volume of 84.1 million tonnes, an increase of
9.9% since 2017.
The compound annual growth rate of the market in the period 2017–22 is predicted to be 1.9%.
Table 6: Colombia agricultural products market volume forecast: million tonnes, 2017–22
Year million tonnes % Growth
2017 76.5 0.6%
2018 78.8 3.0%
2019 80.3 2.0%
2020 81.0 0.9%
2021 82.6 1.9%
2022 84.1 1.8%
CAGR: 2017–22 1.9%
SOURCE: MARKETLINE M A R K E T L I N E
Figure 6: Colombia agricultural products market volume forecast: million tonnes, 2017–22
SOURCE: MARKETLINE M A R K E T L I N E

Colombia - Agricultural Products 0078 - 2000 - 2017
© MARKETLINE THIS PROFILE IS A LICENSED PRODUCT AND IS NOT TO BE PHOTOCOPIED Page | 15
FIVE FORCES ANALYSIS
The agricultural products market will be analyzed taking farming practices and producers as players. The key buyers will
be taken as grocery retailers and food processing companies, and fertilizer and machinery providers as the key
suppliers.
Summary
Figure 7: Forces driving competition in the agricultural products market in Colombia, 2017
SOURCE: MARKETLINE M A R K E T L I N E
In the Colombian agricultural products market, the overall rivalry is assessed as strong.
Buyer power in this market is assessed as strong. Supplier power is assessed as moderate. The threat of new entrants
is assessed as moderate and the threat of substitutes is assessed as weak.
Rivalry as well as buyer power is driven up by large numbers of undifferentiated players operating within this market.
Buyers are able to choose from a number of different agricultural producers, as a number of supermarkets control the
retail of agricultural products, market players compete for these valuable contracts. This further strengthens buyer power.
Inputs into this market from the supplier include undifferentiated products such as chemicals and fertilizer, with the
companies being larger than the farms they supply.
The threat from new entrants depends on a number of factors in the market; entry and operating costs when operating
on a large scale can be significant, operating on a single type of product or on a smaller scale. As buyer loyalty is low,
new entrants do present a reasonable threat within the market if they offer a beneficial product.
The only substitute in this market is homegrown produce; this is a legitimate possibility, however, this takes time, land
and expertise, along with significant amounts of work. The quality of this produce may also not be comparable to the
professionally produced goods.

Colombia - Agricultural Products 0078 - 2000 - 2017
© MARKETLINE THIS PROFILE IS A LICENSED PRODUCT AND IS NOT TO BE PHOTOCOPIED Page | 16
Buyer power
Figure 8: Drivers of buyer power in the agricultural products market in Colombia, 2017
SOURCE: MARKETLINE M A R K E T L I N E
Numerous buyers are present in the agricultural products market owing to the wide range of produce available. Some of
the major buyers of market ready produce, such as fruit and vegetables, include supermarkets such as Carrefour, Exito,
and Cencosud. The major buyers of products requiring processing, such as cereal grain, are wholesale dealers and food
processing companies.
Through bulk purchasing, large supermarket chains are able to negotiate low prices. Contractual arrangements between
market players and the large supermarkets they supply typically favor the interests of the latter; buyer power is enhanced
considerably by the resultant low switching costs. As buyers have a number of options to choose from for their produce,
this increases the buyer power as they can negotiate their prices. Buyers who can obtain the most produce for the lowest
price are able to produce greater profits.
A relatively low level of product differentiation also drives up buyer power, although producers might offer fair-trade,
organic, or locally sourced products in order to mitigate this effect to some extent. Buyer power is also limited somewhat
because the prices for many agricultural commodities are set on global exchanges. Here, producers can hedge in order
to cushion the impact of price fluctuations and therefore limit buyers' leverage over them in the face of downward price
pressure.
Forward integration may also be possible for farmers who sell fresh fruit and vegetables direct to consumers through a
farm-store outlet. In many markets, consumers are willing to pay higher prices for local and organic produce as it is seen
as more ethical and beneficial for the environment. As these practices currently operate on a small scale, however, they
are unlikely to have any significant effect on large buyers. The buyer is in essence dictating this market, as they have the
power to not purchase from specific players in the market. This in turn reduces their profits and financial power which
then means they are less able to purchase new equipment from the suppliers. If players grow produce which is not
deemed to be ‘customer worthy’, this will not be taken by the buyers and could cause the buyers to reconsider their
contracts with the supplier, thereby strengthening buyer power.
Overall, buyer power is assessed as strong.
Colombia - Agricultural Products 0078 - 2000 - 2017
© MARKETLINE THIS PROFILE IS A LICENSED PRODUCT AND IS NOT TO BE PHOTOCOPIED Page | 17
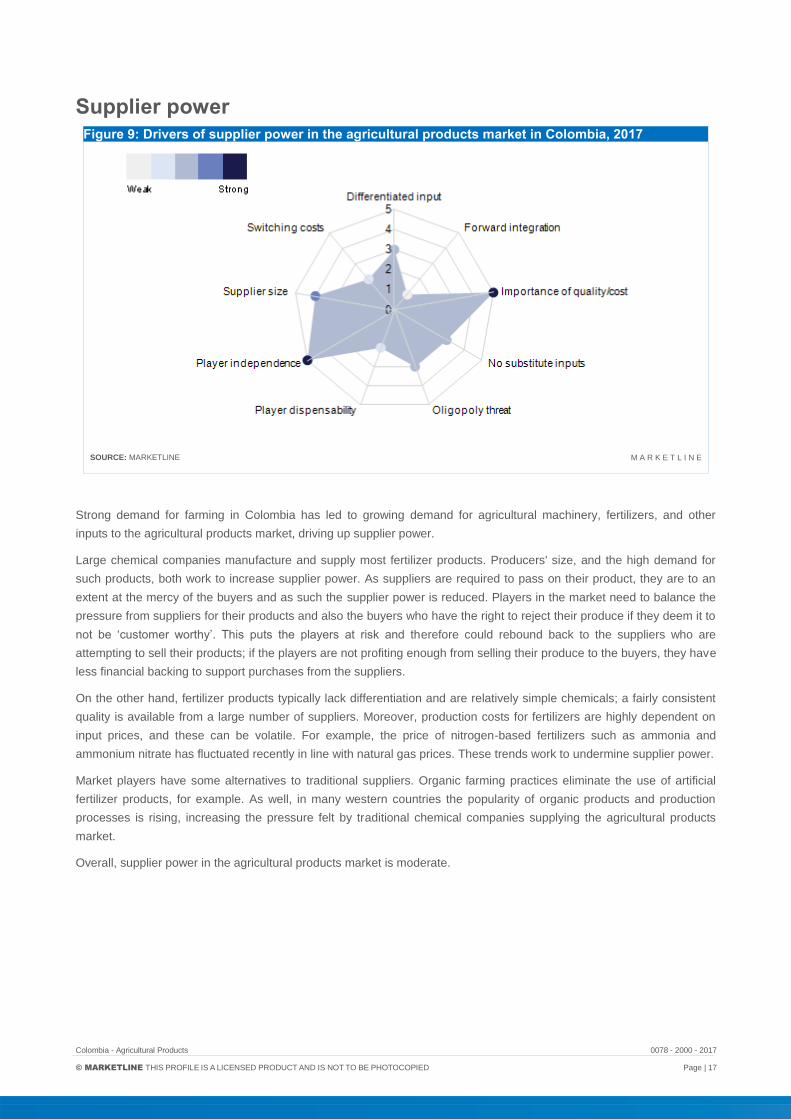
Supplier power
Figure 9: Drivers of supplier power in the agricultural products market in Colombia, 2017
SOURCE: MARKETLINE M A R K E T L I N E
Strong demand for farming in Colombia has led to growing demand for agricultural machinery, fertilizers, and other
inputs to the agricultural products market, driving up supplier power.
Large chemical companies manufacture and supply most fertilizer products. Producers' size, and the high demand for
such products, both work to increase supplier power. As suppliers are required to pass on their product, they are to an
extent at the mercy of the buyers and as such the supplier power is reduced. Players in the market need to balance the
pressure from suppliers for their products and also the buyers who have the right to reject their produce if they deem it to
not be ‘customer worthy’. This puts the players at risk and therefore could rebound back to the suppliers who are
attempting to sell their products; if the players are not profiting enough from selling their produce to the buyers, they have
less financial backing to support purchases from the suppliers.
On the other hand, fertilizer products typically lack differentiation and are relatively simple chemicals; a fairly consistent
quality is available from a large number of suppliers. Moreover, production costs for fertilizers are highly dependent on
input prices, and these can be volatile. For example, the price of nitrogen-based fertilizers such as ammonia and
ammonium nitrate has fluctuated recently in line with natural gas prices. These trends work to undermine supplier power.
Market players have some alternatives to traditional suppliers. Organic farming practices eliminate the use of artificial
fertilizer products, for example. As well, in many western countries the popularity of organic products and production
processes is rising, increasing the pressure felt by traditional chemical companies supplying the agricultural products
market.
Overall, supplier power in the agricultural products market is moderate.

Colombia - Agricultural Products 0078 - 2000 - 2017
© MARKETLINE THIS PROFILE IS A LICENSED PRODUCT AND IS NOT TO BE PHOTOCOPIED Page | 18
New entrants
Figure 10: Factors influencing the likelihood of new entrants in the agricultural products market in Colombia, 2017
SOURCE: MARKETLINE M A R K E T L I N E
The purchase of arable land, machinery and the provision of working capital to sustain initial operations are typically
needed to enter the agricultural products market.
High operating costs pose a significant entry barrier; large scale operations leverage economies of scale in order to
remain profitable, but due to the high cost of land and equipment, it is difficult for small scale farmers to develop into fully
fledged agribusinesses.
The entrance of players deemed suitably qualified is eased somewhat by the existence of loans, which can be obtained
due to the lucrative nature of the agricultural products market. The low level of differentiation between most agricultural
products means it is relatively easy for new entrants to get their product to market. Additionally, brand loyalty is low,
meaning market players are free to source products from an array of suppliers. New entrants might also choose to focus
on a particular product or crop in order to ease their move into the market. All this increases the likelihood of new
entrants.
In Colombia, the primary agricultural products are coffee, bananas, rice and tobacco. The legislation surrounding food
and agricultural products is controlled by the Ministry of Agriculture and Rural Development. While the GDP associated
with agriculture has been declining in recent years as other areas of business expand, agriculture still remains an
important source of revenue and employment. The latest figures indicate agriculture accounted for 7.4% of GDP when it
came to value added. Price bands have been implemented to help protect agriculture in respect to trade with foreign
countries. Therefore, when prices decrease, the tariffs associated with imports increase and vice versa. The impact of
international prices on agriculture is based on a supply and demand basis. If adverse weather prevents one country from
producing an agricultural resource, this permits other countries to increase their prices as the produce is more in
demand.
Colombia, as is the case in many other countries, has legislation specific to food and to agricultural produce, this could
deter new entrants into this market. It is also a strong possibility that new entrants will be deterred from entering this
market as legislation and financial requirements are potentially going to become stricter owing to the introduction of GM
crops. Since 2002, Colombia's government has passed many laws which allow GM corn and cotton from companies
such as Monsanto and Dupont to be grown for human consumption and fed to animals.

Colombia - Agricultural Products 0078 - 2000 - 2017
© MARKETLINE THIS PROFILE IS A LICENSED PRODUCT AND IS NOT TO BE PHOTOCOPIED Page | 19
Overall, the threat from new entrants is assessed to be moderate.

Colombia - Agricultural Products 0078 - 2000 - 2017
© MARKETLINE THIS PROFILE IS A LICENSED PRODUCT AND IS NOT TO BE PHOTOCOPIED Page | 20
Threat of substitutes
Figure 11: Factors influencing the threat of substitutes in the agricultural products market in Colombia, 2017
SOURCE: MARKETLINE M A R K E T L I N E
There are no truly threatening substitutes to agricultural producers' output. Produce such as fruit, vegetables, wheat,
sugar, potatoes and rice form a stable and important part of most people’s diets. As such, buyers can be confident that
consumer demand will remain strong.
That being said, on a small scale, some end users might choose to grow their own fruit and vegetables, and become
self-sufficient. This process is costly, has a high labor demand, and is also difficult to manage when inexperienced.
However, switching costs are high here. If individuals want to switch to self-sufficient farming, this is generally completed
on a much smaller scale, so the benefits from this in relation to the work input could be significantly lower than a large
scale process, allowing both self-sufficiency and also the selling of produce for a profit.
Subsistence level farming is time consuming, requires some degree of specialist knowledge, and brings with it the cost of
purchasing seeds, fertilizer, gardening products, and so on. Moreover, many people do not have the land required to
make this a viable option. The quantity and quality of the end product is not guaranteed.
Even those who make a success of this approach are unlikely to be able to grow all of the food they need; other crops
and products which depend on different environments or more complex or labor intensive production processes will still
have to be bought.
Overall, the threat from substitutes is weak in this market.
Colombia - Agricultural Products 0078 - 2000 - 2017
© MARKETLINE THIS PROFILE IS A LICENSED PRODUCT AND IS NOT TO BE PHOTOCOPIED Page | 21
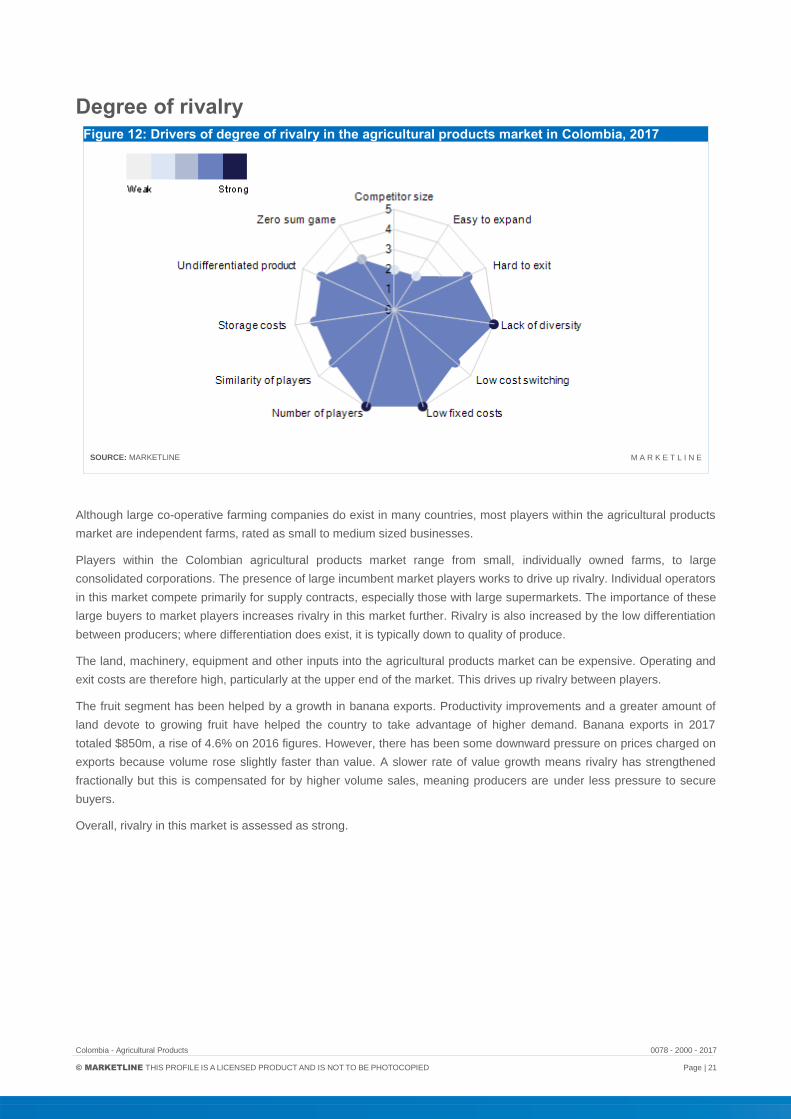
Degree of rivalry
Figure 12: Drivers of degree of rivalry in the agricultural products market in Colombia, 2017
SOURCE: MARKETLINE M A R K E T L I N E
Although large co-operative farming companies do exist in many countries, most players within the agricultural products
market are independent farms, rated as small to medium sized businesses.
Players within the Colombian agricultural products market range from small, individually owned farms, to large
consolidated corporations. The presence of large incumbent market players works to drive up rivalry. Individual operators
in this market compete primarily for supply contracts, especially those with large supermarkets. The importance of these
large buyers to market players increases rivalry in this market further. Rivalry is also increased by the low differentiation
between producers; where differentiation does exist, it is typically down to quality of produce.
The land, machinery, equipment and other inputs into the agricultural products market can be expensive. Operating and
exit costs are therefore high, particularly at the upper end of the market. This drives up rivalry between players.
The fruit segment has been helped by a growth in banana exports. Productivity improvements and a greater amount of
land devote to growing fruit have helped the country to take advantage of higher demand. Banana exports in 2017
totaled $850m, a rise of 4.6% on 2016 figures. However, there has been some downward pressure on prices charged on
exports because volume rose slightly faster than value. A slower rate of value growth means rivalry has strengthened
fractionally but this is compensated for by higher volume sales, meaning producers are under less pressure to secure
buyers.
Overall, rivalry in this market is assessed as strong.

Colombia - Agricultural Products 0078 - 2000 - 2017
© MARKETLINE THIS PROFILE IS A LICENSED PRODUCT AND IS NOT TO BE PHOTOCOPIED Page | 22
LEADING COMPANIES
Cia Envasadora Del Atlantico
Table 7: Cia Envasadora Del Atlantico: key facts
Head office: Zona Franca Bod 12 Mod 4, Barranquilla, COL
Telephone: 57 53448049
Fax: 57 53448269
Website: cea.net.co
SOURCE: COMPANY WEBSITE M A R K E T L I N E
Cia Envasadora Del Atlantico is a producer and marketer of fruit and vegetables in Colombia. The company’s roducts
include mango, passion fruit, pink guava, and tomato. The company also produces a range of frozen fruits and fruit
juices.
Found in 1982, the company’s products are now marketed in 37 countries around the world.
Key Metrics
As a private company, Cia Envasadora Del Atlantico does not publish its financial information.

Colombia - Agricultural Products 0078 - 2000 - 2017
© MARKETLINE THIS PROFILE IS A LICENSED PRODUCT AND IS NOT TO BE PHOTOCOPIED Page | 23
Dole Food Company Inc
Table 8: Dole Food Company Inc: key facts
Head office: PO Box 5700, Thousand Oaks, California, USA
Telephone: 1 800 356 3111
Website: www.dole.com
SOURCE: COMPANY WEBSITE M A R K E T L I N E
Dole Food Company, Inc. (Dole) grows, processes, distributes and markets fresh fruits and vegetables. The company
markets products to wholesale, retail and institutional customers in over 90 countries across the world.
The company’s products are classified into three categories: Fresh Vegetables, Fresh Fruits, and Salads
Under the Fresh Vegetables category, the company offers various fresh vegetables including potatoes, sweet potatoes,
onions, radish, lettuce, mushrooms, celery, cauliflower, broccoli, carrots, sprouts and asparagus, among others.
Under the Fresh Fruits category, the company offers berries, oatmeal, and other fruits. Its portfolio includes bananas
under the DOLE brand, as well as pineapples, and exports diversified fruits, such as grapes, citrus, apples, pears,
cherries, blueberries, stone fruits, and kiwifruit.
Under Salads, Dole offers chopped salads, salad blends, salad kits and slaw. It also offers chopped salad kits such as
chopped sunflower crunch, chopped sesame Asian salad kits, chopped chipotle and cheddar salad kit, chopped BBQ
ranch salad kit, and chopped summer garden blend kit, among others. Additionally, the company offers various salad
mixes including spring mix and baby spinach blend bag, spring mix and baby spinach blend clamshell. Its salad blends
are available in various varieties such as American blend, Arugula, chopped Romaine, classic Romaine, Mediterranean
blend, Italian blend, leafy Romaine.
The company also offers organic products including organic celery, organic bananas, organic baby spinach and arugula,
organic apple Dijon kit, organic baby spinach, organic kale mix, organic Caesar kit, organic super spinach and organic
pineapple. The company classified its geographical operations into four segments: North America, Latin America and
Caribbean, Europe, Africa, and the Middle East, and Asia.
Dole operates 11 packing and cold storage facilities in Chile. It also operates a fresh-cut salad plant and a small local
fruit distribution company in Chile including a value-added vegetable facility in Costa Rica. The company operates three
banana ripening distribution centers in Sweden, one in Germany, one in Austria and two in Italy including two salad and
vegetable plants in Helsingborg, Sweden and Helsinki, Finland. Through Dole Ocean Cargo Express, the company
provides service to commercial customers on Dole’s vessels. The company’s other unit Dole Plantation is one of Oahu’s
popular visitor attractions and attracts over one million visitors a year. The Dole Nutrition Institute (DNI) provides
scientifically-validated information on nutrition and health through the Dole Nutrition News, social media, and educational
materials. The Dole Nutrition Research Lab is located in Kannapolis, North Carolina, the US.
Key Metrics
As a private company, Dole Food is not required to publish its financial information.

Colombia - Agricultural Products 0078 - 2000 - 2017
© MARKETLINE THIS PROFILE IS A LICENSED PRODUCT AND IS NOT TO BE PHOTOCOPIED Page | 24
Grupo Manuelita
Table 9: Grupo Manuelita: key facts
Head office: Calle 6, 3 -13, Cali, COL
Telephone: 57 2 889 1444
Website: www.manuelita.com
SOURCE: COMPANY WEBSITE M A R K E T L I N E
Grupo Manuelita is a producer and marketer of sugar, molasses, and ethyl alcohol products. Other products include
ethanol, honey, bagasse, and industrial and superfine alcohol, biodiesel, farmed prawns and shrimps, and fruits and
vegetables.
The company was established in 1864 and is based in Cali, Colombia. Grupo Manuelita has a presence in four countries
across South America.
Key Metrics
As a private company, Grupo Manuelita does not disclose its financial information
Colombia - Agricultural Products 0078 - 2000 - 2017
© MARKETLINE THIS PROFILE IS A LICENSED PRODUCT AND IS NOT TO BE PHOTOCOPIED Page | 25
MACROECONOMIC INDICATORS
Country data
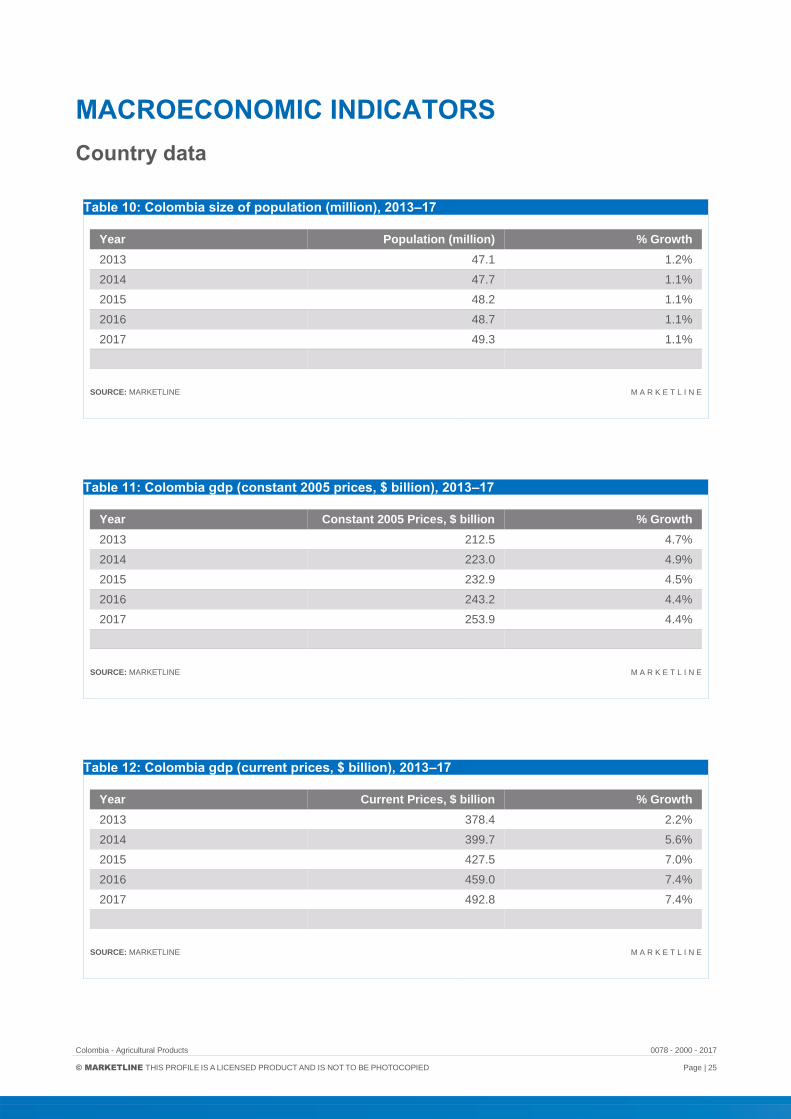
Table 10: Colombia size of population (million), 2013–17
Year Population (million) % Growth
2013 47.1 1.2%
2014 47.7 1.1%
2015 48.2 1.1%
2016 48.7 1.1%
2017 49.3 1.1%
SOURCE: MARKETLINE M A R K E T L I N E
Table 11: Colombia gdp (constant 2005 prices, $ billion), 2013–17
Year Constant 2005 Prices, $ billion % Growth
2013 212.5 4.7%
2014 223.0 4.9%
2015 232.9 4.5%
2016 243.2 4.4%
2017 253.9 4.4%
SOURCE: MARKETLINE M A R K E T L I N E
Table 12: Colombia gdp (current prices, $ billion), 2013–17
Year Current Prices, $ billion % Growth
2013 378.4 2.2%
2014 399.7 5.6%
2015 427.5 7.0%
2016 459.0 7.4%
2017 492.8 7.4%
SOURCE: MARKETLINE M A R K E T L I N E

Colombia - Agricultural Products 0078 - 2000 - 2017
© MARKETLINE THIS PROFILE IS A LICENSED PRODUCT AND IS NOT TO BE PHOTOCOPIED Page | 26
Table 13: Colombia inflation, 2013–17
Year Inflation Rate (%)
2013 2.0%
2014 2.9%
2015 3.2%
2016 3.2%
2017 3.3%
SOURCE: MARKETLINE M A R K E T L I N E
Table 14: Colombia consumer price index (absolute), 2013–17
Year Consumer Price Index (2005 = 100)
2013 136.6
2014 140.6
2015 145.0
2016 149.8
2017 154.7
SOURCE: MARKETLINE M A R K E T L I N E
Table 15: Colombia exchange rate, 2013–17
Year Exchange rate ($/COP) Exchange rate (€/COP)
2013 1,869.4100 2,483.8400
2014 1,997.8300 2,637.0800
2015 2,743.2600 3,043.6702
2016 3,053.1400 3,378.3200
2017 2,939.6956 3,324.6833
SOURCE: MARKETLINE M A R K E T L I N E

Colombia - Agricultural Products 0078 - 2000 - 2017
© MARKETLINE THIS PROFILE IS A LICENSED PRODUCT AND IS NOT TO BE PHOTOCOPIED Page | 27
METHODOLOGY
MarketLine Industry Profiles draw on extensive primary and secondary research, all aggregated, analyzed, cross-
checked and presented in a consistent and accessible style.
Review of in-house databases – Created using 250,000+ industry interviews and consumer surveys and supported by
analysis from industry experts using highly complex modeling & forecasting tools, MarketLine’s in-house databases
provide the foundation for all related industry profiles
Preparatory research – We also maintain extensive in-house databases of news, analyst commentary, company
profiles and macroeconomic & demographic information, which enable our researchers to build an accurate market
overview
Definitions – Market definitions are standardized to allow comparison from country to country. The parameters of each
definition are carefully reviewed at the start of the research process to ensure they match the requirements of both the
market and our clients
Extensive secondary research activities ensure we are always fully up-to-date with the latest industry events and
trends
MarketLine aggregates and analyzes a number of secondary information sources, including:
- National/Governmental statistics
- International data (official international sources)
- National and International trade associations
- Broker and analyst reports
- Company Annual Reports
- Business information libraries and databases
Modeling & forecasting tools – MarketLine has developed powerful tools that allow quantitative and qualitative data to
be combined with related macroeconomic and demographic drivers to create market models and forecasts, which can
then be refined according to specific competitive, regulatory and demand-related factors
Continuous quality control ensures that our processes and profiles remain focused, accurate and up-to-date

Colombia - Agricultural Products 0078 - 2000 - 2017
© MARKETLINE THIS PROFILE IS A LICENSED PRODUCT AND IS NOT TO BE PHOTOCOPIED Page | 28
Industry associations
International Federation of Agricultural Producers
60 rue Saint-Lazare, 75009 Paris, FRA
Tel.: 33 1 4526 0553
Fax: 33 1 4874 7212
www.ifap.org
International Food and Agribusiness Management Association IAMA Business Office 333 Blocker Building 2124 TAMU College Station, Texas 77843-2124, USA
Tel.: 1 979 845 2118
Fax: 1 979 862 1487
www.ifama.org
Related MarketLine research
Industry Profile
Agricultural Products in France
Agricultural Products in Europe
Global Agricultural Products
Agricultural Products in the United Kingdom
Agricultural Products in Italy

Colombia - Agricultural Products 0078 - 2000 - 2017
© MARKETLINE THIS PROFILE IS A LICENSED PRODUCT AND IS NOT TO BE PHOTOCOPIED Page | 29
APPENDIX
About MarketLine In an information-rich world, finding facts you can rely upon isn’t always easy. MarketLine is the solution.
We make it our job to sort through the data and deliver accurate, up-to-date information on companies, industries and
countries across the world. No other business information company comes close to matching our sheer breadth of
coverage.
And unlike many of our competitors, we cut the ‘data padding’ and present information in easy-to-digest formats, so you
can absorb key facts in minutes, not hours.
What we do
Profiling all major companies, industries and geographies, MarketLine is one of the most prolific publishers of business
information today.
Our dedicated research professionals aggregate, analyze, and cross-check facts in line with our strict research
methodology, ensuring a constant stream of new and accurate information is added to MarketLine every day.
With stringent checks and controls to capture and validate the accuracy of our data, you can be confident in MarketLine
to deliver quality data in an instant.
For further information about our products and services see more at: http://www.marketline.com/overview/
Disclaimer
All Rights Reserved.
No part of this publication may be reproduced, stored in a retrieval system or transmitted in any form by any means,
electronic, mechanical, photocopying, recording or otherwise, without the prior permission of the publisher, MarketLine.
The facts of this report are believed to be correct at the time of publication but cannot be guaranteed. Please note that
the findings, conclusions and recommendations that MarketLine delivers will be based on information gathered in good
faith from both primary and secondary sources, whose accuracy we are not always in a position to guarantee. As such
MarketLine can accept no liability whatever for actions taken based on any information that may subsequently prove to
be incorrect.

MarketLine | John Carpenter House, John Carpenter Street | London, United Kingdom, EC4Y 0AN T: +44(0)203 377 3042, F: +44 (0) 870 134 4371 E: [email protected]