India’s Export Competitiveness of Selected Agricultural Products
13
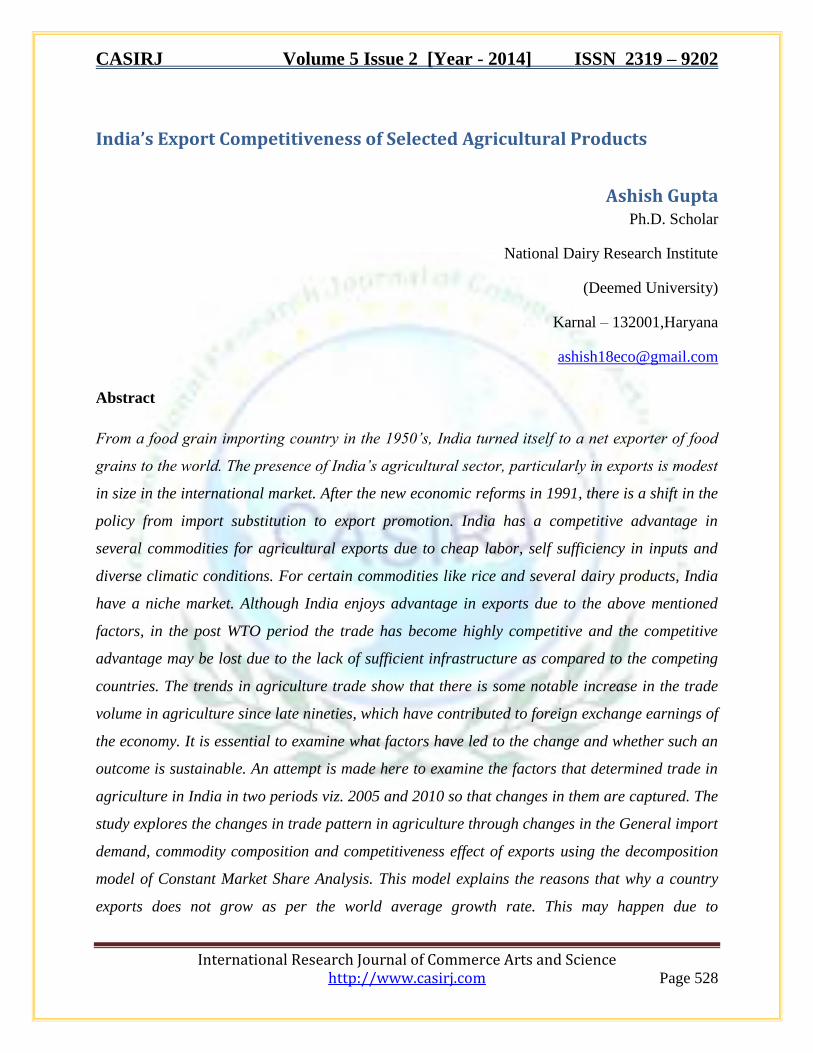
CASIRJ Volume 5 Issue 2 [Year - 2014] ISSN 2319 – 9202 International Research Journal of Commerce Arts and Science http://www.casirj.com Page 528 India’s Export Competitiveness of Selected Agricultural Products Ashish Gupta Ph.D. Scholar National Dairy Research Institute (Deemed University) Karnal – 132001,Haryana [email protected] Abstract From a food grain importing country in the 1950’s, India turned itself to a net exporter of food grains to the world. The presence of India’s agricultural sector, particularly in exports is modest in size in the international market. After the new economic reforms in 1991, there is a shift in the policy from import substitution to export promotion. India has a competitive advantage in several commodities for agricultural exports due to cheap labor, self sufficiency in inputs and diverse climatic conditions. For certain commodities like rice and several dairy products, India have a niche market. Although India enjoys advantage in exports due to the above mentioned factors, in the post WTO period the trade has become highly competitive and the competitive advantage may be lost due to the lack of sufficient infrastructure as compared to the competing countries. The trends in agriculture trade show that there is some notable increase in the trade volume in agriculture since late nineties, which have contributed to foreign exchange earnings of the economy. It is essential to examine what factors have led to the change and whether such an outcome is sustainable. An attempt is made here to examine the factors that determined trade in agriculture in India in two periods viz. 2005 and 2010 so that changes in them are captured. The study explores the changes in trade pattern in agriculture through changes in the General import demand, commodity composition and competitiveness effect of exports using the decomposition model of Constant Market Share Analysis. This model explains the reasons that why a country exports does not grow as per the world average growth rate. This may happen due to
-
Upload
independent -
Category
Documents
-
view
0 -
download
0
Transcript of India’s Export Competitiveness of Selected Agricultural Products
CASIRJ Volume 5 Issue 2 [Year - 2014] ISSN 2319 – 9202
International Research Journal of Commerce Arts and Science http://www.casirj.com Page 528
India’s Export Competitiveness of Selected Agricultural Products
Ashish Gupta Ph.D. Scholar
National Dairy Research Institute
(Deemed University)
Karnal – 132001,Haryana
Abstract
From a food grain importing country in the 1950’s, India turned itself to a net exporter of food
grains to the world. The presence of India’s agricultural sector, particularly in exports is modest
in size in the international market. After the new economic reforms in 1991, there is a shift in the
policy from import substitution to export promotion. India has a competitive advantage in
several commodities for agricultural exports due to cheap labor, self sufficiency in inputs and
diverse climatic conditions. For certain commodities like rice and several dairy products, India
have a niche market. Although India enjoys advantage in exports due to the above mentioned
factors, in the post WTO period the trade has become highly competitive and the competitive
advantage may be lost due to the lack of sufficient infrastructure as compared to the competing
countries. The trends in agriculture trade show that there is some notable increase in the trade
volume in agriculture since late nineties, which have contributed to foreign exchange earnings of
the economy. It is essential to examine what factors have led to the change and whether such an
outcome is sustainable. An attempt is made here to examine the factors that determined trade in
agriculture in India in two periods viz. 2005 and 2010 so that changes in them are captured. The
study explores the changes in trade pattern in agriculture through changes in the General import
demand, commodity composition and competitiveness effect of exports using the decomposition
model of Constant Market Share Analysis. This model explains the reasons that why a country
exports does not grow as per the world average growth rate. This may happen due to

CASIRJ Volume 5 Issue 2 [Year - 2014] ISSN 2319 – 9202
International Research Journal of Commerce Arts and Science http://www.casirj.com Page 529
concentration of exports in commodities for which demand is growing slowly, exports may be
going to relatively stagnant regions, or the lack of country’s competitiveness. The paper
disentangles these effects and explores the growth and performance of exports in the most
notable areas viz. cereals and dairy products. The study is based on the data from 2005 to 2010
of value of export (US $) as per 6 digit Harmonized System (HS) classification related to Indian
export of cereals and dairy products.
Keywords: Constant Share Market Analysis, Export.
JEL: F13, F15
Introduction:
Globalization is a process of unifying the diverse world economies under one umbrella to
facilitate freer trade, which aims overall growth and welfare. India too is part of globalization
and it enabled the country to face competition in the international market (NAAS report1,
2001a). The peculiarities associated with agricultural sector kept the policy makers away from
liberalizing agricultural sector equitable to that of other sectors. The amendments of EXIM
policy made during April 2001 gave importance to agricultural sector through creation of
Agricultural Export Zones wherein the state governments could identify product specific zones.
Import duties on capital goods to be used in agriculture were lowered and credit availability for
exports was increased. Income tax exemptions for profits from agricultural exports were
provided.
The EXIM Policy 2002-07, has given more importance to agriculture, especially for exports.
With sluggish growth in exports and rising imports, liberalization of agricultural exports was an
inevitable outcome. Export restrictions like registration and packaging requirements were
removed on butter, pulses, wheat and wheat products, groundnut oil, cashew and coarse grains.
As a result, the contribution of agriculture to the total trade of India and its importance to the
export earnings of the economy has increased over time. It is essential to examine what factors
have led to the change and whether such an outcome is sustainable. We make an attempt here to
examine the factors that determined trade in agriculture in India in two periods viz. 2005 and
2010 so that changes in them are captured. The changes in trade pattern in agriculture are
CASIRJ Volume 5 Issue 2 [Year - 2014] ISSN 2319 – 9202
International Research Journal of Commerce Arts and Science http://www.casirj.com Page 530
examined through changes in the General import demand, commodity composition and
competitiveness effect of exports.
Objective:
To study growth and competitiveness of cereals and dairy products export from India. The paper
also identifies the changes in trade pattern in agriculture in 2010 as against 2005 and causes for
such changes. The paper aims to scrutinize whether the export growth is due to rising demand,
diversification of product basket or due to competitiveness effect.
Methodology:
The study is based on the data from 2005 to 2010 of value of export (US $) as per 6 digit
Harmonized System (HS) classification related to Indian export of cereals and dairy products.
The data was collected from electronic data base of Commodity Trade Statistics (COMTRADE)
of United Nations. The methodology is divided into two stages. As it is not possible to bring all
products and countries into analysis , At the initial stage, , four countries for cereals and 3
countries for dairy products are selected for analysis based on the availability of data. These
countries are amongst the top 10 importers of the selected agricultural products.
At the second stage, the paper concentrates on the dynamics of export growth of selected
products in short listed countries. For this purpose Constant Market Share (CMS) model has
been picked up. CMS analysis is a popular tool for analyzing changes in exports of a country.
The model used in this paper has been inspired by the work done by Ichikawa (2003),
Richardson (1971), Fagerberg and Sollie (1987), etc. The constant market share analysis
compares the actual growth performance of a country with the performance that could have been
achieved if the country have maintained its exports relative to some standard. The intrinsic norm
of this analysis is a country's export share in a given market should remain unchanged over time.
However, in reality trade is dynamic and market share keeps on changing. The difference
between the actual export growth from a member country into a given market and the
unchanging export share implied by the ‘constant-market share norm’ is attributed to the
following three factors:

CASIRJ Volume 5 Issue 2 [Year - 2014] ISSN 2319 – 9202
International Research Journal of Commerce Arts and Science http://www.casirj.com Page 531
1. The effects of a general increase in demand for imports in the given market
2. Commodity composition, and
3. Changes in competitiveness
Keeping the market share constant, the model expresses the competitiveness term as negative or
positive to adjust the actual change in market share.
X(t) – X(0) = mX(0) + ∑{(mi – m) Xi(0)} + ∑{Xi(t) – Xi(0) – miXi(0)}........(1)
where
X: exports of country A to country B
Xi: commodity i exports of country A to country B
m: Percentage increase in country B's total imports from period 0 to period t
mi: Percentage increase in country B's imports of commodity i between period 0 to period t
and X=∑Xi
The right hand side can be divided into three components
(a) The general rise in country B's total imports
(b) The commodity composition of country A's exports to B in period 0, and
(c) An unexplained residual indicating the difference between country A’s actual exports
increase to country B and the hypothetical increase if country A maintained its share of exports
of each commodity group in country B.
Let us assume,
= country B's imports of commodity i in period t
= the change of Mi between period 0 and t
Mi(t)
Mi

CASIRJ Volume 5 Issue 2 [Year - 2014] ISSN 2319 – 9202
International Research Journal of Commerce Arts and Science http://www.casirj.com Page 532
In that case, for a particular commodity, the (c) part can be written through growth in B’s import
from A, or in other words,
)0(1)0()()0()0()(
Mi
MiXitXimiXiXitXi …………(2)
Dividing the above term by Mi(t), we get
……………(3)
= [A’s share of product i in B's market at time t] - [A’s share of product i in B's market at time 0]
Demand for imports in a given market (country B) from two competing sources of supply
(country A and the rest of the world) is described by the following relationship-
…………...(4)
where Pi = the export price of commodity i to country B
WXi = the rest of the world’s export of commodity i to country B
WPi = the export price of commodity i from the rest of the world to country B
The expression (4) can be altered by multiplying Pi/WPi
……………(5)
The expression (5) implies a relative demand function of export from A in B’s market in terms of
B’s import from the rest of the world.
Mi(t)Xi(t)- Xi(0)
Mi(0)
Xi(t) Xi(0) -
Mi(t) Mi(0)
Xi Pi=
WXi WPif
Pi Xi Pi Pi Pi= =
WPi WXi WPi WPi WPif g

CASIRJ Volume 5 Issue 2 [Year - 2014] ISSN 2319 – 9202
International Research Journal of Commerce Arts and Science http://www.casirj.com Page 533
In other words, it may be stated that for any product i, country A's share in country B will remain
constant except as varies.
So,
Now we shall consider the residual term (c) again. It may be expressed as-
=
= ………………..(6)
The expression (6) provides the overall effect of competitiveness measured through changes in
relative prices and thus the term (c) may be called the ‘competitive effect’. Through it is a
residual term we have identified the residual term as a function of relative price. Change in
competitiveness here is defined through the change in relative prices. If a country fails to
maintain its market share in a given market, the competitiveness term will be negative. This
indicates that the relative price increase for that country is greater than its competitors.
The tables described in the paper with respect to CMS model considers that the sum of these
three effects is always 100 and competitiveness reflected through residual is always adjusted
accordingly. This is due to the fact the model by force brings down the market share to a
constant level and measures the net change. It is important to note availability of detailed trade
data on a continuous basis for selected countries is the major limitation and hence to bring
symmetry among the countries, CMS has considered the data period of 2005 and 2010.
Pi
WPi
Xi(t) Xi(0) Pi(t) Pi(0)
Mi(t) Mi(0) WPi(t) WPi(0)g g
{Xi(t)- Xi(0)-miXi(0)}
Xi(t) Xi(0)Mi(t) -
Mi(t) Mi(0)
Pi(t) Pi(0)Mi(t)
WPi(t) WPi(0)g g

CASIRJ Volume 5 Issue 2 [Year - 2014] ISSN 2319 – 9202
International Research Journal of Commerce Arts and Science http://www.casirj.com Page 534
Factors affecting the Indian Exports:
Exports are considered to be Fuel for India’s growth. Post 1991, reforms in India have gathered
momentum with liberalization of the foreign investment norms, reduction in trade tariffs and
removal of the licensing policy.
One channel refers to demand-side factors, which can lead to a sudden turnaround in growth,
while the other channel refers to supply-side factors. If supply-side factors are not favorable; this
may prevent a quick revival of exports and may also act as an obstacle to maintaining high
growth for a long period.
The demand for products is price-sensitive and firms offering a lower relative price would be
able to sell more than their competitors. Therefore, it makes sense to examine the importance of
India’s external competitiveness .To measure lower relative price, it is necessary to look at price
and exchange rate (rupee appreciation benefits exporters) as compared to those of its
competitors. Since imports by India’s major trading partners are based on derived demand (that
is, as a function of their GDP), Thus, the growth in India’s exports can be partly explained by the
growth in imports by its trading partners.

CASIRJ Volume 5 Issue 2 [Year - 2014] ISSN 2319 – 9202
International Research Journal of Commerce Arts and Science http://www.casirj.com Page 535
The positive impact on exports has come mainly from reforms in the domestic economy and in
the external sector. Other factors, such as growth in world trade since 2003 and the change in the
composition of trade towards value items, have complemented growth in India’s exports.
Agricultural trade status
Beyond several constraints in production and marketing of agricultural commodities,
performance of Indian agricultural and allied sector is noteworthy in global context. India is the
largest producer of milk, cashew nuts, coconuts, tea, ginger, turmeric and black pepper. It is the
second largest producer of wheat, rice, sugar, groundnut and inland fish and third largest
producer of tobacco. India accounts for 10 per cent of the world fruit production and it is the
largest producer of banana and sapota. Though India’s share in world agricultural export and
imports has been increasing over the years, it is still a marginal player as it accounted 1.22 per
cent of world imports as well as 1.70 per cent of world exports in 2010-11.
The share of agricultural trade in agricultural GDP has been increased since 1990–91. During
recent times, India is facing challenges on the import side when the international prices go very
low, imports become cheaper, causing fall in domestic prices of agricultural commodities.
Further, in India post-harvest and sanitary infrastructure is poor and massive investment in this
area will be essential to ensure a level-playing field in external trade in agriculture (NAAS2,
2001b). Global competition also forces domestic businesses to innovate and improve the quality
of their products (Weidenbaum3, 2003).
In this paper we focus on the factors behind the export growth of cereals and dairy products. The
figure shows the trends of cereals and dairy exports over the period

CASIRJ Volume 5 Issue 2 [Year - 2014] ISSN 2319 – 9202
International Research Journal of Commerce Arts and Science http://www.casirj.com Page 536
Source: World Integrated Trades Solution , UN Comtrade
Source: World Integrated Trades Solution, UN Comtrade
239191
266
419
179238 223
0
100
200
300
400
500
2005 2006 2007 2008 2009 2010 2011
Exports of Dairy Products(in mn US $)
TradeValue (in mn US $)
19151589
2771
3912
2987 2924
5371
0
1000
2000
3000
4000
5000
6000
2005 2006 2007 2008 2009 2010 2011
Exports of Cereals(in mn US $)
TradeValue (in mn US $)

CASIRJ Volume 5 Issue 2 [Year - 2014] ISSN 2319 – 9202
International Research Journal of Commerce Arts and Science http://www.casirj.com Page 537
Trade competitiveness of agricultural commodities
India has a competitive advantage in several commodities for agricultural exports because of
near self-sufficiency of inputs, relatively low labour costs and diverse agro-climatic conditions.
These factors have enabled export of several agricultural commodities over the years such as
marine products, cereals, cashew, tea, coffee, spices, oil meals, fruits and vegetables, castor and
tobacco. For certain commodities like Basmati Rice, India have a niche market access in spite of
competition.
Trade competitiveness of commodities varies across space and time. It is largely influenced by
cost, output prices, production structure and quality. Export of agricultural commodities from
developing countries like India is posed to a risk; in terms of gap in quality and food safety
standards at the international markets. To bridge those gaps and improve competitiveness of
agricultural commodities at world markets, India has made several significant reforms at
institutional level. These reforms enhanced the access to international markets with Sanitary and
Phyto-sanitary (SPS) measures and Trade Related Intellectual Property Rights (TRIPS). Setting-
up of Agricultural and Processed Food Products Export Development Authority (APEDA) are
the other formal institutional reforms to enhance both domestic and international marketing.
Although India enjoys advantages in exporting some commodities, in the post-GATT period
international trade has become highly competitive and the competitive advantage of some of
these commodities would be lost due to the infrastructural advantage prevalent in the competing
countries.
Analysis of Export dynamics through CMS modeling:
Cereals Indonesia Saudi Arabia Malaysia Iran
General increase in imports 50.04 100.13 6.22 .35
Commodity composition -17.45 .963 3.16 .060
Increased competitiveness 67.04 -1.12 90.6 99.64
Note: HS code (6 digit)- 100110-100890, No. of commodities-16 , time period 2005-2010

CASIRJ Volume 5 Issue 2 [Year - 2014] ISSN 2319 – 9202
International Research Journal of Commerce Arts and Science http://www.casirj.com Page 538
Interpretation:
As the model is segregated into 3 components, it is the first component which explains the
general rise in exports. It assumes that whether the exports of India have risen at the same pace
as the world imports to a particular country. Second effect explains the diversification in
commodity composition, like in cereals according to HS code system there are more than 16
products at 6 digit level but India exports to Iran is only 2 products whereas Iran imports the
other products under cereals HS code from other countries. This is a commodity composition
effect. The residual is explained by the competitiveness effect.
In the case of cereals it has been noticed that Indian exports is increasing mainly due to
competitive effect. However, in some countries the general rise in imports also account for a
major factor of rise in exports of India. Overall, India is very strong in terms of competitive
effect. India needs to give attention in product diversification in these sectors to sustain the
competitive advantage. Despite lot of competition, India has positive competitive effect which is
partly associated with rise in overall demand in other countries.
DAIRY PRODUCTS USA Saudi Arabia Germany
General increase in imports 1.71 57.85 -81.66
Commodity composition 31.77 -21.50 34.69
Increased competitiveness 66.50 63.64 146.96
Note: HS code (6 digit) - 040110-041000, No. of commodities-27, time period 2005-2010
In the case of dairy products it has been noticed that Indian exports is increasing mainly due to
competitive effect. However, in Saudi arabia the general rise in imports also account for a major
factor of rise in exports of India. India commodity composition effect is significant in case of
United States of America.
Ways to Promote India’s Exports:
Improvement of infrastructure directly reduces the cost of Indian exports. It is hardly
surprising to see why the country’s services exports (which are less dependent on

CASIRJ Volume 5 Issue 2 [Year - 2014] ISSN 2319 – 9202
International Research Journal of Commerce Arts and Science http://www.casirj.com Page 539
infrastructure) are outperforming its other exports (which are more dependent on
infrastructure).
The irregular power supply hurts manufacturing activities. So this is a crucial area to
focus upon.
There is a need to increase operational efficiency in road and railway projects. National
highway development programs are hampered by time overruns and budgetary
constraints.
There is a need for more aggressive negotiations and policy dialogue among developing
nations, especially in the agricultural and services sectors in India. India could strengthen
its involvement in meaningful Regional Trade Agreements (RTAs*) to facilitate better
market access for its exports.
On the domestic front, there is a necessity for proper infrastructure and eliminate the
problems associated with burdensome government regulations and procedural
bottlenecks.
Conclusion:
The current paper analysis India’s Export Opportunity in Selected countries Africa for some
selected Products viz. Cereals and dairy products. Four countries have been selected for Cereals
and three countries have been selected for dairy products subject to the availability of data. In
case of cereals products, we have identified countries like Indonesia, Malaysia, Saudi Arabia and
Iran etc. can be considered for good opportunity in near future. Indian exports show less product
diversification. So far the growth is mainly driven by increase competitiveness. Hence, Indian
exporters must think of expanding their product profiles to have a long run stability in the export
growth.
In case of Dairy Products, India has enjoyed a export growth despite financial crisis of 2008.
Countries such as USA, Saudi Arabia, and Germany are selected for analysis. India’s export
basket lacks focus and it is very concentrated. Sanitary and phyto sanitary (SPS) measures are
the major bottlenecks which government may start having discussion with other countries.The
study provides the analysis that the export growth in selected sectors is not because of
competitiveness only. The growth itself pulls up the import demand and India is a beneficiary of

CASIRJ Volume 5 Issue 2 [Year - 2014] ISSN 2319 – 9202
International Research Journal of Commerce Arts and Science http://www.casirj.com Page 540
that. However, considering competition from China and other developing economies, India must
take focused approach in improving competitiveness considering both macro (trade issues) and
micro (firm specific) aspect at the one hand and diversify product basket on the other as exports
are currently concentrated only to limited number goods and thereby increases long run.
Bibliography
Data Catalogue: World Bank (http://databank.worldbank.org/ddp/home.do)
Data Catalogue: United Nations , Commodity trade statistics ( Comtrade) . World Integrated Trades Solution
ESCAP (2004), “Meeting the Challenges in an Era of Globalization by Strengthening Regional development Cooperation” http://www.unescap.org/pdd/publications/regcoop/index.asp
Fagerberg J and Sollie G, “The method of constant market share analysis, reconsidered”, Applied Economics, Vol. 19, pp1571-1583.
Fredoun Z. Ahmadi-Esafahani, “Constant Market Shares Analysis: Uses, Limitations and Prospects, Australian Journal of Agricultural and Resource Economics pp 510-526
Ichikawa H (2003): Constant Market Share and Open Regionalism available in www.ide.go.jp/English/Publish/Apec/pdf/96et_03.pdf
Kainth G S, (1996), India’s Agricultural Exports: Status and Strategies, in Kainth G S (Ed.) (1996) Export Potential of Indian Agriculture, Regency Publications, N Delhi, India, p-10.
Mallon G & Whalley J, (2004), “China’s Post Accession WTO Stance”, NBER Working Paper,10649.Report of the India China Joint Study Group on Comprehensive Trade and Economic Cooperation
Merkies, A.H.Q.M., and van der Meer, T.: A Theoretical Foundation for Constant Market Share Analysis, Empec, Vol. 13, 1988, p 66.
NAAS Report (2001a) on the national workshop of „Globalization of Agriculture: Research and Development in India‟, organized by the National Academy of Agricultural Sciences (NAAS) at the Kerala Agricultural University Main Campus, Trichur, during 2–3 February 2001 published in Current Science, Vol. 80, No. 12, 25 June 2001a.
NAAS (2001b) Globalization of Agriculture: R & D in India,Policypaper-10 available at http://www.naasindia.org/Policy%20Papers/pp10.pdf as on 31.07.2009
Richardson D (1971), “Constant Market Share Analysis of export growth”, Journal of International Economics, 1, pp 227-239
Thomas S and Sheikh W, “India’s export of Cereals and Cereals Preparations- a constant market Share Analysis”, Abhinav – National Monthly Referred Journal of Research in Commerce and Management. Vol. 1, Issue no. 6. ISSN 2277-1166.
Weidenbaum, M. (2003) Weighing the Pros and Cons of Globalization,available at http://www.wilsoncenter.org/topics/pubs/Weidenbaum.pdf as on 31.07.2009