Unsung Opportunities: Export Growth for Agricultural Products ...
37
Unsung Opportunities: Export Growth for Agricultural Products of Wisconsin Prepared for International AgriBusiness Center (IABC) of the Wisconsin Department of Agriculture, Trade and Consumer Protection By Tamanna Akram William Doty Eric Trey Mueller Logan Pearlman Workshop in Public Affairs Spring 2021
-
Upload
khangminh22 -
Category
Documents
-
view
3 -
download
0
Transcript of Unsung Opportunities: Export Growth for Agricultural Products ...

Unsung Opportunities: Export Growth for Agricultural Products of Wisconsin
Prepared for
International AgriBusiness Center (IABC) of the Wisconsin Department
of Agriculture, Trade and Consumer Protection
By
Tamanna Akram William Doty
Eric Trey Mueller Logan Pearlman
Workshop in Public Affairs Spring 2021

II
©2021 Board of Regents of the University of Wisconsin System. All rights reserved.
For an online copy, see www.lafollette.wisc.edu/research-public-service/workshops-in-
public-affairs
The Robert M. La Follette School of Public Affairs is a teaching and research department of the University of Wisconsin–Madison. The school takes no stand on
policy issues; opinions expressed in these pages reflect the views of the authors.
The University of Wisconsin–Madison is an equal opportunity and affirmative-action educator and employer. We promote excellence through diversity in all programs.

III
Table of Contents FOREWORD ............................................................................................................................................................................ V
ACKNOWLEDGEMENTS ...................................................................................................................................................... VI
ABBREVIATIONS ................................................................................................................................................................ VII
EXECUTIVE SUMMARY ......................................................................................................................................................... 1
RECOMMENDATION 1: RESEARCH OPPORTUNITY MARKETS AND PRODUCTS ..................................................................................... 1 RECOMMENDATION 2: REFINE TOOL ATTRIBUTES AND WEIGHTS ........................................................................................................ 2 RECOMMENDATION 3: USE TOOL FOR ADDITIONAL COUNTRIES ........................................................................................................... 2 RECOMMENDATION 4: ALLOCATE RESOURCES TO OUTREACH ............................................................................................................... 2 RECOMMENDATION 5: ANALYZE THE IMPACT OF POLICY ....................................................................................................................... 2
INTRODUCTION ..................................................................................................................................................................... 3
WISCONSIN DEPARTMENT OF AGRICULTURE, TRADE AND CONSUMER PROTECTION ........................................................................ 3 International AgriBusiness Center ...................................................................................................................................................... 3
WISCONSIN AGRICULTURAL EXPORTS ......................................................................................................................................................... 3
METHODS ................................................................................................................................................................................. 4
SCOPE ................................................................................................................................................................................................................ 4 COUNTRY SELECTION ..................................................................................................................................................................................... 5
Current Consumption ................................................................................................................................................................................ 6 Growth Potential ......................................................................................................................................................................................... 6 Ease of Doing Business and Risk .......................................................................................................................................................... 7
PRODUCT SELECTION ..................................................................................................................................................................................... 9
OPPORTUNITY MATRIX OVERVIEW ................................................................................................................................ 9
AUSTRALIA ..................................................................................................................................................................................................... 11 INDONESIA ...................................................................................................................................................................................................... 12 FRANCE ........................................................................................................................................................................................................... 12 THAILAND ....................................................................................................................................................................................................... 13 SPAIN ............................................................................................................................................................................................................... 13 BRAZIL ............................................................................................................................................................................................................ 13
PRODUCT OVERVIEW ........................................................................................................................................................ 14
HIGH RATINGS AND LOW EXPORTS: UNTAPPED POTENTIAL ................................................................................................................ 14 HIGH RATINGS AND HIGH EXPORTS: PRACTICAL POTENTIAL ............................................................................................................... 15
DISCUSSION .......................................................................................................................................................................... 16
RECOMMENDATIONS ........................................................................................................................................................ 17
EXPORT STRATEGIES .................................................................................................................................................................................... 17 METHODOLOGY CHANGES ............................................................................................................................................................................ 17 POTENTIAL OPPORTUNITIES ....................................................................................................................................................................... 18
CONCLUSION ........................................................................................................................................................................ 18
APPENDIX A ......................................................................................................................................................................... 20
WISCONSIN DATCP HARMONIZED SYSTEM CODES ............................................................................................................................... 20

IV
APPENDIX B ......................................................................................................................................................................... 21
WISCONSIN 10-YEAR AVERAGED EXPORT DOLLARS BY 4-DIGIT HS CODES ..................................................................................... 21 Chapter 12: Oil Seeds/Misc. Grains/Med. Plants/Straw .......................................................................................................... 21 Chapter 04: Dairy, Eggs, Honey, & Ed. Products ......................................................................................................................... 21 Chapter 21: Misc. Edible Preparations ............................................................................................................................................ 22 Chapter 44: Wood & Articles of Wood, Wood Charcoal ........................................................................................................... 23 Chapter 23: Residues from Food Industries, Animal Feed ...................................................................................................... 23 Chapter 3302: Albumins and albumin derivatives..................................................................................................................... 24 Chapter 08: Ed. Fruits & Nuts, Peel of Citrus/Melons ............................................................................................................... 24 Chapter 20: Preps. of Vegetables, Fruits, Nuts, Etc. ................................................................................................................... 24 Chapter 15: Animal or Vegetable Fats, Oils, & Waxes .............................................................................................................. 25 Chapter 10: Cereals .................................................................................................................................................................................. 25 Chapter 22: Beverages, Spirits, and Vinegar ................................................................................................................................ 25 Chapter 03: Fish & Crustaceans .......................................................................................................................................................... 26 Chapter 05: Products of Animal Origin ........................................................................................................................................... 26 Chapter 17: Sugar & Sugar Confectionery ..................................................................................................................................... 26
APPENDIX C .......................................................................................................................................................................... 27
COUNTRY OVERVIEW TABLES ..................................................................................................................................................................... 27
REFERENCES ........................................................................................................................................................................ 29
V
Foreword This report is the result of collaboration between the La Follette School of Public Affairs at the University of Wisconsin–Madison and the Wisconsin Department of Agriculture, Trade and Consumer Protection (DATCP). The objective of this project is to provide La Follette School graduate students the opportunity to improve their policy analysis skills while contributing to the capacity of partner organizations. The La Follette School provides students with a rigorous two-year graduate program leading to a Master of Public Affairs (MPA) degree. Students learn about policy analysis and public management, and they may choose to pursue concentrated study in a policy area. The authors of this report are all in the final semester of their degree program and are enrolled in the Public Affairs 869: Workshop in Public Affairs at the University of Wisconsin–Madison. Although studying policy analysis is important, there is no substitute for actively engaging in applied policy analysis as a means of developing students’ skills. The Workshop gives graduate students that opportunity. I am grateful to the Wisconsin DATCP for partnering with the La Follette School on this project. Wisconsin DATCP staff members have been generous with their time to support the students’ work. The students have collectively contributed hundreds of hours to the project, and in the process they developed critical insights about opportunities for the growth of Wisconsin’s agricultural exports. The La Follette School is grateful for this collaborative effort and hopes the report proves valuable. J. Michael Collins
Professor of Public Affairs Madison, Wisconsin
VI
Acknowledgements We would like to thank the International AgriBusiness Center (IABC), Wisconsin Department of Agriculture, Trade and Consumer Protection for initiating the project, as well as Ashwini Rao, Lisa Stout, Jennifer Lu, and Mark Rhoda-Reis for sharing their knowledge and support. Thank you to Dr. Tessa Conroy and Dr. Steven Dellar from the Department of Agriculture and Applied Economics at the University of Wisconsin–Madison for their time spent discussing our project and data sources. We also extend our gratitude to Professor J. Michael Collins for providing insightful guidance and resources throughout the project. Our appreciation also goes to Bonnie MacRitchie for being our client liaison at the initial stages of the project and Seth Umbaugh and Lisa Hildebrand for their guidance in the editing process. Finally, we would like to express our unqualified appreciation for the students, faculty, and staff of the La Follette School of Public Affairs. The views, opinions, and recommendations in this report represent those of the authors alone and do not reflect findings, recommendations, or policies of the University of Wisconsin–Madison, the La Follette School, or the Wisconsin Department of Agriculture, Trade and Consumer Protection.
VII
Abbreviations CPI Corruption Perception Index EDB Ease of Doing Business Ranking FDI Foreign Direct Investment FSI Fragile States Index FTA Free Trade Agreement GDP Gross Domestic Product HS Codes Harmonized System Codes IABC International AgriBusiness Center IMF International Monetary Fund ITA United States International Trade Administration NESOI Not Elsewhere Specified or Included NTM Nontariff Measure USDA United States Department of Agriculture DATCP Wisconsin Department of Agriculture, Trade and Consumer Protection WISERTrade World Institute for Strategic Economic Research on Trade WTO World Trade Organization

1
Executive Summary Wisconsin exported more than $3 billion in diversified agricultural and food products from wholesale grains, lumber, bratwursts, and other prepared food in 2020 to more than 150 different countries. But it has the potential for growth. It is difficult for producers to tell which products are the most appropriate to export and for which country. Identifying potential export destinations for Wisconsin’s diverse food, forestry, and agricultural products requires discovery research and analysis of three classes of key country and product attributes: current consumption, growth potential, ease of doing business and risk. Ease of doing business and risk is considered one class of attributes because they measure similar things. The Wisconsin Department of Agriculture, Trade and Consumer Protection (DATCP) has a mission to promote the agricultural export growth on behalf of the state. This report identifies markets that have exciting potential for growth. DATCP already has an excellent rapport with Wisconsin’s top trading partners, and this report seeks to include more countries across an array of agricultural products. The information we present will be useful for strategic planning and funding decisions for relevant markets, including trade shows, subsidies to producers, and investment in other resources to promote agricultural growth. It will also inform the proposal for the next biennial budget for United States Department of Agriculture (USDA), as well as the state of Wisconsin and internal DATCP budget. These findings also inform trade agreements being pursued by the USDA on behalf of the state, and they will prepare DATCP leadership to influence trade policy at both the state and federal level. This report aims to explore Wisconsin’s diverse export products to understand and project opportunities for agriculture and value-added products. These products include, but are not limited to, sausage, dairy, and other prepared food, as well as simple products like corn, soybeans, and beef. We will identify six “unsung” opportunity markets and five products each for DATCP to consider for further research and for contemplation among the exporter services it provides to Wisconsin producers.
Recommendation 1: Research Opportunity Markets and Products Using the Market Selection Tool to assign scores, we selected six countries as optimal opportunities for further research. Listed in descending order (by average total rating) these markets are: Australia (80), Indonesia (79), France (66), Thailand (64), Spain (64), and Brazil (55). The quantitative and qualitative analysis for determining agricultural product opportunities for each of the six countries is summarized in a table referred to as the Country-Product Rank Matrix.

2
Country-Product Rank Matrix (Country, by HS product category ranking)
Country Product AUSTRALIA INDONESIA FRANCE THAILAND SPAIN BRAZIL
1st
21: Miscellaneous
Edible Preparations
(82)
12: Miscellaneous
Seeds (81)
12: Miscellaneous
Seeds (69)
12: Miscellaneous
Seeds (68)
08: Edible Fruit/Nuts (67)
21: Miscellaneous
Edible Preparations
(57)
2nd 22: Spirits (81) 04:
Dairy/Honey (80)
21; Miscellaneous
Edible Preparations
(67)
23: Food Residues/
Animal Feeds (68)
44: Wood (65) 15: Oils/Fats (56)
3rd 20: Prepared Vegetables
(80)
21: Miscellaneous
Edible Preparations
(79)
23: Food Residues/
Animal Feeds (66)
04: Dairy/Honey (65)
15: Oils/Fats (65)
22: Spirits (54)
4th
23: Food Residues/
Animal Feeds (79)
17: Sugar/Candy
(78)
3302: Materials for Beverages
(66)
03 Fish/Crustacean
(64) 10: Cereals (62) 05: Animal
Products (54)
5th 44: Wood (79)
3302: Materials for Beverages
(77)
04: Dairy/Honey
(65)
21: Miscellaneous
Edible Preparations
(61)
03: Fish/Crustacean
(61)
10: Cereals (54)
Source: Market Selection Tool, WISERTrade data. Note: darker shades indicate higher frequency in top five products. For example, HS code 21 appears in the top five products most often at five occurrences.
Recommendation 2: Refine Tool Attributes and Weights DATCP can deepen the discovery research by adding or refining key attributes and weights, using statistics to find significant correlations between variables and Wisconsin exports. Variables to explore include domestic market size and its similarity to destination markets, proximity to other opportunity markets and existing trade routes, market volatility, and trade vulnerability.
Recommendation 3: Use Tool for Additional Countries DATCP can broaden the discovery research by using the Market Selection Tool to analyze all attributes for additional countries.
Recommendation 4: Allocate Resources to Outreach DATCP can allocate additional resources to proactively engage and support Wisconsin producers that have export opportunity potential.
Recommendation 5: Analyze the Impact of Policy Identify variables that relate the food policy environment in Wisconsin to the state’s ability to export. For example, safety standards or farm incentives aligning with global trends.

3
Introduction This report identifies which of Wisconsin’s 151 trading partners and diverse agricultural products represent the strongest growth opportunities in the next three to five years based on several criteria. The first section of the report provides background on the Wisconsin Department of Agriculture, Trade and Consumer Protection (DATCP) and the need for this research. The second section explains the data and methodologies used. These analyses provide the foundation for identifying export destinations and products that DATCP should promote in its work. The report concludes with a discussion of the limitations of this research as well as recommendations for DATCP, local businesses, and Wisconsin policymakers.
Wisconsin Department of Agriculture, Trade and Consumer Protection DATCP is a governmental agency responsible for the regulation of agriculture, trade, and commercial activity in the state. DATCP’s mission is to “partner with all the citizens of Wisconsin to grow the economy by promoting quality food, healthy plants and animals, sound use of land and water resources, and a fair marketplace.” It states that its vision is to “… deliver efficient and effective programs and services to Wisconsin agriculture, consumers, and businesses, to provide market confidence and to enhance competitiveness and profitability” (WI DATCP n.d.).
International AgriBusiness Center Among its many programs, DATCP identifies global export opportunities for agricultural companies and producers in Wisconsin. The International AgriBusiness Center (IABC) hosts economic development consultants to increase exports through market development initiatives and trade enhancing partnerships. The IABC also offers services to beginner, intermediate, and advanced exporters, including one-on-one consultations, educational seminars, export documentation, market research, financing, promotions, and market development programs (“Our Services,” n.d.). This report is aimed to help the IABC make more export-related decisions and capitalize on new markets in conjunction with resources from DATCP. Additionally, the research will support also budgetary decisions to invest toward the preliminary stages of new trade relations.
Wisconsin Agricultural Exports Wisconsin ranks 13th among all U.S. states for the value of agricultural exports, totaling more than $3.3 billion in 2019 to 151 countries. Canada, Mexico, and China are among Wisconsin’s top agricultural export markets. In 2019, the state’s most valuable agricultural exports were vegetables, fruits, and nuts. Wisconsin also is a leader in the export of bovine semen, ginseng roots, raw fur skins, prepared/preserved cranberries, and sweet corn (“Wisconsin Agricultural Statistics” 2021). Wisconsin produces a lot of dairy, but most is consumed domestically and not exported. The research for this report took place during the COVID-19 pandemic. The report, however, does not specifically conduct an impact assessment of the short-term and long-term effects of the pandemic on Wisconsin’s agricultural exports. Additionally, due to the nature of trade accounting, data from only the first two quarters of 2020 are available. This means that COVID-19 had a minimal impact on this report,
4
but continued use of the Market Selection Tool or other methods mentioned here by DATCP will contain data that includes any effect of the pandemic.
Methods
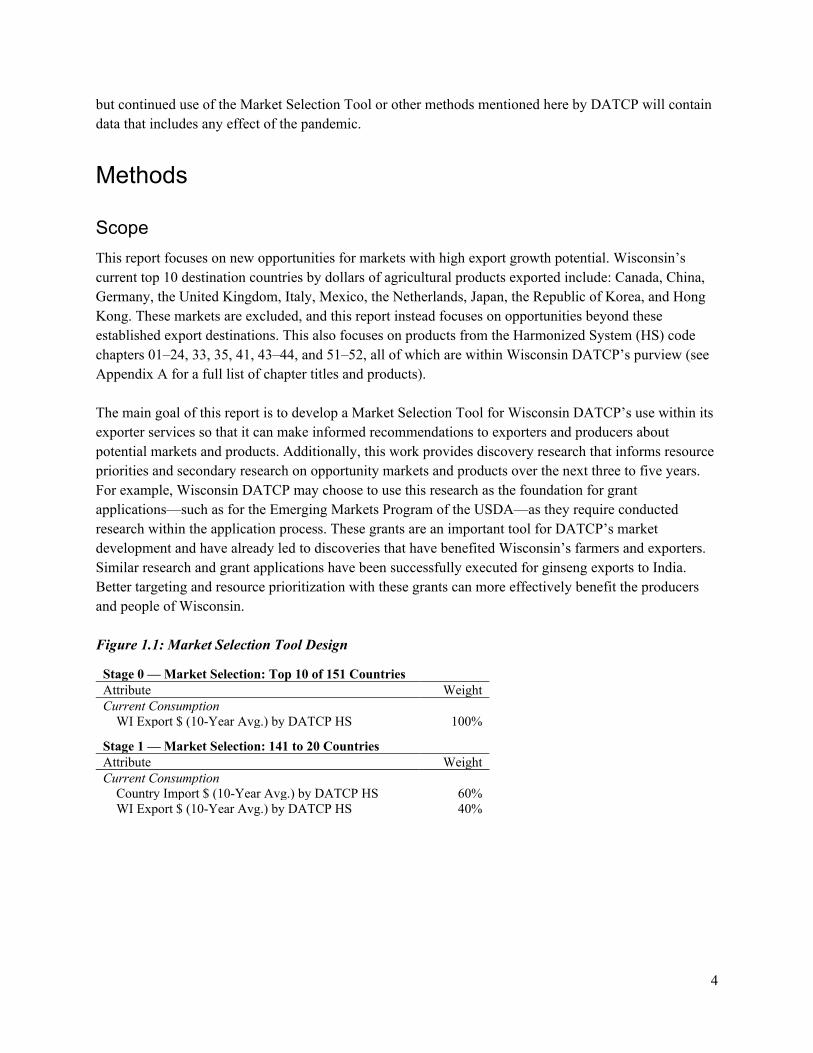
Scope This report focuses on new opportunities for markets with high export growth potential. Wisconsin’s current top 10 destination countries by dollars of agricultural products exported include: Canada, China, Germany, the United Kingdom, Italy, Mexico, the Netherlands, Japan, the Republic of Korea, and Hong Kong. These markets are excluded, and this report instead focuses on opportunities beyond these established export destinations. This also focuses on products from the Harmonized System (HS) code chapters 01–24, 33, 35, 41, 43–44, and 51–52, all of which are within Wisconsin DATCP’s purview (see Appendix A for a full list of chapter titles and products). The main goal of this report is to develop a Market Selection Tool for Wisconsin DATCP’s use within its exporter services so that it can make informed recommendations to exporters and producers about potential markets and products. Additionally, this work provides discovery research that informs resource priorities and secondary research on opportunity markets and products over the next three to five years. For example, Wisconsin DATCP may choose to use this research as the foundation for grant applications—such as for the Emerging Markets Program of the USDA—as they require conducted research within the application process. These grants are an important tool for DATCP’s market development and have already led to discoveries that have benefited Wisconsin’s farmers and exporters. Similar research and grant applications have been successfully executed for ginseng exports to India. Better targeting and resource prioritization with these grants can more effectively benefit the producers and people of Wisconsin. Figure 1.1: Market Selection Tool Design
Stage 0 — Market Selection: Top 10 of 151 Countries Attribute Weight Current Consumption
WI Export $ (10-Year Avg.) by DATCP HS 100%
Stage 1 — Market Selection: 141 to 20 Countries Attribute Weight Current Consumption
Country Import $ (10-Year Avg.) by DATCP HS 60% WI Export $ (10-Year Avg.) by DATCP HS 40%

5
Figure 2.2: Market Selection Tool Design
Stage 2 — Market Selection: 20 to 6 Countries Attribute Weight Current Consumption
Country Import $ (10-Year Avg.) by DATCP HS 30% WI Export $ (10-Year Avg.) by DATCP HS 20%
Growth Potential Population under 55 yo. 10% Pop. Growth Next 3-5y 10% GDP Growth (Avg. Past 5y & Next 5y) 10%
Business Ease, Risk U.S. FTA Status 5% Ease of Doing Business Index 5% Corruption Perception Index 5% Fragile States Index 5%
Stage 3 — Product Selection: 5 Products Per Country Attribute Weight Current Consumption
Country Import $ (10-Year Avg.) by 2-digit HS 25% WI Export $ (10-Year Avg.) by 2-digit HS 15% US Export $ (10-Year Avg.) by 2-digit HS 10%
Growth Potential Population under 55 yo. 10% Pop. Growth Next 3-5y 10% GDP Growth (Avg Past 5y & Next 5y) 10%
Business Ease, Risk U.S. FTA Status 5% Ease of Doing Business Index 5% Corruption Perception Index 5% Fragile States Index 5%
Source: DATCP, 2021. Notes: “by DATCP HS” denotes the aggregate of all two-digit HS codes used by DATCP. “By 2-digit HS” denotes the value for each two-digit HS code used by DATCP.
Country Selection DATCP provided the general framework for a quantitative analysis on Wisconsin’s trading partners. This was based on attributes that DATCP staff believed would show insights into Wisconsin’s current trading relationships and future growth potential. These attributes, and the weights DATCP provided, were approximal but logically modeled the most important aspects of a trading model. Each nation was given a score based on its ranking across these categories to determine if a country constituted an unsung opportunity market. We applied the attributes in sequence to reduce our country markets. In the preliminary pass, we used current consumption to exclude Wisconsin’s current top 10 trading partners: Canada, China, Germany, the United Kingdom, Italy, Mexico, the Netherlands, Japan, South Korea, and Hong Kong. For the first pass, we used current consumption metrics to slim down the list of 141 remaining current trading partners to 20. Current consumption accounted for 50 percent of the weight to score countries. We then performed a deeper analysis on the 20 remaining countries, assigning the remaining 50 percent of the weight across metrics projecting market growth, ease of doing business, and business risks. This allowed

6
us to find the top six (due to a tie) opportunity markets based on the second stage, in which we analyzed a country’s growth potential and intangibles, such as ease of doing business and risk. This results in six opportunity markets, in order by score: Australia (77), Indonesia (71), Brazil (66), France (65.5), Spain (60), and Thailand (60).
Current Consumption Data for agricultural and forestry goods, as well as total exports from Wisconsin to partner countries, comes from the World Institute for Strategic Economic Research (WISER) Trade database (“WISERTrade Methodology” 2021). WISERTrade compiles data from various national and international statistical databases. The import data relies on data from the United Nations Comtrade database and data from 32 national sources. The UN Comtrade data covers 147 countries. The import data for these countries lags by a year (i.e., the most recently available year is 2019). This data covers the total imports for all agricultural/forestry goods managed by DATCP, organized by HS 02, HS 04, and HS 06. The agricultural and forestry export data comes from the U.S. Census Bureau Foreign Trade Division. Like the UN import data, the agricultural and forestry export data is organized by HS Code (the most recent year is 2020). WISERTrade data tracks exports by “state of origin of movement,” the US state from which the product was sent to ports or consolidated in containers for shipping (WISERTrade 2004). We calculated each of Wisconsin’s 151 trading partners into deciles, with the lowest 10 percent being scored 1 and the highest 10 percent being scored 10. This methodology was used for both Wisconsin’s imports to a country and that country’s net imports. We then weighted these scores at 20 percent and 30 percent, respectively. This is in accordance with Stage 2 of Figure 1. The Wisconsin export score is weighted less than that of imports because, although Wisconsin’s current exports are important, total imports are a better indicator of a country’s overall market conditions. To create a shortlist of opportunity markets for more detailed study, we then selected the 20 highest scoring markets: Australia, Brazil, France, Indonesia, Thailand, Vietnam, Argentina, Belgium, Chile, Spain, India, Ireland, Malaysia, Russia, The Philippines, Singapore, Denmark, New Zealand, Poland, and the United Arab Emirates. This process was repeated for Stage 3, which added the attribute total U.S. export dollars and redistributed the weights for the current consumption class. From there, we identified a list of five products based on two-digit HS codes for each country in the same manner of deciles and scoring.
Growth Potential The second class of attributes—growth potential—includes data for a country’s population under age 55, population growth, and GDP growth. This covered 30 percent of the total weight. Population and GDP growth are averaged over both the past five years and their five-year projections, and each are weighted 10 percent. We also assigned scores in deciles in Population and GDP growth, with 1 being the lowest and 10 being the highest. This means that two countries were assigned each score from 1 to 10, which helped create granularity between the 20 countries—often quite similar in absolute terms.

7
Population under Age 55 Data for the population under age 55 comes from the World Bank Open Data database, which in turn uses the UN's World Population Prospects 2019 Revision (World Bank 2020b). These estimates of the total population under 55 are obtained through censuses over time, voter registration rolls, and national trends in fertility, migration, and mortality (World Bank 2020b). The World Bank does not actively track population under 55. To find this, the total population aged 55–59, 60–64, and over 65 for both males and females was subtracted from the total male and female populations for each country.
Population Growth Next 3–5 Years Like the UN age data, the most recently available year for population growth data is 2019. Data for projected population growth over 5 years also comes from the UN Population Division’s World Population Prospects 2019 (UN Department of Human and Economic Affairs 2020). Because this data is future-looking, there is inherent risk that present demographic trends may change. However, the population growth projections focus on long-term trends of fertility, mortality, and migration, as well as a country’s demographic history. This prediction of how a population is going to grow is important because as a country’s population grows, it will have more people to feed and thus a larger market for Wisconsin’s food and agricultural products.
GDP Growth Averaged Past and Next 5 Years Data on Gross Domestic Product (GDP) growth, as well as GDP growth projections, are collected by the International Monetary Fund (IMF) (The International Monetary Fund 2021). The IMF collects data on countries’ GDP growth rates and makes projections on how these will change in the future. Wisconsin’s exports are often high-quality finished foodstuffs. Measuring GDP growth is important to find out if a country’s population has the market and preferences for these often luxury foods. It is important to note that GDP growth analysis is highly affected by the COVID-19 pandemic, which has had unprecedented economic impacts and has significantly hurt global growth forecasts. As this data was collected during the pandemic, it has probably influenced this category. Using these analyses, we distributed an additional 30 percent of the weight in accordance with Stage 2 in Figure 1. The weights for these attributes are distributed evenly because they are each an indicator of how a country’s market for Wisconsin’s food forestry and agricultural goods may grow. It is the relationship between these that will truly determine how good of an export destination a given country is.
Ease of Doing Business and Risk The third set of attributes—ease of doing business and risk—measures political stability. We used the Corruption Perception Index, Ease of Doing Business Index, and the Fragile States Index in the same way as the previous sets, by decile. If a country had a Free Trade Agreement (FTA) with the United States, it received a 10 in the free trade attribute. Countries currently negotiating FTAs with the United States would have received a 5; however, none of our shortlist countries is engaged in talks with the United States at the time of this report. Each of the four ease and risk attributes was weighted at 5 percent and accounted for the final 20 percent of the total weight. Each attribute data source is discussed below.

8
Free Trade Agreement (FTA) Data Data about FTAs with the U.S. was derived from the United States International Trade Administration (ITA) (Office of the United States Trade Representative 2021). The ITA includes details about each bilateral FTA between the U.S. and another partner country. This data was coded with “1” if a country possessed a bilateral agreement with the U.S. and “0” if it did not. The following countries possess an FTA with the U.S., according to the ITA: Australia, Bahrain, Canada, Chile, Colombia, Costa Rica, Dominican Republic, El Salvador, Guatemala, Honduras, Israel, Jordan, Korea, Mexico, Morocco, Nicaragua, Oman, Panama, Peru, and Singapore.
Ease of Doing Business Index Produced by the World Bank, the Ease of Doing Business (EDB) ranking is based on the Ease of Doing Business Index (World Bank 2020j). The EDB scores countries based on the ease of starting a business, ease of construction permits, electricity provision, credit provision, protection of minority investors, ease of paying taxes, trade across borders, and contract enforcement. This score comes from questionnaires administered to business owners and entrepreneurs about these topics. From this score, EDB then ranks the 190 countries from 1 (easiest to do business) to 190 (hardest to do business). However, the EDB may not reflect potential opportunity markets: the infrastructure needed by firms in a market could be built by those firms or facilitated by Foreign Direct Investment (FDI). There are also issues with data irregularity, which the World Bank acknowledges. The EDB gives an overall image of the health of a national economy, is highly influential to investors, and is correlated with FDI rates (Corcoran and Gillanders 2015).
Corruption Perception Index To measure the degree of corruption present in a country, we have utilized the Corruption Perception Index (CPI) (“Corruption Perception Index” 2020). The CPI is an index of the perception of corruption in countries compiled from 13 surveys of regional experts and businesspeople. These surveys explore respondents’ perception of corrupt activities in various countries, including nepotism, bribery, and the diversion of public funds. Countries are ranked from 1 (most corrupt) to 100 (least corrupt). The most recent available year with the CPI is 2020. The CPI is limited because it solely captures perception of corruption. As such, perception may bias the results and “hidden” corruption will not be captured by the index. Additionally, the index focuses on state corruption. Corruption in the private sector, or police forces, is not captured by the index (“Corruption Perception Index” 2020). However, the index has been checked independently by the European Commission Joint Research Center, which found the index to be “conceptually and statistically coherent” (“CORRUPTION PERCEPTIONS INDEX 2020 REPORT,” n.d.).
Fragile States Index The Fragile States Index (FSI) (Fragile States Index 2020), produced by The Fund for Peace, combines content analysis of global media, quantitative data, and qualitative history to produce a score from 0 (most stable) to 120 (most fragile). The indicators measured by the FSI include Fractionalized Elites, Economic Inequality, Human Flight and Brain Drain, and State Legitimacy, all provided by numerous international

9
statistical agencies such as the UN, World Bank, and WHO. To counter media bias, the FSI uses qualitative data about the importance of certain events from country experts (Fragile States Index 2020).
Product Selection After the six opportunity markets were identified using the Market Selection Tool, we modified the methods of the Tool. The main modification was the Current Consumption attribute class. We created a new attribute for the total U.S. export dollars by HS Code to each of the six opportunity markets, then re-ran the Wisconsin export and opportunity market import data to identify values for each product by HS Code. The Current Consumption class weight, totaling 50 percent of the Market Selection Tool rating, was redistributed so that opportunity market import dollars held 25 percent, U.S. export dollars to opportunity market held 10 percent, and Wisconsin export dollars to opportunity market held 15 percent of the total rating. This is reflected in Stage 3 of Figure 1. Like the methods for market selection, we used the WISERTrade U.S. Database for the attribute classes of U.S. and Wisconsin commodity export dollars (“WISERTrade Methodology” 2021). We used the WISERTrade U.N. World Database for country total commodity import values by 2-digit HS Code. Deciles were calculated for all products by country for each of the three attributes, and a rating out of 10 was assigned to each, with 1 denoting the lowest and 10 denoting the highest deciles. These three attribute ratings for each HS Code by market were then weighted and added. The five highest rating products for each market were selected for the recommendation.
Opportunity Matrix Overview The Country-Product Rank Matrix (Figure 2) is a visual summary of our recommendations. This matrix arranges products in rows and countries in columns. The top row ranks, from left to right, recommended opportunity markets. The columns list the best product for that market and its next best products. These products may vary from row to row, so their position reflects rank and not category. Dark colors signify that a product occurs more frequently across export markets. For example, miscellaneous edible preparations (HS 21) occurs five times, so it is the darkest color. Additionally, each box presents the product score found using our aforementioned methodology. More detailed information about products and destinations can be found in Figures 3, 4, and 5. This combined matrix gives established producers a way to quickly find their next opportunity.

10
Figure 3: Country-Product Rank Matrix (Country, by HS product category ranking)
Country Product AUSTRALIA INDONESIA FRANCE THAILAND SPAIN BRAZIL
1st 21: Miscellaneous
Edible Preparations (82)
12: Miscellaneous
Seeds (81)
12: Miscellaneous
Seeds (69)
12: Miscellaneous
Seeds (68)
08: Edible Fruit/Nuts (67)
21: Miscellaneous
Edible Preparations
(57)
2nd 22: Spirits (81) 04:
Dairy/Honey (80)
21; Miscellaneous
Edible Preparations
(67)
23: Food Residues/
Animal Feeds (68)
44: Wood (65) 15: Oils/Fats (56)
3rd 20: Prepared Vegetables (80)
21: Miscellaneous
Edible Preparations
(79)
23: Food Residues/
Animal Feeds (66)
04: Dairy/Honey (65)
15: Oils/Fats (65) 22: Spirits (54)
4th 23: Food
Residues/ Animal Feeds (79)
17: Sugar/Candy
(78)
3302: Materials for Beverages
(66)
03 Fish/Crustacean
(64) 10: Cereals (62) 05: Animal
Products (54)
5th 44: Wood (79)
3302: Materials for Beverages
(77)
04: Dairy/Honey
(65)
21: Miscellaneous
Edible Preparations
(61)
03: Fish/Crustacean
(61)
10: Cereals (54)
Source: Market selection Tool, WISERTrade data. Note: darker shades indicate higher frequency in top five products. For example, HS 21 appears in the top five products most often at five occurrences.
Although each country differed in its product ranking, there were many interesting findings. For example, HS 21 (Miscellaneous Edible Preparations), which includes products like extracts of coffee, yeasts, sauced and condiments, soups, ice creams, and other food preparations not elsewhere specified or identified (NESOI). This category appeared in the top five product rankings for five of the six identified destination countries. We see similar findings for HS 12 (Miscellaneous Seeds), which includes soybeans, oil seeds, plants for perfume, etc.), HS 04 (Dairy/Honey), which includes butter, whey, birds’ eggs, and edible products of animal origin NESOI), HS 22 (Spirits), which includes waters, beer, and vinegar, etc., and HS 23 (Food Residues/Animal Feeds), which includes flour, oilcake, waste, and preparations for animal feeding, etc. This suggests that many of these products would be successful in a variety of opportunity markets and local producers should consider exporting to more than one if possible, depending on other factors exceeding the scope of this report such as shipping and regulatory costs, proximity to other potential markets, and specific 4-digit HS codes that Wisconsin supplies and that the destination countries demand. Although appearing less frequently, HS 08 (Edible Fruit/Nuts), such as fresh or dried fruits and nuts of all kinds, HS 54 (Animal Products), such as bovine genetics, and HS 44 (Wood), such as wood charcoal, veneer sheets, and other articles NESOI, may be worthwhile endeavors for Brazil, despite the country’s lower rating. Figure 3 shows each country in descending order by average rating from left to right and each product in descending order by average rating from top to bottom. This matrix gives exporters and DATCP a concise way to locate opportunity markets for their products. It can also serve as the basis for future research by DATCP. For example, if a producer of a specialty mustard were to contact DATCP and express interest in exporting its product, countries in this list with the highest ratings for HS 21 (Misc. Edible Preparations) should be explored and investigated further—specifically Australia, Indonesia, and France. Alternatively,

11
if DATCP were interested in increasing Wisconsin’s exports to France, the IABC could use the scores listed here to attend trade shows or seek other networking opportunities for products in France’s top five, as well as other high-scoring HS categories, such as HS 44 (Wood) and HS 22 (Spirits). Figure 4: Country-HS Product Category Matrix
HS Code
Label Australia Indonesia France Thailand Spain Brazil Product Avg
12 Misc. Seeds 69 81 * 69 * 68 * 58 52 66 4 Dairy/Honey 76 80 * 65 * 65 * 60 52 66
21 Misc. Ed Prep. 82 * 79 * 67 * 61 * 48 57 * 66 44 Wood 79 * 76 64 59 65 * 51 66 23 Food Waste 79 * 75 66 * 68 * 53 51 65
3302 Beverage Mat’l 67 77 * 66 * 58 59 54 63 8 Ed. Fruit 70 73 60 59 67 * 45 62
20 Prep Veg. 80 * 64 62 61 * 48 49 61 15 Oils/Fats 71 61 53 51 65 * 56 * 59 10 Cereals 56 74 53 57 62 * 54 * 59 22 Spirits 81 * 55 64 47 53 54 * 59
3 Fish/Crust. 65 58 57 64 * 61 * 46 58 5 An. Prod 69 61 54 53 52 54 * 57
17 Sugar/Candy 56 78 * 53 53 48 50 56 Country Avg 71 71 61 59 57 52
Note: * indicates top opportunity product status for the country. Source: WISERTrade data.
Australia Wisconsin has exported to Australia for decades. The country's population projected to grow over the next five years. Additionally, Australia is relatively politically stable and corruption-free. Overall, from quantitative analysis, the country appears to be a welcome market for Wisconsin products. The country has had an FTA with the U.S. since 2005, which facilitates cooperation. This FTA also provides for gradual elimination of customs duties (2–4); the prohibition of import-export restrictions, except in accordance of GATT 1994 (2–4); and sets the goal of gradual easing of agricultural trade barriers (3–1). Additionally, in 2017 the bilateral Food Safety Recognition Agreement was signed by the U.S. and Australian. This agreement harmonizes standards between the U.S. FDA and the Australian Department of Agriculture, Water and the Environment to promote free trade while protecting local ecosystems. As a result of this close cooperation, exporting to Australia is highly simplified (U.S. ITA 2021a). 99% of U.S. exports to Australia enter the market duty-free, and the U.S. is ranked second in supplying agricultural goods to Australia. However, stiff competition from other countries (Canada, New Zealand, EU, and Japan) means that U.S. firms will need to compete in terms of quality with other sources for specialty products. However, according to the U.S. ITA, Australians show an interest in American organic products, food ingredients, and consumer-ready processed food and beverages (U.S. ITA 2021a).

12
Recommended products for export to Australia include specialty/sparkling waters, consumer-ready snack foods, pet food, beer, sauces, and wood products (WISERTrade 2021).
Indonesia Indonesia is an emerging economy whose consumers are acquiring more expendable income for imported goods. Indonesia is the largest economy in the Association of Southeast Asian Nations (ASEAN) and represents the 10th-largest destination for U.S. agricultural exports. Beef and dairy imports are increasing, and this has been attributed to rising consumer demand and government efforts to stabilize domestic prices. Dairy imports are increasing due to increasing expendable income, increased demand, and low domestic production. Non-tropical fruit imports are also a popular product in Indonesia; although the country produces a great variety of fruit, species from temperate regions are imported. This includes blueberries, cherries, apples, and pears. Other opportunities include snack foods and food ingredients. Increasing expendable consumer income means increasing demand for imported snack foods Additionally, local processed food producers source some components from abroad, providing another opportunity for U.S. exporters. This is particularly the case with dairy isolates, corn starch, wheat, raisins, onion, and garlic (U.S. ITA 2021c). Recommended products for export to Indonesia include milk concentrates and isolates, milk fat, lactose, soy flour and seeds, wood chips, and beverage manufacturing materials (WISERTrade 2021).
France While exporters must navigate EU and French regulations, the market opportunity for Wisconsin is huge. France imported $82,809,707,548 of agricultural products on average each year from 2010 to 2020. A 2018 report from the USDA's mission to France indicates that specialty goods from the U.S., such as regional products and food preparations, are very popular in France. Marketing as a specialty product, or as a regional specialty, will benefit American exporters. The U.S. Trade mission to France maintains close ties with French importers; FAS within USDA maintains a list of French importing firms for U.S. exporters. For Wisconsin firms, this could mean the export of Wisconsin dairy products, beverages, or edible food preparations to France. French firms are highly networked in the domestic economy, and exports will need to be specialized or branded to appeal to French consumers. Additionally, regulations in France and the EU are generally phytosanitary. Requirements include the labelling of genetically engineered products, labelling of additives and food coloring, and sanitary/health certificates, along with general import permissions.
As with Australia, French consumers have a great deal of expendable income, and consumers are willing to experiment. According to the US ITA, a massive opportunity for exports exists in food preparations, fresh fruits and vegetables, snack foods, and “ethnic products,” as well as specialty products (e.g., organic and health-oriented goods. Organic and health-oriented goods). The most popular American products in France include fish and seafood, alcoholic beverages, fruits and nuts, non-alcoholic beverages, and edible food preparations (U.S. ITA 2021b).
Recommended products for export to France include beverage manufacturing materials, animal feed, specialty cheeses, yeast, and sauces (WISERTrade 2021).
13
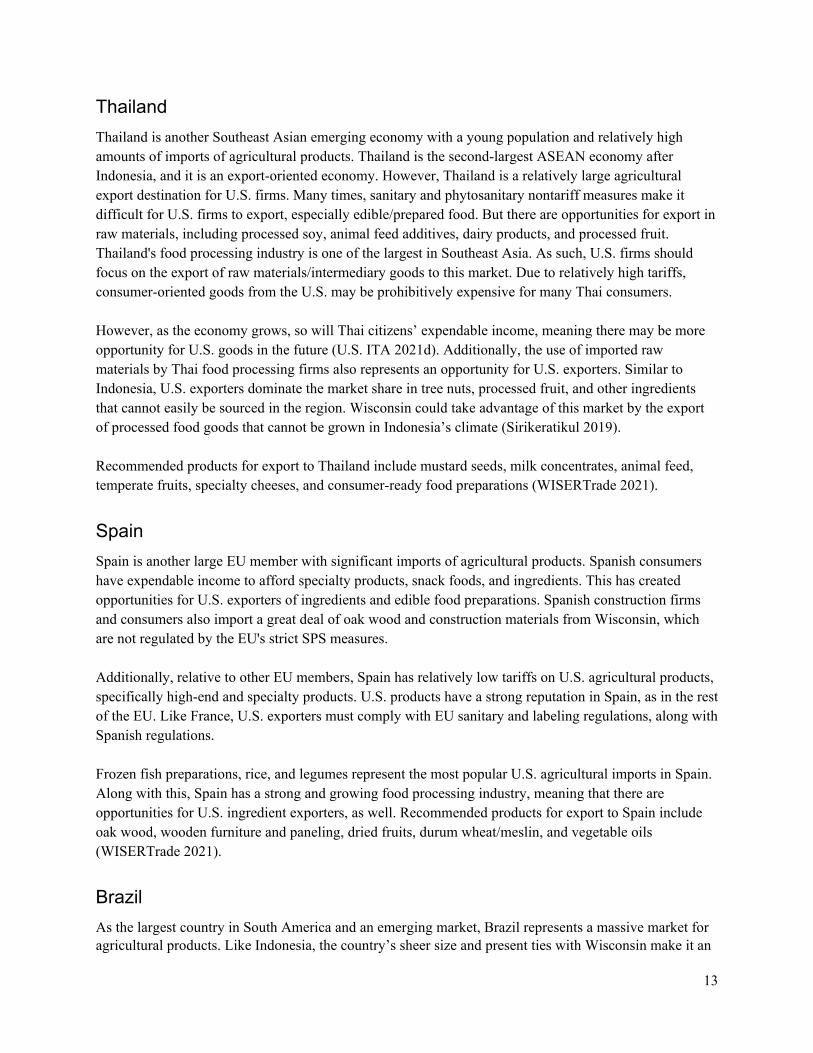
Thailand Thailand is another Southeast Asian emerging economy with a young population and relatively high amounts of imports of agricultural products. Thailand is the second-largest ASEAN economy after Indonesia, and it is an export-oriented economy. However, Thailand is a relatively large agricultural export destination for U.S. firms. Many times, sanitary and phytosanitary nontariff measures make it difficult for U.S. firms to export, especially edible/prepared food. But there are opportunities for export in raw materials, including processed soy, animal feed additives, dairy products, and processed fruit. Thailand's food processing industry is one of the largest in Southeast Asia. As such, U.S. firms should focus on the export of raw materials/intermediary goods to this market. Due to relatively high tariffs, consumer-oriented goods from the U.S. may be prohibitively expensive for many Thai consumers. However, as the economy grows, so will Thai citizens’ expendable income, meaning there may be more opportunity for U.S. goods in the future (U.S. ITA 2021d). Additionally, the use of imported raw materials by Thai food processing firms also represents an opportunity for U.S. exporters. Similar to Indonesia, U.S. exporters dominate the market share in tree nuts, processed fruit, and other ingredients that cannot easily be sourced in the region. Wisconsin could take advantage of this market by the export of processed food goods that cannot be grown in Indonesia’s climate (Sirikeratikul 2019). Recommended products for export to Thailand include mustard seeds, milk concentrates, animal feed, temperate fruits, specialty cheeses, and consumer-ready food preparations (WISERTrade 2021).
Spain Spain is another large EU member with significant imports of agricultural products. Spanish consumers have expendable income to afford specialty products, snack foods, and ingredients. This has created opportunities for U.S. exporters of ingredients and edible food preparations. Spanish construction firms and consumers also import a great deal of oak wood and construction materials from Wisconsin, which are not regulated by the EU's strict SPS measures. Additionally, relative to other EU members, Spain has relatively low tariffs on U.S. agricultural products, specifically high-end and specialty products. U.S. products have a strong reputation in Spain, as in the rest of the EU. Like France, U.S. exporters must comply with EU sanitary and labeling regulations, along with Spanish regulations. Frozen fish preparations, rice, and legumes represent the most popular U.S. agricultural imports in Spain. Along with this, Spain has a strong and growing food processing industry, meaning that there are opportunities for U.S. ingredient exporters, as well. Recommended products for export to Spain include oak wood, wooden furniture and paneling, dried fruits, durum wheat/meslin, and vegetable oils (WISERTrade 2021).
Brazil As the largest country in South America and an emerging market, Brazil represents a massive market for agricultural products. Like Indonesia, the country’s sheer size and present ties with Wisconsin make it an

14
attractive partner in the near future. According to the U.S. ITA, Brazil has a “complicated” regulatory environment. Complaints of arbitrary and discriminatory barriers for imports come from both inside and outside the country. Additionally, pro-domestic incentives from the previous presidential administration mean that U.S. firms face stiff competition in this market. However, despite this complicated bureaucratic system and discriminatory trade barriers, the Brazilian government is trying to open their economy. Brazilian firms are increasingly willing to import U.S. raw materials and U.S. firms are increasingly willing to export to Brazil as the country's economy continues to grow. High demand for U.S. products remains prominent in the country. This is embodied in increasing trade cooperation between the U.S. and Brazil. In 2011, the Agreement on Trade and Economic Cooperation between the U.S. and Brazil (ATEC) was passed, which established a bilateral U.S.–Brazilian commission to analyze the costs and benefits of current trade barriers with the goal of increasing trade (U.S. ITC 2012). This desire for increased economic cooperation and trade has persisted across administrations, with the Trump and Bolsonaro administrations agreeing to accelerate U.S.–Brazilian trade integration in April 2020 (U.S. ITA 2021e). Additionally, the first Foreign Agricultural Service mission to Brazil took place in October 2017 (USDA FAS 2017). Brazil is a major agricultural producer: as such, imports are restricted to select goods that cannot be grown due to climate or otherwise cannot be easily produced in Brazil, such oils and fats, non-indigenous oil seeds, processed fruits and vegetables, wheat, and agricultural intermediary products (U.S. ITC 2012). Recommended products for export to Brazil include hydrogenated vegetable fats, ethyl alcohol, inedible animal products for feed/rendering, and consumer-ready sauces (WISERTrade 2021). Brazil is also the #1 destination for Wisconsin exports of bovine genetics due to the country's massive beef industry (WISERTrade 2021). See Appendix C: Country Overview Tables for each country’s top five products and ratings.
Product Overview This section expands each two-digit HS Code that appears in the top five opportunity products for the six countries identified above. Displayed are 10-year averaged Wisconsin export dollars to each country (rating from the Market Selection Tool in parentheses) and the dollar amount for each 4-digit HS Code within the same period (WISERTrade: State HS Database, n.d.). Chapters are sorted in descending order by average total rating of the two-digit HS Code in all six opportunity markets. Products with 4-digit HS Codes are sorted within each chapter in ascending order by WISERTrade rank. Dollar amounts were rounded to the nearest hundred thousand, if large enough; for smaller amounts, they were rounded to the nearest thousand or hundred. Particularly interesting cases are noted below, and the full list of all 4-digit HS Codes for each chapter in the list of top five products can be found in Appendix B.
High Ratings and Low Exports: Untapped Potential Some products in the top five for a country feature high ratings and low Wisconsin export dollars, such as HS 08 (Edible Fruit & Nuts; Citrus Fruit or Melon Peel), which has a rating of 67 for Spain and represents the lowest amount of Wisconsin export dollars at $5,600. This might suggest that Spain imports an abundance of edible fruit from the U.S. and/or other countries, but Wisconsin does not capture a substantial market share. Possible explanations should be explored. These could include high barriers to

15
market entry or low commodity production in Wisconsin, among other factors. France and Spain are members of the European Union (EU) and enjoy the benefits of close proximity, as well as free trade within the EU, which may explain why they might import from neighbors rather than Wisconsin. DATCP could conduct a WISERTrade search of Spain’s total imports of 08 Edible Fruits to better understand which specific 4-digit HS Codes they import and from whom. If Wisconsin supplies a similar product at a competitive price, we advise further exploring ways to expand market access. The quantitative methods for product selection limited our search to 2-digit HS Codes, but it is possible that Spain imports a significant amount of 4-digit HS Codes, beginning with HS 08, from the U.S. or other countries and Wisconsin may not produce or export those specific products. Figure 4: Markets with High Ratings and Low Exports
HS Code Title Country
WI Export $ Rating
04 Dairy/Honey France 214,000 65 23 Food Waste France 289,000 65.5 08 Ed. Fruit Spain 5,600 67 20 Prep Veg. Thailand 567,000 61 15 Fats Spain 262,000 64.5 15 Fats Brazil 245,000 55.5 10 Cereals Brazil 625,000 53.5 22 Spirits Australia 625,000 80.5 22 Spirits Brazil 35,000 54 03 Fish/Crust. Thailand 90,000 63.5 03 Fish/Crust. Spain 48,000 61
Source: WISERTrade.data.
Figure 4 illustrates similar examples of markets with Wisconsin export dollar amounts of less than $1 million, ordered by appearance in Appendix B. One notable outlier is HS 22 for Australia, which has a high rating of 80.5 but a Wisconsin Export Dollar amount of only $625,000. This may be one of the greatest potential markets for export growth, specifically of HS 2202 (Waters, Sweetened Etc. & Other Nonalcoholic Beverages NESOI), which represents 81 percent of Wisconsin’s export of HS 22 (Spirits) to Australia. Wisconsin exports could be further facilitated through policy or DATCP exporter services. Other items worth mentioning are that HS Codes 15 (Fats), HS 22 (Spirits), and HS 03 (Fish/Crustaceans) appear twice each and that Indonesia does not appear in this list at all.
High Ratings and High Exports: Practical Potential Some products in the top five for a country feature high ratings and high Wisconsin export dollars, such as HS 12 (Oil Seeds Etc.; Miscellaneous Grain, Seed, Fruit, Plant Etc.) which has a rating of 81 for Indonesia and represents the second-highest amount of Wisconsin export dollars at $9.5 million. This suggests that Indonesia represents a great market for the export of miscellaneous seeds and that Wisconsin currently captures a significant market share. There may still be opportunity for export growth:
16
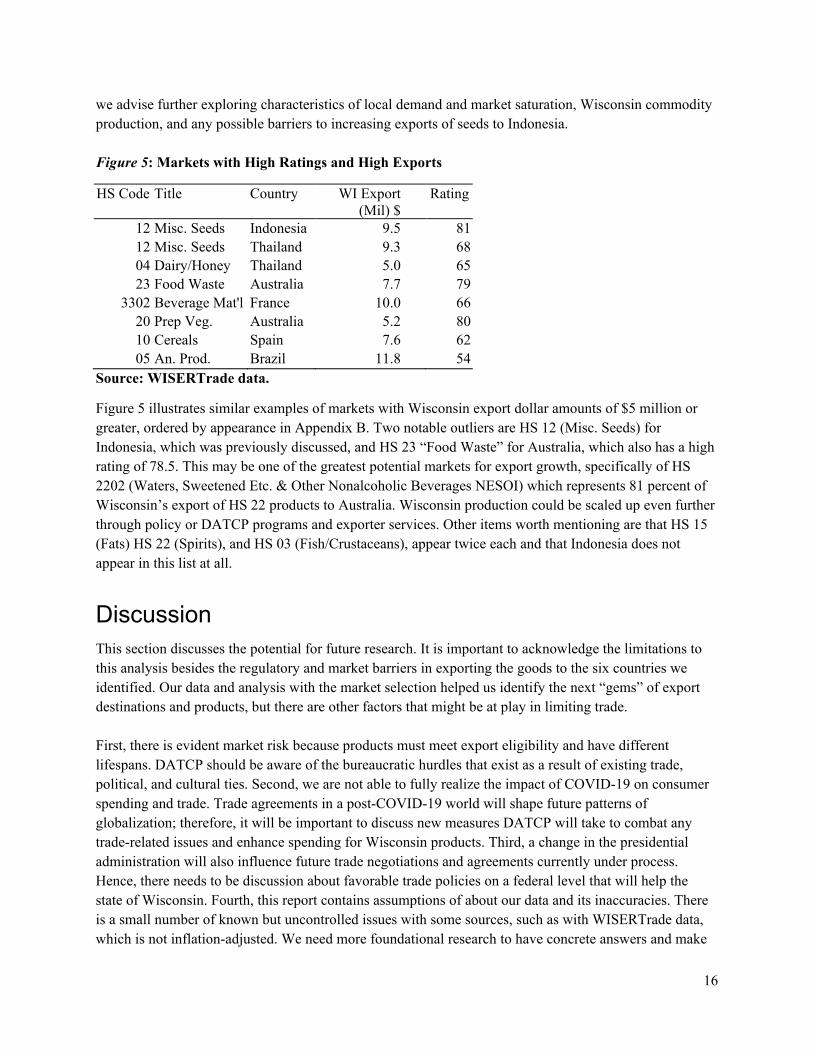
we advise further exploring characteristics of local demand and market saturation, Wisconsin commodity production, and any possible barriers to increasing exports of seeds to Indonesia. Figure 5: Markets with High Ratings and High Exports
HS Code Title Country WI Export (Mil) $
Rating
12 Misc. Seeds Indonesia 9.5 81 12 Misc. Seeds Thailand 9.3 68 04 Dairy/Honey Thailand 5.0 65 23 Food Waste Australia 7.7 79
3302 Beverage Mat'l France 10.0 66 20 Prep Veg. Australia 5.2 80 10 Cereals Spain 7.6 62 05 An. Prod. Brazil 11.8 54
Source: WISERTrade data.
Figure 5 illustrates similar examples of markets with Wisconsin export dollar amounts of $5 million or greater, ordered by appearance in Appendix B. Two notable outliers are HS 12 (Misc. Seeds) for Indonesia, which was previously discussed, and HS 23 “Food Waste” for Australia, which also has a high rating of 78.5. This may be one of the greatest potential markets for export growth, specifically of HS 2202 (Waters, Sweetened Etc. & Other Nonalcoholic Beverages NESOI) which represents 81 percent of Wisconsin’s export of HS 22 products to Australia. Wisconsin production could be scaled up even further through policy or DATCP programs and exporter services. Other items worth mentioning are that HS 15 (Fats) HS 22 (Spirits), and HS 03 (Fish/Crustaceans), appear twice each and that Indonesia does not appear in this list at all.
Discussion This section discusses the potential for future research. It is important to acknowledge the limitations to this analysis besides the regulatory and market barriers in exporting the goods to the six countries we identified. Our data and analysis with the market selection helped us identify the next “gems” of export destinations and products, but there are other factors that might be at play in limiting trade. First, there is evident market risk because products must meet export eligibility and have different lifespans. DATCP should be aware of the bureaucratic hurdles that exist as a result of existing trade, political, and cultural ties. Second, we are not able to fully realize the impact of COVID-19 on consumer spending and trade. Trade agreements in a post-COVID-19 world will shape future patterns of globalization; therefore, it will be important to discuss new measures DATCP will take to combat any trade-related issues and enhance spending for Wisconsin products. Third, a change in the presidential administration will also influence future trade negotiations and agreements currently under process. Hence, there needs to be discussion about favorable trade policies on a federal level that will help the state of Wisconsin. Fourth, this report contains assumptions of about our data and its inaccuracies. There is a small number of known but uncontrolled issues with some sources, such as with WISERTrade data, which is not inflation-adjusted. We need more foundational research to have concrete answers and make
17
informed decisions. Therefore, more in-depth analysis on country-specific inflation and exchange rates through an inflation adjustment tool will be useful in the future. Lastly, although this report is very comprehensive and attempts to capture a wide range of factors to come, one major point of discussion we have not addressed is understanding how new sustainability practices and climate change feeds into consumer preferences and affects trade. It is beyond our current scope to delve into further research in that area, but we hope our current analysis is the best available deliverable for DATCP.
Recommendations This report provides five recommendations for our client and Wisconsin producers to determine the best course of action to help facilitate trade to the new destinations with new products, as well as areas of focus in the future that will inform the analysis further. We have categorized our recommendations in three different groups that focus on export strategies, methodology changes, and potential opportunities.
Export Strategies Recommendation 1: Explore opportunity markets and associated products for export growth We recommend the following countries as the next top export destination for Wisconsin: Australia, Indonesia, Brazil, France, Spain, and Thailand. Products in categories such as seeds, edible preparations, spirits, dairy/honey, and residues/animal feeds have great potential in those markets. We also find surprising consumer preferences that can help to enter and excel in those markets with untapped and practical potentials.
Methodology Changes Recommendation 2: Deepen the discovery research by adding or refining key attributes and weights based on data correlating to export potential, such as domestic market size and similarity to destination markets, proximity to opportunity markets and existing trade routes, market volatility, and trade vulnerability We recommend DATCP improves the market selection tool with different weights and attributes. We also recommend researching further into non-tariff barriers for products and exchange rates for each market. It will be important to assess volatilities in the market over time to quantify risks such as external shocks and diseases. Additionally, DATCP should identify special market conditions such as short-term or long-term opportunities, market saturations, and barriers such as cultural preferences, income levels, and elasticities of different goods. Finally, we recommend DATCP identify how the diversity of products (luxury versus staple goods) and ease of shipment/freight costs can come into play when making initial export decisions. Recommendation 3: Broaden the discovery research by using the Market Selection tool to analyze all attributes for additional countries We recommend DATCP analyze trade practices of other countries and U.S. states for similar products to gain more insight. It will help understand how to trade any specialty products and discover unique opportunities given Wisconsin’s seasonal potential for certain goods. It would be helpful to incorporate other attributes into the Market Selection tool such as competitive pricing, exchange rates effects, and

18
inflation adjustments to make the findings more efficient. The tool can also be used to support further research on other potential markets identified in the initial stages of this project.
Potential Opportunities Recommendation 4: Allocate additional resources to proactively engage and support Wisconsin producers that have export opportunity potential We recommend DATCP should connect with organizations that support a more advocacy-based approach, such as Wisconsin Economic Development Corporation (WEDC). This will complement DATCP’s expertise. Building these relationships will maximize potential and growth for food producers in Wisconsin. Developing a strategy with such organizations will facilitate branding and build cultural ties between the producers and export markets. Investing in extensive and specialized consultation services for producers and participating in more trade shows may also be beneficial for growth. Recommendation 5: Identify the variables that are significantly correlated with the food policy environment in Wisconsin We recommend DATCP should keep up-to-date with the Department of Natural Resources and nutrient management policies in the state. It will be important to learn about food security and cultural identity as they relate to consumption in the countries this report identified. Agriculture lobbying can be very organized and powerful; it will be essential to understand implications of policies in the state of Wisconsin and beyond.
Conclusion Wisconsin’s current export markets consist of a diverse range of products, and the International AgriBusiness Center uses its resources to provide consultation, research, financing, and market development to support home producers in the global market. However, there are many markets that have yet to explored. Through this project, DATCP can identify the next top export destinations as well as products that can be an important vehicle in aiding Wisconsin exporters. DATCP provides a public good for the state and in the form of agriculture and trade-related policy decisions that are fundamental in supporting Wisconsin producers. Identifying the unsung export opportunities proved to be an extensive and complicated study in which key players such as farmers, producers, and state actors have crucial roles to meet. To excel in a global market, they cannot rely on individual resources. Therefore, the state entrusts DATCP with the mission to pool public resources to support Wisconsin trade. The high fixed costs associated with providing export-related services is shared by DATCP, and the benefits are redeemed by stakeholders involved. These products and markets open new opportunities for Wisconsin as our scores from the Market Selection Tool suggest potential export growth opportunity for each product in each country. DATCP can utilize the data and make decisions on export feasibility of the products in the identified markets and later pursue other opportunities by using the tools we have provided.
19
Additionally, we found surprises in our findings that can motivate market choices for Wisconsin producers. For example, HS 22 (Spirits) for Australia has a rating of 80.5 for Australia, while Wisconsin exports only $625,000 worth of products in this category to Australia. This might suggest that Australia imports a lot of spirits from other U.S. states or from other countries. If Wisconsin could increase its exports of these products, it may be able to capture a larger share of the market. Through our report, we created a mechanism in our methods that serves as a tool for DATCP to engage in further research to find additional market opportunities and offer recommendations to analyze export strategies and food policy environment in Wisconsin.

20
Appendix A
Wisconsin DATCP Harmonized System Codes 01 – Live Animals 02 – Meat and Edible Meat Offal 03 – Fish, Crustaceans & Aquatic Invertebrates 04 – Dairy Prods; Birds Eggs; Honey; Edible Animal Products Not Elsewhere Specified or Indicated 05 – Products of Animal Origin, Not Elsewhere Specified or Indicated 06 – Live Trees, Plants, Bulbs Etc.; Cut Flowers Etc. 07 – Edible Vegetables & Certain Roots & Tubers 08 – Edible Fruit & Nuts; Citrus Fruit or Melon Peel 09 – Coffee, Tea, Mate & Spices 10 – Cereals 11 – Milling Products; Malt; Starch; Inulin; Wheat Gluten 12 – Oil Seeds Etc.; Misc Grain, Seed, Fruit, Plant Etc. 13 – Lac; Gums, Resins & Other Vegetable Sap & Extract 14 – Vegetable Plaiting Materials & Products Not Elsewhere Specified or Indicated 15 – Animal or Vegetable Fats, Oils Etc. & Waxes 16 – Edible Preparations of Meat, Fish, Crustaceans Etc. 17 – Sugars and Sugar Confectionary 18 – Cocoa and Cocoa Preparations 19 – Prep Cereal, Flour, Starch or Milk; Bakers Wares 20 – Prep Vegetables, Fruit, Nuts or Other Plant Parts 21 – Miscellaneous Edible Preparations 22 – Beverages, Spirits and Vinegar 23 – Food Industry Residues & Waste; Prep Animal Feed 24 – Tobacco and Manufactured Tobacco Substitutes 3301 – Essential Oils Resinoid; Ext Oleo Terpen By-Products Etc. 3302 – Odoriferous Mixture; Raw Material for Industrial & Beverage Manufacturing 3501 – Casein, Caseinates and Other Casein Derivatives 3502 – Albumins Incl Whey Proteins & Albumin Derivatives 3503 – Gelatin & Deriv; Isinglass; Glues, Animal or Not Elsewhere Specified or Indicated 3504 – Peptones, Other Proteins & Derivatives Etc.; Hide Powder 3505 – Dextrins Etc.; Glues Based on Starches, Dextrin Etc. 3507 – Enzymes; Prepared Enzymes Not Elsewhere Specified or Indicated 41 – Raw Hides and Skins (No Furskins) and Leather 4301 – Raw Furskins Not Elsewhere Specified or Indicated or Indicated (Including Pieces for Fur Use) 4302 – Tanned or Dressed Furskins (Incl Pcs Etc.) 44 – Wood and Articles of Wood; Wood Charcoal 5102 – Fine or Coarse Animal Hair, Not Carded or Combed 5103 – Waste of Wool or of Fine or Coarse Animal Hair 5105 – Wool & Fine or Coarse Animal Hair, Carded & Combed 5201 – Cotton, Not Carded or Combed 5203 – Cotton, Carded or Combed

21
Appendix B
Wisconsin 10-Year Averaged Export Dollars by 4-digit HS Codes Chapters sorted in descending order of average total Market Selection Tool rating. Products with 4-digit HS Codes sorted in ascending order of WISERTrade rank.
Chapter 12: Oil Seeds/Misc. Grains/Med. Plants/Straw Indonesia $9.5 million (81 rating): 1201 Soybeans, Whether Broken – $8.6 million (91%) 1208 Flour & Meal of Oil Seed & Olea Fruit (No Mustard) – 0.88 million (9%) France $3.1 million (69 rating): 1209 Seeds, Fruit and Spores, For Sowing (<2%) 1201 $3 million (98%) 1211 Plants Etc. For Pharmacy, Perfume, Insecticides Etc. (<1%) 1208 (<1%) Thailand $9.3 million (68 rating) 1201 $8.9 million (96%) 1208 <4% 1207 Oil Seeds & Oleaginous Fruits NESOI, Broken or Not <1% 1214 Rutabagas, Hay, Clover & Other Forage Products <1% 1211 Plants Etc. For Pharmacy, Perfume, Insecticides Etc. <1%
Chapter 04: Dairy, Eggs, Honey, & Ed. Products Indonesia $1.9 million (79.5 rating) 0402 Milk and Cream, Concentrated or Sweetened – $300,000 10-year average (15%) 0404 Whey & Milk Products NESOI, Flavored Etc. Or Not – $900,000 (47%) 0406 Cheese and Curd (<4%) 0405 Butter and Other Fats and Oils Derived from Milk – 700,000 (34%) France $214,000 (65 rating) 0406 $164,000 (76%) 0402 (<1%) 0404 $14,000 (6%) 0407 Birds Eggs, In the Shell, Fresh, Preserved or Cooked – $36,000 (17%)

22
Appendix B continued… Thailand $5 million (64.5 rating) 0404 $4.3 million (86%) 0406 Buttermilk, Yogurt, Kefir Etc., Flavored Etc. Or Not (<3%) 0402 (1%) 0409 (<1%) 0403 (<1%) 0405 $500,000 (9%) 0408 Birds Eggs, Not in Shell & Yolks, Fresh, Dry, Etc. (<1%)
Chapter 21: Misc. Edible Preparations Australia $2.8 million (82 rating) 2106 Food Preparations NESOI – $1.8 million (64%) 2103 Sauces & Prep; Mixed Condiments, Mustard Flour Etc. – $400,000 (14%) 2102 Yeasts; Dead Sing-Cell Micro-Org NESOI; Baking Powder – $300,000 (10%) 2104 Soups, Broths & Preps; Homogenized Comp Food Preps – $300,000 (10%) Indonesia $2.3 million (78.5 rating) 2106 $2.3 million (98%) 2103 (<1%) 2102 (<2%) France $2 million (67 rating) 2103 $500,000 (23%) 2106 $1.5 million (72%) 2102 $100,000 (6%) 2101 Extracts Etc. Of Coffee, Tea or Mate; Roast Chicory (<1%) Thailand $836,000 (61 rating) 2106 $302,000 (36%) 2103 $60,000 (7%) 2102 $474,000 (57%) Brazil $2 million (57 rating) 2103 $1.2 million (60%) 2106 $700,000 (36%) 2102 $100,000 (4%) 2105 (<1%) 2101 (<1%)
23
Appendix B continued…
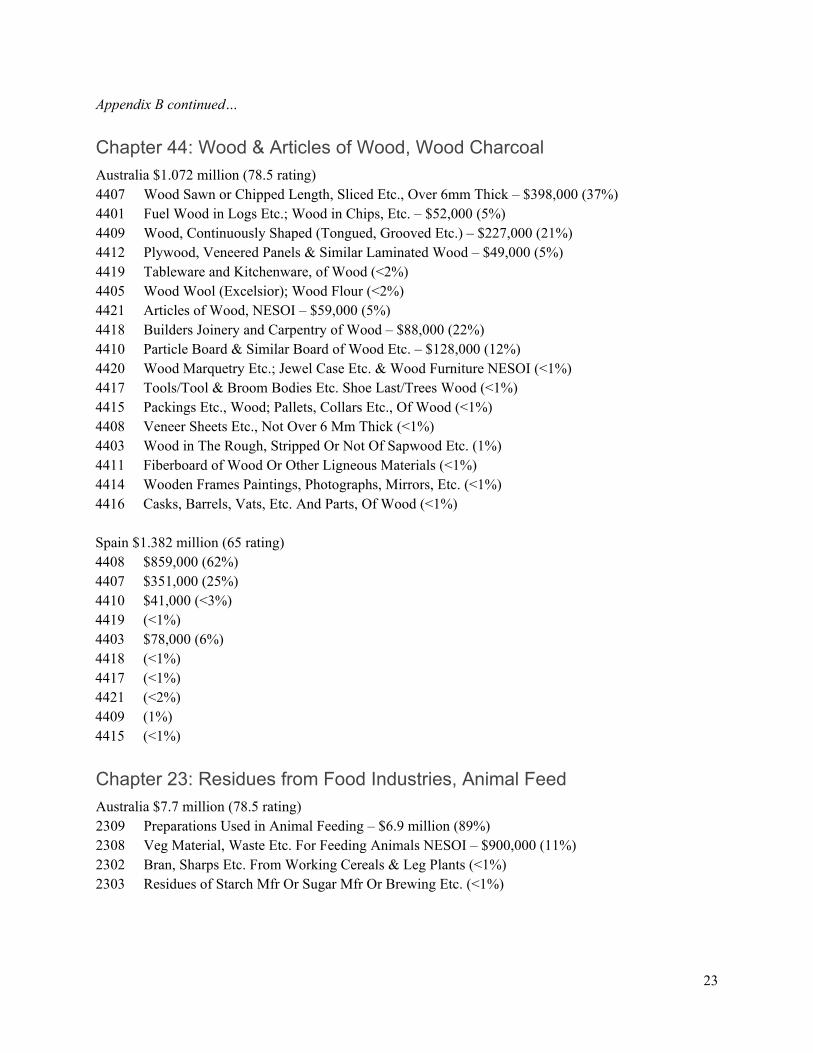
Chapter 44: Wood & Articles of Wood, Wood Charcoal Australia $1.072 million (78.5 rating) 4407 Wood Sawn or Chipped Length, Sliced Etc., Over 6mm Thick – $398,000 (37%) 4401 Fuel Wood in Logs Etc.; Wood in Chips, Etc. – $52,000 (5%) 4409 Wood, Continuously Shaped (Tongued, Grooved Etc.) – $227,000 (21%) 4412 Plywood, Veneered Panels & Similar Laminated Wood – $49,000 (5%) 4419 Tableware and Kitchenware, of Wood (<2%) 4405 Wood Wool (Excelsior); Wood Flour (<2%) 4421 Articles of Wood, NESOI – $59,000 (5%) 4418 Builders Joinery and Carpentry of Wood – $88,000 (22%) 4410 Particle Board & Similar Board of Wood Etc. – $128,000 (12%) 4420 Wood Marquetry Etc.; Jewel Case Etc. & Wood Furniture NESOI (<1%) 4417 Tools/Tool & Broom Bodies Etc. Shoe Last/Trees Wood (<1%) 4415 Packings Etc., Wood; Pallets, Collars Etc., Of Wood (<1%) 4408 Veneer Sheets Etc., Not Over 6 Mm Thick (<1%) 4403 Wood in The Rough, Stripped Or Not Of Sapwood Etc. (1%) 4411 Fiberboard of Wood Or Other Ligneous Materials (<1%) 4414 Wooden Frames Paintings, Photographs, Mirrors, Etc. (<1%) 4416 Casks, Barrels, Vats, Etc. And Parts, Of Wood (<1%) Spain $1.382 million (65 rating) 4408 $859,000 (62%) 4407 $351,000 (25%) 4410 $41,000 (<3%) 4419 (<1%) 4403 $78,000 (6%) 4418 (<1%) 4417 (<1%) 4421 (<2%) 4409 (1%) 4415 (<1%)
Chapter 23: Residues from Food Industries, Animal Feed Australia $7.7 million (78.5 rating) 2309 Preparations Used in Animal Feeding – $6.9 million (89%) 2308 Veg Material, Waste Etc. For Feeding Animals NESOI – $900,000 (11%) 2302 Bran, Sharps Etc. From Working Cereals & Leg Plants (<1%) 2303 Residues of Starch Mfr Or Sugar Mfr Or Brewing Etc. (<1%)

24
Appendix B continued… France $289,000 (65.5 rating) 2309 $164,000 (57%) 2308 $124,000 (43%) 2304 Soybean Oilcake & Other Solid Residue, Whole/Not Ground (<1%) Thailand $1.622 million (67.5 rating) 2309 $318,000 (20%) 2308 $160,000 (10%) 2303 $1.109 million (68%) 2304 (2%)
Chapter 3302: Albumins and albumin derivatives Indonesia $2.4 million (76.5 rating) 330290 Mixtures of Odoriferous Substances, Etc. NESOI – $1.9 million (81%) 330210 Mixtures Odoriferous Substance Use Food/ Drink Ind – $451,000 (19%) France $9.973 million (65.5 rating) 330210 $977,000 (10%) 330290 $8.996 million (90%)
Chapter 08: Ed. Fruits & Nuts, Peel of Citrus/Melons Spain $5,600 (67 rating) 0810 Fruit NESOI, Fresh – $300 (5%) 0813 Fruit Dried NESOI; Mixtures of Nuts or Dried Fruit – $5,300 (95%)
Chapter 20: Preps. of Vegetables, Fruits, Nuts, Etc. Australia $5.2 million (80 rating) 2008 Fruit, Nuts Etc. Prepared or Preserved NESOI – $2.8 million (54%) 2004 Vegetables NESOI Prepared or Preserved NESOI, Frozen – $1.2 million (23%) 2009 Fruit Juice Not Fortified W Vitamins/Mineral/Veg Juice No Spirit – $100,000 (2%) 2005 Vegetables NESOI Prepared Etc. NESOI, Not Frozen – $1 million (20%) 2001 Veg, Fruit, Nuts Etc., Prep Or Pres By Vinegar Etc. (<1%) 2003 Mushrooms and Truffles Prepared Or Preserved NESOI (<1%) Thailand $567,000 (61 rating) 2008 $562,000 (99%) 2007 Jams, Fruit Jellies, Marmalades Etc., Cooked (<1%) 2005 (<1%) 2009 (<1%)

25
Appendix B continued…
Chapter 15: Animal or Vegetable Fats, Oils, & Waxes Spain $262,000 (64.5 rating) 1517 Margarine; Edible Mixtures Etc. and or Veg Fat & Oil – $35,000 (13%) 1507 Soybean Oil & Its Fractions, Not Chemic Modified (<1%) 1515 $226,000 (86%) Brazil $245,000 (55.5 rating) 1516 Animal or Veg Fats & Oils, Hydrogen Etc., Not Fur Prep – $140,000 (57%) 1513 Coconut, Palm Kernel Or Babassu Oil Etc., No Ch Mod – $12,000 (5%) 1504 Fats & Oils, Their Fractions, Fish & Marine Mammal – $73,000 (30%) 1521 Veg Waxes NESOI, Beeswax Etc. And Spermaceti (<1%) 1507 $3,000 (1%) 1512 Sunflower-Seed, Safflow Or Cottonseed Oil Etc., No Ch Mod – $7,000 (3%) 1517 $9,000 (4%)
Chapter 10: Cereals Spain $7.6 million (62 rating) 1001 Wheat and Meslin – $7.3 million (96%) 1005 Corn (Maize) – $300,000 (4%) Brazil $625,000 (53.5 rating) 1001 (100%)
Chapter 22: Beverages, Spirits, and Vinegar Australia $625,000 (80.5 rating) 2202 Waters, Sweetened Etc. & Oth Nonalc Beverages NESOI – $508,000 (81%) 2207 Ethyl Alcohol, Undenat, Nun80% Alc; Alcohol, Denat – $65,000 (10%) 2203 Beer Made from Malt $6,000 (<1%) 2208 Ethyl Alcohol, Undenat, Und80% Alc; Spirit Beverag – $29,000 (5%) 2204 Wine of Fresh Grapes; Grape Must NESOI – $18,000 (3%) Brazil $35,000 (54 rating) 2207 $14,000 (41%) 2208 $3,000 (7%) 2203 $2,000 (5%) 2202 $16,000 (47%)

26
Appendix B continued…
Chapter 03: Fish & Crustaceans Thailand $90,000 (63.5 rating) 0303 Fish, Frozen (No Fish Fillets or Other Fish Meat) – $51,000 (56%) 0302 Fish, Fresh or Chilled (No Fillets Or Other Meat) – $40,000 (44%) Spain $48,000 (61 rating) 0304 Fish Fillets & Oth Fish Meat, Fresh, Chill Or Froz (100%)
Chapter 05: Products of Animal Origin Brazil $11.821 million (53.5 rating) 0511 Animal Products NESOI; Animal Genetics, Dead Animals, Inedible Etc. (100%)
Chapter 17: Sugar & Sugar Confectionery Indonesia $1.074 million (77.5 rating) 1702 Sugars NESOI, Incl Chem Pure Lactose Etc.; Caramel $1.072 million (99%) 1704 Sugar Confection (Incl White Chocolate), No Cocoa (<1%) 1701 Cane Or Beet Sugar & Chem Pure Sucrose, Solid Form (<1%)

27
Appendix C
Country Overview Tables Australia
Growth Potential 18 Business Ease, Risk 18
HS Code Title Consumption Total 21 Ed. Prep'd 46 82 22 Spirits 45 81 20 Prep Veg. 44 80 23 Food Waste 43 79 44 Wood 43 79
Brazil
Growth Potential 15 Business Ease, Risk 3
HS Code Title Consumption Total 21 Ed. Prep'd 39 57 15 Fats 38 56 22 Spirits 36 54 05 An. Prod. 36 54 10 Cereals 36 54
Spain
Growth Potential 12 Business Ease, Risk 9
HS Code Title Consumption Total 08 ED. Fruit 46 67 44 Wood 44 65 15 Fats 44 65 10 Cereals 41 62 03 Fish/Crust. 40 61
France
Growth Potential 12
Business Ease, Risk 10
HS Code Title Consumption Total
12 Misc. Seeds 48 69
21 Ed. Prep'd 46 67
23 Food Waste 44 66
3302 Beverage Mat'l 44 66
04 Dairy/Honey 44 65
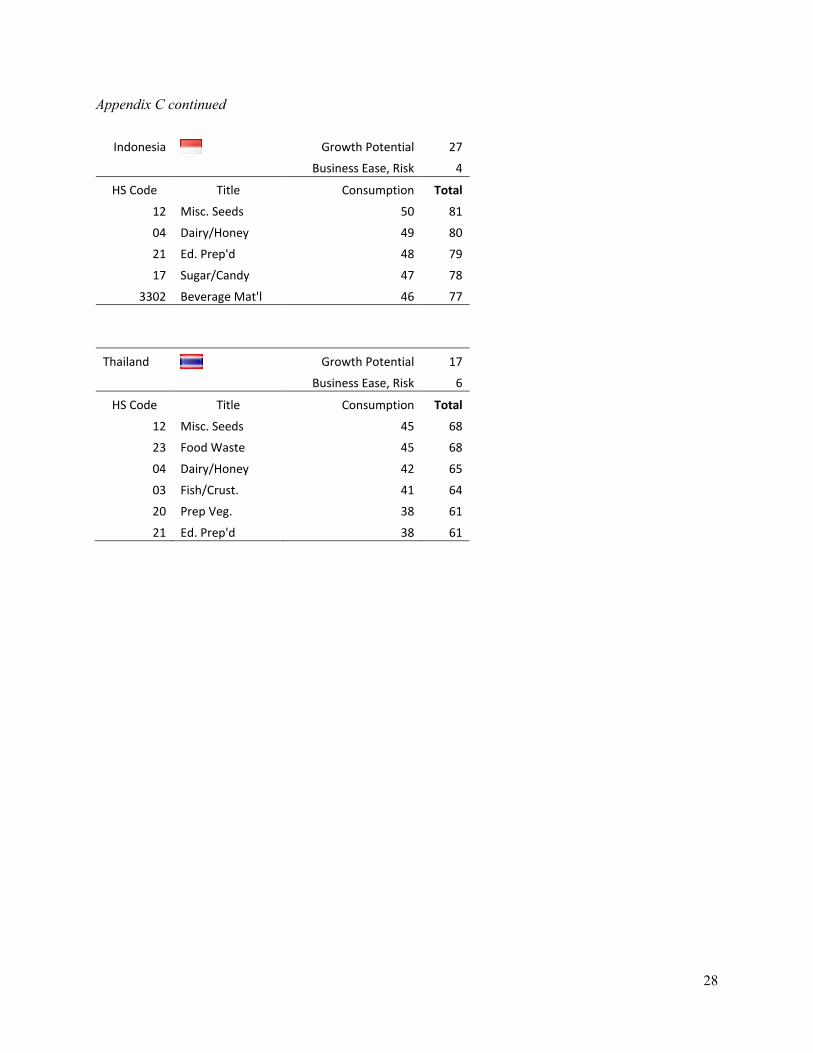
28
Appendix C continued
Indonesia
Growth Potential 27
Business Ease, Risk 4
HS Code Title Consumption Total
12 Misc. Seeds 50 81
04 Dairy/Honey 49 80
21 Ed. Prep'd 48 79
17 Sugar/Candy 47 78
3302 Beverage Mat'l 46 77
Thailand
Growth Potential 17
Business Ease, Risk 6
HS Code Title Consumption Total
12 Misc. Seeds 45 68
23 Food Waste 45 68
04 Dairy/Honey 42 65
03 Fish/Crust. 41 64
20 Prep Veg. 38 61
21 Ed. Prep'd 38 61
29
References Besley, Timothy. 2015. “Law, Regulation, and the Business Climate: The Nature and Influence of the
World Bank Doing Business Project.” Journal of Economic Perspectives 29 (3): 99–120. Corcoran, Adrian, and Robert Gillanders. 2015. “Foreign Direct Investment and the Ease of Doing
Business.” Review of World Economics 151 (1): 103–26. https://doi.org/10.1007/s10290-014-0194-5.
Fragile States Index. 2020. “Methodology.” Fragile States Index. https://fragilestatesindex.org/methodology/.
Fund for Peace. 2020. “Fragile States Index 2020.” The Fund for Peace. https://fragilestatesindex.org/excel/.
International Monetary Fund. 2021. “Real GDP Growth Annual Percent Change.” IMF. https://www.imf.org/external/datamapper/NGDP_RPCH@WEO/OEMDC/ADVEC/WEOWORLD.
Office of the Trade Representative. 2005. “United States - Australia Bilateral Free Trade Agreement - 2005.” USTR.gov. https://ustr.gov/sites/default/files/uploads/agreements/fta/australia/asset_upload_file148_5168.pd
Office of the United States Trade Representative. 2021. “Free Trade Agreements.” ustr.gov. 2021. https://ustr.gov/issue-areas/industry-manufacturing/industrial-tariffs/free-trade-agreements#:~:text=Trade%20agreements%20help%20to%20open,easily%20in%20the%20global%20marketplace.
Population Division of the Department of Economic and Social Affairs. 2019. “Average Annual Rate of Population Change (Percentage) - 2019 Revision - World Population Prospects.” United Nations. https://population.un.org/wpp/Download/Probabilistic/Population/.
Sirikeratikul, Sukanya. 2019. “Exporter Guide - Thailand.” USDA FAS. https://apps.fas.usda.gov/newgainapi/api/Report/DownloadReportByFileName?fileName=Exporter%20Guide_Bangkok_Thailand_12-31-2019.
Transparency.org. “CORRUPTION PERCEPTIONS INDEX 2020 REPORT.” n.d. Transparency.org Transparency.org. “Corruption Perception Index.” 2020. transparency.org. 2020.
https://www.transparency.org/en/cpi/2020/index/nzl. U.S. ITA. 2021a. “Best Prospect - Australia - Agriculture.” trade.gov. 2021.
https://www.trade.gov/knowledge-product/australia-agriculture. U.S. ITA. 2021b. “Best Prospect - France - Agriculture.” trade.gov. 2021. https://www.trade.gov/country-
commercial-guides/france-agricultural-sector. U.S. ITA. 2021c. “Best Prospect - Indonesia - Agriculture.” trade.gov. 2021.
https://www.trade.gov/knowledge-product/indonesia-agriculture. U.S. ITA. 2021d. “Best Prospect - Thailand - Agriculture.” trade.gov. 2021.
http://www.trade.gov/country-commercial-guides/thailand-agriculture. U.S. ITA. 2021e. “Brazil - Country Commercial Guide - Trade Barriers.” trade.gov. 2021.
trade.gov/knowledge-product/brazil-trade-barriers. U.S. ITA. n.d. “Harmonized System (HS) Codes.” Accessed February 12, 2021.
http://www.trade.gov/harmonized-system-hs-codes. U.S. ITC. 2012. “Brazil: Competitive Factors in Brazil Affecting U.S. and Brazilian Agricultural Sales in
Selected Third Country Markets.” U.S. ITC. https://www.usitc.gov/publications/332/pub4310.pdf.
UN Department of Human and Economic Affairs. 2020. “2019 Revision of World Population Prospects.” Population Dynamics. 2020. https://population.un.org/wpp/.
USDA FAS. 2017. “U.S. Ag Exporters Connect with Buyers on Trade Mission to Brazil.” usda.gov. 2017. https://www.fas.usda.gov/newsroom/us-ag-exporters-connect-buyers-trade-mission-brazil.

30
WI DATCP. “Our Services.” n.d. https://datcp.wi.gov. https://datcp.wi.gov/Pages/Growing_WI/OurServices.aspx.
WI DATCP. “Wisconsin Agricultural Statistics.” 2021. https://datcp.wi.gov. February 11, 2021. https://datcp.wi.gov/Pages/Publications/WIAgStatistics.aspx.
WI DATCP. n.d. “DATCP Home Mission, Vision and Core Values.” Wisconsin Department of Agriculture, Trade and Consumer Protection. Accessed March 1, 2021. https://datcp.wi.gov/Pages/About_Us/MissionValues.aspx.
WISERTrade. 2004. “WISERTrade Company Brochure.” WISERTrade. WISERTrade: State HS Database. n.d. “State Exports by HS Data Series.” WISERTrade. Accessed April
5, 2021. WISERTrade. “WISERTrade Methodology.” 2021. WISERTrade. March 1, 2021.
http://www.wisertrade.org/trade/docs/methodology.html. WISERTrade. “WISERTrade Methodology.” n.d. World Bank. “Ease of Doing Business Index.” The World Bank. Accessed February 8, 2021.
https://www.doingbusiness.org/en/rankings. World Bank. 2020a. “Population Ages 55-59, Male (% of Female Population).” The World Bank Group.
https://data.worldbank.org/indicator/SP.POP.5559.FE.5Y. World Bank. 2020b. “Population Ages 55-59, Male (% of Male Population).” The World Bank Group.
https://data.worldbank.org/indicator/SP.POP.65UP.TO. World Bank. 2020c. “Population Ages 60-64, Female (% of Female Population).” The World Bank
Group. https://data.worldbank.org/indicator/SP.POP.6064.FE.5Y. World Bank. 2020d. “Population Ages 60-64, Male (% of Male Population).” The World Bank Group.
https://data.worldbank.org/indicator/SP.POP.6064.MA.5Y. World Bank. 2020e. “Population, Female (% of Total Population).” The World Bank Group.
https://data.worldbank.org/indicator/SP.POP.6064.MA.5Y. World Bank. 2020f. “Population, Male (% of Total Population).” The World Bank Group.
https://data.worldbank.org/indicator/SP.POP.TOTL.MA.ZS. World Bank. 2020g. “Population, Total.” The World Bank Group.
https://data.worldbank.org/indicator/SP.POP.TOTL. World Bank. 2020h. “Poverty Headcount Ratio at $1.90 a Day (2011 PPP) (% of Population).” The
World Bank Group. https://data.worldbank.org/indicator/SI.POV.DDAY?most_recent_value_desc=false.
World Bank. 2020i. “Poverty Headcount Ratio at National Poverty Lines (% of Population).” The World Bank Group. https://data.worldbank.org/indicator/SI.POV.NAHC.
World Bank. 2020j. “REVIEW OF DATA IRREGULARITIES IN DOING BUSINESS.” World Bank Group.
World Bank. 2021. “Measuring Poverty.” https://www.worldbank.org/en/topic/measuringpoverty#2. World Integrated Trade Solutions. n.d. “Australia Non-Tariff Measures.” WITS.
https://wits.worldbank.org/tariff/non-tariff-measures/en/country/AUS.