Export Performance of China's Domestic Firms: the Role of Foreign Export Spillovers
38
CENTRE D’ÉTUDES PROSPECTIVES ET D’INFORMATIONS INTERNATIONALES No 2010 – 32 December DOCUMENT DE TRAVAIL Export performance of China’s domestic firms: the role of foreign export spillovers Florian Mayneris and Sandra Poncet
Transcript of Export Performance of China's Domestic Firms: the Role of Foreign Export Spillovers

C E N T R ED ’ É T U D E S P R O S P E C T I V E SE T D ’ I N F O R M A T I O N SI N T E R N A T I O N A L E S
No 2010 – 32December
DO
CU
ME
NT
DE
TR
AV
AI
L
Export performance of China’s domestic firms: the roleof foreign export spillovers
Florian Mayneris andSandra Poncet

CEPII, WP No 2010 – 32 Export performance of China’s domestic firms: the role of foreign export spillovers
TABLE OF CONTENTS
Non-technical summary . . . . . . . . . . . . . . . . . . . . . . . . . . . 3Abstract . . . . . . . . . . . . . . . . . . . . . . . . . . . . . . . . . 4Résumé non technique . . . . . . . . . . . . . . . . . . . . . . . . . . . 5Résumé court . . . . . . . . . . . . . . . . . . . . . . . . . . . . . . . 61. Introduction . . . . . . . . . . . . . . . . . . . . . . . . . . . . . . 72. Data and indicators . . . . . . . . . . . . . . . . . . . . . . . . . . . 10
2.1. Trade data sources . . . . . . . . . . . . . . . . . . . . . . . . . . 102.2. Empirical approach . . . . . . . . . . . . . . . . . . . . . . . . . 102.3. Explained variable: creation of new export linkages . . . . . . . . . . . . 112.4. Foreign export spillovers and control variables. . . . . . . . . . . . . . . 12
3. Estimation of foreign export spillovers . . . . . . . . . . . . . . . . . . . 163.1. Nature of foreign export spillovers . . . . . . . . . . . . . . . . . . . 163.2. Ordinary versus processing trade . . . . . . . . . . . . . . . . . . . . 20
4. Heterogeneity of foreign export spillovers . . . . . . . . . . . . . . . . . . 224.1. Robustness checks . . . . . . . . . . . . . . . . . . . . . . . . . . 224.2. Foreign export spillovers and product sophistication . . . . . . . . . . . . 244.3. Foreign export spillovers and sophistication gap . . . . . . . . . . . . . . 26
5. Conclusion . . . . . . . . . . . . . . . . . . . . . . . . . . . . . . 286. References . . . . . . . . . . . . . . . . . . . . . . . . . . . . . . 297. Appendix . . . . . . . . . . . . . . . . . . . . . . . . . . . . . . . 31List of working papers released by CEPII . . . . . . . . . . . . . . . . . . . . 33
2

CEPII, WP No 2010 – 32 Export performance of China’s domestic firms: the role of foreign export spillovers
EXPORT PERFORMANCE OF CHINA’S DOMESTIC FIRMS: THE ROLE OF FOREIGNEXPORT SPILLOVERS
NON-TECHNICAL SUMMARY
In this paper we seek to understand what is driving the diversification of exports into new (more sophis-ticated) goods focusing on the possibility that foreign firms act as export catalysts, fostering the creationof new export transactions by domestic firms. There is growing evidence that most of Chinese exportrise is due to foreign firms. Several studies argue that foreign firms, typically engaged in processingtrade, fully drive the skill content upgrading of exports observed in China (Amiti and Freund, 2010; Xuand Lu, 2009). Amiti and Freund (2010) find that the skill content of China’s manufacturing exportsremained unchanged once processing trade is excluded.
Growing evidence of FDI spillovers point at the possibility that foreign exporters presence benefit todomestic firms indirectly. Possible channels are information externalities, cost-sharing opportunitiesand mutualized actions on export markets. Being close to foreign exporters may facilitate the flow ofexport-specific information, valuable to domestic firms seeking international outlets for their products.The literature so far (see Görg and Greenaway (2004) for a survey) has used rather aggregated industry-level information (2-digit to 4-digit ISIC) instead of fine product level customs nomenclature. Moreover,none of these papers exploit the information on the destination country of exports. Yet, export spillovershave been shown to be stronger when product and destination specific. Based on French firm-levelexport data, Koenig et al. (2010) show that export spillovers (although they do not distinguish betweenexport activity in MNEs and domestic firms) are stronger when they are product and destination specific,while they are not significant when considered on all products-all destinations.
Our study further departs from the previous literature by looking at the decision to start exporting, andnot just the export status. Focusing on the creation of new export linkages is consistent with our focuson the impact of FDI as a catalyst for upgrading the export portfolio of domestic firms. Concretely, weuse provincial data at a much more disaggregated product dimension (HS 4-digit), and we exploit infor-mation on the destination country of exports over the period 1997-2007. We believe that exploitationof the detailed product and destination information provide two benefits. First, it allows to investigatespillovers at a more adequate level. Indeed, informational flows are likely to be product and countryspecific. Second, it provides us valuable information to assess the nature of spillovers. We will discrim-inate between aggregate foreign presence likely to provide direct productivity gains to domestic firmsand export spillovers (informational gains) that are likely to be product-destination specific. We believeour study makes three additional contributions. First, we differentiate between ordinary and processingtrade in order to see which trade type is more likely to generate and benefit from export spillovers. Sec-ond, we study whether export benefits from foreign exporters depend on the technology-content of theexported goods. We aim at verifying that positive information spillovers might be more intense for moresophisticated products. Since Jarreau and Poncet (2010) have shown that the sophistication of domesticexports positively impacts on GDP per capita growth at the province level, this would point at an indirectrole of multinational firms on local growth. Third, we investigate the potential conditionality of foreignexport spillovers, depending on the technology gap between foreign and domestic firms. Assuming thatthe capacity to absorb and exploit information on export opportunities depends on the technological
3

CEPII, WP No 2010 – 32 Export performance of China’s domestic firms: the role of foreign export spillovers
distance between the domestic firm and the foreign source of inspiration, foreign export spillovers areexpected to be higher when the technological leadership of foreign firms is not too high.
Our results indicate that domestic firms’ capacity to start exporting a given product to a given countrypositively relates to the export performance of neighboring foreign firms for that same product-countrypair. We find that foreign export spillovers are limited to the ordinary trade activities of foreign firms.Processing trade activities do not generate export spillovers. More, export spillovers are stronger forsophisticated products, indicating that proximity to foreign exporters may help domestic exporters toupgrade their exports. However we observe that foreign export spillovers are weaker when the tech-nology gap between foreign and domestic firms is large, suggesting that the enlargement of the exportportfolio of domestic Chinese firms may not occur in locations and sectors where foreign firms havealready a strong edge.
ABSTRACT
We investigate how the creation of new export linkages (extensive margin of trade) by domestic firmsin China is influenced by their proximity to multinational exporters. Using panel data from Chinesecustoms for 1997-2007, we show that there is evidence that domestic firms’ capacity to start exportingnew varieties to new markets positively relates to the export performance of neighboring foreign firmsfor that same product-country pair. We find that foreign export spillovers are limited to ordinary tradeactivities. No foreign export spillovers are found for processing trade. More, export spillovers arestronger for sophisticated products indicating that proximity to foreign exporters may help domesticexporters to upgrade their exports. However we observe that foreign export spillovers are weaker whenthe technology gap between foreign and domestic firms is large, suggesting that upgrading may notoccur in locations and sectors where foreign firms have already a strong edge.
JEL Classification: F1
Keywords: Export performance, spillovers
4

CEPII, WP No 2010 – 32 Export performance of China’s domestic firms: the role of foreign export spillovers
LA PERFORMANCE EXPORTATRICE DES ENTREPRISES CHINOISES DOMESTIQUES:L’INFLUENCE DES ENTREPRISES ÉTRANGÈRES
RÉSUME NON TECHNIQUE
Dans cet article, nous étudions les déterminants de la diversification des exportations vers de nouveauxproduits (plus sophistiquées) et notamment la possibilité que les entreprises étrangères environnantesagissent comme des catalyseurs à l’exportation, favorisant la création de nouvelles transactions d’ex-portation par les entreprises nationales. Différents travaux indiquent que la hausse des exportations chi-noises est en grande partie attribuable aux entreprises étrangères. Plusieurs études font valoir que lesentreprises étrangères, généralement engagées dans le commerce d’assemblage, sont à l’origine de laplupart de l’amélioration du contenu des exportations observée en Chine (Amiti et Freund, 2010 ; Xu etLu, 2009). Amiti et Freund (2010) trouve que le niveau technologique des exportations manufacturièresde la Chine est en fait resté inchangé une fois que l’on exclut le commerce de transformation.
Différentes preuves des retombées positives des investissements directs étrangers (IDE) suggèrent lapossibilité d’un impact indirect des exportateurs étrangers sur la performance exportatrice domestique.Des canaux possibles sont les externalités d’informations, le partage de coûts et la mutualisation d’ac-tions sur les marchés d’exportation. Etre proche d’exportateurs étrangers peut faciliter la circulationd’informations précieuses pour les entreprises nationales en quête de débouchés internationaux pourleurs produits. La littérature existante sur ce sujet (voir Görg et Greenaway (2004) pour une revue) uti-lise principalement des données agrégées notamment la nomenclature SITC à 2 chiffres ou 4 chiffresau lieu de données plus désagrégés comme la nomenclature douanière. En outre, elle n’exploite pas lesinformations sur le pays de destination des exportations. Pourtant, les externalités à l’exportation se sontavérées être plus fortes quand elles sont spécifiques au produit et à la destination. A partir de donnéesd’exportations françaises au niveau des entreprises, Koenig et al. (2010) montre que les externalités àl’exportation (bien qu’ils ne distinguent pas l’activité d’exportation des entreprises multinationales decelles des entreprises nationales) sont plus fortes quand elles sont spécifiques au produit et à la desti-nation, alors qu’elles ne sont pas importantes quand elles sont considérées tous produits et / ou toutesdestinations.
Notre étude s’écarte encore de la littérature précédente en examinant la décision de commencer à expor-ter, et pas seulement le statut d’exportation. Mettre l’accent sur la création de liens nouveaux à l’expor-tation est cohérent avec notre accent sur l’impact des IDE en tant que catalyseur pour l’exportation desentreprises nationales. Concrètement, nous utilisons des données provinciales au niveau produit relative-ment fin (nomenclature à 4 chiffres), et nous exploitons des informations sur le pays de destination desexportations sur la période 1997-2007. Ce choix a deux avantages. Premièrement, il permet d’étudier lesretombées à un niveau plus adéquat. En effet, les flux d’information sont susceptibles d’être spécifique auproduit et au pays. Deuxièmement, il nous fournit de précieuses informations pour évaluer la nature desretombées. Nous distinguons entre l’impact global de la présence étrangère sur les entreprises nationales(notamment l’effet de concurrence ou de productivité) et leur influence spécifique en termes d’exporta-tion (les gains d’information) qui est susceptible d’être spécifique au produit-destination. La contributionde notre étude est de trois ordres. Tout d’abord, nous distinguons entre le commerce ordinaire et celui
5

CEPII, WP No 2010 – 32 Export performance of China’s domestic firms: the role of foreign export spillovers
d’assemblage afin de voir quel type de commerce est plus susceptible de générer et de profiter des exter-nalités à l’exportation. Deuxièmement, nous étudions si ces retombées en provenance des exportateursétrangers dépendent du contenu technologique des marchandises exportées. Notre objectif est de véri-fier que les externalités à l’exportation existent bien pour les produits les plus sophistiqués. Jarreau etPoncet (2010) ayant montré que la sophistication des exportations nationales a un impact positif sur lacroissance du PIB par habitant au niveau de la province, l’observation d’externalités positives pour desproduits sophistiqués suggérerait un possible rôle indirect des entreprises multinationales sur la crois-sance locale. Troisièmement, nous étudions comment les externalités à l’export dépendent de l’écarttechnologique entre les entreprises étrangères et nationales. En supposant que la capacité d’absorberet d’exploiter des informations sur les possibilités d’export dépend de la distance technologique entrel’entreprise étrangère source et l’entreprise nationale récipiendaire, on s’attend à ce que les possibilitésd’externalités soient plus élevées lorsque le leadership technologique des entreprises étrangères n’estpas trop élevé.
Nos résultats indiquent que la capacité des entreprises nationales à exporter un produit donné vers unpays donné dépend positivement de la performance à l’exportation des entreprises étrangères voisinespour cette même paire de produit-pays. Nous trouvons que les externalités d’exportation sont limitéesaux activités commerciales ordinaires des sociétés étrangères, les activités commerciales d’assemblagene générant pas d’effet. Les externalités apparaissent en outre plus fortes pour les produits sophistiqués,ce qui indique que la présence d’exportateurs étrangers peut aider les exportateurs nationaux à monteren gamme. On observe cependant que les externalités à l’exportation sont plus faibles lorsque l’écarttechnologique entre les entreprises étrangères et nationales est important, ce qui suggère que l’élargisse-ment du portefeuille d’exportation des entreprises nationales chinoises ne peut pas se produire lorsqueles entreprises étrangères ont déjà une forte avance.
RÉSUMÉ COURT
Nous étudions comment la création de liens nouveaux à l’exportation (marge extensive du commerce)par les entreprises nationales en Chine est influencée par leur proximité aux exportateurs étrangers. Enutilisant des données de panel de douanes chinoises pour la période 1997-2007, nous montrons que lacapacité des entreprises nationales à exporter de nouvelles variétés vers de nouveaux marchés dépendpositivement de la performance à l’exportation des entreprises étrangères environnantes pour cette mêmepaire de produit-pays. Nous trouvons que les externalités d’exportation sont limitées aux activités com-merciales ordinaires des sociétés étrangères, les activités commerciales d’assemblage ne générant pasd’effet. Les externalités apparaissent en outre plus fortes pour les produits sophistiqués, ce qui indiqueque la présence d’exportateurs étrangers peut aider les exportateurs nationaux à monter en gamme. Onobserve cependant que les externalités à l’exportation sont plus faibles lorsque l’écart technologiqueentre les entreprises étrangères et nationales est important, ce qui suggère que l’élargissement du porte-feuille d’exportation des entreprises nationales chinoises ne peut pas se produire lorsque les entreprisesétrangères ont déjà une forte avance.
Classification JEL : F1
Mots clés : Performance à l’exportation, externalités à l’export.
6

CEPII, WP No 2010 – 32 Export performance of China’s domestic firms: the role of foreign export spillovers
EXPORT PERFORMANCE OF CHINA’S DOMESTIC FIRMS: THE ROLE OF FOREIGNEXPORT SPILLOVERS
Florian Mayneris∗
Sandra Poncet†
1. INTRODUCTION
There is growing evidence that most of Chinese export rise is due to foreign firms. The shareof foreign enterprises in China’s exports has increased speedily from 26 percent in 1992 to 57percent in 2007 (China Statistical yearbook, 2008). This domination is even stronger for hightechnology products. The share of foreign firms rose from 68 percent to 84 percent over theperiod. Several studies argue that foreign firms, typically engaged in processing trade, fullydrive the skill content upgrading of exports observed in China (Amiti and Freund, 2010; Xuand Lu, 2009).1 Amiti and Freund (2010) find that the skill content of China’s manufactur-ing exports remains unchanged once processing trade is excluded. However, estimations ofgrowth equations indicate that income gains from export performance and export upgradingare confined to improvements made by domestic firms. Jarreau and Poncet (2009) find that thepositive association between GDP per capita growth and export sophistication at the provincelevel is limited to ordinary export activities undertaken by domestic firms. While there are nodirect gains from foreign firms export upgrading, there may still be room for indirect effects offoreign firms on domestic ones through emulation or export spillovers. By favoring the entryof domestic firms on export markets for more sophisticated goods, foreign firms could havean indirect impact on GDP per capita growth in Chinese provinces. In this paper we focus onthe possibility that foreign firms act as export catalysts, fostering the creation of new exporttransactions by domestic firms. We also investigate the heterogeneity of these export spilloversfrom foreign firms according to the sophistication of exported products.
Since the pioneering study of Caves (1974), the existence of FDI spillovers has been widelyinvestigated (Crespo and Fontoura, 2006). Most studies, whether applied to China or not, havefocused on the spillovers from foreign to domestic firms in terms of productivity. The empiricalevidence surveyed in Görg and Greenaway (2004) and Blomström and Kokko (1998) is mixed.In the Chinese context, while several articles suggest a significant and positive impact of foreignpresence on domestic firms’ productivity (Cheung and Lin, 2004; Liu, 2001; Li et al., 2001; Hu
∗IRES, CORE, Université catholique de Louvain; ([email protected])†Sandra Poncet Paris School of Economics, Université Paris I and CEPII, 9 rue George Pitard, 75015 Paris.
([email protected]).1Xu and Lu (2009) find that previous results on the insignificant role of foreign firms and processing trade on
Chinese export sophistication (Wang and Wei, 2010) may be due to the heterogeneity of Foreign Direct Investment(in terms of origin and contract form). They find that FDI matters for China’s exports upgrading when it originatesfrom OECD countries and comes under the form of wholly foreign owned enterprises.
7

CEPII, WP No 2010 – 32 Export performance of China’s domestic firms: the role of foreign export spillovers
and Jefferson, 2002), Hale and Long (2010) argue that the effect disappears when the varioussources of estimation biases are controlled for (aggregation bias, selection bias, downward biasin standard errors).
Here, we concentrate on another source of benefits stemming from foreign presence, exportspillovers. We investigate the presence of foreign export spillovers on the extensive marginof domestic firms, that is their creation of new trade transactions. This focus is coherent withour interest in the determinants of export upgrading of Chinese domestic firms. We seek tounderstand what drives the diversification of exports into new (more sophisticated) goods. Ourapproach is complementary to studies on the export quality of domestic firms (Harding andSmarzynska Javorcik, 2010).2 Using data on Chinese exports at the city-product level, Chenand Swenson (2009) suggest that proximity to multinational firms is associated with higherquality (unit value) of new export transactions by domestic private Chinese traders. Bloningenand Ma (2010) find nevertheless that the share of foreign firms in Chinese exports by productcategory as well as the ratio of foreign to domestic unit values are increasing over time, bothresults running against the idea that Chinese firms are catching up.
In the economic literature, growing evidence has emerged on positive export spillovers fromforeign to domestic firms. Possible channels are information externalities, cost-sharing op-portunities and mutualized actions on export markets. Being close to foreign exporters mayfacilitate the flow of export-specific information, valuable to domestic firms seeking interna-tional outlets for their products. In a pioneer study, Aitken et al. (1997) find that the exportdecision of local firms in Mexico in the period 1986-1990 is positively influenced by the prox-imity to multinational exporters, even after controlling for the overall industrial activity in theregion and for local export concentration. The role of foreign exporting firms as “catalysts”for domestic exporters has since been confirmed by Kneller and Pisu (2007) on UK data andKemme et al. (2009) on India.3 By contrast, Barrios et al. (2003) do not find clear evidenceof such export spillovers from foreign firms in Spain, while Ruane and Sutherland (2005) findthat the export intensity of foreign-owned enterprises is negatively associated with the exportdecision and export intensity of domestic firms in Irish manufacturing. They argue that thisresult suggests that no (and even negative) export spillovers derive from third-country export-platform FDI. This prediction bodes ill for China where foreign firms are mostly engaged inprocessing trade.
2Harding and Smarzynska Javorcik (2010) find, based on a panel of 116 countries over the period 1984-2000, apositive effect of FDI on unit values of exports in developing countries, but not in developed countries, suggestingthat FDI can help bridge the technological gap in production and marketing techniques between developing andhigh income countries. Our paper is applied to China, the country that everyone has in mind when thinking of thecapacity to rapidly upgrade in international markets. Also, contrary to most studies, the Chinese data allow to focusnot only on FDI per se but on export activities of foreign companies. Since we also have information on exportsrealized by domestic producers, our analysis can differentiate between the upgrading induced by multinationalsthemselves and that resulting from the past experience of domestic firms.
3Kokko et al. (2001) also investigate the existence of spillovers from MNEs on the export decision of domesticfirms in Uruguay, using cross-sectional firm-level data for 1998. However, their measure of spillovers is a simplemeasure of the presence of multinationals (not export activity) in terms of the output share of MNEs in an industry.The measured impact of multinationals’ presence could thus be due to R&D spillovers for example and not toexport spillovers.
8

CEPII, WP No 2010 – 32 Export performance of China’s domestic firms: the role of foreign export spillovers
However, it is noteworthy that these papers use rather aggregated industry-level information(2-digit to 4-digit ISIC) instead of fine product level customs nomenclature. Moreover, none ofthese papers exploit the information on the destination country of exports. Yet, export spillovershave been shown to be stronger when product and destination specific. Based on French firm-level export data, Koenig et al. (2010) show that export spillovers are magnified when theyare product and destination specific, while they are not significant when considered on allproducts-all destinations. Our study further departs from the previous literature by lookingat the decision to start exporting, and not just the export status. Focusing on the creation of newexport linkages is consistent with our focus on the impact of FDI as a catalyst for upgradingthe export portfolio of domestic firms.
In the context of China, three studies (Ma, 2006; Swenson, 2008; Chen and Swenson, 2009)investigate export spillovers emanating from foreign firms. Ma (2006) studies how the proba-bility that a province exports in a given 2-digit SITC industry relates to the contemporaneousforeign export activity concentration in this industry. Her probit estimations over the period1993 to 2000 suggest some positive link. Swenson (2008) focuses on the city-level value (orcount) of the new HS2 product trade transactions made by private firms between 1997 and2003. She finds a positive impact of same HS2 foreign export value (or count) in the previousyear. Finally, Chen and Swenson (2009) show that, within a HS2 product-category, the numberof new trade transactions is positively influenced by the level of exports or the count of exporttransactions made by multinational firms at the HS2-city level. These papers have two maincharacteristics in common: while the information is available at a finer product category, theyre-aggregate the data and measure export spillovers at a broader activity level (less than 100categories); they moreover do not investigate the specificity of export spillovers according tothe destination country of exports.
In our paper, we use provincial data at a much more disaggregated product dimension (12134-digit HS), and we exploit information on the destination country of exports over the period1997-2007. We believe that exploitation of the detailed product and destination informationprovide two benefits. First, it allows to investigate spillovers at a more adequate level. Indeed,informational flows are likely to be product and country specific. Second, it helps to assessthe nature of spillovers. We will discriminate between aggregate foreign presence likely toprovide direct productivity gains to domestic firms and export spillovers (informational gains)that are likely to be product-destination specific. We believe our study makes three additionalcontributions. First, we differentiate between ordinary and processing trade in order to seewhich trade type is more likely to generate and benefit from export spillovers. Second, westudy whether export benefits from foreign exporters depend on the technology-content of theexported goods. We aim at verifying that positive information spillovers might be more intensefor more sophisticated products. Since Jarreau and Poncet (2009) have shown that the sophis-tication of domestic exports positively impacts on GDP per capita growth at the province level,this would point at an indirect role of multinational firms on local growth. Third, we investi-gate the potential conditionality of foreign export spillovers, depending on the technology gapbetween foreign and domestic firms. Assuming that the capacity to absorb and exploit informa-tion on export opportunities depends on the technological distance between the domestic firm
9

CEPII, WP No 2010 – 32 Export performance of China’s domestic firms: the role of foreign export spillovers
and the foreign source of inspiration, foreign export spillovers are expected to be higher whenthe technological leadership of foreign firms is not too high.
Using panel data from Chinese customs for 1997-2007, we show that domestic firms’ capac-ity to start exporting new varieties to new markets positively responds to the export activityof neighboring foreign firms for that same product-country pair. We find that foreign exportspillovers are limited to ordinary trade activities. No foreign export spillovers are found forprocessing trade. More, export spillovers are stronger for sophisticated products indicating thatproximity to foreign exporters may help domestic exporters to upgrade their exports. Howeverwe observe that foreign export spillovers are weaker when the technology gap between foreignand domestic firms is large, suggesting that upgrading may not occur when foreign firms havealready a strong edge.
The rest of the paper is organized as follows. Section 2 describes the data, our empiricalapproach, and our measure of export spillovers. Section 3 presents and discusses our results.Section 4 concludes.
2. DATA AND INDICATORS
2.1. Trade data sources
The main data source is a database collected by the Chinese Customs. It contains Chineseexport flows aggregated by province, year, product and destination country, over the 1997-2007 period.4 In our estimations, we explain the creation of new export linkages based on aproduct classification at the 4-digit level. A feature of interest to us in this dataset is that itallows to differentiate between domestic and foreign trading firms, and between processingtrade and ordinary trade.5 Processing trade includes all trade flows by firms operating in theassembly sector, that is, importing inputs to process them in China and re-export the finishedproducts (these producers benefit from a preferential tax regime on imported inputs). We canimagine that firms engaged in this kind of activity are less embedded in their local environment,and consequently generate less (and possibly benefit less from) externalities.
2.2. Empirical approach
Our estimations focus on the impact of foreign firms’ export activities on the creation of newtrade linkages by Chinese domestic firms. The creation of a new linkage (product k/countryj) by domestic firms of province i at year t + 1 is regressed on our proxy of foreign export
4The original data are identified by a 8-digit code. As there were major reclassifications in the international HS6-digit classifications in 1996 and 2002, we convert them to the same HS 6-digit classifications used in 1992,to avoid problems related to codes reclassification. In order to avoid classifying a product as a new variety justbecause there has been a new product code or previous codes were split, we drop product lines that changedclassification at the 6-digit level over the period due to nomenclature changes.
5The data also refer to a third category (“Others”) that groups other flows such as aid, border trade and consign-ment, representing overall less than 1% of total trade value in each year. When considering the processing/ordinarytrade distinction, this category is dropped.
10

CEPII, WP No 2010 – 32 Export performance of China’s domestic firms: the role of foreign export spillovers
spillovers in the previous year t and various controls (measured in t and in t− 1). The relationwe finally bring to data is the following:
Prob(new dom. linkikj,t+1)=Prob(αforeign_spillikj,t+β1Zj,t+β2Zj,t−1+ηikj +µt+εikj,t > 0)(1)
The identification of foreign export spillovers in China relies on a conditional logit estimation,all regressions including fixed effects at the province-product-country level ηikj . Year fixedeffects µt are also added. The foreign export spillovers are thus identified based on the within(time) dimension of our data. Time invariant aspects such as bilateral trading distance, productspecificity, province geography are hence controlled for. The conditioning set Z is describedbelow in Section 2.4. It is made of three categories of variables. First, following the gravityliterature, we control for demand side determinants of new export linkages by introducing des-tination country demand and GDP per capita. Second, we control for supply side determinantsby introducing proxies for provincial and Chinese comparative advantages and export inten-sity. Third, since we are worried that the decision to start exporting by domestic firms capturesthe intrinsic dynamics at the product level or country level, we include the lag of all the vari-ables described above that aim at capturing local and Chinese export intensity at the product ordestination country level.
2.3. Explained variable: creation of new export linkages
We investigate the determinants of new export transactions by Chinese domestic firms. Wemeasure the creation of a new export transaction as a dummy which takes the value 1 if domes-tic firms in a province i start exporting product k at time t to country j and 0 otherwise. Werestrict our sample to province-product-country series of zeros followed by a decision to startexporting. For a given province-product-country we can have several starts. As in Koenig etal. (2010), ceasing and continuing export flows are not explained. For example, the subsequentexport statuses 00011001111 become in our sample .001..01..., with . denoting a missing value.Note that all our results are robust when we consider “durable starts” only, that is cases corre-sponding to provinces that start exporting a product to a country for at least two years (codedin the data as a sequence “011”).6
We construct a specific database, incorporating the set of alternatives faced by each province.For a given province, these are defined as the product-country pairs for which we observe atleast one export start over the 1997-2007 period.7 Since our estimations will include province-product-country fixed-effects, taking into account a broader definition of possible exported
6These results are available upon request.7since we are interested in the probability that a province starts exporting a given product to a given country,
all province-product-destination country triads for which we observe positive domestic export flows in each yearof the period are excluded from our sample by definition. Regarding triads for which we do not observe anypositive domestic export flow, they could be, strictly speaking, taken into account. However, two main issuesarise: first, from a computational point of view, this would increase dramatically the number of observations sothat the database would become hardly tractable. Second, from an economic point of view, it is absolutely notsure that a province can potentially export all the products to all the countries. There can be good reasons why we
11

CEPII, WP No 2010 – 32 Export performance of China’s domestic firms: the role of foreign export spillovers
Table 1 – Summary statistics on domestic exports and foreign presence: number of observa-tionsYear Domestic Exports>0 Domestic Exports==0 Total
Foreign Exports Share Foreign Exports Share=0 >0 Foreign export>0 =0 >0 Total Foreign export>0
1997 148728 40780 0.215 837730 22918 1050156 0.0612000 205471 59359 0.224 757474 27852 1050156 0.0832003 255308 88998 0.258 669855 35995 1050156 0.1192006 354655 141129 0.285 509791 44581 1050156 0.177Total 2730325 957461 0.260 7493638 370292 11551719 0.115
Table 2 – Summary statistics on domestic starts and foreign presence: number of observationsYear Domestic Starts=1 Domestic starts=0 Total
Foreign Exports Share Foreign Exports Share=0 >0 Foreign export>0 =0 >0 Total Foreign export>0
1997 78130 5688 0.068 759600 17230 860648 0.0272000 100001 7889 0.073 657473 19963 785326 0.0352003 136288 11211 0.076 533567 24784 705850 0.0512006 146317 13001 0.082 363474 31580 554372 0.080Total 1174078 94690 0.075 5833347 226741 7328856 0.044
products or destination countries would not change the final sample used for the estimations.Our dataset covers 220 countries and 1213 HS4 products. As reported in Table 1, it includes1,050,516 observations each year, resulting in a total of 11,551,719 (province/product/country/year)observations over the period 1997-2007. Around 32% of our observations correspond to strictlypositive export flows by domestic firms.
We identify, as shown in Table 2, a total of 1,268,768 export starts by domestic firms.
2.4. Foreign export spillovers and control variables
In our empirical analysis, we explain the probability that domestic firms in province i startexporting a product k to country j in year t + 1 on various characteristics of the province i,product k and country j at time t. The structure and the determinants of international trade flowsare now commonly studied using gravity equations. We detail in this section the explanatoryvariables we take into account in this gravity framework.
Foreign export spillovers
Our focus is on export spillovers, that are supposed to reduce the bilateral fixed export cost.There are two channels through which export spillovers can act: foreign firms can bring spe-cific information on export markets, valuable to domestic firms to pay their fixed export cost
do not observe any positive domestic export flow for a given province-product-destination country triad over theperiod, these reasons being not directly linked to export spillovers from foreign firms (provincial specializations,geopolitics etc.).
12

CEPII, WP No 2010 – 32 Export performance of China’s domestic firms: the role of foreign export spillovers
(information about the tastes of foreign consumers, on the distribution networks abroad etc.).On the other hand, it could be the case that export spillovers are linked to the mutualizationof some fixed export costs (participation to international fares, marketing etc.). In both cases,export spillovers could be linked to the presence of foreign exporters per se and/or to the valueof exports by foreign firms. We thus decompose foreign export spillovers in a province intoa dummy that identifies the presence of foreign exporters and the log of the value of exportsmade by foreign firms. As displayed in Table 1, 11.5% of the observations in our sample havenon-null product-country specific foreign export flows. The share rises to 26% if we considerobservations for which domestic firms report positive exports. When focusing on domesticstarts, we compute in Table 2 that foreign firms export the same product to the same countrythe previous year in 7.5% of the cases. Table 9 in the Appendix indicates that the proportionis 69.8% when considering non-null foreign exports of the same product to other countries and88.63% when looking at non-null foreign exports of other products to the same country.
We follow Koenig et al. (2010) and consider different types of spillovers. Depending on thetype of information needed to enter successfully on export markets, the export spillovers couldbe destination specific, product specific or both. For a given triad province-product-destinationcountry ikj, we thus distinguish four types of spillovers: product (HS4) and destination countryspecific (presence in province i of foreign firms exporting product k to country j and valueof these exports), country specific (presence in province i of foreign firms exporting otherproducts than k to country j and value of these exports), product specific (presence in provincei of foreign firms exporting product k to countries other than j and value of these exports) andgeneral spillovers (presence in province i of foreign firms exporting other products than k toother countries than j and value of these exports). In our estimations, the coefficient on thesespillovers variables will capture the net effect of the positive externalities described above andsome negative effects, such as the competition exerted by foreign firms on domestic ones onlocal labor markets (possibly increasing wages) and congestion effects, such as the possiblesaturation of transport infrastructures etc.
Time-invariant determinants of exports
Several determinants, invariant across time, can explain the ability of firms in province i toexport product k to country j, whether they are domestic or foreign. Not controlling for thesedeterminants would bias our estimation of foreign export spillovers. First, province i can havebetter transport infrastructure for example, which will impact, all over the period, on the exportperformance of domestic firms located in province i, whatever their activity and the coun-tries they trade with. It can also influence the attractiveness of the province in terms of FDIand the ability of foreign firms to export. Second, province i can have specific relationshipswith country j, due to distance, to migrants networks, to the presence of a common border, tospecific business partnerships between provincial authorities and country j etc. Again, thesenon-observed determinants, specific to the dyad ij, can impact on the export performance ofboth domestic and foreign firms. Third, province i can have a comparative advantage in productk, due to a specific ability developed across time or to specific development strategies imple-mented by local authorities. This would affect the export activities of both domestic and foreign
13

CEPII, WP No 2010 – 32 Export performance of China’s domestic firms: the role of foreign export spillovers
firms.
In order to take into account these unobserved determinants of export performance of domesticand foreign firms at the local level, we introduce a fixed effect for each triad province i-productk-destination country j.
This empirical strategy raises some issues about the interpretation of our results on exportspillovers. First, given the definition of our dependent variable, the inclusion of the fixed effectmeans that we are in reality interested in the timing of entry: conditioning on the fact thatdomestic firms of province i will start exporting product k to country j over the period, werelate the year of entry to the evolution of export activities of foreign firms in the province.Second, our empirical approach exploits the within dimension of our data and is thus focusedon short-run determinants of the entry on export markets. Indeed, we study how the creation ofexport linkages by domestic firms in t+1 can be explained by the activity of surrounding foreignexporters in year t, once time-invariant province-product-country fixed effects are controlledfor. We believe that this approach is interesting, especially from a public policy point of view,since policy-makers, when implementing strategies aimed at attracting FDI, generally expectquick returns to investment. However, the impact of foreign firms could be different in thelong-run: a positive impact of foreign exporters on the probability that domestic firms startexporting in the short-run could become null or negative in the long-run if foreign firms exerta competitive pressure on local wages or on foreign markets, forcing domestic firms to exitexport markets more rapidly. In the case of China however, Chen and Swenson (2009) showthat the presence of foreign exporters positively impact on the duration of new export flows,casting doubt on the existence of strong negative effects of foreign firms in the long-run.
Time-varying determinants of exports
Our empirical approach so far does not account for determinants of the entry on export marketsthat vary across time, such as the foreign partner’s demand. We need to account for the demandcapacity of the destination country at the product level, which may determine simultaneouslyforeign and domestic export performance. The country’s import value defined at the 4-digitproduct level is taken from the BACI world trade dataset.8 Our regressions will also includethe GDP per capita of the importing country.9
Although the province-product-destination country fixed effects control for specific ability ofprovince i for product k that is fixed over time, they do not account for the reshaping of China’scomparative advantages relating to its rapid economic transformation and liberalization overthe period 1997-2007, among which the entry in WTO. To control for time varying compara-tive advantages, we further introduce the log of province total export sales, province-productexport sales and China-product export sales in year t. Since we also include year fixed effects
8This dataset, which is constructed using COMTRADE original data, provides bilateral tradeflows at the 6-digit product level (Gaulier and Zignago, 2010). BACI is downloadable fromhttp://www.cepii.fr/anglaisgraph/bdd/baci.htm.
9World countries real GDP per capita in PPP are taken from the World Development Indicators database (WorldBank).
14

CEPII, WP No 2010 – 32 Export performance of China’s domestic firms: the role of foreign export spillovers
that account for the evolution of total Chinese exports, controlling for these variables amountsto introducing the elements of a Balassa index of “revealed comparative advantage” at theprovince-product level. Indeed, the Balassa index is calculated as follows:
Bijt =Xikt/Xit
XChina,kt/XChina,t
(2)
where X denotes exports. An increase of the Balassa index reflects an increased comparativeadvantage of province i in product k, with respect to the rest of China. Since we introduce theelements of the Balassa separately, each of them controls for the fact that a potential positiveassociation between the export activity of foreign firms and the probability that domestic firmsstart exporting simply reflects a specific ability of export activities in the province or in China.We also introduce total exports of province i to country j and total Chinese exports to countryj to control for specific relationships between the province/China and the destination country.This is important given the use of business and trade agreements by Chinese authorities tomanage their diplomacy. Finally, we also control for province GDP per capita to take intoaccount supply-side determinants of exports such as workers’ skills.10
We need to make sure that our results are not biased because our measure of multinational pres-ence proxies for omitted unobservable growth in local economic opportunities at the product-level or destination country-level. Indeed, China has grown dramatically over the 1997-2007period and the entry of domestic firms on foreign markets could be driven not only by cur-rent comparative advantages but by specific trends. We thus include the lagged value of allfour variables described above (HS4 world demand of country j, total exports of the province,product-level exports of the province, country-level exports of the province). We also includethe lagged value of China’s exports at the product level and the lagged value of China’s exportsat the destination level to account for overall Chinese dynamics specific to the product and thedestination country respectively.
Last, in order to further verify that our foreign export spillovers are not simply proxying forexport spillovers between domestic firms or for past experience of domestic firms, we furthercontrol for the local export activities undertaken by domestic firms in year t. By construction,since we look at the creation of new linkages at the product-country level, there is no exportactivity by domestic firms in the previous year for the given product-country pair. We needhowever to account for export activities in other products for the same country, in other coun-tries for the same product and in other products and other countries respectively. We controlfor both the presence (through a dummy) and the value of these export activities (through thelog of export value).
We adopt a similar strategy for the foreign export activities when investigating the nature offoreign export spillovers. Checking the specificity of foreign export spillovers is necessary. In-deed, if spillovers from foreign exporters exist at the product level or at the destination countrylevel, not controlling for foreign export activities on these segments could lead to an overes-
10Provincial GDP per capita are taken from the China Statistical yearbooks.
15

CEPII, WP No 2010 – 32 Export performance of China’s domestic firms: the role of foreign export spillovers
timation of the impact of our measure of product-country specific export foreign spillovers.Finally, note that if larger foreign presence leads to congestion effects on the use of local in-puts and/or competition, this could negatively affect domestic firms’ export performance. Ourestimation will thus measure the net effect of positive externalities and congestion effects.
3. ESTIMATION OF FOREIGN EXPORT SPILLOVERS
3.1. Nature of foreign export spillovers
In Table 3, we explore the existence and the nature of foreign export spillovers in China. Werely on a conditional logit estimation. Moulton (1990) showed that regressing individual vari-ables on aggregate variables could induce a downward bias in the estimation of standard-errors.All regressions in this Table and the following are thus clustered at the province level. Wefirst use the value of exports by foreign firms as a proxy for foreign export spillovers. Wesuccessively estimate the impact of four different spillover variables, in increasing order ofspecificity, controlling for the demand in the destination country and for supply-side determi-nants of exports in the province and in China the year before the entry. In column 1, we relyon the most aggregated measure of local foreign export activity, the total value of exports byforeign firms (all products-all destinations). This general spillover variable is significant butenters negatively, possibly due to crowding out effect: since we also control for total exportsin province i in year t, the more these exports are covered by foreign firms, the less probableis the entry of domestic firms on foreign markets the following year. In column 2, we focuson country-specific spillovers (all products-same destination), while in column 3, we rely on aproduct-specific measure (same product-all destinations). These two spillover variables attracta negative sign but are not significant. In column 4 we use the most precise measure of foreignspillovers (same product-same destination). Interestingly, the product-country spillover vari-able is positive and significant at the 1% confidence level attesting that the entry of domesticfirms on export markets for product k and country j in year t + 1 is positively influenced byexport activities of foreign firms for product k and country j in year t.
To assess further the specificity of export spillovers, for a given province-product-destinationcountry triad ikj, we decompose in column 5 the overall foreign export value in province i in itsfour complementary components: exports of the same product k to the same country j, exportsof the same product k to other countries, exports of other products to the same country j andexports of other products to other countries. In this column, we also control for the dynamics indemand-side and supply-side determinants of entry on export markets by introducing relevantcontrols in t− 1. As can be seen in column 5, the country/product specific spillover measure isthe only one to be positive and significant. Column 6 adds a final category of controls to ensurethat the measured impact of foreign export spillovers does not simply reflect past experience ofdomestic firms on export markets for product k or country j. Indeed, scope economies acrossdestinations or across products may be at work for domestic exports. If the export performanceof domestic firms on a destination country j (for other products than k) is correlated to foreignexport performance and explains the entry of domestic firms on the product-country pair kjthen, our estimation of foreign export spillovers will be biased. We thus include proxies for
16

CEPII, WP No 2010 – 32 Export performance of China’s domestic firms: the role of foreign export spillovers
Table 3 – Nature of foreign export spilloversExplained variable Domestic new export link in t+1
(1) (2) (3) (4) (5) (6)
Fore
ign
expo
rtsp
illov
ers
Yea
rt
All product-country Foreign export -0.338b
(0.154)Country all products for. export -0.003
(0.003)Product all countries for. export -0.003
(0.002)Same product-country for. export 0.020a 0.020a 0.023a
(0.002) (0.002) (0.001)Other product same country for. export -0.001 0.004
(0.003) (0.003)Same product other country for. export -0.003 0.007a
(0.002) (0.002)Other product/country for. export -0.331b -0.313
(0.147) (0.202)
Dem
and
Yea
rt
Ln country-product total imports 0.083a 0.083a 0.083a 0.082a 0.080a 0.080a
(0.007) (0.007) (0.007) (0.007) (0.006) (0.006)Ln country gdp per capita 0.758 0.601 0.606 0.585 0.746 0.784
(0.718) (0.912) (0.915) (0.912) (0.704) (0.658)
Supp
lyY
eart
Ln Export province 0.690a 0.533b 0.535b 0.530b 0.475b 0.464(0.210) (0.212) (0.211) (0.211) (0.192) (0.740)
Ln Export province-product 0.178a 0.181a 0.182a 0.179a 0.169a 0.007(0.007) (0.006) (0.007) (0.006) (0.007) (0.009)
Ln Export province-country 0.143a 0.146a 0.144a 0.143a 0.138a 0.001(0.017) (0.016) (0.015) (0.015) (0.016) (0.041)
Ln Export China-product 0.418a 0.415a 0.416a 0.413a 0.354a 0.340a
(0.017) (0.019) (0.019) (0.019) (0.018) (0.018)Ln Export China-country 0.210a 0.208a 0.207a 0.207a 0.197a 0.194a
(0.030) (0.031) (0.032) (0.032) (0.028) (0.027)Ln Province gdp per capita -0.540 -0.378 -0.384 -0.365 -0.545 -0.581
(0.721) (0.922) (0.925) (0.923) (0.708) (0.663)
Mac
rola
gsY
eart−
1
Lag Ln country-product total imports 0.009b 0.009b
(0.004) (0.004)Lag Ln Export province 0.261c 0.255
(0.158) (0.155)Lag Ln Export province-product 0.027a 0.027a
(0.006) (0.006)Lag Ln Export province-country 0.013 0.011
(0.010) (0.009)Lag Ln Export China-product 0.079a 0.074a
(0.013) (0.013)Lag Ln Export China-country 0.020 0.019
(0.015) (0.016)
Dom
estic
pres
ence
Yea
rt
0/1 other products/same country Domestic export -1.220a
(0.391)0/1 same product/other countries Domestic export -1.391a
(0.087)Ln Other countries-same product Domestic export 0.172a
(0.007)Ln Other products-same country Domestic export 0.139a
(0.038)Ln Other prod./country Domestic export -0.014
(0.611)Observations 3575935R-squared 0.121 0.120 0.120 0.120 0.122 0.123
Fixed effects province-product (nc4)-country triad & by year
Heteroskedasticity-robust standard errors are reported in parentheses. Standard errors are clustered at theprovince level. a, b and c indicate significance at the 1%, 5% and 10% confidence level.
17

CEPII, WP No 2010 – 32 Export performance of China’s domestic firms: the role of foreign export spillovers
the domestic export performance on other product-country pairs. We decompose past exportperformance of domestic firms in province i into three non-overlapping variables: domesticexports of product k to countries other than j, exports of products other than k to country j andexports of other products to other countries. Our main result holds: the coefficient on foreignproduct-country specific export spillovers even slightly increases to reach 0.023. Local foreignexports of product k to other countries enter with a positive and significant coefficient, but verysmall in magnitude (0.007).
In Table 4, we investigate further the appropriate way of accounting for foreign export spillovers.Columns 1 and 2 are benchmarks: Column 1 reproduces column 6 of Table 1 and column 2focuses on product-country specific foreign export spillovers, controlling for the overall activ-ity of foreign exporters (all destinations and all products) in the province. In columns 3 to 8 ofTable 4, we address the need to account for the large number of zero foreign presence. Indeed,in only 2.4% of the final sample observations, do we observe positive foreign export flows forthe product-country specific spillovers variable. We adopt two strategies to deal with this issue.First, we verify that our results hold when restricting our sample to cases where we observenon zero foreign presence for product k and country j in year t (columns 3 and 4).
In this subsample, the average probability of new linkage creation by domestic firms rises from0.23 to 0.38 (as reported at the foot of the columns). Also, the size of the coefficient is increasedand is equal now to 0.047 (column 4). In columns 5 and 6, we further restrict our sample toprovince/product/country triads for which positive foreign exports are observed in 1997 (thefirst year of the sample). Overall, despite the reduction in the number of observations (84789in columns 3 to 4 and 60928 in columns 5 to 6) our finding of a positive and significant impactof the product-country specific spillovers variable is confirmed.
The second way to deal with the zero foreign export flows, which is used in the rest of thepaper, is to keep the full sample but to measure simultaneously the impact of the mere presenceof foreign exporters for a given product-country pair and the value of their exports. In columns7 and 8, foreign export spillovers are apprehended based not only on the foreign export value aspreviously, but also on a dummy indicating whether foreign exports are strictly positive. Thisallows us to disentangle what is due to the scale of export activities by foreign firms from themore general effect due to the presence of foreign exporters. In column 8, we use this approachto study the impact of foreign export spillovers for other products and/or other destinations.As can be seen in column 8, we find that product-country specific foreign export spilloversare linked to both the presence of foreign firms and the value of their export activities forthe product-country pair kj. For the product-specific and the country-specific spillovers, thedummy enters with a negative and significant coefficient while the value of exports is on thecontrary positively correlated to the entry of domestic firms on foreign markets. This meansthat foreign exports of the same product k (to other countries) or to the same country j (of otherproducts) have a positive impact above a certain threshold only. However, results in column1 show that the overall average effect is close to zero. Our results on the export spillovers forother products and countries confirm that there is no cross-products or cross-markets benefits
18

CEPII, WP No 2010 – 32 Export performance of China’s domestic firms: the role of foreign export spillovers
Table 4 – Specification on foreign export spilloversExplained variable Domestic new export link in t+1
(1) (2) (3) (4) (5) (6) (7) (8)Positive foreign exports Add dummies
Benchmark in year t in 1997 for exports >0
Fore
ign
expo
rtsp
illov
ers
Same product-country 0.023a 0.023a 0.047a 0. 047a 0.022a 0.022a 0.016a 0.016a
(0.001) (0.001) (0.008) (0.008) (0.003) (0.003) (0.004) (0.004)Other product same country 0.004 0.011 0.009 0.021b
(0.003) (0.014) (0.001) (0.009)Same product other country 0.007a 0.006 0.015a 0.016a
(0.002) (0.006) (0.005) (0.004)Other product/country -0.313 -0.021 -0.323 -0.321
(0.202) (0.331) (0.326) (0.200)All product-country -0.308 -0.018 -0.398 -0.308
(0.207) (0.372) (0.342) (0.207)0/1 same product/country 0.072b 0.067c
(0.036) (0.035)0/1 other prod./same country -0.191c
(0.104)0/1 same prod./other country -0.102b
(0.041)
Dom
estic
pres
ence
Same product other country 0.172a 0.161a 0.156a 0.154a 0.146a 0.138a 0.161a 0.179a
(0.007) (0.007) (0.018) (0.018) (0.017) (0.018) (0.008) (0.009)Other product same country 0.139a 0.123a 0.126b 0.113b 0.146a 0.123b 0.123a 0.166a
(0.038) (0.034) (0.052) (0.049) (0.066) (0.059) (0.034) (0.038)Other product/country -0.014 -0.010 0.203 0.208 0.099 0.002 -0.010 -0.006
(0.611) (0.621) (0.779) (0.821) (0.629) (0.688) (0.621) (0.602)0/1 other prod./same country -1.220a -1.088a -1.797b -1.678b -0.308 -0.084 -1.087a -1.486a
(0.391) (0.374) (0.745) (0.756) (1.285) (1.253) (0.374) (0.410)0/1 same prod./other country -1.391a -1.317a -1.316a -1.302a -1.263a -1.212a -1.314a -1.456a
(0.087) (0.089) (0.211) (0.213) (0.175) (0.178) (0.090) (0.101)Control for GDPs yes yes yes yes yes yes yes yesControl for Macro export yes yes yes yes yes yes yes yesControl for Macro export lags yes yes yes yes yes yes yes yesShare of domestic starts 0.233 0.384 0.305 0.233Observations 3575935 84789 60928 3575935R-squared 0.123 0.123 0.169 0.169 0.106 0.106 0.123 0.123Fixed effects by province-product (nc4)-country triad & by year
Heteroskedasticity-robust standard errors are reported in parentheses. Standard errors are clustered at the provincelevel. a, b and c indicate significance at the 1%, 5% and 10% confidence level.
19

CEPII, WP No 2010 – 32 Export performance of China’s domestic firms: the role of foreign export spillovers
from foreign export activities on the creation of a new export linkage.11
If we now try to have an idea of the magnitude of these product and destination countryspillovers, we can make several thought experiments. Consider a province where there areno firms, neither foreign nor domestic, exporting product k to country j at year t and anotherprovince, where there are foreign firms exporting product k to country j, but in negligible quan-tities: the sole presence of foreign exporting firms raises the probability that domestic firms startexporting product k to country j in t + 1 by 6.9% in the latter province compared to the for-mer.12 Considering the average probability to start exporting in the sample, equal to 23.3%, as areference, the presence of foreign firms exporting product k to country j increases the averageprobability that domestic firms in the province start exporting the same product to the samecountry in t + 1 by 1.6 percentage point. As summarized in Table 10, the marginal impact ofthe value of foreign exports is on the other hand much more modest, since a 10% increase inthe value of foreign exports of product k to country j raises the probability that domestic firmsstart exporting the same product to the same country by 0.04 percentage point.13
3.2. Ordinary versus processing trade
Our results tend to show so far that domestic Chinese firms benefit from foreign export spillovers,but at a very specific level: the probability that domestic firms start exporting product k to coun-try j is positively associated with surrounding foreign firms’ exports of the same product to thesame country the year before.
Other export activities of foreign firms have overall no significant or very marginal impact.However, one remaining question is whether the results hold when we account for the impor-tant role of processing trade. Indeed, since firms engaged in processing trade “simply” importinputs and re-export a transformed product, we can imagine that they are less embedded in theirdirect environment and consequently generate less externalities. In Table 5, we thus further de-compose our foreign export spillovers into the two trade regimes (ordinary and processing).Also, in order to identify whether export spillovers affect differently the creation of new link-ages depending on the trade regimes used by domestic firms, we study separately ordinary(ODT) export creation (columns 3 and 4) and processing (PCS) export creation (columns 5 and6). Columns 1 and 2 indicate that foreign export spillovers in the assembly sector has no predic-tive power on the likelihood of domestic firms to create new linkages. The coefficients on boththe dummy for the presence of foreign exporters and their export value are insignificant. Bycontrast, the two measures attract a positive and significant sign when export spillovers emanatefrom foreign exporters engaged in ordinary trade. More interestingly, the comparison betweencolumns 3 and 4 (restricted to ordinary export flows creation) and 5 and 6 (restricted to pro-
11Note that the dummy 0/1 indicating whether foreign firms export is always 1 for other products and countries,this is why is does not appear in column 8.12Given the form of the logistic function, the increase in probability generated by the sole presence of foreignfirms exporting product k to country j is equal to [e0.067 − 1]%.13If we consider a reference value x̄ for variable x, the increase in probability generated by a 10% increase in x isequal to (1.1βx − 1), βx being the coefficient on x. The increase expressed in percentage point of probability isequal to (1.1βx − 1)Px̄.
20
CEPII, WP No 2010 – 32 Export performance of China’s domestic firms: the role of foreign export spillovers
Table 5 – Ordinary versus Processing trade (1999-2007)Explained variable: new domestic export link in t+1 All Ordinary Processing
(1) (2) (3) (4) (5) (6)
Fore
ign
Spill
over
s
ODT same prod./country for. export 0.015a 0.013a 0.017a 0.016a -0.017c -0.018c
(0.004) (0.004) (0.004) (0.004) (0.010) (0.010)0/1 ODT same prod/country for. export 0.086a 0.083a 0.065b 0.063b 0.279b 0.274b
(0.029) (0.029) (0.030) (0.030) (0.112) (0.112)PCS same prod./country for. export 0.006 0.006 0.007 0.007 0.009 0.009
(0.006) (0.006) (0.006) (0.006) (0.015) (0.015)0/1 PCS same prod/country for. export 0.080 0.068 0.040 0.028 0.201 0.195
(0.049) (0.050) (0.045) (0.046) (0.168) (0.169)ODT same prod. other country for. export 0.021a 0.021a 0.010
(0.005) (0.005) (0.010)0/1 ODT same prod. other country for. export -0.132a -0.139a 0.031
(0.046) (0.045) (0.088)ODT other prod. same country for. export 0.021b 0.021b -0.027
(0.009) (0.009) (0.021)0/1 ODT other prod. same country for. export -0.186b -0.185b 0.382c
(0.093) (0.088) (0.231)ODT other prod./country for. export 0.025 0.017 0.226
(0.102) (0.105) (0.162)PCS same prod. other country for. export 0.022a 0.021a 0.036a
(0.004) (0.005) (0.010)0/1 PCS same prod. other country for. export -0.214a -0.207a -0.269a
(0.040) (0.044) (0.099)PCS other prod. same country for. export 0.010 0.007 0.040
(0.007) (0.007) (0.026)0/1 PCS other prod. same country for. export -0.122 -0.101 -0.341
(0.084) (0.085) (0.257)PCS other prod./country for. export -0.116 -0.121 -0.198
(0.118) (0.123) (0.139)0/1 PCS other prod./country for. export 2.355c 2.417c 2.148
(1.373) (1.434) (1.539)
Dom
estic
pres
ence
0/1 other prod./same country dom. export -1.163a -1.464a -1.083b -1.354a -1.168c -1.551b
(0.430) (0.448) (0.453) (0.467) (0.650) (0.693)0/1 same prod./other country dom. export -1.325a -1.543a -1.319a -1.534a -1.636a -1.901a
(0.088) (0.100) (0.088) (0.099) (0.267) (0.292)Same prod. other country Domestic export 0.162a 0.189a 0.162a 0.189a 0.183a 0.214a
(0.008) (0.010) (0.007) (0.009) (0.030) (0.032)Other product same country Domestic export 0.130a 0.163a 0.127a 0.157a 0.128a 0.170a
(0.040) (0.042) (0.042) (0.043) (0.049) (0.056)Other prod./country Domestic export 0.555 0.460 0.602 0.483 -0.894a -0.898b
(0.408) (0.510) (0.420) (0.511) (0.313) (0.439)Control for GDPs yes yes yes yes yes yesControl for Macro export yes yes yes yes yes yesControl for Macro export lags yes yes yes yes yes yesAverage probability of domestic start 0.233 0.235 0.274Observations 3575935 3425094 222838R-squared 0.123 0.124 0.123 0.124 0.138 0.139Fixed effects province-product (nc4)-country triad & by year
Heteroskedasticity-robust standard errors are reported in parentheses. Standard errors are clustered at the provincelevel. a, b and c indicate significance at the 1%, 5% and 10% confidence level.
21

CEPII, WP No 2010 – 32 Export performance of China’s domestic firms: the role of foreign export spillovers
cessing export new linkages) suggest that foreign export spillovers only derive from ordinaryexport activities from foreign firms and mainly apply to ordinary export activities of domesticfirms. It seems thus that processing trade activities are driven by different determinants. In theend, the presence per se of foreign firms exporting product k to country j increases the averageprobability that domestic firms of the province start exporting this product to this country by1.52 percentage point14 while a 10% increase in the value of foreign exports increases the aver-age probability that domestic firms start exporting by 0.04 percentage point15. These results arein line with previous findings on the heterogenous impact of export upgrading depending ontrade type. Jarreau and Poncet (2009) for example argue that processing exports performancemust not be taken as signalling a process of technological adoption in China, but rather as anartefact due to China’s participation in the increasing fragmentation of production processes.
4. HETEROGENEITY OF FOREIGN EXPORT SPILLOVERS
We now investigate the robustness of our results and the potential heterogeneity of exportspillovers according to the sophistication of exported products and the sophistication gap be-tween foreign and domestic firms. Given the results obtained in the previous section, we focuson ordinary trade activities.
4.1. Robustness checks
We verify that our results are robust to several modifications aimed at excluding potential out-liers. While the first column of Table 6 reproduces the benchmark specification (correspondingto column 4 of Table 5), columns 2 and 3 drop country-product pairs for which China accountsfor more than 45% and 85% respectively of the total imports. The figures of 45 and 85% corre-spond to the top quartile and top decile respectively of the distribution China’s share in importsat the destination country-product level. In column 4, we exclude from our sample observa-tions for the three main exporters (Guangdong, Shanghai and Jiangsu). These three provincesaccount for around 60% of China’s total exports over the period. We verify that the significanceof foreign export spillovers is not restricted to these outward-oriented locations. In column 5,we drop observations for clothing, textile and footwear sectors (HS2 codes from 50 to 67). Inthese sectors, the WTO entry has resulted in massive reductions in tariffs and quotas that mayexplain jointly the surge in both domestic and foreign exports.
Despite the sharp reduction in sample size induced by these various restrictions, we con-firm the positive and significant impact of foreign export spillovers limited to the same prod-uct/destination case. Column 6 reproduces column 1 adding product-year fixed-effects definedat the SH2 level. Results are obtained from a linear probability model since it was impossi-ble to account in a logit model for both the province-product-country triadic fixed-effects andfor product-year fixed-effects. We find that the product-country foreign export spillovers resistthe inclusion of product-year fixed effect controlling for product specific factors that vary overtime such as tariffs. The final column of Table 6 includes lags (by one year) of the variables
14This figure corresponds to [exp0.063 − 1]× 0.233 from column 4.15This figure corresponds to (1.10.016 − 1)× 0.233 from column 4.
22

CEPII, WP No 2010 – 32 Export performance of China’s domestic firms: the role of foreign export spillovers
Table 6 – Robustness check on the impact of foreign export spilloversExplained variable: Domestic ordinary new export link in t+1
(1) (2) (3) (4) (5) (6) (7)China’s No Noshare top 3 Textile Additional
benchmark <45% <85% provinces Clothing controls
Ord
inar
ytr
ade
Fore
ign
Spill
over
s
Same prod/country 0.016a 0.018a 0.016a 0.016a 0.014a 0.006a 0.018a
(0.004) (0.004) (0.004) (0.004) (0.004) (0.001) (0.005)0/1 Same prod/country 0.066b 0.048c 0.059b 0.065b 0.079b 0.013c 0.109b
(0.030) (0.028) (0.029) (0.028) (0.034) (0.001) (0.047)Same prod. other country 0.021a 0.022a 0.022a 0.014a 0.023a 0.003a 0.020a
(0.005) (0.005) (0.005) (0.004) (0.006) (0.001) (0.005)0/1 Same prod. other country -0.144a -0.155a -0.149a -0.075c -0.155a -0.027a -0.125a
(0.047) (0.048) (0.047) (0.039) (0.049) (0.010) (0.048)Other prod. same country 0.021b 0.022b 0.021b 0.011 0.019b 0.004b 0.018b
(0.009) (0.009) (0.009) (0.008) (0.009) (0.002) (0.009)0/1 Other prod. same country -0.192b -0.182c -0.193b -0.080 -0.156c -0.053a -0.175c
(0.092) (0.095) (0.093) (0.081) (0.093) (0.018) (0.094)Other product/country 0.031 0.042 0.037 0.041 -0.005 0.016 0.037
(0.101) (0.097) (0.100) (0.095) (0.098) (0.018) (0.097)Lag same prod/country -0.006
(0.005)Lag 0/1 same prod/country 0.220a
(0.042)Lag same prod. other country 0.009b
(0.004)Lag 0/1 same prod. other country -0.062
(0.038)Lag same country other prod. 0.010
(0.007)0/1 Other prod same country -0.085
(0.073)lag Other prod/country -0.026
(0.062)
Dom
estic
pres
ence
0/1 Other prod./same country -1.297a -1.462a -1.396a -1.072a -1.232a -0.177b -1.381a
(0.473) (0.539) (0.475) (0.303) (0.464) (0.069) (0.506)0/1 Same prod./other country -1.436a -1.460a -1.436a -1.297a -1.444a -0.182a -1.567a
(0.091) (0.103) (0.096) (0.091) (0.094) (0.015) (0.102)Same product other country 0.177a 0.180a 0.177a 0.164a 0.182a 0.018a 0.196a
(0.008) (0.008) (0.008) (0.007) (0.008) (0.001) (0.009)Other product same country 0.152a 0.170a 0.160a 0.134a 0.150a 0.001 0.161a
(0.044) (0.049) (0.045) (0.028) (0.048) (0.006) (0.049)Other country/product 0.702 0.689 0.696 0.935b 0.628 0.079 0.889
(0.466) (0.450) (0.465) (0.391) (0.449) (0.054) (0.551)Control for GDPs yes yes yes yes yes yes yesControl for Macro export yes yes yes yes yes yes yesControl for Macro export lags yes yes yes yes yes yes yesSH2-year Fixed effects non no no no no yes noFixed effects by province-product (nc4)-country triad & by yearObservations 3425094 2568573 3239186 2689057 2782764 4387492 2860539R-squared 0.123 0.125 0.126 0.113 0.131 0.019 0.178
Heteroskedasticity-robust standard errors are reported in parentheses. Standard errors are clustered at the province level. a, b
and c indicate significance at the 1%, 5% and 10% confidence level.23

CEPII, WP No 2010 – 32 Export performance of China’s domestic firms: the role of foreign export spillovers
capturing the different foreign export spillovers (same product-country, same product othercountries, other products same country and other products other countries). We verify that ourresults hold. Also all our findings are confirmed when we restrict our sample to durable starts,defined as export starts followed by a least two consecutive years of positive export values.16
4.2. Foreign export spillovers and product sophistication
One argument often advanced by policy-makers to justify policies aiming at attracting FDI isthat foreign firms may help domestic ones to improve their processes, to adopt technology andthen to increase their productivity and upgrade the quality of their products. Jarreau and Poncet(2009) show that the export sophistication of domestic exports is favorable to provincial growth,but not the sophistication of foreign exports. However, if the export spillovers generated byforeign firms are stronger for more sophisticated products, this would be consistent with anindirect impact of foreign firms’ export activities on local income growth. In Table 7, we thuscheck wether the magnitude of foreign export spillovers depends on the product sophisticationlevel. As in the previous section, we focus on domestic starts and foreign exports in ordinarytrade. We follow Hausmann, Hwang and Rodrik (2007) and assume that each good k that acountry can potentially produce and export has an intrinsic level of sophistication17 associatedto it, PRODYk, that is the weighted average of the income levels of this good k’s exporters,where the weights correspond to the revealed comparative advantage of each country j in goodk:18
PRODYk =1
Ck
∑j
xjk
Xj
× Yj, (3)
where xjk is the value of exports of good k by country j, Xj is the total value of country j’sexports and Yj is the per capita level of income of country j, measured as the real GDP percapita, in 2000 PPP dollars. Ck is a normalization term used to have the coefficients sum to 1.The bigger share a given good k weighs in the exports of rich countries, the higher its PRODY ,the more sophisticated it is.
We compute the product(HS4)-level sophistication level for the year 1997, the initial year of oursample. The average sophistication value of goods exported by China across the 1213 exportedHS4-products in 1997 is 12813$ with a minimum of 971 and a maximum of 32000$.19
In Table 7, we use two alternative cut-offs. Columns 1 to 4 rely on the value of 13775$ whichensures a split in almost two equal subsamples. Columns 5 to 8 use a lower value, equal to11000$.
16Results are available upon request from the authors.17While Hausmann, Hwang and Rodrik (2007) use the word “productivity” to describe sophistication at the goodlevel, we prefer terms like sophistication, high quality or technological advancement.18The numerator of the weight, xjk/Xj , is the value-share of the commodity in the country j’s overall exportbasket while the denominator of the weight, Ck =
∑j(xjk/Xj), aggregates the value-shares across all countries
exporting the good.19The statistical distribution of sophistication value is reproduced in Figure 1 in the Appendix. Values are inconstant 2000 PPP dollars. For example sophistication values of 5000$ correspond to cotton fabrics and freshfish, sophistication values of 10000$ correspond to woven fabrics in synthetic staple fibers and stranded wires inaluminium. At values of 15000$, one finds children printed books and sewing machines.
24

CEPII, WP No 2010 – 32 Export performance of China’s domestic firms: the role of foreign export spilloversTa
ble
7–
Het
erog
enei
tyim
pact
offo
reig
nex
port
spill
over
sdep
endi
ngon
prod
ucts
ophi
stic
atio
nE
xpla
ined
vari
able
:D
omes
ticor
dina
rytr
ade
new
expo
rtlin
kin
t+1
(1)
(2)
(3)
(4)
(5)
(6)
(7)
(8)
Prod
uctH
S-4
soph
istic
atio
n)≥
1377
5<
1377
5≥
1377
5<
1377
5≥
1100
0<
1100
0≥
1100
0<
1100
0ForeignODTspillovers
OD
Tsa
me
prod
/cou
ntry
for.
expo
rt0.
012b
0.02
5a0.
009c
0.02
4a0.
015a
0.02
4a0.
013a
0.02
3a
(0.0
05)
(0.0
05)
(0.0
05)
(0.0
05)
(0.0
04)
(0.0
08)
(0.0
04)
(0.0
08)
0/1
OD
Tsa
me
prod
/cou
ntry
for.
expo
rt0.
095b
0.01
60.
100b
0.01
50.
070b
0.02
40.
074b
0.02
1(0
.040
)(0
.044
)(0
.040
)(0
.044
)(0
.030
)(0
.071
)(0
.030
)(0
.071
)A
llpr
oduc
t-co
untr
yFo
reig
nex
port
0.04
20.
059
0.03
70.
074
(0.1
10)
(0.1
01)
(0.1
12)
(0.0
93)
OD
Tsa
me
prod
.oth
erco
untr
yfo
r.ex
port
0.02
6a0.
016a
0.02
3a0.
018a
(0.0
06)
(0.0
06)
(0.0
06)
(0.0
05)
OD
Tot
herp
rod.
sam
eco
untr
yfo
r.ex
port
0.02
0b0.
022b
0.01
9b0.
024b
(0.0
10)
(0.0
09)
(0.0
10)
(0.0
10)
OD
Tot
herp
rod.
/cou
ntry
for.
expo
rt0.
023
0.03
40.
017
0.04
7(0
.108
)(0
.099
)(0
.110
)(0
.091
)0/
1O
DT
othe
rpro
d.sa
me
coun
try
for.
expo
rt-0
.181c
-0.1
91b
-0.1
73c
-0.2
08b
(0.0
97)
(0.0
95)
(0.0
97)
(0.1
00)
0/1
OD
Tsa
me
prod
.oth
erco
untr
yfo
r.ex
port
-0.1
86a
-0.0
91c
-0.1
51a
-0.1
20b
(0.0
52)
(0.0
48)
(0.0
50)
(0.0
49)
Domesticpresence
Sam
epr
od.o
ther
coun
try
dom
.exp
ort
0.16
4a0.
161a
0.18
0a0.
175a
0.16
0a0.
162a
0.17
6a0.
178a
(0.0
10)
(0.0
09)
(0.0
11)
(0.0
10)
(0.0
08)
(0.0
10)
(0.0
09)
(0.0
11)
Oth
erpr
oduc
tsam
eco
untr
ydo
m.e
xpor
t0.
129b
0.12
7a0.
151a
0.15
3a0.
139a
0.10
7a0.
160a
0.13
6a
(0.0
51)
(0.0
37)
(0.0
53)
(0.0
39)
(0.0
45)
(0.0
39)
(0.0
47)
(0.0
42)
Oth
erpr
od./c
ount
ryD
omes
ticex
port
0.72
60.
696
0.73
70.
674
0.75
40.
641
0.75
70.
614
(0.5
25)
(0.4
50)
(0.5
15)
(0.4
42)
(0.5
03)
(0.4
43)
(0.4
92)
(0.4
35)
0/1
Oth
erpr
od./s
ame
coun
try
dom
.exp
ort
-0.9
29c
-1.1
92a
-1.1
21b
-1.4
22a
-1.1
26b
-0.9
87b
-1.3
13a
-1.2
40b
(0.5
01)
(0.4
34)
(0.5
21)
(0.4
47)
(0.4
51)
(0.4
94)
(0.4
68)
(0.5
08)
0/1
Sam
epr
od./o
ther
coun
try
dom
.exp
ort
-1.3
02a
-1.3
52a
-1.4
30a
-1.4
61a
-1.2
95a
-1.3
61a
-1.4
16a
-1.4
86a
(0.1
27)
(0.1
06)
(0.1
35)
(0.1
08)
(0.1
08)
(0.1
13)
(0.1
14)
(0.1
17)
Con
trol
forG
DPs
yes
yes
yes
yes
yes
yes
yes
yes
Con
trol
forM
acro
expo
rtye
sye
sye
sye
sye
sye
sye
sye
sC
ontr
olfo
rMac
roex
port
lags
yes
yes
yes
yes
yes
yes
yes
yes
Shar
eof
dom
estic
star
ts0.
234
0.23
60.
234
0.23
60.
234
0.23
70.
234
0.23
7O
bser
vatio
ns17
1221
917
1093
117
1221
917
1093
123
5276
010
7039
023
5276
010
7039
0R
-squ
ared
0.14
70.
101
0.14
70.
101
0.14
30.
084
0.14
30.
084
Fixe
def
fect
sby
prov
ince
-pro
duct
(nc4
)-co
untr
ytr
iad
&by
year
Het
eros
keda
stic
ity-r
obus
tst
anda
rder
rors
are
repo
rted
inpa
rent
hese
s.St
anda
rder
rors
are
clus
tere
dat
the
prov
ince
leve
l.a,b
andc
indi
cate
sign
ifica
nce
atth
e1%
,5%
and
10%
confi
denc
ele
vel.
25
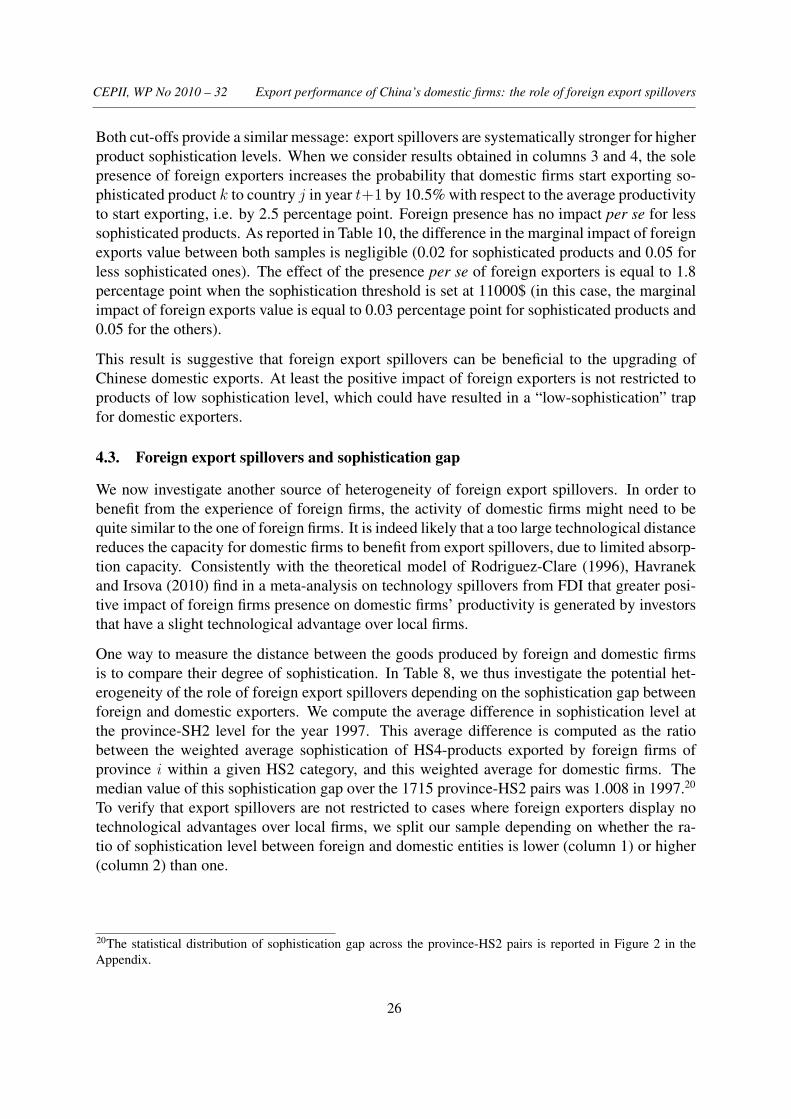
CEPII, WP No 2010 – 32 Export performance of China’s domestic firms: the role of foreign export spillovers
Both cut-offs provide a similar message: export spillovers are systematically stronger for higherproduct sophistication levels. When we consider results obtained in columns 3 and 4, the solepresence of foreign exporters increases the probability that domestic firms start exporting so-phisticated product k to country j in year t+1 by 10.5% with respect to the average productivityto start exporting, i.e. by 2.5 percentage point. Foreign presence has no impact per se for lesssophisticated products. As reported in Table 10, the difference in the marginal impact of foreignexports value between both samples is negligible (0.02 for sophisticated products and 0.05 forless sophisticated ones). The effect of the presence per se of foreign exporters is equal to 1.8percentage point when the sophistication threshold is set at 11000$ (in this case, the marginalimpact of foreign exports value is equal to 0.03 percentage point for sophisticated products and0.05 for the others).
This result is suggestive that foreign export spillovers can be beneficial to the upgrading ofChinese domestic exports. At least the positive impact of foreign exporters is not restricted toproducts of low sophistication level, which could have resulted in a “low-sophistication” trapfor domestic exporters.
4.3. Foreign export spillovers and sophistication gap
We now investigate another source of heterogeneity of foreign export spillovers. In order tobenefit from the experience of foreign firms, the activity of domestic firms might need to bequite similar to the one of foreign firms. It is indeed likely that a too large technological distancereduces the capacity for domestic firms to benefit from export spillovers, due to limited absorp-tion capacity. Consistently with the theoretical model of Rodriguez-Clare (1996), Havranekand Irsova (2010) find in a meta-analysis on technology spillovers from FDI that greater posi-tive impact of foreign firms presence on domestic firms’ productivity is generated by investorsthat have a slight technological advantage over local firms.
One way to measure the distance between the goods produced by foreign and domestic firmsis to compare their degree of sophistication. In Table 8, we thus investigate the potential het-erogeneity of the role of foreign export spillovers depending on the sophistication gap betweenforeign and domestic exporters. We compute the average difference in sophistication level atthe province-SH2 level for the year 1997. This average difference is computed as the ratiobetween the weighted average sophistication of HS4-products exported by foreign firms ofprovince i within a given HS2 category, and this weighted average for domestic firms. Themedian value of this sophistication gap over the 1715 province-HS2 pairs was 1.008 in 1997.20
To verify that export spillovers are not restricted to cases where foreign exporters display notechnological advantages over local firms, we split our sample depending on whether the ra-tio of sophistication level between foreign and domestic entities is lower (column 1) or higher(column 2) than one.
20The statistical distribution of sophistication gap across the province-HS2 pairs is reported in Figure 2 in theAppendix.
26

CEPII, WP No 2010 – 32 Export performance of China’s domestic firms: the role of foreign export spillovers
Tabl
e8
–H
eter
ogen
eity
impa
ctof
fore
ign
expo
rtsp
illov
ersd
epen
ding
onso
phis
ticat
ion
gap
Exp
lain
edva
riab
le:
Dom
estic
OD
Tne
wex
port
link
int+
1(1
)(2
)(3
)(4
)(5
)(6
)R
atio
Fore
ign/
Dom
estic
ordi
nary
soph
istic
atio
n(s
h2-p
rovi
nce
1997
)<
1≥
1≥
1&
<1.
07≥
1&
<1.
09≥
1.07
≥1.
09O
DT
sam
epr
od/c
ount
ryfo
r.ex
port
0.01
5b0.
017a
0.01
3c0.
013b
0.02
1a0.
021a
(0.0
06)
(0.0
03)
(0.0
07)
(0.0
07)
(0.0
04)
(0.0
05)
0/1
OD
Tsa
me
prod
/cou
ntry
for.
expo
rt0.
082
0.05
3b0.
092c
0.08
6c0.
010
0.01
0(0
.053
)(0
.026
)(0
.048
)(0
.049
)(0
.042
)(0
.048
)O
DT
sam
epr
od.o
ther
coun
try
for.
expo
rt0.
018a
0.02
4a0.
036a
0.03
5a0.
014b
0.01
2b
(0.0
05)
(0.0
06)
(0.0
07)
(0.0
07)
(0.0
06)
(0.0
06)
OD
Tot
herp
rod.
sam
eco
untr
yfo
r.ex
port
0.02
3b0.
020b
0.02
7a0.
029a
0.01
30.
010
(0.0
11)
(0.0
09)
(0.0
09)
(0.0
09)
(0.0
10)
(0.0
11)
OD
Tot
herp
rod.
/cou
ntry
for.
expo
rt-0
.135
0.07
40.
298
0.19
1-0
.035
-0.0
05(0
.230
)(0
.123
)(0
.223
)(0
.251
)(0
.095
)(0
.097
)0/
1O
DT
othe
rpro
d.sa
me
coun
try
for.
expo
rt-0
.184c
-0.1
92b
-0.2
78a
-0.2
91a
-0.1
19-0
.090
(0.1
11)
(0.0
90)
(0.0
95)
(0.0
90)
(0.0
96)
(0.0
98)
0/1
OD
Tsa
me
prod
.oth
erco
untr
yfo
r.ex
port
-0.1
05b
-0.1
69a
-0.2
66a
-0.2
54a
-0.0
89-0
.081
(0.0
47)
(0.0
57)
(0.0
68)
(0.0
65)
(0.0
57)
(0.0
58)
Con
trol
forG
DPs
yes
yes
yes
yes
yes
yes
Con
trol
forM
acro
expo
rtye
sye
sye
sye
sye
sye
sC
ontr
olfo
rMac
roex
port
lags
yes
yes
yes
yes
yes
yes
Shar
eof
dom
estic
star
ts0.
233
0.23
00.
235
0.23
40.
227
0.22
65O
bser
vatio
ns14
2761
219
9553
887
0664
9837
3311
2487
410
1180
5R
-sq
0.12
890.
1200
0.13
290.
1313
0.11
070.
1097
Fixe
def
fect
sby
prov
ince
-pro
duct
(nc4
)-co
untr
ytr
iad
&by
year
Het
eros
keda
stic
ity-r
obus
tsta
ndar
der
rors
are
repo
rted
inpa
rent
hese
s.St
anda
rder
rors
are
clus
tere
dat
the
prov
ince
leve
l.a,b
andc
indi
cate
sign
ifica
nce
atth
e1%
,5%
and
10%
confi
denc
ele
vel.
27

CEPII, WP No 2010 – 32 Export performance of China’s domestic firms: the role of foreign export spillovers
We find that spillovers are stronger when the HS4-products exported by foreign firms of theprovince are on average as sophisticated or more sophisticated than the products exported bydomestic firms (column 2 compared to column 1). In this case, the presence of foreign ex-porters increases the average productivity that domestic firms start exporting a given productk to country j by 5.3% (i.e. 1.25 percentage point). The presence of foreign firms per se hasno effect when domestic firms of the province export products that are more sophisticated thanforeign firms’ exported products. In columns 3 to 6, we further split the sample of column 2depending on the level of the sophistication advance of foreign firms. We use two alternativevalues 1.07 and 1.09. Interestingly, we find that the export spillovers effect is much higherwhen foreign exporters have a slight technological advantage over domestic firms (in columns3 and 5).
Overall, our results suggest that the magnitude of foreign export spillovers is greatest when theaverage difference in sophistication between foreign and domestic firms is positive but lowerthan 10%. In this case, the presence of foreign exporters in the province increases the probabil-ity that domestic firms start exporting product k to country j by around 9% (i.e. 2.26 percentagepoint). The presence of foreign exporters per se has no impact when the technological advanceof foreign firms is too big. Regarding the marginal impact of the foreign exports value, thedifference between both samples is again negligible (0.03 percentage point when sophistica-tion gap is small (columns 3 and 5) vs 0.05 when it is big (columns 4 and 6)). This result iscoherent with empirical findings obtained on foreign spillovers on productivity. Our results arein line with theoretical and empirical evidence on technology spillovers from FDI (Rodriguez-Clare (1996), Havranek and Irsova (2010)) suggesting that the positive impact from foreignfirms presence on domestic firms’ productivity is greatest when the technological advantageof foreign investors over local firms is moderate. This last finding suggests that the optimisticresult obtained previously about the magnification effect of export spillovers with product levelsophistication should be qualified. While proximity to foreign exporters can help domestic ex-porters to create new export linkages, especially for sophisticated products, this is restricted toinstances where the technological advantage of foreign firms is not too high.
5. CONCLUSION
We investigate how the creation of new export linkages (extensive margin of trade) by domesticfirms in China is influenced by their proximity to multinational exporters. Using panel datafrom Chinese customs for 1997-2007, we show that domestic firms’ capacity to start exportingnew varieties to new markets positively responds to the export activity of neighboring foreignfirms for that same product-country pair. We find that foreign export spillovers are limited toordinary trade activities. No foreign export spillovers are found for processing trade. More,export spillovers are stronger for sophisticated products indicating that proximity to foreignexporters may help domestic exporters to upgrade their exports. However we observe thatforeign export spillovers are weaker when the technology gap between foreign and domesticfirms is large, suggesting that upgrading may not occur when foreign firms have already astrong edge.
28

CEPII, WP No 2010 – 32 Export performance of China’s domestic firms: the role of foreign export spillovers
6. REFERENCES
AITKEN B., G. HANSON AND A. HARRISON, 1997, “Spillovers, Foreign Investment, andExport Behavior” Journal of International Economics 43: 103-132.
AMITI M. AND C. FREUND, 2010, “An anatomy of China’s export growth”, in Robert Feen-stra and Shang-Jin Wei (Eds.), China’s Growing Role in World Trade. : University ofChicago Press.
BARRIOS, S., H. GORG AND E. STROBL, 2003, “Explaining Firms’ Export Behaviour:R&D, Spillovers and the Destination Market”, Oxford Bulletin of Economics and Statistics,65, 4, 475-96.
BLOMSTRÖM, M. AND KOKKO, A., 1998, “Multinational corporations and spillovers”, Jour-nal of Economic Survey, 12(3), pp. 247-278.
BLONINGEN, B. AND MA A., 2010, “Please Pass the Catch-up: The Relative Performanceof Chinese and Foreign Firms in Chinese Exports”, in Robert Feenstra and Shang-Jin Wei(Eds.), China’s Growing Role in World Trade. : University of Chicago Press.
CAVES, R., 1974, “Multinational firms, competition and productivity in host-country mar-kets”, Economica, 41, 176–193.
CHEN H. AND D. SWENSON, 2009, “Multinational Exposure and the Quality of New ChineseExports”, mimeo.
CHEUNG K.-Y. AND P. LIN , 2004, “Spillover effects of FDI on innovation in China: Evi-dence from the provincial data”, China Economic Review 15 25- 44
CHINA STATISTICAL YEARBOOK, 2008, China Statistics Press.CRESPO N. AND M. P. FONTOURA, 2006, “Determinants factors of FDI spillovers, what do
we really know”, World Development 35 (3), p. 410-425.GÖRG H. AND D. GREENAWAY, 2004, “Much ado about nothing? Do domestic firms really
benefit from Foreign Direct Investment?” The World Bank Research Observer, 19 (2), p.171-197.
GAULIER G. AND S. ZIGNAGO, 2010. “BACI: A World Database of International Trade atthe Product level, The 1994-2007 Version” , CEPII working paper 2010-23.
HALE G. AND C. LONG, 2010, “Are There Productivity Spillovers from Foreign Direct In-vestment in China?”, Pacific Economic Review, forthcoming.
HARDING T. AND B. SMARZYNSKA JAVORCIK, 2010, “A Touch of Sophistication: FDI andUnit values of exports”, mimeo.
HAUSMANN R., J. HWANG AND D. RODRIK, 2007, ‘What You Export Matters’, Journal ofEconomic Growth, 12, 1-25.
HAVRANEK T. AND Z. IRSOVA, 2010, “Which Foreigners are worth wooing? A Meta-Analysis of vertical spillovers from FDI?”, mimeo.
HU, A., AND JEFFERSON, G., 2002, “FDI impact of spillover: Evidence from China’s elec-tronic and textile industries”, World Economy, 25(8), 1063-1076.
29

CEPII, WP No 2010 – 32 Export performance of China’s domestic firms: the role of foreign export spillovers
JAFFE, A.B., TRAJTENBERG, M., HENDERSON, R., 1993, “Geographic localization ofknowledge spillovers as evidenced by patent citations”. Quarterly Journal of Economics108, 577–598.
JARREAU, J. AND S. PONCET, 2009, “Export Sophistication and Economic Performance:evidence from China”, CEPII working paper 2009-34.
KNELLER R., M. PISU, 2007, “Industrial Linkages and Export Spillovers from FDI”, TheWorld Economy, 30 n˚ 1, pp. 105-134.
KOKKO A., M. ZEJEAN AND R. TANSINI, 2001, “Trade regimes and spillover effects of FDI:Evidence from Uruguay”, Weltwirschaftliches Archiv, 137 (1) 124-149.
KOENIG P., F. MAYNERIS AND S. PONCET, 2010, “Local export spillovers in France”, Eu-ropean Economic Review 54, 622–641.
LI, X., X. LIU, AND D. PARKER, 2001, “Foreign direct investment and productivity spilloversin the Chinese manufacturing sector,” Economic Systems, 25(4), 305-321.
LIU, Z., 2001, “Foreign direct investment and technology spillover: evidence from China,”Journal of Comparative Economics, 30(3), 579-602.
MA, ALYSON, 2006, “Export Spillovers to Chinese Firms: Evidence from Provincial Data”,Journal of Chinese Economic and Business Studies, Vol. 4, No. 2, 127-149.
MOULTON B. R., 1990, “An Illustration of a Pitfall in Estimating the Effects of AggregateVariables on Micro Unit”, The Review of Economics and Statistics, 72(2), 334-338.
RODRIGUEZ-CLARE A., 1996, “Multinationals, linkages, and Economic Development”, Amer-ican Economic Review, 86 (4), pp. 852-73.
RUANE F. AND J. SUTHERLAND, 2005, “Foreign Direct Investment and Export Spillovers:How do export platforms fare?”, IIIS discussion paper 58.
SWENSON D., 2008, “Multinationals and the creation of Chinese trade linkages”, CanadianJournal of Economics, 41(2):596-618.
XU B. AND J. LU, 2009, Foreign Direct Investment, processing trade, and the sophisticationof China’s exports, China Economic Review, 20, 425-439.
WANG Z. AND WEI S-J, 2010, What Accounts for the Rising Sophistication of China’sExports? , in Robert Feenstra and Shang-Jin Wei (Eds.), China’s Growing Role in WorldTrade. : University of Chicago Press.
30

CEPII, WP No 2010 – 32 Export performance of China’s domestic firms: the role of foreign export spillovers
Table 9 – Summary statistics on domestic starts and foreign presence natureYear Domestic Start=1 Domestic start=0
Total Foreign Exports>0 Total Foreign Exports=0Same product Other product Same product Other product
Same Other Same Other Same Other Same Othercountry country country country country country country country
1997 83818 5688 55047 71753 83818 776830 17230 444238 581812 7768302006 159318 13001 118686 146838 159318 395054 31580 250577 358320 395054Total 1268768 94690 885055 1123626 1268768 6060088 226741 3674106 4956347 6060088Share (%) 100 7.5 69.8 88.6 100 100 3.7 60.6 81.8 100
7. APPENDIX
0.0
2.0
4.0
6.0
8F
ract
ion
0 5000 10000 15000 20000 25000 30000 35000Product level sophistication (sh4, 1997)
®
Figure 1 – Density of product-level export sophistication, 1997. Source: Authors’ computa-tions based on Chinese customs, BACI and WDI.
31

CEPII, WP No 2010 – 32 Export performance of China’s domestic firms: the role of foreign export spillovers
0.1
.2.3
.4.5
Fra
ctio
n
0 .5 1 1.5 2 2.5 3Diff in sophistication Foreign/Domestic (province−sh2, 1997)
®
Figure 2 – Density of Foreign-Domestic ODT export sophistication, 1997. Source: Authors’computations based on Chinese customs, BACI and WDI.
Table 10 – Marginal impact-SummaryAll sample ODT PCS Soph. Not soph. Low soph. gap High soph.gap
Col. 8 Col. 4 Col. 6 Col. 4 Col. 5 Col. 3 Col. 5Tab. 4 Tab. 5 Tab. 5 Tab. 7 Tab. 7 Tab. 8 Tab. 8
Foreign presence per se 1.6 1.53 n.s. 2.5 n.s. 2.26 n.s.Foreign exp. val 0.04 0.04 n.s. 0.02 0.05 0.03 0.05
Figures correspond to the increase in the average probability that domestic firms start exporting in a product/countrypair when foreign firms’ exports are positive for this product/country pair (first row) and when foreign firms’ exportsrise by 10% (second row).
32

CEPII, WP No 2010-32 Export performance of China’s domestic firms: the role of foreign export spillovers
33
LIST OF WORKING PAPERS RELEASED BY CEPII
An Exhaustive list is available on the website: \\www.cepii.fr. To receive an alert, please contact Sylvie Hurion ([email protected]).
No Tittle Authors
2010-31 Wholesalers in International Trade M. Crozet, G. Lalanne& S. Poncet
2010-30 TVA et taux de marge: une analyse empirique sur données d’entreprises
P. Andra, M. Carré& A. Bénassy-Quéré
2010-29 Economic and cultural assimilation and integration of immigrants in europe
M. Aleksynska& Y. Algan
2010-28 Les firmes françaises dans le commerce de service G. Gaulier, E. Milet& D. Mirza
2010-27 The world Economy in 2050: a Tentative Picture J. Fouré,A. Bénassy-Quéré
& L. Fontagné
2010-26 Determinants and Pervasiveness of the Evasion of Customs Duties
S. Jean& C. Mitaritonna
2010-25 On the Link between Credit Procyclicality and Bank Competition
V. Bouvatier,A. Lopez-Villavicencio
& V. Mignon
2010-24 Are Derivatives Dangerous? A Literature Survey G. Capelle-Blancard
2010-23 BACI: International Trade Database at the Product-Level – The 1994-2007 Version
G. Gaulier& Soledad Zignago
2010-22 Indirect Exporters F. McCann
2010-21 Réformes des retraites en France : évaluation de la mise en place d’un système par comptes notionnels
X. Chojnicki& R. Magnani

CEPII, WP No 2010-32 Export performance of China’s domestic firms: the role of foreign export spillovers
34
No Tittle Authors
2010-20 The Art of Exceptions: Sensitive Products in the Doha Negotiations
C. Gouel, C. Mitaritonna & M.P. Ramos
2010-19 Measuring Intangible Capital Investment: an Application to the “French Data”
V. Delbecque& L. Nayman
2010-18 Clustering the Winners: The French Policy of Competitiveness Clusters
L. Fontagné, P. Koenig,F. Mayneris &S. Poncet
2010-17 The Credit Default Swap Market and the Settlement of Large Defauts
V. Coudert & M. Gex
2010-16 The Impact of the 2007-10 Crisis on the Geography of Finance
G. Capelle-Blancard& Y. Tadjeddine
2010-15 Socially Responsible Investing : It Takes more than Words
G. Capelle-Blancard& S. Monjon
2010-14 A Case for Intermediate Exchange-Rate Regimes V. Salins& A. Bénassy-Quéré
2010-13 Gold and Financial Assets: Are they any Safe Havens in Bear Markets?
V. Coudert& H. Raymond
2010-12 European Export Performance A. Cheptea, L. Fontagné& S. Zignago
2010-11 The Effects of the Subprime Crisis on the Latin American Financial Markets: An Empirical Assessment
G. Dufrénot, V. Mignon& A. Péguin-Feissolle
2010-10 Foreign Bank Presence and its Effect on Firm Entry and Exit in Transition Economies
O. Havrylchyk
2010-09 The Disorted Effect of Financial Development on International Trade Flows
A. Berthou
2010-08 Exchange Rate Flexibility across Financial Crises V. Coudert, C. Couharde& V. Mignon
2010-07 Crises and the Collapse of World Trade: The Shift to Lower Quality
A. Berthou & C. Emlinger
2010-06 The heterogeneous effect of international outsourcing on firm productivity
Fergal McCann
2010-05 Fiscal Expectations on the Stability and Growth Pact: Evidence from Survey Data
M. Poplawski-Ribeiro& J.C. Rüle

CEPII, WP No 2010-32 Export performance of China’s domestic firms: the role of foreign export spillovers
35
No Tittle Authors
2010-04 Terrorism Networks and Trade: Does the Neighbor Hurt J. de Sousa, D. Mirza& T. Verdier
2010-03 Wage Bargaining and the Boundaries of the Multinational Firm
M. Bas & J. Carluccio
2010-02 Estimation of Consistent Multi-Country FEERs B. Carton & K. Hervé
2010-01 The Elusive Impact of Investing Abroad for Japanese Parent Firms: Can Disaggregation According to FDI Motives Help
L. Hering, T. Inui& S. Poncet
2009-39 The Effects at Home of Initiating Production Abroad: Evidence from Matched French Firms
A. Hijzen, S. Jean& T. Mayer
2009-38 On Equilibrium Exchange Rates: Is Emerging Asia Different?
A. López-Villavicencio& V. Mignon
2009-37 Assessing Barriers to Trade in the Distribution and Telecom Sectors in Emerging Countries
L. Fontagné& C. Mitaritonna
2009-36 Les impacts économiques du changement climatique : enjeux de modélisation
P. Besson & N. Kousnetzoff
2009-35 Trade, Foreign Inputs and Firms’ Decisions: Theory and Evidence
M. Bas
2009-34 Export Sophistication and Economic Performance: Evidence from Chinese Provinces
J. Jarreau & S. Poncet
2009-33 Assessing the Sustainability of Credit Growth: The Case of Central and Eastern European Countries
V. Coudert & C. Pouvelle
2009-32 How do different exporters react to exchange rate changes? Theory, empirics and aggregate implications
N. Berman, P. Martin& Thierry Mayer
2009-31 Spillovers from Multinationals to Heterogeneous Domestic Firms: Evidence from Hungary
G. Békés, J. Kleinert& F. Toubal
2009-30 Ethnic Networks, Information, and International Trade: Revisiting the Evidence
G. J. Felbermayr, B. Jung& F. Toubal
2009-29 Financial Constraints in China: Firm-level Evidence S. Poncet, W. Steingress& H. Vandenbussche

CEPII, WP No 2010-32 Export performance of China’s domestic firms: the role of foreign export spillovers
36
2009-28 The Crisis: Policy Lessons and Policy Challenges A. Bénassy-Quéré,B. Coeuré, P. Jacquet
&J. Pisani-Ferry
2009-27 Commerce et flux financiers internationaux : MIRAGE-D A. Lemelin
2009-26 Oil Prices, Geography and Endogenous Regionalism: Too Much Ado about (Almost) Nothing
D. Mirza & H. Zitouna
2009-25 EU15 Trade with Emerging Economies and Rentier States: Leveraging Geography
G. Gaulier, F. Lemoine& D. Ünal
2009-24 Market Potential and Development T. Mayer
2009-23 Immigration, Income and Productivity of Host Countries: A Channel Accounting Approach
A. Mariya & A. Tritah
2009-22 A Picture of Tariff Protection Across the World in 2004 MAcMap-HS6, Version 2
H. Boumellassa, D. Laborde Debucquet & C. Mitaritonna
2009-21 Spatial Price Discrimination in International Markets J. Martin
2009-20 Is Russia Sick with the Dutch Disease V. Dobrynskaya& E. Turkisch
2009-19 Économies d’agglomération à l’exportation et difficulté d’accès aux marchés
P. Koenig, F. Mayneris& S. Poncet
2009-18 Local Export Spillovers in France P. Koenig, F. Mayneris& S. Poncet
2009-17 Currency Misalignments and Growth: A New Look using Nonlinear Panel Data Methods,
S. Béreau,A. López Villavicencio
& V. Mignon
2009-16 Trade Impact of European Measures on GMOs Condemned by the WTO Panel
A. C. Disdier & L. Fontagné
2009-15 Economic Crisis and Global Supply Chains
A. Bénassy-Quéré, Y. Decreux, L. Fontagné& D. Khoudour-Casteras
2009-14 Quality Sorting and Trade: Firm-level Evidence for French Wine
M. Crozet, K. Head& T. Mayer
2009-13 New Evidence on the Effectiveness of Europe’s Fiscal Restrictions
M. Poplawski Ribeiro

CEPII, WP No 2010-32 Export performance of China’s domestic firms: the role of foreign export spillovers
37
2009-12 Remittances, Capital Flows and Financial Development during the Mass Migration Period, 1870-1913
R. Esteves& D. Khoudour-Castéras
2009-11 Evolution of EU and its Member States’Competitiveness in International Trade
L. Curran & S. Zignago
2009-10 Exchange-Rate Misalignments in Duopoly: The Case of Airbus and Boeing
A. Bénassy-Quéré,L. Fontagné & H. Raff
2009-09 Market Positioning of Varieties in World Trade: Is Latin America Losing out on Asia?
N. Mulder, R. Paillacar& S. Zignago
2009-08 The Dollar in the Turmoil A Bénassy-Quéré,S. Béreau & V. Mignon
2009-07 Term of Trade Shocks in a Monetary Union: An Application to West-Africa
L. Batté,A. Bénassy-Quéré,
B. Carton & G. Dufrénot
2009-06 Macroeconomic Consequences of Global Endogenous Migration: A General Equilibrium Analysis
V. Borgy, X. Chojnicki, G. Le Garrec
& C. Schwellnus
2009-05 Équivalence entre taxation et permis d’émission échangeables
P. Villa
2009-04 The Trade-Growth Nexus in the Developing Countries: a Quantile Regression Approach
G. Dufrénot, V. Mignon& C. Tsangarides
2009-03 Price Convergence in the European Union: within Firms or Composition of Firms?
I. Méjean& C. Schwellnus
2009-02 Productivité du travail : les divergences entre pays développés sont-elles durables ?
C. Bosquet & M. Fouquin
2009-01 From Various Degrees of Trade to Various Degrees of Financial Integration: What Do Interest Rates Have to Say
A. Bachellerie,J. Héricourt & V. Mignon

Organisme public d’étude et de recherche en économie internationale, le CEPII est placé auprès du Centre d’Analyse Stratégique. Son programme de travail est fixé par un conseil composé de responsables de l’administration et de personnalités issues des entreprises, des organisations syndicales et de l’Université.
Les documents de travail du CEPII mettent à disposition du public professionnel des travaux effectués au CEPII, dans leur phase d’élaboration et de discussion avant publication définitive. Les documents de travail sont publiés sous la responsabilité de la direction du CEPII et n’engagent ni le conseil du Centre, ni le Centre d’Analyse Stratégique. Les opinions qui y sont exprimées sont celles des auteurs.
Les documents de travail du CEPII sont disponibles sur le site : http//www.cepii.fr