european institute of romania - EconStor
117
-
Upload
khangminh22 -
Category
Documents
-
view
0 -
download
0
Transcript of european institute of romania - EconStor
EUROPEAN INSTITUTE OF ROMANIA SPOS Project 2009 – Strategy and Policy Studies
Study no. 1
PUBLIC FINANCES: INTRODUCTION OF A MEDIUM-TERM BUDGETARY FRAMEWORK
Authors: Professor Moisă ALTĂR, Ph.D. ∗- coordinator
Professor Lucian Liviu ALBU, Ph.D.∗∗ Lecturer Ciprian NECULA, Ph.D.∗∗∗ Lecturer Gabriel BOBEICĂ∗∗∗∗
Bucharest December 2009
© European Institute of Romania, 2010
∗ Moisă ALTĂR, coordinator of the study, Ph.D. Professor, with experience in international projects and in the elaboration of the Romanian Quarterly Model (RQM), used by the Ministry of Finance in the analysis of fiscal – budgetary decisions. ∗∗ Lucian Liviu ALBU, Ph.D. Professor and Director of the Institute for Economic Forecasting, with an extensive experience in research for numerous macroeconomics and economic forecasting projects, at the national and international level. ∗∗∗ Ciprian NECULA, Ph.D. Lecturer at the Academy of Economic Studies, Monetary department, with experience in numerous research projects in fiscal policy and macroeconomic forecasting, as well as author of specialized publications. ∗∗∗∗ Gabriel BOBEICĂ, lecturer, Pd.D. candidate at the Academy of Economic Studies, participant in numerous research projects as member in the research team and author of specialized publications in the field of monetary policy and econometric models.

3
Foreword
The research - development program destined for the Strategy and
Policy Studies – SPOS, launched by the European Institute of Romania in
2006 in order to support Romania in exerting its attributions as EU member
state, has continued in 2009 through a new series of studies.
The topics approached have answered different requirements, of
great interest from the perspective of the evolution of the Romanian
economy and society, representing the result of both a consultation process
as well as of national and European programmatic documents, and
institutional requests, as they are perceived by representatives of the central
administration present at the European affairs coordination meetings.
The studies provide founding elements for the main directions of
action in order to bring to fulfillment some measures adopted at the
European level (Public finances: Introduction of a medium-term budgetary
framework; The Future of the European Community’s Resources and the
Implications for Romania’s Contribution to the EU Budget and The Impact
of the Implementation of the Energy-climate Change Package on the
Romanian Economy), as well as perspectives of Romanian policies aiming
to promote national reform measures in a European context (Flexicurity and
social dialogue in Romania– Perspectives on the implementation of
flexicurity principles in Romanian undertakings and Improving vocational
competencies among graduates and youths: A chance for the future).
The current series of studies has benefited from contributions of a
research team made up of:
Mr. Moisă Altăr, coordinator of the study, Ph.D. Professor, with
experience in international projects and in the elaboration of the Romanian
Quarterly Model (RQM), used by the Ministry of Finance in the analysis of
fiscal – budgetary decisions.
4
Mr. Lucian Liviu Albu, Ph.D. Professor and Director of the
Institute for Economic Forecasting, with an extensive experience in research
for numerous macroeconomics and economic forecasting projects, at the
national and international level.
Mr. Ciprian Necula, Ph.D. Lecture at the Academy of Economic
Studies, Monetary department, with experience in numerous research
projects in fiscal policy and macroeconomic forecasting, as well as author of
specialized publications.
Mr. Gabriel Bobeică, lecturer, Pd.D. candidate at the Academy of
Economic Studies, participant in numerous research projects as member in
the research team and author of specialized publications in the field of
monetary policy and econometric models.
Throughout the elaboration of the above mentioned study, the
research team has enjoyed the active contribution of Mrs. Agnes Nicolescu
as Project coordinator on behalf of the European Institute of Romania, as
well as the support of a working group, consisting in representatives of the
main central administration institutions with attributions in the field.
Gabriela Drăgan
Director general of the European Institute of Romania
5
CONTENTS
EXECUTIVE SUMMARY...................................................................7
1. INTRODUCTION.............................................................................17
2. DIRECTIONS FOR IMPROVING THE QUALITY OF PUBLIC
FINANCES ............................................................................................24
2.1. Implementing the medium-term budgetary framework ...............24
2.2. Long-term fiscal sustainability.....................................................31
2.3. Fiscal rules ...................................................................................34
2.4. Automatic stabilization mechanism .............................................37
2.5. The role of Stability and Growth Pact in ensuring European
fiscal discipline.............................................................................42
2.6. The coordination between monetary and fiscal policies ..............50
3. ASSESSING THE STRUCTURAL POSITION OF PUBLIC
FINANCES IN ROMANIA..................................................................53
3.1. Potential GDP and output-gap .....................................................53
3.2. Cyclically adjusted budget balance – a fundamental indicator
for the structural position of the public finances ..........................71
3.3. Medium term scenarios for the structural position of the Romanian
economy .......................................................................................79
4. PROBLEMS OF THE PUBLIC FINANCES IN ROMANIA.
THE EFFECTS OF THE CRISIS.......................................................85
4.1. Domestic economic framework ...................................................85
4.2. Macroeconomic evolutions and trends during 2010 - 2012.........93
4.3. The agreement with the international institutions and the economic
impact ...........................................................................................101
5. CONCLUDING REMARKS ...........................................................107
6. REFERENCES..................................................................................111

7
EXECUTIVE SUMMARY
In the context of the current economic and financial crisis, a
phenomenon without precedent since the Great Depression between 1928 –
1933, public finances stand for a fundamental vector aimed to ensure
macroeconomic stabilization and launch economic growth. This is clearly
pointed out in the recovery programs nationally adopted by numerous
countries, but also in those promoted by international organizations such as
the European Union1 or the International Monetary Fund
2.
A crucial element for ensuring the desired efficiency of fiscal and
budgetary policies is the continuous enhancing of the quality of public
finances. Currently, there is a major concern regarding increasing the
quality of public finances both at a national level, but also for international
institutions such as the European Commission, the International Monetary
Fund, OECD, World Bank etc. Accordingly, the European Commission has
set up a special work group which was given the task of delineating the
concept of quality of public finances together with identifying the
methodology and econometric techniques to measure the quality of national
public finances. A first result achieved by this work group is the
identification of those distinctive elements which define the multi-
dimensional nature of the concept of quality of public finances, namely the
size of the public sector (revenues, expenditures), the fiscal position and
sustainability, the structure and efficiency of public of the revenue system
and governance of public finances, together with the interconnectedness of
these elements.
As highlighted by documents elaborated by the European
Commission, the quality of public finances has a major impact on the
business environment, on economic growth and social welfare. In the
aforementioned approach of the European Commission, a central element of
the concept of quality of public finances is fiscal governance. By this it is
generally understood the assembly of the fiscal rules used by a country, as
well as fiscal institutions, budgetary procedures and medium-term
frameworks. The achievement of a sound fiscal governance is ensured by
the existence of a fiscal strategy with strong scientific and praxeological
grounds, clear rules enforced by law for fiscal and budgetary policies, and
1 „European Economic Recovery Programme,” november 2008.
2 „IMF Staff Position Note, dec. 2008: Fiscal Policy for the Crisis.”
European Institute of Romania – Strategy and Policy Studies
8
an Independent Fiscal Council in charged with the supervision of the fiscal
policy as a whole.
It is necessary that both the Government and the independent Fiscal
Council firmly observe the principles that guarantee the coherence and
effectiveness of fiscal policies.
Furthermore, the transparence and predictability of fiscal policy
should be ensured. A crucial prerequisite for enhancing the quality and
stability of the macroeconomic environment is that the business sector is
informed with respect to the fiscal strategy, as well as any fiscal or
budgetary decisions. Moreover, the principle of responsibility, the
principle of efficiency and the principle of social equity etc should be
promoted through appropriate methods. It is obvious that in order to create a
coherent institutional and regulatory framework, both fiscal strategy and the
medium term budgetary objectives need to be enforced by law, being passed
by the Parliament.
The revision of the Stability and Growth Pact in 2005 has placed a
special emphasis on the issue of increasing the quality of fiscal governance
in Europe. Numerous studies signed by the European Commission, OECD,
IMF, World Bank and other international institutions have highlighted the
fact that a sound fiscal governance is a sine-qua-non prerequisite for
ensuring the success of structural reforms. Moreover, it has been
emphasized that countries with well established medium term budgetary
objectives, with sound fiscal rules and independent fiscal institutions will
benefit from stable budgetary positions and sustainable rates of growth.
In Romania, as well as in other countries of the European Union, there
are deep concerns over increasing the quality of public finances and continually
improving fiscal governance. Unfortunately, as revealed by a scoreboard of the
quality of public finances in EU-27, made public by the European Commission
in August 2009, Romania is placed on the 27th position with respect to fiscal
governance. On a scale ranging from -30 to +30, where a score which lies
between -30 and -10 reflects an ”extremely poor” quality of fiscal governance,
Romania was attributed a score equal to -13.3.
Considering the quality of public finances in Romania, the European
Commission has reaffirmed in June 2008 its recommendations for
implementing a budgetary framework on the medium and long term and
taking measures for improving the quality of public finances in every
respect. The Commission’s advice is based on the fact that these measures
would significantly contribute to strengthen the budgetary credibility and
predictability and they will facilitate a better reflection of the long term
growth strategy in the overall budget, according to the Lisbon agenda.
Public Finances: Introduction of a medium-term budgetary framework
9
Moreover, this will contribute to a strong budgetary discipline and the use of
additional revenues for reducing the deficit.
The issue of improving the fiscal governance in Romania is also
addressed in the Memorandum signed in May 2009 by the Romanian
Government and the European Union. The Memorandum includes a set of
firm measure, such as:
� Preparing a new law on fiscal responsibility, aimed to ensure
that the multi-annual budgetary programming is operational;
� Establishing an independent fiscal council that will elaborate
macroeconomic forecasts, expenditures and revenues forecasts
and any other elements necessary for budgetary planning.
It is worth mentioning that the implementation of a medium-term
budgetary framework is an objective undertook by the Romanian
Government through the Convergence Program in 2009.
Considering the strong need for enhancing the quality of public
finances in Romania, the present study introduces a set of elements
necessary for establishing the fiscal strategy and implementing a
budgetary framework on the medium term. Moreover, the study analyses
the elements that are essential to elaborate fiscal policies in such a manner
that they provide stability to the budgetary processes and diminish their
volatility.
The first part of the paper establishes the major directions for
effective action that has to be taken for improving public finances in
Romania, based on increasing their quality and that of fiscal governance.
Taking into consideration that a crucial direction for improving the
fiscal governance and strengthening the role of public finances for
macroeconomic stabilization and launching economic growth is given by
the adoption of a medium term budgetary framework, section 2.1
addresses the most important aspects regarding this issue and highlights the
means of actions that have to be taken in order to implement it. The present
study takes into consideration the diverse experience of countries in the
European Union that have successfully implemented a medium term
budgetary framework.
The topic of implementing a medium term budgetary framework is
tackled in close connection with emphasizing the need to elaborate a sound
fiscal strategy and setting up an independent fiscal council that will
supervise the way this strategy is being put into practice. Furthermore, the
study analyses the stages that need to be fulfilled in order to successfully
implement a medium term budgetary framework. Of utmost importance is
the stage of elaborating a set of macroeconomic forecasts on scientific
European Institute of Romania – Strategy and Policy Studies
10
grounds and which are based on a system of operational econometric
models designed starting from the latest results achieved worldwide.
It is worth noting that the system of models is a crucial element for
establishing fiscal strategies, for highlighting the fiscal risk factors, but also
for ascertaining the impact of global shocks or of those originating in the
domestic economy. Considering the fact that the Stability and Growth Pact
places a special emphasis on identifying the structural positions of the
economy, the system of models should allow an accurate estimation of the
potential GDP and of the cyclically adjusted balance (CAB), together
with their dynamics.
Section 2.2 addresses the problem of long term fiscal
sustainability, analyzing the specific indicators and emphasizing their
informational power. The concept of sustainability refers to the future
implications of the adopted fiscal policies and choosing those policies that
ensure budgetary solvency. The present paper establishes the conditions for
sustainability, which can be deduced from the inter-temporal budgetary
constraints. A special emphasis is placed on the methodology used by the
international institutions to analyze fiscal sustainability.
A fundamental component of fiscal governance and of a successful
implementation of a medium term budgetary framework is given by the
existence of fiscal rules whose putting into practice must be firmly
supervised. Additionally, both the Maastricht Treaty and the Stability and
Growth Pact have as fundamental pillars the two fiscal rules, namely that
regarding the budget deficit and that referring to public debt. Section 2.3
addresses the issue of fiscal rules, reflecting the means of action and their
contribution to strengthening fiscal discipline and budgetary stability. In
addition, the section analyses the prerequisites a fiscal rule should fulfill in
order to efficiently contribute to implementing fiscal policies, putting
emphasis on measuring the performance of the budgetary system by means
of an aggregate indicator, namely the Fiscal Rules Index.
The fiscal rules issue is in close connection with the mechanism of
automatic stabilization, which ensures the correlation of the fiscal policy
with the cyclical positions of the general system of the economy. It is a
generally acknowledged fact that promoting the appropriate pro-cyclical or
counter-cyclical fiscal policies, according to the cyclical position of the
economy, is of utmost importance. Section 2.4 analyses the mechanism of
automatic stabilizers, reflecting their role in ensuring efficient
macroeconomic policies. In order to assess the impact that different types of
exogenous or endogenous shocks can have on the fiscal position, the section
presents a model that emphasizes the role of automatic stabilizers for
Public Finances: Introduction of a medium-term budgetary framework
11
ensuring a favorable evolution of GDP and inflation and for dampening out
the supply and demand shocks.
A key element for a successful implementation of a medium term
budgetary framework is given by the fiscal discipline. Within the European
Union, the Stability and Growth Pact adopted in 1997 and revised in 2005,
plays an essential role in ensuring fiscal discipline. Section 2.5 reviews the
main provisions of the Stability and Growth Pact, revealing the
mechanisms through which fiscal disciplined in attained in the European
Union. A special emphasis is placed on the excessive deficit procedure,
which, unfortunately, has been initiated on Romania, as well, starting with
June 2009.
The firm implementation of a coherent macroeconomic strategy able
to ensure the exit from the crisis period and launch economic growth is in
close connection with an efficient correlation between monetary and
fiscal policies. It is common knowledge that, in the case of no correlation
between the two sides of macroeconomic policy, the fiscal policy can
deteriorate price stability, as well as a discretionary monetary policy can
alter the fiscal position of a country. Considering the importance of
monetary and fiscal policy synchronization, section 2.6 extensively
discusses this problem and highlights, based on a mathematical model, the
directions in which actions are needed in order to ensure macroeconomic
equilibrium.
Taking into consideration the fact that implementing a medium term
budgetary framework raises new challenges with respect to identifying the
structural position of the economy, the second part of the paper presents
the econometric techniques employed to estimate the potential GDP and the
output-gap, and consequently, the estimation of the cyclically adjusted
balance (CAB).
It is generally agreed upon that the potential GDP and the output gap
are a set particularly important macroeconomic variables for the design of
fiscal policies. These are not directly observable variables. Consequently, is
important that these fundamental variables are estimated as precise as
possible. Section 3.1 presents the results regarding the potential GDP and
output gap estimation for the Romanian economy. In order to obtain an
estimation characterized by a high robustness, the paper makes use of
techniques based on production functions and on techniques based on
econometric filters (Kalman filters, band-pass, wavelet etc.). The
estimations of the output gap obtained through the production function
approach and by employing econometric filters can be aggregated to yield
an overall measure of the Romanian business cycle. The obtained results
European Institute of Romania – Strategy and Policy Studies
12
show that during the period 2001 – 2008, the average growth rate of the
potential GDP was 5.5%, which emphasizes the fact that this stage stands
for a period of sustained economic growth of the Romanian economy.
Section 3.2 presents the results regarding the size of the Romanian
cyclically adjusted balance (CAB). In order to estimate this indicator
which is crucial in order to know the structural position of Romanian public
finances, it was necessary to calculate the elasticity of budgetary revenues
and expenditures with respect to the size of the output gap. The analysis
revealed that, in the case of the Romanian economy, the semi-elasticity
indicator of the budgetary account with respect to the output gap equaled, on
average, 0,285 in the period 1998 – 2008, whereas the amplitude of the
cyclical component of the budgetary balance amounted to 1% of GDP.
By employing the CAPEF-QM econometric model, elaborated by
the Center for Economic and Financial Analysis and Prognosis, authors
have put forward a set of scenarios regarding the medium term evolution
of the structural position of the Romanian economy, and the results are
being presented within section 3.3. The simulations take into consideration
various evolutionary paths for the exogenous variables, yielding a
benchmark scenario, an optimistic one and a pessimistic one. For all the
considered scenarios, the output gap remains negative for the entire forecast
horizon, 2009 – 2012, whereas the structural position of public finances is
characterized by a continuously diminishing cyclically adjusted balance
(CAB).
The final part of the paper analyses the specific problems
associated with public finances in Romania, putting an emphasis on the
effects of the current economic and financial crisis. Starting from the
economic environment in the year 2009, the paper presents the evolution
and macroeconomic trends foreseen for the period 2010 – 2012. Moreover,
we present the economic impact of the agreement signed by Romania with
international institutions in May.
The present study emphasizes the role of public finances in reducing
the effects of the current financial and economic crisis that Romania is
experiencing, as well as for ensuring the premises for launching economic
growth. It is of utmost importance to increase the quality of public finances,
of fiscal governance and to strengthen fiscal discipline through a better
management of budgetary resources.
In order to enhance the quality of fiscal governance, institutional
and legislative measures are urgently needed, as follows: a new law of
fiscal accountability, setting up a long term fiscal strategy, transition to a
multi-annual budgetary programming by implementing a medium term
Public Finances: Introduction of a medium-term budgetary framework
13
budgetary framework, introducing strict fiscal rules, setting up an
independent fiscal council and so on. In order to guarantee the effectiveness
and efficiency of the adopted measures, it is crucial that the fiscal strategy
and the medium term budgetary framework, as well as the independent
fiscal council, are governed by law enforced by the Parliament.
The study underlines the fact that the implementation of a
medium-term fiscal-budgetary framework requires the fulfillment of
several important stages, and its design should take into consideration
possible risk factors which may arise.
A first stage which needs to be accomplished refers to the
identification of the type of budgetary framework about to be
implemented according to the national institutional structure, existing
human resources and the restrictions imposed on Romania, as member of
the European Union.
Taking into consideration the advantages and disadvantages of each
main type of medium-term budgetary framework presented in the paper, as
well as the distinctive features of the Romanian economy, the authors
recommend the use of a budgetary framework which is fixed with
respect to the limit budgetary indicators and changeable with respect to
the envisaged horizons. The adoption of such a medium-term budgetary
framework will allow the change of the limit regarding the budgetary
indicators only in extraordinary circumstances, based on the approval of the
independent fiscal council. Moreover, the independent fiscal council would
have the ability to analyze the budgetary impact of any proposal to modify
the budgetary framework, especially in the pre-election periods.
As far as the independent fiscal council is concerned, it is
recommended that it is made up of highly qualified specialists, with
profound knowledge of Macroeconomics, with a vast experience in the
fiscal field and have proved the potential to accurately interpret the
economic and budgetary framework.
A sine qua non prerequisite for a successful implementation of a
medium-term budgetary framework and an efficient functioning of the
independent fiscal council is given by robust and highly accurate forecasts,
for at least a three year horizon. To this purpose, it is required that a system
of econometric models is elaborated according to high standards with
respect to the quality of forecasts, and this system will allow a real time
evaluation of the structural position of public finances. In addition, the
system of models should allow for the fiscal risks measurements, as well
as for the evaluation of the impact of various endogenous and
exogenous shocks on the fiscal position. It is also recommended that the
European Institute of Romania – Strategy and Policy Studies
14
system of national models is compatible with that used by the European
Commission and by the International Monetary Fund.
A special attention is to be paid to the training of specialists which
ensure that the budgetary framework is operational on the medium term, as
well as exploiting and updating the system of models.
Once the medium-term budgetary framework is adopted, a
scientifically-founded fiscal strategy with is required, allowing the
projection of budgetary processes, the implementation of fiscal rules,
especially of those referring to spending limits, as well as connecting the
annual budgets to the medium-term budgetary framework.
The fiscal strategy which is about to be adopted should place a
special emphasis on investments in human capital and on those aimed to
develop the scientific and technological potential of the country –
fundamental vectors for progress and nation welfare.
The fiscal strategy should be targeted at creating a national
adaptable and efficient fiscal system. The national fiscal system is made
up of the institutions, procedures and mechanisms that ensure the
programming and implementation of budgetary policies. In fact, this
represents the decisional environment in which agents plan their activity.
As the present study emphasizes, the National Fiscal System is
based on the following fundamental pillars:
� The medium-term budgetary framework;
� The independent fiscal council;
� The fiscal rules;
� The budgetary procedures.
It is worth noting that each of the four pillars stands for a dynamic
and complex system, with numerous direct and inverse connexions (feed-
backs) with the other systems. The corroborated action of the four pillars
determines the effectiveness and the efficiency of the national fiscal system
and finally, the evolution path of the national economy, as a whole. It is
necessary to stress out the fact that the four pillars have a complementary
and synergetic action, neither of those being able to substitute the action of
other pillars.
The experience of countries that have successfully adopted a
strategy for creating a national flexible and efficient fiscal system has
revealed that the four fundamental pillars must be implemented in the spirit
of a unifying vision, as apposed to a fragmented one. In general, countries
that have implemented the four fundamental pillars in a fragmented manner
have failed in achieving fiscal reforms.
Public Finances: Introduction of a medium-term budgetary framework
15
It is obvious that the successful implementation of a coherent fiscal
strategy should rely on several essential prerequisites, such as an accounting
system in line with international standards, a coherent statistical system, the
existence of a project - based budgeting ability, full authority granted to the
Ministry of Finance with respect to budgetary proposals and so on.
The fiscal reform on which the national fiscal system relies should
be elaborated with utmost attention and competence. The fiscal strategy that
serves in achieving the reform must take into account the distinctive
economic conditions in every country, existing institutions and traditions, as
well as the experience of countries that have successfully implemented these
reforms. Otherwise, there is the risk of creating non-functional institutions,
which are not anchored in the economic realities of a given country.
Fiscal rules currently play a central role in the fiscal strategies
adopted at the level of the European Union. It is worth mentioning that a
successful implementation of the fiscal rules can only be achieved within a
medium-term budgetary framework and based on budgetary procedures able
to ensure fiscal discipline. It is obvious the adoption of strict fiscal rules
should play a central role at the level of the fiscal strategy of Romania as
well.
Considering the intellectual potential existing in Romania, the
possibility to creatively make use of other countries’ experiences, the
transfer of expertise ensured by the European Commission and other
international financial institutions, we are certain that Romania will succeed
in elaborating an efficient national fiscal system able to facilitate the
economic and social progress of the country.

17
1. INTRODUCTION
In the context of the current economic and financial crisis, a
phenomenon without precedent since the Great Depression between 1928 –
1933, public finances stand for a fundamental vector aimed to ensure
macroeconomic stabilization and launch economic growth. This is clearly
pointed out in the recovery programs nationally adopted by numerous
countries, but also in those promoted by international organizations such as
the European Union3 or the International Monetary Fund
4.
A crucial element for ensuring the desired efficiency of fiscal and
budgetary policies is the continuous enhancing of the quality of public
finances. Currently, there is a major concern regarding increasing the
quality of public finances both at a national level, but also for international
institutions such as the European Commission, the International Monetary
Fund, OECD, World Bank etc. Accordingly, the European Commission has
set up a special work group which was given the task of delineating the
concept of quality of public finances together with identifying the
methodology and econometric techniques to measure the quality of national
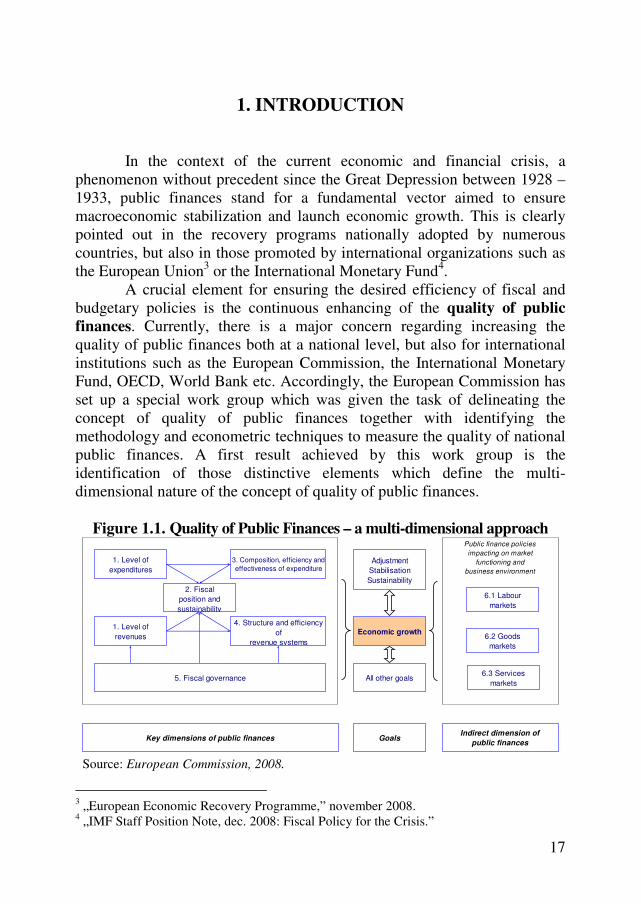
public finances. A first result achieved by this work group is the
identification of those distinctive elements which define the multi-
dimensional nature of the concept of quality of public finances.
Figure 1.1. Quality of Public Finances – a multi-dimensional approach
1. Level of
expenditures
1. Level of
revenues
3. Composition, efficiency and
effectiveness of expenditure
4. Structure and efficiency
of
revenue systems
2. Fiscal
position and
sustainability
5. Fiscal governance
Key dimensions of public finances
Adjustment
Stabilisation
Sustainability
Economic growth
All other goals
GoalsIndirect dimension of
public finances
Public finance policies
impacting on market
functioning and
business environment
6.1 Labour
markets
6.2 Goods
markets
6.3 Services
markets
Source: European Commission, 2008.
3 „European Economic Recovery Programme,” november 2008.
4 „IMF Staff Position Note, dec. 2008: Fiscal Policy for the Crisis.”
European Institute of Romania – Strategy and Policy Studies
18
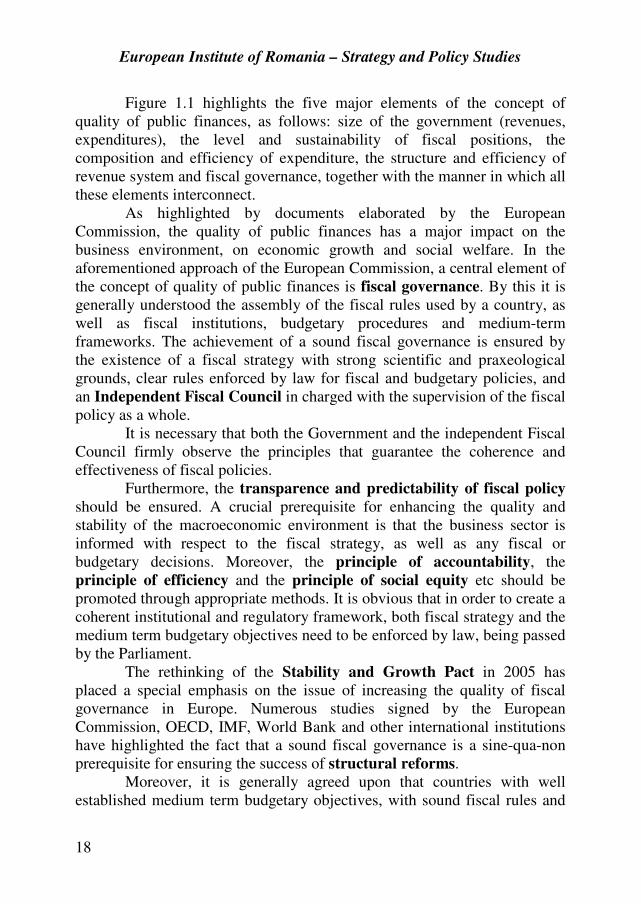
Figure 1.1 highlights the five major elements of the concept of
quality of public finances, as follows: size of the government (revenues,
expenditures), the level and sustainability of fiscal positions, the
composition and efficiency of expenditure, the structure and efficiency of
revenue system and fiscal governance, together with the manner in which all
these elements interconnect.
As highlighted by documents elaborated by the European
Commission, the quality of public finances has a major impact on the
business environment, on economic growth and social welfare. In the
aforementioned approach of the European Commission, a central element of
the concept of quality of public finances is fiscal governance. By this it is
generally understood the assembly of the fiscal rules used by a country, as
well as fiscal institutions, budgetary procedures and medium-term
frameworks. The achievement of a sound fiscal governance is ensured by
the existence of a fiscal strategy with strong scientific and praxeological
grounds, clear rules enforced by law for fiscal and budgetary policies, and
an Independent Fiscal Council in charged with the supervision of the fiscal
policy as a whole.
It is necessary that both the Government and the independent Fiscal
Council firmly observe the principles that guarantee the coherence and
effectiveness of fiscal policies.
Furthermore, the transparence and predictability of fiscal policy
should be ensured. A crucial prerequisite for enhancing the quality and
stability of the macroeconomic environment is that the business sector is
informed with respect to the fiscal strategy, as well as any fiscal or
budgetary decisions. Moreover, the principle of accountability, the
principle of efficiency and the principle of social equity etc should be
promoted through appropriate methods. It is obvious that in order to create a
coherent institutional and regulatory framework, both fiscal strategy and the
medium term budgetary objectives need to be enforced by law, being passed
by the Parliament.
The rethinking of the Stability and Growth Pact in 2005 has
placed a special emphasis on the issue of increasing the quality of fiscal
governance in Europe. Numerous studies signed by the European
Commission, OECD, IMF, World Bank and other international institutions
have highlighted the fact that a sound fiscal governance is a sine-qua-non
prerequisite for ensuring the success of structural reforms.
Moreover, it is generally agreed upon that countries with well
established medium term budgetary objectives, with sound fiscal rules and

Public Finances: Introduction of a medium-term budgetary framework
19
independent fiscal institutions will benefit from stable budgetary positions
and sustainable rates of growth.
In Romania, as well as in other countries of the European Union, there
are deep concerns over increasing the quality of public finances and continually
improving fiscal governance. Unfortunately, as revealed by a scoreboard of the
quality of public finances in EU-27, made public by the European Commission
in August 2009, Romania is placed on the 27-th position with respect to fiscal
governance. On a scale ranging from -30 to +30, where a score which lies
between -30 and -10 reflects an ”extremely poor” quality of fiscal governance,
Romania was attributed a score equal to -13.3.
Figure 1.2 emphasizes by means of a pentagonal shape, the current
situation in Romania of all five components that define the concept of
quality of public finances. Except the components that reflect the size of the
government and the structure and efficiency of revenue system, the quality
of public finances in Romania is well below the European average.
Figure 1.2. The Quality of Public Finances in Romania5
Source: Barrios and Schaechter, 2009.
5 The interval (-30, +30) was set so that the average computed for EU-15 is equal to 0.
Assuming a normal distribution, the authors of the study recon that scores that lie between -
30 and -10 indicate an ”extremely poor” performance of the underlying indicator, values
that range between -10 and -4 show a ”poor” performance, values between -4 and +4
indicate an ”average” performance and values between +10 and +30 show an ”extremely
good” performance.
European Institute of Romania – Strategy and Policy Studies
20
Considering the quality of public finances in Romania, in June 2008,
the European Commission has reaffirmed its recommendations for
implementing a budgetary framework on the medium and long term and
taking measures for improving the quality of public finances in every
respect. The Commission`s advice is based on the fact that these measures
would significantly contribute to strengthen the budgetary credibility and
predictability and they will facilitate a better reflection of the long term
growth strategy in the overall budget, according to the Lisbon agenda.
Moreover, this will contribute to a strong budgetary discipline and the use of
additional revenues for reducing the deficit.
The issue of improving the fiscal governance in Romania is also
addressed by the Memorandum signed in May 2009 by the Romanian
Government and the European Union. The Memorandum posits a set of firm
measure, such as:
� Preparing a new law on fiscal accountability, aimed to ensure
that the multi-annual budgetary programming is operational;
� Establishing an independent fiscal council that will elaborate
macroeconomic forecasts, expenditures and revenues forecasts
and any other elements necessary for budgetary planning.
It is worth mentioning that implementing a medium-term budgetary
framework is an objective undertook by the Romanian Government through
the Convergence Program in 2009.
Considering the strong need for enhancing the quality of public
finances in Romania, the present study introduces a set of elements
necessary for establishing the fiscal strategy and implementing a budgetary
framework on the medium term. Moreover, the study analyses the elements
that are essential to elaborate fiscal policies in such a manner that they
provide stability to the budgetary processes and diminish their volatility.
The first part of the paper establishes the major directions for
effective action that has to be taken for improving public finances in
Romania, based on increasing their quality and that of fiscal governance.
Taking into consideration that a crucial direction for improving the
fiscal governance and strengthening the role of public finances for
macroeconomic stabilization and launching economic growth is given by
the adoption of a medium term budgetary framework, section 2.1
addresses the most important aspects regarding this issue and highlights the
means of actions that have to be taken in order to implement it. The present
study takes into consideration the diverse experience of countries in the
European Union that have successfully implemented a medium term
budgetary framework.
Public Finances: Introduction of a medium-term budgetary framework
21
The topic of implementing a medium term budgetary framework is
tackled in close connection with emphasizing the need to elaborate a sound
fiscal strategy and setting up an independent fiscal council that will
supervise the way this strategy is being put into practice. Furthermore, the
study analyses the stages that need to be fulfilled in order to successfully
implement a medium term budgetary framework. Of utmost importance is
the stage of elaborating a set of macroeconomic forecasts on scientific
grounds and which are based on a system of operational econometric
models designed based on the latest results achieved worldwide.
It is worth noting that the system of models is a crucial element for
establishing fiscal strategies, for highlighting the fiscal risk factors, but also
for ascertaining the impact of global shocks or of those originating in the
domestic economy. Considering the fact that the Stability and Growth Pact
places a special emphasis on identifying the structural positions of the
economy, the system of models should allow an accurate estimation of the
potential GDP and of the cyclically adjusted balance (CAB), together
with their dynamics.
Section 2.2 addresses the problem of long term fiscal
sustainability, analyzing the specific indicators and emphasizing their
informational power. The concept of sustainability refers to the future
implications of the adopted fiscal policies and choosing those policies that
ensure budgetary solvency. The present paper establishes the conditions for
sustainability, which can be deduced from the inter-temporal budgetary
constraints. A special emphasis is placed on the methodology used by the
international institutions to analyze fiscal sustainability.
A fundamental component of fiscal governance and of a successful
implementation of a medium term budgetary framework is given by the
existence of fiscal rules whose putting into practice must be firmly
supervised. Additionally, both the Maastricht Treaty and the Stability and
Growth Pact have as fundamental pillars the two fiscal rules, namely that
regarding the budget deficit and that referring to public debt. Section 2.3
addresses the issue of fiscal rules, reflecting the means of action and their
contribution to strengthening fiscal discipline and budgetary stability. In
addition, the section analyses the prerequisites a fiscal rule should fulfill in
order to efficiently contribute to implementing fiscal policies, putting
emphasis on measuring the performance of the budgetary system by means
of an aggregate indicator, namely the Fiscal Rules Index.
The fiscal rules issue is in close connection with the mechanism on
automatic stabilization, which ensures the correlation of the fiscal policy
with the cyclical position of the general system of the economy. It is a
European Institute of Romania – Strategy and Policy Studies
22
generally acknowledged fact that promoting the appropriate pro-cyclical or
counter-cyclical fiscal policies, according to the cyclical position of the
economy, is of utmost importance. Section 2.4 analyses the mechanism of
automatic stabilizers, reflecting their role in ensuring efficient
macroeconomic policies. In order to assess the impact that different types of
exogenous or endogenous shocks can have on the fiscal position, the section
presents a model that emphasizes the role of automatic stabilizers for
ensuring a favorable evolution of GDP and inflation and for dampening out
the supply and demand shocks.
A key element for a successful implementation of a medium term
budgetary framework is given by the fiscal discipline. Within the European
Union, the Stability and Growth Pact enacted in 1997 and revised in 2005,
plays an essential role in ensuring fiscal discipline. Section 2.5 reviews the
main provisions of the Stability and Growth Pact, revealing the mechanisms
through which fiscal disciplined in attained in the European Union. A special
emphasis is placed on the excessive deficit procedure, which, unfortunately,
has been initiated on Romania, as well, starting with June 2009.
The firm implementation of a coherent macroeconomic strategy able
to overcome the crisis period and launch economic growth is in close
connection with an efficient correlation between the monetary and the
fiscal policies. It is common knowledge that in the case of no correlation
between the two sides of macroeconomic policy, the fiscal policy can
deteriorate price stability, as well as a discretionary monetary policy can
alter the fiscal position of a country. Considering the importance of
monetary and fiscal policy synchronization, section 2.6 extensively
discusses this problem and highlights, based on a mathematical model, the
directions in which is optimum to act in order to ensure macroeconomic
equilibrium.
Taking into consideration the fact that implementing a medium term
budgetary framework raises new challenges with respect to indentifying the
structural position of the economy, the second part of the paper presents
the econometric techniques employed to estimate the potential GDP and the
output-gap, and consequently, the estimation of the cyclically adjusted
balance (CAB).
It is generally agreed upon that the potential GDP and the output gap
are a set particularly important macroeconomic variables for the design of
fiscal policies. These are not directly observable variables. Consequently, is
important that these fundamental variables are estimated as precise as
possible. Section 3.1 presents the results regarding the potential GDP and
output gap estimation for the Romanian economy. In order to obtain a
Public Finances: Introduction of a medium-term budgetary framework
23
highly robust estimation, the paper makes use of techniques based on
production functions and on techniques based on econometric filters
(Kalman filters, band-pass, wavelet etc.). The estimations of the output gap
obtained through the production function approach and by employing
econometric filters can be aggregated to yield an overall measure of the
Romanian business cycle. The obtained results show that during the period
2001 – 2008, the average growth rate of the potential GDP was 5.5%, which
emphasizes the fact that this stage stands for a period of sustained economic
growth of the Romanian economy.
Section 3.2 presents the results regarding the size of the Romanian
cyclically adjusted balance (CAB). In order to estimate this crucial
indicator of the structural position of the Romanian public finances, it is
necessary to compute the elasticity of budgetary expenditures and revenues
with respect to the output gap. The analysis reveals that, for Romania, the
semi-elasticity of the budgetary account with respect to the output gap
equaled, on average, 0,285 in the period 1998 – 2008, whereas the
amplitude of the cyclical component of the budgetary balance amounted to
1% of GDP.
By employing the CAPEF-QM econometric model, elaborated by
the Center for Economic and Financial Analysis and Prognosis, the authors
have put forward a set of scenarios regarding the medium term evolution
of the structural position of the Romanian economy, and the results are
being presented within section 3.3. The simulations take into consideration
the different evolutionary paths for the exogenous variables, yielding a
benchmark scenario, an optimistic one and a pessimistic one. Thus,
according to the benchmark scenario, the GDP growth rate will equal -
8.11% in 2009, 0.24% in 2010, 1.95% in 2011 and 2.75% in 2012. As far as
the budgetary balance is concerned, this will amount to -7.25% of GDP in
2009, reaching -1.83% of GDP in 2012.
For all the considered scenarios, the output gap remains negative for
the entire forecast horizon, 2009 – 2012, whereas the structural position of
public finances is characterized by a continuously diminishing cyclically
adjusted balance (CAB).
The final part of the paper analyses the specific problems
associated with public finances in Romania, putting an emphasis on the
effects of the current economic and financial crisis. On the grounds of the
economic environment in the year 2009, the paper presents the evolution
and macroeconomic trends envisioned for the period 2010 – 2012.
Moreover, we present the economic impact of the agreement signed by
Romania with international institutions in May this year.
24
2. DIRECTIONS FOR IMPROVING THE QUALITY
OF PUBLIC FINANCES
2.1. Implementing the medium-term budgetary framework
For EU members, as well as for the majority of other countries,
preparing the annual budget is the main step in the fiscal policy decision
process within the macroeconomic context. Taking into account that many
of the macroeconomic policy decisions have economic and budgetary
implications far beyond their initial annual horizon, and in order to ensure
budgetary coherence, since 1990, more and more states have adopted
medium-term budgetary frameworks (MTBF) generally covering three or
four years, including the budget year.
MTFB was introduced in the practice of public finances in various
countries responding to the necessity of improving the fiscal discipline,
together with the coherence, accountability and transparence of the
budgetary process. Typically, MTFB was introduced in countries that faced
high deficits or public debt, or encountered an economic downturn.
As it is known, Sweden experienced a period of financial and fiscal
crisis at the beginning of the 90’s. Following the experienced economic
situation, Sweden decided in 1997 to set up a MTFB based on three pillars:
� three-year nominal expenditure targets;
� 2 percent surplus on average, due to demographic
considerations;
� balanced local government budgets.
In the beginning of the 1990’s, Finland also experienced a severe
economic downturn. In response to the fiscal difficulties caused by the
recession in the early 1990’s, Finland adopted since 1991 a series of fiscal
measures, introducing in 1995 a multi-year expenditure framework. The
framework appears to have contributed to fiscal stability and prudence.
Finland’s current MTBF was introduced in 2003.
In the Netherlands, the MTBF was put in place in 1994, in order to
annihilate the phenomena of fiscal indiscipline with respect to budgetary
expenditure. The initial phase of the budgeting process takes place when a
new government enters into office and formulates an overall budgetary
policy for its entire four-year term. As no political party enjoys a majority in
the parliament, a special attention is awarded to the process of defining a
coalition agreement on the MTBF.
Public Finances: Introduction of a medium-term budgetary framework
25
In Spain, the MTBF was set up by the Budgetary Stability Law, in
2001. MTBF targets fiscal balance over the cycle for the general
government, excluding the social security system. To avoid the complexities
of defining the cyclical position, it establishes targets for three states of the
economy: a fiscal balance for normal growth; a small public deficit for low
growth; and a surplus for high growth.
One can find the roots of the MTBF in the United Kingdom in the
so called “golden rule” and “sustainable investment rule,” both put into
effect in 1998. The two rules represent the main pillars of the fiscal policy in
the UK, specifying that the government is allowed to borrow only for
investments, not for current expenditures. Technically, the golden rule is
that, over the cycle, the average current balance should be balanced or
better. Those rules are accompanied by a multi-annual (three years)
programming, setting targets for the budgetary expenditures beyond the
cyclical evolution of the economy.
Currently, the budget is prepared on a MTBF basis in the majority of
the EU countries.
The experience accumulated until now emphasizes the advantages
of the MTBF. First, MTBF increases the transparence of the fiscal policies,
with direct implications on the information of the private agents. Second,
MTBF consists of a set of perfected instruments for budgetary
programming, public expenditures management, and implementation of the
structural reforms. At the same time, MTBF allows a better analysis of the
effects of fiscal policy decisions.
An important advantage of the MTBF is that it ensures the dynamic
consistency of the fiscal policy decisions. Numerous studies highlighted the
fact that, in general, the majority of the fiscal policy decisions are adopted
for a short time horizon. The existence of the MTBF implies that the fiscal
policy authority takes into account the consistency in time of the projected
trajectories.
Although most of the EU members have put in place a MTBF, the
results differ significantly from one country to another. While in countries
such as UK, Spain, Sweden, or Finland the MTBF represents an important
instrument for budgetary management, in other countries, especially in the
new members, Romania included, the results are still unsatisfactory. Those
countries haven’t succeeded in the creation of an organic symbiosis
between the annual budgets and MTBF’s. More precisely, the annual
budgets are not correlated with the multi-annual program of the MTBF.
Although the advantages of the MTBF are beyond any doubt, setting
up in practice such a framework requires passing through an important
European Institute of Romania – Strategy and Policy Studies
26
number of steps, and spending a substantial amount of time, human and
monetary resources.
First, setting up a MTBF requires the existence of models able to
forecast the principal macroeconomic indicators and to provide accurate
information concerning the dynamic of GDP and its components, the
evolution of prices, exchange rates etc. Also, it is necessary to determine the
business cycle position of the economy.
Another requirement for setting up a functional MTBF is the
existence of a clear medium term strategy for the public finances,
including: the taxation system, public investment, the funding for the
educational, health and R&D systems etc. Macroeconomic forecasts and the
medium term strategy act as a basis for the prognosis concerning budgetary
revenues and expenditures, budgetary deficit, public debt a.o.
The next step consists of setting the multi-annual targets for the
budgetary resources available for the ministries or other public bodies.
Starting from these targets, the ministries and other public bodies distribute
the available budgetary resources to subordinate entities, for the given time
horizon. Obviously, one can require the ministries and other public bodies to
elaborate a multi-annual program starting from the limits of budgetary
resources allotted to them. This program has to be in full concordance with
the approved government and branch strategies. Ministries should assess the
costs of various programs and activities from their own accountability area,
should select between the alternatives concerning sectorial policy, and
should design the multi-annual breakdown of the selected alternatives. The
selection of the sectorial policies, as well as their distribution in time should
be based on performance criteria, and on optimization computations. In
order to ensure the coherence of the MTBF, the budgetary expenditures
related to activities started in previous years should be considered in a
distinct way from the ones related to new objectives.
MTBF also allows a better coordination between current and
investment expenditures. The entire design of the MTBF should be
conceived in such a way to enhance the budgetary performance, based on
the objective and operational efficiency of the public expenditures.
The experience of the countries which implemented the MTBF with
positive results shows that a first step in this direction is to introduce the
Programmatic Budget Classification, which keeps track of the budgetary
expenditures not only at the administrative bodies, but also on types of
programs oriented towards well defined outputs and outcomes. In many
countries, the evidence of these programs is correlated with the
classification of the General Government Expenditures by Function and
Public Finances: Introduction of a medium-term budgetary framework
27
Economic Category. The second step is to define the indicators which
provide information about the resources required for every program, and the
activities to be performed. The next step is to define the indicators which
characterize the envisaged results obtained in a given program.
It is worth mentioning that, in general, defining the indicators which
characterize the results obtained in various programs is a complex task,
requiring a great amount of work. These indicators should be set up at the
beginning of the program and should function for its entire duration. After
setting up the structure of the approved programs and the suitable indicators,
it is necessary to identify the required activities in order to attain the
established goals. For every program, there is a series of performance and
efficiency indicators to be calculated on the basis of the resources
consumed and on the expected results. The efficiency indicators measure the
relation between the expenditures and the expected results of each program.
Both at the branch level, as well as for the entire economy, the
resources necessary for the implementation of all the desired programs
exceed the available budgetary resources. After computing the efficiency
indicators for every program, the selection process can be performed by
solving an optimal programming problem in which the expenditure
threshold appears as one of the restrictions.
The European Commission manifests a vivid interest in elaborating
scientifically-founded methodologies allowing the assessment of budgetary
expenditures’ efficiency indicators. This concern is related to the necessity
to increase the quality of public finances in the European Union. The re-
shaped Growth and Stability Pact, the backbone of the fiscal policy in EU,
adopted in 2005, emphasizes the role of the increased quality of public
finances.
In support of this policy priority, a host of analytical and empirical
work on the quality of public finances (QPF) has already been carried out in
the EU. In 2004, the Economic Policy Committee decided to establish a
Working Group on the Quality of Public Finances, serving as a key
exchange on cross-country experiences.
The research conducted at the European Commission level
highlights that the QPF is a multi-dimensional and extremely complex
concept. The dimensions of the QPF concept can be approached considering
their contribution to the economic growth process, and to the process of
ensuring the fiscal stability of the country.
The European Commission methodology concerning the
computation of an aggregate indicator to quantify the quality of public
finances includes the following main aspects:
European Institute of Romania – Strategy and Policy Studies
28
1) the size of government;
2) fiscal position and sustainability;
3) composition, efficiency and effectiveness of expenditure;
4) structure and efficiency of revenue systems;
5) fiscal governance.
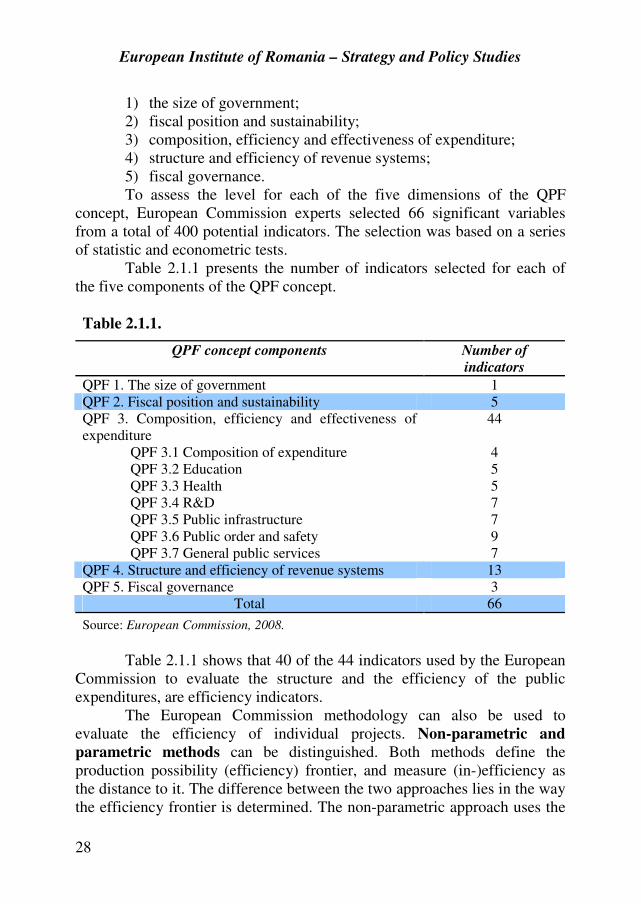
To assess the level for each of the five dimensions of the QPF
concept, European Commission experts selected 66 significant variables
from a total of 400 potential indicators. The selection was based on a series
of statistic and econometric tests.
Table 2.1.1 presents the number of indicators selected for each of
the five components of the QPF concept.
Table 2.1.1.
QPF concept components Number of
indicators
QPF 1. The size of government 1
QPF 2. Fiscal position and sustainability 5
QPF 3. Composition, efficiency and effectiveness of
expenditure
44
QPF 3.1 Composition of expenditure 4
QPF 3.2 Education 5
QPF 3.3 Health 5
QPF 3.4 R&D 7
QPF 3.5 Public infrastructure 7
QPF 3.6 Public order and safety 9
QPF 3.7 General public services 7
QPF 4. Structure and efficiency of revenue systems 13
QPF 5. Fiscal governance 3
Total 66
Source: European Commission, 2008.
Table 2.1.1 shows that 40 of the 44 indicators used by the European
Commission to evaluate the structure and the efficiency of the public
expenditures, are efficiency indicators.
The European Commission methodology can also be used to
evaluate the efficiency of individual projects. Non-parametric and
parametric methods can be distinguished. Both methods define the
production possibility (efficiency) frontier, and measure (in-)efficiency as
the distance to it. The difference between the two approaches lies in the way
the efficiency frontier is determined. The non-parametric approach uses the
Public Finances: Introduction of a medium-term budgetary framework
29
empirical data about inputs and outputs, taking into consideration their
convexity, while the parametric method defines an ex-ante specification for
the production function, for example a Cobb-Douglas specification. A
widely used non-parametric method is the Data Envelope Approach,
pioneered by the Nobel laureates Gérard Debreu and Tjalling Koopmans,
and developed by Charnes et al. (1978).
Recently, (in June 2009) the members of the Quality of Public
Finances Working Group issued a series of results about the size of the
efficiency indicators in EU-27. With respect to the efficiency and
composition of the budgetary expenditures, Romania is the 26th
, followed
solely by Bulgaria. Sweden ranks first, followed by Finland and Denmark.
When the components of the composition and efficiency indicator are
analyzed, Romania is ranked the 23rd
for the efficiency of the education
expenditure, the 26th
for the efficiency of health related expenditures, the
24th
for the R&D expenditures, the 27th
for the infrastructure, the 26th
for the
public order, and the 25 with respect to the efficiency of public services.
Also, it is worth mentioning that Romania is the 27th
in the classification
concerning fiscal governance.
As the Table 2.1.1 highlights, the European Commission’s
methodology assesses the fiscal governance indicator by looking at the
following aspects:
� the existence of a MTBF;
� the strength of the fiscal rules and the way of using them;
� the existence of an independent fiscal agency, enforced by the
parliament.
The information used by the European Commission methodology to
evaluate the MTBF related indicator comprises the existence of such a
framework, its legal base (by a law adopted in the parliament, or included in
the constitution etc.), the methods used to identify and correct the deviations
of the annual budgets from the multi-annual targets, the way the
macroeconomic forecasts and those regarding public revenues and
expenditures are elaborated etc.
As far as the revenues forecasts are concerned, the experience of
various countries showed that, generally, these are optimistic, introducing in
this way additional risk factors in the implementation of the MTBF.
The MTBF methodologies adopted by each country depends on the
particular national conditions, institutions etc.
MTBFs already adopted in various countries can be classified using
as criteria their time horizon, the way they cover all or just some of the
European Institute of Romania – Strategy and Policy Studies
30
budgetary activities, the legal framework, more precisely if they are adopted
by the parliament or only by the government etc.
An important criterion for MTBF’s classification is the continuity
in time of the process. Using this criterion, we distinguish two categories:
� flexible MTBF and
� fixed MTBF.
Flexible MTBF allows annual revision of the general objectives, in
order to adjust them according to the economy dynamics or the evolution of
the fiscal policy.
Fixed MTBF can’t be changed until the end of the time horizon,
excepting cases such as severe recessions, a government change etc.
Another classification divides the MTBFs in periodical and rolling.
A periodical framework covers a definided period of time and the new
framework is not to being drawn up before this period ends. In a rolling
framework, a new year is added at the end of the period covered by the
previous projections with the occasion of every annual update.
Combining the two criteria mentioned above, the following MTBF
typology can be obtained:
� periodical flexible frameworks;
� rolling flexible frameworks;
� periodical fixed frameworks and
� rolling fixed frameworks.
While most of the EU national MTBFs are flexible rolling
frameworks, UK and the Netherlands use periodical fixed frameworks.
Choosing the appropriate MTBF to implement in a specific country
depends on a series of factors, such as the institutional and legal structure,
traditions, the correlation mechanism between monetary and fiscal policies.
Irrespective of the MTBF type, its adoption by law has several
advantages, because it represents the main instrument that ensures the
implementation of the budgetary and fiscal strategy of a country. In the
same time, a properly conceived MTBF, applied and enforced is a force
vector which brings fiscal stability and fosters economic growth. MTBF has
an important role in the implementation of the fundamental principles of a
modern macroeconomic policy: transparence, accountability, equity etc.
In order to yield positive results, the design of a MTBF should obey
numerous exigencies.
First, an appropriate implementation of a MTBF requires accurate
forecasts for the macroeconomic indicators, which can be done only within
a well defined and continuously improved system of macroeconomic
models.
Public Finances: Introduction of a medium-term budgetary framework
31
A special attention should be oriented towards improving the
methods used to estimate the unobservable macroeconomic variables, such
as the potential GDP. As it is known, using the potential GDP one can
compute the output-gap, with a fundamental role in the design of
macroeconomic policies, both fiscal, as well as monetary. Therefore, the
modern robust programming econometric techniques are heavily
preoccupied to improve the methods of reducing the influence of uncertainty
on the output-gap and potential GDP estimation.
A fundamental indicator for ensuring fiscal sustainability is the
cyclically adjusted budget balance (CAB). SGP gives CAB a central role
in underlying the fiscal policy strategies that are able to ensure fiscal
sustainability. Because CAB estimation methods uses as input the output-
gap values, it is extremely important that the latter is estimated with
accuracy.
A successful implementation of the MTBF also implies the
existence of econometric techniques able to grasp the CAB dynamics, as a
consequence to the developments in variables such as the economic growth
rate, or the unemployment rate.
The existence of a scientific instrument for updating the forecasts,
conducting sensitivity analysis, or assessing the risks of government
guarantees is also required for a successful implementation of a MTBF.
Moreover, econometric models, such as the Vector Autoregressive
class of models, able to pinpoint the effects of various shocks, should be
added to the ensemble of methods and techniques required for the
implementation of a coherent and efficient fiscal policy.
2.2. Long-term fiscal sustainability
The sustainability concept refers to the future implications of the
present fiscal policies, more precisely, to the opportunity that the
government continues to promote current policies without jeopardizing
budgetary solvency.
The traditional approach of the fiscal sustainability starts from the
government’s budget constraint, which can be written in nominal terms as
follows:
tttttttt TPMBBRgP +∆+=++ −1)1( , (2.2.1)
where tP is the general level of prices, tg is the real government spending,
including transfers, tR is the average interest rate payed for the debt
European Institute of Romania – Strategy and Policy Studies
32
contracted at the end of the period 1−t , tB is the nominal value of the
bonds issued at the end of the period t , tM is the money supply at the
beginning of the period t , and tT stands for the total real taxes.
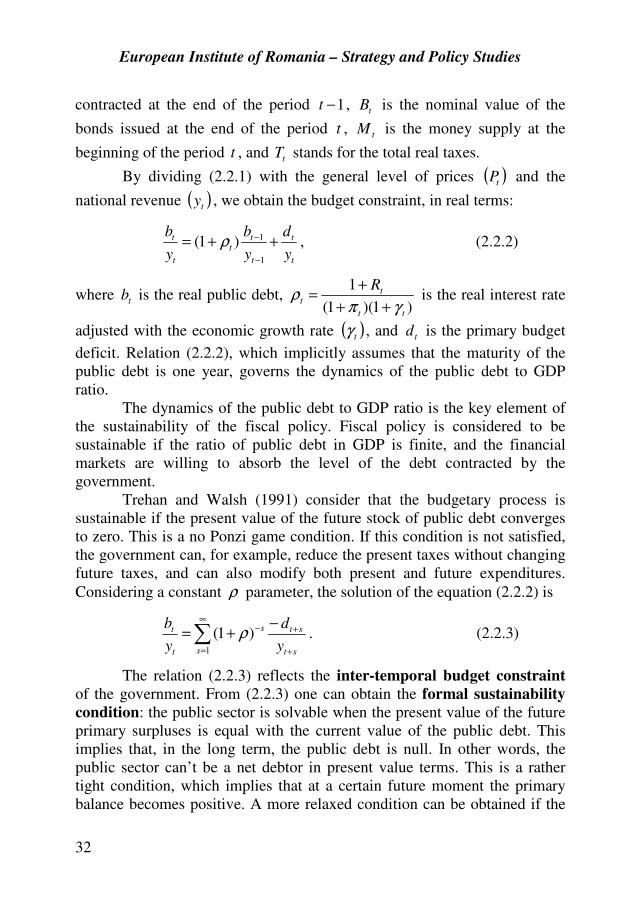
By dividing (2.2.1) with the general level of prices ( )tP and the
national revenue ( )ty , we obtain the budget constraint, in real terms:
t
t
t
tt
t
t
y
d
y
b
y
b++=
−
−
1
1)1( ρ , (2.2.2)
where tb is the real public debt, )1)(1(
1
tt
tt
R
γπρ
++
+= is the real interest rate
adjusted with the economic growth rate ( )tγ , and td is the primary budget
deficit. Relation (2.2.2), which implicitly assumes that the maturity of the
public debt is one year, governs the dynamics of the public debt to GDP
ratio.
The dynamics of the public debt to GDP ratio is the key element of
the sustainability of the fiscal policy. Fiscal policy is considered to be
sustainable if the ratio of public debt in GDP is finite, and the financial
markets are willing to absorb the level of the debt contracted by the
government.
Trehan and Walsh (1991) consider that the budgetary process is
sustainable if the present value of the future stock of public debt converges
to zero. This is a no Ponzi game condition. If this condition is not satisfied,
the government can, for example, reduce the present taxes without changing
future taxes, and can also modify both present and future expenditures.
Considering a constant ρ parameter, the solution of the equation (2.2.2) is
∑∞
= +
+− −+=
1
)1(s st
sts
t
t
y
d
y
bρ . (2.2.3)
The relation (2.2.3) reflects the inter-temporal budget constraint
of the government. From (2.2.3) one can obtain the formal sustainability
condition: the public sector is solvable when the present value of the future
primary surpluses is equal with the current value of the public debt. This
implies that, in the long term, the public debt is null. In other words, the
public sector can’t be a net debtor in present value terms. This is a rather
tight condition, which implies that at a certain future moment the primary
balance becomes positive. A more relaxed condition can be obtained if the
Public Finances: Introduction of a medium-term budgetary framework
33
level of the public debt to be obtained over a certain time horizon is fixed. In
this case, the relation (2.2.3) shows how the present value of the future
primary surpluses will reduce the debt to a level below the current one.
These issues are especially relevant in the actual context, when the set of
fiscal rules imposed to the EMU accessing countries set an upper limit for
the public debt share in GDP.
The IMF approach to fiscal sustainability
From the point of view of the loan granted by IMF to Romania, the
IMF approach to fiscal sustainability deserves a special attention.
Fiscal sustainability is an issue frequently addressed by IMF in its
relations with member states, and also in the context of the IMF research on
the fiscal transparence and vulnerability.
The first step in the IMF analysis on fiscal sustainability is a five
year time horizon forecast, based on the most recent data and assuming that
the actual economic policies are maintained. The result of this prognosis is
labeled as the base scenario. This scenario highlights the details related to
the key variables for the real, external, monetary and fiscal sectors:
economic growth, investment and inflation rate; imports, exports, current
account; money supply, domestic credit and interest rates; public revenues,
and expenditures other than interest, and interest expenditures.
These macroeconomic projections, as well as other funds that can be
obtained to cover the future deficits, are fed into the projection of the
government’s debt dynamics, and the sustainability it is assessed. Although
there are several criteria to evaluate the sustainability of fiscal policies, a
large share of public debt in GDP is seen as a major concern, because it is
always accompanied, on medium term, by a deterioration of the main
macroeconomic variables (for example, low economic growth, increased
inflation, high external debt and/ or low international reserves).
If the public debt dynamics is not favorable, then an alternative
scenario is drawn defining the adjustment path for the public debt share in
GDP and a satisfactory evolution for the macroeconomic indicators. An
adjustment plan for the primary deficit is being set up in order to attain the
target for the public debt, considering the fiscal actions able to induce the
appropriate adjustments. Also, the effects of the adjustments on the
macroeconomic variables (especially on economic growth, and on interest
rates, which has a capital influence on the sustainability) are to be evaluated.
Finally, the adjustment scenario can be drawn only after a large number of
iterations, many of these requiring a re-specification of the public debt
target.
European Institute of Romania – Strategy and Policy Studies
34
2.3. Fiscal rules
High budgetary deficits accumulated in the 70’s and in the 80’s in
the majority of the developed countries led in the early 90’s to a decrease in
the discretion of the fiscal policy, manifested through the introduction and
the spreading out of the fiscal rules. The last 15 years witnessed a
continuously increase in the number of the EU member states that had
resorted to fiscal rules, expressed either by numbers, either by an explicit
target for the fiscal variables.
The attractiveness of the fiscal rules as a way to limit the excesses of
the government with respect to public expenditures and budgetary deficits
lies in the apparent simplicity of a rule based fiscal framework. Once a fiscal
rule is adopted, it is relatively easy to assess the performance of the
government in copping with it, although it can be established beyond any
doubt the efficacy of such a rule. This happens mainly because it is difficult
to evaluate if the fiscal variables reactions is a response to policy measures,
or to the developments in macroeconomic variables, such as GDP,
employment, inflation etc. Therefore, in some cases, an apparent
conforming to a rule is just the consequence of favorable economic
conditions.
The arguments for restricting the discretion of fiscal policy rely on
three types of adverse effects of the government policies: (a) excessive
deficits; (b) the increased variability and (c) the pro-cyclicality of the fiscal
policy. The benefits that come from restricting the behavior of fiscal policy
gravitate around two major themes: fiscal discipline and a better
coordination between monetary and fiscal policies.
Excessive deficits. The persistent increase of the public debt in
many of the developed countries after the 70’s brought into attention the fact
that governments are inherently oriented towards high deficits and public
debts. Public debt accumulates because governments fail to internalize the
cost of additional debt and postpone the fiscal adjustments inline with the
cyclical evolution of the economy.
The variability of the fiscal policy. Political cycle literature (for
example Alesina and Tabellini, 1990; Alesina et al., 1997) identify two
types of political reasons that stand behind a discretionary fiscal policy:
accepting high deficits in electoral years and the changes in the preferences
of the political parties that have the power – the so-called partisan cycle.
Empirical studies show that: the fiscal policy changes are significant; the
welfare cost associated with these changes is relatively high, and the extent
Public Finances: Introduction of a medium-term budgetary framework
35
to which the government uses discretionary fiscal policy measures depends
on the institutional constraints.
The pro-cyclicality of the fiscal policy. The fiscal policy response
to the economic fluctuations has to be counter-cyclical: budgetary surplus in
the boom periods, and deficit in recession. But, in many cases, the fiscal
policy is pro-cyclical, meaning that in the boom periods the expenditures
grow faster than the revenues. Because the elasticity of expenditures with
respect to economic activity is lower than that of the revenues, the growth of
expenditures in the economic expansion period will lead, eventually, to
excessive deficits in the recession periods.
Another argument for constraining fiscal discretion by introducing a
rule based framework, is the necessity to coordinate fiscal policy with
monetary policy. The discretionary fiscal policy measures destroy
“monetary engagement.” If the policy objectives are different (for example:
the central bank is preoccupied by inflation, while the fiscal authority
follows a certain level of the economic activity, superior to the potential),
the competition between the two authorities: monetary and fiscal, can lead
to sub-optimal equilibrium levels for inflation and for aggregate output.
In a broad sense, fiscal rules refer to all the legislative and
procedural elements underpinning the making of budgetary policy (Ayuso-i-
Casals et al., 2007). In a much narrower sense, fiscal rules set numerical
target or ceilings for the budgetary aggregates: revenues, expenditures,
budgetary deficit, CAB, public debt etc. according to Kopits and Symansky
(1998), numerical fiscal rules represent permanent constraints on fiscal
policy, expressed in terms of a synthetic indicator of fiscal performance. As
Ayuso-i-Casals et al. (2007) point out, this definition excludes fiscal targets
that are subject to regular revisions, which is typical in most of the MTBFs
in force in many European countries.
The set of available fiscal rules applied in the economic practice is
relatively vast, the differences being given by: the budgetary variable
targeted, coverage and institutional design. The rules that pursue the
strength of the fiscal discipline set targets for the fiscal deficit or for the
public debt. The rules that envisage revenues and expenditures are designed
to re-equilibrate the structure of the budget, to stop the uncontrolled increase
of some expenditure categories etc. Fiscal rules can cover the entire
government sector, or a component of it, such as social security. A survey
produced by the Working Group on the Quality of Public Finances
(WGQPF) in 2006 showed that around 52 of the fiscal rules in force in the
EU member countries are budget balance rules, around 41 impose
European Institute of Romania – Strategy and Policy Studies
36
restrictions on borrowing and debt, 41 target expenditures, and 101
revenues. The same study suggests that most of the deficit and public debt
rules apply to the regional and local budgets, while the majority of the
expenditure ones refer to central and social security budgets. Two thirds of
the expenditure rules set ceilings for the level or for the growth rates of
those in nominal terms, the rest being defined in real terms, or as share in
GDP (Ayuso-i-Casals et al., 2007).
Fiscal rules operate both at national, and at supra-national level. At
supra-national level, the fiscal rules for the EU member states are set by the
Stability and Growth Pact.
Buti et al. (2003) analyze the quality of fiscal rules in the EU,
employing the criteria identified by Kopits and Symansky (1998), and
Inman (1996), for the design, implementation and enforcement.
Kopits and Symansky (1998) consider that an ideal fiscal rule
should be well-defined (clear, simple, transparent, consistent, and flexible),
should allow its effective implementation (by incorporating ex ante and ex
post enforcing mechanisms, and also, the opportunities for an efficient
monitoring process), and should be enforceable (with respect to decision,
amendment and sanctions)
The criteria mentioned above were developed to assess the quality
of domestic fiscal rules, at a national level. In order to be applicable at a
supra-national level, their design and implementation should be altered with
respect to at least two aspects:
� national sovereignty and subsidiarity. Fiscal rules should be as
neutral as possible with respect to the heterogeneous social
preferences of the countries. This impede the adoption of rules
which implicitly, or explicitly, comprise mentions to the role or
the size of public sector in the economy;
� tradeoffs between various criteria, such as simplicity and
flexibility, simplicity and adequacy, flexibility and
enforceability.
Inman (1996) considers that an efficient fiscal rule should target ex
post and not the ex ante deficit; should be impossible to be temporarily
suspended or abrogated by simple majority of the parliament; should offer
free access to the information to all interested parts, to indicate eventually
slippages; and should provide substantial penalties.
The implementation of the SGP sanctions is relatively difficult
because, in the absence of a federal authority, it is politically hard to impose
sanctions on a sovereign country. Thus, a set of rules in a multi-national
Public Finances: Introduction of a medium-term budgetary framework
37
context forces taking into account the reputation effects of the early warning
mechanisms, and of the excessive deficit procedures.
To summarize information about the coverage and the strength of
the numerical fiscal rules, Ayuso-i-Casals et al., (2007) design a Fiscal Rule
Index, comprising the following aspects:
� statutory basis of the rule: statutory or legal base of the rule, and
room for setting or revising objectives;
� body in charge of monitoring respect of the rule;
� body in charge of enforcement of the rule,
� enforcement mechanism of the rule, and
� media visibility of the rule.
By replacing the information on the strength of individual fiscal
rules by information on the properties of each fiscal rule with respect to
stabilization, the authors obtain the Fiscal Rule Cyclicality Index.
The studies of the European Commission (2006, 2007, 2008a,
2008b) show that a high level for the Fiscal Rules Index determines the
increase of the budgetary performance, reduction of expenditures, and
public debt shares in GDP.
2.4. Automatic stabilization mechanism
The entire set of the fiscal rules in the European Monetary Union
(EMU) relies on the automatic stabilization mechanism (cyclically induced
changes in budgetary revenues and expenditures), once the member states
attained the medium term fiscal positions according to the SGP. Adhering to
the medium-term budgetary target allows enough space for the automatic
stabilisers to work freely without exceeding the 3% of GDP deficit ceiling.
This non-discretionary approach should, at least in principle, guarantee that
the behaviour of the actual budget balance is always counter-cyclical and
hence, contributes to economic stability.
Fiscal policy rules relying on automatic stabilisers provide several
clear advantages. State-contingent revenues and expenditures, such as
unemployment benefits cushion the economic fluctuations without any
informational or implementation delays. Moreover, the impact of automatic
stabilizers is short, and if they operate symmetrical over the business cycle,
they don’t deteriorate the structural position of the budget.
Using the automatic stabilizers as a rule, and the discretionary
measures as an exception, raises questions about the automatic stabilization
process, highlighted by Buti, and van den Noord (2003). Is the actual size of
the automatic stabilizers sufficient? Considering an optimal monetary
European Institute of Romania – Strategy and Policy Studies
38
policy, is the action of the automatic stabilizers sufficient for producing an
optimum fiscal position, both at national, as well as at the Euro area level?
Are automatic stabilisers always stabilising?
To analyse the effects of automatic stabilizers on aggregate output
and on inflation, under different types of shocks, we follow the model of
Buti, and van den Noord (2003):
( ) d
edyidy εφπφπφφ +⋅−⋅−−−⋅= 4321 , (2.4.1)
( ) s
esy εππω +−= . (2.4.2)
Relation (2.4.1) is a IS type curve, where aggregate demand, dy , is
a function of the share in GDP of the budgetary deficit, d , real interest rate,
( )ei π− , and a temporary demand shock, dε . Although aggregate output is
also influenced by the current account, to preserve the simplicity of the
model, the feed-back effect manifested by the rest of the monetary union is
not explicitly modeled. As a consequence, the current account depends only
on the aggregate output, y (absorbtion effect) and on inflation
(competitiveness effect). 3φ and 4φ measure the openness of the economy.
Relation (2.4.2) is a Lucas- Phillips supply function, where aggregate
supply, sy , depends on the inflation surprise, ( )eππ − , and on a supply
shock, sε , that can be permanent or transitory. All the variables are
expressed as deviation from their long term values.
If the fiscal authority conducts a neutral discretionary policy, letting
the automatic stabilizers freely operate, the budgetary deficit reduces to its
cyclical component:
ytd ⋅−= , (2.4.3)
where automatic stabilizers are included in the sensitivity parameter t . This
specification allows a parcimonius expression of the complex action of the
automatic stabilizers on both components of the budget. However, equation
(2.4.3) fails to reflect the impact that various budgetary components have on
the deficit.
Monetary authority act according to a Taylor type rule:
( )yi ⋅+= βπλ , (2.4.4)
where β reflects the relative importance awarded by the monetary authority
to the economic growth, respective of price stability objectives. The
parameter λ reflects the degree of activism of the monetary policy and

Public Finances: Introduction of a medium-term budgetary framework
39
expresses the degree to which an individual economy can influence the
monetary union variables. A large economy exerts a significant influence on
the decision of the single central bank, which translates into a larger value
for λ . In what follows it is assumed that the equilibrium level of the interest
rate ensures that, in the medium term, inflation is on target.
Starting from the behavioural relations defined above, we obtain y
and π :
( )[ ]sdy εφλφεωµ
32
1+⋅+⋅= , (2.4.5)
( )[ ]sd t εφβλφφωεµ
π 42111
+⋅⋅+⋅+−= , (2.4.6)
where ( ) ( ) 3241 11 φωβλφφφωµ +⋅+⋅++⋅+= t . Obviously, for a temporary
demand shock, a high value of t stabilizes both the output and the
inflation. A high degree of openness (large 3φ and 4φ ) and a low value for
ω atenuate the demand shocks. In case of a temporary supply shock (a
shock which doesn’t affect potential output), relations (2.4.5) and (2.4.6)
demonstrates that automatic stabilizers reduce output volatility, but produce
a larger deviation of π from its long term value.
If the supply shock is permanent (the supply shock sε is included
in the potential output change), the expression of the new output-gap is:
( )[ ]λβφφφµ
ωε ⋅⋅++⋅+−=− 2311 ty s , (2.4.7)
( )[ ]ωβφφφωωµ
επ ⋅⋅++⋅+
⋅= 2311 ts . (2.4.8)
A large value for t will increase the deviation from the new value of
the potential GDP, de-stabilizing both output and inflation. If the central
bank is interested only in inflation, perfect inflation stabilization process
( eππ = in any moment) implies, in case of a permanent supply shock,
perfect output stabilization (output shifts instantaneously from the old to the
new potential level).
The previous analysis considers that the degree of automatic
stabilization is exogenous. This hypothesis is plausible because the
automatic stabilizers are, usually, the ex post result of the social preferences
related to efficiency and equity. However, in the EMU, the fiscal policy is
responsible for the attenuation of the national shocks, and the fiscal systems

European Institute of Romania – Strategy and Policy Studies
40
and social security to be designed taking into account the degree of
automatic stabilization should be taken into account. While the fiscal
authorities desire the highest degree of stabilization, considering the EMU
budgetary rules, in its cyclical evolution, the budgetary deficit can’t exceed
the threshold of 3% of GDP. It is possible, however, that governments do
not accept budgetary surpluses in the expansion periods.
To endogenize the degree of automatic stabilization, we assume that
the loss function for the fiscal authority is:
22 ydL ⋅+= δ , (2.4.9)
where δ reflects the relative preference of the fiscal authority between
output and deficit. The specification of the loss function in relation (2.4.9)
allows one to obtain an expression for the optimal level of taxation, *t ,
Minimizing the loss of the fiscal authority:
( ) ( ) 423
1*
1 φωβλφφω
φωδ
+⋅+++
⋅⋅=t . (2.4.10)
The higher the preference for stabilising output, the larger *t . A
small country, characterized by a low value of λ , will select a greater value
for the automatic stabilization coefficient, because it benefits less from the
stabilization process. In an open economy, this effect is compensated by a
higher stabilization from the external trade.
Cunterintuitively, the higher the efficiency of the fiscal policy, 1φ ,
the higher *t . Via the feedback effect on the budget, a more powerful
impact on demand helps to lower the cyclical component of the budget
balance.
Automatic stabilization through supply channels Although the traditional view on automatic stabilization places a
special emphasis on demand channels, there is also an alternative view,
considering that, thorough the supply channels, automatic stabilizers have,
in the short run, an adverse influence on the attenuation of the cyclical
developments.
To analyze the interactions between market flexibility and cyclical
stabilization, the model highlighted above can be extended to incorporate
the supply side effects of the automatic stabilizers. Van den Noord (2003)
and Buti (2003) assume that the slope of the output supply depends
positively on the tax rate.
Public Finances: Introduction of a medium-term budgetary framework
41
This hypothesis corresponds to a unionized labor market, with a
high degree of wage rigidity and a progressive fiscal system. One can show,
that if an imperfect labor market employee transfers the cyclical variation in
their fiscal burden at least partially to the employer (the so-called “real wage
resistance”), the slope of the labor supply (increasing with respect to real
wage) depends on the taxation rate. Aggregate output has the following
expression:
( ) ( ) s
ety εππωεγ +−⋅⋅−= 1 . (2.4.11)
The parameter ε models the degree of progressivity/ redistribution
of the aggregate fiscal and social system, and ω is a positive and constant
parameter. If the real wage resistence is present (a positive γ ), the output
reaction to a surprise in inflation is lower when t is larger. In other words,
in countries with large public sectors and high taxation, a value of inflation
greater (lower) than that expected leads to a less (more) intense reaction of
the output, which corresponds to a steeper supply curve in the output
inflation space. In case of a positive inflation surprise, as employers demand
more labour to increase production, they will have to pay higher wages to
cover for the higher prices, but also to account for the fact that real
reservation wage moves up as taxes increase progressively as means-tests
kink in; this tends to limit the rise in production.
In this context, the fiscal policy rule can be written as:
ytd ⋅⋅−= ε . (2.4.12)
When considering the supply side effects, the properties of the
automatic stabilizers change as they depend in this case on a critical level.
If a supply shock occurs, like in the previous model, a greater
taxation rate shifts the inflation rate to a greater extent. In a country with a
fiscality above the critical level, the output deviates from the equilibrium
value more than in a country with a lower taxation rate. If a demand shock
occurs, while the output is closer to its potential level, as t is greater,
beyond the critical value of t , the increase in the taxation level has a
destabilization level for inflation.
The critical level of the tax rate has the following analytic
expression:
( )
εγφ
γφβλφφ
⋅⋅⋅
+⋅⋅+−=
1
421**
2
1t . (2.4.13)
European Institute of Romania – Strategy and Policy Studies
42
The critical level of the taxes beyond which the automatic stabilizers
produce adverse effects depends, among other variables, on the relative
preference of the central bank between inflation and output, β . A central
bank preoccupied mainly with price stability neutralizes the adverse effects
automatic stabilizers have on supply, reducing consequently the incentives
for fiscal reforms intended to reduce taxation. As relation (2.4.13) shows,
the critical taxation level depends also on the openness of the economy: a
more open economy is equivalent with a lower fiscal multiplier and a supply
curve which is steeper than the demand curve. Hence, it is more likely for an
open economy to face the adverse effects of fiscal stabilization, compared to
a closed economy, when an equal taxation and progressivity level are
considered.
The fiscal burden in EMU member countries ranges typically
between 40% and 50%. Buti and van den Noord (2003) find 4.0** =t for
the larger countries of the euro area, suggesting that for the countries
situated in the upper level of the interval, the taxation level is sub-optimal.
In order to obtain an improvement in the stabilization properties of the
automatic stabilizers, an economy with an initial taxation level 5.0=t , must
reduce it with 10 percentage points. For small open economies, **t lies
between 0.2 and 0.3. In these conditions, the reduction in the government
size will improve fiscal stabilization. As a consequence, the small open
economies in the EMU have powerfull incentives to reform their fiscal
systems.
To conclude, automatic stabilizers affect the value of output and
inflation in the long run, both from the demand and the supply side. If the
fiscal burden is significant, exceeding the critical level, the combined effect
can be destabilizing on output and inflation when a supply shock occurs,
and destabilizing on inflation in case of a demand shock.
2.5. The role of Stability and Growth Pact in ensuring European
fiscal discipline
Fiscal discipline is an important feature of the EMU, preserving
sound public finances it is considered to be a sine qua non pre-requisite for
ensuring price stability and an economic growth which creates additional
employment. Giving up the exchange rate as instrument by becoming a
member of the EMU implies letting the automatic stabilizers operate at
national level to offset the asymmetric shocks and increase the role of
national budgetary policies in supporting stability oriented monetary
policies. The main reason underlying the SGP is that the “medium-term
Public Finances: Introduction of a medium-term budgetary framework
43
objective of budgetary positions close to balance or in surplus will allow all
Member States to deal with normal cyclical fluctuations while keeping the
government deficit within the value of 3% of GDP6”.
The EU fiscal framework generally applies to all member states,
with several provisions applicable only to the EMU members. The EU fiscal
policy operates on three levels:
� Excessive Deficit Procedure, as a component of the European
Commission Treaty;
� Growth and Stability Pact;
� Code of Conduct, comprising guidelines for a correct
implementation of the SGP.
Those three elements taken together define rules and mechanism for
an efficient coordination of national fiscal authorities, and promote public
finances sustainability in the European countries. The fiscal policy
framework is legitimated by the fact that it is designed by the interplay of
the national governments. Consequently, the importance of the long run
budgetary discipline is being aknowledged, many decisions being aimed to
improve the monitoring process on the fiscal policy and to promote a long
term approach to budgetary planning.
The Stability and Growth Pact was adopted in June 1997 by the
Amsterdam European Council, being enforced starting with the 1st of January
1999. SGP consolidates the provisions in the articles 99 and 104 from the
European Commission Treaty regarding fiscal discipline in the EMU.
SGP includes both a preventive, as well as a corrective arm. The
preventive side of the SGP refers to setting and obtaining adequate medium
term objectives. The preventive arm of the SGP refers to ensuring a fiscal
policy as close to optimum as possible, in order to obtain stability, but, in
the same time, to offer sufficient space for the automatic stabilizers to
function. The corrective arm consists in simple rules, designed to produce a
minimum level of fiscal discipline and anchoring expectations.
Formally, SGP relies on:
� a political commitment by all parties involved (Commission,
Member States, Council) to the full and timely implementation
of the budget surveillance process;
6 Council Regulation (EC) No 1055/2005 of 27 June 2005 amending Regulation (EC)
No 1466/97 on the strengthening of the surveillance of budgetary positions and the
surveillance and coordination of economic policies, Official Journal L 174 , 07/07/2005 P.
0001 – 0004, http://eur-
lex.europa.eu/LexUriServ/LexUriServ.do?uri=CELEX:32005R1055:EN:HTML.
European Institute of Romania – Strategy and Policy Studies
44
� preventive elements, aiming at preventing budget deficits going
above the 3% reference value. To this purpose, Council
Regulation 1466/97 reinforces the multilateral surveillance of
budget positions and the co-ordination of economic policies. It
foresees the submission by all Member States of stability and
convergence programmes, which are examined by the Council,
and also the possibility to trigger the early warning mechanism
in the event that a significance slippage in the budgetary position
of a Member State is identified;
� dissuasive elements which in the event of the 3% reference
value being breached, require Member States to take immediate
corrective action and, if necessary, allow for the imposition of
sanctions.
Every member state should prepare a stability programe for the
ECOFIN Council and for the Commission, containing the necessary
information for multilateral surveillance: the medium term objective of
close to balance or in surplus, the hypothesis taken into account with respect
to the expected macroeconomic developments and main indicators, a
description of the policy measures to be adopted or proposed to be
adopted with the aim of achieving the targets set by the stability programs
and an analysis of the way these hypothesis affect budgetary position and
public debt. The EU members which are not EMU members prepare
convergence programs, with a similar content. The information related to
the path for the budgetary balance, public debt and the main macroeconomic
hypothesis, are supplied on an annual basis and must cover the previous, the
current, and, at least, the next three years.
As a component of the multilateral surveillance process, ECOFIN
Council monitors the implementation of the stability programs, based on the
information provided by the member states and on the evaluation of the
Commission and the Economic and Financial Committee, in order to
identify the actual or future deviations from the objectives undertaken in the
medium term projections.
If the ECOFIN Council identifies significant deviations of the
current budgetary position from the medium term objective, an early
warning is issued, in order to prevent an excessive deficit. Also, a
recommendation is addressed to the member state, specifying the need to
draw necessary correction measures (for example, the recommendation
addressed by the European Commission to Romania on 12th
of June 2009).
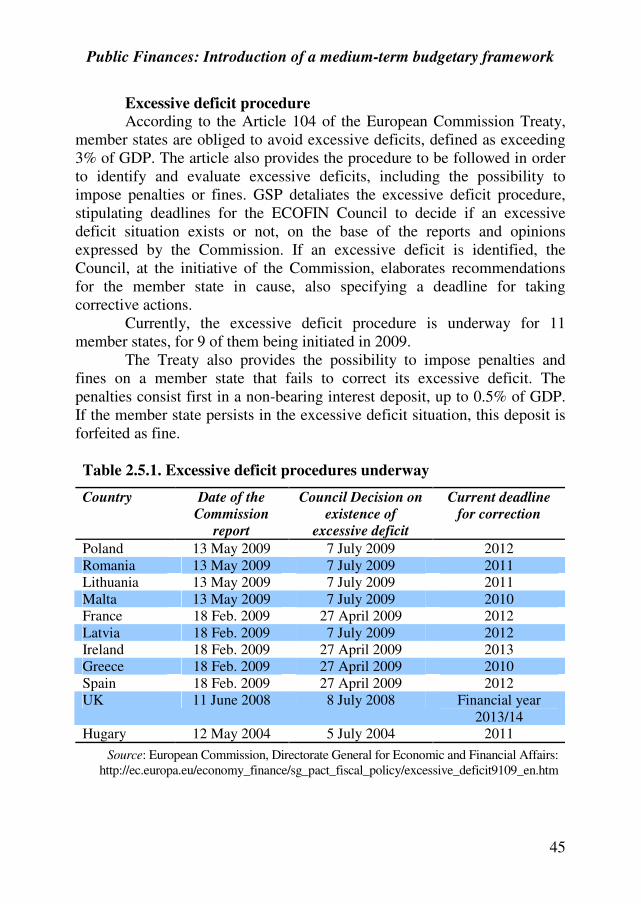
Public Finances: Introduction of a medium-term budgetary framework
45
Excessive deficit procedure According to the Article 104 of the European Commission Treaty,
member states are obliged to avoid excessive deficits, defined as exceeding
3% of GDP. The article also provides the procedure to be followed in order
to identify and evaluate excessive deficits, including the possibility to
impose penalties or fines. GSP detaliates the excessive deficit procedure,
stipulating deadlines for the ECOFIN Council to decide if an excessive
deficit situation exists or not, on the base of the reports and opinions
expressed by the Commission. If an excessive deficit is identified, the
Council, at the initiative of the Commission, elaborates recommendations
for the member state in cause, also specifying a deadline for taking
corrective actions.
Currently, the excessive deficit procedure is underway for 11
member states, for 9 of them being initiated in 2009.
The Treaty also provides the possibility to impose penalties and
fines on a member state that fails to correct its excessive deficit. The
penalties consist first in a non-bearing interest deposit, up to 0.5% of GDP.
If the member state persists in the excessive deficit situation, this deposit is
forfeited as fine.
Table 2.5.1. Excessive deficit procedures underway
Country Date of the
Commission
report
Council Decision on
existence of
excessive deficit
Current deadline
for correction
Poland 13 May 2009 7 July 2009 2012
Romania 13 May 2009 7 July 2009 2011
Lithuania 13 May 2009 7 July 2009 2011
Malta 13 May 2009 7 July 2009 2010
France 18 Feb. 2009 27 April 2009 2012
Latvia 18 Feb. 2009 7 July 2009 2012
Ireland 18 Feb. 2009 27 April 2009 2013
Greece 18 Feb. 2009 27 April 2009 2010
Spain 18 Feb. 2009 27 April 2009 2012
UK 11 June 2008 8 July 2008 Financial year
2013/14
Hugary 12 May 2004 5 July 2004 2011
Source: European Commission, Directorate General for Economic and Financial Affairs:
http://ec.europa.eu/economy_finance/sg_pact_fiscal_policy/excessive_deficit9109_en.htm
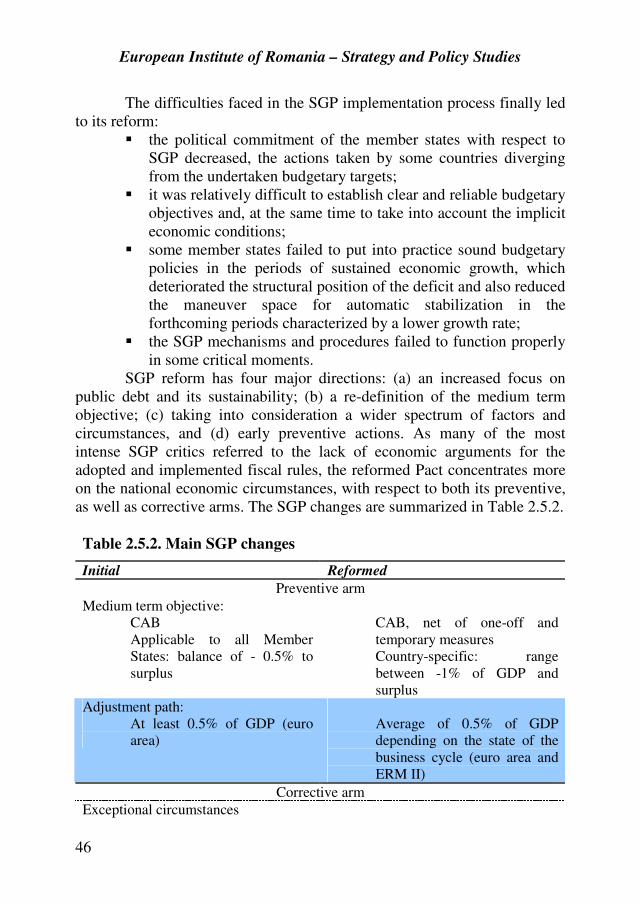
European Institute of Romania – Strategy and Policy Studies
46
The difficulties faced in the SGP implementation process finally led
to its reform:
� the political commitment of the member states with respect to
SGP decreased, the actions taken by some countries diverging
from the undertaken budgetary targets;
� it was relatively difficult to establish clear and reliable budgetary
objectives and, at the same time to take into account the implicit
economic conditions;
� some member states failed to put into practice sound budgetary
policies in the periods of sustained economic growth, which
deteriorated the structural position of the deficit and also reduced
the maneuver space for automatic stabilization in the
forthcoming periods characterized by a lower growth rate;
� the SGP mechanisms and procedures failed to function properly
in some critical moments.
SGP reform has four major directions: (a) an increased focus on
public debt and its sustainability; (b) a re-definition of the medium term
objective; (c) taking into consideration a wider spectrum of factors and
circumstances, and (d) early preventive actions. As many of the most
intense SGP critics referred to the lack of economic arguments for the
adopted and implemented fiscal rules, the reformed Pact concentrates more
on the national economic circumstances, with respect to both its preventive,
as well as corrective arms. The SGP changes are summarized in Table 2.5.2.
Table 2.5.2. Main SGP changes
Initial Reformed
Preventive arm
Medium term objective:
CAB
Applicable to all Member
States: balance of - 0.5% to
surplus
CAB, net of one-off and
temporary measures
Country-specific: range
between -1% of GDP and
surplus
Adjustment path:
At least 0.5% of GDP (euro
area)
Average of 0.5% of GDP
depending on the state of the
business cycle (euro area and
ERM II)
Corrective arm
Exceptional circumstances
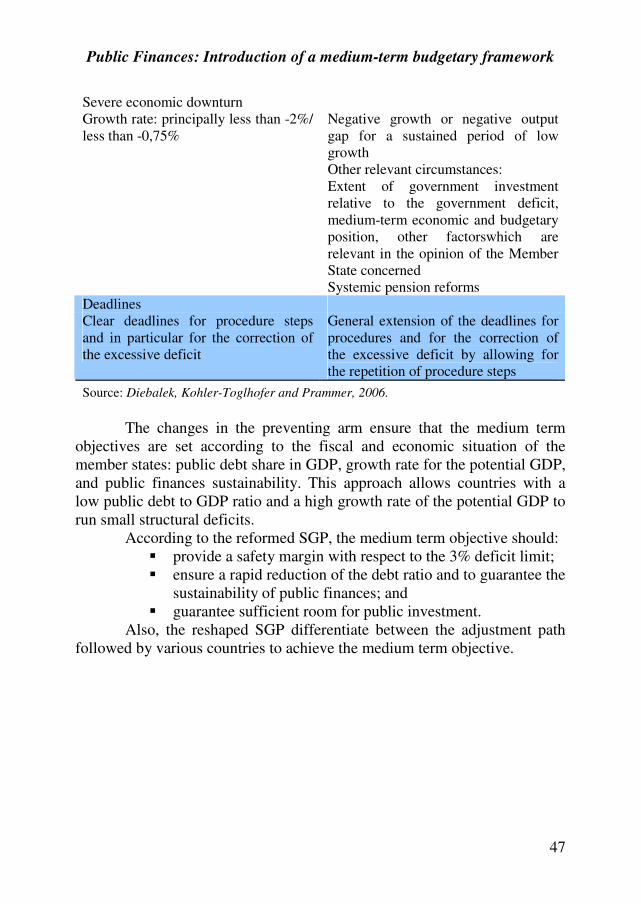
Public Finances: Introduction of a medium-term budgetary framework
47
Severe economic downturn
Growth rate: principally less than -2%/
less than -0,75%
Negative growth or negative output
gap for a sustained period of low
growth
Other relevant circumstances:
Extent of government investment
relative to the government deficit,
medium-term economic and budgetary
position, other factorswhich are
relevant in the opinion of the Member
State concerned
Systemic pension reforms
Deadlines
Clear deadlines for procedure steps
and in particular for the correction of
the excessive deficit
General extension of the deadlines for
procedures and for the correction of
the excessive deficit by allowing for
the repetition of procedure steps
Source: Diebalek, Kohler-Toglhofer and Prammer, 2006.
The changes in the preventing arm ensure that the medium term
objectives are set according to the fiscal and economic situation of the
member states: public debt share in GDP, growth rate for the potential GDP,
and public finances sustainability. This approach allows countries with a
low public debt to GDP ratio and a high growth rate of the potential GDP to
run small structural deficits.
According to the reformed SGP, the medium term objective should:
� provide a safety margin with respect to the 3% deficit limit;
� ensure a rapid reduction of the debt ratio and to guarantee the
sustainability of public finances; and
� guarantee sufficient room for public investment.
Also, the reshaped SGP differentiate between the adjustment path
followed by various countries to achieve the medium term objective.
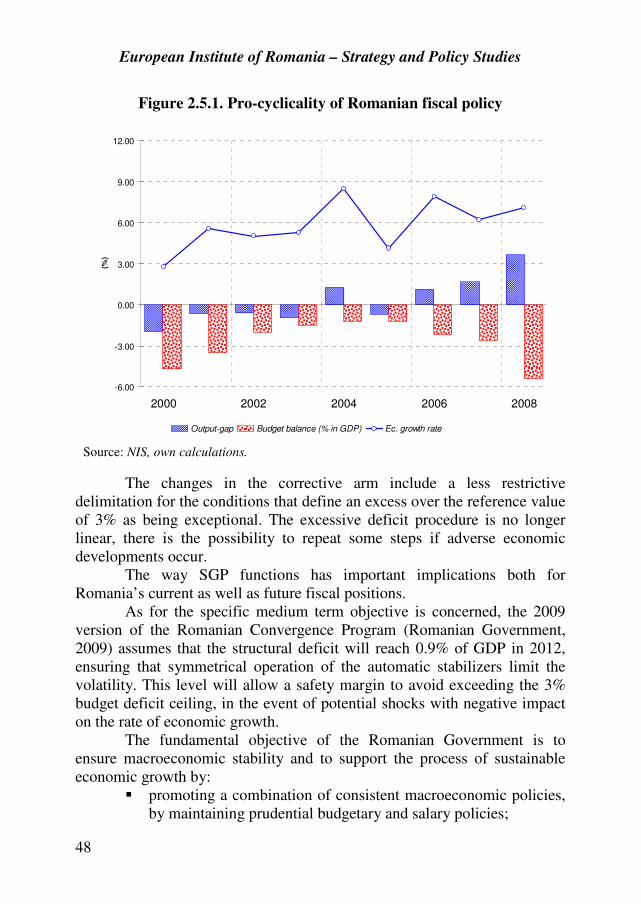
European Institute of Romania – Strategy and Policy Studies
48
Figure 2.5.1. Pro-cyclicality of Romanian fiscal policy
-6.00
-3.00
0.00
3.00
6.00
9.00
12.00
2000 2002 2004 2006 2008
(%)
Output-gap Budget balance (% in GDP) Ec. growth rate
Source: NIS, own calculations.
The changes in the corrective arm include a less restrictive
delimitation for the conditions that define an excess over the reference value
of 3% as being exceptional. The excessive deficit procedure is no longer
linear, there is the possibility to repeat some steps if adverse economic
developments occur.
The way SGP functions has important implications both for
Romania’s current as well as future fiscal positions.
As for the specific medium term objective is concerned, the 2009
version of the Romanian Convergence Program (Romanian Government,
2009) assumes that the structural deficit will reach 0.9% of GDP in 2012,
ensuring that symmetrical operation of the automatic stabilizers limit the
volatility. This level will allow a safety margin to avoid exceeding the 3%
budget deficit ceiling, in the event of potential shocks with negative impact
on the rate of economic growth.
The fundamental objective of the Romanian Government is to
ensure macroeconomic stability and to support the process of sustainable
economic growth by:
� promoting a combination of consistent macroeconomic policies,
by maintaining prudential budgetary and salary policies;
Public Finances: Introduction of a medium-term budgetary framework
49
� creating a binding fiscal and budgetary framework on a medium
term;
� improving the revenue administration through the tax
administration reform and the reduction of the collection costs;
� broadening the tax base in sectors such as the environment, the
state enterprises and the agriculture;
� substantially improving the efficiency of public funds spending,
by formulating clear priorities, especially for the investment
projects, through the horizontal coordination of the economic
policies.
The analysis elaborated by the DG ECFIN on the Romanian
Convergence Program (DG ECFIN, 2009) assesses the main risks for the
achievement of the medium term objective: domestic and external
macroeconomic developments, or the implementation of the planned
expenditure reduction.
During the 2005-2008 period, characterized by an unprecedented
expansion of the demand, the fiscal position in Romania was pro-cyclical.
As Figure 2.5.1 shows, the periods with positive output-gap correspond to
the periods with high deficit, meaning that the government failed to exploit
the opportunities offered by the increased growth rate to reduce the
structural balance, through expenditure consolidation,.
The pro-cyclicality in the Romanian fiscal policy is seen by the
National Bank as a major risk for the disinflation process (Inflation Report
August 2007), and it triggered the recommendations of the European
Commission (European Commission, 2007, 2008a, 2008b) to adopt a fiscal
position that is opposed to the business cycle.
Thus, the first Convergence Report of Romania, together with the
economic and fiscal position, formed the basis for the comments on the
Romanian economy of the 2007 edition of the study on the European public
finances (European Commission 2007). The ECOFIN Council analyzes the
current structural deficit and its perspectives, the medium term objective,
effective deficit and the possibility of exceeding the 3% limit, and also, the
necessary adjustments efforts. The Council recommends Romania a fiscal
position against the economic cycle.
The European Commission considers that Romania pursued a pro-
cyclical fiscal policy with headline deficits rising from 1.2% of GDP in
2005 to 5.4% of GDP in 2008, amidst an average real GDP growth of 6.3%.
This was due to a large extent to overall weak budgetary planning and
execution, which resulted in recurrent budgetary slippages. In this context,
the effective implementation of the envisaged measures to improve
European Institute of Romania – Strategy and Policy Studies
50
budgetary management and fiscal governance, notably by introducing a
medium-term budgetary framework, is crucial to restore the credibility
and improve the observance of the planned deficit targets.
2.6. The coordination between monetary and fiscal policies
Contemporary empirical evidence shows that interest rate affects
both investment, but also money demand. Thus, both the monetary, and the
fiscal policy, determine aggregate demand.
Complex analyses on macroeconomic policy identify three aspects
of the policy mix: the influence on the aggregate demand and supply
composition, the possibility that fiscal policy undermines the control exerted
by the monetary authority on inflation, and strategic interactions between
policies.
We will further detail two of the three above.
The composition effect
The policy mix influences the aggregate output through the
following mechanism: the result between the monetary and fiscal policy
influence the interest rate, which changes investment, in relation with public
spending. Moreover, a change in the domestic interest rate influences the
exchange rate, and, consequently, net exports.
In the case of a non-ricardian closed economy, an increase of the
real government expenditures leads to a combination between investment
and savings, the crowding-out effect. The magnitude of this effect depends
on factors such as the sensitivity of the savings, the access to international
resources, and the substitution between capital investment and government
bonds.
In the case of an open economy, the increase of the domestic interest
rate following an expansionary fiscal policy measure will produce capital
inflows, partially or fully financing (when the capital account is fully
liberalized) government expenditures, reducing the crowding out effect.
Capital inflows will reduce the contribution of the net exports to GDP,
yielding what is known as twin deficits situation.
Without an explicit welfare criterion, the models that analyze the
composition effects are unable to explore when a certain architecture for
macroeconomic policies is optimal or not.
Public Finances: Introduction of a medium-term budgetary framework
51
Strategic interactions between monetary and fiscal policies
It is possible for the monetary and fiscal authority to display non-
cooperative behaviors, especially when thay have conflicting objectives.
The behavior of the fiscal authority can affect the ability of the monetary
policy to achieve the inflation objective. Strategic interactions between
monetary and fiscal policies are the result of the way the two policies set
their objectives. The corresponding loss functions can differ by the variables
they include, by the values of the objectives set for these variables, or by
their relative importance.
The loss functions are:
( ) ,22
1 22 ∗−+= ttt
FyyL
απ (2.6.1)
for the fiscal authority, and
( ) ,22
1 22 ∗−++
= ttt
MyyL
απ
ε (2.6.2)
for the monetary authority,
where ( )∗− tt yy is the output gap after adopting the monetary and fiscal
policy measures, while α and ε characterize the relative importance of
output gap and inflation in the fiscal, and monetary policy design. Both
authorities minimize the corresponding loss function in (2.6.1) and (2.6.2),
under the constraint:
( ) ,t
e
ttt uy +−= ππ (2.6.3)
where e
tπ is the expected inflation rate, and tu is a supply shock.
If the two authorities act independently, their inflation objectives
are:
( )[ ],1
tt
e
tF uy −++
= ∗∗ πα
απ (2.6.3)
for the government, and
( )[ ],1
tt
e
tM uy −+++
= ∗∗ πεα
απ (2.6.4)
for the central bank. In (2.6.3) compared to (2.6.4), if 0>ε , then ∗∗ > MF ππ .
European Institute of Romania – Strategy and Policy Studies
52
To model the cooperation between monetary and fiscal authorities
we assume that they have a common loss function, defined as an average of
the loss functions in (2.6.1) and (2.6.2):
( ) ( ).1,0,1 ∈−+= δδδ FM LLL (2.6.5)
In this case, the inflation objective is:
( )[ ].1
tt
e
t uy −+++
= ∗∗ πδεα
απ (2.6.6)
From (2.6.6) results ∗∗∗ >> MF πππ . The inflation ojective in the
cooperation case is between the objectives in the case of independent action.
Monetary and fiscal policies are fundamental instruments for the
attenuation of cyclical evolution in the economy. In a monetary union,
monetary policy is centralized, while fiscal policy is conducted at a national
level, being independent. This asymmetry, combined with the monetary-
fiscal interactions pose serious difficulties for the implementation of the
fiscal policy in the context of a monetary union.
Because the member states preserve their fiscal autonomy, while
monetary policy is common, EMU is built on the sound basis of fiscal
discipline. Numerous SGP and Maastricht Treaty provisions refer to the
budgetary autonomy of the EMU member states. The Treaty sets the criteria
related to the budgetary deficit and public debt to be fulfilled for adopting
the common currency, being a selection instrument, while the SGP has the
role of ensuring fiscal discipline in EMU.
53
3. ASSESSING THE STRUCTURAL POSITION OF
PUBLIC FINANCES IN ROMANIA
3.1. Potential GDP and output-gap
Potential GDP is a measure of the economy’s productive capacity,
reflecting “full-employment” GDP, the level of GDP attainable when the
economy is operating at a high rate of resource use. Potential GDP can also
be defined as the level of output corresponding to a balanced state of the
economy characterized by stable inflation (i.e. consistent with NAIRU). The
potential GDP and the output gap (i.e. the difference between actual and
potential output) attracted sustained interest by researchers over a long
period of time. As early as Okun (1962), it was pointed out the importance
of these variables in assessing the cyclical position of the economy.
Nowadays the potential GDP is widely employed for macroeconomic
modeling, policy analysis, assessment of fiscal sustainability, and
quantifying the structural budget balance. Output gap estimations are used
in central bank’s monetary policy response function such as in the Taylor
rule (Taylor, 1993) or in the inflation targeting framework (Svensson,
1999).
In the long-run, the level of potential output depends on the growth
of the productive capacity of the economy, which in turn depends on total
factor productivity and the growth rates of physical capital and of the
potential labor force. Thus, the potential output reflects the optimum
potential supply of an economy and facilitates an estimate of non-
inflationary growth. In the short run, it reflects the potential impact of
economic growth on macroeconomic stability indicators, such as inflation.
A positive output gap is associated with excess demand, which may lead to
inflationary pressures. Orphanides (2002) argues that during the 1970s the
Fed estimated the output gap to be much more negative than in reality,
which led to policy actions that overheated the economy.
Due to the fact that potential output is not observable, researchers
are forced to rely on uncertain estimates, computed using statistical methods
and theoretical models. There is a wide range of methods for estimating
potential GDP, beginning with analysis of time-series data and trend-based
analysis, to more complex assessments based on the production function and
structural equations. Various statistical methods have been proposed to
estimate the potential output as a trend of the actual level of output. One of
the easiest ways is to consider a moving average of actual output as the
European Institute of Romania – Strategy and Policy Studies
54
potential GDP. The HP filter, proposed by Hodrick and Prescott (1997), is
widely used. Other methods include band-pass filters (Baxter and King,
1999; Christiano and Fitzgerald, 2003), wavelet-based filters, and
unobserved components models (Harvey and Jaeger, 1993), estimated using
the Kalman filter. The multivariate statistical approach to potential GDP
estimation consists in connecting the output-gap with other macroeconomic
variables, such as inflation (Phillips curve) or unemployment (Okun’s law).
Laxton and Tetlow (1992) extended the HP filter to a multivariate setting
and computed potential output linked to inflation fluctuations. Kuttner
(1994) considered potential output as an unobserved stochastic trend and
applied the Kalman filter to extract it, using simplified output and inflation
equations.
The main drawback of the pure statistical methods approach is the
lack of economic content. The production function approach can be
employed in order to take into account the economic structure. In this
approach, an aggregate production function is estimated and then normal
amount of inputs are substituted in it to calculate the potential output.
Another structural estimation of the potential GDP consists in
econometrically estimating or calibrating large-scale DSGE models and
extracting a model-consistent output-gap. This approach was employed by
Edge et al. (2008) for the U.S. economy and by Smets and Wouters (2003)
for the Euro Area. One has to be careful in assessing the estimated output
gap using this method, since it is sensitive to the model parameters,
particularly to alternative specifications of the monetary policy rule.
Since there is no ideal method for measuring the output-gap,
researchers usually employ different methods instead of relying on a single
measure. Various studies compared the estimation techniques and concluded
that there are similarities in the shape, but divergences on the magnitude of
the output gap estimates (Cerra and Saxena, 2000; Cotis et al., 2003;
Billmeier, 2004). As Bjornland et al. (2005) points out, professional
judgment is needed to analyze and interpret the economic significance of the
results. Darvas and Vadas (2002) reviewed some univariate de-trending
methods which can be applied in the estimation of the potential output and
of the output gap. Since all the methods have weaknesses, the authors derive
a consensus estimate of potential output by weighting the results from these
statistical methods. The weights are derived based on revisions of the output
gap for all dates by recursively estimating the models. The conclusion is that
consensus estimate can provide a useful indicator for the position of the
economy, especially for transition countries that might have more volatile
macroeconomic dynamics, and are more often subject to structural shifts.
Public Finances: Introduction of a medium-term budgetary framework
55
Due to the lack of data, to the structural breaks present in it, or to
numerous structural shifts our economy faced in its short post-revolutionary
history, the literature concerned with the estimation of potential GPD and
other structural macroeconomic variables for Romania is scarce. There are,
however, a number of noticeable studies, among which we must mention
Bucşa (2001), Stănică (2005), Dobrescu (2006), and Galatescu et al.
(2007)7.
In this section of the study we use an eclectic approach for the
estimation of potential GDP and of the output-gap for the Romanian
economy. First, we estimate the levels of potential employment and capital
stock and combine them using the production function method to obtain
potential GDP. Second, we estimate the output gap by a consensus measure
using different econometric filters.
Production function (PF) approach models explicitly the
dependence of the output on the production factors, therefore reflecting the
supply side of the economy. Based on the definition of potential GDP as a
measure of the productive capacity of the economy, the PF methodology
estimates potential output in a natural manner, replacing the inputs in the
production function with their potential level.
The specification of the production function generally relies on two
simplifying assumptions: constant returns to scale and constant elasticity of
substitution between the production factors.
Estimating the potential output in an economic framework built
around the production function has a series of advantages, since: (1) allows
explicit growth accounting, detailing the sources of growth in terms of
capital, labor and total factor productivity (TFP) contributions; (2) creates
the opportunity of establishing a meaningful link between policy reform
measures and actual outcomes; (3) supports forecasting, or scenario building
on growth prospects, by making explicit assumptions on the evolution of
demographic, institutional and technological trends; (4) uses (as other
structural methods) a larger information set, information which is then
interpreted through the relations between variables suggested by the
economic theory.
The main drawback of the production function approach is that the
potential level of the TFP is obtained by applying statistical detrending
techniques to the “Solow residual,” which is generally computed by
7 Among the work dedicated to the estimation of the potential GDP in Romania we must
also mention the joint efforts of the DOFIN, Ministry of Finance and National Commission
for Economic Forecasting, conducted in the process of preparing the Convergence Program.

European Institute of Romania – Strategy and Policy Studies
56
inverting the production function. In this way, the production function
approach inherits, eventually, the vulnerabilities of the statistical method
used to detrend the technical progress factor. A common feature of these
filtering techniques is that they may give poor approximation at the end of
the sample. In addition, the PF often delivers the same result as a basic
statistical filter of the GDP.
The PF approach requires the estimation of the potential levels of
employment and capital. The potential level of employment is usually
computed on the basis of trend participation rate and NAIRU. While the
trend participation rate is obtained by a filtering technique, NAIRU is
obtained through a more elaborated methodology, but is still influenced by
incertitude. Assuming full capacity utilization, the potential level of capital
is considered to be equal to the actual one. The capital stock is commonly
computed as the accumulation of quarterly national account investment
flows by assuming an ad-hoc constant rate of capital depreciation, although
several corrections are sometimes introduced.
We assume for the Romanian economy a Cobb-Douglas (C-D)
aggregate production function with constant returns to scale. The Cobb-
Douglas specification for the production function is widely used by the
major economic institutions as OECD (Beffy et al., 2007), European Central
Bank (Cahn and Saint-Guilhem, 2007) and the European Commission
(Denis et al., 2006). The C-D production function represents the output ( )Y
as a combination of factor inputs – labor ( )L and capital ( )K – and of TFP
( )A , which includes the degree of excess capacity, adjusted for the level of
efficiency:
αα −⋅⋅= 1KLAY , (3.1.1)
where the output elasticities of labor and capital are represented by α
( )10 << α , and ( )α−1 respectively.
From (3.1.1) and its potential counterpart, it is obvious to see that
( ) ( ) ( ) ( )kkllaayy −⋅−+−⋅+−=− αα 1 , (3.1.2a)
where lowercase symbols represent logs (i.e. Yy log= ), and hats indicate
the potential level.
Thus, the output gap computed using the PF approach built on a C-D
specification is the weighted average of the TFP, employment and physical
capital gaps. Unlike the labor input and TFP, the capital input does not need
to be cyclically adjusted to create a “potential” level. Although use of the
Public Finances: Introduction of a medium-term budgetary framework
57
capital stock varies greatly during the business cycle, the potential flow of
capital services will always be related to the total size of the capital stock,
not to the amount currently being used (CBO, 2004). With the capital used
at full capacity, the output gap is given by
( ) ( )llaayy −⋅+−=− α , (3.1.2b)
Under the PF method assumptions, the output gap is influenced explicitly by
the employment and the TFP gaps, and implicitly by the capital stock,
through the TFP gap.
We set the output elasticity in respect to labor to 0.65, a value
consistent with those employed in similar studies (Denis et al., 2006;
Dobrescu, 2006; Galatescu et al., 2007). There are two alternatives to the
ad-hoc setting of the production function parameter α : econometric
estimation and direct computation using the data from National Accounts.
As Galatescu et al. (2007) show, trying to estimate capital and labor
contributions to the output in the C-D production function doesn’t yield
economically meaningful results in the case of Romania. As it concerns
using the National Accounts information, α is computed as the ratio
between the compensation of employees and the gross valued added. The
average value of the compensation of employees gross value added ratio
computed for yearly data on the time span 2000-2008 for the Romanian
economy is 0.44. However, as Bergoeing et al. (2002) suggest, measured
labor compensation fails to account for the income of most self-employed
and family workers. They also point out that a high capital share (implied in
the hypothesis of constant returns to scale by a low labor share) implies
implausibly high rates of return on capital.
We define the labor input as employment, multiplied by the
average number of actual weekly hours. The potential level for the labor
input can be estimated as
( ) HuqNL ⋅−⋅⋅= 1 (3.1.3)
where N stands for the population of working, q for the trend participation
rate, H for the trend in the number of actual weekly hours worked, and u
for NAIRU. To ensure a higher degree of robustness to the results, we
estimate the trends for the participation rate and the number of hours using a
principal component consensus of the HP and Kalman filters.
The approaches broadly adopted in the definition and modeling of
NAIRU either distinguish a series of labor market variables as being
potential empirical determinants of the NAIRU, either employ a number of
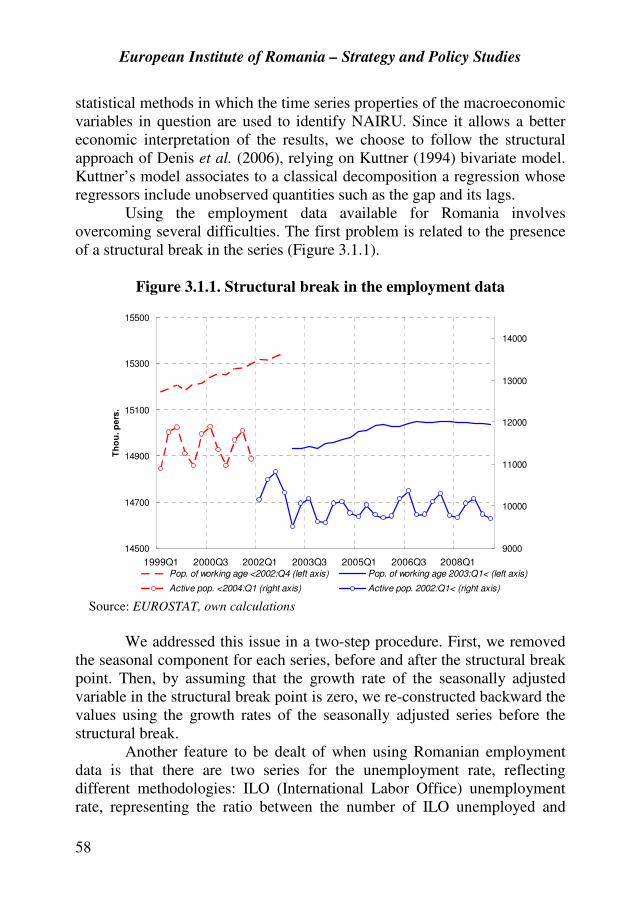
European Institute of Romania – Strategy and Policy Studies
58
statistical methods in which the time series properties of the macroeconomic
variables in question are used to identify NAIRU. Since it allows a better
economic interpretation of the results, we choose to follow the structural
approach of Denis et al. (2006), relying on Kuttner (1994) bivariate model.
Kuttner’s model associates to a classical decomposition a regression whose
regressors include unobserved quantities such as the gap and its lags.
Using the employment data available for Romania involves
overcoming several difficulties. The first problem is related to the presence
of a structural break in the series (Figure 3.1.1).
Figure 3.1.1. Structural break in the employment data
14500
14700
14900
15100
15300
15500
1999Q1 2000Q3 2002Q1 2003Q3 2005Q1 2006Q3 2008Q1
Th
ou
. p
ers
.
9000
10000
11000
12000
13000
14000
Pop. of working age <2002:Q4 (left axis) Pop. of working age 2003:Q1< (left axis)
Active pop. <2004:Q1 (right axis) Active pop. 2002:Q1< (right axis) Source: EUROSTAT, own calculations
We addressed this issue in a two-step procedure. First, we removed
the seasonal component for each series, before and after the structural break
point. Then, by assuming that the growth rate of the seasonally adjusted
variable in the structural break point is zero, we re-constructed backward the
values using the growth rates of the seasonally adjusted series before the
structural break.
Another feature to be dealt of when using Romanian employment
data is that there are two series for the unemployment rate, reflecting
different methodologies: ILO (International Labor Office) unemployment
rate, representing the ratio between the number of ILO unemployed and
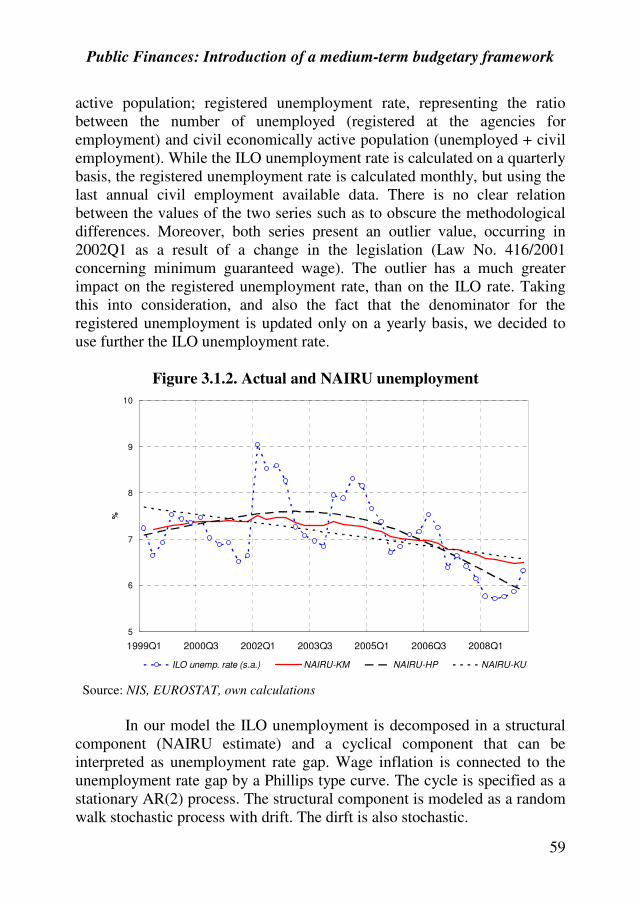
Public Finances: Introduction of a medium-term budgetary framework
59
active population; registered unemployment rate, representing the ratio
between the number of unemployed (registered at the agencies for
employment) and civil economically active population (unemployed + civil
employment). While the ILO unemployment rate is calculated on a quarterly
basis, the registered unemployment rate is calculated monthly, but using the
last annual civil employment available data. There is no clear relation
between the values of the two series such as to obscure the methodological
differences. Moreover, both series present an outlier value, occurring in
2002Q1 as a result of a change in the legislation (Law No. 416/2001
concerning minimum guaranteed wage). The outlier has a much greater
impact on the registered unemployment rate, than on the ILO rate. Taking
this into consideration, and also the fact that the denominator for the
registered unemployment is updated only on a yearly basis, we decided to
use further the ILO unemployment rate.
Figure 3.1.2. Actual and NAIRU unemployment
5
6
7
8
9
10
1999Q1 2000Q3 2002Q1 2003Q3 2005Q1 2006Q3 2008Q1
%
ILO unemp. rate (s.a.) NAIRU-KM NAIRU-HP NAIRU-KU
Source: NIS, EUROSTAT, own calculations
In our model the ILO unemployment is decomposed in a structural
component (NAIRU estimate) and a cyclical component that can be
interpreted as unemployment rate gap. Wage inflation is connected to the
unemployment rate gap by a Phillips type curve. The cycle is specified as a
stationary AR(2) process. The structural component is modeled as a random
walk stochastic process with drift. The dirft is also stochastic.
European Institute of Romania – Strategy and Policy Studies
60
The equations of the model described above are estimated with
maximum likelihood on quarterly data over the period 1999Q1 to 2009Q1.
The series were seasonally adjusted using the X12 ARIMA procedure in
Demetra. Figure 3.1.2 displays the values obtained for NAIRU using the
bivariate Kalman filter, and, also, for comparison reasons the values
obtained by applying a HP filter (NAIRU-HP) and a Kalman univariate
filter (NAIRU-KU). The values obtained with the bivariate Kalman filter
range between the values computed using the two univariate methods.
The estimated values of NAIRU range between 6.48% in 2008Q4
and 7.52% in 2002Q1. Beginning with 2006Q1 the size of NAIRU situated
below the value of 7%.
It is possible to elude some of the difficulties raised by the
employment data in the case of Romania by considering the labor input
variable in the production function as the number of employees.
Accordingly, the potential level of the labor input is computed by applying a
filtering technique A number of arguments favor the use of employment
data instead of the number of employees. First, it is obvious that
employment data include those who contributed to the creation of the
domestic production, but are not included in the number of employees
because they don’t fit the statistical definition of the employee (they don’t
have an individual labor contract). Second, a structural method involving a
Phillips curve applied to employment data is more suitable than a detrending
method applied to the number of employees data, since the resulting
potential GDP corresponds more to the definition as the level where no
inflation pressures emerge. Third, using only the number of employees
reveals little information on the sources of the labor input gap.
The proper concept of capital in the context of the production
function methodology is given by the flow of services of capital in constant
prices. The use of the gross capital stock as input in the production function
implies the following assumptions: (1) the flow of capital services is a
constant proportion of an estimate measure of the capital stock; (2) the rate
of change of capital services coinciding over time with the rate of change of
the capital stock as estimated by cumulating measurable investment; (3) the
aggregate capital stock is made up of assets that generate the same marginal
revenues in production.
One of the major problems of using the PF method to estimate the
potential GDP for the Romanian economy is the lack of an adequate data
series for the capital stock. As relation (3.1.2b) shows, the severity of this
problem is greater for the potential output than for output gap.
Public Finances: Introduction of a medium-term budgetary framework
61
In the absence of official statistics, the fixed capital stock in
Romania can be estimated using the Perpetual Inventory Method (PIM). The
PIM method consists in accumulating past capital formation and deducting
the value of assets that have reached the end of their service lives. The basic
requirements to apply the PIM to estimate the gross capital stock are: (1) an
initial benchmark estimate of the capital stock; (2) statistics on gross fixed
capital formation extending back to the benchmark, or if no benchmark is
available, back over the life of the longest-lived asset; (3) information on
capital depreciation, implicitly comprising: asset price indices, information
on the average services lives of different assets, and information on how
assets are retired around the average service life (mortality functions). The
PIM approach we employed can be formally stated as:
( ) ( ) ( )∑=
−
− −⋅+−⋅=+−⋅=t
j
jt
j
t
ttt IKIKK1
01 111 δδδ , (3.1.4)
where tK represents the capital stock at time t , 0K is the initial capital stock,
jI the gross fixed capital formation, and δ the depreciation rate. The value of
the capital stock is thus dependant on the path of the gross fixed capital
formation, on the initial capital stock, and on the depreciation rate. Statistics on
gross fixed capital formation are available since 1990, annual data, with a
methodology shift from ESA 1979 to ESA 1995 in 1998, and since 1998,
quarterly data. For the depreciation rate we choose a constant value, similar to
the one generally used in the literature (see e.g. Denis et al., 2006), namely 5
percent annually. Following Denis et al. (2006), we set the initial moment for
the capital stock to be 1995, and the value of the physical capital to be twice the
GDP in that moment. According to the PIM methodology, the initial capital
stock is less, and less important as the initial moment is more far away in the
past. For an annual depreciation rate equal to 5%, setting the initial moment in
1995 means that, at the end of 2008, only a half of the initial capital is still in
use. However, an initial moment very distant in the past is feasible only when a
reliable gross fixed capital formation series is available.
Summarizing, our implementation of the PIM methodology can be
stated as:
2=t
t
Y
K, 1995=t ;
( ) ttt IKK +⋅−=+ δ11 , where 05.0=δ , 1996=t ;
( ) Q
t
Q
tQ
Q
t IKK +−=+ δ11 , where ( ) δδ −=− 114
Q , 1996>t .
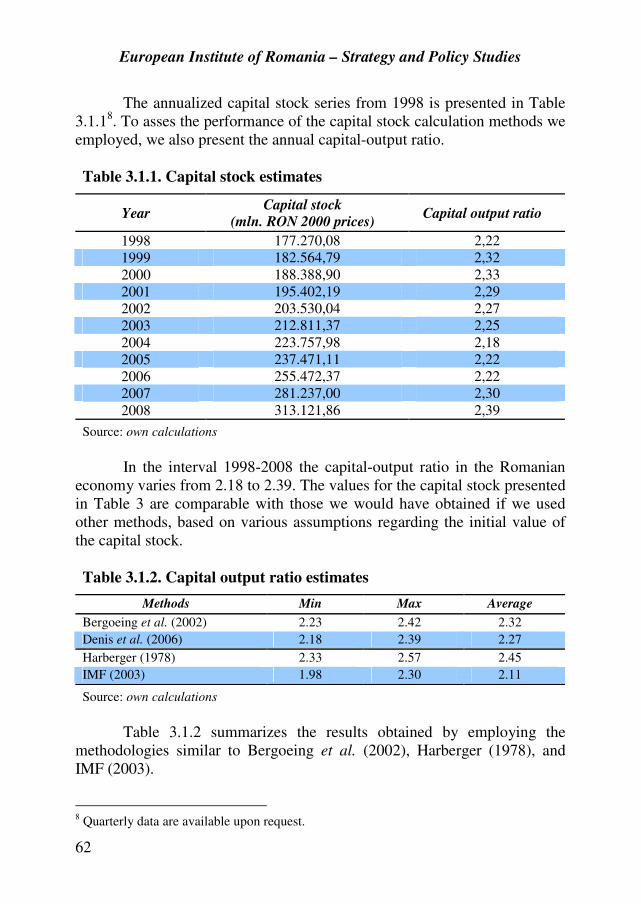
European Institute of Romania – Strategy and Policy Studies
62
The annualized capital stock series from 1998 is presented in Table
3.1.18. To asses the performance of the capital stock calculation methods we
employed, we also present the annual capital-output ratio.
Table 3.1.1. Capital stock estimates
Year Capital stock
(mln. RON 2000 prices) Capital output ratio
1998 177.270,08 2,22
1999 182.564,79 2,32
2000 188.388,90 2,33
2001 195.402,19 2,29
2002 203.530,04 2,27
2003 212.811,37 2,25
2004 223.757,98 2,18
2005 237.471,11 2,22
2006 255.472,37 2,22
2007 281.237,00 2,30
2008 313.121,86 2,39
Source: own calculations
In the interval 1998-2008 the capital-output ratio in the Romanian
economy varies from 2.18 to 2.39. The values for the capital stock presented
in Table 3 are comparable with those we would have obtained if we used
other methods, based on various assumptions regarding the initial value of
the capital stock.
Table 3.1.2. Capital output ratio estimates
Methods Min Max Average
Bergoeing et al. (2002) 2.23 2.42 2.32
Denis et al. (2006) 2.18 2.39 2.27
Harberger (1978) 2.33 2.57 2.45
IMF (2003) 1.98 2.30 2.11
Source: own calculations
Table 3.1.2 summarizes the results obtained by employing the
methodologies similar to Bergoeing et al. (2002), Harberger (1978), and
IMF (2003).
8 Quarterly data are available upon request.

Public Finances: Introduction of a medium-term budgetary framework
63
In our version of the Bergoieng et al. (2002) methodology we
consider the time span 1998-2008, and we determine 1998K such as
∑=
⋅=2008
1998
20022002 111t
tt YKYK . Harberger (1978) methodology assumes that
the economy evolves on the „balanced growth path,” implying that the
growth rates of the capital stock and of real GDP are equal. We consider the
time span 1998-2008, and we determine 1998K such as
( ) ( ) 101
19982008
101
19982008 YYKK = . Similar to IMF (2003) we estimate the
initial capital stock using the ratio of the Romanian to Euro Area per capita
GDP (at PPS) in 2000, 23%. Departing from the IMF methodology, we
consider that only one third of the difference in per capita GDP it can be
explained by different real capital endowments, the rest being explained by
other factors, such as human capital, institutions setting etc. Assuming a
capital share of about 31 , we obtain
( )( )
( )( ) 4744.06888.03 2
2
20002000
20002000
20002000
20002000 ==
⋅=
EAEA
RORO
EAEA
RORO
LY
LY
YK
YK, meaning that in 2000
the Romanian capital-output ratio is 47.44% of the one for Euro Area. The
value of 4.44 for the Euro Area capital-output ratio yields a value of about
2.11 for Romania. It’s worth mentioning that computing backwards the
values of the annual capital stock the capital-output ratio for 1992 is 1.44,
close to the value of 1.3 in the IMF (2003) report.
Within the production function framework, potential output refers to
the level of output which can be produced with a “normal” level of
efficiency of factor inputs. The trend efficiency level is measured as a
principal component consensus of the HP and Kalman filtered Sollow
residual:
( ) ( ) ( ) ( )[ ].ln1lnln tttt KLYa αα −+−= (3.1.5)
Potential output is derived by inserting potential capital stock and
potential labor into the production function equation. Figure 3.1.3 represents
the output gap obtained in the production function analysis using quarterly
data for the period 1999Q2-2009Q1. After a period of positive output gap,
between 2006Q1 and 2008Q3, the output gap plunges to a negative value of
around -7 percent in 2009Q1. Output gap reached its maximum value in
2008Q3, 3.8%.
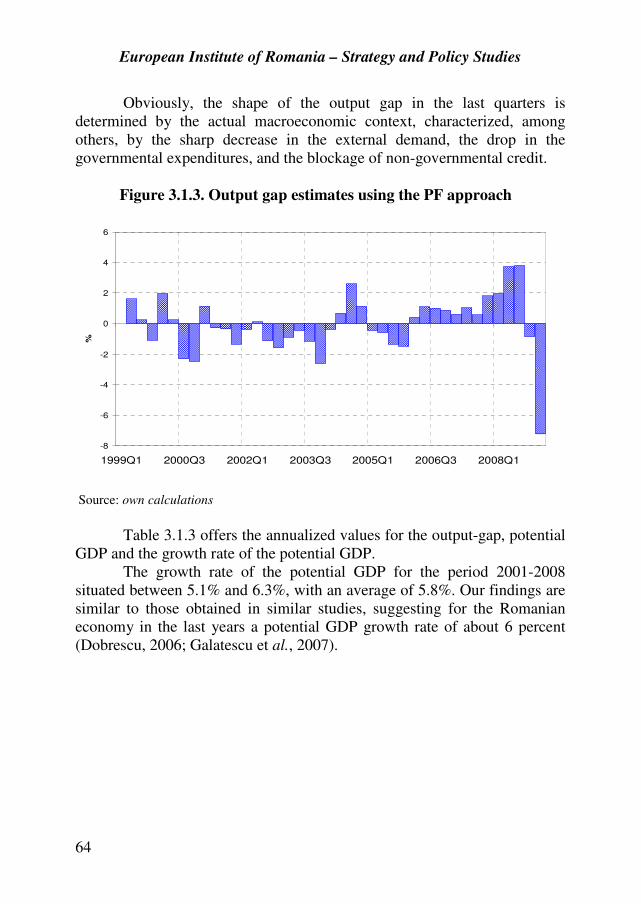
European Institute of Romania – Strategy and Policy Studies
64
Obviously, the shape of the output gap in the last quarters is
determined by the actual macroeconomic context, characterized, among
others, by the sharp decrease in the external demand, the drop in the
governmental expenditures, and the blockage of non-governmental credit.
Figure 3.1.3. Output gap estimates using the PF approach
-8
-6
-4
-2
0
2
4
6
1999Q1 2000Q3 2002Q1 2003Q3 2005Q1 2006Q3 2008Q1
%
Source: own calculations
Table 3.1.3 offers the annualized values for the output-gap, potential
GDP and the growth rate of the potential GDP.
The growth rate of the potential GDP for the period 2001-2008
situated between 5.1% and 6.3%, with an average of 5.8%. Our findings are
similar to those obtained in similar studies, suggesting for the Romanian
economy in the last years a potential GDP growth rate of about 6 percent
(Dobrescu, 2006; Galatescu et al., 2007).
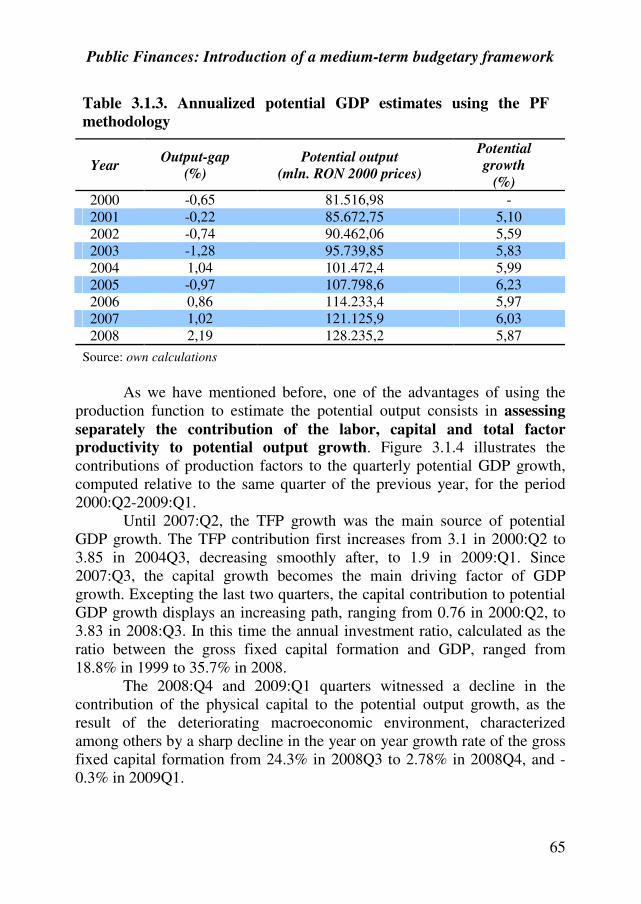
Public Finances: Introduction of a medium-term budgetary framework
65
Table 3.1.3. Annualized potential GDP estimates using the PF
methodology
Year Output-gap
(%)
Potential output
(mln. RON 2000 prices)
Potential
growth
(%)
2000 -0,65 81.516,98 -
2001 -0,22 85.672,75 5,10
2002 -0,74 90.462,06 5,59
2003 -1,28 95.739,85 5,83
2004 1,04 101.472,4 5,99
2005 -0,97 107.798,6 6,23
2006 0,86 114.233,4 5,97
2007 1,02 121.125,9 6,03
2008 2,19 128.235,2 5,87
Source: own calculations
As we have mentioned before, one of the advantages of using the
production function to estimate the potential output consists in assessing
separately the contribution of the labor, capital and total factor
productivity to potential output growth. Figure 3.1.4 illustrates the
contributions of production factors to the quarterly potential GDP growth,
computed relative to the same quarter of the previous year, for the period
2000:Q2-2009:Q1.
Until 2007:Q2, the TFP growth was the main source of potential
GDP growth. The TFP contribution first increases from 3.1 in 2000:Q2 to
3.85 in 2004Q3, decreasing smoothly after, to 1.9 in 2009:Q1. Since
2007:Q3, the capital growth becomes the main driving factor of GDP
growth. Excepting the last two quarters, the capital contribution to potential
GDP growth displays an increasing path, ranging from 0.76 in 2000:Q2, to
3.83 in 2008:Q3. In this time the annual investment ratio, calculated as the
ratio between the gross fixed capital formation and GDP, ranged from
18.8% in 1999 to 35.7% in 2008.
The 2008:Q4 and 2009:Q1 quarters witnessed a decline in the
contribution of the physical capital to the potential output growth, as the
result of the deteriorating macroeconomic environment, characterized
among others by a sharp decline in the year on year growth rate of the gross
fixed capital formation from 24.3% in 2008Q3 to 2.78% in 2008Q4, and -
0.3% in 2009Q1.
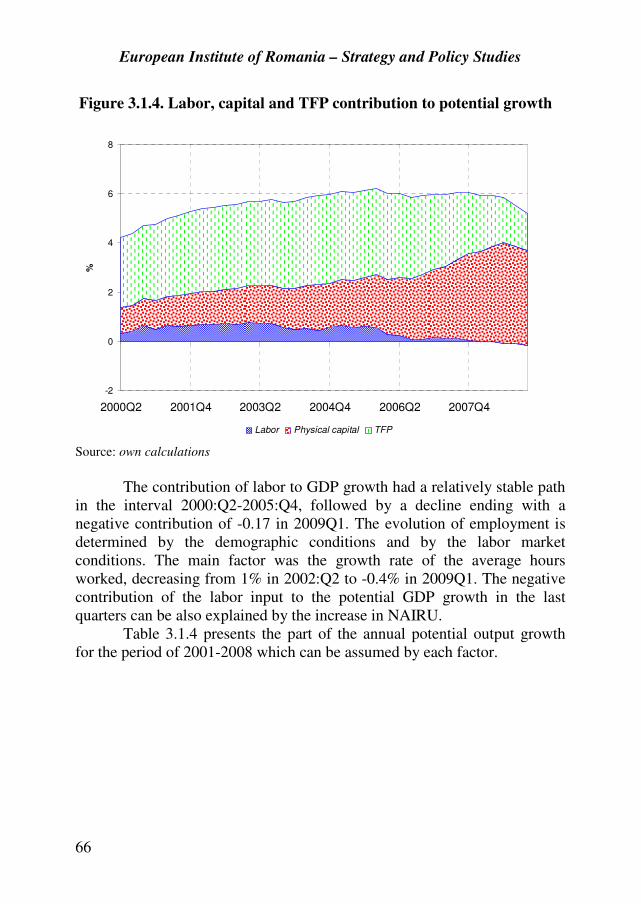
European Institute of Romania – Strategy and Policy Studies
66
Figure 3.1.4. Labor, capital and TFP contribution to potential growth
-2
0
2
4
6
8
2000Q2 2001Q4 2003Q2 2004Q4 2006Q2 2007Q4
%
Labor Physical capital TFP
Source: own calculations
The contribution of labor to GDP growth had a relatively stable path
in the interval 2000:Q2-2005:Q4, followed by a decline ending with a
negative contribution of -0.17 in 2009Q1. The evolution of employment is
determined by the demographic conditions and by the labor market
conditions. The main factor was the growth rate of the average hours
worked, decreasing from 1% in 2002:Q2 to -0.4% in 2009Q1. The negative
contribution of the labor input to the potential GDP growth in the last
quarters can be also explained by the increase in NAIRU.
Table 3.1.4 presents the part of the annual potential output growth
for the period of 2001-2008 which can be assumed by each factor.
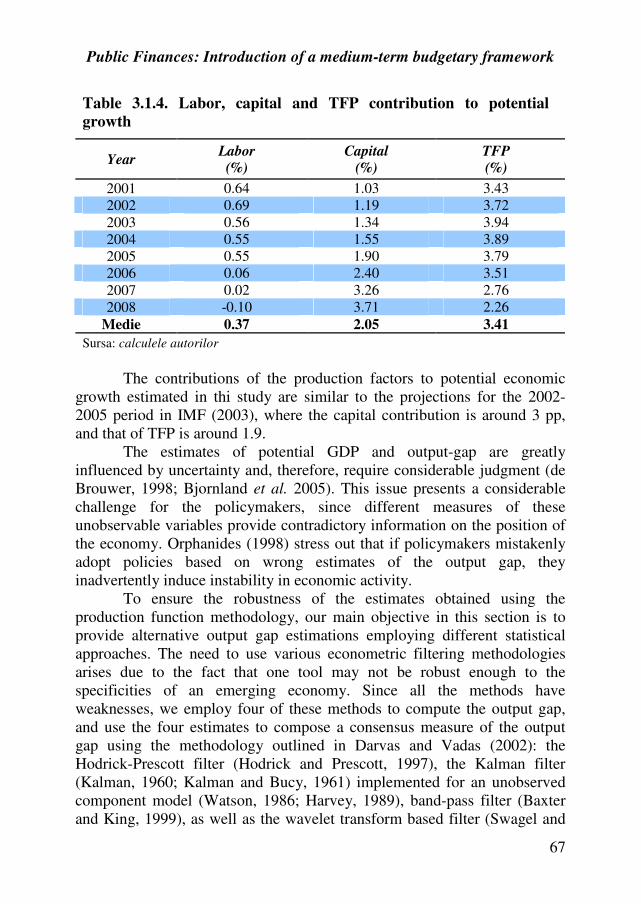
Public Finances: Introduction of a medium-term budgetary framework
67
Table 3.1.4. Labor, capital and TFP contribution to potential
growth
Year Labor
(%)
Capital
(%)
TFP
(%)
2001 0.64 1.03 3.43
2002 0.69 1.19 3.72
2003 0.56 1.34 3.94
2004 0.55 1.55 3.89
2005 0.55 1.90 3.79
2006 0.06 2.40 3.51
2007 0.02 3.26 2.76
2008 -0.10 3.71 2.26
Medie 0.37 2.05 3.41
Sursa: calculele autorilor
The contributions of the production factors to potential economic
growth estimated in thi study are similar to the projections for the 2002-
2005 period in IMF (2003), where the capital contribution is around 3 pp,
and that of TFP is around 1.9.
The estimates of potential GDP and output-gap are greatly
influenced by uncertainty and, therefore, require considerable judgment (de
Brouwer, 1998; Bjornland et al. 2005). This issue presents a considerable
challenge for the policymakers, since different measures of these
unobservable variables provide contradictory information on the position of
the economy. Orphanides (1998) stress out that if policymakers mistakenly
adopt policies based on wrong estimates of the output gap, they
inadvertently induce instability in economic activity.
To ensure the robustness of the estimates obtained using the
production function methodology, our main objective in this section is to
provide alternative output gap estimations employing different statistical
approaches. The need to use various econometric filtering methodologies
arises due to the fact that one tool may not be robust enough to the
specificities of an emerging economy. Since all the methods have
weaknesses, we employ four of these methods to compute the output gap,
and use the four estimates to compose a consensus measure of the output
gap using the methodology outlined in Darvas and Vadas (2002): the
Hodrick-Prescott filter (Hodrick and Prescott, 1997), the Kalman filter
(Kalman, 1960; Kalman and Bucy, 1961) implemented for an unobserved
component model (Watson, 1986; Harvey, 1989), band-pass filter (Baxter
and King, 1999), as well as the wavelet transform based filter (Swagel and

European Institute of Romania – Strategy and Policy Studies
68
Scacciavillani, 2002; Darvas and Vadas, 2003). The details of those
techniques are beyond the scope of this study. A detailed description can be
found in Darvas and Vadas (2003), or Altăr, Necula and Bobeică (2009b).
However, it worth noting that the Kalman filter suffers less than other
techniques, e.g. Hodrick-Prescott filter, from end-point problems.
We employed the quarterly GDP data series for the period 1998:Q1-
2009:Q1. Figure 3.1.5 depicts the output gap estimates using the four
econometric methods mentioned above.
Figure3.1.5. Output gap estimates using econometric filters
-10
-5
0
5
10
15
1998Q1 1999Q3 2001Q1 2002Q3 2004Q1 2005Q3 2007Q1 2008Q3
%, yoy
Kalman Band pass HP Wavelet
Source: own calculations
Although the amplitude of the estimates varies, the shapes of the
curves describing the output gap from four methods are comparable. Using
the Kalman filter estimate of the unobserved component model, the period
of the business cycle resulted to be 8.14 years. Although the other
estimates do not allow for an analytic computation of the length period, a
visual inspection of the graph also indicates a period around 8 years. These
results are consistent with de definition of a business cycle consisting of
periodic components whose frequencies lie between 2 and 8 years per
cycle (Burns and Mitchell, 1946; Hodrick and Prescott, 1997; Baxter and
King, 1999).
The most challenging task is the evaluation of the estimations
resulted from these methods. Considering the weak stability of the various
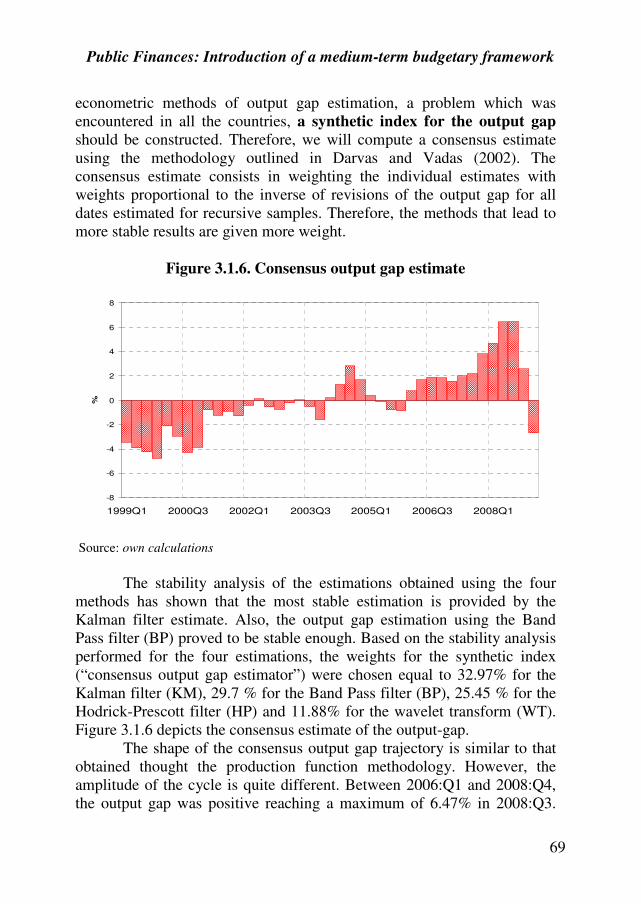
Public Finances: Introduction of a medium-term budgetary framework
69
econometric methods of output gap estimation, a problem which was
encountered in all the countries, a synthetic index for the output gap
should be constructed. Therefore, we will compute a consensus estimate
using the methodology outlined in Darvas and Vadas (2002). The
consensus estimate consists in weighting the individual estimates with
weights proportional to the inverse of revisions of the output gap for all
dates estimated for recursive samples. Therefore, the methods that lead to
more stable results are given more weight.
Figure 3.1.6. Consensus output gap estimate
-8
-6
-4
-2
0
2
4
6
8
1999Q1 2000Q3 2002Q1 2003Q3 2005Q1 2006Q3 2008Q1
%
Source: own calculations
The stability analysis of the estimations obtained using the four
methods has shown that the most stable estimation is provided by the
Kalman filter estimate. Also, the output gap estimation using the Band
Pass filter (BP) proved to be stable enough. Based on the stability analysis
performed for the four estimations, the weights for the synthetic index
(“consensus output gap estimator”) were chosen equal to 32.97% for the
Kalman filter (KM), 29.7 % for the Band Pass filter (BP), 25.45 % for the
Hodrick-Prescott filter (HP) and 11.88% for the wavelet transform (WT).
Figure 3.1.6 depicts the consensus estimate of the output-gap.
The shape of the consensus output gap trajectory is similar to that
obtained thought the production function methodology. However, the
amplitude of the cycle is quite different. Between 2006:Q1 and 2008:Q4,
the output gap was positive reaching a maximum of 6.47% in 2008:Q3.
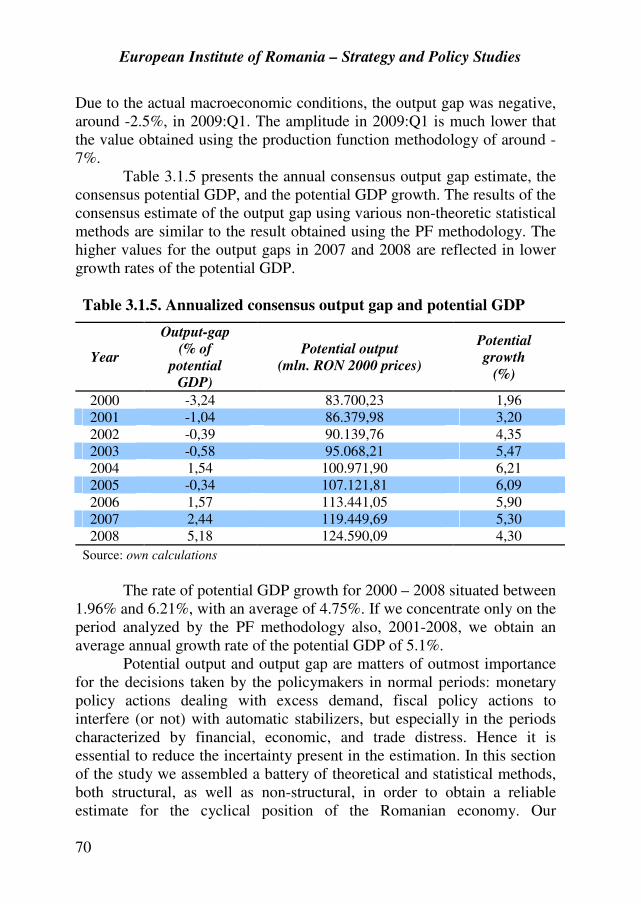
European Institute of Romania – Strategy and Policy Studies
70
Due to the actual macroeconomic conditions, the output gap was negative,
around -2.5%, in 2009:Q1. The amplitude in 2009:Q1 is much lower that
the value obtained using the production function methodology of around -
7%.
Table 3.1.5 presents the annual consensus output gap estimate, the
consensus potential GDP, and the potential GDP growth. The results of the
consensus estimate of the output gap using various non-theoretic statistical
methods are similar to the result obtained using the PF methodology. The
higher values for the output gaps in 2007 and 2008 are reflected in lower
growth rates of the potential GDP.
Table 3.1.5. Annualized consensus output gap and potential GDP
Year
Output-gap
(% of
potential
GDP)
Potential output
(mln. RON 2000 prices)
Potential
growth
(%)
2000 -3,24 83.700,23 1,96
2001 -1,04 86.379,98 3,20
2002 -0,39 90.139,76 4,35
2003 -0,58 95.068,21 5,47
2004 1,54 100.971,90 6,21
2005 -0,34 107.121,81 6,09
2006 1,57 113.441,05 5,90
2007 2,44 119.449,69 5,30
2008 5,18 124.590,09 4,30
Source: own calculations
The rate of potential GDP growth for 2000 – 2008 situated between
1.96% and 6.21%, with an average of 4.75%. If we concentrate only on the
period analyzed by the PF methodology also, 2001-2008, we obtain an
average annual growth rate of the potential GDP of 5.1%.
Potential output and output gap are matters of outmost importance
for the decisions taken by the policymakers in normal periods: monetary
policy actions dealing with excess demand, fiscal policy actions to
interfere (or not) with automatic stabilizers, but especially in the periods
characterized by financial, economic, and trade distress. Hence it is
essential to reduce the incertainty present in the estimation. In this section
of the study we assembled a battery of theoretical and statistical methods,
both structural, as well as non-structural, in order to obtain a reliable
estimate for the cyclical position of the Romanian economy. Our
Public Finances: Introduction of a medium-term budgetary framework
71
methodology combines the production function method with econometric
filtering techniques: Hodrick-Prescott, Kalman, band-pass and wavelet
transform. Thus, the potential output and output gap estimates benefit from
the advantages of both methods.
Although the four statistical estimates have been combined into a
consensus measure using an explicit methodology, further aggregation of
this measure with the estimate obtained using the production function
methodology is beyond the scope of the present study, and should be
subject to further research and expert judgment. As a rule of thumb, an
equal weighting scheme might be used to obtain a single estimate of the
output gap.
3.2. Cyclically adjusted budget balance – a fundamental
indicator for the structural position of the public finances
The structural or cyclically adjusted budgetary balance is defined as
the fiscal balance that would arise, provided output was at its potential level
and therefore not reflecting cyclical aspects in economic activity. Hagemann
(1999) defines the structural fiscal balance as the residual balance after
removing the balance of the estimated budgetary consequences of the
business cycle. Therefore, the calculation of the structural fiscal balance is
useful, as it provides a clearer picture of the underlying fiscal situation by
abstracting from the impact of the business cycle. As a result, it can be used
to guide fiscal policy analysis. One approach to examine the impact of
discretionary fiscal policy over the cycle is to link the fiscal policy position,
generally measured as the change in the structural fiscal balance, to the
cyclical conditions measured by the output gap. Econometric investigation
covering the period from the mid-1990s to 2006 shows that the fiscal policy
has on average been pro-cyclical in the Euro Area and in the EU (European
Commission, 2006).
The importance of assessing the structural fiscal balance has
increased after Romania entered the European Union. The structural fiscal
balance does play a key role in the European Union surveillance procedures,
especially in the Stability and Growth Pact. Although, the condition of the
Pact concerning the ratio of government deficit to GDP refers to the actual
rather than the structural deficit, the cyclically adjusted budget balance id
employed within the SGP framework to measure the position of the fiscal
policy. Also, the structural balance is used by The European Commission in
assessing whether the prevailing fiscal situation in individual EU countries
is sufficient to comply with the requirements of the Stability and Growth

European Institute of Romania – Strategy and Policy Studies
72
Pact, whether it is strong enough to provide for a safety margin that the
actual budget deficit does not exceed the threshold of 3% of GDP during a
recession. On the other hand, the Euro Area and the ERM II member states
should adopt a country-specific medium-term budgetary objective that
should be in a range between -1% of GDP and “in balance or surplus”,
measured in cyclically adjusted terms, net of one-off effects and temporary
measures.
Although several methodologies have been proposed (Giorno et. al.,
1995; Hagemann, 1999; van der Noord, 2000; Bouthevillain et al., 2001;
Congressional Budget Office, 2004; Girouard and Andre, 2005), there is no
generally accepted method of quantifying what part of the current budgetary
balance reflects short-term transitory influences caused by cyclical factors
and what part is due to structural measures taken by fiscal authorities.
Generally, the measurement of the cyclically adjusted budget balance
proceeds in three steps. The first step involves the estimation of the potential
GDP, of a reference path for real GDP to that could be obtained in the
absence of cyclical fluctuations. The difference between the actual output
level and estimated potential output provides a measure of the output gap.
Budget revenues and expenditure are also sensitive not only to output-gap
but to changes in the composition of aggregate demand (i.e. a composition
effect). The measurement of the composition effect requires the existence of
an equilibrium composition of aggregate demand. However, unlike potential
output, there is no equivalent for the equilibrium structure of aggregate
demand. This issue argues for usage the output gap as the benchmark for
cyclical adjustment. The second step concerns the econometrical estimation
of the elasticities of different components budget revenues and expenditures
with respect to output gap. In the last step the output gap and the
government revenue and expenditure elasticities are combined to compute
what government revenues and expenditure would have been had output
been at the reference path level. The structural fiscal position may also be
affected by temporary shocks, not directly linked to business cycles,
including one-off fiscal measures, creative accounting, classification errors,
etc. (Girouard and Price, 2004; Koen and van den Noord, 2005).
The potential GDP is unobservable and is sensitive to the method of
estimation. Although a variety of methods exists for calculating potential
output none of them are without shortcomings. For this reason all output gap
estimates, and hence also the corresponding measures of the cyclically
adjusted budget balances, are subject to considerable uncertainty. Langedijk
and Larch (2007) assessed the sensitivity of the EU fiscal framework to
variations in output gap estimates and concluded that the uncertainty
Public Finances: Introduction of a medium-term budgetary framework
73
surrounding output gap estimates is a serious issue since it can give rise to
an inappropriate policy response. Therefore, one should not rely on a single
measure to compute the output gap. Hence, we will employ further a robust
estimation computed a the simple average of the two ouput-gap estimates
obtained in the previous section.
In this section, we propose a robust approach to the estimation of the
structural fiscal balance for the Romanian economy, by employing quarterly
and annual data for the period 1998:Q1 – 2008:Q4. For quarterly data we
will employ a methodology similar to that of Giorno et. al. (1995) and van
der Noord (2000). In order to check the robustness of the estimates, we will
also use annual data and a methodology similar to that outlined in Girouard
and Andre (2005). The main weakness of the cyclical adjustment method
used in the EU fiscal surveillance framework is the assumption of constant
tax elasticities (European Commission 2006, 2007, 2008). Constant tax
elasticities are an acceptable approximation in the short-term. However, in
some years tax elasticities can depart quite substantially from their “normal
values” (European Commission 2008; Wolswijk, 2007). Therefore, in this
paper we relax the assumption of fixed elasticities hypothesized in OECD
and European Commission methodologies and allow for varying tax
elasticities along the business cycle.
This approach involves the estimation of elasticities with respect to
output for the various government revenue and expenditure categories.
These elasticities, together with the estimated output-gap are then used to
calculate the structural (i.e. not affected by cyclical conditions) tax revenues
and expenditures. Every elasticity is decomposed in a number of
components that can be estimated using the available data and specific
econometric techniques. The OECD methodology computes for every
government revenue and expenditure category a single elasticity for the
whole period. Therefore, the estimated elasticities may be expected to
reflect, at best, the average cyclical responsiveness of these revenue and
expenditure items over a sample period. Actual quarter-to-quarter behavior
may be more erratic as specific tax bases may react atypically over the
cycle. In this study we will compute a different elasticity for each quarter in
the data set. Further details can be found in Altăr, Necula and Bobeică
(2009a).
The elasticity of the tax income with respect to the tax base is
determined by the structure and the evolution of the Romanian tax system:
� in the case of the Personal Income Tax is given by the wage
elasticity of the personal income;
European Institute of Romania – Strategy and Policy Studies
74
� in the case of the Social Security Contribution it is constant and
equal to 1 across the sample since the contribution rate is flat and
there are no deductions;
� in the case of the Corporate Income Tax it is constant and equal
to 1 since it is assumed that corporate income tax receipts are
proportional to their tax base, corporate profits;
� in the case of Indirect Taxes it is constant and equal to 1 since it
is considered that indirect tax income is proportional to the main
tax base, consumer expenditure;
� in the case of Current Primary Expenditures it is equal to the
share of unemployment-related spending in total government
spending since the elasticity of government expenditure reflects
cyclical variations in unemployment-related spending and an
unitary elasticity is assumed between unemployment-related
expenditure and unemployment.
For the estimation of the wage elasticity of the personal income tax,
following the OECD and European Commission methodology, we consider
a representative household consisting of a full-time male worker, a working
spouse and two children. Since the average gross wage of a female was,
over the analyzed period, 85% of the average gross wage of a male, we
considered that in the representative family the secondary earner has a wage
income equal to 85% of those of the principal earner. The OECD
methodology employs a parametric log-normal distribution to assess the
variation in wage income across households. To better account the large
proportion of individuals earning the minimum wage we followed a slightly
different approach. For each year in the sample a location-shifted log-
normal income distribution function was estimated. The estimation of the
location-shifted log-normal distribution function was performed based on
three inputs: the minimum wage level for each period, the average gross
wage for each period, the 90-th percentile of the actual distribution.
Figure 3.2.1 depicts the estimated location-shifted log-normal
distribution of the actual wage distribution in 2006, the last year in the
sample that we had available data regarding income distribution. Tha
distribution obtained for 2006 was also used for 2007 and 2008.
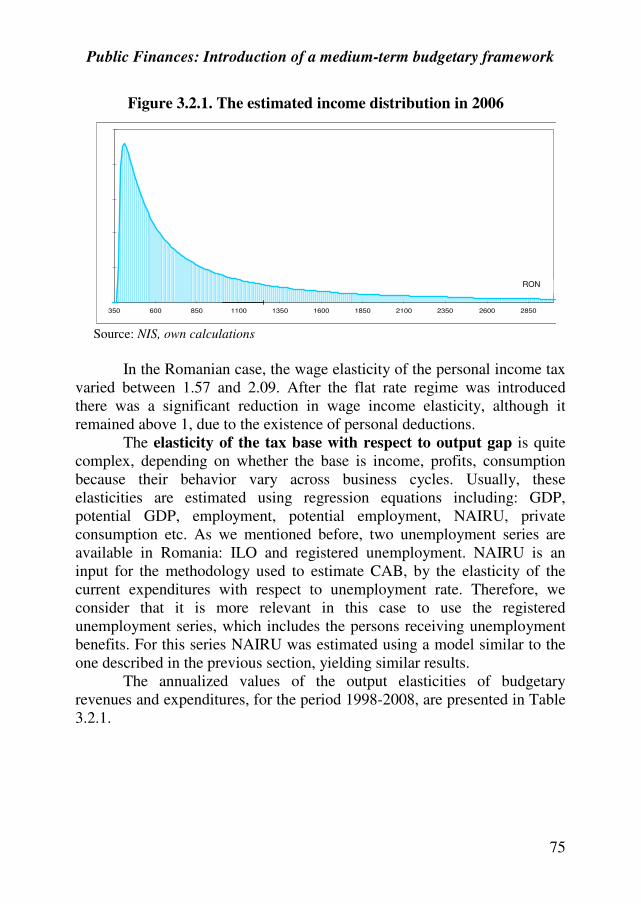
Public Finances: Introduction of a medium-term budgetary framework
75
Figure 3.2.1. The estimated income distribution in 2006
350 600 850 1100 1350 1600 1850 2100 2350 2600 2850
Source: NIS, own calculations
In the Romanian case, the wage elasticity of the personal income tax
varied between 1.57 and 2.09. After the flat rate regime was introduced
there was a significant reduction in wage income elasticity, although it
remained above 1, due to the existence of personal deductions.
The elasticity of the tax base with respect to output gap is quite
complex, depending on whether the base is income, profits, consumption
because their behavior vary across business cycles. Usually, these
elasticities are estimated using regression equations including: GDP,
potential GDP, employment, potential employment, NAIRU, private
consumption etc. As we mentioned before, two unemployment series are
available in Romania: ILO and registered unemployment. NAIRU is an
input for the methodology used to estimate CAB, by the elasticity of the
current expenditures with respect to unemployment rate. Therefore, we
consider that it is more relevant in this case to use the registered
unemployment series, which includes the persons receiving unemployment
benefits. For this series NAIRU was estimated using a model similar to the
one described in the previous section, yielding similar results.
The annualized values of the output elasticities of budgetary
revenues and expenditures, for the period 1998-2008, are presented in Table
3.2.1.
RON
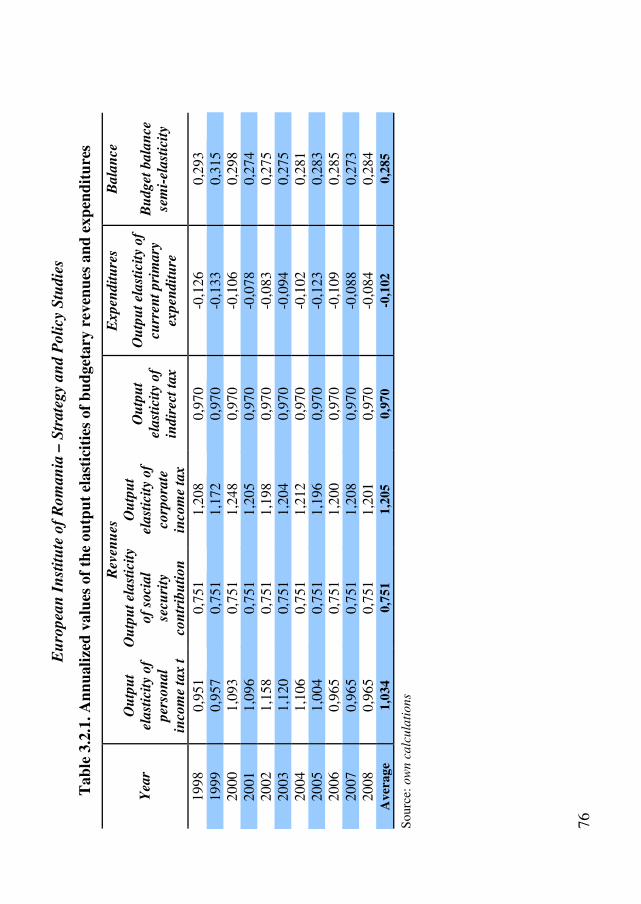
Eu
ropea
n I
nst
itu
te o
f R
om
an
ia –
Str
ate
gy
an
d P
oli
cy S
tudie
s
76
Tab
le 3
.2.1
. A
nn
uali
zed
valu
es o
f th
e ou
tpu
t el
ast
icit
ies
of
bu
dget
ary
rev
enu
es a
nd
exp
end
itu
res
Rev
enu
es
Expen
dit
ure
s B
ala
nce
Yea
r O
utp
ut
ela
stic
ity
of
per
son
al
inco
me
tax
t
Ou
tpu
t el
ast
icit
y
of
soci
al
secu
rity
con
trib
uti
on
Ou
tpu
t
elast
icit
y of
corp
ora
te
inco
me
tax
Ou
tpu
t
elast
icit
y of
indir
ect
tax
Ou
tpu
t el
ast
icit
y of
curr
ent
pri
mary
expen
dit
ure
Bu
dg
et b
ala
nce
sem
i-el
ast
icit
y
1998
0,9
51
0,7
51
1,2
08
0,9
70
-0,1
26
0,2
93
1999
0,9
57
0,7
51
1,1
72
0,9
70
-0,1
33
0,3
15
2000
1,0
93
0,7
51
1,2
48
0,9
70
-0,1
06
0,2
98
2001
1,0
96
0,7
51
1,2
05
0,9
70
-0,0
78
0,2
74
2002
1,1
58
0,7
51
1,1
98
0,9
70
-0,0
83
0,2
75
2003
1,1
20
0,7
51
1,2
04
0,9
70
-0,0
94
0,2
75
2004
1,1
06
0,7
51
1,2
12
0,9
70
-0,1
02
0,2
81
2005
1,0
04
0,7
51
1,1
96
0,9
70
-0,1
23
0,2
83
2006
0,9
65
0,7
51
1,2
00
0,9
70
-0,1
09
0,2
85
2007
0,9
65
0,7
51
1,2
08
0,9
70
-0,0
88
0,2
73
2008
0,9
65
0,7
51
1,2
01
0,9
70
-0,0
84
0,2
84
A
ver
ag
e 1
,03
4
0,7
51
1
,20
5
0,9
70
-0
,102
0
,28
5
So
urc
e: o
wn
ca
lcu
lati
on
s
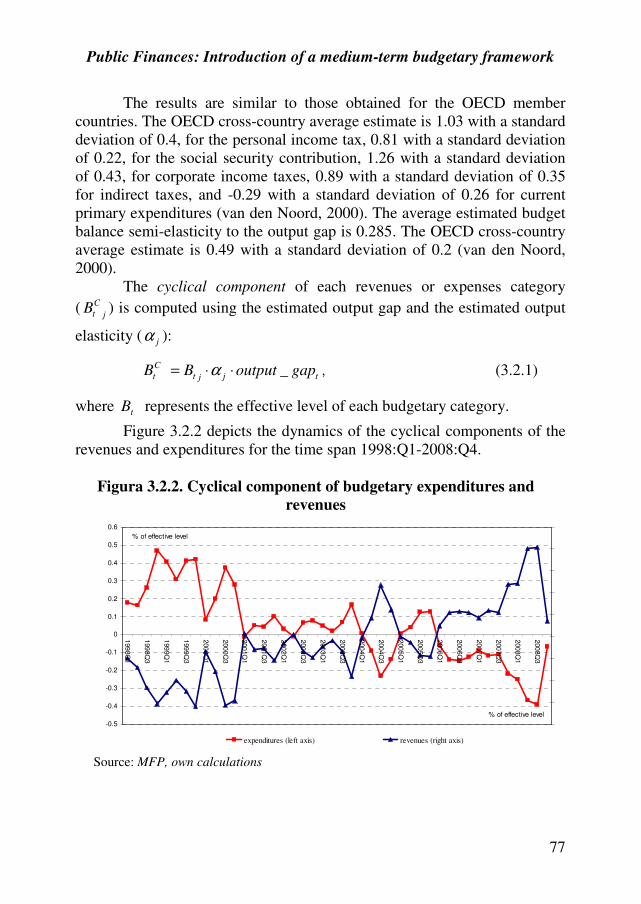
Public Finances: Introduction of a medium-term budgetary framework
77
The results are similar to those obtained for the OECD member
countries. The OECD cross-country average estimate is 1.03 with a standard
deviation of 0.4, for the personal income tax, 0.81 with a standard deviation
of 0.22, for the social security contribution, 1.26 with a standard deviation
of 0.43, for corporate income taxes, 0.89 with a standard deviation of 0.35
for indirect taxes, and -0.29 with a standard deviation of 0.26 for current
primary expenditures (van den Noord, 2000). The average estimated budget
balance semi-elasticity to the output gap is 0.285. The OECD cross-country
average estimate is 0.49 with a standard deviation of 0.2 (van den Noord,
2000).
The cyclical component of each revenues or expenses category
(j
C
tB ) is computed using the estimated output gap and the estimated output
elasticity ( jα ):
tjjt
C
t gapoutputBB _⋅⋅= α , (3.2.1)
where tB represents the effective level of each budgetary category.
Figure 3.2.2 depicts the dynamics of the cyclical components of the
revenues and expenditures for the time span 1998:Q1-2008:Q4.
Figura 3.2.2. Cyclical component of budgetary expenditures and
revenues
-0.5
-0.4
-0.3
-0.2
-0.1
0
0.1
0.2
0.3
0.4
0.5
0.6
199
8Q
1
199
8Q
3
199
9Q
1
199
9Q
3
200
0Q
1
200
0Q
3
200
1Q
1
200
1Q
3
200
2Q
1
200
2Q
3
200
3Q
1
200
3Q
3
200
4Q
1
200
4Q
3
200
5Q
1
200
5Q
3
200
6Q
1
200
6Q
3
200
7Q
1
200
7Q
3
200
8Q
1
200
8Q
3
% of effective level
% of effective level
expenditures (left axis) revenues (right axis)
Source: MFP, own calculations

European Institute of Romania – Strategy and Policy Studies
78
The paths followed by the cyclical components of the budgetary
revenues and expenditures display a mirroring dynamics, but with
significant differencies in amplitude. Thus, in the periods characterized by
positive output-gap the revenues have a positive cyclical component, while
the expenditures, as a result of the reduced employment benefits payed, a
negative cyclical component. The situation is reversed in the periods when
the economy functions below the potential level.
The cyclical component of the budgetary balance is obtained by
adding the cyclical parts of the budgetary components. The cyclically
adjusted budget balance (CAB) is obtained by subtracting the cyclical
component from the actual budget balance. Table 3.2.2 reports the estimates
for the annualized structural budget balance.
Table 3.2.2. Estimated structural budget balance using quarterly data
Actual balance Cyclical Balance Structural balance
(% in GDP) (% in GDP) (% in GDP)
1998 -3,59 -0,76 -2,84
1999 -1,85 -0,99 -0,85
2000 -3,96 -0,77 -3,18
2001 -3,19 -0,18 -3,00
2002 -2,60 -0,16 -2,44
2003 -2,23 -0,27 -1,96
2004 -1,18 0,35 -1,53
2005 -0,79 -0,19 -0,60
2006 -1,64 0,34 -1,98
2007 -2,50 0,49 -2,99
2008 -5,40 0,99 -6,39
Source: own calculations
Figure 3.2.3 dysplays the dynamics of the cyclical and structural
balances for 1998 – 2008.
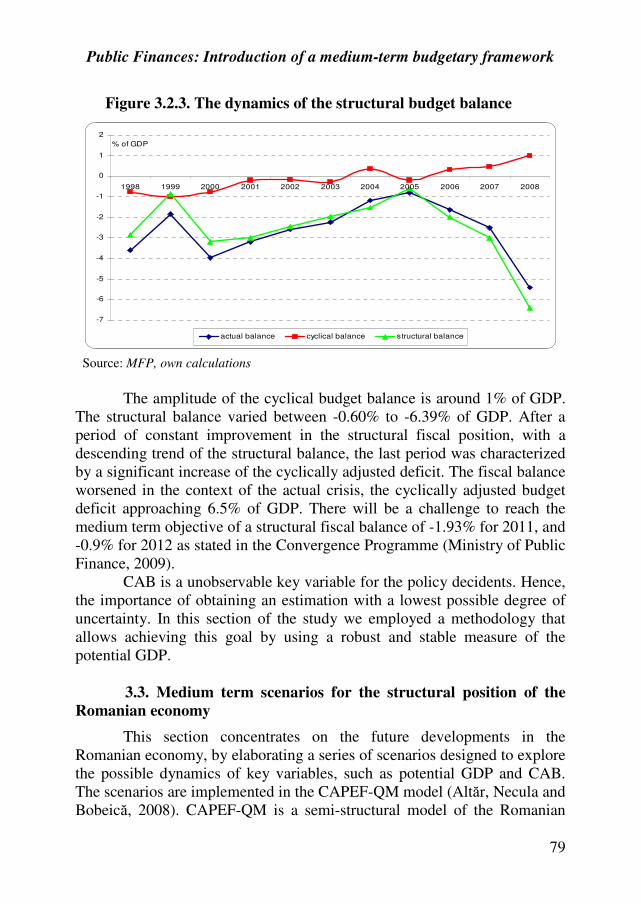
Public Finances: Introduction of a medium-term budgetary framework
79
Figure 3.2.3. The dynamics of the structural budget balance
-7
-6
-5
-4
-3
-2
-1
0
1
2
1998 1999 2000 2001 2002 2003 2004 2005 2006 2007 2008
% of GDP
actual balance cyclical balance structural balance
Source: MFP, own calculations
The amplitude of the cyclical budget balance is around 1% of GDP.
The structural balance varied between -0.60% to -6.39% of GDP. After a
period of constant improvement in the structural fiscal position, with a
descending trend of the structural balance, the last period was characterized
by a significant increase of the cyclically adjusted deficit. The fiscal balance
worsened in the context of the actual crisis, the cyclically adjusted budget
deficit approaching 6.5% of GDP. There will be a challenge to reach the
medium term objective of a structural fiscal balance of -1.93% for 2011, and
-0.9% for 2012 as stated in the Convergence Programme (Ministry of Public
Finance, 2009).
CAB is a unobservable key variable for the policy decidents. Hence,
the importance of obtaining an estimation with a lowest possible degree of
uncertainty. In this section of the study we employed a methodology that
allows achieving this goal by using a robust and stable measure of the
potential GDP.
3.3. Medium term scenarios for the structural position of the
Romanian economy
This section concentrates on the future developments in the
Romanian economy, by elaborating a series of scenarios designed to explore
the possible dynamics of key variables, such as potential GDP and CAB.
The scenarios are implemented in the CAPEF-QM model (Altăr, Necula and
Bobeică, 2008). CAPEF-QM is a semi-structural model of the Romanian
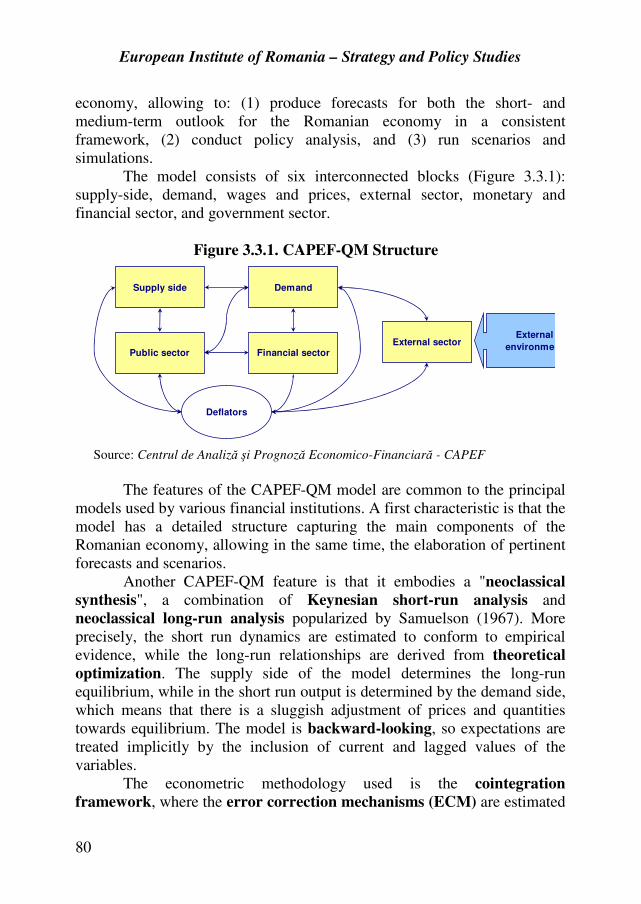
European Institute of Romania – Strategy and Policy Studies
80
economy, allowing to: (1) produce forecasts for both the short- and
medium-term outlook for the Romanian economy in a consistent
framework, (2) conduct policy analysis, and (3) run scenarios and
simulations.
The model consists of six interconnected blocks (Figure 3.3.1):
supply-side, demand, wages and prices, external sector, monetary and
financial sector, and government sector.
Figure 3.3.1. CAPEF-QM Structure
Supply side
Financial sectorPublic sector
Demand
External sector
Deflators
External
environment
Source: Centrul de Analiză şi Prognoză Economico-Financiară - CAPEF
The features of the CAPEF-QM model are common to the principal
models used by various financial institutions. A first characteristic is that the
model has a detailed structure capturing the main components of the
Romanian economy, allowing in the same time, the elaboration of pertinent
forecasts and scenarios.
Another CAPEF-QM feature is that it embodies a "neoclassical
synthesis", a combination of Keynesian short-run analysis and
neoclassical long-run analysis popularized by Samuelson (1967). More
precisely, the short run dynamics are estimated to conform to empirical
evidence, while the long-run relationships are derived from theoretical
optimization. The supply side of the model determines the long-run
equilibrium, while in the short run output is determined by the demand side,
which means that there is a sluggish adjustment of prices and quantities
towards equilibrium. The model is backward-looking, so expectations are
treated implicitly by the inclusion of current and lagged values of the
variables.
The econometric methodology used is the cointegration
framework, where the error correction mechanisms (ECM) are estimated
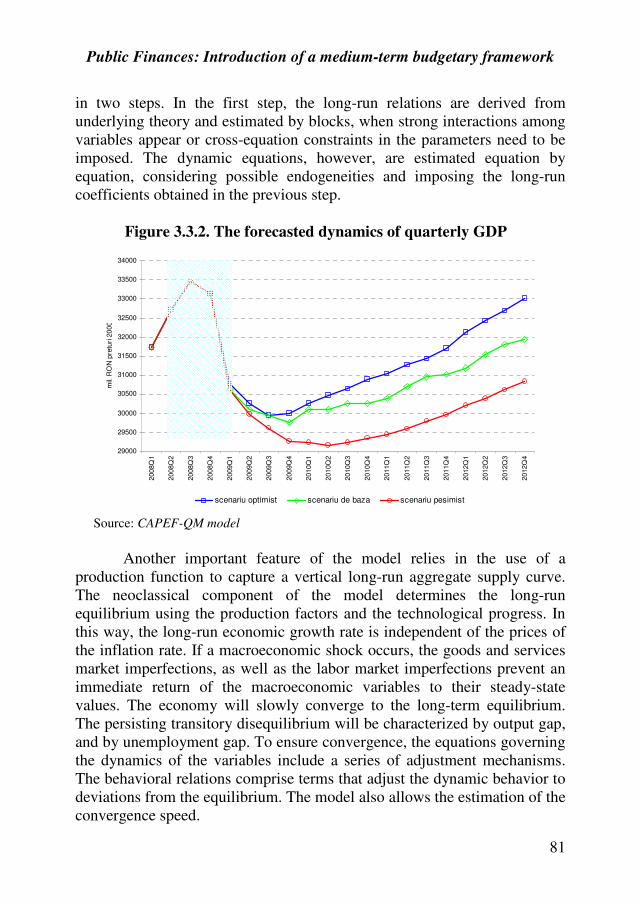
Public Finances: Introduction of a medium-term budgetary framework
81
in two steps. In the first step, the long-run relations are derived from
underlying theory and estimated by blocks, when strong interactions among
variables appear or cross-equation constraints in the parameters need to be
imposed. The dynamic equations, however, are estimated equation by
equation, considering possible endogeneities and imposing the long-run
coefficients obtained in the previous step.
Figure 3.3.2. The forecasted dynamics of quarterly GDP
29000
29500
30000
30500
31000
31500
32000
32500
33000
33500
34000
2008Q
1
2008Q
2
2008Q
3
2008Q
4
2009Q
1
2009Q
2
2009Q
3
2009Q
4
2010Q
1
2010Q
2
2010Q
3
2010Q
4
2011Q
1
2011Q
2
2011Q
3
2011Q
4
2012Q
1
2012Q
2
2012Q
3
2012Q
4
mil.
RO
N p
retu
ri 2
000
scenariu optimist scenariu de baza scenariu pesimist
Source: CAPEF-QM model
Another important feature of the model relies in the use of a
production function to capture a vertical long-run aggregate supply curve.
The neoclassical component of the model determines the long-run
equilibrium using the production factors and the technological progress. In
this way, the long-run economic growth rate is independent of the prices of
the inflation rate. If a macroeconomic shock occurs, the goods and services
market imperfections, as well as the labor market imperfections prevent an
immediate return of the macroeconomic variables to their steady-state
values. The economy will slowly converge to the long-term equilibrium.
The persisting transitory disequilibrium will be characterized by output gap,
and by unemployment gap. To ensure convergence, the equations governing
the dynamics of the variables include a series of adjustment mechanisms.
The behavioral relations comprise terms that adjust the dynamic behavior to
deviations from the equilibrium. The model also allows the estimation of the
convergence speed.

Eu
ropea
n I
nst
itu
te o
f R
om
an
ia –
Str
ate
gy
an
d P
oli
cy S
tudie
s 82
Thre
e sc
enar
ios
wer
e si
mula
ted u
sing t
he
CA
PE
F-Q
M m
od
el:
a b
ase
scen
ario
, a
pes
sim
isti
c sc
enar
io,
and
an o
pti
mis
tic
one.
The
quar
terl
y G
DP
pat
hs
for
each
sce
nar
io a
re d
epic
ted i
n F
igu
re 3
.3.2
.
Tab
le 3
.3.1
. S
cen
ari
os
on
th
e ev
olu
tion
of
the
stru
ctu
ral
posi
tion
of
the
Ro
man
ian
eco
nom
y
Ba
se s
cen
ari
o
2
00
8
2
00
9
2
01
0
2
01
1
2
01
2
GD
P g
row
th r
ate
(%)
7
,10
-8,1
1
0
,24
1,9
5
2
,75
Po
tenti
al G
DP
gro
wth
rat
e (%
)
4,3
0
1
,94
1,0
8
0
,86
0,7
7
Outp
ut-
gap
(%
)
5,1
8
-5
,18
-5,9
7
-4
,95
-3,0
9
Act
ual
bud
get
ary b
alance
(%
of
GD
P)
-5
,40
-7,5
2
-5
,26
-3,0
0
-1
,83
Cycl
ical
bal
ance
(%
of
PIB
)
1,5
6
-1
,55
-1,7
9
-1
,49
-0,9
3
CA
B (
% o
f P
IB)
-6
,96
-5,9
7
-3
,47
-1,5
1
-0
,90
Pes
imis
tic
scen
ari
o
2
00
8
2
00
9
2
01
0
2
01
1
2
01
2
GD
P g
row
th r
ate
(%)
7
,10
-8,8
4
-2
,08
1,5
5
2
,75
Po
tenti
al G
DP
gro
wth
rat
e (%
)
4,3
0
1
,57
0,3
5
0
,20
0,2
0
Outp
ut-
gap
(%
)
5,1
8
-5
,60
-7,8
8
-6
,64
-4,2
7
Act
ual
bud
get
ary b
alance
(%
of
GD
P)
-5
,40
-8,1
4
-5
,81
-3,0
0
-2
,18
Cycl
ical
bal
ance
(%
of
PIB
)
1,5
6
-1
,68
-2,3
6
-1
,99
-1,2
8
CA
B (
% o
f P
IB)
-6
,96
-6,4
6
-3
,45
-1,0
1
-0
,90
Op
tim
isti
c sc
ena
rio
20
08
20
09
20
10
20
11
20
12
GD
P g
row
th r
ate
(%)
7
,10
-7,6
8
1
,06
2,6
0
3
,85
Po
tenti
al G
DP
gro
wth
rat
e (%
)
4,3
0
2
,34
1,6
0
1
,48
1,4
6
Outp
ut-
gap
(%
)
5,1
8
-5
,11
-5,6
2
-4
,58
-2.3
4
Act
ual
bud
get
ary b
alance
(%
of
GD
P)
-5
,40
-7,0
2
-5
,12
-3,0
0
-1
,60
Cycl
ical
bal
ance
(%
of
PIB
)
1,5
6
-1
,53
-1,6
9
-1
,37
-0,7
0
CA
B (
% o
f P
IB)
-6
,96
-5,4
9
-3
,43
-1,6
3
-0
,90
S
ou
rce:
CA
PE
F-Q
M m
od
el
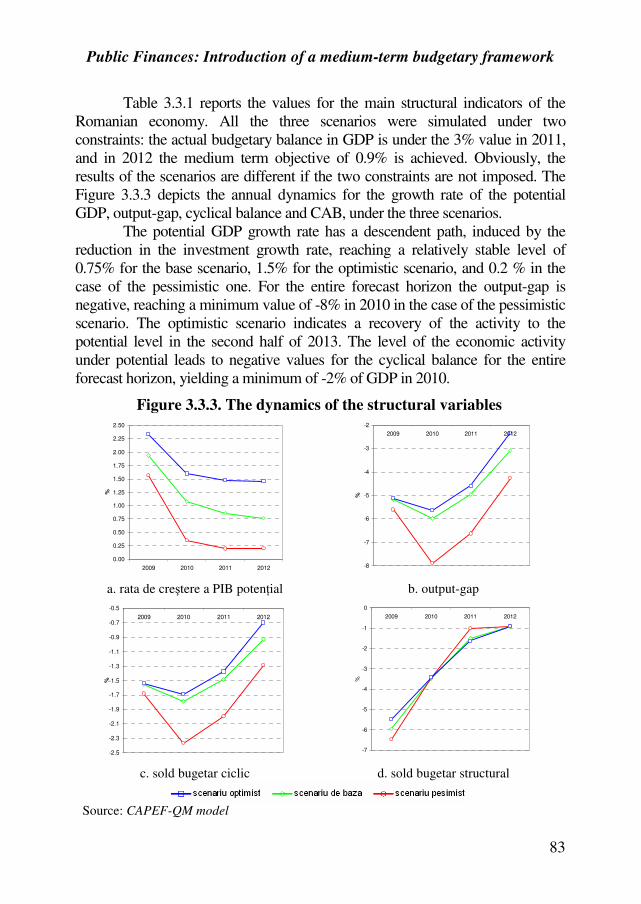
Public Finances: Introduction of a medium-term budgetary framework
83
Table 3.3.1 reports the values for the main structural indicators of the
Romanian economy. All the three scenarios were simulated under two
constraints: the actual budgetary balance in GDP is under the 3% value in 2011,
and in 2012 the medium term objective of 0.9% is achieved. Obviously, the
results of the scenarios are different if the two constraints are not imposed. The
Figure 3.3.3 depicts the annual dynamics for the growth rate of the potential
GDP, output-gap, cyclical balance and CAB, under the three scenarios.
The potential GDP growth rate has a descendent path, induced by the
reduction in the investment growth rate, reaching a relatively stable level of
0.75% for the base scenario, 1.5% for the optimistic scenario, and 0.2 % in the
case of the pessimistic one. For the entire forecast horizon the output-gap is
negative, reaching a minimum value of -8% in 2010 in the case of the pessimistic
scenario. The optimistic scenario indicates a recovery of the activity to the
potential level in the second half of 2013. The level of the economic activity
under potential leads to negative values for the cyclical balance for the entire
forecast horizon, yielding a minimum of -2% of GDP in 2010.
Figure 3.3.3. The dynamics of the structural variables
0.00
0.25
0.50
0.75
1.00
1.25
1.50
1.75
2.00
2.25
2.50
2009 2010 2011 2012
%
-8
-7
-6
-5
-4
-3
-2
2009 2010 2011 2012
%
a. rata de creştere a PIB potenţial b. output-gap
-2.5
-2.3
-2.1
-1.9
-1.7
-1.5
-1.3
-1.1
-0.9
-0.7
-0.5
2009 2010 2011 2012
%
-7
-6
-5
-4
-3
-2
-1
0
2009 2010 2011 2012
%
c. sold bugetar ciclic d. sold bugetar structural
Source: CAPEF-QM model
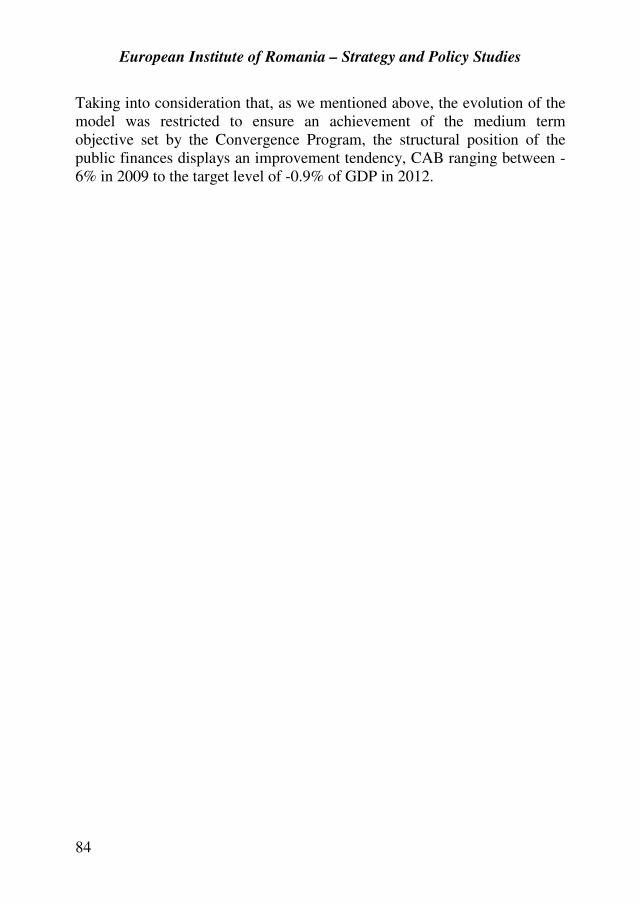
European Institute of Romania – Strategy and Policy Studies
84
Taking into consideration that, as we mentioned above, the evolution of the
model was restricted to ensure an achievement of the medium term
objective set by the Convergence Program, the structural position of the
public finances displays an improvement tendency, CAB ranging between -
6% in 2009 to the target level of -0.9% of GDP in 2012.
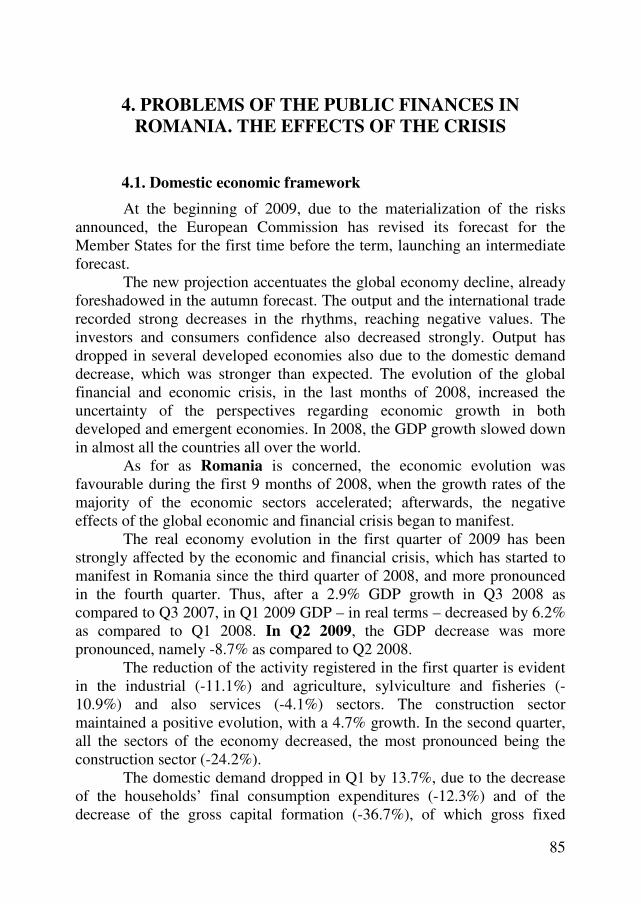
85
4. PROBLEMS OF THE PUBLIC FINANCES IN
ROMANIA. THE EFFECTS OF THE CRISIS
4.1. Domestic economic framework
At the beginning of 2009, due to the materialization of the risks
announced, the European Commission has revised its forecast for the
Member States for the first time before the term, launching an intermediate
forecast.
The new projection accentuates the global economy decline, already
foreshadowed in the autumn forecast. The output and the international trade
recorded strong decreases in the rhythms, reaching negative values. The
investors and consumers confidence also decreased strongly. Output has
dropped in several developed economies also due to the domestic demand
decrease, which was stronger than expected. The evolution of the global
financial and economic crisis, in the last months of 2008, increased the
uncertainty of the perspectives regarding economic growth in both
developed and emergent economies. In 2008, the GDP growth slowed down
in almost all the countries all over the world.
As for as Romania is concerned, the economic evolution was
favourable during the first 9 months of 2008, when the growth rates of the
majority of the economic sectors accelerated; afterwards, the negative
effects of the global economic and financial crisis began to manifest.
The real economy evolution in the first quarter of 2009 has been
strongly affected by the economic and financial crisis, which has started to
manifest in Romania since the third quarter of 2008, and more pronounced
in the fourth quarter. Thus, after a 2.9% GDP growth in Q3 2008 as
compared to Q3 2007, in Q1 2009 GDP – in real terms – decreased by 6.2%
as compared to Q1 2008. In Q2 2009, the GDP decrease was more
pronounced, namely -8.7% as compared to Q2 2008.
The reduction of the activity registered in the first quarter is evident
in the industrial (-11.1%) and agriculture, sylviculture and fisheries (-
10.9%) and also services (-4.1%) sectors. The construction sector
maintained a positive evolution, with a 4.7% growth. In the second quarter,
all the sectors of the economy decreased, the most pronounced being the
construction sector (-24.2%).
The domestic demand dropped in Q1 by 13.7%, due to the decrease
of the households’ final consumption expenditures (-12.3%) and of the
decrease of the gross capital formation (-36.7%), of which gross fixed
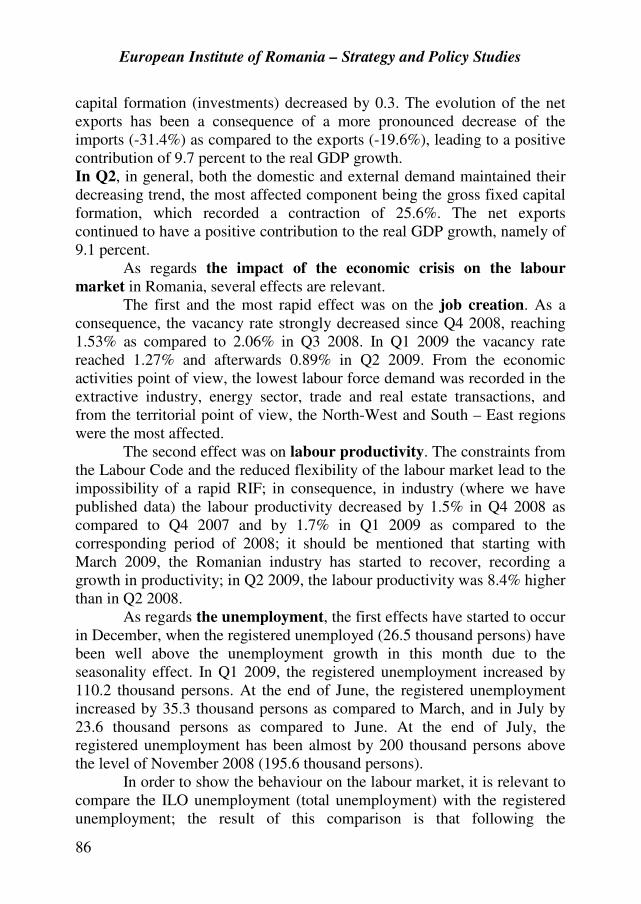
European Institute of Romania – Strategy and Policy Studies
86
capital formation (investments) decreased by 0.3. The evolution of the net
exports has been a consequence of a more pronounced decrease of the
imports (-31.4%) as compared to the exports (-19.6%), leading to a positive
contribution of 9.7 percent to the real GDP growth.
In Q2, in general, both the domestic and external demand maintained their
decreasing trend, the most affected component being the gross fixed capital
formation, which recorded a contraction of 25.6%. The net exports
continued to have a positive contribution to the real GDP growth, namely of
9.1 percent.
As regards the impact of the economic crisis on the labour
market in Romania, several effects are relevant.
The first and the most rapid effect was on the job creation. As a
consequence, the vacancy rate strongly decreased since Q4 2008, reaching
1.53% as compared to 2.06% in Q3 2008. In Q1 2009 the vacancy rate
reached 1.27% and afterwards 0.89% in Q2 2009. From the economic
activities point of view, the lowest labour force demand was recorded in the
extractive industry, energy sector, trade and real estate transactions, and
from the territorial point of view, the North-West and South – East regions
were the most affected.
The second effect was on labour productivity. The constraints from
the Labour Code and the reduced flexibility of the labour market lead to the
impossibility of a rapid RIF; in consequence, in industry (where we have
published data) the labour productivity decreased by 1.5% in Q4 2008 as
compared to Q4 2007 and by 1.7% in Q1 2009 as compared to the
corresponding period of 2008; it should be mentioned that starting with
March 2009, the Romanian industry has started to recover, recording a
growth in productivity; in Q2 2009, the labour productivity was 8.4% higher
than in Q2 2008.
As regards the unemployment, the first effects have started to occur
in December, when the registered unemployed (26.5 thousand persons) have
been well above the unemployment growth in this month due to the
seasonality effect. In Q1 2009, the registered unemployment increased by
110.2 thousand persons. At the end of June, the registered unemployment
increased by 35.3 thousand persons as compared to March, and in July by
23.6 thousand persons as compared to June. At the end of July, the
registered unemployment has been almost by 200 thousand persons above
the level of November 2008 (195.6 thousand persons).
In order to show the behaviour on the labour market, it is relevant to
compare the ILO unemployment (total unemployment) with the registered
unemployment; the result of this comparison is that following the

Public Finances: Introduction of a medium-term budgetary framework
87
difficulties on the labour market induced by the economic crisis, more
unemployed stopped looking for a job on their own. Taking into
consideration that the main difference between the ILO and the registered
unemployment comes from the unemployed who are looking for a job on
their own, it seems that in Q1, all the unemployed asked for a job at the
National Agency for Employment; in Q1, total ILO unemployed increased
by 98 thousand persons, and the registered unemployed by 110 thousand
persons.
Table 4.1.1. Evolution of the number of unemployed
ILO unemployed
increase Registered unemployed increase
(thous persons) Q I 2009 /
Q IV 2008
March 2009/
December 2008
June 2009 /
March 2009
Total 98 110.2 35.3
- male 64 76.1 16.4
- female 34 34.1 18.9
Source: NIS, NCEF.
The impact of the economic crisis on the employment was
characterized, from the structural point of view, by two trends: the increase
of the number of employees in the hidden economy and the more
pronounced decrease of the employment in the non-wage occupation,
phenomenon explained by liberal jobs and the micro enterprises, which have
been more affected.
The available data for Q1 (AMIGO survey) show that as compared
to Q1 2008, in Q1 2009 the employment increased by 0.9%, the average
number of employees by 0.4% and the number of persons employed in non-
wage activities decreased by 3.6%.
At the same time, the average number of employees in the official
economy decreased by 1.8% in Q1 2009, as compared to the corresponding
quarter of 2008. In value terms, the percentage gap of 2.2 points between the
total number of employees dynamic (AMIGO survey) and the number of
employees in the official economy (Labour Force Balance), might represent
an increase of the average number of employees in the hidden economy in
Q1 2009 of about 110 thousand persons.
The evolution of the female unemployment starting October, when
the first dysfunctions have started to manifest in the Romanian economy,
shows the following trends:
European Institute of Romania – Strategy and Policy Studies
88
� at the beginning of the economic crisis women have been less
affected, their share in total ILO unemployment being 35.4% in
Q1 2009 (64 thousand persons more than in Q4 2008);
� the net inflows in the registered unemployment for women at
the end of March 2009 were 34.1 thousand persons as compared
to December 2008, while for men the increase is double (76.1
thousand persons).
As for as the registered unemployed in Q2 is concerned, where we
have statistical data, there can be seen a switch in the trend for female
unemployment. Thus, in Q2, there is an increase of the net inflows in
unemployment for women, recording an increase of their share in total from
43.1% at the end of March to 53.6% at the end of June, namely an addition
of 18.9 thousand as compared to only 16.4 thousand for male
unemployment.
This evolution is to be correlated with the evolution of the number of
employees and also with the economic performances recorded in different
sectors. The light industry, an activity with almost integrally female labour
force, has reduced the output volume with over 25% in the first 5 months as
compared to the corresponding period of 2008. Only in "clothing articles"
the number of employees decreased in April and May by almost 10
thousand persons, and another 3.5 thousand persons have been RIFed in
textile and leather industries. The trade activity is another area affected by
the crisis through the reduced demand and is characterized by predominant
female labour force. In this case, the decrease of the number of employees
in April and May was about 12 thousand persons.
From the structural point of view, in Romania, the budgetary
expenditures trend during 2007-2008 was opposite to the EU trend,
reveiling the pro-cyclical character of the budgetary policy and the
aggravation of fiscal sustainability.
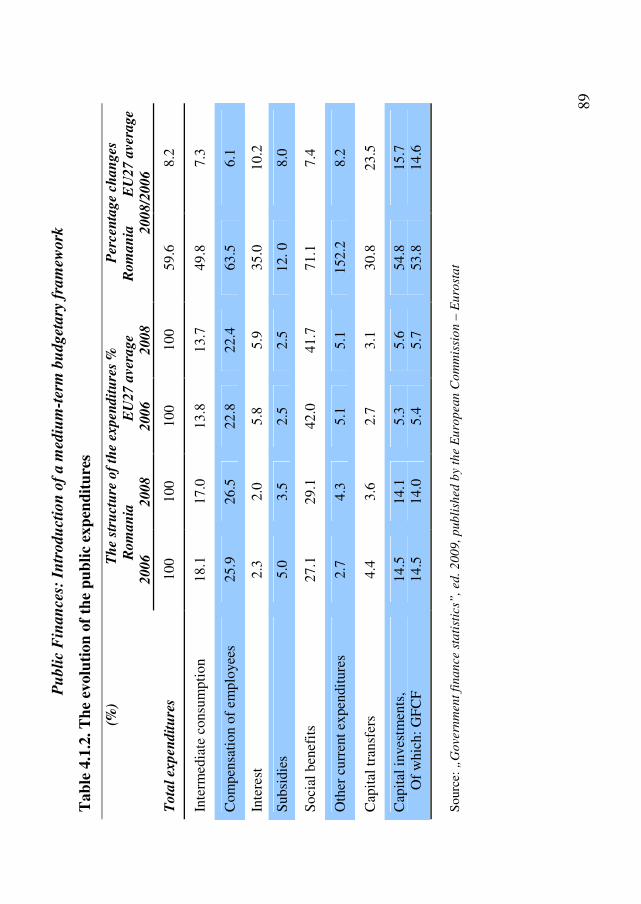
Pu
bli
c F
inan
ces:
In
trodu
ctio
n o
f a m
ediu
m-t
erm
bu
dget
ary
fra
mew
ork
89
Tab
le 4
.1.2
. T
he
evolu
tion
of
the
pu
bli
c ex
pen
dit
ure
s
Th
e st
ruct
ure
of
the
expen
dit
ure
s %
P
erce
nta
ge
cha
nges
Rom
an
ia
EU
27 a
vera
ge
Rom
an
ia
EU
27
ave
rage
(%)
20
06
2008
2006
2008
200
8/2
00
6
Tota
l ex
pen
dit
ure
s 1
00
100
100
100
59.6
8
.2
Inte
rmed
iate
con
sum
pti
on
1
8.1
17.0
13.8
13.7
49.8
7
.3
Com
pen
sati
on o
f em
plo
yee
s 2
5.9
26.5
22.8
22.4
63.5
6
.1
Inte
rest
2
.3
2.0
5.8
5.9
35.0
1
0.2
Subsi
die
s 5
.0
3.5
2.5
2.5
12.
0
8.0
Soci
al b
enef
its
27
.1
29.1
42.0
41.7
71.1
7
.4
Oth
er c
urr
ent
expen
dit
ure
s 2
.7
4.3
5.1
5.1
152.2
8
.2
Cap
ital
tra
nsf
ers
4.4
3.6
2.7
3.1
30.8
2
3.5
Cap
ital
inves
tmen
ts,
O
f w
hic
h:
GF
CF
14
.5
14
.5
14.1
14.0
5.3
5.4
5.6
5.7
54.8
53.8
15
.7
14
.6
So
urc
e: „
Go
vern
men
t fi
na
nce
sta
tist
ics”
, ed
. 2
00
9, p
ub
lish
ed b
y th
e E
uro
pea
n C
om
mis
sio
n –
Eu
rost
at
European Institute of Romania – Strategy and Policy Studies
90
If in UE 27 the dynamic of the wages, goods and services and social
securities expenditures was below the total budgetary expenditures, in order
to create resources for investments, in Romania, it was the opposite: while
total expenditures increased during 2007-2008 by 59.6%, the compensation
of employees increased by 63.5% and the social benefits expenditures
increased by 71.1%.
In consequence, Romania is one of the few countries in which the
share of the compensation of employees and the social benefits expenditures
in total expenditures increased in detriment of investments; these two
categories represented in 2008 55.6% of the total budgetary expenditures, as
compared to 53% in 2006. In comparison, while for Romania the share of
these two categories increased by 2.6 percentage points, in EU 27, their
share decreased by almost 1 percentage point.
In Romania, the public investments’ share in total budgetary
expenditures decreased by 0.5 percentage points, while in EU 27, this share
increased by 0.3 percentage points. The same conclusions are also revealed
by the budget execution based on an internal methodology.
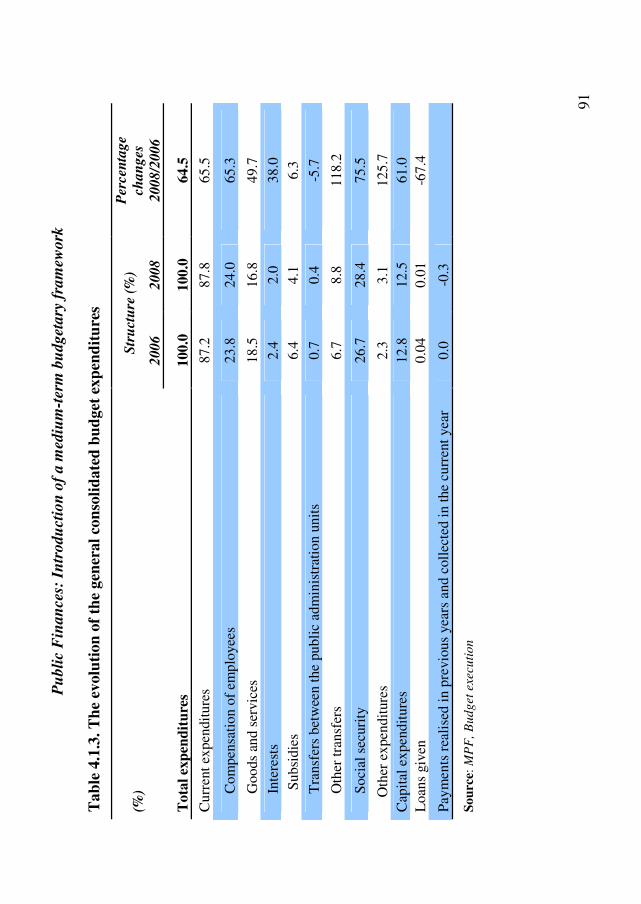
Pu
bli
c F
inan
ces:
In
trodu
ctio
n o
f a m
ediu
m-t
erm
bu
dget
ary
fra
mew
ork
91
Tab
le 4
.1.3
. T
he
evolu
tion
of
the
gen
eral
con
soli
date
d b
ud
get
exp
end
itu
res
(%)
Str
uct
ure
(%
) P
erce
nta
ge
cha
ng
es
2006
2008
20
08
/20
06
Tota
l ex
pen
dit
ure
s 100.0
100.0
6
4.5
Curr
ent
expen
dit
ure
s
87.2
87.8
6
5.5
Com
pen
sati
on
of
emp
loyee
s
23.8
24.0
6
5.3
Goods
and s
ervic
es
18.5
16.8
4
9.7
Inte
rest
s 2.4
2.0
3
8.0
S
ubsi
die
s
6.4
4.1
6
.3
Tra
nsf
ers
bet
wee
n t
he
pu
bli
c ad
min
istr
atio
n u
nit
s
0.7
0.4
-5
.7
Oth
er t
ransf
ers
6.7
8.8
1
18
.2
Soci
al s
ecuri
ty
26.7
28.4
7
5.5
Oth
er e
xpen
dit
ure
s 2.3
3.1
1
25
.7
Cap
ital
expen
dit
ure
s
12.8
12.5
6
1.0
Loan
s giv
en
0.0
4
0.0
1
-67
.4
Pay
men
ts r
eali
sed
in
pre
vio
us
yea
rs a
nd
coll
ecte
d i
n t
he
curr
ent
yea
r 0.0
-0
.3
So
urc
e: M
PF
, B
ud
get
exe
cuti
on
European Institute of Romania – Strategy and Policy Studies
92
The effects of the fiscal – budgetary policy in 2008 on 2009
External effects � Overtaking the ceiling of 3% of GDP for the budget deficit
agreed according to Stability and Growth Pact, which represents
for Romania a possibility to start the excessive deficit procedure;
� Reduction the sovereign rating by the international rating
agencies below the investments degree category (minimum
BBB-) having negative consequences on the costs for external
financing at governmental level
� The lack of predictability for fiscal – budgetary policy and the
major budgetary slippage at the end of the previous year lead to
the decrease of the foreign investors' confidence on the
Romanian economy perspectives. In the last part of the previous
year, the foreign investments flow decreased from 963 million
Euro in October to less than 400 million Euro in December.
Internal effects
� Unpaid amounts of the central and local administration to the
economic agents valuing 7.7 billion lei, equivalent of 2.1 billion
Euro (1.5% of GDP) leading to an artificial restraint of the
activity volume, especially in construction sector. This is one of
the reasons for which the construction works increased in
November only by 13.4%.
� The increase of 16.4 billion lei for the government public debt at
November, 30, 2008 as compared to the end of 2007 due to the
financing of a higher than expected budget deficit, taking also
into consideration the turbulences on the international financial
markets, the drop in the liquidity at global level and the increase
of the gains obtained by the Lei state bonds emissions.
� The necessity of adjustment for public expenditures and for the
budget deficit taking into account the difficult economic
environment.
� The lack of EU funds absorption. For example, the lack of
performance in doing payments in agriculture from the advance
received from EU lead to the lack of planting seeds on
considerable broad surfaces.

Public Finances: Introduction of a medium-term budgetary framework
93
The pre-accession funds
2009-2010 period is decisive when taking about the pre-accession
funds absorption, taking into account the fact that PHARE, ISPA and
SAPARD funds follow the “n+3” rule (n representing the year before the
accession, in our country’s case 2006).
Generally, the budget credits, both for PHARE and ISPA funds and
also for their co financing, will record an increase in 2009 as compared to
2008, being determined by:
� Contract in 2008 of an important number of projects which
imply the payment of the advance in the next period (in some
cases, these might represent 80% of the total value);
� Delays in the contract unroll in 2008, which lead to the necessity
of reallocation for 2009 for some programmed payments;
� The maturity of some ISPA projects (fulfilling the conditionality
referring to the field acquisition, receiving all the notices,
permits, etc) and the acceleration in their effective unroll.
Post-accession funds
For 2009, the total expenditures for the projects with post-accession
financing are estimated at 8.4 billion lei (1.44% of GDP), of which 5.13
billion lei (0.9% of GDP) represents co-financing from post-accession
funds.
The achievement of the forecasted level of the revenues from post-
accession funds is directly conditioned by the acceleration of the rhythm of
funds absorption.
4.2. Macroeconomic evolutions and trends during 2010 - 2012
The first factor which will influence the future evolution of the
economy will be the European context. From this point of view the
positive signals of a recovery are still weak and are still alternating with the
negative ones.
If for the constructions sector the decline has started to reduce its
amplitude since March, with monthly increases on the whole EU, in the
industry sector the output is still recording high negative rhythms.
Nevertheless, the uncertainty is given by the specific of the
Romanian economy. The particularities coming both from the level of
development (the less pronounced exposure to the external market, the low
degree of covering the potential domestic demand, etc) and from the
structure (the important share of the agriculture and the self consumption in
European Institute of Romania – Strategy and Policy Studies
94
the economy, the constructions structure with an important share of the
engineering constructions, etc) may magnify or not the economic – financial
crisis, taking into account the way in which the domestic policies are
adequate or not to this type of specific.
The allocation of important amounts for the investments represents
the main tool of limiting the economic decrease and can be used for the
partially compensation of the activity reduction in the private sector and also
for the achievement of the programmed level of the public revenues. The
main support for the prevention of the economic decline is represented by
the public investment.
Monetary and exchange rate policy
Given the prerequisite of implementing additional structural reform
aimed to increase the flexibility of the Romanian economy and its capacity
to withstand asymmetric shocks, the domestic currency will join the
Exchange rate Mechanism II (ERM II) no sooner than 2012. This assertion
also takes into account the necessary fulfillment of the criteria that would
warrant the minimum two-year participation in ERM II. Both the ERM II
pre-entry period and the duration of actual stay in this mechanism are seen
as landmarks of the convergence process the Romanian economy has
embarked upon.
The dampening of the effects of the global economic and financial
crisis, on the one hand, and sounder national economy fundamentals
alongside increasingly more stable long run exchange rate expectations led
by the advancement of the convergence process, on the other hand, will
support the gradual decrease in the volatility of the exchange rate of the Leu
and the subsequent increase in its stability. In addition, the likely persistence
of a significant productivity differential and the prospective medium-term
rebound in foreign direct investment will pave the way for the domestic
currency to resume its sustainable appreciation, in real terms, trend against
the euro, which would be a beneficial adjustment in terms of real and
nominal convergence of the Romanian economy.
Given that the Romanian economy is still witnessing a disinflation
process, although a sustainable inflation rate in the medium run has not
been recorded yet, inflation targets are set an annual basis
(December/December) as mid-points within a variation band of ± 1
percentage point, being agreed upon jointly by the National Bank of
Romania and the Government for a two-year horizon.
Thus, annual inflation targets set in the context of the direct
inflation targeting strategy followed a downward trend, which went from

Public Finances: Introduction of a medium-term budgetary framework
95
7.5% ± 1 percentage point in 2005 down to 3.5% ± 1 percentage point in
2009. For 2010, the inflation target is maintained at the previsions year’s
level, i.e 3.5% ± 1 percentage point. The major rational behind this decision
is the pressing need for attaining the 2010 inflation target, a key prerequisite
for preserving central bank credibility given the overshooting of the 2007
and 2008 inflation targets under the impact of numerous, strong inflationary
shocks that occurred successively or simultaneously.
An additional reason is the difficulty of achieving a more ambitious
target in 2010 due to the prospects of persistently adverse effects from the
necessary adjustment to sustainable levels of external imbalances, on the
one hand, and the increase – against the background of the intensification
and broadening of the global economic and financial crisis – in the
authorities’ concern for the sustainable consolidation of the disinflation
taking into account the reduction in the existing macroeconomic imbalances
and the maintenance of the financial stability, on the other hand.
Other reasons for taking a prudent approach to setting the 2010
inflation target were the anticipated persistence in the years ahead of direct
inflationary effects exerted by the factors beyond the central bank’s sphere
of influence, the most significant being: (i) the adjustment of administered
prices and indirect taxes, (ii) the continuing nominal and real convergence
of the Romanian economy, and (iii) the lingering of some asymmetric
nominal rigidities.
At the same time, this inflation target meets the requirement for
consolidated disinflation in a sustainable manner and for attaining, in line
with the euro adoption calendar, an inflation rate level compatible with both
the inflation criterion laid down in the Maastricht Treaty and the ECB’ s
quantitative definition of price stability.
Achieving the medium-term inflation target and calibrating
monetary policy accordingly will further stand out as a concern for the
central bank, given that short-term priorities include the orderly unwinding
of macroeconomic imbalances (soft landing) – witch has already been
initiated in 2008, and preserving financial system stability.
Against this backdrop, maintaining monetary policy efficacy and
ability to anchor inflation expectations can only be achieved by rebalancing
and enhancing the consistency and credibility of the macroeconomic policy
mix as well as by speeding up structural reforms. From this perspective, the
significant tightening of fiscal and income policies is a must, which needs to
materialize in the considerable narrowing of the budget deficit and hence the
reduction of the savings/investment imbalance. Tight policies are essential
for minimizing social and economic costs associated with the necessary

European Institute of Romania – Strategy and Policy Studies
96
adjustment of macroeconomic imbalances in an environment marred by the
deep economic and financial crisis worldwide. Furthermore, the
sustainability of disinflation and the resumption of sound economic growth
over the medium and long run are conditional upon a tight policy position –
also through the potentially positive impact on foreign investors' confidence
in relation to the outlook for the domestic economy.
Medium term fiscal and budgetary framework
The main pillars of the medium term budgetary framework are the
stability, sustainability and finance of the fundamental sectors in order to
reach a durable economic growth, the protection of the economic interests of
the population, ensuring the social security and counterbalancing the
macroeconomic risks.
The specific objective on medium term is the general consolidated
budget adjustment towards a target of the structural deficit of 1% of GDP,
which will give enough reasons for not exceeding the limit asked by the EU.
The medium term macroeconomic framework represents a starting
point and it does not include the fiscal and administrative measures which
will be taken in order to increase the share of the revenues in GDP on
medium term. This framework will be adjusted once the fiscal budgetary
vision on medium term will be finished during 2009.
Thus, the objectives of the fiscal policy are the following:
� transparence, predictability, stability and transpose in the Romanian
legislation of all the European directives which will be applied
starting 2010;
� improvement in the collecting level of the public revenues and the
increase of their share in GDP;
� a higher degree of voluntary comply of the contributors;
� intensify the monitoring, guidance and control activities and a more
efficient administration of the state revenues including measures to
extend the monitoring and supervision processes for the products
with high risk degree from the tax evasion point of view.
The medium term public finance development is driven by the
deteriorated budget position in 2008 and by the difficult international and
European context. The economic growth forecast continues to be under the
burden of a wide spectrum of uncertainties, the most significant of which
are connected with the economic activity prospects and the EU markets’
sentiment.
Recognizing the need of a significant adjustment with a view to
restore the balance of public finance in the context of an economic growth
Public Finances: Introduction of a medium-term budgetary framework
97
lower than expected for 2009, the Government has decided to promote a
mix of economic and budget policies which are meant to:
• lead to scaling down of the budget deficits and the financing
requirements for the public sector;
• confine the effects of the global financial crisis on the Romanian
economy;
• consolidate the level of budgetary revenues by promoting some
measures to expand the tax basis, improve tax collection and increase
certain categories of taxes;
• keep under control and rationalize the dynamics of the current
expenditures of the public administration (wage-related expenditures ,
materials etc.).
• create and maintain sufficient space for public investments.
Consequently, the budget represents a commitment to obtain a
significant and constant progress in the fiscal consolidation in the following
three years. The fiscal policy will be characterized by coherence,
predictability and stability, by elaborating and re-writing some projects of
the Fiscal Code and the Fiscal Procedure Code, unitary integrated and
harmonized with EU directives and economic realities. The consolidation of
the budget revenue base is still essential for ensuring the resources required
for the economic development and for Romania to meet its commitments
assumed as an EU member state.
Macroeconomic forecast for 2009-2012
The macroeconomic forecast for 2009 takes into account the fact that
the contraction trend manifested within the economic activity, compared to
the previous year, will continue all along the year. Therefore, in the
preliminary version of the autumn forecast 2009, the National Commission
for Economic Forecasting foresees a contraction of GDP, in real terms, of
about 8% as against 2008, as a result of the lower household consumption
due to the reduction of incomes and credit constraints and lower
governmental consumption as a result of the fiscal adjustment.
The domestic demand will diminish significantly, as its main
components – the private consumption and the gross fixed capital formation
– will also register decreases, by 4.1% and respectively 6.5%. The public
investment in infrastructure is a top priority of the Government, being
expected to accelerate along with the process for the absorption of European
funds. The Government consumption will decrease by 11%, as a result of
the consolidation of the budget deficit
European Institute of Romania – Strategy and Policy Studies
98
The lower external demand correlated with the contraction of the
domestic economic activity, will influence the evolution of the foreign trade,
by reducing significantly both the exports and the imports of goods and
services. A positive contribution of the net exports (7.5 percents) to GDP
real growth is foreseen, as the contraction of the imports might strongly
exceed the export’s one.
As the measures provided by the economic and financial recovery
plan will become effective, both in Romania and in the other EU member
states, it is expected that the economic deterioration will slowdown and the
confidence degree will increase.
National Commission for Economic Forecasting anticipates for the
forthcoming three years (2010 - 2012), that the GDP growth will
progressively attain positive values, due to the developments in trade and
the manufacturing output.
After the stabilization of the economies and the overcome of the
recession in 2010, when the economic growth is forecasted to exceed zero
(0.5%), we expect the resumption of the economic activity in 2011 and, on
this basis, a 2.4% GDP growth, followed by a 3.7% growth in 2012. This
forecast is based on the assumption of the improvement of the domestic and
the international economic environments, the stabilization of the financial
markets and the encouragement of additional investment and private
consumption by the stimulus measures.
The domestic demand will manifest a recovery trend, sustained by
the investment process. Thus, the forecast for 2010 shows a 1.1% increase,
while for 2012 we expect a 4.6% growth.
After the end of the declining trend in 2010, there are also
assumptions for the recovery of the investment process in the private sector,
on the background of the beginning of projects financed from structural
funds. Thus, the gross fixed capital formation is expected to increase by 2%
in 2010 and until 2012 it might exceed 6% on the basis of a growing
propensity toward investment and unlocking of the lending process.
As the labor market will stabilize and the population incomes will
increase, compared to the labor productivity, a recovery of the private
consumption expenditures is expected starting 2010, but with growth
rhythms which will not exceed 4%. The measures taken in order to cut the
expenditures will have a negative impact on the governmental consumption;
there might be increases starting 2012.
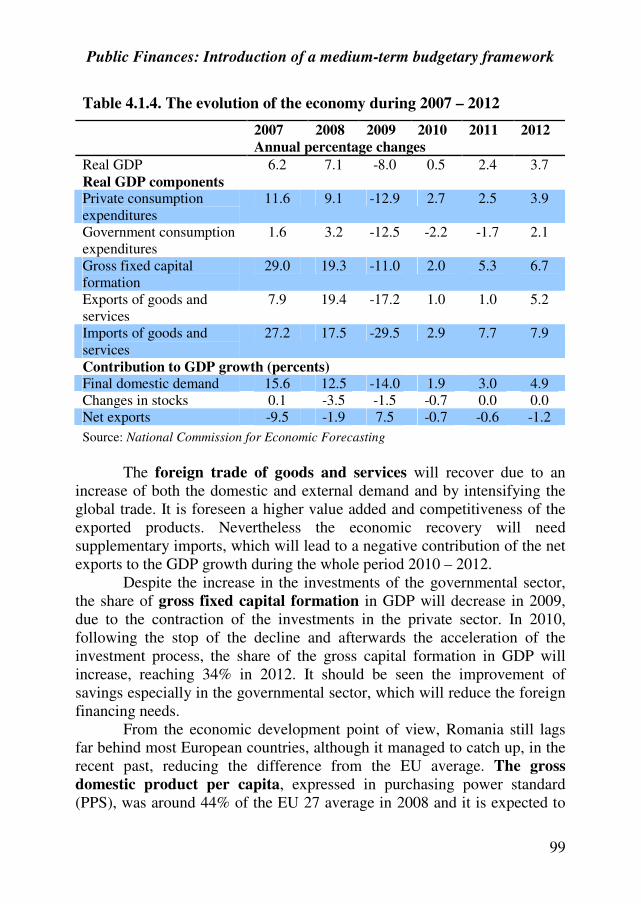
Public Finances: Introduction of a medium-term budgetary framework
99
Table 4.1.4. The evolution of the economy during 2007 – 2012
2007 2008 2009 2010 2011 2012
Annual percentage changes
Real GDP 6.2 7.1 -8.0 0.5 2.4 3.7
Real GDP components Private consumption
expenditures
11.6 9.1 -12.9 2.7 2.5 3.9
Government consumption
expenditures
1.6 3.2 -12.5 -2.2 -1.7 2.1
Gross fixed capital
formation
29.0 19.3 -11.0 2.0 5.3 6.7
Exports of goods and
services
7.9 19.4 -17.2 1.0 1.0 5.2
Imports of goods and
services
27.2 17.5 -29.5 2.9 7.7 7.9
Contribution to GDP growth (percents)
Final domestic demand 15.6 12.5 -14.0 1.9 3.0 4.9
Changes in stocks 0.1 -3.5 -1.5 -0.7 0.0 0.0
Net exports -9.5 -1.9 7.5 -0.7 -0.6 -1.2
Source: National Commission for Economic Forecasting
The foreign trade of goods and services will recover due to an
increase of both the domestic and external demand and by intensifying the
global trade. It is foreseen a higher value added and competitiveness of the
exported products. Nevertheless the economic recovery will need
supplementary imports, which will lead to a negative contribution of the net
exports to the GDP growth during the whole period 2010 – 2012.
Despite the increase in the investments of the governmental sector,
the share of gross fixed capital formation in GDP will decrease in 2009,
due to the contraction of the investments in the private sector. In 2010,
following the stop of the decline and afterwards the acceleration of the
investment process, the share of the gross capital formation in GDP will
increase, reaching 34% in 2012. It should be seen the improvement of
savings especially in the governmental sector, which will reduce the foreign
financing needs.
From the economic development point of view, Romania still lags
far behind most European countries, although it managed to catch up, in the
recent past, reducing the difference from the EU average. The gross
domestic product per capita, expressed in purchasing power standard
(PPS), was around 44% of the EU 27 average in 2008 and it is expected to
European Institute of Romania – Strategy and Policy Studies
100
go up to 50% in 2012.
It is estimated that the exports of goods in 2009 will decrease by
20.5% and imports of goods by 36.4%. In this context, compared to 2008,
the share of FOB-FOB trade deficit in GDP will decrease by 8 pp, reaching
5.3%.
The current account deficit of the external balance of payments is
expected to reach 6.4 billion euro, representing 5.5% of GDP, mainly due to
the decline of the trade deficit.
Starting from the assumption regarding the end of the recession in
2010 and the recovery of growth of the world economy in 2010, the exports
of goods will slightly increase by 1.3% and imports by 3%, followed by an
increase of 9.1% and 12.5% respectively, in 2012.
The current account deficit will maintain at 7-8.5 billion euro, with a
share in GDP estimated at 6.8% in 2010 and 5.7% in 2012.
As regards the labour market, taking into account the economic
slowdown, especially in industry, the average number of employees is
expected to decrease by 6.3% in 2009. As a result the registered
unemployment rate will increase to 7.6% at the end of the year. For the
following period, as the economic growth will start to recover, and the
measures for employment stimulation will be implemented and will lead to
job creation, the average number of employees is expected to go up by 5%
on the whole period. In the same time, the registered unemployment rate
will decrease to 5.4% in 2012.
The inflation is expected to decrease gradually. Therefore, the
inflation rate in 2009 will go down at the end of the year to 4.5%,
corresponding to an average of 5.6% as compared to 2008.
The forecast for consumer prices is based on the decline of the
excess demand during 2009, triggered by the recently worsening global
financial and economic conditions. Simultaneously, the disinflation process
will be helped by the prudential measures taken by the NBR, aimed at
tempering credit growth as well as a cautious wage and budgetary policies
promoted by the government.
On the other hand, the international economic context, along with
persistent macroeconomic imbalances in the second half of the previous
year, caused higher exchange rate volatility, with the domestic currency
depreciating as against the main foreign currencies, a trend which may
continue this year as well. This will determine an increase of the imported
goods prices, but also of the prices for domestic products or services, which
depend on the European currency. At the same time, the consequence of
such depreciation can be reflected in a reduction of private consumption,
Public Finances: Introduction of a medium-term budgetary framework
101
especially for those individuals who, over the past years, resorted to loans in
foreign currencies. Under these circumstances, the reduction of the demand
will go significantly down, to the benefit of the estimated disinflation
process.
The inflation rate is expected to decrease gradually to 2.8% in 2012
(annual average).
4.3. The agreement with the international institutions and the
economic impact
At the beginning of March 2009, due to the aggravation of the
macroeconomic framework, the government announced in public Romania's
intention to access external financial assistance on medium term. So it
was agreed with the European Commission, International Monetary Fund
and International Financial Institutions the macroeconomic framework and
the potential external financial need for Romania.
The targets of the external financing package for Romania are the
following:
� the reduction of the crisis' effects;
� prevention of a severe economic recession;
� a more rapid recovery of the economic growth in the positive
area;
� protection of the vulnerable categories;
� ensure the fiscal sustainability on medium and long term, in
order to prepare Romania for Euro area accession;
� reduce the excessive pressures on the exchange rate;
� keep a comfortable level of liquidity on national financial
market;
� ensure the external financing to the level of the financing need,
at low costs;
� improving the level of confidence in the Romanian economy
perspectives (country rating).
Based on a stand by agreement, for 24 months, the International
Monetary Fund provides Romania 12.95 billion Euro (11.44 billion SDR).
The loan from the IMF is administrated by the National Bank of Romania.
The amounts from the stand-by agreement will consolidate the foreign
reserve, having an important role in the process of gradual reduction of the
minimum compulsory reserves in foreign currency of the Romanian banks
and in the creation of a corresponding level of liquidity on the monetary
market. The cost conditions are very efficient and more favorable than the
European Institute of Romania – Strategy and Policy Studies
102
one which could have been obtained through the accession of internal and
external financial markets.
The financial assistance of 5 billion Euro from the European
Union represents a part of a multilateral package of external financial
support for Romania and it should be used for the balance of payments
equilibration. The EC loan is administered by the Ministry of Public
Finances; the amounts are kept in the state treasury and should be used for
financing the budget deficit and refinancing the payable public debt.
The loan will be given in favorable financial conditions, benefiting also by
the guarantees offered by the community budget.
The first tranche of 1.5 billion euro has already been collected by the
state treasury and another 1 billion euro has to be collected until the end of
2009.
These three loans for development policies totaling 1 billion euro
from World Bank are given for a package of reforms in public sector area,
including education and health, reforms in the social security area and in the
financial sector. The board of directors within the International Bank for
Reconstruction and Development, part of the World Bank has already
approved the first tranche of 300 million Euro for development policies.
These loans given by IBRD will be oriented towards the budget deficit
financing.
The first tranche of 300 million euro for the development policies is
estimated to be given in September 2009. The second tranche has to be
approved by the boards of directors until the end of 2009 and the third one
in the first half of 2010.
In the same time, 1 billion euro represents available amounts within
some facilities offered by EIB and IBRD for the private sector financing
through the Romanian financial institutions.
The main characteristics of the Program for the economic
support and for the reduction of the financial crisis effects, agreed by
the Romanian authorities with IMF/EC/WB are the following:
On short term
� reducing the budget deficit by 1.1% of GDP, until 4.6% of GDP;
� for a better discipline of the budgetary execution during the
whole year, there have been created, in agreement, performance
criterion for quarterly budget deficits;
On medium term
� reducing the deficit of the general consolidated budget until
3.7% of GDP starting 2010 and below 3% of GDP in 2011;
� limitation of the budgetary rectifications during the whole year;
Public Finances: Introduction of a medium-term budgetary framework
103
� establishing a fiscal council which will ensure an independent
and competent analysis of the macroeconomic and budgetary
forecasts;
� approving the fiscal accountability law (by the end of March
2010);
� introducing some fiscal rules regarding the public debt and the
primary budget deficit;
� budget sector salary law. Until October 30, 2009 it should be
adopted the law regarding the unitary salary in the budget sector,
which will be implemented gradually in maximum 3 years;
� reforming the actual system of benefits, because its share in the
earnings is higher than the share of the core salary;
� establishing a maximum level for other categories of salary
expenditures, excepting the core salary;
� for the employees with low revenues there are kept the real
revenues, and there is a possibility of gradual increase. The ratio
between the lowest and the highest salary in the system will be
from 1 to 15 as compared to 1 to 72 which is nowadays.
On long term:
There is a focus on the reform of the pension's public system with
World Bank coordination through the following:
� continuation of the adjustment of the age for retirement taking
into consideration the evolution of the life expectancy, in order
to permit a much higher flexibility of the system and also for the
alignment with the EU countries practices;
� protecting the vulnerable groups of retired through the
development of some support programs which can reduce
poverty and can increase the standard of living of this category;
� continuing the gradually implementation of the second pillar of
the pensions system.
The program with the World Bank is mainly based on the
implementation of the reforms in education, health, social protection and on
the improvement of the framework for surveillance and reglementation of
the financial sector.
Through the Strategy of Partnership with Romania (2010-2013),
created on the basis of these three loans for development policies and
technical assistance corresponding to the fulfillment of the conditionality,
the objectives of the Government of Romania and of the World Bank are the
following:
European Institute of Romania – Strategy and Policy Studies
104
� improving the strategic planning processes for the main credit
ordinators and the prioritization of the expenditures;
� enhancing the transparence for the public administration
remuneration and linking correctly with the labour market and
with the job responsibility;
� reforming the health insurance system and encouraging the
supplementary insurances;
� improving the quality of education and the access to education;
� increasing the coverage degree of the programs for social
assistance;
� improving the fiscal sustainability of the pensions system;
� improving the operation of the financial markets.
The conditions negotiated with IMF/EC/WB have not been imposed,
these were commonly agreed; they represent the obvious way in order to
reach sustainable growth, which represents the fundament of any
government.
In August 2009 it took place the first assessment mission of the
IMF from the stand by agreement, with the objective of analyzing the way
in which Romania fulfilled the objectives from the program. Even if the
implementation of the anti-crisis program, which was sustained by the IMF,
EU and WB succeed in bringing to normal the financial conditions, the
contraction of the economic activity was stronger than the projections from
the beginning of the year. This was the consequence of both an unfavorable
external environment and a more pronounced reduction of the domestic
demand.
The quantitative performance criteria have been entirely
fulfilled. Thus:
� it was achieved the target for the primary expenditures of the
consolidated general budget;
� the efforts for the control of the general consolidated budget
expenditures permitted to be achieved the target for the deficit of
the general consolidated budget established for the end of June
2009, even if some decentralized units have exceed the
expenditure limit;
� the structural reference criterion regarding the ratification by the
parliament of the measures for fiscal adjustment established for
the end of August 2009 was achieved in April;
� the Government is still prepared to take supplementary measures
in order to achieve its objectives.
Public Finances: Introduction of a medium-term budgetary framework
105
Romania promised also to adopt supplementary measures in order to
limit the fiscal deficit in 2009 and to reduce it in 2010.
As regards the measures for the adjustment of the expenditures, the
following can be mentioned:
� the expenditures with goods and services will be strongly
reduced as compared to the trend in the first half of the year
(0.5% of GDP); it is anticipated an important decrease in the self
– financed units, taking into consideration the reduction of the
own revenues;
� cut the payment of the supplementary hours and the benefits
during the whole year (0.1% of GDP);
� for the local authorities and decentralized units, following the
discussions with the local authorities, there will be introduced
some institutional reforms in order to counterbalance the risk
for the macro-fiscal stability (the historical trend of the increase
of the expenditures at local level at the end of the year)
� on medium term, there will be applied some normative acts for
the remuneration of employees and for the goods and services
expenditures;
� the reorganization of some state agencies in the government
sector both through their eradication or inclusion in the resort
ministries;
� until the end of October 2009 it should be adopted the legislation
for the improvement of the social contribution system through
the consolidation of some social contribution (from the total of
200 which exist nowadays) and through better targeting the
maintained programs.
Therewith, there have been agreed some measures in order to stimulate
the economic environment, measures for the protection of the vulnerable
categories and measures to reduce the arrears.
Measures to stimulate the economic environment � tax exemption for the reinvested profit since October 1
st 2009
and for 2010;
� increase the ceiling for public guarantees to 7.7 billion lei in
2009 (+400 mill Euro) and to 8.6 billion Lei in 2010 (+200 mill
Euro);
� allocation of 500 million Lei for the public investments;
� allocation of 400 million Lei for investments in county roads

European Institute of Romania – Strategy and Policy Studies
106
Measures to protect the vulnerable categories:
� 2% indexation of pensions since October 1st 2009;
� Allocation of 864 mill Lei for unemployment budget;
� Allocation of 500 mill Lei for pension budget.
Reduction of the arrears: � allocation of 364 mill Lei for subsidies for Romanian Railway
System in order to pay the debts to the economic agents;
� allocation of 120 mill Lei for the transfer to the local authorities
which can not pay the invoices for utilities;
� allocation of 110 mill Lei for subsidies to the local budgets in
order to pay the invoices to CETs.
107
5. CONCLUDING REMARKS
The present study emphasizes the role of public finances for
dampening the effects of the current financial and economic crisis that
Romania is experiencing, as well as for ensuring the premises for launching
economic growth.
It is of utmost importance to increase the quality of public finances,
of fiscal governance and to strengthen fiscal discipline through a better
management of budgetary resources.
The fiscal-budgetary policy of Romania should rely on observing
the principle of transparence, the principle of accountability, the principle of
efficiency and to ensure the stability of the fiscal position. Moreover, the
fiscal-budgetary policy should ensure social equity by maximizing the social
efficiency of the budgetary resources.
In order to enhance the quality of fiscal governance, institutional and
legislative measures are urgently needed, as follows: a new law of fiscal
accountability, setting up a long term fiscal strategy, transition to a multi-
annual budgetary programming by implementing a medium term budgetary
framework, introducing strict fiscal rules, setting up an independent fiscal
council and so on. To guarantee the effectiveness and efficiency of the
adopted measures, it is crucial that the fiscal strategy and the medium term
budgetary framework, as well as the independent fiscal council, are
governed by law enforced by the Parliament.
The experience of the different countries that have adopted a
medium-term fiscal-budgetary framework highlights the fact that its
implementation requires the fulfillment of several important stages, and its
design should take into consideration possible risk factors.
A first stage necessary to be accomplished refers to identifying the
type of budgetary framework about to be implemented according to the
national institutional structure, the existing human resources and the
restrictions imposed on Romania, as member of the European Union.
Taking into consideration the advantages and disadvantages of each
main type of medium-term budgetary framework presented in the paper, as
well as the distinctive features of the Romanian economy, the authors
recommend the use of a budgetary framework that is fixed with respect to
the limit budgetary indicators and changing with respect to the envisaged
horizons. The adoption of such a medium-term budgetary framework will
allow the change of the limit regarding the budgetary indicators only in
European Institute of Romania – Strategy and Policy Studies
108
extraordinary circumstances, based on the approval of the independent fiscal
council. Moreover, the independent fiscal council would have the ability to
analyze the budgetary impact of any proposal to modify the budgetary
framework, especially in the pre-election periods.
As far as the independent fiscal council is concerned, it is
recommended that it would be made up of highly qualified specialists, with
profound knowledge of Macroeconomics, with a vast experience in the
fiscal field and who have proved the potential to accurately interpret the
economic and budgetary framework.
A sine-qua-non prerequisite for a successful implementation of a
medium-term budgetary framework and an efficient functioning of the
independent fiscal council is given by robust and highly accurate forecasts,
for at least a three year horizon. To this purpose, it is required that the
system of econometric models is elaborated according to high standards
with respect to the quality of forecasts, and this system will allow a real time
evaluation of the structural position of public finances. In addition, the
system of models should allow for the fiscal risks measurements, as well as
for the impact of different endogenous and exogenous shocks on the fiscal
position. It is also recommended that the system of national models is
compatible with that used by the European Commission and by the
International Monetary Fund.
A special attention is to be paid to the training of specialists capable
of making the budgetary framework operational on the medium term, as
well as exploiting and updating the system of models.
With the adoption of the medium-term budgetary framework, a
fiscal strategy with rigorous scientific grounds is required, that will allow
the design of budgetary processes, the implementation of fiscal rules,
especially of those referring to spending limits, as well as connecting the
annual budgets to the medium-term budgetary framework.
The fiscal strategy that will be adopted should place a special
emphasis on investments in human capital and on those aimed to develop
the scientific and technological potential of the country – fundamental
vectors for progress and nation welfare.
The fiscal strategy should be targeted to create a national fiscal
system that is adaptable and efficient. The national fiscal system is formed
by the institutions, procedures and mechanisms that ensure the
programming and implementation of budgetary policies. In fact, this
represents the decisional environment in which agents plan their activity.
As the present study emphasizes, the National Fiscal System is
based on the following fundamental pillars:
Public Finances: Introduction of a medium-term budgetary framework
109
� The medium-term budgetary framework;
� The independent fiscal council;
� The fiscal rules;
� The budgetary procedures.
It is worth noting that each of the four pillars stands for a dynamic
and complex system, with numerous feed-backs with the other systems. The
corroborated action of the four pillars determines the effectiveness and the
efficiency of the national fiscal system and finally, the evolution path of the
national economy, as a whole.
It is necessary to account for the fact that the four pillars have a
complementary and synergetic action, neither of those being able to
substitute the action of other pillars.
The experience of countries that have adopted a successful strategy
for creating an adaptable and efficient national fiscal system has revealed
that the four fundamental pillars must be implemented according to a
unifying vision, as apposed to a fragmented one. In general, countries that
have implemented the four fundamental pillars in a fragmented manner have
failed in achieving the fiscal reforms.
It is obvious that the successful implementation of a coherent fiscal
strategy should rely on several essential prerequisites, such as an accounting
system in line with international standards, a coherent statistical system,
project based budgeting ability, full authority granted to the Ministry of
Finance with respect to budgetary proposals and so on.
The fiscal reform on which the national fiscal system relies should
be elaborated with most attention and competence. The fiscal strategy that
leads the reform should account for the distinctive economic conditions in
every country, the existing institutions and traditions, as well as for the
experience of countries that have successfully implemented these reforms.
Otherwise, it appears the risk of creating non-functional institutions that are
not anchored to the economic realities of a particular country.
It is well known that among the 27 countries of the European Union,
22 have reported that they have a medium-term budgetary framework,
although in some of these, due to different reasons, the framework doesn`t
function.
Also, in spite of the fact that many countries have an active and
successful independent fiscal council, in other countries, although this
council has been set up, it shortly became a useless political entity, with no
particular role, except that of ensuring back-up positions for politicians no
longer on the forefront.
European Institute of Romania – Strategy and Policy Studies
110
The fiscal rules currently play a special role within the fiscal
strategies adopted in the European Union. Whereas in 1990, the European
Union implemented 16 fiscal rules, until 2008 they became aprox. 4 times
as numerous, reaching 67. The fiscal rules have both increased numerically,
and been largely diversified.
It is worth mentioning that a successful implementation of the fiscal
rules can be done only within a medium-term budgetary framework and
based on budgetary procedures able to ensure fiscal discipline. It is obvious
that within the fiscal strategy of Romania as well, the adoption of strict
fiscal rules should play a central role.
Considering the intellectual potential in Romania, the ability to
creatively make use of similar experiences of other countries, the transfer of
expertise ensured by the European Commission and by other financial
institutions, we are certain that Romania will succeed in elaborating an
efficient national fiscal system able to promote the economic and social
progress of the country.
111
REFERENCES
[1] Alesina A., Tabellini, G. (1990) „A positive theory of fiscal deficits
and government debt,” Review of Economic Studies 57: 403-14.
[2] Alesina, A., Roubini, N. and Cohen, G. (1997) Political Cycles and
the Macroeconomy, MIT.
[3] Altăr, M., Necula, C. and Bobeică, G. (2008) “CAPEF-QM. A
Quarterly Semi-Structural Model of the Romanian Economy,”
Working Paper, Centrul de Analiză şi Prognoză Economico-
Financiară - CAPEF, www.capef.ro.
[4] Altăr, M., Necula, C. and Bobeică, G. (2009) „Estimating the
Cyclically Adjusted Budget Balance for the Romanian Economy. A
Robust Approach”, Romanian Journal of Economic Forecasting,
forthcoming.
[5] Altăr, M., Necula, C. and Bobeică, G. (2009) „Estimating the
Potential GDP for the Romanian Economy. An Eclectic Approach,”
Romanian Journal of Economic Forecasting, forthcoming.
[6] Ayuso-i-Casals J., Hernandez, D.G., Moulin, L. and Turrini, A. (2007)
„Beyond the SGP – Features and effects of the EU nationallevel fiscal
rules,” in: Ayuso-i-Casals J., Deroose, S., Flores Gual, E. şi Moulin,
L. (eds.) „The role of fiscal rules and budgetary institutions in shaping
budgetary outcomes,” European Economy − Economic Papers 275,
Bruxelles: Comisia Europeană.
[7] Barrios, S. and Schaechter, A. (2009) „Gauging by numbers: A first
attempt to measure the quality of public finances in the EU,“
European Commission Economic Papers 382.
[8] Baxter, M. and King, R. (1999) „Measuring Business Cycles:
Approximate Band-Pass Filters for Economic Time Series,” Review of
Economics and Statistics 81: 575-93.
[9] Beffy, P.O., Ollivaud, P., Richardson, P., and Sédillot, F. (2007) “New
OECD method for supply-side and medium-term assessments: a
capital services approach,” OECD Economics Department Working
Papers 482.
[10] Bergoeing, R., Kehoe, P., Kehoe, T. and Soto, R. (2002) „A Decade
Lost and Found: Mexico and Chile in the 1980s,” Review of Economic
Dynamics, 5: 166-205.
[11] Billmeier, A., (2004) „Ghostbusting: Which Output Gap Measure
Really Matters?” IMF Working Paper 146.
European Institute of Romania – Strategy and Policy Studies
112
[12] Bjornland, H.C., Brubakk, L. and Jore, A.S. (2005) „Measuring the
Output Gap in Norway – an Assessment,” Norges Bank Economic
Bulletin, LXXVI, 2.
[13] Bouthevillain, C., Courthimann,P., Van den Dool, G., Hernández,P.,
Langenus, G., Mohr, M., Momiglianoand, S. and Tujula , M. (2001),
“Cyclically Adjusted Budget Balances: An Alternative Approach”,
ECB Working Paper 77.
[14] Bucşa, D. (2001) “Output Gap Estimation Using Unobserved
Components Models,” disertaţie DOFIN.
[15] Burns, A. and Mitchell, W.C. (1946) Measuring Business Cycles,
National Bureau of Economic Research.
[16] Buti, M. (2003) „Interactions and Coordination between Monetary and
Fiscal Policies in EMU: What are the Issues?”, in M. Buti, (ed.),
Monetary and Fiscal Policies in EMU: Interactions and
Coordination, Cambridge University Press.
[17] Buti, M., Eijffinger, S. and Franco, D. (2003) „Revisiting the Stability
and Growth Pact: Grand design or internal adjustment?” CEPR
Discussion Paper 3692.
[18] Buti, M. and van den Noord, P. (2003) „Fiscal Policy in EMU: Rules,
Discretion and Political Incentives”, European Commission Economic
Papers 206.
[19] Cahn C. and Saint-Guilhem, A. (2007) „Potential output growth in
several Industrialised countries. A comparison,” ECB Working Paper
828, November.
[20] Cerra, V. şi Saxena, S.C. (2000) „Alternative Methods of Estimating
Potential Output and the Output Gap: An Application to Sweden,”
IMF Working Paper 00/59.
[21] Charnes, A., Cooper, W. and Rhodes, E. (1978) „Measuring efficiency
of decision-making units,” European Journal of Operational Research
3: 429-444.
[22] Christiano, L. and Fitzgerald, T.J. (2003) „The bandpass filter,”
International Economic Review, 44(2): 435-65.
[23] Cogley, T. and Nason, J. M. (1995) „Effects of the Hodrick-Prescott
Filter on Trend and Difference Stationary Time Series: Implications
for Business Cycle Research,” Journal of Economic Dynamics and
Control, 19: 253-278.
[24] Congressional Budget Office (2004) „A Summary of Alternative
Methods for Estimating Potential GDP,” Congressional Budget Office
Background Paper.
Public Finances: Introduction of a medium-term budgetary framework
113
[25] Conway, P. and Frame, D. (2000) „A Spectral analysis of New
Zealand output gaps using Fourier and Wavelet techniques,” Reserve
Bank of New Zealand, Discussion Paper Series DP2000/6.
[26] Cotis, J.P., Elmeskov, J. and Mourgane, A. (2003) „Estimates of
potential output: benefits and pitfalls from a policy perspective”,
OECD working paper,
http://www.oecd.org/dataoecd/60/12/23527966.pdf
[27] Darvas, Z., and Vadas, G. (2003) „Univariate Potential Output
Estimations for Hungary,” MNB Working Paper 2003/8.
[28] Daubechies, I. (1988) „Orthonormal Bases of Compactly Supported
Wavelets,” Communication on Pure and Applied Mathematics, 41:
909-996.
[29] de Brouwer, G. (1998) „Estimating Output Gaps,” Reserve Bank of
Australia Research Discussion Paper 9809.
[30] Denis, C., Grenouilleau, D., McMorrow, K., and Roger, W. (2006)
“Calculating potential growth rates and output gaps - A revised
production function approach,” European Commission Economic
Papers 247.
[31] Diebalek, L., W. Köhler-Töglhofer and D. Prammer (2006), Reform
of the Stability and Growth Pact, Oesterreichische Nationalbank,
Monetary Policy and the Economy Q1/06.
[32] Diebold, F.X. and Senhadji, A.S. (1996) „The Uncertain Unit Root on
GNP: Comment,” American Economic Review, 86(5): 1291-1298.
[33] Dobrescu, E. (2006) Macromodels of the Romanian market economy,
Ed. Economica.
[34] Edge, R.M., Kiley, M.T. and Laforte, J.P. (2008) „Natural Rate
Measures in an Estimated DSGE Model of the U.S. Economy,”
Journal of Economic Dynamics and Control, 32: 2512-2535.
[35] Fatas, A., Mihov, I. (2003) „The Case for Restricting Fiscal Policy
Discretion,” Quarterly Journal of Economics.
[36] Galatescu, A.A., Rădulescu, B. and Copaciu, M. (2007) „Potential
GDP Estimation for Romania,” National Bank of Romania Occasional
Paper 6.
[37] Giorno, C., Richardson, P., Roseveare, D. and den Noord, P. (1995)
„Estimating Potential Output, Output Gaps and Structural Budget
Balances,” OECD Economics Department Working Papers 152.
[38] Giorno, C., Richardson, P., Roseveare, D. and van den Noord, P.
(1995), „Potential output, output gaps and structural budget balances”,
OECD Economic Studies, 24:167-209.
European Institute of Romania – Strategy and Policy Studies
114
[39] Girouard, N. and André, C. (2005) „Measuring Cyclically-adjusted
Budget Balances for OECD Countries,” OECD Economics
Department Working Paper, No. 434.
[40] Girouard, N. and Price R. (2004) „Asset Price Cycles, One-off Factors
and Structural Budget Balances,” OECD Working Paper 391.
[41] Hagemann, R. (1999) „The Structural Budget Balance. The IMF
Methodology”. IMF Working Paper, WP/99/95.
[42] Harberger, A. (1978) „Perspectives on Capital and Technology in
Less Developed Countries,” Contemporary Economic Analysis, Artis,
M.J. and Nobay, A.R. (eds.), London: Croom Helm.
[43] Harvey, A.C. (1989) Forecasting, Structural Time Series Models and
the Kalman Filter, Cambridge University Press.
[44] Harvey, A.C. and Jaeger, A. (1993) „Detrending, stylized facts and the
business cycle,” Journal of Applied Econometrics 8: 231-247.
[45] Hodrick, R.J. and Prescott, E.C. (1997) „Postwar U.S. Business
Cycles: An Empirical Investigation,” Journal of Money, Credit and
Banking, 29(1): 1-16.
[46] Inman, R.P. (1996) „Do balanced budget rules work? U.S. experience
and possible lessons for the EMU,” NBER Working paper 5838.
[47] Kalman, R.E. (1960) „A new approach to linear filtering and
prediction problems,” Journal of Basic Engineering, 82(1): 35-45.
[48] Kalman, R.E. and Bucy, R.S. (1961) „New Results in Linear Filtering
and Prediction Theory,” Journal of Basic Engineering, 83: 95-107.
[49] Koen, V. and van den Noord, P. (2005) „Fiscal Gimmickry in Europe:
One-off Measures and Creative Accounting”, OECD Working Paper
417.
[50] Kopits, G., Symansky, S. (1998) „Fiscal policy rules,” IMF
Occasional paper 162.
[51] Kuttner, K.N. (1994) „Estimating Potential Output as a Latent
Variable,” Journal of Business and Economic Statistics, 12(3): 361-
368.
[52] Langedijk, S. and Larch M. (2007) „Testing the EU fiscal
surveillance: How sensitive is it to variations in output gap
estimates?”, European Economy − Economic Papers 285.
[53] Laxton, D. and Tetlow, R.J. (1992) „A Simple Multivariate Filter for
the Measurement of Potential Output,” Bank of Canada Technical
Report 59.
[54] Okun, A.M. (1962) „Potential GDP: Its Measurement and
Significations,” Cowles Foundation Paper 190.

Public Finances: Introduction of a medium-term budgetary framework
115
[55] Orphanides, A. (1998) „Monetary Policy Evaluation with Noisy
Information,” Finance and Economics Discussion Series Working
Paper 1998-50, Federal Reserve System.
[56] Orphanides, A. (2002) „Monetary Policy Rules and the Great
Inflation,” American Economic Review Papers and Proceedings,
92(2): 115-120.
[57] Ross, K. and Ubide A. (2001) „Mind the Gap: What is the Best
Measure of Slack in the Euro Area?” IMF Working Paper 01/203.
[58] Samuelson, P. (1967), Economics. An Introductory Analysis,
McGraw–Hill Book Company.
[59] Smets, F. and Wouters, R. (2003) „An Estimated Dynamic Stochastic
General Equilibrium Model of the Euro Area,” Journal of the
European Economic Association, 1(5): 1123-1175.
[60] Stanica, C.N. (2005) „Unobserved Components Methods To Estimate
Potential Gdp (The Case Of Romania),” Romanian Journal for
Economic Forecasting 2(4): 44-63.
[61] Svensson, L.E.O. (1999) „Inflation Targeting as a Monetary Policy
Rule,” Journal of Monetary Economics, 43: 607-54.
[62] Swagel, P. and Scacciavillani, F. (2002) „Measures of Potential
Output: An Application to Israel,” Applied Economics, 34: 945-957.
[63] Taylor, J.B. (1993) „Discretion versus Policy Rules in Practice,”
Carnegie-Rochester Series on Public Policy, 39: 195-214.
[64] Trehan, B., Walsh, C. (1991) „Testing Intertemporal Budget
Constraints: Theory and Applications to U.S. Federal Budget and
Current Account Deficits,” Journal of Money, Credit and Banking 23:
210-223.
[65] van der Noord, P. (2000) „The Size and Role of Automatic Fiscal
Stabilizers in the 1990’s and Beyond”, OECD Economics Department
Working Paper 230.
[66] Watson, M.W. (1986) „Univariate Detrending Methods with
Stochastic Trends,” Journal of Monetary Economics, 18(1):49-75.
[67] Wolswijk, G. (2007) „Short and long-run tax elasticities. The case of
the Netherlands”, ECB Working Paper 763.
[68] ***, European Commission (2006) „Public finances in EMU – 2006,”
European Economy 3/2006.
[69] ***, European Commission (2007) „Public finances in EMU – 2007,”
European Economy 3/2007.
[70] ***, European Commission (2008a) „Public finances in EMU –
2008,” European Economy 4/2008.
European Institute of Romania – Strategy and Policy Studies
116
[71] ***, European Commission (2008b) „The quality of public finances
and economic growth,” Economic Papers 337.
[72] ***, Romanian Government (2009) „Programul de Convergenţă 2008-
2011”,
[73] ***, IMF (2003) „Romania: Selected Issues and Statistical
Appendix,” IMF Country Report 0312.
[74] ***, National Institute of Statistics (2007), Anuarul Statistic al
României.