Water Resource Pollution and Impacts on the local livelihood: A case study of Beas River in Kullu...
15
Future of Food: Journal on Food, Agriculture and Society • Vol. 2, Nr. 1 • Summer 2014 Water Resource Pollution and Impacts on the local livelihood: A case study of Beas River in Kullu District, India P. RANJAN MISHRA * a and R. K. NADDA b * Corresponding author, Email:- [email protected] a. SAIPEM International b. Pollution Control Board, Himachal Pradesh, India Submitted: 19 February 2014; Revised 27 May 2014; Accepted for publication: 8 June 2014; Published: 10 June 2014 Abstract Rivers are considered as the life line of any country since they make water available for our domestic, industrial and recreational functions. The quality of river water signifies the health status and hygienic aspects of a particular region, but the quality of these life lines is continuously deteriorating due to discharge of sewage, garbage and industrial effluents into them. Water demand has increased manifolds due to the increased population, therefore tangible efforts to make water sources free from pollution is catching attention all across the globe. This paper attempts to highlight the trends in water quality change of River Beas, right from Manali to Larji in India. This is an important river in the state of Himachal Pradesh and caters to the need of water for Manali and Kullu townships, besides other surrounding rural areas. The Manali-Larji Beas river stretch is exposed to the flow of sewage, garbage and muck resulting from various project activities, thereby making it vulnerable to pollution. In addition, the influx of thousands of tourists to these towns also contributes to the pollution load by their recreational and other tourist related activities. Pollution of this river has ultimately affected the livelihood of the local population in this region. Hence, water quality monitoring was carried out for the said stretch between January, 2010 and January, 2012 at 15 various locations on a quarterly basis, right from the upstream of Manali town and up to downstream of Larji dam. Temperature, colour, odor, D.O. pH, BOD, TSS, TC and FC has been the parameters that were studied. This study gives the broad idea about the characteristics of water at locations in the said river stretch, and suggestions for improving water quality and livelihood of local population in this particular domain. Keywords: Competitiveness; Ecological; hygienic; vulnerable; anthropogenic Introduction Degradation of rivers has become a serious problem around the world due to an increased level of urbanization. Though the causes leading to river degradation are diverse, disposal of solid and liquid waste, encroachment upon the river waterway and water extraction are some of the obvious causes of river degradation. Water security is emerging as an increasingly important and vital issue for India. Many Indian cities have started to experience moderate to severe water shortages, brought on by the synergistic effects of agricultural boom, urbanization and industrialization. Mishra, P Ranjan., and Nadda, R.K. (2014). Water Resource Pollution and Impacts on the local livelihood: A case study of Beas River in Kullu District, India, Future of Food: Future of Food: Journal on Food, Agriculture and Society.2 (1): 61-75 ISSN-Internet: 2197-411X / OCLC-Nr.: 862804632
-
Upload
rivpolyonline -
Category
Documents
-
view
0 -
download
0
Transcript of Water Resource Pollution and Impacts on the local livelihood: A case study of Beas River in Kullu...
Future of Food: Journal on Food, Agriculture and Society • Vol. 2, Nr. 1 • Summer 2014
Water Resource Pollution and Impacts on the local livelihood: A case study of Beas
River in Kullu District, India P. RANJAN MISHRA *a and R. K. NADDAb
* Corresponding author, Email:- [email protected]
a. SAIPEM International b. Pollution Control Board, Himachal Pradesh, India Submitted: 19 February 2014; Revised 27 May 2014; Accepted for publication: 8 June 2014; Published: 10 June 2014
Abstract Rivers are considered as the life line of any country since they make water available for our domestic, industrial and recreational functions. The quality of river water signifies the health status and hygienic aspects of a particular region, but the quality of these life lines is continuously deteriorating due to discharge of sewage, garbage and industrial effluents into them. Water demand has increased manifolds due to the increased population, therefore tangible efforts to make water sources free from pollution is catching attention all across the globe. This paper attempts to highlight the trends in water quality change of River Beas, right from Manali to Larji in India. This is an important river in the state of Himachal Pradesh and caters to the need of water for Manali and Kullu townships, besides other surrounding rural areas. The Manali-Larji Beas river stretch is exposed to the flow of sewage, garbage and muck resulting from various project activities, thereby making it vulnerable to pollution. In addition, the influx of thousands of tourists to these towns also contributes to the pollution load by their recreational and other tourist related activities. Pollution of this river has ultimately affected the livelihood of the local population in this region. Hence, water quality monitoring was carried out for the said stretch between January, 2010 and January, 2012 at 15 various locations on a quarterly basis, right from the upstream of Manali town and up to downstream of Larji dam. Temperature, colour, odor, D.O. pH, BOD, TSS, TC and FC has been the parameters that were studied. This study gives the broad idea about the characteristics of water at locations in the said river stretch, and suggestions for improving water quality and livelihood of local population in this particular domain.
Keywords: Competitiveness; Ecological; hygienic; vulnerable; anthropogenic
Introduction
Degradation of rivers has become a serious problem around the world due to an increased level of urbanization. Though the causes leading to river degradation are diverse, disposal of solid and liquid waste, encroachment upon the river waterway and water extraction are some of the obvious causes of river degradation. Water
security is emerging as an increasingly important and vital issue for India. Many Indian cities have started to experience moderate to severe water shortages, brought on by the synergistic effects of agricultural boom, urbanization and industrialization.
Mishra, P Ranjan., and Nadda, R.K. (2014). Water Resource Pollution and Impacts on the local livelihood: A case study of Beas River in Kullu District, India, Future of Food: Future of Food: Journal on Food, Agriculture and Society.2 (1): 61-75 ISSN-Internet: 2197-411X / OCLC-Nr.: 862804632
Future of Food: Journal on Food, Agriculture and Society • Vol. 2, Nr. 1 • Summer 2014
ISSN-Internet: 2197-411X / OCLC-Nr.: 862804632
62
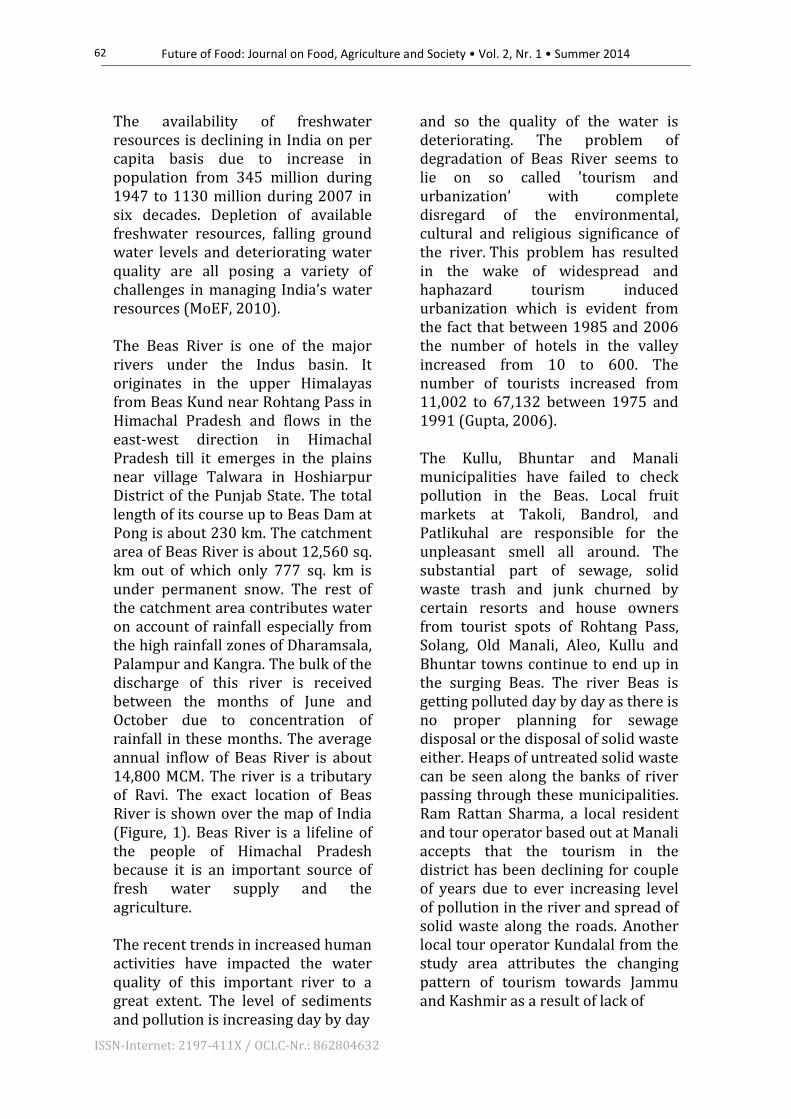
The availability of freshwater resources is declining in India on per capita basis due to increase in population from 345 million during 1947 to 1130 million during 2007 in six decades. Depletion of available freshwater resources, falling ground water levels and deteriorating water quality are all posing a variety of challenges in managing India’s water resources (MoEF, 2010). The Beas River is one of the major rivers under the Indus basin. It originates in the upper Himalayas from Beas Kund near Rohtang Pass in Himachal Pradesh and flows in the east-west direction in Himachal Pradesh till it emerges in the plains near village Talwara in Hoshiarpur District of the Punjab State. The total length of its course up to Beas Dam at Pong is about 230 km. The catchment area of Beas River is about 12,560 sq. km out of which only 777 sq. km is under permanent snow. The rest of the catchment area contributes water on account of rainfall especially from the high rainfall zones of Dharamsala, Palampur and Kangra. The bulk of the discharge of this river is received between the months of June and October due to concentration of rainfall in these months. The average annual inflow of Beas River is about 14,800 MCM. The river is a tributary of Ravi. The exact location of Beas River is shown over the map of India (Figure, 1). Beas River is a lifeline of the people of Himachal Pradesh because it is an important source of fresh water supply and the agriculture. The recent trends in increased human activities have impacted the water quality of this important river to a great extent. The level of sediments and pollution is increasing day by day
and so the quality of the water is deteriorating. The problem of degradation of Beas River seems to lie on so called 'tourism and urbanization’ with complete disregard of the environmental, cultural and religious significance of the river. This problem has resulted in the wake of widespread and haphazard tourism induced urbanization which is evident from the fact that between 1985 and 2006 the number of hotels in the valley increased from 10 to 600. The number of tourists increased from 11,002 to 67,132 between 1975 and 1991 (Gupta, 2006). The Kullu, Bhuntar and Manali municipalities have failed to check pollution in the Beas. Local fruit markets at Takoli, Bandrol, and Patlikuhal are responsible for the unpleasant smell all around. The substantial part of sewage, solid waste trash and junk churned by certain resorts and house owners from tourist spots of Rohtang Pass, Solang, Old Manali, Aleo, Kullu and Bhuntar towns continue to end up in the surging Beas. The river Beas is getting polluted day by day as there is no proper planning for sewage disposal or the disposal of solid waste either. Heaps of untreated solid waste can be seen along the banks of river passing through these municipalities. Ram Rattan Sharma, a local resident and tour operator based out at Manali accepts that the tourism in the district has been declining for couple of years due to ever increasing level of pollution in the river and spread of solid waste along the roads. Another local tour operator Kundalal from the study area attributes the changing pattern of tourism towards Jammu and Kashmir as a result of lack of

Future of Food: Journal on Food, Agriculture and Society • Vol. 2, Nr. 1 • Summer 2014
ISSN-Internet: 2197-411X / OCLC-Nr.: 862804632
63
Figure 1 Map showing location of Beas River in the northern part of India
sanitation and pollution seen all across the river banks. The fishermen community that is largely dependent upon the fishing of snow water pomfret species of fish is also affected due to increasing level of pollution; Chaman Thakur of village Bandrol
shares his experience of fishing in the Beas River over the years. As per talks with a fisherman by profession, Chaman Lal Thakur, the Pomfret species that is found in snow water downstream Manali has reduced drastically due to pollution of river

Future of Food: Journal on Food, Agriculture and Society • Vol. 2, Nr. 1 • Summer 2014
ISSN-Internet: 2197-411X / OCLC-Nr.: 862804632
64
and the increase in subsequent water temperature. The above observations inspired the authors to go for physico-chemical and biological
assessment of the river water for a particular stretch between Manali and Larji Dam which is largely affected by pollution due to tourism activities and human habitation.
Figure 2 Map showing the exact location of the sampling points marked as tiny white circles over the red line depicting river in the valley (Source: Non-Technical Summary, Environmental and Social Impact Assessment: 192 MW Allain Duhangan Hydroelectric Power Project, Tehsil Manali, District Kullu, Himachal Pradesh,February 2009, Page-2).
The district is situated between 3105’00’” North latitude and 77006’04”
East longitude. The altitude variation in the district varies from 1,300 metres to over 6,000 metres from the sea level. The rock types found in the district are phylite, slate, quartzite, limestone, schist and granites (Balokhra, 1997).
Study Area The study area comprises of Beas River from Manali to Larji along NH21 between upstream Manali town and downstream of Larji dam at 15 locations. The actual points of sampling for the study have been shown above the thick broken red line that shows the Beas River in the
Future of Food: Journal on Food, Agriculture and Society • Vol. 2, Nr. 1 • Summer 2014
ISSN-Internet: 2197-411X / OCLC-Nr.: 862804632
65
middle of the map (Figure 2). The study points were carefully chosen so as to get representative samples in order to interpret the impact due to sewage and solid waste dump into the river. Methodology
To study the impact of pollution in Beas River, water samples were collected from 15 points in the Manali-Larji stretch from upstream Manali and up to downstream Larji Hydel project on quarterly basis from January, 2010 to January, 2012. The sampling points were selected at various vulnerable points along the stretch. As far as practicable, representative and homogeneous samples were collected from River Beas from the following points; Upstream (US) Manali, Downstream (DS) Manali, US Municipal solid waste processing facility (MSWPF) Manali, DS MSWPF Manali, DS Allain Nallah Confluence, DS Duhangan Nallah Confluence, US Kullu, DS Kullu, US Parvati river Confluence, DS Parvati river Confluence, DS MSWPF Kullu, US Fermenta Biodel, DS Fermenta Biodel, DS Aut and DS Larji power House. Allain Nallah Confluence and Duhangan Nallah Confluence were selected as one of the study points as these Nallahs carry the untreated sewage from nearby villages of Prini, Aleo and Jagatsukh. The pollution due to untreated wastewater from the tourist activities of Manali is seen reflected in the sample collected from DS of Manali. The physical para-meters like temperature, colour, odour and pH were determined physically at site (Trivedi & Goel, 1984). The analysis for other chemical & biological parameters i.e. Dissolved Oxygen (DO), Biochemical
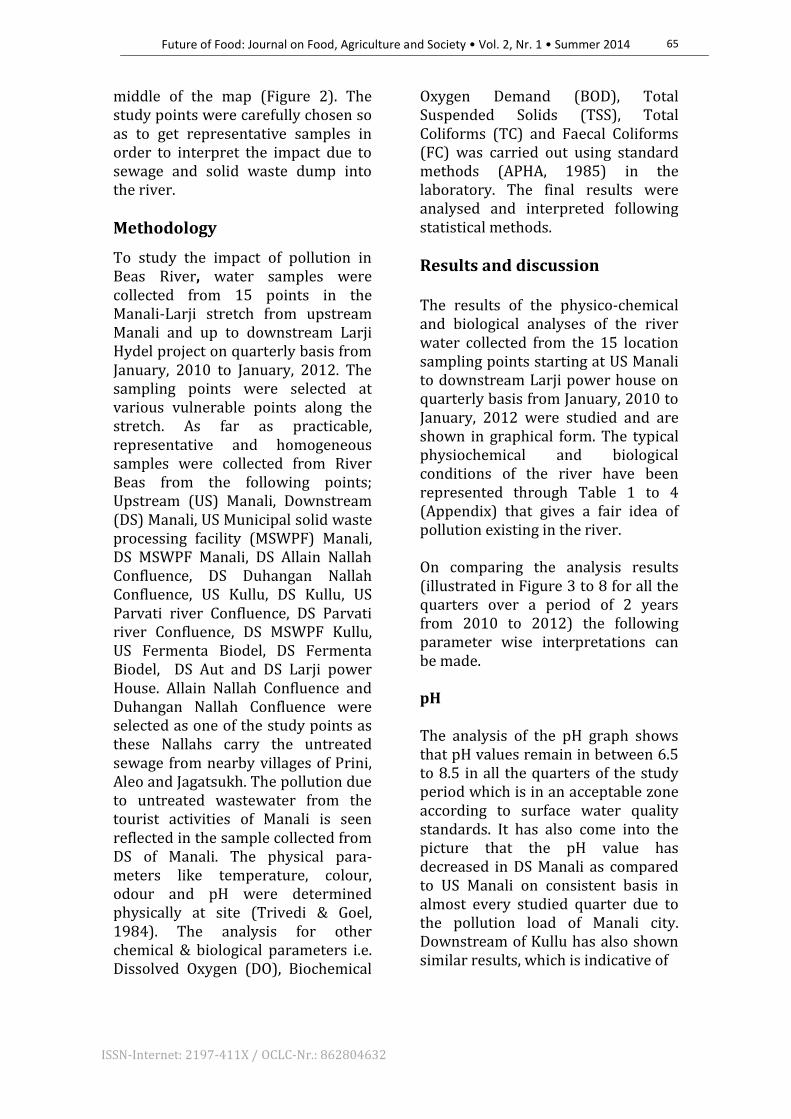
Oxygen Demand (BOD), Total Suspended Solids (TSS), Total Coliforms (TC) and Faecal Coliforms (FC) was carried out using standard methods (APHA, 1985) in the laboratory. The final results were analysed and interpreted following statistical methods. Results and discussion The results of the physico-chemical and biological analyses of the river water collected from the 15 location sampling points starting at US Manali to downstream Larji power house on quarterly basis from January, 2010 to January, 2012 were studied and are shown in graphical form. The typical physiochemical and biological conditions of the river have been represented through Table 1 to 4 (Appendix) that gives a fair idea of pollution existing in the river. On comparing the analysis results (illustrated in Figure 3 to 8 for all the quarters over a period of 2 years from 2010 to 2012) the following parameter wise interpretations can be made. pH The analysis of the pH graph shows that pH values remain in between 6.5 to 8.5 in all the quarters of the study period which is in an acceptable zone according to surface water quality standards. It has also come into the picture that the pH value has decreased in DS Manali as compared to US Manali on consistent basis in almost every studied quarter due to the pollution load of Manali city. Downstream of Kullu has also shown similar results, which is indicative of
Future of Food: Journal on Food, Agriculture and Society • Vol. 2, Nr. 1 • Summer 2014
ISSN-Internet: 2197-411X / OCLC-Nr.: 862804632
66
6,5
7
7,5
8
8,5
9
US
Man
ali
DS
Man
ali
USM
SWP
F M
anal
i
DSM
SWP
F M
anal
i
DS
AL
LAIN
Nal
la C
onf.
DS
Duh
anga
n n
alla
co
nf.
US
Ku
llu
DSK
ullu
DSM
SWP
F K
ullu
US
Par
vat
i riv
er c
onfl
.
DS
Par
vat
i ri
ver
con
fl.
US
Ferm
enta
Bio
del
DS
Fer
men
ta B
iode
l
DS
Au
t
DS
Lar
ji P
ow
er H
ou
se.
pH
sca
le
SAMPLING POINTS
2010 (I Ouater)
2010 (II Ouater)
2010 (III Ouater)
2010 (IV Ouater)
2011 (I Ouater)
2011 (II Ouater)
2011 (III Ouater)
2011 (IV Ouater)
2012 (I Ouater)
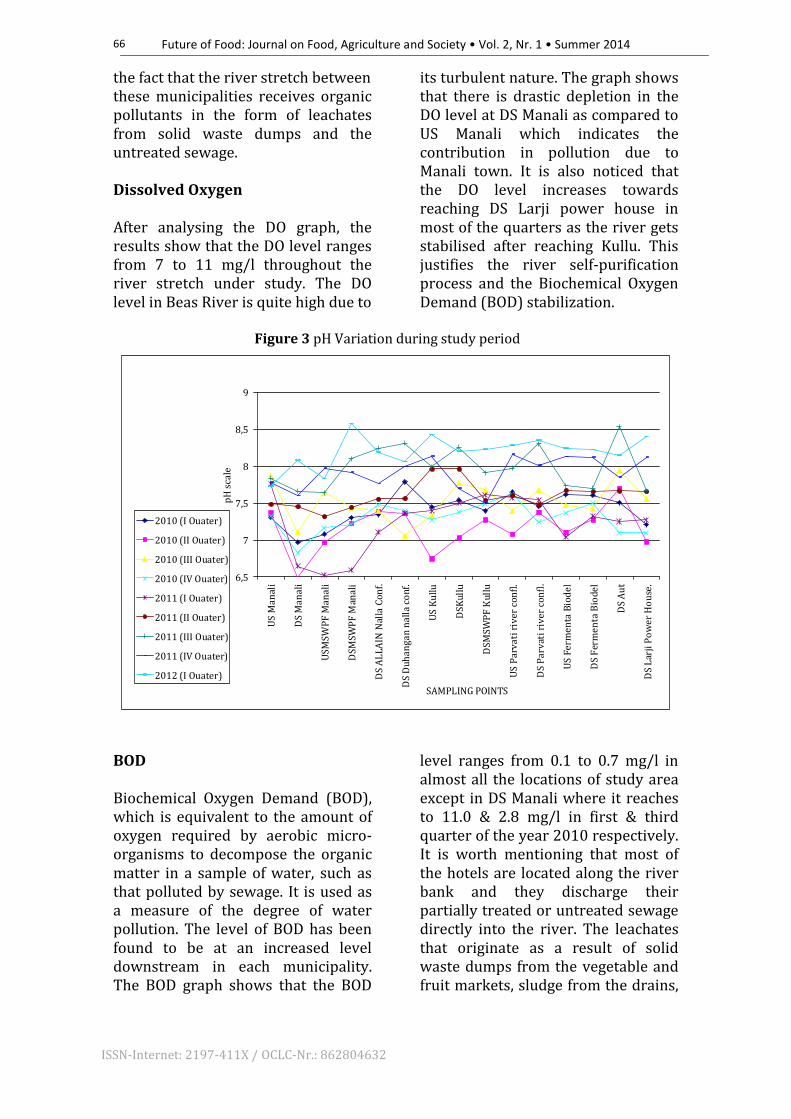
the fact that the river stretch between these municipalities receives organic pollutants in the form of leachates from solid waste dumps and the untreated sewage. Dissolved Oxygen After analysing the DO graph, the results show that the DO level ranges from 7 to 11 mg/l throughout the river stretch under study. The DO level in Beas River is quite high due to
its turbulent nature. The graph shows that there is drastic depletion in the DO level at DS Manali as compared to US Manali which indicates the contribution in pollution due to Manali town. It is also noticed that the DO level increases towards reaching DS Larji power house in most of the quarters as the river gets stabilised after reaching Kullu. This justifies the river self-purification process and the Biochemical Oxygen Demand (BOD) stabilization.
Figure 3 pH Variation during study period
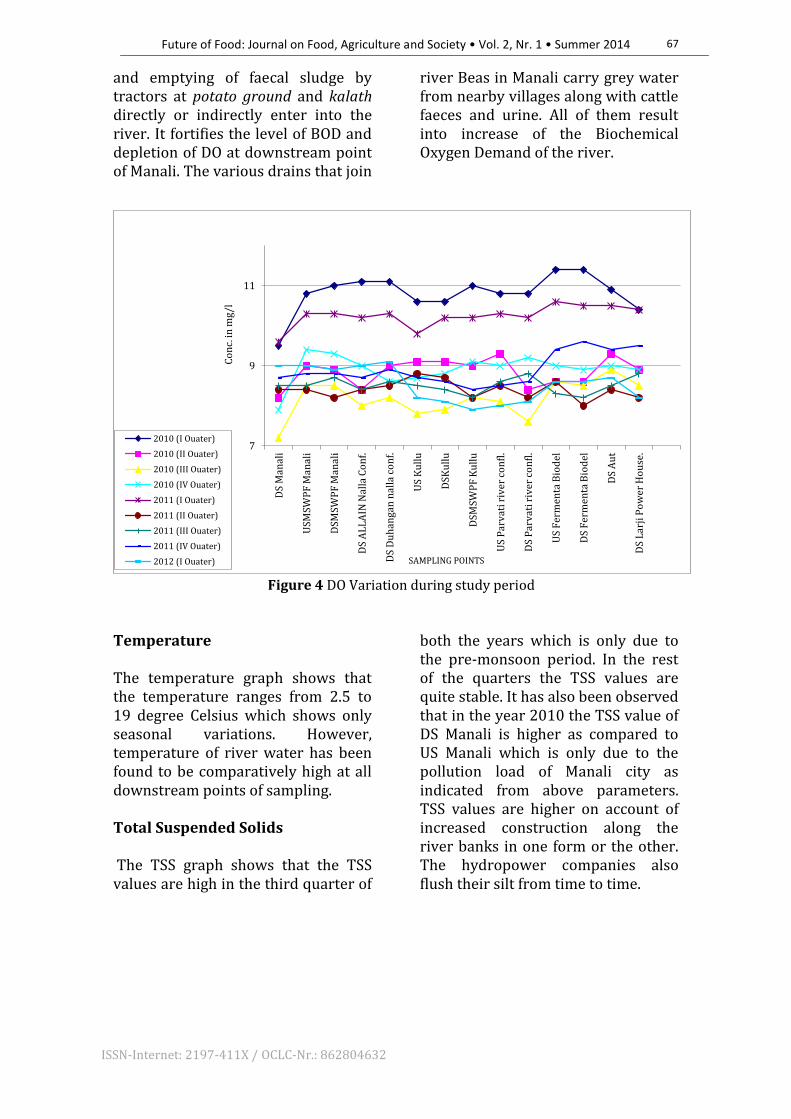
BOD Biochemical Oxygen Demand (BOD), which is equivalent to the amount of oxygen required by aerobic micro-organisms to decompose the organic matter in a sample of water, such as that polluted by sewage. It is used as a measure of the degree of water pollution. The level of BOD has been found to be at an increased level downstream in each municipality. The BOD graph shows that the BOD
level ranges from 0.1 to 0.7 mg/l in almost all the locations of study area except in DS Manali where it reaches to 11.0 & 2.8 mg/l in first & third quarter of the year 2010 respectively. It is worth mentioning that most of the hotels are located along the river bank and they discharge their partially treated or untreated sewage directly into the river. The leachates that originate as a result of solid waste dumps from the vegetable and fruit markets, sludge from the drains,
Future of Food: Journal on Food, Agriculture and Society • Vol. 2, Nr. 1 • Summer 2014
ISSN-Internet: 2197-411X / OCLC-Nr.: 862804632
67
7
9
11 D
S M
anal
i
USM
SWP
F M
anal
i
DSM
SWP
F M
anal
i
DS
AL
LA
IN N
alla
Co
nf.
DS
Du
han
gan
nal
la c
on
f.
US
Ku
llu
DSK
ull
u
DSM
SWP
F K
ull
u
US
Par
vat
i riv
er c
on
fl.
DS
Par
vat
i riv
er c
on
fl.
US
Fer
men
ta B
iod
el
DS
Fer
men
ta B
iod
el
DS
Au
t
DS
Lar
ji P
ow
er H
ou
se.
Co
nc.
in m
g/l
SAMPLING POINTS
2010 (I Ouater)
2010 (II Ouater)
2010 (III Ouater)
2010 (IV Ouater)
2011 (I Ouater)
2011 (II Ouater)
2011 (III Ouater)
2011 (IV Ouater)
2012 (I Ouater)
and emptying of faecal sludge by tractors at potato ground and kalath directly or indirectly enter into the river. It fortifies the level of BOD and depletion of DO at downstream point of Manali. The various drains that join
river Beas in Manali carry grey water from nearby villages along with cattle faeces and urine. All of them result into increase of the Biochemical Oxygen Demand of the river.
Figure 4 DO Variation during study period
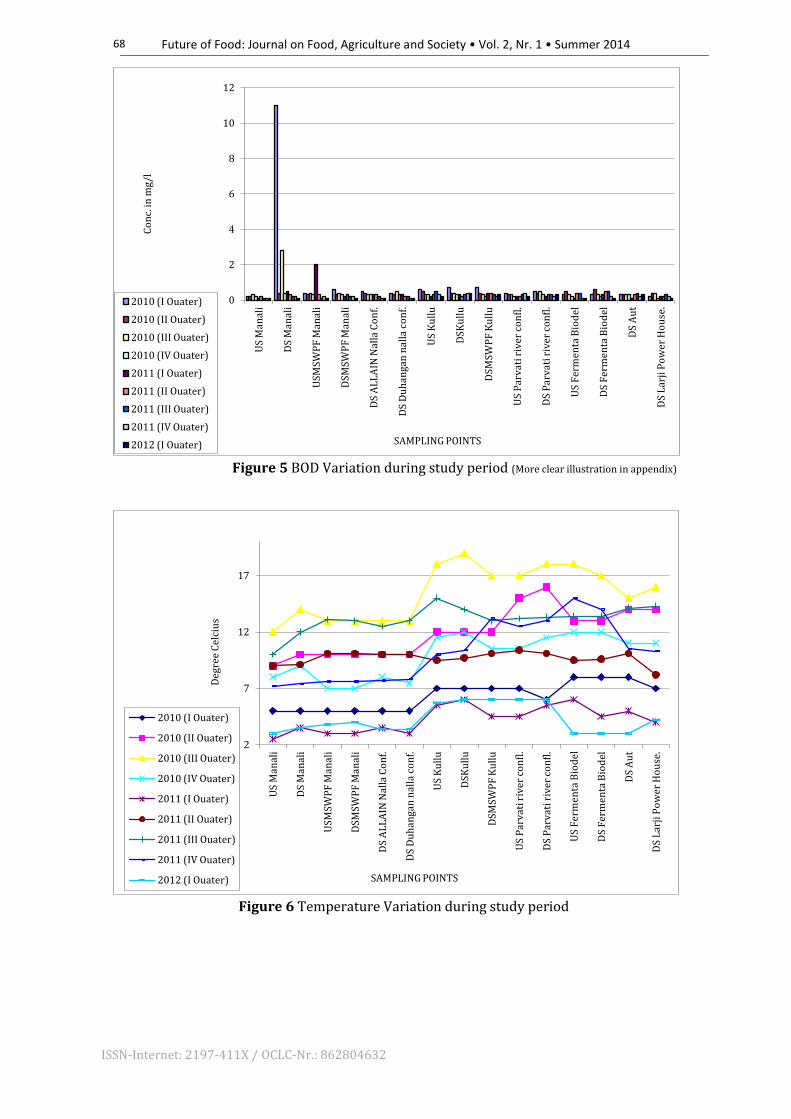
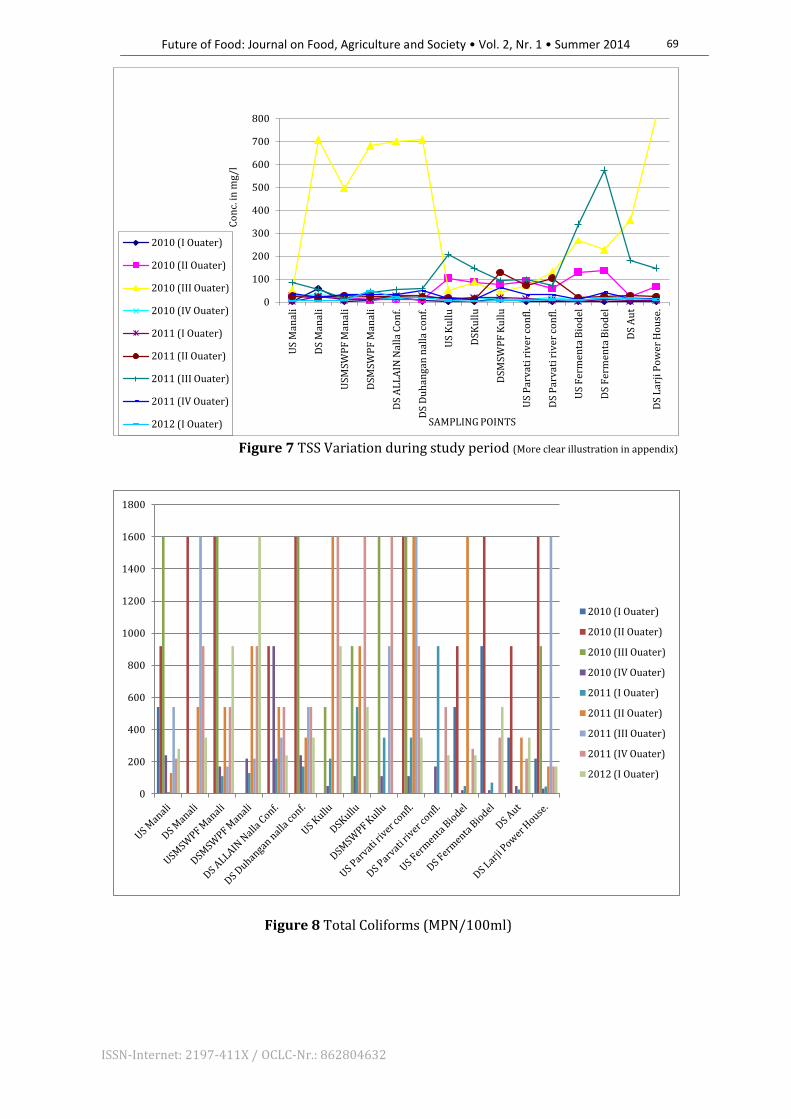
Temperature The temperature graph shows that the temperature ranges from 2.5 to 19 degree Celsius which shows only seasonal variations. However, temperature of river water has been found to be comparatively high at all downstream points of sampling. Total Suspended Solids The TSS graph shows that the TSS values are high in the third quarter of
both the years which is only due to the pre-monsoon period. In the rest of the quarters the TSS values are quite stable. It has also been observed that in the year 2010 the TSS value of DS Manali is higher as compared to US Manali which is only due to the pollution load of Manali city as indicated from above parameters. TSS values are higher on account of increased construction along the river banks in one form or the other. The hydropower companies also flush their silt from time to time.
Future of Food: Journal on Food, Agriculture and Society • Vol. 2, Nr. 1 • Summer 2014
ISSN-Internet: 2197-411X / OCLC-Nr.: 862804632
68
Figure 5 BOD Variation during study period (More clear illustration in appendix)
Figure 6 Temperature Variation during study period
0
2
4
6
8
10
12
US
Man
ali
DS
Man
ali
USM
SWP
F M
anal
i
DSM
SWP
F M
anal
i
DS
AL
LA
IN N
alla
Co
nf.
DS
Du
han
gan
nal
la c
on
f.
US
Ku
llu
DSK
ull
u
DSM
SWP
F K
ull
u
US
Par
vat
i riv
er c
on
fl.
DS
Par
vat
i riv
er c
on
fl.
US
Fer
men
ta B
iod
el
DS
Fer
men
ta B
iod
el
DS
Au
t
DS
Lar
ji P
ow
er H
ou
se.
Co
nc.
in m
g/l
SAMPLING POINTS
2010 (I Ouater)
2010 (II Ouater)
2010 (III Ouater)
2010 (IV Ouater)
2011 (I Ouater)
2011 (II Ouater)
2011 (III Ouater)
2011 (IV Ouater)
2012 (I Ouater)
2
7
12
17
US
Man
ali
DS
Man
ali
USM
SWP
F M
anal
i
DSM
SWP
F M
anal
i
DS
AL
LA
IN N
alla
Co
nf.
DS
Du
han
gan
nal
la c
on
f.
US
Ku
llu
DSK
ull
u
DSM
SWP
F K
ull
u
US
Par
vat
i riv
er c
on
fl.
DS
Par
vat
i riv
er c
on
fl.
US
Fer
men
ta B
iod
el
DS
Fer
men
ta B
iod
el
DS
Au
t
DS
Lar
ji P
ow
er H
ou
se.
Deg
ree
Cel
ciu
s
SAMPLING POINTS
2010 (I Ouater)
2010 (II Ouater)
2010 (III Ouater)
2010 (IV Ouater)
2011 (I Ouater)
2011 (II Ouater)
2011 (III Ouater)
2011 (IV Ouater)
2012 (I Ouater)
Future of Food: Journal on Food, Agriculture and Society • Vol. 2, Nr. 1 • Summer 2014
ISSN-Internet: 2197-411X / OCLC-Nr.: 862804632
69
Figure 7 TSS Variation during study period (More clear illustration in appendix)
Figure 8 Total Coliforms (MPN/100ml)
0
100
200
300
400
500
600
700
800
US
Man
ali
DS
Man
ali
USM
SWP
F M
anal
i
DSM
SWP
F M
anal
i
DS
AL
LA
IN N
alla
Co
nf.
DS
Du
han
gan
nal
la c
on
f.
US
Ku
llu
DSK
ull
u
DSM
SWP
F K
ull
u
US
Par
vat
i riv
er c
on
fl.
DS
Par
vat
i riv
er c
on
fl.
US
Fer
men
ta B
iod
el
DS
Fer
men
ta B
iod
el
DS
Au
t
DS
Lar
ji P
ow
er H
ou
se.
Co
nc.
in m
g/l
SAMPLING POINTS
2010 (I Ouater)
2010 (II Ouater)
2010 (III Ouater)
2010 (IV Ouater)
2011 (I Ouater)
2011 (II Ouater)
2011 (III Ouater)
2011 (IV Ouater)
2012 (I Ouater)
0
200
400
600
800
1000
1200
1400
1600
1800
2010 (I Ouater)
2010 (II Ouater)
2010 (III Ouater)
2010 (IV Ouater)
2011 (I Ouater)
2011 (II Ouater)
2011 (III Ouater)
2011 (IV Ouater)
2012 (I Ouater)
Future of Food: Journal on Food, Agriculture and Society • Vol. 2, Nr. 1 • Summer 2014
ISSN-Internet: 2197-411X / OCLC-Nr.: 862804632
70
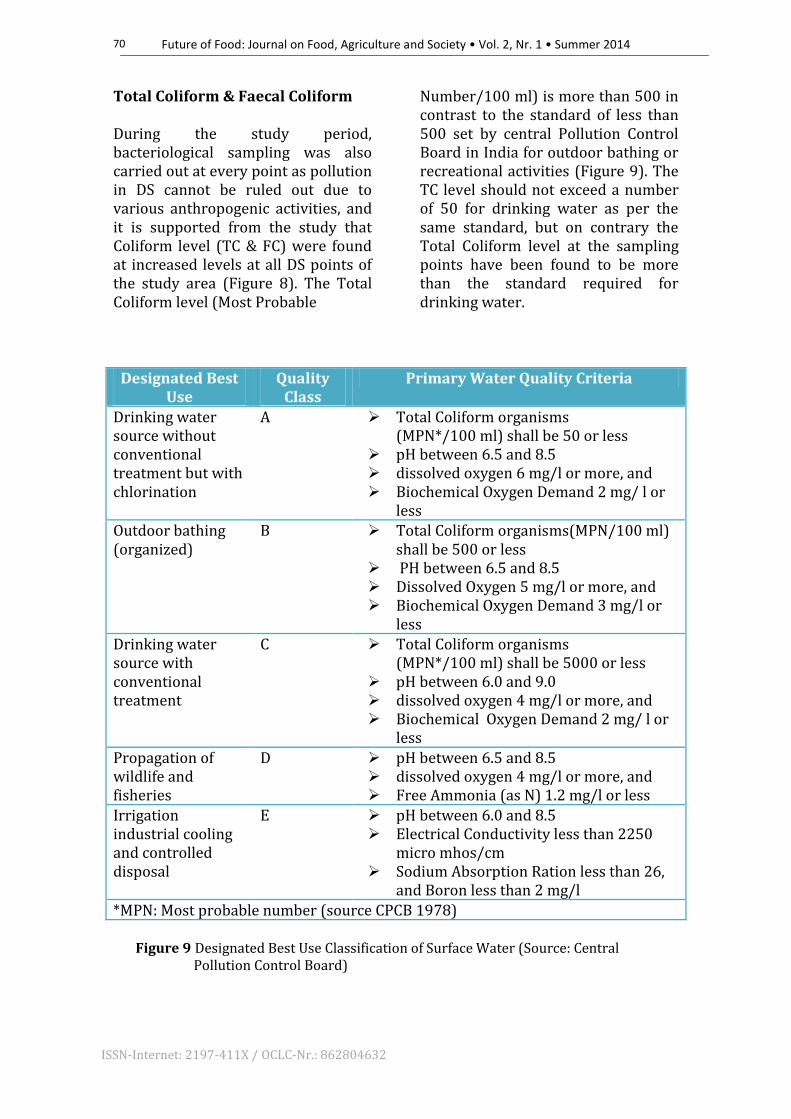
Total Coliform & Faecal Coliform During the study period, bacteriological sampling was also carried out at every point as pollution in DS cannot be ruled out due to various anthropogenic activities, and it is supported from the study that Coliform level (TC & FC) were found at increased levels at all DS points of the study area (Figure 8). The Total Coliform level (Most Probable
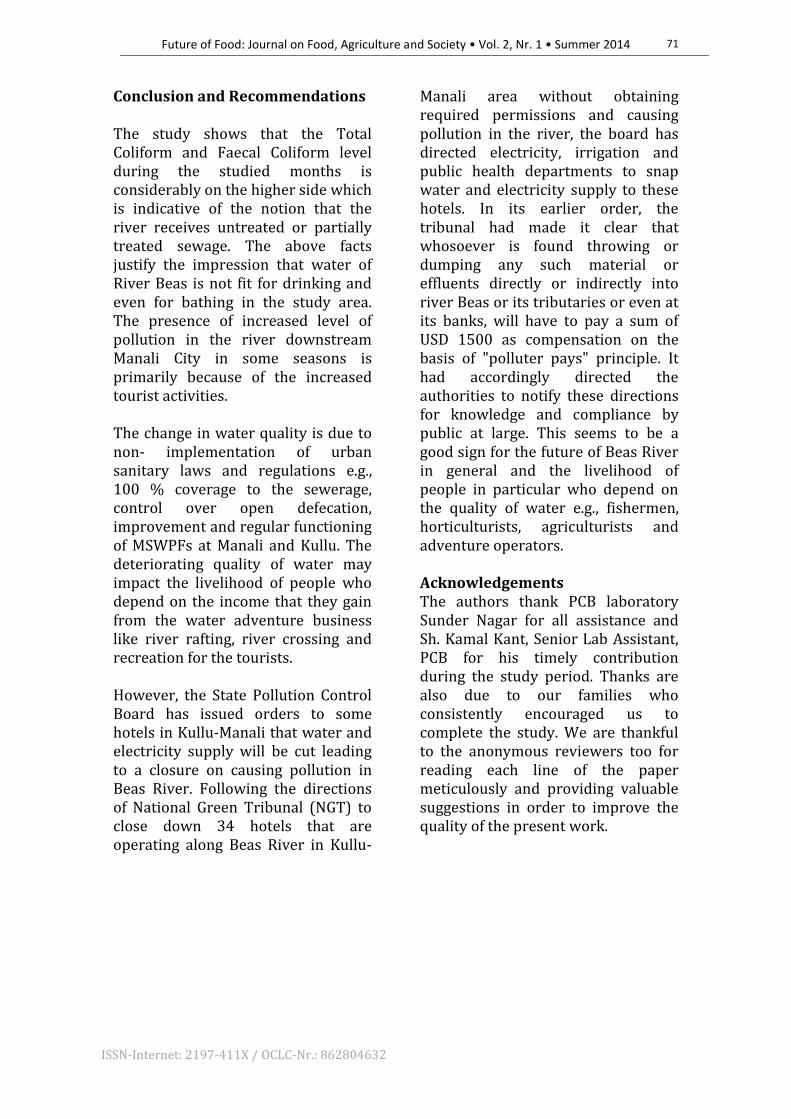
Number/100 ml) is more than 500 in contrast to the standard of less than 500 set by central Pollution Control Board in India for outdoor bathing or recreational activities (Figure 9). The TC level should not exceed a number of 50 for drinking water as per the same standard, but on contrary the Total Coliform level at the sampling points have been found to be more than the standard required for drinking water.
Designated Best Use
Quality Class
Primary Water Quality Criteria
Drinking water source without conventional treatment but with chlorination
A Total Coliform organisms (MPN*/100 ml) shall be 50 or less
pH between 6.5 and 8.5 dissolved oxygen 6 mg/l or more, and Biochemical Oxygen Demand 2 mg/ l or
less Outdoor bathing (organized)
B Total Coliform organisms(MPN/100 ml) shall be 500 or less
PH between 6.5 and 8.5 Dissolved Oxygen 5 mg/l or more, and Biochemical Oxygen Demand 3 mg/l or
less Drinking water source with conventional treatment
C Total Coliform organisms (MPN*/100 ml) shall be 5000 or less
pH between 6.0 and 9.0 dissolved oxygen 4 mg/l or more, and Biochemical Oxygen Demand 2 mg/ l or
less
Propagation of wildlife and fisheries
D pH between 6.5 and 8.5 dissolved oxygen 4 mg/l or more, and Free Ammonia (as N) 1.2 mg/l or less
Irrigation industrial cooling and controlled disposal
E pH between 6.0 and 8.5 Electrical Conductivity less than 2250
micro mhos/cm Sodium Absorption Ration less than 26,
and Boron less than 2 mg/l
*MPN: Most probable number (source CPCB 1978) Figure 9 Designated Best Use Classification of Surface Water (Source: Central Pollution Control Board)
Future of Food: Journal on Food, Agriculture and Society • Vol. 2, Nr. 1 • Summer 2014
ISSN-Internet: 2197-411X / OCLC-Nr.: 862804632
71
Conclusion and Recommendations The study shows that the Total Coliform and Faecal Coliform level during the studied months is considerably on the higher side which is indicative of the notion that the river receives untreated or partially treated sewage. The above facts justify the impression that water of River Beas is not fit for drinking and even for bathing in the study area. The presence of increased level of pollution in the river downstream Manali City in some seasons is primarily because of the increased tourist activities. The change in water quality is due to non- implementation of urban sanitary laws and regulations e.g., 100 % coverage to the sewerage, control over open defecation, improvement and regular functioning of MSWPFs at Manali and Kullu. The deteriorating quality of water may impact the livelihood of people who depend on the income that they gain from the water adventure business like river rafting, river crossing and recreation for the tourists. However, the State Pollution Control Board has issued orders to some hotels in Kullu-Manali that water and electricity supply will be cut leading to a closure on causing pollution in Beas River. Following the directions of National Green Tribunal (NGT) to close down 34 hotels that are operating along Beas River in Kullu-
Manali area without obtaining required permissions and causing pollution in the river, the board has directed electricity, irrigation and public health departments to snap water and electricity supply to these hotels. In its earlier order, the tribunal had made it clear that whosoever is found throwing or dumping any such material or effluents directly or indirectly into river Beas or its tributaries or even at its banks, will have to pay a sum of USD 1500 as compensation on the basis of "polluter pays" principle. It had accordingly directed the authorities to notify these directions for knowledge and compliance by public at large. This seems to be a good sign for the future of Beas River in general and the livelihood of people in particular who depend on the quality of water e.g., fishermen, horticulturists, agriculturists and adventure operators. Acknowledgements The authors thank PCB laboratory Sunder Nagar for all assistance and Sh. Kamal Kant, Senior Lab Assistant, PCB for his timely contribution during the study period. Thanks are also due to our families who consistently encouraged us to complete the study. We are thankful to the anonymous reviewers too for reading each line of the paper meticulously and providing valuable suggestions in order to improve the quality of the present work.
Future of Food: Journal on Food, Agriculture and Society • Vol. 2, Nr. 1 • Summer 2014
ISSN-Internet: 2197-411X / OCLC-Nr.: 862804632
72
References: APHA, Standards Methods for the Examination of Water and Waste Water( 1976), 14th Ed.
American Public Health Association, Washington, D.C., Balokhra J., The wonderland Himachal Pradesh (1997), 2nd. Edition. H.G. publication, New
Delhi, 168-188. Gilbert M Masters, Wendell P. Ela (2008), Introduction to Environmental Engineering
and Science, Third Edition, Pearson Prentice Hall. Guidelines for Water Quality Monitoring, MINARS/27/2007-08, Central Pollution
Control Board, New Delhi. Gupta RD Environmental Pollution: Hazards and Control (2006), Concept Publishing
Company, Indian Standards Specifications.IS:1172-1971 ON BASIC REQUIREMENTS FOR Water
Supply, Drainage and Sanitation. Non-Technical Summary, Environmental and Social Impact Assessment: 192 MW Allain
Duhangan Hydroelectric Power Project (February 2009), Tehsil Manali, District Kullu, Himachal Pradesh.
Parmar, K. S. & Bhardwaj, R. (2013) Water quality index and fractal dimension analysis
of water parameters. International Journal of Environmental Science and Technology 10, 151-164.
Report of the Working Group on RIVERS, LAKES AND AQUIFERS In Environment &
Forests for the Eleventh Five Year Plan (2007-2012) Planning Commission, Government of India, New Delhi.
Sawyer, C N, PL McCarty, and GF Parkin (1994), Chemistry for Environmental
Engineering, 4th ed, ZMc Graw Hill, New York. Singh O., Vijay and Rai S.P., Water quality aspects-some wells, springs and rivers in
parts of Udhampur district (J &K ) (2005) Journal of Environmental Science and Engg.,47(1); 25-32.
Status of Water quality in India – (2010), Ministry of Environment and Forest
Publication. Sewage Disposal and Air Pollution Engineering, SK Garg (2007), Khanna Publishers, new
Delhi. Trivedy, R.K., Goel, R.K. Chemical and Biological Methods for Water Pollution Studies
(1984) Environmental Publication, Aligarh. Water Resources Engineering by Linsley and Franzini (Mc Graw Hill Book Company,
New York).

Future of Food: Journal on Food, Agriculture and Society • Vol. 2, Nr. 1 • Summer 2014
ISSN-Internet: 2197-411X / OCLC-Nr.: 862804632
73
Appendix
Sampling Locations Colour DO (mg/l) Odour pH Temp. (OC)
BOD ( mg/l)
TSS ( mg/l)
TC (MPN/ 100ml)
FC (MPN/ 100ml)
US Manali Clear 10,6 Odour free 7,31 5,0 0,2 2,0 540 27
DS Manali Light grey 9,5 Odour free 6,97 5,0 11,0 60,0 >2400 >2400
USMSWPF Manali Clear 10,8 Odour free 7,08 5,0 0,4 4,0 >2400 540
DSMSWPF Manali Clear 11,0 Odour free 7,30 5,0 0,6 8,0 >2400 920
DS Allain Nalla conf. Clear 11,1 Odour free 7,35 5,0 0,5 18,0 >2400 240
DS Duhangan nalla conf. Clear 11,1 Odour free 7,79 5,0 0,4 6,0 >2400 350
US Kullu Clear 10,6 Odour free 7,45 7,0 0,6 2,0 >2400 350
DSKullu Clear 10,6 Odour free 7,54 7,0 0,7 2,0 >2400 920
DSMSWPF Kullu Clear 11,0 Odour free 7,40 7,0 0,7 14,0 >2400 1600
US Parvati river confl. Clear 10,8 Odour free 7,65 7,0 0,4 2,0 >2400 240
DS Parvati river confl. Clear 10,8 Odour free 7,46 6,0 0,5 2,0 >2400 920
US Fermenta Biodel Clear 11,4 Odour free 7,62 8,0 0,3 2,0 540 14
DS Fermenta Biodel Clear 11,4 Odour free 7,61 8,0 0,3 2,0 920 27
DS Aut Clear 10,9 Odour free 7,51 8,0 0,3 2,0 350 17
DS Larji Power House. Clear 10,4 Odour free 7,21 7,0 0,2 2,0 220 8
Table 1 Analysis results of Beas River - collected in the month of January- 2010
ng Locations Colour DO
(mg/l) Odour pH Temp.
(OC) BOD
( mg/l) TSS
( mg/l) TC
(MPN/ 100ml)
FC (MPN/ 100ml)
US Manali Colourless 8,9 Odour free
7,37 9,0 0,2 27,0 920 79
DS Manali Colourless 8,2 Odour free
6,49 10,0 0,4 25,0 1600 130
USMSWPF Manali Colourless 9,0 Odour free
6,97 10,0 0,3 18,0 1600 170
DSMSWPF Manali Colourless 8,9 Odour free
7,23 10,0 0,3 10,0 >2400 280
DS Allain Nalla Conf. Colourless 8,4 Odour free
7,39 10,0 0,4 13,0 920 33
DS Duhangan nalla conf. Colourless 9,0 Odour free
7,36 10,0 0,3 13,0 1600 79
US Kullu Light Brown 9,1 Odour free
6,75 12,0 0,5 105,0 >2400 350
DSKullu Light Brown 9,1 Odour free
7,03 12,0 0,4 87,0 >2400 540
DSMSWPF Kullu Light Brown 9,0 Odour free
7,28 12,0 0,4 79,0 >2400 540
US Parvati river confl. Light Brown 9,3 Odour free
7,08 15,0 0,3 92,0 1600 94
DS Parvati river confl. Light Brown 8,4 Odour free
7,38 16,0 0,4 60,0 >2400 110
US Fermenta Biodel Light Brown 8,6 Odour free
7,11 13,0 0,5 130,0 920 240
DS Fermenta Biodel Light Brown 8,6 Odour free
7,28 13,0 0,6 138,0 1600 540
DS Aut Light Brown 9,3 Odour free
7,70 14,0 0,3 25,0 920 130
DS Larji Power House. Light Brown 8,9 Odour free
6,98 14,0 0,4 68,0 1600 220
Table 2 Analysis results of Beas River- collected in the month of April- 2010
Future of Food: Journal on Food, Agriculture and Society • Vol. 2, Nr. 1 • Summer 2014
ISSN-Internet: 2197-411X / OCLC-Nr.: 862804632
74
Sampling Locations Colour DO
(mg/l) Odour pH Temp.
(OC) BOD
( mg/l) TSS ( mg/l)
TC (MPN/ 100ml)
FC (MPN/ 100ml)
US Manali Grey 8,2 Odour free 7,87 12,0 0,3 52,0 1600 70
DS Manali Grey 7,2 Odour free 7,11 14,0 2,8 708,0 >2400 920
USMSWPF Manali Grey 8,5 Odour free 7,64 13,0 0,4 496,0 1600 350
DSMSWPF Manali Grey 8,5 Odour free 7,44 13,0 0,4 682,0 >2400 540
DS Allain Nalla Conf. Grey 8,0 Odour free 7,40 13,0 0,3 700,0 >2400 350
DS Duhangan nalla conf. Grey 8,2 Odour free 7,06 13,0 0,5 708,0 1600 140
US Kullu Clear 7,8 Odour free 7,33 18,0 0,3 52,0 540 79
DSKullu Clear 7,9 Odour free 7,77 19,0 0,4 88,0 920 110
DSMSWPF Kullu Grey 8,2 Odour free 7,69 17,0 0,3 44,0 1600 350
US Parvati river confl. Grey 8,1 Odour free 7,40 17,0 0,3 72,0 1600 110
DS Parvati river confl. Grey 7,6 Odour free 7,68 18,0 0,5 130,0 >2400 240
US Fermenta Biodel Brown 8,6 Odour free 7,47 18,0 0,3 268,0 >2400 170
DS Fermenta Biodel Brown 8,5 Odour free 7,42 17,0 0,3 228,0 >2400 220
DS Aut Brown 8,9 Odour free 7,95 15,0 0,3 358,0 >2400 350
DS Larji Power House. Grey 8,5 Odour free 7,56 16,0 0,4 816,0 920 70
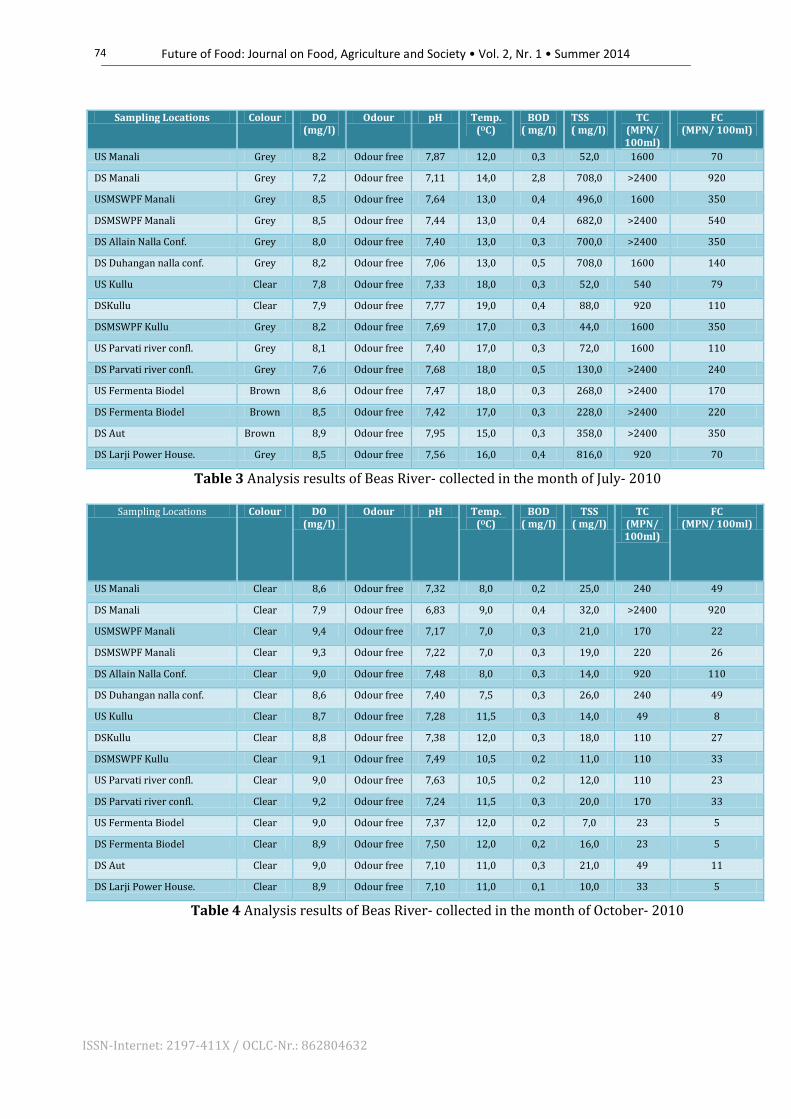
Table 3 Analysis results of Beas River- collected in the month of July- 2010
Sampling Locations Colour DO (mg/l)
Odour pH Temp. (OC)
BOD ( mg/l)
TSS ( mg/l)
TC (MPN/ 100ml)
FC (MPN/ 100ml)
US Manali Clear 8,6 Odour free 7,32 8,0 0,2 25,0 240 49
DS Manali Clear 7,9 Odour free 6,83 9,0 0,4 32,0 >2400 920
USMSWPF Manali Clear 9,4 Odour free 7,17 7,0 0,3 21,0 170 22
DSMSWPF Manali Clear 9,3 Odour free 7,22 7,0 0,3 19,0 220 26
DS Allain Nalla Conf. Clear 9,0 Odour free 7,48 8,0 0,3 14,0 920 110
DS Duhangan nalla conf. Clear 8,6 Odour free 7,40 7,5 0,3 26,0 240 49
US Kullu Clear 8,7 Odour free 7,28 11,5 0,3 14,0 49 8
DSKullu Clear 8,8 Odour free 7,38 12,0 0,3 18,0 110 27
DSMSWPF Kullu Clear 9,1 Odour free 7,49 10,5 0,2 11,0 110 33
US Parvati river confl. Clear 9,0 Odour free 7,63 10,5 0,2 12,0 110 23
DS Parvati river confl. Clear 9,2 Odour free 7,24 11,5 0,3 20,0 170 33
US Fermenta Biodel Clear 9,0 Odour free 7,37 12,0 0,2 7,0 23 5
DS Fermenta Biodel Clear 8,9 Odour free 7,50 12,0 0,2 16,0 23 5
DS Aut Clear 9,0 Odour free 7,10 11,0 0,3 21,0 49 11
DS Larji Power House. Clear 8,9 Odour free 7,10 11,0 0,1 10,0 33 5
Table 4 Analysis results of Beas River- collected in the month of October- 2010

Future of Food: Journal on Food, Agriculture and Society • Vol. 2, Nr. 1 • Summer 2014
ISSN-Internet: 2197-411X / OCLC-Nr.: 862804632
75
Figure 5 BOD Variation during study period
Figure 7 TSS Variation during study period
0
2
4
6
8
10
12
US
Man
ali
DS
Man
ali
USM
SWP
F M
anal
i
DSM
SWP
F M
anal
i
DS
AL
LA
IN N
alla
Co
nf.
DS
Du
han
gan
nal
la c
on
f.
US
Ku
llu
DSK
ull
u
DSM
SWP
F K
ull
u
US
Par
vati
riv
er c
on
fl.
DS
Par
vati
riv
er c
on
fl.
US
Fer
men
ta B
iod
el
DS
Fer
men
ta B
iod
el
DS
Au
t
DS
Lar
ji P
ow
er H
ou
se.
Co
nc.
in m
g/l
SAMPLING POINTS
2010 (I Ouater) 2010 (II Ouater) 2010 (III Ouater) 2010 (IV Ouater) 2011 (I Ouater)
2011 (II Ouater) 2011 (III Ouater) 2011 (IV Ouater) 2012 (I Ouater)
0
100
200
300
400
500
600
700
800
US
Man
ali
DS
Man
ali
USM
SWP
F M
anal
i
DSM
SWP
F M
anal
i
DS
AL
LA
IN N
alla
Co
nf.
DS
Du
han
gan
nal
la c
on
f.
US
Ku
llu
DSK
ull
u
DSM
SWP
F K
ull
u
US
Par
vati
riv
er c
on
fl.
DS
Par
vati
riv
er c
on
fl.
US
Fer
men
ta B
iod
el
DS
Fer
men
ta B
iod
el
DS
Au
t
DS
Lar
ji P
ow
er H
ou
se.
Co
nc.
in m
g/l
SAMPLING POINTS
2010 (I Ouater) 2010 (II Ouater) 2010 (III Ouater) 2010 (IV Ouater) 2011 (I Ouater)
2011 (II Ouater) 2011 (III Ouater) 2011 (IV Ouater) 2012 (I Ouater)