Hydrogeochemical evaluation of groundwater in the lower Offin basin, Ghana
12
ORIGINAL ARTICLE Hydrogeochemical evaluation of groundwater in the lower Offin basin, Ghana Benony K. Kortatsi Collins K. Tay Geophrey Anornu Ebenezer Hayford Grace A. Dartey Received: 3 February 2007 / Accepted: 17 April 2007 / Published online: 17 May 2007 Ó Springer-Verlag 2007 Abstract Alumino-silicate mineral dissolution, cation exchange, reductive dissolution of hematite and goethite, oxidation of pyrite and arsenopyrite are processes that influence groundwater quality in the Offin Basin. The main aim of this study was to characterise groundwater and delineate relevant water–rock interactions that control the evolution of water quality in Offin Basin, a major gold mining area in Ghana. Boreholes, dug wells, springs and mine drainage samples were analysed for major ions, minor and trace elements. Major ion study results show that the groundwater is, principally, Ca–Mg–HCO 3 or Na–Mg–Ca– HCO 3 in character, mildly acidic and low in conductivity. Groundwater acidification is principally due to natural biogeochemical processes. Though acidic, the groundwater has positive acid neutralising potential provided by the dissolution of alumino-silicates and mafic rocks. Trace elements’ loading (except arsenic and iron) of groundwater is generally low. Reductive dissolution of iron minerals in the presence of organic matter is responsible for high-iron concentration in areas underlain by granitoids. Elsewhere pyrite and arsenopyrite oxidation is the plausible process for iron and arsenic mobilisation. Approximately 19 and 46% of the boreholes have arsenic and iron concentrations exceeding the WHO’s (Guidelines for drinking water quality. Final task group meeting. WHO Press, World Health Organization, Geneva, 2004) maximum acceptable limits of 10 lgl –1 and 0.3 mg l –1 , for drinking water. Keywords Cation exchange Ghana Offin basin Silicate weathering Pyrite and arsenopyrite Oxidation Introduction The Lower Offin Basin is a major gold-mining area in Ghana. This area receives high-annual rainfall and as a result is drained by numerous springs and streams (Dickson and Benneh 1980). These streams were the sources of drinking water to some of the communities in the Basin and also act as pathways through which weathered materials and mine effluents were transported into the sea via the major river, River Pra. Due to the discharge of mine effluents into the rivers and streams by the major mining companies and the activities of small-scale miners, most of these surface water bodies have become polluted and unsuitable for drinking water supply. Groundwater has therefore become the principal and sometimes the only source of drinking water in the area. Consequently, a large number of boreholes and hand-dug wells have been drilled in the area and a lot more are being considered. Groundwater in hard-rock aquifers, particularly in min- ing areas, is known to be vulnerable to quality problems that may have serious impact on human health. The rocks are often carbonate-deficient and give rise to poorly buffered water (Smedley et al. 1995). Also in gold and base metal mining areas such as the Lower Offin Basin, inorganic and microbial-induced sulphide oxidations are a common phe- nomenon. This often leads to low pH groundwater that B. K. Kortatsi (&) C. K. Tay G. A. Dartey CSIR-Water Research Institute, P. O. Box M32, Accra, Ghana e-mail: [email protected] G. Anornu Civil Engineering Department, KNUST, Kumasi, Ghana E. Hayford Geology Department, University of Ghana, Legon, Accra, Ghana 123 Environ Geol (2008) 53:1651–1662 DOI 10.1007/s00254-007-0772-0
Transcript of Hydrogeochemical evaluation of groundwater in the lower Offin basin, Ghana
ORIGINAL ARTICLE
Hydrogeochemical evaluation of groundwater in the lowerOffin basin, Ghana
Benony K. Kortatsi Æ Collins K. Tay ÆGeophrey Anornu Æ Ebenezer Hayford ÆGrace A. Dartey
Received: 3 February 2007 / Accepted: 17 April 2007 / Published online: 17 May 2007
� Springer-Verlag 2007
Abstract Alumino-silicate mineral dissolution, cation
exchange, reductive dissolution of hematite and goethite,
oxidation of pyrite and arsenopyrite are processes that
influence groundwater quality in the Offin Basin. The main
aim of this study was to characterise groundwater and
delineate relevant water–rock interactions that control the
evolution of water quality in Offin Basin, a major gold
mining area in Ghana. Boreholes, dug wells, springs and
mine drainage samples were analysed for major ions, minor
and trace elements. Major ion study results show that the
groundwater is, principally, Ca–Mg–HCO3 or Na–Mg–Ca–
HCO3 in character, mildly acidic and low in conductivity.
Groundwater acidification is principally due to natural
biogeochemical processes. Though acidic, the groundwater
has positive acid neutralising potential provided by the
dissolution of alumino-silicates and mafic rocks. Trace
elements’ loading (except arsenic and iron) of groundwater
is generally low. Reductive dissolution of iron minerals in
the presence of organic matter is responsible for high-iron
concentration in areas underlain by granitoids. Elsewhere
pyrite and arsenopyrite oxidation is the plausible process
for iron and arsenic mobilisation. Approximately 19 and
46% of the boreholes have arsenic and iron concentrations
exceeding the WHO’s (Guidelines for drinking water
quality. Final task group meeting. WHO Press, World
Health Organization, Geneva, 2004) maximum acceptable
limits of 10 lg l–1 and 0.3 mg l–1, for drinking water.
Keywords Cation exchange � Ghana � Offin basin �Silicate weathering � Pyrite and arsenopyrite � Oxidation
Introduction
The Lower Offin Basin is a major gold-mining area in
Ghana. This area receives high-annual rainfall and as a
result is drained by numerous springs and streams (Dickson
and Benneh 1980). These streams were the sources of
drinking water to some of the communities in the Basin and
also act as pathways through which weathered materials
and mine effluents were transported into the sea via the
major river, River Pra. Due to the discharge of mine
effluents into the rivers and streams by the major mining
companies and the activities of small-scale miners, most of
these surface water bodies have become polluted and
unsuitable for drinking water supply. Groundwater has
therefore become the principal and sometimes the only
source of drinking water in the area. Consequently, a large
number of boreholes and hand-dug wells have been drilled
in the area and a lot more are being considered.
Groundwater in hard-rock aquifers, particularly in min-
ing areas, is known to be vulnerable to quality problems that
may have serious impact on human health. The rocks are
often carbonate-deficient and give rise to poorly buffered
water (Smedley et al. 1995). Also in gold and base metal
mining areas such as the Lower Offin Basin, inorganic and
microbial-induced sulphide oxidations are a common phe-
nomenon. This often leads to low pH groundwater that
B. K. Kortatsi (&) � C. K. Tay � G. A. Dartey
CSIR-Water Research Institute,
P. O. Box M32, Accra, Ghana
e-mail: [email protected]
G. Anornu
Civil Engineering Department, KNUST,
Kumasi, Ghana
E. Hayford
Geology Department, University of Ghana,
Legon, Accra, Ghana
123
Environ Geol (2008) 53:1651–1662
DOI 10.1007/s00254-007-0772-0
might encourage dissolution of trace elements such as Al,
As, Be, Cr, Mn and Fe from most host rocks in dangerous
proportions into the groundwater system if they are present
in the rock matrix. Wilson and Hawkins (1978) observed
concentrations of As between 240 and 1,200 lg l–1 in the
Fairbanks area, Alaska. Williams and Smith (1994) reported
that acid waters draining in a gold-mining area in Zimba-
bwe had As concentration of up to 72 mg l–1. Therefore,
basing the water supply of the study area on groundwater
without adequate information on quality or the chemistry of
groundwater can be dangerous.
A few studies pertaining to groundwater quality were
carried out in the Offin Basin. These were specifically in
connection with arsenic mobilisation and its health impli-
cations on rural water supply and include Amasa (1975),
Smedley et al. (1995), Smedley et al. (1996) and Smedley
(1996).
In all these studies, only little emphasis has been placed
on either the natural processes that govern the chemical
composition of the groundwater or the anthropogenic fac-
ets, which have some effects on it. The main objective of
this paper, therefore, is to use existing chemical data to
characterise the groundwater and to delineate the relevant
water–rock interactions and anthropogenic factors that
control the water quality in the study area.
Study area
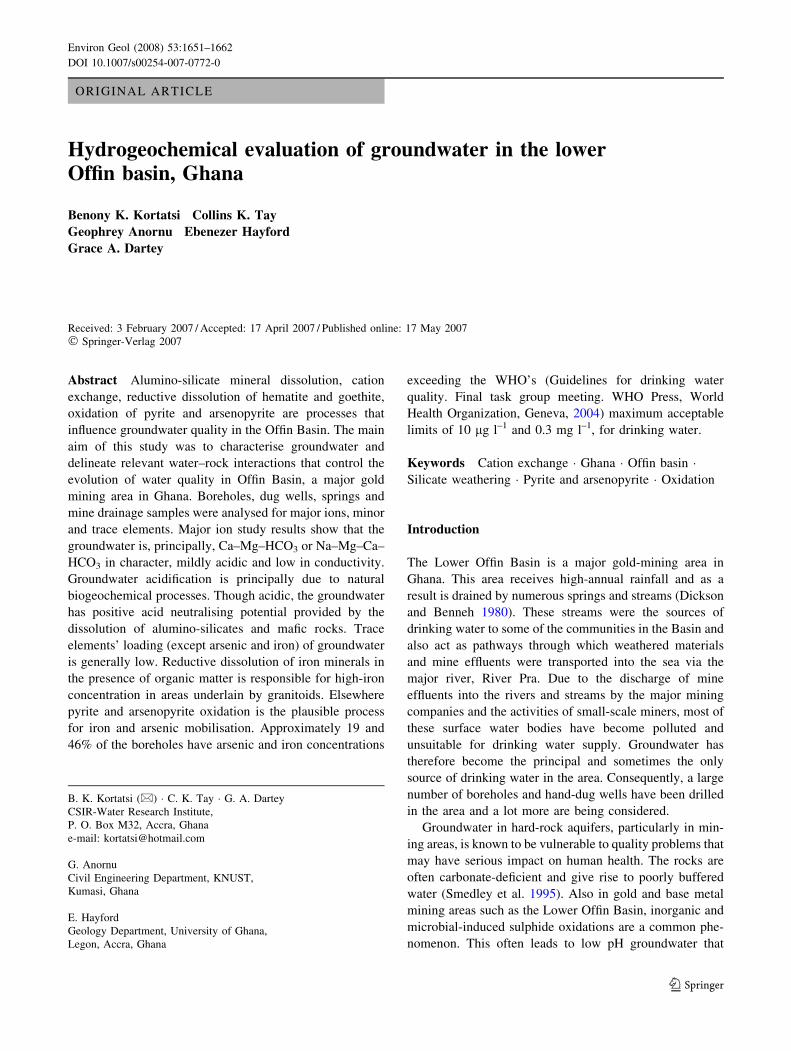
The Lower Offin Basin lies between latitudes 5.8�N and
6.5�N and longitudes 1.3�W and 2.2�W (Fig. 1). This area
receives copious rainfall between March and October and
its mean annual value is approximately 1,600 mm. The
diurnal temperature is between 20 and 30�C while the
potential evapotranspiration is about 1,260 mm year–1 al-
though it does not exceed rainfall for most part of the rainy
season. The Lower Offin Basin is covered with the moist
semi-deciduous forest although much of the vegetation has
been removed for cocoa and food crop production. Tec-
tonic lines of weakness and Eburnian orogenic episodes
have facilitated extensive and intensive regolith and ravine
development. Consequently many perennial streams and
rivers (e.g. Ofin, Oda and Gymi) drain the area.
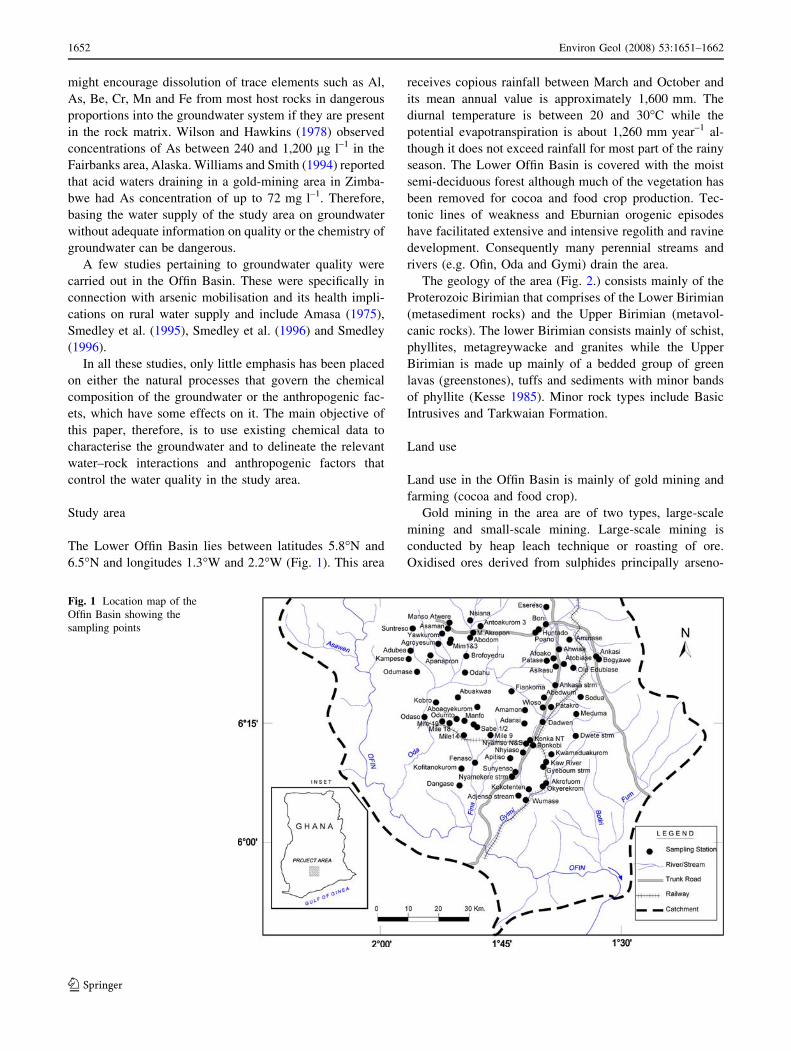
The geology of the area (Fig. 2.) consists mainly of the
Proterozoic Birimian that comprises of the Lower Birimian
(metasediment rocks) and the Upper Birimian (metavol-
canic rocks). The lower Birimian consists mainly of schist,
phyllites, metagreywacke and granites while the Upper
Birimian is made up mainly of a bedded group of green
lavas (greenstones), tuffs and sediments with minor bands
of phyllite (Kesse 1985). Minor rock types include Basic
Intrusives and Tarkwaian Formation.
Land use
Land use in the Offin Basin is mainly of gold mining and
farming (cocoa and food crop).
Gold mining in the area are of two types, large-scale
mining and small-scale mining. Large-scale mining is
conducted by heap leach technique or roasting of ore.
Oxidised ores derived from sulphides principally arseno-
Fig. 1 Location map of the
Offin Basin showing the
sampling points
1652 Environ Geol (2008) 53:1651–1662
123
pyrites, realgar, orpiment and pyrites in the weathered
zones are heap leached by cyanidation. Paleoplacer (free
milling ore) are mined from deep zones crushed, milled
and cyanided. Small-scale mining involves extracting gold
from alluvial soils mainly from stream floors by mercury
amalgamation.
Cocoa farming is the main cash crop farming in the
study area. Large acreages of flora or virgin forest were
removed and replaced with cocoa farms. Additionally, food
crops such as plantain, cassava, cocoyams etc. are pro-
duced alongside cocoa for subsistence. Due to the fact that
agro chemicals are expensive and often above the reach of
most the peasant farmers, their use in the study area is
limited.
Materials and methods
Sample collection
Samples were collected from 148 water points (boreholes,
hand-dug wells and springs) and 2 samples from mine
drainage in December 2004 during the dry period. Sam-
pling protocols described by Claasen (1982) Barcelona
et al. (1985) and Gale and Robins (1989) were strictly
observed during sample collection. Samples were collected
using 4-1 acid-washed polypropylene containers. Each
sample was immediately filtered on site through 0.45 lm
filters on acetate cellulose. Filtrate for metals analyses were
transferred into 100-cm3 polyethylene bottles and imme-
diately acidified to pH < 2 by the addition of MerckTM
ultrapure nitric acid (5 ml 6N HNO3). Samples for anions
analyses were collected into 250-cm3 polyethylene bottles
without preservation. All the samples were stored in an ice
chest at a temperature of <4�C and later, transferred to the
laboratory and stored in a refrigerator at a temperature of
<4�C until analysed (within 1 week).
Field measurements
In the field, temperature, pH and electrical conductivity
measurements were carried out using WTW-Multiline P4
Universal Meter in flow-through cell attached in line to the
borehole pump outlet. Before taking readings, pumping
was carried out until the meter readings were stable for
each parameter. Since the boreholes were already being
used, the pumping time before stable meter readings were
achieved was, on average, 5 min. The pH electrode was
calibrated against pH 4, 7 and or 10 buffers (Wood 1981).
Alkalinity (as HCO3–) was determined by field titration with
1.6 N H2SO4 to pH ~4.5 using HACH Digital multi
Sampler Model 1690
Laboratory measurements
Chemical analysis for anions (Bicarbonate, Chloride, Sul-
phate and nitrate was performed at the Ecological labora-
tory at the University of Ghana using Dionex DX-120 ion
N
G H A N A
I N S E T
0 10 20 30 Km.
Fig. 2 Geological map of
the Offin Basin with the
sampling points
Environ Geol (2008) 53:1651–1662 1653
123
chromatography. Detection limits were 2 lmol 1–1 for
SO42–, NO3
–, HCO3 and Cl–. Trace element analyses were
performed on the acidified samples using the Unicam 969
Atomic Absorption Spectrometer (AAS). An ionic balance
was computed and used as a basis for checking analytical
results.
The ionic balances for the analyses varied from 5.9 to
10.1%, though more than 85% of the samples had an ionic
balance within ±5%. An ionic balance outside ±5% was
largely associated with samples with very low total dis-
solved solids.
Results and discussion
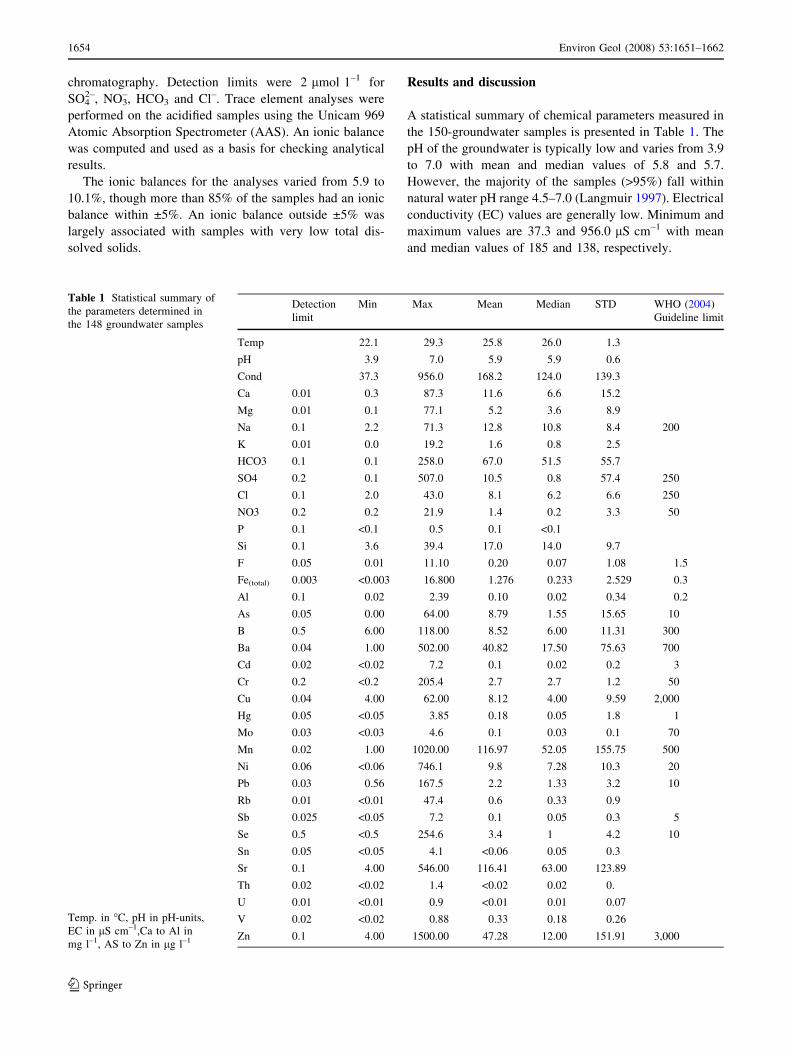
A statistical summary of chemical parameters measured in
the 150-groundwater samples is presented in Table 1. The
pH of the groundwater is typically low and varies from 3.9
to 7.0 with mean and median values of 5.8 and 5.7.
However, the majority of the samples (>95%) fall within
natural water pH range 4.5–7.0 (Langmuir 1997). Electrical
conductivity (EC) values are generally low. Minimum and
maximum values are 37.3 and 956.0 lS cm–1 with mean
and median values of 185 and 138, respectively.
Table 1 Statistical summary of
the parameters determined in
the 148 groundwater samples
Temp. in �C, pH in pH-units,
EC in lS cm–1,Ca to Al in
mg l–1, AS to Zn in lg l–1
Detection
limit
Min Max Mean Median STD WHO (2004)
Guideline limit
Temp 22.1 29.3 25.8 26.0 1.3
pH 3.9 7.0 5.9 5.9 0.6
Cond 37.3 956.0 168.2 124.0 139.3
Ca 0.01 0.3 87.3 11.6 6.6 15.2
Mg 0.01 0.1 77.1 5.2 3.6 8.9
Na 0.1 2.2 71.3 12.8 10.8 8.4 200
K 0.01 0.0 19.2 1.6 0.8 2.5
HCO3 0.1 0.1 258.0 67.0 51.5 55.7
SO4 0.2 0.1 507.0 10.5 0.8 57.4 250
Cl 0.1 2.0 43.0 8.1 6.2 6.6 250
NO3 0.2 0.2 21.9 1.4 0.2 3.3 50
P 0.1 <0.1 0.5 0.1 <0.1
Si 0.1 3.6 39.4 17.0 14.0 9.7
F 0.05 0.01 11.10 0.20 0.07 1.08 1.5
Fe(total) 0.003 <0.003 16.800 1.276 0.233 2.529 0.3
Al 0.1 0.02 2.39 0.10 0.02 0.34 0.2
As 0.05 0.00 64.00 8.79 1.55 15.65 10
B 0.5 6.00 118.00 8.52 6.00 11.31 300
Ba 0.04 1.00 502.00 40.82 17.50 75.63 700
Cd 0.02 <0.02 7.2 0.1 0.02 0.2 3
Cr 0.2 <0.2 205.4 2.7 2.7 1.2 50
Cu 0.04 4.00 62.00 8.12 4.00 9.59 2,000
Hg 0.05 <0.05 3.85 0.18 0.05 1.8 1
Mo 0.03 <0.03 4.6 0.1 0.03 0.1 70
Mn 0.02 1.00 1020.00 116.97 52.05 155.75 500
Ni 0.06 <0.06 746.1 9.8 7.28 10.3 20
Pb 0.03 0.56 167.5 2.2 1.33 3.2 10
Rb 0.01 <0.01 47.4 0.6 0.33 0.9
Sb 0.025 <0.05 7.2 0.1 0.05 0.3 5
Se 0.5 <0.5 254.6 3.4 1 4.2 10
Sn 0.05 <0.05 4.1 <0.06 0.05 0.3
Sr 0.1 4.00 546.00 116.41 63.00 123.89
Th 0.02 <0.02 1.4 <0.02 0.02 0.
U 0.01 <0.01 0.9 <0.01 0.01 0.07
V 0.02 <0.02 0.88 0.33 0.18 0.26
Zn 0.1 4.00 1500.00 47.28 12.00 151.91 3,000
1654 Environ Geol (2008) 53:1651–1662
123
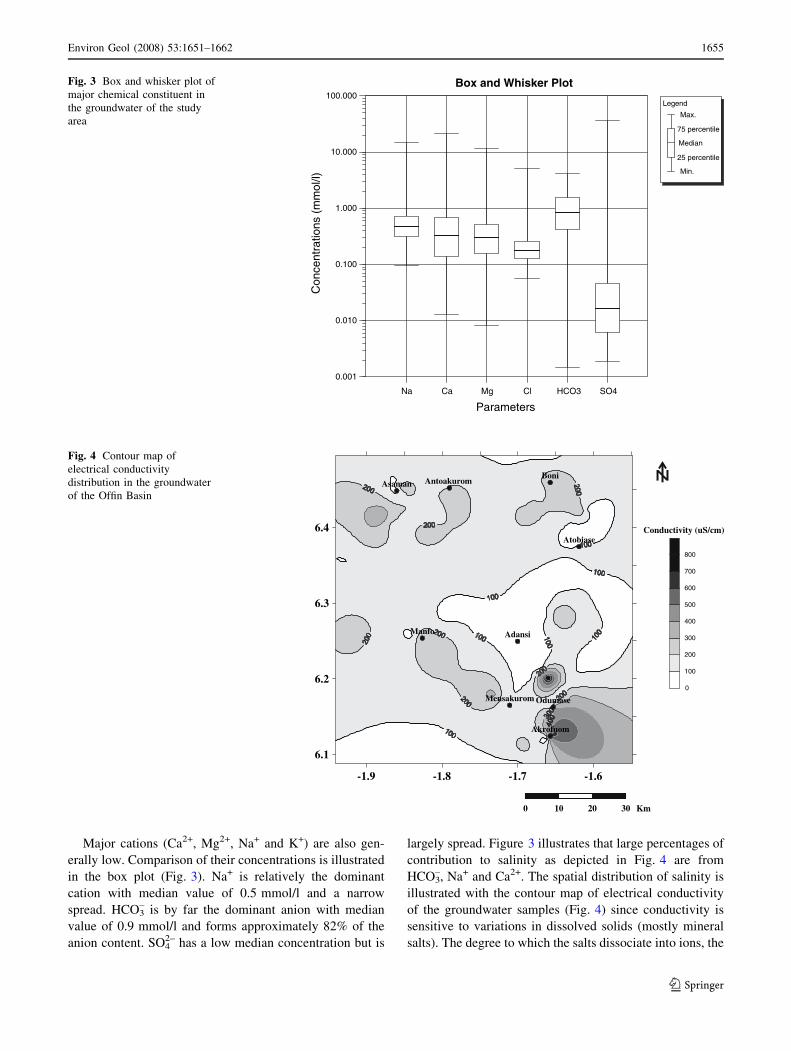
Major cations (Ca2+, Mg2+, Na+ and K+) are also gen-
erally low. Comparison of their concentrations is illustrated
in the box plot (Fig. 3). Na+ is relatively the dominant
cation with median value of 0.5 mmol/l and a narrow
spread. HCO3– is by far the dominant anion with median
value of 0.9 mmol/l and forms approximately 82% of the
anion content. SO42– has a low median concentration but is
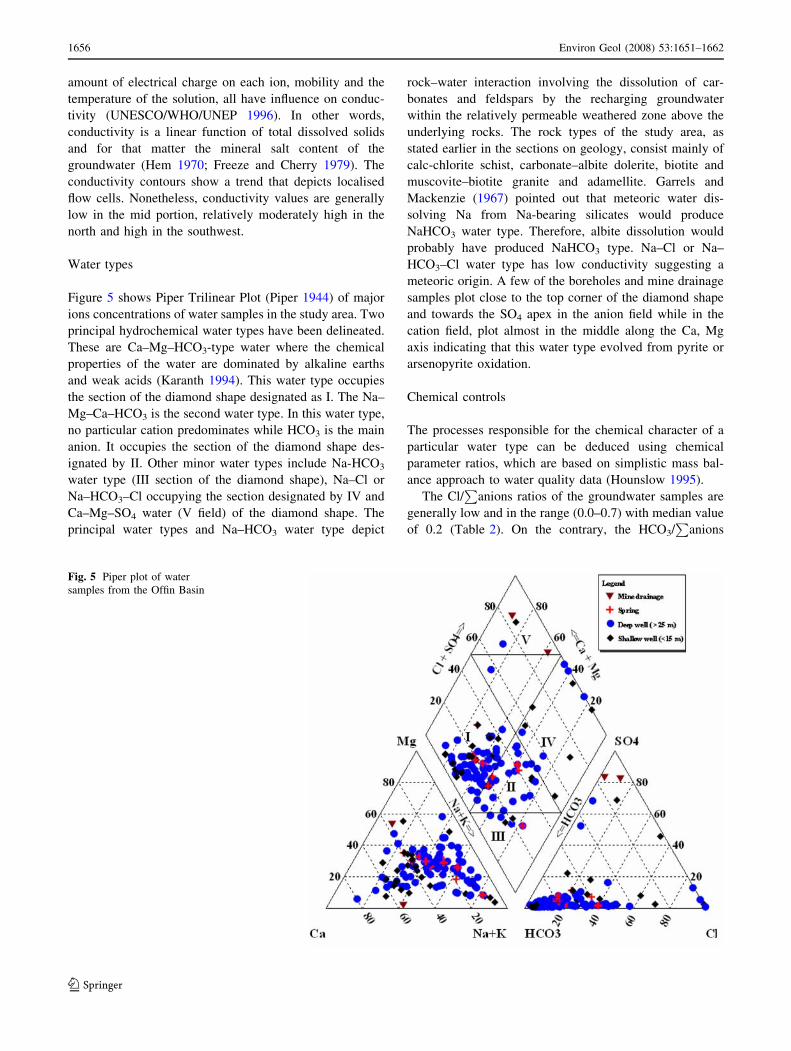
largely spread. Figure 3 illustrates that large percentages of
contribution to salinity as depicted in Fig. 4 are from
HCO3–, Na+ and Ca2+. The spatial distribution of salinity is
illustrated with the contour map of electrical conductivity
of the groundwater samples (Fig. 4) since conductivity is
sensitive to variations in dissolved solids (mostly mineral
salts). The degree to which the salts dissociate into ions, the
Na Ca Mg Cl HCO3 SO4
Parameters
0.001
0.010
0.100
1.000
10.000
100.000
Con
cent
ratio
ns (
mm
ol/l)
Box and Whisker Plot
Legend
Max.
75 percentile
Median
25 percentile
Min.
Fig. 3 Box and whisker plot of
major chemical constituent in
the groundwater of the study
area
-1.9 -1.8 -1.7 -1.6
6.1
6.2
6.3
6.4Atobiase
Adansi
Odumase
Boni
Manfo
Antoakurom Asaman
Akrofuom
Mensakurom0
100
200
300
400
500
600
700
800
0 10 20 30 Km
Conductivity (uS/cm)
Fig. 4 Contour map of
electrical conductivity
distribution in the groundwater
of the Offin Basin
Environ Geol (2008) 53:1651–1662 1655
123
amount of electrical charge on each ion, mobility and the
temperature of the solution, all have influence on conduc-
tivity (UNESCO/WHO/UNEP 1996). In other words,
conductivity is a linear function of total dissolved solids
and for that matter the mineral salt content of the
groundwater (Hem 1970; Freeze and Cherry 1979). The
conductivity contours show a trend that depicts localised
flow cells. Nonetheless, conductivity values are generally
low in the mid portion, relatively moderately high in the
north and high in the southwest.
Water types
Figure 5 shows Piper Trilinear Plot (Piper 1944) of major
ions concentrations of water samples in the study area. Two
principal hydrochemical water types have been delineated.
These are Ca–Mg–HCO3-type water where the chemical
properties of the water are dominated by alkaline earths
and weak acids (Karanth 1994). This water type occupies
the section of the diamond shape designated as I. The Na–
Mg–Ca–HCO3 is the second water type. In this water type,
no particular cation predominates while HCO3 is the main
anion. It occupies the section of the diamond shape des-
ignated by II. Other minor water types include Na-HCO3
water type (III section of the diamond shape), Na–Cl or
Na–HCO3–Cl occupying the section designated by IV and
Ca–Mg–SO4 water (V field) of the diamond shape. The
principal water types and Na–HCO3 water type depict
rock–water interaction involving the dissolution of car-
bonates and feldspars by the recharging groundwater
within the relatively permeable weathered zone above the
underlying rocks. The rock types of the study area, as
stated earlier in the sections on geology, consist mainly of
calc-chlorite schist, carbonate–albite dolerite, biotite and
muscovite–biotite granite and adamellite. Garrels and
Mackenzie (1967) pointed out that meteoric water dis-
solving Na from Na-bearing silicates would produce
NaHCO3 water type. Therefore, albite dissolution would
probably have produced NaHCO3 type. Na–Cl or Na–
HCO3–Cl water type has low conductivity suggesting a
meteoric origin. A few of the boreholes and mine drainage
samples plot close to the top corner of the diamond shape
and towards the SO4 apex in the anion field while in the
cation field, plot almost in the middle along the Ca, Mg
axis indicating that this water type evolved from pyrite or
arsenopyrite oxidation.
Chemical controls
The processes responsible for the chemical character of a
particular water type can be deduced using chemical
parameter ratios, which are based on simplistic mass bal-
ance approach to water quality data (Hounslow 1995).
The Cl/P
anions ratios of the groundwater samples are
generally low and in the range (0.0–0.7) with median value
of 0.2 (Table 2). On the contrary, the HCO3/P
anions
Fig. 5 Piper plot of water
samples from the Offin Basin
1656 Environ Geol (2008) 53:1651–1662
123
ratios are high with median 0.8 suggesting rock weath-
ering, principally silicate or carbonate weathering as has
been observed on the Piper plot. The occurrence of Na–
HCO3 water also suggests the possibility of ion exchange.
Thus, the water chemistry is probably controlled by car-
bonate or silicate dissolution and cation exchange. The
dominance of silicate or carbonate-weathering process can
be deduced from HCO3/SiO2 molar ratio. If the ratio is
greater than ten, which implies HCO3 >> SiO2, carbonate
weathering predominates. However, if the ratio is low and
in fact less than five, then silicate weathering predominates
(Hounslow 1995). Apart from a few of the water samples
that showed high ratios (HCO3/SiO2 > 10), most of the
samples had low to moderate ratios (median value = 3.6)
suggesting silicate weathering as a more dominant chemi-
cal process influencing the chemical character of ground-
water in the study area than carbonate weathering. The low
Cl/P
anions ratio of the groundwater in an area remote
from the sea suggests that the Cl– was derived mainly from
atmospheric sources and, therefore, the Cl– would be
present in the groundwater as sodium chloride (Karanth
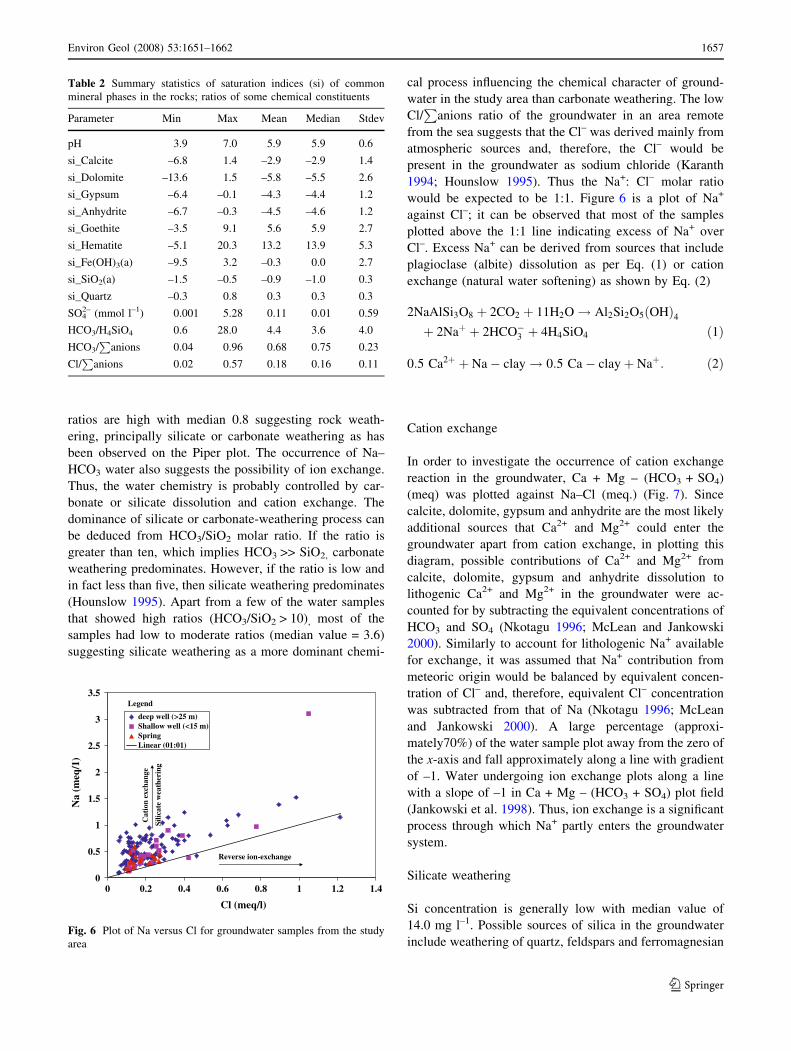
1994; Hounslow 1995). Thus the Na+: Cl– molar ratio
would be expected to be 1:1. Figure 6 is a plot of Na+
against Cl–; it can be observed that most of the samples
plotted above the 1:1 line indicating excess of Na+ over
Cl–. Excess Na+ can be derived from sources that include
plagioclase (albite) dissolution as per Eq. (1) or cation
exchange (natural water softening) as shown by Eq. (2)
2NaAlSi3O8 þ 2CO2 þ 11H2O! Al2Si2O5ðOHÞ4þ 2Naþ þ 2HCO�3 þ 4H4SiO4 ð1Þ
0:5 Ca2þ þ Na� clay! 0:5 Ca� clayþ Naþ: ð2Þ
Cation exchange
In order to investigate the occurrence of cation exchange
reaction in the groundwater, Ca + Mg – (HCO3 + SO4)
(meq) was plotted against Na–Cl (meq.) (Fig. 7). Since
calcite, dolomite, gypsum and anhydrite are the most likely
additional sources that Ca2+ and Mg2+ could enter the
groundwater apart from cation exchange, in plotting this
diagram, possible contributions of Ca2+ and Mg2+ from
calcite, dolomite, gypsum and anhydrite dissolution to
lithogenic Ca2+ and Mg2+ in the groundwater were ac-
counted for by subtracting the equivalent concentrations of
HCO3 and SO4 (Nkotagu 1996; McLean and Jankowski
2000). Similarly to account for lithologenic Na+ available
for exchange, it was assumed that Na+ contribution from
meteoric origin would be balanced by equivalent concen-
tration of Cl– and, therefore, equivalent Cl– concentration
was subtracted from that of Na (Nkotagu 1996; McLean
and Jankowski 2000). A large percentage (approxi-
mately70%) of the water sample plot away from the zero of
the x-axis and fall approximately along a line with gradient
of –1. Water undergoing ion exchange plots along a line
with a slope of –1 in Ca + Mg – (HCO3 + SO4) plot field
(Jankowski et al. 1998). Thus, ion exchange is a significant
process through which Na+ partly enters the groundwater
system.
Silicate weathering
Si concentration is generally low with median value of
14.0 mg l–1. Possible sources of silica in the groundwater
include weathering of quartz, feldspars and ferromagnesian
Table 2 Summary statistics of saturation indices (si) of common
mineral phases in the rocks; ratios of some chemical constituents
Parameter Min Max Mean Median Stdev
pH 3.9 7.0 5.9 5.9 0.6
si_Calcite –6.8 1.4 –2.9 –2.9 1.4
si_Dolomite –13.6 1.5 –5.8 –5.5 2.6
si_Gypsum –6.4 –0.1 –4.3 –4.4 1.2
si_Anhydrite –6.7 –0.3 –4.5 –4.6 1.2
si_Goethite –3.5 9.1 5.6 5.9 2.7
si_Hematite –5.1 20.3 13.2 13.9 5.3
si_Fe(OH)3(a) –9.5 3.2 –0.3 0.0 2.7
si_SiO2(a) –1.5 –0.5 –0.9 –1.0 0.3
si_Quartz –0.3 0.8 0.3 0.3 0.3
SO42– (mmol l–1) 0.001 5.28 0.11 0.01 0.59
HCO3/H4SiO4 0.6 28.0 4.4 3.6 4.0
HCO3/P
anions 0.04 0.96 0.68 0.75 0.23
Cl/P
anions 0.02 0.57 0.18 0.16 0.11
0
0.5
1
1.5
2
2.5
3
3.5
0 0.2 0.4 0.6 0.8 1 1.2 1.4
Cl (meq/l)
Na
(meq
/1)
deep well (>25 m)Shallow well (<15 m)SpringLinear (01:01)
egnahcxe noitaC
gnirehtaew etaciliS
Reverse ion-exchange
Legend
Fig. 6 Plot of Na versus Cl for groundwater samples from the study
area
Environ Geol (2008) 53:1651–1662 1657
123
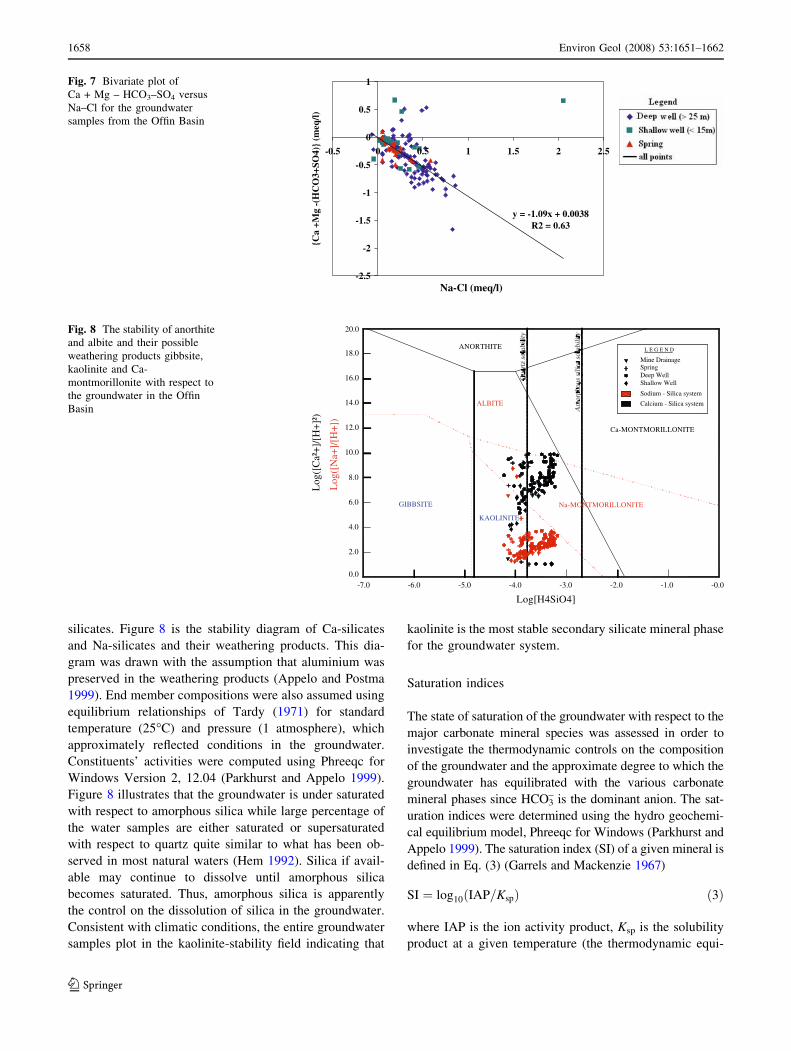
silicates. Figure 8 is the stability diagram of Ca-silicates
and Na-silicates and their weathering products. This dia-
gram was drawn with the assumption that aluminium was
preserved in the weathering products (Appelo and Postma
1999). End member compositions were also assumed using
equilibrium relationships of Tardy (1971) for standard
temperature (25�C) and pressure (1 atmosphere), which
approximately reflected conditions in the groundwater.
Constituents’ activities were computed using Phreeqc for
Windows Version 2, 12.04 (Parkhurst and Appelo 1999).
Figure 8 illustrates that the groundwater is under saturated
with respect to amorphous silica while large percentage of
the water samples are either saturated or supersaturated
with respect to quartz quite similar to what has been ob-
served in most natural waters (Hem 1992). Silica if avail-
able may continue to dissolve until amorphous silica
becomes saturated. Thus, amorphous silica is apparently
the control on the dissolution of silica in the groundwater.
Consistent with climatic conditions, the entire groundwater
samples plot in the kaolinite-stability field indicating that
kaolinite is the most stable secondary silicate mineral phase
for the groundwater system.
Saturation indices
The state of saturation of the groundwater with respect to the
major carbonate mineral species was assessed in order to
investigate the thermodynamic controls on the composition
of the groundwater and the approximate degree to which the
groundwater has equilibrated with the various carbonate
mineral phases since HCO3– is the dominant anion. The sat-
uration indices were determined using the hydro geochemi-
cal equilibrium model, Phreeqc for Windows (Parkhurst and
Appelo 1999). The saturation index (SI) of a given mineral is
defined in Eq. (3) (Garrels and Mackenzie 1967)
SI ¼ log10ðIAP=KspÞ ð3Þ
where IAP is the ion activity product, Ksp is the solubility
product at a given temperature (the thermodynamic equi-
y = -1.09x + 0.0038R2 = 0.63
-2.5
-2
-1.5
-1
-0.5
0
0.5
1
-0.5 0 0.5 1 1.5 2 2.5
Na-Cl (meq/l)
)l/qem( })4
OS+3O
CH(- g
M+ aC{
Fig. 7 Bivariate plot of
Ca + Mg – HCO3–SO4 versus
Na–Cl for the groundwater
samples from the Offin Basin
20.0
18.0
16.0
14.0
12.0
10.0
8.0
6.0
4.0
2.0
0.0-7.0 -6.0 -5.0 -4.0 -3.0 -2.0 -1.0 -0.0
GIBBSITE
KAOLINITE
Na-MONTMORILLONITE
ALBITE
Log[H4SiO4]
Log
([N
a+]/
[H+
])ANORTHITE
Ca-MONTMORILLONITE
Log
([C
a²+
]/[H
+]²
)
L E G E N D
Mine DrainageSpringDeep WellShallow Well
Sodium - Silica system
Calcium - Silica system
Fig. 8 The stability of anorthite
and albite and their possible
weathering products gibbsite,
kaolinite and Ca-
montmorillonite with respect to
the groundwater in the Offin
Basin
1658 Environ Geol (2008) 53:1651–1662
123
librium constant adjusted to the temperature of the given
sample).
The thermodynamic data used in this computation were
those contained in the default database of the ‘Phreeqc for
Windows’. Supersaturation (SI > 0) indicates that precip-
itation is thermodynamically favourable in spite of the fact
that slow rates of reaction can inhibit precipitation. On the
other hand, undersaturation (SI < 0) signifies that dissolu-
tion is favoured. The summary statistics of saturated indi-
ces of some of the common mineral phases is presented in
Table 2, which clearly shows that the groundwater is
generally undersaturated with respect to most of the car-
bonate phases. However, petrographic evidence indicates
that carbonates exist in the rock matrices, thus the under-
saturation may be attributable to very short residence time
of the groundwater in the aquifer or the carbonate species
may exist in other forms, which are not readily soluble in
water. The groundwater is also undersaturated with respect
to gypsum and anhydrite due plausibly to the absence of
these mineral phases from the rock matrix. It is also uni-
formly supersaturated with respect to quarts but undersat-
urated with respect to amorphous silica (Table 2)
suggesting that amorphous silica possibly controls the sil-
ica concentration in the groundwater.
Minor and trace elements
The analytical results did not indicate high levels of minor
and trace metal loading expected from mining area. None-
theless, arsenic and iron showed concentrations significantly
above their detection levels in a few boreholes sampled.
The concentration of arsenic is generally low varying
from <0.05 to 64.00 lg l–1 with a median value of
1.55 lg l–1. Relatively high As concentrations (>5 lg l–1)
occur in the western and the northwestern part of the study
area, where the Birimian rocks contains significant amount
of pyrite and arsenopyrites (Fig. 2). Approximately 19% of
the boreholes have arsenic concentrations slightly to
moderately in excess of the WHO guideline limit of
10 lg l–1 (WHO 2004) suggesting arsenopyrite oxidation
enhanced perhaps by mining activities in the area; arse-
nopyrite oxidation can take place without mining once the
pyrite or arsenopyrite are exposed to air and water as in
weathering reactions. Oxidation of pyrite and arsenopyrite
may be expressed by Eqs. (4) and (5), respectively
FeS2 þ 3:5O2 þ H2O ¼ Fe2þ þ 2SO2�4 þ 2Hþ ð4Þ
FeAsS þ 3:25O2 þ 1:5 H2O
¼ Fe2þ þ AsO3�4 þ SO2�
4 þ 3Hþ ð5Þ
These reactions are supposed to produce high sulphate
concentration, low pH and Fe2+/SO42– molar ratios of 0.5
and 1.0, respectively. However, SO42– concentration in the
boreholes is generally very low, 0.001–5.28 mmol l–1 with
a median value of 0.01 mmol l–1. Additionally Fe2+/SO42–
molar ratios are generally very low (median value = 0.1)
and only a few samples satisfy iron to sulphate (Fe2+/SO42–)
molar ratios of 0.5 and 1.0 for the stoichiometry of pyrite
and arsenopyrite oxidation, respectively. It is possible that
iron may have precipitated as amorphous Fe(OH)3 and
hydrated to form limonite or hematite as in Eq. (6).
FeS2 þ 3:75O2 þ 2:5 H2O ¼ FeOOH þ 2SO2�4 þ 4Hþ:
ð6Þ
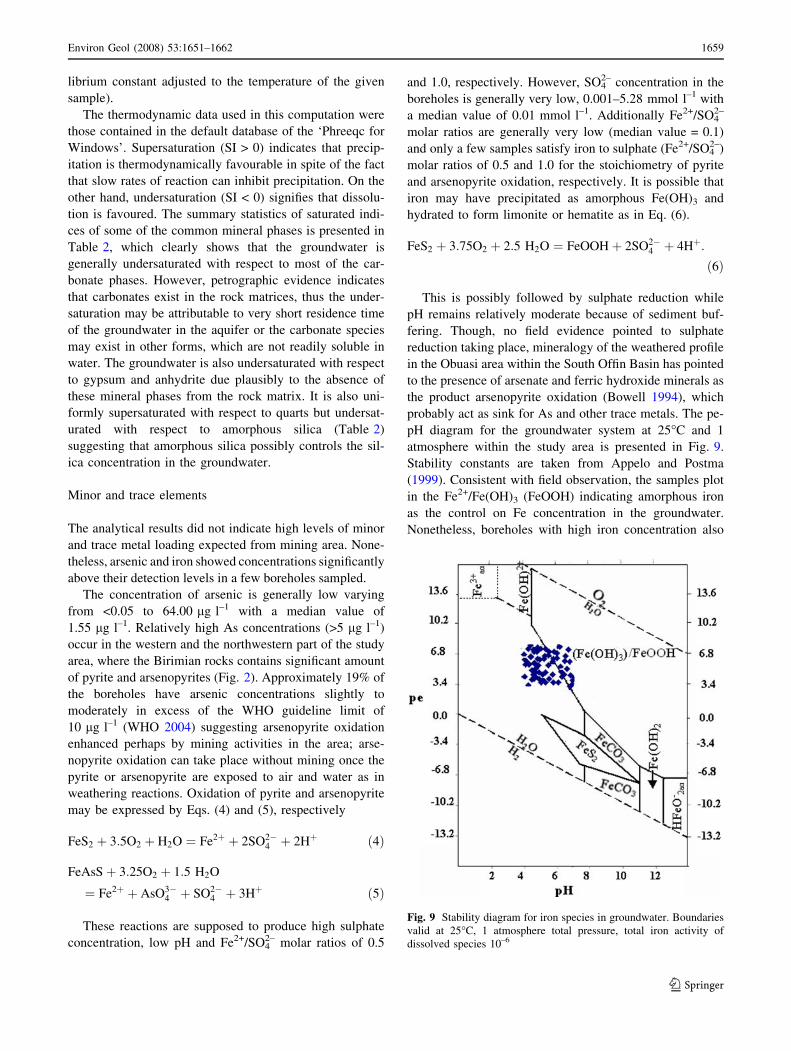
This is possibly followed by sulphate reduction while
pH remains relatively moderate because of sediment buf-
fering. Though, no field evidence pointed to sulphate
reduction taking place, mineralogy of the weathered profile
in the Obuasi area within the South Offin Basin has pointed
to the presence of arsenate and ferric hydroxide minerals as
the product arsenopyrite oxidation (Bowell 1994), which
probably act as sink for As and other trace metals. The pe-
pH diagram for the groundwater system at 25�C and 1
atmosphere within the study area is presented in Fig. 9.
Stability constants are taken from Appelo and Postma
(1999). Consistent with field observation, the samples plot
in the Fe2+/Fe(OH)3 (FeOOH) indicating amorphous iron
as the control on Fe concentration in the groundwater.
Nonetheless, boreholes with high iron concentration also
Fig. 9 Stability diagram for iron species in groundwater. Boundaries
valid at 25�C, 1 atmosphere total pressure, total iron activity of
dissolved species 10–6
Environ Geol (2008) 53:1651–1662 1659
123
have Fe2+/SO42– > 1 suggesting that unless SO4
2– reduction
has taken place, but as said earlier has not been evident,
pyrite and/or arsenopyrite oxidation may have occurred but
cannot explain the high iron concentration in the ground-
water particularly at areas underlain by granites and basic
intrusives in the northeast. Furthermore, calculated satu-
rated indices of the iron species goethite, hematite and
magnetite indicate that the waters are highly supersaturated
with respect to these species. Thus the groundwater should
be precipitating these iron minerals to reduce Fe2+/SO42–
ratio. Since this does not seem to happen, Fe2+ could have
been derived from other sources apart from pyrite or
arsenopyrite oxidation. Hematite, scorodite and goethite
and to a limited extent magnetite are some of the iron
species present in the rock matrix of the study area (Kesse
1985; Bowell 1992). Reductive dissolution of these iron
minerals results in the production of Fe2+ that can sustain
Fe2+/SO42– > 1. Hematite dissolution in the presence of
proton (acid) is extremely slow but in the presence of or-
ganic ligands the reaction can be fast (Appelo and Postma
1999). Though in this study the content of organic matter in
the soil zone has not been measured, the upper zone of soils
to the east of the study area is known to be high in organic
content (Bowell 1993). The brown colouration of rivers
and streams throughout the year in Offin basin is a further
indication of the presence of organic matter in the soil
zone. Thus, reductive dissolution of iron minerals in the
presence of organic matter and perhaps a reductant seems
to be a more plausible process through which Fe2+ entered
the groundwater particularly in the low sulphide ore areas
in the north–east where the major rock types are granites
and granodiorites than arsenopyrite or pyrite oxidation.
Additional source of iron could be the leaching from fer-
romagnesian silicates—Biotite, Chlorite, hornblende and
pyroxenes, which are common in the rock types that
underlain the study area.
Groundwater acidification
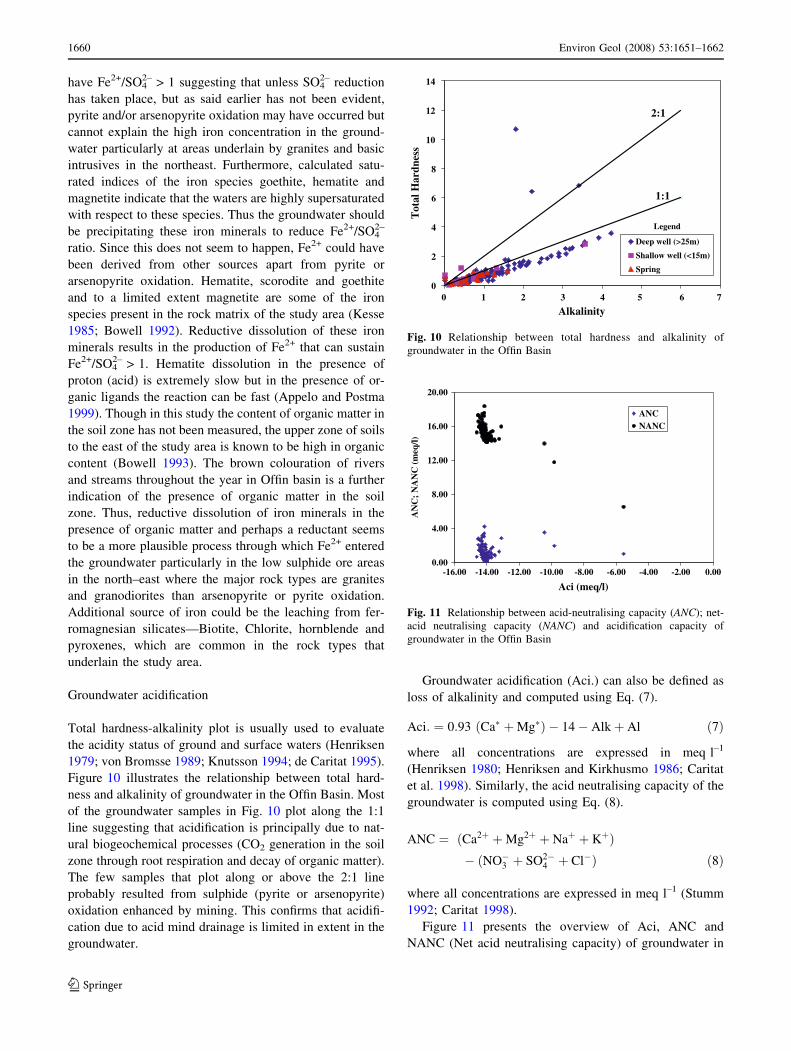
Total hardness-alkalinity plot is usually used to evaluate
the acidity status of ground and surface waters (Henriksen
1979; von Bromsse 1989; Knutsson 1994; de Caritat 1995).
Figure 10 illustrates the relationship between total hard-
ness and alkalinity of groundwater in the Offin Basin. Most
of the groundwater samples in Fig. 10 plot along the 1:1
line suggesting that acidification is principally due to nat-
ural biogeochemical processes (CO2 generation in the soil
zone through root respiration and decay of organic matter).
The few samples that plot along or above the 2:1 line
probably resulted from sulphide (pyrite or arsenopyrite)
oxidation enhanced by mining. This confirms that acidifi-
cation due to acid mind drainage is limited in extent in the
groundwater.
Groundwater acidification (Aci.) can also be defined as
loss of alkalinity and computed using Eq. (7).
Aci: ¼ 0:93 ðCa� þMg�Þ � 14� Alkþ Al ð7Þ
where all concentrations are expressed in meq l–1
(Henriksen 1980; Henriksen and Kirkhusmo 1986; Caritat
et al. 1998). Similarly, the acid neutralising capacity of the
groundwater is computed using Eq. (8).
ANC ¼ ðCa2þ þMg2þ þ Naþ þ KþÞ� ðNO�3 þ SO2�
4 þ Cl�Þ ð8Þ
where all concentrations are expressed in meq l–1 (Stumm
1992; Caritat 1998).
Figure 11 presents the overview of Aci, ANC and
NANC (Net acid neutralising capacity) of groundwater in
1:1
2:1
0
2
4
6
8
10
12
14
0 1 2 3 4 5 6 7
Alkalinity
ssendraH lato
T
Deep well (>25m)
Shallow well (<15m)
Spring
Legend
Fig. 10 Relationship between total hardness and alkalinity of
groundwater in the Offin Basin
0.00
4.00
8.00
12.00
16.00
20.00
-16.00 -14.00 -12.00 -10.00 -8.00 -6.00 -4.00 -2.00 0.00
Aci (meq/l)
)l/qem(
CN
AN ;
CN
AANCNANC
Fig. 11 Relationship between acid-neutralising capacity (ANC); net-
acid neutralising capacity (NANC) and acidification capacity of
groundwater in the Offin Basin
1660 Environ Geol (2008) 53:1651–1662
123
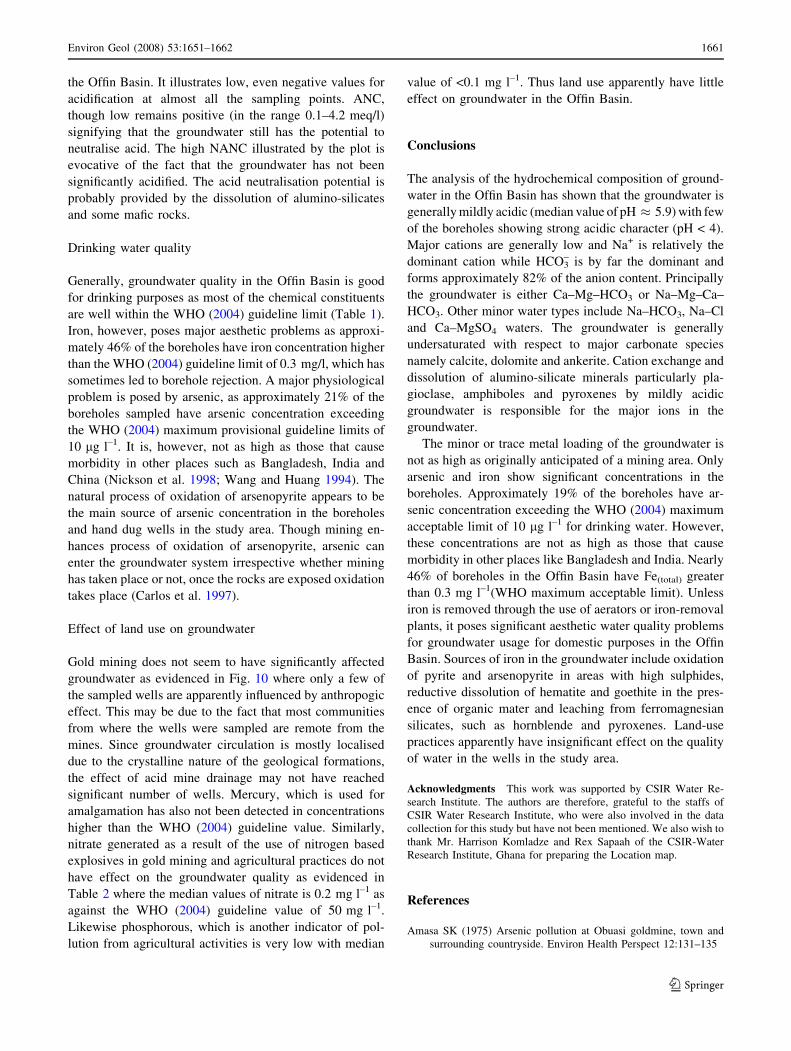
the Offin Basin. It illustrates low, even negative values for
acidification at almost all the sampling points. ANC,
though low remains positive (in the range 0.1–4.2 meq/l)
signifying that the groundwater still has the potential to
neutralise acid. The high NANC illustrated by the plot is
evocative of the fact that the groundwater has not been
significantly acidified. The acid neutralisation potential is
probably provided by the dissolution of alumino-silicates
and some mafic rocks.
Drinking water quality
Generally, groundwater quality in the Offin Basin is good
for drinking purposes as most of the chemical constituents
are well within the WHO (2004) guideline limit (Table 1).
Iron, however, poses major aesthetic problems as approxi-
mately 46% of the boreholes have iron concentration higher
than the WHO (2004) guideline limit of 0.3 mg/l, which has
sometimes led to borehole rejection. A major physiological
problem is posed by arsenic, as approximately 21% of the
boreholes sampled have arsenic concentration exceeding
the WHO (2004) maximum provisional guideline limits of
10 lg l–1. It is, however, not as high as those that cause
morbidity in other places such as Bangladesh, India and
China (Nickson et al. 1998; Wang and Huang 1994). The
natural process of oxidation of arsenopyrite appears to be
the main source of arsenic concentration in the boreholes
and hand dug wells in the study area. Though mining en-
hances process of oxidation of arsenopyrite, arsenic can
enter the groundwater system irrespective whether mining
has taken place or not, once the rocks are exposed oxidation
takes place (Carlos et al. 1997).
Effect of land use on groundwater
Gold mining does not seem to have significantly affected
groundwater as evidenced in Fig. 10 where only a few of
the sampled wells are apparently influenced by anthropogic
effect. This may be due to the fact that most communities
from where the wells were sampled are remote from the
mines. Since groundwater circulation is mostly localised
due to the crystalline nature of the geological formations,
the effect of acid mine drainage may not have reached
significant number of wells. Mercury, which is used for
amalgamation has also not been detected in concentrations
higher than the WHO (2004) guideline value. Similarly,
nitrate generated as a result of the use of nitrogen based
explosives in gold mining and agricultural practices do not
have effect on the groundwater quality as evidenced in
Table 2 where the median values of nitrate is 0.2 mg l–1 as
against the WHO (2004) guideline value of 50 mg l–1.
Likewise phosphorous, which is another indicator of pol-
lution from agricultural activities is very low with median
value of <0.1 mg l–1. Thus land use apparently have little
effect on groundwater in the Offin Basin.
Conclusions
The analysis of the hydrochemical composition of ground-
water in the Offin Basin has shown that the groundwater is
generally mildly acidic (median value of pH � 5.9) with few
of the boreholes showing strong acidic character (pH < 4).
Major cations are generally low and Na+ is relatively the
dominant cation while HCO3– is by far the dominant and
forms approximately 82% of the anion content. Principally
the groundwater is either Ca–Mg–HCO3 or Na–Mg–Ca–
HCO3. Other minor water types include Na–HCO3, Na–Cl
and Ca–MgSO4 waters. The groundwater is generally
undersaturated with respect to major carbonate species
namely calcite, dolomite and ankerite. Cation exchange and
dissolution of alumino-silicate minerals particularly pla-
gioclase, amphiboles and pyroxenes by mildly acidic
groundwater is responsible for the major ions in the
groundwater.
The minor or trace metal loading of the groundwater is
not as high as originally anticipated of a mining area. Only
arsenic and iron show significant concentrations in the
boreholes. Approximately 19% of the boreholes have ar-
senic concentration exceeding the WHO (2004) maximum
acceptable limit of 10 lg l–1 for drinking water. However,
these concentrations are not as high as those that cause
morbidity in other places like Bangladesh and India. Nearly
46% of boreholes in the Offin Basin have Fe(total) greater
than 0.3 mg l–1(WHO maximum acceptable limit). Unless
iron is removed through the use of aerators or iron-removal
plants, it poses significant aesthetic water quality problems
for groundwater usage for domestic purposes in the Offin
Basin. Sources of iron in the groundwater include oxidation
of pyrite and arsenopyrite in areas with high sulphides,
reductive dissolution of hematite and goethite in the pres-
ence of organic mater and leaching from ferromagnesian
silicates, such as hornblende and pyroxenes. Land-use
practices apparently have insignificant effect on the quality
of water in the wells in the study area.
Acknowledgments This work was supported by CSIR Water Re-
search Institute. The authors are therefore, grateful to the staffs of
CSIR Water Research Institute, who were also involved in the data
collection for this study but have not been mentioned. We also wish to
thank Mr. Harrison Komladze and Rex Sapaah of the CSIR-Water
Research Institute, Ghana for preparing the Location map.
References
Amasa SK (1975) Arsenic pollution at Obuasi goldmine, town and
surrounding countryside. Environ Health Perspect 12:131–135
Environ Geol (2008) 53:1651–1662 1661
123
Appelo CAJ, Postma D (1999) Chemical analysis of groundwater.
Geochemistry, Groundwater and pollution. Fourth corrected
print. AA Balkema, Rotterdam
Barcelona M, Gibb JP, Helfrich JA, Garske EE (1985) Practical guide
for groundwater sampling. Illinois State Water Survey ISWS
Contract Report 374
Bowell RJ (1992) Supergene gold mineralogy at Ashanti, Ghana:
implications for the supergene behaviour of gold. Miner Mag
56:545–560
Bowell RJ (1993) Mineralogy and geochemistry of tropical rain forest
soils: Ashanti, Ghana. Chem Geol 106:345–358
Bowell RJ (1994) Sorption of arsenic by iron oxides and oxyhydrox-
ides in soils. Appl Geochem 9:279–286
von Bromsse U (1989) Acidification trends in Swedish groundwaters.
Report 3576 National Swedish Environmental Protection Board,
Solna, Sweden
de Caritat P (1995) Intensifying groundwater acidification at
Birkenes, southern Norway J Hydrol 170:47–62
Caritat DP, Danilova S, J�ger Ø, Reimann C, Storrø G (1998)
Groundwater composition near the nickel-copper smelting
industry on the Kola Peninsula, central Barents Region (NW
Russia and NE Norway). J Hydrol 208:92–107
Carlos D, Da Rosa JD, Lyon JS, Udall SL, Hocker PM (1997) Golden
dreams, poisoned streams. Mineral Policy Center, Washington
Claasen HC (1982) Guidelines and techniques for obtaining water
samples that accurately represent the water quality for an aquifer.
U.S. Geological Survey Open File Report 82–1024, 49 pp
Dickson KB, Benneh G (1980) A new geography of Ghana.
Longmans Group Limited, London
Freeze AR, Cherry JA (1979) Groundwater. Prentice-Hall, Inc.
Englewood Cliffs
Gale IN, Robins NS (1989) The sampling and monitoring of
groundwater quality. British Geological Survey. Hydrogeology
Report, No 89/37
Garrels RM, Mackenzie FT (1967) Origin of the chemical compo-
sitions of some springs and lakes. In: Gound RF (ed) Equilibrium
concepts in natural water systems. American Chemical Society
Publications, Washington
Hem JD (1970) Study and interpretation of chemical characteristics of
natural water. US Geol Surv Water-Supply Paper 1473:363
Hem JD (1992) Study and interpretation of chemical characteristics of
natural water. United States Geological Survey Water-Supply
Paper, 2254, United States Government Printing Office, Wash-
ington, Krumbein, W. 1943
Henriksen A (1979) A simple approach for identifying and measuring
acidification of freshwaters. Nature 278:542–545
Henriksen A (1980) Acidification of freshwaters—a large scale
titration. In: Proceedings of international conference on ecolog-
ical impact of acid precipitation. Norway 1980 SNSF Project, pp
68–74
Henriksen A, Kirkhusmo LA (1986) Water chemistry of acidified
aquifers in southern Norway. Water Qual Bull 11(1):34–38 and
61
Hounslow AW (1995) Water quality data analysis and interpretation.
Lewis Publishers, Boca Raton
Jankowski J, Acworth RI, Shekarforoush S (1998) Reverse ion-
exchange in deeply weathered porphyritic dacite fractured
aquifer system, Yass, New South Wales, Australia. In: Arehart
GB, Hulston JR (eds) Proceedings of 9th international sympo-
sium on water–rock interaction. Taupo, New Zealand, 30
March–April1998. Balkema, Rotterdam, pp 243–246
Karanth KR (1994) Groundwater assessment development and
management. Tata McGraw-Hill Publishing Company Limited,
New Delhi. Third reprint
Kesse GO (1985) The mineral and rock resources of Ghana. A.A/
Balkema, Rotterdam, Boston
Knutsson G (1994) Trends in acidification of groundwater. In: Kovar
K, Soveri J (eds) Groundwater quality management. Proceedings
of Tallinn conference in Estonia, September 1993. IAHS publ.
No. 220
Langmuir D (1997) Aqueous environmental geochemistry. Prentice
Hall, Upper Saddle River
McLean W, Jankowski J (2000) Groundwater quality and sustain-
ability in an alluvial aquifer, Australia. In: Sililo et al (eds)
Proceedeings of the XXX IAH congress on groundwater: past
achievements and future challenges Cape Town South Africa
26th November–1st December 2000. A. A. Balkema, Rotterdam
Nkotagu H (1996) The groundwater geochemistry in a semi-arid,
fractured crystalline basement area of Dodoma, Tanzania. J
Afric Earth Sci 23(4):593–605
Nickson R, McArthur J, Burgess W, Ahmed KM, Ravenscroft P,
Rahman M (1998) Arsenic poisoning of Bangladesh groundwa-
ter. Nature 395:338
Parkhurst DL, Appelo CAJ (1999) Phreeqc for windows version
1.4.07. A hydrogeochemical transport model. US Geological
Survey Software
Piper AM (1944) A graphic procedure in the Geochemical
interpretation of water analyses. Am Geophys Union Trans
25:914–923
Smedley PL, Edmunds WM, West JM, Gardner SJ, Pelig-Ba KB
(1995) Vulnerability of shallow groundwater quality due to
natural geochemical environment. Health problems related to
groundwater in the Obuasi and Bolgatanga Areas, Ghana. Report
prepared for ODA under the ODA/BGS Technology Develop-
ment and Research Programme, Project 92/5
Smedley PL (1996) Arsenic in rural groundwater in Ghana. J Afr
Earth Sci 22:459–470
Smedley PL Edmunds WM, Pelig-Ba KB (1996) Mobility of arsenic
in groundwater in the Obuasi gold-mining area of Ghana: some
implications for human health. In: Appleton JD, Fuge R, McCall
GJH (eds) Environmental Geochemistry and Health. Geological
Society Special Publication No. 113 pp 163–181, Chapman and
Hall, London
Stumm (1992) Chemistry of solid-Water Interface: processes at the
mineral–water and particle-water interface in natural systems.
John Wiley, New York. ISBN-0-471-57672-7
Tardy Y (1971) Characterization of the principal weathering types by
the geochemistry of waters from some European and African
crystalline massifs. Chem Geol 7:253–271
UNESCO/WHO/UNEP (1996) Water quality assessments. A guide to
the use of biota, sediments and water in environmental
monitoring, 2nd edn (eds) Deborah Chapman. E & FN Spon,
London, New York
Wang L, Huang J (1994) Chronic arsenism from drinking water in
some areas of Xinjiang, China. In: Nriagu JO (ed) Arsenic in the
environment, Part II: Human health and ecosystem effects.
Wiley, New York, pp 159–172
Williams MW, Smith B (1994) Empirical and modelled hydrochem-
istry of acid mine drainage, iron Duke mine, Mazowe, Zimba-
bwe. British Geological Survey Technical Report WC/94/78/
R.25p
Wilson FH., Hawkins DB (1978) Arsenic in streams, stream
sediments and ground water; Fairbanks area, Alaska. Environ
Geol 2:195–202
Wood WW (1981) Guidelines for collection and field analysis of
ground-water samples for selected unstable constituents. US
Geological Survey Teechniques of Water-Resources Investiga-
tions book 1, ch D2. Us Government Printing Office, Washing-
ton
World Health Organisation (WHO) (2004) Guidelines for drinking
water quality. Final task group meeting. WHO Press, World
Health Organization, Geneva
1662 Environ Geol (2008) 53:1651–1662
123