consolidated fund.cdr - Ghana Audit Service
161
R E P U B L I C O F G H A N A R E P U B L I C O F G H A N A R E P O R T O F T H E A U D I T O R - G E N E R A L T H E P U B L I C A C C O U N T S O F G H A N A ( C O N S O L I D A T E D F U N D ) F O R T H E Y E A Y E N D E D 3 1 D E C E M B E R 2 0 1 5 R E P O R T O F T H E A U D I T O R - G E N E R A L T H E P U B L I C A C C O U N T S O F G H A N A ( C O N S O L I D A T E D F U N D ) F O R T H E Y E A Y E N D E D 3 1 D E C E M B E R 2 0 1 5 O u r V i s i o n T o b e o n e o f t h e l e a d i n g S u p r e m e A u d i t I n s t i t u t i o n s i n t h e w o r l d , d e l i v e r i n g p r o f e s s i o n a l , e x c e l l e n t , a n d c o s t e f f e c t i v e a u d i t i n g s e r v i c e s
-
Upload
khangminh22 -
Category
Documents
-
view
1 -
download
0
Transcript of consolidated fund.cdr - Ghana Audit Service

REPUBLIC OF GHANAREPUBLIC OF GHANA
REPORT OF THE AUDITOR-GENERAL
THE PUBLIC ACCOUNTS OF GHANA
(CONSOLIDATED FUND) FOR THE YEAY ENDED
31 DECEMBER 2015
REPORT OF THE AUDITOR-GENERAL
THE PUBLIC ACCOUNTS OF GHANA
(CONSOLIDATED FUND) FOR THE YEAY ENDED
31 DECEMBER 2015
Our VisionTo be one of the leading
Supreme Audit Institutionsin the world, delivering professional, excellent,
andcost effective auditing services
This report has been prepared under Section 11of the Audit Service Act, 2000 for presentationto Parliament in accordance withSection 20 of the Act.
Richard QuarteyAuditor-GeneralGhana Audit Service14 September 2016
This report can be found on the Ghana Audit Service website: www.ghaudit.org
For further information about the Ghana Audit Service, please contact:
The Director, Communication Unit Ghana Audit Service Headquarters Post Office Box MB 96, Accra.
Tel: 0302 664928/29/20 Fax: 0302 662493/675496 E-mail: [email protected]: Ministries Block 'O'
© Ghana Audit Service 2016

REPORT of the AUDITOR–GENERAL on the PUBLIC ACCOUNTS OF GHANA (CONSOLIDATED FUND) FOR THE YEAR ENDED 31 DECEMBER 2015 i
Ref. No. AG. 01/109/Vol.2/93
Office of the Auditor-General
Ministries Block ‘O’ P. O. Box MB 96
Accra
Tel. (021) 662493 Fax (021) 662493
14 September 2016
Dear Mr Speaker,
REPORT OF THE AUDITOR–GENERAL ON THE PUBLIC ACCOUNTS OF GHANA (CONSOLIDATED FUND)
FOR THE FINANCIAL YEAR ENDED 31 DECEMBER 2015
In accordance with Article 187(5) of the Constitution of the Republic of
Ghana and Section 23(1) of the Audit Service Act 2000 (Act 584), I have the
honour to present my report on the Public Accounts of Ghana (Consolidated
Fund) for the year ended 31 December 2015 to be laid before Parliament.
2. The report highlights the outcomes of the financial statements which
comprise mainly the Balance Sheet, Revenue and Expenditure Statement,
Receipts and Payments Statements, Cash Flow Statement and the supporting
schedules, with a view to expressing an opinion on the accounts.
3. In my opinion, except for the significant issues raised in paragraph 93 of
this report, the financial statements give a true and fair view of the financial
position of the Government of Ghana as at 31 December 2015 and the results of
its operations, cash flow and financial requirements for the year then ended.
TRANSMITTAL LETTER
REPORT of the AUDITOR–GENERAL on the PUBLIC ACCOUNTS OF GHANA (CONSOLIDATED FUND) FOR THE YEAR ENDED 31 DECEMBER 2015 ii
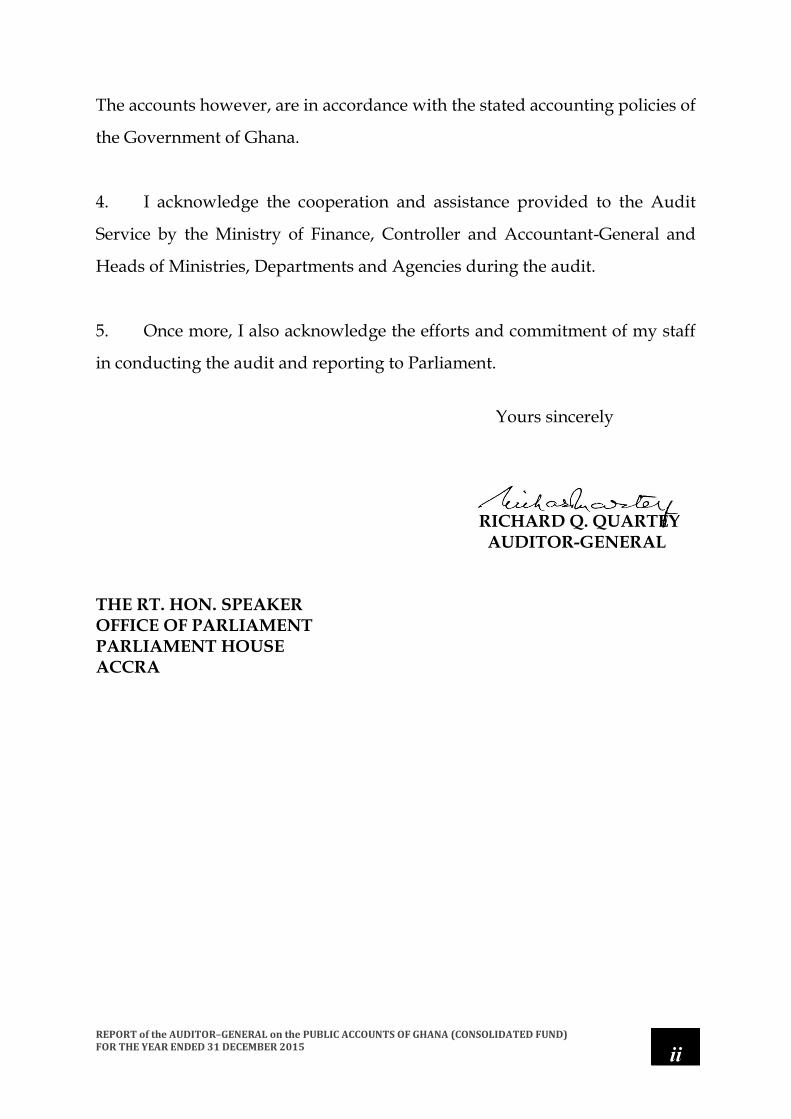
The accounts however, are in accordance with the stated accounting policies of
the Government of Ghana.
4. I acknowledge the cooperation and assistance provided to the Audit
Service by the Ministry of Finance, Controller and Accountant-General and
Heads of Ministries, Departments and Agencies during the audit.
5. Once more, I also acknowledge the efforts and commitment of my staff
in conducting the audit and reporting to Parliament.
Yours sincerely RICHARD Q. QUARTEY AUDITOR-GENERAL THE RT. HON. SPEAKER OFFICE OF PARLIAMENT PARLIAMENT HOUSE ACCRA

REPORT of the AUDITOR–GENERAL on the PUBLIC ACCOUNTS OF GHANA (CONSOLIDATED FUND) FOR THE YEAR ENDED 31 DECEMBER 2015 iii
Contents
Acronyms and Abbreviations …………………………………………………...ii
Introduction ……………………………………………………………………….1
Summary of findings………………………………………………………………. 4
Ineffective recovery of GoG loans ……………………………………………….4
Inconsistencies in reporting loan receivables …………………………………..4
Undisclosed GoG on-lending loans ……………………………………………. 4
Payments outside the GIFMIS system …………………………………………..5
Poor management of non-tax revenue by Commercial banks ………………..5
Understatement of ABFA receipt ………………………………………………. 5
Understatement of external debt balance……………………………………… 6
Delays in crediting budget support receipt…………………………………… 6
Details of findings…………………………..……………………………………....7
Ineffective recovery of GoG loans……………………………………………… .7
Inconsistencies in reporting loan receivables………………………………….. 8
Undisclosed GoG on-lending loans…………………………………………….. 9
Payments outside the GIFMIS system ………………………………………...10
Poor management of non-tax revenue by Commercial banks………………12
Delays in transfer of NTR……………………………………………………….13
Understatement of ABFA receipt……………………………………………… 14
Understatement of external debt balance…………………………………….. 15
Understatement of external debt receipts…………………………………….. 16
Delays in crediting budget support receipts…………………………………. 17
Financial Analysis on the 2015 Financial Statements…………………………18
Audit opinion …………………...…….………………………………………….... 19
Acknowledgement………………………………………………………………….21
REPORT of the AUDITOR–GENERAL on the PUBLIC ACCOUNTS OF GHANA (CONSOLIDATED FUND) FOR THE YEAR ENDED 31 DECEMBER 2015 iv
Acronyms and Abbreviations
ABFA Annual Budget Funding Amount ADF African Development Fund AOM Audit Observation Memorandum BBP Barclays Bank Plc BoG Bank of Ghana BTA Bank Transfer Advice CAG Controller and Accountant General CAGD Controller and Accountant General Department CF Consolidated Fund CS-DRMS Commonwealth Secretariat Debt Recording and Management
System DACF District Assemblies Common Fund DMD Debt Management Division EFT Electronic Fund Transfer ERM External Resource Mobilization FAA Financial Administration Act, 2003 (ACT 654) FAR Financial Administration Regulations, 2004 (LI 1802) GoG Government of Ghana GIFMIS Ghana Integrated Financial Management and Information System GRA Ghana Revenue Authority GCB Ghana Commercial Bank IGF Internally Generated Fund INTOSAI International Organization of Supreme Audit Institution MDAs Ministries, Departments and Agencies MoF Ministry of Finance PDI Public Debt and Investment PID Public Investment Division PIU Project Implementation Units NTR Non Tax Revenue VAT Value Added Tax AFC African Finance Corporation ABFA Annual Budget Funding Amount SOEs State Owned Enterprises SMEs Small and Medium Enterprises PIMS Public Information Management System GBEs Government Business Enterprises SIP Social Intervention Programme GIIF Ghana Infrastructure Investment Fund
REPORT of the AUDITOR–GENERAL on the PUBLIC ACCOUNTS OF GHANA (CONSOLIDATED FUND)
FOR THE YEAR ENDED 31 DECEMBER 2015 1
REPORT OF THE AUDITOR–GENERAL ON THE PUBLIC ACCOUNTS OF GHANA (CONSOLIDATED FUND)
FOR THE FINANCIAL YEAR ENDED 31 DECEMBER 2015
Introduction
1. The Controller and Accountant-General (CAG) is mandated under
Sections 41(1b & 2) and 44(1) of the Financial Administration Act (FAA), 2003
(Act 654), to prepare and submit to the Auditor-General for examination, the
annual financial statements on the Public Accounts of Ghana. The financial
statements comprise the following:
Statement of Assets and Liabilities (Balance Sheet)
Statement of Revenue and Expenditure
Statement of Receipts and Payments
Cash Flow Statement (which discloses the results of cash
transactions on the Consolidated Fund (CF) during the year)
Notes to the accounts
Functional classification of expenditure by items and heads
Summary of expenditure by heads and items
Analyses of the position of public debts, grants, public loans
funded from the CF, deposits, advances, equity investments,
Annual Budget Funding Amount (ABFA), and Social Intervention
Programme (SIP) Funds
Audit objectives
2. Section 15 of the Audit Service Act, 2000 (Act 584) requires that I
examine the Financial Statements and certify whether in my opinion, the
statements present fairly financial information on the accounts in accordance
with accounting policies of Government and consistent with statements of the
preceding year in accordance with best international practices. I am also
REPORT of the AUDITOR–GENERAL on the PUBLIC ACCOUNTS OF GHANA (CONSOLIDATED FUND)
FOR THE YEAR ENDED 31 DECEMBER 2015 2
required to state any reservation or make any comment that I consider
necessary.
Audit scope and methodology
3. The audit covered transactions/events in 2015 which impacted on the
CF. Our review of these transactions/events was carried out taking into
consideration relevant provisions of the 1992 Constitution, the FAA, 2003 (Act
654), enabling enactments on statutory funds and other statutes and
regulations. The audit focused mainly on processes followed by the Controller
and Accountant General’s Department to capture transactions/events for the
preparation of the Public Accounts of Ghana (Consolidated Fund).
4. To satisfy the audit objectives, the control environment within which
the transactions/events were effected was assessed. This assessment included
the review of applications controls and data integrity of the GIFMIS system to
gain assurance on the adequacy and consistency with government business
processes as redefined. Inherent risks associated with significant transactions
and events were also assessed with the aim of evaluating the adequacy of
managements’ responses to these risks. On the basis of the outcome of these
reviews, I evolved and executed audit procedures which, in my view were
necessary to minimise audit risks. Systems supporting transactions/events
were also reviewed and substantive tests as appropriate were undertaken.
5. The outcome of my reviews were discussed with respective desk
officers and their supervising officers, whose responses were considered in
arriving at my conclusions. Observations derived from the reviews were
communicated to the CAG through Audit Observation Memoranda (AOM).
The responses obtained on the AOM were evaluated and, where necessary,
incorporated in this report.
REPORT of the AUDITOR–GENERAL on the PUBLIC ACCOUNTS OF GHANA (CONSOLIDATED FUND)
FOR THE YEAR ENDED 31 DECEMBER 2015 3
6. I wish to state that the matters raised in this report were the significant
issues noted during the audit. The audit was directed primarily at giving an
opinion on the Financial Statements of the Public Accounts (Consolidated
Fund) for the year ended 31 December 2015. As a result, comments on systems
and internal controls in this report may not be exhaustive.
7. Mr Speaker, pursuant to Section 15 of Act 584, my office has reviewed
the annual financial statements on the Public Accounts of Ghana for the year
ended 31 December 2015. In compliance with Section 44(1) of Act 654 and
Section 23 of the Audit Service Act, 2000 (Act 584), I hereby present my report
on the Financial Statements for the year ended 31 December 2015.
REPORT of the AUDITOR–GENERAL on the PUBLIC ACCOUNTS OF GHANA (CONSOLIDATED FUND)
FOR THE YEAR ENDED 31 DECEMBER 2015 4
Summary of significant findings and recommendations
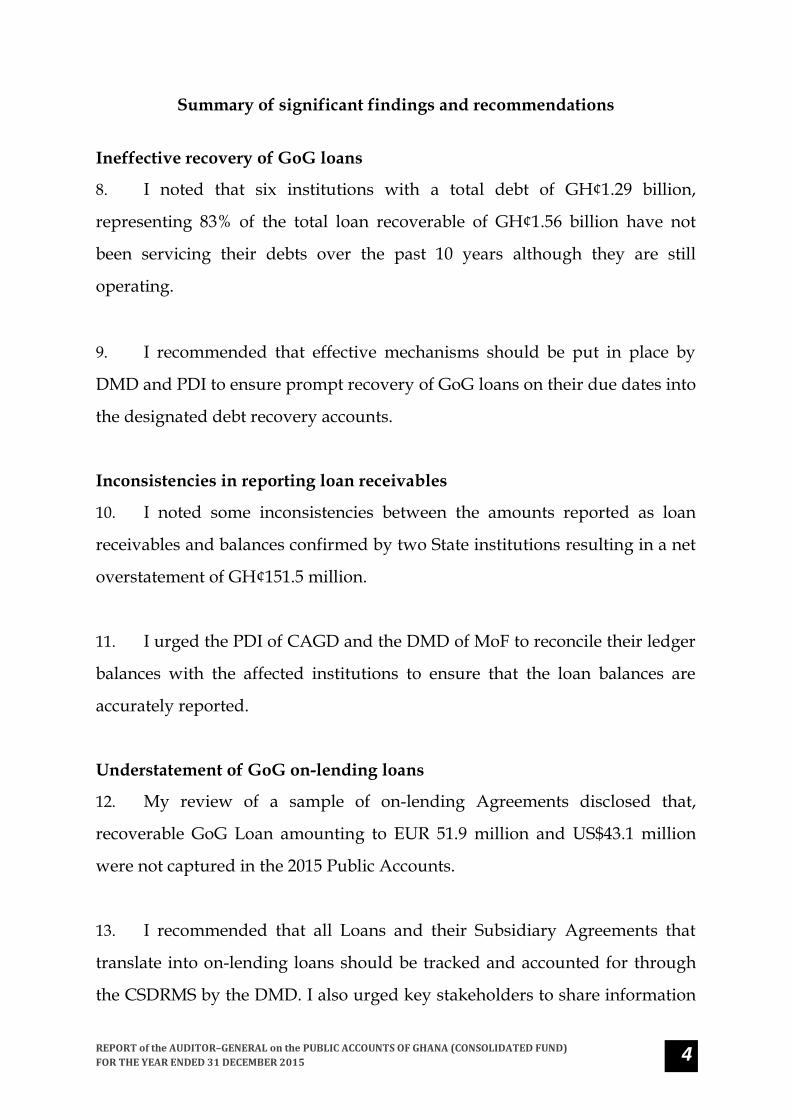
Ineffective recovery of GoG loans
8. I noted that six institutions with a total debt of GH¢1.29 billion,
representing 83% of the total loan recoverable of GH¢1.56 billion have not
been servicing their debts over the past 10 years although they are still
operating.
9. I recommended that effective mechanisms should be put in place by
DMD and PDI to ensure prompt recovery of GoG loans on their due dates into
the designated debt recovery accounts.
Inconsistencies in reporting loan receivables
10. I noted some inconsistencies between the amounts reported as loan
receivables and balances confirmed by two State institutions resulting in a net
overstatement of GH¢151.5 million.
11. I urged the PDI of CAGD and the DMD of MoF to reconcile their ledger
balances with the affected institutions to ensure that the loan balances are
accurately reported.
Understatement of GoG on-lending loans
12. My review of a sample of on-lending Agreements disclosed that,
recoverable GoG Loan amounting to EUR 51.9 million and US$43.1 million
were not captured in the 2015 Public Accounts.
13. I recommended that all Loans and their Subsidiary Agreements that
translate into on-lending loans should be tracked and accounted for through
the CSDRMS by the DMD. I also urged key stakeholders to share information
REPORT of the AUDITOR–GENERAL on the PUBLIC ACCOUNTS OF GHANA (CONSOLIDATED FUND)
FOR THE YEAR ENDED 31 DECEMBER 2015 5
relating to these facilities and perform periodic reconciliation on all on-
lending loans.
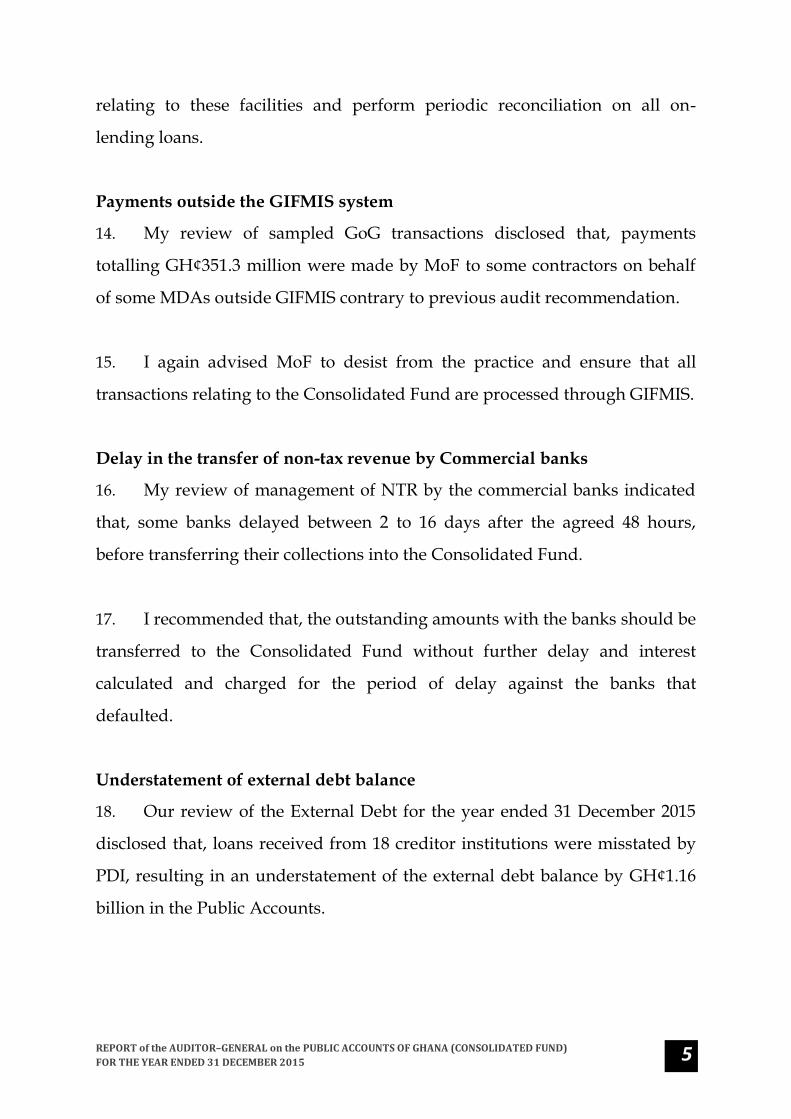
Payments outside the GIFMIS system
14. My review of sampled GoG transactions disclosed that, payments
totalling GH¢351.3 million were made by MoF to some contractors on behalf
of some MDAs outside GIFMIS contrary to previous audit recommendation.
15. I again advised MoF to desist from the practice and ensure that all
transactions relating to the Consolidated Fund are processed through GIFMIS.
Delay in the transfer of non-tax revenue by Commercial banks
16. My review of management of NTR by the commercial banks indicated
that, some banks delayed between 2 to 16 days after the agreed 48 hours,
before transferring their collections into the Consolidated Fund.
17. I recommended that, the outstanding amounts with the banks should be
transferred to the Consolidated Fund without further delay and interest
calculated and charged for the period of delay against the banks that
defaulted.
Understatement of external debt balance
18. Our review of the External Debt for the year ended 31 December 2015
disclosed that, loans received from 18 creditor institutions were misstated by
PDI, resulting in an understatement of the external debt balance by GH¢1.16
billion in the Public Accounts.

REPORT of the AUDITOR–GENERAL on the PUBLIC ACCOUNTS OF GHANA (CONSOLIDATED FUND)
FOR THE YEAR ENDED 31 DECEMBER 2015 6
19. I recommended that, DMD should regularly communicate the updates
of the External Debt receipts and balances to PDI and also urged CAG to
restate the External Debt balance to reflect the true Debt position of the State.
Delays in crediting budget support receipts
20. I noted that BoG delayed for over 26 months before crediting the CF
with GBP 3,691,430 it received on behalf of Government from the UK
Government for the Ghana Poverty Reduction Budget Support Capacity
Building.
21. I urged CAGD to constantly monitor its accounts with BoG to ensure
that donor Budget support inflows are promptly credited to the CF.

REPORT of the AUDITOR–GENERAL on the PUBLIC ACCOUNTS OF GHANA (CONSOLIDATED FUND)
FOR THE YEAR ENDED 31 DECEMBER 2015 7
DETAILS OF FINDINGS AND RECOMMENDATIONS
Ineffective recovery of GoG loans
22. My review of the 2015 Public Accounts showed an amount of
GH¢1,558,170,259.00 as balance on GoG Loan recoverable. I noted that, the
loans have been non-performing because some of the Debtors are defunct
State Owned Enterprises (SOEs) and liquidated companies.
23. I however, observed that the six institutions listed below, with a total
debt of GH¢1,285,555,385.00, representing 83% of the total loan recoverable of
GH¢1,558,170,259.00 have not been servicing their debts over the past 10 years
although they are still operating.
24. I also observed from the MoF records that though some recoveries were
made from the VRA, GWCL and ECG, these were not communicated to
CAGD to update their ledgers, as reflected in the table below.
No. Debtor Company Amount (GH¢)
Amount Paid (GH¢)
Outstanding Balance (GH¢)
Unreflected recoveries (GH¢)
1. Volta River Authority 218,470,000 Nil 218,470,000 100,000
2. Ghana Water Co. Ltd. 118,833,339 Nil 118,333,339 3,504,538
3. Electricity Co. Ltd 180,599,000 2,000,000 178,599,000 2,000,000
4. Tema Oil Refinery 70,704,016 Nil 70,704,016 -
5. Ghana National Petroleum
10,870,959 Nil 10,870,959 -
6. Vodafone 686,578,071 Nil 686,578,071 -
Total 1,285,555,385 1,283,555,385
25. Considering the poor rate of recovery, I am of the view that MoF and
CAGD are not managing these loans properly.
26. The incidence of non-performing Loans affects the ability of GoG to
extend loan facilities to other SOEs to enable them expand and improve their
operations.
REPORT of the AUDITOR–GENERAL on the PUBLIC ACCOUNTS OF GHANA (CONSOLIDATED FUND)
FOR THE YEAR ENDED 31 DECEMBER 2015 8
27. I recommended that effective mechanisms should be put in place by
DMD and PDI to ensure prompt recovery of GoG Loans on their due dates
into the designated debt recovery accounts.
Management response
28. CAG indicated that a Committee has been set up to reconcile and
recover all government receivables. The amounts owed by defunct companies
are being compiled for possible write-off.
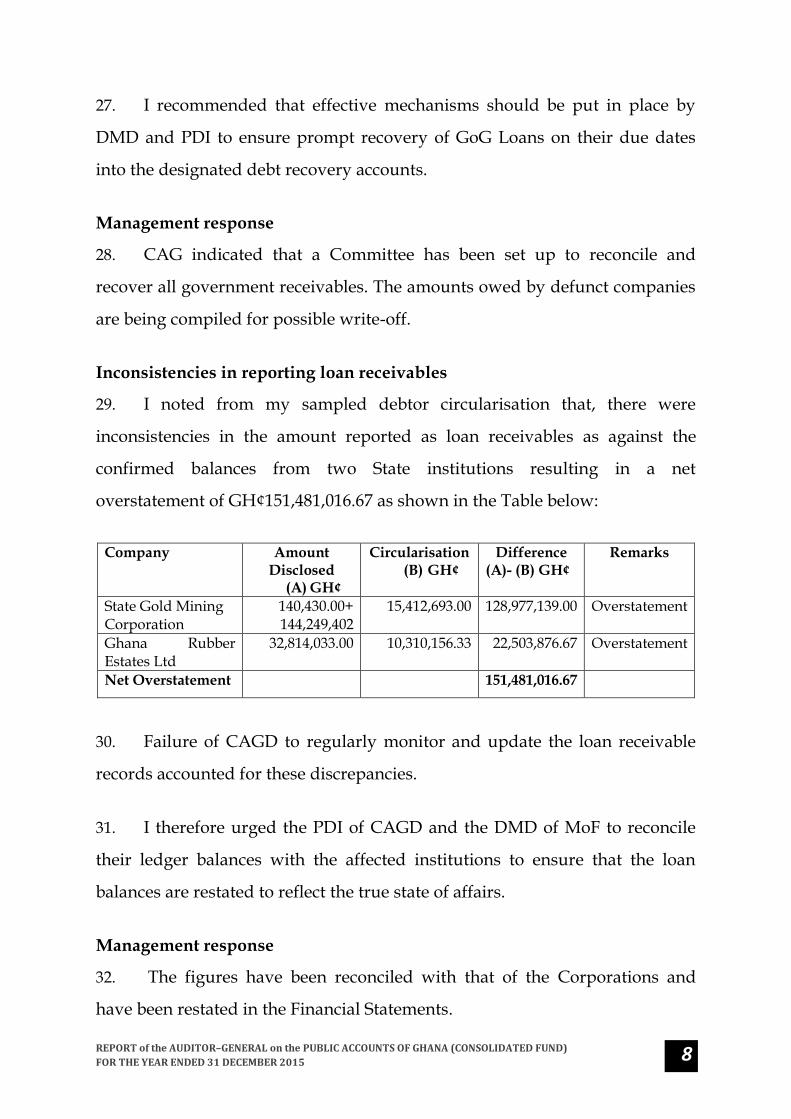
Inconsistencies in reporting loan receivables
29. I noted from my sampled debtor circularisation that, there were
inconsistencies in the amount reported as loan receivables as against the
confirmed balances from two State institutions resulting in a net
overstatement of GH¢151,481,016.67 as shown in the Table below:
Company Amount
Disclosed (A) GH¢
Circularisation (B) GH¢
Difference (A)- (B) GH¢
Remarks
State Gold Mining Corporation
140,430.00+ 144,249,402
15,412,693.00 128,977,139.00 Overstatement
Ghana Rubber Estates Ltd
32,814,033.00 10,310,156.33 22,503,876.67 Overstatement
Net Overstatement 151,481,016.67
30. Failure of CAGD to regularly monitor and update the loan receivable
records accounted for these discrepancies.
31. I therefore urged the PDI of CAGD and the DMD of MoF to reconcile
their ledger balances with the affected institutions to ensure that the loan
balances are restated to reflect the true state of affairs.
Management response
32. The figures have been reconciled with that of the Corporations and
have been restated in the Financial Statements.

REPORT of the AUDITOR–GENERAL on the PUBLIC ACCOUNTS OF GHANA (CONSOLIDATED FUND)
FOR THE YEAR ENDED 31 DECEMBER 2015 9
33. Our checks disclosed that the figures have not been restated.
Understatement of GoG on-lending loans
34. GoG embarked on a number of on-lending facilities in the form of Loan
to Loan and Grant to Loan aimed at bailing-out State Own Enterprises and
boosting growth in the private sector.
35. In practice, DMD of the MoF captures and reports all the On-lending
loans to beneficiary Institutions on the CS-DRMS based on signed
Agreements. The PDI of CAGD is to receive copies of these Agreements and
maintain a ledger on these on-lending loans to track recovery and report in
the Public Accounts as required by Regulations 134 and 138 of the FAR, 2004.
36. My sample review of these Agreements disclosed that due to failure on
the part of PDI unit of CAGD to monitor and track these facilities, recoverable
GoG Loan amounting to EUR 51,933,855 and US$43,120,000 were not captured
in the 2015 Public Accounts. Details of the on-lending loans are shown below:
No. Source of Loan Date
Signed Beneficiary Institutions
Amount (USD)
Amount (EUR) Purpose
1.
Italian Government Phase 1 2003
29 Small and Medium Enterprises
10,000,000
Ghana Private Sector Development
2.
Italian Government Phase 2 2007
26 Small and Medium Enterprises
10,000,000
Ghana Private Sector Development
3.
Italian Government Phase 2 2007
9 Small and Medium Enterprises
10,000,000
Ghana Private Sector Development
4.
International Development Association 2005
Volta River Authority
43,120,000
-
Coastal Transmission backbone Project
5. KfW-Germany 2012 5 PFI-Farmer groups
10,000,000 Outgrower value chain facility
6. KBC Bank 2015 GRIDCO
11,933,885
For the Kpando-Kadjebi transmission line development
Total
43,120,00
0 51,933,855
REPORT of the AUDITOR–GENERAL on the PUBLIC ACCOUNTS OF GHANA (CONSOLIDATED FUND)
FOR THE YEAR ENDED 31 DECEMBER 2015 10
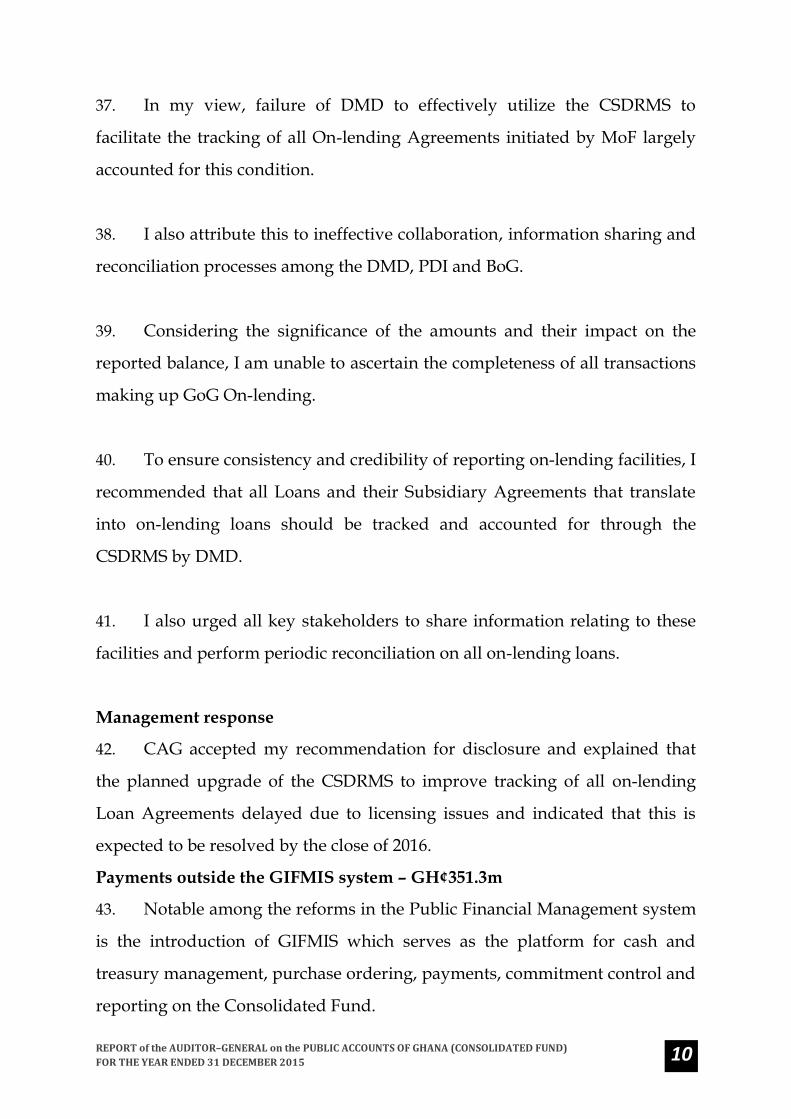
37. In my view, failure of DMD to effectively utilize the CSDRMS to
facilitate the tracking of all On-lending Agreements initiated by MoF largely
accounted for this condition.
38. I also attribute this to ineffective collaboration, information sharing and
reconciliation processes among the DMD, PDI and BoG.
39. Considering the significance of the amounts and their impact on the
reported balance, I am unable to ascertain the completeness of all transactions
making up GoG On-lending.
40. To ensure consistency and credibility of reporting on-lending facilities, I
recommended that all Loans and their Subsidiary Agreements that translate
into on-lending loans should be tracked and accounted for through the
CSDRMS by DMD.
41. I also urged all key stakeholders to share information relating to these
facilities and perform periodic reconciliation on all on-lending loans.
Management response
42. CAG accepted my recommendation for disclosure and explained that
the planned upgrade of the CSDRMS to improve tracking of all on-lending
Loan Agreements delayed due to licensing issues and indicated that this is
expected to be resolved by the close of 2016.
Payments outside the GIFMIS system – GH¢351.3m
43. Notable among the reforms in the Public Financial Management system
is the introduction of GIFMIS which serves as the platform for cash and
treasury management, purchase ordering, payments, commitment control and
reporting on the Consolidated Fund.

REPORT of the AUDITOR–GENERAL on the PUBLIC ACCOUNTS OF GHANA (CONSOLIDATED FUND)
FOR THE YEAR ENDED 31 DECEMBER 2015 11
44. I however, noted that GoG continued to transact business outside the
GIFMIS platform despite my audit recommendation in 2014 and the assurance
of CAG to discontinue the practice.
45. My review of sampled GoG transactions showed that, payments
totalling GH¢351,347,884.09 were made by MoF to some contractors on behalf
of six MDAs outside GIFMIS. Details are shown in the table below:
MDA Amount (GH¢)
Ghana Highway Authority 60,870,343.53
Department of Feeder Roads 54,714,651.63
Department of Urban Roads 75,543,566.60
Office of Government Machinery 29,370,784.90
Ministry of Water Resources Works and Housing
80,583,767.11
Ministry of Power 50,264,770.32 Total 351,347,884.09
46. In view of this I could not confirm the completeness of the transactions
disclosed in the Consolidated Fund considering the materiality of the
payments involved.
47. To avoid budget overruns, I again advise MoF to desist from the
practice and ensure that all transactions relating to the Consolidated Fund are
processed through the GIFMIS System.
Management response
48. The CAG explained that the business processes under the GIFMIS
recognizes two ways of making payments on the platform. The ex-Ante
method where transactions are directly processed on the system using the
Procure to Pay business process and the ex-Post method where transactions
are paid and subsequently journalized into GIFMIS.

REPORT of the AUDITOR–GENERAL on the PUBLIC ACCOUNTS OF GHANA (CONSOLIDATED FUND)
FOR THE YEAR ENDED 31 DECEMBER 2015 12
49. CAG added that as the GIFMIS is still at its developmental stage, it is
not practicable to process all transactions ex-Ante hence the use of ex-Post for
the stated transactions but indicated that systems are being developed to
minimize the use of the ex-Post method and eventually deploy the ex-Ante
approach to cover all transactions.
Audit position
50. I am of the opinion that as all MDAs have been fully deployed on the
GIFMIS and the payments noted above were not payments for emergencies,
there is no reasonable excuse for processing payments outside the system.
Delay in the transfer of non-tax revenue by commercial banks
51. In order to improve the system and accounting for collection of Non-tax
revenue from the MDAs, MoF has signed agreements with some commercial
banks to provide on-site banking services to these Institutions. Per the
agreement, the commercial banks are to lodge collections into the Institutions’
Non-tax Revenue Holding accounts with Bank of Ghana within 48 hours.
52. My review of management of NTR by the commercial banks indicated
that, a total amount of GH¢4,553,469.51 collected and paid into the transit
accounts with Eco-Bank and Fidelity Bank were not transferred to BoG within
the 48 hours deadline.
53. I noted that the banks delayed between 2 to 16 days after the agreed 48
hours, before transferring their collections into the Consolidated Fund. Details
are shown below.

REPORT of the AUDITOR–GENERAL on the PUBLIC ACCOUNTS OF GHANA (CONSOLIDATED FUND)
FOR THE YEAR ENDED 31 DECEMBER 2015 13
Delays in transfer of NTR
MDA Period Collected
Date Transferred
Amount (GH¢)
Days Delayed Bank
DVLA 30/12/2014 5/1/2015 127,185.00 3 Eco-Bank
31/12/2014 6/1/2015 74,611.30 3 Eco-Bank
2/1/2015 7/1/2015 150,256.20 3 Eco-Bank
24/12/2014 7/1/2015 3,638.00 12 Eco-Bank
22/12/2014 7/1/2015 5,784.25 12 Eco-Bank
8/1/2015 14/1/2015 72,556.00 5 Eco-Bank
14/1/2015 20/01/2015 63,427.00 3 Eco-Bank
26/1/2015 30/1/2015 18,207.00 3 Eco-Bank
5/2/2015 11/2/2015 53,504.10 3 Eco-Bank
6/2/2015 11/2/2015 43,606.70 4 Eco-Bank
12/2/2015 17/2/2015 41,146.83 4 Eco-Bank
2/10/2015 20/2/2015 6,264.00 16 Eco-Bank
20/02/2015 27/2/2015 7,735.00 5 Eco-Bank
26/02/2015 3/3/2015 47,368.00 4 Eco-Bank
27/02/2015 4/3/2015 48,006.30 3 Eco-Bank
4/3/2015 10/3/2015 47,004.15 4 Eco-Bank
5/3/2015 11/3/2015 56,614.00 3 Eco-Bank
12/3/2015 17/3/2015 50,717.80 3 Eco-Bank
2/1/2015 18/1/2015 40,009.00 16 Eco-Bank
Registrar General 2/01/2015 19/1/2015 43,452.51 16 Fidelity Bank
21/01/2015 2/2/2015 72,289.31 12 Fidelity Bank
2/2/2015 9/2/2015 97,538.99 6 Fidelity Bank
19/02/2015 25/02/2015 139,299.78 5 Fidelity Bank
26/02/2015 9/3/2015 2,746,494.31 10 Fidelity Bank
2/4/2015 7/4/2015 81,189.91 4 Fidelity Bank
8/5/2015 15/05/2015 59,188.04 5 Fidelity Bank
1/6/2015 5/6/2015 85,416.81 4 Fidelity Bank
5/6/2015 10/6/2015 58,686.36 4 Fidelity Bank
10/6/2015 17/06/2015 74,663.18 6 Fidelity Bank
18/08/2015 26/08/2015 137,609.68 6 Fidelity Bank
4,553,469.51
54. I also noted that, two Banks failed to transfer a total amount of
GH¢993,194.62 collected on behalf of Veterinary Services Division at the end
of the 2015 financial year. The table below shows the details.
MDA Commercial Bank
Amount Collected
(GH¢)
Amount Transferred
(GH¢)
Outstanding Amount (GH¢)
Veterinary Services GCB 1,367,386.40 858,437.40 508,949.00
Veterinary Services HFC 2,162,059.22 1,677,813.60 484,245.62
Total 3,529,445.62 2,536,251.00 993,194.62
REPORT of the AUDITOR–GENERAL on the PUBLIC ACCOUNTS OF GHANA (CONSOLIDATED FUND)
FOR THE YEAR ENDED 31 DECEMBER 2015 14
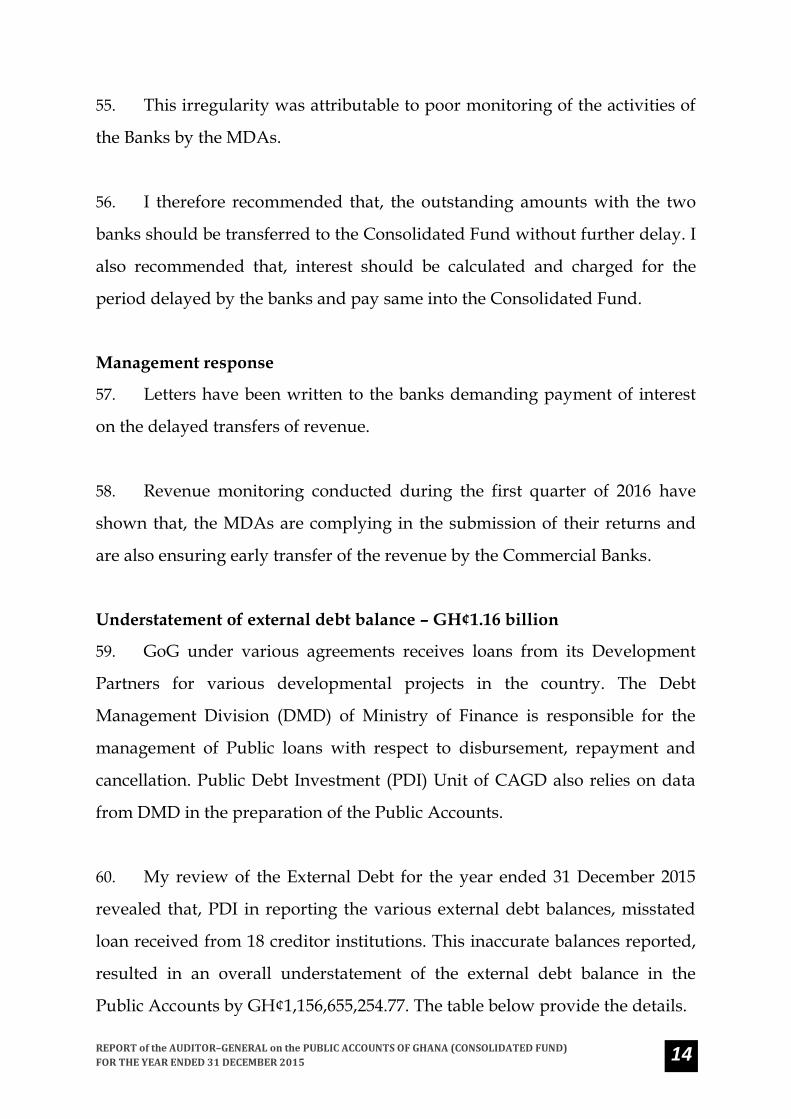
55. This irregularity was attributable to poor monitoring of the activities of
the Banks by the MDAs.
56. I therefore recommended that, the outstanding amounts with the two
banks should be transferred to the Consolidated Fund without further delay. I
also recommended that, interest should be calculated and charged for the
period delayed by the banks and pay same into the Consolidated Fund.
Management response
57. Letters have been written to the banks demanding payment of interest
on the delayed transfers of revenue.
58. Revenue monitoring conducted during the first quarter of 2016 have
shown that, the MDAs are complying in the submission of their returns and
are also ensuring early transfer of the revenue by the Commercial Banks.
Understatement of external debt balance – GH¢1.16 billion
59. GoG under various agreements receives loans from its Development
Partners for various developmental projects in the country. The Debt
Management Division (DMD) of Ministry of Finance is responsible for the
management of Public loans with respect to disbursement, repayment and
cancellation. Public Debt Investment (PDI) Unit of CAGD also relies on data
from DMD in the preparation of the Public Accounts.
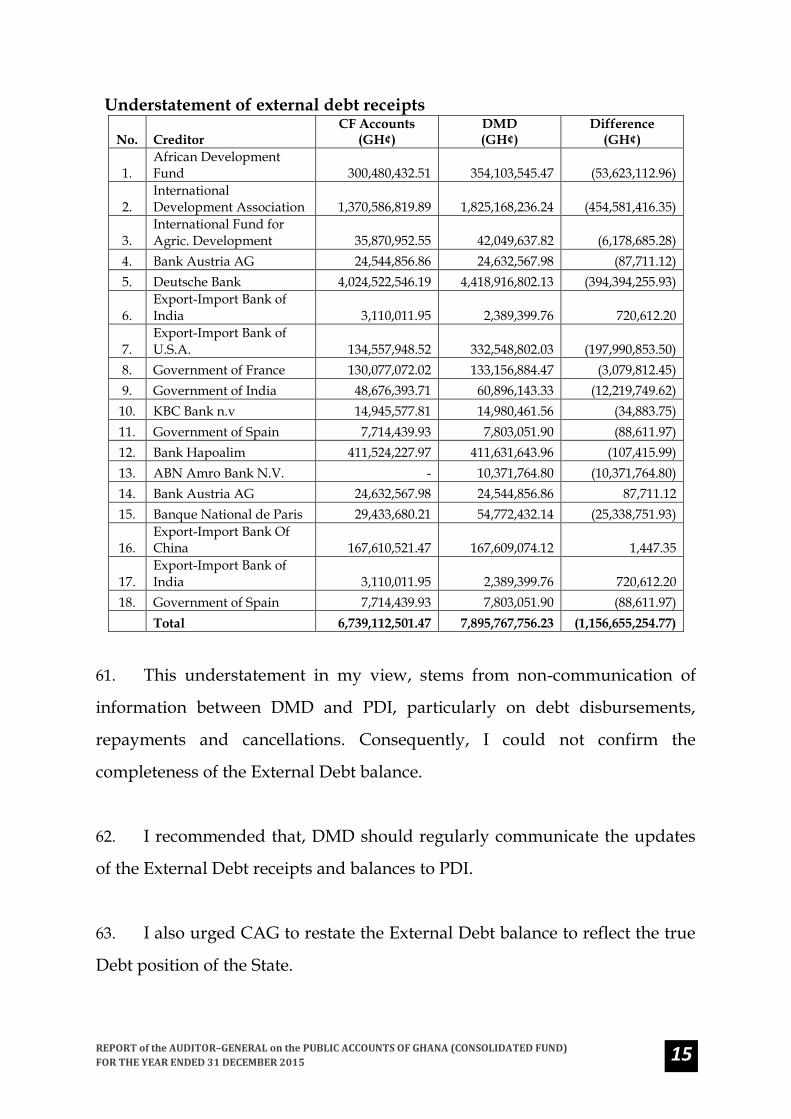
60. My review of the External Debt for the year ended 31 December 2015
revealed that, PDI in reporting the various external debt balances, misstated
loan received from 18 creditor institutions. This inaccurate balances reported,
resulted in an overall understatement of the external debt balance in the
Public Accounts by GH¢1,156,655,254.77. The table below provide the details.
REPORT of the AUDITOR–GENERAL on the PUBLIC ACCOUNTS OF GHANA (CONSOLIDATED FUND)
FOR THE YEAR ENDED 31 DECEMBER 2015 15
Understatement of external debt receipts
No. Creditor CF Accounts
(GH¢) DMD (GH¢)
Difference (GH¢)
1. African Development Fund 300,480,432.51 354,103,545.47 (53,623,112.96)
2. International Development Association 1,370,586,819.89 1,825,168,236.24 (454,581,416.35)
3. International Fund for Agric. Development 35,870,952.55 42,049,637.82 (6,178,685.28)
4. Bank Austria AG 24,544,856.86 24,632,567.98 (87,711.12)
5. Deutsche Bank 4,024,522,546.19 4,418,916,802.13 (394,394,255.93)
6. Export-Import Bank of India 3,110,011.95 2,389,399.76 720,612.20
7. Export-Import Bank of U.S.A. 134,557,948.52 332,548,802.03 (197,990,853.50)
8. Government of France 130,077,072.02 133,156,884.47 (3,079,812.45)
9. Government of India 48,676,393.71 60,896,143.33 (12,219,749.62)
10. KBC Bank n.v 14,945,577.81 14,980,461.56 (34,883.75)
11. Government of Spain 7,714,439.93 7,803,051.90 (88,611.97)
12. Bank Hapoalim 411,524,227.97 411,631,643.96 (107,415.99)
13. ABN Amro Bank N.V. - 10,371,764.80 (10,371,764.80)
14. Bank Austria AG 24,632,567.98 24,544,856.86 87,711.12
15. Banque National de Paris 29,433,680.21 54,772,432.14 (25,338,751.93)
16. Export-Import Bank Of China 167,610,521.47 167,609,074.12 1,447.35
17. Export-Import Bank of India 3,110,011.95 2,389,399.76 720,612.20
18. Government of Spain 7,714,439.93 7,803,051.90 (88,611.97)
Total 6,739,112,501.47 7,895,767,756.23 (1,156,655,254.77)
61. This understatement in my view, stems from non-communication of
information between DMD and PDI, particularly on debt disbursements,
repayments and cancellations. Consequently, I could not confirm the
completeness of the External Debt balance.
62. I recommended that, DMD should regularly communicate the updates
of the External Debt receipts and balances to PDI.
63. I also urged CAG to restate the External Debt balance to reflect the true
Debt position of the State.
REPORT of the AUDITOR–GENERAL on the PUBLIC ACCOUNTS OF GHANA (CONSOLIDATED FUND)
FOR THE YEAR ENDED 31 DECEMBER 2015 16
Management response
64. The figures stated in the Public Accounts of 2015 are the reconciled
figures between CAGD and MoF as at the 31st December, 2015 per MoF Letter
with reference DMD/CAGD/2016/01 dated 8th February, 2016.
65. The differences observed by the Auditor may be as a result of updates
done by DMD after 31st December, 2015 because the CS-DRMS reports are on
real time basis.
Audit position
66. The transactions that resulted in the understatement occurred before 31
December 2015, but DMD of MoF delayed in the updates of the CS-DRMS
with those transactions. As per Generally Accepted Accounting Practice
(GAAP), accounting transactions that occurred before the year end and has
impact on the reported account balance shall be adjusted in the Financial
Statements.
Delays in crediting budget support receipts
67. The Government of Ghana had a Memorandum of Understanding
(MoU) with the United Kingdom (UK) in which the UK government agreed to
provide six million pounds sterling for the Ghana Poverty Reduction Budget
Support Capacity Building, to be disbursed from 2006 to 2008.
68. In line with the MoU, the UK government through HSBC Bank PLC
remitted GBP 3,691,430 to BoG on 19 March 2013.
69. I noted that BoG held on till 30 June 2015, before notifying CAG of
receipt of the amount and indicated that the recipient account had been closed
REPORT of the AUDITOR–GENERAL on the PUBLIC ACCOUNTS OF GHANA (CONSOLIDATED FUND)
FOR THE YEAR ENDED 31 DECEMBER 2015 17
since August 2010. The CF was eventually credited with the amount on 9
September 2015 after a period of 26 months’ delay.
70. I urged CAGD to constantly monitor its accounts with BoG to ensure
that donor Budget support inflows are promptly credited to the CF.
Management response
71. CAGD has been monitoring its bank account. The delay was due to
BoG’s failure to communicate receipt of the money on time. CAGD, MoF and
BoG are improving collaboration to avert future occurrences.
Follow-up on recommendations from previous audit report
72. We followed up on action taken on recommendations in previous audit
reports, the results of which are attached.
REPORT of the AUDITOR–GENERAL on the PUBLIC ACCOUNTS OF GHANA (CONSOLIDATED FUND)
FOR THE YEAR ENDED 31 DECEMBER 2015 18
FINANCIAL ANALYSIS
Revenue
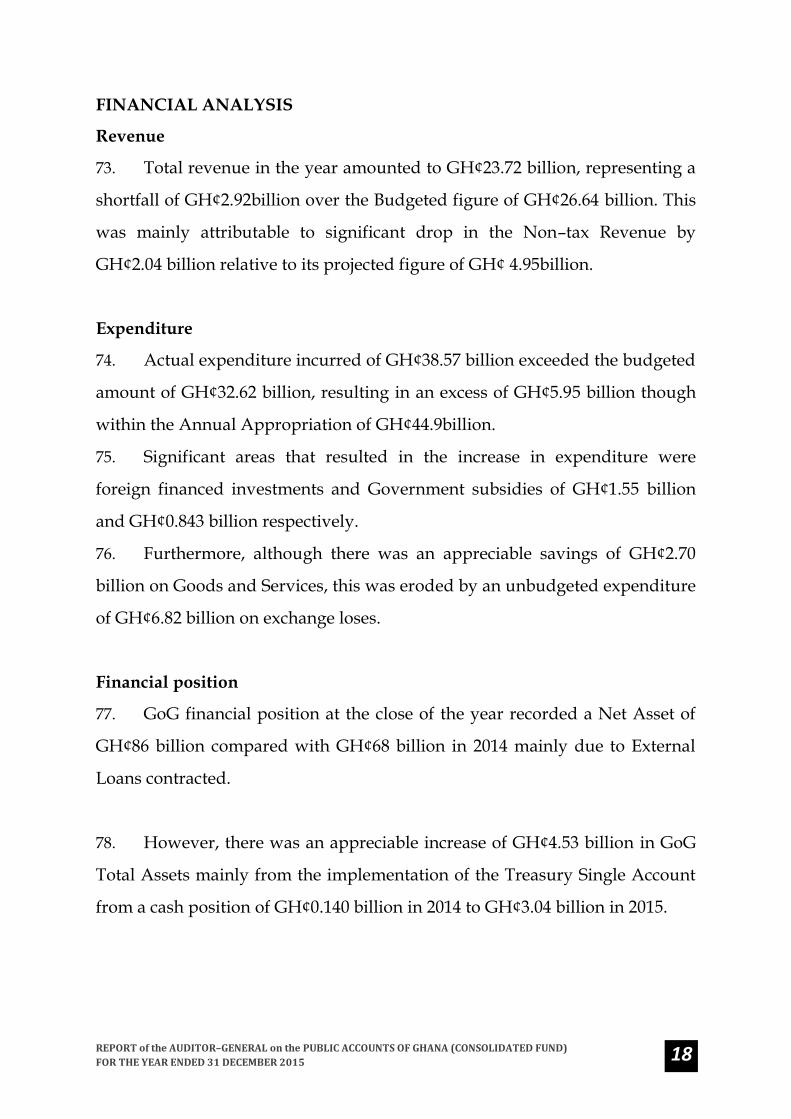
73. Total revenue in the year amounted to GH¢23.72 billion, representing a
shortfall of GH¢2.92billion over the Budgeted figure of GH¢26.64 billion. This
was mainly attributable to significant drop in the Non–tax Revenue by
GH¢2.04 billion relative to its projected figure of GH¢ 4.95billion.
Expenditure
74. Actual expenditure incurred of GH¢38.57 billion exceeded the budgeted
amount of GH¢32.62 billion, resulting in an excess of GH¢5.95 billion though
within the Annual Appropriation of GH¢44.9billion.
75. Significant areas that resulted in the increase in expenditure were
foreign financed investments and Government subsidies of GH¢1.55 billion
and GH¢0.843 billion respectively.
76. Furthermore, although there was an appreciable savings of GH¢2.70
billion on Goods and Services, this was eroded by an unbudgeted expenditure
of GH¢6.82 billion on exchange loses.
Financial position
77. GoG financial position at the close of the year recorded a Net Asset of
GH¢86 billion compared with GH¢68 billion in 2014 mainly due to External
Loans contracted.
78. However, there was an appreciable increase of GH¢4.53 billion in GoG
Total Assets mainly from the implementation of the Treasury Single Account
from a cash position of GH¢0.140 billion in 2014 to GH¢3.04 billion in 2015.
REPORT of the AUDITOR–GENERAL on the PUBLIC ACCOUNTS OF GHANA (CONSOLIDATED FUND)
FOR THE YEAR ENDED 31 DECEMBER 2015 19
Audit opinion
79. I have audited the Statement of Assets and Liabilities of the CF as at 31
December 2015 and the Summary Statement of Receipts and Payments of the
CF, Statement of Revenue and Expenditure and Cash Flow Statement for the
year then ended shown on pages 20 to 24 of the 2015 Financial Statements of
the Public Accounts.
80. These statements have been prepared under the historical cost
convention on the basis of the accounting policies set out on pages 3 to 8 of the
financial statements of the Public Accounts.
Responsibility of the Controller and Accountant-General
81. Section 41 of the FAA requires the CAG to prepare and present to the
Auditor–General in respect of the financial year, the public accounts on the
Consolidated Fund which shall comprise a balance sheet; a statement of
revenue and expenditure; a cash flow statement; and notes that form part of
the accounts.
Auditor-General’s responsibility
82. Article 187(2) of the 1992 Constitution, Section 44(1) of FAA and Section
11 of the Audit Service Act 2000, (Act 584) require the Auditor-General to
audit and report on the public accounts of Ghana. It is therefore, the
responsibility of the Auditor-General to express an independent opinion on
the financial statements of the CF.
83. I give my opinion as to whether proper books of account have been
maintained by the CAG and whether the financial statements are in
agreement therewith and comply with the requirements of the FAA and
present fairly, the financial position of the CF as at 31 December 2015 and
REPORT of the AUDITOR–GENERAL on the PUBLIC ACCOUNTS OF GHANA (CONSOLIDATED FUND)
FOR THE YEAR ENDED 31 DECEMBER 2015 20
whether the results of its operations, cash flow and financial requirements for
the year then ended are in accordance with the stated accounting policies of
Government and comply with the relevant legislations.
Basis of opinion
84. I conducted the audit in accordance with generally accepted auditing
standards and the auditing standards of the International Organisation of
Supreme Audit Institutions (INTOSAI). An audit includes examination, on a
test basis, of evidence relevant to the amounts, disclosures and regularity of
financial transactions included in the financial statements. It also includes an
assessment of significant estimates and judgements made by the CAG in the
preparation of the financial statements.
85. I planned and performed my audit so as to obtain all the information
and explanations which I considered necessary to provide me with sufficient
evidence to give reasonable assurance that the financial statements are free
from material misstatements, whether caused by error, fraud or any other
irregularity and that, in all material respects, the expenditure and income
have been applied to the purposes intended by Parliament, and the financial
transactions conform to the authorities which govern them.
86. In forming my opinion, I also evaluated the overall adequacy of the
presentation of information in the financial statements. I believe that my audit
provides a reasonable basis for the audit opinion.
Opinion
87. Basis of my qualification:
a. Understatement of external debt balance
b. Understatement of GoG on-lending loans

REPORT of the AUDITOR–GENERAL on the PUBLIC ACCOUNTS OF GHANA (CONSOLIDATED FUND)
FOR THE YEAR ENDED 31 DECEMBER 2015 21
88. In my opinion, except for the above reservations, the accounts present
fairly, in all material respects, the financial position of the Consolidated Fund
as at 31 December 2015; and of the results of its operations and cash flows for
the year then ended in accordance with the stated accounting policies of
Government.
Acknowledgement
89. I gratefully acknowledge the cooperation and assistance accorded the
audit team by key personnel of MoF and CAGD during the audit. I also
acknowledge the efforts and commitment of my staff in conducting the audit.
RICHARD Q. QUARTEY AUDITOR-GENERAL
REPORT of the AUDITOR–GENERAL on the PUBLIC ACCOUNTS OF GHANA (CONSOLIDATED FUND)
FOR THE YEAR ENDED 31 DECEMBER 2015 22
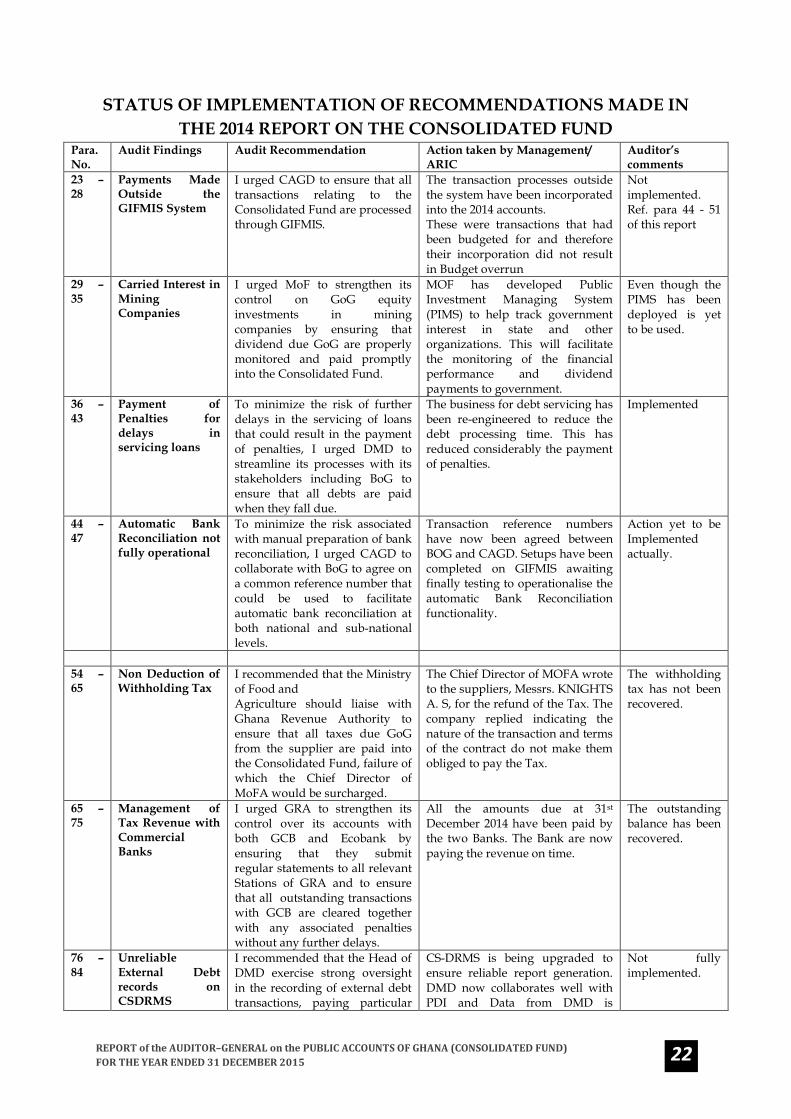
STATUS OF IMPLEMENTATION OF RECOMMENDATIONS MADE IN
THE 2014 REPORT ON THE CONSOLIDATED FUND Para. No.
Audit Findings Audit Recommendation Action taken by Management/ ARIC
Auditor’s comments
23 – 28
Payments Made Outside the GIFMIS System
I urged CAGD to ensure that all transactions relating to the Consolidated Fund are processed through GIFMIS.
The transaction processes outside the system have been incorporated into the 2014 accounts. These were transactions that had been budgeted for and therefore their incorporation did not result in Budget overrun
Not implemented. Ref. para 44 - 51 of this report
29 – 35
Carried Interest in Mining Companies
I urged MoF to strengthen its control on GoG equity investments in mining companies by ensuring that dividend due GoG are properly monitored and paid promptly into the Consolidated Fund.
MOF has developed Public Investment Managing System (PIMS) to help track government interest in state and other organizations. This will facilitate the monitoring of the financial performance and dividend payments to government.
Even though the PIMS has been deployed is yet to be used.
36 – 43
Payment of Penalties for delays in servicing loans
To minimize the risk of further delays in the servicing of loans that could result in the payment of penalties, I urged DMD to streamline its processes with its stakeholders including BoG to ensure that all debts are paid when they fall due.
The business for debt servicing has been re-engineered to reduce the debt processing time. This has reduced considerably the payment of penalties.
Implemented
44 – 47
Automatic Bank Reconciliation not fully operational
To minimize the risk associated with manual preparation of bank reconciliation, I urged CAGD to collaborate with BoG to agree on a common reference number that could be used to facilitate automatic bank reconciliation at both national and sub-national levels.
Transaction reference numbers have now been agreed between BOG and CAGD. Setups have been completed on GIFMIS awaiting finally testing to operationalise the automatic Bank Reconciliation functionality.
Action yet to be Implemented actually.
54 – 65
Non Deduction of Withholding Tax
I recommended that the Ministry of Food and Agriculture should liaise with Ghana Revenue Authority to ensure that all taxes due GoG from the supplier are paid into the Consolidated Fund, failure of which the Chief Director of MoFA would be surcharged.
The Chief Director of MOFA wrote to the suppliers, Messrs. KNIGHTS A. S, for the refund of the Tax. The company replied indicating the nature of the transaction and terms of the contract do not make them obliged to pay the Tax.
The withholding tax has not been recovered.
65 – 75
Management of Tax Revenue with Commercial Banks
I urged GRA to strengthen its control over its accounts with both GCB and Ecobank by ensuring that they submit regular statements to all relevant Stations of GRA and to ensure that all outstanding transactions with GCB are cleared together with any associated penalties without any further delays.
All the amounts due at 31st December 2014 have been paid by the two Banks. The Bank are now paying the revenue on time.
The outstanding balance has been recovered.
76 – 84
Unreliable External Debt records on CSDRMS
I recommended that the Head of DMD exercise strong oversight in the recording of external debt transactions, paying particular
CS-DRMS is being upgraded to ensure reliable report generation. DMD now collaborates well with PDI and Data from DMD is
Not fully implemented.

REPORT of the AUDITOR–GENERAL on the PUBLIC ACCOUNTS OF GHANA (CONSOLIDATED FUND)
FOR THE YEAR ENDED 31 DECEMBER 2015 23
attention to prompt update of the CSDRMS and regular reconciliation with lending institutions. I also urged PDI to collaborate with DMD to clean the external debt schedule.
reconciled before incorporation into the accounts.
89 -93 Delays in the transfer of Accrued GETFund
To ensure that the operations of GETFund are not stifled due to financial constraints, I urged MoF to ensure compliance.
Although Amount Due in 2015 has been paid. There are still some 2014 outstanding GETFUND.
94 – 98
Late Transfers into DACF
To ensure that the District Assemblies have access to funds for their developmental activities, I urged the Ministry of Finance to issue instructions for the transfer of the outstanding amount in compliance with Act 455.
Although Amount Due in 2015 has been paid. There are still some 2014 outstanding DACF.
100 – 111
Non Transfer of Non Tax Revenue
I recommended that, MoF and CAGD should ensure that the unpaid NTR totaling GH¢21,296,167.31 is transferred into the appropriate Consolidated Fund account without any further delay. I also recommended that, Ghana Tourism Authority should ensure full compliance with the provisions of the Appropriation and Retention Act by ensuring the transfer of surplus funds into the Consolidated Fund.
Not implemented


TABLE OF CONTENTS
PAGE
ACRONYMS i
CAG'S REPORT ON THE FINANCIAL STATEMENTS 1
FINANCIAL STATEMENTS
STATEMENT OF RECEIPTS AND PAYMENTS 20
STATEMENT OF REVENUE AND EXPENDITURE 21
BALANCE SHEET 22
STATEMENT OF CASH FLOW 23
POLICY 25
NOTES TO THE ACCOUNTS 28
ADDITIONAL STATEMENTS (INDEX) 36-76
ADDITIONAL INFORMATION (INDEX) 77-124

ARIC Audit Report Implementation CommitteeBoG Bank of GhanaCAG Controller and Accountant - GeneralCAGD Controller and Accountant - General’s DepartmentCF Consolidated FundCoA Chart of AccountsDIC Diverstiture Implementation CommitteeDMD Debts Management DivisionEOCO Economic and Organised Crime OfficeEFT Electronic Funds TransferFAA Financial Administration Act, 2003 (Act 654)FAR Financial Administration Regulations, 2004 (LI 1802)FWSC Fair Wages and Salaries CommissionGCB GCB Bank LimitedGCNet Ghana Community NetworkGES Ghana Education ServiceGFS Government Finance StatisticsGHS Ghana Health ServiceGIFMIS Ghana Integrated Financial Management Information SystemGoG Government of GhanaGRA Ghana Revenue AuthorityHIPC Highly Indebted Poor CountriesHRMS Human Resource Management SystemIAAA Internal Audit Agency Act, 2003 (Act 658)ICT Information Communication TechnologyIGF Internally Generated FundIPPD Integrated Personnel and Payroll DatabaseMDAs Ministries, Departments and AgenciesMDBS Multi–Donor Budgetary SupportMDRI Multilateral Debt Relief InitiativeMESTI Ministry of Environment, Science, Technology and InnovationMELR Ministry of Employment and Labour RelationsMFARI Ministry of Foreign Affairs and Regional IntegrationMINT Ministry of the InteriorMLGRD Ministry of Local Government and Rural DevelopmentMLNR Ministry of Lands and Natural ResourcesMMDAs Metropolitan, Municipal and District AssembliesMoC Ministry of CommunicationMCTA Ministry of Chieftaincy and Traditional AffairsMoD Ministry of Defence
ACRONYMS
i
ACRONYMS
MoE Ministry of EducationMoEnP Ministry of Energy and PetroleumMoFA Ministry of Food and AgricultureMoFAD Ministry of Fisheries and Aquaculture DevelopmentMoF Ministry of FinanceMoH Ministry of HealthMoJAG Ministry of Justice and Attorney-GeneralMoRH Ministry of Roads and HighwaysMoT Ministry of TransportMoP Ministry of PowerMoTI Ministry of Trade and IndustryMoGCSP Ministry of Gender, Children and Social ProtectionMoYS Ministry of Youth and SportsMWRWH Ministry of Water Resources, Works and HousingNITA National Information Technology AgencyNHIL National Health Insurance LevyNPT Non - Project TypeOMCs Oil Marketing CompaniesPDI Public Debt and Investment PIA Project Implementation AgencyPPA Public Procurement Act, 2003 (Act 663)PFM Public Financial ManagementPUFMARP Public Financial Management Reforms ProgrammeSSNIT Social Security and National Insurance TrustSSPP Single Spine Pay PolicySIP Social Intervention ProgrammeTRIPS Total Revenue Integrated Processing System TSA Treasury Single AccountNPRA National Pensions Regulatory AuthorityPIMS Public Investment Management SystemBAT Bank Account Tracking SystemSWIFT Society For World wide Inter Bank Tele CommunicationGIIF Ghana Infrastructure and Investment Fund
i

1
REPORT OF THE CONTROLLER AND ACCOUNTANT-GENERAL (CAG) ON THE
PUBLIC ACCOUNTS OFTHE CONSOLIDATED FUND FOR THE YEAR ENDED 31ST
DECEMBER, 2015
1 INTRODUCTION
1.1 Mandate
Section 41(1)(b) of the Financial Administration Act, 2003 (Act 654)(FAA) and
Regulation191 of the Financial Administration Regulations, 2004 (LI 1802)(FAR)
require the Controller and Accountant-General to prepare and transmit to the Auditor-
General and the Minister for Finance (MoF), the Public Accounts (Financial
Statements) on the Consolidated Fund of the Republic of Ghana within a period of
three months after the end of the financial year or such other period as Parliament may
by resolution determine.
The financial statements are prepared on Government business which is regulated by
the financial laws. The authorization to spend and the limit on expenditure are
stipulated in the Appropriation Act for each financial year as required by Article 179
(2) (a) of the 1992 Constitution of the Republic of Ghana.
In addition to the legal requirements, the Financial Statements are to provide a
summary of government’s financial resources and their application for the benefit of
the citizens of Ghana.
1.2 Components of the Financial Statements
The financial statements of the Consolidated Fund comprise:
A Statement of Receipts and Payments
A Statement of Revenue and Expenditure
A Balance Sheet
A Cash Flow Statement
Notes to the Accounts

2
1.3 Additional Statements
In line with Regulation 191 (d) of the FAR, a statement of transactions during the year and
analysis of the financial position at the end of the year for the following accounts are included
in the financial statements
Public Debts
Deposits and Other Trust Monies
Securities of Government
Advances
Public loans (Receivables)
Equity Investments of the Consolidated Fund
Additional information comprising Summary Expenditure of MDAs by items and sectors are
included in the financial statements
1.4 Duties of the Controller And Accountant General (CAG) In accordance with Section 3 of the Financial Administration Act 2003 (Act 654), the Controller and
Accountant General is responsible to the Minister of Finance for the custody, safety and integrity of
the consolidated fund and other public funds designated under CAG’s care.
As a chief accounting officer of Government, the Controller and Accountant General is responsible to
keep, render, and publish statement of public account as required by the afore-mentioned Act. He is
also the chief adviser to the Minister and the Government on accounting matters and approves
accounting instructions of Government departments.
The Controller and Accountant General also manages the payroll on salaries and pensions.
1.5 Scope of the financial statements
In compliance with Section 41(1) (b) of the FAA, the Public Accounts (Financial Statements)
is prepared on the Consolidated Fund only.

3
1.6 Basis of Accounting The 2015 financial statements were prepared in accordance with the stated accounting policies
of the Government of Ghana currently in use as in pages 34 & 35. Efforts are being made to
progressively move towards the accrual basis of the International Public Sector Accounting
Standards (IPSAS).
2 BUDGET FOCUS AND FINANCIAL MANAGEMENT REFORMS
2.1 Budget focus for 2015
In the 2015 budget, Fiscal policy was driven mainly by new tax policy measures, revenue administration
reforms, improved public financial management, expenditure rationalization, and the implementation
of new debt management strategies.
Specific revenue generating measures included Imposition of Special Petroleum Tax of 17.5 percent;
Extension of the National Fiscal Stabilization Levy; special import levy; a 5 percent flat VAT rate on real
estates. Some of the expenditure rationalization actions were, continuation of net freeze policy on
employment (excluding education and health) and non-replacement of separated staff from MDAs,
full implementation of the Electronic Salary Payment Voucher (ESPV) System and price adjustment for
utility tariffs and fuel prices.
Key initiatives for sustainability and efficiency in debt management included continuing with the on-
lending and escrow arrangements to minimize the impact of loans on the public debt portfolio;
financing the capital expenditure component of the annual budget primarily from long-term debt
issuance and initiation of a municipal bonds programme to support credit-worthy MMDAs to access
the domestic capital market to finance commercially viable projects.
3 POLICY INITIATIVES
3.1 Public Financial Management Strategy
In pursuance of improved public financial management, Government has been implementing various
Public Financial Management (PFM) reform initiatives. The 2015 budget statement highlighted reform
initiatives such as the Ghana Integrated Financial Management Information System (GIFMIS), Budget
Reforms including the introduction of Programme-Based Budgeting (PBB) a new Budget Preparation
and Management System, Fiscal Decentralization and Modernization of Revenue Management and
Administration. Progress has been made in all these areas.

4
A PFM strategy has been approved by Cabinet, and processes are underway to prepare a new PFM Bill
to consolidate and codify principles; improve existing processes and ongoing reforms; provide for
comprehensive coverage of public sector loans and guarantees; and clarify the roles of public officers,
Cabinet, Parliament and other stakeholders.
The new PFM Bill will also provide a comprehensive approach to macro-fiscal management, budgeting,
treasury and debt management as well as accounting and reporting for all public funds. The Bill will
also address some of the inconsistencies and gaps in the existing PFM laws. It will provide better
guidance to public sector PFM practitioners and managers, the public and other stakeholders on issues
relating to Government's fiscal policies and budget.
3.2 SYSTEMS IMPROVEMENT
As part of the expenditure rationalization effort, continuous improvement in systems and business
process are being rigorously pursued in the following areas.
Phase 1 of GIFMIS has been concluded in June 2015, and a new Public Financial Management Reform
Project commenced thereafter. This was after the development of a comprehensive PFM Reform
Strategy in April, 2015. The Goal of the strategy is to guide the development of Ghana’s PFM Reforms
going forward.
The new Project is an expansion of GIFMIS and comprises of IFMIS and Payroll management in CAGD
Budget Reforms being implemented by the budget division of the Ministry of Finance; continue the
implementation of HRMIS under the auspices of the Public Service Commission, and support public
sector procurement management through the Public Procurement Authority. The Project also seeks
to strengthen external audit by the Ghana Audit Service and support Parliamentary Service for its
Legislative oversight. Currently the Project is being funded by the World Bank with support from
Government of Ghana. The GRA modernization is also on-going.
3.3 Payroll Management
Seven years into the implementation of the Single Spine Pay Policy (SSPP), particularly the Single Spine
Salary Structure (SSSS), distortions and inequities that characterized public service pay administration
have largely been addressed. The process has also led to the abolition of over 123 different salary
structures and 50 allowances in the Public Service. These have impacted positively on fiscal
management.
Government remains committed to the implementation of the policy and is pursuing measures to
eliminate leakages in the payroll system some of which are as follows:

5
3.3.1 Electronic Salary Payment Voucher (ESPV) system Roll Out
The Electronic Salary Payment Voucher (ESPV) system has now been roll out to all 10 regions to enable
the validation of salaries before payment. It is worth noting that actual saving made through
discontinued employees was Gh₵15,737,159.74 while potential saving arising from unverified and
invalidated employees amounted to Gh₵187,966,032.83 in 2015
3.3.2 Audit of Payroll Database and Security System:
The Ministry of Finance through the Controller & Accountant-General commissioned Ernest &
Young Consultants to carry out an audit of the payroll Database and security system in 2015.
The audit which reviewed the status of implementation of the KPMG Audit recommendations as
well as examined new areas of payroll security and control system was completed and the final
report issued in July 2015.
3.3.3 Interface with SSNIT Biometric System:
SSNIT in collaboration with Controller & Accountant-General’s Department has re-enrolled
334,579 employees on CAGD Payroll on their biometric system as a first step towards interfacing
the two systems for continuous verification.
While efforts are underway to complete the re-enrolment of the remaining employees, discussions
have already began on CAGD Payroll/HRMIS Systems interface with SSNIT biometric system.
Interface requirements have been agreed with the Public Services Commission (PSC). The
interface is expected to be completed by the first half of 2016.
3.3.4 Implementation of New Recruitment Policy:
Government policy to freeze new employment during the year 2015 was effectively carried
out in collaboration with the Compensation Unit of Ministry of Finance (MOF). Except for
Ghana Education Service and Ghana Health Service which were allowed to make new
recruitments in respect of graduate trainees during the year, all other government institutions
are only allowed to make replacement of staff when justified.

6
3.3.5 Migration of Subvented organizations:
The process of migrating subvented organizations including the Public Universities was revived
in 2015. Relatively smaller institutions such as African Bio Fuel and Centre for National
Distance and Open Learning have been migrated. With regards to the interface of Ghana
Revenue Authority’s payroll with GIMIS, the chart of Accounts has been agreed and the
interface file is ready for testing. Work has begun on the interface of the payroll of state
universities with GIFMIS Financials. Interface requirements and chart of accounts have been
agreed for University of Ghana while all other Universities are being assessed for interface or
migration based on the strength of their current payroll and the control systems in place.
3.3.6 Discontinuation of Printing of Pay-slips and Vouchers
To achieve the full benefit of the e-initiatives, CAGD has discontinued the printing and
distribution of employee salary pay-slip with effect from December 2015, thus bringing some
cost saving to government
3.4.0 Treasury Management
3.4.1 Upgrade of the Swift System
To improve efficiency and security of electronic funds transfer to MDAs/MMDAs, the SWIFT
system was upgraded to the version being used by Bank of Ghana. The upgraded system also
supports the Electronic Funds Transfer (EFT) system of GIFMIS due to its improved security
features.
Other benefits of the system include flexible reporting and timely delivery of MT 950 from BOG
with filtering features for loading onto the GIFMIS system for purposes of automatic bank
reconciliation.
3.5.0 CASH MANAGEMENT
To effectively manage public expenditure and make funds available in a timely manner to meet
planned expenditures, a number of Policy initiatives are being undertaken to strengthen the cash
management system. These include the B-Tracking, e-Travel Card, e-Fuel Card, and the Treasury
Single Account.
3.5.1 Bank Account Tracking System (B-Tracking)
To improve the management of bank accounts, a web-based Bank Account Tracking System (BATS)
platform that enables all government accounts with Bank of Ghana and Commercial Banks to be
tracked at CAGD has been implemented. Currently, details of over 1,500 bank accounts at both
7
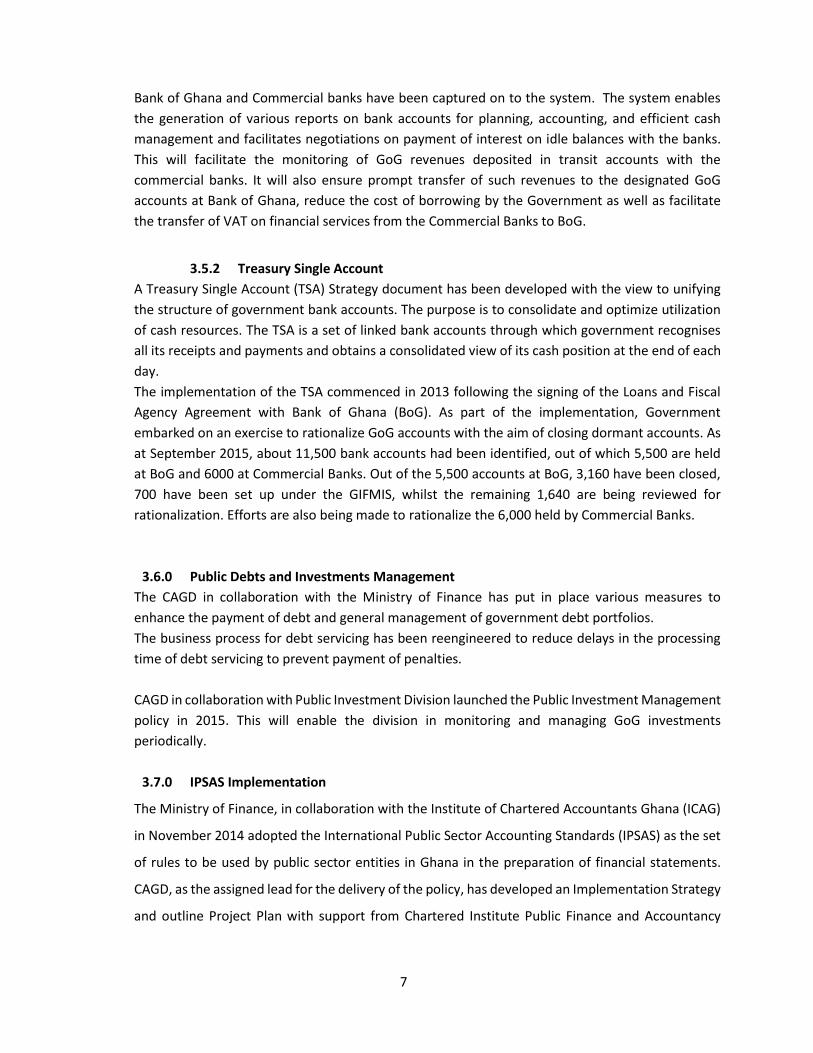
Bank of Ghana and Commercial banks have been captured on to the system. The system enables
the generation of various reports on bank accounts for planning, accounting, and efficient cash
management and facilitates negotiations on payment of interest on idle balances with the banks.
This will facilitate the monitoring of GoG revenues deposited in transit accounts with the
commercial banks. It will also ensure prompt transfer of such revenues to the designated GoG
accounts at Bank of Ghana, reduce the cost of borrowing by the Government as well as facilitate
the transfer of VAT on financial services from the Commercial Banks to BoG.
3.5.2 Treasury Single Account
A Treasury Single Account (TSA) Strategy document has been developed with the view to unifying
the structure of government bank accounts. The purpose is to consolidate and optimize utilization
of cash resources. The TSA is a set of linked bank accounts through which government recognises
all its receipts and payments and obtains a consolidated view of its cash position at the end of each
day.
The implementation of the TSA commenced in 2013 following the signing of the Loans and Fiscal
Agency Agreement with Bank of Ghana (BoG). As part of the implementation, Government
embarked on an exercise to rationalize GoG accounts with the aim of closing dormant accounts. As
at September 2015, about 11,500 bank accounts had been identified, out of which 5,500 are held
at BoG and 6000 at Commercial Banks. Out of the 5,500 accounts at BoG, 3,160 have been closed,
700 have been set up under the GIFMIS, whilst the remaining 1,640 are being reviewed for
rationalization. Efforts are also being made to rationalize the 6,000 held by Commercial Banks.
3.6.0 Public Debts and Investments Management
The CAGD in collaboration with the Ministry of Finance has put in place various measures to
enhance the payment of debt and general management of government debt portfolios.
The business process for debt servicing has been reengineered to reduce delays in the processing
time of debt servicing to prevent payment of penalties.
CAGD in collaboration with Public Investment Division launched the Public Investment Management
policy in 2015. This will enable the division in monitoring and managing GoG investments
periodically.
3.7.0 IPSAS Implementation
The Ministry of Finance, in collaboration with the Institute of Chartered Accountants Ghana (ICAG)
in November 2014 adopted the International Public Sector Accounting Standards (IPSAS) as the set
of rules to be used by public sector entities in Ghana in the preparation of financial statements.
CAGD, as the assigned lead for the delivery of the policy, has developed an Implementation Strategy
and outline Project Plan with support from Chartered Institute Public Finance and Accountancy
8
(CIPFA). The plan proposes a phased implementation approach aimed at a full compliance with
accrual basis IPSAS from 2022. Efforts are being made to secure funding for implementation.
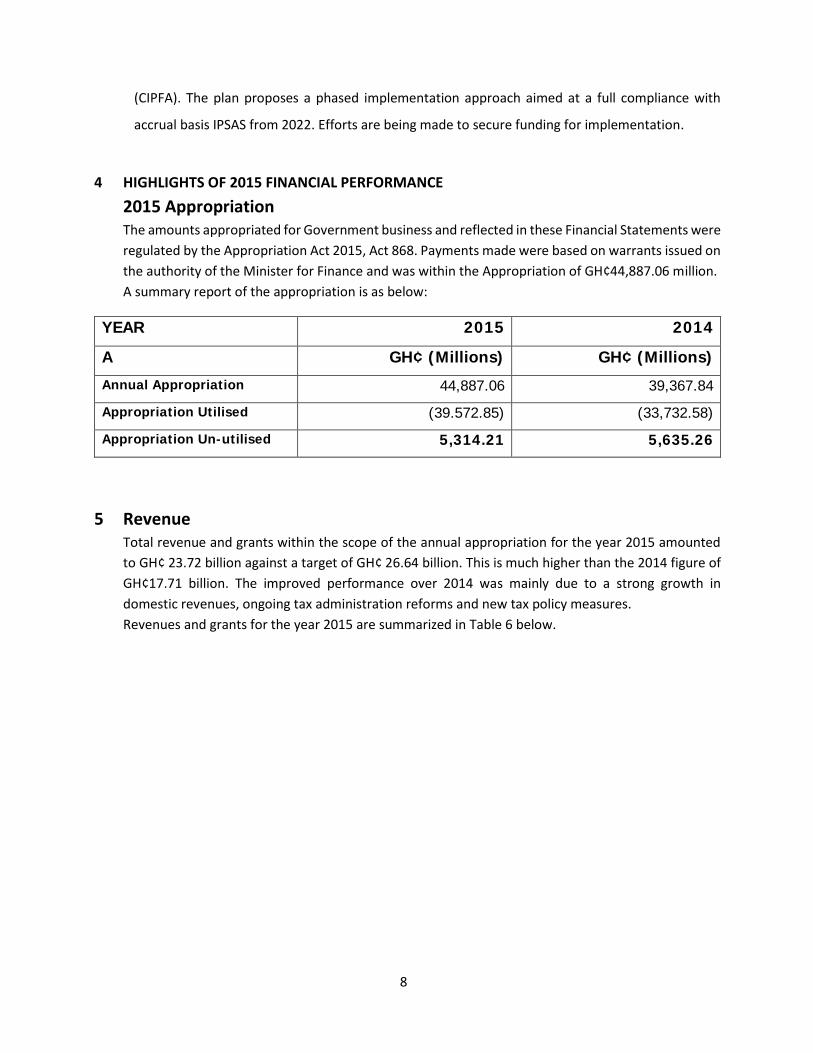
4 HIGHLIGHTS OF 2015 FINANCIAL PERFORMANCE
2015 Appropriation
The amounts appropriated for Government business and reflected in these Financial Statements were
regulated by the Appropriation Act 2015, Act 868. Payments made were based on warrants issued on
the authority of the Minister for Finance and was within the Appropriation of GH¢44,887.06 million.
A summary report of the appropriation is as below:
YEAR 2015 2014
A GH¢ (Millions) GH¢ (Millions)
Annual Appropriation 44,887.06 39,367.84
Appropriation Utilised (39.572.85) (33,732.58)
Appropriation Un-utilised 5,314.21 5,635.26
5 Revenue Total revenue and grants within the scope of the annual appropriation for the year 2015 amounted
to GH¢ 23.72 billion against a target of GH¢ 26.64 billion. This is much higher than the 2014 figure of
GH¢17.71 billion. The improved performance over 2014 was mainly due to a strong growth in
domestic revenues, ongoing tax administration reforms and new tax policy measures.
Revenues and grants for the year 2015 are summarized in Table 6 below.

9
Table 6: Summary of Revenues and Grants - 2015
Source: CAGD
Revenue(A) BUDGET 2015(B)
(B)
ACTUAL 2015 (C) BUDGET 2014 (D) ACTUAL 2014 (E) DIFFERENCE-F (C-E)
Direct Tax 8,849,375,163 7,722,068,381 9,308,815,075 7,024,573,751 697,494,630
Indirect Tax 10,834,761,744 10,235,812,934 10,347,623,325 7,236,689,757 2,999,123,177
Grant 2,001,764,510 2,852,768,040 1,130,723,000 995,626,782 1,857,141,258
Non Tax 4,950,621,283 2,908,118,606 4,342,758,647 2,451,902,748 456,215,858
TOTAL 26,636,522,700
23,718,767,961
25,129,920,047
17,708,793,038
6,009,974,923
5.1.0 OIL REVENUE
Total Oil revenue for the year 2015 amounted to GH¢ 1, 422.93 million. The ABFA’s share was GH¢881.76
million against a budget of GH¢554.63. This is lower than the 2014 share of GH¢ 1,196.5 million.
Table 6: Summary of oil revenue - 2015
Source: CAGD
OIL REVENUE DISTRIBUTION AMOUNT GHC
ABFA
881,763,540
847,550,101.38
STABILISATION 60,447,805
HERITAGE 25,906,202
GNPC 454,811,537
TOTAL
1,422,929,084
5.2.0 Grants Grant disbursement from development partners for the year 2015 amounted to GH¢ 2,853 million,
42.52 percent higher than the budget target of GH¢ 2,001.8 million and 187.56 percent higher than
the amount recorded during the same period in 2014. It is worth noting that for the first time in the
last three years Development Partners have disbursed their budget support pledges as planned.
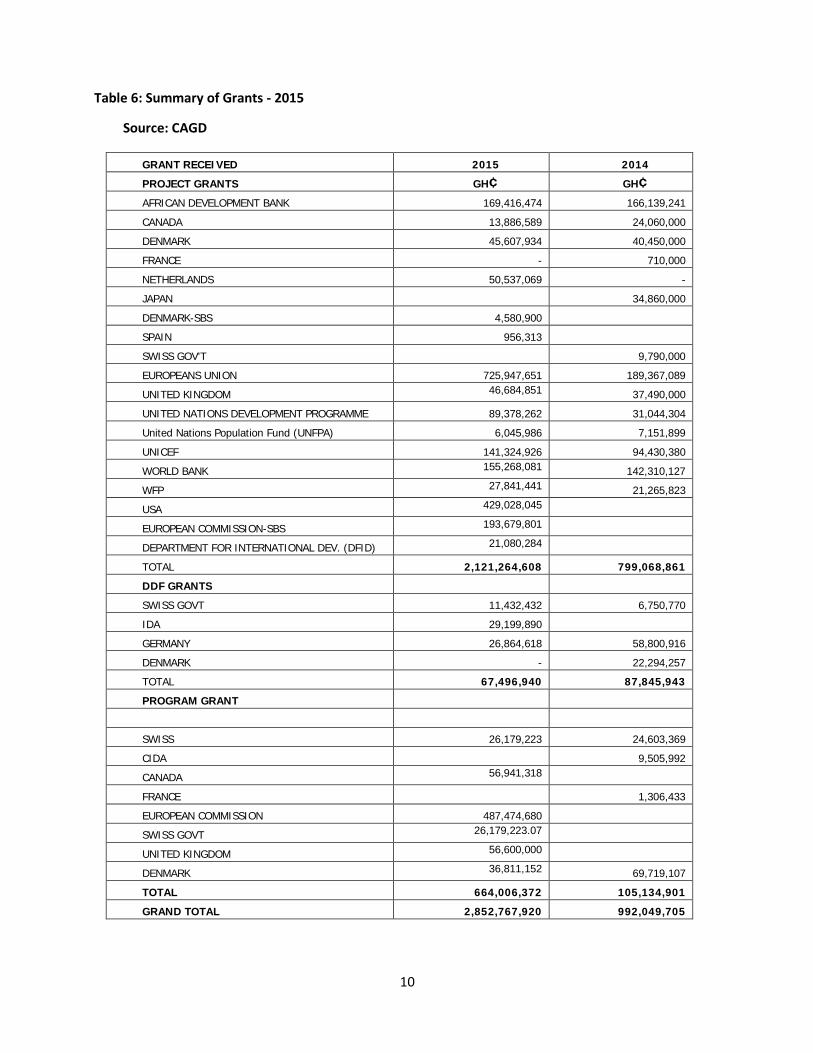
10
Table 6: Summary of Grants - 2015
Source: CAGD
GRANT RECEIVED 2015 2014
PROJECT GRANTS GH¢ GH¢
AFRICAN DEVELOPMENT BANK 169,416,474 166,139,241
CANADA 13,886,589 24,060,000
DENMARK 45,607,934 40,450,000
FRANCE - 710,000
NETHERLANDS 50,537,069 -
JAPAN 34,860,000
DENMARK-SBS 4,580,900
SPAIN 956,313
SWISS GOV'T 9,790,000
EUROPEANS UNION 725,947,651 189,367,089
UNITED KINGDOM 46,684,851 37,490,000
UNITED NATIONS DEVELOPMENT PROGRAMME 89,378,262 31,044,304
6 7,151,899
United Nations Population Fund (UNFPA) 6,045,986 7,151,899
UNICEF 141,324,926 94,430,380
WORLD BANK 155,268,081 142,310,127
WFP 27,841,441
21,265,823
USA 429,028,045
EUROPEAN COMMISSION-SBS 193,679,801
DEPARTMENT FOR INTERNATIONAL DEV. (DFID) 21,080,284
TOTAL 2,121,264,608 799,068,861
DDF GRANTS
SWISS GOVT 11,432,432 6,750,770
IDA 29,199,890
GERMANY 26,864,618 58,800,916
DENMARK - 22,294,257
TOTAL 67,496,940 87,845,943
PROGRAM GRANT
SWISS 26,179,223 24,603,369
CIDA 9,505,992
CANADA 56,941,318
FRANCE 1,306,433
EUROPEAN COMMISSION 487,474,680
SWISS GOVT 26,179,223.07
UNITED KINGDOM 56,600,000
DENMARK 36,811,152
69,719,107
TOTAL 664,006,372 105,134,901
GRAND TOTAL 2,852,767,920 992,049,705
11
6.1.0 Expenditure
Total expenditure, including payments for the clearance of arrears and outstanding commitments for the
year amounted to GH¢38,574.16 million. This was 2.74 percent higher than the expenditure for 2014.
6.1.1 Compensation of Employees Expenditure on Wages and Salaries including payments for the clearance of arrears and outstanding
commitments for 2015 amounted to GH¢ 13,015.2 million, 3.3 percent higher than the budget target
of GH¢ 12,597.7 million and 8.1 percent higher than the actual amount for 2014.
6.1.2 Goods and Services Expenditure on Goods and Services including Government subsidies, social benefits and other
expenditure for the year 2015 amounted to GH¢ 3,332.63 million, 46.83 percent lower than the
budget target of GH¢ 6,268 million and 4.14 percent higher than the actual expenditure for the year
2014.
6.1.3 Interest Interest payment for the year amounted to GH¢ 9,084.5 million, 2.92 percent lower than the revised
budget target of GH¢ 9,349.80 million and 28.62 percent higher than the actual amount for the 2014
financial year. Out of this amount, domestic interest payment was GH¢ 7,477.2 million.
6.1.4 Capital Expenditure Total capital expenditure for the 2015 amounted to GH¢ 1,474.6 million, 17.03 percent lower than
that of last year. Foreign Finance Investment GH¢ 6,044.6 while consumption of fixed Assets
amounted to GH¢ 373.6 million.
6.1.5 Grants to Other Government Units
Included in the grants to other government units was a transfer to District Assemblies Common Fund
(DACF) of GH¢ 1,687.2 million and Ghana Education Trust Fund (GETFund) of GH 1,023.5 million. The
transfer included 2014 arrears of GH¢ 98.8 million and GH¢ 260.6 million for GETFund and DACF
respectively.

12
Table 8: Summary of Central Government Expenditures for 2015
EXPENDITURE(A) BUDGET 2015 (B)
GH¢
ACTUAL 2015 (C)
GH¢
BUDGET 2014(D)
GH¢
ACTUAL 2014 (E)
GH¢
DIFFERENCE (C-
E) GH¢
COMPENSATION
OFEMPLOYEES
12,597,696,797
13,015,237,35
7
10,793,436,07
5
12,034,478,34
6
980,759,011
GOODS AND SERVICES 4,600,535,45
0
1,896,174,688 4,814,395,950 1,923,663,227
(27,488,539)
NON-FINANCIAL
ASSETS(CAPITAL)
3,978,866,08
4
1,474,647,766 3,827,841,038 1,777,420,468
(316,030,106)
INTEREST 9,349,796,46
4
9,084,510,936 7,884,706,682 7,063,447,154
2,021,063,782
GOVRNMENT SUBSIDIES 50,000,000
893,258,165 618,755,321 862,178,609
31,079,556
EXCHANGE LOSS
5,079,814,278
-
6,823,681,990 - 10,119,216,62
0
(3,295,534,630
)
SOCIAL BENEFIT 19,949,436
14,148,777 48,531,656 4,802,125
9,346,652
OTHER EXPENSES 1,597,991,95
9
529,050,482 792,279,800 409,828,323
161,545,159
FOREIGN FINANCED
IINVESTMENT
4,399,423,19
9
5,944,535,499 - 4,858,895,576
1,185,717,946
CONSUMPTION OF FIXED
ASSETS
- 373,560,250 - 268,270,069
105,290,181
TOTAL 36,594,259,389.00
40,048,805,910.00
440,177,949,529
28,779,946,522.00
39,322,200,517.00
726,605,393.00
7 Loans Receipt
Total loans receipts including Net Treasury Operations amounted to GH¢ 12,514.57 million against a
budget of GH¢ 14,446.8 million for the year 2015. Out of this was an amount of GH¢8,992.64 million
for external and GH¢3,521.93 for domestic. Inflow from Treasury Operations was GH¢52,031.41
million as against a redemption of GH¢48,582.34 million resulting in the Net Treasury operations of
GH¢3,449.22 million
Domestic loans (Net Treasury operations & Standard Loans) amounted to GH¢ 3,521.1 million, against
a target of GH¢ 5,064.4 million. Foreign loans was GH¢ 8,992.6 million, against a target of GH¢ 9,382.4
million.
Loan receipts for the year 2015 are summarized in Table 9 below.
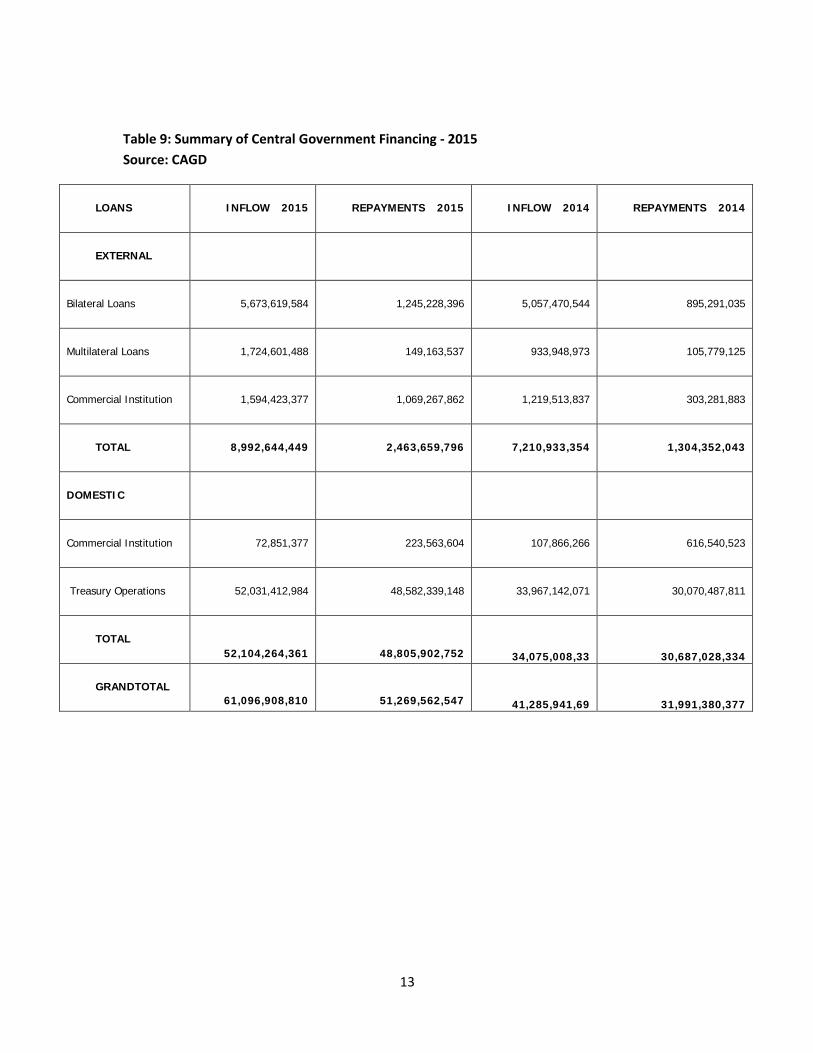
13
Table 9: Summary of Central Government Financing - 2015
Source: CAGD
LOANS INFLOW 2015
billion
REPAYMENTS 2015
billion
INFLOW 2014
billion
REPAYMENTS 2014
billion
EXTERNAL
Bilateral Loans
8 Bilateral Loans
5,673,619,584 1,245,228,396 5,057,470,544
895,291,035
Multilateral Loans
1,724,601,488 149,163,537
933,948,973 105,779,125
Commercial Institution
1,594,423,377
1,069,267,862
1,219,513,837
303,281,883
TOTAL 8,992,644,449 2,463,659,796 7,210,933,354 1,304,352,043
DOMESTIC
Commercial Institution
72,851,377
223,563,604
107,866,266
616,540,523
Treasury Operations
52,031,412,984
48,582,339,148 33,967,142,071
30,070,487,811
TOTAL
52,104,264,361
48,805,902,752
34,075,008,33
7
30,687,028,334
GRANDTOTAL
61,096,908,810
51,269,562,547
41,285,941,69
1
31,991,380,377

14
11 IMPLEMENTATION STATUS OF THE AUDITOR-GENERAL’S RECOMMENDATIONS ON THE 2014
PUBLIC ACCOUNTS
8.1.0 Payments Made Outside the GIFMIS System: Paragraph 23 to 28.
To mitigate the risk of budget overruns and ensure the completeness of financial reporting, I urged
CAGD to ensure that all transactions relating to the Consolidated Fund are processed through GIFMIS.
Action Taken
The transactions processed outside the system have been incorporated into the 2014 Accounts. These
were transactions that had been budgeted for and therefore their incorporation did not result in
budget overruns.
8.2.0 Carried Interest in Mining Companies: Paragraph 29 to 35
To ensure effective revenue mobilization of carried interest from mining companies, I urged MoF to
strengthen its control on GoG equity investments in mining companies by ensuring that dividend due
GoG are properly monitored and paid promptly into the Consolidated Fund.
Action Taken
MoF has developed a Public Investment Managing System (PIMS) to help track government interest
in state and other organizations. This will facilitate the monitoring of the financial performance and
dividend payments to government.
Additionally, a check list has been deployed to the agencies concerned to monitor the equity
investments in mining companies.
8.3.0 Payment of Penalties for delays in servicing loans :Paragraph 36 to 53
To minimize the risk of further delays in the servicing of loans that could result in the payment of
penalties, I urged DMD to streamline its processes with its stakeholders including BoG to ensure that
all debts are paid when they fall due. I urged MoF and CAG to improve their processing time for loan
repayment to avert the risk of delays that would lead to payment of penalties. Also, for full disclosure,
I reiterate my position that a separate code should be assigned in respect of penalties for delay in
loans servicing.
Action Taken
The business process for debt servicing has been reengineered to reduce the processing time. This
has reduced considerably the payment of penalties.
15
8.4.0 Automatic Bank Reconciliation not fully operational: Paragraphs 44 to 47.
To minimize the risk associated with manual preparation of bank reconciliation, I urged CAGD to
collaborate with BoG to agree on a common reference number that could be used to facilitate
automatic bank reconciliation at both national and sub-national levels.
Action Taken
Transaction reference numbers have now been agreed on between BoG and CAGD. Setups have been
completed on GIFMIS awaiting final testing to operationalize the automatic Bank Reconciliation
functionality.
8.5.0 Special Characters found in the Supplier database: Paragraphs 48 to 53.
I urged CAG to exercise strong oversight on its database management system. Also, I recommended
that the vendor database should be reviewed and all irregular suppliers on the Accounts Payable
Module terminated.
Action Taken
All the special characters have been removed and effective controls are exercised on the supplier’s
database
8.6.0 Non Deduction of Withholding Tax: Paragraphs 54 to 65.
To minimize the risk of loss of Tax Revenue, I urged CAGD to setup application control mechanism that
would ensure that appropriate taxes are automatically withheld unless tax exemption reference letter
numbers are provided on the GIFMIS platform. Furthermore, I recommended that the Ministry of Food
and Agriculture should liaise with Ghana Revenue Authority to ensure that all taxes due GoG from the
supplier are paid into the Consolidated Fund, failure of which the Chief Director of MoFA would be
surcharged. I refer to the Contract Form on the contract agreement between Messrs. KNIGHTS A. S and
the MoFA which acknowledged the execution of the agreement in accordance with the laws of Ghana. The
procurement, in my view, was subject to the Ghana Tax Laws and therefore the withholding tax provisions
were applicable to the purchase of the tractors. Consequently, I reiterate my position that, the Chief
Director of MoFA should be surcharged with the loss of GHȻ612,500 being Withholding Tax not deducted.
16
Action Taken
The Chief Director of MOFA wrote to the suppliers, Messrs Knights A. S., for the refund of the tax. The
company replied indicating the nature of the transaction and terms of the contract do not make them
obliged to pay the tax.
8.7.0 Management of Tax Revenue with Commercial Banks:Paragraphs 66 to 75
To minimize the risk of revenue leakages from poor cash monitoring, I urged GRA to strengthen its control
over its accounts with both GCB and Ecobank by ensuring that they submit regular statements to all
relevant stations of GRA. I also recommended that GRA should ensure that all outstanding transactions
with GCB are cleared together with any associated penalties without any further delays. Furthermore, I
urged GRA to assess the overall performance of the commercial banks and consider whether or not to
continue doing business with the banks.
Action Taken
All the amounts due at 31st December 2014 have been paid by the two banks. The banks are now
paying the revenue on time.
8.8.0 Unreliable External Debt records on CSDRMS:Paragraphs 76 to 84
I recommended that the Head of DMD exercise strong oversight in the recording of external debt
transactions, paying particular attention to prompt update of the CSDRMS and regular reconciliation
with lending institutions. I also urged PDI to collaborate with DMD to clean the external debt schedule.
Action Taken
CSDRMS is being upgraded to ensure reliable report generation. DMD now collaborates well with PDI
and data from DMD is reconciled before incorporation into the accounts
8.9.0 Lack of Collaboration between DMD and ERM:Paragraphs 85 to 88
To minimize the risk of wrongful external debt repayments, I urged the two divisions to effectively
collaborate and share information on expected loan disbursement from lending institutions to PIUs.
Action Taken
A Committee has been setup comprising ERM, DMD and CAGD to ensure information sharing on loans
disbursement.
17
8.10.0 Delays in the transfer of Accrued GETFund: Paragraphs 89 to 93
To ensure that the operations of GETFund are not stifled due to financial constraints, I urged MoF to ensure
compliance.
Action Taken
With the exception of last quarter of 2014, all releases have been made up to November 2015.
8.11.0 Late Transfers into DACF: Paragraphs 94 to 98
To ensure that the District Assemblies have access to funds for their developmental activities, I urged the
Ministry of Finance to issue instructions for the transfer of the outstanding amount in compliance with Act
455.
Action Taken
With the exception of last quarter of 2014, all releases have been made up to December 2015.
8.12.0 Non Transfer of Non Tax Revenue: Paragraphs 99 to 111
To minimize the risk of budget overrun due to excessive retentions, I recommended that, MoF and
CAGD should ensure that the unpaid NTR totaling GH¢21,296,167.31 is transferred into the
appropriate Consolidated Fund account without any further delay.
I also recommended that, Ghana Tourism Authority should ensure full compliance with the provisions
of the Appropriations and Retentions Act by ensuring the transfer of surplus funds into the
Consolidated Fund. I reiterated my position that NTR of GH¢145,342 realised from the rental of GNTC
property by MoTI should be transferred into the Consolidated Fund.
Action Taken
A letter has been written to the Ministry of Trade to transfer the amount involved in the rental of
spaces in GNTC building. Ghana Tourism Authority has been written to, to refund the amount spent
without authority.
Reminder letters have been sent, directing Ghana Tourism Authority and all other MDAs to comply
with the law in the future.
8.13.0 Accounting for other Statutory Funds treated outside GIFMIS: Paragraphs 112 to 117
To ensure transparency with respect to the proper accounting of revenue that accrued to GETFund,
Petroleum/Road & Energy Fund and DACF, I urged CAGD to ensure that all transactions relating to
those are processed from deposit accounts set-up in GIFMIS. I also urged MoF in line with the relevant

18
Acts, to periodically communicate amount attributable to other statutory funds to CAGD to enable
them appropriately maintain the respective deposit accounts of GETFund, Petroleum/Road & Energy
Fund and DACF.
Action Taken
The unique codes created under the Chart of Accounts for Statutory Funds are being used and are
effectively supporting the management of the deposits.
8.14.0 Wrong treatment of GoG deposits with CDB in the Public Accounts: Paragraphs 118 to 123
To minimize the risk of loss of funds, I urged CAGD to strengthen its control on financial reporting.
Also, to ensure that the Public Accounts reflect the true state of affairs, I urged CAGD to readjust the
Public Accounts after reviewing all CDB transactions since its inception.
Action Taken
Reclassification of deposits has been done. Controls have been strengthened to prevent re-
occurrence.
8.15.0 Wrong Treatment of Foreign Exchange Transactions: Paragraphs 124 to 128
I urged CAG to institute control mechanism to ensure strict compliance with all Accounting Policies
including the Policy on foreign exchange conversions. I also urged CAG to make the necessary adjustment
in the Public Accounts to reflect the true state of affairs.
Action Taken
Exchange rates are now defined on GIFMIS and this will minimise the risk of wrong exchange rates on
foreign transactions being applied.
8.16.0 Wrong Categorisation of Domestic Debt: Paragraphs 129 to 133
I urged CAG to institute control mechanism to ensure strict compliance with all Accounting Policies
including the Policy on loan receipts. I also urged CAG to make the necessary adjustments in the Public
Accounts to reflect the true state of affairs.
Action Taken
Measures have been instituted to ensure that domestic debts are put into the right categories.

19
9 CONCLUSION
I wish to take this opportunity to thank the Hon. Minister, Hon. Deputy Ministers and staff of MoF
and CAGD and other public officers for the immense contribution made towards the preparation of
the Report and the Public Accounts on the Consolidated Fund for the year ended 2015.
I also wish to sincerely thank all staff of the Department who have worked tirelessly to ensure that
we put various systems in place for an improved service delivery to our clients.
In compliance with Section 41(1) (b) of the Financial Administration Act, 2003 (Act 654) and Regulation
191 of the Financial Administration Regulation, 2004 (LI 1802), I hereby present the Report and the
Public Accounts on the Consolidated Fund for the year ended December 31, 2015.
SEIDU KOTOMAH
Ag. CONTROLLER AND ACCOUNTANT-GENERAL
Public Accounts on the Consolidated Fund for the yea
SEIDU KOTOMAH

STATEMENT OF RECEIPTS AND PAYMENTS FOR THE YEAR ENDED DECEMBER 31, 2015
ANNUAL REVISED ACTUAL VARIANCE
BUDGET BUDGET
NOTES GH¢ GH¢ GH¢ GH¢
RECEIPTS
DIRECT TAX 2 11,228,607,519 9,410,805,539 9,148,712,303 (262,093,236)
INDIRECT TAX 3 13,174,333,514 12,714,020,226 12,045,318,255 (668,701,971)
GRANTS 5 1,550,774,000 2,001,764,510 2,852,768,040 851,003,530
NON-TAX REVENUE 6 5,266,783,466 5,213,960,456 2,907,563,339 (2,306,397,117)
NHIL 7 1,185,674,914 1,185,674,914 1,237,603,071 51,928,157
LOANS RECEIVED 8 4,055,037,200 9,382,372,610 9,065,495,826 (316,876,784)
NET TREASURY OPERATIONS 9 8,697,559,537 5,064,425,377 3,449,073,836 (1,615,351,541)
RECOVERIES 24 0 0 15,639,879 15,639,879
TRUST MONIES 22 0 0 174,481,998 174,481,998
TOTAL RECEIPTS 45,158,770,150 44,973,023,632 40,896,656,547 (4,250,849,084)
PAYMENTS
COMPENSATION OF EMPLOYEES 10 12,597,696,797 12,597,696,797 12,574,728,570 22,968,227
GOODS AND SERVICES 11 4,523,265,030 4,600,535,450 1,866,273,281 2,734,262,168
NON-FINANCIAL ASSETS 12 4,578,680,456 3,978,866,084 1,461,390,362 2,517,475,722
INTEREST 13 9,577,176,464 9,349,796,464 9,084,510,936 265,285,528
GOVERNMENT SUBSIDIES 14 50,000,000 50,000,000 889,274,974 (839,274,974)
SOCIAL BENEFITS 16 19,949,436 19,949,436 14,148,777 5,800,659
OTHER EXPENSES 17 1,597,991,959 1,597,991,959 528,346,644 1,069,645,315
LOAN REPAYMENTS 19 2,799,228,500 4,633,406,900 2,687,223,400 1,946,183,500
STATUTORY PAYMENT 20 3,877,855,079 3,659,390,011 4,034,067,035 (374,677,024)
OTHER PAYMENTS 21 0 0 223,911,757 (223,911,757)
FINANCIAL ASSETS 23 0 0 190,879,893 (190,879,893)
FOREIGN FINANCED INVESTMENT18 4,399,423,199 4,399,423,199 5,944,535,499 (1,545,112,300)
TOTAL PAYMENTS 44,021,266,919 44,887,056,299 39,499,291,127 5,387,765,172
NET CHANGE IN STOCK OF CASH 1,397,365,419
CASH/BANK BALANCE AS AT
BEGINNING 1,640,031,719
CASH AND CASH EQUIVALENT AT CLOSE 3,037,397,138
20
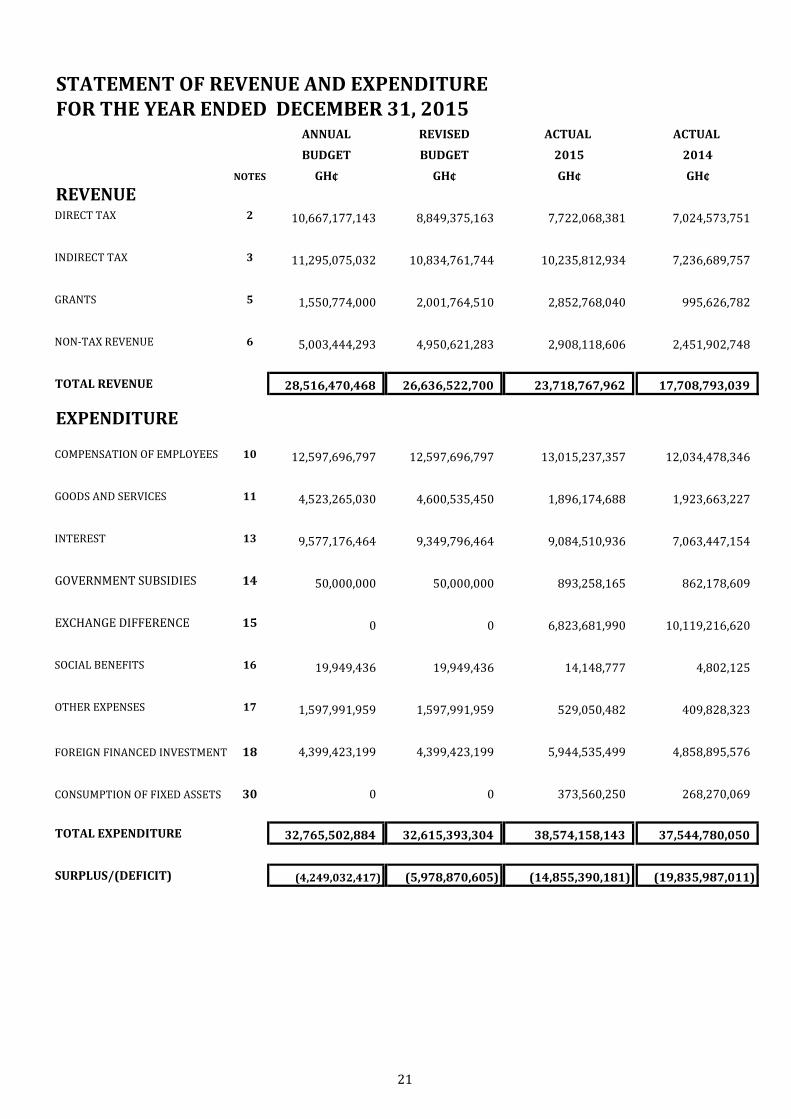
STATEMENT OF REVENUE AND EXPENDITURE FOR THE YEAR ENDED DECEMBER 31, 2015
ANNUAL REVISED ACTUAL ACTUAL
BUDGET BUDGET 2015 2014
NOTES GH¢ GH¢ GH¢ GH¢
REVENUEDIRECT TAX 2 10,667,177,143 8,849,375,163 7,722,068,381 7,024,573,751
INDIRECT TAX 3 11,295,075,032 10,834,761,744 10,235,812,934 7,236,689,757
GRANTS 5 1,550,774,000 2,001,764,510 2,852,768,040 995,626,782
NON-TAX REVENUE 6 5,003,444,293 4,950,621,283 2,908,118,606 2,451,902,748
TOTAL REVENUE 28,516,470,468 26,636,522,700 23,718,767,962 17,708,793,039
EXPENDITURE
COMPENSATION OF EMPLOYEES 10 12,597,696,797 12,597,696,797 13,015,237,357 12,034,478,346
GOODS AND SERVICES 11 4,523,265,030 4,600,535,450 1,896,174,688 1,923,663,227
INTEREST 13 9,577,176,464 9,349,796,464 9,084,510,936 7,063,447,154
GOVERNMENT SUBSIDIES 14 50,000,000 50,000,000 893,258,165 862,178,609
EXCHANGE DIFFERENCE 15 0 0 6,823,681,990 10,119,216,620
SOCIAL BENEFITS 16 19,949,436 19,949,436 14,148,777 4,802,125
OTHER EXPENSES 17 1,597,991,959 1,597,991,959 529,050,482 409,828,323
FOREIGN FINANCED INVESTMENT 18 4,399,423,199 4,399,423,199 5,944,535,499 4,858,895,576
CONSUMPTION OF FIXED ASSETS 30 0 0 373,560,250 268,270,069
TOTAL EXPENDITURE 32,765,502,884 32,615,393,304 38,574,158,143 37,544,780,050
SURPLUS/(DEFICIT) (4,249,032,417) (5,978,870,605) (14,855,390,181) (19,835,987,011)
21
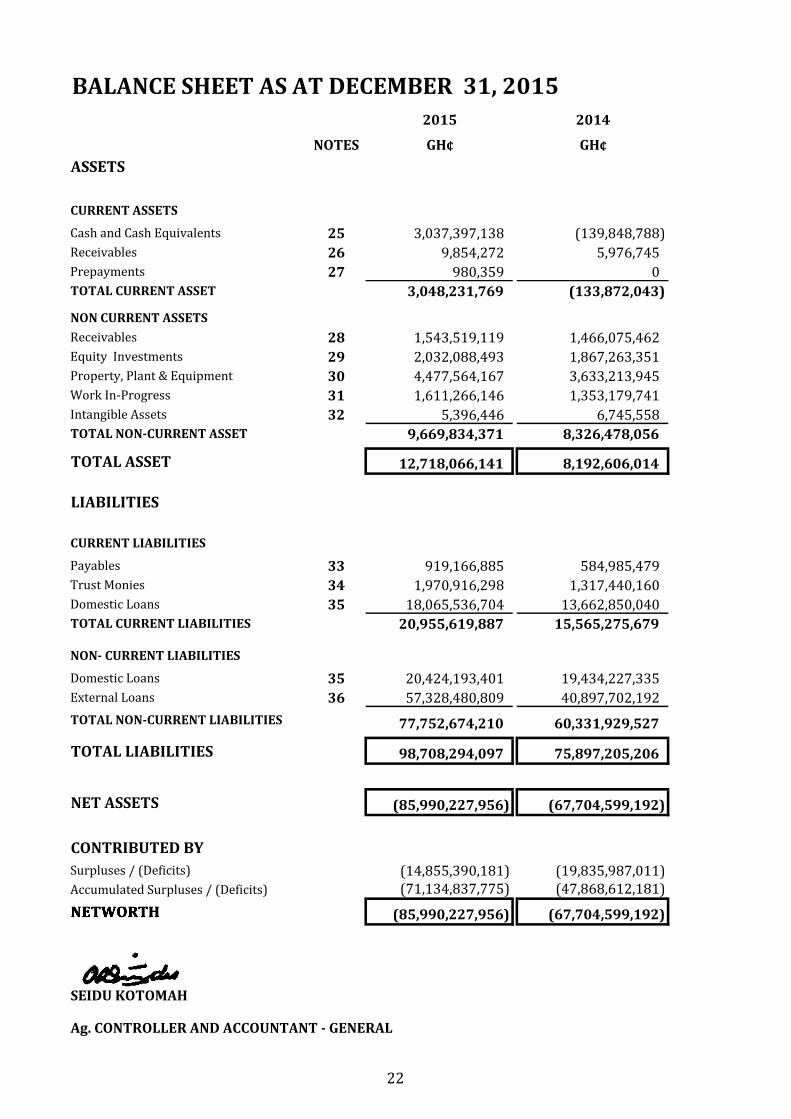
BALANCE SHEET AS AT DECEMBER 31, 2015
2015 2014
NOTES GH¢ GH¢
ASSETS
CURRENT ASSETS
Cash and Cash Equivalents 25 3,037,397,138 (139,848,788)Receivables 26 9,854,272 5,976,745
Prepayments 27 980,359 0
TOTAL CURRENT ASSET 3,048,231,769 (133,872,043)
NON CURRENT ASSETS
Receivables 28 1,543,519,119 1,466,075,462
Equity Investments 29 2,032,088,493 1,867,263,351Property, Plant & Equipment 30 4,477,564,167 3,633,213,945Work In-Progress 31 1,611,266,146 1,353,179,741
Intangible Assets 32 5,396,446 6,745,558
TOTAL NON-CURRENT ASSET 9,669,834,371 8,326,478,056
TOTAL ASSET 12,718,066,141 8,192,606,014
LIABILITIES
CURRENT LIABILITIES
Payables 33 919,166,885 584,985,479
Trust Monies 34 1,970,916,298 1,317,440,160
Domestic Loans 35 18,065,536,704 13,662,850,040TOTAL CURRENT LIABILITIES 20,955,619,887 15,565,275,679
NON- CURRENT LIABILITIES
Domestic Loans 35 20,424,193,401 19,434,227,335External Loans 36 57,328,480,809 40,897,702,192
TOTAL NON-CURRENT LIABILITIES 77,752,674,210 60,331,929,527
TOTAL LIABILITIES 98,708,294,097 75,897,205,206
NET ASSETS (85,990,227,956) (67,704,599,192)
CONTRIBUTED BY
Surpluses / (Deficits) (14,855,390,181) (19,835,987,011)Accumulated Surpluses / (Deficits) (71,134,837,775) (47,868,612,181)
NETWORTH (85,990,227,956) (67,704,599,192)
SEIDU KOTOMAH
Ag. CONTROLLER AND ACCOUNTANT - GENERAL
22
NETWORTH
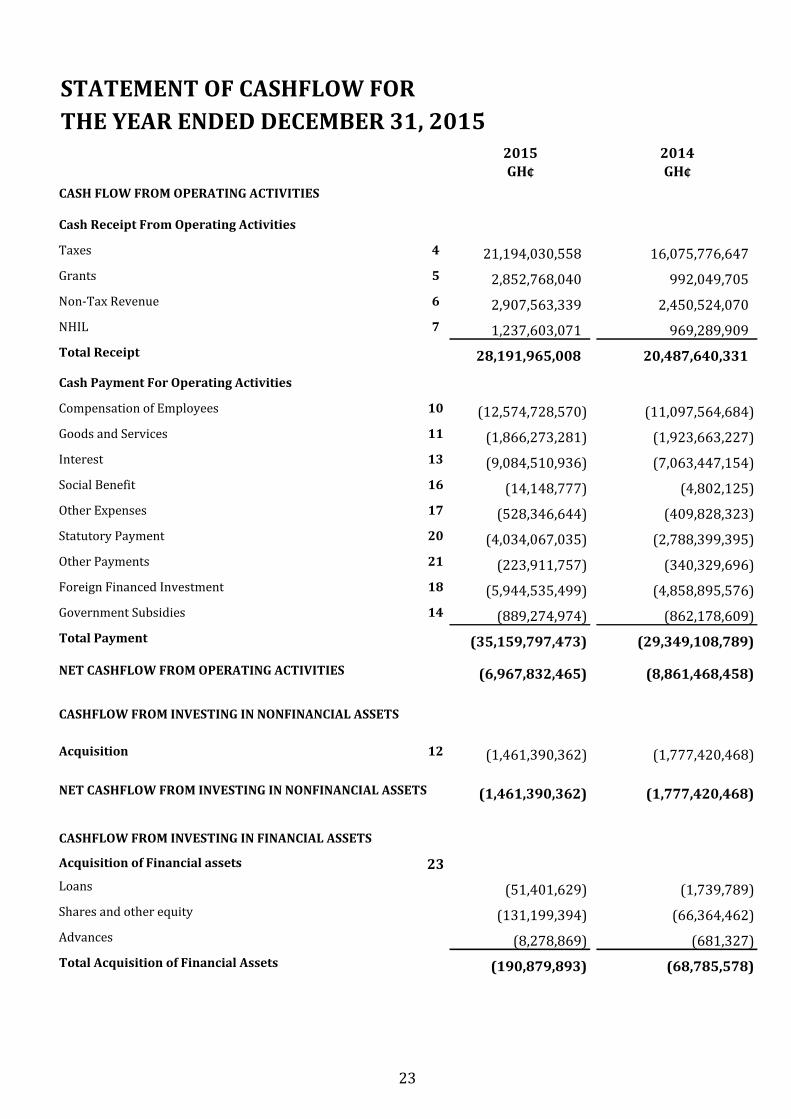
STATEMENT OF CASHFLOW FOR
THE YEAR ENDED DECEMBER 31, 20152015 2014GH¢ GH¢
CASH FLOW FROM OPERATING ACTIVITIES
Cash Receipt From Operating Activities
Taxes 4 21,194,030,558 16,075,776,647
Grants 5 2,852,768,040 992,049,705
Non-Tax Revenue 6 2,907,563,339 2,450,524,070
NHIL 7 1,237,603,071 969,289,909
Total Receipt 28,191,965,008 20,487,640,331
Cash Payment For Operating Activities
Compensation of Employees 10 (12,574,728,570) (11,097,564,684)
Goods and Services 11 (1,866,273,281) (1,923,663,227)
Interest 13 (9,084,510,936) (7,063,447,154)
Social Benefit 16 (14,148,777) (4,802,125)
Other Expenses 17 (528,346,644) (409,828,323)
Statutory Payment 20 (4,034,067,035) (2,788,399,395)
Other Payments 21 (223,911,757) (340,329,696)
Foreign Financed Investment 18 (5,944,535,499) (4,858,895,576)
Government Subsidies 14 (889,274,974) (862,178,609)
Total Payment (35,159,797,473) (29,349,108,789)
NET CASHFLOW FROM OPERATING ACTIVITIES (6,967,832,465) (8,861,468,458)
CASHFLOW FROM INVESTING IN NONFINANCIAL ASSETS
Acquisition 12 (1,461,390,362) (1,777,420,468)
NET CASHFLOW FROM INVESTING IN NONFINANCIAL ASSETS (1,461,390,362) (1,777,420,468)
CASHFLOW FROM INVESTING IN FINANCIAL ASSETS
Acquisition of Financial assets 23
Loans (51,401,629) (1,739,789)
Shares and other equity (131,199,394) (66,364,462)
Advances (8,278,869) (681,327)
Total Acquisition of Financial Assets (190,879,893) (68,785,578)
23

STATEMENT OF CASHFLOW FOR
THE YEAR ENDED DECEMBER 31, 20152015 2014GH¢ GH¢
Disposal/Recovery of Financial assets 24
Loans 11,238,537 10,229,286Shares and other equity 0 0Advances 4,401,342 5,383,686
Total Disposal/Recovery of Financial assets 15,639,879 15,612,973
NET CASHFLOW FROM INVESTING IN NONFINANCIAL ASSETS (175,240,013) (53,172,605)
CASHFLOW FROM FINANCING ACTIVITY
Domestic
Inflow 9 52,031,412,984 33,967,142,071
Outflow 9 (48,582,339,148) (30,070,487,811)
Trust Monies 22 174,481,998 0
Net Incurrence of Domestic Liability 3,623,555,834 3,896,654,260
External
Inflow 8 9,065,495,826 7,318,799,620
Outflow 19 (2,687,223,400) (1,920,892,566)
Net Incurrence of Foreign Liability 6,378,272,426 5,397,907,054
NET CASHFLOW FROM FINANCING ACTIVITY 10,001,828,260 9,294,561,314
NET CHANGE IN STOCK OF CASH 1,397,365,419 (1,397,500,217)
CASH AND CASH EQUIVALENT AT BEGINNING 1,640,031,719 1,257,651,429
CASH AND CASH EQUIVALENT AT CLOSE 3,037,397,138 (139,848,789)
24
NOTES TO THE ACCOUNTS
1. ACCOUNTING POLICIES
SUMMARY OF SIGNIFICANT ACCOUNTING POLICIES
1.1 General Statement
The Government of Ghana (GoG)is a not for profit making sovereign entity preparing General Purpose
Financial Statements in accordance with generally accepted accounting principles as prescribed by the
Financial Administration Act (FAA)2003, Act 654 and the accompanying Financial Administration
Regulation(FAR) 2004, LI 1802
In preparing the Financial Statements, the Controller and Accountant General (CAG) who is the Chief
Accounting Officer of Government of Ghana takes cognizance of the 1992 Constitution and the Financial
Administration Act 2003, Act 654 and its accompanying Regulation 2004. These statutes form the legal
framework governing financial management of the Government of Ghana and also define the scope of the
financial statements to be prepared by the CAG which covers only the Consolidated Fund
1.2 Policy Statement
Furthermore, the Public Accounts of Ghana is prepared with the adoption of (IPSAS) full accrual in mind.
The adoption of IPSAS in Ghana was launched by the Honorable Minister of Finance and a formal
declaration was made under paragraph 819 to 81 of the 2015 budget and economic policy presented to
parliament in November, 2014.
An implementation plan for the adoption of (IPSAS) Accrual is currently under development.
1.3 Basis of Preparation
The Financial Statements are prepared on modified Accrual Basis using the Historical Cost Convention.
The Accounting Policies adopted in preparing the Financial Statements have been consistently applied
throughout all periods presented unless otherwise stated.The Financial Statements are presented in Ghana Cedis and all values are rounded to the nearest Ghana
Cedi.
1.4 Transactions denominated in foreign currency
Transactions denominated in foreign currency are converted using the exchange rate at the time of the
transaction. Monetary items are converted using the exchange rate at the Balance Sheet date. Any
exchange loss resulting is charged against the current financial year while exchange gain is deferred until
realized.
1.5 Comparative Figures
Comparative figures are, where appropriate, reclassified to be comparable with the figures presented in
the current financial year. Basically a figure of a particular current period of the current financial year is
compared with a figure of the same period in the previous financial year. However in some instances a
figure of a particular current period is compared with a figure for the immediate preceding period. The
two instances are stated clearly in the presentation when adopted.
25

1.6 Assets and services received in kind
Assets and services received free of charge or for nominal cost are recognised as Grant at the fair value of
the assets and/or the fair value of those services that the Government would otherwise pay for, where the
fair value can be reliably measured. A corresponding expense is recognised for services received. Receipts
of assets are recognised in the Balance Sheet.
1.7 Revenue
Government reports revenue in the period in which they are received and lodged into the Treasury
Accounts with Bank of Ghana. Revenue received is apportioned among the Consolidated Fund and the
other statutory funds like the GETFund, District Assembly Common Fund, Energy Fund, Exploration Fund,
Road Fund and Petroleum Fund. The reported revenue in the Statement of Revenue and Expenditure is the
Consolidated Fund portion of the revenue received. The other Statutory Funds revenue is accrued and
transferred to the Institutions managing them.
1.8 Expenditure
The reported expenditure which is solely from the consolidated fund is recognized when incurred.
1.9 Assets
In compliance with IPSAS and in line with best practice, Fixed Assets acquired during the year is
capitalized and shown in the Balance Sheet and depreciation is not to be charged in the year of acquisition.
The fixed assets capitalized in 2012 have been depreciated using the straight line method with the
following rates;
2.0 Loans Received.
Loans received are recorded on a Cash Basis and are classified into short term (≤1year), medium term (>1
year ≤ 3 years) and long term (> 3 years) according to the time of maturity for repayment.
2.1 Investments
Investment which is made up of Equity investment, Loans and other investments are recorded on cash
basis. Loans and other investments are classified into current receivables (≤1 year) and non-current
receivables (>1year)
26
1.10 Provisions
Government does not make provision for irrecoverable investment until they are highly probable where a
request will be made to Parliament for write-off. The provision for equity investment of GH ¢2,958,236
and noncurrent receivables of GH¢ 100,101,686 in the accounts are investments the recovery of which is
highly improbable and a request to Parliament for a write-off is awaiting approval.
1.11 Cash and Cash equivalent.
Cash and cash equivalent is restricted to only cash on hand and cash balances on bank accounts.
1.12 Project loans and grants
Project loans are currently treated as ‘in and out’ thus income and expenditure at the same time since
detail data on their disbursement are not readily available.
27
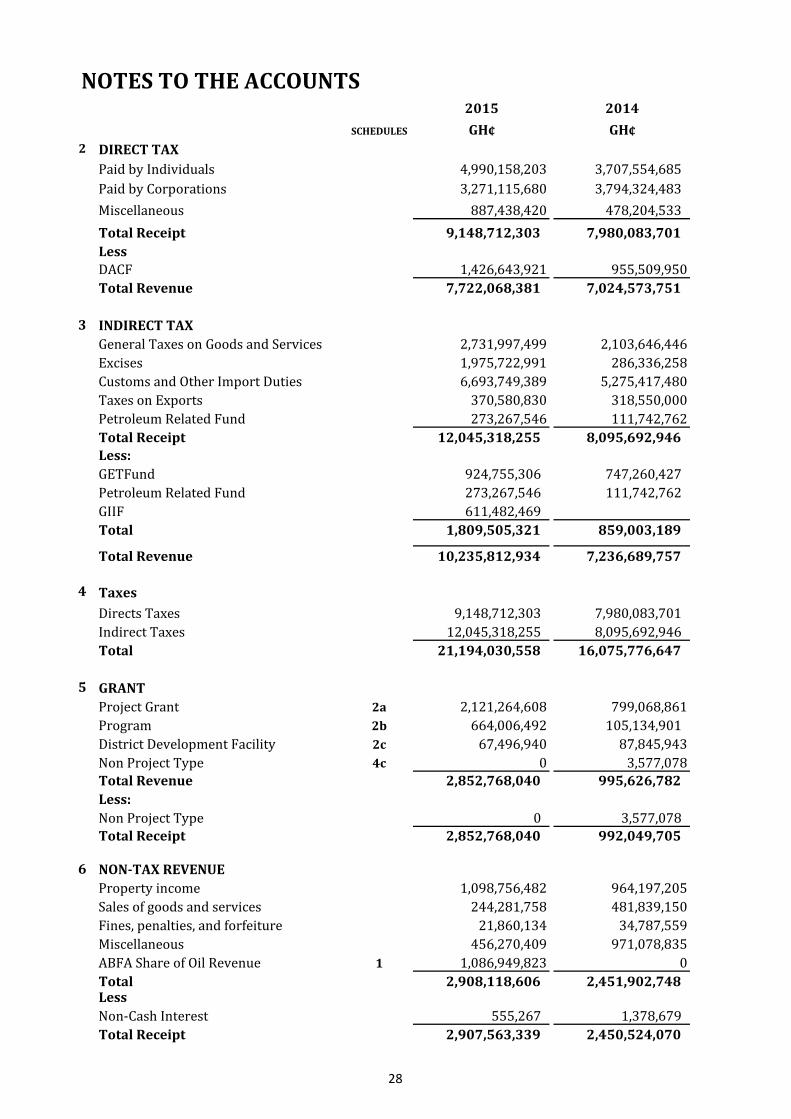
NOTES TO THE ACCOUNTS2015 2014
SCHEDULES GH¢ GH¢
2 DIRECT TAX
Paid by Individuals 4,990,158,203 3,707,554,685
Paid by Corporations 3,271,115,680 3,794,324,483
Miscellaneous 887,438,420 478,204,533
Total Receipt 9,148,712,303 7,980,083,701
Less
DACF 1,426,643,921 955,509,950
Total Revenue 7,722,068,381 7,024,573,751
3 INDIRECT TAX
General Taxes on Goods and Services 2,731,997,499 2,103,646,446
Excises 1,975,722,991 286,336,258
Customs and Other Import Duties 6,693,749,389 5,275,417,480
Taxes on Exports 370,580,830 318,550,000
Petroleum Related Fund 273,267,546 111,742,762
Total Receipt 12,045,318,255 8,095,692,946
Less:
GETFund 924,755,306 747,260,427
Petroleum Related Fund 273,267,546 111,742,762
GIIF 611,482,469
Total 1,809,505,321 859,003,189
Total Revenue 10,235,812,934 7,236,689,757
4 Taxes
Directs Taxes 9,148,712,303 7,980,083,701
Indirect Taxes 12,045,318,255 8,095,692,946
Total 21,194,030,558 16,075,776,647
5 GRANT
Project Grant 2a 2,121,264,608 799,068,861
Program 2b 664,006,492 105,134,901
District Development Facility 2c 67,496,940 87,845,943
Non Project Type 4c 0 3,577,078
Total Revenue 2,852,768,040 995,626,782
Less:
Non Project Type 0 3,577,078
Total Receipt 2,852,768,040 992,049,705
6 NON-TAX REVENUE
Property income 1,098,756,482 964,197,205
Sales of goods and services 244,281,758 481,839,150
Fines, penalties, and forfeiture 21,860,134 34,787,559
Miscellaneous 456,270,409 971,078,835
ABFA Share of Oil Revenue 1 1,086,949,823 0
Total 2,908,118,606 2,451,902,748Less
Non-Cash Interest 555,267 1,378,679
Total Receipt 2,907,563,339 2,450,524,070
28
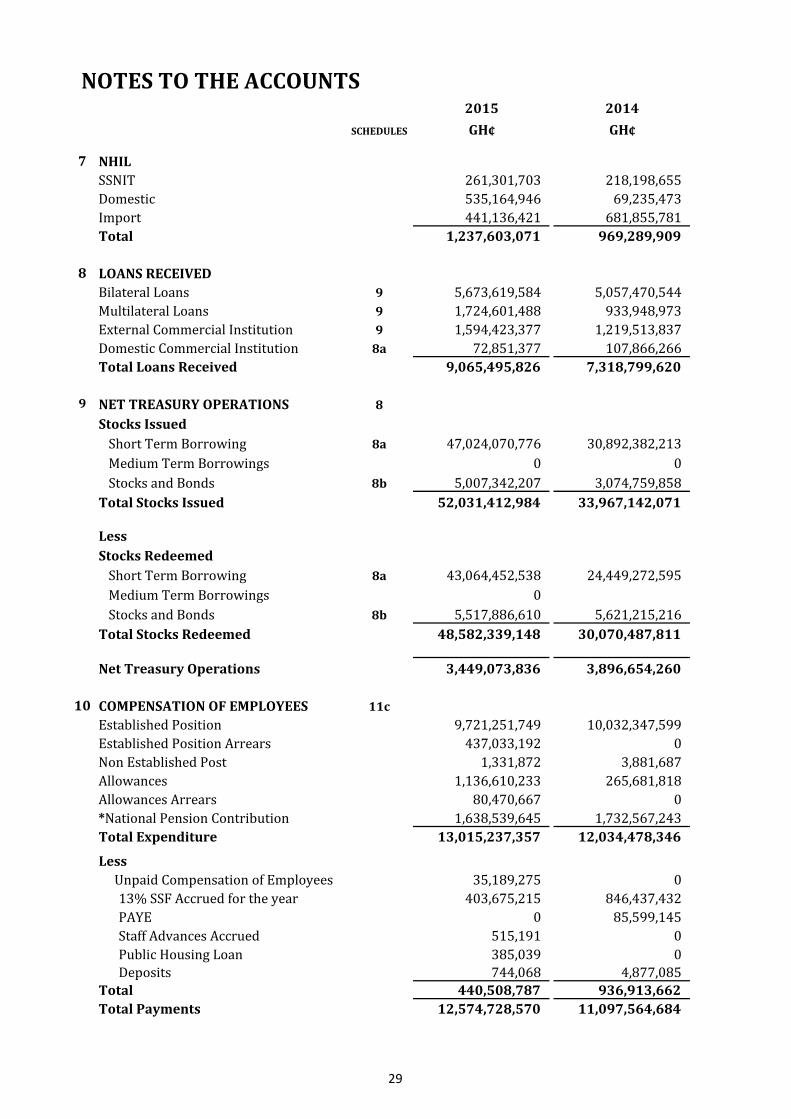
NOTES TO THE ACCOUNTS2015 2014
SCHEDULES GH¢ GH¢
7 NHIL
SSNIT 261,301,703 218,198,655
Domestic 535,164,946 69,235,473
Import 441,136,421 681,855,781
Total 1,237,603,071 969,289,909
8 LOANS RECEIVED
Bilateral Loans 9 5,673,619,584 5,057,470,544
Multilateral Loans 9 1,724,601,488 933,948,973
External Commercial Institution 9 1,594,423,377 1,219,513,837
Domestic Commercial Institution 8a 72,851,377 107,866,266
Total Loans Received 9,065,495,826 7,318,799,620
9 NET TREASURY OPERATIONS 8
Stocks Issued
Short Term Borrowing 8a 47,024,070,776 30,892,382,213
Medium Term Borrowings 0 0
Stocks and Bonds 8b 5,007,342,207 3,074,759,858
Total Stocks Issued 52,031,412,984 33,967,142,071
Less
Stocks Redeemed
Short Term Borrowing 8a 43,064,452,538 24,449,272,595
Medium Term Borrowings 0
Stocks and Bonds 8b 5,517,886,610 5,621,215,216
Total Stocks Redeemed 48,582,339,148 30,070,487,811
Net Treasury Operations 3,449,073,836 3,896,654,260
10 COMPENSATION OF EMPLOYEES 11c
Established Position 9,721,251,749 10,032,347,599
Established Position Arrears 437,033,192 0
Non Established Post 1,331,872 3,881,687
Allowances 1,136,610,233 265,681,818
Allowances Arrears 80,470,667 0
*National Pension Contribution 1,638,539,645 1,732,567,243
Total Expenditure 13,015,237,357 12,034,478,346
Less
Unpaid Compensation of Employees 35,189,275 0
13% SSF Accrued for the year 403,675,215 846,437,432
PAYE 0 85,599,145
Staff Advances Accrued 515,191 0
Public Housing Loan 385,039 0
Deposits 744,068 4,877,085
Total 440,508,787 936,913,662
Total Payments 12,574,728,570 11,097,564,684
29

NOTES TO THE ACCOUNTS2015 2014
SCHEDULES GH¢ GH¢
National Pension Contribution*13.5% SSF Contribution 801,973,194 680,224,671Gratuity 159,735,418 358,505,436Pension 676,642,126 639,359,810End of Service Benefit (ESB) 188,906 54,477,325Total 1,638,539,645 1,732,567,243
11 GOODS AND SERVICES 11d
Materials and Office Consumables 452,338,833 600,249,334
Utilities 250,464,870 169,136,146
General Cleaning 1,309,622 3,558,104
Rentals 7,738,720 33,450,635
Travel and Transport 127,512,886 190,163,967
Repairs and Maintenance 61,180,186 212,033,763
Training, Seminar and Confer 226,783,380 304,911,730
Consultancy Expenses 40,709,330 243,876,624
Special Services 410,874,424 6,255,418
Other Charges and Fees 316,873,868 157,284,032
Emergency Services 388,570 2,672,284
Statutory transfers 0 71,190
Total Expenditure 1,896,174,688 1,923,663,227
Less:
Unpaid Goods and Services 29,901,407 0
Total Payments 1,866,273,281 1,923,663,227
12 NON-FINANCIAL ASSETS 7
Fixed asset 1,216,561,360 1,277,366,027
Work In Progress 258,086,406 493,308,884
Intangible Asset 0 6,745,558
Total Expenditure 1,474,647,766 1,777,420,468Less:Unpaid Non-Financial Asset 13,257,404 0
Total Payments 1,461,390,362 1,777,420,468
13 INTEREST 11b
Non Residents 1,607,346,764 1,290,377,022
Residents 7,211,167,518 5,773,070,133
Overdraft 265,996,653 0
Total Expenditure 9,084,510,936 7,063,447,154
14 GOVERNMENT SUBSIDIES 11b
Utility 144,000,000 0
Petroleum Products 649,236,342 795,284,500
Fertilizer Subsidy 30,780,755 66,894,109
Capitation Grants 24,987,230 0
Schools Subsidy 44,253,838 0
Total Expenditure 893,258,165 862,178,609
Less:
Unpaid Subsidies 3,983,191 0
Total Payments 889,274,974 800,122,179
30
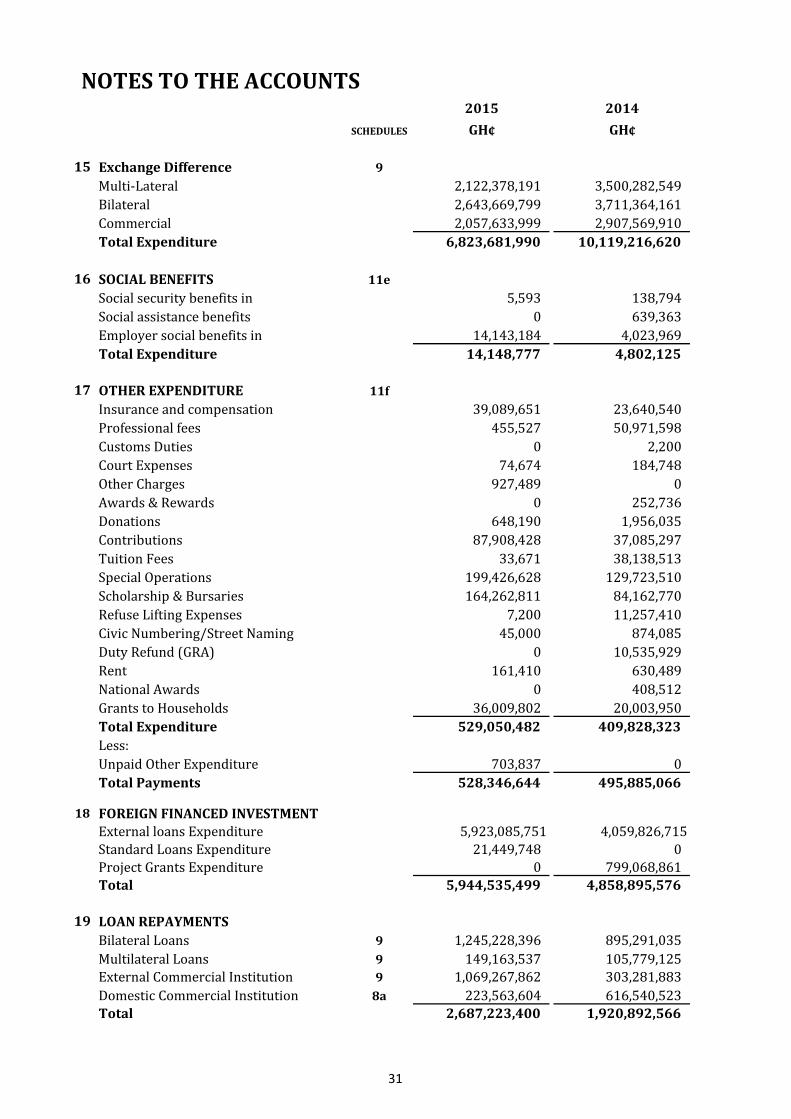
NOTES TO THE ACCOUNTS2015 2014
SCHEDULES GH¢ GH¢
15 Exchange Difference 9
Multi-Lateral 2,122,378,191 3,500,282,549
Bilateral 2,643,669,799 3,711,364,161
Commercial 2,057,633,999 2,907,569,910
Total Expenditure 6,823,681,990 10,119,216,620
16 SOCIAL BENEFITS 11e
Social security benefits in 5,593 138,794
Social assistance benefits 0 639,363
Employer social benefits in 14,143,184 4,023,969
Total Expenditure 14,148,777 4,802,125
17 OTHER EXPENDITURE 11f
Insurance and compensation 39,089,651 23,640,540
Professional fees 455,527 50,971,598
Customs Duties 0 2,200
Court Expenses 74,674 184,748
Other Charges 927,489 0
Awards & Rewards 0 252,736
Donations 648,190 1,956,035
Contributions 87,908,428 37,085,297
Tuition Fees 33,671 38,138,513
Special Operations 199,426,628 129,723,510
Scholarship & Bursaries 164,262,811 84,162,770
Refuse Lifting Expenses 7,200 11,257,410
Civic Numbering/Street Naming 45,000 874,085
Duty Refund (GRA) 0 10,535,929
Rent 161,410 630,489
National Awards 0 408,512
Grants to Households 36,009,802 20,003,950
Total Expenditure 529,050,482 409,828,323
Less:
Unpaid Other Expenditure 703,837 0
Total Payments 528,346,644 495,885,066
18 FOREIGN FINANCED INVESTMENT
External loans Expenditure 5,923,085,751 4,059,826,715
Standard Loans Expenditure 21,449,748 0
Project Grants Expenditure 0 799,068,861
Total 5,944,535,499 4,858,895,576
19 LOAN REPAYMENTS
Bilateral Loans 9 1,245,228,396 895,291,035
Multilateral Loans 9 149,163,537 105,779,125
External Commercial Institution 9 1,069,267,862 303,281,883
Domestic Commercial Institution 8a 223,563,604 616,540,523
Total 2,687,223,400 1,920,892,566
31
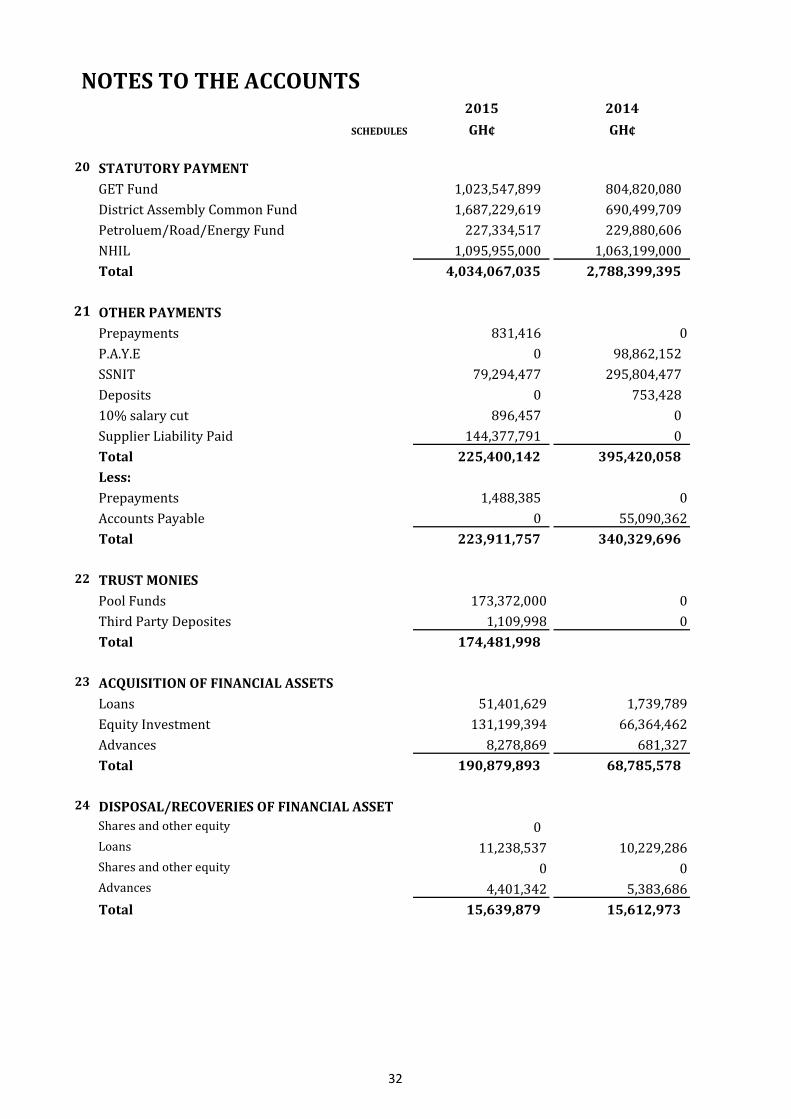
NOTES TO THE ACCOUNTS2015 2014
SCHEDULES GH¢ GH¢
20 STATUTORY PAYMENT
GET Fund 1,023,547,899 804,820,080
District Assembly Common Fund 1,687,229,619 690,499,709
Petroluem/Road/Energy Fund 227,334,517 229,880,606
NHIL 1,095,955,000 1,063,199,000
Total 4,034,067,035 2,788,399,395
21 OTHER PAYMENTS
Prepayments 831,416 0
P.A.Y.E 0 98,862,152
SSNIT 79,294,477 295,804,477
Deposits 0 753,428
10% salary cut 896,457 0
Supplier Liability Paid 144,377,791 0
Total 225,400,142 395,420,058
Less:
Prepayments 1,488,385 0
Accounts Payable 0 55,090,362
Total 223,911,757 340,329,696
22 TRUST MONIES
Pool Funds 173,372,000 0
Third Party Deposites 1,109,998 0
Total 174,481,998
23 ACQUISITION OF FINANCIAL ASSETS
Loans 51,401,629 1,739,789
Equity Investment 131,199,394 66,364,462
Advances 8,278,869 681,327
Total 190,879,893 68,785,578
24 DISPOSAL/RECOVERIES OF FINANCIAL ASSET
Shares and other equity 0
Loans 11,238,537 10,229,286
Shares and other equity 0 0
Advances 4,401,342 5,383,686
Total 15,639,879 15,612,973
32
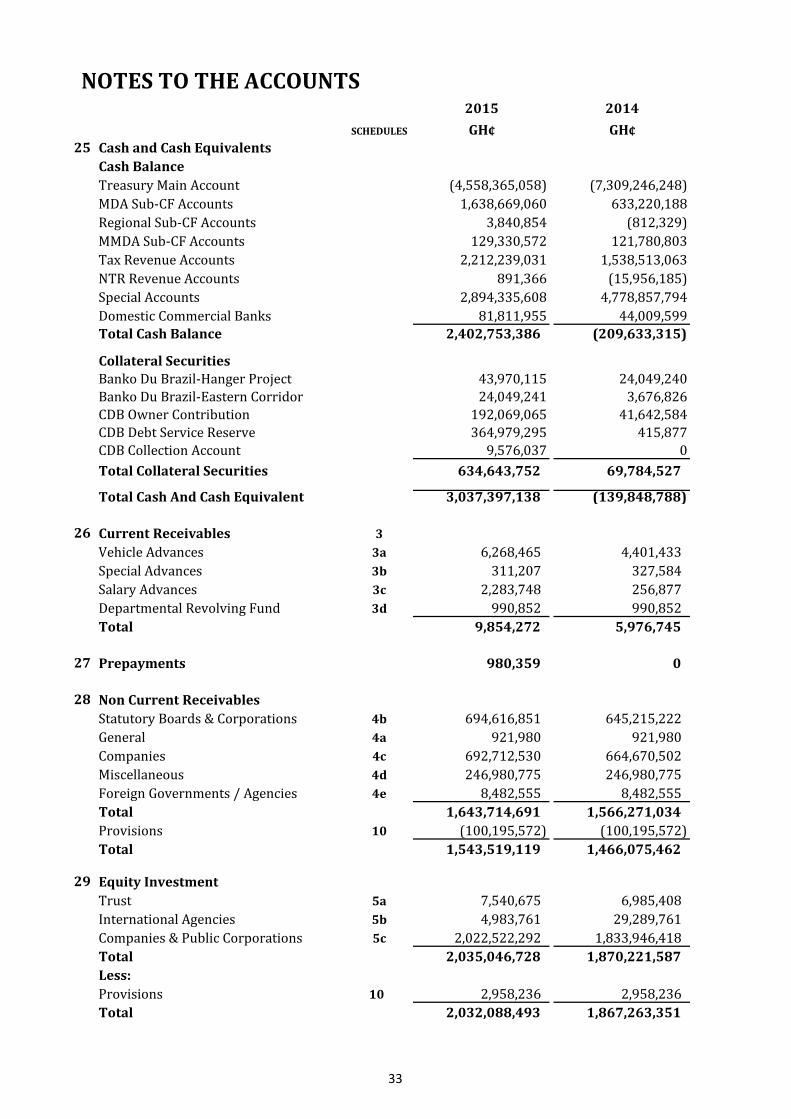
NOTES TO THE ACCOUNTS2015 2014
SCHEDULES GH¢ GH¢25 Cash and Cash Equivalents
Cash Balance
Treasury Main Account (4,558,365,058) (7,309,246,248)
MDA Sub-CF Accounts 1,638,669,060 633,220,188
Regional Sub-CF Accounts 3,840,854 (812,329)
MMDA Sub-CF Accounts 129,330,572 121,780,803
Tax Revenue Accounts 2,212,239,031 1,538,513,063
NTR Revenue Accounts 891,366 (15,956,185)
Special Accounts 2,894,335,608 4,778,857,794
Domestic Commercial Banks 81,811,955 44,009,599
Total Cash Balance 2,402,753,386 (209,633,315)
Collateral Securities
Banko Du Brazil-Hanger Project 43,970,115 24,049,240
Banko Du Brazil-Eastern Corridor 24,049,241 3,676,826
CDB Owner Contribution 192,069,065 41,642,584
CDB Debt Service Reserve 364,979,295 415,877
CDB Collection Account 9,576,037 0
Total Collateral Securities 634,643,752 69,784,527
Total Cash And Cash Equivalent 3,037,397,138 (139,848,788)
26 Current Receivables 3
Vehicle Advances 3a 6,268,465 4,401,433
Special Advances 3b 311,207 327,584
Salary Advances 3c 2,283,748 256,877
Departmental Revolving Fund 3d 990,852 990,852
Total 9,854,272 5,976,745
27 Prepayments 980,359 0
28 Non Current Receivables
Statutory Boards & Corporations 4b 694,616,851 645,215,222
General 4a 921,980 921,980
Companies 4c 692,712,530 664,670,502
Miscellaneous 4d 246,980,775 246,980,775
Foreign Governments / Agencies 4e 8,482,555 8,482,555
Total 1,643,714,691 1,566,271,034
Provisions 10 (100,195,572) (100,195,572)
Total 1,543,519,119 1,466,075,462
29 Equity Investment
Trust 5a 7,540,675 6,985,408
International Agencies 5b 4,983,761 29,289,761
Companies & Public Corporations 5c 2,022,522,292 1,833,946,418
Total 2,035,046,728 1,870,221,587
Less:
Provisions 10 2,958,236 2,958,236
Total 2,032,088,493 1,867,263,351
33

NOTES TO THE ACCOUNTS2015 2014
SCHEDULES GH¢ GH¢
30 Property, Plant & Equipment 7a
Dwellings 67,195,709 33,710,896
Non Residential Buildings 187,125,170 171,869,401
Other structures 2,061,814,266 1,382,213,306
Transport Equipment 515,593,284 386,420,699
Other machinery and equipment 1,353,388,131 1,218,116,337
Infrastructure Assets 1,096,641,545 872,866,106
Total 5,281,758,106 4,065,196,746
Less:
Consumption of Fixed Assets 372,211,138
Accumulated Consumption of Fixed Assets 431,982,800 431,982,801
Net Book Value 4,477,564,167 3,633,213,945
31 Work - In - Progress 7b
Dwellings 120,753,904 114,102,645
Non Residential Buildings 276,050,799 204,458,121
Other structures 912,118,078 811,986,725
Transport Equipment 29,728,102 2,625,894
Other machinery and equipment 0 0
Infrastructure Assets 272,615,263 220,006,357
Total 1,611,266,146 1,353,179,741
32 Intangible Asset 7a
Computer Software 6,745,558 6,745,558
Total 6,745,558 6,745,558
Less:
Consumption of Fixed Assets 1,349,112 0
Net Book Value 5,396,446 6,745,558
33 Payables
Supplier 99,685,972 68,656,550
Withholding 2,176,970 1,058,490
P.A.Y.E 0 85,599,154
SSNIT 6 474,789,924 38,800,000
NPRA 6 333,795,062 390,871,285
Staff Advances Recovery 515,191 0
Rent & Rates 385,039 0
Payables- Compensation 7,818,728 0
Total 919,166,885 584,985,479
34
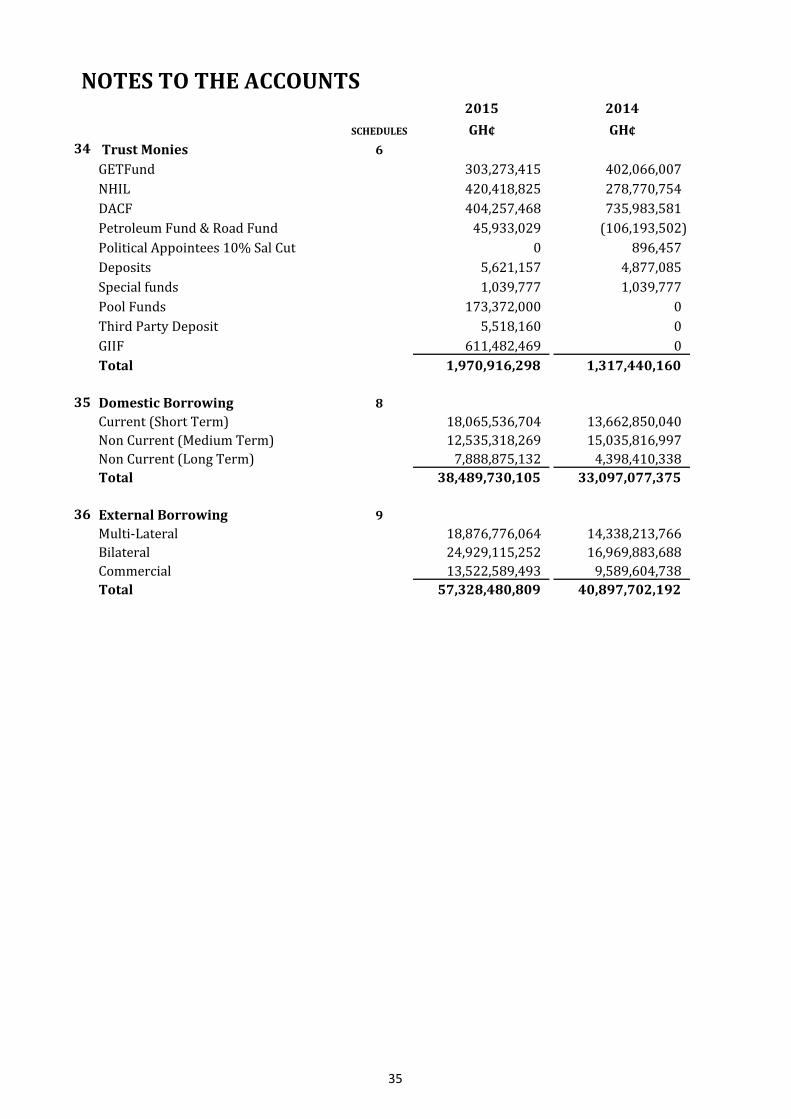
NOTES TO THE ACCOUNTS2015 2014
SCHEDULES GH¢ GH¢
34 Trust Monies 6
GETFund 303,273,415 402,066,007
NHIL 420,418,825 278,770,754
DACF 404,257,468 735,983,581
Petroleum Fund & Road Fund 45,933,029 (106,193,502)
Political Appointees 10% Sal Cut 0 896,457
Deposits 5,621,157 4,877,085
Special funds 1,039,777 1,039,777
Pool Funds 173,372,000 0
Third Party Deposit 5,518,160 0
GIIF 611,482,469 0
Total 1,970,916,298 1,317,440,160
35 Domestic Borrowing 8
Current (Short Term) 18,065,536,704 13,662,850,040
Non Current (Medium Term) 12,535,318,269 15,035,816,997
Non Current (Long Term) 7,888,875,132 4,398,410,338
Total 38,489,730,105 33,097,077,375
36 External Borrowing 9
Multi-Lateral 18,876,776,064 14,338,213,766
Bilateral 24,929,115,252 16,969,883,688
Commercial 13,522,589,493 9,589,604,738
Total 57,328,480,809 40,897,702,192
35

A CHART SHOWING THE REVENUE AND EXPENDITURE FOR THE YEAR 2015
COMPENSATION OF EMPLOYEESGOODS AND SERVICESINTERESTSOCIAL BENEFITSOTHER EXPENSESGOVERNMENT SUBSIDIESCONSUMPTION OF FIXED ASSETSEXCHANGE DIFFERENCEFOREIGN FINANCED INVESTMENT
REVENUE BY ITEM
EXPENDITURE BY ITEM
DIRECT TAX32.557%
INDIRECT TAX43.155%
GRANTS12.027%
NON-TAX REVENUE12.261%
COMPENSATION OF EMPLOYEES
33.741%
GOODS AND SERVICES4.916%
INTEREST23.551%
SOCIAL BENEFITS0.037%
OTHER EXPENSES1.372%
GOVERNMENT SUBSIDIES
2.316%
CONSUMPTION OF FIXED ASSETS
0.968%
EXCHANGE DIFFERENCE
17.690%
FOREIGN FINANCED INVESTMENT
15.411%
36
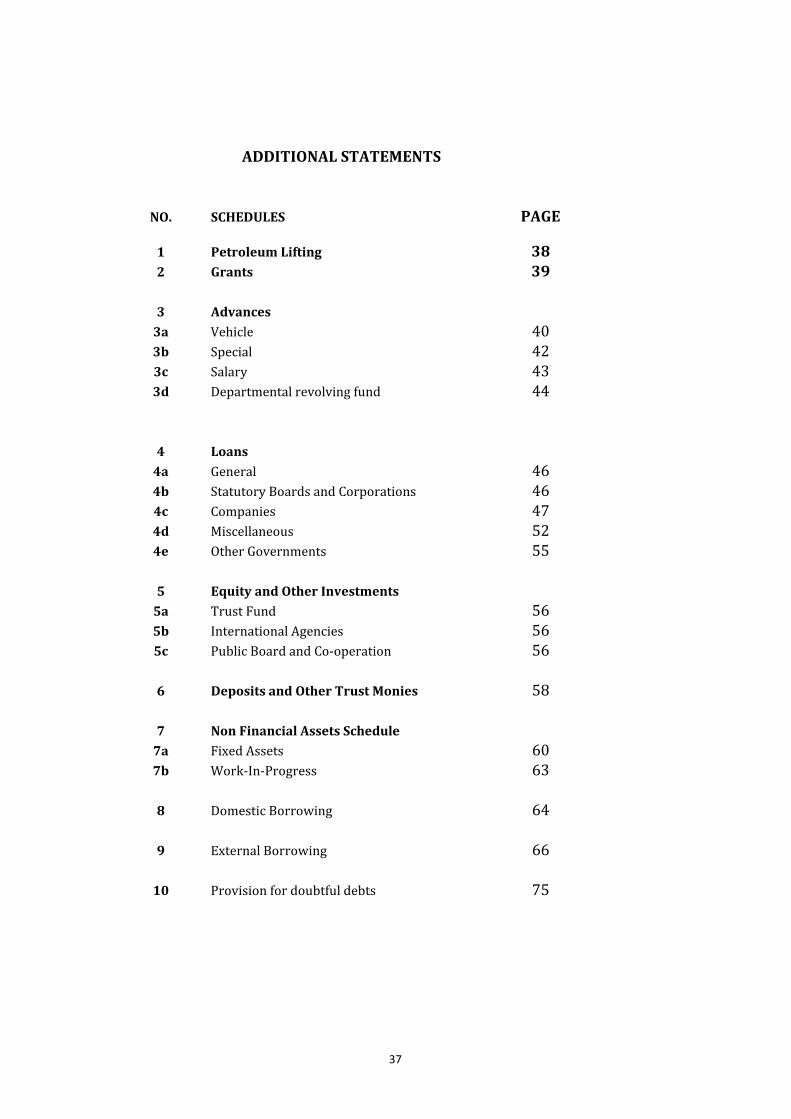
NO. SCHEDULES PAGE
1 Petroleum Lifting 382 Grants 39
3 Advances
3a Vehicle 403b Special 423c Salary 433d Departmental revolving fund 44
4 Loans
4a General 464b Statutory Boards and Corporations 464c Companies 474d Miscellaneous 524e Other Governments 55
5 Equity and Other Investments
5a Trust Fund 565b International Agencies 565c Public Board and Co-operation 56
6 Deposits and Other Trust Monies 58
7 Non Financial Assets Schedule
7a Fixed Assets 607b Work-In-Progress 63
8 Domestic Borrowing 64
9 External Borrowing 66
10 Provision for doubtful debts 75
ADDITIONAL STATEMENTS
37
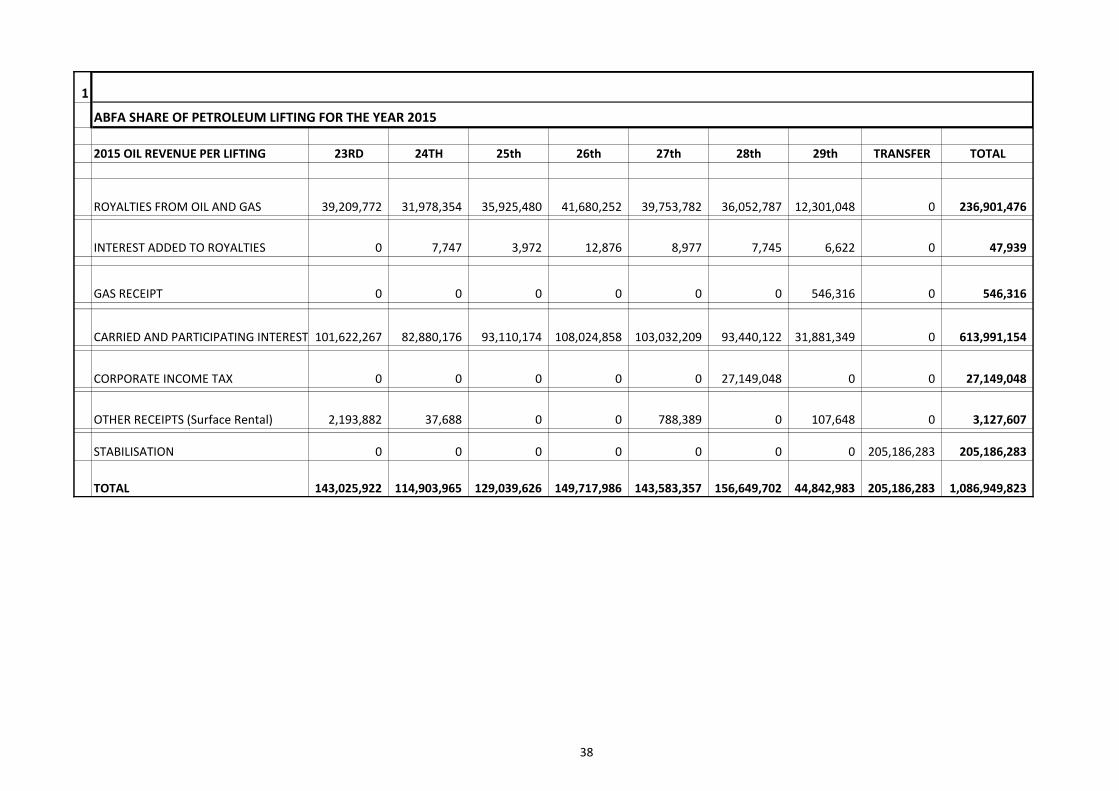
1
2015 OIL REVENUE PER LIFTING 23RD 24TH 25th 26th 27th 28th 29th TRANSFER TOTAL
ROYALTIES FROM OIL AND GAS 39,209,772 31,978,354 35,925,480 41,680,252 39,753,782 36,052,787 12,301,048 0 236,901,476
INTEREST ADDED TO ROYALTIES 0 7,747 3,972 12,876 8,977 7,745 6,622 0 47,939
GAS RECEIPT 0 0 0 0 0 0 546,316 0 546,316
CARRIED AND PARTICIPATING INTEREST(EQUITY)101,622,267 82,880,176 93,110,174 108,024,858 103,032,209 93,440,122 31,881,349 0 613,991,154
CORPORATE INCOME TAX 0 0 0 0 0 27,149,048 0 0 27,149,048
OTHER RECEIPTS (Surface Rental) 2,193,882 37,688 0 0 788,389 0 107,648 0 3,127,607
STABILISATION 0 0 0 0 0 0 0 205,186,283 205,186,283
TOTAL 143,025,922 114,903,965 129,039,626 149,717,986 143,583,357 156,649,702 44,842,983 205,186,283 1,086,949,823
ABFA SHARE OF PETROLEUM LIFTING FOR THE YEAR 2015
38

2
GRANTS SCHEDULE 2015 2014GH¢ GH¢
2a PROJECT GRANTSAFRICAN DEVELOPMENT BANK 169,416,474 166,139,241CANADA 13,886,589 24,060,000DENMARK 45,607,934 40,450,000FRANCE 0 710,000JAPAN 0 34,860,000NETHERLANDS 50,537,070 0SPAIN 956,313 0SWISS GOV'T 0 9,790,000EUROPEANS UNION 725,947,651 189,367,089UNITED KINGDOM 46,684,851 37,490,000UNITED NATIONS DEVELOPMENT PROGRAMME 89,378,262 31,044,304UNITED NATIONS POPULATION FUND (UNFPA) 6,045,986 7,151,899UNICEF 141,324,926 94,430,380WORLD BANK 155,268,081 142,310,127WFP 27,841,441 21,265,823USA 429,028,045 0DENMARK- SBS 4,580,900 0EUROPEAN COMMSSION-SBS 193,679,801 0DEPARTMENT FOR INTERNATIONAL DEVELOPMENT (DfID) 21,080,284 0TOTAL 2,121,264,608 799,068,861
2b PROGRAM GRANTCIDA 0 9,505,992CANADA 56,941,318 0FRANCE 0 1,306,433EUROPEAN COMMISSION 487,474,799 0SWISS GOVT 26,179,223 24,603,369UNITED KINGDOM 56,600,000 0DENMARK 36,811,152 69,719,107TOTAL PROGRAM 664,006,492 105,134,901
2c DDF GRANTSSWISS GOVT 11,432,432 6,750,770GERMANY 26,864,618 58,800,916IDA 29,199,890 0DENMARK 0 22,294,257TOTAL DDF 67,496,940 87,845,943
TOTAL GRANTS 2,852,768,040 992,049,705
39
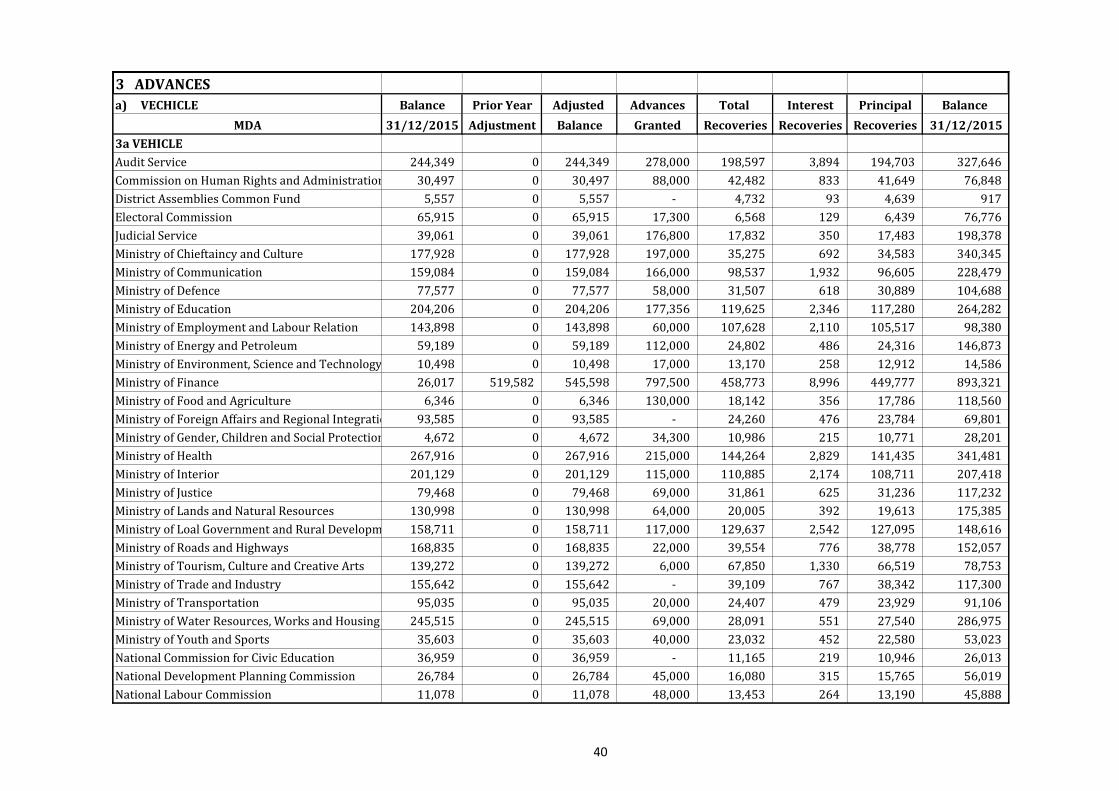
3 ADVANCES
a) VECHICLE Balance Prior Year Adjusted Advances Total Interest Principal Balance
MDA 31/12/2015 Adjustment Balance Granted Recoveries Recoveries Recoveries 31/12/2015
3a VEHICLE
Audit Service 244,349 0 244,349 278,000 198,597 3,894 194,703 327,646
Commission on Human Rights and Administration Justice30,497 0 30,497 88,000 42,482 833 41,649 76,848
District Assemblies Common Fund 5,557 0 5,557 - 4,732 93 4,639 917
Electoral Commission 65,915 0 65,915 17,300 6,568 129 6,439 76,776
Judicial Service 39,061 0 39,061 176,800 17,832 350 17,483 198,378
Ministry of Chieftaincy and Culture 177,928 0 177,928 197,000 35,275 692 34,583 340,345
Ministry of Communication 159,084 0 159,084 166,000 98,537 1,932 96,605 228,479
Ministry of Defence 77,577 0 77,577 58,000 31,507 618 30,889 104,688
Ministry of Education 204,206 0 204,206 177,356 119,625 2,346 117,280 264,282
Ministry of Employment and Labour Relation 143,898 0 143,898 60,000 107,628 2,110 105,517 98,380
Ministry of Energy and Petroleum 59,189 0 59,189 112,000 24,802 486 24,316 146,873
Ministry of Environment, Science and Technology 10,498 0 10,498 17,000 13,170 258 12,912 14,586
Ministry of Finance 26,017 519,582 545,598 797,500 458,773 8,996 449,777 893,321
Ministry of Food and Agriculture 6,346 0 6,346 130,000 18,142 356 17,786 118,560
Ministry of Foreign Affairs and Regional Integration 93,585 0 93,585 - 24,260 476 23,784 69,801
Ministry of Gender, Children and Social Protection 4,672 0 4,672 34,300 10,986 215 10,771 28,201
Ministry of Health 267,916 0 267,916 215,000 144,264 2,829 141,435 341,481
Ministry of Interior 201,129 0 201,129 115,000 110,885 2,174 108,711 207,418
Ministry of Justice 79,468 0 79,468 69,000 31,861 625 31,236 117,232
Ministry of Lands and Natural Resources 130,998 0 130,998 64,000 20,005 392 19,613 175,385
Ministry of Loal Government and Rural Development 158,711 0 158,711 117,000 129,637 2,542 127,095 148,616
Ministry of Roads and Highways 168,835 0 168,835 22,000 39,554 776 38,778 152,057
Ministry of Tourism, Culture and Creative Arts 139,272 0 139,272 6,000 67,850 1,330 66,519 78,753
Ministry of Trade and Industry 155,642 0 155,642 - 39,109 767 38,342 117,300
Ministry of Transportation 95,035 0 95,035 20,000 24,407 479 23,929 91,106
Ministry of Water Resources, Works and Housing 245,515 0 245,515 69,000 28,091 551 27,540 286,975
Ministry of Youth and Sports 35,603 0 35,603 40,000 23,032 452 22,580 53,023
National Commission for Civic Education 36,959 0 36,959 - 11,165 219 10,946 26,013
National Development Planning Commission 26,784 0 26,784 45,000 16,080 315 15,765 56,019
National Labour Commission 11,078 0 11,078 48,000 13,453 264 13,190 45,888
40
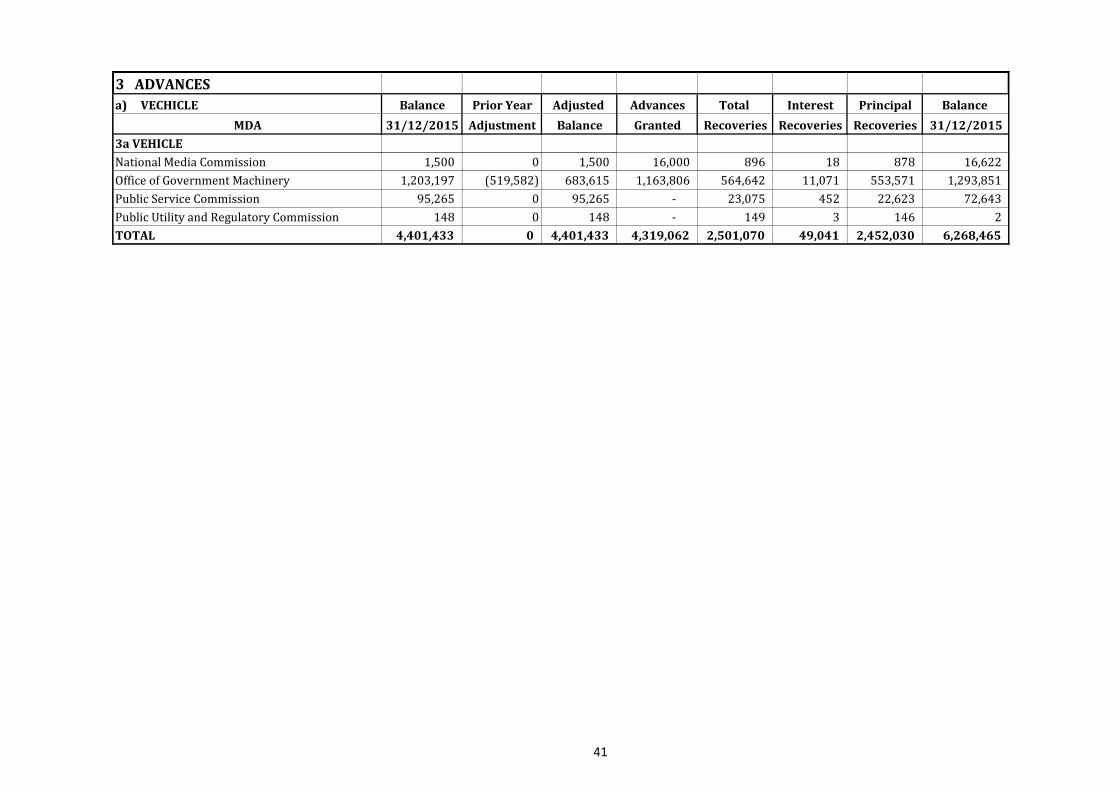
3 ADVANCES
a) VECHICLE Balance Prior Year Adjusted Advances Total Interest Principal Balance
MDA 31/12/2015 Adjustment Balance Granted Recoveries Recoveries Recoveries 31/12/2015
3a VEHICLE
National Media Commission 1,500 0 1,500 16,000 896 18 878 16,622
Office of Government Machinery 1,203,197 (519,582) 683,615 1,163,806 564,642 11,071 553,571 1,293,851
Public Service Commission 95,265 0 95,265 - 23,075 452 22,623 72,643
Public Utility and Regulatory Commission 148 0 148 - 149 3 146 2
TOTAL 4,401,433 0 4,401,433 4,319,062 2,501,070 49,041 2,452,030 6,268,465
41
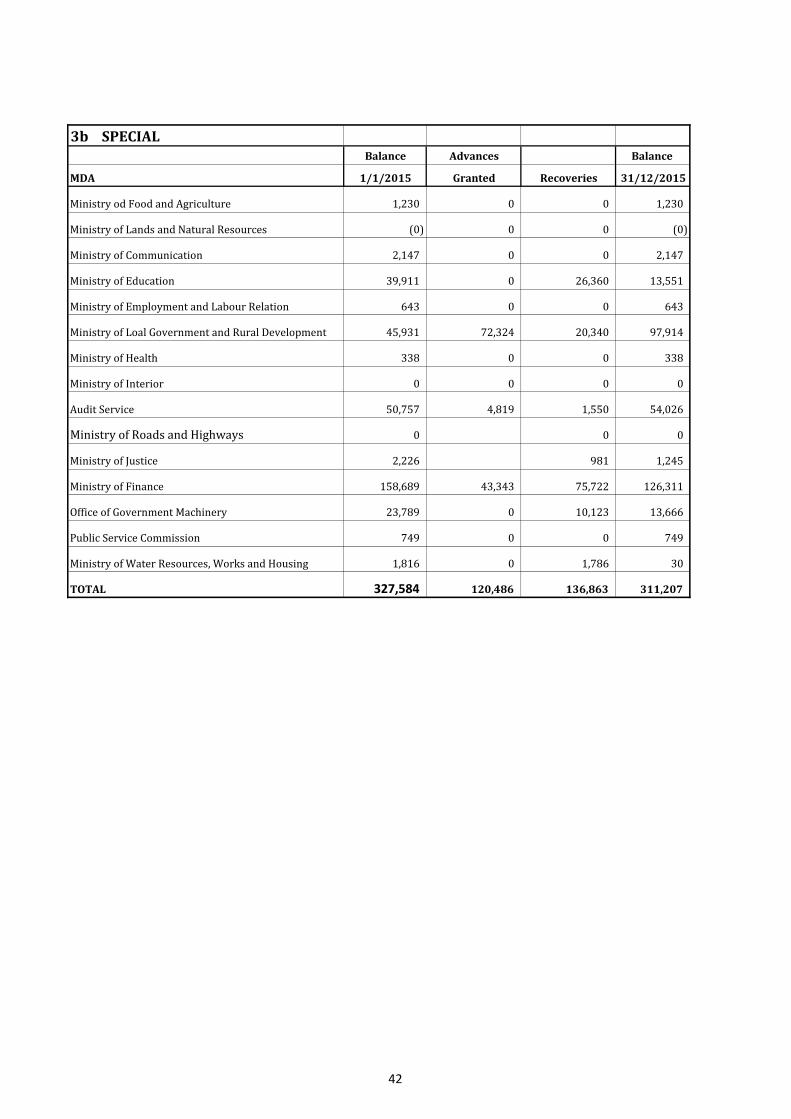
3b SPECIALBalance Advances Balance
MDA 1/1/2015 Granted Recoveries 31/12/2015
Ministry od Food and Agriculture 1,230 0 0 1,230
Ministry of Lands and Natural Resources (0) 0 0 (0)
Ministry of Communication 2,147 0 0 2,147
Ministry of Education 39,911 0 26,360 13,551
Ministry of Employment and Labour Relation 643 0 0 643
Ministry of Loal Government and Rural Development 45,931 72,324 20,340 97,914
Ministry of Health 338 0 0 338
Ministry of Interior 0 0 0 0
Audit Service 50,757 4,819 1,550 54,026
Ministry of Roads and Highways 0 0 0
Ministry of Justice 2,226 981 1,245
Ministry of Finance 158,689 43,343 75,722 126,311
Office of Government Machinery 23,789 0 10,123 13,666
Public Service Commission 749 0 0 749
Ministry of Water Resources, Works and Housing 1,816 0 1,786 30
TOTAL 327,584 120,486 136,863 311,207
42
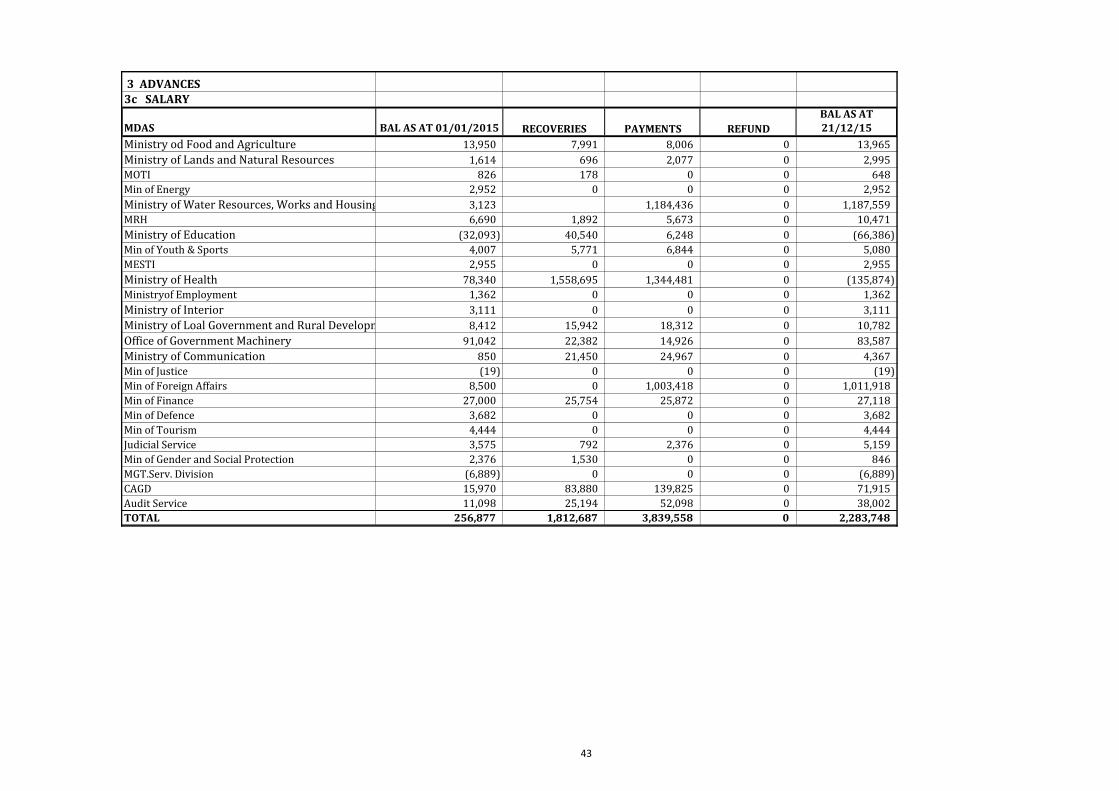
3 ADVANCES 3c SALARY
MDAS BAL AS AT 01/01/2015 RECOVERIES PAYMENTS REFUND
BAL AS AT 21/12/15
Ministry od Food and Agriculture 13,950 7,991 8,006 0 13,965
Ministry of Lands and Natural Resources 1,614 696 2,077 0 2,995
MOTI 826 178 0 0 648
Min of Energy 2,952 0 0 0 2,952
Ministry of Water Resources, Works and Housing 3,123 1,184,436 0 1,187,559
MRH 6,690 1,892 5,673 0 10,471
Ministry of Education (32,093) 40,540 6,248 0 (66,386)
Min of Youth & Sports 4,007 5,771 6,844 0 5,080
MESTI 2,955 0 0 0 2,955
Ministry of Health 78,340 1,558,695 1,344,481 0 (135,874)
Ministryof Employment 1,362 0 0 0 1,362
Ministry of Interior 3,111 0 0 0 3,111
Ministry of Loal Government and Rural Development 8,412 15,942 18,312 0 10,782
Office of Government Machinery 91,042 22,382 14,926 0 83,587
Ministry of Communication 850 21,450 24,967 0 4,367
Min of Justice (19) 0 0 0 (19)
Min of Foreign Affairs 8,500 0 1,003,418 0 1,011,918
Min of Finance 27,000 25,754 25,872 0 27,118
Min of Defence 3,682 0 0 0 3,682
Min of Tourism 4,444 0 0 0 4,444
Judicial Service 3,575 792 2,376 0 5,159
Min of Gender and Social Protection 2,376 1,530 0 0 846
MGT.Serv. Division (6,889) 0 0 0 (6,889)
CAGD 15,970 83,880 139,825 0 71,915
Audit Service 11,098 25,194 52,098 0 38,002
TOTAL 256,877 1,812,687 3,839,558 0 2,283,748
43
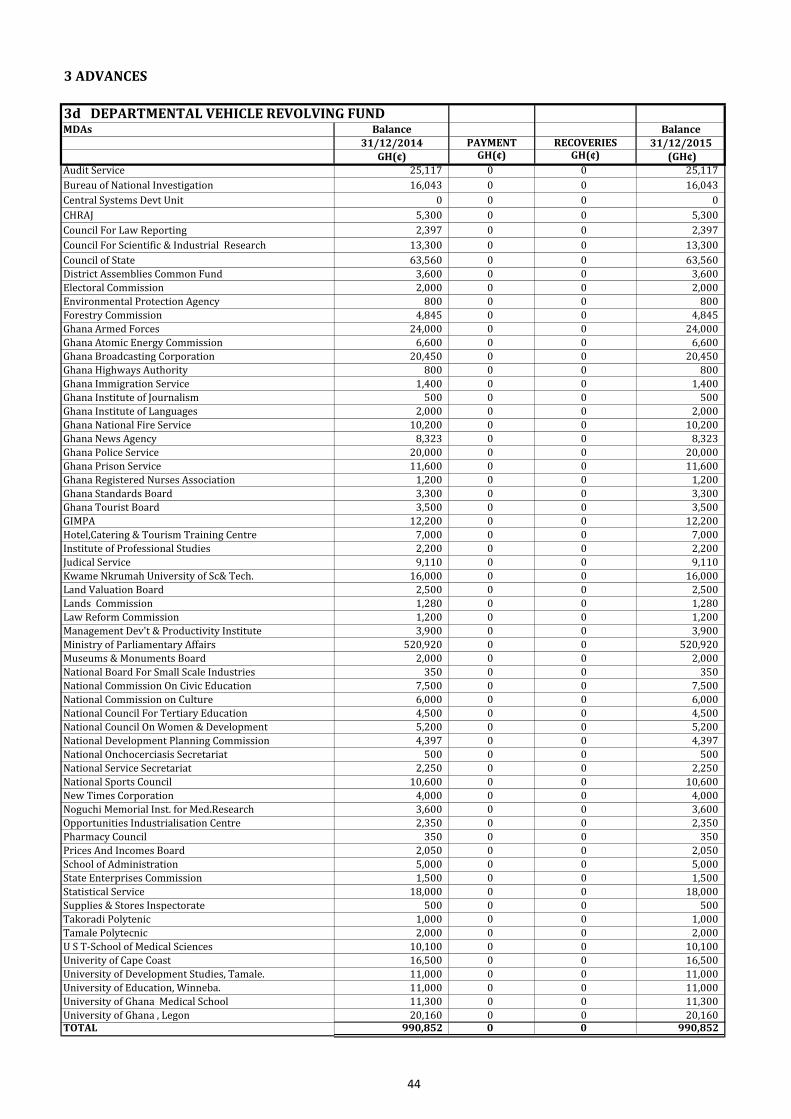
3 ADVANCES
3d DEPARTMENTAL VEHICLE REVOLVING FUND MDAs Balance Balance
31/12/2014 PAYMENT RECOVERIES 31/12/2015
GH(¢) GH(¢) GH(¢) (GH¢)Audit Service 25,117 0 0 25,117
Bureau of National Investigation 16,043 0 0 16,043
Central Systems Devt Unit 0 0 0 0
CHRAJ 5,300 0 0 5,300
Council For Law Reporting 2,397 0 0 2,397
Council For Scientific & Industrial Research 13,300 0 0 13,300
Council of State 63,560 0 0 63,560
District Assemblies Common Fund 3,600 0 0 3,600
Electoral Commission 2,000 0 0 2,000
Environmental Protection Agency 800 0 0 800
Forestry Commission 4,845 0 0 4,845
Ghana Armed Forces 24,000 0 0 24,000
Ghana Atomic Energy Commission 6,600 0 0 6,600
Ghana Broadcasting Corporation 20,450 0 0 20,450
Ghana Highways Authority 800 0 0 800
Ghana Immigration Service 1,400 0 0 1,400
Ghana Institute of Journalism 500 0 0 500
Ghana Institute of Languages 2,000 0 0 2,000
Ghana National Fire Service 10,200 0 0 10,200
Ghana News Agency 8,323 0 0 8,323
Ghana Police Service 20,000 0 0 20,000
Ghana Prison Service 11,600 0 0 11,600
Ghana Registered Nurses Association 1,200 0 0 1,200
Ghana Standards Board 3,300 0 0 3,300
Ghana Tourist Board 3,500 0 0 3,500
GIMPA 12,200 0 0 12,200
Hotel,Catering & Tourism Training Centre 7,000 0 0 7,000
Institute of Professional Studies 2,200 0 0 2,200
Judical Service 9,110 0 0 9,110
Kwame Nkrumah University of Sc& Tech. 16,000 0 0 16,000
Land Valuation Board 2,500 0 0 2,500
Lands Commission 1,280 0 0 1,280
Law Reform Commission 1,200 0 0 1,200
Management Dev't & Productivity Institute 3,900 0 0 3,900
Ministry of Parliamentary Affairs 520,920 0 0 520,920
Museums & Monuments Board 2,000 0 0 2,000
National Board For Small Scale Industries 350 0 0 350
National Commission On Civic Education 7,500 0 0 7,500
National Commission on Culture 6,000 0 0 6,000
National Council For Tertiary Education 4,500 0 0 4,500
National Council On Women & Development 5,200 0 0 5,200
National Development Planning Commission 4,397 0 0 4,397
National Onchocerciasis Secretariat 500 0 0 500
National Service Secretariat 2,250 0 0 2,250
National Sports Council 10,600 0 0 10,600
New Times Corporation 4,000 0 0 4,000
Noguchi Memorial Inst. for Med.Research 3,600 0 0 3,600
Opportunities Industrialisation Centre 2,350 0 0 2,350
Pharmacy Council 350 0 0 350
Prices And Incomes Board 2,050 0 0 2,050
School of Administration 5,000 0 0 5,000
State Enterprises Commission 1,500 0 0 1,500
Statistical Service 18,000 0 0 18,000
Supplies & Stores Inspectorate 500 0 0 500
Takoradi Polytenic 1,000 0 0 1,000
Tamale Polytecnic 2,000 0 0 2,000
U S T-School of Medical Sciences 10,100 0 0 10,100
Univerity of Cape Coast 16,500 0 0 16,500
University of Development Studies, Tamale. 11,000 0 0 11,000
University of Education, Winneba. 11,000 0 0 11,000
University of Ghana Medical School 11,300 0 0 11,300
University of Ghana , Legon 20,160 0 0 20,160 TOTAL 990,852 0 0 990,852
44

4. LOANS RECEIVABLES SCHEDULEBalance as at Loans Balance as at
INSTITUTION 31/12/2014 Adjustments Granted Recoveries 31/12/20154a
G E N E R A L
Ghana Railway and Ports Authority 921,686 0 0 0 921,686
Local Authorities 293 0 0 0 293
TOTAL 921,980 0 0 0 921,980
4b
PUBLIC BOARDS AND CORPORATION
State Farms Corporation 32,886 0 0 0 32,886
New Times Corporation 74,352 0 0 0 74,352
Ghana Enterprise Development Commission 883 0 0 0 883
Agricultural Development Bank 38,967,282 0 0 0 38,967,282
State Transport Corporation 6,775,392 0 0 0 6,775,392
National Investment Bank 5,067 0 0 0 5,067
State Gold Mining Corpration 140,430 0 0 0 140,430
Post and Telecommunication (Ghana Telecom) 5,108,187 0 0 0 5,108,187
Ghana Agricultural Development Corporation 630 0 0 0 630
Architectural Engineering Services Corporation 79,106 0 0 0 79,106
Ghanaian Industrial Development Corporation 1,746 0 0 0 1,746
State Hotels Corporation 46,002 0 0 0 46,002
State Construction Corporation 275,644 0 0 0 275,644
State Housing Corporation 254,746 0 0 0 254,746
Ghana Supply Commission 3,282 0 0 0 3,282
Omnibus Services Authority 20,509,151 0 0 0 20,509,151
Ghana Tourist Corporation 20 0 0 0 20
Ghana Water and Sewerage Corporation (GWCL) 118,333,339 0 0 0 118,333,339
Food Production Corporation 112,388 0 0 0 112,388
Ghana Food Distribution Corporation 583 0 0 0 583
Aluminium Industries Commission 1,018 0 0 0 1,018
Ghana Airways Corporation 23,553,437 0 0 0 23,553,437
Ghana National Manganese Corporation 378,949 0 0 0 378,949
Gonja Development Corporation 210 0 0 0 210
West African Airways Corporation 3 0 0 0 3
State Fishing Corporation 14,253 0 0 0 14,253
Western Regional Development Corporation 117 0 0 0 117
Brong Ahafo Regional Development Corporation 3,866 0 0 0 3,866
Ghana Railways Corporation 484,552 0 0 0 484,552
Upper East Development Corporation 2,011 0 0 0 2,011
State Oil Palm Plantation Corporation 2,500 0 0 0 2,500
Electricity Company of Ghana 180,599,000 0 0 2,000,000 178,599,000
GIHOC - Tema Steelworks 772 0 0 0 772
GIHOC - Farms 233 0 0 0 233
GIHOC - Footwear 29,228 0 0 0 29,228
GIHOC - Vegetable Oil Mills 9,637 0 0 0 9,637
GIHOC - Fibre Bag 243 0 0 0 243
GIHOC - Fibre Products 106,418 0 0 0 106,418
GIHOC - Manufacturing Co. 6,188 0 0 0 6,188
GIHOC - Mosquito Coil 3,531 0 0 0 3,531
GIHOC - Marbles 8,925 0 0 0 8,925
GIHOC - Meat (Tema & Bolga) 22,128 0 0 0 22,128
GIHOC - Boatyards (Mumford) 1,885 0 0 0 1,885
GIHOC - Boatyards (Tema) 24,637 0 0 0 24,637
GIHOC - Cannery (Pwulugu) 4,090 0 0 0 4,090
GIHOC - Refrigeration & Household Prod. 5,505 0 0 0 5,505
GIHOC - Cannery (Wenchi) 3,639 0 0 0 3,639
45
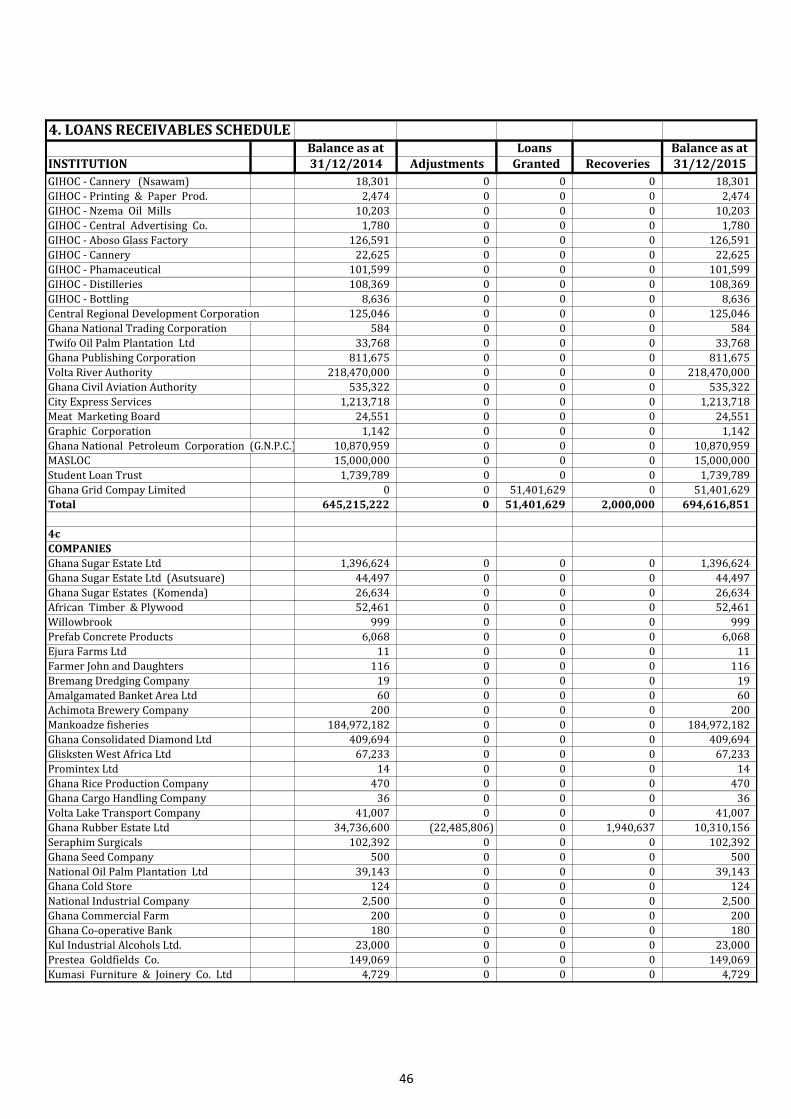
4. LOANS RECEIVABLES SCHEDULEBalance as at Loans Balance as at
INSTITUTION 31/12/2014 Adjustments Granted Recoveries 31/12/2015
GIHOC - Cannery (Nsawam) 18,301 0 0 0 18,301
GIHOC - Printing & Paper Prod. 2,474 0 0 0 2,474
GIHOC - Nzema Oil Mills 10,203 0 0 0 10,203
GIHOC - Central Advertising Co. 1,780 0 0 0 1,780
GIHOC - Aboso Glass Factory 126,591 0 0 0 126,591
GIHOC - Cannery 22,625 0 0 0 22,625
GIHOC - Phamaceutical 101,599 0 0 0 101,599
GIHOC - Distilleries 108,369 0 0 0 108,369
GIHOC - Bottling 8,636 0 0 0 8,636
Central Regional Development Corporation 125,046 0 0 0 125,046
Ghana National Trading Corporation 584 0 0 0 584
Twifo Oil Palm Plantation Ltd 33,768 0 0 0 33,768
Ghana Publishing Corporation 811,675 0 0 0 811,675
Volta River Authority 218,470,000 0 0 0 218,470,000
Ghana Civil Aviation Authority 535,322 0 0 0 535,322
City Express Services 1,213,718 0 0 0 1,213,718
Meat Marketing Board 24,551 0 0 0 24,551
Graphic Corporation 1,142 0 0 0 1,142
Ghana National Petroleum Corporation (G.N.P.C.) 10,870,959 0 0 0 10,870,959
MASLOC 15,000,000 0 0 0 15,000,000
Student Loan Trust 1,739,789 0 0 0 1,739,789
Ghana Grid Compay Limited 0 0 51,401,629 0 51,401,629
Total 645,215,222 0 51,401,629 2,000,000 694,616,851
4c
COMPANIES
Ghana Sugar Estate Ltd 1,396,624 0 0 0 1,396,624
Ghana Sugar Estate Ltd (Asutsuare) 44,497 0 0 0 44,497
Ghana Sugar Estates (Komenda) 26,634 0 0 0 26,634
African Timber & Plywood 52,461 0 0 0 52,461
Willowbrook 999 0 0 0 999
Prefab Concrete Products 6,068 0 0 0 6,068
Ejura Farms Ltd 11 0 0 0 11
Farmer John and Daughters 116 0 0 0 116
Bremang Dredging Company 19 0 0 0 19
Amalgamated Banket Area Ltd 60 0 0 0 60
Achimota Brewery Company 200 0 0 0 200
Mankoadze fisheries 184,972,182 0 0 0 184,972,182
Ghana Consolidated Diamond Ltd 409,694 0 0 0 409,694
Glisksten West Africa Ltd 67,233 0 0 0 67,233
Promintex Ltd 14 0 0 0 14
Ghana Rice Production Company 470 0 0 0 470
Ghana Cargo Handling Company 36 0 0 0 36
Volta Lake Transport Company 41,007 0 0 0 41,007
Ghana Rubber Estate Ltd 34,736,600 (22,485,806) 0 1,940,637 10,310,156
Seraphim Surgicals 102,392 0 0 0 102,392
Ghana Seed Company 500 0 0 0 500
National Oil Palm Plantation Ltd 39,143 0 0 0 39,143
Ghana Cold Store 124 0 0 0 124
National Industrial Company 2,500 0 0 0 2,500
Ghana Commercial Farm 200 0 0 0 200
Ghana Co-operative Bank 180 0 0 0 180
Kul Industrial Alcohols Ltd. 23,000 0 0 0 23,000
Prestea Goldfields Co. 149,069 0 0 0 149,069
Kumasi Furniture & Joinery Co. Ltd 4,729 0 0 0 4,729
46
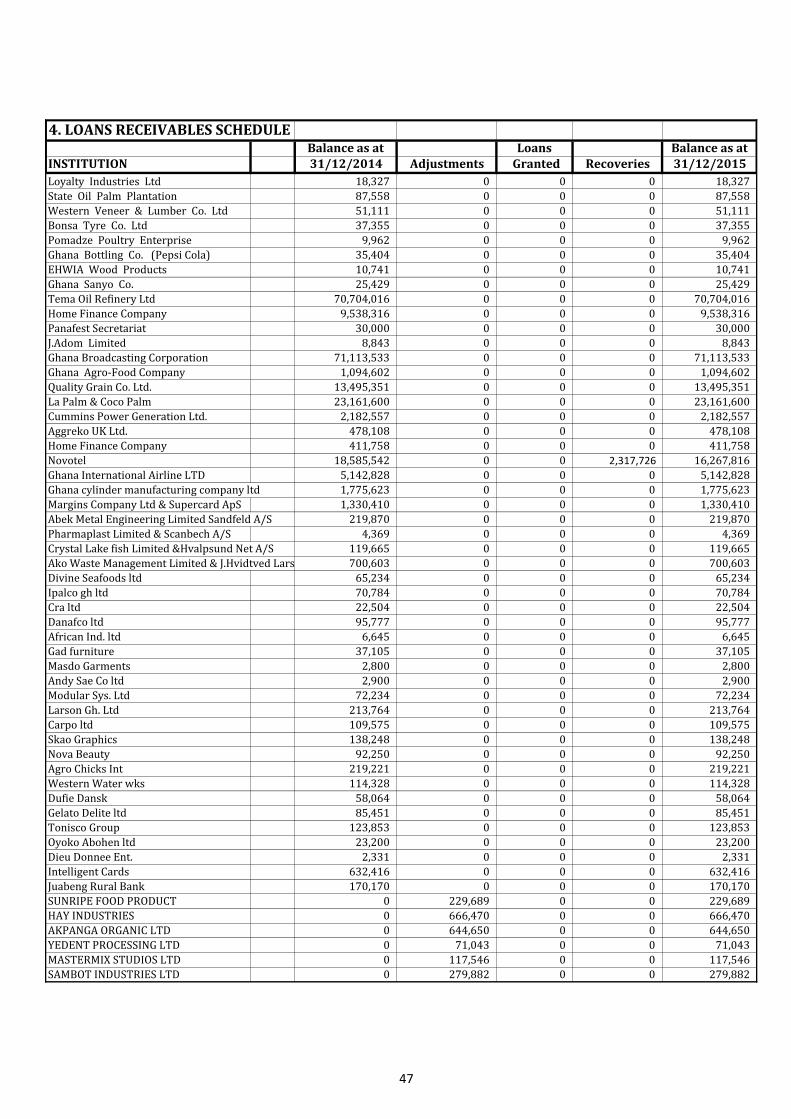
4. LOANS RECEIVABLES SCHEDULEBalance as at Loans Balance as at
INSTITUTION 31/12/2014 Adjustments Granted Recoveries 31/12/2015
Loyalty Industries Ltd 18,327 0 0 0 18,327
State Oil Palm Plantation 87,558 0 0 0 87,558
Western Veneer & Lumber Co. Ltd 51,111 0 0 0 51,111
Bonsa Tyre Co. Ltd 37,355 0 0 0 37,355
Pomadze Poultry Enterprise 9,962 0 0 0 9,962
Ghana Bottling Co. (Pepsi Cola) 35,404 0 0 0 35,404
EHWIA Wood Products 10,741 0 0 0 10,741
Ghana Sanyo Co. 25,429 0 0 0 25,429
Tema Oil Refinery Ltd 70,704,016 0 0 0 70,704,016
Home Finance Company 9,538,316 0 0 0 9,538,316
Panafest Secretariat 30,000 0 0 0 30,000
J.Adom Limited 8,843 0 0 0 8,843
Ghana Broadcasting Corporation 71,113,533 0 0 0 71,113,533
Ghana Agro-Food Company 1,094,602 0 0 0 1,094,602
Quality Grain Co. Ltd. 13,495,351 0 0 0 13,495,351
La Palm & Coco Palm 23,161,600 0 0 0 23,161,600
Cummins Power Generation Ltd. 2,182,557 0 0 0 2,182,557
Aggreko UK Ltd. 478,108 0 0 0 478,108
Home Finance Company 411,758 0 0 0 411,758
Novotel 18,585,542 0 0 2,317,726 16,267,816
Ghana International Airline LTD 5,142,828 0 0 0 5,142,828
Ghana cylinder manufacturing company ltd 1,775,623 0 0 0 1,775,623
Margins Company Ltd & Supercard ApS 1,330,410 0 0 0 1,330,410
Abek Metal Engineering Limited Sandfeld A/S 219,870 0 0 0 219,870
Pharmaplast Limited & Scanbech A/S 4,369 0 0 0 4,369
Crystal Lake fish Limited &Hvalpsund Net A/S 119,665 0 0 0 119,665
Ako Waste Management Limited & J.Hvidtved Larsen A/S 700,603 0 0 0 700,603
Divine Seafoods ltd 65,234 0 0 0 65,234
Ipalco gh ltd 70,784 0 0 0 70,784
Cra ltd 22,504 0 0 0 22,504
Danafco ltd 95,777 0 0 0 95,777
African Ind. ltd 6,645 0 0 0 6,645
Gad furniture 37,105 0 0 0 37,105
Masdo Garments 2,800 0 0 0 2,800
Andy Sae Co ltd 2,900 0 0 0 2,900
Modular Sys. Ltd 72,234 0 0 0 72,234
Larson Gh. Ltd 213,764 0 0 0 213,764
Carpo ltd 109,575 0 0 0 109,575
Skao Graphics 138,248 0 0 0 138,248
Nova Beauty 92,250 0 0 0 92,250
Agro Chicks Int 219,221 0 0 0 219,221
Western Water wks 114,328 0 0 0 114,328
Dufie Dansk 58,064 0 0 0 58,064
Gelato Delite ltd 85,451 0 0 0 85,451
Tonisco Group 123,853 0 0 0 123,853
Oyoko Abohen ltd 23,200 0 0 0 23,200
Dieu Donnee Ent. 2,331 0 0 0 2,331
Intelligent Cards 632,416 0 0 0 632,416
Juabeng Rural Bank 170,170 0 0 0 170,170
SUNRIPE FOOD PRODUCT 0 229,689 0 0 229,689
HAY INDUSTRIES 0 666,470 0 0 666,470
AKPANGA ORGANIC LTD 0 644,650 0 0 644,650
YEDENT PROCESSING LTD 0 71,043 0 0 71,043
MASTERMIX STUDIOS LTD 0 117,546 0 0 117,546
SAMBOT INDUSTRIES LTD 0 279,882 0 0 279,882
47
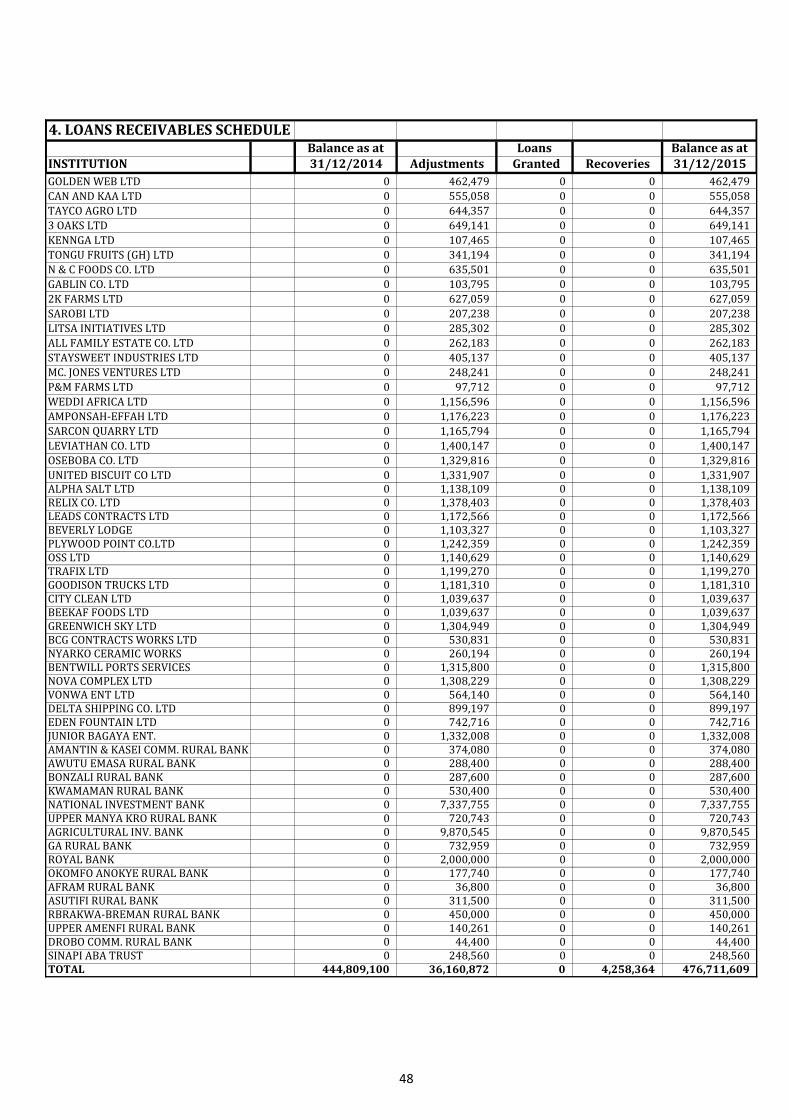
4. LOANS RECEIVABLES SCHEDULEBalance as at Loans Balance as at
INSTITUTION 31/12/2014 Adjustments Granted Recoveries 31/12/2015
GOLDEN WEB LTD 0 462,479 0 0 462,479
CAN AND KAA LTD 0 555,058 0 0 555,058
TAYCO AGRO LTD 0 644,357 0 0 644,357
3 OAKS LTD 0 649,141 0 0 649,141
KENNGA LTD 0 107,465 0 0 107,465
TONGU FRUITS (GH) LTD 0 341,194 0 0 341,194
N & C FOODS CO. LTD 0 635,501 0 0 635,501
GABLIN CO. LTD 0 103,795 0 0 103,795
2K FARMS LTD 0 627,059 0 0 627,059
SAROBI LTD 0 207,238 0 0 207,238
LITSA INITIATIVES LTD 0 285,302 0 0 285,302
ALL FAMILY ESTATE CO. LTD 0 262,183 0 0 262,183
STAYSWEET INDUSTRIES LTD 0 405,137 0 0 405,137
MC. JONES VENTURES LTD 0 248,241 0 0 248,241
P&M FARMS LTD 0 97,712 0 0 97,712
WEDDI AFRICA LTD 0 1,156,596 0 0 1,156,596
AMPONSAH-EFFAH LTD 0 1,176,223 0 0 1,176,223
SARCON QUARRY LTD 0 1,165,794 0 0 1,165,794
LEVIATHAN CO. LTD 0 1,400,147 0 0 1,400,147
OSEBOBA CO. LTD 0 1,329,816 0 0 1,329,816
UNITED BISCUIT CO LTD 0 1,331,907 0 0 1,331,907ALPHA SALT LTD 0 1,138,109 0 0 1,138,109RELIX CO. LTD 0 1,378,403 0 0 1,378,403LEADS CONTRACTS LTD 0 1,172,566 0 0 1,172,566BEVERLY LODGE 0 1,103,327 0 0 1,103,327PLYWOOD POINT CO.LTD 0 1,242,359 0 0 1,242,359OSS LTD 0 1,140,629 0 0 1,140,629TRAFIX LTD 0 1,199,270 0 0 1,199,270GOODISON TRUCKS LTD 0 1,181,310 0 0 1,181,310CITY CLEAN LTD 0 1,039,637 0 0 1,039,637BEEKAF FOODS LTD 0 1,039,637 0 0 1,039,637GREENWICH SKY LTD 0 1,304,949 0 0 1,304,949BCG CONTRACTS WORKS LTD 0 530,831 0 0 530,831NYARKO CERAMIC WORKS 0 260,194 0 0 260,194BENTWILL PORTS SERVICES 0 1,315,800 0 0 1,315,800NOVA COMPLEX LTD 0 1,308,229 0 0 1,308,229VONWA ENT LTD 0 564,140 0 0 564,140DELTA SHIPPING CO. LTD 0 899,197 0 0 899,197EDEN FOUNTAIN LTD 0 742,716 0 0 742,716JUNIOR BAGAYA ENT. 0 1,332,008 0 0 1,332,008AMANTIN & KASEI COMM. RURAL BANK 0 374,080 0 0 374,080AWUTU EMASA RURAL BANK 0 288,400 0 0 288,400BONZALI RURAL BANK 0 287,600 0 0 287,600KWAMAMAN RURAL BANK 0 530,400 0 0 530,400NATIONAL INVESTMENT BANK 0 7,337,755 0 0 7,337,755UPPER MANYA KRO RURAL BANK 0 720,743 0 0 720,743AGRICULTURAL INV. BANK 0 9,870,545 0 0 9,870,545GA RURAL BANK 0 732,959 0 0 732,959ROYAL BANK 0 2,000,000 0 0 2,000,000OKOMFO ANOKYE RURAL BANK 0 177,740 0 0 177,740AFRAM RURAL BANK 0 36,800 0 0 36,800ASUTIFI RURAL BANK 0 311,500 0 0 311,500RBRAKWA-BREMAN RURAL BANK 0 450,000 0 0 450,000UPPER AMENFI RURAL BANK 0 140,261 0 0 140,261DROBO COMM. RURAL BANK 0 44,400 0 0 44,400SINAPI ABA TRUST 0 248,560 0 0 248,560TOTAL 444,809,100 36,160,872 0 4,258,364 476,711,609
48

4. LOANS RECEIVABLES SCHEDULEBalance as at Loans Balance as at
INSTITUTION 31/12/2014 Adjustments Granted Recoveries 31/12/2015
ECGD LOANS RECEIVABLES SCHEDULE
Mallam Issa Issahatu 1,710,870 0 0 0 1,710,870
Marine Construction Ltd 4,760,319 0 0 0 4,760,319
Frandesco (WA) Ltd 879,195 0 0 0 879,195
KASAP Ltd 13,186,628 0 0 0 13,186,628
J. Stanley Owusu & Co. Ltd 7,511,458 0 0 0 7,511,458
Goi-Kposem 8,924,046 0 0 0 8,924,046
K. E. & Sons Ltd 1,987,322 0 0 0 1,987,322
Danielli Mabey Ltd 9,617,776 0 0 0 9,617,776
Mabey & Johnson 22,272,366 0 0 0 22,272,366
Chartsworth Carpets (GH) Ltd 4,712,391 0 0 0 4,712,391
Pentrex (GH) Ltd 2,436,941 0 0 0 2,436,941
Franmar Joint Venture 18,875,703 0 0 0 18,875,703
Taysec 87,535,419 0 0 0 87,535,419
Kamara Group Ltd 3,250,589 0 0 0 3,250,589
Yiadom Builders Ltd 1,914,384 0 0 0 1,914,384
Ussuya(Ghana) Ltd 900,492 0 0 0 900,492
Bascom Works Ltd 2,657,870 0 0 0 2,657,870
Wunishie Secretariat Services 1,337,843 0 0 0 1,337,843
Progressive & Modern Company Ltd 3,722,580 0 0 0 3,722,580
Goi-Kposem 8,469,365 0 0 0 8,469,365
TOTAL 206,663,557 0 0 0 206,663,557
Export Finance Company (Austrian On-Lent Loan)
Alfralex Company Ltd 161,970 0 0 0 161,970
Alluvial Recovery System 21,799 0 0 0 21,799
Asamoah Raffan Works 212,458 0 0 0 212,458
Asihene Brothers 394,482 0 0 0 394,482
Cofie Zane Jewellery Ltd 23,652 0 0 0 23,652
Direct Arts Industries Ltd 147,626 0 0 0 147,626
Esterimo Packaging Ltd 128,020 0 0 0 128,020
Gellina Packaging Co Ltd 29,348 0 0 0 29,348
Gidama Wood Processing 404,529 0 0 0 404,529
Hicent Enterprise 45,020 0 0 0 45,020
J K Enterprise 26,760 0 0 0 26,760
Ken Sworth Mining & Cont. Limited 4,889 0 0 0 4,889
Lorando Mining Co. Limited 389,330 0 0 0 389,330
Louis Jewellery Factory Limited 6,496 0 0 0 6,496
Nana Boakye Austrian Casting Limited 374,134 0 0 0 374,134
Osei Research Centre 445,681 0 0 0 445,681
Osumanu Salt Industry Limited 117,800 0 0 0 117,800
Planstic Packaging Products Limited 47,852 0 0 0 47,852
Tropical Crop Export Limited 15,863 0 0 0 15,863
Tropical Golden Fruits Limited 373,571 0 0 0 373,571
West Africa Salt Limited 8,773 0 0 0 8,773
TOTAL 3,380,053 0 0 0 3,380,053
NON-PROJECT TYPE
NPT.9
MORTON EXCLUSIVE GBP 33,615 NPT.9 20,291 0 0 20,291 0
PASCO OSCO USD 227,872.04 NPT.9 72,454 (5,573) 0 66,880 0
TOTAL 92,745 (5,573) 0 87,171 0
49
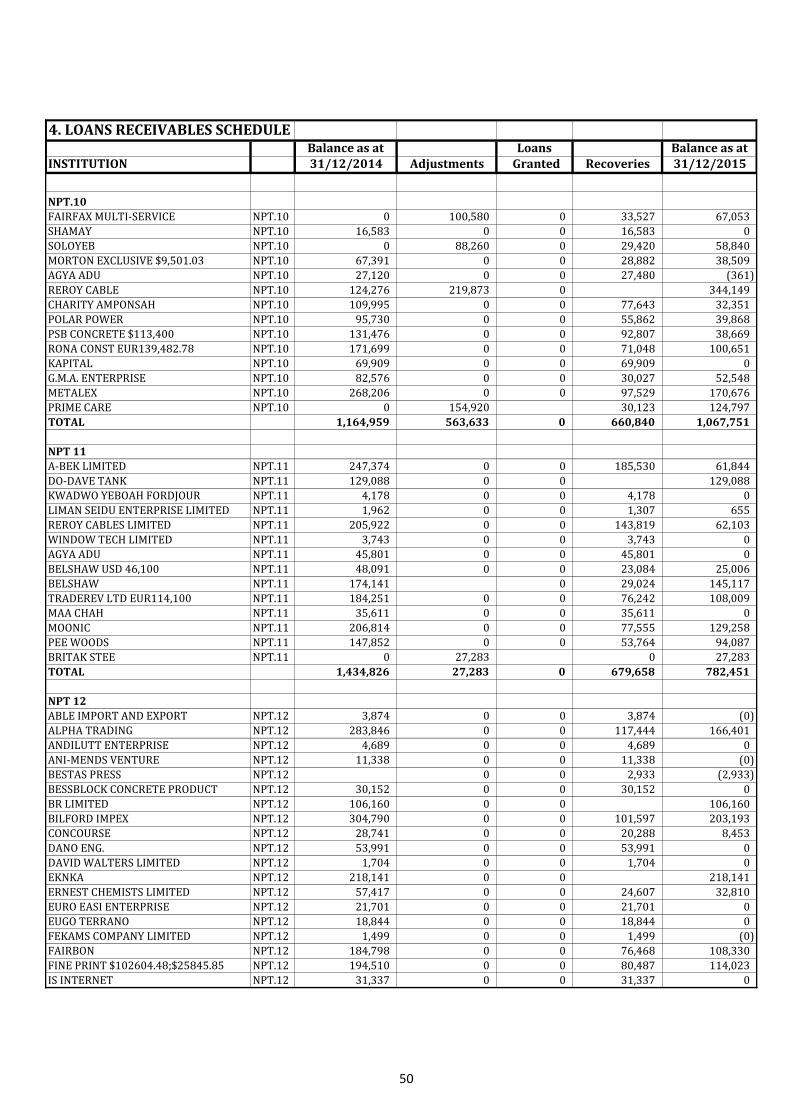
4. LOANS RECEIVABLES SCHEDULEBalance as at Loans Balance as at
INSTITUTION 31/12/2014 Adjustments Granted Recoveries 31/12/2015
NPT.10
FAIRFAX MULTI-SERVICE NPT.10 0 100,580 0 33,527 67,053
SHAMAY NPT.10 16,583 0 0 16,583 0
SOLOYEB NPT.10 0 88,260 0 29,420 58,840
MORTON EXCLUSIVE $9,501.03 NPT.10 67,391 0 0 28,882 38,509
AGYA ADU NPT.10 27,120 0 0 27,480 (361)
REROY CABLE NPT.10 124,276 219,873 0 344,149
CHARITY AMPONSAH NPT.10 109,995 0 0 77,643 32,351
POLAR POWER NPT.10 95,730 0 0 55,862 39,868
PSB CONCRETE $113,400 NPT.10 131,476 0 0 92,807 38,669
RONA CONST EUR139,482.78 NPT.10 171,699 0 0 71,048 100,651
KAPITAL NPT.10 69,909 0 0 69,909 0
G.M.A. ENTERPRISE NPT.10 82,576 0 0 30,027 52,548
METALEX NPT.10 268,206 0 0 97,529 170,676
PRIME CARE NPT.10 0 154,920 30,123 124,797
TOTAL 1,164,959 563,633 0 660,840 1,067,751
NPT 11
A-BEK LIMITED NPT.11 247,374 0 0 185,530 61,844
DO-DAVE TANK NPT.11 129,088 0 0 129,088
KWADWO YEBOAH FORDJOUR NPT.11 4,178 0 0 4,178 0
LIMAN SEIDU ENTERPRISE LIMITED NPT.11 1,962 0 0 1,307 655
REROY CABLES LIMITED NPT.11 205,922 0 0 143,819 62,103
WINDOW TECH LIMITED NPT.11 3,743 0 0 3,743 0
AGYA ADU NPT.11 45,801 0 0 45,801 0
BELSHAW USD 46,100 NPT.11 48,091 0 0 23,084 25,006
BELSHAW NPT.11 174,141 0 29,024 145,117
TRADEREV LTD EUR114,100 NPT.11 184,251 0 0 76,242 108,009
MAA CHAH NPT.11 35,611 0 0 35,611 0
MOONIC NPT.11 206,814 0 0 77,555 129,258
PEE WOODS NPT.11 147,852 0 0 53,764 94,087
BRITAK STEE NPT.11 0 27,283 0 27,283
TOTAL 1,434,826 27,283 0 679,658 782,451
NPT 12
ABLE IMPORT AND EXPORT NPT.12 3,874 0 0 3,874 (0)
ALPHA TRADING NPT.12 283,846 0 0 117,444 166,401
ANDILUTT ENTERPRISE NPT.12 4,689 0 0 4,689 0
ANI-MENDS VENTURE NPT.12 11,338 0 0 11,338 (0)
BESTAS PRESS NPT.12 0 0 2,933 (2,933)
BESSBLOCK CONCRETE PRODUCT NPT.12 30,152 0 0 30,152 0
BR LIMITED NPT.12 106,160 0 0 106,160
BILFORD IMPEX NPT.12 304,790 0 0 101,597 203,193
CONCOURSE NPT.12 28,741 0 0 20,288 8,453
DANO ENG. NPT.12 53,991 0 0 53,991 0
DAVID WALTERS LIMITED NPT.12 1,704 0 0 1,704 0
EKNKA NPT.12 218,141 0 0 218,141
ERNEST CHEMISTS LIMITED NPT.12 57,417 0 0 24,607 32,810
EURO EASI ENTERPRISE NPT.12 21,701 0 0 21,701 0
EUGO TERRANO NPT.12 18,844 0 0 18,844 0
FEKAMS COMPANY LIMITED NPT.12 1,499 0 0 1,499 (0)
FAIRBON NPT.12 184,798 0 0 76,468 108,330
FINE PRINT $102604.48;$25845.85 NPT.12 194,510 0 0 80,487 114,023
IS INTERNET NPT.12 31,337 0 0 31,337 0
50

4. LOANS RECEIVABLES SCHEDULEBalance as at Loans Balance as at
INSTITUTION 31/12/2014 Adjustments Granted Recoveries 31/12/2015
INDUSTRIAL NPT.12 81,716 0 0 81,716 0
JANDEL LIMITED NPT.12 32,199 0 0 18,638 13,561
KALVICO COMPANY LIMITED NPT.12 1,172 0 0 1,172 (0)
KWAME ASANTE AND ASSOCIATES NPT.12 313 0 313
LETAFORM DYNAMICS LIMITED NPT.12 34,648 0 0 34,648 0
LILYGOLD NPT.12 571,552 0 571,552
MAKAM KAOLIN NPT.12 66,670 0 0 22,223 44,446
MASKA CONSTRUCTION WORKS NPT.12 3,856 0 0 3,856 (0)
MARKYS GH. $37,224.99;$178,100 NPT.12 246,996 0 0 102,205 144,791
NANA ADU NPT.12 26,399 0 0 26,399 0
NATIONWIDE $171,502:$23,950 NPT.12 274,034 0 0 117,452 156,582
NIC-JAY ASSOCIATES NPT.12 3,559 0 0 3,559 0
OFORI-POKU COMPANY LTD NPT.12 22,870 0 0 22,870 (0)
REGIMANUEL GRAY LIMITED NPT.12 1,499 0 0 1,499 (0)
SOLID DEVELOPMENT LIMITED NPT.12 8,553 0 0 8,553 0
SUDO CONSTRUCTION LIMITED NPT.12 3,966 0 0 3,966 (0)
WASTE LANDFIELDS COMPANY NPT.12 3,962 0 0 3,962 0
PHILIO DELIO NPT.12 90,498 0 0 9,015 81,483
TEMA BONDED NPT.12 251,007 0 0 177,181 73,825
THORPE ROAD $76,126.21 NPT.12 112,161 0 0 46,411 65,750
UNIC SOLUTION $171,502;$23,950 NPT.12 324,368 0 0 134,221 190,147
REROY NPT.12 344,988 20,293 0 365,282
TOTAL 4,064,516 20,293 0 1,422,500 2,662,309
NPT 13
HAMDARK USD 20111228 NPT 13 NPT.13 147,643 0 0 136,284 11,359
ASAYAK GLOBAL NPT.13 16,588 0 0 16,588 0
ATTACHY CONSTRU NPT.13 190,291 0 0 190,291 0
AMPONSAH-EFFAH NPT.13 27,712 0 0 27,712 0
ADEKESE FARMS NPT.13 6,310 0 0 6,310 0
AGYARE AND SONS NPT.13 54,051 0 0 48,648 5,404
ABL ENVIROMENT NPT.13 29,875 0 0 29,875 0
ABOAFO BUYING CO. NPT.13 25,389 0 0 25,389 0
AGYEI BUILD NPT.13 41,984 0 0 41,984 0
BESTES PRESS NPT.13 76,541 0 0 54,029 22,512
BELLTOP GH LTD NPT.13 21,026 0 0 21,026 0
BRA GHA NPT.13 20,036 0 0 20,036 0
BRIM OIL $57,512.11 NPT.13 28,768 0 0 28,768 0
CONNIKAYE LTD. NPT.13 51,649 0 0 51,649 0
CREATOR DIGITAL NPT.13 32,800 0 0 35,694 (2,894)
DAN U CO. $111,467.03 NPT.13 55,756 0 0 55,756 0
DAVID WALTER NPT.13 41,875 0 0 41,875 0
EXCELLENT BUILDER NPT.13 42,013 0 0 38,022 3,991
EXECUTIVE ELITE NPT.13 78,365 0 0 78,365 0
EUROPELAND NPT.13 72,915 0 0 51,469 21,446
FACKAP CO. NPT.13 51,608 0 0 51,608 0
FC COSMETICS IND NPT.13 35,800 0 0 25,271 10,530
FRIMATA CHEMICALS NPT.13 50,452 0 0 50,452 0
GLOBAL PAK NPT.13 12,841 0 0 9,064 3,777
GRANDE DESIGNS NPT.13 20,498 0 0 20,498 0
GELINA PACKAGING NPT.13 59,997 0 0 59,997 0
GHANA CYLINDER NPT.13 144,599 0 0 102,070 42,529
INDUSTRIAL PACK NPT.13 19,986 0 0 19,986 0
51
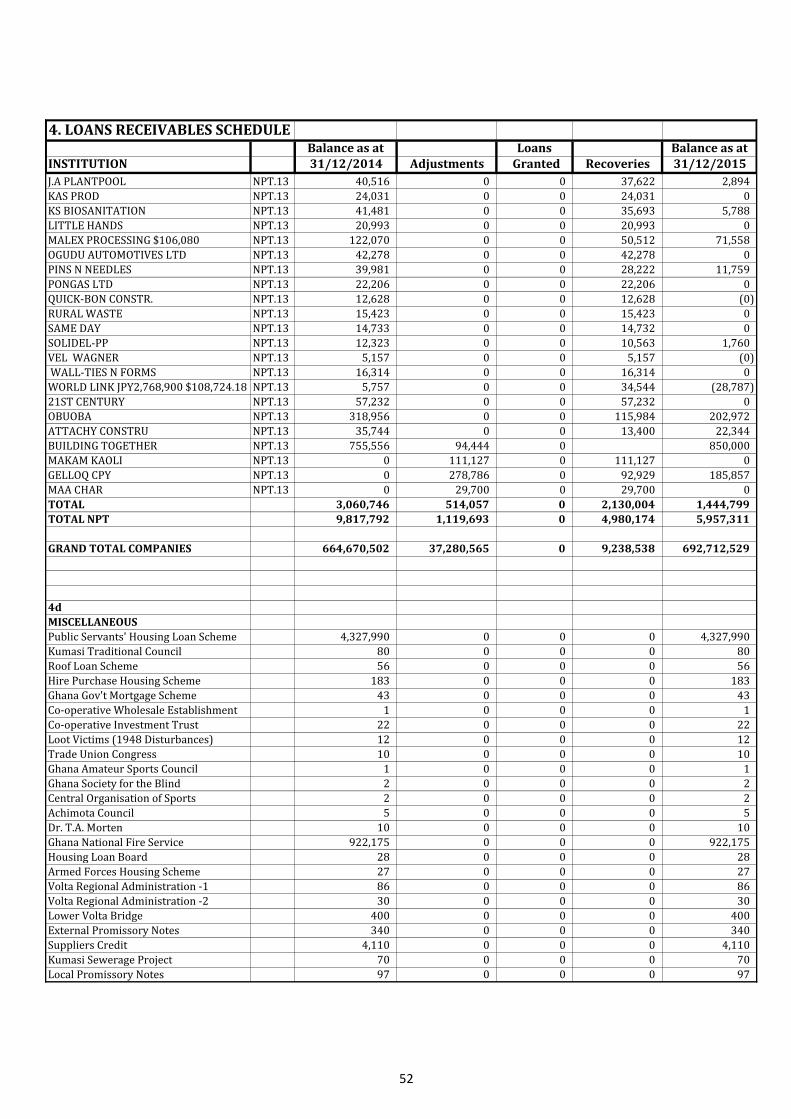
4. LOANS RECEIVABLES SCHEDULEBalance as at Loans Balance as at
INSTITUTION 31/12/2014 Adjustments Granted Recoveries 31/12/2015
J.A PLANTPOOL NPT.13 40,516 0 0 37,622 2,894
KAS PROD NPT.13 24,031 0 0 24,031 0
KS BIOSANITATION NPT.13 41,481 0 0 35,693 5,788
LITTLE HANDS NPT.13 20,993 0 0 20,993 0
MALEX PROCESSING $106,080 NPT.13 122,070 0 0 50,512 71,558
OGUDU AUTOMOTIVES LTD NPT.13 42,278 0 0 42,278 0
PINS N NEEDLES NPT.13 39,981 0 0 28,222 11,759
PONGAS LTD NPT.13 22,206 0 0 22,206 0
QUICK-BON CONSTR. NPT.13 12,628 0 0 12,628 (0)
RURAL WASTE NPT.13 15,423 0 0 15,423 0
SAME DAY NPT.13 14,733 0 0 14,732 0
SOLIDEL-PP NPT.13 12,323 0 0 10,563 1,760
VEL WAGNER NPT.13 5,157 0 0 5,157 (0)
WALL-TIES N FORMS NPT.13 16,314 0 0 16,314 0
WORLD LINK JPY2,768,900 $108,724.18 NPT.13 5,757 0 0 34,544 (28,787)
21ST CENTURY NPT.13 57,232 0 0 57,232 0
OBUOBA NPT.13 318,956 0 0 115,984 202,972
ATTACHY CONSTRU NPT.13 35,744 0 0 13,400 22,344
BUILDING TOGETHER NPT.13 755,556 94,444 0 850,000
MAKAM KAOLI NPT.13 0 111,127 0 111,127 0
GELLOQ CPY NPT.13 0 278,786 0 92,929 185,857
MAA CHAR NPT.13 0 29,700 0 29,700 0
TOTAL 3,060,746 514,057 0 2,130,004 1,444,799
TOTAL NPT 9,817,792 1,119,693 0 4,980,174 5,957,311
GRAND TOTAL COMPANIES 664,670,502 37,280,565 0 9,238,538 692,712,529
4d
MISCELLANEOUS
Public Servants' Housing Loan Scheme 4,327,990 0 0 0 4,327,990
Kumasi Traditional Council 80 0 0 0 80
Roof Loan Scheme 56 0 0 0 56
Hire Purchase Housing Scheme 183 0 0 0 183
Ghana Gov't Mortgage Scheme 43 0 0 0 43
Co-operative Wholesale Establishment 1 0 0 0 1
Co-operative Investment Trust 22 0 0 0 22
Loot Victims (1948 Disturbances) 12 0 0 0 12
Trade Union Congress 10 0 0 0 10
Ghana Amateur Sports Council 1 0 0 0 1
Ghana Society for the Blind 2 0 0 0 2
Central Organisation of Sports 2 0 0 0 2
Achimota Council 5 0 0 0 5
Dr. T.A. Morten 10 0 0 0 10
Ghana National Fire Service 922,175 0 0 0 922,175
Housing Loan Board 28 0 0 0 28
Armed Forces Housing Scheme 27 0 0 0 27
Volta Regional Administration -1 86 0 0 0 86
Volta Regional Administration -2 30 0 0 0 30
Lower Volta Bridge 400 0 0 0 400
External Promissory Notes 340 0 0 0 340
Suppliers Credit 4,110 0 0 0 4,110
Kumasi Sewerage Project 70 0 0 0 70
Local Promissory Notes 97 0 0 0 97
52
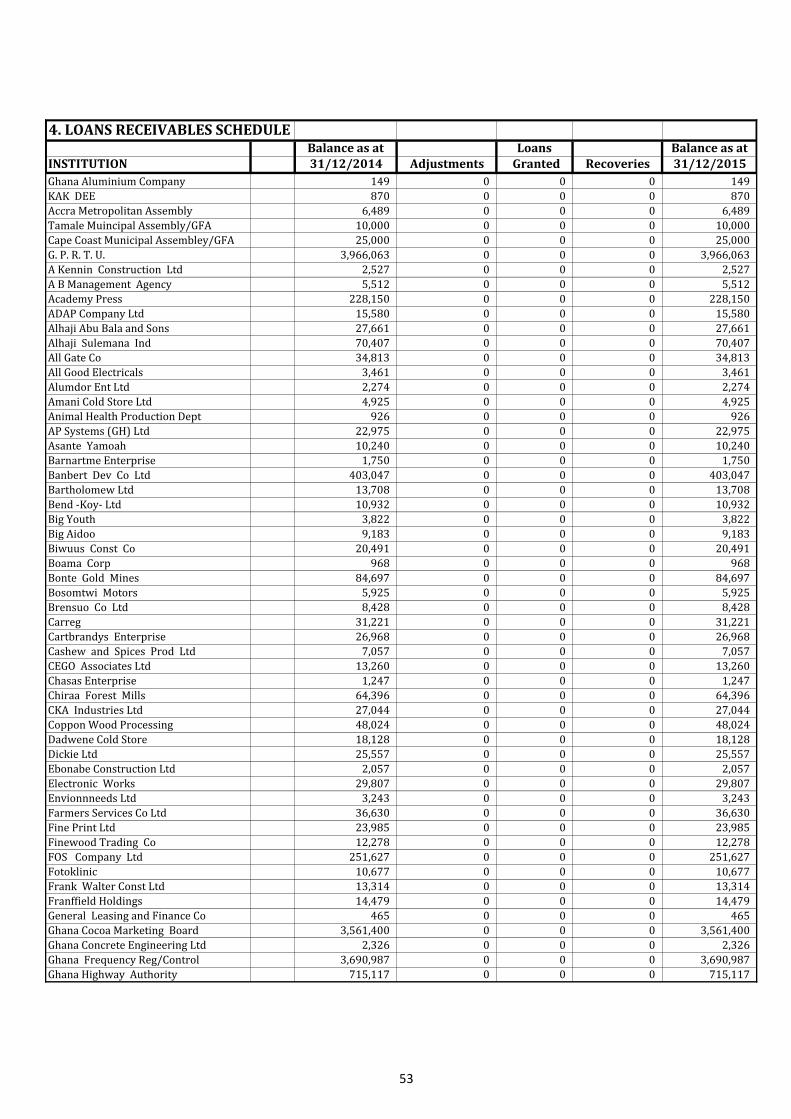
4. LOANS RECEIVABLES SCHEDULEBalance as at Loans Balance as at
INSTITUTION 31/12/2014 Adjustments Granted Recoveries 31/12/2015
Ghana Aluminium Company 149 0 0 0 149
KAK DEE 870 0 0 0 870
Accra Metropolitan Assembly 6,489 0 0 0 6,489
Tamale Muincipal Assembly/GFA 10,000 0 0 0 10,000
Cape Coast Municipal Assembley/GFA 25,000 0 0 0 25,000
G. P. R. T. U. 3,966,063 0 0 0 3,966,063
A Kennin Construction Ltd 2,527 0 0 0 2,527
A B Management Agency 5,512 0 0 0 5,512
Academy Press 228,150 0 0 0 228,150
ADAP Company Ltd 15,580 0 0 0 15,580
Alhaji Abu Bala and Sons 27,661 0 0 0 27,661
Alhaji Sulemana Ind 70,407 0 0 0 70,407
All Gate Co 34,813 0 0 0 34,813
All Good Electricals 3,461 0 0 0 3,461
Alumdor Ent Ltd 2,274 0 0 0 2,274
Amani Cold Store Ltd 4,925 0 0 0 4,925
Animal Health Production Dept 926 0 0 0 926
AP Systems (GH) Ltd 22,975 0 0 0 22,975
Asante Yamoah 10,240 0 0 0 10,240
Barnartme Enterprise 1,750 0 0 0 1,750
Banbert Dev Co Ltd 403,047 0 0 0 403,047
Bartholomew Ltd 13,708 0 0 0 13,708
Bend -Koy- Ltd 10,932 0 0 0 10,932
Big Youth 3,822 0 0 0 3,822
Big Aidoo 9,183 0 0 0 9,183
Biwuus Const Co 20,491 0 0 0 20,491
Boama Corp 968 0 0 0 968
Bonte Gold Mines 84,697 0 0 0 84,697
Bosomtwi Motors 5,925 0 0 0 5,925
Brensuo Co Ltd 8,428 0 0 0 8,428
Carreg 31,221 0 0 0 31,221
Cartbrandys Enterprise 26,968 0 0 0 26,968
Cashew and Spices Prod Ltd 7,057 0 0 0 7,057
CEGO Associates Ltd 13,260 0 0 0 13,260
Chasas Enterprise 1,247 0 0 0 1,247
Chiraa Forest Mills 64,396 0 0 0 64,396
CKA Industries Ltd 27,044 0 0 0 27,044
Coppon Wood Processing 48,024 0 0 0 48,024
Dadwene Cold Store 18,128 0 0 0 18,128
Dickie Ltd 25,557 0 0 0 25,557
Ebonabe Construction Ltd 2,057 0 0 0 2,057
Electronic Works 29,807 0 0 0 29,807
Envionnneeds Ltd 3,243 0 0 0 3,243
Farmers Services Co Ltd 36,630 0 0 0 36,630
Fine Print Ltd 23,985 0 0 0 23,985
Finewood Trading Co 12,278 0 0 0 12,278
FOS Company Ltd 251,627 0 0 0 251,627
Fotoklinic 10,677 0 0 0 10,677
Frank Walter Const Ltd 13,314 0 0 0 13,314
Franffield Holdings 14,479 0 0 0 14,479
General Leasing and Finance Co 465 0 0 0 465
Ghana Cocoa Marketing Board 3,561,400 0 0 0 3,561,400
Ghana Concrete Engineering Ltd 2,326 0 0 0 2,326
Ghana Frequency Reg/Control 3,690,987 0 0 0 3,690,987
Ghana Highway Authority 715,117 0 0 0 715,117
53
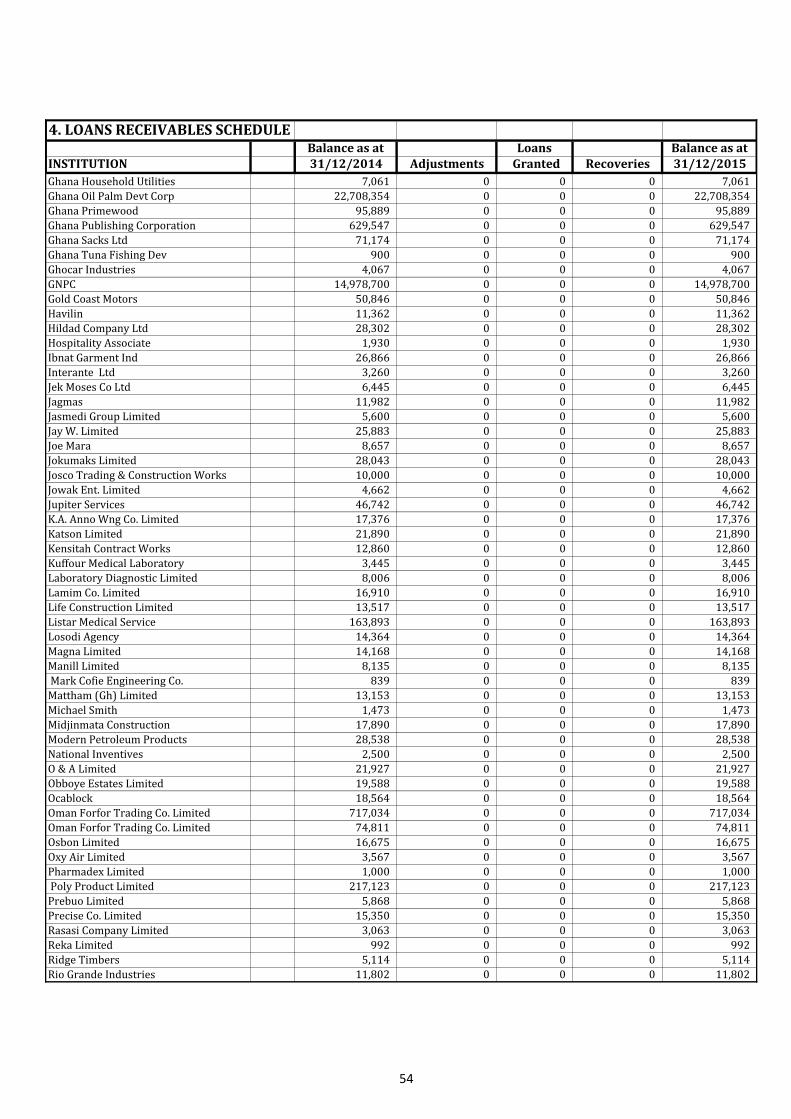
4. LOANS RECEIVABLES SCHEDULEBalance as at Loans Balance as at
INSTITUTION 31/12/2014 Adjustments Granted Recoveries 31/12/2015
Ghana Household Utilities 7,061 0 0 0 7,061
Ghana Oil Palm Devt Corp 22,708,354 0 0 0 22,708,354
Ghana Primewood 95,889 0 0 0 95,889
Ghana Publishing Corporation 629,547 0 0 0 629,547
Ghana Sacks Ltd 71,174 0 0 0 71,174
Ghana Tuna Fishing Dev 900 0 0 0 900
Ghocar Industries 4,067 0 0 0 4,067
GNPC 14,978,700 0 0 0 14,978,700
Gold Coast Motors 50,846 0 0 0 50,846
Havilin 11,362 0 0 0 11,362
Hildad Company Ltd 28,302 0 0 0 28,302
Hospitality Associate 1,930 0 0 0 1,930
Ibnat Garment Ind 26,866 0 0 0 26,866
Interante Ltd 3,260 0 0 0 3,260
Jek Moses Co Ltd 6,445 0 0 0 6,445
Jagmas 11,982 0 0 0 11,982
Jasmedi Group Limited 5,600 0 0 0 5,600
Jay W. Limited 25,883 0 0 0 25,883
Joe Mara 8,657 0 0 0 8,657
Jokumaks Limited 28,043 0 0 0 28,043
Josco Trading & Construction Works 10,000 0 0 0 10,000
Jowak Ent. Limited 4,662 0 0 0 4,662
Jupiter Services 46,742 0 0 0 46,742
K.A. Anno Wng Co. Limited 17,376 0 0 0 17,376
Katson Limited 21,890 0 0 0 21,890
Kensitah Contract Works 12,860 0 0 0 12,860
Kuffour Medical Laboratory 3,445 0 0 0 3,445
Laboratory Diagnostic Limited 8,006 0 0 0 8,006
Lamim Co. Limited 16,910 0 0 0 16,910
Life Construction Limited 13,517 0 0 0 13,517
Listar Medical Service 163,893 0 0 0 163,893
Losodi Agency 14,364 0 0 0 14,364
Magna Limited 14,168 0 0 0 14,168
Manill Limited 8,135 0 0 0 8,135
Mark Cofie Engineering Co. 839 0 0 0 839
Mattham (Gh) Limited 13,153 0 0 0 13,153
Michael Smith 1,473 0 0 0 1,473
Midjinmata Construction 17,890 0 0 0 17,890
Modern Petroleum Products 28,538 0 0 0 28,538
National Inventives 2,500 0 0 0 2,500
O & A Limited 21,927 0 0 0 21,927
Obboye Estates Limited 19,588 0 0 0 19,588
Ocablock 18,564 0 0 0 18,564
Oman Forfor Trading Co. Limited 717,034 0 0 0 717,034
Oman Forfor Trading Co. Limited 74,811 0 0 0 74,811
Osbon Limited 16,675 0 0 0 16,675
Oxy Air Limited 3,567 0 0 0 3,567
Pharmadex Limited 1,000 0 0 0 1,000
Poly Product Limited 217,123 0 0 0 217,123
Prebuo Limited 5,868 0 0 0 5,868
Precise Co. Limited 15,350 0 0 0 15,350
Rasasi Company Limited 3,063 0 0 0 3,063
Reka Limited 992 0 0 0 992
Ridge Timbers 5,114 0 0 0 5,114
Rio Grande Industries 11,802 0 0 0 11,802
54
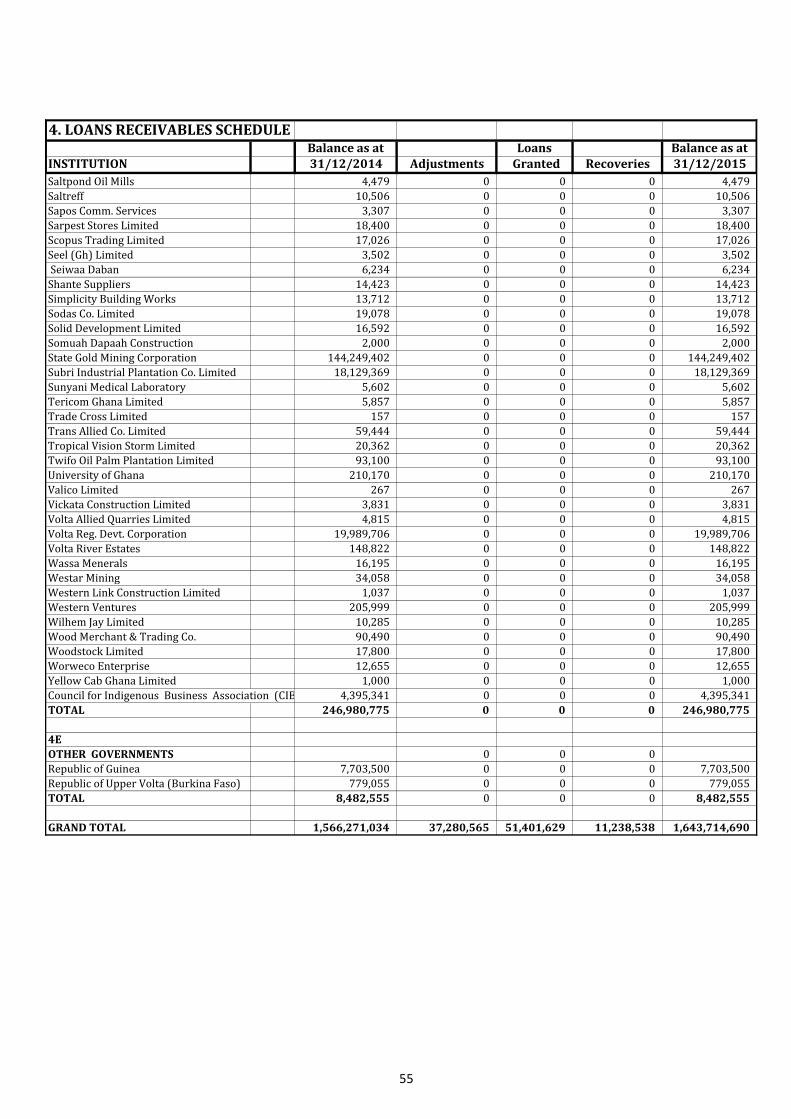
4. LOANS RECEIVABLES SCHEDULEBalance as at Loans Balance as at
INSTITUTION 31/12/2014 Adjustments Granted Recoveries 31/12/2015
Saltpond Oil Mills 4,479 0 0 0 4,479
Saltreff 10,506 0 0 0 10,506
Sapos Comm. Services 3,307 0 0 0 3,307
Sarpest Stores Limited 18,400 0 0 0 18,400
Scopus Trading Limited 17,026 0 0 0 17,026
Seel (Gh) Limited 3,502 0 0 0 3,502
Seiwaa Daban 6,234 0 0 0 6,234
Shante Suppliers 14,423 0 0 0 14,423
Simplicity Building Works 13,712 0 0 0 13,712
Sodas Co. Limited 19,078 0 0 0 19,078
Solid Development Limited 16,592 0 0 0 16,592
Somuah Dapaah Construction 2,000 0 0 0 2,000
State Gold Mining Corporation 144,249,402 0 0 0 144,249,402
Subri Industrial Plantation Co. Limited 18,129,369 0 0 0 18,129,369
Sunyani Medical Laboratory 5,602 0 0 0 5,602
Tericom Ghana Limited 5,857 0 0 0 5,857
Trade Cross Limited 157 0 0 0 157
Trans Allied Co. Limited 59,444 0 0 0 59,444
Tropical Vision Storm Limited 20,362 0 0 0 20,362
Twifo Oil Palm Plantation Limited 93,100 0 0 0 93,100
University of Ghana 210,170 0 0 0 210,170
Valico Limited 267 0 0 0 267
Vickata Construction Limited 3,831 0 0 0 3,831
Volta Allied Quarries Limited 4,815 0 0 0 4,815
Volta Reg. Devt. Corporation 19,989,706 0 0 0 19,989,706
Volta River Estates 148,822 0 0 0 148,822
Wassa Menerals 16,195 0 0 0 16,195
Westar Mining 34,058 0 0 0 34,058
Western Link Construction Limited 1,037 0 0 0 1,037
Western Ventures 205,999 0 0 0 205,999
Wilhem Jay Limited 10,285 0 0 0 10,285
Wood Merchant & Trading Co. 90,490 0 0 0 90,490
Woodstock Limited 17,800 0 0 0 17,800
Worweco Enterprise 12,655 0 0 0 12,655
Yellow Cab Ghana Limited 1,000 0 0 0 1,000
Council for Indigenous Business Association (CIBA) 4,395,341 0 0 0 4,395,341
TOTAL 246,980,775 0 0 0 246,980,775
4E
OTHER GOVERNMENTS 0 0 0
Republic of Guinea 7,703,500 0 0 0 7,703,500
Republic of Upper Volta (Burkina Faso) 779,055 0 0 0 779,055
TOTAL 8,482,555 0 0 0 8,482,555
GRAND TOTAL 1,566,271,034 37,280,565 51,401,629 11,238,538 1,643,714,690
55
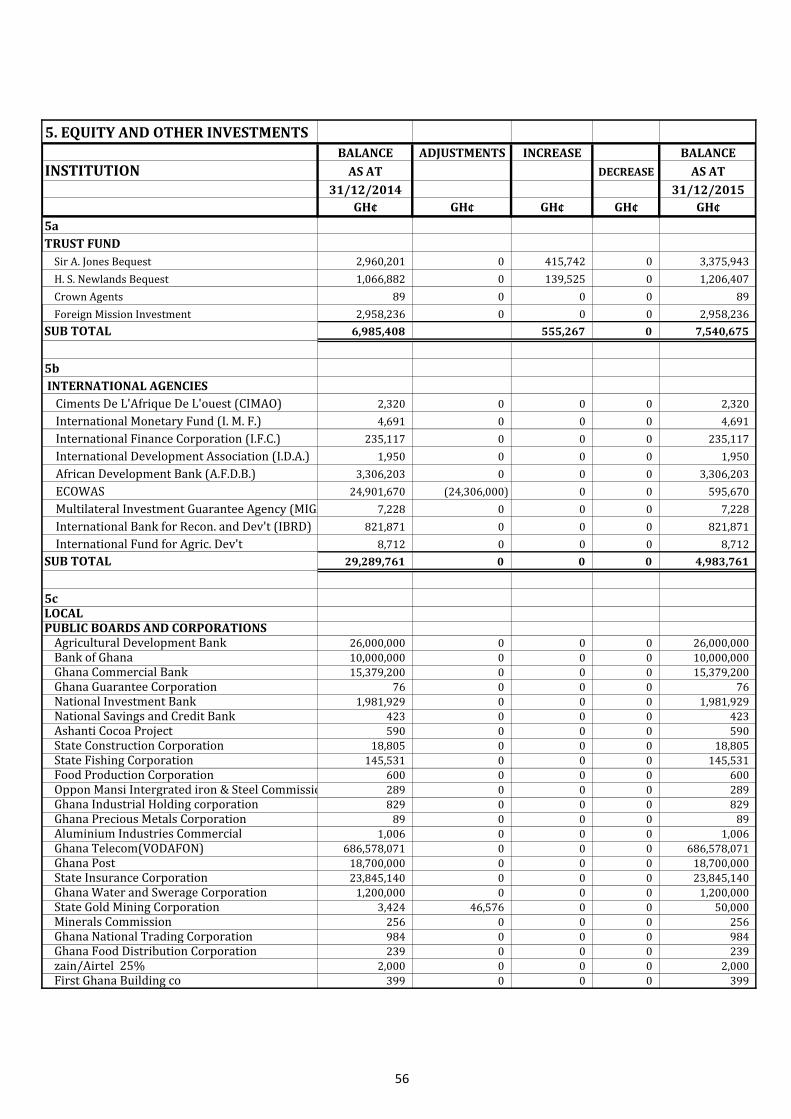
5. EQUITY AND OTHER INVESTMENTS
BALANCE ADJUSTMENTS INCREASE BALANCE
INSTITUTION AS AT DECREASE AS AT
31/12/2014 31/12/2015
GH¢ GH¢ GH¢ GH¢ GH¢
5a
TRUST FUND
Sir A. Jones Bequest 2,960,201 0 415,742 0 3,375,943
H. S. Newlands Bequest 1,066,882 0 139,525 0 1,206,407
Crown Agents 89 0 0 0 89
Foreign Mission Investment 2,958,236 0 0 0 2,958,236
SUB TOTAL 6,985,408 555,267 0 7,540,675
5b
INTERNATIONAL AGENCIES
Ciments De L'Afrique De L'ouest (CIMAO) 2,320 0 0 0 2,320
International Monetary Fund (I. M. F.) 4,691 0 0 0 4,691
International Finance Corporation (I.F.C.) 235,117 0 0 0 235,117
International Development Association (I.D.A.) 1,950 0 0 0 1,950
African Development Bank (A.F.D.B.) 3,306,203 0 0 0 3,306,203
ECOWAS 24,901,670 (24,306,000) 0 0 595,670
Multilateral Investment Guarantee Agency (MIGA) 7,228 0 0 0 7,228
International Bank for Recon. and Dev't (IBRD) 821,871 0 0 0 821,871
International Fund for Agric. Dev't 8,712 0 0 0 8,712
SUB TOTAL 29,289,761 0 0 0 4,983,761
5cLOCALPUBLIC BOARDS AND CORPORATIONS
Agricultural Development Bank 26,000,000 0 0 0 26,000,000
Bank of Ghana 10,000,000 0 0 0 10,000,000
Ghana Commercial Bank 15,379,200 0 0 0 15,379,200
Ghana Guarantee Corporation 76 0 0 0 76
National Investment Bank 1,981,929 0 0 0 1,981,929
National Savings and Credit Bank 423 0 0 0 423
Ashanti Cocoa Project 590 0 0 0 590
State Construction Corporation 18,805 0 0 0 18,805
State Fishing Corporation 145,531 0 0 0 145,531
Food Production Corporation 600 0 0 0 600
Oppon Mansi Intergrated iron & Steel Commission 289 0 0 0 289
Ghana Industrial Holding corporation 829 0 0 0 829
Ghana Precious Metals Corporation 89 0 0 0 89
Aluminium Industries Commercial 1,006 0 0 0 1,006
Ghana Telecom(VODAFON) 686,578,071 0 0 0 686,578,071
Ghana Post 18,700,000 0 0 0 18,700,000
State Insurance Corporation 23,845,140 0 0 0 23,845,140
Ghana Water and Swerage Corporation 1,200,000 0 0 0 1,200,000
State Gold Mining Corporation 3,424 46,576 0 0 50,000
Minerals Commission 256 0 0 0 256
Ghana National Trading Corporation 984 0 0 0 984
Ghana Food Distribution Corporation 239 0 0 0 239
zain/Airtel 25% 2,000 0 0 0 2,000
First Ghana Building co 399 0 0 0 399
56
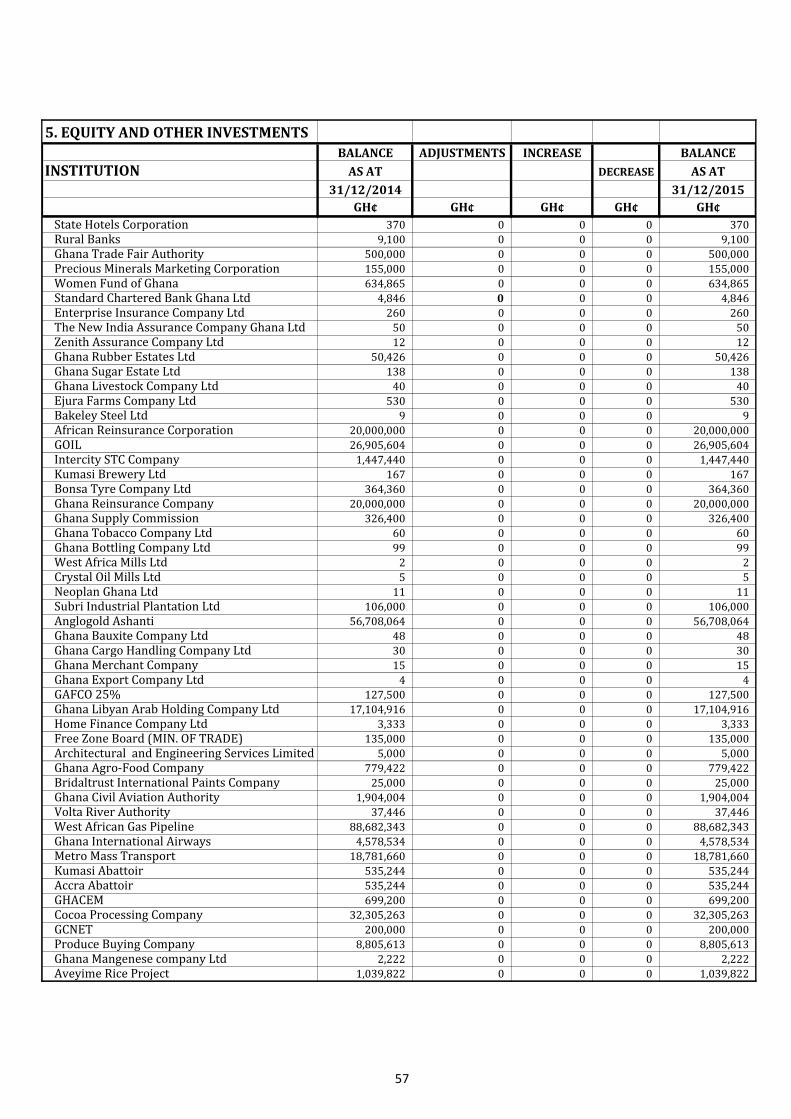
5. EQUITY AND OTHER INVESTMENTS
BALANCE ADJUSTMENTS INCREASE BALANCE
INSTITUTION AS AT DECREASE AS AT
31/12/2014 31/12/2015
GH¢ GH¢ GH¢ GH¢ GH¢
State Hotels Corporation 370 0 0 0 370
Rural Banks 9,100 0 0 0 9,100
Ghana Trade Fair Authority 500,000 0 0 0 500,000
Precious Minerals Marketing Corporation 155,000 0 0 0 155,000
Women Fund of Ghana 634,865 0 0 0 634,865
Standard Chartered Bank Ghana Ltd 4,846 0 0 0 4,846
Enterprise Insurance Company Ltd 260 0 0 0 260
The New India Assurance Company Ghana Ltd 50 0 0 0 50
Zenith Assurance Company Ltd 12 0 0 0 12
Ghana Rubber Estates Ltd 50,426 0 0 0 50,426
Ghana Sugar Estate Ltd 138 0 0 0 138
Ghana Livestock Company Ltd 40 0 0 0 40
Ejura Farms Company Ltd 530 0 0 0 530
Bakeley Steel Ltd 9 0 0 0 9
African Reinsurance Corporation 20,000,000 0 0 0 20,000,000
GOIL 26,905,604 0 0 0 26,905,604
Intercity STC Company 1,447,440 0 0 0 1,447,440
Kumasi Brewery Ltd 167 0 0 0 167
Bonsa Tyre Company Ltd 364,360 0 0 0 364,360
Ghana Reinsurance Company 20,000,000 0 0 0 20,000,000
Ghana Supply Commission 326,400 0 0 0 326,400
Ghana Tobacco Company Ltd 60 0 0 0 60
Ghana Bottling Company Ltd 99 0 0 0 99
West Africa Mills Ltd 2 0 0 0 2
Crystal Oil Mills Ltd 5 0 0 0 5
Neoplan Ghana Ltd 11 0 0 0 11
Subri Industrial Plantation Ltd 106,000 0 0 0 106,000
Anglogold Ashanti 56,708,064 0 0 0 56,708,064
Ghana Bauxite Company Ltd 48 0 0 0 48
Ghana Cargo Handling Company Ltd 30 0 0 0 30
Ghana Merchant Company 15 0 0 0 15
Ghana Export Company Ltd 4 0 0 0 4
GAFCO 25% 127,500 0 0 0 127,500
Ghana Libyan Arab Holding Company Ltd 17,104,916 0 0 0 17,104,916
Home Finance Company Ltd 3,333 0 0 0 3,333
Free Zone Board (MIN. OF TRADE) 135,000 0 0 0 135,000
Architectural and Engineering Services Limited 5,000 0 0 0 5,000
Ghana Agro-Food Company 779,422 0 0 0 779,422
Bridaltrust International Paints Company 25,000 0 0 0 25,000
Ghana Civil Aviation Authority 1,904,004 0 0 0 1,904,004
Volta River Authority 37,446 0 0 0 37,446
West African Gas Pipeline 88,682,343 0 0 0 88,682,343
Ghana International Airways 4,578,534 0 0 0 4,578,534
Metro Mass Transport 18,781,660 0 0 0 18,781,660
Kumasi Abattoir 535,244 0 0 0 535,244
Accra Abattoir 535,244 0 0 0 535,244
GHACEM 699,200 0 0 0 699,200
Cocoa Processing Company 32,305,263 0 0 0 32,305,263
GCNET 200,000 0 0 0 200,000
Produce Buying Company 8,805,613 0 0 0 8,805,613
Ghana Mangenese company Ltd 2,222 0 0 0 2,222
Aveyime Rice Project 1,039,822 0 0 0 1,039,822
57

5. EQUITY AND OTHER INVESTMENTS
BALANCE ADJUSTMENTS INCREASE BALANCE
INSTITUTION AS AT DECREASE AS AT
31/12/2014 31/12/2015
GH¢ GH¢ GH¢ GH¢ GH¢
GNPA Limited 100,000 0 0 0 100,000
Ghana Airports Company Limited 1,000,000 0 0 0 1,000,000
Goldfields Ghana Limited 2,500 0 0 0 2,500
Abosso Goldfields Limited 600 0 0 0 600
Graphic Communication 2,500,000 0 0 0 2,500,000
Ghana Cocoa Board 393,290 0 0 0 393,290
Ghana Publishing Company Limited 677,761 0 0 0 677,761
Ghana Heavy Equipment Limited 100,000 0 0 0 100,000
SIC Life Company Limited 4,058,573 0 0 0 4,058,573
Free Zone Board 16,243 0 0 0 16,243
New Times Company 230 0 0 0 230
Exim Guaranty Limited 3,000,000 0 0 0 3,000,000
GIHOC Distilleries Company Limited 50,000 0 0 0 50,000
Valco Limited 2,304,987 0 0 0 2,304,987
Tema Development Company 2,800 0 0 0 2,800
Gridco Company Limited 1,000 0 0 0 1,000
Tema Oil Refinery 15,242,000 0 0 0 15,242,000
Shelter Afrique 23,961,606 0 0 0 23,961,606
Venture Capital Trust Fund 0 0 5,000,000 0 5,000,000
GAMA Film Co. Ltd 2,000,600 0 0 0 2,000,600
Northern Star Tomatoes 1,000,000 0 0 0 1,000,000
Newmont Ghana Gold LTD (10%) 0 0 0 0 0
Others 906 0 0 0 906
Ghana National Gas company 30,000,000 0 0 0 30,000,000
ECOWAS Bank for Dev. & Investment 35,367,529 24,306,000 35,200,000 0 94,873,529
PSC Tema Shipyard 16,962,183 0 0 0 16,962,183
Tema Oil Refinery (Redemption of promissory Note) 607,843,010 0 0 0 607,843,010
Komenda Sugar Factory 0 33,023,904 48,676,394 0 81,700,298
Africa Finance Corporation (AFC) 0 0 42,323,000 0 42,323,000
SUB TOTAL 1,833,946,418 0 131,199,394 0 2,022,522,292
GRAND TOTAL 1,897,947,654 0 131,754,661 0 2,035,046,728
58
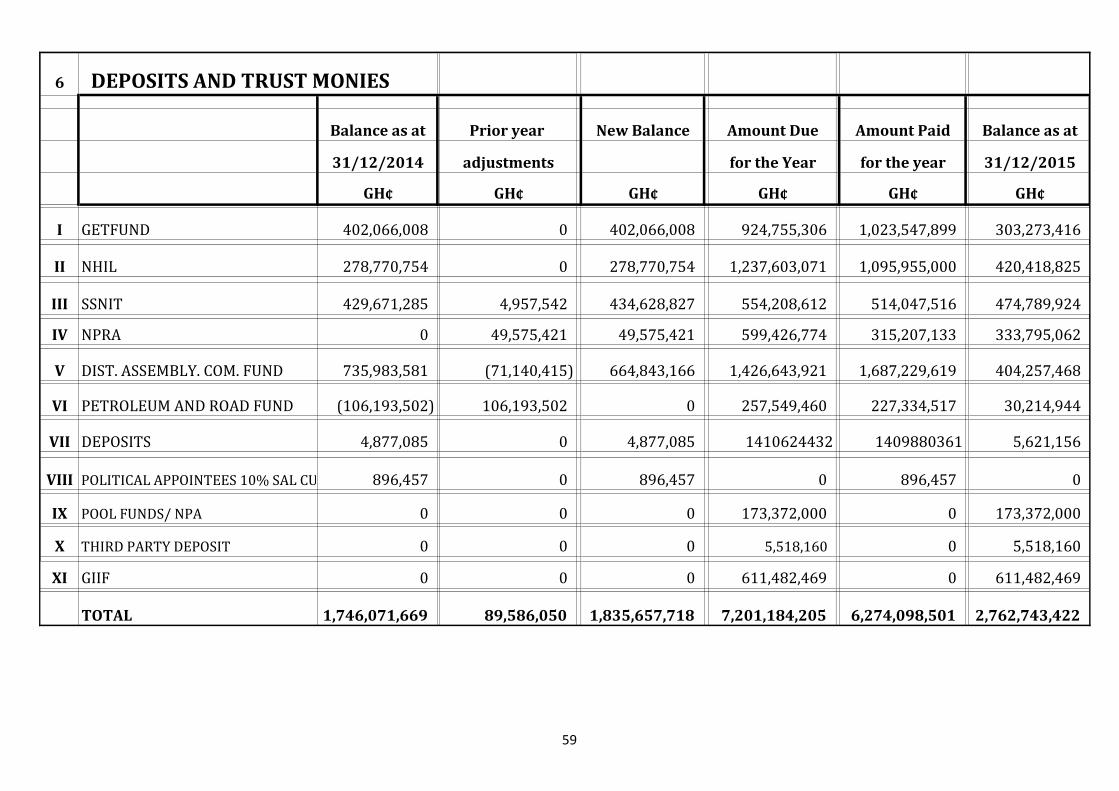
6 DEPOSITS AND TRUST MONIES
Balance as at Prior year New Balance Amount Due Amount Paid Balance as at
31/12/2014 adjustments for the Year for the year 31/12/2015
GH¢ GH¢ GH¢ GH¢ GH¢ GH¢
I GETFUND 402,066,008 0 402,066,008 924,755,306 1,023,547,899 303,273,416
II NHIL 278,770,754 0 278,770,754 1,237,603,071 1,095,955,000 420,418,825
III SSNIT 429,671,285 4,957,542 434,628,827 554,208,612 514,047,516 474,789,924
IV NPRA 0 49,575,421 49,575,421 599,426,774 315,207,133 333,795,062
V DIST. ASSEMBLY. COM. FUND 735,983,581 (71,140,415) 664,843,166 1,426,643,921 1,687,229,619 404,257,468
VI PETROLEUM AND ROAD FUND (106,193,502) 106,193,502 0 257,549,460 227,334,517 30,214,944
VII DEPOSITS 4,877,085 0 4,877,085 1410624432 1409880361 5,621,156
VIII POLITICAL APPOINTEES 10% SAL CUT 896,457 0 896,457 0 896,457 0
IX POOL FUNDS/ NPA 0 0 0 173,372,000 0 173,372,000
X THIRD PARTY DEPOSIT 0 0 0 5,518,160 0 5,518,160
XI GIIF 0 0 0 611,482,469 0 611,482,469
TOTAL 1,746,071,669 89,586,050 1,835,657,718 7,201,184,205 6,274,098,501 2,762,743,422
59

7 NON FINANCIAL ASSETS
7a FIXED ASSETSCOST ADDITIONS COST Current Year Acc. Depreciation REVALUATION NET BOOK
AS AT IN THE AS AT Depreciation As At VALUE
31/12/2014 YEAR 31/12/2015 Expense 31/12/2014
A B C=(A+B) D E F=(A-D)
DWELLINGS
Buildings 15,281,961 0 15,281,961 305,639 573,132 0 14,403,190
Destitute Homes 19,878 0 19,878 398 0 0 19,481
Bungalows/Flats 12,304,162 6,534,813 18,838,975 246,844 402,370 0 18,189,762
Homes of the Aged 53,665 0 53,665 1,073 0 0 52,592
Palace 6,051,230 26,950,000 33,001,230 121,025 0 0 32,880,205
TOTAL 33,710,896 33,484,813 67,195,709 674,978 975,501 0 65,545,230
NON RESIDENTIAL BUILDINGS
Hospitals 16,991,430 24,740 17,016,170 339,829 664,252 0 16,012,090
Clinics 2,549,227 7,259 2,556,486 50,985 75,541 0 2,429,961
Day Care Centre 2,441,789 0 2,441,789 9,201 0 0 2,432,589
Office Buildings 57,609,631 11,410,544 69,020,176 1,152,193 2,085,442 0 65,782,541
School Buildings 62,733,950 3,808,225 66,542,174 1,254,185 2,189,808 0 63,098,181
Slaughter House 26,976,351 0 26,976,351 539,527 1,069,176 0 25,367,648
Health Centres 2,567,023 5,000 2,572,023 51,340 8,909 0 2,511,773
TOTAL 171,869,401 15,255,768 187,125,170 3,397,259 6,093,129 0 177,634,782
OTHER STRUCTURES
Roads 550,294,700 0 550,294,700 11,005,894 22,010,552 0 517,278,254
Cemeteries 88,108 0 88,108 1,762 430 0 85,916
Toilets 4,977,836 217,689 5,195,525 99,557 275 0 5,095,694
Markets 104,339,304 215,871 104,555,175 2,086,786 356,654 0 102,111,736
Car/Lorry Park 1,352,671 25,000 1,377,671 67,634 0 0 1,310,037
Bridges 11,227,924 4,929,698 16,157,622 1,122,792 0 0 15,034,830
Road Signals 2,014,811 0 2,014,811 201,481 0 0 1,813,330
Feeder Roads 201,039,672 78,337,957 279,377,629 10,051,984 0 0 269,325,645
Urban Roads 241,870,151 227,702,689 469,572,840 12,093,508 0 0 457,479,333
Highways 260,153,854 364,811,525 624,965,380 13,007,693 0 0 611,957,687
Drainage 4,852,374 3,360,530 8,212,904 242,619 0 0 7,970,286
Workshop 1,900 0 1,900 38 0 0 1,862
TOTAL 1,382,213,306 679,600,960 2,061,814,266 49,981,747 22,367,910 0 1,989,464,609
60
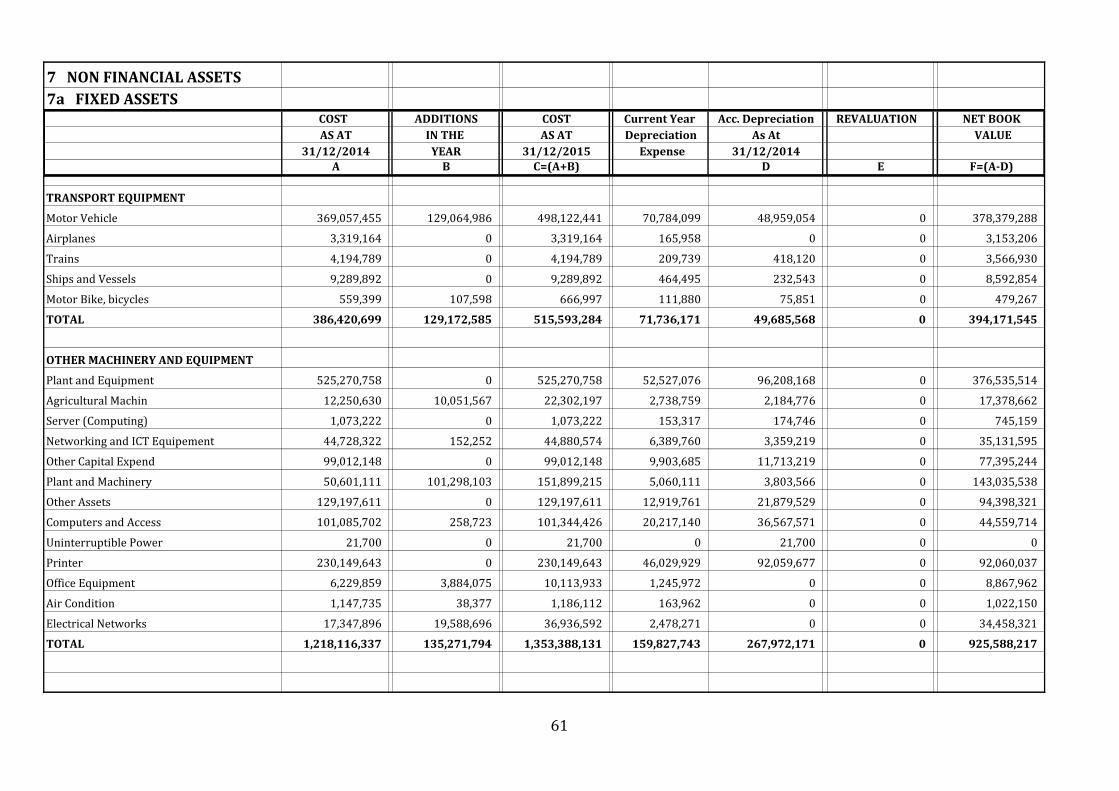
7 NON FINANCIAL ASSETS
7a FIXED ASSETSCOST ADDITIONS COST Current Year Acc. Depreciation REVALUATION NET BOOK
AS AT IN THE AS AT Depreciation As At VALUE
31/12/2014 YEAR 31/12/2015 Expense 31/12/2014
A B C=(A+B) D E F=(A-D)
TRANSPORT EQUIPMENT
Motor Vehicle 369,057,455 129,064,986 498,122,441 70,784,099 48,959,054 0 378,379,288
Airplanes 3,319,164 0 3,319,164 165,958 0 0 3,153,206
Trains 4,194,789 0 4,194,789 209,739 418,120 0 3,566,930
Ships and Vessels 9,289,892 0 9,289,892 464,495 232,543 0 8,592,854
Motor Bike, bicycles 559,399 107,598 666,997 111,880 75,851 0 479,267
TOTAL 386,420,699 129,172,585 515,593,284 71,736,171 49,685,568 0 394,171,545
OTHER MACHINERY AND EQUIPMENT
Plant and Equipment 525,270,758 0 525,270,758 52,527,076 96,208,168 0 376,535,514
Agricultural Machin 12,250,630 10,051,567 22,302,197 2,738,759 2,184,776 0 17,378,662
Server (Computing) 1,073,222 0 1,073,222 153,317 174,746 0 745,159
Networking and ICT Equipement 44,728,322 152,252 44,880,574 6,389,760 3,359,219 0 35,131,595
Other Capital Expend 99,012,148 0 99,012,148 9,903,685 11,713,219 0 77,395,244
Plant and Machinery 50,601,111 101,298,103 151,899,215 5,060,111 3,803,566 0 143,035,538
Other Assets 129,197,611 0 129,197,611 12,919,761 21,879,529 0 94,398,321
Computers and Access 101,085,702 258,723 101,344,426 20,217,140 36,567,571 0 44,559,714
Uninterruptible Power 21,700 0 21,700 0 21,700 0 0
Printer 230,149,643 0 230,149,643 46,029,929 92,059,677 0 92,060,037
Office Equipment 6,229,859 3,884,075 10,113,933 1,245,972 0 0 8,867,962
Air Condition 1,147,735 38,377 1,186,112 163,962 0 0 1,022,150
Electrical Networks 17,347,896 19,588,696 36,936,592 2,478,271 0 0 34,458,321
TOTAL 1,218,116,337 135,271,794 1,353,388,131 159,827,743 267,972,171 0 925,588,217
61
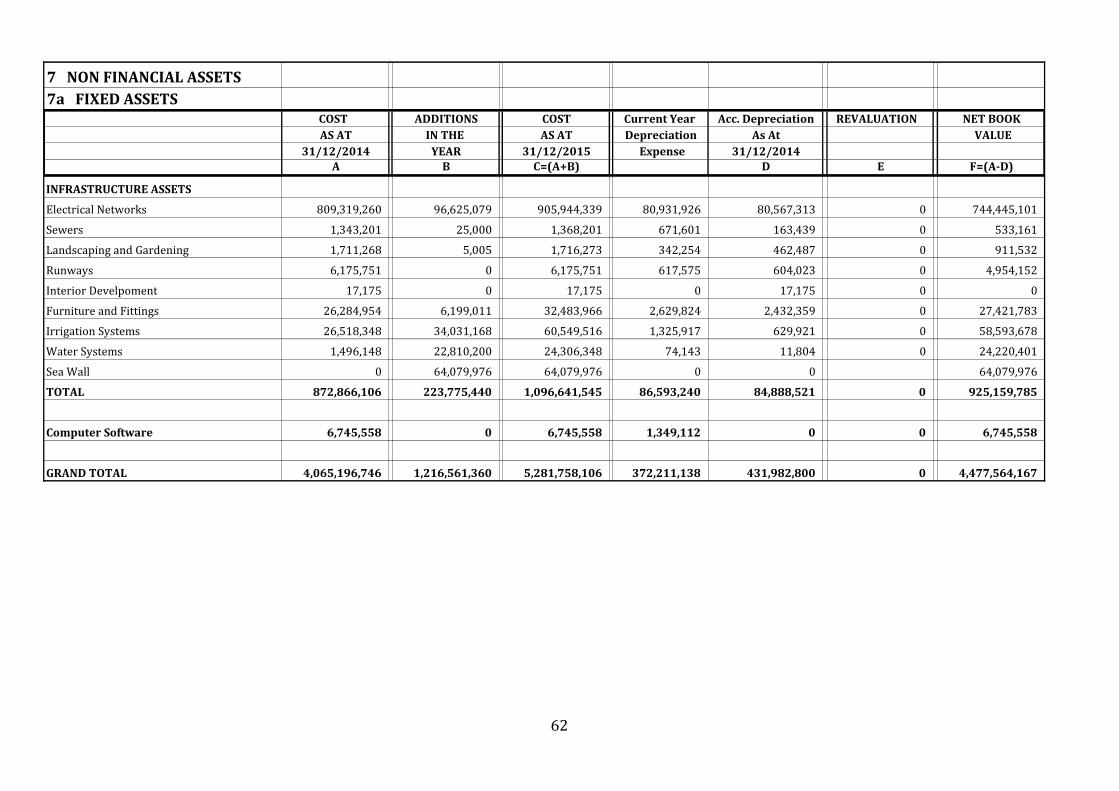
7 NON FINANCIAL ASSETS
7a FIXED ASSETSCOST ADDITIONS COST Current Year Acc. Depreciation REVALUATION NET BOOK
AS AT IN THE AS AT Depreciation As At VALUE
31/12/2014 YEAR 31/12/2015 Expense 31/12/2014
A B C=(A+B) D E F=(A-D)
INFRASTRUCTURE ASSETS
Electrical Networks 809,319,260 96,625,079 905,944,339 80,931,926 80,567,313 0 744,445,101
Sewers 1,343,201 25,000 1,368,201 671,601 163,439 0 533,161
Landscaping and Gardening 1,711,268 5,005 1,716,273 342,254 462,487 0 911,532
Runways 6,175,751 0 6,175,751 617,575 604,023 0 4,954,152
Interior Develpoment 17,175 0 17,175 0 17,175 0 0
Furniture and Fittings 26,284,954 6,199,011 32,483,966 2,629,824 2,432,359 0 27,421,783
Irrigation Systems 26,518,348 34,031,168 60,549,516 1,325,917 629,921 0 58,593,678
Water Systems 1,496,148 22,810,200 24,306,348 74,143 11,804 0 24,220,401
Sea Wall 0 64,079,976 64,079,976 0 0 64,079,976
TOTAL 872,866,106 223,775,440 1,096,641,545 86,593,240 84,888,521 0 925,159,785
Computer Software 6,745,558 0 6,745,558 1,349,112 0 0 6,745,558
GRAND TOTAL 4,065,196,746 1,216,561,360 5,281,758,106 372,211,138 431,982,800 0 4,477,564,167
62
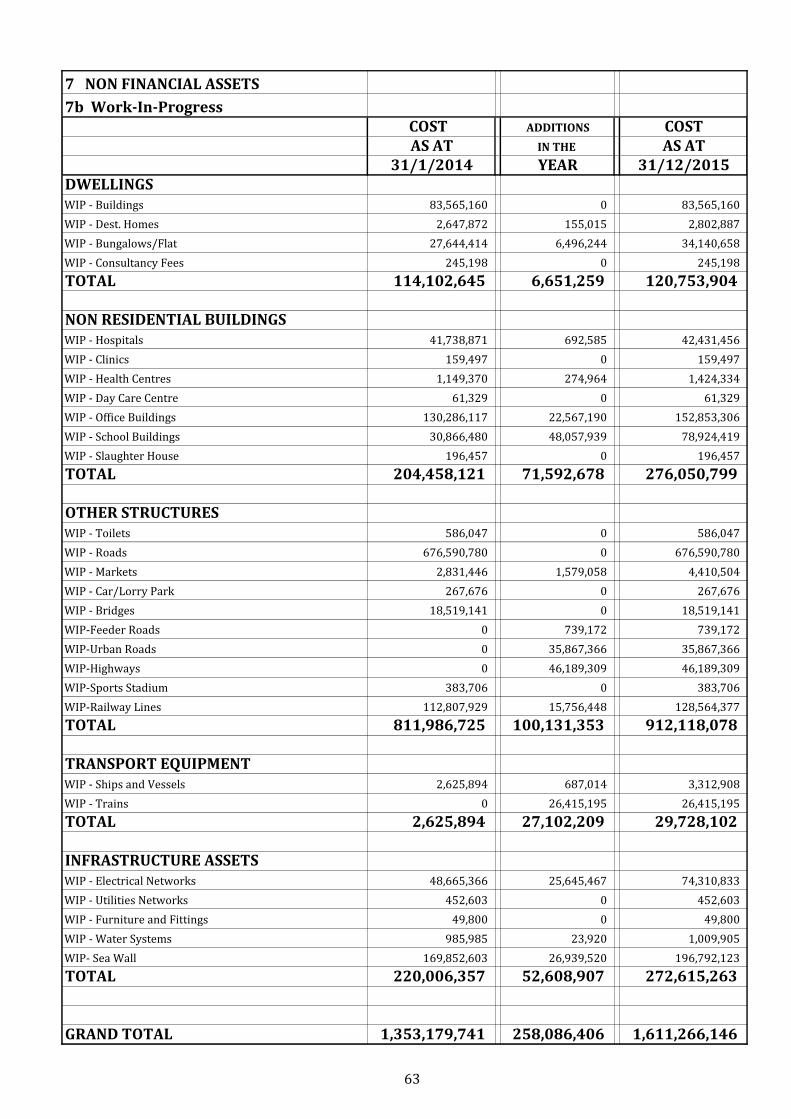
7 NON FINANCIAL ASSETS
7b Work-In-ProgressCOST ADDITIONS COSTAS AT IN THE AS AT
31/1/2014 YEAR 31/12/2015DWELLINGSWIP - Buildings 83,565,160 0 83,565,160
WIP - Dest. Homes 2,647,872 155,015 2,802,887
WIP - Bungalows/Flat 27,644,414 6,496,244 34,140,658
WIP - Consultancy Fees 245,198 0 245,198
TOTAL 114,102,645 6,651,259 120,753,904
NON RESIDENTIAL BUILDINGS WIP - Hospitals 41,738,871 692,585 42,431,456
WIP - Clinics 159,497 0 159,497
WIP - Health Centres 1,149,370 274,964 1,424,334
WIP - Day Care Centre 61,329 0 61,329
WIP - Office Buildings 130,286,117 22,567,190 152,853,306
WIP - School Buildings 30,866,480 48,057,939 78,924,419
WIP - Slaughter House 196,457 0 196,457
TOTAL 204,458,121 71,592,678 276,050,799
OTHER STRUCTURES WIP - Toilets 586,047 0 586,047
WIP - Roads 676,590,780 0 676,590,780
WIP - Markets 2,831,446 1,579,058 4,410,504
WIP - Car/Lorry Park 267,676 0 267,676
WIP - Bridges 18,519,141 0 18,519,141
WIP-Feeder Roads 0 739,172 739,172
WIP-Urban Roads 0 35,867,366 35,867,366
WIP-Highways 0 46,189,309 46,189,309
WIP-Sports Stadium 383,706 0 383,706
WIP-Railway Lines 112,807,929 15,756,448 128,564,377
TOTAL 811,986,725 100,131,353 912,118,078
TRANSPORT EQUIPMENTWIP - Ships and Vessels 2,625,894 687,014 3,312,908
WIP - Trains 0 26,415,195 26,415,195
TOTAL 2,625,894 27,102,209 29,728,102
INFRASTRUCTURE ASSETSWIP - Electrical Networks 48,665,366 25,645,467 74,310,833
WIP - Utilities Networks 452,603 0 452,603
WIP - Furniture and Fittings 49,800 0 49,800
WIP - Water Systems 985,985 23,920 1,009,905
WIP- Sea Wall 169,852,603 26,939,520 196,792,123
TOTAL 220,006,357 52,608,907 272,615,263
GRAND TOTAL 1,353,179,741 258,086,406 1,611,266,146
63
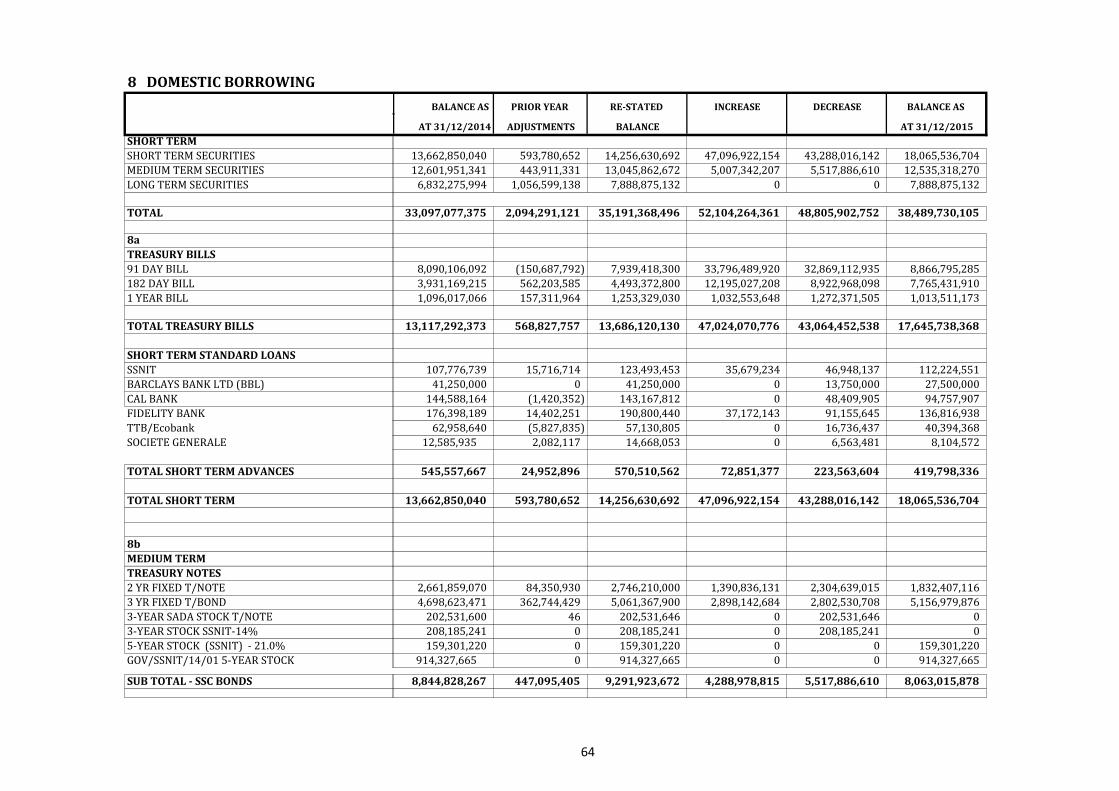
8 DOMESTIC BORROWING
M BALANCE AS PRIOR YEAR RE-STATED INCREASE DECREASE BALANCE AS
D AT 31/12/2014 ADJUSTMENTS BALANCE AT 31/12/2015
SHORT TERM
SHORT TERM SECURITIES 13,662,850,040 593,780,652 14,256,630,692 47,096,922,154 43,288,016,142 18,065,536,704
MEDIUM TERM SECURITIES 12,601,951,341 443,911,331 13,045,862,672 5,007,342,207 5,517,886,610 12,535,318,270
LONG TERM SECURITIES 6,832,275,994 1,056,599,138 7,888,875,132 0 0 7,888,875,132
TOTAL 33,097,077,375 2,094,291,121 35,191,368,496 52,104,264,361 48,805,902,752 38,489,730,105
8a
TREASURY BILLS
91 DAY BILL 8,090,106,092 (150,687,792) 7,939,418,300 33,796,489,920 32,869,112,935 8,866,795,285
182 DAY BILL 3,931,169,215 562,203,585 4,493,372,800 12,195,027,208 8,922,968,098 7,765,431,910
1 YEAR BILL 1,096,017,066 157,311,964 1,253,329,030 1,032,553,648 1,272,371,505 1,013,511,173
TOTAL TREASURY BILLS 13,117,292,373 568,827,757 13,686,120,130 47,024,070,776 43,064,452,538 17,645,738,368
SHORT TERM STANDARD LOANS
SSNIT 107,776,739 15,716,714 123,493,453 35,679,234 46,948,137 112,224,551
BARCLAYS BANK LTD (BBL) 41,250,000 0 41,250,000 0 13,750,000 27,500,000
CAL BANK 144,588,164 (1,420,352) 143,167,812 0 48,409,905 94,757,907
FIDELITY BANK 176,398,189 14,402,251 190,800,440 37,172,143 91,155,645 136,816,938
TTB/Ecobank 62,958,640 (5,827,835) 57,130,805 0 16,736,437 40,394,368
SOCIETE GENERALE 12,585,935 2,082,117 14,668,053 0 6,563,481 8,104,572
TOTAL SHORT TERM ADVANCES 545,557,667 24,952,896 570,510,562 72,851,377 223,563,604 419,798,336
TOTAL SHORT TERM 13,662,850,040 593,780,652 14,256,630,692 47,096,922,154 43,288,016,142 18,065,536,704
8b
MEDIUM TERM
TREASURY NOTES
2 YR FIXED T/NOTE 2,661,859,070 84,350,930 2,746,210,000 1,390,836,131 2,304,639,015 1,832,407,116
3 YR FIXED T/BOND 4,698,623,471 362,744,429 5,061,367,900 2,898,142,684 2,802,530,708 5,156,979,876
3-YEAR SADA STOCK T/NOTE 202,531,600 46 202,531,646 0 202,531,646 0
3-YEAR STOCK SSNIT-14% 208,185,241 0 208,185,241 0 208,185,241 0
5-YEAR STOCK (SSNIT) - 21.0% 159,301,220 0 159,301,220 0 0 159,301,220
GOV/SSNIT/14/01 5-YEAR STOCK 914,327,665 0 914,327,665 0 0 914,327,665
SUB TOTAL - SSC BONDS 8,844,828,267 447,095,405 9,291,923,672 4,288,978,815 5,517,886,610 8,063,015,878
64
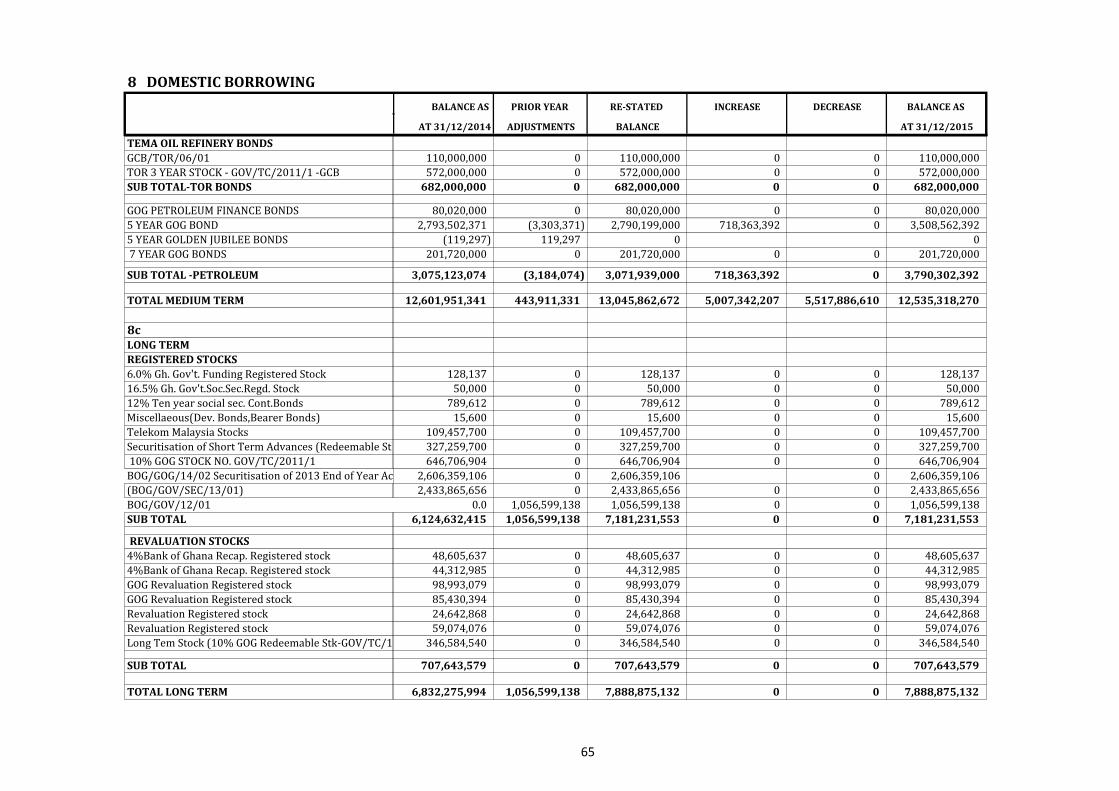
8 DOMESTIC BORROWING
M BALANCE AS PRIOR YEAR RE-STATED INCREASE DECREASE BALANCE AS
D AT 31/12/2014 ADJUSTMENTS BALANCE AT 31/12/2015
TEMA OIL REFINERY BONDS
GCB/TOR/06/01 110,000,000 0 110,000,000 0 0 110,000,000
TOR 3 YEAR STOCK - GOV/TC/2011/1 -GCB 2011 -2014572,000,000 0 572,000,000 0 0 572,000,000
SUB TOTAL-TOR BONDS 682,000,000 0 682,000,000 0 0 682,000,000
GOG PETROLEUM FINANCE BONDS 80,020,000 0 80,020,000 0 0 80,020,000
5 YEAR GOG BOND 2,793,502,371 (3,303,371) 2,790,199,000 718,363,392 0 3,508,562,392
5 YEAR GOLDEN JUBILEE BONDS (119,297) 119,297 0 0
7 YEAR GOG BONDS 201,720,000 0 201,720,000 0 0 201,720,000
SUB TOTAL -PETROLEUM 3,075,123,074 (3,184,074) 3,071,939,000 718,363,392 0 3,790,302,392
TOTAL MEDIUM TERM 12,601,951,341 443,911,331 13,045,862,672 5,007,342,207 5,517,886,610 12,535,318,270
8cLONG TERM
REGISTERED STOCKS
6.0% Gh. Gov't. Funding Registered Stock 2000/2004128,137 0 128,137 0 0 128,137
16.5% Gh. Gov't.Soc.Sec.Regd. Stock 2005/201050,000 0 50,000 0 0 50,000
12% Ten year social sec. Cont.Bonds 789,612 0 789,612 0 0 789,612
Miscellaeous(Dev. Bonds,Bearer Bonds) 15,600 0 15,600 0 0 15,600
Telekom Malaysia Stocks 109,457,700 0 109,457,700 0 0 109,457,700
Securitisation of Short Term Advances (Redeemable Stk) 2009 -2014327,259,700 0 327,259,700 0 0 327,259,700
10% GOG STOCK NO. GOV/TC/2011/1 646,706,904 0 646,706,904 0 0 646,706,904
BOG/GOG/14/02 Securitisation of 2013 End of Year Account2,606,359,106 0 2,606,359,106 0 2,606,359,106
(BOG/GOV/SEC/13/01) 2,433,865,656 0 2,433,865,656 0 0 2,433,865,656
BOG/GOV/12/01 0.0 1,056,599,138 1,056,599,138 0 0 1,056,599,138
SUB TOTAL 6,124,632,415 1,056,599,138 7,181,231,553 0 0 7,181,231,553
REVALUATION STOCKS
4%Bank of Ghana Recap. Registered stock 48,605,637 0 48,605,637 0 0 48,605,637
4%Bank of Ghana Recap. Registered stock 44,312,985 0 44,312,985 0 0 44,312,985
GOG Revaluation Registered stock 2002 - 2011A98,993,079 0 98,993,079 0 0 98,993,079
GOG Revaluation Registered stock 2002 - 2011B85,430,394 0 85,430,394 0 0 85,430,394
Revaluation Registered stock 2005-201424,642,868 0 24,642,868 0 0 24,642,868
Revaluation Registered stock 2005-201459,074,076 0 59,074,076 0 0 59,074,076
Long Tem Stock (10% GOG Redeemable Stk-GOV/TC/10/01) 346,584,540 0 346,584,540 0 0 346,584,540
SUB TOTAL 707,643,579 0 707,643,579 0 0 707,643,579
TOTAL LONG TERM 6,832,275,994 1,056,599,138 7,888,875,132 0 0 7,888,875,132
65
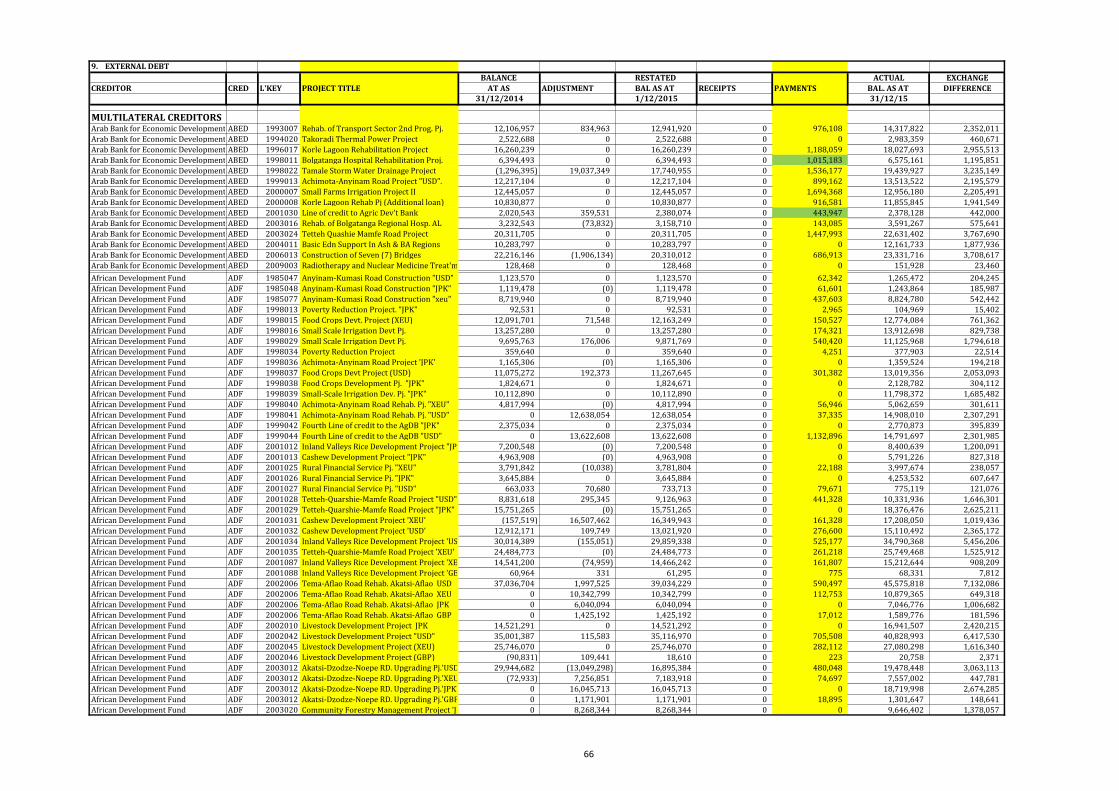
9. EXTERNAL DEBT
BALANCE RESTATED ACTUAL EXCHANGE
CREDITOR CRED L'KEY PROJECT TITLE AT AS ADJUSTMENT BAL AS AT RECEIPTS PAYMENTS BAL. AS AT DIFFERENCE31/12/2014 1/12/2015 31/12/15
MULTILATERAL CREDITORSArab Bank for Economic Development ABED 1993007 Rehab. of Transport Sector 2nd Prog. Pj. 12,106,957 834,963 12,941,920 0 976,108 14,317,822 2,352,011
Arab Bank for Economic Development ABED 1994020 Takoradi Thermal Power Project 2,522,688 0 2,522,688 0 0 2,983,359 460,671
Arab Bank for Economic Development ABED 1996017 Korle Lagoon Rehabilitation Project 16,260,239 0 16,260,239 0 1,188,059 18,027,693 2,955,513
Arab Bank for Economic Development ABED 1998011 Bolgatanga Hospital Rehabilitation Proj. 6,394,493 0 6,394,493 0 1,015,183 6,575,161 1,195,851
Arab Bank for Economic Development ABED 1998022 Tamale Storm Water Drainage Project (1,296,395) 19,037,349 17,740,955 0 1,536,177 19,439,927 3,235,149
Arab Bank for Economic Development ABED 1999013 Achimota-Anyinam Road Project "USD". 12,217,104 0 12,217,104 0 899,162 13,513,522 2,195,579
Arab Bank for Economic Development ABED 2000007 Small Farms Irrigation Project II 12,445,057 0 12,445,057 0 1,694,368 12,956,180 2,205,491
Arab Bank for Economic Development ABED 2000008 Korle Lagoon Rehab Pj (Additional loan) 10,830,877 0 10,830,877 0 916,581 11,855,845 1,941,549
Arab Bank for Economic Development ABED 2001030 Line of credit to Agric Dev't Bank 2,020,543 359,531 2,380,074 0 443,947 2,378,128 442,000
Arab Bank for Economic Development ABED 2003016 Rehab. of Bolgatanga Regional Hosp. AL 3,232,543 (73,832) 3,158,710 0 143,085 3,591,267 575,641
Arab Bank for Economic Development ABED 2003024 Tetteh Quashie Mamfe Road Project 20,311,705 0 20,311,705 0 1,447,993 22,631,402 3,767,690
Arab Bank for Economic Development ABED 2004011 Basic Edn Support In Ash & BA Regions 10,283,797 0 10,283,797 0 0 12,161,733 1,877,936
Arab Bank for Economic Development ABED 2006013 Construction of Seven (7) Bridges 22,216,146 (1,906,134) 20,310,012 0 686,913 23,331,716 3,708,617
Arab Bank for Economic Development ABED 2009003 Radiotherapy and Nuclear Medicine Treat'mt Ser. Pj 128,468 0 128,468 0 0 151,928 23,460
African Development Fund ADF 1985047 Anyinam-Kumasi Road Construction "USD" 1,123,570 0 1,123,570 0 62,342 1,265,472 204,245
African Development Fund ADF 1985048 Anyinam-Kumasi Road Construction "JPK" 1,119,478 (0) 1,119,478 0 61,601 1,243,864 185,987
African Development Fund ADF 1985077 Anyinam-Kumasi Road Construction "xeu" 8,719,940 0 8,719,940 0 437,603 8,824,780 542,442
African Development Fund ADF 1998013 Poverty Reduction Project. "JPK" 92,531 0 92,531 0 2,965 104,969 15,402
African Development Fund ADF 1998015 Food Crops Devt. Project (XEU) 12,091,701 71,548 12,163,249 0 150,527 12,774,084 761,362
African Development Fund ADF 1998016 Small Scale Irrigation Devt Pj. 13,257,280 0 13,257,280 0 174,321 13,912,698 829,738
African Development Fund ADF 1998029 Small Scale Irrigation Devt Pj. 9,695,763 176,006 9,871,769 0 540,420 11,125,968 1,794,618
African Development Fund ADF 1998034 Poverty Reduction Project 359,640 0 359,640 0 4,251 377,903 22,514
African Development Fund ADF 1998036 Achimota-Anyinam Road Project 'JPK' 1,165,306 (0) 1,165,306 0 0 1,359,524 194,218
African Development Fund ADF 1998037 Food Crops Devt Project (USD) 11,075,272 192,373 11,267,645 0 301,382 13,019,356 2,053,093
African Development Fund ADF 1998038 Food Crops Development Pj. "JPK" 1,824,671 0 1,824,671 0 0 2,128,782 304,112
African Development Fund ADF 1998039 Small-Scale Irrigation Dev. Pj. "JPK" 10,112,890 0 10,112,890 0 0 11,798,372 1,685,482
African Development Fund ADF 1998040 Achimota-Anyinam Road Rehab. Pj. "XEU" 4,817,994 (0) 4,817,994 0 56,946 5,062,659 301,611
African Development Fund ADF 1998041 Achimota-Anyinam Road Rehab. Pj. "USD" 0 12,638,054 12,638,054 0 37,335 14,908,010 2,307,291
African Development Fund ADF 1999042 Fourth Line of credit to the AgDB "JPK" 2,375,034 0 2,375,034 0 0 2,770,873 395,839
African Development Fund ADF 1999044 Fourth Line of credit to the AgDB "USD" 0 13,622,608 13,622,608 0 1,132,896 14,791,697 2,301,985
African Development Fund ADF 2001012 Inland Valleys Rice Development Project "JPK" 7,200,548 (0) 7,200,548 0 0 8,400,639 1,200,091
African Development Fund ADF 2001013 Cashew Development Project "JPK" 4,963,908 (0) 4,963,908 0 0 5,791,226 827,318
African Development Fund ADF 2001025 Rural Financial Service Pj. "XEU" 3,791,842 (10,038) 3,781,804 0 22,188 3,997,674 238,057
African Development Fund ADF 2001026 Rural Financial Service Pj. "JPK" 3,645,884 0 3,645,884 0 0 4,253,532 607,647
African Development Fund ADF 2001027 Rural Financial Service Pj. "USD" 663,033 70,680 733,713 0 79,671 775,119 121,076
African Development Fund ADF 2001028 Tetteh-Quarshie-Mamfe Road Project "USD" 8,831,618 295,345 9,126,963 0 441,328 10,331,936 1,646,301
African Development Fund ADF 2001029 Tetteh-Quarshie-Mamfe Road Project "JPK" 15,751,265 (0) 15,751,265 0 0 18,376,476 2,625,211
African Development Fund ADF 2001031 Cashew Development Project 'XEU' (157,519) 16,507,462 16,349,943 0 161,328 17,208,050 1,019,436
African Development Fund ADF 2001032 Cashew Development Project 'USD' 12,912,171 109,749 13,021,920 0 276,600 15,110,492 2,365,172
African Development Fund ADF 2001034 Inland Valleys Rice Development Project 'USD' 30,014,389 (155,051) 29,859,338 0 525,177 34,790,368 5,456,206
African Development Fund ADF 2001035 Tetteh-Quarshie-Mamfe Road Project 'XEU' 24,484,773 (0) 24,484,773 0 261,218 25,749,468 1,525,912
African Development Fund ADF 2001087 Inland Valleys Rice Development Project 'XEU' 14,541,200 (74,959) 14,466,242 0 161,807 15,212,644 908,209
African Development Fund ADF 2001088 Inland Valleys Rice Development Project 'GBP' 60,964 331 61,295 0 775 68,331 7,812
African Development Fund ADF 2002006 Tema-Aflao Road Rehab. Akatsi-Aflao USD 37,036,704 1,997,525 39,034,229 0 590,497 45,575,818 7,132,086
African Development Fund ADF 2002006 Tema-Aflao Road Rehab. Akatsi-Aflao XEU 0 10,342,799 10,342,799 0 112,753 10,879,365 649,318
African Development Fund ADF 2002006 Tema-Aflao Road Rehab. Akatsi-Aflao JPK 0 6,040,094 6,040,094 0 0 7,046,776 1,006,682
African Development Fund ADF 2002006 Tema-Aflao Road Rehab. Akatsi-Aflao GBP 0 1,425,192 1,425,192 0 17,012 1,589,776 181,596
African Development Fund ADF 2002010 Livestock Development Project JPK 14,521,291 0 14,521,292 0 0 16,941,507 2,420,215
African Development Fund ADF 2002042 Livestock Development Project "USD" 35,001,387 115,583 35,116,970 0 705,508 40,828,993 6,417,530
African Development Fund ADF 2002045 Livestock Development Project (XEU) 25,746,070 0 25,746,070 0 282,112 27,080,298 1,616,340
African Development Fund ADF 2002046 Livestock Development Project (GBP) (90,831) 109,441 18,610 0 223 20,758 2,371
African Development Fund ADF 2003012 Akatsi-Dzodze-Noepe RD. Upgrading Pj.'USD 29,944,682 (13,049,298) 16,895,384 0 480,048 19,478,448 3,063,113
African Development Fund ADF 2003012 Akatsi-Dzodze-Noepe RD. Upgrading Pj.'XEU' (72,933) 7,256,851 7,183,918 0 74,697 7,557,002 447,781
African Development Fund ADF 2003012 Akatsi-Dzodze-Noepe RD. Upgrading Pj.'JPK' 0 16,045,713 16,045,713 0 0 18,719,998 2,674,285
African Development Fund ADF 2003012 Akatsi-Dzodze-Noepe RD. Upgrading Pj.'GBP' 0 1,171,901 1,171,901 0 18,895 1,301,647 148,641
African Development Fund ADF 2003020 Community Forestry Management Project 'JPK' 0 8,268,344 8,268,344 0 0 9,646,402 1,378,057
66
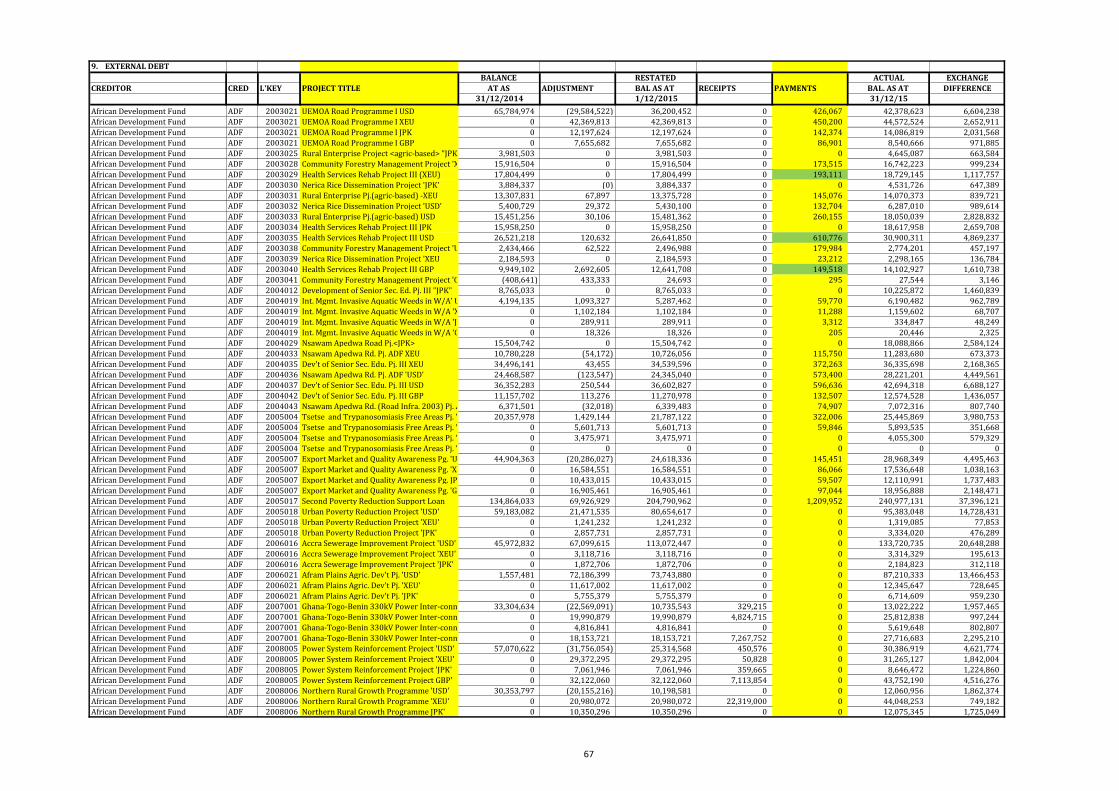
9. EXTERNAL DEBT
BALANCE RESTATED ACTUAL EXCHANGE
CREDITOR CRED L'KEY PROJECT TITLE AT AS ADJUSTMENT BAL AS AT RECEIPTS PAYMENTS BAL. AS AT DIFFERENCE31/12/2014 1/12/2015 31/12/15
African Development Fund ADF 2003021 UEMOA Road Programme I USD 65,784,974 (29,584,522) 36,200,452 0 426,067 42,378,623 6,604,238
African Development Fund ADF 2003021 UEMOA Road Programme I XEU 0 42,369,813 42,369,813 0 450,200 44,572,524 2,652,911
African Development Fund ADF 2003021 UEMOA Road Programme I JPK 0 12,197,624 12,197,624 0 142,374 14,086,819 2,031,568
African Development Fund ADF 2003021 UEMOA Road Programme I GBP 0 7,655,682 7,655,682 0 86,901 8,540,666 971,885
African Development Fund ADF 2003025 Rural Enterprise Project <agric-based> "JPK" 3,981,503 0 3,981,503 0 0 4,645,087 663,584
African Development Fund ADF 2003028 Community Forestry Management Project 'XEU' 15,916,504 0 15,916,504 0 173,515 16,742,223 999,234
African Development Fund ADF 2003029 Health Services Rehab Project III (XEU) 17,804,499 0 17,804,499 0 193,111 18,729,145 1,117,757
African Development Fund ADF 2003030 Nerica Rice Dissemination Project 'JPK' 3,884,337 (0) 3,884,337 0 0 4,531,726 647,389
African Development Fund ADF 2003031 Rural Enterprise Pj.(agric-based) -XEU 13,307,831 67,897 13,375,728 0 145,076 14,070,373 839,721
African Development Fund ADF 2003032 Nerica Rice Dissemination Project 'USD' 5,400,729 29,372 5,430,100 0 132,704 6,287,010 989,614
African Development Fund ADF 2003033 Rural Enterprise Pj.(agric-based) USD 15,451,256 30,106 15,481,362 0 260,155 18,050,039 2,828,832
African Development Fund ADF 2003034 Health Services Rehab Project III JPK 15,958,250 0 15,958,250 0 0 18,617,958 2,659,708
African Development Fund ADF 2003035 Health Services Rehab Project III USD 26,521,218 120,632 26,641,850 0 610,776 30,900,311 4,869,237
African Development Fund ADF 2003038 Community Forestry Management Project 'USD' 2,434,466 62,522 2,496,988 0 179,984 2,774,201 457,197
African Development Fund ADF 2003039 Nerica Rice Dissemination Project 'XEU 2,184,593 0 2,184,593 0 23,212 2,298,165 136,784
African Development Fund ADF 2003040 Health Services Rehab Project III GBP 9,949,102 2,692,605 12,641,708 0 149,518 14,102,927 1,610,738
African Development Fund ADF 2003041 Community Forestry Management Project 'GBP' (408,641) 433,333 24,693 0 295 27,544 3,146
African Development Fund ADF 2004012 Development of Senior Sec. Ed. Pj. III "JPK" 8,765,033 0 8,765,033 0 0 10,225,872 1,460,839
African Development Fund ADF 2004019 Int. Mgmt. Invasive Aquatic Weeds in W/A' USD' 4,194,135 1,093,327 5,287,462 0 59,770 6,190,482 962,789
African Development Fund ADF 2004019 Int. Mgmt. Invasive Aquatic Weeds in W/A 'XEU' 0 1,102,184 1,102,184 0 11,288 1,159,602 68,707
African Development Fund ADF 2004019 Int. Mgmt. Invasive Aquatic Weeds in W/A 'JPK' 0 289,911 289,911 0 3,312 334,847 48,249
African Development Fund ADF 2004019 Int. Mgmt. Invasive Aquatic Weeds in W/A 'GBP' 0 18,326 18,326 0 205 20,446 2,325
African Development Fund ADF 2004029 Nsawam Apedwa Road Pj.<JPK> 15,504,742 0 15,504,742 0 0 18,088,866 2,584,124
African Development Fund ADF 2004033 Nsawam Apedwa Rd. Pj. ADF XEU 10,780,228 (54,172) 10,726,056 0 115,750 11,283,680 673,373
African Development Fund ADF 2004035 Dev't of Senior Sec. Edu. Pj. III XEU 34,496,141 43,455 34,539,596 0 372,263 36,335,698 2,168,365
African Development Fund ADF 2004036 Nsawam Apedwa Rd. Pj. ADF 'USD' 24,468,587 (123,547) 24,345,040 0 573,400 28,221,201 4,449,561
African Development Fund ADF 2004037 Dev't of Senior Sec. Edu. Pj. III USD 36,352,283 250,544 36,602,827 0 596,636 42,694,318 6,688,127
African Development Fund ADF 2004042 Dev't of Senior Sec. Edu. Pj. III GBP 11,157,702 113,276 11,270,978 0 132,507 12,574,528 1,436,057
African Development Fund ADF 2004043 Nsawam Apedwa Rd. (Road Infra. 2003) Pj. ADF 'GBP' 6,371,501 (32,018) 6,339,483 0 74,907 7,072,316 807,740
African Development Fund ADF 2005004 Tsetse and Trypanosomiasis Free Areas Pj. 'USD' 20,357,978 1,429,144 21,787,122 0 322,006 25,445,869 3,980,753
African Development Fund ADF 2005004 Tsetse and Trypanosomiasis Free Areas Pj. 'XEU' 0 5,601,713 5,601,713 0 59,846 5,893,535 351,668
African Development Fund ADF 2005004 Tsetse and Trypanosomiasis Free Areas Pj. 'JPK' 0 3,475,971 3,475,971 0 0 4,055,300 579,329
African Development Fund ADF 2005004 Tsetse and Trypanosomiasis Free Areas Pj. 'GBP' 0 0 0 0 0 0 0
African Development Fund ADF 2005007 Export Market and Quality Awareness Pg. 'USD' 44,904,363 (20,286,027) 24,618,336 0 145,451 28,968,349 4,495,463
African Development Fund ADF 2005007 Export Market and Quality Awareness Pg. 'XEU' 0 16,584,551 16,584,551 0 86,066 17,536,648 1,038,163
African Development Fund ADF 2005007 Export Market and Quality Awareness Pg. JPK' 0 10,433,015 10,433,015 0 59,507 12,110,991 1,737,483
African Development Fund ADF 2005007 Export Market and Quality Awareness Pg. 'GBP' 0 16,905,461 16,905,461 0 97,044 18,956,888 2,148,471
African Development Fund ADF 2005017 Second Poverty Reduction Support Loan 134,864,033 69,926,929 204,790,962 0 1,209,952 240,977,131 37,396,121
African Development Fund ADF 2005018 Urban Poverty Reduction Project 'USD' 59,183,082 21,471,535 80,654,617 0 0 95,383,048 14,728,431
African Development Fund ADF 2005018 Urban Poverty Reduction Project 'XEU' 0 1,241,232 1,241,232 0 0 1,319,085 77,853
African Development Fund ADF 2005018 Urban Poverty Reduction Project 'JPK' 0 2,857,731 2,857,731 0 0 3,334,020 476,289
African Development Fund ADF 2006016 Accra Sewerage Improvement Project 'USD' 45,972,832 67,099,615 113,072,447 0 0 133,720,735 20,648,288
African Development Fund ADF 2006016 Accra Sewerage Improvement Project 'XEU' 0 3,118,716 3,118,716 0 0 3,314,329 195,613
African Development Fund ADF 2006016 Accra Sewerage Improvement Project 'JPK' 0 1,872,706 1,872,706 0 0 2,184,823 312,118
African Development Fund ADF 2006021 Afram Plains Agric. Dev't Pj. 'USD' 1,557,481 72,186,399 73,743,880 0 0 87,210,333 13,466,453
African Development Fund ADF 2006021 Afram Plains Agric. Dev't Pj. 'XEU' 0 11,617,002 11,617,002 0 0 12,345,647 728,645
African Development Fund ADF 2006021 Afram Plains Agric. Dev't Pj. 'JPK' 0 5,755,379 5,755,379 0 0 6,714,609 959,230
African Development Fund ADF 2007001 Ghana-Togo-Benin 330kV Power Inter-connection Pj 'USD'33,304,634 (22,569,091) 10,735,543 329,215 0 13,022,222 1,957,465
African Development Fund ADF 2007001 Ghana-Togo-Benin 330kV Power Inter-connection Pj 'XEU' 0 19,990,879 19,990,879 4,824,715 0 25,812,838 997,244
African Development Fund ADF 2007001 Ghana-Togo-Benin 330kV Power Inter-connection Pj 'JPK' 0 4,816,841 4,816,841 0 0 5,619,648 802,807
African Development Fund ADF 2007001 Ghana-Togo-Benin 330kV Power Inter-connection Pj 'GBP 0 18,153,721 18,153,721 7,267,752 0 27,716,683 2,295,210
African Development Fund ADF 2008005 Power System Reinforcement Project 'USD' 57,070,622 (31,756,054) 25,314,568 450,576 0 30,386,919 4,621,774
African Development Fund ADF 2008005 Power System Reinforcement Project 'XEU' 0 29,372,295 29,372,295 50,828 0 31,265,127 1,842,004
African Development Fund ADF 2008005 Power System Reinforcement Project 'JPK' 0 7,061,946 7,061,946 359,665 0 8,646,472 1,224,860
African Development Fund ADF 2008005 Power System Reinforcement Project GBP' 0 32,122,060 32,122,060 7,113,854 0 43,752,190 4,516,276
African Development Fund ADF 2008006 Northern Rural Growth Programme 'USD' 30,353,797 (20,155,216) 10,198,581 0 0 12,060,956 1,862,374
African Development Fund ADF 2008006 Northern Rural Growth Programme 'XEU' 0 20,980,072 20,980,072 22,319,000 0 44,048,253 749,182
African Development Fund ADF 2008006 Northern Rural Growth Programme JPK' 0 10,350,296 10,350,296 0 0 12,075,345 1,725,049
67

9. EXTERNAL DEBT
BALANCE RESTATED ACTUAL EXCHANGE
CREDITOR CRED L'KEY PROJECT TITLE AT AS ADJUSTMENT BAL AS AT RECEIPTS PAYMENTS BAL. AS AT DIFFERENCE31/12/2014 1/12/2015 31/12/15
African Development Fund ADF 2008006 Northern Rural Growth Programme 'GBP' 0 31,388,639 31,388,639 21,446,760 0 57,903,154 5,067,756
African Development Fund ADF 2008015 Gender Responsive Skills and Community Development PJ. 'USD'6,241,732 (5,244,810) 996,923 0 0 1,178,972 182,049
African Development Fund ADF 2008015 Gender Responsive Skills and Community Development PJ. 'XEU' 0 2,711,160 2,711,160 0 0 2,881,211 170,050
African Development Fund ADF 2008015 Gender Responsive Skills and Community Development PJ.'JPK' 0 1,651,675 1,651,675 0 0 1,926,954 275,279
African Development Fund ADF 2008015 Gender Responsive Skills and Community Development PJ. 'GBP' 0 3,770,752 3,770,752 143,235 0 4,403,138 489,151
African Development Fund ADF 2008028 Poverty Reduction Support Loan III 'USD' 275,961,600 176,042,951 452,004,551 0 0 534,545,614 82,541,063
African Development Fund ADF 2009010 UEMOA-Ghana Road Programme - Additional Loan 'USD'12,751,947 (6,697,770) 6,054,177 0 125,745 7,013,620 1,085,188
African Development Fund ADF 2009010 UEMOA-Ghana Road Programme - Additional Loan 'XEU' 0 3,885,174 3,885,174 0 87,633 4,044,599 247,057
African Development Fund ADF 2009010 UEMOA-Ghana Road Programme - Additional Loan 'JPK' 0 5,025,664 5,025,664 0 120,986 5,743,616 838,938
African Development Fund ADF 2009010 UEMOA-Ghana Road Programme - Additional Loan 'GBP' 0 4,237,884 4,237,884 0 101,502 4,678,549 542,167
African Development Fund ADF 2009011 Tema -Afloa Rehab. Road Pj - Additional Loan 'USD' 52,867,287 (26,485,159) 26,382,128 0 559,598 30,549,538 4,727,008
African Development Fund ADF 2009011 Tema -Afloa Rehab. Road Pj - Additional Loan 'XEU' 0 31,316,854 31,316,854 0 648,095 32,679,428 2,010,668
African Development Fund ADF 2009011 Tema -Afloa Rehab. Road Pj - Additional Loan 'JPK' 0 3,884,722 3,884,722 0 104,147 4,429,172 648,596
African Development Fund ADF 2009011 Tema -Afloa Rehab. Road Pj - Additional Loan 'GBP' 0 36,682,065 36,682,065 13,225,851 1,178,481 54,062,194 5,332,759
African Development Fund ADF 2009012 Akatsi-Dzodze-Noepe Road Upgrading Pj- Additionnal Loan 'USD'31,396,531 12,823,115 44,219,646 0 918,438 51,227,408 7,926,200
African Development Fund ADF 2009012 Akatsi-Dzodze-Noepe Road Upgrading Pj- Additionnal Loan 'XEU'0 3,864,956 3,864,956 0 87,177 4,023,551 245,772
African Development Fund ADF 2009012 Akatsi-Dzodze-Noepe Road Upgrading Pj- Additionnal Loan 'JPK'0 1,064,092 1,064,092 0 25,617 1,216,105 177,630
African Development Fund ADF 2009012 Akatsi-Dzodze-Noepe Road Upgrading Pj- Additionnal Loan 'GBP'0 1,327,021 1,327,021 0 31,784 1,465,008 169,770
African Development Fund ADF 2010005 Rehabilitation of Pokuasi-Awoshie Road 'USD' 85,164,256 (52,970,024) 32,194,231 0 0 38,073,256 5,879,025
African Development Fund ADF 2010005 Rehabilitation of Pokuasi-Awoshie Road 'XEU' 0 24,356,609 24,356,609 6,328,481 0 32,017,435 1,332,345
African Development Fund ADF 2010005 Rehabilitation of Pokuasi-Awoshie Road 'JPK' 0 15,518,493 15,518,493 0 0 18,104,908 2,586,415
African Development Fund ADF 2010005 Rehabilitation of Pokuasi-Awoshie Road 'GBP' 0 73,769,478 73,769,478 5,737,326 0 88,918,945 9,412,141
African Development Fund ADF 2011024 Poverty Reduction and Buss. Env. Supp. Prog. (PRBSP)141,243,128 74,958,969 216,202,097 0 0 255,683,007 39,480,910
African Development Fund ADF 2012041 Development of Skills for Industry Project 1,661,759 4,502,658 6,164,417 901,579 0 8,178,740 1,112,744
African Development Fund ADF 2015017 Programme Based Operation 209,981,596 210,003,723 22,127
Ecowas Bank for International DevelopmentEBID 2002007 Akatsi-Aflao Road Rehab. Pj. Main 5,630,142 1,652,164 7,282,306 0 1,439,551 10,405,709 4,562,955
Ecowas Bank for International DevelopmentEBID 2008018 Modernization of Ghana National Fire Service 13,285,249 0 13,285,249 707,388 1,396,578 15,127,883 2,531,824
Ecowas Bank for International DevelopmentEBID 2009022 SHEP-4 Ashant Region and B/A 11,179,409 19,191,145 30,370,554 1,714,769 0 37,929,317 5,843,994
Ecowas Bank for International DevelopmentEBID 2010006 Bekwai District Hospital (Health Services Rehab Pj. III) 7,989,208 754,847 8,744,055 0 0 14,842,941 6,098,886
Ecowas Bank for International Development 38,084,009 21,598,155 59,682,164 2,422,157 2,836,129 78,305,850 19,037,658
European Investment Bank EIB 2006014 West African Gas Pipeline Project 215,937,996 0 215,937,996 0 17,110,360 212,186,585 13,358,949
International Development AssociationIDA 1995033 Thermal Power Project 56,233,715 (1,621) 56,232,094 0 3,319,393 60,731,759 7,819,058
International Development AssociationIDA 1996018 Urban Environmental Sanitation Pj-URB 4 3,453,738 (1,290) 3,452,448 0 97,422 3,829,409 474,382
International Development AssociationIDA 1996021 Public Enterprise & Priv. Tech. Asst. Pj 11,611,678 (1,147) 11,610,531 0 281,509 12,878,198 1,549,175
International Development AssociationIDA 1997023 Village Infrastructure Pj. 13,456,357 159,431 13,615,788 0 185,928 15,297,272 1,867,411
International Development AssociationIDA 1998025 Trade and Investment Gateway Pj. 68,840,301 (765,991) 68,074,310 0 1,738,823 75,695,600 9,360,113
International Development AssociationIDA 1999009 Public Sector Management Reform Project 160,619 (4,517) 156,102 0 3,914 173,467 21,280
International Development AssociationIDA 1999016 Community Water and Sanitation ProjectII 38,259,856 (4,108) 38,255,748 0 999,832 42,516,349 5,260,433
International Development AssociationIDA 2000006 National Functional Literacy Project 67,932,095 (12,265) 67,919,830 0 1,775,062 75,484,218 9,339,451
International Development AssociationIDA 2000013 Urban V Project 8,434,757 (1,460) 8,433,298 0 221,287 9,375,668 1,163,657
International Development AssociationIDA 2001014 Road Sector Development Project 642,754,774 (6,986,690) 635,768,084 0 15,170,763 707,148,566 86,551,245
International Development AssociationIDA 2001015 Rural Financial Services Project 13,704,543 (2,491) 13,702,052 0 350,264 15,235,803 1,884,015
International Development AssociationIDA 2001018 Ghana Aids Response Project 40,621,781 (6,933) 40,614,848 0 1,042,562 45,175,718 5,603,432
International Development AssociationIDA 2001019 Community-Based Poverty Reduction Proj 9,120,929 (621) 9,120,307 0 211,216 10,133,886 1,224,795
International Development AssociationIDA 2001020 Agric.Services Sub-sector Investment Pj. 159,566,202 (10,635) 159,555,567 0 3,615,629 177,376,896 21,436,958
International Development AssociationIDA 2003005 2ND Health Sector Program Support Pj. 193,569,511 (63,030) 193,506,481 0 4,649,744 215,484,035 26,627,299
International Development AssociationIDA 2003013 Land Administration Project 63,898,613 1,691,556 65,590,169 0 1,394,147 73,019,628 8,823,606
International Development AssociationIDA 2004005 Education Sector Project 243,043,178 (1,065,263) 241,977,915 0 4,959,144 269,994,748 32,975,976
International Development AssociationIDA 2004006 Second Poverty Reduction Support Financg 268,894,890 (65,019) 268,829,871 0 6,075,366 299,422,618 36,668,114
International Development AssociationIDA 2004007 Community Based Rural Dev't Project 247,630,763 (43,629) 247,587,134 0 4,206,047 277,157,630 33,776,543
International Development AssociationIDA 2004008 Second Urban Environmental Sanitation Pj 183,392,281 68,583 183,460,864 0 4,033,049 204,417,895 24,990,080
International Development AssociationIDA 2004009 Small Town Water SS & Sanitation Project 125,248,473 6,939,780 132,188,253 0 1,717,063 148,542,651 18,071,461
International Development AssociationIDA 2005008 First -Phase of Coastal Transmision Backbone Project121,916,084 0 121,916,084 0 1,392,549 137,257,833 16,734,298
International Development AssociationIDA 2005011 Third Poverty Reduction Support 390,267,000 0 390,267,000 0 4,460,859 439,253,424 53,447,283
International Development AssociationIDA 2005015 Economic Management Capacity Building Proj. 80,053,461 0 80,053,461 0 915,033 90,101,794 10,963,366
International Development AssociationIDA 2005016 Multi Sectoral HIV/AIDS Proj. 64,072,389 0 64,072,389 0 0 72,858,669 8,786,281
International Development AssociationIDA 2006003 Micro Small Scale and Medium Enterprise Project. 133,226,161 0 133,226,161 0 0 151,495,535 18,269,374
International Development AssociationIDA 2006011 4th Poverty Reduction Support Credit 451,449,000 0 451,449,000 0 0 513,356,440 61,907,440
68

9. EXTERNAL DEBT
BALANCE RESTATED ACTUAL EXCHANGE
CREDITOR CRED L'KEY PROJECT TITLE AT AS ADJUSTMENT BAL AS AT RECEIPTS PAYMENTS BAL. AS AT DIFFERENCE31/12/2014 1/12/2015 31/12/15
International Development AssociationIDA 2006023 eGhana Project 122,455,268 0 122,455,268 2,217,284 0 141,433,341 16,760,790
International Development AssociationIDA 2007007 Fifth Poverty Reduction Support Credit 336,964,500 0 336,964,500 0 0 383,172,620 46,208,120
International Development AssociationIDA 2007015 Energy Development and Access Project 263,516,283 0 263,516,283 1,420,182 0 301,292,070 36,355,605
International Development AssociationIDA 2007016 Health Insurance Project 46,149,872 0 46,149,872 0 0 52,478,428 6,328,556
International Development AssociationIDA 2007017 Nutritution and Malaria Control for Child Survival Project75,678,873 0 75,678,873 0 0 86,056,756 10,377,884
International Development AssociationIDA 2007027 Urban Transport Project 92,289,195 0 92,289,195 21,173,018 0 125,206,064 11,743,851
International Development AssociationIDA 2007030 II Phase of the Coastal Transmission Backbone Pj. 135,685,262 0 135,685,262 0 0 154,291,854 18,606,592
International Development AssociationIDA 2007031 West Africa Agricultural Productivity Program(WAAP) Supp.Pj.46,714,013 0 46,714,013 0 0 53,119,930 6,405,917
International Development AssociationIDA 2008011 Additional Financing- Economic Management Capacity Building Proj.28,493,796 0 28,493,796 0 0 32,401,166 3,907,369
International Development AssociationIDA 2008014 Sixth Poverty Reduction Support Credit 281,808,000 0 281,808,000 0 0 320,452,480 38,644,480
International Development AssociationIDA 2008026 1st Agric. Development Policy Operation 73,233,000 0 73,233,000 0 0 83,275,480 10,042,480
International Development AssociationIDA 2008027 1st Nat.Resource&Env.Gov.Dev.Policy Operation 57,937,500 0 57,937,500 0 0 65,882,500 7,945,000
International Development AssociationIDA 2008036 West African Transport and Transit Facilitation Project205,138,828 0 205,138,828 4,780,519 0 238,000,193 28,080,846
International Development AssociationIDA 2009017 Economic Governance and Poverty Credit 898,263,000 0 898,263,000 0 0 1,021,442,280 123,179,280
International Development AssociationIDA 2009018 Transport Sector Project 393,039,127 0 393,039,127 49,184,449 0 497,915,374 55,691,797
International Development AssociationIDA 2009021 2ND NREG-WORLD BANK 31,518,000 0 31,518,000 0 0 35,840,080 4,322,080
International Development AssociationIDA 2010014 e-Ghana Project Additonal Financing 121,156,119 0 121,156,119 14,225,143 0 154,227,749 18,846,487
International Development AssociationIDA 2010015 2nd Agric Development Policy Operation 76,477,500 0 76,477,500 0 0 86,964,900 10,487,400
International Development AssociationIDA 2010016 Energy Developmenmt and Access Project Additonal 154,109,194 0 154,109,194 13,290,817 0 189,035,628 21,635,617
International Development AssociationIDA 2010017 3rd Nat. Resource and Environ. Gov. Develop. Policy 30,591,000 0 30,591,000 0 0 34,785,960 4,194,960
International Development AssociationIDA 2010018 Sustainable Water and Sanitation Project 159,855,817 0 159,855,817 49,980,704 0 235,389,006 25,552,485
International Development AssociationIDA 2010019 Social Opportunities Project 211,624,836 0 211,624,836 34,852,644 0 278,029,942 31,552,462
International Development AssociationIDA 2011005 Seventh Poverty Reduction Support Credit (PRSC-VII)653,535,000 0 653,535,000 0 0 743,154,600 89,619,600
International Development AssociationIDA 2010029 Abidjan-Lagos Transport Facilitation Project 215,685,208 0 215,685,208 115,373,042 0 365,897,763 34,839,513
International Development AssociationIDA 2011014 Oil And Gas Capacity Building Project 108,449,766 0 108,449,766 3,187,194 0 126,725,338 15,088,378
International Development AssociationIDA 2011015 Third Agriculture Development Policy Operation 166,860,000 0 166,860,000 0 0 189,741,600 22,881,600
International Development AssociationIDA 2011021 Local Government Capacity Support Project 184,305,720 0 184,305,720 56,965,204 0 270,683,699 29,412,775
International Development AssociationIDA 2011022 Ghana Skills and Technology Development Project 101,074,960 67,483 101,142,443 63,600,068 0 179,437,570 14,695,059
International Development AssociationIDA 2011026 Land Administration Project 2 74,494,486 0 74,494,486 14,577,758 0 99,555,723 10,483,479
International Development AssociationIDA 2012008 Inter-Zonal Transmission Hub Project of th e West African Power Pool (APL3) - Phase 4,946,956 0 4,946,956 0 0 5,625,335 678,379
International Development AssociationIDA 2012009 Regional Trade Facilitation Project-PhaseII 0 0 0 0 0 0 0
International Development AssociationIDA 2012010 Fourth Agriculture Development Policy Operation 149,710,500 0 149,710,500 0 0 170,240,380 20,529,880
International Development AssociationIDA 2012033 West Africa Regional Fisheries Program - Phase I 30,884,300 0 30,884,300 10,387,977 0 44,991,471 3,719,194
International Development AssociationIDA 2012017 Ghana Commercial Agriculture Project 80,162,402 0 80,162,402 13,428,956 0 105,559,759 11,968,400
International Development AssociationIDA 2012018 West Africa Productivity Program (WAAPP) - 2A 78,949,432 0 78,949,432 66,960,519 0 153,984,802 8,074,851
International Development AssociationIDA 2012024 Public Private Partnership Project 19,306,240 0 19,306,240 12,219,389 0 33,564,790 2,039,161
International Development AssociationIDA 2014006 Ghana Statistical Development Project 0 30,716,637 30,716,637 0 0 34,928,826 4,212,189
International Development AssociationIDA 2014009 Ghana Secondary Education Improvement Project 0 0 0 145,072,323 0 153,414,567 8,342,244
International Development AssociationIDA 2014010 eTransform Ghana Project 0 0 0 65,713,239 0 69,410,992 3,697,753
International Development AssociationIDA 2015015 Macro- economic stability for Competitiveness and Growth Dev't Policy Finance0 611,976,391 576,116,147 (35,860,244)
International Fund for Agric. DevelopmentIFAD 1980011 Volta Region Agric. Dev't Project 16,900,645 (599,617) 16,301,029 0 559,958 17,906,327 2,165,256
International Fund for Agric. DevelopmentIFAD 1987004 Small Holder Rehab. & Dev't Programme 10,679,167 (134,252) 10,544,915 0 579,375 11,451,814 1,486,274
International Fund for Agric. DevelopmentIFAD 1987005 Small Holder Rehab. & Dev't Programme 14,555,090 (169,258) 14,385,832 0 789,644 15,623,774 2,027,586
International Fund for Agric. DevelopmentIFAD 1990031 Smallholder Credt, Input SS & Mkting pro 30,059,489 (3,332,863) 26,726,627 0 1,655,565 28,783,705 3,712,643
International Fund for Agric. DevelopmentIFAD 1990032 Smallholder Credt, Input SS & Mkting Pro 12,940,855 (1,595,334) 11,345,521 0 549,192 12,385,671 1,589,342
International Fund for Agric. DevelopmentIFAD 1991001 U-E Reg. Land Consv. & Smallholder Proj 31,224,173 (3,493,420) 27,730,753 0 1,174,071 30,307,995 3,751,313
International Fund for Agric. DevelopmentIFAD 1994005 Rural Enterprises Project 19,046,131 (2,051,333) 16,994,798 0 668,309 18,657,306 2,330,817
International Fund for Agric. DevelopmentIFAD 1995022 Upper West Agricultural Development Pj. 25,529,111 (4,116,680) 21,412,431 0 1,124,638 23,174,837 2,887,043
International Fund for Agric. DevelopmentIFAD 1997024 Village Infrastructure Project 19,442,763 (247,044) 19,195,719 0 451,883 21,319,574 2,575,738
International Fund for Agric. DevelopmentIFAD 1998018 Root and Tuber Improvement Project 26,782,978 (3,539,564) 23,243,414 0 1,152,677 25,278,657 3,187,920
International Fund for Agric. DevelopmentIFAD 1999006 U-E Reg. Land Consv. & Smallholder Pj.2 33,492,766 (4,719,358) 28,773,408 0 1,339,503 31,380,242 3,946,338
International Fund for Agric. DevelopmentIFAD 2001017 Rural Financial Services Project 36,099,566 (3,830,800) 32,268,767 0 1,501,660 35,241,578 4,474,472
International Fund for Agric. DevelopmentIFAD 2003001 Northern Region Poverty Reduction Pj 36,326,812 (1,307,116) 35,019,696 0 1,558,181 38,315,084 4,853,569
International Fund for Agric. DevelopmentIFAD 2003002 Rural Enterprise Project Project II 35,351,615 (670,209) 34,681,406 0 1,556,536 37,931,995 4,807,125
International Fund for Agric. DevelopmentIFAD 2006008 Root and Tuber Improvement and Marketing Programme (RTIMP)41,902,927 0 41,902,927 1,721,692 1,146,409 48,314,106 5,835,896
International Fund for Agric. DevelopmentIFAD 2008029 Northern Rural Growth Programme 22,601,187 0 22,601,187 8,993,134 0 34,343,270 2,748,949
International Fund for Agric. DevelopmentIFAD 2009020 Rural and Agric. Finance Programme(RAFIP) 9,476,819 0 9,476,819 3,381,417 0 13,967,625 1,109,390
International Fund for Agric. DevelopmentIFAD 2010007 Rural and Agric. Finance Programme(RAFIP) 0 0 0 13,422,560 0 12,843,436 (579,124)
69
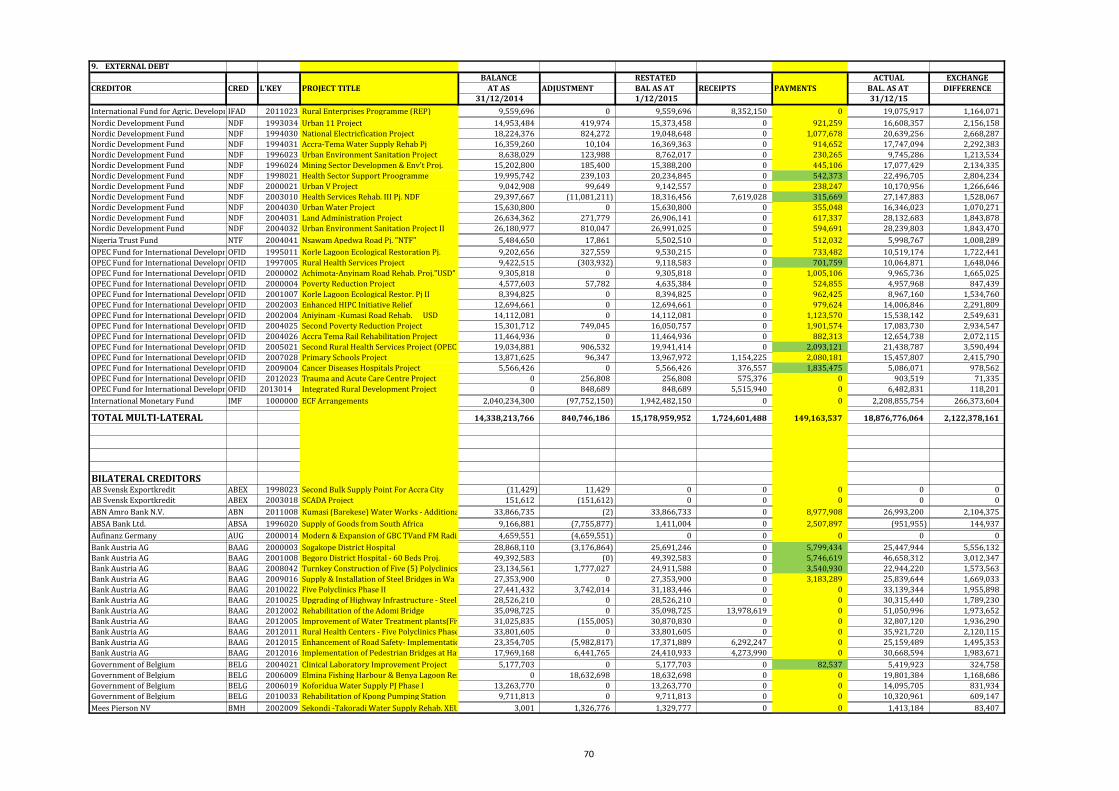
9. EXTERNAL DEBT
BALANCE RESTATED ACTUAL EXCHANGE
CREDITOR CRED L'KEY PROJECT TITLE AT AS ADJUSTMENT BAL AS AT RECEIPTS PAYMENTS BAL. AS AT DIFFERENCE31/12/2014 1/12/2015 31/12/15
International Fund for Agric. DevelopmentIFAD 2011023 Rural Enterprises Programme (REP) 9,559,696 0 9,559,696 8,352,150 0 19,075,917 1,164,071
Nordic Development Fund NDF 1993034 Urban 11 Project 14,953,484 419,974 15,373,458 0 921,259 16,608,357 2,156,158
Nordic Development Fund NDF 1994030 National Electricfication Project 18,224,376 824,272 19,048,648 0 1,077,678 20,639,256 2,668,287
Nordic Development Fund NDF 1994031 Accra-Tema Water Supply Rehab Pj 16,359,260 10,104 16,369,363 0 914,652 17,747,094 2,292,383
Nordic Development Fund NDF 1996023 Urban Environment Sanitation Project 8,638,029 123,988 8,762,017 0 230,265 9,745,286 1,213,534
Nordic Development Fund NDF 1996024 Mining Sector Developmen & Env't Proj. 15,202,800 185,400 15,388,200 0 445,106 17,077,429 2,134,335
Nordic Development Fund NDF 1998021 Health Sector Support Proogramme 19,995,742 239,103 20,234,845 0 542,373 22,496,705 2,804,234
Nordic Development Fund NDF 2000021 Urban V Project 9,042,908 99,649 9,142,557 0 238,247 10,170,956 1,266,646
Nordic Development Fund NDF 2003010 Health Services Rehab. III Pj. NDF 29,397,667 (11,081,211) 18,316,456 7,619,028 315,669 27,147,883 1,528,067
Nordic Development Fund NDF 2004030 Urban Water Project 15,630,800 0 15,630,800 0 355,048 16,346,023 1,070,271
Nordic Development Fund NDF 2004031 Land Administration Project 26,634,362 271,779 26,906,141 0 617,337 28,132,683 1,843,878
Nordic Development Fund NDF 2004032 Urban Environment Sanitation Project II 26,180,977 810,047 26,991,025 0 594,691 28,239,803 1,843,470
Nigeria Trust Fund NTF 2004041 Nsawam Apedwa Road Pj. "NTF" 5,484,650 17,861 5,502,510 0 512,032 5,998,767 1,008,289
OPEC Fund for International DevelopmentOFID 1995011 Korle Lagoon Ecological Restoration Pj. 9,202,656 327,559 9,530,215 0 733,482 10,519,174 1,722,441
OPEC Fund for International DevelopmentOFID 1997005 Rural Health Services Project 9,422,515 (303,932) 9,118,583 0 701,759 10,064,871 1,648,046
OPEC Fund for International DevelopmentOFID 2000002 Achimota-Anyinam Road Rehab. Proj."USD" 9,305,818 0 9,305,818 0 1,005,106 9,965,736 1,665,025
OPEC Fund for International DevelopmentOFID 2000004 Poverty Reduction Project 4,577,603 57,782 4,635,384 0 524,855 4,957,968 847,439
OPEC Fund for International DevelopmentOFID 2001007 Korle Lagoon Ecological Restor. Pj II 8,394,825 0 8,394,825 0 962,425 8,967,160 1,534,760
OPEC Fund for International DevelopmentOFID 2002003 Enhanced HIPC Initiative Relief 12,694,661 0 12,694,661 0 979,624 14,006,846 2,291,809
OPEC Fund for International DevelopmentOFID 2002004 Aniyinam -Kumasi Road Rehab. USD 14,112,081 0 14,112,081 0 1,123,570 15,538,142 2,549,631
OPEC Fund for International DevelopmentOFID 2004025 Second Poverty Reduction Project 15,301,712 749,045 16,050,757 0 1,901,574 17,083,730 2,934,547
OPEC Fund for International DevelopmentOFID 2004026 Accra Tema Rail Rehabilitation Project 11,464,936 0 11,464,936 0 882,313 12,654,738 2,072,115
OPEC Fund for International DevelopmentOFID 2005021 Second Rural Health Services Project (OPEC) 19,034,881 906,532 19,941,414 0 2,093,121 21,438,787 3,590,494
OPEC Fund for International DevelopmentOFID 2007028 Primary Schools Project 13,871,625 96,347 13,967,972 1,154,225 2,080,181 15,457,807 2,415,790
OPEC Fund for International DevelopmentOFID 2009004 Cancer Diseases Hospitals Project 5,566,426 0 5,566,426 376,557 1,835,475 5,086,071 978,562
OPEC Fund for International DevelopmentOFID 2012023 Trauma and Acute Care Centre Project 0 256,808 256,808 575,376 0 903,519 71,335
OPEC Fund for International DevelopmentOFID 2013014 Integrated Rural Development Project 0 848,689 848,689 5,515,940 0 6,482,831 118,201
International Monetary Fund IMF 1000000 ECF Arrangements 2,040,234,300 (97,752,150) 1,942,482,150 0 0 2,208,855,754 266,373,604
TOTAL MULTI-LATERAL 14,338,213,766 840,746,186 15,178,959,952 1,724,601,488 149,163,537 18,876,776,064 2,122,378,161
BILATERAL CREDITORSAB Svensk Exportkredit ABEX 1998023 Second Bulk Supply Point For Accra City (11,429) 11,429 0 0 0 0 0
AB Svensk Exportkredit ABEX 2003018 SCADA Project 151,612 (151,612) 0 0 0 0 0
ABN Amro Bank N.V. ABN 2011008 Kumasi (Barekese) Water Works - Additional Works 33,866,735 (2) 33,866,733 0 8,977,908 26,993,200 2,104,375
ABSA Bank Ltd. ABSA 1996020 Supply of Goods from South Africa 9,166,881 (7,755,877) 1,411,004 0 2,507,897 (951,955) 144,937
Aufinanz Germany AUG 2000014 Modern & Expansion of GBC TVand FM Radio 4,659,551 (4,659,551) 0 0 0 0 0
Bank Austria AG BAAG 2000003 Sogakope District Hospital 28,868,110 (3,176,864) 25,691,246 0 5,799,434 25,447,944 5,556,132
Bank Austria AG BAAG 2001008 Begoro District Hospital - 60 Beds Proj. 49,392,583 (0) 49,392,583 0 5,746,619 46,658,312 3,012,347
Bank Austria AG BAAG 2008042 Turnkey Construction of Five (5) Polyclinics 23,134,561 1,777,027 24,911,588 0 3,540,930 22,944,220 1,573,563
Bank Austria AG BAAG 2009016 Supply & Installation of Steel Bridges in Wa 27,353,900 0 27,353,900 0 3,183,289 25,839,644 1,669,033
Bank Austria AG BAAG 2010022 Five Polyclinics Phase II 27,441,432 3,742,014 31,183,446 0 0 33,139,344 1,955,898
Bank Austria AG BAAG 2010025 Upgrading of Highway Infrastructure - Steel Bridges II 28,526,210 0 28,526,210 0 0 30,315,440 1,789,230
Bank Austria AG BAAG 2012002 Rehabilitation of the Adomi Bridge 35,098,725 0 35,098,725 13,978,619 0 51,050,996 1,973,652
Bank Austria AG BAAG 2012005 Improvement of Water Treatment plants(Five Towns) 31,025,835 (155,005) 30,870,830 0 0 32,807,120 1,936,290
Bank Austria AG BAAG 2012011 Rural Health Centers - Five Polyclinics Phase III 33,801,605 0 33,801,605 0 0 35,921,720 2,120,115
Bank Austria AG BAAG 2012015 Enhancement of Road Safety- Implementation of Photovoltaic-Based Street Lighting23,354,705 (5,982,817) 17,371,889 6,292,247 0 25,159,489 1,495,353
Bank Austria AG BAAG 2012016 Implementation of Pedestrian Bridges at Hazardous Road Locations in Ghana17,969,168 6,441,765 24,410,933 4,273,990 0 30,668,594 1,983,671
Government of Belgium BELG 2004021 Clinical Laboratory Improvement Project 5,177,703 0 5,177,703 0 82,537 5,419,923 324,758
Government of Belgium BELG 2006009 Elmina Fishing Harbour & Benya Lagoon Restor. Pj 0 18,632,698 18,632,698 0 0 19,801,384 1,168,686
Government of Belgium BELG 2006019 Koforidua Water Supply PJ Phase I 13,263,770 0 13,263,770 0 0 14,095,705 831,934
Government of Belgium BELG 2010033 Rehabilitation of Kpong Pumping Station 9,711,813 0 9,711,813 0 0 10,320,961 609,147
Mees Pierson NV BMH 2002009 Sekondi -Takoradi Water Supply Rehab. XEU 3,001 1,326,776 1,329,777 0 0 1,413,184 83,407
70

9. EXTERNAL DEBT
BALANCE RESTATED ACTUAL EXCHANGE
CREDITOR CRED L'KEY PROJECT TITLE AT AS ADJUSTMENT BAL AS AT RECEIPTS PAYMENTS BAL. AS AT DIFFERENCE31/12/2014 1/12/2015 31/12/15
Mees Pierson NV BMH 2003017 Odaw Drainage Improvement Works 0 2,176,826 2,176,826 0 2,263,894 0 87,069
Mees Pierson NV BMH 2004010 Kwanyaku Water Trtment Plant Rehab & Exp 17,408,190 0 17,408,190 0 7,313,783 11,100,043 1,005,636
Mees Pierson NV BMH 2004016 Rehab of Sefwi-Wiawso Benkyema Junction Road PJ 31,418,081 (65,957) 31,352,124 0 7,323,264 25,204,828 1,175,967
Mees Pierson NV BMH 2004022 Sub-Transmission Imp. PJ. Accra- Kumasi 46,814,370 (0) 46,814,370 0 10,152,343 45,297,160 8,635,133
Mees Pierson NV BMH 2005014 Gushiegu District Hospital Project 11,534,820 (72,940) 11,461,880 0 4,244,805 8,017,693 800,618
Mees Pierson NV BMH 2006001 Baifikrom water supply project 19,231,292 (6,971) 19,224,321 0 4,923,640 15,329,994 1,029,314
Mees Pierson NV BMH 2006002 District Dental Facilities project 3,115,294 (0) 3,115,294 0 1,269,620 740,575 (1,105,099)
Mees Pierson NV BMH 2006017 Odaw Drainage Extension Project 4,905,967 (32) 4,905,936 0 3,425,263 1,737,916 257,243
Mees Pierson NV BMH 2007003 Barekese Water Supply Project 34,418,763 15,901,201 50,319,964 0 7,316,706 46,152,124 3,148,866
Mees Pierson NV BMH 2008003 Regional Street Lighting Project 35,223,961 3,960,012 39,183,974 0 6,956,172 34,670,150 2,442,349
Mees Pierson NV BMH 2008017 Winneba District Hospital Project 27,411,023 (2) 27,411,021 0 4,914,262 24,275,257 1,778,498
Mees Pierson NV BMH 2009001 Sub-Transmission Improvement Project Phase II 202,833,764 (3,924,348) 198,909,416 0 28,379,418 182,143,404 11,613,406
Mees Pierson NV BMH 2010003 Rehabilitation of Tamale Teaching Hospital 71,272,157 5,928,210 77,200,367 0 10,522,539 70,837,506 4,159,679
Banque National de Paris BNP 2009009 Supply & Installtion of Equipment (SHEP IV) 31,843,750 (1,522,908) 30,320,843 0 3,599,480 28,900,396 2,179,034
Banque National de Paris BNP 2010009 Ada Coastal Protection Works Project 208,545,682 9,475,026 218,020,708 0 33,622,197 197,702,883 13,304,372
Banque National de Paris BNP 2011002 Vessel Traffic Management Information System (VTMIS)52,712,417 16,403,302 69,115,719 0 2,842,664 70,512,784 4,239,729
Banque National de Paris BNP 2011019 Supply and Delivery of Various Types of Vechicles 153,625,966 (14,130,150) 139,495,816 0 39,216,738 109,693,269 9,414,191
Banque National de Paris BNP 2012019 Supply of Steel Bridges for the Enhancement of Rural Development on Selected Feeder Roads24,613,215 0 24,613,215 1,823,824 0 28,085,493 1,648,453
Banque National de Paris BNP 2012028 Construction of Kwame Nkrumah Circle Flyover 228,112,048 11,793,825 239,905,874 52,948,608 52,623,792 259,134,719 18,904,030
Cooperatieve Central Raifffeisen-Bank CCRB 2004024 Const. of Modula Steel Truss Bridges 4,551,321 (4,551,321) 0 0 4,986,512 (4,836,790) 149,723
Cooperatieve Central Raifffeisen-Bank CCRB 2004027 Const. & Delivery of Two Tugboats + Parts 1,361,891 0 1,361,891 0 0 1,447,312 85,421
Cooperatieve Central Raifffeisen-Bank CCRB 2012021 Ada Coastal Protection Works- Phase II 465,081,539 0 465,081,539 41,891,395 0 539,588,570 32,615,637
Commerzbank CMBK 2006004 Supply of 63 buses & spare parts project 11,678,175 1,950,906 13,629,081 0 3,925,861 10,345,663 642,444
Commerzbank CMBK 2006020 Supply & Inst. of Telecom System Pj 11,856,375 741,023 12,597,398 0 2,384,978 11,025,030 812,609
Commerzbank CMBK 2006037 Supply of 75 Jonckheere Buses &. Spare Parts 33,803,383 (0) 33,803,383 0 3,892,512 31,932,097 2,021,227
Commerzbank CMBK 2007033 Supply of 75 Jonckheere Buses and Spare Parts 35,681,349 (1,877,964) 33,803,384 0 3,892,513 31,932,099 2,021,227
Commerzbank CMBK 2008030 Supply of 150 Buses and Spare Parts 30,553,904 0 30,553,904 0 3,240,268 29,223,284 1,909,648
Commerzbank CMBK 2010020 Supply of 50 Jonckheere Bus 18,332,983 0 18,332,983 0 4,710,972 14,612,153 990,142
Commerzbank CMBK 2010030 Supply of 50 Jonckhere Buses 20,728,011 3,604,871 24,332,882 0 4,936,611 21,070,375 1,674,104
China International Water & Electric CorpCWE 2006028 Supply & Installation of Equipment SHEP 4 635,599,800 (101,118,150) 534,481,650 0 78,807,314 551,326,296 95,651,959
China International Water & Electric CorpCWE 2010026 NES - Upper West Regional Electrification Project 143,491,832 104,707,263 248,199,095 0 28,109,209 265,568,441 45,478,555
China International Water & Electric CorpCWE 2012004 Upper West Electrification Extension 322,405,647 0 322,405,647 0 0 381,280,508 58,874,861
Deutsche Bank Sociedad Anonima Espanola DESA 2011009 Supply of 2 C-295 Military Transport (26,328,447) 212,200,279 185,871,832 0 27,228,802 169,302,132 10,659,102
Deutsche Bank DBNY 2011012 Supply of Medical Equipment 742,666,770 (6) 742,666,764 0 65,898,938 814,935,228 138,167,401
Deutsche Bank DBNY 2013011 Construction of Tamale Airport 64,202,000 41,959,303 106,161,303 257,022,546 49,439,375 332,176,250 18,431,776
Deutsche Bank DBNY 2014004 Sovereign Bond 2024 - 2026 3,210,100,000 0 3,210,100,000 0 0 3,796,300,000 586,200,000
Deutsche Bank DBNY 2015009 Sovereign Bond 2028 - 2030 0 0 0 3,767,500,000 0 3,796,300,000 28,800,000
Deutsche Bank S.A. (Brazil) DBSA 2014005 Modernisation of Kumasi Central Market and Kejetia Interchange0 0 0 216,952,196 0 254,863,109 37,910,913
Deutsche Bank S.A. (Brazil) DBSA 2014008 Design and Construction of Kasoa Interchange 0 0 0 177,396,633 0 176,849,947 (546,686)
Export-Import Bank Of China EXIC 2007032 Bui Hydroelectric Dam Project 942,183,807 0 942,183,807 0 0 1,114,237,060 172,053,253
Export-Import Bank Of China EXIC 2010021 Kpong Water Supply Expansion Project 806,014,153 0 806,014,153 30,330,628 0 984,570,403 148,225,622
Export-Import Bank Of China EXIC 2011027 E-Government Platform Project 201,030,102 148,181,389 349,211,491 33,119,219 0 451,814,672 69,483,961
Export-Import Bank Of China EXIC 2012013 Legon ICT Project (Phase II) 90,500,744 0 90,500,744 0 0 107,027,188 16,526,444
Export-Import Bank Of China EXIC 2012031 Bui Dam Project - Additional Loan 241,890,860 0 241,890,860 0 0 286,062,824 44,171,964
Export-Import Bank Of China EXIC 2012032 Bui Dam Project - Additional Loan 244,631,896 0 244,631,896 0 0 289,304,404 44,672,508
Export-Import Bank Of China EXIC 2013012 Ghana Dedicated Security Information Syst em Phase II 104,251,607 0 104,251,607 104,160,674 0 243,273,780 34,861,4992,630,503,169 148,181,389 2,778,684,559 167,610,521 0 3,476,290,331 529,995,251
Export-Import Bank of India EXIM 2005010 Rural Electrification project - India 89,884,185 (25,654,426) 64,229,759 0 7,669,216 68,374,026 11,813,482
Export-Import Bank of India EXIM 2005012 Purchase of Goods form India 57,595,862 (31,340) 57,564,522 0 6,900,124 61,252,269 10,587,871
Export-Import Bank of India EXIM 2005025 Const. of Presidential Palace & Offices 70,628,794 (6,393,826) 64,234,968 0 7,644,297 68,405,189 11,814,519
Export-Import Bank of India EXIM 2008049 Supply of Goods from India 61,009,556 3,192,444 64,202,000 0 0 75,926,000 11,724,000
Export-Import Bank of India EXIM 2010032 Fish Harvesting and Waste Management Support Pj. 39,785,535 13,884,375 53,669,910 3,110,012 0 66,742,014 9,962,093
Export-Import Bank of U.S.A. EXUS 1999018 Keta Sea Defence Wall (10) 10 0 0 0 0 0
Export-Import Bank of U.S.A. EXUS 2007034 Supply of Equipment - BOST 219,143,691 1,053,511 220,197,202 0 38,105,182 224,681,525 42,589,505
Export-Import Bank of U.S.A. EXUS 2008032 Self Help Electrification (SHEP IV) - EXUS 641,937,201 1,619,925 643,557,125 75,249,421 95,828,985 738,290,655 115,313,093
Export-Import Bank of U.S.A. EXUS 2009019 Mampong Water Supply Project 44,327,155 (2,739,689) 41,587,466 0 3,651,810 45,433,121 7,497,465
Export-Import Bank of U.S.A. EXUS 2013003 Rehabilitation and Expansion of Ridge Hospital 6,998,434 0 6,998,434 59,308,527 0 69,888,399 3,581,438
Government of the Fed. Rep. of Germany FRG 2002041 DISTRICT TOWNS IV. 23,727,985 4,057 23,732,042 0 953,862 24,340,178 1,561,997
71
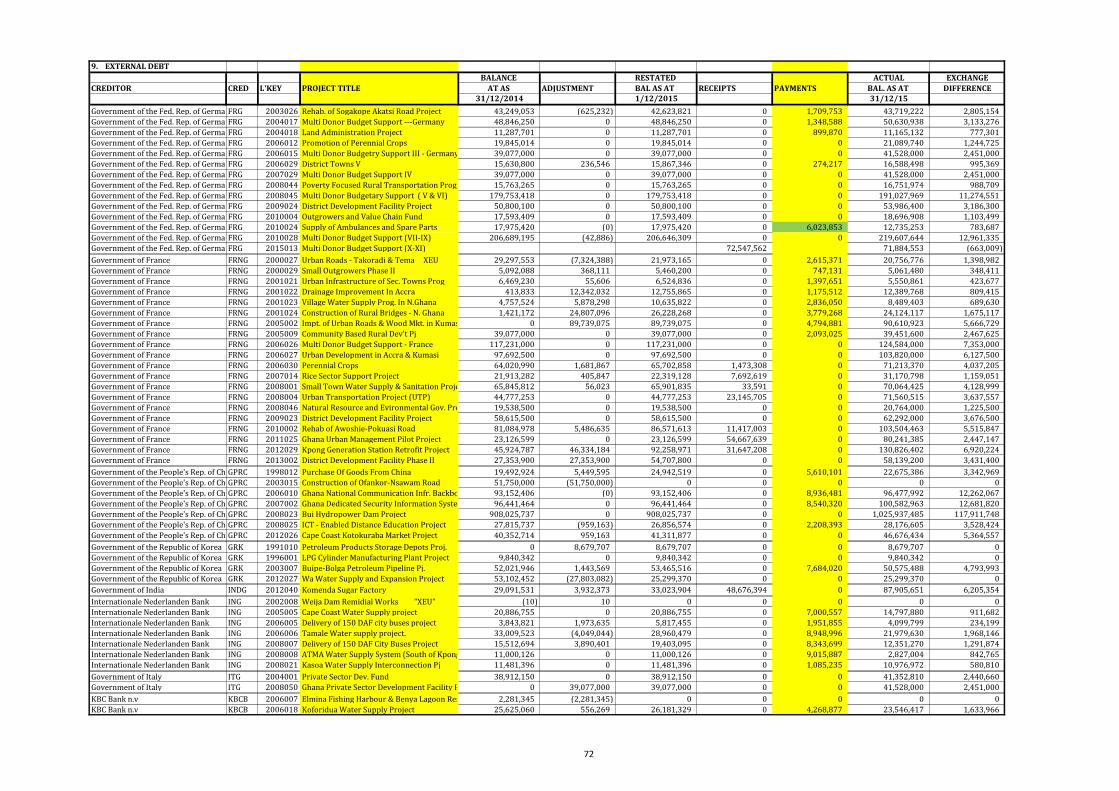
9. EXTERNAL DEBT
BALANCE RESTATED ACTUAL EXCHANGE
CREDITOR CRED L'KEY PROJECT TITLE AT AS ADJUSTMENT BAL AS AT RECEIPTS PAYMENTS BAL. AS AT DIFFERENCE31/12/2014 1/12/2015 31/12/15
Government of the Fed. Rep. of Germany FRG 2003026 Rehab. of Sogakope Akatsi Road Project 43,249,053 (625,232) 42,623,821 0 1,709,753 43,719,222 2,805,154
Government of the Fed. Rep. of Germany FRG 2004017 Multi Donor Budget Support ---Germany 48,846,250 0 48,846,250 0 1,348,588 50,630,938 3,133,276
Government of the Fed. Rep. of Germany FRG 2004018 Land Administration Project 11,287,701 0 11,287,701 0 899,870 11,165,132 777,301
Government of the Fed. Rep. of Germany FRG 2006012 Promotion of Perennial Crops 19,845,014 0 19,845,014 0 0 21,089,740 1,244,725
Government of the Fed. Rep. of Germany FRG 2006015 Multi Donor Budgetry Support III - Germany 39,077,000 0 39,077,000 0 0 41,528,000 2,451,000
Government of the Fed. Rep. of Germany FRG 2006029 District Towns V 15,630,800 236,546 15,867,346 0 274,217 16,588,498 995,369
Government of the Fed. Rep. of Germany FRG 2007029 Multi Donor Budget Support IV 39,077,000 0 39,077,000 0 0 41,528,000 2,451,000
Government of the Fed. Rep. of Germany FRG 2008044 Poverty Focused Rural Transportation Programme 15,763,265 0 15,763,265 0 0 16,751,974 988,709
Government of the Fed. Rep. of Germany FRG 2008045 Multi Donor Budgetary Support ( V & VI) 179,753,418 0 179,753,418 0 0 191,027,969 11,274,551
Government of the Fed. Rep. of Germany FRG 2009024 District Development Facility Project 50,800,100 0 50,800,100 0 0 53,986,400 3,186,300
Government of the Fed. Rep. of Germany FRG 2010004 Outgrowers and Value Chain Fund 17,593,409 0 17,593,409 0 0 18,696,908 1,103,499
Government of the Fed. Rep. of Germany FRG 2010024 Supply of Ambulances and Spare Parts 17,975,420 (0) 17,975,420 0 6,023,853 12,735,253 783,687
Government of the Fed. Rep. of Germany FRG 2010028 Multi Donor Budget Support (VII-IX) 206,689,195 (42,886) 206,646,309 0 0 219,607,644 12,961,335
Government of the Fed. Rep. of Germany FRG 2015013 Multi Donor Budget Support (X-XI) 72,547,562 71,884,553 (663,009)
Government of France FRNG 2000027 Urban Roads - Takoradi & Tema XEU 29,297,553 (7,324,388) 21,973,165 0 2,615,371 20,756,776 1,398,982
Government of France FRNG 2000029 Small Outgrowers Phase II 5,092,088 368,111 5,460,200 0 747,131 5,061,480 348,411
Government of France FRNG 2001021 Urban Infrastructure of Sec. Towns Prog 6,469,230 55,606 6,524,836 0 1,397,651 5,550,861 423,677
Government of France FRNG 2001022 Drainage Improvement In Accra 413,833 12,342,032 12,755,865 0 1,175,512 12,389,768 809,415
Government of France FRNG 2001023 Village Water Supply Prog. In N.Ghana 4,757,524 5,878,298 10,635,822 0 2,836,050 8,489,403 689,630
Government of France FRNG 2001024 Construction of Rural Bridges - N. Ghana 1,421,172 24,807,096 26,228,268 0 3,779,268 24,124,117 1,675,117
Government of France FRNG 2005002 Impt. of Urban Roads & Wood Mkt. in Kumasi 0 89,739,075 89,739,075 0 4,794,881 90,610,923 5,666,729
Government of France FRNG 2005009 Community Based Rural Dev't Pj 39,077,000 0 39,077,000 0 2,093,025 39,451,600 2,467,625
Government of France FRNG 2006026 Multi Donor Budget Support - France 117,231,000 0 117,231,000 0 0 124,584,000 7,353,000
Government of France FRNG 2006027 Urban Development in Accra & Kumasi 97,692,500 0 97,692,500 0 0 103,820,000 6,127,500
Government of France FRNG 2006030 Perennial Crops 64,020,990 1,681,867 65,702,858 1,473,308 0 71,213,370 4,037,205
Government of France FRNG 2007014 Rice Sector Support Project 21,913,282 405,847 22,319,128 7,692,619 0 31,170,798 1,159,051
Government of France FRNG 2008001 Small Town Water Supply & Sanitation Project 65,845,812 56,023 65,901,835 33,591 0 70,064,425 4,128,999
Government of France FRNG 2008004 Urban Transportation Project (UTP) 44,777,253 0 44,777,253 23,145,705 0 71,560,515 3,637,557
Government of France FRNG 2008046 Natural Resource and Evironmental Gov. Programme 19,538,500 0 19,538,500 0 0 20,764,000 1,225,500
Government of France FRNG 2009023 District Development Facility Project 58,615,500 0 58,615,500 0 0 62,292,000 3,676,500
Government of France FRNG 2010002 Rehab of Awoshie-Pokuasi Road 81,084,978 5,486,635 86,571,613 11,417,003 0 103,504,463 5,515,847
Government of France FRNG 2011025 Ghana Urban Management Pilot Project 23,126,599 0 23,126,599 54,667,639 0 80,241,385 2,447,147
Government of France FRNG 2012029 Kpong Generation Station Retrofit Project 45,924,787 46,334,184 92,258,971 31,647,208 0 130,826,402 6,920,224
Government of France FRNG 2013002 District Development Facility Phase II 27,353,900 27,353,900 54,707,800 0 0 58,139,200 3,431,400
Government of the People's Rep. of ChinaGPRC 1998012 Purchase Of Goods From China 19,492,924 5,449,595 24,942,519 0 5,610,101 22,675,386 3,342,969
Government of the People's Rep. of ChinaGPRC 2003015 Construction of Ofankor-Nsawam Road 51,750,000 (51,750,000) 0 0 0 0 0
Government of the People's Rep. of ChinaGPRC 2006010 Ghana National Communication Infr. Backbone Phase I93,152,406 (0) 93,152,406 0 8,936,481 96,477,992 12,262,067
Government of the People's Rep. of ChinaGPRC 2007002 Ghana Dedicated Security Information System (Phase 1) Pj96,441,464 0 96,441,464 0 8,540,320 100,582,963 12,681,820
Government of the People's Rep. of ChinaGPRC 2008023 Bui Hydropower Dam Project 908,025,737 0 908,025,737 0 0 1,025,937,485 117,911,748
Government of the People's Rep. of ChinaGPRC 2008025 ICT - Enabled Distance Education Project 27,815,737 (959,163) 26,856,574 0 2,208,393 28,176,605 3,528,424
Government of the People's Rep. of ChinaGPRC 2012026 Cape Coast Kotokuraba Market Project 40,352,714 959,163 41,311,877 0 0 46,676,434 5,364,557
Government of the Republic of Korea GRK 1991010 Petroleum Products Storage Depots Proj. 0 8,679,707 8,679,707 0 0 8,679,707 0
Government of the Republic of Korea GRK 1996001 LPG Cylinder Manufacturing Plant Project 9,840,342 0 9,840,342 0 0 9,840,342 0
Government of the Republic of Korea GRK 2003007 Buipe-Bolga Petroleum Pipeline Pj. 52,021,946 1,443,569 53,465,516 0 7,684,020 50,575,488 4,793,993
Government of the Republic of Korea GRK 2012027 Wa Water Supply and Expansion Project 53,102,452 (27,803,082) 25,299,370 0 0 25,299,370 0
Government of India INDG 2012040 Komenda Sugar Factory 29,091,531 3,932,373 33,023,904 48,676,394 0 87,905,651 6,205,354
Internationale Nederlanden Bank ING 2002008 Weija Dam Remidial Works "XEU" (10) 10 0 0 0 0 0
Internationale Nederlanden Bank ING 2005005 Cape Coast Water Supply project 20,886,755 0 20,886,755 0 7,000,557 14,797,880 911,682
Internationale Nederlanden Bank ING 2006005 Delivery of 150 DAF city buses project 3,843,821 1,973,635 5,817,455 0 1,951,855 4,099,799 234,199
Internationale Nederlanden Bank ING 2006006 Tamale Water supply project. 33,009,523 (4,049,044) 28,960,479 0 8,948,996 21,979,630 1,968,146
Internationale Nederlanden Bank ING 2008007 Delivery of 150 DAF City Buses Project 15,512,694 3,890,401 19,403,095 0 8,343,699 12,351,270 1,291,874
Internationale Nederlanden Bank ING 2008008 ATMA Water Supply System (South of Kpong) 11,000,126 0 11,000,126 0 9,015,887 2,827,004 842,765
Internationale Nederlanden Bank ING 2008021 Kasoa Water Supply Interconnection Pj 11,481,396 0 11,481,396 0 1,085,235 10,976,972 580,810
Government of Italy ITG 2004001 Private Sector Dev. Fund 38,912,150 0 38,912,150 0 0 41,352,810 2,440,660
Government of Italy ITG 2008050 Ghana Private Sector Development Facility Phase II 0 39,077,000 39,077,000 0 0 41,528,000 2,451,000
KBC Bank n.v KBCB 2006007 Elmina Fishing Harbour & Benya Lagoon Restor. Pj 2,281,345 (2,281,345) 0 0 0 0 0
KBC Bank n.v KBCB 2006018 Koforidua Water Supply Project 25,625,060 556,269 26,181,329 0 4,268,877 23,546,417 1,633,966
72

9. EXTERNAL DEBT
BALANCE RESTATED ACTUAL EXCHANGE
CREDITOR CRED L'KEY PROJECT TITLE AT AS ADJUSTMENT BAL AS AT RECEIPTS PAYMENTS BAL. AS AT DIFFERENCE31/12/2014 1/12/2015 31/12/15
KBC Bank n.v KBCB 2007009 Koforidua Water Supply Phase 2 20,294,560 (1,648,749) 18,645,811 0 3,545,872 15,769,465 669,526
KBC Bank n.v KBCB 2008022 New Tafo Water Supply Project 25,175,002 (1,441,317) 23,733,686 0 3,992,811 21,341,961 1,601,086
KBC Bank n.v KBCB 2008031 Clinical Laboratory Improvement Phase II Pj 2,122,242 (0) 2,122,242 0 2,175,818 (0) 53,576
KBC Bank n.v KBCB 2008043 Korley Lagoon Restoration project 192,570,765 0 192,570,765 0 30,455,082 169,868,328 7,752,645
KBC Bank n.v KBCB 2010012 Supply of Fire Tenders 27,915,611 0 27,915,611 0 5,759,870 23,368,676 1,212,936
KBC Bank n.v KBCB 2011003 Job 600 of Parliament House (ICT) 27,757,624 (0) 27,757,624 0 5,628,090 23,967,650 1,838,116
KBC Bank n.v KBCB 2011004 Supply of X-Ray Equipment for District Hospital 7,385,646 (0) 7,385,646 0 2,126,867 5,886,668 627,890
KBC Bank n.v KBCB 2011006 Essakyir Water Supply Project 40,811,144 (2,147,955) 38,663,189 0 4,592,568 36,522,874 2,452,254
KBC Bank n.v KBCB 2011011 Rehab of Kpong Pumping Water Station 12,264,185 (1,832,550) 10,431,635 0 3,397,887 7,190,949 157,200
KBC Bank n.v KBCB 2012012 Kpando-Kadjebi Sub-station Project 15,976,272 0 15,976,272 14,945,578 5,212,093 26,647,734 937,976
Kuwait Fund for Arab Economic Dev't. KFED 2000032 Korle Lagoon Ecological Restoration Pj.2 6,143,910 0 6,143,910 0 2,440,465 5,119,925 1,416,480
Kuwait Fund for Arab Economic Dev't. KFED 2001115 Kuwait Fund Debt Relief Loan 55,169,311 0 55,169,311 0 0 55,169,311 0
Kuwait Fund for Arab Economic Dev't. KFED 2003006 Aboadze-Volta Transmission Line Pj. 13,777,071 (2,051,910) 11,725,161 0 0 11,725,161 0
Midland Bank PLC MPLC 1999015 Phase II-K.I.A Rehab. Project 17,871,916 (17,871,916) 0 0 0 0 0
Nedcor Bank Limited NCBL 1997004 Self Help Electrification Pg.(Shep3)FCA 2,601,643 (492,500) 2,109,143 0 1,154,179 1,329,424 374,460
Belfius Bank NV/SA BBNV 2010031 Construction of Drinking Water Facility 11,614,904 22,272,740 33,887,644 0 5,532,814 30,472,670 2,117,840
Nordbanken International Division NORB 2012030 Rural Fiber Optic Backbone Link,Data Cent er Project 79,089,245 (9,773,471) 69,315,775 15,931,913 8,535,611 82,257,724 5,545,647
Samsung Corporation SAMG 1999034 TOR- Mordenization Project Phase II(RFCC) 25,239,411 (25,239,411) 0 0 0 0 0
Government of Saudi Arabia SARG 1985024 College of Science in Accra Project 63,239 0 63,239 0 0 63,239 0
Government of Saudi Arabia SARG 1987013 The Support of Economical Dev. Project 3,620,560 (226,285) 3,394,275 0 45,855 3,375,795 27,375
Government of Saudi Arabia SARG 1993017 Health Centres Project (530,130) 1,079,266 549,136 0 0 549,136 0
Government of Saudi Arabia SARG 2002037 NPC II - Saudi Resch of Principal Arrears 5,909,518 0 5,909,518 0 0 5,909,518 0
Government of Saudi Arabia SARG 2002038 NPC II - Saudi Resch of Interest Arrears 813,861 0 813,861 0 0 813,861 0
Government of Saudi Arabia SARG 2002039 NPC II - Saudi Resch of Principal (Current) 3,580,653 0 3,580,653 0 0 3,580,653 0
Government of Saudi Arabia SARG 2002040 NPC II - Saudi Resch of Interest (Current) 465,794 0 465,794 0 0 465,794 0
Government of Saudi Arabia SARG 2004015 Tetteh Quarshie Mamfe Road Project 4,769,444 5,213,244 9,982,688 0 1,690,474 8,931,116 638,902
Government of Saudi Arabia SARG 2008033 Rehabilitation & Expansion of Bolgatanga Regional Hospital Pj.530,865 0 530,865 2,492,026 0 3,022,890 (0)
Standard Chartered Bank. SCB 2000015 Phase II Korle Lagoon Ecological Res. Pj 23,852,065 (17,888,078) 5,963,987 0 7,066,406 1,531 1,103,950
Government of Spain SPAG 1999036 Rural Elect. By Half Tension Equipment 13,365,132 (1,215,012) 12,150,120 0 0 14,368,867 2,218,747
Government of Spain SPAG 2000011 Akwapim Ridge Water Supply System 13,831,083 (1,220,390) 12,610,693 0 480,930 14,432,464 2,302,701
Government of Spain SPAG 2001001 Supply of Firetrucks 14,484,598 (1,565,902) 12,918,695 0 462,354 14,814,829 2,358,488
Government of Spain SPAG 2002002 Six Towns Water Project-Eastern Region 16,635,793 5,680,394 22,316,187 0 1,717,042 24,680,694 4,081,549
Government of Spain SPAG 2003011 SS of Equip't for UDS & Polytechnics 26,603,184 0 26,603,184 0 0 31,461,221 4,858,038
Government of Spain SPAG 2004013 Medical Equipment Supply Cardio Cent. Korlebu/Kath (2,918,273) 29,179,843 26,261,570 0 3,196,727 27,606,043 4,541,201
Government of Spain SPAG 2004014 Supply Medical Equipment For Hospital Network 9,484,386 (1,442) 9,482,944 0 1,602,217 9,484,836 1,604,109
Government of Spain SPAG 2007021 Supply of Medical Equip for National Hospital Nk 39,077,000 0 39,077,000 0 4,190,333 36,913,778 2,027,111
Government of Spain SPAG 2007023 Supply of Refrigeration for Fishing Sector 24,462,948 0 24,462,948 2,178,575 2,927,614 25,030,576 1,316,666
Government of Spain SPAG 2008012 Supply of Border Surveillance Digital System Pj 4,168,990 0 4,168,990 0 0 4,430,478 261,489
Government of Spain SPAG 2008013 Supply of 26 Steel Bridges Project 19,538,500 0 19,538,500 0 0 20,764,000 1,225,500
Government of Spain SPAG 2008020 Supply of 26 Steel Bridges Project 3,907,700 0 3,907,700 0 0 4,152,800 245,100
Government of Spain SPAG 2011030 Irrigation and Underground Water Systems 6,376,097 0 6,376,097 5,535,865 0 12,445,668 533,707
Calyon Bank CCAB 2008038 Improvement of Electricity Supply, Accra & Kumasi 126,218,117 31,012,402 157,230,519 0 26,392,402 141,140,858 10,302,741
Societe Generale SOGE 2008034 Supply &. Installation of Modular Steel Bridges 51,063,301 9,169,032 60,232,333 0 21,272,582 50,879,572 11,919,822
Societe Generale SOGE 2009002 E - Government Project 54,170,438 0 54,170,438 0 13,555,125 49,826,438 9,211,125
Societe Generale SOGE 2009013 Construction of 132 megawatt Thermal Plant 413,023,547 38,173 413,061,720 0 61,867,490 427,045,536 75,851,307
Societe Generale SOGE 2010010 Supply of Fire Tenders 38,807,805 45,191,265 83,999,070 0 20,231,372 79,470,587 15,702,888
Societe Generale SOGE 2010011 Supply of Fire Tenders 2,794,979 (2,794,979) 0 0 0 0 0
Societe Generale SOGE 2010013 Dassault Falcon 900EX Aircraft 22,199,380 0 22,199,380 0 26,033,859 0 3,834,479
Societe Generale SOGE 2011010 Takoradi Thermal Power Project - Additional Loan 202,940,961 0 202,940,961 12,092,635 20,423,476 231,447,809 36,837,689
Societe Generale SOGE 2012034 Financing of the Tumu-Han-Wa Transmission Project172,747,289 0 172,747,289 0 0 183,582,399 10,835,110
Societe Generale SOGE 2012035 Financing of Sub-stations Reliability Enhancement Project (SREP)26,904,072 0 26,904,072 50,920,133 0 82,153,247 4,329,042
Societe Generale SOGE 2015007 Accra Ashaltic Overlay Project (Resurfacing of streets of Accra) 0 0 0 50,967,318 0 51,195,224 227,906
Bank Hapoalim BHI 2008009 ATMA Water Supply System (North of Kpong) 4,742,576 (0) 4,742,576 0 1,679,436 4,006,159 943,019
Bank Hapoalim BHI 2008010 ATMA Water Supply System (North of Kpong) 26,364,148 4,634,223 30,998,371 0 10,977,110 26,185,013 6,163,752
Bank Hapoalim BHI 2010001 3K Water Supply Project 327,685,567 17,976,610 345,662,177 0 51,899,438 359,698,054 65,935,314
Bank Hapoalim BHI 2011013 Legon University Hospital and Other Related Works 261,899,514 20,926,558 282,826,073 300,900,796 37,878,190 605,307,839 59,459,160
73

9. EXTERNAL DEBT
BALANCE RESTATED ACTUAL EXCHANGE
CREDITOR CRED L'KEY PROJECT TITLE AT AS ADJUSTMENT BAL AS AT RECEIPTS PAYMENTS BAL. AS AT DIFFERENCE31/12/2014 1/12/2015 31/12/15
Bank Hapoalim BHI 2012001 3K Water Supply Project (Phase II) 61,273,916 165,880,808 227,154,724 110,623,432 38,841,813 347,094,939 48,158,596
Raiffeisen ZentralBank Osterreich AG RZB 2010008 Upgrading of Technical and Vocational Education Pj 29,288,212 0 29,288,212 0 0 31,125,236 1,837,025
Raiffeisen ZentralBank Osterreich AG RZB 2012006 Four Constituencies of Water Supply Scheme 31,463,699 3,197,600 34,661,299 0 0 36,835,336 2,174,037
Raiffeisen ZentralBank Osterreich AG RZB 2012039 Four Constituencies Water Project Phase 2 24,421,560 6,840,040 31,261,600 0 0 33,222,400 1,960,800
TOTAL BILATERAL LOANS 16,969,883,688 887,170,562 17,857,054,250 5,673,619,604 1,245,228,396 24,929,115,252 2,643,669,794
COMMERCIAL CREDITORSBarclays Bank Plc BBP 2012020 Construction of 7 District Hospitals and Pr ovision of Integrated IT Systems in Ghana 111,366,255 44,503,621 155,869,876 29,433,680 30,135,812 186,703,543 31,535,799
Banco do Brazil BADB 2011029 Construction of Hangar for Ghana Airforce 41,819,876 (470,686) 41,349,190 0 5,667,031 43,206,587 7,524,427
Banco Nacionale de Desenvolvimento Economico E SocialeBNDS 2013009 Buyer Credit Facility - Eastern Corridor Ro ad Pj 170,489,141 0 170,489,141 152,846,576 0 358,994,237 35,658,520
Citi Group Bank CITI 2007020 10-Year Debut Sovereign Bond 2017 1,702,990,151 0 1,702,990,151 0 0 2,013,975,113 310,984,962
Citi Group Bank CITI 2012007 Self Help - Electrification Programme 4 ( SHEP 4) 366,950,363 (82,400,186) 284,550,177 34,986,894 0 371,861,707 52,324,636
Citi Group Bank CITI 2013007 10-Yr Sovereign Bond 2023 3,210,100,000 0 3,210,100,000 0 0 3,796,300,000 586,200,000
Poly Technologies Inc. China PTIC 2008039 Purchase of Equipment 27,285,850 27,285,850 0 28,466,925 0 1,181,075
Poly Technologies Inc. China PTIC 2010027 Procurement of Goods for the GAF 158,739,445 0 158,739,445 0 65,668,473 121,747,341 28,676,369
Euroget de Invest S.A. EDI 2008037 2 Regional and 6 Districts Hospitals 301,823,963 847,806,854 1,149,630,816 0 151,341,901 1,213,525,254 215,236,338
Euroget de Invest S.A. EDI 2008040 500 Bed Military Hospital Pj In Kumasi 104,180,522 469,097,479 573,278,001 0 80,358,531 598,405,346 105,485,876
China Development Bank Corperation CDB 2011020 China Development Bank Master Faciliity Agreement (Tranche A)0 0 0 0 0 0 0
China Development Bank Corperation CDB 2011028 China Development Bank Master Faciliity Agreement (Tranche B)2,111,905,600 0 2,111,905,600 162,706,599 309,258,336 2,371,983,089 406,629,226
Industrial & Commercial Bank of ChinaICBC 2012003 Rural Electrification - Northern Region 54,526,498 0 54,526,498 39,637,129 0 111,217,736 17,054,110
Credit Suisse International CSI 2013001 OAS Construction of 5000 Affordable Hous e 642,020,000 0 642,020,000 0 125,120,214 621,226,532 104,326,746
Export Credit Bank of Turkey ECBT 2012014 Akim Oda, Akwatia and Winneba Water Su pply Project 75,517,954 0 75,517,954 187,212,619 0 265,638,452 2,907,878
HSBC Bank Plc HSBC 2012036 Redevelopment of Police Hospital 206,904,476 0 206,904,476 10,162,005 12,867,552 232,183,458 27,984,529
HSBC Bank Plc HSBC 2013004 Refurbishment and Expansion Project for Ridge Hospital, Accra160,721,714 69,970,871 230,692,584 11,535,395 60,439,500 214,749,033 32,960,553
Unicredit Bank AG Munich UNCM 2013010 Purchase and Installation of Equipment an d Machinery 92,436,513 0 92,436,513 0 19,711,069 76,279,907 3,554,463
Unicredit Bank of Austria UNCR 2013006 Supply of Two Ferries for Renovation of A domi Bridge 49,826,417 1,687,271 51,513,688 0 7,503,129 47,225,048 3,214,489
VTB Capital Plc, London VTB 2014007 United Nations Peacekeeping Operations 0 0 0 965,902,500 172,729,389 877,367,111 84,194,000
TOTAL COMMERCIAL LOANS 9,589,604,738 1,350,195,224 10,939,799,962 1,594,423,397 1,069,267,862 13,522,589,493 2,057,633,996
GRAND TOTAL 40,897,702,192 3,078,111,972 43,975,814,164 8,992,644,489 2,463,659,796 57,328,480,809 6,823,681,952
74

10 PROVISION FOR DOUBTFUL DEBTSCURRENT TOTAL
G E N E R A L GH¢ GH¢
1 Local Authorities
PUBLIC BOARDS AND CORPORATION1 Tema Shipyard and Drydock corporation 28,9152 State Farms Corporation 32,8863 Ghana Enterprise Development Commission 8834 Ghanaian Industrial Development Corporation 1,7465 State Hotels Corporation 46,0026 State Construction Corporation 275,6447 State Housing Corporation 254,7468 Food Production Corporation 112,3889 Aluminium Industries Commission 1,018
10 Gonja Development Corporation 21011 West African Airways Corporation 312 State Fishing Corporation 14,25313 Western Regional Development Corporation 11714 Brong Ahafo Regional Development Corporation 3,86615 Upper East Development Corporation 2,01116 State Oil Palm Plantation Corporation 2,50017 GIHOC - Tema Steelworks 77218 GIHOC - Farms 23319 GIHOC - Footwear 29,22820 GIHOC - Vegetable Oil Mills 9,63721 GIHOC - Fibre Bag 24322 GIHOC - Fibre Products 106,41823 GIHOC - Manufacturing Co. 6,18824 GIHOC - Mosquito Coil 3,53125 GIHOC - Marbles 8,92526 GIHOC - Meat (Tema & Bolga) 22,12827 GIHOC - Boatyards (Mumford) 1,88528 GIHOC - Boatyards (Tema) 24,63729 GIHOC - Cannery (Pawalugu) 4,09030 GIHOC - Refrigeration & Household Prod. 5,50531 GIHOC - Cannery (Wenchi) 3,63932 GIHOC - Cannery (Nsawam) 18,30133 GIHOC - Printing & Paper Prod. 2,47434 GIHOC - Nzema Oil Mills 10,20335 GIHOC - Central Advertising Co. 1,78036 GIHOC - Aboso Glass Factory 126,59137 GIHOC - Cannery 22,62538 GIHOC - Phamaceutical 101,59939 GIHOC - Distilleries 108,36940 GIHOC - Bottling 8,63641 Central Regional Development Corporation 125,04642 Ghana National Trading Corporation 58443 Meat Marketing Board 24,55144 State Shipping Corporation (BSL) 10845 Omnibus Services Authority 20,509,15146 Ghana Airways Corporation 23,553,43747 City Express Services 1,213,718
TOTAL 0.00 46,831,419.55
COMPANIES1 Ghana Sugar Estate Ltd 1,396,6242 Ghana Sugar Estate Ltd (Asutsuare) 44,4973 Ghana Sugar Estates (Komenda) 26,6344 African Timber & Plywood 52,4615 Willowbrook 9996 Prefab Concrete Products 6,068
75
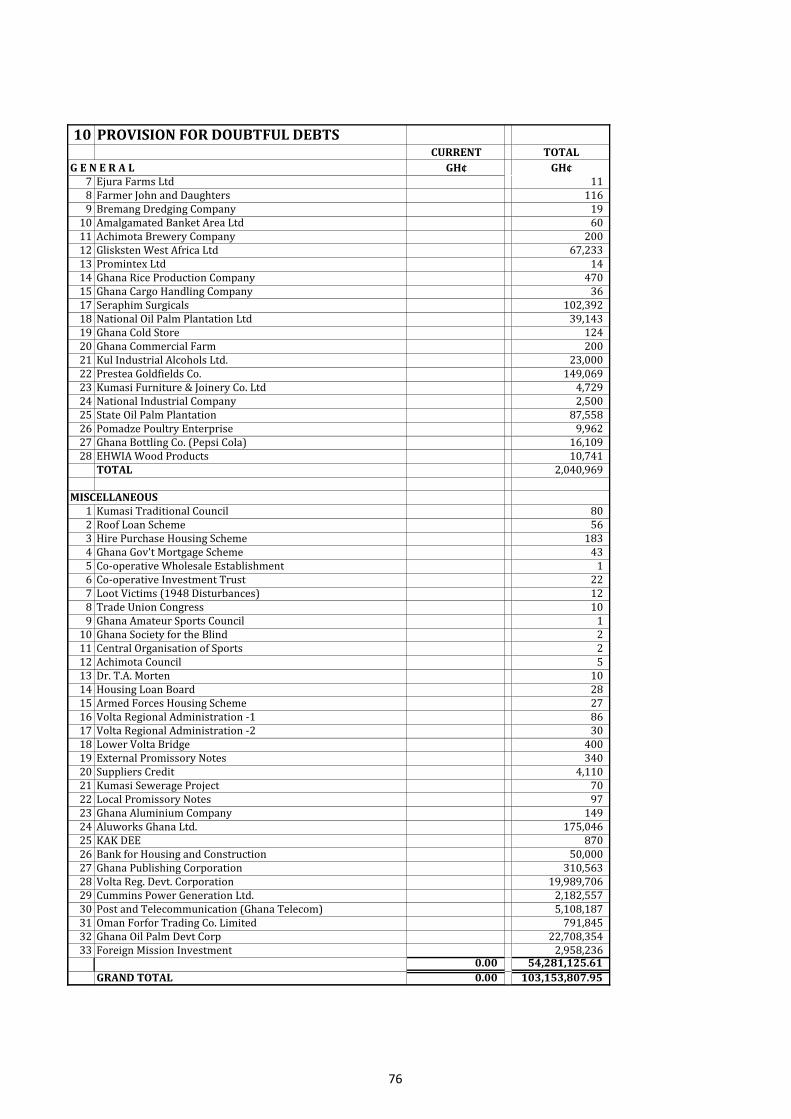
10 PROVISION FOR DOUBTFUL DEBTSCURRENT TOTAL
G E N E R A L GH¢ GH¢7 Ejura Farms Ltd 118 Farmer John and Daughters 1169 Bremang Dredging Company 19
10 Amalgamated Banket Area Ltd 6011 Achimota Brewery Company 20012 Glisksten West Africa Ltd 67,23313 Promintex Ltd 1414 Ghana Rice Production Company 47015 Ghana Cargo Handling Company 3617 Seraphim Surgicals 102,39218 National Oil Palm Plantation Ltd 39,14319 Ghana Cold Store 12420 Ghana Commercial Farm 20021 Kul Industrial Alcohols Ltd. 23,00022 Prestea Goldfields Co. 149,06923 Kumasi Furniture & Joinery Co. Ltd 4,72924 National Industrial Company 2,50025 State Oil Palm Plantation 87,55826 Pomadze Poultry Enterprise 9,96227 Ghana Bottling Co. (Pepsi Cola) 16,10928 EHWIA Wood Products 10,741
TOTAL 2,040,969
MISCELLANEOUS1 Kumasi Traditional Council 802 Roof Loan Scheme 563 Hire Purchase Housing Scheme 1834 Ghana Gov't Mortgage Scheme 435 Co-operative Wholesale Establishment 16 Co-operative Investment Trust 227 Loot Victims (1948 Disturbances) 128 Trade Union Congress 109 Ghana Amateur Sports Council 1
10 Ghana Society for the Blind 211 Central Organisation of Sports 212 Achimota Council 513 Dr. T.A. Morten 1014 Housing Loan Board 2815 Armed Forces Housing Scheme 2716 Volta Regional Administration -1 8617 Volta Regional Administration -2 3018 Lower Volta Bridge 40019 External Promissory Notes 34020 Suppliers Credit 4,11021 Kumasi Sewerage Project 7022 Local Promissory Notes 9723 Ghana Aluminium Company 14924 Aluworks Ghana Ltd. 175,04625 KAK DEE 87026 Bank for Housing and Construction 50,00027 Ghana Publishing Corporation 310,56328 Volta Reg. Devt. Corporation 19,989,70629 Cummins Power Generation Ltd. 2,182,55730 Post and Telecommunication (Ghana Telecom) 5,108,18731 Oman Forfor Trading Co. Limited 791,84532 Ghana Oil Palm Devt Corp 22,708,35433 Foreign Mission Investment 2,958,236
0.00 54,281,125.61
GRAND TOTAL 0.00 103,153,807.95
76

ADDITIONAL INFORMATION
ITEM PAGE
TRENDS
Statement of Assets and Liabilities 78
Statement of Revenue and Expenditure 79
Charts For Five Year Revenue and Expenditure 80
SUPPLEMENTARY STATEMENTS
Classification Of Expenditure By Functions of Government 81
Charts For Expenditure By Functions of Government 84
Summary of Expenditure of MDAs by Items 85
Charts For Expenditure Summary by Item 87
Classification Of Expenditure By Cost Centre - COMPENSATION OF EMPLOYEES 88
Classification Of Expenditure By Cost Centre - GOODS AND SERVICES 97
Classification Of Expenditure By Cost Centre - SOCIAL BENEFITS 107
Classification Of Expenditure By Cost Centre - OTHER EXPENDITURE 110
Classification Of Expenditure By Cost Centre - NON - FINANCIAL ASSETS 113
Summary of Expenditure of MMDAs by Items 120
Reallocation Report From Centralised Vote 124
77
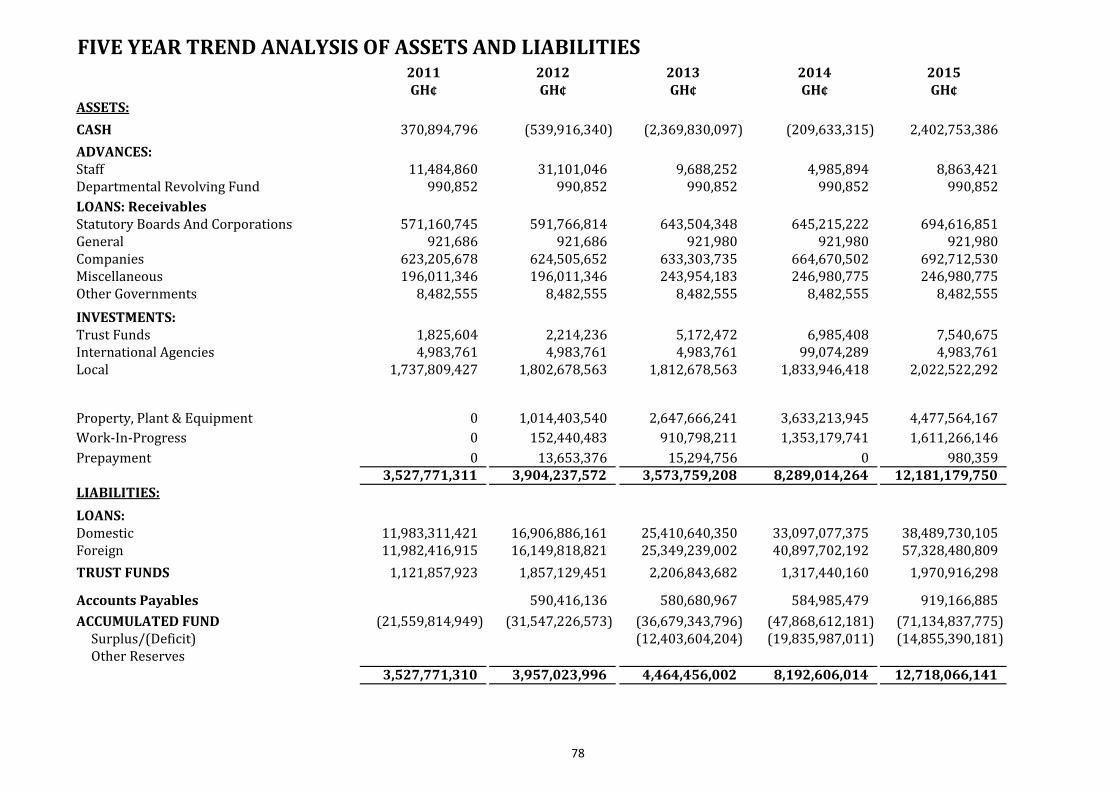
FIVE YEAR TREND ANALYSIS OF ASSETS AND LIABILITIES 2011 2012 2013 2014 2015GH¢ GH¢ GH¢ GH¢ GH¢
ASSETS:
CASH 370,894,796 (539,916,340) (2,369,830,097) (209,633,315) 2,402,753,386
ADVANCES:Staff 11,484,860 31,101,046 9,688,252 4,985,894 8,863,421Departmental Revolving Fund 990,852 990,852 990,852 990,852 990,852
LOANS: ReceivablesStatutory Boards And Corporations 571,160,745 591,766,814 643,504,348 645,215,222 694,616,851General 921,686 921,686 921,980 921,980 921,980Companies 623,205,678 624,505,652 633,303,735 664,670,502 692,712,530Miscellaneous 196,011,346 196,011,346 243,954,183 246,980,775 246,980,775Other Governments 8,482,555 8,482,555 8,482,555 8,482,555 8,482,555
INVESTMENTS:Trust Funds 1,825,604 2,214,236 5,172,472 6,985,408 7,540,675International Agencies 4,983,761 4,983,761 4,983,761 99,074,289 4,983,761Local 1,737,809,427 1,802,678,563 1,812,678,563 1,833,946,418 2,022,522,292
Property, Plant & Equipment 0 1,014,403,540 2,647,666,241 3,633,213,945 4,477,564,167
Work-In-Progress 0 152,440,483 910,798,211 1,353,179,741 1,611,266,146
Prepayment 0 13,653,376 15,294,756 0 980,3593,527,771,311 3,904,237,572 3,573,759,208 8,289,014,264 12,181,179,750
LIABILITIES:
LOANS:Domestic 11,983,311,421 16,906,886,161 25,410,640,350 33,097,077,375 38,489,730,105Foreign 11,982,416,915 16,149,818,821 25,349,239,002 40,897,702,192 57,328,480,809
TRUST FUNDS 1,121,857,923 1,857,129,451 2,206,843,682 1,317,440,160 1,970,916,298
Accounts Payables 590,416,136 580,680,967 584,985,479 919,166,885
ACCUMULATED FUND (21,559,814,949) (31,547,226,573) (36,679,343,796) (47,868,612,181) (71,134,837,775) Surplus/(Deficit) (12,403,604,204) (19,835,987,011) (14,855,390,181) Other Reserves
3,527,771,310 3,957,023,996 4,464,456,002 8,192,606,014 12,718,066,141
78

FIVE YEAR TREND ANALYSIS OF REVENUE AND EXPENDITURE
REVENUE: 2011 % 2012 % 2013 % 2014 2015
Direct Taxes 3,738,761,323 36 5,408,491,338 41 5,136,451,308 48 7,024,573,751 40 7,722,068,381
Indirect Taxes 3,485,971,516 35 4,140,962,193 39 5,444,605,856 37 7,236,689,757 41 10,235,812,934
Non - Tax Revenue 693,983,781 13 904,706,594 8 1,290,799,132 8 2,451,902,748 14 2,908,118,606
Grant 1,092,102,947 22 866,533,068 12 784,080,081 8 995,626,782 6 2,852,768,040
Total 9,010,819,567 100 11,320,693,194 100 12,655,936,377 100 17,708,793,039 100 23,718,767,962
EXPENDITURE:
COMPENSATION OF EMPLOYEES 5,917,303,897 43 10,499,997,913 64 11,064,978,705 59 12,034,478,346 32 13,015,237,357
GOODS AND SERVICES 3,346,804,140 21 5,885,259,064 36 7,625,499,215 41 15,391,085,084 41 18,735,238,796
EXCHANGE DIFFERENCE 10,119,216,620 27 5,965,530,539
NON-FINANCIAL ASSETS Expense 4,482,960,519 33 - - - - - - -
NON-FINANCIAL ASSETS 409,828,323 - 1,461,390,362
Total 13,747,068,557 100 16,385,256,978 100 18,690,477,920 100 37,544,780,050 100 37,716,006,692
SURPLUS/(DEFICIT) (4,736,248,990) (5,064,563,783) (6,034,541,543) (9,716,770,391) (13,997,238,731)
79

CHARTS
A GRAPH SHOWING THE FIVE YEAR TREND OF REVENUE AND EXPENDITURE
YEAR
2011
2012
2013
2014
2015
0.00
5.00
10.00
15.00
20.00
25.00
2009 2010 2011 2012 2013 2014 2015 2016
BIL
LIO
NS
OF
GH
AN
A C
EDIS
YEAR
FIVE YEAR REVENUE TREND
0
5
10
15
20
25
30
35
40
2009 2010 2011 2012 2013 2014 2015 2016
BIL
LIO
NS
OF
GH
AN
A C
EDIS
YEAR
FIVE YEAR EXPENDITURE TREND
80

11a. CLASSIFICATION OF EXPENDITURE FOR THE YEAR 2015
BY FUNCTION OF GOVERNMENTANNUAL REVISED ACTUAL VARIANCE
BUDGET BUDGET
MDAs GH¢ GH¢ GH¢ GH¢
DEFENCE
Defence N.E.C 23,788,599 633,788,599 630,057,126 3,731,474
Military Defence 769,976,112 159,976,112 77,773,655 82,202,457
TOTAL 793,764,711 793,764,711 707,830,781 85,933,930
ECONOMIC AFFAIRS
Agriculture 549,989,934 146,397,989 131,441,339 14,956,650
Communication 182,419,821 182,419,821 52,184,560 130,235,261
Construction 34,766,699 359,581,073 354,518,139 5,062,934
Distributive trades, storage and warehousing 66,742,329 66,742,329 0 66,742,329
Economic Affairs N.E.C 37,998,353 37,998,353 16,786,652 21,211,702
Electricity 754,186,962 275,716,016 130,324,035 145,391,982
Fishing and Hunting 61,777,563 31,839,579 26,269,612 5,569,967
Forestry 11,684,704 49,684,704 47,097,514 2,587,190
General Economic and Commercial 219,673,807 219,673,807 46,520,888 173,152,918
General Labor Affairs 9,995,964 32,995,964 31,696,340 1,299,623
Manufacturing 20,080,242 20,080,242 8,396,778 11,683,465
Mining of Mineral Resources other than mineral fuels49,884,489 14,884,489 13,499,734 1,384,755
Multipurpose Development projects 1,372,734 1,372,734 671,148 701,586
Nuclear fuels 12,751,983 12,751,983 102,746 12,649,237
Other Fuels 420,266 420,266 159,468 260,797
Petroleum and Natural Gas 42,906,098 903,357,916 902,190,137 1,167,779
R&D Agriculture, Forestry, Fishing and hunting 77,783,555 22,783,555 467,613 22,315,942
R&D Mining Manufacturing and construction 45,601,912 45,601,912 17,994,837 27,607,075
Railway Transport 200,063,333 79,515,489 66,077,841 13,437,648
Road Transport 1,441,894,440 587,374,717 576,940,340 10,434,377
Tourism 12,141,240 12,141,240 5,732,460 6,408,780Water Transport 0 55,000,000 49,750,433 5,249,567
TOTAL 3,834,136,427 3,158,334,178 2,478,822,613 679,511,564EDUCATION
Education N.E.C 860,528,823 4,720,972,224 4,711,861,617 9,110,607
Education not definable by Level 221,882,321 216,510,669 55,671,935 160,838,734
Lower-Secondary Education 1,304,555,415 4,555,415 5,637 4,549,777
Post-Secondary Nontertiary Education 102,235,583 402,235,583 317,936,902 84,298,681
Pre-primary Education 322,338,300 322,338,300 452 322,337,848
Primary Education 1,010,638,890 30,575,416 29,830,081 745,336
Subsidiary services to Education 850,793,972 5,094,817 5,028,888 65,929
Upper-Secondary Education 1,171,415,294 154,798,716 153,817,604 981,112
Tertiary Education 1,549,541,944 1,325,462,756 619,075,056 706,387,701
TOTAL 7,393,930,541 7,182,543,896 5,893,228,171 1,289,315,725
81
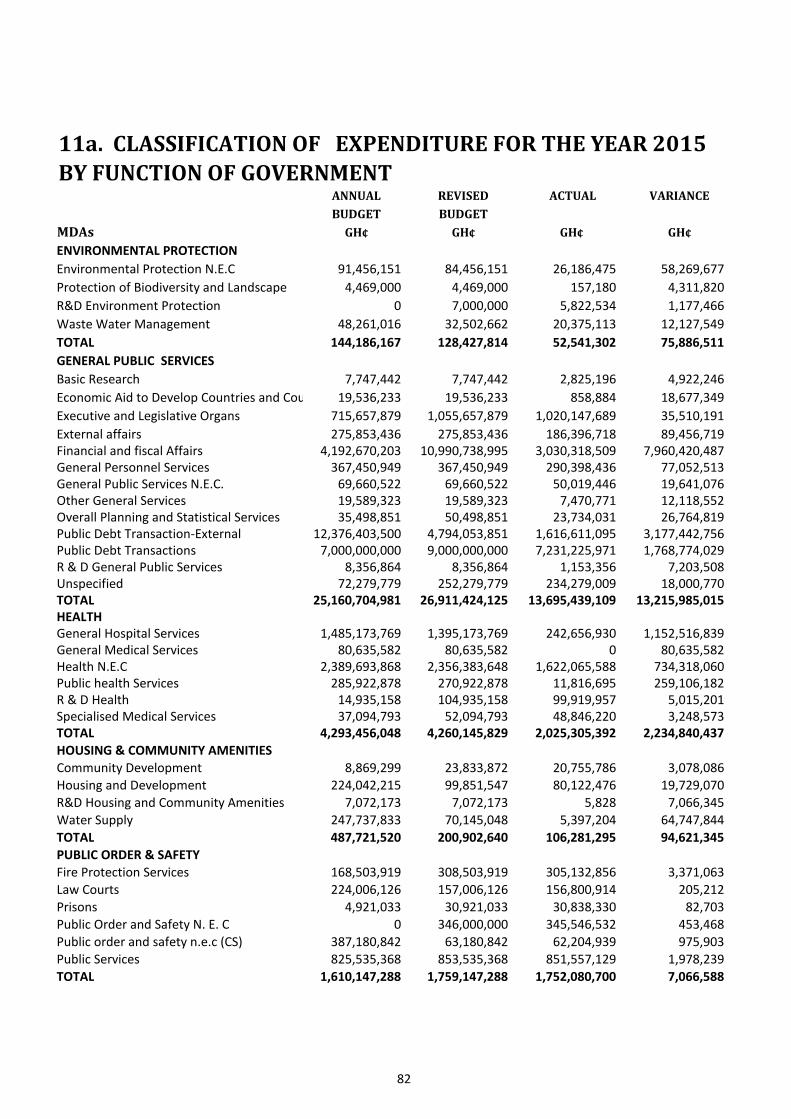
11a. CLASSIFICATION OF EXPENDITURE FOR THE YEAR 2015
BY FUNCTION OF GOVERNMENTANNUAL REVISED ACTUAL VARIANCE
BUDGET BUDGET
MDAs GH¢ GH¢ GH¢ GH¢
ENVIRONMENTAL PROTECTION
Environmental Protection N.E.C 91,456,151 84,456,151 26,186,475 58,269,677
Protection of Biodiversity and Landscape 4,469,000 4,469,000 157,180 4,311,820
R&D Environment Protection 0 7,000,000 5,822,534 1,177,466
Waste Water Management 48,261,016 32,502,662 20,375,113 12,127,549
TOTAL 144,186,167 128,427,814 52,541,302 75,886,511
GENERAL PUBLIC SERVICES
Basic Research 7,747,442 7,747,442 2,825,196 4,922,246
Economic Aid to Develop Countries and Countries in Transition19,536,233 19,536,233 858,884 18,677,349
Executive and Legislative Organs 715,657,879 1,055,657,879 1,020,147,689 35,510,191
External affairs 275,853,436 275,853,436 186,396,718 89,456,719Financial and fiscal Affairs 4,192,670,203 10,990,738,995 3,030,318,509 7,960,420,487General Personnel Services 367,450,949 367,450,949 290,398,436 77,052,513General Public Services N.E.C. 69,660,522 69,660,522 50,019,446 19,641,076Other General Services 19,589,323 19,589,323 7,470,771 12,118,552Overall Planning and Statistical Services 35,498,851 50,498,851 23,734,031 26,764,819Public Debt Transaction-External 12,376,403,500 4,794,053,851 1,616,611,095 3,177,442,756Public Debt Transactions 7,000,000,000 9,000,000,000 7,231,225,971 1,768,774,029R & D General Public Services 8,356,864 8,356,864 1,153,356 7,203,508Unspecified 72,279,779 252,279,779 234,279,009 18,000,770TOTAL 25,160,704,981 26,911,424,125 13,695,439,109 13,215,985,015HEALTHGeneral Hospital Services 1,485,173,769 1,395,173,769 242,656,930 1,152,516,839General Medical Services 80,635,582 80,635,582 0 80,635,582Health N.E.C 2,389,693,868 2,356,383,648 1,622,065,588 734,318,060Public health Services 285,922,878 270,922,878 11,816,695 259,106,182R & D Health 14,935,158 104,935,158 99,919,957 5,015,201Specialised Medical Services 37,094,793 52,094,793 48,846,220 3,248,573TOTAL 4,293,456,048 4,260,145,829 2,025,305,392 2,234,840,437
HOUSING & COMMUNITY AMENITIES
Community Development 8,869,299 23,833,872 20,755,786 3,078,086
Housing and Development 224,042,215 99,851,547 80,122,476 19,729,070
R&D Housing and Community Amenities 7,072,173 7,072,173 5,828 7,066,345
Water Supply 247,737,833 70,145,048 5,397,204 64,747,844
TOTAL 487,721,520 200,902,640 106,281,295 94,621,345
PUBLIC ORDER & SAFETY
Fire Protection Services 168,503,919 308,503,919 305,132,856 3,371,063
Law Courts 224,006,126 157,006,126 156,800,914 205,212
Prisons 4,921,033 30,921,033 30,838,330 82,703
Public Order and Safety N. E. C 0 346,000,000 345,546,532 453,468
Public order and safety n.e.c (CS) 387,180,842 63,180,842 62,204,939 975,903
Public Services 825,535,368 853,535,368 851,557,129 1,978,239
TOTAL 1,610,147,288 1,759,147,288 1,752,080,700 7,066,588
82
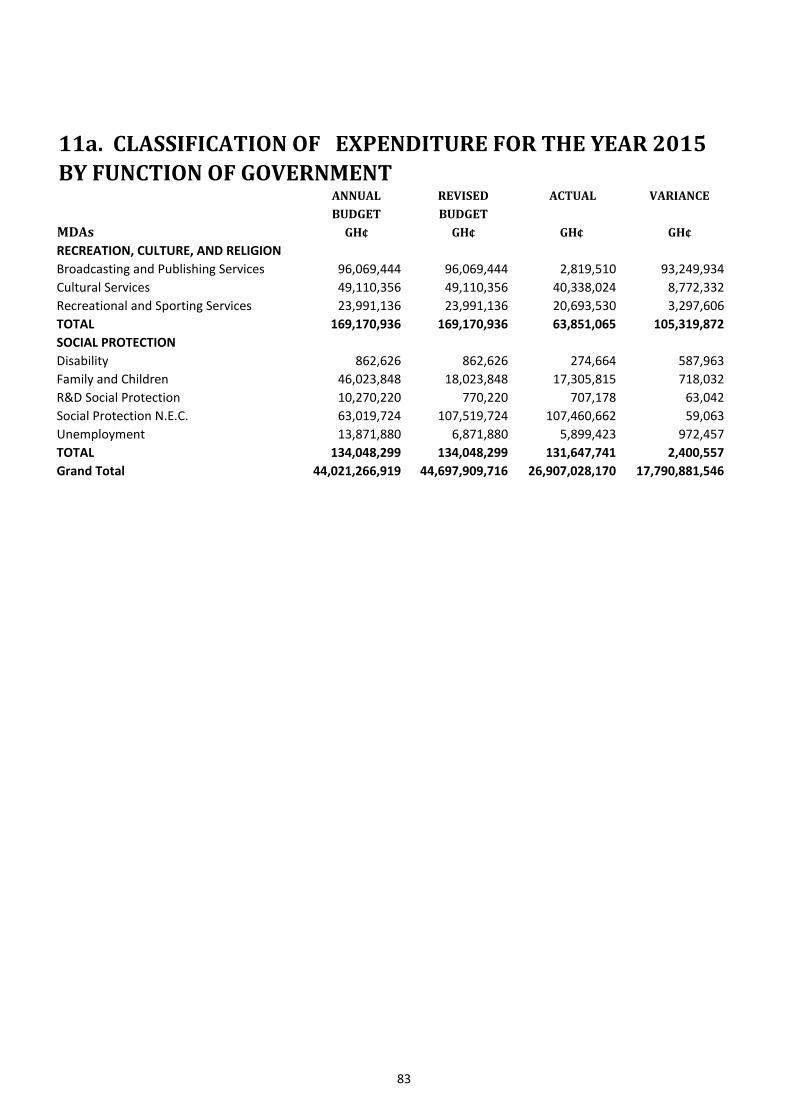
11a. CLASSIFICATION OF EXPENDITURE FOR THE YEAR 2015
BY FUNCTION OF GOVERNMENTANNUAL REVISED ACTUAL VARIANCE
BUDGET BUDGET
MDAs GH¢ GH¢ GH¢ GH¢
RECREATION, CULTURE, AND RELIGION
Broadcasting and Publishing Services 96,069,444 96,069,444 2,819,510 93,249,934
Cultural Services 49,110,356 49,110,356 40,338,024 8,772,332
Recreational and Sporting Services 23,991,136 23,991,136 20,693,530 3,297,606
TOTAL 169,170,936 169,170,936 63,851,065 105,319,872
SOCIAL PROTECTION
Disability 862,626 862,626 274,664 587,963
Family and Children 46,023,848 18,023,848 17,305,815 718,032
R&D Social Protection 10,270,220 770,220 707,178 63,042
Social Protection N.E.C. 63,019,724 107,519,724 107,460,662 59,063
Unemployment 13,871,880 6,871,880 5,899,423 972,457
TOTAL 134,048,299 134,048,299 131,647,741 2,400,557
Grand Total 44,021,266,919 44,697,909,716 26,907,028,170 17,790,881,546
83
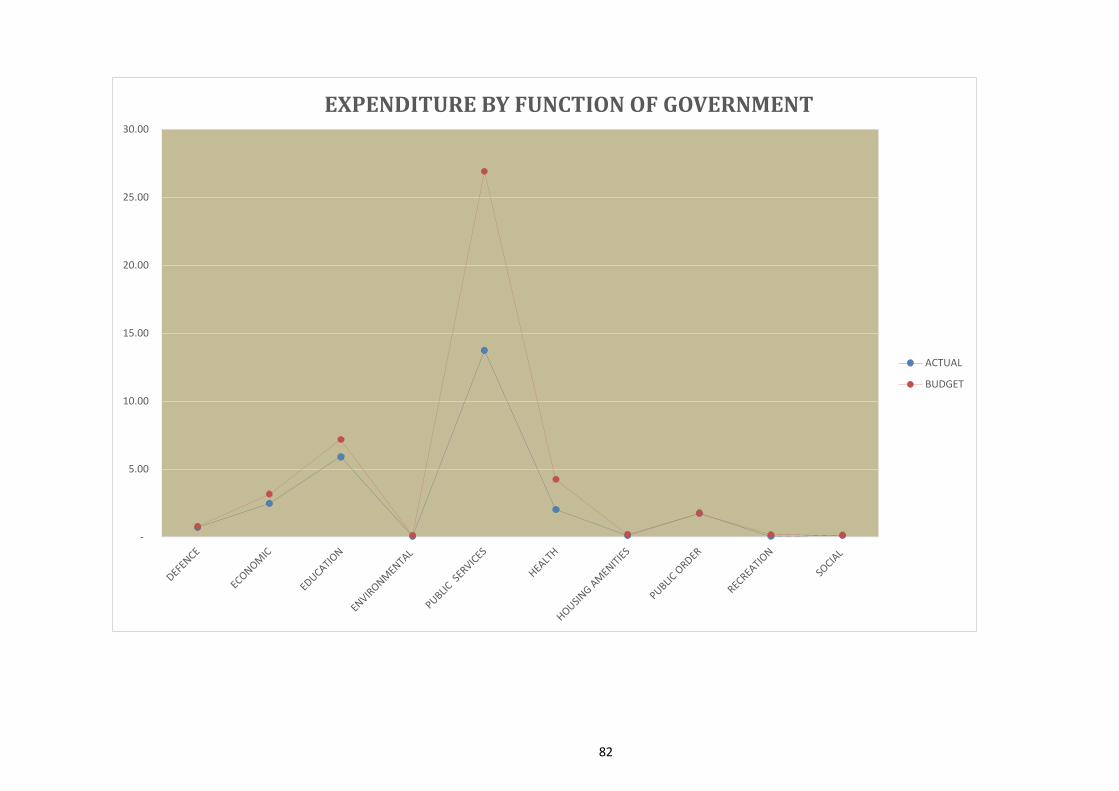
COFOG
DEFENCE
ECONOMIC
EDUCATION
HEALTH
RECREATION
SOCIAL
TOTAL
-
5.00
10.00
15.00
20.00
25.00
30.00
EXPENDITURE BY FUNCTION OF GOVERNMENT
ACTUAL
BUDGET
82

11b. SUMMARY CLASSIFICATION OF EXPENDITURE BY MDA FOR THE YEAR 2015COMPENSATION INTEREST NON OTHER SOCIAL GOODS AND GOVERNMENT GRAND
FINANCIAL ASSETS EXPENDITURE BENEFITS SERVICES SUBSIDY TOTAL
MDA GH¢ GH¢ GH¢ GH¢ GH¢ GH¢ GH¢ GH¢
Audit Service(AS) 107,454,097 0 0 0 0 9,885,392 0 117,339,489
CHRAJ (CHRAJ) 13,643,504 0 482,419 1,200 16,177 1,189,894 0 15,333,194
District Assembly Common Fund(DACF) 353,502 0 0 0 0 0 0 353,502
Electoral Commission 24,458,058 0 0 0 0 190,638,999 0 215,097,057
Judicial Service (JS) 121,422,167 0 9,906,991 0 2,128,837 8,009,725 0 141,467,720
Ministry of Communications (MoC) 60,634,930 0 0 0 0 6,113,039 0 66,747,969
Ministry of Chieftaincy (MCTA) 20,634,549 0 58,465 0 0 415,810 0 21,108,824
Ministry of Defence (MoD) 672,507,219 0 0 383,126 301,349 34,639,088 0 707,830,781
Ministry of Education (MOE) 5,530,646,389 0 47,930,396 158,204 66,790 92,332,482 69,241,068 5,740,375,328
Ministry of Employment (MELR) 40,800,399 0 279,834 0 2,986,860 13,818,017 0 57,885,111
Ministry of Energy and Petroleum(MENP) 3,511,716 0 211,884,124 0 0 3,961,362 793,236,342 1,012,593,545
Ministry of Environment Science,(MESTI) 144,082,296 0 1,198,758 1,214,019 827,528 27,175,577 0 174,498,179
Ministry of Finance (MoF) 155,194,169 392,994,091 405,770,897 121,182,551 175,957 419,250,754 0 1,494,568,419
Ministry of Fisheries(MFAD) 25,972,542 0 1,782,808 0 0 418,838 0 28,174,188
Ministry of Food and Agriculture (MOFA) 39,615,301 0 41,128,399 0 0 16,841,645 30,780,755 128,366,100
Ministry of Foreign Affairs (MFARI) 170,254,432 0 3,008,702 27,813,338 0 10,628,062 0 211,704,534
Ministry of Gender, Children & Social(MGCSP) 18,636,195 0 0 36,000,000 0 1,692,086 0 56,328,281
Ministry of Health (MoH) 2,031,551,261 0 11,249,564 0 0 177,638,888 0 2,220,439,714
Ministry of Interior (MINT) 1,178,527,756 0 4,419,898 0 6,598,257 210,064,805 0 1,399,610,716
Ministry of Justice (MoJ) 61,123,559 0 211,071 0 0 3,567,802 0 64,902,432
Ministry of Lands and Natural(MLNR) 83,784,577 0 9,554,828 55,298 31,401 41,497,712 0 134,923,816
Ministry of Local Govt and Rural(MLGRD) 350,412,349 0 1,763,657 0 0 137,241,717 0 489,417,723
Ministry of Power 0 0 0 0 0 3,208,028 0 3,208,028
Ministry of Roads and Highways 32,083,543 0 394,352,657 0 14,376 141,209 0 426,591,785
Ministry of Tourism, Culture (MTCCA) 18,591,078 0 67,972 0 0 660,534 0 19,319,583
Ministry of Trade and Industry (MoTI) 27,547,900 0 1,990,578 0 868,634 3,191,434 0 33,598,545
Ministry of Transport (MRT) 26,381,983 0 137,113,962 1,817,876 33,743 27,136,056 0 192,483,621
Ministry of Water Resources,(MWRWH) 19,302,310 0 92,729,756 184,906 0 2,253,484 0 114,470,457
Ministry of Youth and Sports (MoYS) 10,718,121 0 0 0 0 16,505,780 0 27,223,901
85
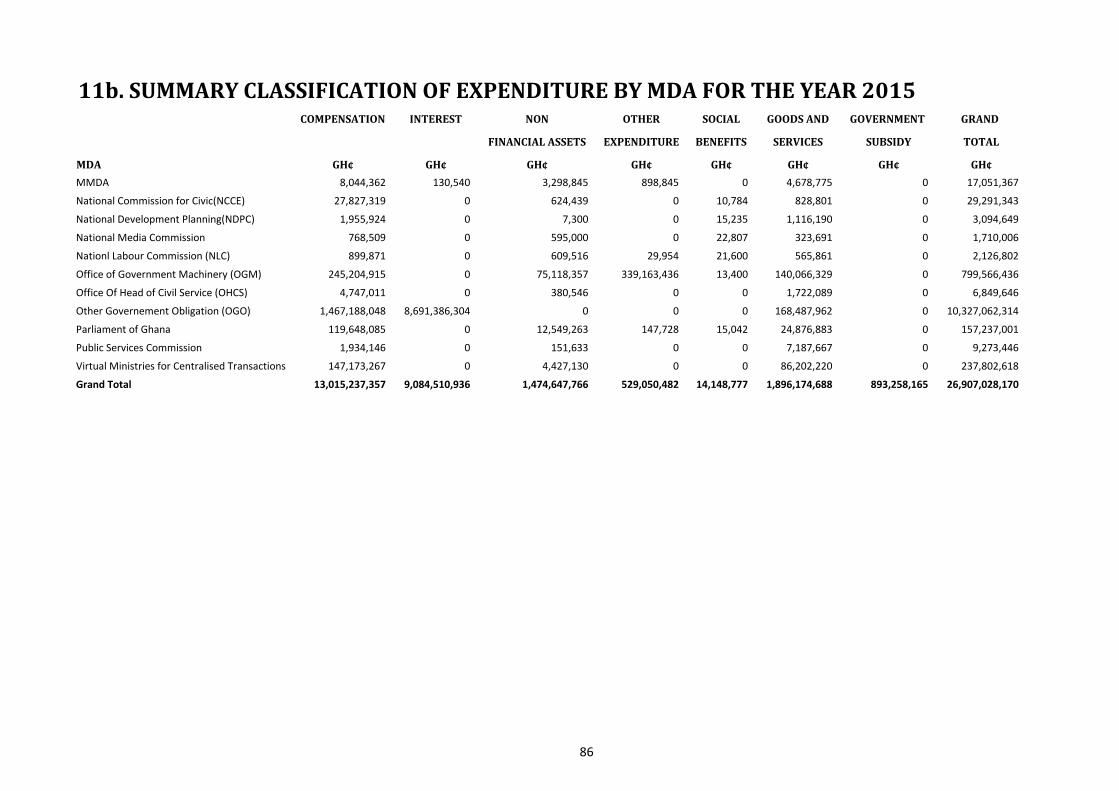
11b. SUMMARY CLASSIFICATION OF EXPENDITURE BY MDA FOR THE YEAR 2015COMPENSATION INTEREST NON OTHER SOCIAL GOODS AND GOVERNMENT GRAND
FINANCIAL ASSETS EXPENDITURE BENEFITS SERVICES SUBSIDY TOTAL
MDA GH¢ GH¢ GH¢ GH¢ GH¢ GH¢ GH¢ GH¢
MMDA 8,044,362 130,540 3,298,845 898,845 0 4,678,775 0 17,051,367
National Commission for Civic(NCCE) 27,827,319 0 624,439 0 10,784 828,801 0 29,291,343
National Development Planning(NDPC) 1,955,924 0 7,300 0 15,235 1,116,190 0 3,094,649
National Media Commission 768,509 0 595,000 0 22,807 323,691 0 1,710,006
Nationl Labour Commission (NLC) 899,871 0 609,516 29,954 21,600 565,861 0 2,126,802
Office of Government Machinery (OGM) 245,204,915 0 75,118,357 339,163,436 13,400 140,066,329 0 799,566,436
Office Of Head of Civil Service (OHCS) 4,747,011 0 380,546 0 0 1,722,089 0 6,849,646
Other Governement Obligation (OGO) 1,467,188,048 8,691,386,304 0 0 0 168,487,962 0 10,327,062,314
Parliament of Ghana 119,648,085 0 12,549,263 147,728 15,042 24,876,883 0 157,237,001
Public Services Commission 1,934,146 0 151,633 0 0 7,187,667 0 9,273,446
Virtual Ministries for Centralised Transactions 147,173,267 0 4,427,130 0 0 86,202,220 0 237,802,618
Grand Total 13,015,237,357 9,084,510,936 1,474,647,766 529,050,482 14,148,777 1,896,174,688 893,258,165 26,907,028,170
86
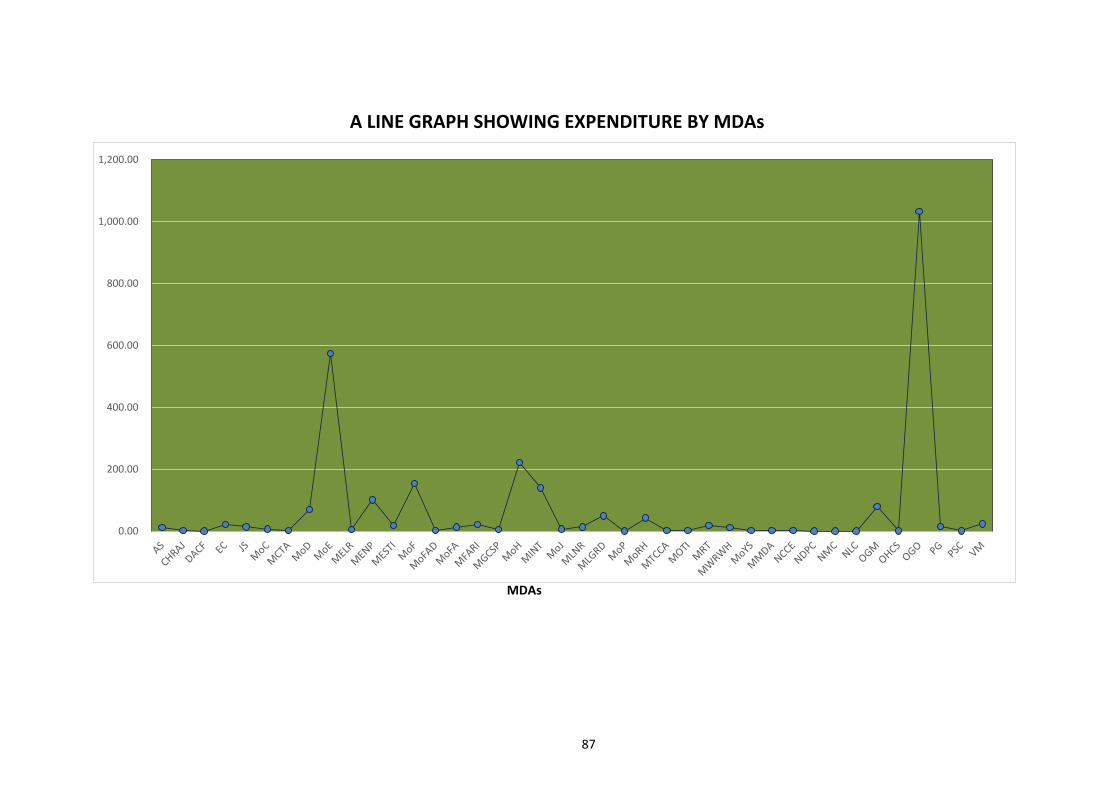
A LINE GRAPH SHOWING EXPENDITURE BY MDAs
MDAs
0.00
200.00
400.00
600.00
800.00
1,000.00
1,200.00
87
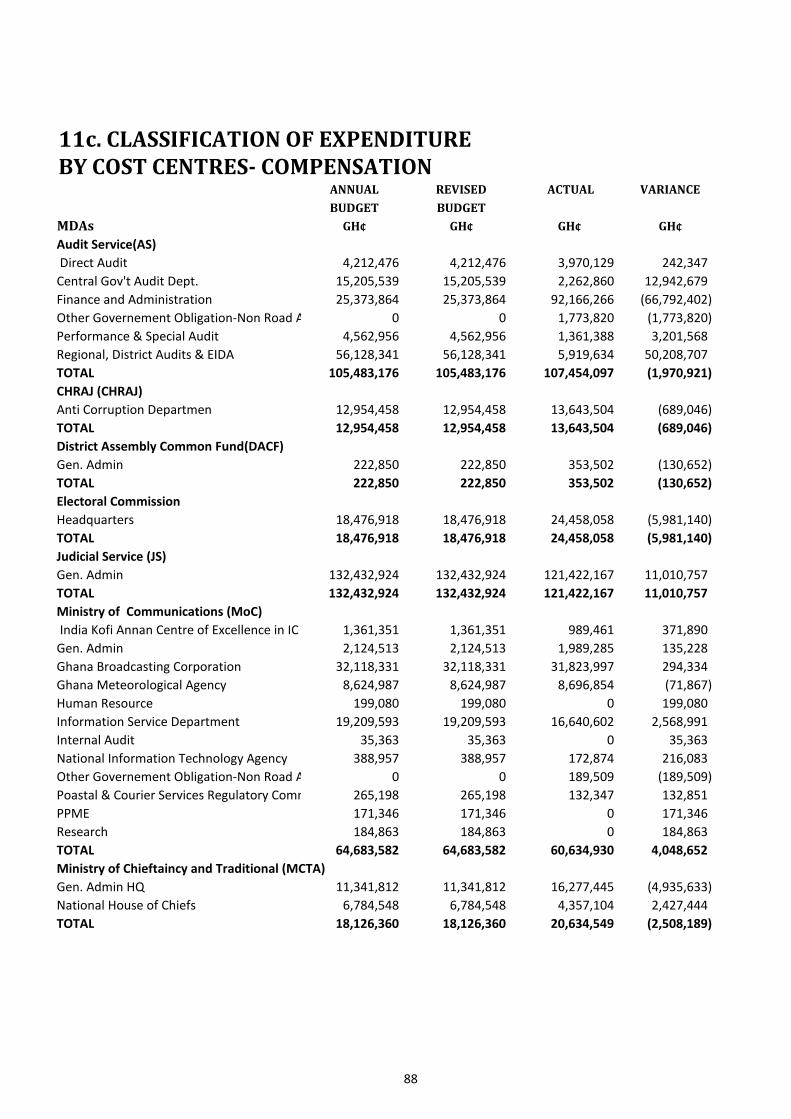
11c. CLASSIFICATION OF EXPENDITUREBY COST CENTRES- COMPENSATION
ANNUAL REVISED ACTUAL VARIANCE
BUDGET BUDGET
MDAs GH¢ GH¢ GH¢ GH¢
Audit Service(AS)
Direct Audit 4,212,476 4,212,476 3,970,129 242,347
Central Gov't Audit Dept. 15,205,539 15,205,539 2,262,860 12,942,679
Finance and Administration 25,373,864 25,373,864 92,166,266 (66,792,402)
Other Governement Obligation-Non Road Arrears 0 0 1,773,820 (1,773,820)
Performance & Special Audit 4,562,956 4,562,956 1,361,388 3,201,568
Regional, District Audits & EIDA 56,128,341 56,128,341 5,919,634 50,208,707
TOTAL 105,483,176 105,483,176 107,454,097 (1,970,921)
CHRAJ (CHRAJ)
Anti Corruption Departmen 12,954,458 12,954,458 13,643,504 (689,046)
TOTAL 12,954,458 12,954,458 13,643,504 (689,046)
District Assembly Common Fund(DACF)
Gen. Admin 222,850 222,850 353,502 (130,652)
TOTAL 222,850 222,850 353,502 (130,652)
Electoral Commission
Headquarters 18,476,918 18,476,918 24,458,058 (5,981,140)
TOTAL 18,476,918 18,476,918 24,458,058 (5,981,140)
Judicial Service (JS)
Gen. Admin 132,432,924 132,432,924 121,422,167 11,010,757
TOTAL 132,432,924 132,432,924 121,422,167 11,010,757
Ministry of Communications (MoC)
India Kofi Annan Centre of Excellence in IC 1,361,351 1,361,351 989,461 371,890
Gen. Admin 2,124,513 2,124,513 1,989,285 135,228
Ghana Broadcasting Corporation 32,118,331 32,118,331 31,823,997 294,334
Ghana Meteorological Agency 8,624,987 8,624,987 8,696,854 (71,867)
Human Resource 199,080 199,080 0 199,080
Information Service Department 19,209,593 19,209,593 16,640,602 2,568,991
Internal Audit 35,363 35,363 0 35,363
National Information Technology Agency 388,957 388,957 172,874 216,083
Other Governement Obligation-Non Road Arrears 0 0 189,509 (189,509)
Poastal & Courier Services Regulatory Commission 265,198 265,198 132,347 132,851
PPME 171,346 171,346 0 171,346
Research 184,863 184,863 0 184,863
TOTAL 64,683,582 64,683,582 60,634,930 4,048,652
Ministry of Chieftaincy and Traditional (MCTA)
Gen. Admin HQ 11,341,812 11,341,812 16,277,445 (4,935,633)
National House of Chiefs 6,784,548 6,784,548 4,357,104 2,427,444
TOTAL 18,126,360 18,126,360 20,634,549 (2,508,189)
88

11c. CLASSIFICATION OF EXPENDITUREBY COST CENTRES- COMPENSATION
ANNUAL REVISED ACTUAL VARIANCE
BUDGET BUDGET
MDAs GH¢ GH¢ GH¢ GH¢
Ministry of Defence (MoD)
Gen. Admin 3,208,915 3,208,915 535,836,831 (532,627,917)Ghana Armed Forces 611,722,931 611,722,931 40,658,997 571,063,934Other Governement Obligation-Non Road Arrears 0 0 4,677,731 (4,677,731)
Veterans Association of Ghana 0 0 91,333,660 (91,333,660)
TOTAL 614,931,845 614,931,845 672,507,219 (57,575,374)
Ministry of Education (MOE)
Centre for National Distance Learning and Open Schooling (CENDLOS)223,180 223,180 116,171 107,009
Council for Technical & Vocational Education & Training612,802 612,802 419,402 193,400
Gen. Admin 3,246,042 3,246,042 21,010,252 (17,764,210)
Ghana Book Development Council 225,223 225,223 136,547 88,676
Ghana Education Service (GES) 36,130,021 36,130,021 4,546,183 31,583,838
Ghana Library Board 5,941,141 5,941,141 4,825,044 1,116,098
Ghana National Commission for UNESCO 292,090 292,090 0 292,090
Institutions For The Handicapped 16,321,880 16,321,880 0 16,321,880
National Council for Curriculum and Assessment 112,817 112,817 0 112,817
National Inspectorate Board 429,778 429,778 1,372,729 (942,951)
National Service Secretariat 340,935,423 340,935,423 277,191,388 63,744,035
National Teaching Council 119,318 119,318 0 119,318
Non Formal Education 30,287,588 30,287,588 14,109,971 16,177,617
Other Governement Obligation-Non Road Arrears 0 0 6,437,146 (6,437,146)
Regional/District/School Services 3,496,125,616 3,496,125,616 4,391,291,708 (895,166,092)
Tertiary 964,632,691 964,632,691 792,880,889 171,751,802
WAEC (INTERNATIONAL) 11,974,480 11,974,480 8,980,860 2,993,620
WAEC (National) 6,756,765 6,756,765 7,328,098 (571,333)
TOTAL 4,914,366,857 4,914,366,857 5,530,646,389 (616,279,532)
Ministry of Employment and Labour(MELR)
Dept. of Co-operatives 3,687,634 3,687,634 3,618,648 68,986
Dept. of Factories Inspectorate 998,545 998,545 0 998,545
Dept. of Factories Inspectorate 0 0 974,117 (974,117)
Fair Wages and Salaries Commission 1,630,367 1,630,367 1,462,606 167,761
Ghana Cooperative Council 128,604 128,604 0 128,604
Headquarters 1,101,780 1,101,780 1,160,967 (59,187)
Integrated Cummunity Centeres For Employable Skill4,396,594 4,396,594 4,616,366 (219,771)
Labour Department 3,319,612 3,319,612 3,350,809 (31,196)
Management Development & Productivity Institute (M1,594,450 1,594,450 1,231,538 362,912
National Pension & Regulatory Authority 3,645,469 3,645,469 1,437,510 2,207,959
National Vocational Training Institute (NVTI) 8,604,182 8,604,182 9,751,019 (1,146,837)
Opportunity Industrialisation center 1,027,264 1,027,264 946,385 80,880
Organisation of African Trade Unioin Unity 107,691 107,691 149,041 (41,350)
Youth Employment Authority 0 0 12,101,393 (12,101,393)
TOTAL 30,242,193 30,242,193 40,800,399 (10,558,207)
89
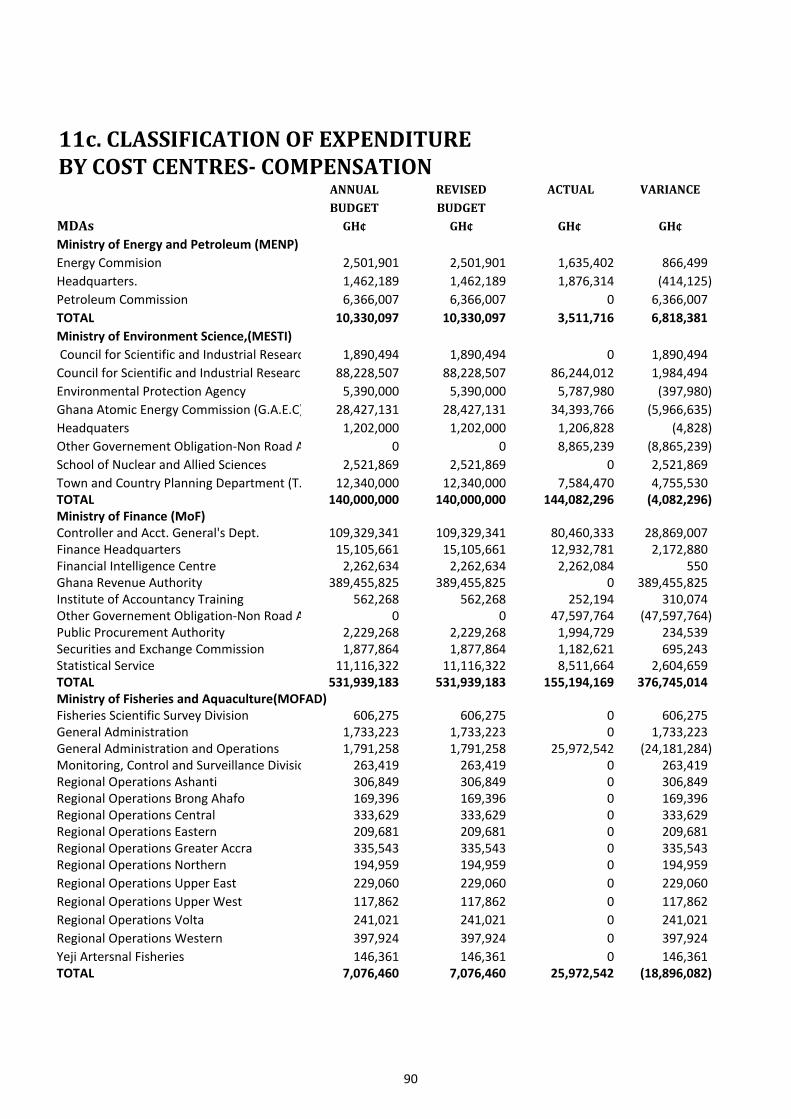
11c. CLASSIFICATION OF EXPENDITUREBY COST CENTRES- COMPENSATION
ANNUAL REVISED ACTUAL VARIANCE
BUDGET BUDGET
MDAs GH¢ GH¢ GH¢ GH¢
Ministry of Energy and Petroleum (MENP)
Energy Commision 2,501,901 2,501,901 1,635,402 866,499
Headquarters. 1,462,189 1,462,189 1,876,314 (414,125)
Petroleum Commission 6,366,007 6,366,007 0 6,366,007
TOTAL 10,330,097 10,330,097 3,511,716 6,818,381
Ministry of Environment Science,(MESTI)
Council for Scientific and Industrial Research (C.Roots and Tuber Project1,890,494 1,890,494 0 1,890,494
Council for Scientific and Industrial Research (C. 88,228,507 88,228,507 86,244,012 1,984,494
Environmental Protection Agency 5,390,000 5,390,000 5,787,980 (397,980)
Ghana Atomic Energy Commission (G.A.E.C) 28,427,131 28,427,131 34,393,766 (5,966,635)
Headquaters 1,202,000 1,202,000 1,206,828 (4,828)
Other Governement Obligation-Non Road Arrears 0 0 8,865,239 (8,865,239)
School of Nuclear and Allied Sciences 2,521,869 2,521,869 0 2,521,869
Town and Country Planning Department (T.C.P.D)12,340,000 12,340,000 7,584,470 4,755,530TOTAL 140,000,000 140,000,000 144,082,296 (4,082,296)Ministry of Finance (MoF)Controller and Acct. General's Dept. 109,329,341 109,329,341 80,460,333 28,869,007Finance Headquarters 15,105,661 15,105,661 12,932,781 2,172,880Financial Intelligence Centre 2,262,634 2,262,634 2,262,084 550Ghana Revenue Authority 389,455,825 389,455,825 0 389,455,825Institute of Accountancy Training 562,268 562,268 252,194 310,074Other Governement Obligation-Non Road Arrears 0 0 47,597,764 (47,597,764)Public Procurement Authority 2,229,268 2,229,268 1,994,729 234,539Securities and Exchange Commission 1,877,864 1,877,864 1,182,621 695,243Statistical Service 11,116,322 11,116,322 8,511,664 2,604,659TOTAL 531,939,183 531,939,183 155,194,169 376,745,014Ministry of Fisheries and Aquaculture(MOFAD)Fisheries Scientific Survey Division 606,275 606,275 0 606,275General Administration 1,733,223 1,733,223 0 1,733,223General Administration and Operations 1,791,258 1,791,258 25,972,542 (24,181,284)Monitoring, Control and Surveillance Division 263,419 263,419 0 263,419Regional Operations Ashanti 306,849 306,849 0 306,849Regional Operations Brong Ahafo 169,396 169,396 0 169,396Regional Operations Central 333,629 333,629 0 333,629Regional Operations Eastern 209,681 209,681 0 209,681Regional Operations Greater Accra 335,543 335,543 0 335,543Regional Operations Northern 194,959 194,959 0 194,959
Regional Operations Upper East 229,060 229,060 0 229,060
Regional Operations Upper West 117,862 117,862 0 117,862
Regional Operations Volta 241,021 241,021 0 241,021
Regional Operations Western 397,924 397,924 0 397,924
Yeji Artersnal Fisheries 146,361 146,361 0 146,361TOTAL 7,076,460 7,076,460 25,972,542 (18,896,082)
90
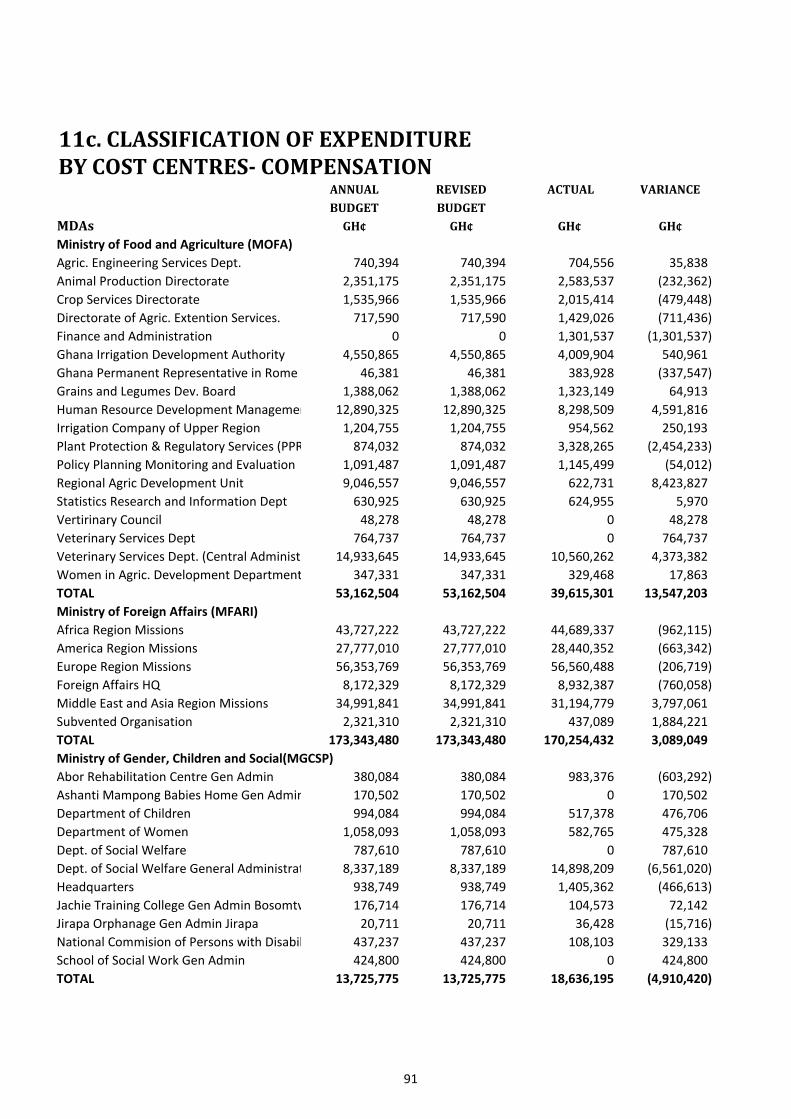
11c. CLASSIFICATION OF EXPENDITUREBY COST CENTRES- COMPENSATION
ANNUAL REVISED ACTUAL VARIANCE
BUDGET BUDGET
MDAs GH¢ GH¢ GH¢ GH¢
Ministry of Food and Agriculture (MOFA)
Agric. Engineering Services Dept. 740,394 740,394 704,556 35,838
Animal Production Directorate 2,351,175 2,351,175 2,583,537 (232,362)
Crop Services Directorate 1,535,966 1,535,966 2,015,414 (479,448)
Directorate of Agric. Extention Services. 717,590 717,590 1,429,026 (711,436)
Finance and Administration 0 0 1,301,537 (1,301,537)
Ghana Irrigation Development Authority 4,550,865 4,550,865 4,009,904 540,961
Ghana Permanent Representative in Rome 46,381 46,381 383,928 (337,547)
Grains and Legumes Dev. Board 1,388,062 1,388,062 1,323,149 64,913
Human Resource Development Management 12,890,325 12,890,325 8,298,509 4,591,816
Irrigation Company of Upper Region 1,204,755 1,204,755 954,562 250,193
Plant Protection & Regulatory Services (PPRS) 874,032 874,032 3,328,265 (2,454,233)
Policy Planning Monitoring and Evaluation 1,091,487 1,091,487 1,145,499 (54,012)
Regional Agric Development Unit 9,046,557 9,046,557 622,731 8,423,827
Statistics Research and Information Dept 630,925 630,925 624,955 5,970
Vertirinary Council 48,278 48,278 0 48,278
Veterinary Services Dept 764,737 764,737 0 764,737
Veterinary Services Dept. (Central Administration)14,933,645 14,933,645 10,560,262 4,373,382
Women in Agric. Development Department (WIAD) 347,331 347,331 329,468 17,863
TOTAL 53,162,504 53,162,504 39,615,301 13,547,203
Ministry of Foreign Affairs (MFARI)
Africa Region Missions 43,727,222 43,727,222 44,689,337 (962,115)
America Region Missions 27,777,010 27,777,010 28,440,352 (663,342)
Europe Region Missions 56,353,769 56,353,769 56,560,488 (206,719)
Foreign Affairs HQ 8,172,329 8,172,329 8,932,387 (760,058)
Middle East and Asia Region Missions 34,991,841 34,991,841 31,194,779 3,797,061
Subvented Organisation 2,321,310 2,321,310 437,089 1,884,221
TOTAL 173,343,480 173,343,480 170,254,432 3,089,049
Ministry of Gender, Children and Social(MGCSP)
Abor Rehabilitation Centre Gen Admin 380,084 380,084 983,376 (603,292)
Ashanti Mampong Babies Home Gen Admin 170,502 170,502 0 170,502
Department of Children 994,084 994,084 517,378 476,706
Department of Women 1,058,093 1,058,093 582,765 475,328
Dept. of Social Welfare 787,610 787,610 0 787,610
Dept. of Social Welfare General Administration, Budget and Planning8,337,189 8,337,189 14,898,209 (6,561,020)
Headquarters 938,749 938,749 1,405,362 (466,613)
Jachie Training College Gen Admin Bosomtwe 176,714 176,714 104,573 72,142
Jirapa Orphanage Gen Admin Jirapa 20,711 20,711 36,428 (15,716)
National Commision of Persons with Disabillity General Administration437,237 437,237 108,103 329,133
School of Social Work Gen Admin 424,800 424,800 0 424,800
TOTAL 13,725,775 13,725,775 18,636,195 (4,910,420)
91

11c. CLASSIFICATION OF EXPENDITUREBY COST CENTRES- COMPENSATION
ANNUAL REVISED ACTUAL VARIANCE
BUDGET BUDGET
MDAs GH¢ GH¢ GH¢ GH¢
Ministry of Health (MoH)
Allied Health Professions Council 275,608 275,608 65,771 209,837
Christian Health Association of Ghana 338,840,952 338,840,952 249,869,000 88,971,951
Ghana Health Service 664,817,021 664,817,021 1,126,093,059 (461,276,038)
Health Headquarters 6,811,242 6,811,242 12,779,979 (5,968,737)
Office of the Chief Director 137,669 137,669 0 137,669
Office of the Minister 8,898 8,898 0 8,898
Procurement and Supplies 570,893 570,893 0 570,893
Psychiatry Hospitals (Tertiary Health Services) 20,401,953 20,401,953 48,846,220 (28,444,267)
Regulatory Agencies 41,123,171 41,123,171 46,540,609 (5,417,439)
Subvented Organisations 27,017,899 27,017,899 28,544,533 (1,526,634)
Teaching Hospitals 392,208,552 392,208,552 216,655,521 175,553,031
Traditional and Alternative Medicine Directorate 33,715 33,715 0 33,715
Training Institutions 40,606,960 40,606,960 302,156,569 (261,549,609)
TOTAL 1,532,854,532 1,532,854,532 2,031,551,261 (498,696,729)
Ministry of Interior (MINT)
Gaming Board 360,582 360,582 374,202 (13,621)
Ghana Immigration Service 93,824,876 93,824,876 110,765,558 (16,940,682)
Ghana National Fire Service 147,369,641 147,369,641 157,303,070 (9,933,429)
Ghana Police Service 657,368,912 657,368,912 708,546,083 (51,177,171)
Ghana Prisons Service 112,027,535 112,027,535 122,844,701 (10,817,166)
Ghana Refugee Board 657,000 657,000 347,950 309,050
Interior Headquarters 1,401,059 1,401,059 1,139,349 261,710
Nacortic Control Board 18,160,000 18,160,000 13,486,097 4,673,903
National Commission on Small Arms 500,000 500,000 257,373 242,627
National Disaster Management Organization 50,436,442 50,436,442 62,434,528 (11,998,085)
National Peace Council 2,907,292 2,907,292 1,028,846 1,878,447
TOTAL 1,085,013,340 1,085,013,340 1,178,527,756 (93,514,417)
Ministry of Justice (MoJ)
Attorney General's Department 29,574,069 29,574,069 37,251,602 (7,677,532)
CopyRight Office 579,975 579,975 293,336 286,639
Council for Law Reporting 2,004,912 2,004,912 1,628,498 376,414
Economic and Organised Crime Office 13,164,884 13,164,884 11,922,048 1,242,836
Gen. Admin and Finance 2,662,027 2,662,027 1,173,839 1,488,189
General Legal Council 4,388,550 4,388,550 2,351,230 2,037,320
Law Reform Commission 685,820 685,820 514,514 171,306
Legal Aid Scheme 3,209,412 3,209,412 3,007,600 201,812
Registrar General's Dep't 3,933,358 3,933,358 2,980,893 952,465
TOTAL 60,203,007 60,203,007 61,123,559 (920,552)
92
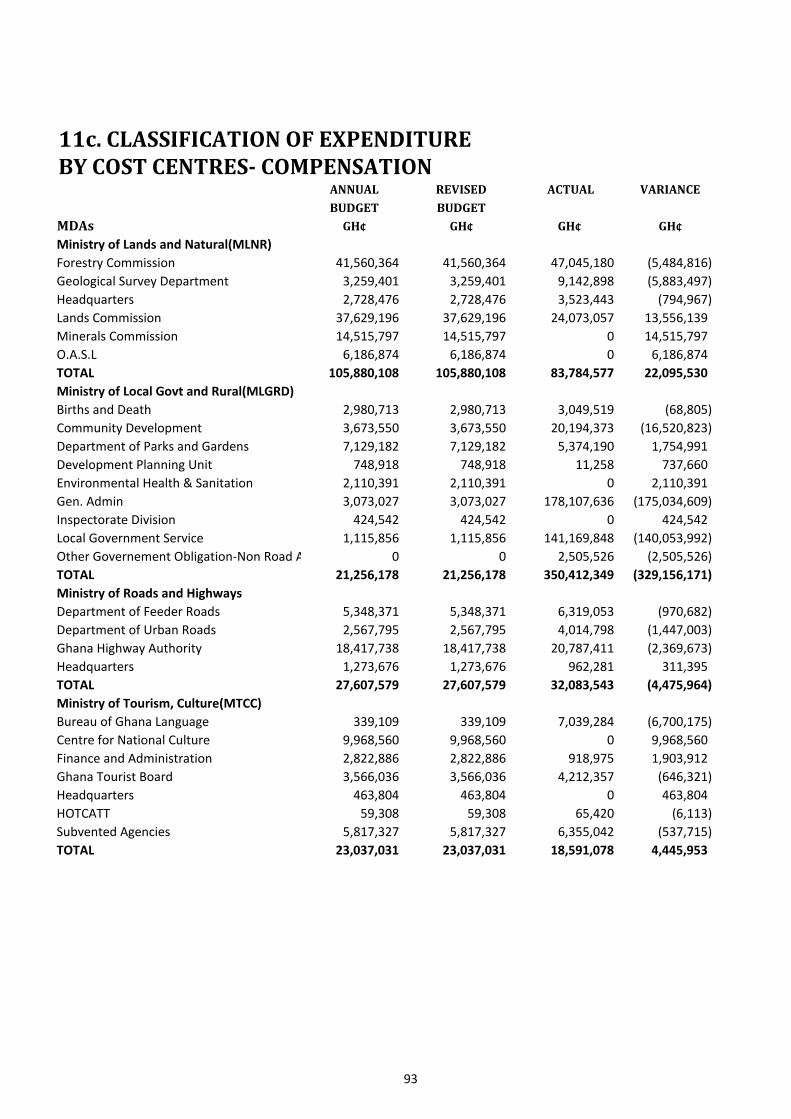
11c. CLASSIFICATION OF EXPENDITUREBY COST CENTRES- COMPENSATION
ANNUAL REVISED ACTUAL VARIANCE
BUDGET BUDGET
MDAs GH¢ GH¢ GH¢ GH¢
Ministry of Lands and Natural(MLNR)
Forestry Commission 41,560,364 41,560,364 47,045,180 (5,484,816)
Geological Survey Department 3,259,401 3,259,401 9,142,898 (5,883,497)
Headquarters 2,728,476 2,728,476 3,523,443 (794,967)
Lands Commission 37,629,196 37,629,196 24,073,057 13,556,139
Minerals Commission 14,515,797 14,515,797 0 14,515,797
O.A.S.L 6,186,874 6,186,874 0 6,186,874
TOTAL 105,880,108 105,880,108 83,784,577 22,095,530
Ministry of Local Govt and Rural(MLGRD)
Births and Death 2,980,713 2,980,713 3,049,519 (68,805)
Community Development 3,673,550 3,673,550 20,194,373 (16,520,823)
Department of Parks and Gardens 7,129,182 7,129,182 5,374,190 1,754,991
Development Planning Unit 748,918 748,918 11,258 737,660
Environmental Health & Sanitation 2,110,391 2,110,391 0 2,110,391
Gen. Admin 3,073,027 3,073,027 178,107,636 (175,034,609)
Inspectorate Division 424,542 424,542 0 424,542
Local Government Service 1,115,856 1,115,856 141,169,848 (140,053,992)
Other Governement Obligation-Non Road Arrears 0 0 2,505,526 (2,505,526)
TOTAL 21,256,178 21,256,178 350,412,349 (329,156,171)
Ministry of Roads and Highways
Department of Feeder Roads 5,348,371 5,348,371 6,319,053 (970,682)
Department of Urban Roads 2,567,795 2,567,795 4,014,798 (1,447,003)
Ghana Highway Authority 18,417,738 18,417,738 20,787,411 (2,369,673)
Headquarters 1,273,676 1,273,676 962,281 311,395
TOTAL 27,607,579 27,607,579 32,083,543 (4,475,964)
Ministry of Tourism, Culture(MTCC)
Bureau of Ghana Language 339,109 339,109 7,039,284 (6,700,175)
Centre for National Culture 9,968,560 9,968,560 0 9,968,560
Finance and Administration 2,822,886 2,822,886 918,975 1,903,912
Ghana Tourist Board 3,566,036 3,566,036 4,212,357 (646,321)
Headquarters 463,804 463,804 0 463,804
HOTCATT 59,308 59,308 65,420 (6,113)
Subvented Agencies 5,817,327 5,817,327 6,355,042 (537,715)
TOTAL 23,037,031 23,037,031 18,591,078 4,445,953
93

11c. CLASSIFICATION OF EXPENDITUREBY COST CENTRES- COMPENSATION
ANNUAL REVISED ACTUAL VARIANCE
BUDGET BUDGET
MDAs GH¢ GH¢ GH¢ GH¢
Ministry of Trade and Industry (MoTI)
CEDECOM 924,870 924,870 642,215 282,655
Foreign Missions 196,502 196,502 8,680,000 (8,483,498)
Gen. Admin 10,987,656 10,987,656 3,808,166 7,179,489
Ghana Export Promotion Authority 1,832,976 1,832,976 1,249,592 583,384
Ghana Standards Board 5,036,182 5,036,182 5,221,080 (184,899)
GRATIS 4,299,952 4,299,952 2,536,090 1,763,862
Industrial Development Division 4,268,359 4,268,359 0 4,268,359
NBSSI 7,900,807 7,900,807 5,410,257 2,490,550
Regional Trade Offices 855,392 855,392 499 854,894
TOTAL 36,302,697 36,302,697 27,547,900 8,754,797
Ministry of Transport (MRT)
Headquarters 1,076,002 1,076,002 2,275,429 (1,199,427)
Driver and Vehicle Licensing Authority 7,213,517 7,213,517 7,986,383 (772,866)
Ghana Railway Development Authority 1,189,779 1,189,779 455,567 734,212
Government Technical Training Centret 399,511 399,511 0 399,511
National Road Safety Commission 997,231 997,231 880,226 117,005
Other Governement Obligation-Non Road Arrears 0 0 6,507,885 (6,507,885)
Other Governement Obligation-General Government Services0 0 8,276,494 (8,276,494)
TOTAL 10,876,040 10,876,040 26,381,983 (15,505,944)
Ministry of Water Resources, Works(MWRWH)Architect Registration Council 59,791 59,791 132,769 (72,978)Community Water & Sanitation Agency 3,633,582 3,633,582 3,487,698 145,884Department of Rural Housing 199,579 199,579 0 199,579Gen. Admin (GA) 688,713 688,713 2,792,269 (2,103,556)Housing 109,035 109,035 1,087,724 (978,688)Human Resource Development and Mamagement (HRDM)128,310 128,310 0 128,310Hydrological Services Department 802,217 802,217 351,033 451,184Policy Planning, Budgeting, Monitoring and Evaluation (PPMBE)147,684 147,684 0 147,684Public Servants Housing Loan Scheme Board 59,987 59,987 40,763 19,224Public Works Department 1,495,325 1,495,325 10,339,237 (8,843,912)Regional/DRH 932,370 932,370 0 932,370Rent Control Department 905,779 905,779 0 905,779Ressearch Statistics and Information Management (RSIM)78,798 78,798 0 78,798Water Resources Commission 82,773 82,773 1,070,819 (988,046)TOTAL 9,323,942 9,323,942 19,302,310 (9,978,368)
Ministry of Youth and Sports (MoYS)
Headquarters 909,795 909,795 2,038,493 (1,128,698)
National Sports Authority 4,494,708 4,494,708 3,312,044 1,182,664
National Sports Colleage 382,464 382,464 405,513 (23,049)
National Youth Authority 4,403,735 4,403,735 4,962,071 (558,336)
TOTAL 10,190,702 10,190,702 10,718,121 (527,420)
94
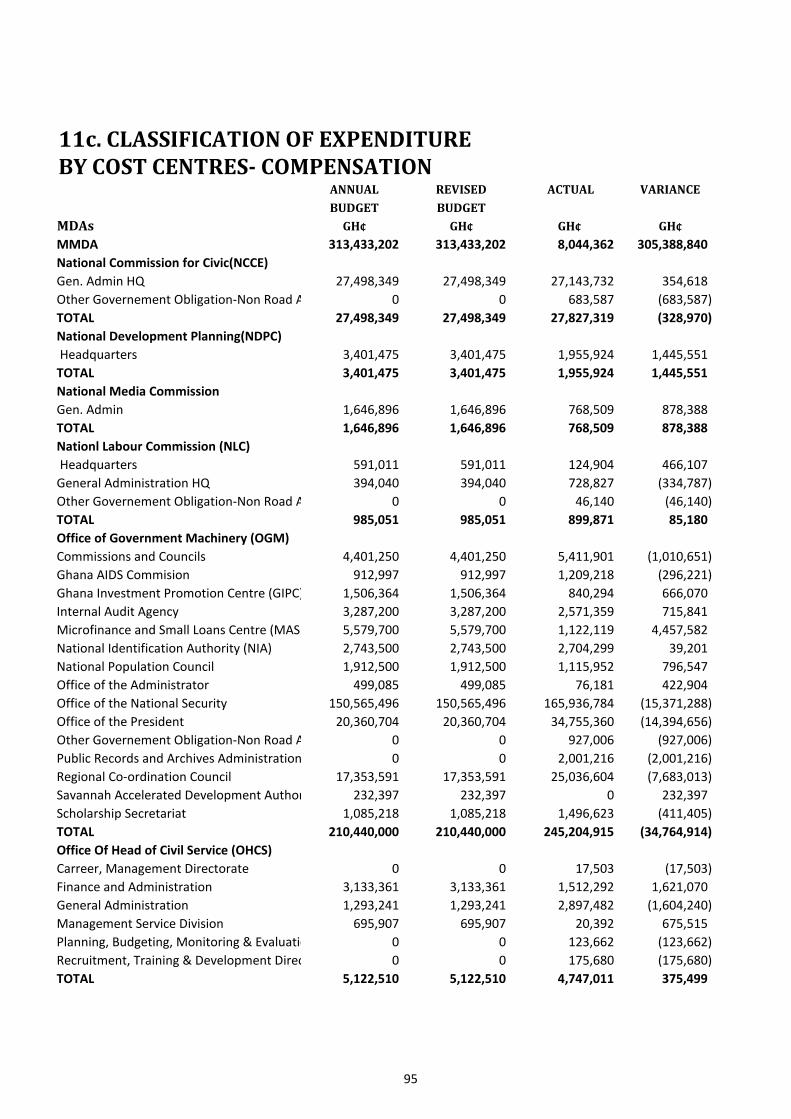
11c. CLASSIFICATION OF EXPENDITUREBY COST CENTRES- COMPENSATION
ANNUAL REVISED ACTUAL VARIANCE
BUDGET BUDGET
MDAs GH¢ GH¢ GH¢ GH¢
MMDA 313,433,202 313,433,202 8,044,362 305,388,840
National Commission for Civic(NCCE)
Gen. Admin HQ 27,498,349 27,498,349 27,143,732 354,618
Other Governement Obligation-Non Road Arrears 0 0 683,587 (683,587)
TOTAL 27,498,349 27,498,349 27,827,319 (328,970)
National Development Planning(NDPC)
Headquarters 3,401,475 3,401,475 1,955,924 1,445,551
TOTAL 3,401,475 3,401,475 1,955,924 1,445,551
National Media Commission
Gen. Admin 1,646,896 1,646,896 768,509 878,388
TOTAL 1,646,896 1,646,896 768,509 878,388
Nationl Labour Commission (NLC)
Headquarters 591,011 591,011 124,904 466,107
General Administration HQ 394,040 394,040 728,827 (334,787)
Other Governement Obligation-Non Road Arrears 0 0 46,140 (46,140)
TOTAL 985,051 985,051 899,871 85,180
Office of Government Machinery (OGM)
Commissions and Councils 4,401,250 4,401,250 5,411,901 (1,010,651)
Ghana AIDS Commision 912,997 912,997 1,209,218 (296,221)
Ghana Investment Promotion Centre (GIPC) 1,506,364 1,506,364 840,294 666,070
Internal Audit Agency 3,287,200 3,287,200 2,571,359 715,841
Microfinance and Small Loans Centre (MASLOC) 5,579,700 5,579,700 1,122,119 4,457,582
National Identification Authority (NIA) 2,743,500 2,743,500 2,704,299 39,201
National Population Council 1,912,500 1,912,500 1,115,952 796,547
Office of the Administrator 499,085 499,085 76,181 422,904
Office of the National Security 150,565,496 150,565,496 165,936,784 (15,371,288)
Office of the President 20,360,704 20,360,704 34,755,360 (14,394,656)
Other Governement Obligation-Non Road Arrears 0 0 927,006 (927,006)
Public Records and Archives Administration Departm 0 0 2,001,216 (2,001,216)
Regional Co-ordination Council 17,353,591 17,353,591 25,036,604 (7,683,013)
Savannah Accelerated Development Authority (SADA)232,397 232,397 0 232,397
Scholarship Secretariat 1,085,218 1,085,218 1,496,623 (411,405)
TOTAL 210,440,000 210,440,000 245,204,915 (34,764,914)
Office Of Head of Civil Service (OHCS)
Carreer, Management Directorate 0 0 17,503 (17,503)
Finance and Administration 3,133,361 3,133,361 1,512,292 1,621,070
General Administration 1,293,241 1,293,241 2,897,482 (1,604,240)
Management Service Division 695,907 695,907 20,392 675,515
Planning, Budgeting, Monitoring & Evaluation 0 0 123,662 (123,662)
Recruitment, Training & Development Directorate 0 0 175,680 (175,680)
TOTAL 5,122,510 5,122,510 4,747,011 375,499
95
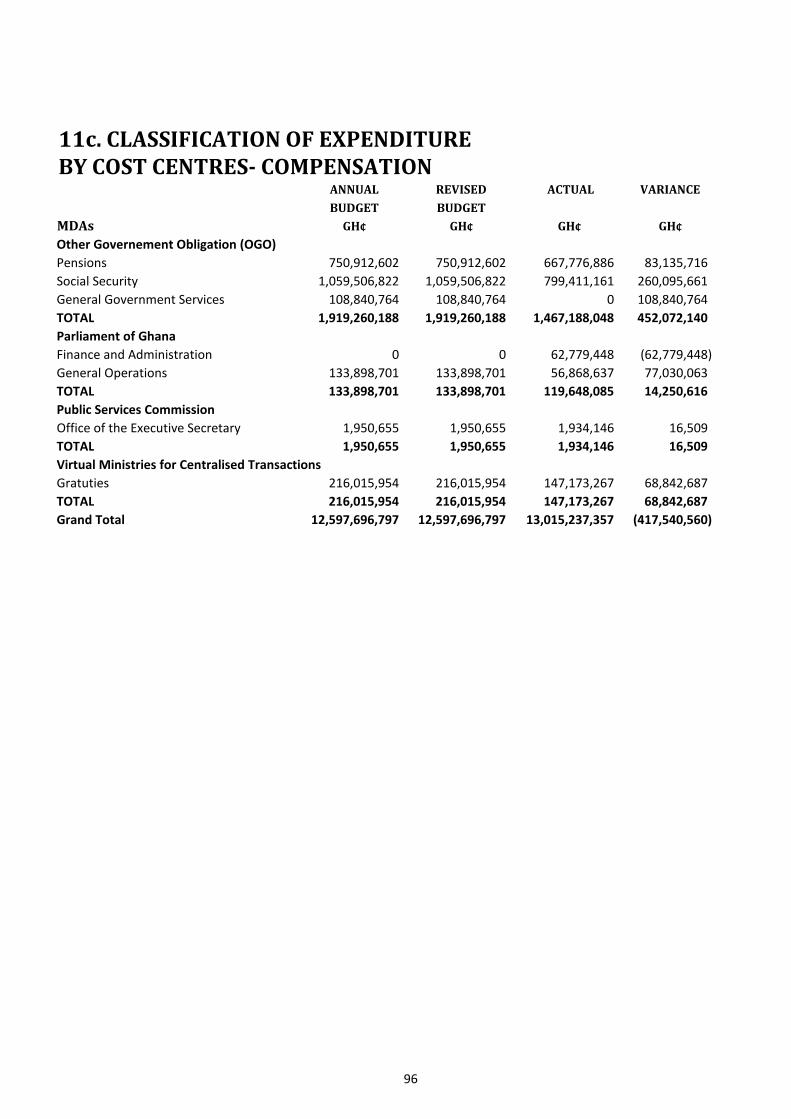
11c. CLASSIFICATION OF EXPENDITUREBY COST CENTRES- COMPENSATION
ANNUAL REVISED ACTUAL VARIANCE
BUDGET BUDGET
MDAs GH¢ GH¢ GH¢ GH¢
Other Governement Obligation (OGO)
Pensions 750,912,602 750,912,602 667,776,886 83,135,716
Social Security 1,059,506,822 1,059,506,822 799,411,161 260,095,661
General Government Services 108,840,764 108,840,764 0 108,840,764
TOTAL 1,919,260,188 1,919,260,188 1,467,188,048 452,072,140
Parliament of Ghana
Finance and Administration 0 0 62,779,448 (62,779,448)
General Operations 133,898,701 133,898,701 56,868,637 77,030,063
TOTAL 133,898,701 133,898,701 119,648,085 14,250,616
Public Services Commission
Office of the Executive Secretary 1,950,655 1,950,655 1,934,146 16,509
TOTAL 1,950,655 1,950,655 1,934,146 16,509
Virtual Ministries for Centralised Transactions
Gratuties 216,015,954 216,015,954 147,173,267 68,842,687
TOTAL 216,015,954 216,015,954 147,173,267 68,842,687
Grand Total 12,597,696,797 12,597,696,797 13,015,237,357 (417,540,560)
96
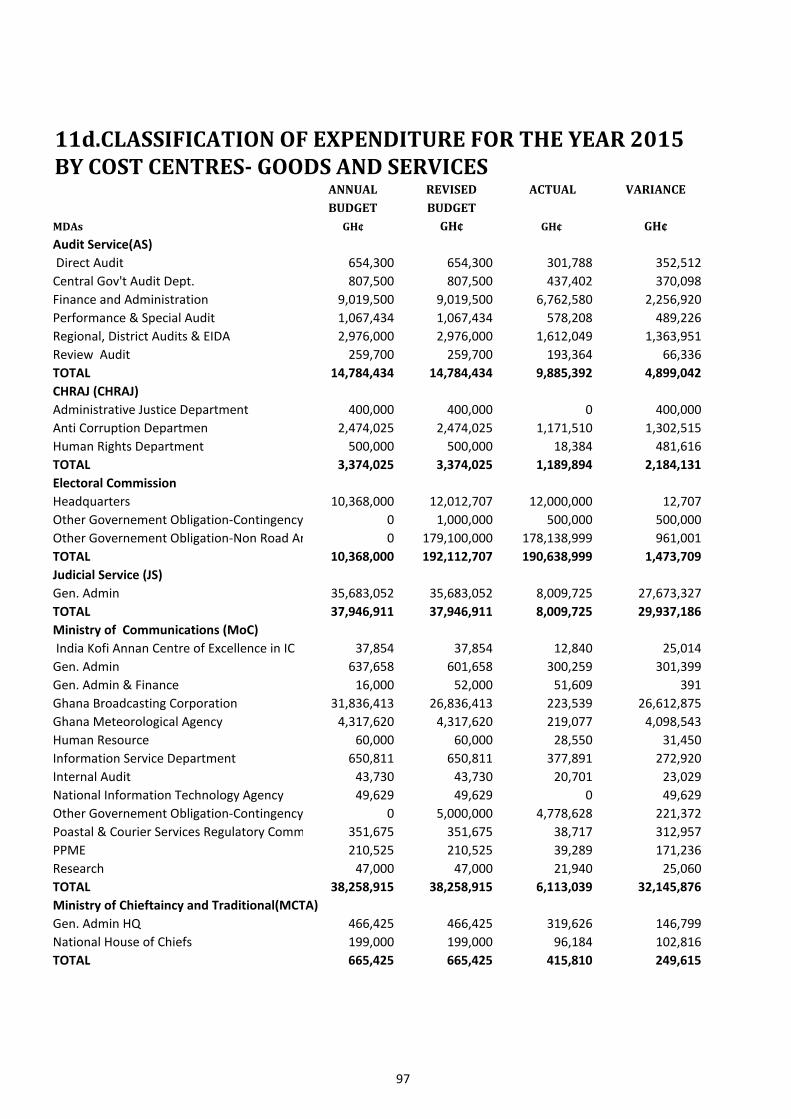
11d.CLASSIFICATION OF EXPENDITURE FOR THE YEAR 2015BY COST CENTRES- GOODS AND SERVICES
ANNUAL REVISED ACTUAL VARIANCE
BUDGET BUDGET
MDAs GH¢ GH¢ GH¢ GH¢
Audit Service(AS)
Direct Audit 654,300 654,300 301,788 352,512
Central Gov't Audit Dept. 807,500 807,500 437,402 370,098
Finance and Administration 9,019,500 9,019,500 6,762,580 2,256,920
Performance & Special Audit 1,067,434 1,067,434 578,208 489,226
Regional, District Audits & EIDA 2,976,000 2,976,000 1,612,049 1,363,951
Review Audit 259,700 259,700 193,364 66,336
TOTAL 14,784,434 14,784,434 9,885,392 4,899,042
CHRAJ (CHRAJ)
Administrative Justice Department 400,000 400,000 0 400,000
Anti Corruption Departmen 2,474,025 2,474,025 1,171,510 1,302,515
Human Rights Department 500,000 500,000 18,384 481,616
TOTAL 3,374,025 3,374,025 1,189,894 2,184,131
Electoral Commission
Headquarters 10,368,000 12,012,707 12,000,000 12,707
Other Governement Obligation-Contingency 0 1,000,000 500,000 500,000
Other Governement Obligation-Non Road Arrears 0 179,100,000 178,138,999 961,001
TOTAL 10,368,000 192,112,707 190,638,999 1,473,709
Judicial Service (JS)
Gen. Admin 35,683,052 35,683,052 8,009,725 27,673,327
TOTAL 37,946,911 37,946,911 8,009,725 29,937,186
Ministry of Communications (MoC)
India Kofi Annan Centre of Excellence in IC 37,854 37,854 12,840 25,014
Gen. Admin 637,658 601,658 300,259 301,399
Gen. Admin & Finance 16,000 52,000 51,609 391
Ghana Broadcasting Corporation 31,836,413 26,836,413 223,539 26,612,875
Ghana Meteorological Agency 4,317,620 4,317,620 219,077 4,098,543
Human Resource 60,000 60,000 28,550 31,450
Information Service Department 650,811 650,811 377,891 272,920
Internal Audit 43,730 43,730 20,701 23,029
National Information Technology Agency 49,629 49,629 0 49,629
Other Governement Obligation-Contingency 0 5,000,000 4,778,628 221,372
Poastal & Courier Services Regulatory Commission 351,675 351,675 38,717 312,957
PPME 210,525 210,525 39,289 171,236
Research 47,000 47,000 21,940 25,060
TOTAL 38,258,915 38,258,915 6,113,039 32,145,876
Ministry of Chieftaincy and Traditional(MCTA)
Gen. Admin HQ 466,425 466,425 319,626 146,799
National House of Chiefs 199,000 199,000 96,184 102,816
TOTAL 665,425 665,425 415,810 249,615
97

11d.CLASSIFICATION OF EXPENDITURE FOR THE YEAR 2015BY COST CENTRES- GOODS AND SERVICES
ANNUAL REVISED ACTUAL VARIANCE
BUDGET BUDGET
MDAs GH¢ GH¢ GH¢ GH¢
Ministry of Defence (MoD)
Gen. Admin 3,214,250 3,214,250 2,377,282 836,968
Ghana Armed Forces 56,949,107 46,949,107 22,261,805 24,687,302
Other Governement Obligation-Non Road Arrears 0 10,000,000 10,000,000 0
Veterans Association of Ghana 150,200 150,200 0 150,200
TOTAL 60,313,557 60,313,557 34,639,088 25,674,469
Ministry of Education (MOE)
Centre for National Distance Learning and Open Schooling (CENDLOS)698,200 698,200 164,942 533,258
Council for Technical & Vocational Education & Training818,910 818,910 134,958 683,952
Gen. Admin 68,413,421 19,521,329 16,189,967 3,331,362
Ghana Book Development Council 213,000 213,000 37,411 175,589
Ghana Education Service (GES) 535,988,301 537,570,288 36,144,464 501,425,824
Ghana Library Board 910,011 910,011 203,844 706,167
Ghana National Commission for UNESCO 437,000 437,000 119,616 317,384
Human Resource and Development 470,000 470,000 117,637 352,363
Institutions For The Handicapped 390,000 390,000 0 390,000
Internal Audit 200,000 200,000 55,025 144,975
National Council for Curriculum and Assessment 193,280 193,280 35,051 158,229
National Inspectorate Board 700,000 700,000 183,642 516,358
National Service Secretariat 2,923,170 2,923,170 31,015 2,892,155
National Teaching Council 192,600 192,600 5,000 187,600
Non Formal Education 1,514,644 1,514,644 407,777 1,106,867
Office of the Chief Director 170,000 4,170,000 3,983,471 186,529
Office of the Minister 170,000 170,000 46,700 123,300
Other Governement Obligation-Non Road Arrears 0 3,000,000 2,166,005 833,995
Planning Budgeting,Monitoring & Evaluation 1,050,000 1,050,000 200,116 849,884
Regional/District/School Services 81,887,961 81,887,961 21,425 81,866,536
Statistics, Research, Information & Public Relation 400,000 400,000 90,462 309,538
Tertiary 683,707,293 660,750,151 16,432,465 644,317,686
WAEC (National) 21,411,035 15,705,243 15,561,489 143,754
TOTAL 1,402,858,826 1,333,885,788 92,332,482 1,241,553,305
98

11d.CLASSIFICATION OF EXPENDITURE FOR THE YEAR 2015BY COST CENTRES- GOODS AND SERVICES
ANNUAL REVISED ACTUAL VARIANCE
BUDGET BUDGET
MDAs GH¢ GH¢ GH¢ GH¢
Ministry of Employment and Labour(MELR)
Dept. of Co-operatives 334,000 334,000 180,880 153,120
Dept. of Factories Inspectorate 290,000 290,000 177,751 112,249
Fair Wages and Salaries Commission 358,900 358,900 198,813 160,087
Ghana Cooperative Council 100,824 100,824 36,918 63,907
Headquarters 2,082,755 2,082,755 1,807,298 275,457
Integrated Cummunity Centeres For Employable Skill180,150 180,150 110,468 69,682
Labour Department 351,384 351,384 188,105 163,279
Management Development & Productivity Institute (M648,398 648,398 61,785 586,613
National Pension & Regulatory Authority 912,505 912,505 152,468 760,037
National Vocational Training Institute (NVTI) 4,504,628 4,504,628 32,744 4,471,885
Opportunity Industrialisation center 448,347 448,347 80,131 368,216
Other Governement Obligation-Non Road Arrears 0 4,000,000 3,603,914 396,086
Youth Employment Authority 0 8,000,000 7,186,743 813,257
TOTAL 10,211,892 22,211,892 13,818,017 8,393,874
Ministry of Energy and Petroleum (MENP)
Energy Commision 186,918 186,918 80,753 106,165
Headquarters. 16,136,248 16,136,248 3,880,609 12,255,639
TOTAL 16,323,166 16,323,166 3,961,362 12,361,804
Ministry of Environment Science,(MESTI)
MESTI Headquaters 18,813,253 18,813,253 406,962 18,406,291
Council for Scientific and Industrial Research (C. 5,732,703 5,732,703 1,305,625 4,427,078
Environmental Protection Agency 2,445,462 24,555,772 22,617,295 1,938,477
Ghana Atomic Energy Commission (G.A.E.C) 2,275,123 2,275,123 506,226 1,768,897
Headquaters 2,695,786 2,695,786 1,979,292 716,494MESTI Headquaters 100,000 100,000 0 100,000Other Governement Obligation-Non Road Arrears 0 1,000 466 534School of Nuclear and Allied Sciences 403,740 402,740 0 402,740Town and Country Planning Department (T.C.P.D) 610,000 610,000 359,712 250,288TOTAL 33,076,067 55,186,377 27,175,577 28,010,800Ministry of Finance (MoF)Controller and Acct. General's Dept. 16,990,271 186,990,271 184,404,157 2,586,114Finance Headquarters 10,715,927 23,105,792 16,132,376 6,973,416Financial Intelligence Centre 736,520 736,520 736,520 0Ghana Revenue Authority 43,150,000 33,650,000 0 33,650,000Institute of Accountancy Training 332,507 332,507 241,925 90,582Other Governement Obligation-Contingency 0 6,000,000 5,926,734 73,266Other Governement Obligation-Non Road Arrears 0 210,000,000 206,229,941 3,770,059Public Procurement Authority 1,608,205 2,108,205 1,761,277 346,928Securities and Exchange Commission 2,470,462 2,470,462 138,483 2,331,978Statistical Service 2,982,760 2,982,760 974,076 2,008,684Other Governement Obligation-General Government Services0 3,000,000 2,705,265 294,735TOTAL 78,986,652 471,376,517 419,250,754 52,125,763
99
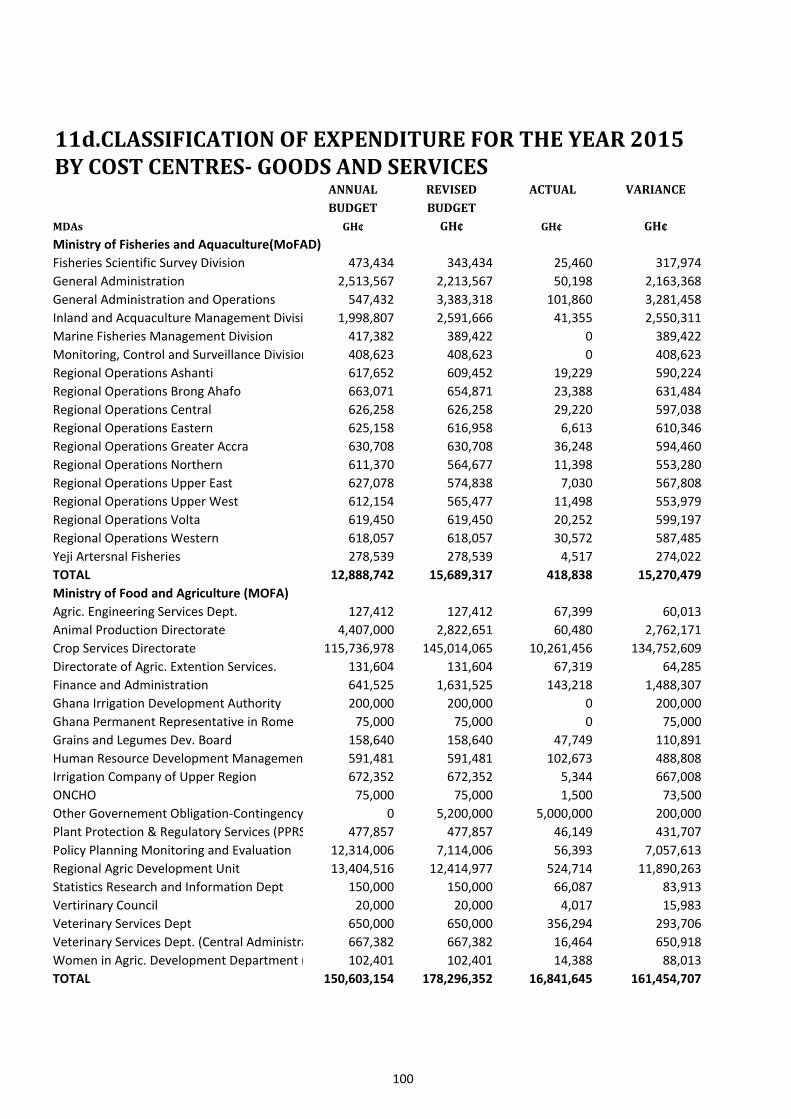
11d.CLASSIFICATION OF EXPENDITURE FOR THE YEAR 2015BY COST CENTRES- GOODS AND SERVICES
ANNUAL REVISED ACTUAL VARIANCE
BUDGET BUDGET
MDAs GH¢ GH¢ GH¢ GH¢
Ministry of Fisheries and Aquaculture(MoFAD)
Fisheries Scientific Survey Division 473,434 343,434 25,460 317,974
General Administration 2,513,567 2,213,567 50,198 2,163,368
General Administration and Operations 547,432 3,383,318 101,860 3,281,458
Inland and Acquaculture Management Division 1,998,807 2,591,666 41,355 2,550,311
Marine Fisheries Management Division 417,382 389,422 0 389,422
Monitoring, Control and Surveillance Division 408,623 408,623 0 408,623
Regional Operations Ashanti 617,652 609,452 19,229 590,224
Regional Operations Brong Ahafo 663,071 654,871 23,388 631,484
Regional Operations Central 626,258 626,258 29,220 597,038
Regional Operations Eastern 625,158 616,958 6,613 610,346
Regional Operations Greater Accra 630,708 630,708 36,248 594,460
Regional Operations Northern 611,370 564,677 11,398 553,280
Regional Operations Upper East 627,078 574,838 7,030 567,808
Regional Operations Upper West 612,154 565,477 11,498 553,979
Regional Operations Volta 619,450 619,450 20,252 599,197
Regional Operations Western 618,057 618,057 30,572 587,485
Yeji Artersnal Fisheries 278,539 278,539 4,517 274,022
TOTAL 12,888,742 15,689,317 418,838 15,270,479
Ministry of Food and Agriculture (MOFA)
Agric. Engineering Services Dept. 127,412 127,412 67,399 60,013
Animal Production Directorate 4,407,000 2,822,651 60,480 2,762,171
Crop Services Directorate 115,736,978 145,014,065 10,261,456 134,752,609
Directorate of Agric. Extention Services. 131,604 131,604 67,319 64,285
Finance and Administration 641,525 1,631,525 143,218 1,488,307
Ghana Irrigation Development Authority 200,000 200,000 0 200,000
Ghana Permanent Representative in Rome 75,000 75,000 0 75,000
Grains and Legumes Dev. Board 158,640 158,640 47,749 110,891
Human Resource Development Management 591,481 591,481 102,673 488,808
Irrigation Company of Upper Region 672,352 672,352 5,344 667,008
ONCHO 75,000 75,000 1,500 73,500
Other Governement Obligation-Contingency 0 5,200,000 5,000,000 200,000
Plant Protection & Regulatory Services (PPRS) 477,857 477,857 46,149 431,707
Policy Planning Monitoring and Evaluation 12,314,006 7,114,006 56,393 7,057,613
Regional Agric Development Unit 13,404,516 12,414,977 524,714 11,890,263
Statistics Research and Information Dept 150,000 150,000 66,087 83,913
Vertirinary Council 20,000 20,000 4,017 15,983
Veterinary Services Dept 650,000 650,000 356,294 293,706
Veterinary Services Dept. (Central Administration) 667,382 667,382 16,464 650,918
Women in Agric. Development Department (WIAD) 102,401 102,401 14,388 88,013
TOTAL 150,603,154 178,296,352 16,841,645 161,454,707
100
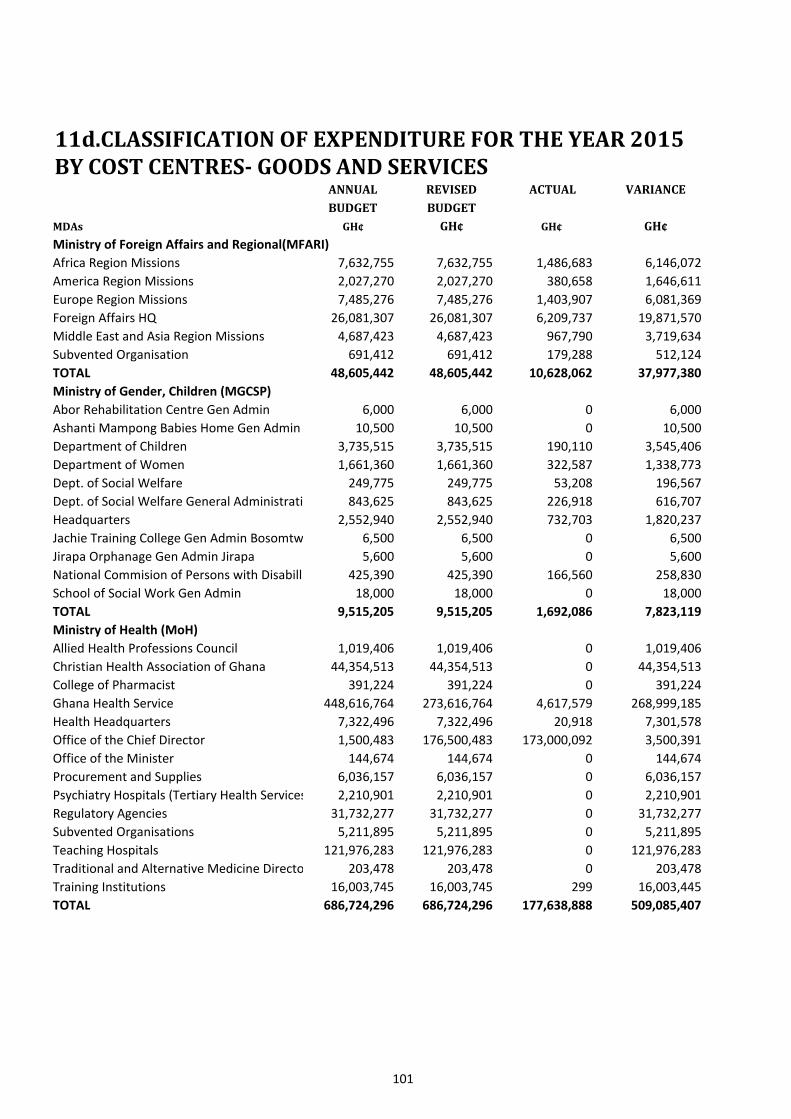
11d.CLASSIFICATION OF EXPENDITURE FOR THE YEAR 2015BY COST CENTRES- GOODS AND SERVICES
ANNUAL REVISED ACTUAL VARIANCE
BUDGET BUDGET
MDAs GH¢ GH¢ GH¢ GH¢
Ministry of Foreign Affairs and Regional(MFARI)
Africa Region Missions 7,632,755 7,632,755 1,486,683 6,146,072
America Region Missions 2,027,270 2,027,270 380,658 1,646,611
Europe Region Missions 7,485,276 7,485,276 1,403,907 6,081,369
Foreign Affairs HQ 26,081,307 26,081,307 6,209,737 19,871,570
Middle East and Asia Region Missions 4,687,423 4,687,423 967,790 3,719,634
Subvented Organisation 691,412 691,412 179,288 512,124
TOTAL 48,605,442 48,605,442 10,628,062 37,977,380
Ministry of Gender, Children (MGCSP)
Abor Rehabilitation Centre Gen Admin 6,000 6,000 0 6,000
Ashanti Mampong Babies Home Gen Admin 10,500 10,500 0 10,500
Department of Children 3,735,515 3,735,515 190,110 3,545,406
Department of Women 1,661,360 1,661,360 322,587 1,338,773
Dept. of Social Welfare 249,775 249,775 53,208 196,567
Dept. of Social Welfare General Administration, Budget and Planning843,625 843,625 226,918 616,707
Headquarters 2,552,940 2,552,940 732,703 1,820,237
Jachie Training College Gen Admin Bosomtwe 6,500 6,500 0 6,500
Jirapa Orphanage Gen Admin Jirapa 5,600 5,600 0 5,600
National Commision of Persons with Disabillity General Administration425,390 425,390 166,560 258,830
School of Social Work Gen Admin 18,000 18,000 0 18,000
TOTAL 9,515,205 9,515,205 1,692,086 7,823,119
Ministry of Health (MoH)
Allied Health Professions Council 1,019,406 1,019,406 0 1,019,406
Christian Health Association of Ghana 44,354,513 44,354,513 0 44,354,513
College of Pharmacist 391,224 391,224 0 391,224
Ghana Health Service 448,616,764 273,616,764 4,617,579 268,999,185
Health Headquarters 7,322,496 7,322,496 20,918 7,301,578
Office of the Chief Director 1,500,483 176,500,483 173,000,092 3,500,391
Office of the Minister 144,674 144,674 0 144,674
Procurement and Supplies 6,036,157 6,036,157 0 6,036,157
Psychiatry Hospitals (Tertiary Health Services) 2,210,901 2,210,901 0 2,210,901
Regulatory Agencies 31,732,277 31,732,277 0 31,732,277
Subvented Organisations 5,211,895 5,211,895 0 5,211,895
Teaching Hospitals 121,976,283 121,976,283 0 121,976,283
Traditional and Alternative Medicine Directorate 203,478 203,478 0 203,478
Training Institutions 16,003,745 16,003,745 299 16,003,445
TOTAL 686,724,296 686,724,296 177,638,888 509,085,407
101
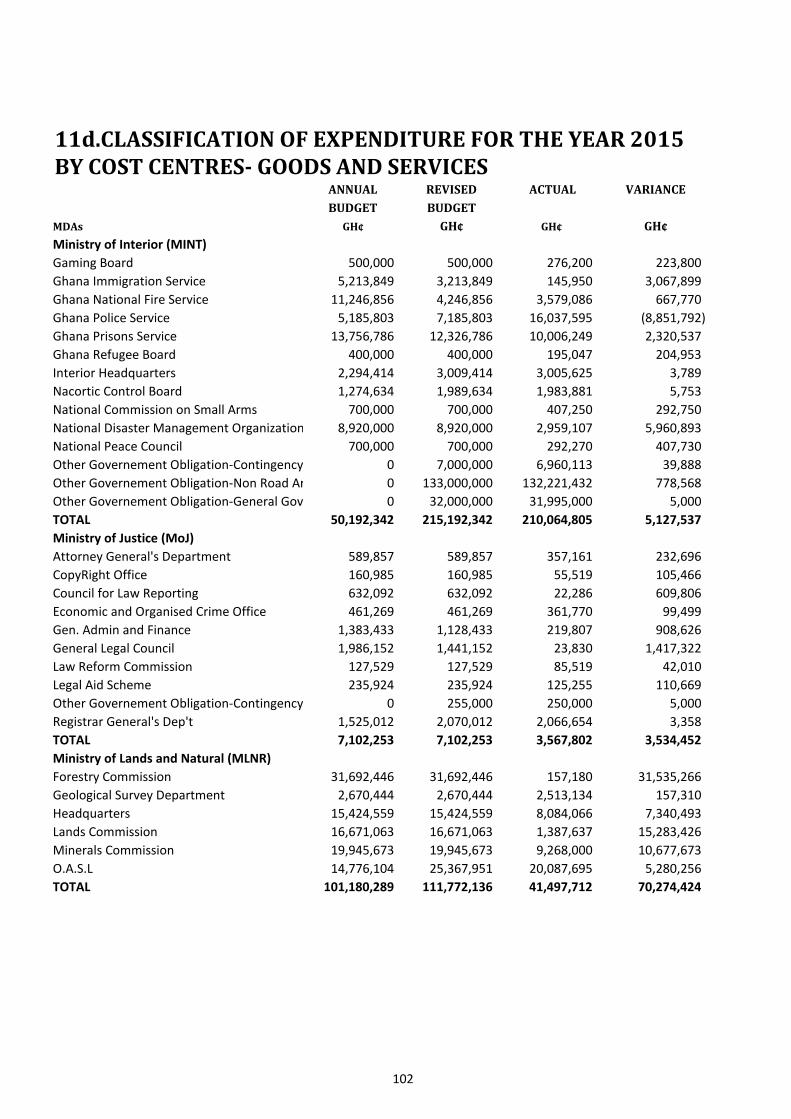
11d.CLASSIFICATION OF EXPENDITURE FOR THE YEAR 2015BY COST CENTRES- GOODS AND SERVICES
ANNUAL REVISED ACTUAL VARIANCE
BUDGET BUDGET
MDAs GH¢ GH¢ GH¢ GH¢
Ministry of Interior (MINT)
Gaming Board 500,000 500,000 276,200 223,800
Ghana Immigration Service 5,213,849 3,213,849 145,950 3,067,899
Ghana National Fire Service 11,246,856 4,246,856 3,579,086 667,770
Ghana Police Service 5,185,803 7,185,803 16,037,595 (8,851,792)
Ghana Prisons Service 13,756,786 12,326,786 10,006,249 2,320,537
Ghana Refugee Board 400,000 400,000 195,047 204,953
Interior Headquarters 2,294,414 3,009,414 3,005,625 3,789
Nacortic Control Board 1,274,634 1,989,634 1,983,881 5,753
National Commission on Small Arms 700,000 700,000 407,250 292,750
National Disaster Management Organization 8,920,000 8,920,000 2,959,107 5,960,893
National Peace Council 700,000 700,000 292,270 407,730
Other Governement Obligation-Contingency 0 7,000,000 6,960,113 39,888
Other Governement Obligation-Non Road Arrears 0 133,000,000 132,221,432 778,568
Other Governement Obligation-General Government Services0 32,000,000 31,995,000 5,000
TOTAL 50,192,342 215,192,342 210,064,805 5,127,537
Ministry of Justice (MoJ)
Attorney General's Department 589,857 589,857 357,161 232,696
CopyRight Office 160,985 160,985 55,519 105,466
Council for Law Reporting 632,092 632,092 22,286 609,806
Economic and Organised Crime Office 461,269 461,269 361,770 99,499
Gen. Admin and Finance 1,383,433 1,128,433 219,807 908,626
General Legal Council 1,986,152 1,441,152 23,830 1,417,322
Law Reform Commission 127,529 127,529 85,519 42,010
Legal Aid Scheme 235,924 235,924 125,255 110,669
Other Governement Obligation-Contingency 0 255,000 250,000 5,000
Registrar General's Dep't 1,525,012 2,070,012 2,066,654 3,358
TOTAL 7,102,253 7,102,253 3,567,802 3,534,452
Ministry of Lands and Natural (MLNR)
Forestry Commission 31,692,446 31,692,446 157,180 31,535,266
Geological Survey Department 2,670,444 2,670,444 2,513,134 157,310
Headquarters 15,424,559 15,424,559 8,084,066 7,340,493
Lands Commission 16,671,063 16,671,063 1,387,637 15,283,426
Minerals Commission 19,945,673 19,945,673 9,268,000 10,677,673
O.A.S.L 14,776,104 25,367,951 20,087,695 5,280,256
TOTAL 101,180,289 111,772,136 41,497,712 70,274,424
102
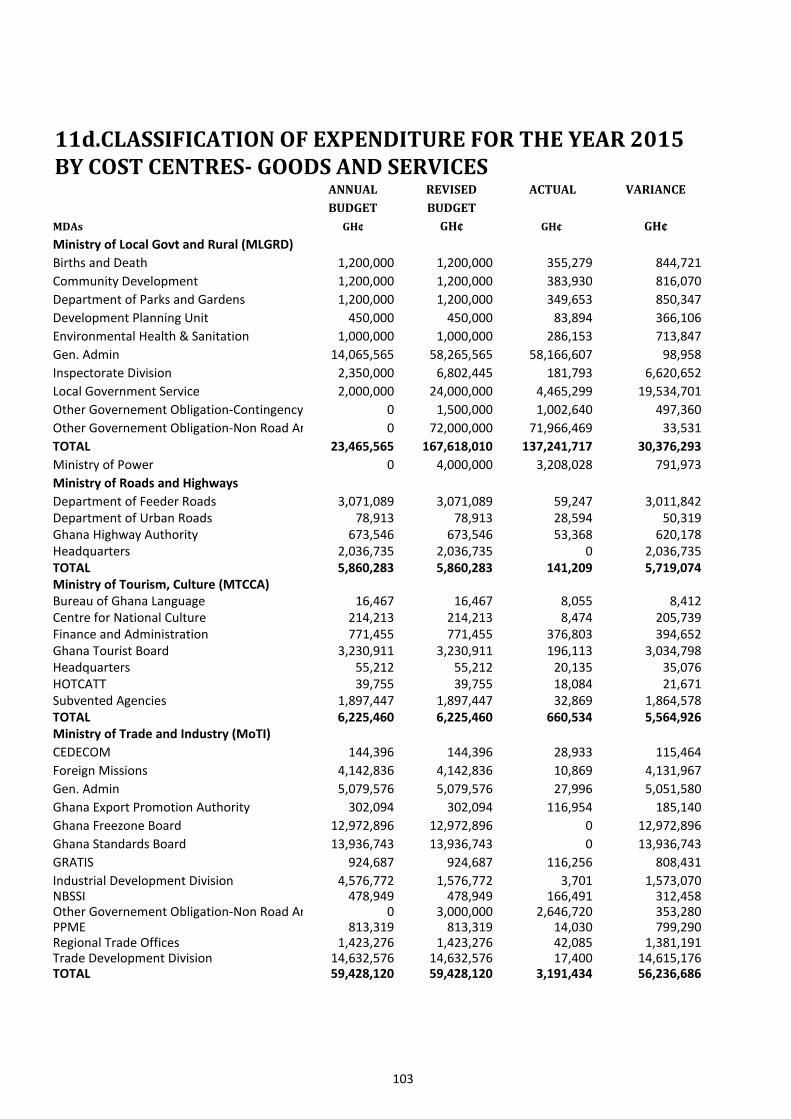
11d.CLASSIFICATION OF EXPENDITURE FOR THE YEAR 2015BY COST CENTRES- GOODS AND SERVICES
ANNUAL REVISED ACTUAL VARIANCE
BUDGET BUDGET
MDAs GH¢ GH¢ GH¢ GH¢
Ministry of Local Govt and Rural (MLGRD)
Births and Death 1,200,000 1,200,000 355,279 844,721
Community Development 1,200,000 1,200,000 383,930 816,070
Department of Parks and Gardens 1,200,000 1,200,000 349,653 850,347
Development Planning Unit 450,000 450,000 83,894 366,106
Environmental Health & Sanitation 1,000,000 1,000,000 286,153 713,847
Gen. Admin 14,065,565 58,265,565 58,166,607 98,958
Inspectorate Division 2,350,000 6,802,445 181,793 6,620,652
Local Government Service 2,000,000 24,000,000 4,465,299 19,534,701
Other Governement Obligation-Contingency 0 1,500,000 1,002,640 497,360
Other Governement Obligation-Non Road Arrears 0 72,000,000 71,966,469 33,531
TOTAL 23,465,565 167,618,010 137,241,717 30,376,293
Ministry of Power 0 4,000,000 3,208,028 791,973
Ministry of Roads and Highways
Department of Feeder Roads 3,071,089 3,071,089 59,247 3,011,842Department of Urban Roads 78,913 78,913 28,594 50,319Ghana Highway Authority 673,546 673,546 53,368 620,178Headquarters 2,036,735 2,036,735 0 2,036,735TOTAL 5,860,283 5,860,283 141,209 5,719,074Ministry of Tourism, Culture (MTCCA)Bureau of Ghana Language 16,467 16,467 8,055 8,412Centre for National Culture 214,213 214,213 8,474 205,739Finance and Administration 771,455 771,455 376,803 394,652Ghana Tourist Board 3,230,911 3,230,911 196,113 3,034,798Headquarters 55,212 55,212 20,135 35,076HOTCATT 39,755 39,755 18,084 21,671Subvented Agencies 1,897,447 1,897,447 32,869 1,864,578TOTAL 6,225,460 6,225,460 660,534 5,564,926Ministry of Trade and Industry (MoTI)
CEDECOM 144,396 144,396 28,933 115,464
Foreign Missions 4,142,836 4,142,836 10,869 4,131,967
Gen. Admin 5,079,576 5,079,576 27,996 5,051,580
Ghana Export Promotion Authority 302,094 302,094 116,954 185,140
Ghana Freezone Board 12,972,896 12,972,896 0 12,972,896
Ghana Standards Board 13,936,743 13,936,743 0 13,936,743
GRATIS 924,687 924,687 116,256 808,431
Industrial Development Division 4,576,772 1,576,772 3,701 1,573,070NBSSI 478,949 478,949 166,491 312,458Other Governement Obligation-Non Road Arrears 0 3,000,000 2,646,720 353,280PPME 813,319 813,319 14,030 799,290Regional Trade Offices 1,423,276 1,423,276 42,085 1,381,191Trade Development Division 14,632,576 14,632,576 17,400 14,615,176TOTAL 59,428,120 59,428,120 3,191,434 56,236,686
103
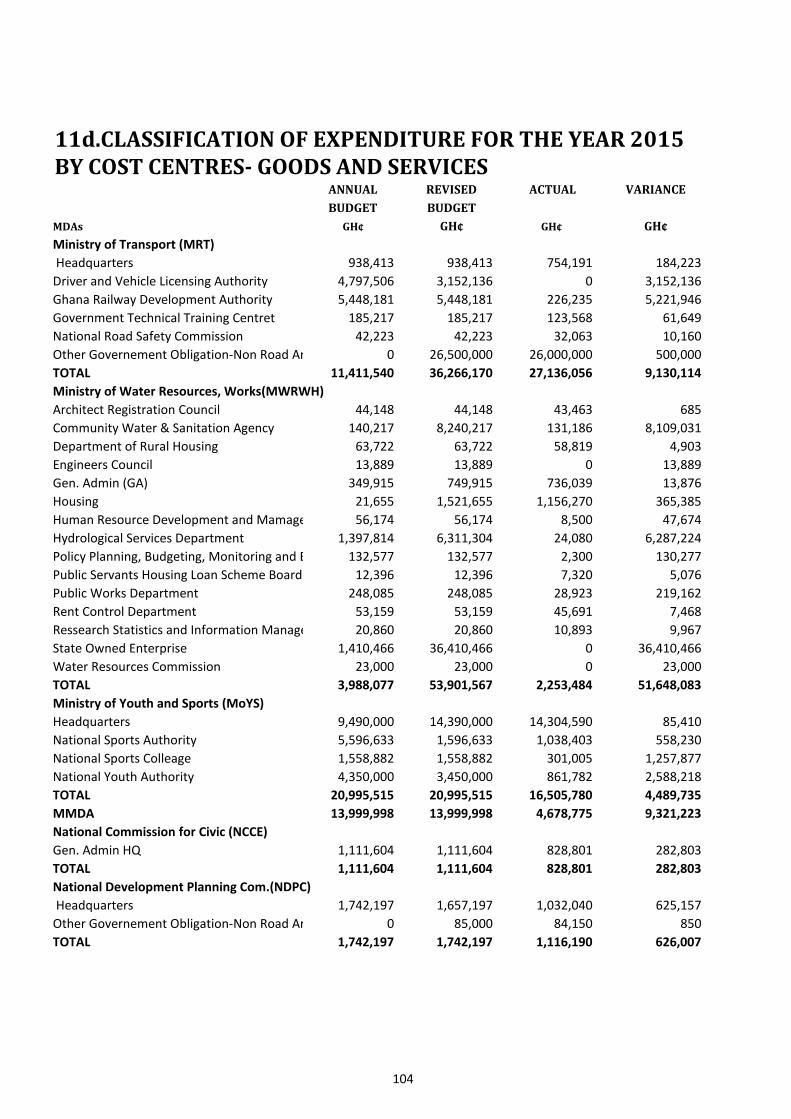
11d.CLASSIFICATION OF EXPENDITURE FOR THE YEAR 2015BY COST CENTRES- GOODS AND SERVICES
ANNUAL REVISED ACTUAL VARIANCE
BUDGET BUDGET
MDAs GH¢ GH¢ GH¢ GH¢
Ministry of Transport (MRT)
Headquarters 938,413 938,413 754,191 184,223
Driver and Vehicle Licensing Authority 4,797,506 3,152,136 0 3,152,136
Ghana Railway Development Authority 5,448,181 5,448,181 226,235 5,221,946
Government Technical Training Centret 185,217 185,217 123,568 61,649
National Road Safety Commission 42,223 42,223 32,063 10,160
Other Governement Obligation-Non Road Arrears 0 26,500,000 26,000,000 500,000
TOTAL 11,411,540 36,266,170 27,136,056 9,130,114
Ministry of Water Resources, Works(MWRWH)
Architect Registration Council 44,148 44,148 43,463 685
Community Water & Sanitation Agency 140,217 8,240,217 131,186 8,109,031
Department of Rural Housing 63,722 63,722 58,819 4,903
Engineers Council 13,889 13,889 0 13,889
Gen. Admin (GA) 349,915 749,915 736,039 13,876
Housing 21,655 1,521,655 1,156,270 365,385
Human Resource Development and Mamagement (HRDM)56,174 56,174 8,500 47,674
Hydrological Services Department 1,397,814 6,311,304 24,080 6,287,224
Policy Planning, Budgeting, Monitoring and Evaluation (PPMBE)132,577 132,577 2,300 130,277
Public Servants Housing Loan Scheme Board 12,396 12,396 7,320 5,076
Public Works Department 248,085 248,085 28,923 219,162
Rent Control Department 53,159 53,159 45,691 7,468
Ressearch Statistics and Information Management (RSIM)20,860 20,860 10,893 9,967
State Owned Enterprise 1,410,466 36,410,466 0 36,410,466
Water Resources Commission 23,000 23,000 0 23,000
TOTAL 3,988,077 53,901,567 2,253,484 51,648,083
Ministry of Youth and Sports (MoYS)
Headquarters 9,490,000 14,390,000 14,304,590 85,410
National Sports Authority 5,596,633 1,596,633 1,038,403 558,230
National Sports Colleage 1,558,882 1,558,882 301,005 1,257,877
National Youth Authority 4,350,000 3,450,000 861,782 2,588,218
TOTAL 20,995,515 20,995,515 16,505,780 4,489,735
MMDA 13,999,998 13,999,998 4,678,775 9,321,223
National Commission for Civic (NCCE)
Gen. Admin HQ 1,111,604 1,111,604 828,801 282,803
TOTAL 1,111,604 1,111,604 828,801 282,803
National Development Planning Com.(NDPC)
Headquarters 1,742,197 1,657,197 1,032,040 625,157
Other Governement Obligation-Non Road Arrears 0 85,000 84,150 850
TOTAL 1,742,197 1,742,197 1,116,190 626,007
104
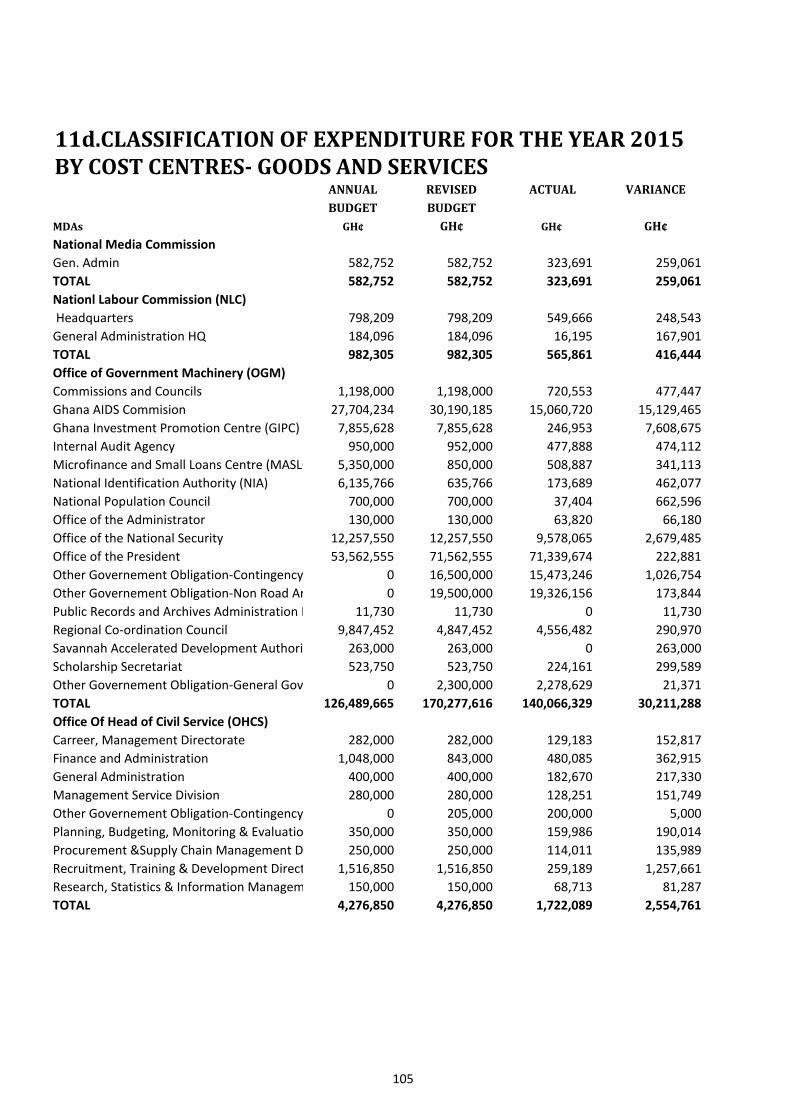
11d.CLASSIFICATION OF EXPENDITURE FOR THE YEAR 2015BY COST CENTRES- GOODS AND SERVICES
ANNUAL REVISED ACTUAL VARIANCE
BUDGET BUDGET
MDAs GH¢ GH¢ GH¢ GH¢
National Media Commission
Gen. Admin 582,752 582,752 323,691 259,061
TOTAL 582,752 582,752 323,691 259,061
Nationl Labour Commission (NLC)
Headquarters 798,209 798,209 549,666 248,543
General Administration HQ 184,096 184,096 16,195 167,901
TOTAL 982,305 982,305 565,861 416,444
Office of Government Machinery (OGM)
Commissions and Councils 1,198,000 1,198,000 720,553 477,447
Ghana AIDS Commision 27,704,234 30,190,185 15,060,720 15,129,465
Ghana Investment Promotion Centre (GIPC) 7,855,628 7,855,628 246,953 7,608,675
Internal Audit Agency 950,000 952,000 477,888 474,112
Microfinance and Small Loans Centre (MASLOC) 5,350,000 850,000 508,887 341,113
National Identification Authority (NIA) 6,135,766 635,766 173,689 462,077
National Population Council 700,000 700,000 37,404 662,596
Office of the Administrator 130,000 130,000 63,820 66,180
Office of the National Security 12,257,550 12,257,550 9,578,065 2,679,485
Office of the President 53,562,555 71,562,555 71,339,674 222,881
Other Governement Obligation-Contingency 0 16,500,000 15,473,246 1,026,754
Other Governement Obligation-Non Road Arrears 0 19,500,000 19,326,156 173,844
Public Records and Archives Administration Departm 11,730 11,730 0 11,730
Regional Co-ordination Council 9,847,452 4,847,452 4,556,482 290,970
Savannah Accelerated Development Authority (SADA)263,000 263,000 0 263,000
Scholarship Secretariat 523,750 523,750 224,161 299,589
Other Governement Obligation-General Government Services0 2,300,000 2,278,629 21,371
TOTAL 126,489,665 170,277,616 140,066,329 30,211,288
Office Of Head of Civil Service (OHCS)
Carreer, Management Directorate 282,000 282,000 129,183 152,817
Finance and Administration 1,048,000 843,000 480,085 362,915
General Administration 400,000 400,000 182,670 217,330
Management Service Division 280,000 280,000 128,251 151,749
Other Governement Obligation-Contingency 0 205,000 200,000 5,000
Planning, Budgeting, Monitoring & Evaluation 350,000 350,000 159,986 190,014
Procurement &Supply Chain Management Dpt 250,000 250,000 114,011 135,989
Recruitment, Training & Development Directorate 1,516,850 1,516,850 259,189 1,257,661
Research, Statistics & Information Management Directorate150,000 150,000 68,713 81,287
TOTAL 4,276,850 4,276,850 1,722,089 2,554,761
105

11d.CLASSIFICATION OF EXPENDITURE FOR THE YEAR 2015BY COST CENTRES- GOODS AND SERVICES
ANNUAL REVISED ACTUAL VARIANCE
BUDGET BUDGET
MDAs GH¢ GH¢ GH¢ GH¢
Other Governement Obligation (OGO)
GET Fund 0 9,300,845 0 9,300,845
Lifeline Consumers of Electricity 60,754,863 15,754,863 12,037,199 3,717,664
Transfer To Ghana National Petroleum 697,688,578 3,954,778 0 3,954,778
Utility 91,794,703 91,794,703 0 91,794,703
General Government Services 399,754,918 30,005,741 0 30,005,741
Debt Management 0 160,000,000 156,450,762 3,549,238
TOTAL 1,249,993,062 310,810,930 168,487,962 142,322,969
Parliament of Ghana
Bills and Procedural Services 8,911,569 7,311,569 6,588,795 722,774
Corporate Services 7,693,696 7,896,496 5,857,180 2,039,316
Finance and Administration 2,687,226 2,687,226 2,547,256 139,970
General Operations 2,372,844 3,972,844 3,922,022 50,822
Library, Research and Information Services 4,740,627 4,740,627 4,324,052 416,575
Parliamentary Committees 11,032,886 11,032,886 1,637,578 9,395,309
TOTAL 37,438,848 37,641,648 24,876,883 12,764,765
Public Services Commission
Office of the Executive Secretary 10,255,927 10,255,927 7,187,667 3,068,260
TOTAL 10,255,927 10,255,927 7,187,667 3,068,260
Virtual Ministries for Centralised Transactions
Contingency 171,037,669 52,094,149 0 52,094,149
DACF-OGO 0 123,127,292 86,202,220 36,925,072
TOTAL 171,037,669 175,221,441 86,202,220 89,019,220
Grand Total 4,523,265,030 4,600,535,450 1,896,174,688 2,704,360,761
106

11e. CLASSIFICATION OF EXPENDITUREBY COST CENTRES- SOCIAL BENEFITS
ANNUAL REVISED ACTUAL VARIANCE
BUDGET BUDGET
MDAs GH¢ GH¢ GH¢ GH¢
CHRAJ (CHRAJ)
Anti Corruption Departmen 0 20,000 16,177 3,823
TOTAL 0 20,000 16,177 3,823
Electoral Commission
Headquarters 126,500 106,500 0 106,500
TOTAL 126,500 106,500 0 106,500
Judicial Service (JS)
Gen. Admin 1,649,100 2,149,100 2,128,837 20,263
TOTAL 1,649,100 2,149,100 2,128,837 20,263
Ministry of Defence (MoD)
Gen. Admin 162,000 162,000 161,697 303
Ghana Armed Forces 1,220,493 720,493 139,652 580,841
TOTAL 1,382,493 882,493 301,349 581,144
Ministry of Education (MOE)
Centre for National Distance Learning and Open Schooling (CENDLOS)7,000 12,000 10,941 1,059
Council for Technical & Vocational Education & Training 24,000 19,000 6,756 12,244
Gen. Admin 7,199 37,199 30,087 7,112
Ghana Book Development Council 12,000 12,000 0 12,000
Ghana Library Board 35,602 35,602 0 35,602
Ghana National Commission for UNESCO 13,000 13,000 3,576 9,424
Human Resource and Development 160,000 130,000 15,429 114,571
National Council for Curriculum and Assessment 6,720 6,720 0 6,720
National Teaching Council 7,400 7,400 0 7,400
Non Formal Education 20,656 20,656 0 20,656
TOTAL 293,577 293,577 66,790 226,787
Ministry of Employment and Labour Relations (MELR)
Headquarters 0 3,000,000 2,986,860 13,140
Management Development & Productivity Institute (M 246,506 246,506 0 246,506
TOTAL 246,506 3,246,506 2,986,860 259,646
Ministry of Environment Science,(MESTI)
Environmental Protection Agency 3,741,393 1,181,393 827,528 353,865
Ghana Atomic Energy Commission (G.A.E.C) 262,308 262,308 0 262,308
TOTAL 4,003,701 1,443,701 827,528 616,173
Ministry of Finance (MoF)
Finance Headquarters 0 100,000 96,895 3,105
Ghana Revenue Authority 3,500,000 0 0 0
Securities and Exchange Commission 0 70,000 67,712 2,288
Statistical Service 137,550 137,550 11,350 126,200
TOTAL 3,637,550 307,550 175,957 131,593
107
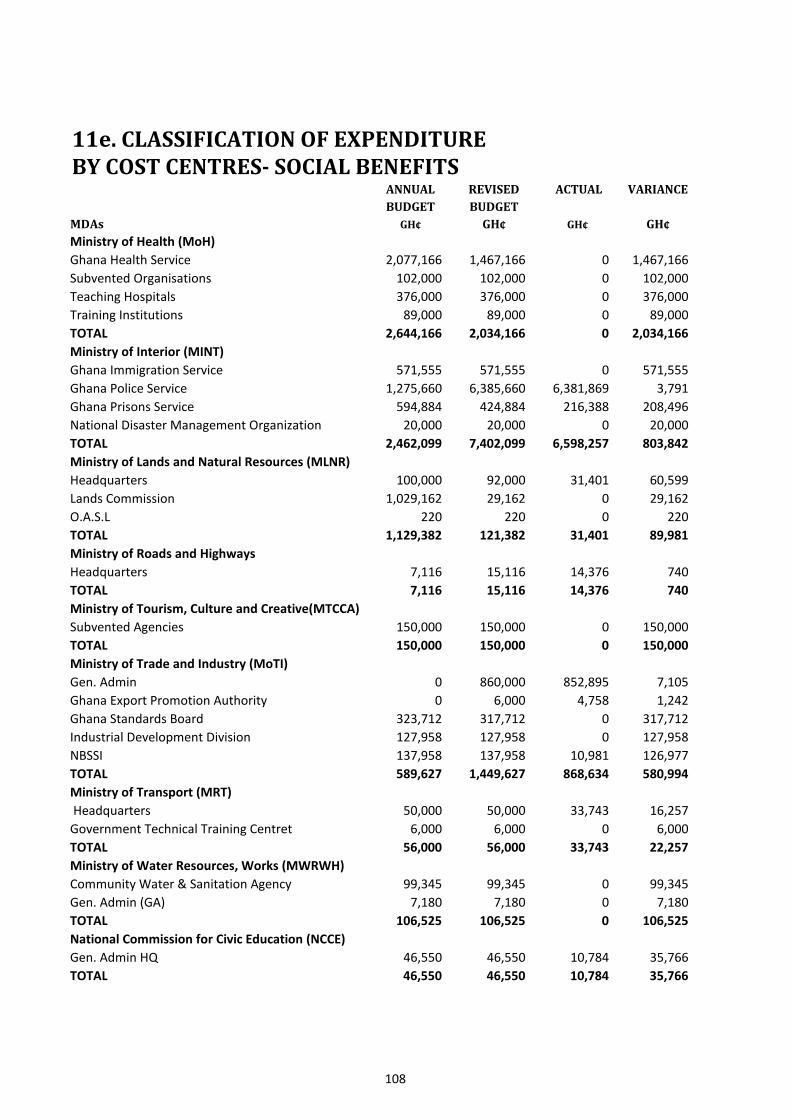
11e. CLASSIFICATION OF EXPENDITUREBY COST CENTRES- SOCIAL BENEFITS
ANNUAL REVISED ACTUAL VARIANCE
BUDGET BUDGET
MDAs GH¢ GH¢ GH¢ GH¢
Ministry of Health (MoH)
Ghana Health Service 2,077,166 1,467,166 0 1,467,166
Subvented Organisations 102,000 102,000 0 102,000
Teaching Hospitals 376,000 376,000 0 376,000
Training Institutions 89,000 89,000 0 89,000
TOTAL 2,644,166 2,034,166 0 2,034,166
Ministry of Interior (MINT)
Ghana Immigration Service 571,555 571,555 0 571,555
Ghana Police Service 1,275,660 6,385,660 6,381,869 3,791
Ghana Prisons Service 594,884 424,884 216,388 208,496
National Disaster Management Organization 20,000 20,000 0 20,000
TOTAL 2,462,099 7,402,099 6,598,257 803,842
Ministry of Lands and Natural Resources (MLNR)
Headquarters 100,000 92,000 31,401 60,599
Lands Commission 1,029,162 29,162 0 29,162
O.A.S.L 220 220 0 220
TOTAL 1,129,382 121,382 31,401 89,981
Ministry of Roads and Highways
Headquarters 7,116 15,116 14,376 740
TOTAL 7,116 15,116 14,376 740
Ministry of Tourism, Culture and Creative(MTCCA)
Subvented Agencies 150,000 150,000 0 150,000
TOTAL 150,000 150,000 0 150,000
Ministry of Trade and Industry (MoTI)
Gen. Admin 0 860,000 852,895 7,105
Ghana Export Promotion Authority 0 6,000 4,758 1,242
Ghana Standards Board 323,712 317,712 0 317,712
Industrial Development Division 127,958 127,958 0 127,958
NBSSI 137,958 137,958 10,981 126,977
TOTAL 589,627 1,449,627 868,634 580,994
Ministry of Transport (MRT)
Headquarters 50,000 50,000 33,743 16,257
Government Technical Training Centret 6,000 6,000 0 6,000
TOTAL 56,000 56,000 33,743 22,257
Ministry of Water Resources, Works (MWRWH)
Community Water & Sanitation Agency 99,345 99,345 0 99,345
Gen. Admin (GA) 7,180 7,180 0 7,180
TOTAL 106,525 106,525 0 106,525
National Commission for Civic Education (NCCE)
Gen. Admin HQ 46,550 46,550 10,784 35,766
TOTAL 46,550 46,550 10,784 35,766
108

11e. CLASSIFICATION OF EXPENDITUREBY COST CENTRES- SOCIAL BENEFITS
ANNUAL REVISED ACTUAL VARIANCE
BUDGET BUDGET
MDAs GH¢ GH¢ GH¢ GH¢
National Development Planning Commission (NDPC)
Headquarters 30,000 15,500 15,235 265
TOTAL 30,000 15,500 15,235 265
National Media Commission
Gen. Admin 20,000 23,000 22,807 193
TOTAL 20,000 23,000 22,807 193
Nationl Labour Commission (NLC)
Headquarters 23,520 23,520 21,600 1,920
TOTAL 23,520 23,520 21,600 1,920
Office of Government Machinery (OGM)
Commissions and Councils 2,000 5,000 4,920 80
National Identification Authority (NIA) 0 8,500 8,480 20
TOTAL 2,000 13,500 13,400 100
Parliament of Ghana
Corporate Services 1,343,023 43,023 15,042 27,981
TOTAL 1,343,023 43,023 15,042 27,981
Grand Total 19,949,436 19,949,436 14,148,777 5,800,659
109
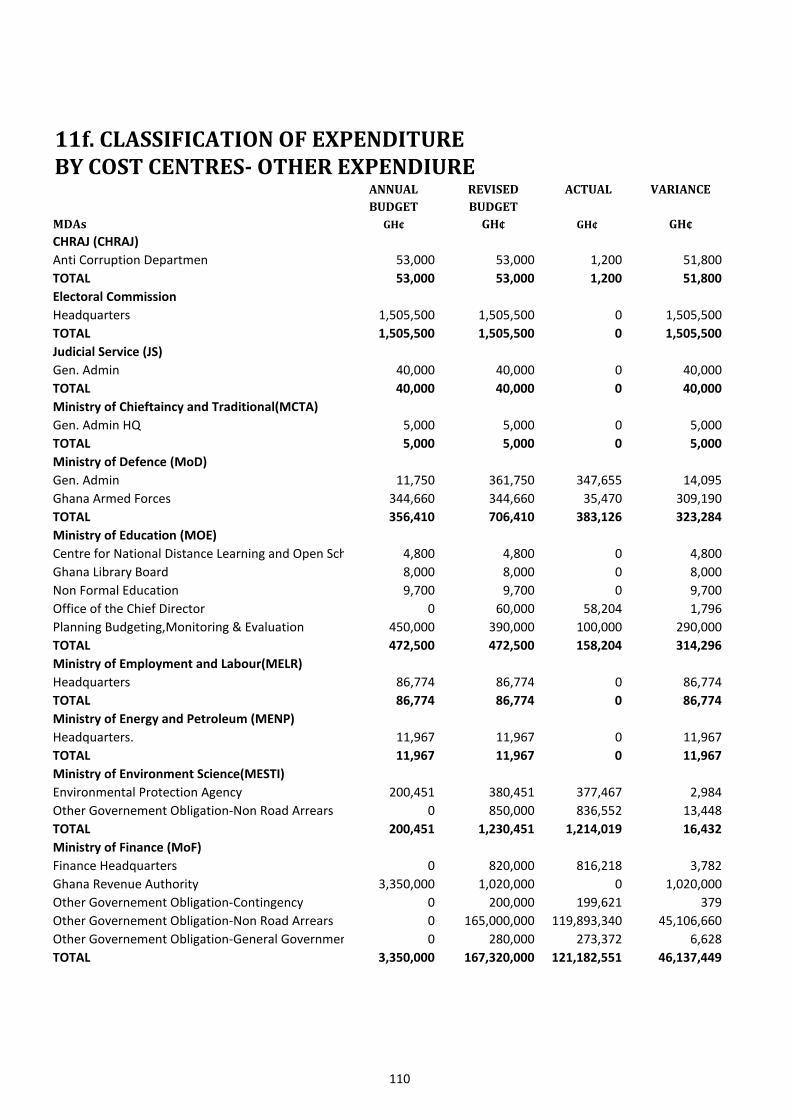
11f. CLASSIFICATION OF EXPENDITUREBY COST CENTRES- OTHER EXPENDIURE
ANNUAL REVISED ACTUAL VARIANCE
BUDGET BUDGET
MDAs GH¢ GH¢ GH¢ GH¢
CHRAJ (CHRAJ)
Anti Corruption Departmen 53,000 53,000 1,200 51,800
TOTAL 53,000 53,000 1,200 51,800
Electoral Commission
Headquarters 1,505,500 1,505,500 0 1,505,500
TOTAL 1,505,500 1,505,500 0 1,505,500
Judicial Service (JS)
Gen. Admin 40,000 40,000 0 40,000
TOTAL 40,000 40,000 0 40,000
Ministry of Chieftaincy and Traditional(MCTA)
Gen. Admin HQ 5,000 5,000 0 5,000
TOTAL 5,000 5,000 0 5,000
Ministry of Defence (MoD)
Gen. Admin 11,750 361,750 347,655 14,095
Ghana Armed Forces 344,660 344,660 35,470 309,190
TOTAL 356,410 706,410 383,126 323,284
Ministry of Education (MOE)
Centre for National Distance Learning and Open Schooling (CENDLOS)4,800 4,800 0 4,800
Ghana Library Board 8,000 8,000 0 8,000
Non Formal Education 9,700 9,700 0 9,700
Office of the Chief Director 0 60,000 58,204 1,796
Planning Budgeting,Monitoring & Evaluation 450,000 390,000 100,000 290,000
TOTAL 472,500 472,500 158,204 314,296
Ministry of Employment and Labour(MELR)
Headquarters 86,774 86,774 0 86,774
TOTAL 86,774 86,774 0 86,774
Ministry of Energy and Petroleum (MENP)
Headquarters. 11,967 11,967 0 11,967
TOTAL 11,967 11,967 0 11,967
Ministry of Environment Science(MESTI)
Environmental Protection Agency 200,451 380,451 377,467 2,984
Other Governement Obligation-Non Road Arrears 0 850,000 836,552 13,448
TOTAL 200,451 1,230,451 1,214,019 16,432
Ministry of Finance (MoF)
Finance Headquarters 0 820,000 816,218 3,782
Ghana Revenue Authority 3,350,000 1,020,000 0 1,020,000
Other Governement Obligation-Contingency 0 200,000 199,621 379
Other Governement Obligation-Non Road Arrears 0 165,000,000 119,893,340 45,106,660
Other Governement Obligation-General Government Services 0 280,000 273,372 6,628
TOTAL 3,350,000 167,320,000 121,182,551 46,137,449
110

11f. CLASSIFICATION OF EXPENDITUREBY COST CENTRES- OTHER EXPENDIURE
ANNUAL REVISED ACTUAL VARIANCE
BUDGET BUDGET
MDAs GH¢ GH¢ GH¢ GH¢
Ministry of Food and Agriculture (MOFA)
Veterinary Services Dept 500,000 500,000 0 500,000
TOTAL 500,000 500,000 0 500,000
Ministry of Foreign Affairs(MFARI)
Foreign Affairs HQ 0 80,000 73,495 6,505
Other Governement Obligation-Non Road Arrears 0 29,920,000 27,739,843 2,180,157
TOTAL 0 30,000,000 27,813,338 2,186,662
Ministry of Gender, Children and Social(MGCSP)
Other Governement Obligation-Non Road Arrears 0 40,000,000 36,000,000 4,000,000
TOTAL 0 40,000,000 36,000,000 4,000,000
Ministry of Health (MoH)
Ghana Health Service 3,525,642 3,525,642 0 3,525,642
Office of the Chief Director 1,200,000 1,200,000 0 1,200,000
Psychiatry Hospitals (Tertiary Health Services) 10,000 10,000 0 10,000
Regulatory Agencies 65,000 65,000 0 65,000
Subvented Organisations 237,207 237,207 0 237,207
Teaching Hospitals 599,066 599,066 0 599,066
Training Institutions 40,996 40,996 0 40,996
TOTAL 5,677,911 5,677,911 0 5,677,911
Ministry of Interior (MINT)
Ghana Police Service 1,065,604 1,065,604 0 1,065,604
National Disaster Management Organization 60,000 60,000 0 60,000
TOTAL 1,125,604 1,125,604 0 1,125,604
Ministry of Justice (MoJ)
Gen. Admin and Finance 60,000 60,000 0 60,000
TOTAL 60,000 60,000 0 60,000
Ministry of Lands and Natural Resources (MLNR)
Headquarters 150,000 150,000 55,298 94,702
O.A.S.L 1,200 1,200 0 1,200
TOTAL 151,200 151,200 55,298 95,902
Ministry of Transport (MRT)
Ghana Railway Development Authority 65,852 65,852 17,876 47,976
Other Governement Obligation-General Government Services 0 2,000,000 1,800,000 200,000
TOTAL 65,852 2,065,852 1,817,876 247,976
Ministry of Water Resources, Works (MWRWH)
Community Water & Sanitation Agency 1,047,150 1,047,150 0 1,047,150
Gen. Admin (GA) 212,704 212,704 181,334 31,371
Hydrological Services Department 2,798 2,798 0 2,798
Public Servants Housing Loan Scheme Board 58,921 58,421 0 58,421
Public Works Department 3,500 4,000 3,573 427
TOTAL 1,325,073 1,325,073 184,906 1,140,167
111
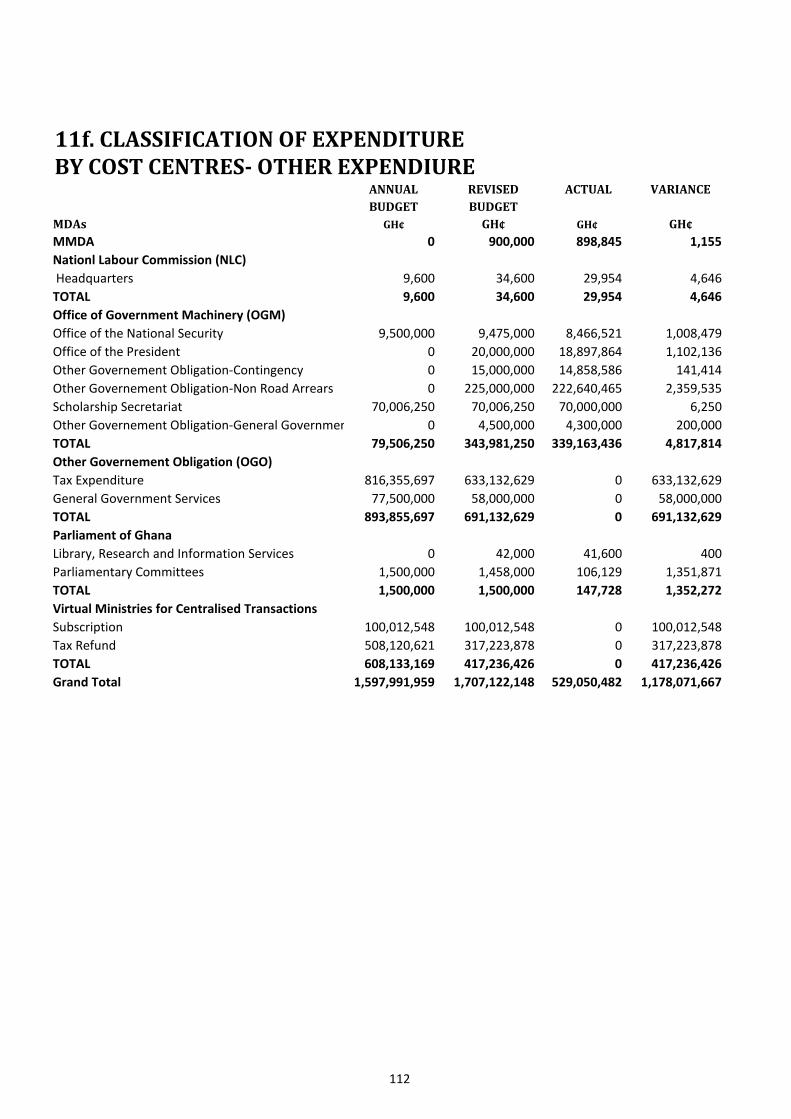
11f. CLASSIFICATION OF EXPENDITUREBY COST CENTRES- OTHER EXPENDIURE
ANNUAL REVISED ACTUAL VARIANCE
BUDGET BUDGET
MDAs GH¢ GH¢ GH¢ GH¢
MMDA 0 900,000 898,845 1,155
Nationl Labour Commission (NLC)
Headquarters 9,600 34,600 29,954 4,646
TOTAL 9,600 34,600 29,954 4,646
Office of Government Machinery (OGM)
Office of the National Security 9,500,000 9,475,000 8,466,521 1,008,479
Office of the President 0 20,000,000 18,897,864 1,102,136
Other Governement Obligation-Contingency 0 15,000,000 14,858,586 141,414
Other Governement Obligation-Non Road Arrears 0 225,000,000 222,640,465 2,359,535
Scholarship Secretariat 70,006,250 70,006,250 70,000,000 6,250
Other Governement Obligation-General Government Services 0 4,500,000 4,300,000 200,000
TOTAL 79,506,250 343,981,250 339,163,436 4,817,814
Other Governement Obligation (OGO)
Tax Expenditure 816,355,697 633,132,629 0 633,132,629
General Government Services 77,500,000 58,000,000 0 58,000,000
TOTAL 893,855,697 691,132,629 0 691,132,629
Parliament of Ghana
Library, Research and Information Services 0 42,000 41,600 400
Parliamentary Committees 1,500,000 1,458,000 106,129 1,351,871
TOTAL 1,500,000 1,500,000 147,728 1,352,272
Virtual Ministries for Centralised Transactions
Subscription 100,012,548 100,012,548 0 100,012,548
Tax Refund 508,120,621 317,223,878 0 317,223,878
TOTAL 608,133,169 417,236,426 0 417,236,426
Grand Total 1,597,991,959 1,707,122,148 529,050,482 1,178,071,667
112

11f. CLASSIFICATION OF EXPENDITUREBY COST CENTRES- NON FINANCIAL ASSET
ANNUAL REVISED ACTUAL VARIANCE
BUDGET BUDGET
MDAs GH¢ GH¢ GH¢ GH¢
Audit Service(AS)
Finance and Administration 5,260,000 5,260,000 0 5,260,000
TOTAL 5,260,000 5,260,000 0 5,260,000
CHRAJ (CHRAJ)
Anti Corruption Departmen 700,000 700,000 482,419 217,581
TOTAL 700,000 700,000 482,419 217,581
Electoral Commission
Headquarters 1,500,000 1,500,000 0 1,500,000
TOTAL 1,500,000 1,500,000 0 1,500,000
Judicial Service (JS)
Gen. Admin 26,022,658 26,022,658 9,906,991 16,115,667
TOTAL 26,022,658 26,022,658 9,906,991 16,115,667
Ministry of Communications (MoC)
India Kofi Annan Centre of Excellence in IC 79,762 79,762 0 79,762
Gen. Admin 142,634,546 142,634,546 0 142,634,546
Ghana Broadcasting Corporation 13,564,766 13,564,766 0 13,564,766
Ghana Meteorological Agency 3,551,765 3,551,765 0 3,551,765
Information Service Department 191,072 191,072 0 191,072
National Information Technology Agency 54,020 54,020 0 54,020
TOTAL 160,075,931 160,075,931 0 160,075,931
Ministry of Chieftaincy and Traditional(MCTA)
Gen. Admin HQ 239,759 239,759 58,465 181,294
National House of Chiefs 510,241 510,241 0 510,241
TOTAL 750,000 750,000 58,465 691,535
Ministry of Defence (MoD)
Gen. Admin 550,000 550,000 0 550,000
Ghana Armed Forces 3,450,000 3,450,000 0 3,450,000
TOTAL 4,000,000 4,000,000 0 4,000,000
Ministry of Education (MOE)
Council for Technical & Vocational Education & Training2,221,636 1,476,451 0 1,476,451
Gen. Admin 42,835,322 47,999,972 46,987,290 1,012,682
Ghana Education Service (GES) 23,096,796 21,904,496 599,774 21,304,722
National Service Secretariat 1,145,644 1,145,644 0 1,145,644
Tertiary 195,883,124 4,931,290 343,332 4,587,958
WAEC (National) 1,500,000 1,500,000 0 1,500,000
TOTAL 266,682,522 78,957,852 47,930,396 31,027,457
113
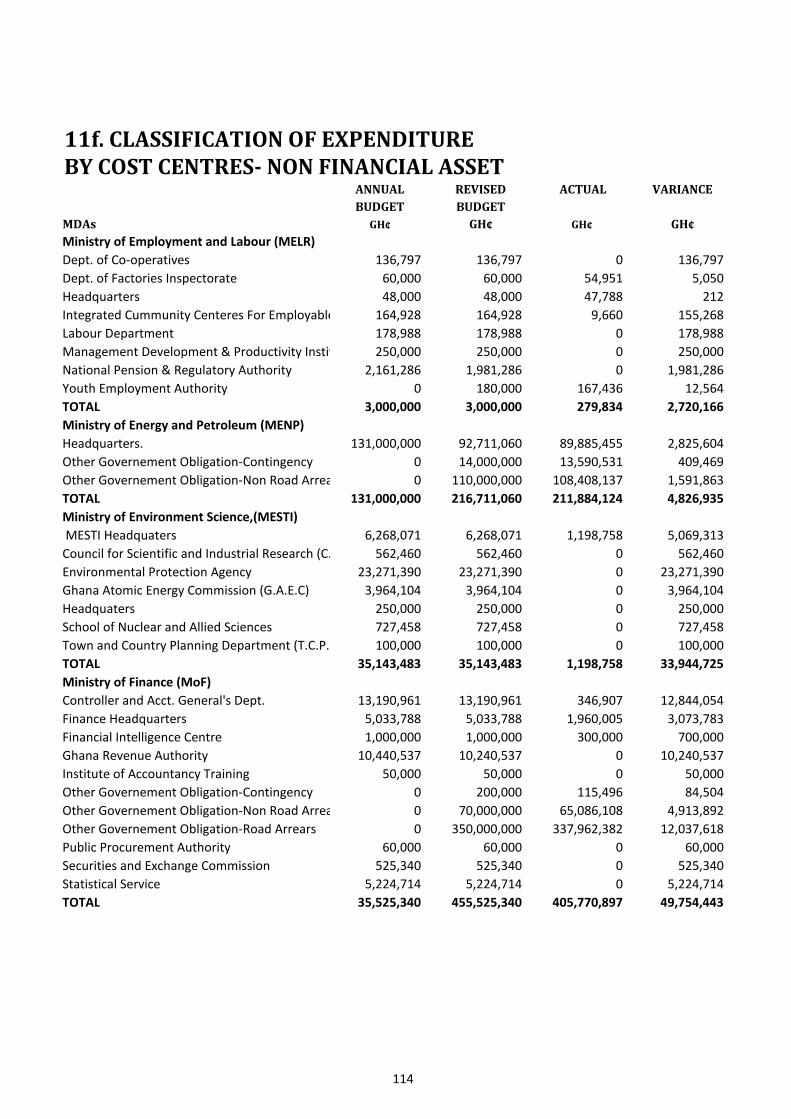
11f. CLASSIFICATION OF EXPENDITUREBY COST CENTRES- NON FINANCIAL ASSET
ANNUAL REVISED ACTUAL VARIANCE
BUDGET BUDGET
MDAs GH¢ GH¢ GH¢ GH¢
Ministry of Employment and Labour (MELR)
Dept. of Co-operatives 136,797 136,797 0 136,797
Dept. of Factories Inspectorate 60,000 60,000 54,951 5,050
Headquarters 48,000 48,000 47,788 212
Integrated Cummunity Centeres For Employable Skill 164,928 164,928 9,660 155,268
Labour Department 178,988 178,988 0 178,988
Management Development & Productivity Institute (M 250,000 250,000 0 250,000
National Pension & Regulatory Authority 2,161,286 1,981,286 0 1,981,286
Youth Employment Authority 0 180,000 167,436 12,564
TOTAL 3,000,000 3,000,000 279,834 2,720,166
Ministry of Energy and Petroleum (MENP)
Headquarters. 131,000,000 92,711,060 89,885,455 2,825,604
Other Governement Obligation-Contingency 0 14,000,000 13,590,531 409,469
Other Governement Obligation-Non Road Arrears 0 110,000,000 108,408,137 1,591,863
TOTAL 131,000,000 216,711,060 211,884,124 4,826,935
Ministry of Environment Science,(MESTI)
MESTI Headquaters 6,268,071 6,268,071 1,198,758 5,069,313
Council for Scientific and Industrial Research (C. 562,460 562,460 0 562,460
Environmental Protection Agency 23,271,390 23,271,390 0 23,271,390
Ghana Atomic Energy Commission (G.A.E.C) 3,964,104 3,964,104 0 3,964,104
Headquaters 250,000 250,000 0 250,000
School of Nuclear and Allied Sciences 727,458 727,458 0 727,458
Town and Country Planning Department (T.C.P.D) 100,000 100,000 0 100,000
TOTAL 35,143,483 35,143,483 1,198,758 33,944,725
Ministry of Finance (MoF)
Controller and Acct. General's Dept. 13,190,961 13,190,961 346,907 12,844,054
Finance Headquarters 5,033,788 5,033,788 1,960,005 3,073,783
Financial Intelligence Centre 1,000,000 1,000,000 300,000 700,000
Ghana Revenue Authority 10,440,537 10,240,537 0 10,240,537
Institute of Accountancy Training 50,000 50,000 0 50,000
Other Governement Obligation-Contingency 0 200,000 115,496 84,504
Other Governement Obligation-Non Road Arrears 0 70,000,000 65,086,108 4,913,892
Other Governement Obligation-Road Arrears 0 350,000,000 337,962,382 12,037,618
Public Procurement Authority 60,000 60,000 0 60,000
Securities and Exchange Commission 525,340 525,340 0 525,340
Statistical Service 5,224,714 5,224,714 0 5,224,714
TOTAL 35,525,340 455,525,340 405,770,897 49,754,443
114

11f. CLASSIFICATION OF EXPENDITUREBY COST CENTRES- NON FINANCIAL ASSET
ANNUAL REVISED ACTUAL VARIANCE
BUDGET BUDGET
MDAs GH¢ GH¢ GH¢ GH¢
Ministry of Fisheries and Aquaculture(MoFAD)
Anumabo Fisheries College 1,728,566 1,454,981 1,368,233 86,747
Fisheries Scientific Survey Division 7,000,000 200,000 0 200,000
General Administration 14,245,744 588,666 350,000 238,666
General Administration and Operations 5,398,325 1,046,334 64,575 981,759
Inland and Acquaculture Management Division 6,212,448 212,448 0 212,448
TOTAL 34,585,083 3,502,428 1,782,808 1,719,620
Ministry of Food and Agriculture (MOFA)
Agric. Engineering Services Dept. 6,500,000 4,096,333 0 4,096,333
Finance and Administration 500,000 7,500,000 7,097,231 402,769
Ghana Irrigation Development Authority 13,253,704 18,836,681 18,798,747 37,934
Grains and Legumes Dev. Board 58,540 58,540 0 58,540
Other Governement Obligation-Non Road Arrears 0 15,500,000 15,232,421 267,579
Policy Planning Monitoring and Evaluation 36,089,150 3,589,150 0 3,589,150
Regional Agric Development Unit 600,000 600,000 0 600,000
Veterinary Services Dept 4,057,146 2,794,234 0 2,794,234
Veterinary Services Dept. (Central Administration) 111,795 111,795 0 111,795
TOTAL 61,170,335 53,086,733 41,128,399 11,958,333
Ministry of Foreign Affairs and Reg. (MFARI)
Foreign Affairs HQ 49,375,587 49,375,587 3,008,702 46,366,885
TOTAL 49,375,587 49,375,587 3,008,702 46,366,885
Ministry of Gender, Children (MGCSP)
Department of Children 40,621 40,621 0 40,621
Department of Women 345,444 345,444 0 345,444
Dept. of Social Welfare General Administration, Budget and Planning28,049 28,049 0 28,049
Headquarters 85,886 85,886 0 85,886
TOTAL 500,000 500,000 0 500,000
Ministry of Health (MoH)
Allied Health Professions Council 230,000 230,000 0 230,000
Christian Health Association of Ghana 2,415,000 2,415,000 0 2,415,000
Ghana Health Service 14,681,953 8,340,468 282,909 8,057,559
Health Headquarters 30,010,047 21,041,313 10,966,655 10,074,658
Psychiatry Hospitals (Tertiary Health Services) 99,600 99,600 0 99,600
Regulatory Agencies 29,095,932 29,095,932 0 29,095,932
Subvented Organisations 283,300 283,300 0 283,300
Teaching Hospitals 29,297,920 29,297,920 0 29,297,920
Training Institutions 21,448,750 21,448,750 0 21,448,750
TOTAL 127,562,503 112,252,283 11,249,564 101,002,719
115
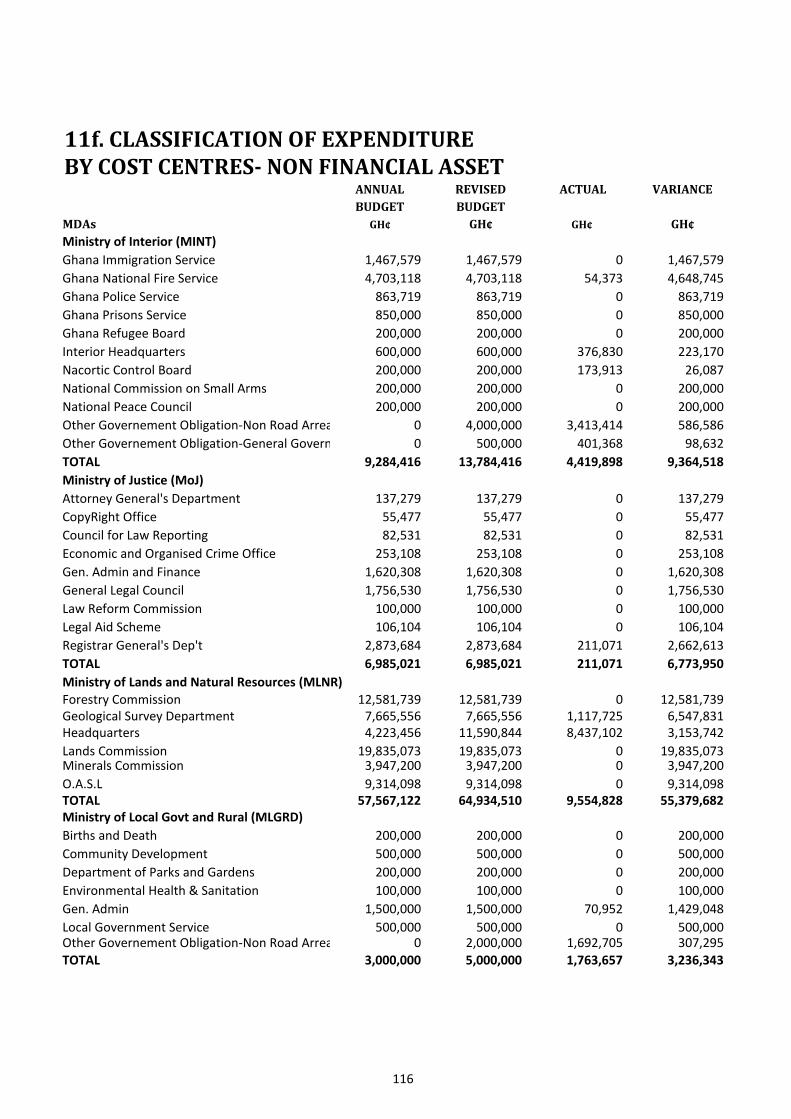
11f. CLASSIFICATION OF EXPENDITUREBY COST CENTRES- NON FINANCIAL ASSET
ANNUAL REVISED ACTUAL VARIANCE
BUDGET BUDGET
MDAs GH¢ GH¢ GH¢ GH¢
Ministry of Interior (MINT)
Ghana Immigration Service 1,467,579 1,467,579 0 1,467,579
Ghana National Fire Service 4,703,118 4,703,118 54,373 4,648,745
Ghana Police Service 863,719 863,719 0 863,719
Ghana Prisons Service 850,000 850,000 0 850,000
Ghana Refugee Board 200,000 200,000 0 200,000
Interior Headquarters 600,000 600,000 376,830 223,170
Nacortic Control Board 200,000 200,000 173,913 26,087
National Commission on Small Arms 200,000 200,000 0 200,000
National Peace Council 200,000 200,000 0 200,000
Other Governement Obligation-Non Road Arrears 0 4,000,000 3,413,414 586,586
Other Governement Obligation-General Government Services 0 500,000 401,368 98,632
TOTAL 9,284,416 13,784,416 4,419,898 9,364,518
Ministry of Justice (MoJ)
Attorney General's Department 137,279 137,279 0 137,279
CopyRight Office 55,477 55,477 0 55,477
Council for Law Reporting 82,531 82,531 0 82,531
Economic and Organised Crime Office 253,108 253,108 0 253,108
Gen. Admin and Finance 1,620,308 1,620,308 0 1,620,308
General Legal Council 1,756,530 1,756,530 0 1,756,530
Law Reform Commission 100,000 100,000 0 100,000
Legal Aid Scheme 106,104 106,104 0 106,104
Registrar General's Dep't 2,873,684 2,873,684 211,071 2,662,613
TOTAL 6,985,021 6,985,021 211,071 6,773,950
Ministry of Lands and Natural Resources (MLNR)
Forestry Commission 12,581,739 12,581,739 0 12,581,739Geological Survey Department 7,665,556 7,665,556 1,117,725 6,547,831Headquarters 4,223,456 11,590,844 8,437,102 3,153,742
Lands Commission 19,835,073 19,835,073 0 19,835,073Minerals Commission 3,947,200 3,947,200 0 3,947,200
O.A.S.L 9,314,098 9,314,098 0 9,314,098TOTAL 57,567,122 64,934,510 9,554,828 55,379,682Ministry of Local Govt and Rural (MLGRD)
Births and Death 200,000 200,000 0 200,000
Community Development 500,000 500,000 0 500,000
Department of Parks and Gardens 200,000 200,000 0 200,000
Environmental Health & Sanitation 100,000 100,000 0 100,000
Gen. Admin 1,500,000 1,500,000 70,952 1,429,048
Local Government Service 500,000 500,000 0 500,000Other Governement Obligation-Non Road Arrears 0 2,000,000 1,692,705 307,295
TOTAL 3,000,000 5,000,000 1,763,657 3,236,343
116

11f. CLASSIFICATION OF EXPENDITUREBY COST CENTRES- NON FINANCIAL ASSET
ANNUAL REVISED ACTUAL VARIANCE
BUDGET BUDGET
MDAs GH¢ GH¢ GH¢ GH¢
Ministry of Roads and Highways
Department of Feeder Roads 160,540,850 141,119,627 2,601,131 138,518,496
Department of Urban Roads 208,175,551 152,766,443 35,867,366 116,899,077
Ghana Highway Authority 287,370,635 206,641,949 46,189,309 160,452,641
Headquarters 129,160,200 34,247,998 0 34,247,998
Other Governement Obligation-Non Road Arrears 0 250,000,000 241,102,895 8,897,105
Other Governement Obligation-Road Arrears 0 70,000,000 68,591,957 1,408,043
TOTAL 785,247,236 854,776,017 394,352,657 460,423,359
Ministry of Tourism, Culture and Creative(MTCCA)
Bureau of Ghana Language 78,883 78,883 39,759 39,124
Finance and Administration 391,103 391,103 28,213 362,890
Ghana Tourist Board 1,358,849 1,358,849 0 1,358,849
Headquarters 69,919 69,919 0 69,919
HOTCATT 21,850 21,850 0 21,850
Subvented Agencies 1,963,449 1,963,449 0 1,963,449
TOTAL 3,884,052 3,884,052 67,972 3,816,081
Ministry of Trade and Industry (MoTI)
CEDECOM 303,467 303,467 0 303,467
Gen. Admin 8,500,234 8,500,234 0 8,500,234
Ghana Export Promotion Authority 486,501 486,501 0 486,501
Ghana Standards Board 15,313,490 15,313,490 0 15,313,490
GRATIS 459,882 459,882 153,000 306,882
NBSSI 559,250 559,250 0 559,250
OGO 0 2,000,000 1,837,578 162,422
TOTAL 25,622,824 27,622,824 1,990,578 25,632,247
Ministry of Transport (MRT)
Headquarters 106,226,986 102,178,482 81,959,998 20,218,484
Driver and Vehicle Licensing Authority 9,652,136 9,652,136 0 9,652,136
Ghana Railway Development Authority 191,359,521 70,197,867 53,171,643 17,026,225
Government Technical Training Centret 80,000 80,000 0 80,000
National Road Safety Commission 70,000 70,000 0 70,000
Regional Maritime University 2,000,000 2,613,809 1,982,321 631,489
TOTAL 309,388,643 184,792,295 137,113,962 47,678,333
117

11f. CLASSIFICATION OF EXPENDITUREBY COST CENTRES- NON FINANCIAL ASSET
ANNUAL REVISED ACTUAL VARIANCE
BUDGET BUDGET
MDAs GH¢ GH¢ GH¢ GH¢
Ministry of Water Resources, Works (MWRWH)
Architect Registration Council 38,137 15,223 0 15,223
Community Water & Sanitation Agency 36,238,143 127,000 0 127,000
Department of Rural Housing 161,981 127,508 0 127,508
Engineers Council 29,827 7,045 0 7,045
Gen. Admin (GA) 984,148 247,741 49,000 198,741
Housing 35,516,620 6,409,124 5,043,887 1,365,237
Hydrological Services Department 41,144,697 20,386,343 20,000,000 386,343
Other Governement Obligation-Non Road Arrears 0 50,000,000 49,749,720 250,280
Public Works Department 30,952,740 18,400,817 17,805,289 595,527
Rent Control Department 702,045 455,704 81,861 373,844
Ressearch Statistics and Information Management (RSIM)46,382 10,956 0 10,956
State Owned Enterprise 51,977,633 256,412 0 256,412
Water Resources Commission 1,000,000 236,210 0 236,210
TOTAL 198,792,353 96,680,083 92,729,756 3,950,327
Ministry of Youth and Sports (MoYS)
Headquarters 2,000,000 2,000,000 0 2,000,000
National Sports Authority 1,500,000 1,500,000 0 1,500,000
National Sports Colleage 200,000 200,000 0 200,000
National Youth Authority 1,300,000 1,300,000 0 1,300,000
TOTAL 5,000,000 5,000,000 0 5,000,000
MMDA 2,000,000 6,000,000 3,298,845 2,701,155
National Commission for Civic Education (NCCE)
Gen. Admin HQ 700,000 700,000 624,439 75,561
TOTAL 700,000 700,000 624,439 75,561
National Development Planning (NDPC)
Headquarters 1,000,000 1,000,000 7,300 992,700
TOTAL 1,000,000 1,000,000 7,300 992,700
National Media Commission
Gen. Admin 650,000 650,000 595,000 55,000
TOTAL 650,000 650,000 595,000 55,000
Nationl Labour Commission (NLC)
Headquarters 700,000 700,000 609,516 90,484
TOTAL 700,000 700,000 609,516 90,484
118
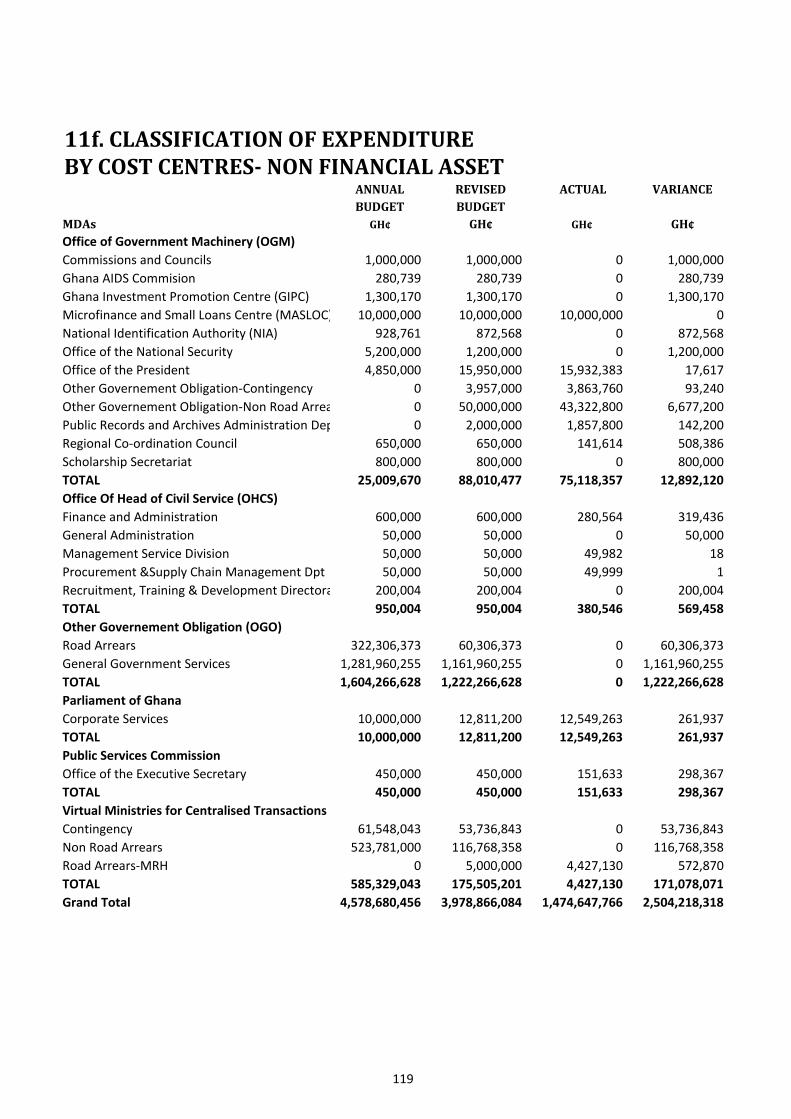
11f. CLASSIFICATION OF EXPENDITUREBY COST CENTRES- NON FINANCIAL ASSET
ANNUAL REVISED ACTUAL VARIANCE
BUDGET BUDGET
MDAs GH¢ GH¢ GH¢ GH¢
Office of Government Machinery (OGM)
Commissions and Councils 1,000,000 1,000,000 0 1,000,000
Ghana AIDS Commision 280,739 280,739 0 280,739
Ghana Investment Promotion Centre (GIPC) 1,300,170 1,300,170 0 1,300,170
Microfinance and Small Loans Centre (MASLOC) 10,000,000 10,000,000 10,000,000 0
National Identification Authority (NIA) 928,761 872,568 0 872,568
Office of the National Security 5,200,000 1,200,000 0 1,200,000
Office of the President 4,850,000 15,950,000 15,932,383 17,617
Other Governement Obligation-Contingency 0 3,957,000 3,863,760 93,240
Other Governement Obligation-Non Road Arrears 0 50,000,000 43,322,800 6,677,200
Public Records and Archives Administration Departm 0 2,000,000 1,857,800 142,200
Regional Co-ordination Council 650,000 650,000 141,614 508,386
Scholarship Secretariat 800,000 800,000 0 800,000
TOTAL 25,009,670 88,010,477 75,118,357 12,892,120
Office Of Head of Civil Service (OHCS)
Finance and Administration 600,000 600,000 280,564 319,436
General Administration 50,000 50,000 0 50,000
Management Service Division 50,000 50,000 49,982 18
Procurement &Supply Chain Management Dpt 50,000 50,000 49,999 1
Recruitment, Training & Development Directorate 200,004 200,004 0 200,004
TOTAL 950,004 950,004 380,546 569,458
Other Governement Obligation (OGO)
Road Arrears 322,306,373 60,306,373 0 60,306,373
General Government Services 1,281,960,255 1,161,960,255 0 1,161,960,255
TOTAL 1,604,266,628 1,222,266,628 0 1,222,266,628
Parliament of Ghana
Corporate Services 10,000,000 12,811,200 12,549,263 261,937
TOTAL 10,000,000 12,811,200 12,549,263 261,937
Public Services Commission
Office of the Executive Secretary 450,000 450,000 151,633 298,367
TOTAL 450,000 450,000 151,633 298,367
Virtual Ministries for Centralised Transactions
Contingency 61,548,043 53,736,843 0 53,736,843
Non Road Arrears 523,781,000 116,768,358 0 116,768,358
Road Arrears-MRH 0 5,000,000 4,427,130 572,870
TOTAL 585,329,043 175,505,201 4,427,130 171,078,071
Grand Total 4,578,680,456 3,978,866,084 1,474,647,766 2,504,218,318
119

SUMMARY CLASSIFICATION OF EXPENDITURE BY MMDA FOR THE YEAR 2015COMPENSATION INTEREST NON OTHER GOODS AND GRAND
FINANCIAL ASSETS EXPENDITURE SERVICES TOTAL
MMDA GH¢ GH¢ GH¢ GH¢ GH¢ GH¢
Abura /Asebu/Kwamankese District 0 0 0 0 106,998 106,998
Ada East District 10,578 0 0 0 45,909 56,487
Adentan Municipal 770 0 0 0 39,102 39,872
Agona East District 1,000 0 0 0 13,692 14,692
Agona West Municipal 0 0 0 27,399 25,188 52,587
Ahanta West District 0 0 130,500 0 56,740 187,240
Ajumako/Enyan/Esiam District 0 0 155,015 1,000 26,743 182,758
Akatsi South District 0 0 124,695 0 31,571 156,266
Akyem Mansa District 0 0 0 0 50,871 50,871
Accra MetroPolitan Assembly 56,467 0 1,215,029 133,950 406,411 1,811,858
Ashaiman Municipal 0 0 59,806 0 192,739 252,545
Asikuma/Odobeng/Brakwa District 0 0 12,517 8,900 34,074 55,491
Assin North Municipal 12,690 0 0 99,000 46,388 158,078
Assin South - Nsuaem Kyekyewere 0 0 0 4,800 90,408 95,208
Asunafo North Municipal 750 0 0 0 162,926 163,676
Asutifi District 0 0 0 25,000 58,838 83,838
Atebubu/Amantin 16,094 0 0 0 16,264 32,358
Atiwa District 0 0 0 2,000 3,000 5,000
Atwima Kwanwoma District 0 0 0 0 88,783 88,783
Ayensuano 0 0 0 0 27,060 27,060
Berekum Municipal 0 0 0 0 5,570 5,570
Bosomtwe District 0 0 0 0 2,528 2,528
Cape Coast Metropolitan 0 0 5,080 0 77,270 82,350
Central Tongu District 0 0 0 0 61,448 61,448
Dormaa Central Municipal 0 0 270,876 0 9,409 280,286
Efutu Municipal 0 0 3,240 0 23,966 27,206
Ejura/Sekyedumasi Municipal 1,410,421 0 0 0 51,046 1,461,466
Ekumfi District 0 0 0 0 13,140 13,140
Elmina Municipal 0 0 37,473 0 23,771 61,244
120

SUMMARY CLASSIFICATION OF EXPENDITURE BY MMDA FOR THE YEAR 2015COMPENSATION INTEREST NON OTHER GOODS AND GRAND
FINANCIAL ASSETS EXPENDITURE SERVICES TOTAL
MMDA GH¢ GH¢ GH¢ GH¢ GH¢ GH¢
Ewutu Senya West District 0 0 0 0 32,612 32,612
Ga Central 17,742 0 15,000 0 6,120 38,862
Ga East Municipal 0 0 0 0 19,961 19,961
Ga South Municipal 0 130,540 0 0 26,377 156,917
Ga West Municipal 36,698 0 0 0 0 36,698
Gomoa East District 0 0 0 30,000 14,307 44,307
Gomoa West District 0 0 0 0 14,982 14,982
Ho Municipal 0 0 0 3,239 29,257 32,496
Hohoe Municipal 0 0 0 0 12,846 12,846
Jaman South District 1,456 0 0 0 203,762 205,218
Jasikan District 96 0 2,771 7,500 42,614 52,982
Ketu North District 4,628,665 0 4,520 0 59,859 4,693,044
Kintampo Municipal 0 0 0 45,000 157,697 202,697
Kintampo South District 0 0 0 0 28,489 28,489
Kpando Municipal 0 0 0 2,600 28,645 31,245
Krachi West District 0 0 28,250 0 20,411 48,661
Kumasi Metropolitan Assembly 0 0 0 1,000 36,935 37,935
Kwahu East District 0 0 12,672 0 46,564 59,236
Kwahu South District 0 0 0 0 878 878
La Nkwantanang 0 0 0 6,131 6,087 12,218
Ledzokuku- Krowor Municipal 41,280 0 0 0 11,150 52,430
Mfantseman West Municipal 0 0 94,263 8,000 29,079 131,342
Nkoranza South District 0 0 25,800 0 91,583 117,383
Nkwanta South District 0 0 0 0 6,215 6,215
North Dayi 0 0 0 0 34,570 34,570
Obuasi Municipal 0 0 0 0 19,149 19,149
Offinso Municipal 0 0 0 0 2,000 2,000
Pru District 0 0 0 0 13,566 13,566
Sekondi-Takoradi Metropolitan 0 0 0 0 58,805 58,805
121
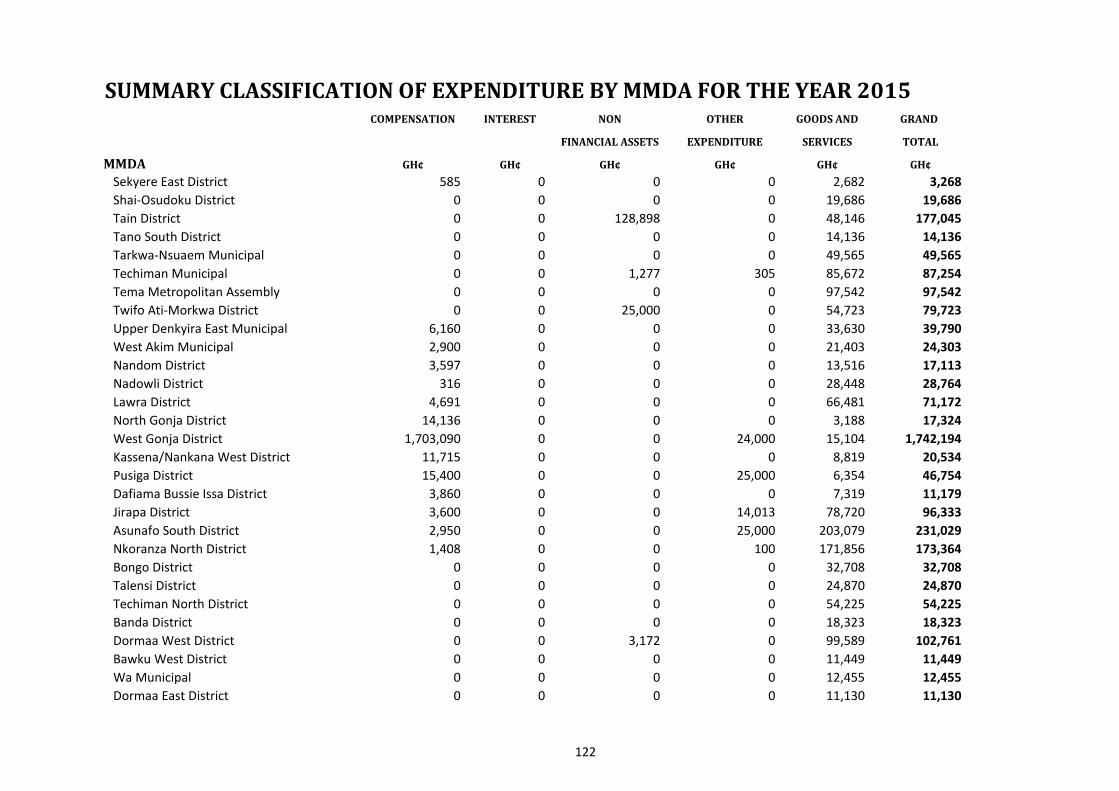
SUMMARY CLASSIFICATION OF EXPENDITURE BY MMDA FOR THE YEAR 2015COMPENSATION INTEREST NON OTHER GOODS AND GRAND
FINANCIAL ASSETS EXPENDITURE SERVICES TOTAL
MMDA GH¢ GH¢ GH¢ GH¢ GH¢ GH¢
Sekyere East District 585 0 0 0 2,682 3,268
Shai-Osudoku District 0 0 0 0 19,686 19,686
Tain District 0 0 128,898 0 48,146 177,045
Tano South District 0 0 0 0 14,136 14,136
Tarkwa-Nsuaem Municipal 0 0 0 0 49,565 49,565
Techiman Municipal 0 0 1,277 305 85,672 87,254
Tema Metropolitan Assembly 0 0 0 0 97,542 97,542
Twifo Ati-Morkwa District 0 0 25,000 0 54,723 79,723
Upper Denkyira East Municipal 6,160 0 0 0 33,630 39,790
West Akim Municipal 2,900 0 0 0 21,403 24,303
Nandom District 3,597 0 0 0 13,516 17,113
Nadowli District 316 0 0 0 28,448 28,764
Lawra District 4,691 0 0 0 66,481 71,172
North Gonja District 14,136 0 0 0 3,188 17,324
West Gonja District 1,703,090 0 0 24,000 15,104 1,742,194
Kassena/Nankana West District 11,715 0 0 0 8,819 20,534
Pusiga District 15,400 0 0 25,000 6,354 46,754
Dafiama Bussie Issa District 3,860 0 0 0 7,319 11,179
Jirapa District 3,600 0 0 14,013 78,720 96,333
Asunafo South District 2,950 0 0 25,000 203,079 231,029
Nkoranza North District 1,408 0 0 100 171,856 173,364
Bongo District 0 0 0 0 32,708 32,708
Talensi District 0 0 0 0 24,870 24,870
Techiman North District 0 0 0 0 54,225 54,225
Banda District 0 0 0 0 18,323 18,323
Dormaa West District 0 0 3,172 0 99,589 102,761
Bawku West District 0 0 0 0 11,449 11,449
Wa Municipal 0 0 0 0 12,455 12,455
Dormaa East District 0 0 0 0 11,130 11,130
122
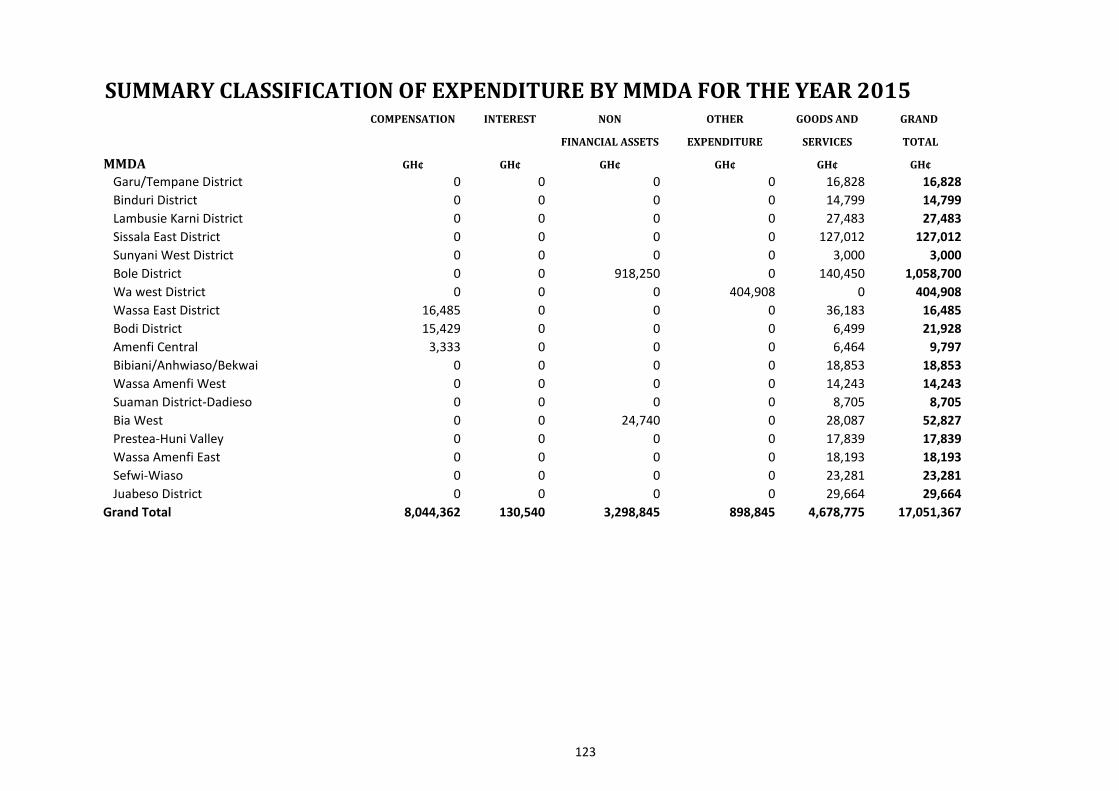
SUMMARY CLASSIFICATION OF EXPENDITURE BY MMDA FOR THE YEAR 2015COMPENSATION INTEREST NON OTHER GOODS AND GRAND
FINANCIAL ASSETS EXPENDITURE SERVICES TOTAL
MMDA GH¢ GH¢ GH¢ GH¢ GH¢ GH¢
Garu/Tempane District 0 0 0 0 16,828 16,828
Binduri District 0 0 0 0 14,799 14,799
Lambusie Karni District 0 0 0 0 27,483 27,483
Sissala East District 0 0 0 0 127,012 127,012
Sunyani West District 0 0 0 0 3,000 3,000
Bole District 0 0 918,250 0 140,450 1,058,700
Wa west District 0 0 0 404,908 0 404,908
Wassa East District 16,485 0 0 0 36,183 16,485
Bodi District 15,429 0 0 0 6,499 21,928
Amenfi Central 3,333 0 0 0 6,464 9,797
Bibiani/Anhwiaso/Bekwai 0 0 0 0 18,853 18,853
Wassa Amenfi West 0 0 0 0 14,243 14,243
Suaman District-Dadieso 0 0 0 0 8,705 8,705
Bia West 0 0 24,740 0 28,087 52,827
Prestea-Huni Valley 0 0 0 0 17,839 17,839
Wassa Amenfi East 0 0 0 0 18,193 18,193
Sefwi-Wiaso 0 0 0 0 23,281 23,281
Juabeso District 0 0 0 0 29,664 29,664
Grand Total 8,044,362 130,540 3,298,845 898,845 4,678,775 17,051,367
123
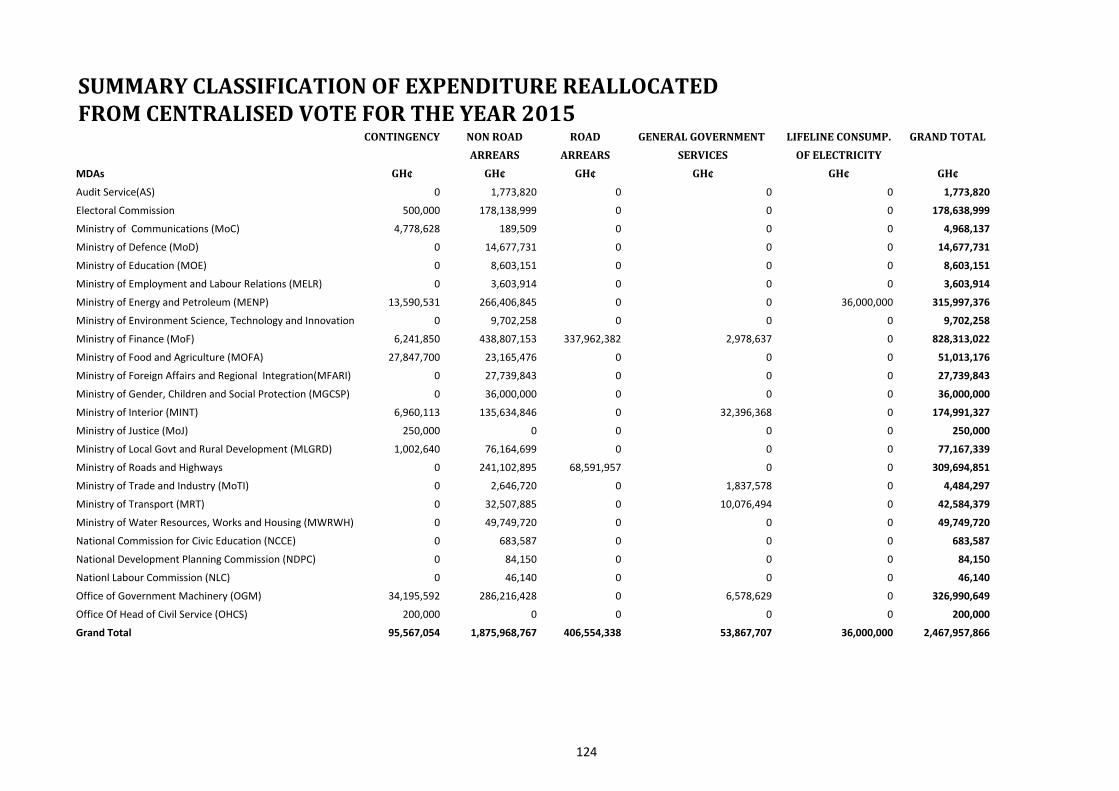
SUMMARY CLASSIFICATION OF EXPENDITURE REALLOCATED FROM CENTRALISED VOTE FOR THE YEAR 2015
CONTINGENCY NON ROAD ROAD GENERAL GOVERNMENT LIFELINE CONSUMP. GRAND TOTAL
ARREARS ARREARS SERVICES OF ELECTRICITY
MDAs GH¢ GH¢ GH¢ GH¢ GH¢ GH¢
Audit Service(AS) 0 1,773,820 0 0 0 1,773,820
Electoral Commission 500,000 178,138,999 0 0 0 178,638,999
Ministry of Communications (MoC) 4,778,628 189,509 0 0 0 4,968,137
Ministry of Defence (MoD) 0 14,677,731 0 0 0 14,677,731
Ministry of Education (MOE) 0 8,603,151 0 0 0 8,603,151
Ministry of Employment and Labour Relations (MELR) 0 3,603,914 0 0 0 3,603,914
Ministry of Energy and Petroleum (MENP) 13,590,531 266,406,845 0 0 36,000,000 315,997,376
Ministry of Environment Science, Technology and Innovation (MESTI) 0 9,702,258 0 0 0 9,702,258
Ministry of Finance (MoF) 6,241,850 438,807,153 337,962,382 2,978,637 0 828,313,022
Ministry of Food and Agriculture (MOFA) 27,847,700 23,165,476 0 0 0 51,013,176
Ministry of Foreign Affairs and Regional Integration(MFARI) 0 27,739,843 0 0 0 27,739,843
Ministry of Gender, Children and Social Protection (MGCSP) 0 36,000,000 0 0 0 36,000,000
Ministry of Interior (MINT) 6,960,113 135,634,846 0 32,396,368 0 174,991,327
Ministry of Justice (MoJ) 250,000 0 0 0 0 250,000
Ministry of Local Govt and Rural Development (MLGRD) 1,002,640 76,164,699 0 0 0 77,167,339
Ministry of Roads and Highways 0 241,102,895 68,591,957 0 0 309,694,851
Ministry of Trade and Industry (MoTI) 0 2,646,720 0 1,837,578 0 4,484,297
Ministry of Transport (MRT) 0 32,507,885 0 10,076,494 0 42,584,379
Ministry of Water Resources, Works and Housing (MWRWH) 0 49,749,720 0 0 0 49,749,720
National Commission for Civic Education (NCCE) 0 683,587 0 0 0 683,587
National Development Planning Commission (NDPC) 0 84,150 0 0 0 84,150
Nationl Labour Commission (NLC) 0 46,140 0 0 0 46,140
Office of Government Machinery (OGM) 34,195,592 286,216,428 0 6,578,629 0 326,990,649
Office Of Head of Civil Service (OHCS) 200,000 0 0 0 0 200,000
Grand Total 95,567,054 1,875,968,767 406,554,338 53,867,707 36,000,000 2,467,957,866
124

Mission
Statement
The Ghana Audit Service exists
To promote
·
good governance in the areas of transparency,
accountability and probity in the public financial
management system of Ghana
By auditing
·
to recognized international auditing standards, the
management of public resources
And
· reporting to Parliament