Hydrogeochemical evaluation of groundwater in the lower Offin basin, Ghana

Journal of Advanced Research (2015) xxx, xxx–xxx
Cairo University
Journal of Advanced Research
ORIGINAL ARTICLE
Hydrogeochemical evolution of inland lakes’ water:
A study of major element geochemistry in the Wadi
El Raiyan depression, Egypt
* Corresponding author. Tel.: +20 1115797536.
E-mail address: [email protected] (H.S. Abu Salem).
Peer review under responsibility of Cairo University.
Production and hosting by Elsevier
http://dx.doi.org/10.1016/j.jare.2014.12.0082090-1232 ª 2015 Production and hosting by Elsevier B.V. on behalf of Cairo University.
Please cite this article in press as: Mohamed EA et al., Hydrogeochemical evolution of inland lakes’ water: A study of major element geochemistry in theRaiyan depression, Egypt, J Adv Res (2015), http://dx.doi.org/10.1016/j.jare.2014.12.008
Essam A. Mohameda, Ahmed M. El-Kammar
b, Mohamed M. Yehia
c,
Hend S. Abu Salem b,*
a Geology Department, Faculty of Science, Beni Suef University, Egyptb Geology Department, Faculty of Science, Cairo University, Egyptc Central Laboratory for Environmental Quality Monitoring, National Water Research Centre, Kanater El-Khairia, Egypt
A R T I C L E I N F O
Article history:
Received 19 July 2014
Received in revised form 14 December
2014
Accepted 25 December 2014
Available online xxxx
Keywords:
Surface water
Major elements
Geochemical evolution
Faiyum
El Raiyan depression
A B S T R A C T
Wadi El Raiyan is a great depression located southwest of Cairo in the Western Desert of Egypt.
Lake Qarun, located north of the study area, is a closed basin with a high evaporation rate. The
source of water in the lake is agricultural and municipal drainage from the El Faiyum province.
In 1973, Wadi El Raiyan was connected with the agricultural wastewater drainage system of the
Faiyum province and received water that exceeded the capacity of Lake Qarun. Two hydrogeo-
logical regimes have been established in the area: (i) higher cultivated land and (ii) lowerWadi El
Raiyan depression lakes. The agricultural drainage water of the cultivated land has been
collected in one main drain (ElWadi Drain) and directed toward theWadi El Raiyan depression,
forming two lakes at different elevations (upper and lower). In the summer of 2012, the major
chemical components were studied using data from 36 stations distributed over both hydrogeo-
logical regimes in addition to one water sample collected from Bahr Youssef, the main source of
freshwater for the Faiyum province. Chemical analyses were made collaboratively. The major
ion geochemical evolution of the drainage water recharging the El Raiyan depression was exam-
ined. Geochemically, the Bahr Youssef sample is considered the starting point in the geochemical
evolution of the studied surface water. In the cultivated area, major-ion chemistry is generally
influenced by chemical weathering of rocks and minerals that are associated with anthropogenic
inputs, as well as diffuse urban and/or agricultural drainage. In the depression lakes, the water
chemistry generally exhibits an evaporation-dependent evolutionary trend that is further
modified by cation exchange and precipitation of carbonate minerals.
ª 2015 Production and hosting by Elsevier B.V. on behalf of Cairo University.
Introduction
The Wadi El Raiyan depression is located in the WesternDesert, 40 km southwest of Faiyum Province, and has an esti-mated area of 703 km2. It is situated between latitudes 28�450and 29�200N and longitudes 30�150 and 30�350E. Since 1973,
Wadi El
2 E.A. Mohamed et al.
the depression has been used as a reservoir for agriculturaldrainage water. Approximately 200 million cubic meters ofdrainage water from cultivated lands are transported annually
via El Wadi Drain to the Wadi El Raiyan lakes [1]. Twoman-made lakes (i.e., upper and lower) joined by a channelwere built at two different altitudes (Fig. 1). The upper lake
covers an area of approximately 53 km2 at an elevation of10 m below sea level. The upper lake is completely filled withwater and surrounded by dense vegetation [2]. The excess
water of this lake flows to the lower lake via a shallow connect-ing channel [3]. The lower lake is larger than the upper lakeand has an estimated area of approximately 110 km2 at an ele-vation of 18 m below sea level [4]. The recorded maximum
water depth in the lower lake is 33 m [5]. The inflow of waterto the lower lake varied from 17.68 · 106 m3 in March 1996 to3.66 · 106 m3 in July 1996, with a total annual inflow of
127.2 · 106 m3/year [5]. The area between these two lakes isused for fish farming.
The major ionic composition of the surface water can reveal
the type of weathering and a variety of other natural andanthropogenic processes on a hydrological basin-wide scale.Since the earlier works [6–9], the major element geochemistry
of numerous major rivers has been studied, notably includingthe Amazon [10–13], Ganges–Brahmaputra [14–16], Lena [17–19], Makenzie [20], and Orinoco [21,22]. Studies have shownthat there are a variety of processes that control the geochem-
ical characteristics and variety of river water geochemistry.These processes include rainfall type, degree of evaporation,weathering of the bedrock, bedrock mineralogy, temperature,
relief, vegetation and biological uptake.To the authors’ knowledge, there have been few published
studies and insufficient data on the geochemical evolution of
drainage water in the study area. Those studies include the
Fig. 1 Location map of the Wadi El Raiyan upper and lower lakes
cultivated land ‘‘as shown in yellow circles’’.
Please cite this article in press as: Mohamed EA et al., Hydrogeochemical evolutionRaiyan depression, Egypt, J Adv Res (2015), http://dx.doi.org/10.1016/j.jare.2014.1
works of Saleh [2], Sayed and Abdel-Satar [3], Saleh et al.[23,24]. This article addresses the water geochemistry of anintegrated drainage system that drains through different
sources of agricultural wastewater into an artificial inlanddepression (Figs. 1 and 2).
The area supports rich and varied desert wildlife and
unique geological and geomorphological features [25]. Since1973, the Wadi El Raiyan lakes have attracted large popula-tions of birds, particularly waterfowl. The two lakes are
currently among the most important Egyptian wetland areasand are likely to assume international importance for migrat-ing waterfowl in the future.
The inorganic pollutants in the Wadi El Raiyan lakes were
studied by Saleh et al. [23] in 2000. The study documented asignificant improvement in the water quality of the Wadi ElRaiyan lakes compared to 1988 as reported by Saleh et al.
[24]. Mansour and Sidky [4] compared the major componentsof contamination between the Lake Qarun and Wadi ElRaiyan wetlands, and they concluded that Lake Qarun was
more polluted than the Wadi El-Raiyan lakes and that thelower lake of this wetland was relatively more contaminatedthan the upper lake.
Bedrock geology
El Faiyum Depression is a natural depression in the WesternDesert of Egypt and extends over 12,000 km2. Tablelands sur-
round the Faiyum Depression on the east, west and south andseparate it from neighboring depressions, the Nile Valley andWadi El Raiyan. The Faiyum Depression is underlain by rocks
of the Middle Eocene, which form the oldest exposed beds inthe area and are composed essentially of gypsiferrous shale,
, El Wadi drain and location of collected water samples from the
of inland lakes’ water: A study of major element geochemistry in the Wadi El2.008
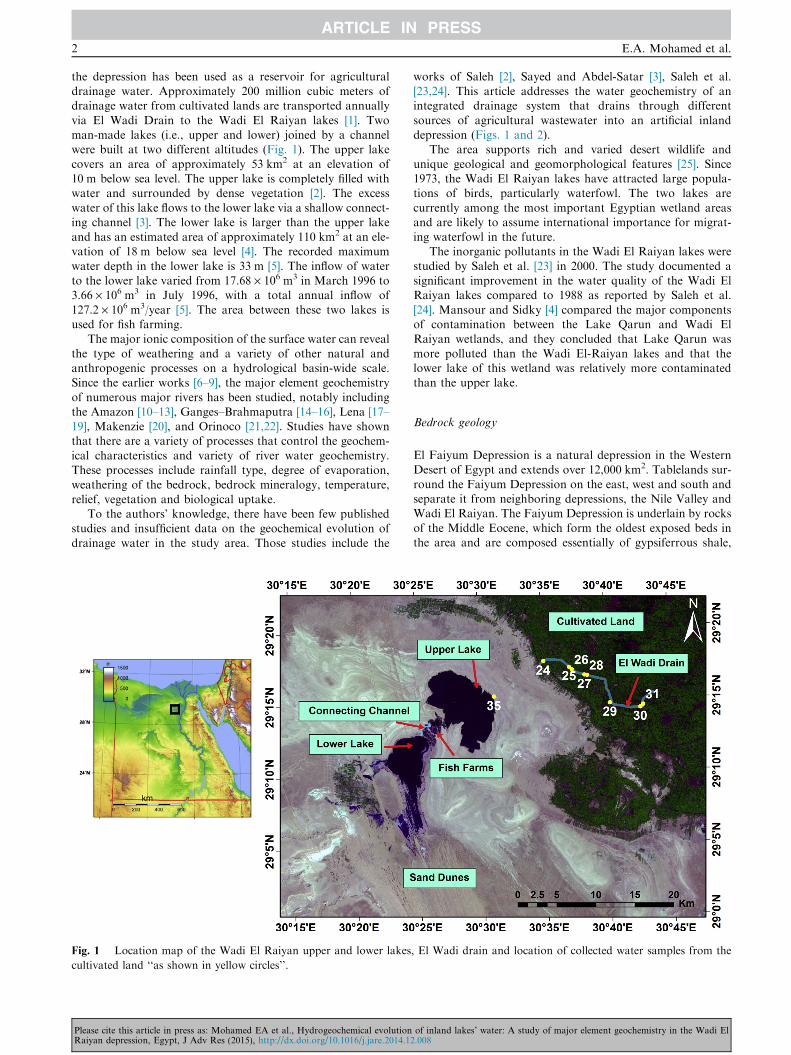
Fig. 2 (a) The location of the collected samples from upper and lower lakes and the fish farms area, (b) The fish farm samples (1–14,
white box), samples 5 and 6 have the same point.
Hydrogeochemistry of waters from Wadi El Raiyan depression 3
Please cite this article in press as: Mohamed EA et al., Hydrogeochemical evolution of inland lakes’ water: A study of major element geochemistry in the Wadi ElRaiyan depression, Egypt, J Adv Res (2015), http://dx.doi.org/10.1016/j.jare.2014.12.008

4 E.A. Mohamed et al.
white marls, limestone and sand [26,27]. Quaternary depositsare widely distributed over the Faiyum area in the form ofeolian, Nilotic and lacustrine deposits (Fig. 3).
Most of the cultivated lands in the Faiyum province aredeep alluvial loam or clayey, derived mainly from Nile floodalluvium. The depression forms a more or less level plain, from
which the ground slopes gently away at the northern sidetoward Lake Qarun and to the southwest toward the WadiEl Raiyan. It has a dense network of irrigation canals and
drains. In addition, calcareous clayey and some sandy soilsare found in patches toward the edge of the depression [28,29].
The Wadi El Raiyan depression was naturally formed inMiddle Eocene carbonates (Fig. 3). The Middle Eocene sedi-
mentary sequence consists of two formations, the QaretGehannam Formation and the underlying Wadi El RaiyanFormation. The Qaret Gehannam Formation has a thickness
of approximately 50 m and consists of Nummulitic limestonein addition to shale, gypsum and marlstone intercalated withlimestone. The Wadi El Raiyan Formation is located in the
Fig. 3 Geological map o
Please cite this article in press as: Mohamed EA et al., Hydrogeochemical evolutionRaiyan depression, Egypt, J Adv Res (2015), http://dx.doi.org/10.1016/j.jare.2014.1
south of the depression and consists mainly of very hard lime-stone with alternating Nummulitic limestone and occasionalargillaceous sandstone. The Nummulitic limestone is interca-
lated with reefal limestone at its base.
Methodology
In August 2012, 36 water samples were collected from theWadi El Raiyan lakes and their recharging drain (El Wadidrain) and at fish farms that have been developed between
the upper and lower lakes (Fig. 1 and Fig. 2b). The sampleswere placed in polyethylene bottles for laboratory analysis.Two bottles of one-liter capacity each were used for major ele-
ment and biochemical oxygen demand (BOD) analyses. Thesamples were placed in iceboxes before being transported tothe central chemical analysis laboratories of the National
Water Research Centre, El-Kanater El-Khairia, Egypt.The sampling and analytical methods were performed
following British Standard Institute (BSI) water sampling
f El Faiyum area [30].
of inland lakes’ water: A study of major element geochemistry in the Wadi El2.008
Hydrogeochemistry of waters from Wadi El Raiyan depression 5
and analytical methods. pH, temperature, conductivity andtotal salinity were measured in situ using standard fieldequipment. Acid-washed, airtight sample bottles were rinsed
with surface water at the sampling site and then filled to thetop. Total alkalinity, which is the sum of CO3
2� and HCO3�,
was measured by titration within a few hours of sampling
using 0.02 N sulfuric acid with a few drops of phenolphthaleinand methyl orange as indicators according to the standardmethod. The water samples were filtered through 0.45-lmpolypropylene filter membranes before analysis.
Water samples for cation analysis were acidified to pH < 2with ultra-pure nitric acid and kept in a refrigerator. Cations(K, Na, Mg and Ca) were analyzed using an 11355 Inductively
Coupled Plasma (ICP) Multi Element Standard + 0.2%(Merck reference) with concentration 1000 mg + 10/L, andan arsenic standard solution (As = 99 + 5 mg/L Merck) was
used as a standard for measurement. Anions (Cl, SO4, andNO3) were measured by ion chromatography (IC) using amodel DX-500 chromatograph system with a CD20 Conduc-
tivity Detector. To check the quality of the overall analyticaldata, all of the surface water geochemical data obtained in thisstudy were assessed for charge balance using Geochemist
Workbench. Under this scheme, water analyses with a chargebalance of greater than ±5% should be rejected from the dataset. In this study, all of the samples met the recommendedbalance. This is because of the replication of each sample; each
replicate was analyzed three times and the average of the sixmeasurements for each element was taken. The activity of ions,minerals speciation and saturation indices were calculated
using PHREEQC software [31]. The chemical analyses ofwater samples were plotted on a diagram developed byChadha [32] to identify the different water types, and on Gibbs
diagram [33,34] to investigate the natural mechanisms, whichcontrol the water chemistry.
Results
Water acidity and total dissolved solid (TDS) distribution
The water samples are mainly alkaline, with pH values in therange of 7.5–8.9 (Table 1). The drain water samples from thecultivated land have relatively lower pH values, ranging from
7.5 to 8.1. The pH increases to 8.9 in the recharge water tothe upper lake from El Wadi Drain (sample 35). The upperlake shows the highest pH values except sample number 35
(Fig. 1), which is related closely to El Wadi Drain. ThepH values of the water samples from the fish farms rangefrom 7.7 to 8.2 but increase to 8.6 in the lower lake
(Table 1).The total dissolved solids (TDS) are lowest in the water
samples from El Wadi Drain (Table 1) but increase in the
lower lake water. The average TDS in the drainage water fromcultivated land is 718 mg/l. However, TDS increases to2658 mg/l in the upper lake waters and 2504 mg/l in the fishfarm samples. The highest value of TDS (14,963 mg/l) was
obtained from lower lake samples. The TDS values of the sam-ples collected from the upper lake fall between the cultivatedland and the fish farm values (Table 1), except for sample num-
ber 32 (Fig. 2a). This sample was collected from the westernside of the study area (Fig. 2a); it is pumped from the upperlake through pipelines to irrigate a wide reclaimed area in
Please cite this article in press as: Mohamed EA et al., Hydrogeochemical evolutionRaiyan depression, Egypt, J Adv Res (2015), http://dx.doi.org/10.1016/j.jare.2014.12
the west of the lower lake and represents the drainage waterof this area. The pH values are directly proportional to theTDS concentrations (Table 1).
Major element geochemistry
The concentrations of the major elements, including K, Na,
Mg, Ca, Cl and SO4, reflect that of TDS because they tendto increase in the direction of flow (Table 1). Accordingly,the water samples from the lower lake (the last destination)
represent the highest concentration of major elements andTDS than the other occurrences. Sample number 32 has higherchloride and sulfate concentrations than the rest of the upper
lake samples (Table 1).Bicarbonate concentrations do not show the same trend
relative to other geochemical parameters (Table 1). The fishfarms’ waters have the highest average bicarbonate concentra-
tion, followed by the lower lake waters, the cultivated landdrains and finally the upper lake water (Table 1).
Geochemical composition and water types
Water Type 1 (T1); (Ca–Mg–HCO3)
The irrigation water from Bahr Youssef falls in the upper rightquadrant of the Chadha diagram (type 1) (Fig. 4a). This water
is fresh with a TDS of 269 mg/l and pH of 7.8. It is character-ized by higher concentrations of weak acidic anions (HCO3)relative to strong acidic anions (Cl + SO4) and with higher
concentrations of alkali earth elements (Ca + Mg) relative toalkali elements (Na + K).
Water Type 2 (T2); (Na–Cl–SO4)
Water type 2 represents drainage water samples from culti-vated lands, the upper lake, fish farms and lower lake(Fig. 4a). All type T2 water samples are characterized by
higher concentrations of strong acidic anions relative to weakacidic anions and higher concentrations of alkali elementsrelative to alkali earth elements.
Geochemical classification
Application of the Gibbs diagrams to the water samples from
the study area shows distinctive chemical variations betweenthe water samples collected from the area (Fig. 5). The RiverNile water as represented by the Bahr Youssef sample is chem-ically controlled by leaching of the bedrock. This process of
water–rock interaction has resulted in an increased concentra-tion of Ca and HCO3 (Fig. 5). The drainage water from culti-vated lands has an average TDS concentration higher than
that of the River Nile water. Elevated TDS is associated withthe increase in Cl and Na concentrations. The chemical com-position of the agricultural drainage water apparently is con-
trolled by the reaction with the bedrock with a small amountof evaporation (Fig. 5). Going further, the drain water in theupper lake, fish farms and lower lake show a gradual increasein TDS, Na and Cl concentrations. This maximizes the effect
of the evaporation process on the chemical composition ofthe surface waters under consideration (Fig. 5).
of inland lakes’ water: A study of major element geochemistry in the Wadi El.008

Table 1 Physical properties and ionic concentrations of the collected water samples.
Location Sample No. Temperature
(�C)pH TDS
(mg/l)
EC
(mmhos/cm)
Total
Alkalinity
(mg/l)
BOD
(mg/l)
K
(mg/l)
Na
(mg/l)
Mg
(mg/l)
Ca
(mg/l)
NO3
(mg/l)
Cl
(mg/l)
SO4
(mg/l)
CO3
(mg/l)
HCO3
(mg/l)
Fish Farms 1 27.7 7.7 2310.0 3.6 273.0 12.0 27.0 400.0 86.0 183.3 2.6 610.0 500.0 0.0 380.0
2 28.0 8.2 2304.0 3.6 301.6 10.0 27.0 450.0 90.0 155.7 4.8 647.2 485.0 9.6 392.0
4 28.4 8.1 2406.0 3.8 297.0 40.0 29.0 525.0 84.4 142.6 7.1 736.0 470.0 0.0 377.0
5 28.5 7.9 2387.0 3.7 312.0 16.0 28.0 515.0 79.9 151.0 8.7 704.0 490.0 0.0 400.0
6 28.8 8.2 2444.0 3.8 263.0 12.0 26.0 525.0 86.2 157.0 7.6 691.0 580.0 0.0 420.0
8 29.3 7.8 2771.0 4.3 246.0 23.0 28.0 625.0 76.7 182.4 8.0 800.0 752.0 0.0 246.0
10 29.1 8.3 2348.0 3.7 273.0 13.0 29.0 500.0 82.5 121.0 4.6 614.0 551.0 0.0 373.0
11 31.8 7.7 2700.0 44.2 331.0 10.0 31.0 725.0 42.4 151.7 5.4 900.0 700.0 0.0 231.0
13 32.7 8.0 3078.0 4.8 263.0 6.0 29.0 820.0 47.2 170.0 13.6 1020.0 731.0 0.0 263.0
14 30.2 7.8 2291.0 3.6 302.0 11.0 27.0 470.0 75.0 130.0 2.3 602.0 550.0 0.0 300.0
Average 29.5 8.0 2503.9 7.9 286.2 15.3 28.1 555.5 75.0 154.5 6.5 732.4 580.9 338.2
Lower Lake 3 30.4 8.5 10912.0 17.1 247.0 20.0 96.0 2700.0 189.2 505.7 <0.2 4100.0 1500.0 52.0 295.0
7 31.4 8.5 12083.0 18.9 301.0 8.0 100.0 2900.0 169.5 600.0 <0.2 4300.0 1800.0 33.0 278.0
9 31.1 8.3 14208.0 22.2 226.0 10.0 114.0 3400.0 243.4 849.4 0.0 5250.0 2200.0 43.0 226.0
12 32.7 8.4 11782.0 18.4 219.0 5.0 104.0 2850.0 192.2 583.2 0.4 4350.0 1720.0 39.0 359.0
15 29.8 8.4 16512.0 25.8 367.0 6.0 165.0 4100.0 400.0 350.0 0.6 6000.0 2500.0 43.0 324.0
16 29.0 8.3 16384.0 25.6 353.0 5.0 155.0 4200.0 419.6 367.0 0.6 6200.0 2550.0 48.0 305.0
17 30.3 8.6 16512.0 25.8 273.0 6.0 160.0 4300.0 426.0 370.0 0.6 6400.0 2600.0 49.0 224.0
18 29.9 8.6 16896.0 26.4 353.0 6.0 165.0 4450.0 437.0 392.0 0.7 6550.0 2770.0 68.0 285.0
19 29.9 8.6 16960.0 26.5 308.0 7.0 155.0 4500.0 434.6 382.8 0.8 6600.0 2800.0 49.0 259.0
20 30.7 8.6 16576.0 25.9 273.0 6.0 165.0 4350.0 415.0 340.8 0.7 6400.0 2750.0 44.0 229.0
21 30.6 8.6 16512.0 25.8 264.0 8.0 165.0 4200.0 468.0 332.8 0.8 6350.0 2870.0 73.0 191.0
22 28.6 8.5 15616.0 24.4 291.0 7.0 150.0 3900.0 430.3 324.0 0.9 5850.0 2750.0 43.0 248.0
23 28.9 8.6 13568.0 21.2 259.0 7.0 130.0 3580.0 400.0 290.0 0.5 5500.0 2400.0 45.0 214.0
Average 30.3 8.5 14963.2 23.4 287.2 7.8 140.3 3802.3 355.7 437.5 0.6 5680.8 2400.8 48.4 264.4
Cultivated
Land
24 29.3 7.6 638.0 1.0 200.0 10.0 9.0 125.0 20.0 50.0 6.5 150.0 110.0 0.0 200.0
25 29.4 7.6 657.0 1.0 220.0 13.0 9.0 135.0 24.8 51.8 8.6 160.0 125.0 0.0 220.0
26 29.5 8.1 763.0 1.2 235.0 10.0 10.0 155.0 30.0 52.7 7.6 180.0 145.0 0.0 235.0
27 29.6 7.7 659.0 1.0 217.0 11.0 9.0 140.0 22.0 50.0 7.6 160.0 120.0 0.0 217.0
28 29.6 7.7 658.0 1.0 214.0 12.0 10.0 140.0 21.0 49.1 7.8 162.0 121.0 0.0 214.0
29 28.4 7.8 838.0 1.3 245.0 10.0 12.0 162.0 32.0 60.0 9.5 200.0 155.0 0.0 245.0
30 29.2 7.7 605.0 0.9 210.0 12.0 9.0 128.0 21.0 52.0 6.8 145.0 120.0 0.0 210.0
31 30.0 7.5 922.0 1.4 285.0 14.0 11.0 195.0 28.4 63.5 10.6 230.0 140.0 0.0 285.0
Average 29.4 7.7 717.5 1.1 228.3 11.5 9.9 147.5 24.9 53.6 8.1 173.4 129.5 0.0 228.3
Upper Lake 32 27.2 8.0 7283.0 11.4 244.0 3.0 33.0 2000.0 185.0 420.0 12.8 2800.0 2000.0 0.0 244.0
33 29.7 8.8 1796.0 2.8 203.0 8.0 21.0 430.0 60.8 120.3 <0.2 580.0 500.0 33.0 170.0
34 32.4 8.9 1783.0 2.8 198.0 3.0 16.0 400.0 59.0 121.0 <0.2 550.0 475.0 33.0 165.0
35 27.6 7.7 640.0 1.0 219.0 6.0 7.0 140.0 25.0 45.0 4.5 160.0 130.0 0.0 210.0
36 30.0 8.9 1788.0 2.8 218.0 5.0 16.0 400.0 55.3 118.9 <0.2 560.0 400.0 28.0 190.0
Average 29.4 8.5 2658.0 4.2 216.4 5.0 18.6 674.0 77.0 165.0 8.7 930.0 701.0 18.8 195.8
Bahr Youssef 37 30.0 7.8 268.5 0.4 137.6 1.8 5.3 30.5 9.6 27.4 5.6 24.1 33.3 0.0 137.6
6E.A
.Mohamed
etal.
Please
citeth
isarticle
inp
ressas:
Mo
ham
edE
Aet
al.,H
ydro
geoch
emical
evolu
tion
of
inlan
dlak
es’w
ater:A
stud
yo
fm
ajor
elemen
tgeo
chem
istryin
the
Wad
iE
lR
aiyand
epressio
n,
Egyp
t,J
Ad
vR
es(2015),
http
://dx.d
oi.o
rg/10.1016/j.jare.2014.12.008

Fig. 4 (a) (CO3 + HCO3)-(Cl + SO4) versus (Ca + Mg)+(-
Na + K) diagram, letters in squares represent the different
geochemical fields [32], (b) Variation of HCO3 and pH in the
studied water samples.
Fig. 5 Gibbs diagram for the studied water samples, (a) for
cations and (b) for anions.
Hydrogeochemistry of waters from Wadi El Raiyan depression 7
Discussion
The geochemistry of surface water constituents
Geochemical reactions 1–13 (Table 2) have been derived toassist in the interpretation of the geochemical reactions that
control the surface water geochemistry in the area. Crossplotsof all geochemical reactions that could possibly influence waterchemistry were made. On the crossplots, reactions are repre-
sented by vectors according to their effect on the X- or Y-axes.If a reaction does not influence either the X- or Y-axis, it can-not be plotted on the crossplot, while if it only influences one
axis or the other the vector is parallel to that axis. On the otherhand, if a reaction influences both X- and Y-axis parameters,then the vector has a gradient specific to the particular reac-
tion. Accordingly, the vector diagrams in Figs. 4, 6 and 7 helpreveal the dominant geochemical reactions in the study surfacewaters.
The downstream progressive change of any chemical com-
ponent will be a consequence of the increasing impact of geo-chemical processes on waters along the flow path.
Please cite this article in press as: Mohamed EA et al., Hydrogeochemical evolutionRaiyan depression, Egypt, J Adv Res (2015), http://dx.doi.org/10.1016/j.jare.2014.12
Controls on chloride concentration
The chloride concentration in the water samples from the cul-tivated land is sevenfold greater than that in the Bahr Youssefsample. The upper lake and fish farm waters have Cl concen-
trations greater by fivefold and fourfold than the cultivatedland, respectively. This value rises to about sixfold in the lowerlake than in the upper lake waters.
of inland lakes’ water: A study of major element geochemistry in the Wadi El.008
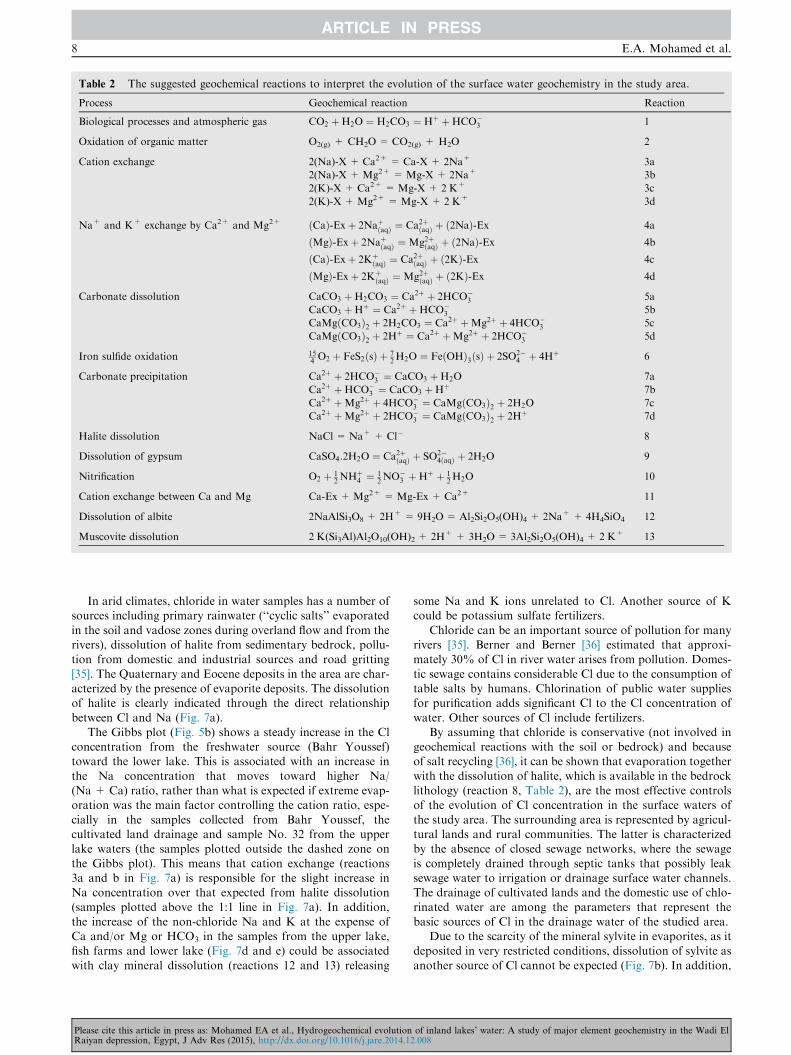
Table 2 The suggested geochemical reactions to interpret the evolution of the surface water geochemistry in the study area.
Process Geochemical reaction Reaction
Biological processes and atmospheric gas CO2 þH2O ¼ H2CO3 ¼ Hþ þHCO�3 1
Oxidation of organic matter O2(g) + CH2O= CO2(g) + H2O 2
Cation exchange 2(Na)-X + Ca2+ = Ca-X + 2Na+ 3a
2(Na)-X +Mg2+ =Mg-X+ 2Na+ 3b
2(K)-X+ Ca2+ =Mg-X+ 2 K+ 3c
2(K)-X+ Mg2+ =Mg-X+ 2 K+ 3d
Na+ and K+ exchange by Ca2+ and Mg2+ ðCaÞ-Exþ 2NaþðaqÞ ¼ Ca2þðaqÞ þ ð2NaÞ-Ex 4a
ðMgÞ-Exþ 2NaþðaqÞ ¼Mg2þðaqÞ þ ð2NaÞ-Ex 4b
ðCaÞ-Exþ 2KþðaqÞ ¼ Ca2þðaqÞ þ ð2KÞ-Ex 4c
ðMgÞ-Exþ 2KþðaqÞ ¼Mg2þðaqÞ þ ð2KÞ-Ex 4d
Carbonate dissolution CaCO3 þH2CO3 ¼ Ca2þ þ 2HCO�3 5a
CaCO3 þHþ ¼ Ca2þ þHCO�3 5b
CaMgðCO3Þ2 þ 2H2CO3 ¼ Ca2þ þMg2þ þ 4HCO�3 5c
CaMgðCO3Þ2 þ 2Hþ ¼ Ca2þ þMg2þ þ 2HCO�3 5d
Iron sulfide oxidation 154 O2 þ FeS2ðsÞ þ 7
2H2O ¼ FeðOHÞ3ðsÞ þ 2SO2�4 þ 4Hþ 6
Carbonate precipitation Ca2þ þ 2HCO�3 ¼ CaCO3 þH2O 7a
Ca2þ þHCO�3 ¼ CaCO3 þHþ 7b
Ca2þ þMg2þ þ 4HCO�3 ¼ CaMgðCO3Þ2 þ 2H2O 7c
Ca2þ þMg2þ þ 2HCO�3 ¼ CaMgðCO3Þ2 þ 2Hþ 7d
Halite dissolution NaCl = Na+ + Cl� 8
Dissolution of gypsum CaSO4:2H2O ¼ Ca2þðaqÞ þ SO2�4ðaqÞ þ 2H2O 9
Nitrification O2 þ 12NHþ4 ¼ 1
2NO�3 þHþ þ 12H2O 10
Cation exchange between Ca and Mg Ca-Ex +Mg2+ =Mg-Ex + Ca2+ 11
Dissolution of albite 2NaAlSi3O8 + 2H+ = 9H2O= Al2Si2O5(OH)4 + 2Na+ + 4H4SiO4 12
Muscovite dissolution 2 K(Si3Al)Al2O10(OH)2 + 2H+ + 3H2O= 3Al2Si2O5(OH)4 + 2 K+ 13
8 E.A. Mohamed et al.
In arid climates, chloride in water samples has a number ofsources including primary rainwater (‘‘cyclic salts’’ evaporated
in the soil and vadose zones during overland flow and from therivers), dissolution of halite from sedimentary bedrock, pollu-tion from domestic and industrial sources and road gritting
[35]. The Quaternary and Eocene deposits in the area are char-acterized by the presence of evaporite deposits. The dissolutionof halite is clearly indicated through the direct relationship
between Cl and Na (Fig. 7a).The Gibbs plot (Fig. 5b) shows a steady increase in the Cl
concentration from the freshwater source (Bahr Youssef)toward the lower lake. This is associated with an increase in
the Na concentration that moves toward higher Na/(Na + Ca) ratio, rather than what is expected if extreme evap-oration was the main factor controlling the cation ratio, espe-
cially in the samples collected from Bahr Youssef, thecultivated land drainage and sample No. 32 from the upperlake waters (the samples plotted outside the dashed zone on
the Gibbs plot). This means that cation exchange (reactions3a and b in Fig. 7a) is responsible for the slight increase inNa concentration over that expected from halite dissolution(samples plotted above the 1:1 line in Fig. 7a). In addition,
the increase of the non-chloride Na and K at the expense ofCa and/or Mg or HCO3 in the samples from the upper lake,fish farms and lower lake (Fig. 7d and e) could be associated
with clay mineral dissolution (reactions 12 and 13) releasing
Please cite this article in press as: Mohamed EA et al., Hydrogeochemical evolutionRaiyan depression, Egypt, J Adv Res (2015), http://dx.doi.org/10.1016/j.jare.2014.1
some Na and K ions unrelated to Cl. Another source of Kcould be potassium sulfate fertilizers.
Chloride can be an important source of pollution for manyrivers [35]. Berner and Berner [36] estimated that approxi-mately 30% of Cl in river water arises from pollution. Domes-
tic sewage contains considerable Cl due to the consumption oftable salts by humans. Chlorination of public water suppliesfor purification adds significant Cl to the Cl concentration of
water. Other sources of Cl include fertilizers.By assuming that chloride is conservative (not involved in
geochemical reactions with the soil or bedrock) and becauseof salt recycling [36], it can be shown that evaporation together
with the dissolution of halite, which is available in the bedrocklithology (reaction 8, Table 2), are the most effective controlsof the evolution of Cl concentration in the surface waters of
the study area. The surrounding area is represented by agricul-tural lands and rural communities. The latter is characterizedby the absence of closed sewage networks, where the sewage
is completely drained through septic tanks that possibly leaksewage water to irrigation or drainage surface water channels.The drainage of cultivated lands and the domestic use of chlo-rinated water are among the parameters that represent the
basic sources of Cl in the drainage water of the studied area.Due to the scarcity of the mineral sylvite in evaporites, as it
deposited in very restricted conditions, dissolution of sylvite as
another source of Cl cannot be expected (Fig. 7b). In addition,
of inland lakes’ water: A study of major element geochemistry in the Wadi El2.008

Fig. 6 Relationships between different ratios and ionic concentrations versus bicarbonate and sulfate concentrations.
Hydrogeochemistry of waters from Wadi El Raiyan depression 9
cation exchange and clay minerals dissolution control the con-
centrations of Na and K ions in the surface waters understudy.
Alkalinity and carbonate mineral reactions
Bicarbonate has a number of sources in surface waterincluding rain, dissolution and dissociation of biogenic soil
Please cite this article in press as: Mohamed EA et al., Hydrogeochemical evolutionRaiyan depression, Egypt, J Adv Res (2015), http://dx.doi.org/10.1016/j.jare.2014.12
gas (reaction 1, Table 2) and dissolution of carbonate minerals
(reaction 5, Table 2).The pH of most natural waters is controlled by reactions
involving the carbonate system. To obtain a pH above 7, it
is necessary to introduce cations other than H+ [37]. All watersamples collected from the area are alkaline, with pH valuesabove 7 (Table 1). The main anionic concentration in the fresh-water (Bahr Youssef) is HCO3. In the cultivated land drainage,
of inland lakes’ water: A study of major element geochemistry in the Wadi El.008

Fig. 7 Relationships between different ionic concentrations versus bicarbonate and chloride concentrations.
10 E.A. Mohamed et al.
TDS and HCO3 concentrations increase (Fig. 4b). Conversely,the pH is not significantly correlated with HCO3 (Fig. 4b) andis slightly lower than that of Bahr Youssef. This can be inter-
preted as a result of dissolution of atmospheric CO2 and nitri-fication (reaction numbers 1 and 10, respectively, Table 2). Asthe system is completely open, there is a continuous influx ofCO2 into the water from the atmosphere, biological processes
in the soil, and via the oxidation of dead organic matter (reac-tion 2, Table 2). The high concentration of NO3 in the watersamples in the drains from cultivated land means that the nitri-
fication process has been active due to contamination from thedecay of plant remains, thereby increasing the acidity of thewater. The increase of mH+ in the water has been buffered
by the increase in HCO3 concentration due to complete disso-lution of carbonate minerals (reactions 5a, c, Table 2 andFig. 4b). In the lakes, pH increases as the TDS increases(Table 1) due to the dissolution of carbonate minerals, accom-
panied by the reduction of pH. Therefore, besides the completecarbonate dissolution reactions (reactions 5a, c), reactions 5b,d also prevail, as they require an acid environment (Fig. 4 and
Table 2).The water in Bahr Youssef is undersaturated with respect to
carbonate minerals, calcite and dolomite (Fig. 8). A saturation
state has been achieved in the cultivated land drains, suggest-
Please cite this article in press as: Mohamed EA et al., Hydrogeochemical evolutionRaiyan depression, Egypt, J Adv Res (2015), http://dx.doi.org/10.1016/j.jare.2014.1
ing dissolution of carbonate minerals (i.e., the Ca, Mg andHCO3 concentrations increase). At the same time, the dissolu-tion of evaporites, especially gypsum, increases the concentra-
tion of Ca that drives up the saturation state of carbonateminerals, leading to their precipitation. The decrease in Caand Mg concentrations due to the precipitation of carbonateminerals causes the Na/Na + Ca ratio to shift to the right
(Fig. 5a) and below the 1:1 equivalent line with HCO3
(Fig. 6a and b).In the depression lakes (upper and lower lakes), the increase
in TDS is accompanied by an increase in the concentration ofCa, Mg and SO4. With continuous sources of HCO3, the sat-urated state of calcite and dolomite is driven up, leading to
their precipitation. As a result of calcite precipitation in theearly stage of evaporation process [37], Ca is removed fromthe system. Accordingly, Mg concentration increases onaccount of Ca until the saturation of dolomite has been
achieved (Fig. 8).In the lower lake, evaporation with a continuous dissolu-
tion of evaporite may concentrate SO4, Cl and Na. The contin-
uous precipitation of carbonate minerals (Fig. 8) decreases theconcentration of HCO3 as well as Ca and Mg (Figs. 4 and 5),and thus cation exchange processes compensate the decrease in
Ca and Mg concentrations (reaction 4, Fig. 6a–f).
of inland lakes’ water: A study of major element geochemistry in the Wadi El2.008

Fig. 8 Saturation indices of calcite, dolomite and gypsum for the collected water samples.
Hydrogeochemistry of waters from Wadi El Raiyan depression 11
Possible sources of sulfate
Potential sources of elevated sulfate in surface water include
gypsum dissolution (reaction 9), pyrite oxidation (reaction 6)and anthropogenic pollution. It is possible that a significantpercentage of sulfates in surface water is from pollutionsources, including burning of sulfur-rich fossil fuels, direct
industrial discharge, treated sewage release and K-sulfatefertilizers [38,36].
Sulfate equivalent concentration in the irrigation water
(Bahr Youssef) is 0.7 and increases to an average of 27.5 inthe drainage water from cultivated land. There is a significantcorrelation between Ca and SO4 in these waters (R2 = 0.9) in
the direction of reaction 9, dissolution of evaporites (Fig. 6e).However, pyrite oxidation should be ruled out as beingresponsible for increased SO4 (reaction 6) because there is no
increase in SO4 concentration more than expected fromevaporite dissolution (Fig. 6). If the sulfate came from pollu-tion, it would be necessary to invoke a similar pollution sourceof calcium. This would be difficult to explain because calcium
is not normally a consequence of pollution [36]. This seems tosuggest that evaporite dissolution mainly controls the SO4
concentration in the drain water. Such an increase is supported
by the increase of Na and Cl [38] that is reflected in the increaseof TDS from 269 in Bahr Youssef to 717 mg/l in the cultivatedland drainage water.
The dissolution of gypsum from the soil of the cultivatedland and the use of superphosphate fertilizers enhances theconcentration of Ca in the drainage water. Therefore, thesaturation indices of the carbonate minerals (calcite and dolo-
mite) have been increased in the cultivated land drainage aswell as the saturation index of gypsum; however, the water isstill undersaturated with respect to gypsum (Fig. 8). The
concentration of magnesium is apparently controlled by the
Please cite this article in press as: Mohamed EA et al., Hydrogeochemical evolutionRaiyan depression, Egypt, J Adv Res (2015), http://dx.doi.org/10.1016/j.jare.2014.12
dissolution of carbonate minerals rather than dissolution of
evaporite (Fig. 6f–h).In the Wadi El Raiyan lakes (upper and lower lakes), the
equivalent concentrations of SO4 increase from 14.6 to approx-
imately 50 meq/l in the upper lake and lower lake, respectively.
The anionic composition is in the order Cl > SO4 > HCO3,
which means that the increase in the TDS resulted in the
increase of SO4 over HCO3. In the waters of the upper lake
and fish farms (Fig. 6e), there is an increase of SO4 over that
expected from gypsum dissolution. This means that other pro-
cesses, possibly iron sulfide oxidation, could be operating in
the upper lake and fish farms (reaction 6). The high values
of TDS in these waters are mainly due to evaporation, which
raises the concentration of all water chemical components.
The lower lake is a closed lake where the annual evapora-tion is extremely high and exceeds the inflow. The water in this
lake is salty, which could be due to either evaporation, salineinflow, or both [39]. Because the lake has no outlet, and the cli-matic conditions are typically arid throughout most of the
year, the lake water gradually evaporates and its salinityincreases. The lower lake is recharged by waters of SO4 equiv-alent concentration of approximately 14.6 from the upper lake;this water is subjected to intensive evaporation that increases
the SO4 equivalent to approximately 50 meq/l. The anionicconcentration follows the same order as in the upper lake(Cl > SO4 > HCO3); however, the average TDS increases
from approximately 2658 mg/l in the upper lake to approxi-mately 14963 mg/l in the lower lake. Fig. 6e shows that the cor-relation between SO4 and Ca is not significant (R2 = 0.4) with
respect to the waters of the upper and lower lakes, except forfour (grouped) samples taken from the lower lake. These foursamples (samples 3, 7, 9 and 12, Table 1) are characterized by a
higher BOD compared to the remaining lower lake samples.This means that biological processes, especially fish respiration,
of inland lakes’ water: A study of major element geochemistry in the Wadi El.008
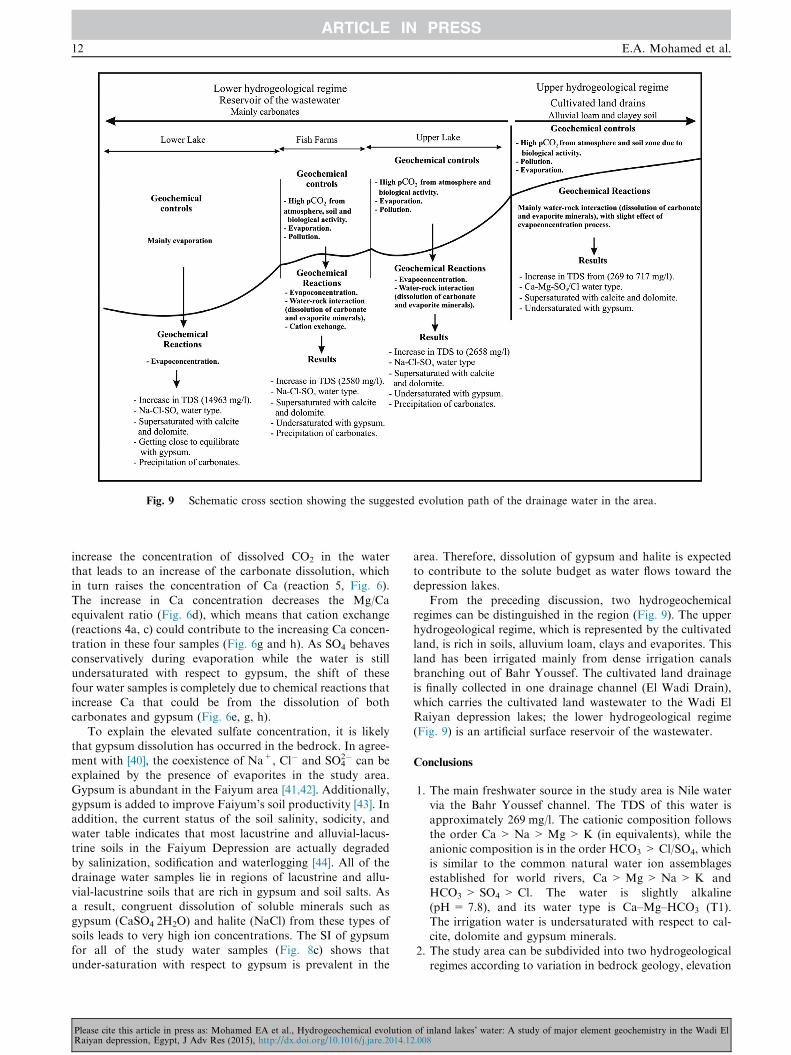
Fig. 9 Schematic cross section showing the suggested evolution path of the drainage water in the area.
12 E.A. Mohamed et al.
increase the concentration of dissolved CO2 in the waterthat leads to an increase of the carbonate dissolution, whichin turn raises the concentration of Ca (reaction 5, Fig. 6).
The increase in Ca concentration decreases the Mg/Caequivalent ratio (Fig. 6d), which means that cation exchange(reactions 4a, c) could contribute to the increasing Ca concen-
tration in these four samples (Fig. 6g and h). As SO4 behavesconservatively during evaporation while the water is stillundersaturated with respect to gypsum, the shift of these
four water samples is completely due to chemical reactions thatincrease Ca that could be from the dissolution of bothcarbonates and gypsum (Fig. 6e, g, h).
To explain the elevated sulfate concentration, it is likelythat gypsum dissolution has occurred in the bedrock. In agree-ment with [40], the coexistence of Na+, Cl� and SO4
2� can beexplained by the presence of evaporites in the study area.
Gypsum is abundant in the Faiyum area [41,42]. Additionally,gypsum is added to improve Faiyum’s soil productivity [43]. Inaddition, the current status of the soil salinity, sodicity, and
water table indicates that most lacustrine and alluvial-lacus-trine soils in the Faiyum Depression are actually degradedby salinization, sodification and waterlogging [44]. All of the
drainage water samples lie in regions of lacustrine and allu-vial-lacustrine soils that are rich in gypsum and soil salts. Asa result, congruent dissolution of soluble minerals such as
gypsum (CaSO4Æ2H2O) and halite (NaCl) from these types ofsoils leads to very high ion concentrations. The SI of gypsumfor all of the study water samples (Fig. 8c) shows thatunder-saturation with respect to gypsum is prevalent in the
Please cite this article in press as: Mohamed EA et al., Hydrogeochemical evolutionRaiyan depression, Egypt, J Adv Res (2015), http://dx.doi.org/10.1016/j.jare.2014.1
area. Therefore, dissolution of gypsum and halite is expectedto contribute to the solute budget as water flows toward thedepression lakes.
From the preceding discussion, two hydrogeochemicalregimes can be distinguished in the region (Fig. 9). The upperhydrogeological regime, which is represented by the cultivated
land, is rich in soils, alluvium loam, clays and evaporites. Thisland has been irrigated mainly from dense irrigation canalsbranching out of Bahr Youssef. The cultivated land drainage
is finally collected in one drainage channel (El Wadi Drain),which carries the cultivated land wastewater to the Wadi ElRaiyan depression lakes; the lower hydrogeological regime
(Fig. 9) is an artificial surface reservoir of the wastewater.
Conclusions
1. The main freshwater source in the study area is Nile water
via the Bahr Youssef channel. The TDS of this water isapproximately 269 mg/l. The cationic composition followsthe order Ca > Na >Mg >K (in equivalents), while the
anionic composition is in the order HCO3 > Cl/SO4, whichis similar to the common natural water ion assemblagesestablished for world rivers, Ca > Mg> Na> K and
HCO3 > SO4 > Cl. The water is slightly alkaline(pH= 7.8), and its water type is Ca–Mg–HCO3 (T1).The irrigation water is undersaturated with respect to cal-cite, dolomite and gypsum minerals.
2. The study area can be subdivided into two hydrogeologicalregimes according to variation in bedrock geology, elevation
of inland lakes’ water: A study of major element geochemistry in the Wadi El2.008
Hydrogeochemistry of waters from Wadi El Raiyan depression 13
and other factors and activities that control geochemical
reactions.3. The dissolution of carbonate and evaporite minerals in
addition to cultivation, anthropogenic sources of pollution,
and evaporation increase the average TDS to approxi-mately 717 mg/l in the cultivated land drainage. Na andCl ions increase in these waters due to dissolution ofhalite and pollution, leading to a change in the cationic
and anionic order to follow Na > Ca > Mg> K andCl > HCO3 > SO4. The water type developed toNa-SO4/Cl (T2), which tends to be predominantly influ-
enced by the chemical weathering of rocks and minerals.The water becomes saturated to supersaturated withcarbonate minerals.
4. El Wadi Drain discharges its drainage water to the upperlake. The lake has been formed in carbonate rocks. Thedrainage water is detained in this lake before reaching thelower lake. Evapoconcentration and water–rock interaction
enhance the average TDS to become 2658 mg/l.
The water becomes alkaline (pH = 8.5). The ionic constit-
uents of the water follow the same order as that in the culti-vated drainage except that the SO4 concentration exceeds theHCO3 concentration. This could be accompanied by the pre-
cipitation of carbonate minerals as the water becomes com-pletely supersaturated with respect to calcite and dolomite.The water type becomes completely Na–Cl–SO4 (T2).
5. The area of fish farms is located between the upper andlower lakes and is mainly recharged from the upper lakewater. This area is also surrounded by wild and cultivated
lands on a plausible soil thickness rich in clays. The factorscontrolling the chemical composition of the drainage waterin this area are quite similar to those in the upper lake. The
final additional factor is the cation exchange process thatseems to be active due to the availability of clays in soilsthat are in contact with water rich in Na. This leads to
increases in the Ca concentration in the water and precipi-tation of carbonate minerals.
6. In the lower lake at the last station, the drainage water hasbeen detained for a long period. The only way to escape is
through evaporation. The evapoconcentration process withselective precipitation of some minerals mainly prevails andcontrols the chemical composition of the drainage water,
being alkaline (pH= 8.5) with Na-Cl-SO4 water type. Pre-cipitation of carbonate minerals is commonly expected. Thewater is going to equilibrate with gypsum.
Conflict of Interest
The authors have declared no conflict of interest.
Compliance with Ethics Requirements
This article does not contain any studies with human or animalsubjects.
Acknowledgments
The authors would like to express their appreciation to theteam of the central chemical analysis laboratories of the
Please cite this article in press as: Mohamed EA et al., Hydrogeochemical evolutionRaiyan depression, Egypt, J Adv Res (2015), http://dx.doi.org/10.1016/j.jare.2014.12
National Water Research Centre, El-Kanater El-Khairia,
Egypt, for doing the analysis.
References
[1] El-Shabrawy GM. Ecological studies on macrobenthos of Lake
Qarun, El-Fayum, Egypt. J Egypt Acad Soc Environ Dev
2001;2:29–49.
[2] Saleh MA. Ecological investigation of inorganic pollutants in
El-Faiyum and El-Raiyan aquatic environment. Supreme
Council of Universities, FRCU, Rep; 1985, p. 1–54.
[3] Sayed MF, Abdel-Satar AM. Chemical assessment of Wadi El-
Rayan lakes, Egypt. Am-Eurasian J Agric Environ Sci
2009;5(1):53–62.
[4] Mansour SA, Sidky MM. Ecotoxicological Studies. 6. The first
comparative study between lake Qarun and Wadi El-Rayan
wetland (Egypt), with respect to contamination of their major
components. Food Chem 2003;82:181–9.
[5] Abd-Ellah RG. Physical limnology of El-Fayoum depression
and their budget. PhD Thesis. Faculty of Science, South Valley
University; 1999. 140 pp.
[6] Clark FW. Data of Gechemistry, US Geol Surv. Bull., 5th ed.
US Government Printing Office, Washington, DC; 1924. p. 770.
[7] Alekin OA, Brazhnikova LV. Contribution to knowledge of
dissolved matter runoff at the earth’s surface. Gidrochim Mat
1960;32:12–34.
[8] Alekin OA, Brazhnikova LV. Dissolved matter discharge and
mechanical and chemical erosion. Int Assoc Sci Hydrol 1968;78:
35–41.
[9] Livingstone DA. Chemical composition of rivers and lakes.
Data of Chemistry, USGS prof 1963; Paper 440 G. p. 1–64.
[10] Gibbs RJ. Water chemistry of the Amazon River. Geochim
Cosmochim Acta 1972;36:1061–6.
[11] Stallard RF, Edmond JM. Geochemistry of the Amazon: 1.
Precipitation chemistry and the marine contribution to the
dissolved load at the time of peak discharge. J Geophys Res
1981;86:9844–55.
[12] Stallard RF, Edmond JM. Geochemistry of the Amazon: 2. The
influence of geology and weathering environment on the
dissolved load. J Geophys Res 1983;88:9671–88.
[13] Stallard RF, Edmond JM. Geochemistry of the Amazon: 3.
Weathering chemistry and limits to dissolved inputs. J Geophys
Res 1987;92:8293–302.
[14] Sarin MM, Krishnaswami S, Dili K, Somayajulu BLK, Moore
WS. Major ion chemistry of the Ganga-Brahmaputra river
system: weathering processes and fluxes to the bay of Bebgal.
Geochim Cosmochim Acta 1989;53:997–1009.
[15] Sarin MM, Krishnaswami S, Trivedi JR, Sharma KK. Major
ion chemistry of the Ganga source waters: weathering in the
high altitude Himalaya. Proc Ind Acad Sci (Earth Planet Sci)
1992;101:89–98.
[16] Galy A, France-Lanord C. Weathering processes in the Ganges-
Brahmaputra basin and the riverine alkalinity budget. Chem
Geol 1999;159:31–60.
[17] Gordeev VV, Sidorov LS. Concentrations of major elements and
their outflow into the Laptev Sea by the Lena River. Mar Chem
1993;43:33–45.
[18] Huh Y, Tsoi MY, Zaitsev A, Edmond JM. The fluvial
geochemistry of the rivers of eastern Siberia: I. Tributaries of
the Lena River draining the sedimentary platform of the
Siberian Craton. Geochim Cosmochim Acta 1998;62:1657–76.
[19] Huh Y, Panteleyev G, Babich D, Zaitsev A, Edmond JM. The
fluvial geochemistry of the rivers of Eastren Siberia: II.
Tributaries of the Lena, Omoloy, Yana, Indigirka/Kolyma,
and Anadyr draining the collisional/accretionary zone of the
Verkhoyansk and Cherskiy ranges. Geochim Cosmochim Acta
1998;62:2053–75.
of inland lakes’ water: A study of major element geochemistry in the Wadi El.008

14 E.A. Mohamed et al.
[20] Reeder SW, Hitchon B, Levinson AA. Hydrochemistry of the
surface waters of the Machenzie River drainage basin, Canada:
1. Factors controlling inorganic composition. Geochim
Cosmochim Acta 1972;36:181–92.
[21] Stallard RF, Koehnken L, Johnson MJ. Weathering processes
and the composition of inorganic material transported through
the Orinoco River system, Venezuela and Colombia. Geoderma
1991;51:133–65.
[22] Edmond JM, Palmer MR, Measures CI, Brown ET, Huh Y.
Fluvial geochemistry of the eastern slope of the northeastern
Andes and its fore deep in the drainage of the Orinoco in
Colombia and Venzuela. Geochim Cosmochim Acta 1996;60:
2949–76.
[23] Saleh MA, Ewane E, Jones J, Wilson BL. Monitoring Wadi El
Raiyan Lakes of the Egyptian Desert for Inorganic Pollutants
by Ion-Selective Electrodes, Ion Chromatography, and Inductively
Coupled Plasma Spectroscopy. Ecotoxicol Environ Saf 2000;45:
310–6.
[24] Saleh Mahmoud A, Saleh Mostafa A, Fouda Mostafa M, Saleh
Magdy A, Abdel Lattif Mohamed S, Wilson Bobby L. Inorganic
pollution of the Man-Made lakes of Wadi El-Raiyan and its
impact on aquaculture and wildlife of the surrounding Egyptian
desert. Arch Environ Contain Toxicol 1988;17:391–403.
[25] Said R. The geology of Egypt. Amsterdam: Elsevier; 1962, 377
pp.
[26] Hammad MA, Abo-El-Ennan SM, Abed F. Pedological studies
on the Fayoum area, Egypt, landscapes and soil morphology.
Egypt J Soil Sci 1983;23(2):99–114.
[27] Said R. The river Nile: geology, hydrology and
utilization. Amsterdam: Elsevier; 1993.
[28] Ghabbour TK. Soil salinity mapping and monitoring using
remote sensing and a geographical information system (some
applications in Egypt). Ph.D. Thesis, Fac of Sci, State
University, Ghent; 1988. 195pp.
[29] Shendi MM. Some mineralogical aspects of soil sediments with
special reference to both lithology and environmental conditions
of formation in Fayoum area, Egypt. Ph.D. Thesis, Fac of
Agriculture, El-Fayoum Cairo University, Egypt; 1990. 227 pp.
[30] Abdel Wahed MM, Mohamed EA, El-Sayed MI, M’nif A,
Sillanpaa M. Geochemical modeling of evaporation process in
Lake Qarun, Egypt. J Afr Earth Sci 2014;97:322–30.
[31] Parkhurst DL. User’s guide to PHREEQC- a computer
program for speciation, reaction-path, advective-transport, and
Please cite this article in press as: Mohamed EA et al., Hydrogeochemical evolutionRaiyan depression, Egypt, J Adv Res (2015), http://dx.doi.org/10.1016/j.jare.2014.1
inverse geochemical calculations. Water resources investigations
report 95-4227. USGS, Earth Sciences Information Section.
Box 25286, MS 517, Denver Federal Centre, Denver, CO80225;
1995. 151p.
[32] Chadha DK. A proposed new diagram for geochemical
classification of natural waters and interpretation of chemical
data. Hydrogeol J 1999;7:431–9.
[33] Gibbs RJ. Mechanisms controlling world water chemistry.
Science 1970;170(3962):1088–90.
[34] Gibbs RJ. Mechanisms controlling world water chemistry:
evaporation-crystallization process. Science 1971;172:871–2.
[35] Meybeck M. Concentrations des eaux fluviales en elements
majeurs et apports en solution aux oceans. Rev Geol Dyn
Geoger Phys 1979;21(3):215–46.
[36] Berner EK, Berner RA. Global environment: water, air, and
geochemical cycles. Prentice-Hall, Inc.; 1996, p. 376.
[37] Drever JI. The geochemistry of natural waters. third
ed. Englewood Cliffs, NJ: Prentice-Hall; 1997, 436 p..
[38] Hounslow AW. Water quality data. Analysis and
interpretation. New York: Lewis Publishers; 1995, p. 182.
[39] Eugster HP, Hardie LA. Saline Lakes. In: Lerman A, editor.
Lakes: chemistry, geology, physics. New York, NY: Springer;
1978. p. 237–93.
[40] Huang X, Sillanpaa M, Gjessing ET, Vogt DR. Water quality in
the Tibetan Plateau: major ions and trace elements in the
headwaters of four major Asian rivers. Sci Tot Environ
2009;407:6242–54.
[41] Aref MAM. Classification and depositional environments of
Quaternary pedogenic gypsum crusts (gypcrete) from east of the
Fayum Depression, Egypt. Sediment Geol 2003;155:87–108.
[42] Keatings KW, Hawkes I, Holmes JA, Flower RJ, Leng MJ,
Abu-Zied RH, et al. Evaluation of ostracod-based
palaeoenvironmental reconstruction with instrumental data
from the arid Faiyum Depression, Egypt. J Paleolimnol 2010;38:
261–83.
[43] Abdel Kawy WAM, Belal A. Use of satellite and GIS for soil
mapping and monitoring soil productivity of the cultivated land
in El-Fayoum Depression, Egypt. Arab J Geosci 2013;6(3):
723–32.
[44] Ali RR, Abdel Kawy WAM. Land degradation risk assessment
of El Fayoum Depression, Egypt. Arab J Geosci 2013;6(8):
2767–76.
of inland lakes’ water: A study of major element geochemistry in the Wadi El2.008
Copyright © 2022 FDOKUMEN