Desertification, salinization, and biotic homogenization in a dryland river ecosystem
Detection of process-related changes in plant patterns atextended spatial scales during early drylanddesertification
J O R G E A R E S , H E C T O R D E L VA L L E and A L E J A N D R O B I S I G A T O
National Patagonic Center, Boulevard Brown s/n, 9120 Puerto Madryn, Argentina
Abstract
Arid and semiarid shrublands occupy extensive land areas over the world, are
susceptible to desertification by anthropic use and can contribute to regional climate
change. These prompt the interest to monitor and evaluate these lands adequately in
order to detect early stages of degradation. Evaluation topics must refer to biology-
relevant characteristics of these systems, while simultaneously satisfying sampling
consistency over extended landscape areas. We present an analysis of process-relevant
parameters related to changes in the spatial arrangement of the plant canopy of
shrublands inferred from high-resolution panchromatic aerial photos and Interfero-
metric Synthetic Aperture Radar imagery. We obtained low-altitude images system-
atically located along several gradients of land-use intensity in a Patagonian Monte
shrubland in Argentina. Images were digitized to spatial resolutions ranging from 0.09 to
0.72m (pixel size) and the average values and an-isotropic characteristics of the plant
canopy patterns were quantified by means of a Fourier metric. We used radar-derived
imagery to overlay the panchromatic images on a digital elevation model in order to
study the correspondence of potential runoff patterns and the spatial arrangement of
plants. We related an-isotropic features of the plant canopy images to the prevailing
wind regime. Observed trends were further interpreted on the basis of a spatial-explicit
simulation model describing the dynamics of the main functional groups in the plant
community. We conclude that early stages of anthropic-driven dryland degradation in
the Patagonian Monte can be characterized by the incipient un-coupling of spatial
vegetation patterns from those of runoff at a landscape scale, and a progressive coupling
to the spatial pattern of the wind regime. The method and metrics we present can be
used to quantify early desertification changes in other similar drylands at extended
spatial scales.
Keywords: desertification, drylands, Patagonia, remote sensing, spatial-explicit models, spatial
vegetation patterns, wind erosion
Received 22 October 2002; revised version received 16 April 2003 and accepted 26 June 2003
Introduction
Arid and semiarid drylands compose one-third of the
land surface of the world (OIES, 1991). Among these,
shrublands (8.5� 106 km2) are fragile ecosystems prone
to desertification (In what follows, ‘desertification’
implies a ‘loss or spatial redistribution of net primary
productivity in arid and semiarid lands’ (Schlesinger
et al., 1990).), as indicated in the case of the Mojave
(Sharifi et al., 1999) and Chihuahuan (Schlesinger et al.,
1990) systems in northern America and semiarid
systems in central and southern Argentina (Busso,
1997). These systems share many structural and floristic
characteristics (Mares et al., 1985).
The detection, prevention and/or adaptation to
desertification and land degradation in general could
benefit from improved monitoring methods (Reynolds
et al., 2000). Monitoring shrublands in time to detect
early deterioration is an unresolved subject in most
cases. Most of our knowledge about the dynamics
of these systems comes from relatively restrictedCorrespondence: Jorge Ares, Cassila 76, 9120 Puerto Madryn,
Argentina, fax 1 54 2965 451021, e-mail: [email protected]
Global Change Biology (2003) 9, 1643–1659, doi: 10.1046/j.1529-8817.2003.00690.x
r 2003 Blackwell Publishing Ltd 1643
areas, including relatively small exclosures of major
herbivores used to draw comparisons about their effect
on the plant canopy (Brown & Waller, 1986). In many
cases, the available knowledge has been obtained with
techniques that are not amenable for use at a scale
commensurate with the extension of drylands. Some-
times the interpretation of data can be limited by pseudo-
replication effects imposed by the intensity of the
sampling effort required in field observations of large
terrestrial areas (Wester, 1992; Landsberg et al., 2002).
Identifying early desertification in shrublands also
requires the selection of adequate ‘signs’, or relevant
process-related parameters or monitorables to quantify
the processes occurring at early stages of land degrada-
tion. Changes in the net primary production (NPP)
have been indicated as conceptually adequate metrics
(Schlesinger et al., 1990) and remote-sensing techniques
have been applied to the analysis of the changes in time
of aboveground NPP-related spectral vegetation char-
acteristics in grazing gradients (Pickup et al., 1993,
1998). These experiences confirm that the aboveground
NPP is a highly time-unstable characteristic of dryland
ecosystems (Le Houerou et al., 1988). Interpreting its
changes in time requires a detailed record of the highly
variable precipitation events and the availability of
suitable (i.e. day-time, cloud free, etc.) remotely sensed
images some time (but in general shortly) after them.
Unfortunately, quantitative multi-temporal arid region
optical remote sensing is extremely difficult. In a recent
review of the applications of optical satellite-based
remote sensing, Okin (2001) concluded that despite
their great promise, these methods have not yet proved
capable of providing some types of information
pertinent to desertification such as plant community
composition.
Alternatively, the evaluation of changes of above-
ground NPP (or surrogate indicators) in space seems to
offer greater possibilities (Couteron & Lejeune, 2001;
Okin, 2001). Low (500oheighto700 m) aerial views of
the vegetation in semiarid shrublands exhibit a
spotted/banded pattern, where darker clumps or
patches correspond to the shrub components inter-
spersed on a background of lighter tones corresponding
to open-space soil or herbaceous sparse vegetation.
There are numerous indications that the spatial
distribution of vegetation in arid and semiarid lands
is relevant to interpret basic ecosystem processes. The
distribution of patches, their size and internal cover and
the amount of denuded soil change in various propor-
tions during shrubland deterioration by grazing or fire
(Bisigato & Bertiller, 1997; Dunkerley, 1997; Adler et al.,
2001). Consequently, with these, many functional
characteristics related to water balance and fertility
are modified, including or triggering losses of top soil,
increased wind and water erosion, etc. (Beeskow et al.,
1995; Schlesinger et al., 1996; Holm et al., 2001; Parizek
et al., 2002). While these changes are measurable in
labor-intensive field surveys, their detection by remote
sensing would require a pixel resolution smaller than
the scale of variability of the dominant elements
(shrubs, grass tussocks, soil patches). This type of
spatial resolution is not accessible in standard public-
domain remote imagery, but ad hoc high-resolution
aerial photographs can be used for this purpose
(Hudak & Wessman, 1998).
Runoff patterns are closely related to the spatial
structure of the plant canopy in drylands, as shown by
Greene & Ringrose-Voase (1994) and Dunkerley &
Brown (1999) in Australia, Galle et al. (1999) in Africa,
Bergkamp et al. (1999) in Europe and Delhoumme
(1996) in North America. Runoff patterns at a landscape
scale (4100 m) can be estimated by means of standard
statistical surface analysis techniques (Jenson &
Domingue, 1996) applied to digital elevation models
(DEM) based on InSAR (interferometric synthetic
aperture radar) remote imagery (Coulson, 1995). This
technique uses the phase information of a remote radar
signal by taking the difference in path length (distance)
from a given pixel on the Earth’s surface to each SAR
antenna. The phase difference for each pixel corre-
sponding to the same area of the ground is known as an
interferogram. Using the exact knowledge of the orbit
parameters corresponding to the location of the remote
sensor, the interferogram can be related directly to the
altitude of the satellite above the ground on a pixel-by-
pixel basis to generate a DEM. This is accomplished by
combining two radar images of the same ground area
taken from slightly differing orbiting angles.
In previous papers (Bertiller et al., 2002b; Ares et al.,
2003a,b), we presented metrics derived from the Four-
ier spectral theory that allow inspection of high-
resolution aerial photographs with the aim of detecting
patterns in the structure of the plant canopy related to
shrubland degradation by domestic grazing. The
technique draws on results on the mechanisms through
which sheep grazing impacts the structure of vegeta-
tion (Bisigato & Bertiller, 1997) and makes use of
gray-palette aerial photography digitized to a spatial
resolution of 1.5 m or less. Using this technique, and
validating its estimates with field sheep fecal counts,
long-term patterns of grazing use in the Patagonian
Monte have been characterized. In large grazed
paddocks with a single watering point located at one
corner, both direct and inverse (bimodal) types of
grazing gradients occur, but a direct trend (higher
grazing pressure around watering points, diminishing
at increasing distance from it) predominates when
gradients of several paddocks are pooled in a regional
1644 J . A R E S et al.
r 2003 Blackwell Publishing Ltd, Global Change Biology, 9, 1643–1659
estimate. The possible reasons for the existence of
inverse grazing gradients are the effect of nondomestic
grazers excluded from sheep-visited areas, and the
tendency of sheep to walk along the wind direction
(Ares et al., 2003a).
In this study, we develop and further apply the
technique to test its ability to quantify early stages of
structural change in the plant community of drylands
resulting from desertification mechanisms known to
operate at a large spatial scale in domestic grazing
systems in the southern Argentinian Monte. At these
spatial scales, the detection of incipient structural
changes is complicated by the occurrence of natural
variability. Sheep grazing in the Patagonian Monte has
been widespread during the last century, and no relict
areas where a characterization of natural variability
could be performed are now available. Spatial explicit
modeling of shrub-grass plant canopies based on the
changes observed in areas once intentionally denuded
and in long abandoned fields supplied estimates of the
spatial variability over large areas of the Patagonian
Monte in terms of the above-mentioned Fourier metrics
(Bisigato et al., 2002).
The emphasis in this paper is on the detection of
subtle structural changes at large spatial scales as
distinguished from approaches directed to evaluate
severe changes at small spatial scales (dune formation,
sand hummocks behind shrubs, deflation areas, etc.). In
accordance with this approach, we selected an experi-
mental system where desertification changes are not
strikingly evident, but only sparsely distributed indica-
tions of its occurrence exist, like in localized deflation
areas or small water channels barely distinguishable
from naturally occurring bare soil patches or natural
runoff rills. The overall question we address is: ‘Can
process-related metrics be developed that would
quantify these minor changes at large spatial scales,
where naturally occurring variability may mask their
detection?’.
Specifically, we tested the following hypotheses:
1. In drylands lightly grazed by domestic herbivores
(sheep) there is a component of large-scale spatial
vegetation patterns related to the long-term pattern
of herbivore use.
2. During early dryland degradation, the large-scale
spatial vegetation pattern is progressively un-
coupled from the landscape runoff system. This
implies a diminishing correlation between plant
canopy and runoff patterns as grazing impact
increases.
3. During early desertification, the spatial vegetation
pattern is progressively coupled to the pattern of the
wind regime. This implies an increasing correlation
between plant canopy and wind regime patterns as
grazing impact increases.
We tested these hypotheses on a series of high-
resolution aerial photographs along a transect in the
southern Patagonian Monte in sites where previous
field studies indicated the existence of sheep grazing
gradients, and discuss the implications of the results for
the identification and quantification of early stages of
desertification in these and other similar drylands.
Materials and methods
Description of the area
Observations on the spatial arrangement of plant
canopies were conducted in an area of about 300 km2
centered at 421380S, 651230W in the southern Patagonian
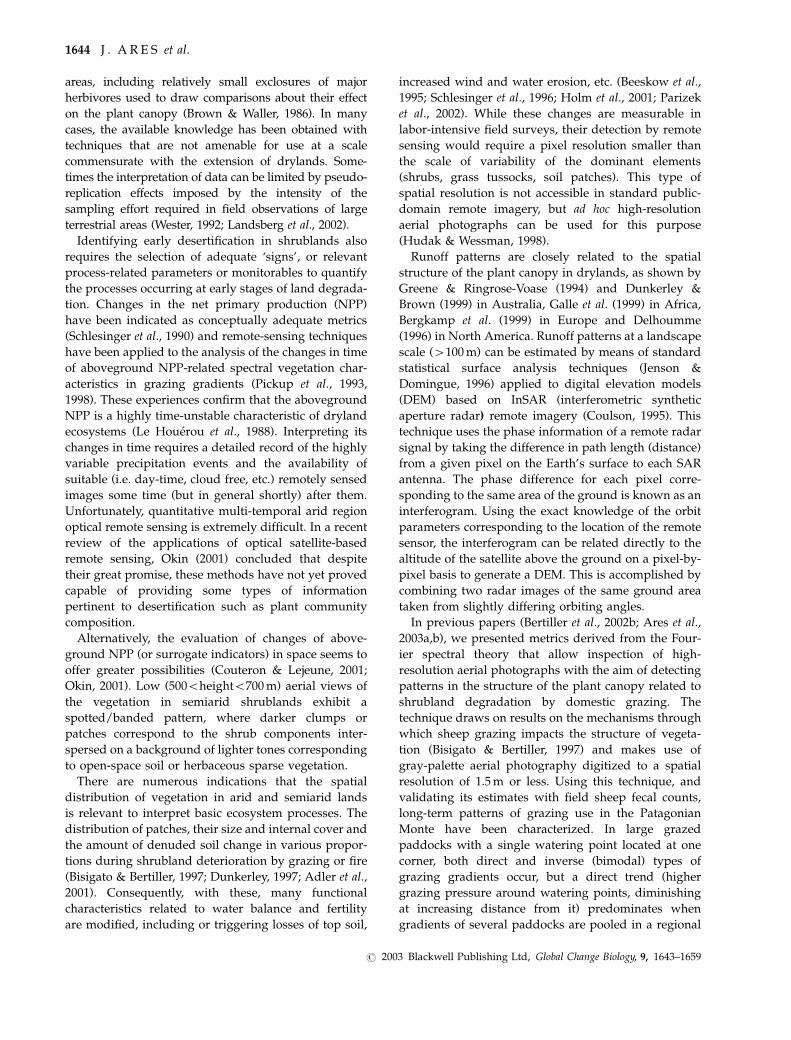
Monte (Chubut Province, Argentina, Fig. 1). The area
selected is characteristic of the plain plateaus of gravels
and the average annual rainfall (1975–1990) is 189 mm.
Single precipitation events as high as 90 mm day� 1
have been recorded in this period, producing signifi-
cant soil erosion, and intense showers are not rare. The
vegetation is tall-shrub steppe of Larrea spp. character-
istic of the southern portion of the Monte Phytogeo-
graphic Province, sharing floristic elements with the
northern Patagonian Province (Leon et al., 1998). The
vegetation is characteristic of the III Xeromorphic Tall
Shrub floristic unit described in Ares et al. (1990) and
Fig. 1 Location of the study site in South America, Argentina.
P L A N T PA T T E R N S I N E A R LY D R Y L A N D D E S E R T I F I C AT I O N 1645
r 2003 Blackwell Publishing Ltd, Global Change Biology, 9, 1643–1659
consists of patches of shrubs and perennial grasses,
covering 40–60% of the soil. Sheep were introduced in
the area at the beginning of last century (Defosse et al.,
1992) and are presently raised in large estancias
(10000 ha or more), usually consisting in several
paddocks around a shared watering place. In each
paddock, gradients of land degradation produced by
the concentration of sheep around watering places are
common (Bisigato & Bertiller, 1997). Information about
present and past sheep stocking rates, grazing pres-
sures and/or grazing exclusion records are available for
many paddocks during at least the last six decades. The
Usual present grazing pressures in these paddocks
range from 0.1 to 0.14 adult sheep ha� 1.
Field survey
A set of aerial photographs (�36 exposures) from the
fields were obtained on 29 May 2002 (morning flight,
solar azimuth 1 291 to 1 351 clockwise from N)) with a
regular auto-focusing 36 mm optical camera (Canon
EOS 500N, Miami, FL, USA). The camera was mounted
on the outside of the cabin of a two-seat ultra-light
plane flying at 660 m above ground level, such that it
would obtain nadir-oriented exposures when remotely
triggered from the inside of the cabin. The field covered
by a single exposure was estimated on the basis of a
ground calibration of the exposure field in relation to
the distance camera-object. Based on this, each expo-
sure was estimated to cover a ground area of 1.8E4 m2.
After inspection of this photo-set, it became evident
that testing Hypothesis 3 required obtaining new aerial
images where the predominant wind direction would
not overlap that of the sun-oriented plant shadows.
Accordingly, a new photo-set was obtained during an
afternoon flight on 31 July 2002 (solar azimuth: � 301 to
� 341, anticlockwise from N).
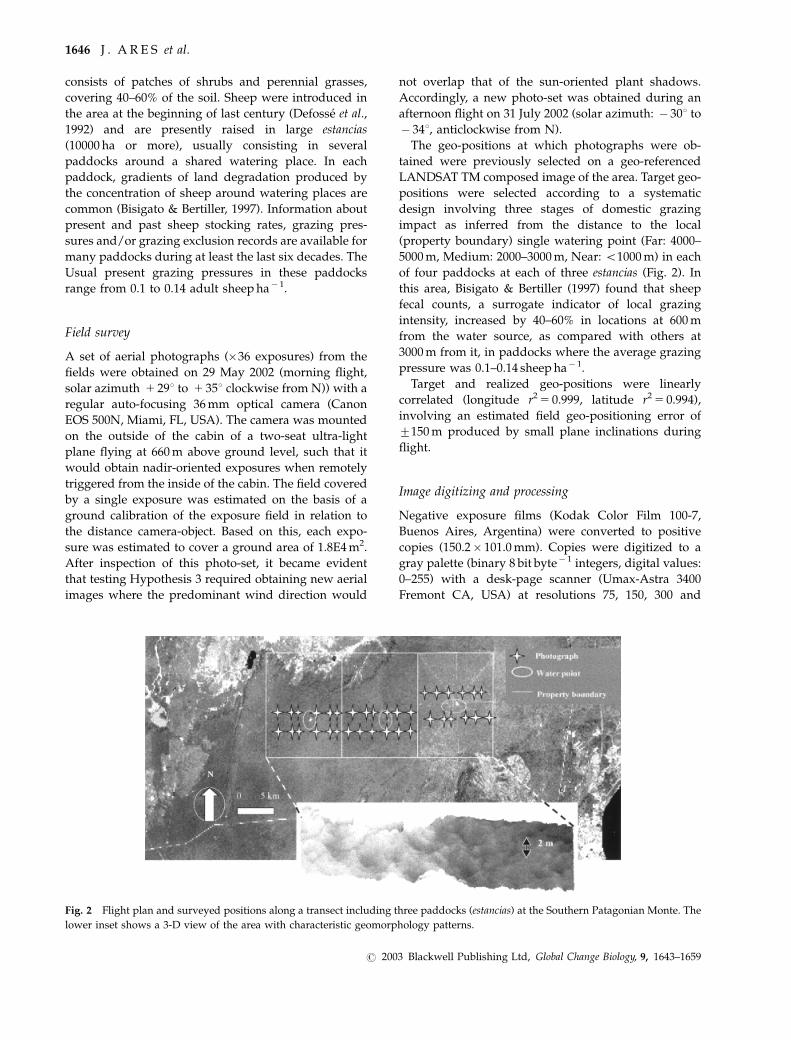
The geo-positions at which photographs were ob-
tained were previously selected on a geo-referenced
LANDSAT TM composed image of the area. Target geo-
positions were selected according to a systematic
design involving three stages of domestic grazing
impact as inferred from the distance to the local
(property boundary) single watering point (Far: 4000–
5000 m, Medium: 2000–3000 m, Near: o1000 m) in each
of four paddocks at each of three estancias (Fig. 2). In
this area, Bisigato & Bertiller (1997) found that sheep
fecal counts, a surrogate indicator of local grazing
intensity, increased by 40–60% in locations at 600 m
from the water source, as compared with others at
3000 m from it, in paddocks where the average grazing
pressure was 0.1–0.14 sheep ha� 1.
Target and realized geo-positions were linearly
correlated (longitude r25 0.999, latitude r25 0.994),
involving an estimated field geo-positioning error of
7150 m produced by small plane inclinations during
flight.
Image digitizing and processing
Negative exposure films (Kodak Color Film 100-7,
Buenos Aires, Argentina) were converted to positive
copies (150.2� 101.0 mm). Copies were digitized to a
gray palette (binary 8 bit byte� 1 integers, digital values:
0–255) with a desk-page scanner (Umax-Astra 3400
Fremont CA, USA) at resolutions 75, 150, 300 and
Fig. 2 Flight plan and surveyed positions along a transect including three paddocks (estancias) at the Southern Patagonian Monte. The
lower inset shows a 3-D view of the area with characteristic geomorphology patterns.
1646 J . A R E S et al.
r 2003 Blackwell Publishing Ltd, Global Change Biology, 9, 1643–1659
600 dpi. The scanning procedure resulted in gray-tone
scaling proportional to shrub1grass cover on a lighter
background corresponding to open soil patches. Several
digitizing alternatives available were explored and
discarded during preliminary trials either because they
generated impractical large digital files at the desired
resolution (real/true-color) noncontinuous (256 color)
or bilateral-saturated file histograms (exposure auto-
scaling). Images were further inspected for sub-satu-
rated value histograms, a necessary condition to
prevent information loss. Image pixels thus obtained
range from a spatial resolution of 0.09� 0.09 m (600 dpi)
to 0.72� 0.72 m (75 dpi) in the field. Statistical tests in
this study were applied to all resolution sets in order to
avoid eventual artifacts in pattern inference due to the
spatial resolution of the sampling procedure. Three
square-windows, where the lateral size (in pixel units)
satisfied the condition of being a power of 2, were
extracted from each rectangular image in a systematic,
nonoverlapping design (upper left, central, lower
right). This size condition is a requisite for the
application of the technique to characterize spatial
patterns, which is explained in what follows.
We characterized the spatial pattern of vegetation by
means of the Fourier signature S/N, (signal/noise ratio)
developed in previous studies (Ares et al., 2003a). The
S/N metric refers to the spatial arrangement of a linear
data vector, combining the evaluation of their departure
from a random distribution, and the relative size of the
‘peak’ values along the data string. Anisotropy in
spatial distribution can be evaluated by inspecting the
variation of S/N ratios in data transects with diverse
spatial orientation. The technique and some examples
that illustrate the meaning of the S/N ratio are sum-
marized in Appendix I. We wrote a computer code to
calculate the S/N ratios corresponding to 20–30 ran-
domly oriented transects in each photograph window.
Digital elevation model and potential runoff estimation
We analyzed a sector (421350S–651360W to 421410S–
651060W) of a digital elevation model (DEM) developed
at the Remote Sensing Data Center (DFD) of the
German Aerospace Center (DLR) and made available
in the scope of this study (del Valle et al., 2002). The
DEM was computed on the basis of four ascending and
one descending tandem from ERS/SAR 1-2 scenes with
different interferometric baselines. Tandem data were
selected based on usual criteria related to the coherence
and baseline characteristics (Coulson, 1995). The hor-
izontal DEM accuracy is 25 m, sampled at 1 m along the
elevation axis.
Rasterized fields of potential runoff values (mm of
water) (Jenson & Domingue, 1988) were computed over
the area covered by the DEM, and local average values
were computed for windows of 12� 12 pixels
(300� 300 m) centered at the estimated realized central
geoposition of each photograph. The algorithm to
calculate the potential runoff uses the information
stored in the DEM, estimates local slopes and pixel
orientations, and calculates the total amount of water
potentially flowing through each image pixel in case all
pixels would receive 1 mm of rain. Potential runoff is a
surrogate estimate of actual runoff, since it can be
expected that water will always flow along decreasing
height gradients, although with different intensities
depending on the intensity of the precipitation event.
Meteorological data
Analysis of spatial an-isotropy of the plant canopy in relation
to the wind regime
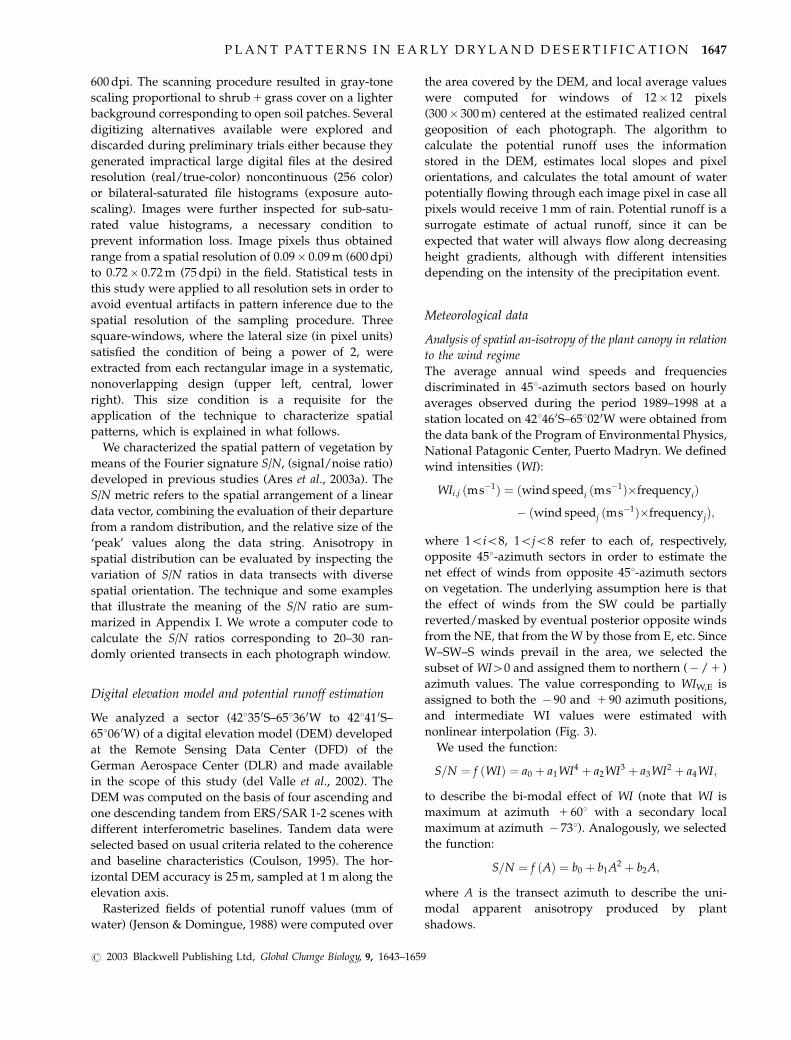
The average annual wind speeds and frequencies
discriminated in 451-azimuth sectors based on hourly
averages observed during the period 1989–1998 at a
station located on 421460S–651020W were obtained from
the data bank of the Program of Environmental Physics,
National Patagonic Center, Puerto Madryn. We defined
wind intensities (WI):
WIi;j ðms�1Þ ¼ ðwind speedi ðms�1Þ�frequencyiÞ
� ðwind speedj ðms�1Þ�frequencyjÞ;
where 1oio8, 1ojo8 refer to each of, respectively,
opposite 451-azimuth sectors in order to estimate the
net effect of winds from opposite 451-azimuth sectors
on vegetation. The underlying assumption here is that
the effect of winds from the SW could be partially
reverted/masked by eventual posterior opposite winds
from the NE, that from the W by those from E, etc. Since
W–SW–S winds prevail in the area, we selected the
subset of WI40 and assigned them to northern (�/1 )
azimuth values. The value corresponding to WIW,E is
assigned to both the � 90 and 1 90 azimuth positions,
and intermediate WI values were estimated with
nonlinear interpolation (Fig. 3).
We used the function:
S=N ¼ f ðWIÞ ¼ a0 þ a1WI4 þ a2WI3 þ a3WI2 þ a4WI;
to describe the bi-modal effect of WI (note that WI is
maximum at azimuth 1 601 with a secondary local
maximum at azimuth � 731). Analogously, we selected
the function:
S=N ¼ f ðAÞ ¼ b0 þ b1A2 þ b2A;
where A is the transect azimuth to describe the uni-
modal apparent anisotropy produced by plant
shadows.
P L A N T PA T T E R N S I N E A R LY D R Y L A N D D E S E R T I F I C AT I O N 1647
r 2003 Blackwell Publishing Ltd, Global Change Biology, 9, 1643–1659
Spatial simulation model
In order to explore the numerical feasibility and
internal consistency of the tested hypotheses about
the dynamics of vegetation patterns, we used a
previously developed (Bisigato et al., 2002) spatial-
explicit, difference equation, dynamic cellular automata
model (Baker, 1989; Wiegand et al., 1995). The model
(PATCHGEN, Table 1, Fig. 4) simulates the development
of vegetation canopies in Monte shrublands on the
basis of a set of rules related to the allometry of shrubs
and perennial grasses and the observed carrying
capacity of relatively undisturbed field sites with
respect to them. The growth of shrubs and perennial
grasses is conceived as depending on the existent
volume at each grid element and the volumes of plants
of the same type diffusing to/from neighbor grid cells.
An-isotropic growth can be introduced in the model at
451 intervals, by assuming different diffusive growth
rates to cells in the octet surrounding each grid cell.
Allometric descriptors of shrubs and grasses are
introduced by assuming a frequency distribution of
plant volume sizes similar to those observed in
relatively undisturbed fields. Increasing runoff inten-
sity reduces the potential plant size (carrying capacity)
at each microsite, implying an increased local nutrient
loss (Dunkerley & Brown, 1999). The effect of sheep
grazing on the structure on the plant canopy is
introduced by assuming that sheep select the most
productive plant patches nearby before starting con-
sumption at a next neighboring patch, moving to
another grazing station when no neighbor patch offers
biomass above a critical threshold level (Ares et al.,
2003a). The model generates several types of outputs,
including Fourier analysis of random linear transects
and raster grids compatible with display color palettes
scaled as needed to mimic field aerial photographs at
various spatial resolutions.
Statistical analysis and numerical simulation
Preliminary searches of spatial patterns in digitized
field photographs and in model-output imagery were
performed with software developed for percolation
analysis (Milne et al., 1999). The average grazing impact
was assumed to be at a highest level at places near the
watering sources, intermediate at mid-away positions
and lighter at the farther positions (Fig. 2). The null
Hypothesis 1 (no grazing effect upon plant spatial
distribution) was tested by comparing the frequency
distributions of S/N values at Far, Medium and Near
positions (12 exposures� 20 transects� 4 spatial reso-
lutions5 960 values/position) by means of a nonpara-
metric w2 test (Crow et al., 1993).
The null hypothesis 2 (relation of vegetation pattern
to runoff not depending on grazing impact) was tested
by inspecting the linear correlation between the average
S/N of exposures at Far, Medium and Near positions
(dependent variable) with the corresponding average
potential runoff values (independent variable). The
linear correlation was selected as an estimate of
Euclidean distance of the data points to a reference
function, and parsimony search indicated that the fit
did not improve for fitting functions of higher order.
This, however, should not be interpreted sensu stricto to
Fig. 3 The average annual wind regime in the study area. (a)
Frequencies, velocities and Wind Intensities (WI) pooled by 451-
azimuth sectors as defined in the text. (b) Discrete vector
representation. (c) Continuous fitted function.
1648 J . A R E S et al.
r 2003 Blackwell Publishing Ltd, Global Change Biology, 9, 1643–1659
imply that a linear relation is proposed for the data (or
the underlying process they describe), in fact any
higher order function would have served the purpose
of obtaining descriptors based on Euclidean distances
to a reference function. Estimates at all spatial resolu-
tions (12 windows� 4 resolutions� 3 positions5 144
average values) were used to build confidence intervals
for the correlation coefficients by randomly sampling
across resolutions according to a Monte Carlo proce-
dure. The correlation estimates were then regressed
against distance to the watering point and the most
significant trend was identified along a new parsimo-
nious search sequence.
Additionally, the consistency of a mechanistic ex-
planation for the observed trend relating spatial
patterns and runoff was tested with PATCHGEN by
running the model on potential runoff surfaces corre-
sponding to the sample photographed field areas.
The null hypothesis 3 (no anisotropy related to
regional wind pattern) was tested on the photo-set
obtained on 31 July 2002, since the solar azimuth tends
to be perpendicular to WI directions during postmeri-
dian time in the region of predominant westerly winds
of the southern hemisphere. In this photo-set, plant
solar shadows appear at an angle 70–751 with respect to
the annual average predominant WI-azimuth. This
enhances the ability of statistical tests to discriminate
between apparent anisotropy in the aerial images
produced by sun-shadow effects from eventual actual
anisotropy produced by winds. The nonlinear correla-
tion between S/N values at Far, Medium and Near
positions (dependent variable) with WI and A were
computed. Both functions were regressed jointly and
separately as independent variables against the S/N
values (dependent variable), in order to discriminate
the magnitude of the an-isotropic effects associated to
each of them.
Three windows (upper left, center, lower right) were
sampled within each exposure. A total of 20 values/
window� 12 exposures� 3 windows/exposure5 720
S/N values were used for each position in these
analyses. An-isotropic effects were also simulated with
PATCHGEN at the observed range of runoff values, by
assuming that the lateral diffusive growth at each pixel
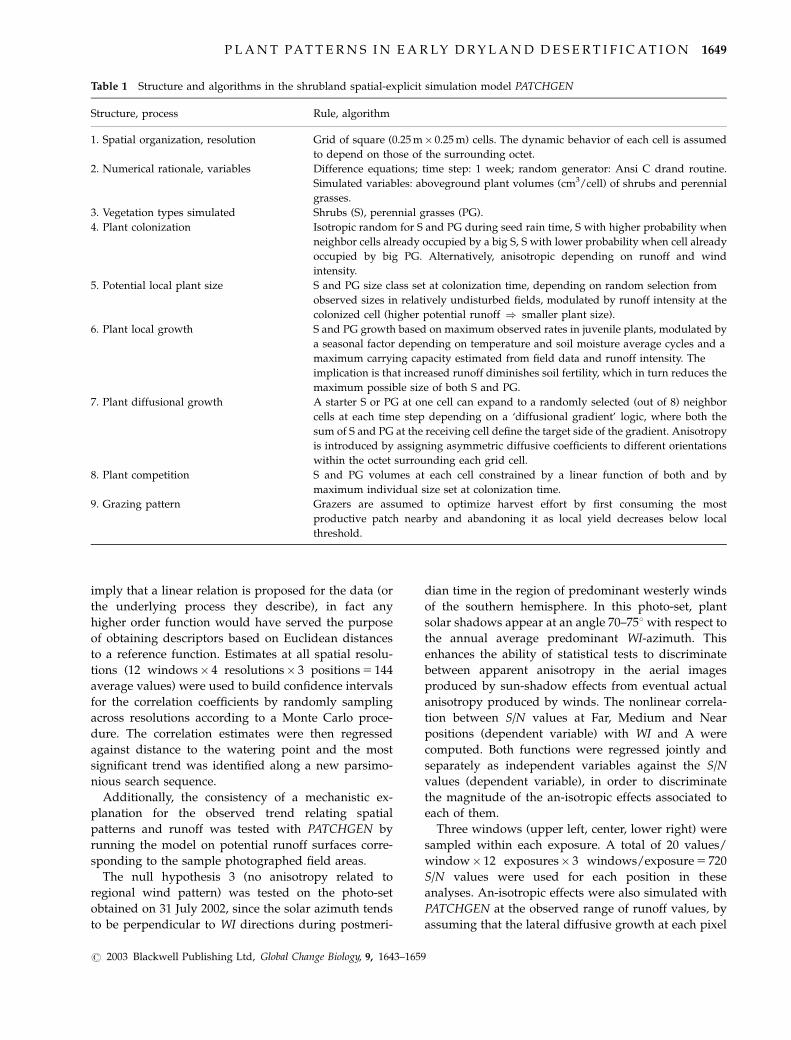
Table 1 Structure and algorithms in the shrubland spatial-explicit simulation model PATCHGEN
Structure, process Rule, algorithm
1. Spatial organization, resolution Grid of square (0.25 m� 0.25 m) cells. The dynamic behavior of each cell is assumed
to depend on those of the surrounding octet.
2. Numerical rationale, variables Difference equations; time step: 1 week; random generator: Ansi C drand routine.
Simulated variables: aboveground plant volumes (cm3/cell) of shrubs and perennial
grasses.
3. Vegetation types simulated Shrubs (S), perennial grasses (PG).
4. Plant colonization Isotropic random for S and PG during seed rain time, S with higher probability when
neighbor cells already occupied by a big S, S with lower probability when cell already
occupied by big PG. Alternatively, anisotropic depending on runoff and wind
intensity.
5. Potential local plant size S and PG size class set at colonization time, depending on random selection from
observed sizes in relatively undisturbed fields, modulated by runoff intensity at the
colonized cell (higher potential runoff ) smaller plant size).
6. Plant local growth S and PG growth based on maximum observed rates in juvenile plants, modulated by
a seasonal factor depending on temperature and soil moisture average cycles and a
maximum carrying capacity estimated from field data and runoff intensity. The
implication is that increased runoff diminishes soil fertility, which in turn reduces the
maximum possible size of both S and PG.
7. Plant diffusional growth A starter S or PG at one cell can expand to a randomly selected (out of 8) neighbor
cells at each time step depending on a ‘diffusional gradient’ logic, where both the
sum of S and PG at the receiving cell define the target side of the gradient. Anisotropy
is introduced by assigning asymmetric diffusive coefficients to different orientations
within the octet surrounding each grid cell.
8. Plant competition S and PG volumes at each cell constrained by a linear function of both and by
maximum individual size set at colonization time.
9. Grazing pattern Grazers are assumed to optimize harvest effort by first consuming the most
productive patch nearby and abandoning it as local yield decreases below local
threshold.
P L A N T PA T T E R N S I N E A R LY D R Y L A N D D E S E R T I F I C AT I O N 1649
r 2003 Blackwell Publishing Ltd, Global Change Biology, 9, 1643–1659
octet was proportionally related to the annual pattern
of WI (see also Table 1).
Results
Hypothesis 1: Grazing modifies the spatial pattern of thevegetation canopy
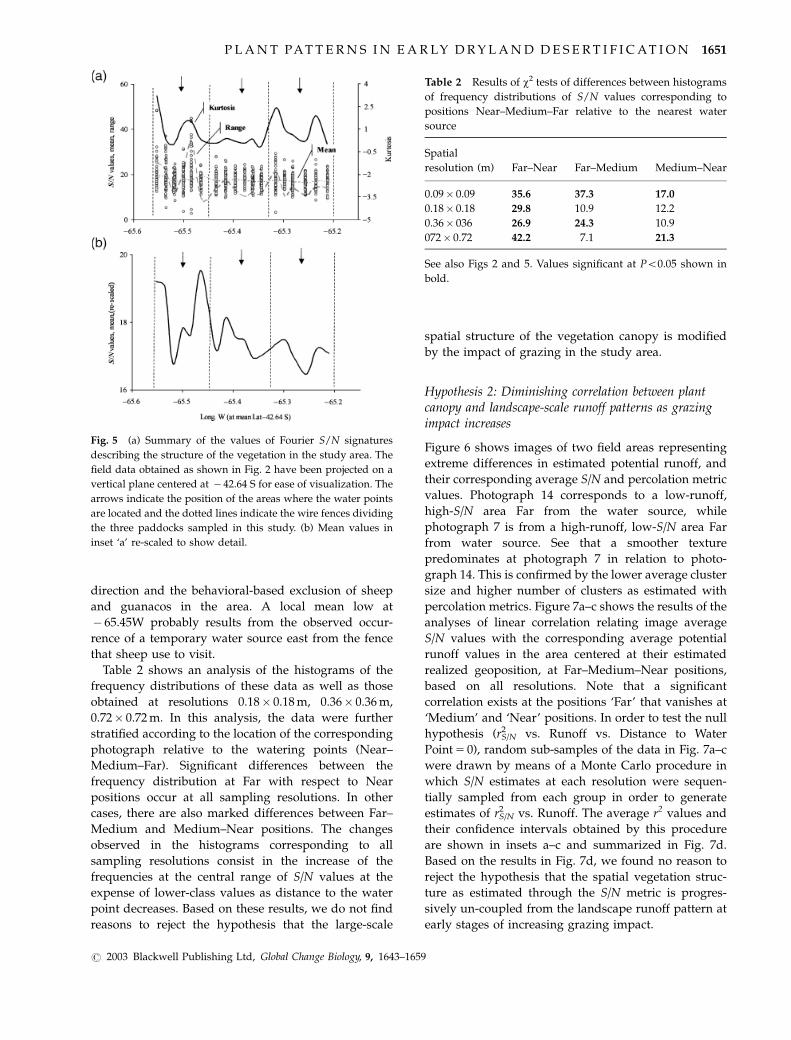
Figure 5a and b shows a summary of the values of
Fourier S/N signatures describing the structure of the
vegetation in the study area at spatial resolutions
0.09� 0.09 m. The field data obtained as shown in Fig.
1 have been projected on a vertical plane centered at
� 42.64 S for ease of visualization. The arrows indicate
the position of the areas where the water points are
located and the dotted lines indicate the wire fences
dividing the three paddocks sampled in this study (see
also Fig. 2). The picture is equivalent to considering a
lateral view of the study area, where the position of
water points and paddock wire fences is also indicated.
Note that data means, ranges and kurtoses show
regular local lows in approximate coincidence with
the location of water points (arrows). Other less marked
local minima also occur along easterly wire-fences.
These trends indicate that the large spatial (200–300 m)
variability of the plant structure diminishes near water
points (where fecal counts indicate a higher grazing
intensity) or at places where sheep tend to concentrate
during wind storms. Mechanisms that account for
higher grazing intensity along easterly fence lines have
been discussed in our previous study (Ares, 2003a) and
include the tendency of sheep to walk along the wind
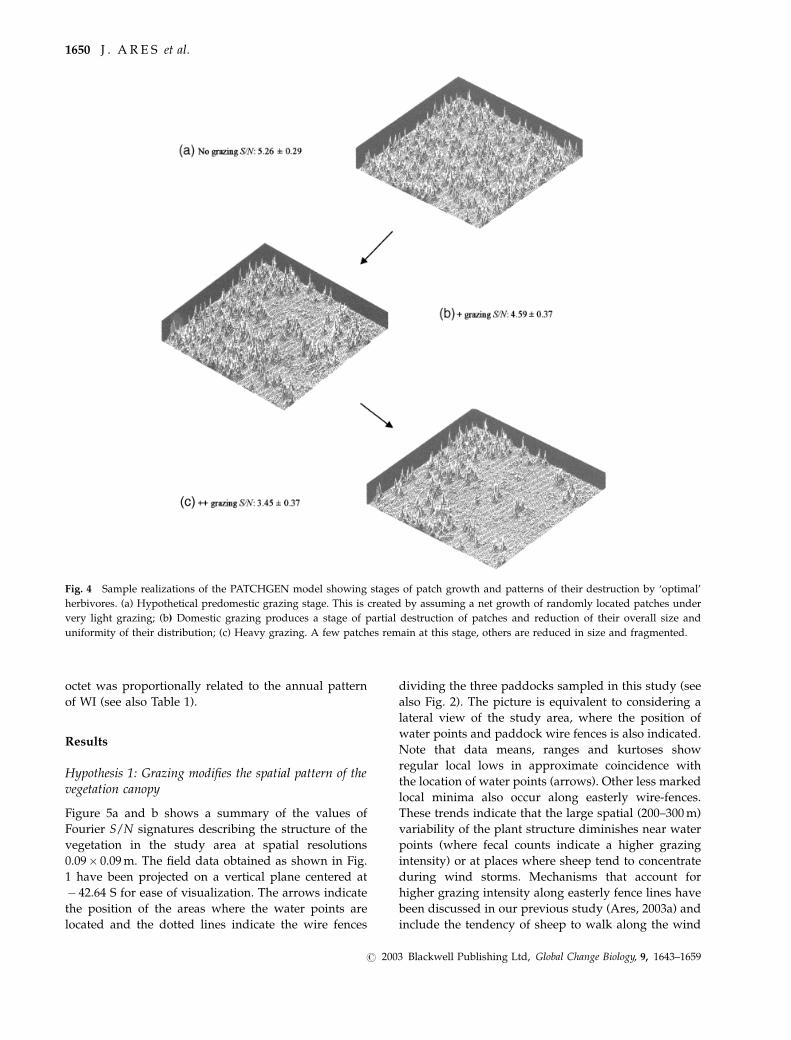
Fig. 4 Sample realizations of the PATCHGEN model showing stages of patch growth and patterns of their destruction by ‘optimal’
herbivores. (a) Hypothetical predomestic grazing stage. This is created by assuming a net growth of randomly located patches under
very light grazing; (b) Domestic grazing produces a stage of partial destruction of patches and reduction of their overall size and
uniformity of their distribution; (c) Heavy grazing. A few patches remain at this stage, others are reduced in size and fragmented.
1650 J . A R E S et al.
r 2003 Blackwell Publishing Ltd, Global Change Biology, 9, 1643–1659
direction and the behavioral-based exclusion of sheep
and guanacos in the area. A local mean low at
� 65.45W probably results from the observed occur-
rence of a temporary water source east from the fence
that sheep use to visit.
Table 2 shows an analysis of the histograms of the
frequency distributions of these data as well as those
obtained at resolutions 0.18� 0.18 m, 0.36� 0.36 m,
0.72� 0.72 m. In this analysis, the data were further
stratified according to the location of the corresponding
photograph relative to the watering points (Near–
Medium–Far). Significant differences between the
frequency distribution at Far with respect to Near
positions occur at all sampling resolutions. In other
cases, there are also marked differences between Far–
Medium and Medium–Near positions. The changes
observed in the histograms corresponding to all
sampling resolutions consist in the increase of the
frequencies at the central range of S/N values at the
expense of lower-class values as distance to the water
point decreases. Based on these results, we do not find
reasons to reject the hypothesis that the large-scale
spatial structure of the vegetation canopy is modified
by the impact of grazing in the study area.
Hypothesis 2: Diminishing correlation between plantcanopy and landscape-scale runoff patterns as grazingimpact increases
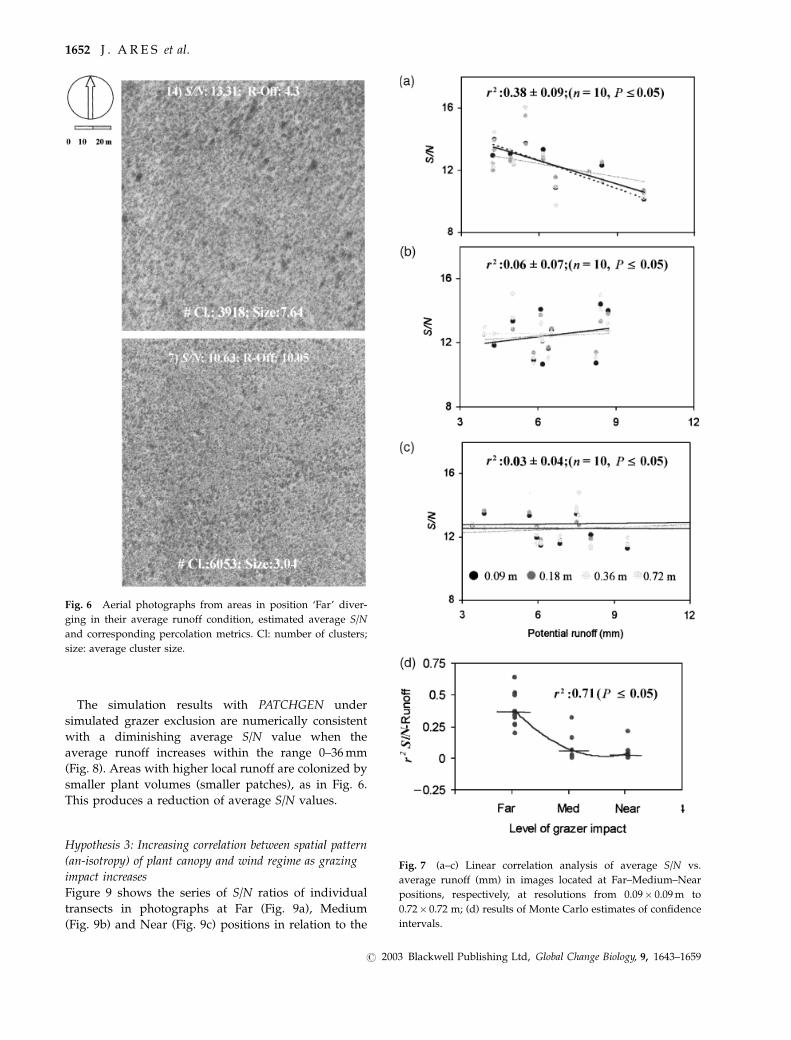
Figure 6 shows images of two field areas representing
extreme differences in estimated potential runoff, and
their corresponding average S/N and percolation metric
values. Photograph 14 corresponds to a low-runoff,
high-S/N area Far from the water source, while
photograph 7 is from a high-runoff, low-S/N area Far
from water source. See that a smoother texture
predominates at photograph 7 in relation to photo-
graph 14. This is confirmed by the lower average cluster
size and higher number of clusters as estimated with
percolation metrics. Figure 7a–c shows the results of the
analyses of linear correlation relating image average
S/N values with the corresponding average potential
runoff values in the area centered at their estimated
realized geoposition, at Far–Medium–Near positions,
based on all resolutions. Note that a significant
correlation exists at the positions ‘Far’ that vanishes at
‘Medium’ and ‘Near’ positions. In order to test the null
hypothesis (r2S/N vs. Runoff vs. Distance to Water
Point5 0), random sub-samples of the data in Fig. 7a–c
were drawn by means of a Monte Carlo procedure in
which S/N estimates at each resolution were sequen-
tially sampled from each group in order to generate
estimates of r2S/N vs. Runoff. The average r2 values and
their confidence intervals obtained by this procedure
are shown in insets a–c and summarized in Fig. 7d.
Based on the results in Fig. 7d, we found no reason to
reject the hypothesis that the spatial vegetation struc-
ture as estimated through the S/N metric is progres-
sively un-coupled from the landscape runoff pattern at
early stages of increasing grazing impact.
Fig. 5 (a) Summary of the values of Fourier S/N signatures
describing the structure of the vegetation in the study area. The
field data obtained as shown in Fig. 2 have been projected on a
vertical plane centered at � 42.64 S for ease of visualization. The
arrows indicate the position of the areas where the water points
are located and the dotted lines indicate the wire fences dividing
the three paddocks sampled in this study. (b) Mean values in
inset ‘a’ re-scaled to show detail.
Table 2 Results of w2 tests of differences between histograms
of frequency distributions of S/N values corresponding to
positions Near–Medium–Far relative to the nearest water
source
Spatial
resolution (m) Far–Near Far–Medium Medium–Near
0.09� 0.09 35.6 37.3 17.0
0.18� 0.18 29.8 10.9 12.2
0.36� 036 26.9 24.3 10.9
072� 0.72 42.2 7.1 21.3
See also Figs 2 and 5. Values significant at Po0.05 shown in
bold.
P L A N T PA T T E R N S I N E A R LY D R Y L A N D D E S E R T I F I C AT I O N 1651
r 2003 Blackwell Publishing Ltd, Global Change Biology, 9, 1643–1659
The simulation results with PATCHGEN under
simulated grazer exclusion are numerically consistent
with a diminishing average S/N value when the
average runoff increases within the range 0–36 mm
(Fig. 8). Areas with higher local runoff are colonized by
smaller plant volumes (smaller patches), as in Fig. 6.
This produces a reduction of average S/N values.
Hypothesis 3: Increasing correlation between spatial pattern
(an-isotropy) of plant canopy and wind regime as grazing
impact increases
Figure 9 shows the series of S/N ratios of individual
transects in photographs at Far (Fig. 9a), Medium
(Fig. 9b) and Near (Fig. 9c) positions in relation to the
Fig. 6 Aerial photographs from areas in position ‘Far’ diver-
ging in their average runoff condition, estimated average S/N
and corresponding percolation metrics. Cl: number of clusters;
size: average cluster size.
Fig. 7 (a–c) Linear correlation analysis of average S/N vs.
average runoff (mm) in images located at Far–Medium–Near
positions, respectively, at resolutions from 0.09� 0.09 m to
0.72� 0.72 m; (d) results of Monte Carlo estimates of confidence
intervals.
1652 J . A R E S et al.
r 2003 Blackwell Publishing Ltd, Global Change Biology, 9, 1643–1659
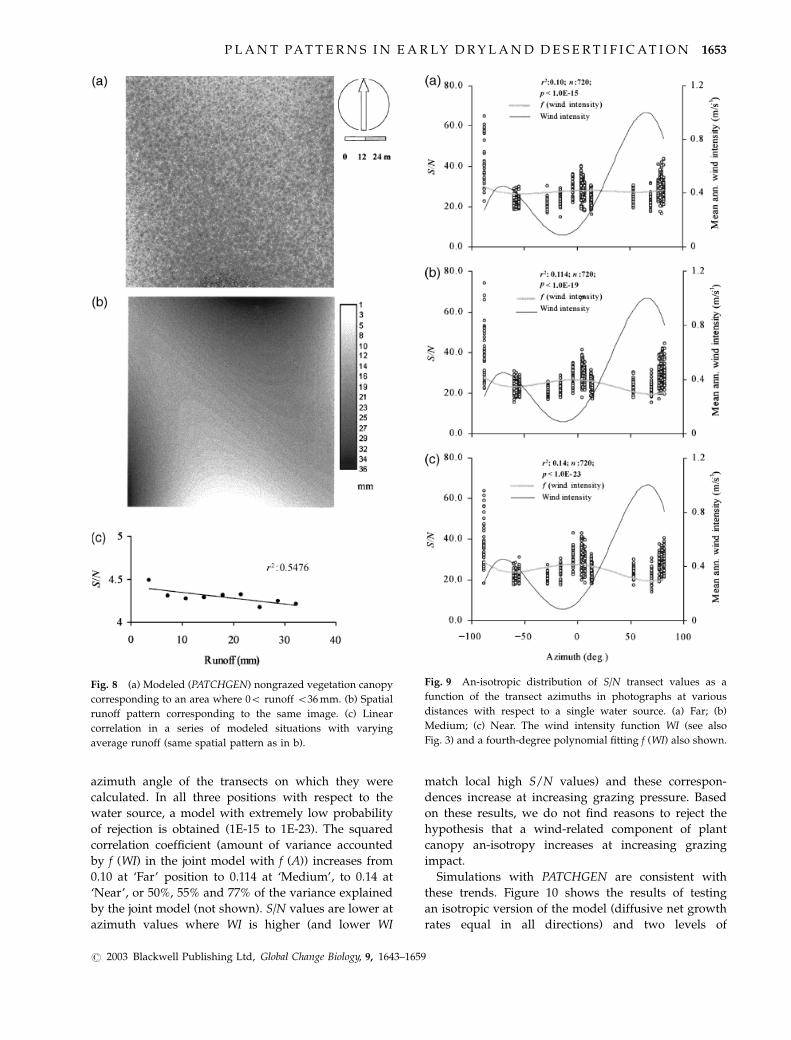
azimuth angle of the transects on which they were
calculated. In all three positions with respect to the
water source, a model with extremely low probability
of rejection is obtained (1E-15 to 1E-23). The squared
correlation coefficient (amount of variance accounted
by f (WI) in the joint model with f (A)) increases from
0.10 at ‘Far’ position to 0.114 at ‘Medium’, to 0.14 at
‘Near’, or 50%, 55% and 77% of the variance explained
by the joint model (not shown). S/N values are lower at
azimuth values where WI is higher (and lower WI
match local high S/N values) and these correspon-
dences increase at increasing grazing pressure. Based
on these results, we do not find reasons to reject the
hypothesis that a wind-related component of plant
canopy an-isotropy increases at increasing grazing
impact.
Simulations with PATCHGEN are consistent with
these trends. Figure 10 shows the results of testing
an isotropic version of the model (diffusive net growth
rates equal in all directions) and two levels of
Fig. 8 (a) Modeled (PATCHGEN) nongrazed vegetation canopy
corresponding to an area where 0o runoff o36 mm. (b) Spatial
runoff pattern corresponding to the same image. (c) Linear
correlation in a series of modeled situations with varying
average runoff (same spatial pattern as in b).
Fig. 9 An-isotropic distribution of S/N transect values as a
function of the transect azimuths in photographs at various
distances with respect to a single water source. (a) Far; (b)
Medium; (c) Near. The wind intensity function WI (see also
Fig. 3) and a fourth-degree polynomial fitting f (WI) also shown.
P L A N T PA T T E R N S I N E A R LY D R Y L A N D D E S E R T I F I C AT I O N 1653
r 2003 Blackwell Publishing Ltd, Global Change Biology, 9, 1643–1659
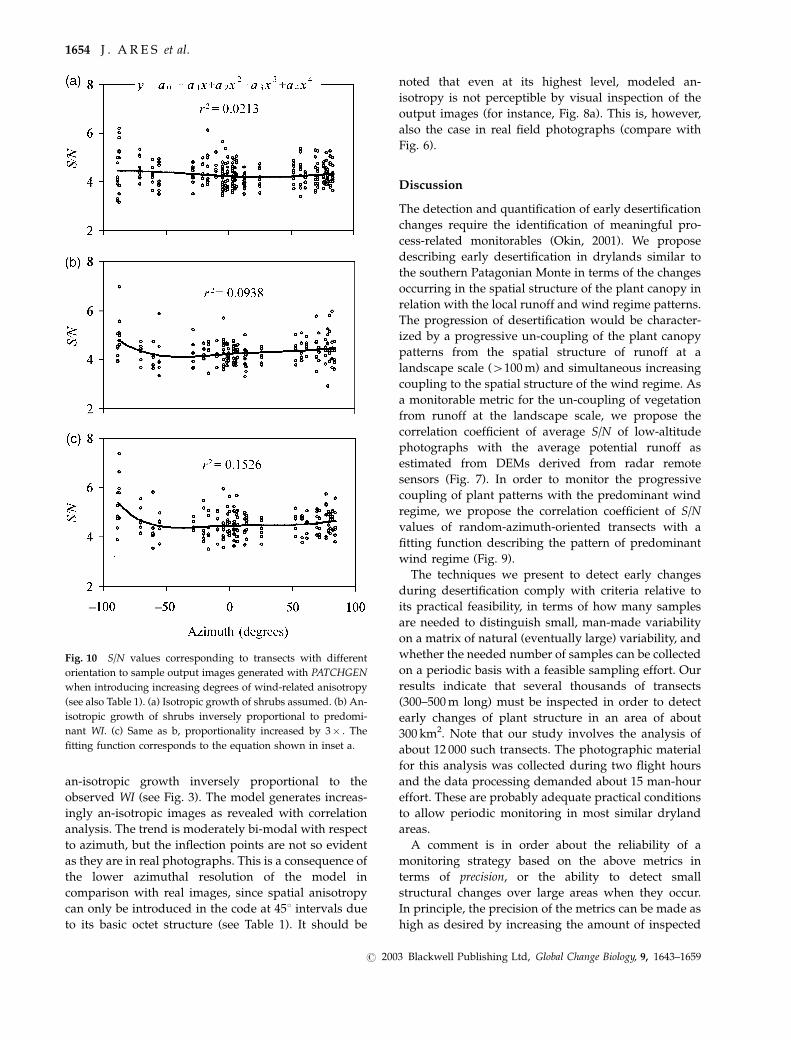
an-isotropic growth inversely proportional to the
observed WI (see Fig. 3). The model generates increas-
ingly an-isotropic images as revealed with correlation
analysis. The trend is moderately bi-modal with respect
to azimuth, but the inflection points are not so evident
as they are in real photographs. This is a consequence of
the lower azimuthal resolution of the model in
comparison with real images, since spatial anisotropy
can only be introduced in the code at 451 intervals due
to its basic octet structure (see Table 1). It should be
noted that even at its highest level, modeled an-
isotropy is not perceptible by visual inspection of the
output images (for instance, Fig. 8a). This is, however,
also the case in real field photographs (compare with
Fig. 6).
Discussion
The detection and quantification of early desertification
changes require the identification of meaningful pro-
cess-related monitorables (Okin, 2001). We propose
describing early desertification in drylands similar to
the southern Patagonian Monte in terms of the changes
occurring in the spatial structure of the plant canopy in
relation with the local runoff and wind regime patterns.
The progression of desertification would be character-
ized by a progressive un-coupling of the plant canopy
patterns from the spatial structure of runoff at a
landscape scale (4100 m) and simultaneous increasing
coupling to the spatial structure of the wind regime. As
a monitorable metric for the un-coupling of vegetation
from runoff at the landscape scale, we propose the
correlation coefficient of average S/N of low-altitude
photographs with the average potential runoff as
estimated from DEMs derived from radar remote
sensors (Fig. 7). In order to monitor the progressive
coupling of plant patterns with the predominant wind
regime, we propose the correlation coefficient of S/N
values of random-azimuth-oriented transects with a
fitting function describing the pattern of predominant
wind regime (Fig. 9).
The techniques we present to detect early changes
during desertification comply with criteria relative to
its practical feasibility, in terms of how many samples
are needed to distinguish small, man-made variability
on a matrix of natural (eventually large) variability, and
whether the needed number of samples can be collected
on a periodic basis with a feasible sampling effort. Our
results indicate that several thousands of transects
(300–500 m long) must be inspected in order to detect
early changes of plant structure in an area of about
300 km2. Note that our study involves the analysis of
about 12 000 such transects. The photographic material
for this analysis was collected during two flight hours
and the data processing demanded about 15 man-hour
effort. These are probably adequate practical conditions
to allow periodic monitoring in most similar dryland
areas.
A comment is in order about the reliability of a
monitoring strategy based on the above metrics in
terms of precision, or the ability to detect small
structural changes over large areas when they occur.
In principle, the precision of the metrics can be made as
high as desired by increasing the amount of inspected
Fig. 10 S/N values corresponding to transects with different
orientation to sample output images generated with PATCHGEN
when introducing increasing degrees of wind-related anisotropy
(see also Table 1). (a) Isotropic growth of shrubs assumed. (b) An-
isotropic growth of shrubs inversely proportional to predomi-
nant WI. (c) Same as b, proportionality increased by 3� . The
fitting function corresponds to the equation shown in inset a.
1654 J . A R E S et al.
r 2003 Blackwell Publishing Ltd, Global Change Biology, 9, 1643–1659
transects on the photograph fields. This is achieved by
introducing some minor changes in the computer code
that processes the digital image files, and involves
small increases in computing time. While this should
hold in most cases, it can be predicted that the relative
success in increasing precision by this means will
depend on the natural ‘background’ variability in the
inspected area.
Self-consistency, or the ability of obtaining similar
estimates at places that do not change over time, is
another dimension of reliability. This depends on
various factors related to the flying equipment used,
the prevailing meteorological conditions during flight
time and the skill of the operators in handling the
camera and geo-positioning equipment. Strong winds
might prevent maintaining a desired flying route
within the precision attained in this study. Since plant
shadows can introduce false plant anisotropy particu-
larly at low solar elevation angles, care should be taken
in selecting flying times when plant shadows are not
elongated in the direction of predominant winds, but
nearly orthogonal to them. Under these latter condi-
tions, solar anisotropy can be effectively out-filtered
from wind anisotropy, as done in this study.
It should be noted that the presence of small
(anthropic-related) sources of variation in a frame of
large naturally occurring variability results in low
values of the estimated correlation coefficient attribu-
table to the anthropic-related source. However, the
corresponding probability at which the null hypothesis
can be rejected can be made notoriously low by
increasing the amount of data points. (see Figs 9
and 10).
In the Patagonian Monte and similar systems, the
inter-annual variability of rainfall is extremely high
(Barros & Rivero, 1982). This complicates the design of
monitoring systems to detect nonseasonal changes in
time, because even observations performed at the same
date (say every year) can show large fluctuations due to
temporal modifications of the plant canopy after rain
events. It is our view that monitoring structural changes
would necessarily be more convenient than monitoring
floristic changes, or surrogate estimates thereof depend-
ing on the plant canopy-soil reflectance or the green
intensity of plant canopy color (like in usual satellite
imagery). Structural changes in semiarid shrublands
basically depend on the location and size of long-lived
shrubs, which act as spatial organizers of other life
forms around them. Shrub size varies little (and shrub
position might not vary at all) during temporary
droughts or humid periods or seasons because they
are rooted deeper than grasses and can better tap soil
water reserves. Accordingly, we hypothesize that
indicators derived from the spatial arrangement and
size of shrubs can be expected to show considerably
lesser temporal variation than those based on season-
ally fluctuating herbaceous forms, while still embed-
ding process-meaningful signals of the state of the
shrubland system. .
In the conception of Schlesinger et al. (1996), an
increase in the heterogeneity of water, nitrogen and
other soil resources occurs during progressing deserti-
fication. Our data along grazing gradients in the
Patagonian Monte indicate that the structural varia-
bility of the plant canopy is reduced at scales of 200–
300 m as the grazing intensity increases. These changes
are coupled to the distribution of shrubs and perennial
grasses. These life forms tend to create, maintain and be
influenced by localized soil microsites with character-
istic chemical and physical conditions beneath and
around them (Mazzarino et al., 1996; del Valle & Rosell,
1999; Carrera et al., 2000). The impact of domestic
grazing reduces the shrub size and internal cover of
shrub-dominated patches in the Patagonian Monte. The
soil moisture vary inside and outside the patches
depending on their size and internal cover, as shown
by micrometeorological field measurements, and these
trends alter the sheltering-competition balance between
shrubs and grasses (Bertiller et al., 2002a). These trends
prompt interest in developing clues to interpret
changes in the spatial pattern of plant canopies as early
indicators of dryland degradation.
In a previous paper (Ares et al., 2003a), we showed
that the S/N ratio decreases in areas severely impacted
by grazing, because shrub patches are disrupted and
spatially disorganized into smaller units, fragments of
remnant patches, etc. In this study, where early stages
of desertification were observed, the average S/N ratios
do not diminish significantly with increasing grazing
impact, but their frequency distribution shifts signifi-
cantly towards a reduced frequency of low values and
an increased frequency of central values. These trends
are consistent with an increasing shrub encroachment,
as reported for similar shrublands (Beeskow et al., 1995;
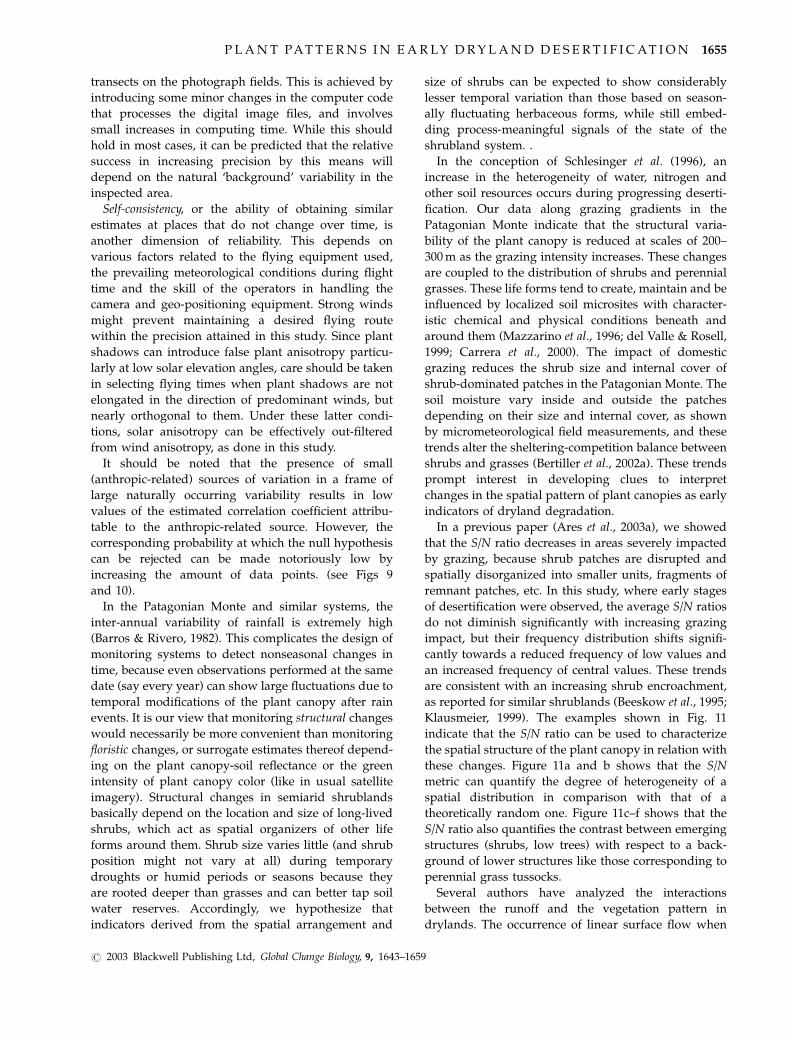
Klausmeier, 1999). The examples shown in Fig. 11
indicate that the S/N ratio can be used to characterize
the spatial structure of the plant canopy in relation with
these changes. Figure 11a and b shows that the S/N
metric can quantify the degree of heterogeneity of a
spatial distribution in comparison with that of a
theoretically random one. Figure 11c–f shows that the
S/N ratio also quantifies the contrast between emerging
structures (shrubs, low trees) with respect to a back-
ground of lower structures like those corresponding to
perennial grass tussocks.
Several authors have analyzed the interactions
between the runoff and the vegetation pattern in
drylands. The occurrence of linear surface flow when
P L A N T PA T T E R N S I N E A R LY D R Y L A N D D E S E R T I F I C AT I O N 1655
r 2003 Blackwell Publishing Ltd, Global Change Biology, 9, 1643–1659
rainfall exceeds a certain threshold tends to limit the
development of banded patterns and favor the forma-
tion of dotted bush. These trends have been observed in
Niger (Leprun 1999; Valentin & d’Herbes 1999), in
Mediterranean semiarid conditions (Bergkamp et al.,
1999) and in semiarid and arid areas of Australia
(Tongway & Ludwig, 1990; Dunkerley & Brown, 1999).
Our results show that the average S/N value diminishes
as the average runoff increases in relatively undis-
turbed land conditions (‘Far’ from water sources). In
our case, the range of changes related to runoff does not
involve a transition from banded to spotted patterns,
but a change in the grain of these latter. Both the visual
inspection of the photographs as well as the analysis of
selected cases with percolation metrics (Milne et al.,
1999) indicate that most of the reduction in S/N values
can be traced back to a reduction in individual patch
sizes. Calculations with PATCHGEN using a simulated
runoff grid (Fig. 8) and assuming runoff-dependent
sizes of shrubs and grasses are numerically consistent
with this interpretation. A mechanistic explanation of
the effect of runoff in limiting plant size would imply a
reduction of the carrying capacity at areas with high
runoff because of enhanced nutrient washout, as
observed in experiments at similar shrublands with
controlled conditions (Schlesinger et al., 1999).
Domestic grazing disrupts the functional relations
between runoff and plant canopy patterns. The per-
ennial grasses interspersed among shrubs in a mulga
woodland (Anderson & Hodgkinson, 1997) were
adversely affected by grazing, reducing the capacity
of the vegetation canopy to capture runoff water and
nutrients and affecting the mulga-banding. Wu et al.
(2000) found that vegetation bands in Niger were
seriously affected during the period 1960–1992 by
human-managed herbivores. Montana et al. (2001)
suggested that adequate monitoring of band integrity
needs to be developed in order to provide early
warnings of land degradation. In this study, we show
that the spatial spotted pattern of vegetation canopy is
progressively un-coupled from the pattern of natural
runoff in areas with increasing grazing impact. Grazing
effects on the plant canopy structure override those
resulting from the landscape runoff pattern.
In a previous paper where we performed long-term
monitoring of the amounts of flying soil dust at the
Patagonian Monte (Ares et al., 1990), we showed that
the generation of soil dust is increasingly related to
wind intensity as the total vegetation cover decreases.
Okin (2001) summarized current ideas about the
possible effects of wind on modifying plant spatial
patterns in semiarid shrublands. These include in-
creased saltation of sand grains and sand-blasting of
plants, increased plant evapotranspiration and in-
creased winnowing of fine particles leading to de-
creased water-holding capacity. All these effects can be
expected to be more intense at the windward side of
shrub patches than at the leeward side of them. As a
consequence of these, the net growth of plant parts can
be expected to be greater at the lee-side of shrubs (this
would include both the local growth of established
plants as well as that from colonizers finding sheltered
microsites at downwind orientations). In our study,
wind-oriented anisotropy of plant volumes is a minor
trait accounting for 10–14% of the variance of S/N
records in random-oriented transects. However, inten-
sive spatial sampling shows that there is a significant
increasing correlation trend with increasing grazing
impact. Numerical simulation with PATCHGEN indi-
cates that increasing the shrub growth rate in propor-
tion to the directions of predominant winds creates
spatial anisotropy having characteristics similar to
those observed in real field images. It should be
mentioned that a modeled 3� inverse proportionality
of growth rates to wind intensities creates anisotropy
that is detectable with statistical techniques (Fig. 10),
but is not evident to the naked eye, nor with the limited
Fig. 11 Real and modeled images of spatial plant distribution
that illustrate the meaning of the S/N metric.
1656 J . A R E S et al.
r 2003 Blackwell Publishing Ltd, Global Change Biology, 9, 1643–1659
sampling intensity feasible in field observations at
ground level (A. Bisigato, unpublished results).
Conclusions
Early stages of desertification can be identified in
shrublands of the Patagonian Monte through the
analysis of changes in the spatial distribution of the
plant canopy. The observed changes can be interpreted
in terms of a progressive un-coupling of the vegetation
pattern from that of the runoff at a landscape scale, and
a simultaneous and progressive relation with the
prevailing wind regime. High-resolution aerial photo-
graphs and Digital Elevation Models derived from
radar remote imagery can be used to investigate runoff
un-coupling, while the analysis of image an-isotropy
can be used to detect predominant wind effects along
grazing gradients. Fourier-based metrics can be used in
both cases, and the techniques can probably be applied
at a scale adequate for regular monitoring and
surveillance of other extended shrublands in the world.
Acknowledgements
Dr M. Bertiller contributed with ideas and comments at variousstages of the study. Dr C. Ibarra provided technical assistance indeveloping the flight procedures and protocols. Funds weresupplied by Agencia Nacional de Promocion Cientıfica yTecnologica (FONCYT), Project BID 1201/OC-AR PICT-99 #08-06027 and GTZ-Universitat Munchen-CENPAT-UNPSJB, ‘Erfas-sung und Abschatzung von Desertifikationserscheinigungen inPatagonien’. Interferometric techniques for the calculation of theDEM of the study area were made available for the scope of thisproject by the Remote Sensing Data Center (DFD) of the GermanAerospace Center (DLR). Special thanks are due to A. Roth forsoftware support. The European Space Agency (ESA), DLR andComision Nacional de Actividades Espaciales (CONAE) fromArgentina supplied the satellite images. A patient anonymousreviewer made detailed and critical comments that contributedto the improvement in the presentation of our results.
References
Adler PB, Raff DA, Lauenroth WK (2001) The effect of grazing
on the spatial heterogeneity of vegetation. Oecologia, 128, 465–
479.
Anderson VJ, Hodgkinson KC (1997) Grass-mediated capture of
resource flows and the maintenance of banded mulga in a
semi-arid woodland. Australian Journal of Botany, 45, 331–342.
Ares JO, Beeskow AM, Bertiller MB, et al. (1990) Structural and
dynamic characteristics of overgrazed grasslands in northern
Patagonia. In: Managed Grasslands. Regional Studies (ed.
Breymeyer A), pp. 268–274. Elsevier, Amsterdam.
Ares J, Bertiller M, Bisigato A (2003a) Modeling and measure-
ment of structural changes at a landscape scale in dryland
areas. Ecological Modeling and Assesment, 8, 1–13.
Ares J, Bertiller M, Bisigato A (2003b) Estimates of dryland
degradation with Fourier signatures in low-altitude high reso-
lution monochromatic images. Landscape Ecology, 18, 51–63.
Baker WL (1989) A review of models of landscape change.
Landscape Ecology, 2, 111–133.
Barros V, Rivero M (1982) Mapas de probabilidad de la
precipitacion en la provincia de Chubut. National Patayonic
Center, Puerto Madryn.
Beeskow AM, Elissalde NO, Rostagno MC (1995) Ecosystem
changes associated with grazing intensity on the Punta Ninfas
rangelands of Patagonia, Argentina. Journal of Range Manage-
ment, 48, 517–522.
Bergkamp G, Cerda A, Imeson AC (1999) Magnitude-frequency
analysis of water redistribution along a climate gradient in
Spain. Catena, 37, 129–146.
Bertiller MB, Sain CL, Bisigato AJ et al. (2002a) Spatial sex
segregation in the dioecious grass Poa ligularis in northern
Patagonia: the role of environmental patchiness. Biodiversity
and Conservation, 11, 69–84.
Bertiller MB, Ares J, Bisigato A (2002b) Multiscale indicators of
land degradation in the Patagonian Monte, Argentina.
Environmental Management, 30, 704–715.
Bisigato AJ, Bertiller MB (1997) Grazing effects on patchy
dryland vegetation in northern Patagonia. Journal of Arid
Environments, 36, 639–653.
Bisigato A, Ares J, Bertiller M (2002) Assessment of pristine
vegetation structure in semiarid shrublands based on spatial
explicit modelling. Phytocoenologia, 32, 581–594.
Bloomfield P (1976) Fourier Analysis of Time series: An Introduc-
tion. John Wiley, New York.
Brown MA, Waller SS (1986) The impact of experimental design
on the application of grazing research results – an exposition.
Journal of Range Management, 39, 197–200.
Busso CA (1997) Towards an increased and sustainable
production in semiarid rangelands of central Argentina: two
decades of research. Journal of Arid Environments, 36, 197–210.
Carrera AL, Sain CL, Bertiller MB (2000) Patterns of nitrogen
conservation in shrubs and grasses in the Patagonian Monte,
Argentina. Plant and Soil, 224, 185–193.
Coulson SN (1995) SAR interferometry. In: Multi-Disciplinary
Online Documentation. URL: http://earth.esa.int/docpot.
Couteron P, Lejeune O (2001) Periodic spotted patterns in semi-
arid vegetation explained by a propagation-inhibition model.
Journal of Ecology, 89, 616–628.
Crow EL, Davis FA, Maxfield M (1993) Statistics Manual. Dover
Pulications Inc., New York.
Defosse GE, Bertiller MB, Rostagno C (1992) Rangeland mana-
gement in Patagonian drylands. In: Proceedings of the Interna-
tional Rangeland Development Symposium (eds Perrier GK, Gay
CW), pp. 12–21. Society for Range Management, Spokane.
Delhoumme JP (1996) Fonctionnement hydropedologique d’une
toposequence de sols an milieu aride (reserve de la biophere
de Mapimi, Nord-Mexique). PhD Thesis, Universite de
Poitiers, Poitiers.
del Valle HF, Rosell A (1999) Formation, distribution and
physicochemical properties of plant litter in shrub patches of
northeastern Patagonia. Arid Soil Research and Rehabilitation,
13, 105–122.
P L A N T PA T T E R N S I N E A R LY D R Y L A N D D E S E R T I F I C AT I O N 1657
r 2003 Blackwell Publishing Ltd, Global Change Biology, 9, 1643–1659
del Valle HF, Buck A, Mehl H (2002) Digital elevation models as
tools in soil research in northeastern Patagonia. In: XVIII
Argentine Soil Science Meeting, Puerto Madryn (Chubut),
Argentina, 16–19 April 2002, p. 112 (abstracts).
Dunkerley DL (1997) Banded vegetation: survival under
drought and grazing pressure based on a simple cellular
automaton model. Journal of Arid Environments, 35,
419–428.
Dunkerley DL, Brown KJ (1999) Banded vegetation near Broken
Hill, Australia: significance of surface roughness and soil
physical properties. Catena, 37, 197–216.
Galle S, Ehrman M, Peugeot C (1999) Water balance on a banded
vegetation pattern. A case study of tiger bush in western
Niger. Catena, 37, 197–216.
Greene RSB, Ringrose-Voase AJ (1994) Micromorphological and
hydraulic properties of surface crusts formed on a red earth
soil in the semiarid rangelands. In: Proceedings of the IX
International Working Meeting on Soil Micromorphology (eds
Ringrose-Voase AJ, Humpheys GS), pp. 763–776. Elsevier
Science Publishers, Amsterdam.
Holm A, Loneragan WA, Adams MA (2001) Do variations on a
model of landscape function assist in interpreting the growth
response of vegetation to rainfall in arid environments?
Journal of Arid Environments, 50, 23–52.
Hudak AT, Wessman CA (1998) Textural analysis of historical
aerial photography to characterize woody plant encroachment
in South African savanna. Remote Sensing of the Environment,
66, 317–330.
Jenson S, Domingue J (1988) Extracting topographic structure
from digital elevation data for geographic information system
analysis. Photogrammetric Engineering and Remote Sensing, 54,
1593–1600.
Klausmeier CA (1999) Regular and irregular patterns in
semiarid vegetation. Science, 284, 1826–1828.
Landsberg J, James CD, Maconochie J et al. (2002) Scale-related
effects of grazing on native plant communities in an arid
rangeland region of South Australia. Journal of Applied Ecology,
39, 427–444.
Le Houerou HN, Bingham RL, Skerbek L (1988) Relationship
between the variability of annual precipitation in world arid
lands. Journal of Arid Environments, 15, 1–18.
Leon RJC, Bran D, Collantes M et al. (1998) Grandes unidades de
la Patagonia extra andina. Ecologıa Austral, 8, 125–144.
Leprun JC (1999) The influences of ecological factors on tiger
bush and dotted bush patterns along a gradient from Mali to
northern Burkina Faso. Catena, 37, 25–44.
Mares MA, Morello J, Goldstein G (1985) The Monte desert and
other subtropical semi-arid biomes of Argentina, with com-
ments on their relation to North American arid areas. In: Hot
Deserts and Arid Shrublands, Ecosystems of the World, Vol 12 (eds
Evenari M, Noy-Meir I, Goodall D), pp. 203–237. Elsevier
Science, Amsterdam.
Mazzarino MJ, Bertiller MB, Sain CL, Laos F, Coronato F (1996)
Spatial patterns of nitrogen availability, mineralization and
immobilization in northern Patagonia (Argentina). Arid Soil
Research and Rehabilitation, 10, 295–309.
Milne BT, Johnson AR, Matyk S (1999) Clara-T: Instructional
software for fractal pattern generation and analysis. In:
Landscape Ecological Analysis (eds Klopatek JM, Gardner RH),
pp. 304–332. Springer-Verlag, New York.
Montana C, Seghieri J, Cornet A (2001) Vegetation dynamics:
recruitment and regeneration in two-phase mosaics. In: Banded
Vegetation Patterns in Arid and Semiarid Environments (eds
Tongway DJ Valentin C, Seghieri J), pp. 132–145. Springer-
Verlag, New York.
OIES (1991) Arid Ecosystem Interactions. Office of Interdiscipli-
nary Earth Studies, Boulder, CO, USA, 81 pp.
Okin GS (2001) Wind-driven desertification: process modeling,
remote monitoring and forecasting. PhD Thesis, California
Institute of Technology, California, 269 pp.
Parizek B, Rostagno CM, Sottini R (2002) Soil erosion as affected
by shrub encroachment in north-eastern Patagonia. Journal of
Range Management, 55, 43–48.
Pickup G, Chewings VH, Nelson DJ (1993) Estimating
changes in vegetation cover over time in arid areas from
remotely sensed data. Remote Sensing of the Environment, 43,
243–263.
Pickup G, Bastin GN, Chewings VH (1998) Identifying trends in
land degradation in non-equilibrium rangelands. Journal of
Applied Ecology, 35, 365–377.
Reynolds JF, Fernandez RJ, Kemp PR (2000) Drylands and
global change: rainfall variability and sustainable range-
land production. In: Proceedings of the 12th Toyota Confer-
ence: Challenge of Plant and Agricultural Sciences to the Crisis
of Biosphere on the Earth in the 21st Century (eds Watanabe K,
Komamine A), Toyota Motor Co., Mikkabi, Shizuoka,
Japan.
Schlesinger WH, Reynolds JF, Cunningham GL, Huenecke
LF, Jarrel WM, Virginia RA, Whitford WG (1990) Biolo-
gical feedbacks in global desertification. Science, 247, 1043–
1048.
Schlesinger WH, Raikes JA, Hartley AE, Cross AF (1996) On the
spatial pattern of soil nutrients in desert ecosystems. Ecology,
77, 364–374.
Schlesinger WH, Abrahams AD, Parsons AJ, Wainwright J (1999)
Nutrient losses in runoff from grassland and shrubland
habitats in Southern New Mexico: I. rainfall simulation
experiments. Biogeochemistry, 45, 21–34.
Sharifi M, Gibson A, Rundel P (1999) Phenological and
physiological responses of heavily dusted creosote bush
(Larrea tridentata) to summer irrigation in the Mojave Desert.
Flora, 194, 369–378.
Tongway DJ, Ludwig JA (1990) Vegetation and soil patterning in
semiarid mulga lands of eastern Australia. Australian Journal of
Ecology, 15, 23–34.
Valentin C, d’Herbes JM (1999) Soil and water components of
banded vegetation patterns. Catena, 37, 1–24.
Wester DB (1992) Viewpoint: replication, randomization, and
statistics in range research. Journal of Range Management, 45,
285–290.
Wiegand T, Milton SJ, Wissel C (1995) A simulation model for a
shrub ecosystem in the semiarid Karoo, South Africa. Ecology,
76, 2205–2221.
Wu XB, Thurow TL, Whisenant SG (2000) Fragmentation and
functional change of tiger bush landscapes in Niger. Journal of
Ecology, 88, 790–800.
1658 J . A R E S et al.
r 2003 Blackwell Publishing Ltd, Global Change Biology, 9, 1643–1659
Appendix I
The S/N metric is an application of Fourier spectral
analysis to the description of the spatial distribution of
a scalable attribute. Take for example, a vector X of
x1, x2,y, xn values representing the local biomass of a
plant species in laterally contiguous quadrants of side
size l along a line transect of length l�n, n@ l. It can be
shown that all xi values can be expressed as a sum of
sine and cosine functions oof the type
xl ¼ A0 þX
0ojon=2
ðAj cosojlþ Bj sinojlÞ þ ð�1ÞlAn=2;
where the oj are the Fourier frequencies at length l, and
the coefficients A0, Aj, Bj, An/2, correspond to the mean,
the relative contribution of each frequency to the
description of the series xl and their phases, respec-
tively. The coefficients are computed (Bloomfield 1976)
in the frequency domain through the Fast Fourier
Transform algorithm, which yields the partial contribu-
tion or magnitude M (sum of cosine and sin terms at each
frequency) of all harmonics in describing the data series.
In characterizing the sets of Fourier magnitudes we
used the ratios of the cumulative magnitudes at low
frequencies in relation to those at high frequencies (S/N
ratios):
S=N ¼ SMl=SMh
;
where Ml and Mh are the magnitudes at user-specified
ranges of low (signal) and high (noise) frequencies. In
this contribution, we used the ratio defined at SM0–0.25/
SM0.26–0.5, the lower and higher half frequency ranges,
respectively. In terms of the vegetation canopy, the
‘signal’ refers to the degree of development of patch
structures and their spatial arrangements, while the
‘noise’ refers to the distribution of nonpatchy structures
like fragments of old patches, randomly located
colonizers, etc. Homogeneous patch growth creates
low-frequency variation (S/N ratio increases), while
heterogeneous patch development, fragmentation into
smaller units, etc. creates high-frequency variation,
which is reflected in decreased S/N ratios.
An intuitive perception of the meaning and behavior
of the S/N ratio can be gained by inspecting the set of
image examples shown in Fig. 11. In Fig. 11a, an aerial
nadir-oriented photograph of a field in the area
described in this study is shown. The image has been
digitized to a resolution of 1024 rows� 1024 columns,
or 10242 pixels, and associated to a 256-grade gray-
palette. These translate every value in the image to a
gray-tone scale, as described in the vertical bar along
the right side of the photo. The frequency distribution
of all pixel values is outlined in the small upper-right
inset. A relatively high average S/N ratio corresponding
to 20 randomly oriented transects sampling optical
density in this image reflects the occurrence of well-
defined spatial structures (clumps of high optical
density corresponding to vegetation patches contrast-
ing with their background). Figure 11b shows the same
image after a process of randomization, i.e. a computer
code mixed image columns and rows just like card
players do before each game. Although the range of
values contained in the image is the same as in Fig. 11a
(they have identical frequency histograms), the spatial
distribution is deployed of any structural arrangement.
Note that the S/N ratio approaches 1, meaning that
these are the same magnitudes associated with signals
(patches) as with noise (background).
Consider now Fig. 11c. This represents the spatial
distribution of a single un-grazed plant form, generated
by a stochastic simulation model (Ares et al., 2003a).
Although patches are randomly distributed over the
surface, they have a similar size and geometric
structure. Each patch corresponds to a group of
contiguous pixels in the image, with ascending and
descending values around a central maximum. The
average S/N describing this structure is 5.26 (70.29,
Po0.05), where the confidence interval corresponds to
the mean of 5 random realizations of the model. In Fig.
11d, grazing on the same plant canopy has been
simulated. The herbivore has consumed the fastest
growing portions of plant patches down to a given
threshold. Because of herbivore selection, some patches
remain undamaged and attain a large size, while others
are confined to a small size. Also, newly formed
patches appear as small dots scattered on the image.
This relatively less organized and heterogeneous
structure is characterized by a lower S/N5 3.82
(70.76, Po0.05).
Consider now Fig. 11e–f. These correspond to
photographs of study areas presented in this paper
differing in grazing intensity as estimated by their
distance to a single water source (4000–5000 m, low
grazing intensity, Fig. 11e) and a site near a water
source (o1000 m, high grazing intensity, Fig. 11f),
respectively. The intensively grazed area shows a
spatial arrangement of plant patches with increased
randomness and size heterogeneity as compared with
the less intensively grazed area.
The S/N ratio estimated on data obtained in ‘ground
truth’ field transects has been shown (Bertiller et al.,
2002b) to be quantitatively related to the density of
patches (D), the size (radius R) of the patches and
the internal cover (C) of the patch units. (S/N5
� 2.28D1 3.14R1 4.10C, r25 0.98, Pr0.001).
P L A N T PA T T E R N S I N E A R LY D R Y L A N D D E S E R T I F I C AT I O N 1659
r 2003 Blackwell Publishing Ltd, Global Change Biology, 9, 1643–1659
Copyright © 2022 FDOKUMEN