Equivalence scales in tax and transfer policies
22
investigaciones económicas. vol. XXVII (3), 2003, 593-614 EQUIVALENCE SCALES IN TAX AND TRANSFER POLICIES LUIS AYALA Universidad de Castilla-La Mancha ROSA MARTÍNEZ JESÚS RUIZ-HUERTA Universidad Rey Juan Carlos Income distribution and poverty measurement require weighting the impact of both economies of scale and the di erent needs of each household member. Di erent models of equivalence scales have been defined. Equivalence scales are also present in many tax and benefit programs. This paper reviews the equivalence scales implicit in personal income tax in Spain. We identify the adjustments contained in the new income tax and highlight the di erences with those used in other social programs and the scales normally used to study poverty. An empirical analysis of poverty rates for di erent kinds of households is carried out using both these implicit scales as well as conven- tional equivalence scales. The results illustrate that economies of scale are taken into account to a lesser extent in income tax legislation than in income distribution analysis. Keywords: Equivalence scales, personal income tax, poverty. (JEL I22, H24, D1) 1. Introduction The theory of personal income taxation and analyses of income distri- bution face some similar basic problems. Choosing the tax-paying unit and assessing that unit’s ability to pay (as a basis for determining the level of taxation) have much in common with the choice of the unit of analysis and the quantification of “adjusted” income levels in poverty and inequality studies. Equivalence scales are relevant in both fields. Concerning income tax, these scales are frequently implicit in the way We are grateful to two anonymous referees for their helpful comments. Research financed by the Interministerial Commission on Science and Technology (Project SEC 98-1090).
Transcript of Equivalence scales in tax and transfer policies

investigaciones económicas. vol. XXVII (3), 2003, 593-614
EQUIVALENCE SCALES IN TAX AND TRANSFERPOLICIES
LUIS AYALAUniversidad de Castilla-La Mancha
ROSA MARTÍNEZJESÚS RUIZ-HUERTA
Universidad Rey Juan Carlos
Income distribution and poverty measurement require weighting the impactof both economies of scale and the di erent needs of each household member.Di erent models of equivalence scales have been defined. Equivalence scalesare also present in many tax and benefit programs. This paper reviews theequivalence scales implicit in personal income tax in Spain. We identify theadjustments contained in the new income tax and highlight the di erenceswith those used in other social programs and the scales normally used tostudy poverty. An empirical analysis of poverty rates for di erent kinds ofhouseholds is carried out using both these implicit scales as well as conven-tional equivalence scales. The results illustrate that economies of scale aretaken into account to a lesser extent in income tax legislation than in incomedistribution analysis.
Keywords: Equivalence scales, personal income tax, poverty.
(JEL I22, H24, D1)
1. Introduction
The theory of personal income taxation and analyses of income distri-bution face some similar basic problems. Choosing the tax-paying unitand assessing that unit’s ability to pay (as a basis for determining thelevel of taxation) have much in common with the choice of the unit ofanalysis and the quantification of “adjusted” income levels in povertyand inequality studies. Equivalence scales are relevant in both fields.Concerning income tax, these scales are frequently implicit in the way
We are grateful to two anonymous referees for their helpful comments. Researchfinanced by the Interministerial Commission on Science and Technology (ProjectSEC 98-1090).

594 investigaciones económicas, vol xxvii (3), 2003
tax laws treat taxpayers having di erent family circumstances. Equi-valence scales are also present, either implicitly or explicitly, in manytransfer programs such as pensions, minimum guaranteed incomes orfamily and child benefit schemes.
The Personal and Family Minimum (hereinafter PFM), approved inthe Spanish income tax reform of 1998, explicitly aims to graduate in-dividuals’ income tax liabilities. Resources considered to be essential tocover the basic needs of individuals or family units are exempted fromtaxation. In this way, the new PFM simultaneously includes an eva-luation of the income required to cover basic needs (a concept closelyrelated to the notion of the poverty thresholds used in income distri-bution studies) and an assessment of the adjustments needed whenpersonal and family circumstances of the taxpayer di er in order todefine di erent amounts to be exempted from taxation.
The equivalence scales implicit in the PFM are analysed in this study.The assessment of the family circumstances in the PFM is comparedwith assessments applied in other fields. The concept of equivalen-ce scales and the di erent procedures that can be used to determinethem are briefly reviewed in Section 2. We then go on to study theadjustments contained in the PFM and highlight the di erences thatexist with those used in other social benefit programs, as well as theequivalence scales normally used in poverty studies (Section 3). Lastly,an empirical analysis of the demographic structure of poverty when thePFM scales are used (instead of thresholds adjusted with conventionalequivalence scales) is made in Section 4. The article ends with a briefsection of conclusions.
2. Justification and types of equivalence scales
An important presupposition when analysing inequality and povertyis that income is a good indicator for measuring the economic well-being of similar individuals having the same needs and paying thesame prices. In fact, however, researchers and legislators on fiscal mat-ters have to deal with units that vary considerably concerning theircharacteristics and needs (number of household members, geographiclocation, disabilities, etc.). This situation gives rise to the need of usingadjustments to convert non-comparable incomes obtained by di erenthouseholds into comparable incomes that can constitute an adequate
l. ayala, r. martínez, j. ruiz-huerta: equivalence scales 595
indicator of the economic well-being of the individuals forming part ofthe households1.
In order to establish comparisons of the situations of individual well-being it is therefore necessary to analyse the relationship between theneeds and resources available to di erent households. Generally spea-king, putting together equivalence scales requires carrying out twokinds of main adjustments. Firstly, an adjustment based on house-hold size is necessary to take into account the economies of scale inconsumption as household size increases. Secondly, it is generally re-cognized that the needs of di erent households vary as a function ofthe ages of their members or other circumstances considered to berelevant.
In formal terms, the construction of equivalence scales is based on thesupposition that the economic well-being reached by the members ofthe household depends on the income level of household , itssize and the remaining socio-demographic characteristics consideredto be relevant ( ):
= ( )
If we take a household with characteristics { 0 0} that reaches a de-termined level of economic well-being 0 with an income level 0 asa reference, then the equivalence scale of a household with charac-teristics { } will be given by the multiplier , which determinesthe income needed for that household to reach the same level ofeconomic well-being as the one taken as a base:
=( 0 )
0 ( 0 0 0)
The above expression could be interpreted as a “cost index of hou-sehold characteristics"having a similar structure as price indices. Itprovides a deflator applicable to the household income of di erentkinds of households to obtain incomes that can be compared with
1Although the use of equivalence scales is a generalized procedure when analysingincome distribution, the sensitivity of the results and the options adopted have leadto some authors searching for other methods that do not require this kind of ad-justments. Atkinson and Bourguignon (1982 and 1987) defined di erent dominancecriteria to compare heterogeneous households when these could be sorted by theirdi erent levels of needs. More recently, Ebert and Moyes (2000) proposed Lorenz-type quasi orderings under di erent criteria in order to reduce value judgments sothat comparisons could be consistent.

596 investigaciones económicas, vol xxvii (3), 2003
the one obtained by the reference household (generally a single-personhousehold) in terms of economic well-being.
A question that has not been resolved in the literature on equivalencescales is whether the relation described above is independent of incomeor the utility level at which the comparison is made2. If we assume thatthis independence exists, the "equivalent"income of any householdcan be calculated by dividing the total income of household bythe relevant equivalence scale , which depends only on the size anddemographic characteristics of the household:
( ) =( )
Most of the scales used for analysing income distribution do not varywith income, thus implying identical proportional adjustments for dif-ferent levels of income. It should be highlighted that a constant equi-valence scale necessarily implies that additional income levels to coverthe costs of a child, for example, are greater in absolute terms whenthe household’s income level increases. This assumption has obvioustheoretical justifications when analysing relative inequality or poverty.However, it could be less appropriate when defining equivalence scalesfor social policy or tax purposes3. This is particularly true concerningpersonal income tax, because the introduction of family allowancesthat increase with the level of income could be di cult to justify interms of vertical equity.
The range of equivalence scales employed in studies on income distri-bution is very wide4. They can be divided into three di erent groups:
1. A first group includes the scales estimated from household consump-tion data, usually obtained from large family budget surveys. The bestknown consumption scales are based in the Engel Method, which pla-ces a comparable level of well-being for households that allocate thesame percentage of their spending on food5. Other methods used toestimate the scales, such as Rothbarth’s and its variants developed
2See Lewbel (1989) for an analysis of the assumptions behind equivalence scalesindependent of the base level of income or utility. See also Conni e (1992).3See Ebert and Lambert (2002) for an analysis on the implications for progressionof di erent types of income dependent equivalence scales in income tax.4See Cowell and Mercader (1999) for an extensive survey of fundamental di cultieswith the di erent approaches for the construction of equivalence scales.5See Deaton (1998) for a formal discussion of the costs related to the di erenthousehold members.

l. ayala, r. martínez, j. ruiz-huerta: equivalence scales 597
in recent years, follow a similar philosophy, but use other kinds ofconsumption (generally some kind of spending on “adult goods”) toestablish the comparisons6. Econometric scales can be therefore deri-ved from micro-data on income, consumption and socio-demographiccharacteristics of the households included in family budget surveys7.
2. As an alternative to the previous method, some researchers ha-ve proposed deducing equivalence scales from consumer opinions onwide-ranging categories such as the standard of living. The procedureis based on using some of the subjective questions included in house-hold income or expenditure surveys which ask interviewees to answerquestions on their standard of living or well-being. As Cowell and Mer-cader (1999) have observed, "qualitative questions directly reveal thepopulation’s views on well-being". As is well-known, the influence ofthe researcher’s value judgements regarding the way qualitative ques-tions are formulated and/or the plausible relationship between respon-ses and e ective budget restrictions are some of the problems posedby subjective scales.
3. Most of the scales used when studying income distribution, parti-cularly in international comparisons of inequality or poverty, do nothave an explicitly specified empirical base. Perhaps the best knownscale within this group is the one designed by the OECD and its va-riants. This scale is based on a system of weightings that assigns aunitary value to the first adult and weightings of lower value to theremaining household members:
= 1 + ( 1) +
where the variable ah represents the number of adults in the household, and , the number of children. The original OECD scale assigns avalue of 0.7 to adults other than the head of the household and a valueof 0.5 to children. The correction for economies of scale is thereforereduced due to the lower weighting received by the second adult.
A di erent formulation that has been widely used is the parametricformulation (Buhmann et al., 1988). It calculates the number of equiva-
6See Hourriez and Olier (1997), and Deaton, Ruiz-Castillo and Thomas (1989).7The main criticism that has been made on obtaining scales by this procedure refersto the fact that it is not possible to calculate equivalence scales without includingsome previous presupposition. Demand patterns represent conditional preferences(Pollack and Walles, 1979 and Van Praag, 1994).

598 investigaciones económicas, vol xxvii (3), 2003
lent adults by elevating household size to a parameter ranging between0 and 1:
= 0 1
The parameter (equivalence elasticity) can be interpreted as the elas-ticity of non-adjusted income with regard to household size. As manydi erent studies have shown, many more complex scales can come closeto a parametric form as expressed above with a small margin of error(Banks and Johnson, 1994, and Jenkins and Cowell, 1994). The maindisadvantage of this formulation is that the scale only takes into ac-count household size. As some studies have suggested (particularly thecommittee of experts in charge of reviewing the U.S.’s o cial methodfor measuring poverty), the disadvantages arising from not consideringthe di erences between adults and minors can be avoided by proposinga more general formula for the parametric equivalence scale8:
= ( + ) 0 1 y 0 1
where is the number of adults, and the number of minors inhousehold . The main advantage of this formula is that it allows twodi erent aspects to be determined: the adjustment introduced to con-sider the lower costs of children (through the factor ) and a correctionthat assesses economies of scale (by means of parameter ).
Equivalence scales used in fiscal or social policies have several specificfeatures when compared to the methods described above. Firstly, theirobjectives and justifications can be quite di erent from those used inincome distribution analyses. In public transfer programs, scales aregenerally aimed at determining the amount of benefit that di erenttypes of family units are entitled to. They are usually based on therequirement of ensuring a basic level of income for the populationcovered by the program. In income tax, family related adjustments (inthe tax base, the tax rates or through family tax credits) are mainlyintended to graduate the tax burden according to a tax unit’s realability to pay. In both cases, however, other objectives are also possibleand these frequently contribute to shape the scales (e.g. to protectspecific types of family, to foster women’s participation in the labourforce or even to encourage an increase in birth rate).
Secondly, equivalence scales in social or tax policy are generally im-plicit in the way benefit payments or taxes are graduated according
8See Citro and Michael (1995), Cutler and Katz (1992) and Hourriez and Olier(1997).

l. ayala, r. martínez, j. ruiz-huerta: equivalence scales 599
to household characteristics. These scales need to be inferred fromthe relevant benefit or tax regulations. Such procedures are not al-ways straightforward. Concerning personal income tax, a commonlyused approach is to calculate the di erent levels of income for whichtax units of di erent compositions are considered to be equal in termsof economic capacity. As a result, these units will bear the same taxburden. This method usually implies the need to convert tax credits ortax rate reductions to their corresponding base-equivalents for di erentfamily types. A general characteristic of the implicit scales obtainedin this manner is that they vary with the level of income, usuallydecreasing as income rises. As was noted above, this is a feature thatdistinguishes these equivalence scales from most of ones used in incomedistribution analyses.
In democratic countries, an advantage of this kind of scales is thatthey are normally the result of the population’s preferences revealedthrough the electoral process (Atkinson, 1995). These scales, however,also have some potential drawbacks. Their main disadvantage is pro-bably the lack of any a priori analytical justification. Likewise, thecombination of adjustment elements along with the introduction of in-centives or protective measures targeted at specific population groupscan lead to results that are di cult to justify from a theoretical view-point9.
Although the di erences in the overall aims of equivalence scales usedin the di erent fields should be taken into account, public opinionincreasingly demands a minimum degree of consistency in the designof public policies. This is especially true when comparisons are made ofareas in which final objectives are similar (for instance, setting socialassistance benefits at adequate levels to reach a social minimum andtax base reductions for the amounts required to cover basic needs).Also relevant in this regard is the possible lack of linkage betweenthe scales traditionally used in income distribution analyses and thoseimplicit in government tax and transfer programs. In following sectionwe try to analyse these di erences by comparing the adjustments ofthe new Spanish Income Tax with the Minimum Guaranteed Incomeand parametric scales.
9A good example would be increasing the amounts of child benefit paid out to fami-lies with many children, which would suggest recognizing the existence of negativeeconomies of scale.

600 investigaciones económicas, vol xxvii (3), 2003
3. Equivalence scales implicit in the PFM
The Spanish Income Tax Law passed at the end of 1998 put into e ecta new way of adjusting the tax burden for the di erent kinds of hou-seholds by means of the notion of the Personal and Family Minimum(PFM). This new approach taxes discretionary income, which is defi-ned as disposable income once all the basic necessities of a taxpayer aremet. These necessities vary according to the taxpayer’s characteristics(age, disability) and existing family responsibilities. Thus, the PFMsimultaneously reflects the existence of a basic level of income thatshould not be taxed (a concept previously taken into account througha zero-rate tax base bracket) and adjustments to graduate the tax bur-den as a function of a tax payers’ family circumstances (which leads tofamily tax credits in personal income tax). Additionally, the new per-sonal income tax regulations maintain the possibility of filing joint taxreturns, but eliminates the reduced tax schedules previously applicablein such cases. Discretionary income (income less PFM exemptions) istaxed according to a single tax schedule.
The way PFM works is as follows. There is a basic personal minimumallowance. The amount of this basic personal minimum allowance de-
TABLE 1Implicit scales in legislation on the Personal and Family Minimum
Personal minimum Scale
Adult less than 65 1.00Adult 65 and over 1.18Adult with a disability between 33% and 65% 1.54Adult with a disability equal to or greater than 65% 2.09Adult without spouse, with children 1.64Adult over 65 without spouse, with children 1.82Disabled adult (33%-65%) without spouse, with children 2.18Disabled adult (≥ 65%) without spouse, with children 2.73
Family minimum ∆ Scale
Per ascendant ≥ 65 years whose income does not exceed the Minimum Wage(1) 0.18Per single descendant < 25 years whose income does not exceed 6.010,12 €
For the first and second child 0.36For the third and successive children 0.54
Supplement for school materials (descendants between 3 and 16) 0.05Supplement for children below 3 years of age 0.09Supplement for handicapped ascendant or descendant of any age whose income does not exceed 6.010,12 €(1)
Disability between 33% and 65% 0.54Disability equal to or greater than 65% 1.09
Note(1): 6.068 € for 2001.

l. ayala, r. martínez, j. ruiz-huerta: equivalence scales 601
pends on a series of personal characteristics. For instance, when ataxpayer has children or ascendants to support (who do not file taxreturns and do not receive any income above a certain level), the mi-nimum is increased by means of family supplements. Each taxpayercalculates his/her PFM tax exempt amount according to the sum ofall the personal and family minima that correspond to the tax unit.Each taxpayer is therefore only liable to pay tax for any income abovethis level.
Table 1 shows the scales implicit in the personal minimum when asingle adult younger than 65 years of age is taken as the point of re-ference. As we can see, the PFM increases from 18% to 173% as afunction of variables like age, level of disability or being the bread-winner of a single-parent family. At the same time, the existence offamily charges increases the PFM in cumulative proportions depen-ding on the number, age and other characteristics of the household’sadditional members. Considering the variables that are taken into ac-count to determine the overall reduction in the tax base, the implicitequivalence scale in the PFM can be expressed as:
= ( )
where represents the number of adult taxpayers (one in an indi-vidual tax return and two in a joint return), is the number ofchildren, the number of ascendants, is the vector of ages of thetax unit members, the vector containing information about the dis-ability status of adults and children, and is a variable reflectingsingle-parenthood.
It is important to highlight that values shown in Table 1 are the im-plicit scales at the level of income set by the PFM, which implies azero tax base. Due to the fact that amounts exempted from taxationare independent of income, implicit equivalence scales tend to diminishas income rises. Nevertheless, this zero tax base level is used becausewe are interested in establishing comparisons with family adjustmentsused in other social minima or poverty lines10.
3.1. Implicit scales in the PFM vs. minimum income scales
It is worthwhile asking oneself what relationship exists between the im-plicit assessment on family costs included in this approach with those
10See Ruiz-Huerta, Martínez and Ayala (2001) for a comparison between implicitequivalence scales in the present and the previous income tax at di erent incomelevels.

where = 1 ( = Autonomous Community), = 1 ( = num-ber of non-adult household members), represents the household’sequivalent adults, the number of adults other than the head of thehousehold, the weighting given in each Community to each adult
602 investigaciones económicas, vol xxvii (3), 2003
of other minima foreseen in Spanish social protection legislation or inthe thresholds used to measure poverty. Making a comparison with theguaranteed minimum income systems turns out to be specially usefulto carry out this assessment as such benefits attempt to guaranteeall families receive a minimum income that is su cient to cover theirbasic needs. These systems graduate benefits according to householdsize and, in some cases, the age of the members of the family receivingbenefit.
The decentralized nature of these schemes in Spain must be highlig-hted. The lack of a central government program encouraged regionalgovernments to begin establishing their own minimum income sys-tems in the 1990s. These regional initiatives have been handicappedby serious problems of co-ordination and financing from their incep-tion. This has resulted in a mosaic of highly varied schemes with astriking disparity of regulations and results. The number of equiva-lent adults derived from taking an average of the di erent equivalencescales implicit in the various minimum income systems of the SpanishAutonomous Communities (Regional Governments)11 can be definedas:
= 1 +X=1
+X=1
X=1
TABLE 2Implicit equivalence scales in Personal and Family Minimum of
regional and European minimum income programs
Personal and Minimum Income Minimum IncomeKind of Family Minimum Average Spain Average EUfamily unit Scale ∆ Scale ∆ Scale ∆One adult1 1.00 – 1.00 – 1.00 –Two adults1 2.00 1.00 1.16 0.16 1.62 0.62Couple + 1 child2 2.41 0.41 1.29 0.13 1.99 0.37Couple + 2 children2 2.82 0.41 1.40 0.11 2.37 0.38Couple + 3 children2 3.41 0.59 1.49 0.09 2.77 0.40Couple + 4 children2 4.00 0.59 1.57 0.08 n.a. n.a.Notes: 1 Adults < 65 years of age without disabilities; 2 Descendants aged 3-16 years. Sources: Own research based on Table 1, European Commission (1999) and data supplied by theSpanish Autonomous Communities.11The supplements allocated to each additional person vary between the extremesrepresented by Castilla-León and the Basque Country. The benefit is establishedindependently of household size in the former whereas in the latter two 30% moreis allocated to a second member and 20% more for the third and the followingmembers. See Ayala (2000)

l. ayala, r. martínez, j. ruiz-huerta: equivalence scales 603
other than the head of the household, the number of children livingin each household, and the weighting given to each additional childin each region up to a maximum number ( )12.
Table 2 shows the average equivalence scales that are implicit in theregional and European minimum income programs for the most com-mon family types compared with the ones implicit in the personalincome tax’s PFM . The latter is obtained from Table 1 taking adultsof less than 65 years of age without disabilities and with descendantsaged between 3 and 16. The first thing that strikes us about the com-parison above is the contrast between the negligible variation of theguaranteed minimum income provided by the regions as household sizeincreases and the increases foreseen by the Personal and Family Mi-nimum in personal income tax. Thus, the minimum income obtainedby a household composed of two adults is 16% more than the incomereceived by a single individual. This proportion is much lower than the100% implicit increase in the PFM thresholds. The cost assessmentassociated with children is also clearly lower. The amount of benefita couple with four children is entitled to is only 57% more than thebenefit received by a single person, while the Minimum for a familyunit of these characteristics is four times greater than for one adult.
The implicit scales in the European Union programs turn out to behigher despite the fact that they are also lower than the ones includedin the PFM foreseen in personal income tax. The main di erence inthis case is due to the less than proportional increase in benefit when asecond adult is added. This fact is coherent with the existence of eco-nomies of scale linked to household size which the adjustment schemeof the personal and family minimum allowance does not foresee13.
3.2. Implicit Scales in the PFM vs. scales applied in incomedistribution analyses
As was mentioned before, no consensus exists on the çorrect"scalesto use to measure poverty or inequality. Nevertheless, almost all theempirical scales have equivalent elasticity values that range from 0.20
12Most regional programs establish additional supplements for a maximum of eightchildren.13These di erences in the assessment given to spouses can be noted in other com-parisons with other minimum benefits existing in the Spanish social protection sys-tem. Thus, the increase in minimum pensions that contemplate having a dependentspouse is situated around 18%.

604 investigaciones económicas, vol xxvii (3), 2003
to 0.80 in the parametric formula. That is why we include three scaleswith parameters of = 0 25 = 0 50 y = 0 75 in the compari-son. These are intended to cover quite di erent assumptions regardingthe size of the economies of scale within households. The first of the-se presupposes the greatest economies of scale. It is very close to theestimated elasticity of subjective scales and is only slightly lower thanthe scale obtained from household consumption surveys. The second isused in much recent research on international comparisons and repre-sents an adjustment close to the one implicit in the scales based on thedetermination of minimum budgets for di erent types of households.The third presupposes lower economies of scale than the previous twoand could summarize the adjustments implicit in statistical scales putforward without any specific theoretical or empirical grounds to ma-ke comparative income distribution analyses. In addition, two otherscales are included in the comparison incorporating di erent adjust-ments for adults and children. These are the OECD scale14, whichhas been widely used in poverty and income studies in Spain, and thebi-parametric scale ( = 0 7 = 0 7)15.
14Some studies have found certain equivalence between OECD scale and that re-sulting from = 0 75.15The commission of experts charged with reviewing the o cial methods to measurepoverty in the United States recommends a weighting of 0.70 for children and anequivalent elasticity value situated between 0.65 and 0.75. See Citro and Michael(1995).
TABLE 3Implicit equivalence scales in the PFM and statistical scales
applied in income distribution analyses
Parametric scales
Type of Household PFM γ=1.00 γ=0.70 OECD
φ=0.25 φ=0.50 φ=0.75 φ=0.70 Scale
One adult1 1.00 1.00 1.00 1.00 1.00 1.00One person > 65 1.18 1.00 1.00 1.00 1.00 1.00Two adults1 2.00 1.19 1.41 1.68 1.62 1.70Two people > 65 2.36 1.19 1.41 1.68 1.62 1.70One adult + 1 child2 2.05 1.19 1.41 1.68 1.45 1.50One adult + 2 children2 2.45 1.32 1.73 2.28 1.85 2.00One adult + 3 children2 3.05 1.41 2.00 2.83 2.21 2.50One adult + 4 children2 3.64 1.50 2.24 3.34 2.55 2.70Two adults + 1 child2 2.41 1.32 1.73 2.28 2.00 2.20Two adults + 2 children2 2.82 1.41 2.00 2.83 2.35 2.70Two adults + 3 children2 3.41 1.50 2.24 3.34 2.68 3.20Two adults + 4 children2 4.00 1.57 2.45 3.83 3.00 3.70Notes: 1 Adults < 65 years of age without disabilities; 2 Descendants aged 3-16 years.

l. ayala, r. martínez, j. ruiz-huerta: equivalence scales 605
Table 3 shows the values of the resulting scales for twelve possible ty-pes of family units based on the head of the household, the existenceor not of a spouse and the number of children the family unit is res-ponsible for. As can be seen, none of the scales considered implement agraduation as detailed as the Personal and Family Minimum. Amountsdo not vary for adults over 65. Concerning the relative size of the ad-justments, the PFM is di erent from the rest of the statistical scalesconsidered by assigning the same weight to the main breadwinner andthe spouse (no economies of scale). This is obviously due to the wishof not disincentivising joint tax returns.
The increases in the scale arising from the family unit having childrenare situated slightly above the increases recommended by the commis-sion of American experts and below the implicit scales of the OECDfor the first two children. However, the amounts foreseen by the taxlaw for the third and successive children are more generous than in allthe other scales under consideration. The fact the Minimum increasesmore from the third child onwards represents an “anomaly” in theseimplicit scales (lack of economies of scale in large families). As canbe observed in the figures, all the other scales incorporate adjustmentsthat decrease slightly as household size increases, except for the OECDscale (whose adjustment is constant from the first child onwards). The
FIGURE 1Scale increases for different family units in the PFM
and other equivalence scales

606 investigaciones económicas, vol xxvii (3), 2003
explanation also probably resides in the existence of objectives besidesmerely quantifying the levels of income needed to cover basic needs.Such objectives could include the desire to provide special protectionin the form of a tax relief to families with more than two children.
4. The PFM and measuring poverty
As is well known, equivalence scales tend to have an influence on thesocio-demographic structure of poverty. This question will be analyzedin this section by comparing the poverty rates obtained for fifteen kindsof households when the PFM is applied with the poverty rates obtainedfrom three di erent adjustments, particularly the poverty rates derivedfrom the OECD scale, the parametric scale with f=0,5 and the doubleparameter scale ( = 0 7 = 0 7).
In Ruiz-Huerta, Martínez and Ayala (2000) we used the 1 wave dataof the European Community Household Panel (ECHP) to calculatethe poverty levels that would be obtained if a threshold equivalent tothe PFM was applied instead of the thresholds that are normally usedin most studies16. Assuming an average underestimation of 23% inreported income, we reached the conclusion that 13.6% of the Spanishpopulation belonged to households that obtained income levels belowtheir respective PFM’s expressed in 1993 prices. This figure is approxi-mately 65% of the relative poverty index obtained with a threshold ofhalf of the average equivalent income for the same year. Given that ouraim is to assess the pure e ect of the equivalence scales implicit in thePFM on the structure of poverty, we have chosen relative thresholdsthat generate poor populations of approximately equal sizes (about13.6% of the total population). This can be achieved using lines setat 42% of average equivalent income for the various equivalence scalesused in the analysis.
The classification of household types has been di erentiated into hou-seholds having only a single tax unit and households made up ofmore than one such unit. The former are solely formed by indivi-duals/couples with children or ascendants to support. In the latter,on the other hand, there are members that cannot be considered asdependants of the main breadwinner or his/her spouse, because theyare not part of the family or because they have incomes above the
16The European Community Household Panel (ECHP) is an income and livingconditions survey carried out simultaneously in almost all countries of the EuropeanUnion. The sample in Spain amounts to about 7,000 households.

l. ayala, r. martínez, j. ruiz-huerta: equivalence scales 607
maximum levels set by law (see Table 1). In these cases, the povertyrates according the PFM have been calculated by comparing the hou-sehold’s total income with the sum of PFM’s of the di erent tax units.We therefore chose the household as the unit of analysis to obtainthe poverty rates derived from both the PFM and conventional rela-tive scales. However, it was taken into account that the overall PFMof a household depends on its structure regarding the number of taxunits within the household, as the weighting of main taxpayers anddependants are not the same in the PFM.
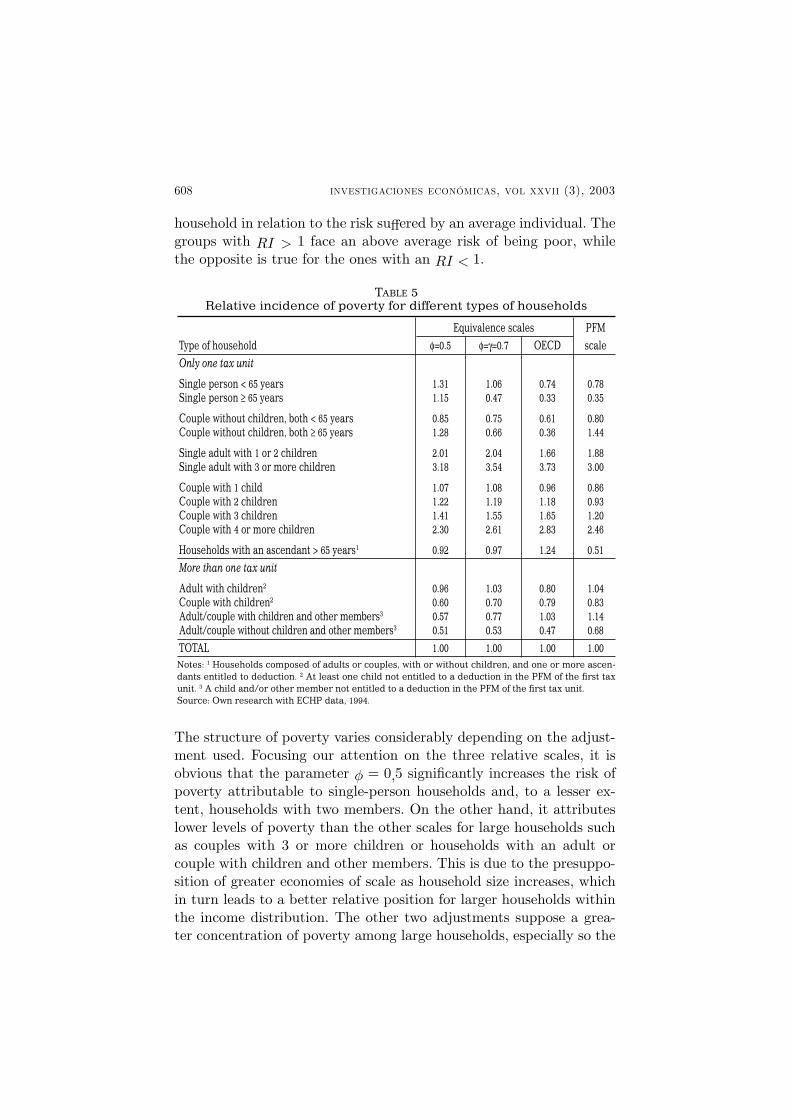
Table 4 shows the specific poverty rates that result for each kind ofhousehold in the four cases under consideration. Table 5 shows thesame information in terms of the relative incidence of poverty ( ),defined as the ratio between the specific poverty index and the generalindex for the population as a whole. This second indicator can beinterpreted in terms of the relative risk of being poor for each kind of
TABLE 4Poverty indices for different types of households
% Equivalence scales PFM
Type of household Population φ=0.5 φ=γ=0.7 OECD scale
Only one tax unit
Single person < 65 years 1.7 18.5 14.0 9.8 10.6Single person ≥ 65 years 2.4 16.1 6.2 4.4 4.8
Couple without children, both < 65 years 5.9 12.0 9.9 8.1 11.0Couple without children, both ≥ 65 years 5.9 18.1 8.7 4.7 19.6
Single adult with 1 or 2 children 1.3 28.3 26.9 22.2 25.6Single adult with 3 or more children 0.4 44.7 46.8 49.8 40.8
Couple with 1 child 12.5 15.0 14.3 12.8 11.7Couple with 2 children 19.9 17.2 15.7 15.8 12.7Couple with 3 children 7.2 19.8 20.4 22.0 16.4Couple with 4 or more children 2.1 32.3 34.5 37.8 33.5
Households with an ascendant > 65 years1 1.8 12.9 12.8 16.5 6.9
More than one tax unit
Adult with children2 4.2 13.5 13.6 10.6 14.1Couple with children2 18.4 8.4 9.3 10.5 11.2Adult/couple with children and other members3 13.0 8.0 10.2 13.8 15.5Adult/couple without children and other members3 3.3 7.2 13.2 6.3 9.3
TOTAL 100.0 14.0 13.2 13.3 13.6Notes: 1 Households composed of adults or couples, with or without children, and one or more ascen-dants entitled to deduction. 2 At least one child not entitled to a deduction in the PFM of the first taxunit. 3 A child and/or other member not entitled to a deduction in the PFM of the first tax unit.Source: Own research with ECHP data, 1994.
608 investigaciones económicas, vol xxvii (3), 2003
household in relation to the risk su ered by an average individual. Thegroups with 1 face an above average risk of being poor, whilethe opposite is true for the ones with an 1.
The structure of poverty varies considerably depending on the adjust-ment used. Focusing our attention on the three relative scales, it isobvious that the parameter = 0 5 significantly increases the risk ofpoverty attributable to single-person households and, to a lesser ex-tent, households with two members. On the other hand, it attributeslower levels of poverty than the other scales for large households suchas couples with 3 or more children or households with an adult orcouple with children and other members. This is due to the presuppo-sition of greater economies of scale as household size increases, whichin turn leads to a better relative position for larger households withinthe income distribution. The other two adjustments suppose a grea-ter concentration of poverty among large households, especially so the
TABLE 5Relative incidence of poverty for different types of households
Equivalence scales PFM
Type of household φ=0.5 φ=γ=0.7 OECD scale
Only one tax unit
Single person < 65 years 1.31 1.06 0.74 0.78Single person ≥ 65 years 1.15 0.47 0.33 0.35
Couple without children, both < 65 years 0.85 0.75 0.61 0.80Couple without children, both ≥ 65 years 1.28 0.66 0.36 1.44
Single adult with 1 or 2 children 2.01 2.04 1.66 1.88Single adult with 3 or more children 3.18 3.54 3.73 3.00
Couple with 1 child 1.07 1.08 0.96 0.86Couple with 2 children 1.22 1.19 1.18 0.93Couple with 3 children 1.41 1.55 1.65 1.20Couple with 4 or more children 2.30 2.61 2.83 2.46
Households with an ascendant > 65 years1 0.92 0.97 1.24 0.51
More than one tax unit
Adult with children2 0.96 1.03 0.80 1.04Couple with children2 0.60 0.70 0.79 0.83Adult/couple with children and other members3 0.57 0.77 1.03 1.14Adult/couple without children and other members3 0.51 0.53 0.47 0.68
TOTAL 1.00 1.00 1.00 1.00Notes: 1 Households composed of adults or couples, with or without children, and one or more ascen-dants entitled to deduction. 2 At least one child not entitled to a deduction in the PFM of the first taxunit. 3 A child and/or other member not entitled to a deduction in the PFM of the first tax unit.Source: Own research with ECHP data, 1994.

l. ayala, r. martínez, j. ruiz-huerta: equivalence scales 609
OECD scale. As was mentioned previously, this scale hardly takes intoaccount the economies of scale associated with the increase in house-hold size.
Despite the di erences in the intensity of poverty that result fromthe application of one or other scale, all three coincide in pointingout single-parent households and couples with four or more childrenas the main groups at risk of su ering poverty. Adults with three ormore children have rates that are more than three times the nationalrates. It is interesting to note that people over the age of 65 livingalone have poverty rates that are always lower than single adults agedbelow 65. Childless couples also show a lower incidence of povertythan the average, except for those made up of older people with the0,5 parameter scale.
Applying the adjustments implicit in the notion of PFM does notnotably change the delimitation of the groups at risk. Single-parentand large families still constitute the types of households su ering thehighest poverty rates. However, the relative incidence of poverty inthese groups is generally somewhat below the results obtained whenother scales are used. The main di erences reside in the way the PFMhandles households with ascendants. These di erences give rise to apoverty rate index that is notably lower for this group. A second pe-culiarity can be found in the relative position of childless couples whonormally obtain higher levels of poverty (especially older couples) withPFM scales. The reason behind this result is the equal weighting givento both spouses in the PFM, an aspect that none of the other scalesshares. Lastly, applying the PFM gives rise to higher poverty rates forthe four household types constituted by various tax units. This is dueto the fact that the tax law does not take into account any economiesof scales when various tax units live in the same household, contrary tothe other scales. Since almost 40% of the population belongs to thesefour types of households, this di erence is responsible for a large partof the overall e ect of using tax instead of statistical scales when iden-tifying the poor. It also explains the results obtained for single-parentfamilies, whose relative position is not worsened by PFM scales, inspite of the more generous scale used in the PFM when compared toother adjustments.
To sum up, although all the scales analysed coincide in delimiting themain groups at risk, the incidence of poverty in the di erent kinds ofhouseholds varies to a certain extent depending on which adjustment

610 investigaciones económicas, vol xxvii (3), 2003
is used. The graduation of needs included in the PFM leads to so-me peculiarities when compared to the other equivalence scales. Suchpeculiarities are essentially the result of the equal weighting given toboth spouses, the small adjustment introduced for dependant ascen-dants and the di erences that arise from the more restrictive way ofdefining the tax unit (and therefore taking into account economies ofscales) in comparison to the household concept used in conventionalpoverty analyses.
5. Conclusions
Equivalence scales constitute an indispensable tool to establish welfarecomparisons among individuals who face di erent personal and familycircumstances. These scales are also necessary to adequately determinethe needs or the ability to pay of individuals who are targeted by socialor tax policies. This study has made an attempt to compare the scalesimplicitly introduced by the PFM, which was designed for the 1998income tax reform, with the scales used in minimum income policiesand others that tend to be applied in income distribution studies.
As a first conclusion, it should be highlighted that our results showthere is a clear contrast between the increases in needs associated withlarger family units in the PFM and the graduation of benefits in themain national income maintenance programs. Generally speaking, theequivalence scales implicit in the PFM are more generous than theones foreseen in welfare benefit programs. In our view, this could leadto some problems concerning the coherence of tax and expenditurepolicies, which should be looked at in more detail.
Comparing the adjustments at the levels stipulated by the PFM andthe ones employed in other widely used equivalence scales to analysepoverty reflects some di erences that suggest economies of scale areconsidered to a lesser extent. This is a result of the fact that bothspouses are given equal weighting as well as the increase in the appli-cable minimum allowance for the third and successive children. Thisapproach contrasts with the ones followed by other scales, which al-ways assign a lower coe cient to the second adult as well as decreasingor, in some cases, assigning equivalent values to additional children.The treatment given to single-parent households is also more generousin the PFM because none of the other scales studied includes a specificthreshold for this kind of household.

l. ayala, r. martínez, j. ruiz-huerta: equivalence scales 611
Overall we can say that the scales implicit in the Personal and FamilyMinimum have the advantage of providing a more detailed graduationof sums dependent on circumstances such as being disabled or a single-parent, which other scales do not take into account. Nevertheless, thePFM adjustments include a notion on economies of scale that is ano-malous in the context of poverty studies and is therefore di cult totransfer to an analysis of the economic position of households.
Although we have to admit that di erent reasons and goals exist be-hind the income tax scales, a greater linkage between the di erentareas in which equivalence scales are used would be desirable. This isespecially true in the case of public policies that should, to a certainextent, have a common approach concerning the way basic needs aredefined, whether it be to determine the level of tax exemption or theamount of welfare benefits to be paid.

612 investigaciones económicas, vol xxvii (3), 2003
References
Atkinson, A.B. (1995), Incomes and the Welfare State Cambridge UniversityPress.
Atkinson, A.B. and F. Bourguignon (1982): “The comparison of multidimen-sioned distribution of economic status”, Review of Economic Studies 49,pp. 183-201.
Atkinson, A.B. and F. Bourguignon (1987): “Income distribution and di e-rences in needs”, in Feiwel, G.R. (ed): Arrow and the foundations of thetheory of economic policy, New York University Press.
Ayala, L. (2000), Las rentas mínimas en la reestructuración de los Estadosde Bienestar Madrid: Consejo Económico y Social.
Ayala, L., R. Martínez and J. Ruiz-Huerta (2001): “Equivalence scales in taxand transfer policies”, Papeles de Trabajo 28/01, Instituto de EstudiosFiscales.
Banks, J. and P. Johnson (1994): “Equivalence scales relativities revisited”,The Economic Journal 104, pp. 883-890.
Blundell, R. (1998): “Equivalence scales and household welfare: what can belearned from household budget data?”, in Jenkins, S.; A. Kapteyn y B.Van Praag (eds.): The Distribution of Welfare and Household Production,Cambridge University Press.
Bradbury, B. (1989): “Family size equivalence scales and survey evaluationsof income and well-being”, Journal of Social Policy 18, pp. 383-408..
Buhmann, B., L. Rainwater, L. Schmaus and T. Smeeding (1988): “Equi-valence scales, well-being, inequality, and poverty: sensitivity estimatesacross ten countries using the Luxembourg Income Study (LIS) databa-se”, Review of Income and Wealth 34, pp. 115-42.
Citro, C.F. and R.T. Michael (eds.) (1995), Measuring Poverty: A New Ap-proach, Washigton, D.C.: National Academy Press.
Conni e, D. (1992): “The non-constancy of equivalence scales”, Review ofIncome and Wealth 38, pp. 429-443.
Cowell, F.A. and M. Mercader (1999): “Equivalence scales and inequality”,in Silber, J. (ed.): Handbook of Income Inequality Measurement. Boston:Kluver Academic Publishers.
Cutler, D.M. and L. Katz (1992): “Rising inequality? Changes in the distri-bution of income and consumption in the 1980’s?”, American EconomicReview 82, pp. 546-51.
Deaton, A. (1998), The Analysis of Household Surveys The Johns HopkinsUniversity Press, Baltimore.
Deaton, A., J. Ruiz-Castillo and D. Thomas (1989): “The influence of house-hold composition on household expenditure patterns: theory and Spanishevidence”, Journal of Political Economy 97, pp. 179-200.
Del Río, C. and J. Ruiz-Castillo (1996): “Ordenaciones de bienestar e infe-rencia estadística. El caso de las EPF de 1980-81 y 1990-91”, in VV.AA.:La desigualdad de los recursos, Madrid: Fundación Argentaria-Visor.

l. ayala, r. martínez, j. ruiz-huerta: equivalence scales 613
Duclos, J.I. and M. Mercader (1999): “Household needs and poverty: withapplication to Spain and the U.K.”, Review of Income and Wealth 45, pp.77-98.
Ebert, U. and P.J. Lambert (2002): “Horizontal equity and progression whenequivalence scales are not constant”, Discussion Papers in Economics,2002/02, University of York.
Ebert, U. and P. Moyes (2000): “Is there any scape to equivalence scaleswhen adjusting incomes for needs?”,World Congress of The EconometricSociety, University of Washington.
European Commission (1999), La Protection Sociale dans les Etats Membresde L’Union, Comisión de las Comunidades Europeas, Bruselas.
Hourriez, J-M., and L. Olier (1997): “Niveau de vie et taille du ménage:estimations d’une échelle d’équivalence”, Économie et Statistique, pp. 308-309-310, pp. 65-94.
Jenkins, S. and F. Cowell (1994): “Parametric equivalence scales and scalerelativities”, The Economic Journal 104, pp. 891-900.
Jenkins, S. and P.J. Lambert (1993): “Ranking income distribution whenneeds di er”, Review of Income and Wealth 39, pp. 337-356.
Johnson, D. (1998): “Equivalence scales and the distribution of well-beingacross and within households”, in Jenkins, S.; A. Kapteyn. y B. Van Praag(eds.): The Distribution of Welfare and Household Production, CambridgeUniversity Press.
Lewbel, A. (1989): “Household equivalence scales and welfare comparisons”,Journal of Public Economics 39, pp. 377-391.
Nicholson, J.L. (1976): “Appraisal of di erent methods of estimating equi-valence scales and their results”, Review of Income and Wealth 22, pp.1-11.
Pollak, R.A. and T. Walles. (1979): “Welfare comparisons and equivalencescales”, American Economic Review 69, pp. 216-221.
Ruiz-Huerta, J., R. Martínez and L. Ayala (2000): “El mínimo personal yfamiliar en el IRPF: una valoración de su cuantía”, Hacienda PúblicaEspañola 152, pp. 151-170.
Ruiz-Huerta, J., R. Martínez and L. Ayala (2001): “Mínimo exento, reformafiscal y equidad: un análisis del caso español”, Hacienda Pública Española,Monografía 2001, pp. 53-78.
Van der Gaag, J. and E. Smolensky (1982): “True household equivalencescales and characteristics of the poor in the United States”, Review ofIncome and Wealth 40, pp. 415-31.
Van Praag, B. (1994): “Ordinal and cardinal utility: an integration of twodimensions of the welfare concept”, in Blundell, R., I. Preston y I. Walker(eds.): The Measurement of Household Welfare, Cambridge UniversityPress.

614 investigaciones económicas, vol xxvii (3), 2003
Resumen
El análisis de la distribución personal de la renta y la pobreza exige valorar elefecto de las economías de escala dentro del hogar y las diferentes necesidadesde cada uno de sus miembros. Para ello se han desarrollado diferentes tipos deescalas de equivalencia. Estas escalas están también presentes en varios tiposde impuestos y prestaciones sociales. En este artículo se revisan las escalas deequivalencia implícitas en el impuesto sobre la renta en España. Se identificanlos ajustes que incorpora el nuevo impuesto y se subrayan las diferenciascon los utilizados en otras prestaciones sociales y las escalas habituales en elestudio de la pobreza. Se estiman las tasas de pobreza para diferentes tiposde hogar utilizando tanto estas escalas implícitas como las tradicionales. Losresultados revelan que la legislación fiscal concede una menor valoración a laseconomías de escala dentro del hogar que el análisis distributivo.
Palabras clave: Escalas de equivalencia, impuesto sobre la renta, pobreza.
Recepción del original, junio de 2001Versión final, septiembre de 2002