The Validity of Unidimensional Scales. Different Association ...
25
DevelopmentsinDataAnalysis A .FerligojandA .Kramberger(Editors) Metodološkizvezki,12,Ljubljana:FDV,1996 TheValidityofUnidimensionalScales . DifferentAssociationStructuresinRelevant SubgroupsofaHeterogeneousPopulation HansWaege' Abstract Comparisonbetweengroupsisoneofthemaintopicsofsocialresearch . Often,wearenosureiftheindicatorsthataresupposedtomeasurea particularconcepthavethesamemeaningineachgroupofaheterogeneous population .Inordertoevaluatetheequalityofmeaningbetweengroupswe canchoosebetweenseveralmethods .Inthisarticlefivestatisticalmethodsfor multi-groupcomparisonarepresentedandcriticallyevaluated .Basedonthe findingswemustconcludethatitisnecessarytocombinedifferentmethods becausetheyhaveseveralweaknessandsometimescomplementarystrengths . 1 .Introduction Inthesocialsciencesingeneralandinthesociologicalsurveyresearchinparticular scalesarewidelyused .Thevastbodyofliteratureonboththemethodologicaland thesubstantivetheoryreflectstheirwidespreaduses . Thatgreatattentionisbeingpaidtoscaleconstructionislargelyduetothemany abstract,notdirectlyobservableconceptsthatareusedinsociologicalreasoning . Well-knownandcentralsociologicalconceptslikeanomie,socialintegration, tolerance,authoritarianism,culturalstatus,individualism,andsolidarityareall abstractand,veryoftencomplexconstructs .Otherconceptsthatseemdirectly observableatfirstsightshowgreatcomplexityuponmorethoroughexamination suchassocio-economicstatus .Scalingisthemostpopulartechniqueformaking theseabstractconstructsobservable . ' DepartmentofSociology,UniversityofLeuven,E .VanEvenstraat 2c, B-3000Leuven, Belgium
-
Upload
khangminh22 -
Category
Documents
-
view
0 -
download
0
Transcript of The Validity of Unidimensional Scales. Different Association ...
Developments in Data AnalysisA. Ferligoj and A . Kramberger (Editors)Metodološki zvezki, 12, Ljubljana: FDV, 1996
The Validity of Unidimensional Scales .Different Association Structures in RelevantSubgroups of a Heterogeneous Population
Hans Waege'
Abstract
Comparison between groups is one of the main topics of social research .Often, we are no sure if the indicators that are supposed to measure aparticular concept have the same meaning in each group of a heterogeneouspopulation . In order to evaluate the equality of meaning between groups wecan choose between several methods . In this article five statistical methods formulti-group comparison are presented and critically evaluated . Based on thefindings we must conclude that it is necessary to combine different methodsbecause they have several weakness and sometimes complementary strengths .
1. Introduction
In the social sciences in general and in the sociological survey research in particularscales are widely used . The vast body of literature on both the methodological andthe substantive theory reflects their widespread uses .
That great attention is being paid to scale construction is largely due to the manyabstract, not directly observable concepts that are used in sociological reasoning .Well-known and central sociological concepts like anomie, social integration,tolerance, authoritarianism, cultural status, individualism, and solidarity are allabstract and, very often complex constructs . Other concepts that seem directlyobservable at first sight show great complexity upon more thorough examinationsuch as socio-economic status . Scaling is the most popular technique for makingthese abstract constructs observable .
' Department of Sociology, University of Leuven, E . Van Evenstraat 2c, B-3000 Leuven,Belgium
128
Hans Waege
Since these concepts are not directly linked to an observable reality, we need ameasurement theory that links both the abstract concepts to the indicators used toobserve it . Note that a prerequisite for such a measurement theory is a clear andwell-developed substantive theory of the concept to be measured . Blalock (1968,1982) termed the theory that links indicators and concepts an auxiliary theory .Although Blalock and, with him, other measurement specialists stressed theimportance of an explicit and well-developed auxiliary theory, most sociologicaltheory and empirical research on abstract concepts has confused "auxiliary" with theunnecessary or the unimportant . Thus, auxiliary theory is only poorly developed andin many respects implicit . This is particularly the case for the very issue of thecomparability of measures .
Whenever empirical research is done comparison between groups is one of themain topics - comparison between educational levels, sexes, socio-economic levels,life-world cultures, nations . Recently, longitudinal research has become a focus ofsocial research . This frequent use of comparison of measures in empirical research isnot being accompanied by commensurate attention to the comparability of measureseither theoretically or methodologically . Sociological methodology in surveyresearch has mainly been concerned with error due to interviewer behaviour (cf .Billiet and Loosveldt, 1984, 1988 ; Sudman, Bradburn, and Schwartz, 1996) and errordue to response communications, memory effects, and other respondent effects . It issomewhat surprising that Sociology is concentrating mainly on individual respondenttraits such as the motivation of the respondent, non-attitudes and acquiescence .Social desirability is a more social variable but rarely is it presented as a feature of asocial group . Much, and perhaps most, of the effort in sociological methodology isfocused on questionnaire design (cf. Schumann and Presser, 1981 ; Groves, 1989) .
In the present article, we will assess the problem of comparability of measuresbetween relevant sub-groups of a heterogeneous population . The question is of greatimportance. If, for example, anomie is greater in the less educated groups but if thevalidity of the indicators used to measure anomie differs depending on theeducational level, then we do not know what these differences between educationalgroups really mean . In educational and psychological research, comparability ofmeasures has received much more attention, especially under the impetus of thequestion of comparability of intelligence tests, which has important ethical andpolitical consequences (cf. Berk, 1989) . The absence of such importantconsequences may be an explanation for the lack of interest of sociologicalmethodology in multi-group comparison . Some procedures that are being applied ineducational research will be presented below .
First of all, there is the problem of theory . In almost all substantive theories,there is no developed auxiliary theory linking the indicators to the concepts anddealing with the problem of the items having the same meaning to all sub-groups of agiven population. As Blalock points out 'there is no effective way to handle thecomparability issue without an explicit auxiliary measurement theory that can pindown the precise nature of potential non-comparability of measures across settings,
The Validity of Unidimensional Scales
129
time periods or individuals' (Blalock, 1982:60) . This substantive theoretical problemis beyond our present scope, which is limited to the presentation and application ofsome possibilities for multi-group comparison . We do hope that substantive andauxiliary theory will deal with the problem of comparability in the near future .
The central thesis that will be argued in this paper is that the way indicators andlatent variable are linked should be the same in the different relevant contexts . Theserelevant contexts can be differences in educational level, sex, socio-economic status,culture, language, or time . The same stimuli (items) can evoke differentconsequences depending on the setting in which they are presented and thus createdifferent meanings, even though the concept is supposed to be measured in the sameway in each setting . If this is the case, the errors that arise are attributed to constructbias . We will illustrate some possibilities for detecting construct bias in surveyresearch will be illustrated using two well-known sociological concepts : Adorno'sauthoritarianism and tolerance towards racial minorities . The technical dataconcerning the population and the measures are discussed in the following section .
2. Population and measures
2.1 Scales
Among the wide variety of scales available today, Adorno's F-Scale (1950) is one ofthe most popular social measures (Meloen, 1991) . Critics like Rorer (1965) andPeabody (1966) have questioned the application of this measurement instrument, butthe number of fundamental methodological concerns with this scale are few . Sincethe publication of Adorno's 'Authoritarian Personality' in 1950, evidence has beengathered to prove the reliability and the validity of the F-Scale . According to somecritics, the scale had to be adapted . The result of this process is a wide variety ofbalanced and unbalanced scales by Rokeach (1960), Kohn, (1972, 1974), Altemeyer,(1981) and others. Every country with a research tradition in political attitudes orpersonality research has its own variants of the F-scale . Some of the recent, mostcomprehensive work on authoritarianism has been done by Jos Meloen (1983, 1988,1991, 1993) . After reconsidering the reliability and validity assessment of theauthoritarianism measure(s), he argues that there is enough evidence to conclude thatthe original F-scale is a reliable and valid measure for anti-democratic and fascisttendencies in contemporary society (Meloen, 1991, 1993) .
Criterion validation is the most popular technique for providing evidence to assesthe validity of authoritarianism scale( e .g ., Eysenck, 1954 ; Christie, 1956 ; Sherwood,1966 ; Orpen, 1970 ; Steiner and Fahrenberg, 1970 ; Mantell, 1974 and Meloen, 1988) .One of the main shortcomings of the research on the validity of the F-scale howeveris the use of a homogenous population -almost always students- for validating theinstrument .
1 3 0
Hans Waege
The second aspect of the criticism and validation of the authoritarianism scale isacquiescence bias (yes saying), but evidence has been reported that supports theutility of the original unbalanced scale (Meloen, 1993) . However, in our opinion, theimportant criticism of Rorer (1965) has not ever been refuted . As the opponents ofthe F-scale have neglected the results of criterion validation that support its validity,its advocates have ignored Rorer's objection, which was primarily concerned with thevagueness of the items .
Because its advocates argue that it is both reliable and valid, we used a shortenedversion of the original F-scale to measure the authoritarianism concept . All the itemsused were worded in the original way (see Appendix) . Six of the seven sub-dimensions of authoritarianism were included in the scale . The Dutch translation isthe one commonly used in current research .
Attitude towards immigrants has been a very topical political and social issuesince the emergence of extreme-right parties in Europe . In general, the issue iscomparable to authoritarianism in the 1950s and the competing 'anomie' scale wasdesigned to predict racial prejudice . Since the extreme right was gaining popularityin Flanders and because of tensions between immigrants and the autochthonouspopulation, such research was also conducted in Flanders . Attitudes towardsimmigrants were measured with a balanced 8-item scale (see Appendix) based on theresearch of Felling et al . (1986, 1987), Billiet et al . (1990), and Waege (1991, 1993) .After exploratory research, the scale was adapted to the Flemish situation in the waythat immigrants were defined (Billiet, Carton, and Huys, 1990) .
2.2 Sample
The data for this paper were obtained from a study on political attitudes of 20- and21- year old young adults in Flanders (the Dutch speaking part of Belgium) . A two-phase cluster sample was used . First, we selected 45 Flemish towns or cities on thebasis of a proportional stratification of the degree of urbanization . We then selectedfrom each community a group of post-adolescents by means of random samplingstratified by sex . The names were taken from the official registers of the generalelections of 24 November 1991 . The respondents were interviewed between 15February and 20 March 1992 . To improve the quality of the results of the survey,the interviewers were trained2 and the interviewers were checked by both written andtelephone requestioning of a sample of the respondent group . Ultimately, 473 usablequestionnaires were obtained . There was a drop-out rate of 19 .3% from the originalsample (refusals, incorrect addresses, movers, etc .) . The population can beconsidered representative of the Flemish 20- and 21- year olds .
2 The interviewers were trained by the ISPO .
The Validity of Unidimensional Scales
1 3 1
3. Bias in construct validity
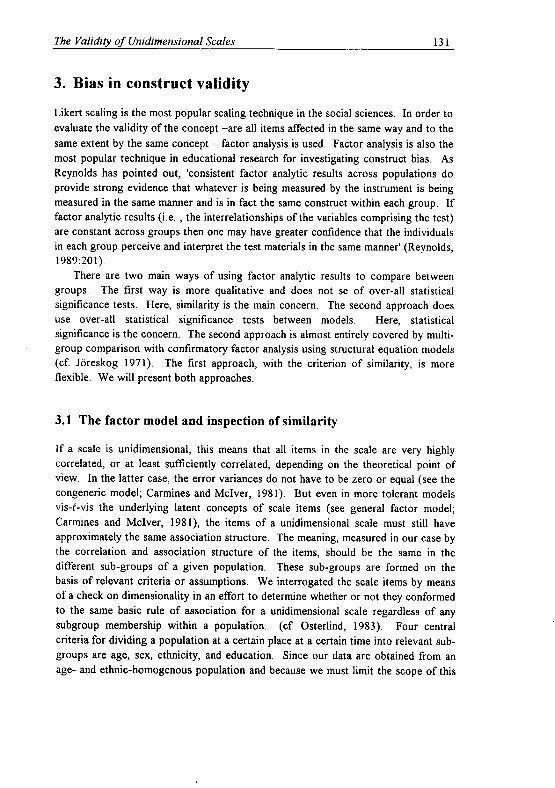
Likert scaling is the most popular scaling technique in the social sciences . In order toevaluate the validity of the concept -are all items affected in the same way and to thesame extent by the same concept - factor analysis is used . Factor analysis is also themost popular technique in educational research for investigating construct bias . AsReynolds has pointed out, 'consistent factor analytic results across populations doprovide strong evidence that whatever is being measured by the instrument is beingmeasured in the same manner and is in fact the same construct within each group . Iffactor analytic results (i .e . , the interrelationships of the variables comprising the test)are constant across groups then one may have greater confidence that the individualsin each group perceive and interpret the test materials in the same manner' (Reynolds,1989:201) .
There are two main ways of using factor analytic results to compare betweengroups . The first way is more qualitative and does not se of over-all statisticalsignificance tests . Here, similarity is the main concern. The second approach doesuse over-all statistical significance tests between models . Here, statisticalsignificance is the concern . The second approach is almost entirely covered by multi-group comparison with confirmatory factor analysis using structural equation models(cf Jöreskog 1971) . The first approach, with the criterion of similarity, is moreflexible . We will present both approaches.
3.1 The factor model and inspection of similarity
If a scale is unidimensional, this means that all items in the scale are very highlycorrelated, or at least sufficiently correlated, depending on the theoretical point ofview. In the latter case, the error variances do not have to be zero or equal (see thecongeneric model ; Carmines and McIver, 1981) . But even in more tolerant modelsvis-t-vis the underlying latent concepts of scale items (see general factor model ;Carmines and McIver, 1981), the items of a unidimensional scale must still haveapproximately the same association structure . The meaning, measured in our case bythe correlation and association structure of the items, should be the same in thedifferent sub-groups of a given population. These sub-groups are formed on thebasis of relevant criteria or assumptions . We interrogated the scale items by meansof a check on dimensionality in an effort to determine whether or not they conformedto the same basic rule of association for a unidimensional scale regardless of anysubgroup membership within a population . (cf. Osterlind, 1983) . Four centralcriteria for dividing a population at a certain place at a certain time into relevant sub-groups are age, sex, ethnicity, and education . Since our data are obtained from anage- and ethnic-homogenous population and because we must limit the scope of this
1 3 2
Hans Waege
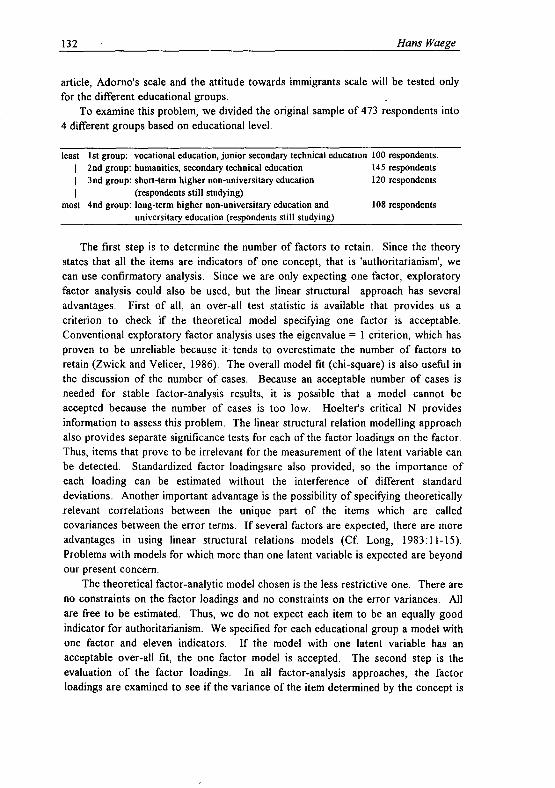
article, Adorno's scale and the attitude towards immigrants scale will be tested onlyfor the different educational groups .
To examine this problem, we divided the original sample of 473 respondents into4 different groups based on educational level .
least 1st group : vocational education, junior secondary technical education 100 respondents.2nd group : humanities, secondary technical education 145 respondents3nd group : short-term higher non-universitary education
120 respondents(respondents still studying)
most 4nd group : long-term higher non-universitary education and
108 respondentsuniversitary education (respondents still studying)
The first step is to determine the number of factors to retain . Since the theorystates that all the items are indicators of one concept, that is 'authoritarianism', wecan use confirmatory analysis . Since we are only expecting one factor, exploratoryfactor analysis could also be used, but the linear structural approach has severaladvantages . First of all, an over-all test statistic is available that provides us acriterion to check if the theoretical model specifying one factor is acceptable .Conventional exploratory factor analysis uses the eigenvalue = 1 criterion, which hasproven to be unreliable because it tends to overestimate the number of factors toretain (Zwick and Velicer, 1986) . The overall model fit (chi-square) is also useful inthe discussion of the number of cases . Because an acceptable number of cases isneeded for stable factor-analysis results, it is possible that a model cannot beaccepted because the number of cases is too low . Hoelter's critical N providesinformation to assess this problem . The linear structural relation modelling approachalso provides separate significance tests for each of the factor loadings on the factor .Thus, items that prove to be irrelevant for the measurement of the latent variable canbe detected . Standardized factor loadingsare also provided, so the importance ofeach loading can be estimated without the interference of different standarddeviations . Another important advantage is the possibility of specifying theoreticallyrelevant correlations between the unique part of the items which are calledcovariances between the error terms . If several factors are expected, there are moreadvantages in using linear structural relations models (Cf Long, 1983 :11-15) .Problems with models for which more than one latent variable is expected are beyondour present concern .
The theoretical factor-analytic model chosen is the less restrictive one. There areno constraints on the factor loadings and no constraints on the error variances . Allare free to be estimated . Thus, we do not expect each item to be an equally goodindicator for authoritarianism . We specified for each educational group a model withone factor and eleven indicators . If the model with one latent variable has anacceptable over-all fit, the one factor model is accepted . The second step is theevaluation of the factor loadings . In all factor-analysis approaches, the factorloadings are examined to see if the variance of the item determined by the concept is
The Validity of Unidimensional Scales
13 3
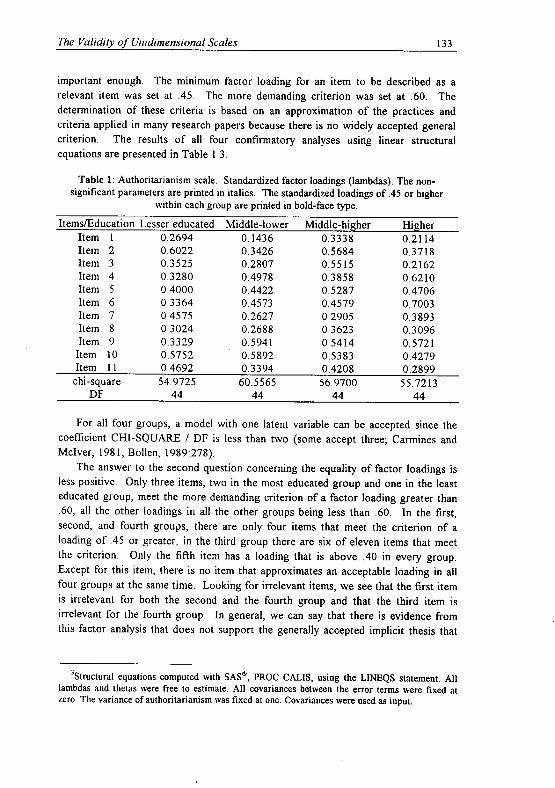
important enough . The minimum factor loading for an item to be described as arelevant item was set at .45 . The more demanding criterion was set at .60 . Thedetermination of these criteria is based on an approximation of the practices andcriteria applied in many research papers because there is no widely accepted generalcriterion . The results of all four confirmatory analyses using linear structuralequations are presented in Table 1 3 .
Table 1 : Authoritarianism scale . Standardized factor loadings (lambdas) . The non-significant parameters are printed in italics . The standardized loadings of .45 or higher
within each group are printed in bold-face type .
Items/Education Lesser educated Middle-lower Middle-higherHigherItem 1 0 .2694 0.1436 0.3338 0.2114Item 2 0 .6022 0.3426 0.5684 0.3718Item 3 0.3525 0.2807 0.5515 0 .2162Item 4 0.3280 0.4978 0.3858 0 .6210Item 5 0.4000 0.4422 0.5287 0 .4706Item 6 0.3364 0.4573 0.4579 0 .7003Item 7 0.4575 0.2627 0.2905 0.3893Item 8 0.3024 0.2688 0.3623 0.3096Item 9 0.3329 0.5941 0.5414 0.5721Item 10
0.5752
0.5892
0.5383
0.4279Item 110.46920.33940.42080.2899
chi-square
54.9725
60.5565
56.9700
55.7213DF44444444
For all four groups, a model with one latent variable can be accepted since thecoefficient CHI-SQUARE / DF is less than two (some accept three; Carmines andMcIver, 1981 ; Bollen, 1989 :278) .
The answer to the second question concerning the equality of factor loadings isless positive . Only three items, two in the most educated group and one in the leasteducated group, meet the more demanding criterion of a factor loading greater than.60, all the other loadings in all the other groups being less than .60 . In the first,second, and fourth groups, there are only four items that meet the criterion of aloading of .45 or greater, in the third group there are six of eleven items that meetthe criterion . Only the fifth item has a loading that is above .40 in every group .Except for this item, there is no item that approximates an acceptable loading in allfour groups at the same time . Looking for irrelevant items, we see that the first itemis irrelevant for both the second and the fourth group and that the third item isirrelevant for the fourth group . In general, we can say that there is evidence fromthis factor analysis that does not support the generally accepted implicit thesis that
3 Structural equations computed with SAS", PROC CALLS, using the LINEQS statement . Alllambdas and thetas were free to estimate . All covariances between the error terms were fixed atzero. The variance of authoritarianism was fixed at one . Covariances were used as input .
1 3 4
Hans Waege
the items assumed to measure authoritarianism behave in approximately the same wayin all four groups .
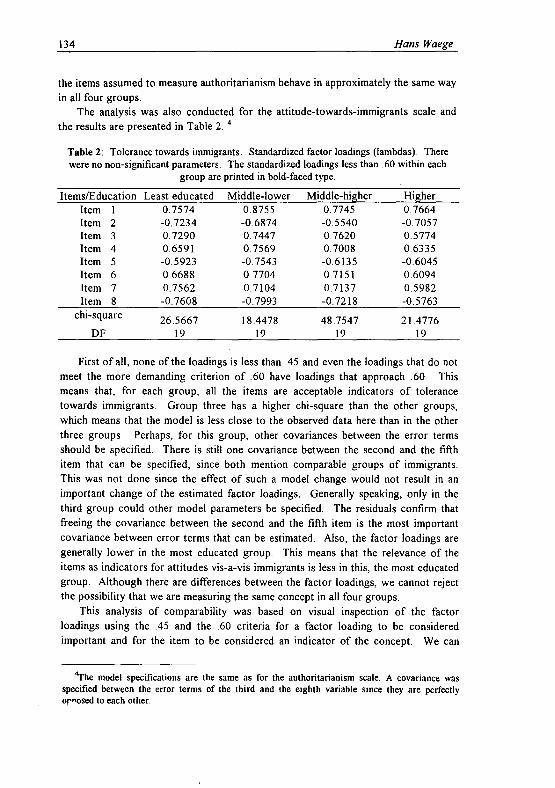
The analysis was also conducted for the attitude-towards-immigrants scale andthe results are presented in Table 2 .
Table 2 : Tolerance towards immigrants . Standardized factor loadings (lambdas) . Therewere no non-significant parameters . The standardized loadings less than .60 within each
group are printed in bold-faced type .
Items/Education Least educated Middle-lower Middle-higherHigherItem 1 0.7574 0.8755 0.7745 0.7664Item 2 -0 .7234 -0.6874 -0 .5540 -0.7057Item 3 0.7290 0.7447 0.7620 0.5774Item 4 0.6591 0.7569 0.7008 0.6335Item 5 -0 .5923 -0.7543 -0.6135 -0.6045Item 6 0.6688 0.7704 0 .7151 0.6094Item 7
0.7562
0.7104
0.7137
0.5982Item 8-0.7608-0 .7993-0.7218-0.5763
chi-square
26 .5667
18 .4478
48 .7547
21 .4776DF
19
19
19
19
First of all, none of the loadings is less than .45 and even the loadings that do notmeet the more demanding criterion of .60 have loadings that approach .60 . Thismeans that, for each group, all the items are acceptable indicators of tolerancetowards immigrants . Group three has a higher chi-square than the other groups,which means that the model is less close to the observed data here than in the otherthree groups . Perhaps, for this group, other covariances between the error termsshould be specified . There is still one covariance between the second and the fifthitem that can be specified, since both mention comparable groups of immigrants .This was not done since the effect of such a model change would not result in animportant change of the estimated factor loadings . Generally speaking, only in thethird group could other model parameters be specified . The residuals confirm thatfreeing the covariance between the second and the fifth item is the most importantcovariance between error terms that can be estimated . Also, the factor loadings aregenerally lower in the most educated group . This means that the relevance of theitems as indicators for attitudes vis-a-vis immigrants is less in this, the most educatedgroup. Although there are differences between the factor loadings, we cannot rejectthe possibility that we are measuring the same concept in all four groups .
This analysis of comparability was based on visual inspection of the factorloadings using the .45 and the .60 criteria for a factor loading to be consideredimportant and for the item to be considered an indicator of the concept . We can
°The model specifications are the same as for the authoritarianism scale . A covariance wasspecified between the error terms of the third and the eighth variable since they are perfectlyor"osed to each other .
The Validity of Unidimensional Scales
1 35
conclude that the comparability of the authoritarianism scale is very low andproblematical and that the comparability of the attitude-towards-immigrants scale ismuch better since all items have acceptable loadings (approximately .60 or more ) inall four groups . This first approach uses the acceptability of all items in all groups asthe criterion for comparability . Of course, this method does not take into accountdifferences between a factor loading of .60 and .80, which, depending on thestandard error of the differences, can be important . To assess this problem, morequantitative measures are needed to evaluate factorial similarity .
3.2 Descriptive summaries of overall similarity
Especially in the case of the attitude-towards-immigrants scale where thecomparability of the measures in not rejected by the 'qualitative' evaluation of thefactor loadings but where differences can be observed, it is relevant to our presentconcern to take a more quantitative look at the data in order to determine the degreeof similarity . There are several ways of doing so, but the discussion and presentationof all these methods is far beyond the scope of this article . Cattell (1979 :246-270)presents five possible measures for comparison between factors where the items arethe same and the subjects are different (see also Katzenmeyer and Stenner, 1977 ;Mulaik, 1972, Reynolds, 1982) . In this article, we will confine ourselves to thepresentation of one obvious measure that is not recommended and one that is popularin educational sciences and is recommended by Cattell (1979) .
One way to estimate the degree of similarity is by means of of Pearson'scoefficient of correlation between the pairs of factor loadings . Because ordinarycorrelation by taking deviations of the mean creates negative deviations when smallloadings are compared with high ones (Cattell, 1979 :252) and because ordinarycorrelations do not take into account differences in variance when the rank order ofthe factor loadings is equal, the use of Pearson's coefficient of correlation is notrecommended .
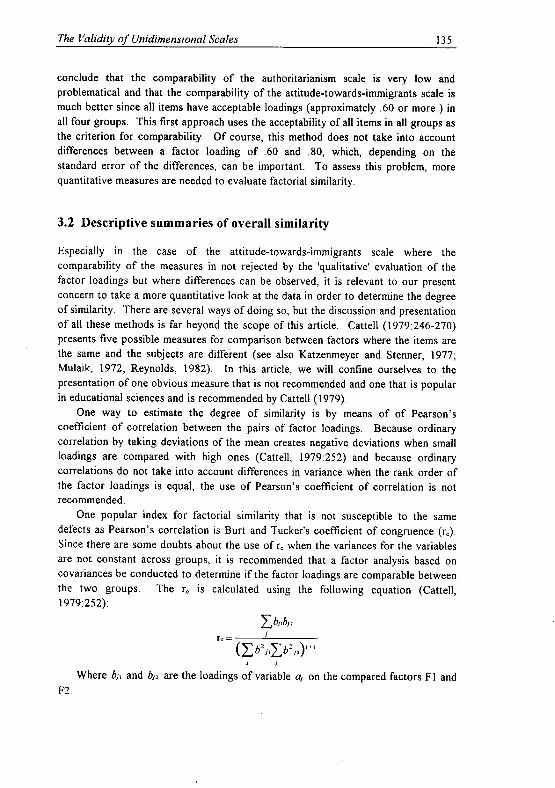
One popular index for factorial similarity that is not susceptible to the samedefects as Pearson's correlation is Burt and Tucker's coefficient of congruence (r e) .Since there are some doubts about the use of r . when the variances for the variablesare not constant across groups, it is recommended that a factor analysis based oncovariances be conducted to determine if the factor loadings are comparable betweenthe two groups . The r. is calculated using the following equation (Cattell,1979:252) :
F2 .
rc =Y_ b, . b, ~
i
(Y_b2 ;,Yb2')"'J
J
Where big and big are the loadings of variable ai on the compared factors Fl and
1 3 6
Hans Waege
One problem with this test of similarity is that there is no clear test ofsignificance. In order to evaluate the significance, results of Monte Carloexperiments are used (Cattell, 1979 :253-255) . We will use the table produced bySchneewind and Cattell (Cattell, 1979 :568) since it is more complete than others .
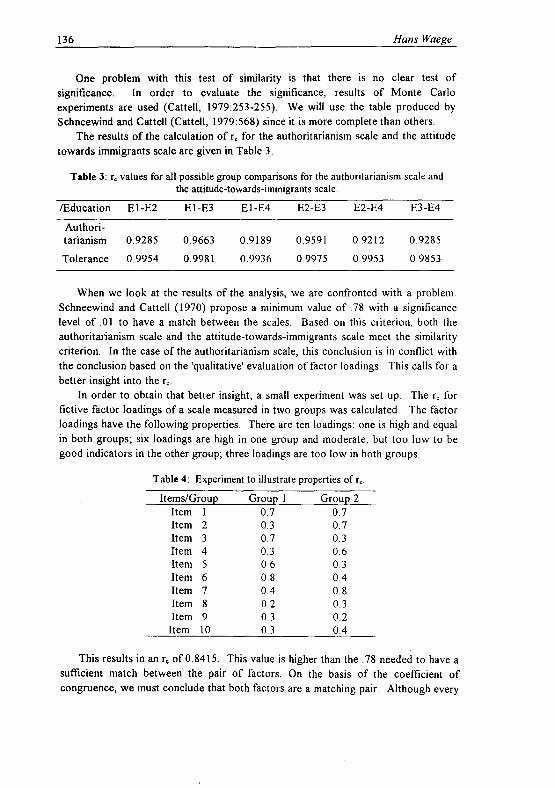
The results of the calculation of r, for the authoritarianism scale and the attitudetowards immigrants scale are given in Table 3 .
Table 3 : r, values for all possible group comparisons for the authoritarianism scale andthe attitude-towards-immigrants scale .
/Education E1-E2
E1-E3
E1-E4
E2-E3
E2-E4
E3-E4
Authori-tarianism
0.9285
0 .9663
0.9189
0 .9591
0.9212
0.9285
Tolerance
0.9954
0.9981
0.9936
0.9975
0.9953
0.9853
When we look at the results of the analysis, we are confronted with a problem .Schneewind and Cattell (1970) propose a minimum value of .78 with a significancelevel of .01 to have a match between the scales . Based on this criterion, both theauthoritarianism scale and the attitude-towards-immigrants scale meet the similaritycriterion . In the case of the authoritarianism scale, this conclusion is in conflict withthe conclusion based on the 'qualitative' evaluation of factor loadings . This calls for abetter insight into the rc .
In order to obtain that better insight, a small experiment was set up . The rc forfictive factor loadings of a scale measured in two groups was calculated . The factorloadings have the following properties. There are ten loadings : one is high and equalin both groups ; six loadings are high in one group and moderate, but too low to begood indicators in the other group ; three loadings are too low in both groups .
Table 4 : Experiment to illustrate properties of r, .
Items/GroupGroup 1Group 2Item 1 0.7 0.7Item 2 0.3 0.7Item 3 0 .7 0 .3Item 4 0 .3 0 .6Item 5 0 .6 0 .3Item 6 0 .8 0 .4Item 7 0.4 0.8Item 8 0 .2 0 .3Item 9 0 .3 0 .2Item 10
0.3
0.4
This results in an r, of 0 .8415 . This value is higher than the .78 needed to have asufficient match between the pair of factors. On the basis of the coefficient ofcongruence, we must conclude that both factors are a matching pair . Although every
The Validity of Unidimensional Scales
13 7
social scientist will agree after evaluating factor loadings that these two factors mayhave much in common but that they are not equal, with the coefficient of congruence,we mustconclude that they are invariant across the groups .
The problem is that this test is not able to distinguish between two importantcauses of similarity : the variance of the factor and the differences in the factorpattern (cf. Pinneau and Newhaus, 1964) . The conclusion is that r 0 of itself isinsufficient for evaluating the comparability of measures . It seems desirable to usesimilarity indices that are able to distinguish between variance as a cause of similarityand the factor loading pattern as a cause of similarity . As Cattell argues, 'Thismethod gives "credit" for the two factors matched being close in general size, asdistinct from being of the same pattern or rank ordering of loadings' (Cattell,1979:266) . The r, is useful as an evaluation of the comparability of measures vis-a-vis the general size .
3.3 Non-parametric test of equality of loadings one by one
To meet the critique of Burt and Tucker's coefficient of congruence, I propose adifferent strategy that stresses the similarity of the factor structure and takes intoaccount the problem of differences due to random errors .
The first and most important problem is the estimation of random error in orderto be able to determine if the differences between groups are considerably higher thanthe differences that may be expected by chance . One important measure often usedin statistics to assess the problem of significant differences are z-values . Thedifference is expressed in terms of the standard deviation of the mean . These z-values can only be used properly if the distribution of the differences between thefactor loadings is a normal distribution .
There is no relevant information about the distribution and standard deviation ofthe differences between the factor loadings in the population . To obtain thenecessary information, we have to estimate this difference and find a way of assessingthe problem of the distribution of those differences . Recently, bootstrapping hasbeen proposed as a way of accomplishing this (Mooney and Duval, 1993), for itprovides a technique to generate an empirical estimate of the sampling distribution .LISREL® 8 (Jöreskog and Sörbom, 1993) makes it possible to obtain these samplesand to calculate the corresponding factor loadings in a simple way . The followingsteps were needed to obtain the estimations of standard errors of the differencesbetween the factor loadings of the items .
• First, a number of samples had to be drawn from the original sample of 473respondents . The sampling proportion is 25% of the original sample since wehave four educational groups of comparable size . Since the aim is theestimation of standard errors, the number of estimates should be between 50and 200 (Mooney and Duval, 1993 :11) . To estimate one difference between
1 3 8
Hans Waege
the factor loadings on a given item, we needed two estimations of the loadingof a particular item . To obtain 100 estimates of differences, we needed 200estimates of factor loadings in a group of 25% of the original sample . In thiscase, 200 random samples with replacement were drawn from the originalsample .
• Second, after drawing the 200 samples, the factor loadings on all items of thescale were calculated for each group . Thus, for each item, 200 factor loadingswere calculated .
•
Third, 100 differences between factor loadings were calculated .•
Fourth, for each of the items the mean difference and the standard deviationfrom the mean difference were calculated, and the distribution of loadings waschecked for normality .
• Fifth, if a normal distribution was obtained, z-values were calculated toestimate the importance of the difference between factor loadings given thestandard deviation of the difference .
•
Finally, the importance or significance can be assessed using the distribution ofnormal probabilities .
The results of these steps for the authoritarianism scale are presented in Table 5 .The significance of the differences can be tested by proposing a minimum value of z .With a proposed a-level of .05 or .10, the critical values of z for absolute values is1 .96 or 1 .65 . Thus, the z-value can be used as a measure of similarity that takes intoaccount differences due to random error . Higher values represent higher differences :if the values are equal to or greater than a proposed critical value of z, one can inferthat the differences are significant and important . Since we have 66 estimations ofdifferences between factor loadings, a minimum z-value of about 2 would seem to benecessary to conclude that the differences between factor loadings are important .
Based on this criterion, Items 1, 5, 7, 8, 10, and 11 are comparable betweengroups, since there is no significant difference between any of the pairs of educationgroups. Items 2, 4, 9, and 6 are problematic vis-f-vis the comparability between thegroups . Evaluating the number of significantly different items in each comparisonshows that the comparison with the most educated seems more problematical andthat there are problems of comparison with the first and the third education group .
Compared with the first retained criterion, we have to conclude that thecomparability between groups is much better based on the z-value criterion thanbased on the critical value evaluation. The evaluation of the standard errors of theitem differences allows a partial interpretation . Since the mean is approximately 0 forall items, the z-value can be approximated by dividing the differences in factorloadings by the standard error . For all the items, all standard errors are above .10,and five items have standard errors of . 15 or higher . This means that the differencesfor these items have to be at least .30 or more before a significant value (z-value) isreached . The consequence of these findings is that a factor loading of .30, which
The Validity of Unidimensional Scales
1 39
would lead to rejection of the item in exploratory factor analysis compared with afactor loading of .59 for the same item, which would lead to acceptance of item as anindicator, is not detected as a significant difference by the z-value criterion when thestandard error of differences between factor loadings is high .
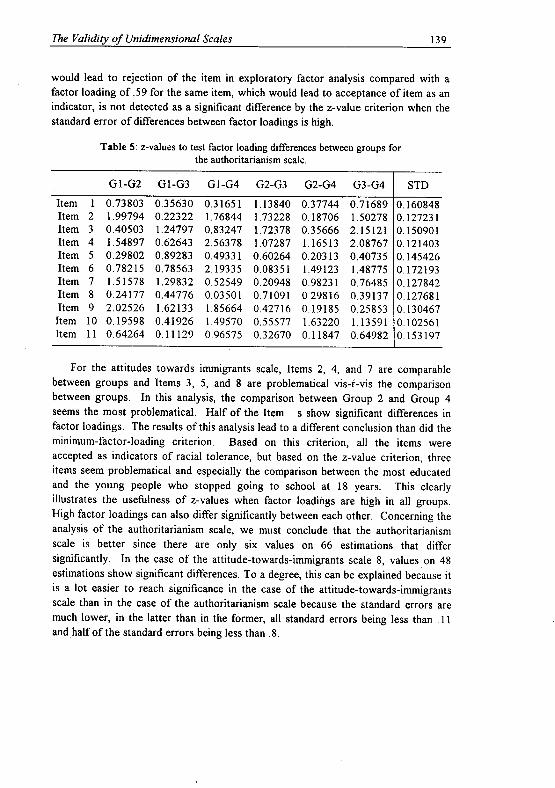
Table 5 : z-values to test factor loading differences between groups forthe authoritarianism scale .
G1-G2 G1-G3 G1-G4 G2-G3 G2-G4 G3-G4Item 1 0.73803 0.35630 0.31651 1 .13840 0 .37744 0.71689Item 2 1.99794 0 .22322 1.76844 1 .73228 0 .18706 1 .50278Item 3 0.40503 1 .24797 0.83247 1 .72378 0 .35666 2.15121Item 4 1.54897 0.62643 2.56378 1 .07287 1 .16513 2.08767Item 5 0.29802 0.89283 0 .49331 0.60264 0.20313 0.40735Item 6 0.78215 0 .78563 2 .19335 0.08351 1 .49123 1 .48775Item 7 1.51578 1.29832 0.52549 0.20948 0 .98231 0.76485Item 8 0.24177 0.44776 0.03501 0.71091 0 .29816 0.39137Item 9 2.02526 1 .62133 1 .85664 0.42716 0.19185 0.25853Item 10 0.19598 0.41926 1 .49570 0.55577 1 .63220 1 .13591Item 11 0.64264 0.11129 0.96575 0.32670 0.11847 0 .64982
STD
0.1608480.1272310.1509010.1214030.1454260.1721930.1278420.1276810.1304670.1025610.153197
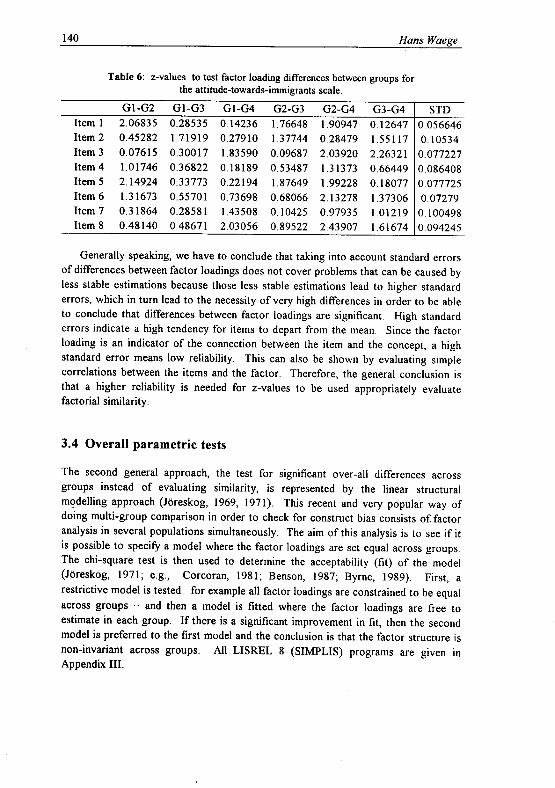
For the attitudes towards immigrants scale, Items 2, 4, and 7 are comparablebetween groups and Items 3, 5, and 8 are problematical vis-ŕ-vis the comparisonbetween groups. In this analysis, the comparison between Group 2 and Group 4seems the most problematical . Half of the Item s show significant differences infactor loadings . The results of this analysis lead to a different conclusion than did theminimum-factor-loading criterion . Based on this criterion, all the items wereaccepted as indicators of racial tolerance, but based on the z-value criterion, threeitems seem problematical and especially the comparison between the most educatedand the young people who stopped going to school at 18 years . This clearlyillustrates the usefulness of z-values when factor loadings are high in all groups .High factor loadings can also differ significantly between each other . Concerning theanalysis of the authoritarianism scale, we must conclude that the authoritarianismscale is better since there are only six values on 66 estimations that differsignificantly . In the case of the attitude-towards-immigrants scale 8, values on 48estimations show significant differences . To a degree, this can be explained because itis a lot easier to reach significance in the case of the attitude-towards-immigrantsscale than in the case of the authoritarianism scale because the standard errors aremuch lower, in the latter than in the former, all standard errors being less than .11and half of the standard errors being less than .8 .
140
Hans Waege
Table 6 : z-values to test factor loading differences between groups forthe attitude-towards-immigrants scale .
G1-G2 G1-G3 G1-G4 G2-G3 G2-G4 G3-G4Item 1 2.06835 0.28535 0.14236 1 .76648 1 .90947 0.12647Item 2 0.45282 1.71919 0.27910 1 .37744 0.28479 1 .55117Item 3 0.07615 0.30017 1 .83590 0.09687 2 .03920 2 .26321Item 4 1.01746 0.36822 0.18189 0.53487 1 .31373 0.66449Item 5 2.14924 0.33773 0.22194 1 .87649 1 .99228 0.18077Item 6 1.31673 0.55701 0.73698 0.68066 2 .13278 1 .37306Item 7 0.31864 0.28581 1 .43508 0.10425 0.97935 1 .01219Item 8 0.48140 0.48671 2.03056 0.89522 2 .43907 1 .61674
STD0.0566460.105340.0772270.0864080.0777250.072790.1004980.094245
Generally speaking, we have to conclude that taking into account standard errorsof differences between factor loadings does not cover problems that can be caused byless stable estimations because those less stable estimations lead to higher standarderrors, which in turn lead to the necessity of very high differences in order to be ableto conclude that differences between factor loadings are significant . High standarderrors indicate a high tendency for items to depart from the mean . Since the factorloading is an indicator of the connection between the item and the concept, a highstandard error means low reliability . This can also be shown by evaluating simplecorrelations between the items and the factor . Therefore, the general conclusion isthat a higher reliability is needed for z-values to be used appropriately evaluatefactorial similarity .
3.4 Overall parametric tests
The second general approach, the test for significant over-all differences acrossgroups instead of evaluating similarity, is represented by the linear structuralmodelling approach (Jöreskog, 1969, 1971) . This recent and very popular way ofdoing multi-group comparison in order to check for construct bias consists of. factoranalysis in several populations simultaneously . The aim of this analysis is to see if itis possible to specify a model where the factor loadings are set equal across groups .The chi-square test is then used to determine the acceptability (fit) of the model(Jöreskog, 1971 ; e .g ., Corcoran, 1981 ; Benson, 1987; Byrne, 1989) . First, arestrictive model is tested -for example all factor loadings are constrained to be equalacross groups - and then a model is fitted where the factor loadings are free toestimate in each group . If there is a significant improvement in fit, then the secondmodel is preferred to the first model and the conclusion is that the factor structure isnon-invariant across groups . All LISREL 8 (SIMPLIS) programs are given inAppendix III .
The Validity of Unidimensional Scales 141
For the authoritarianism scale, the model with equality constraints on all thefactor loadings has a chi-square of 264.93 with 200 degrees of freedom ; the modelwith all the factor loadings free to estimate has a chi-square of 230.98 with 170degrees of freedom . The difference in chi-square is 33 .95 with 30 degrees offreedom. There is no significant improvement in model fit when the factor loadingsare free to estimate . Based on these findings, we can conclude that the factorloadings are invariant across groups for the authoritarianism scale (first itemomitted) .
For the attitude-towards-immigrants scale, the constrained model has a chi-square of 199.37 with 127 degrees of freedom ; the model with unconstrained factorloadings (lambdas) has a chi-square of 164.24 with 103 degrees of freedom . Thedifference in chi-square is 35 .13 with 24 degrees of freedom. Freeing the factorloadings does not result in a significant improvement in over-all model fit .
Based on this criterion, we have to conclude that the factor is invariant acrossgroups. The scale can be used in the same way for the four educational groups .
Again, poor factor loadings constitute an important problem . Saris and Satorra(1993 ; also Saris, Sattora, and Sörbom, 1987) show that the power to detectmisspecifications of a model depends not only on the sample size but also on themodel specification, the lower parameters making it more difficult to detectmisspecifications . For the authoritarianism scale, we have both low parameterestimates and small samples . It is possible that the power of the test if too low todetect misspecifications . Also Jöreskog (1993) stresses the importance of theoryover statistical models. Many researchers using LISREL report difficulties indistinguishing between competing models . LISREL seems most appropriate fordistinguishing between models with bad and good fits, it is less appropriate fordistinguishing between competing models with acceptable fits .
4. Discussion and conclusion
In this article, five ways of evaluating the similarity of factors between groups werepresented and discussed : a qualitative way using common criteria for items to beretained as indicators for a latent variable, the Pearson's coefficient of correlationbetween factor loadings, Burt and Tucker's r ., z-value computation for each itemwithin each group, and the over-all model fit (chi-square) from a linear structuralequation modelling approach. These possibilities are only a sample of the possiblemethods for evaluating factorial similarity, but most of them are commonly used ineducational sciences and psychology (cf Reynolds, 1982 ; Byrne, 1989) . All thesemethods have their strengths and their weaknesses .
The first method looks within each group to see if all the items are acceptable asgood indicators of the concept . To do this, the critical values for the factor loadingswere those commonly used in social sciences. With this criterion, we concluded thatcomparability was problematical for the authoritarianism scale Most of the factor
142
Hans Waege
loadings were too low, particularly in the least-educated groups . Measures for theinternal consistency (e .g ., Cronbach's alpha) would lead to the same conclusion asthat based on the evaluation of the size of factor loadings : the internal consistency ofthe scale is too low within each educational group to conclude that the scale is areliable measure . The most important weakness of this first criterion is that there isno evaluation of significance of differences between groups when the factor loadingsare high, such as .60 or higher, and that there is no criterion to distinguish betweenrandom differences and substantive differences .
To meet these two important shortcomings of the more qualitative evaluations,the use of z-values was proposed when the differences between factor loadings arenormal distributions . To estimate the standard error and the mean for the differencesbetween factor loadings, bootstrapping was used . Since all the differences betweenfactor loadings were normal distributions, z-values could be used . Based on thiscriterion, the attitude-towards-immigrants scale showed more problems than did theauthoritarianism scale . This difference vis-ŕ-vis the first way of assessing factorialsimilarity was mainly due to the large difference in standard deviations, the standarddeviations for the authoritarianism scale being high because of the poor consistencyof the scale . So the problem at the first level, detected by simple inspection of thefactor loadings for each group, was no longer detected by z-values . On the contrary,high standard deviations for less stable factor loadings for the items lead to thenecessity of very high differences . The usefulness of z-values depends on theconsistency of the measurement . When the consistency is too low, z-values are lessappropriate . When the internal consistency was high enough, as in the case of theracial attitude towards immigrants scale, z-values were useful for detecting animportant difference between the most educated and the secondary-school educatedyoung people . Half of the items showed significant differences . This problem recursin the structural modelling approach .
Within the same context two other measures for factorial similarity werediscussed . Pearson's coefficients of correlation between factor loadings wasconsidered on the basis of the literature . Because ordinary correlation takesdeviations of the mean, negative deviations are computed when small loadings arecompared with high ones. Also ordinary correlation does not take into accountdifferences in variance when the rank orders of the factor loadings are equal . Basedon these two important shortcomings, the use of the Pearson's coefficient ofcorrelation was not recommended .
Another, popular measure of factorial similarity is Burt and Tucker's coefficientof congruence (re) . The coefficient was lower for the authoritarianism scale than forthe racial attitude towards immigrants scale. This result was not concordant withboth the critical-factor loading criterion and the z-value evaluation . The mainweaknesses of this coefficient are that there is no way of distinguishing betweendifferences in variance between factors and differences in the factor-loading pattern .The occurrence of high factor loadings in both groups for different items, particularlywhen these are combined with moderate loadings in the other groups can still lead to
The Validity of Unidimensional Scales
143
significant values for r . . Although, this coefficient is not useless, the weight of highfactor loadings in the total score is very high, too high to obtain a differentiatedevaluation of factorial similarity . In this last respect, it is similar to the first way ofassessing factorial similarity .
The fifth way of assessing the question of factorial similarity involves LISRELand similar techniques . LISREL was used to specify two different models, one withall factor loadings set equal and one with all factor loadings free to estimate withineach group . The differences in chi-square relative to the difference of the degrees offreedom were evaluated. For both scales, there was no significant improvement inmodel fit when the factor loadings were freed . On the basis of the parsimonycriterion, the model with the loadings set equal to each other was accepted . So theLISREL approach did not account for the differences found when evaluating z-valuesfor the attitude towards immigrants scale. These differences disappeared in the highnumber of equalities. Also, as expected given the kind of analysis, it did not indicatethat the authoritarianism scale only had poor factorloadings within each group(combined with approximately equal variances) making it very hard, also for LISRELto detect significant differences between groups especially, when combined withsmall samples (cf. Saris and Satorra, 1993) . Apart from this, it should be noted thatthe experience of many researchers indicates that LISREL has problems withdetecting differences between competing models when differences in over-all modelfit are evaluated . LISREL offers possibilities of distinguishing between models witha bad fit and models with a good fit, but LISREL is less appropriate for the'exploratory' evaluation of nearly equivalent models (Jbreskog, 1993) . When notheory is available, the parsimony criterion can be applied . When theory is availableand LISREL is not able to distinguish between a model with fixed factor loadings anda model with freed factor loadings, we cannot conclude validation or falsification ofthe theory .
With this last remark, we return to the introduction of this article . An importantand hitherto too often neglected concern of social scientists working with measuresshould be a theory about the comparability of measures between groups . Based onthis theory, ways could be developed to evaluate the comparability of measures .From the comparison of five techniques for the evaluation of factorial similarity and apartial discussion of these techniques, we can at least conclude that severaltechniques have to be applied since all of them have strengths and weaknesses andnone was able to distinguish between several aspects of factorial similarity .Therefore, a conclusion that factors are similar or dissimilar across groups based ononly one of these criteria should be approached very critically .
To illustrate the possibilities of joint use of several indices for factorial similarity,the conclusions for the two substantive measures used as illustrations are as follows :
• Concerning the authoritarianism scale, we have to conclude that it is verydifficult to assess the problem of comparability of the measure since theconsistency of the scale is low which creates high standard errors; for LISREL
144
Hans Waege
too, poor loadings can lead to low power of the test . It seems that assessmentof the comparability of this measure can only be addressed with more stableand larger estimations of the factor loadings or with larger samples .
•
For the attitude-towards-immigrants scale, the consistency of the scale isacceptable . Based on the critical factor loading criterion and r ., we canconclude that the measure is comparable across groups . Comparison betweenLISREL models also leads to the same conclusion . Only the z-values qualifythese findings . From the evaluation of z-values, we detect a problem ofcomparability between the most educated and the secondary-school educated .The items of the scale show less relevance for the most educated . Althoughthe first three criteria show that this problem is not important enough to rejectthe scale because of non-comparability, the evaluation of z-values shows thatthe measure for attitudes towards immigrants could be improved with respectto greater relevance for the most educated .
References
[1] Altemeyer B . (1981) : Right-wing authoritarianism . Winnepeg : University ofManitoba Press .
[2] Benson J. (1987): Detecting Item Bias in Affective Scales . Educational andPsychological Measurement, 47, 55-67 .
[3] Berk R. A. (1982) : Handbook of methods for detecting test bias . Baltimore :Johns Hopkins University Press .
[4] Billiet J ., Eisinga R ., and Scheepers P . (1992) : Ethnocentrisme in de LageLanden: opinies over 'eigen' en 'ander' yolk in Nederland en Vlaanderen .Sociologische Gids, 38, 300-323 .
[5] Billiet J ., Carton A ., and Huys R . (1990) : Onbekend of onbemind. Eensociologisch onderzoek naar de houding van de Belgen tegenover demigranten .
Leuven :
Departement
Sociologie/
SociologischOnderzoeksinstituut .
[6] Billiet J ., Loosveldt G., and Waterplas L . (1984) : Het Survey-InterviewOnderzocht. Effecten van het ontwerp en gebruik van vragenlijsten op kwaliteitvan de antwoorden . Leuven: Sociologisch Onderzoeksinstituut K .U.Leuven .
[7] Billiet J ., Loosveldt G ., and Waterplas L . (1988) : Response-Effecten bijSurvey-Vragen in het Nederlandse Taalgebied. Leuven : SociologischOnderzoeksinstituut K .U.Leuven.
[8] Billiet J . and Loosveldt G . (1988): Improvement of the Quality of Responsesto Factual Survey Questions by Interviewer Training . Public OpinionQuarterly, 52, 190-211 .
The Validity of Unidimensional Scales
1 45
[9] Blalock H .M. (1982) : Conceptualization and Measurement in the SocialSciences . New York : Sage .
[10] Bollen K . A . (1989) : Structural Equations with Latent Variables . New York :Wiley .
[11] Byrne B .M. and Shavelson R .J . (1987) : Adolescent self- concept : Testing theassumption of equivalent structure across gender. American EducationalResearch Journal, 24, 365-385 .
[12] Byrne B .M . (1991) : The Maslach Burnout Inventory: Validating FactorialStructure and Invariance Across Intermediate, Secondary, and UniversitaryEducators . Multivariate Behavioral Research, 26, 583-605 .
[13] Byrne B.M . (1989) : A Primer of LISREL : basic Applications andProgramming for Confirmatory Factor Analytic Models . New York : Springer-Verlag.
[14] Carmines E .G. and McIver J .P . (1981) : Analyzing Models with UnobservedVariables : Analysis of Covariance Structures . In G.W . Bohrnstedt and E.F .Borgatta (Eds.), Social Measurement: Current Issues, Berverly Hills : Sage, 65-115 .
[15] Carmines E .G . and Zeller R.A . (1979) : Reliability and Validity Assessment .Beverly Hills : Sage .
[16] Cattell R .B . (1966) : Handbook of Multivariate Experimental Psychology .Chicago: Rand McNally & Company .
[17] Cattell R .B . (1979) : The Scientific Use of Factor Analysis . New York :Plenum Press .
[18] Christie R . (1956) : Eysenck's Threatement of the Personality of Communists .Psychological Bulletin, 53, 411-430 .
[19] Eysenck H .J . (1954) : The Psychology of Politics . London: Routledge andPaul Kegan .
[20] Felling A ., Peters J., and Scheepers P . (1986) : Theoretische modellen terverklaring van ethnocentrisme . Nijmegen : ITS .
[21] Fellings A ., J . Peters, and 0 . Schreuder (1987) : Religion in Dutch Society 85 .Documentation on a national suurvey on religious and secular attitudes in1995. Amsterdam : Steinmetz Archive .
[22] Groves R .M . (1989) : Survey Errors and Survey Costs . New York: Wiley .[23] Kohn P .M . (1972) : The Authoritarian-Rebellion Scale : a Balanced F-scale with
Left-Wing Reversals . Sociometry, 35, 176- 189 .[24] Kohn P.M . (1974) : Authoritarianism, Rebeliousness, and their Correlates
among Britisch Undergraduates . Britisch Journal of Social and ClinicalPsychology, 13,245-255 .
[25] Lee R.E. and P .B. Warr (1969) : The Developement and Standardization of aBalanced F-scale . Journal of General Psychology, 81, 109-129 .
146
Hans Waege
[26] Jöreskog K .G . (1971) : Simultanious factor analysis in several populations .Psychometrika, 36, 409-426 .
[27] Jöreskog K .G . (1993) : Testing Structural Equation Models . In K.A. Bollenand J . S . Long (Eds .), Testing Structural Equation Models, London : Sage .
[28] Jöreskog K .G. and Sörbom, D . (1993): Bootstrapping and Monte CarloExperminenting with PRELIS 2 and LISREL 8 . Chicago: Scientific SoftwareInternational Inc . .
[29] Jöreskog K.G. and Sörbom, D . (1989) : LISREL 7: a guide to the program andapplications. Chicago: SPSS .
[30] Jöreskog K.G. and Sörbom, D . (1993) : LISREL 8: Structural EquationModdeling with the SIMPLIS Command Language . Hillsdale, NJ : LawrenceEarlbaum Associates Publishers .
[31] Kohn P .M . (1972) : The authoritarian-rebellion scale : a balanced F-scale withleft-wing reversals . Sociometry, 35(1), 176-189 .
[32] Long J . S . (1983) : Confirmatory Factor Analysis : A Preface to LISREL .Beverly Hills : Sage .
[33] Mantell D.M . (1974) : "True Americanism": Green barets and war-resisters .London : Columbia University .,
[34] Meloen J .D . (1983) : De autoritaire reactie in tijden van welvaart en krisis .Unpublished doctoral dissertation : University of Amsterdam .
[35] Meloen J . (1991) : De autoritarisme-concepten van Adorno et al . en Altemeyervergeleken: theoretische analyse en empirische test . In : P . Scheepers, & R .Eisinga (Eds .), Onderdanig en Intolerant, Nijmegen : ITS, 103-126 .
[36] Meloen J . (1991) : Een kritische analyse van veertig jaar onderzoek naar deautoritaire persoonlijkheid . In: P . Scheepers and R. Eisinga (Eds .),Onderdanig en intolerant, Nijmegen : ITS, 127-150 .
[37] Meloen J .D . (1993) : The F Scale as a Predictor of Fascism : An Overview of 40Years of Authoritarianism Research . In: W.F . Stone, G. Lederer, and R .Christie (Eds.), Strenght and Weakness: The Authoritarian Personality Today,New York: Springer Verlag, 47-69 .
[38] Meloen J .D ., Hagendoorn L ., Raaijmakers Q ., and Visser L . (1988) :Authoritarianism and the Revival of Political Racism : Reassesements in theNetherlands of the Reliability and Validity of the Concept of Authoritarianismby Adorno et al., Political Psychology, 9, 413-429 .
[39] Mooney C .Z . and Duval R .D . (1993) : Bootstrapping. A NonparametricApproach to Statistical Inference . Newbury Park : Sage .
[40] Mulaik S .A. (1972) : The foundations of factoranalysis . New York: McGraw-Hill .
[41] Orpen C . (1970) : Authoritarianism in an "Authoritarian" Culture : The case ofAfrikaans-Speaking South Africa . Journal of Social Psychology, 81, 119-120 .
The Validity of Unidimensional Scales
147
[42] Osterlind S .J. (1983) . Test Item Bias . Beverly Hills : Sage .[43] Pinneau S.R. and Newhouse A .
(1964) : Measures of invariance andcomparability in factor analysis for fixed variables . Psychometrika, 29 .
[44] Reiser M .R . (1981) : Latent Trait Moddeling of Attitude Items . In: G.W .Bohrnstedt and Borgattta Edgar (Eds .), Social Measurement: Current Issues,Beverly Hills : Sage, 117-144 .
[45] Rokeach M. (1968) : Belief Attitudes and Values: A Theory of Organisationand Change . San Francisco : Jossey Bass .
[46] Rorer L.G . (1965) : The Geat Response Style Myth. Psychological Bulletin,63, 129-156 .
[47] Saris W .E ., Satorra A ., and Sörbom D . (1987) : The detection and correction ofspecification errors in structural equation models. In Clogg, C .C . (Ed .)Sociological Methodology 1987, Washington D.C . : ASA .
[48] Saris W.E . and Satorra, A . (1993) : Power Evaluations in Structural EquationModels. In K .A. Bollen and J .S. Long (Eds.), Testing Structural EquationModels, London : Sage .
[49] SAS, Institue Inc . (1989) : SAS/STAT User's Guide, Version 6, Fourth Edition,Volume 1 . Cary, NC : SAS Institute Inc . .
[50] Scheepers P. and R. Eisinga (Eds .) (1991) : Onderdanig en intolerant.Nijmegen : ITS .
[51] Schneewind K . and Cattell R.B, (1970) : Zum Problem derFaktorindentification : Verteilungen and Vertranensintervalle vonKongruentzkoeffizienten . Psychologische Beiträge, 12 : 214-226 .
[52] Schuman H. and Presser S . (1981) : Questions and Answers in AttitudeSurveys: Experiments on Question Form, Wording and Context . New York :Academic Press .
[53] Sherwood J.J . (1966) : Authoritarianism and Moral Realism . Journal ofClinical Psychology, 22, 17-21 .
[54] Steiner J .M. and Fahrenberg, J . (1970) : Die Ausprägung autoritarerEinstellung bei ehemaligen Angehörigen der SS and der Wehrmacht . KolnerZeitschrift für Soziologie and Social Psychologie, 22, 551-566 .
[55] Stone W.F ., Lederer G . and Christie R. (Eds .) (1993) : Strenght andWeakness : The Authoritarian Personality Today, New York : Springer Verlag .
[56] Sudman S . and N. Bradburn (1974): Response Effects in Surveys: A Reviewand synthesis . Chicago : Aldine .
[57] Sudman S ., N.M. Bradburn, and N . Schwartz . (1996) : Thinking aboutAnswers. The Application of Cognitive Processes to Survey Methodology . SanFrancisco : Jossey-Bass .
1 4 8
Hans Waege
[58] Waege H . (1991) : The lifeworld of poor integrated, subservient, supremacistyoung people . Leuven: Departement Sociologie/Centrum voor Dataverzamelingen Analyse .
[59] Waege H . (1991): De Vlaamse jeugd en haar minderheden . Tijdschrift voorSociologie, 12, 181-208 .
[60] Waege H. (1993) : Schalen uit het attitude-onderzoek bij jongvolwassenen1992: aanzet tot kritische analyse . Leuven: Centrum voor Dataverzameling enAnalyse .
[61] Zwick W.R. and Velicer W .F . (1986) : Comparison of Five Rules forDetermining the Number of Components to Retain . Psychological Bulletin, 99,432-442 .
Appendix I
Authoritarianism scale(Between brackets the original number of Adorno et al ., 1950 : 255-257) . If ourwording slightly differs from the original wording of Adorno, Adorno's wording isquoted in italics after the form we used . There were 5 response categories :completely agree, agree, neither agree nor disagree, disagree or completely disagree .
1 . People can be devided into two different classes : the weak and the strong .(26)
2 . If people would talk less and work more, everybody would be better off . (37)3 . Most people dissapoint when you get to know them better (43) Familiarity
breeds contempt . -Slightly altered because the original formulation is nottranslatable in Dutch-
4 . Young people sometimes get rebellious ideas, but as they grow up they oughtto get over them and settle down . (21)
5 . Most of our social problems would be solved if we could somehow get rid ofthe immoral, crooked and freebleminded people . (34)
6 . It's better to support those authorities who maintain order and prevent chaos,even if they are not so democratically minded . (22) It is best to use someprewar authorities in Germany to keep order and prevent chaos . - Slightlyaltered because the item is dated-
7 . There is hardly anything lower than a person who does not feel a great love,grattitude and respect for his parents . (27)
8 . Nowadays when so many different kinds of people move around and mixtogether so much, a person has to protect himself especially carefully againstcatching an infection or disease from them . (18)
9. Sex crimes, such as rape and attacks on children, deserve more than mereimprisonment; such criminals ought to be publicly whipped, or worse . (25)

The Validity of Unidimensional Scales
149
10 .The true way of life is disappearing so fast that force may be necessary topreserve it . (30) The original scale : The true AMERICAN way of life
II .The businessman and the manufacturer are much more important to societythan the artist and the professor . (41)
Reversed items12 .Finally, most people do better than expected13 .Weak people too should get an opportunity for a decent life .14 .We should make an effort to give freebleminded people prospects is our
society .
Attitudes towards immigrants scaleThere were 5 response categories : completely agree, agree, neither agree nordisagree, disagree or completely disagree .
1 . Generally speaking, foreigners can't be trusted .2 . Most Moroccan and Turks living in our country are decent people3 . 1 would find it unpleasant to have foreign neighbours4 . Foreign labourers come here to exploit our social security system .5 . When you get to know the Turks better, most of them are friendly people .6 . Foreigners are a threat to our culture and habits .7 . If more than half of the students in my school were foreigners, I would go to
another school .8 . I would not mind to have a foreign neighbour .
Appendix II
PRELIS PROGRAM TO GENERATE 200 COVARIANCE MATRICES
generating 200 covariance matrices by bootstrappingDA NI=11RA=a :\bledad .ruwOU MA=CM RS=200 SF=25 BM=a :\bledad .tmb
LISREL® 8 PROGRAM TO GENERATE 200 LAMBDA (factorloadings)MATRICES
estim 200 LX MaticesDA NI=11 NO=111 RP=200CM=c :\bledad .tmbMO NX=11 NK=1FR LX(1,1) LX(2,1) LX(3,1) LX(4,1) LX(5,1) LX(6,1) LX(7,1) LX(8,1) LX(9,1)LX(10,1) LX(11,1)OU LX=c :\bledad .LAM

1 5 0
Hans Waege
Appendix III
LISRELS (SIMPLIS) PROGRAM FOR THE TEST OF INVARIANT FACTORSTRUCTURES FOR THE AUTHORITARIANISM SCALE, ALL FACTORLOADINGS CONSTRAINED EQUAL
WINDOWS L I S R E L® 8 .03BY
KARL G JORESKOG AND DAG SORBOM
This program is published exclusively byScientific Software International, Inc .
1525 East 53rd Street - Suite 906Chicago, Illinois 60615, U .S .A .
Voice : (800)247-6113, Voice & Fax : (312)684-4979Copyright by Scientific Software International, Inc ., 1981-93 .
Partial copyright by WATCOM Group Inc ., 1993 and Media Cybernetics Inc ., 1993 .Use of this program is subject to the terms specified in the
Universal Copyright Convention .
The following lines were read from file a :\bledcomt .li8 :
Group 1 : Testing Equality Of Factor StructuresModel A : Factor Loadings, Error Variances InvariantObserved variablesV66 V67 V68 V69 V70 V71 V72 V73 V74 V75 V76Covariance Matrix From file a :\bledadl .covSample Size = 103Latent Variables : AutorRelationshipsV67 V68 V69 V70 V71 V72 V73 V74 V75 V76 = AutorGroup 2 : Testing Equality Of Factor StructuresCovariance Matrix From File a :\bledad2 .covSample Size = 138Group 3 : Testing Equality Of Factor StructuresCovariance Matrix From File a :\bledad3 .covSample Size = 120Group 4 : Testing Equality Of Factor StructuresCovariance Matrix From File a :\bledad4 .covSample Size = 108End of Problem

The Validity of Unidimensional Scales
1 51
LISREL8 (SIMPLIS) PROGRAM FOR THE TEST OF INVARIANT FACTORSTRUCTURES FOR THE AUTHORITARIANISM SCALE, ALL FACTORLOADINGS FREE TO ESTIMATE WITHIN EACH GROUP
WINDOWS L I S R E L 8 .03
BY
KARL G JORESKOG AND DAG SORBOM
Group 1 : Testing Equality Of Factor StructuresModel A : Factor Loadings, Error Variances InvariantObserved variablesV66 V67 V68 V69 V70 V71 V72 V73 V74 V75 V76Covariance Matrix From file a :\bledadl .covSample Size = 103Latent Variables : AutorRelationships :V67 V68 V69 V70 V71 V72 V73 V74 V75 V76 = AutorGroup 2 : Testing Equality Of Factor StructuresCovariance Matrix From File a :\bledad2 .covSample Size = 138Relationships :V67 V68 V69 V70 V71 V72 V73 V74 V75 V76= AutorGroup 3 : Testing Equality Of Factor StructuresCovariance Matrix From File a :\bledad3 .covSample Size = 120Relationships :V67 V68 V69 V70 V71 V72 V73 V74 V75 V76 = AutorGroup 4 : Testing Equality Of Factor StructuresCovariance Matrix From File a :\bledad4 .covSample Size = 108Relationships :V67 V68 V69 V70 V71 V72 V73 V74 V75 V76 = AutorEnd of Problem