Regulation of Akt/PKB activity by P21-activated kinase in cardiomyocytes

Accepted Manuscript
Title: Ferroelectric relaxor behavior and dielectricspectroscopic study of 0.99(Bi0.5Na0.5TiO3)-0.01(SrNb2O6)solid solution
Authors: K.N. Singh, P.K. Bajpai
PII: S0925-8388(11)00005-3DOI: doi:10.1016/j.jallcom.2010.12.195Reference: JALCOM 23969
To appear in: Journal of Alloys and Compounds
Received date: 2-9-2010Revised date: 24-12-2010Accepted date: 29-12-2010
Please cite this article as: K.N. Singh, P.K. Bajpai, Ferroelectric relaxor behavior anddielectric spectroscopic study of 0.99(Bi0.5Na0.5TiO3)-0.01(SrNb2O6) solid solution,Journal of Alloys and Compounds (2010), doi:10.1016/j.jallcom.2010.12.195
This is a PDF file of an unedited manuscript that has been accepted for publication.As a service to our customers we are providing this early version of the manuscript.The manuscript will undergo copyediting, typesetting, and review of the resulting proofbefore it is published in its final form. Please note that during the production processerrors may be discovered which could affect the content, and all legal disclaimers thatapply to the journal pertain.

Page 1 of 22
Accep
ted
Man
uscr
ipt
-
Ferroelectric relaxor behavior and dielectric spectroscopic study of 0.99(Bi0.5Na0.5TiO3)-0.01(SrNb2O6) solid solution
K.N. Singh* and P.K. BajpaiAdvance Material Research LaboratoryDepartment of Pure & Applied Physics
Guru Ghasidas Vishwavidyalaya, Bilaspur 495 009, India
Abstract0.99(Bi0.5Na0.5TiO3)-0.01(SrNb2O6) was prepared by simple solid state reaction route.
Material stabilized in rhombohedral perovskite phase with lattice constants a=3.9060 A0,
=89.860 and ah=5.4852 A0 ch=6.7335 A0 for hexagonal unit cells. Density of material was
found 5.52 gm/cm3(92.9% of theoretical one) in the sample sintered at 9500C.The temperature
dependent dielectric constant exhibits a broad peak at 538K (εm = 2270) at 1 kHz, that shows
frequency dependent shifts toward higher temperature - typical relaxor behavior. Modified
Curie-Weiss law was used to fit the dielectric data that exhibits almost complete diffuse phase
transition characteristics. The dielectric relaxation obeys the Vogel–Fulcher relationship with the
freezing temperature 412.4K. Significant dielectric dispersion is observed in low frequency
regime in both components of dielectric response and a small dielectric relaxation peak is
observed. Cole-Cole plots indicate polydispersive nature of the dielectric relaxation; the
relaxation distribution increasing with temperature.
Keywords: X-ray diffraction; Ferroelectrics; Crystal structure; Dielectric response.
*Author for correspondence: Tel: 91-7752-260249; Fax: +917752260148 E-mail: [email protected] (K.N.Singh)

Page 2 of 22
Accep
ted
Man
uscr
ipt
1
1. IntroductionRelaxor ferroelectrics have drawn attention due to their applications in various
microelectronics devices. Most of relaxor materials such as Pb(Mg1/3Nb2/3)O3,
Pb(Sc1/3Nb2/3)O3 and their derived compounds [1, 2] are used as high capacitance
capacitor, hysteresis free actuators and high performance sensors. However, due to
volatility and toxicity of lead, attempts have been made to develop lead-free
compositions for environmental friendly applications. A number of lead free materials are
designed and characterized as ferroelectric relaxors. However, all the materials are either
complicated to synthesize or less promising in their physical properties than current Pb-
based systems. Therefore, need for developing better systems to enhance their physical
characteristics. Bismuth sodium titanate, Bi0.5Na0.5TiO3 (BNT), discovered by Smolensky
[3] is one of the important ferroelectrics with perovskite structure. But Bi ion is highly
volatile at high temperature above 11300C during sintering and making this material
difficult to pole due to its high conductivity [4]. Although, most investigations have been
concentrated on the modifications of BNT for applications such as piezoelectric and
pyroelectric devices, this material is considered to be good candidate for a high
temperature relaxor. Recently, some investigations have been done on the search for the
modifications in the BNT-based systems [5, 6]. To improve the piezoelectric properties, a
number of BNT-based solid solutions, such as BNT–Bi0.5K0.5TiO3 [3], (1−x−y)
Bi0.5Na0.5TiO3–xBi0.5K0.5TiO3–yBi0.5Li0.5TiO3 [8], BNT–NaNbO3 [9], BNT–BaTiO3–
Bi0.5Li0.5TiO3 [10], Bi0.5Na0.5TiO3– SrTiO3–Bi0.5Li0.5TiO3 [11] and BNT–Bi0.5K0.5TiO3–
BaTiO3 [12], Bi0.5Na0.5TiO3–Bi0.5Li0.5TiO3[13] have been developed and studied
intensively [14]. The Bi0.5Na0.5TiO3-based piezoelectric substituted by Ba2+ [15, 16] and
Page 3 of 22
Accep
ted
Man
uscr
ipt
2
the effect of Ba2+ in BNT ceramics on dielectric and conductivity properties have been
studied [17]. Piezoelectric and dielectric properties of (1−x)BNT–xBT (abbreviated as
BNBT) ceramics were improved by using additives as CeO2 [18], Ga2O3 [19], Y2O3 [20],
La2O3 [21], YMnO3[22], BaTiO3-doped (Bi0.5Na0.5)TiO3 [23]. However, the piezoelectric
properties of these ceramics are not enough for practical uses. In order to further enhance
the properties of BNT ceramics and meet the requirements for practical uses, it is
necessary to develop new BNT-based ceramics.
BNT based lead-free ceramic materials (1–x) Bi0.5Na0.5TiO3–xBaNb2O6, exhibited
relaxor characteristic different from classic relaxor ferroelectrics. Moreover, it can also
be found that the samples of BNT–BN having lower concentration of BN (x=0.002 and
0.006) shows completely different dielectric relaxor characteristic from higher
concentration of BN (x= 0.01 and 0.14) [24]. It motivated us to synthesize another non-
lead based perovskite in single phase with 1% doping level of SrNb2O6 (SN) in ferroelectric
phase of BNT ceramic with relatively low sintering temperature. In this paper we
investigate the ferroelectric relaxor behavior dielectric relaxation in 0.99 (Bi0.5Na0.5TiO3) –
0.01(SrNb2O6) abbreviated as BNT-SN by means of dielectric spectroscopy.
2. Experimental
A conventional ceramic fabrication technique was adopted to prepare 0.99
(Bi0.5Na0.5TiO3) – 0.01(SrNb2O6) ceramic. GR grade oxide and carbonate powders Bi2O3,
TiO2, Nb2O5, SrCO3 and Na2CO3 were used as starting materials. The stoichiometric
amounts of constituent’s powders were mixed in wet medium (acetone) for 5 hours. The
mixed powder were calcined at 900oC for 3 hours at the rate of 20C/m. Calcined powder
were structurally analyzed using X-ray diffraction data which were carried out using X-

Page 4 of 22
Accep
ted
Man
uscr
ipt
3
ray diffractometer (Rigaku, Miniflex) with Cu K Å. Fine calcined powder
were pressed into cylindrical pellets of 10 mm diameter and 1-2 mm thickness under an
isostatic pressure of 100 MPa. Polyvinyl alcohol (PVA) was used as a binder. The pellet
were sintered at 9500C for 3 hours and cooled down to room temperature using controlled
cooling rate 20C/m. To determine the dielectric properties, the sintered sample were
electroded with silver paste and heated at 5000C for 2 hour before measurements were
performed. The electrical measurements were performed at various temperatures, using a
computer controlled LCR HI-TESTER (HIOKI-3532-50) impedance analyzer.
3. Results and discussion
3.1. X-ray diffraction study
Fig. 1 shows the X-ray diffraction patterns of pure BNT and BNT–SN in the 2θ range
of 20–80°. All the reflection peaks of the X-ray profile were indexed and lattice
parameters were determined using a least-squares method with the help of a standard
computer programme (POWD) [25]. It can be seen from Fig. 1, the prepared system
shows rhombohedral perovskite phase. The lattice constants obtained for perovskite
phase of BNT-SN is a=3.9060 A0, =89.860 for rhombohedral and ah=5.4852 A0
ch=6.7335 A0 for hexagonal unit cells. The estimated lattice parameters are matched well
with earlier reports [26, 27] (JCPDF No-36-0340). From XRD analysis, it is evident that
SrNb2O6 diffused into BNT lattice and does not cause any observable phase change in the
structure. However, with the inclusion of Sr at A-site and Nb at B-site, expands the unit
cell. Density of material was found 5.52 gm/cm3(92.9% of theoretical one) in the sample
sintered at 9500C.

Page 5 of 22
Accep
ted
Man
uscr
ipt
4
3.2. Dielectric study
Pure BNT, shows two abnormal dielectric peaks which originate from phase
transition from ferroelectric to anti-ferroelectric (at Tf) and anti-ferroelectric to
paraelectric phase (at Tm) [26-28]. In BNT-SN system both peaks get merged may be due
to inclusion of Sr2+ at A-site and Nb5+ at B-site. The dielectric characterization of relaxors
has mainly focused on investigating the temperature dependence above Tm used for
characterizing the degree of dielectric relaxation [29-31]. The temperature dependence of
dielectric constants for BNT-SN at different frequencies is shown in Fig.2. The values of
dielectric constant (’) increase with increase in temperature and a peak evolves at 538K
(εm = 2250). Dielectric permittivity ε’ shows a broad maximum at ferro–paraelectric
phase transition temperature (Tc); the maximum value of ε’ (εmax) decreases with increase
in frequency. The dielectric response of lead free relaxor BNT-SN, which indicates
typical frequency dispersion (47 K), shift in dielectric maxima temperature (Tm) towards
higher temperature side with increase in frequency (shown in table 1.), matched well with
the earlier reports [32].
The diffused and frequency dispersive maximum in the temperature dependent relative
permittivity (’), indicates that the dielectric polarization has a relaxation type behavior and the
material is relaxor. The dielectric losses (tanδ %) at different frequencies are shown in the
inset of the Fig.2. The tangent loss of BNT-SN shows higher values at lower temperature.
It can be explained by well known macro-domain to micro-domain transition theory [33].
The dielectric loss in BNT-based ferroelectrics ceramics arises from the domain walls,
and with the increasing temperature, macro-domains shift to micro-domain and the
domain walls sharply increases, which leads to increase of dielectric loss at lower

Page 6 of 22
Accep
ted
Man
uscr
ipt
5
temperature. Further, increase in temperature micro-domains change to polar micro-
regions and domain-walls decreases and hence decrease in dielectric loss which leads to a
distinguished peak in dielectric loss–temperature curve corresponding to Tf.
Fig. 3 shows the inverse dielectric constant as a function of temperature performed at 1
kHz. A deviation from the Curie–Weiss law can be observed (Fig. 3). This deviation is a
typical behaviour of ferroelectric materials with diffuse phase transition. The parameter
Tm describes the degree of deviation from the Curie–Weiss law and is defined as Tm =
Tcw − Tm, where Tcw denotes the temperature where the dielectric permittivity starts to
deviate from the Curie–Weiss law and Tm is the temperature of the dielectric maximum
[34]. The obtained results are presented in table 2. In the temperature range between Tm
and Tcw, modified Curie law is used to explain the dielectric behaviour of complex
ferroelectrics with diffuse phase transition, described as [35].
(1)
where γ and C' are measured to be constants, the value of lies between 1 and 2 . The
parameter γ gives information on the phase transition character; γ =1 represents classical
ferroelectric phase transition where normal Curie-Weiss law is followed and γ =2 gives
the quadratic dependence which describes complete diffuse phase transition. Fig. 4 shows
the plot of log(1/ε – 1/ εm) as a function of log(T-Tm) at 1kHz. A linear relationship is
obvious from the plot. The value of γ estimated from the slope of the graph is 1.82,
indicating that the material has almost complete diffuse phase transition characteristics.
For a more detailed insight into the relaxation process in the relative dielectric
permittivity, a graph of 103/Tm was plotted as a function of log (ν), as shown in Fig. 5.

Page 7 of 22
Accep
ted
Man
uscr
ipt
6
The nonlinear nature indicates that the data cannot be fitted by the simple Debye
equation. In order to analyze the relaxation characteristics of BNT-SN ceramic, the
experimental curves were fitted using the Vogel– Fulcher equation [36, 37]:
where ν0 is the attempt frequency, Ea is the measure of average activation energy, kB is
the Boltzman constant and Tf is the freezing temperature. The fitting parameters are Tf =
412.4 K, Ea = 0.053eV and ν0 = 1.6x10¹³Hz. Another parameter Tm (relax) is used to
characterize the degree of relaxation behavior in the frequency range of 1 kHz to 100
kHz, described [38] as
Tm (relax) = Tm (100 kHz) - Tm (1 kHz) (3)
Tm (relax), obtained from the dielectric measurements (table 1) is approximately 47K.
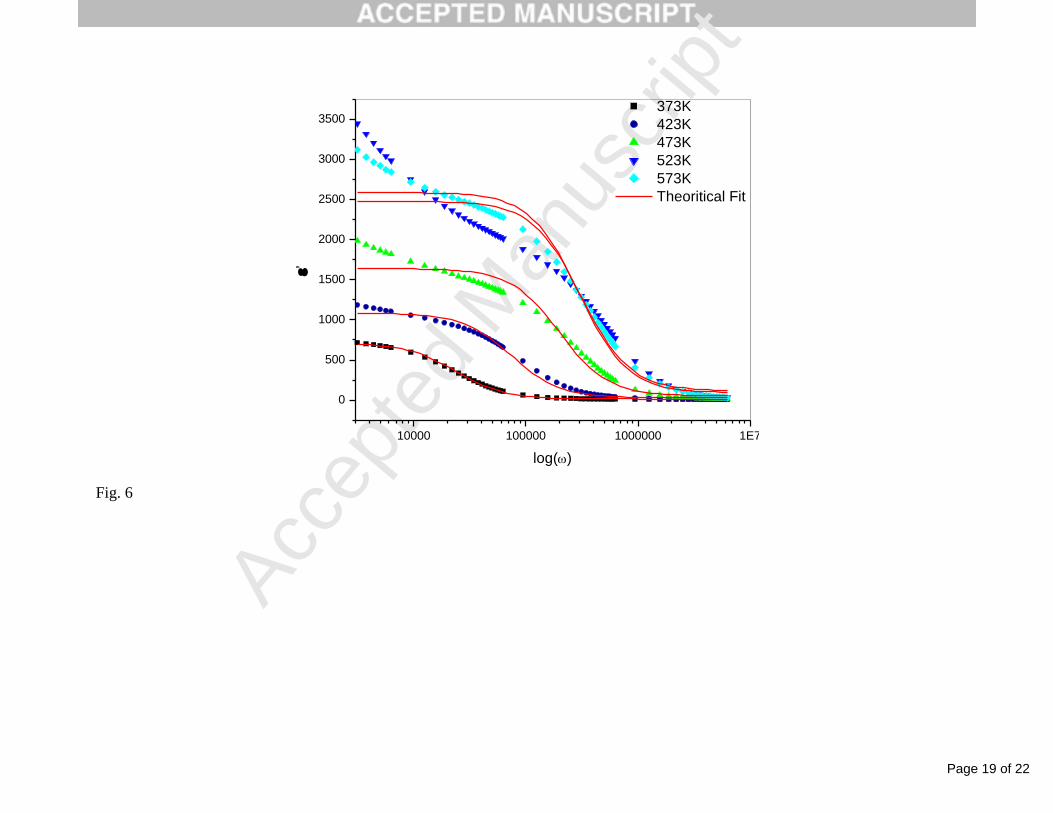
Frequency dependence of dielectric constant and corresponding loss are shown in Fig. 6
and 7 respectively. A general feature of the dielectric response is that dielectric constant
values decrease with increasing the frequency of excitation and the high frequency
dielectric behavior becomes temperature independent. Dielectric loss shows peak, which
varies with temperature. The value of (’) at lower frequencies in general, increases with
decreasing frequency and increasing temperature. This may be attributed to be free
charge buildup at the interface between the sample and the electrode (space charge
polarization).
For a given temperature, the magnitude of ’ decreases with increasing frequencies,
which is a typical characteristic of disordered materials [39, 40]. The Debye formula

Page 8 of 22
Accep
ted
Man
uscr
ipt
7
giving complex permittivity related to free dipole oscillating in an alternating field [41] is
given as:
Where s and ∞ are the low and high frequency value of ’(), =2, being the
measuring frequency, is the relaxation time. Theoretical fitting of dielectric data
(dielectric constant and dielectric loss) using Eq. 4 are shown in Fig. 6 and 7, for BNT-
SN, it is clear that the experimental behaviour follow the Debye equation. However, the
contribution for dielectric constant is overestimated by Debye equation especially at
lower frequencies and the experimentally observed loss peaks are more diffused than
those expected from single relaxation process of Debye. Deviation from the Debye
behaviour is a clear indication of system becoming more diffuse and disorder in the
material. Obviously, one expects the poly-dispersive nature of relaxation processes. In
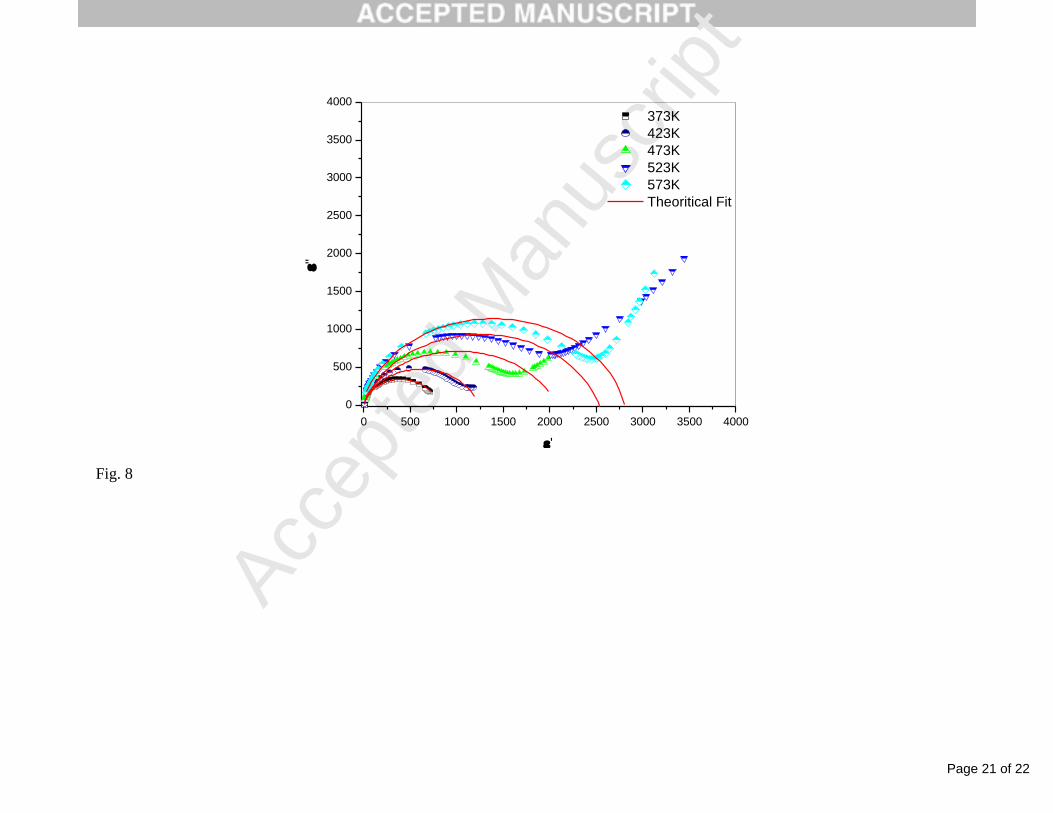
order to understand the diffusion processes operating the system, the Cole-Cole
formalism is adopted for analyzing the frequency dependence of dielectric response. The
Debye equation (4) is modified in order to introduce diffuseness parameter as [42]
where εs and ε∞ are the low and high frequency values of ε' , is a measure of the
distribution of relaxation times, -1. The parameter, can be determined from the

Page 9 of 22
Accep
ted
Man
uscr
ipt
8
location of the center of the Cole-Cole circles, of which only an arc lies above the ε' axis.
Such plots are shown in Fig. 8. It is evident from these plots that the relaxation process
differs from the Debye process (for which =0). The parameter, as determined from
the angle subtended by the radius of the circle with the real axis passing through the
origin of ε'–axis, shows a consistent increase in the interval (0.17 to 0.26 ) with
increasing temperature from 373K to 573K . This means that relaxation time distribution
decreases with decrease in temperature. Thus the Cole-Cole plots indicate the
polydispersive nature of the dielectric relaxation in BNT-SN. Static relative permittivity
s, optical relative permittivity ∞, global average relaxation time and tilt parameter
obtained from the Cole- Cole expression for BNT-SN are given in table 3.
4. Conclusions
0.99(Bi0.5Na0.5TiO3)-0.01(SrNb2O6) (BNT-SN) was prepared by simple solid state
reaction route. Material stabilized in rhombohedral perovskite phase with lattice
constants obtained for BNT- SN is a=3.9060, =89.86 and ah=5.4852 A0 ch=6.7335 A0
for hexagonal unit cells. The values of dielectric constant increase with increase in
temperature and a peak evolves at 538K (εm = 2270) at 1 kHz. Modified Curie law,
indicates that the material has almost complete diffuse phase transition characteristics
with γ=1.82. The reciprocal dielectric constant (1/′) at 1 kHz fitted to the Curie–Weiss
law and calculate the parameters Tm =538K, Tcw = 608K and the difference between two
temperatures, ∆Tm =Tcw - Tm, (70K) used as a characteristic diffuseness of phase
transition. Vogel–Fulcher law fitting parameters are found as pre-exponential factor ωο,
(1.6x10¹³Hz), activation energy Ea (0.053eV) and freezing temperature Tf (412.4K). The

Page 10 of 22
Accep
ted
Man
uscr
ipt
9
low frequency dielectric dispersion is observed in BNT-SN. Cole-Cole plots of dielectric
constant indicate polydispersive nature of the dielectric relaxation.
References[1] Y. Yamashita, Jpn J. Appl. Phys. 33 (1994) 4652.[2] F. Yuan, Z. Peng, and J-M Liu, Matter. Sci. Eng. B117 (2005) 265.[3] G. A. Smolenski, V.A. Isupov, and A.I. Aganovskaya, J. Sov. Phys. Solid State 2 (1961)
2651.[4] T. Takenaka, and H. Nagata, Journal of the European Ceramic Society 25 12 (2005)
2693.[5] C. R. Zhou, X. Y. Liu, W.Z. Li and C.L. Yuan, Solid State Communication 149 (2009)
481.[6] N. Jaitanong, W.C. Vittayakorn, A. Chaipanich, Ceramic International 36 (2010) 1479.[7] K. Yoshii, Y. Hiruma, H. Nagata, T. Takenaka, Jpn. J. Appl. Phys. 45 (2006)
4493.[8] Z. Yang, Y. Hou, H. Pan, Y. Chang, J. Alloys Compd. 480 (2009) 246.[9] Y.M. Li, W. Chen, J. Zhou, Q. Xu, H.J. Sun, R.X. Xu, Mater. Sci. Eng. B 112 (2004)
5.[10] D. Lin, D. Xiao, J. Zhu, P. Yu, J. Eur. Ceram. Soc. 26 (2006) 3247.[11] D. Lin, K.W. Kwok, H.L.W. Chan, J. Alloys Compd. 481 (2009) 310.[12] J. Shieh, K.C. Wu, C.S. Chen, Acta Mater. 55 (2007) 3081.[13] Dunmin Lin, Chenggang Xu, Qiaoji Zheng, Yujun Wei, Daojiang Gao, J Mater Sci.
Mater Electron 20 (2009) 393.[14] C. Xu, D. Lin, K.W. Kwok, Solid State Sci. 10 (2008) 934.[15] L.W. David, A.P. David, J. Am. Ceram. Soc. 86 (2003) 769.[16] J. Richard, G. Pettry, S. Said, P. Marchet, J.P. Mercurio, J. Eur. Ceram. Soc. 24
(2004) 1165.[17] Konapala Sambasiva Rao, Kuan China Varada Rajulu, Bollepalli Tilak, Anem Swathi,
Nature Science 2 4 (2010) 357 [18] J. Shi, W. Yang, J. Alloys Compd. 472 (2009) 267.[19] M.V.M. Rao, C.-F. Kao, Phys. B 403 (2008) 3596.[20] C. Zhou, X. Liu, W. Li, C. Yuan, Mater. Res. Bull. 44 (2009) 724.[21] P. Fu, Z. Xu, R. Chu, W. Li, G. Zang, J. Hao, Mater. Design 31 (2010) 796.[22] Changrong Zhou, Xinyu Liu, Weizhou Li, Changlai Yuan J Mater Sci. Mater Electron
21 (2010) 364.
[23] Marin Cernea, Ecaterina Andronescu, Roxana Radu, Fabio Fochi, Carmen Galassi, Journal of Alloys and Compounds 490 (2010) 690

Page 11 of 22
Accep
ted
Man
uscr
ipt
10
[24] Chang-Rong Zhou and Xin-Yu Liu, Bull. Mater. Sci. 30 (2007) 575.[25] E. Wu, “POWD”, An Interactive Powder Diffraction Data Interpretation and Indexing
Programme, Ver. 2.1, School of Physical Sciences, Flinders University of South Australia, Bedford Park, S.A.,5042,Australia.
[26] Chune Peng, Jing-Feng LiT, Wen Gong, Materials Letters 59 (2005) 1576.[27] Ampika Rachakom, Sukanda Jiansirisomboon, Anucha Watcharapasorn, Journal of
Microscopy Society of Thailand 23 (2009) 107.[28] Liu. Yunfei, L.V. Yinong, Xu. Ming, S.H.I Shuzhe, Xu. Hanqiao, Yang Xiaodong,
Journal of Wuhan University of Technology-Mater. Sci. Ed. June 2007.[29] Q .Yangfang, S. Dan and S. Jianjing Mater. Sci. Eng. B121 (2005) 148.[30] Y. M. Li, W.Chen and J.Zhou Mater. Sci. Eng. B112 (2004) 5.[31] S. Said and J. Mercurio J. Eur. Ceram. Soc. 21 (2001) 1333.[32] I. Rivera, Ashok Kumar, N. Ortega, R.S. Katiyar, Sergey Lushnikov Solid State
Communications 149 (2009) 172.[33] X. Yao, Z. L. Chen and L. E. Cross, J. Appl. Phys. 54 (1983) 3394.[34] X.G. Tang, X. X. Wang, K-H Chew and H. L. W. Chan, Solid State Commun. 136
(2005) 89.[35] G. Fulcher, J. Am. Ceram. Soc. 8 (1925) 339[36] Y. Guo, K. Kakimoto and H. Ohsato J. Phys. Chem. Solids 65 (2004) 1831[37] S. K. Rout, T. Badapanda, E. Sinha, S. Panigrahi, P. K. Barhai and T. P. Sinha Appl.
Phys. A 91 (2008) 101[38] C. Ang, Z. Jing, and Z. Yu, J. Phys. Cond. Matter 14 (2002) 8901.[39] Mukul Pastor, P.K. Bajpai, R.N.P. Chowdhury, Physics B 391 (2007) 1[40] Mukul Pastor, P.K. Bajpai, R.N.P. Chaudhury, Bull. Mat.Sc. 28 (2005) 199.[41] A. Chelkowski, Dielectric Physics, In “ Studies in Physical and Theoretical Chemistry”
Vol. 9, Elsevier Scientific Pub. Co. Amsterdam (1980) pp. 119[42] K.S. Cole, R.H. Cole, J. Chem. Phys. 9 (1941) 341.

Page 12 of 22
Accep
ted
Man
uscr
ipt
Relaxor ferroelectrics have drawn attention due to their applications in various microelectronics
devices. Most of relaxor materials are used as high capacitance capacitor, hysteresis free
actuators and high performance sensors are lead based perovskite relaxors such as
Pb(Mg1/3Nb2/3)O3, Pb(Sc1/3Nb2/3)O3 and their derived compounds. However, due to volatility and
toxicity of lead, attempts have been made to develop lead-free compositions for environmental
friendly applications. BNT based lead-free ceramic materials (1–x) Bi0.5Na0.5TiO3–xBaNb2O6
[4], exhibited relaxor characteristic different from classic relaxor ferroelectrics. It motivated us to
synthesize another non-lead based perovskite in single phase and in this paper we investigate the
ferroelectric relaxor behavior electrical relaxation in 0.99 (Bi0.5Na0.5TiO3) – 0.01(SrNb2O6)
abbreviated as BNT-SN by means of dielectric spectroscopy.
*Research Highlights

Page 13 of 22
Accep
ted
Man
uscr
ipt
Table: 1 Curie temperature Tc and dielectric constant values at different frequencies in
BNT-SN.
Frequency(KHz) Tc(K) ε′m
1 538 2270
5 548 1780
10 556 1620
50 565 997
100 585 684
Table: 2 Characteristic parameters determined and calculated from temperature
dependence dielectric constant ε′(T) measurements.
Frequency(KHz) Tm(K) Θ(K) Tcw(K) ∆Tm=Tcw-Tm
1 538 580 608 70
Table: 3 Static relative permittivity s ∞, global average
relaxation time and tilt parameter obtained from the Cole- Cole expression for
BNT-SN.
Temperature(K) εs ε∞ τ α
373 705.29 12.70 1.0x10⁻⁶
0.17
423 1081.48 28.08 3.2x10⁻⁶
0.20
473 1637.40 52.66 5.3x10⁻⁶
0.23
523 2477.82 89.71 6.2x10⁻⁶
0.24
573 2585.25 91.6291 9.3x10⁻⁶
0.26
Table(s)

Page 14 of 22
Accep
ted
Man
uscr
ipt
Fig. 1
Figure(s)

Page 15 of 22
Accep
ted
Man
uscr
ipt
300 350 400 450 500 550 600 650
0
500
1000
1500
2000
2500
3000
3500
300 350 400 450 500 550 600 6500
1
2
3
4 1kHz
5kHz
10kHz
50kHz
100kHz
tan
()%
Temperature(K)
BNT-SN (x=0.01)
1kHz
5kHz
10kHz
50kHz
100kHz
Die
lectr
ic C
onsta
nt('
)
Temperature(K)
Fig. 2

Page 16 of 22
Accep
ted
Man
uscr
ipt
500 525 550 575 600 625
4.5x10⁻¹
5.0x10⁻¹
5.5x10⁻¹
6.0x10⁻¹
6.5x10⁻¹
TCW
= 608K
Tm = 538K
= 580K
Tm
TCW
1/
'x1
0-3
Temperature (K)
Data
Fit
Fig. 3

Page 17 of 22
Accep
ted
Man
uscr
ipt
1.0 1.2 1.4 1.6
-5.2
-4.8
-4.4
-4.00.99(BNT)-0.01(SN)
=1.82
log(1
/-1
/m)
log(T-Tm)
Fig. 4

Page 18 of 22
Accep
ted
Man
uscr
ipt
1.68 1.72 1.76 1.80 1.84
3.0
3.5
4.0
4.5
5.0
o = 1.6x10
13 Hz
Ea = 0.053 eV
Tf = 412.4 K
log
()
103/(T
mK)
Data
Fit
Fig. 5
Page 19 of 22
Accep
ted
Man
uscr
ipt
10000 100000 1000000 1E7
0
500
1000
1500
2000
2500
3000
3500
'
log()
373K
423K
473K
523K
573K
Theoritical Fit
Fig. 6

Page 20 of 22
Accep
ted
Man
uscr
ipt
10000 100000 1000000 1E7
0
100
200
300
400
500
600
700
"
log()
348K
373K
423K
473K
523K
573K
Theoritical fit
Fig. 7
Page 21 of 22
Accep
ted
Man
uscr
ipt
0 500 1000 1500 2000 2500 3000 3500 4000
0
500
1000
1500
2000
2500
3000
3500
4000
"
'
373K
423K
473K
523K
573K
Theoritical Fit
Fig. 8
Page 22 of 22
Accep
ted
Man
uscr
ipt
Figures Captions
Fig. 1 XRD profile of calcined powder of BNT pure and BNT-SN at room
temperature.
Fig. 2 Temperature dependence of dielectric constant of BNT-SN. Inset shows
temperature dependence of tangent loss.
Fig. 3 Temperature dependence of the reciprocal dielectric constant (1/′) for
BNT-SN fitted with Curie–Weiss law at 1 kHz.
Fig. 4 log (1/ε -1/εm) as function of log(T-Tm) for BNT-SN at 1 kHz.
Fig. 5 log(ω) versus l/Tm plot. The solid line represents the fitting to Vogel–
Fulcher relationship.
Fig. 6 Theoretical curve fit of frequency dependence of ’ for BNT-SN at
various temperatures using Debye formalism. Solid curves are theoretical
fits.
Fig. 7 Theoretical curves fit of frequency dependence of tan for BNT-SN at
various temperatures using Debye formalism. Solid curves are theoretical
fits.
Fig. 8 Cole-Cole plots between ′ and " for BNT-SN at some representative
temperatures. Solid curves are theoretical fits.
Figure(s)
Copyright © 2022 FDOKUMEN