Petrophysical Properties of Indian Kimberlites, Lamproites and Lamprophyres
Global and Planetary Change 113 (2014) 91–109
Contents lists available at ScienceDirect
Global and Planetary Change
j ourna l homepage: www.e lsev ie r .com/ locate /g lop lacha
Combined palaeomagnetic secular variation and petrophysical records totime-constrain geological and hazardous events: An example from theeastern Tyrrhenian Sea over the last 120 ka
Marina Iorio a,⁎, Joseph Liddicoat b, Francesca Budillon a, Alberto Incoronato c, Robert S. Coe d,Donatella D. Insinga a, William S. Cassata f, Carmine Lubritto e, Antimo Angelino a, Stella Tamburrino a
a Istituto per l'Ambiente Marino Costiero, Consiglio Nazionale delle Ricerche, Calata Porta di Massa, Porto di Napoli, 80133 Napoli, Italyb Department of Environmental Science, Barnard College, Columbia University, NY 10027, USAc Dipartimento di Scienze della Terra, Università degli Studi di Napoli Federico II, Largo San Marcellino 10, 80138 Napoli, Italyd Earth Science Department, University of California, Santa Cruz, CA 95064, USAe Dipartimento di Scienze e Tecnologie Ambientali, Biologiche e Farmaceutiche, Seconda Università degli Studi di Napoli, Via Vivaldi 43, 81100 Caserta, Italyf Lawrence Livermore National Laboratory, 7000 East Avenue, Livermore, CA 94550, USA
⁎ Corresponding author. Istituto per l‘Ambiente MarNazionale delle Ricerche (CNR), Calata Porta di Massa – PItaly. Tel.: +39 081 5423845; fax: +39 081 5423888.
E-mail address: [email protected] (M. Iorio).
0921-8181/$ – see front matter © 2013 Elsevier B.V. All rihttp://dx.doi.org/10.1016/j.gloplacha.2013.11.005
a b s t r a c t
a r t i c l e i n f oArticle history:Received 3 December 2012Received in revised form 10 October 2013Accepted 7 November 2013Available online 14 November 2013
Keywords:palaeomagnetismtephrochronologyTyrrhenian SeaPleistoceneHolocene
Long-term change of Earth's magnetic field (palaeomagnetic secular variation, PSV) during much of the lastapproximately 120 ka was recorded in cored sediment from the slope margin of the eastern Tyrrhenian Sea.The PSV record has been correlated to master curves of global palaeomagnetic field intensity and PSV recordsforwestern Europe. Tephrochronology and radiometric dating (14C and 40Ar/39Ar) have also been used to constrainthe age of the PSV record. The combination of the newdatawith prior PSV andpetrophysical data from the area pro-vides a chronological framework for geological events such as large-scale submarine slumps, stratigraphic gaps andshort-term changes in deposition rate on the continental margin. These latter changes are linked to the combinedaction of relative sea-level oscillations, climate events, and consequent variations in land exposure through time.Moreover, new data concerning the thickness and dispersal of Campanian Plain pyroclastic deposits in the marinesetting enable volcanic-hazard evaluation. Finally, a pyroclastic deposit (tephra X-6) found offshore in the SouthernCampanian marine environment was 40Ar/39Ar dated for the first time at 108.9 ± 1.8 ka BP.
© 2013 Elsevier B.V. All rights reserved.
1. Introduction
Continuous palaeosecular variation (PSV) records, in addition totheir value for geomagnetism, have stratigraphic potential in the Earthsciences because they can provide a means of high-resolution correla-tion and dating for sedimentary and volcanic sequences. In particular,recognition that precisely dated, detailed palaeointensity records havecoherency on a global scale has led to the notion that geomagneticrelative palaeointensity can be used to constrain the chronology of a sed-imentary sequence. This concept is often referred to as palaeointensity-assisted chronology (PAC) (e.g. Roberts et al., 2013 and referencestherein). The advantage of using palaeointensity for higher resolutiondating is that dipolar geomagnetic variations are globally synchronous,although it is difficult to test for isochrony at better than millennialscale (e.g. Channell et al., 2000; Laj et al., 2000; Stoner et al., 2002; Lajet al., 2004; Channell et al., 2009). Sediments, in particular, offer the
ino Costiero (IAMC), Consiglioorto di Napoli, 80133 Napoli –
ghts reserved.
possibility to construct high-resolution PSV records if: sedimentation iscontinuous and the sedimentation rate is particularly high (e.g. Lisé-Provonost et al., 2009; Barletta et al., 2010), there is good chronologicalcontrol, the age of the primary magnetization is unequivocallyestablished, and the sediment is unaffected by significant diageneticchanges in the primary magnetic mineralogy (e.g. Leslie et al.,1990a,b; Verosub, 2000). However, sedimentary effects associatedwith depositional and post-depositional remanent magnetization(DRM and pDRM) acquisition may alter the fidelity with which sed-iments are capable of recording past geomagnetic variations. DRMis often argued to be affected by inclination shallowing due to sedimenta-ry processes (King, 1955; Verosub, 1977; Blow and Hamilton, 1978;Anson and Kodama, 1987) and pDRM is affected by realignment of mag-netic particles during compaction, which introduces a time lag betweenthe time of sedimentation and the age of the recorded remanence,known as the lock-in time, which depends on the sedimentaryenvironment (Verosub, 1977; Hyodo, 1984; Bleil and von Dobeneck,1999; Roberts and Winklhofer, 2004; Sagnotti et al., 2005; Suganumaet al., 2011). Integration of coeval PSV records frommultiple sedimentaryor volcanic sequences in the same region has led to the definition ofregional PSV master curves (e.g. Turner and Thompson, 1981, 1982;
92 M. Iorio et al. / Global and Planetary Change 113 (2014) 91–109
Thouveny, 1987; Creer, 1989; Thouveny et al., 1990; Hagstrum andChampion, 2002; St-Onge et al., 2003; Vigliotti, 2006; Snowball et al.,2007).
Similarly, petrophysical analyses from multi-sensor core logger(MSCL) instruments are commonly used as stratigraphic tools forhigh-resolution correlations over wide marine areas and provide infor-mation on sediment provenance, regional stratigraphy, palaeoclimate,and tephrostratigraphy (e.g. Robinson et al., 1995; Moros et al., 1997;Ortiz and Rack, 1999; Giosan et al., 2002; Helmke et al., 2002; Iorioet al., 2004a; Miao et al., 2007). Palaeomagnetic investigations thathelp to date catastrophic and climatically driven processes in the Med-iterranean region include PSV analyses from the Tyrrhenian Sea (Iorioet al., 2004b, 2009, 2011; Sagnotti et al., 2011). These studies providedetailed PSV and petrophysical records from overlapping gravity coresin different marine provinces that have been dated using tephra layersand radiometric methods.
In this paper, we present an integrated study of seismic and multi-proxy data for a gravity core (C1202) from the eastern TyrrhenianSea. The sedimentary sequence recovered is characterized by stablepalaeomagnetic properties and provides a stratigraphic record thatallows reconstruction of local PSV for much of the past 120 ka, both interms of field directions and relative palaeointensity (RPI) features.We have established a high-resolution age model for the sequencewhich we use to compile a chronological framework to understandthe regional geology, the combined effect of sea-level oscillations andpalaeomorphology on continental slope sedimentation, and to contributeto regional risk assessment regarding tephra distribution and the ages ofsubmarine slides.
2. Regional setting
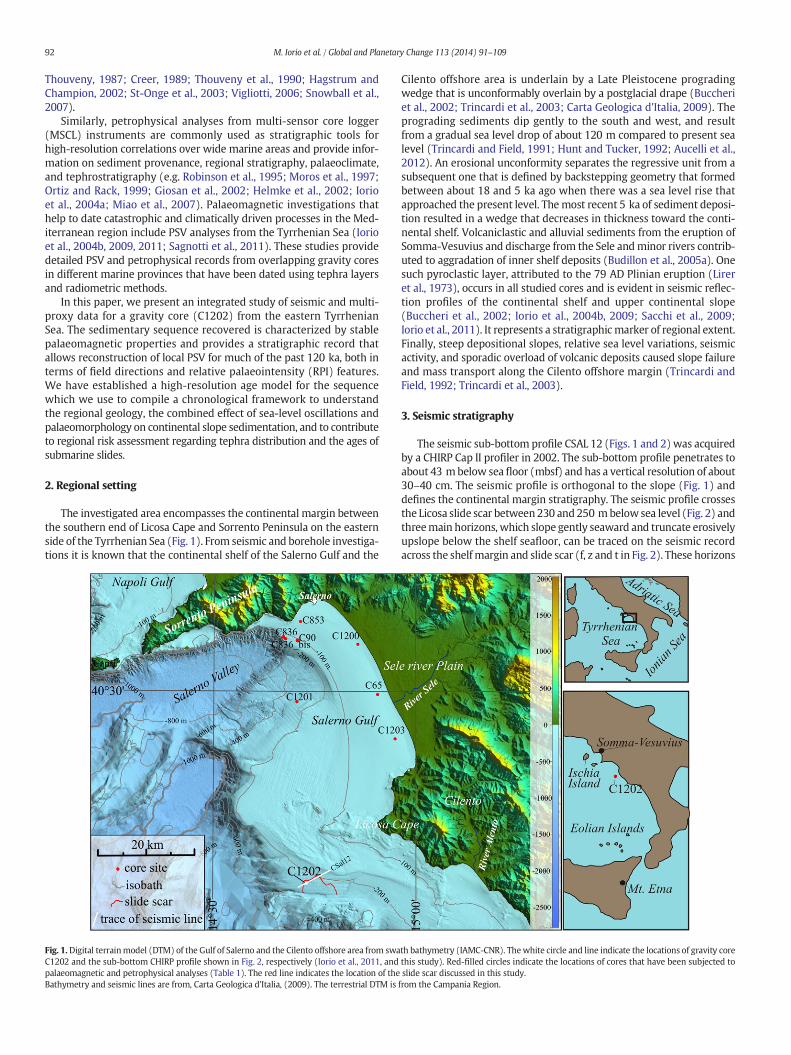
The investigated area encompasses the continental margin betweenthe southern end of Licosa Cape and Sorrento Peninsula on the easternside of the Tyrrhenian Sea (Fig. 1). From seismic and borehole investiga-tions it is known that the continental shelf of the Salerno Gulf and the
Fig. 1.Digital terrainmodel (DTM) of the Gulf of Salerno and the Cilento offshore area from swaC1202 and the sub-bottom CHIRP profile shown in Fig. 2, respectively (Iorio et al., 2011, andpalaeomagnetic and petrophysical analyses (Table 1). The red line indicates the location of theBathymetry and seismic lines are from, Carta Geologica d'Italia, (2009). The terrestrial DTM is
Cilento offshore area is underlain by a Late Pleistocene progradingwedge that is unconformably overlain by a postglacial drape (Buccheriet al., 2002; Trincardi et al., 2003; Carta Geologica d'Italia, 2009). Theprograding sediments dip gently to the south and west, and resultfrom a gradual sea level drop of about 120 m compared to present sealevel (Trincardi and Field, 1991; Hunt and Tucker, 1992; Aucelli et al.,2012). An erosional unconformity separates the regressive unit from asubsequent one that is defined by backstepping geometry that formedbetween about 18 and 5 ka ago when there was a sea level rise thatapproached the present level. Themost recent 5 ka of sediment deposi-tion resulted in a wedge that decreases in thickness toward the conti-nental shelf. Volcaniclastic and alluvial sediments from the eruption ofSomma-Vesuvius and discharge from the Sele andminor rivers contrib-uted to aggradation of inner shelf deposits (Budillon et al., 2005a). Onesuch pyroclastic layer, attributed to the 79 AD Plinian eruption (Lireret al., 1973), occurs in all studied cores and is evident in seismic reflec-tion profiles of the continental shelf and upper continental slope(Buccheri et al., 2002; Iorio et al., 2004b, 2009; Sacchi et al., 2009;Iorio et al., 2011). It represents a stratigraphicmarker of regional extent.Finally, steep depositional slopes, relative sea level variations, seismicactivity, and sporadic overload of volcanic deposits caused slope failureand mass transport along the Cilento offshore margin (Trincardi andField, 1992; Trincardi et al., 2003).
3. Seismic stratigraphy
The seismic sub-bottom profile CSAL 12 (Figs. 1 and 2) was acquiredby a CHIRP Cap II profiler in 2002. The sub-bottom profile penetrates toabout 43 mbelow sea floor (mbsf) and has a vertical resolution of about30–40 cm. The seismic profile is orthogonal to the slope (Fig. 1) anddefines the continental margin stratigraphy. The seismic profile crossesthe Licosa slide scar between230 and 250 mbelow sea level (Fig. 2) andthreemain horizons, which slope gently seaward and truncate erosivelyupslope below the shelf seafloor, can be traced on the seismic recordacross the shelfmargin and slide scar (f, z and t in Fig. 2). These horizons
th bathymetry (IAMC-CNR). Thewhite circle and line indicate the locations of gravity corethis study). Red-filled circles indicate the locations of cores that have been subjected toslide scar discussed in this study.from the Campania Region.
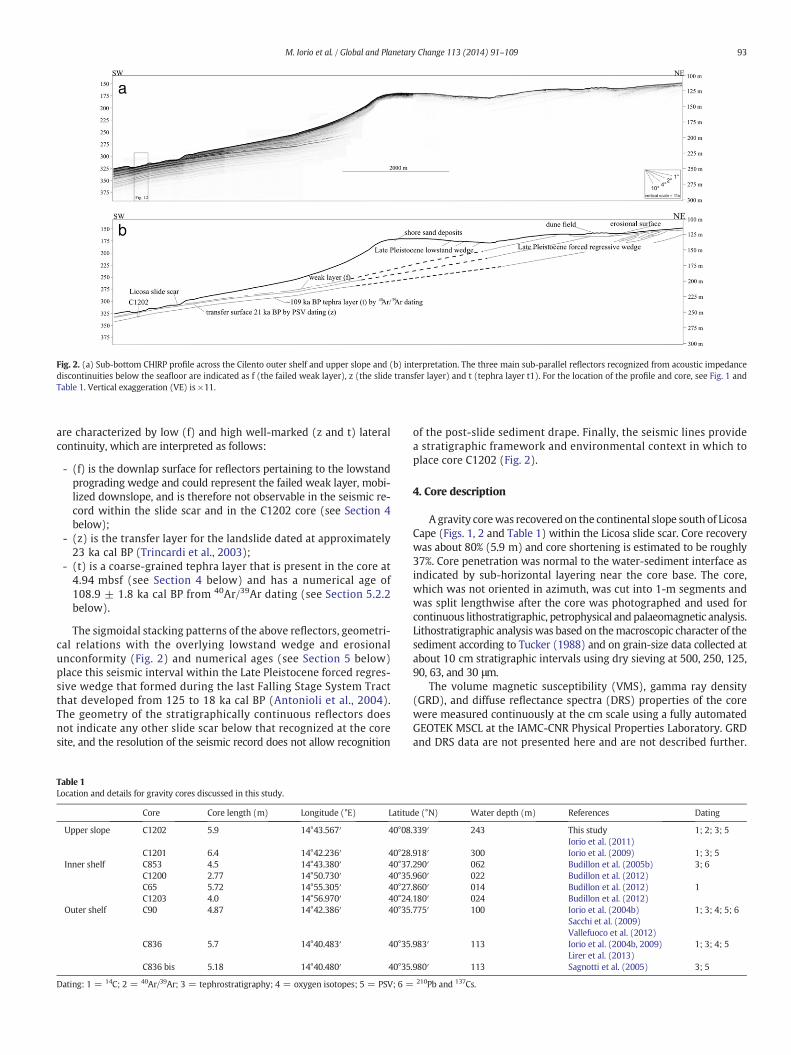
Fig. 2. (a) Sub-bottom CHIRP profile across the Cilento outer shelf and upper slope and (b) interpretation. The three main sub-parallel reflectors recognized from acoustic impedancediscontinuities below the seafloor are indicated as f (the failed weak layer), z (the slide transfer layer) and t (tephra layer t1). For the location of the profile and core, see Fig. 1 andTable 1. Vertical exaggeration (VE) is ×11.
93M. Iorio et al. / Global and Planetary Change 113 (2014) 91–109
are characterized by low (f) and high well-marked (z and t) lateralcontinuity, which are interpreted as follows:
- (f) is the downlap surface for reflectors pertaining to the lowstandprograding wedge and could represent the failed weak layer, mobi-lized downslope, and is therefore not observable in the seismic re-cord within the slide scar and in the C1202 core (see Section 4below);
- (z) is the transfer layer for the landslide dated at approximately23 ka cal BP (Trincardi et al., 2003);
- (t) is a coarse-grained tephra layer that is present in the core at4.94 mbsf (see Section 4 below) and has a numerical age of108.9 ± 1.8 ka cal BP from 40Ar/39Ar dating (see Section 5.2.2below).
The sigmoidal stacking patterns of the above reflectors, geometri-cal relations with the overlying lowstand wedge and erosionalunconformity (Fig. 2) and numerical ages (see Section 5 below)place this seismic interval within the Late Pleistocene forced regres-sive wedge that formed during the last Falling Stage System Tractthat developed from 125 to 18 ka cal BP (Antonioli et al., 2004).The geometry of the stratigraphically continuous reflectors doesnot indicate any other slide scar below that recognized at the coresite, and the resolution of the seismic record does not allow recognition
Table 1Location and details for gravity cores discussed in this study.
Core Core length (m) Longitude (°E) Latitu
Upper slope C1202 5.9 14°43.567′ 40°08
C1201 6.4 14°42.236′ 40°28Inner shelf C853 4.5 14°43.380′ 40°37
C1200 2.77 14°50.730′ 40°35C65 5.72 14°55.305′ 40°27C1203 4.0 14°56.970′ 40°24
Outer shelf C90 4.87 14°42.386′ 40°35
C836 5.7 14°40.483′ 40°35
C836 bis 5.18 14°40.480′ 40°35
Dating: 1 = 14C; 2 = 40Ar/39Ar; 3 = tephrostratigraphy; 4 = oxygen isotopes; 5 = PSV; 6 =
of the post-slide sediment drape. Finally, the seismic lines providea stratigraphic framework and environmental context in which toplace core C1202 (Fig. 2).
4. Core description
A gravity corewas recovered on the continental slope south of LicosaCape (Figs. 1, 2 and Table 1) within the Licosa slide scar. Core recoverywas about 80% (5.9 m) and core shortening is estimated to be roughly37%. Core penetration was normal to the water-sediment interface asindicated by sub-horizontal layering near the core base. The core,which was not oriented in azimuth, was cut into 1-m segments andwas split lengthwise after the core was photographed and used forcontinuous lithostratigraphic, petrophysical and palaeomagnetic analysis.Lithostratigraphic analysis was based on themacroscopic character of thesediment according to Tucker (1988) and on grain-size data collected atabout 10 cm stratigraphic intervals using dry sieving at 500, 250, 125,90, 63, and 30 μm.
The volume magnetic susceptibility (VMS), gamma ray density(GRD), and diffuse reflectance spectra (DRS) properties of the corewere measured continuously at the cm scale using a fully automatedGEOTEK MSCL at the IAMC-CNR Physical Properties Laboratory. GRDand DRS data are not presented here and are not described further.
de (°N) Water depth (m) References Dating
.339′ 243 This studyIorio et al. (2011)
1; 2; 3; 5
.918′ 300 Iorio et al. (2009) 1; 3; 5
.290′ 062 Budillon et al. (2005b) 3; 6
.960′ 022 Budillon et al. (2012)
.860′ 014 Budillon et al. (2012) 1
.180′ 024 Budillon et al. (2012)
.775′ 100 Iorio et al. (2004b)Sacchi et al. (2009)Vallefuoco et al. (2012)
1; 3; 4; 5; 6
.983′ 113 Iorio et al. (2004b, 2009)Lirer et al. (2013)
1; 3; 4; 5
.980′ 113 Sagnotti et al. (2005) 3; 5
210Pb and 137Cs.
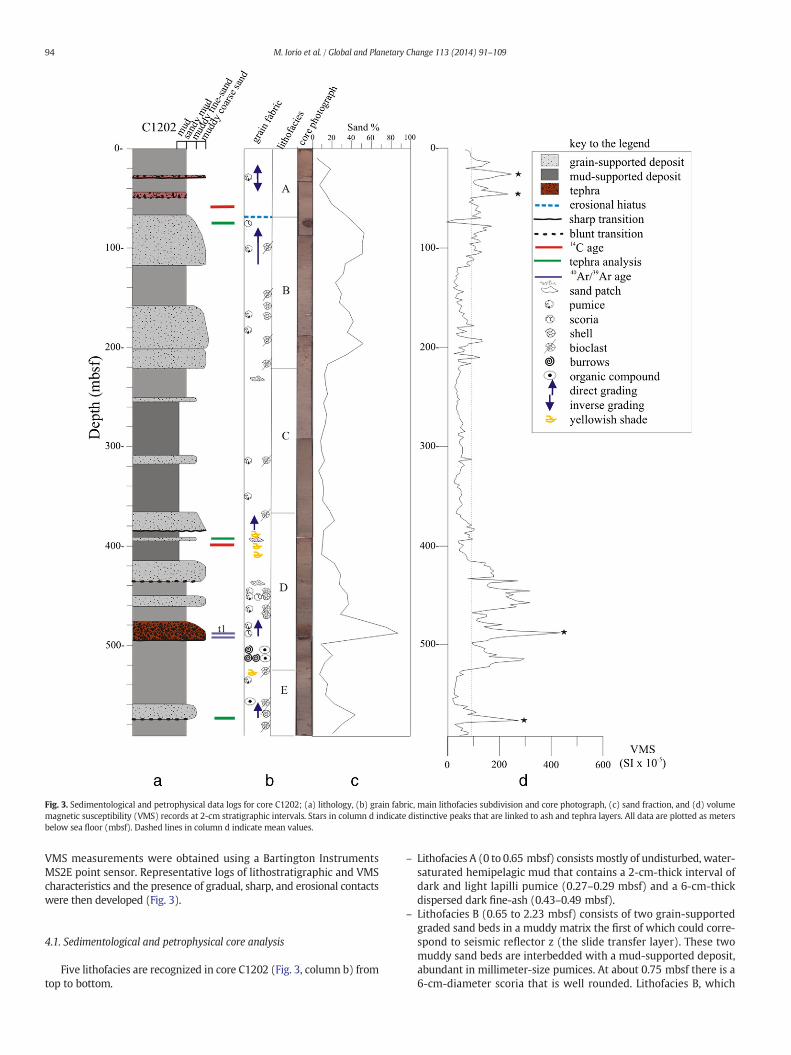
Fig. 3. Sedimentological and petrophysical data logs for core C1202; (a) lithology, (b) grain fabric, main lithofacies subdivision and core photograph, (c) sand fraction, and (d) volumemagnetic susceptibility (VMS) records at 2-cm stratigraphic intervals. Stars in column d indicate distinctive peaks that are linked to ash and tephra layers. All data are plotted as metersbelow sea floor (mbsf). Dashed lines in column d indicate mean values.
94 M. Iorio et al. / Global and Planetary Change 113 (2014) 91–109
VMS measurements were obtained using a Bartington InstrumentsMS2E point sensor. Representative logs of lithostratigraphic and VMScharacteristics and the presence of gradual, sharp, and erosional contactswere then developed (Fig. 3).
4.1. Sedimentological and petrophysical core analysis
Five lithofacies are recognized in core C1202 (Fig. 3, column b) fromtop to bottom.
– Lithofacies A (0 to 0.65 mbsf) consists mostly of undisturbed, water-saturated hemipelagic mud that contains a 2-cm-thick interval ofdark and light lapilli pumice (0.27–0.29 mbsf) and a 6-cm-thickdispersed dark fine-ash (0.43–0.49 mbsf).
– Lithofacies B (0.65 to 2.23 mbsf) consists of two grain-supportedgraded sand beds in a muddy matrix the first of which could corre-spond to seismic reflector z (the slide transfer layer). These twomuddy sand beds are interbedded with a mud-supported deposit,abundant in millimeter-size pumices. At about 0.75 mbsf there is a6-cm-diameter scoria that is well rounded. Lithofacies B, which
95M. Iorio et al. / Global and Planetary Change 113 (2014) 91–109
consists mainly of coarse-grained shells and bioclastic fragments, islikely to have been deposited during a relative sea level lowstand.
– Lithofacies C (2.23 to 3.68 mbsf) is characterized by a homogeneousfine-grained mud with variable color and includes two thin sandbeds at 2.53 and 3.10 mbsf. This lithofacies is interpreted to havebeen deposited in low-energy environments typical of a deeper(with respect to Lithofacies B) marine setting.
– Lithofacies D (from 3.68 to 5.22 mbsf) includes several decimeter-thick, poorly sorted fine sand deposits in a muddy matrix withpatches of dark-colored sand alternating with mud-supportedbeds. It is locally yellowish (from 3.85 to 4.16 mbsf) and contains alarge amount of dispersed lapilli pumice. A distinct 18-cm-thicktephra, here labeled t1, occurs at 4.76–4.94 mbsf. It consists of acoarse- to a medium-grained pumice lapilli overlying a basal2 mm-thick ash layer. Pumices have elongated and sub-roundedmorphologies and both types are vesiculated and porphyric (K-feldspar). Diffuse platy glass shards, a few scoriae, and severalleucite-bearing lithics are present. Tephra layer t1 is responsiblefor seismic reflector t (Section 3), andwas dated by 40Ar/39Ar geo-chronology (see Section 5.2.2 below). Lithofacies D is likely to havebeen deposited in a higher energy environment, if compared toLithofacies C.
– Lithofacies E (5.22 to 5.90 mbsf) consists of mud of different shades,from yellowish to dark gray, including, from 5.60 to 5.73 mbsf, amud-supported fine-sand that is rich in bioclasts. This lithofacies,which is homogeneous and fine-grained, is interpreted to have beendeposited under low-energy environmental conditions (comparedto Lithofacies B and D). We compared lithofacies and VMS petro-physical property variations and found that VMS values are fairlyconstant, with slightly lower than average values from 0.65 to4.16 mbsf and from 5.22 to 5.90 mbsf in lithofacies B, C and E.However, higher amplitude oscillations, with distinct positive peaks,are present mainly from 0 to 0.65 mbsf and from 4.16 to 5.22 mbsf,which result from the presence of tephra and sandy layers (LithofaciesA, D and E) (Fig. 3, columns b and d). These oscillations might resultfrom volcaniclastic enrichments from surrounding volcanic areas(Fig. 1). Based on similar sediment characteristics and VMS peak-to-peak correlations among analogous stratigraphic records in adjacentregions (see Section 6.3.2 below), it can be reasonably inferred thatthe two volcaniclastic layers of Lithofacies A are, respectively, depositsfrom the 79 AD eruption and the 3.0–3.5 ka BP protohistoric activityof Mt. Somma-Vesuvius (AP activity; Andronico and Cioni, 2002)that are found elsewhere in the basin (Iorio et al., 2004b; Sagnottiet al., 2005; Insinga et al., 2008; Iorio et al., 2009; Sacchi et al., 2009;Lirer et al., 2013).
4.2. Palaeomagnetism and rock magnetism
The working and archive halves of core C1202 were sub-sampledwith discrete samples with separation between samples of 5 mm orless. No sampleswere taken from theupper 14 cmof core C1202, becausethe sediments were deformed and unsuitable for PSV studies, from thetwo volcanic pumice layers at 0.27–0.29 mbsf (down to 0.38 mbsf) and4.76–4.94 mbsf, and from the scoria level from 0.72 to 0.80 mbsf.
Palaeomagnetic directions (inclination and relative declination) andremanence of 222 discrete samples (210 from the working half and 12from the archive half of the core)weremeasured at the PalaeomagnetismLaboratory, University of California, Santa Cruz, in a 2-G Enterprisessuperconducting rock magnetometer that has a noise level of1 × 10−8 A/m. Low-field magnetic susceptibility (c), anhystereticremanent magnetization (ARM), isothermal remanent magnetiza-tion (IRM), and palaeomagnetic directions and remanence of 164discrete samples (from the archive half of the core), were measuredat the Palaeomagnetism and Rock Magnetism Laboratory of the Uni-versity of Naples Federico II, using a Bartington Instruments MS2 system,a Molspin AF demagnetizer with ARM coil, a MMTD thermal
demagnetizer, two magnetometers (JR-6A spinner and Minispin),and a water-cooled electromagnet (Figs. 4 and 5).
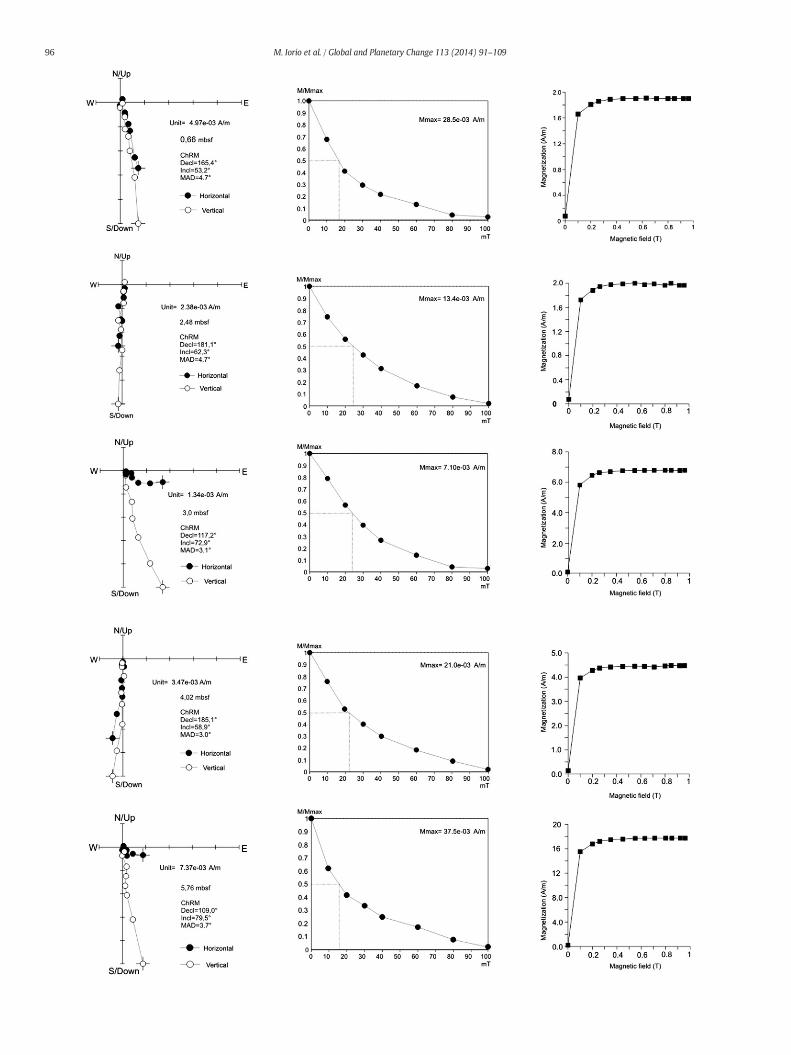
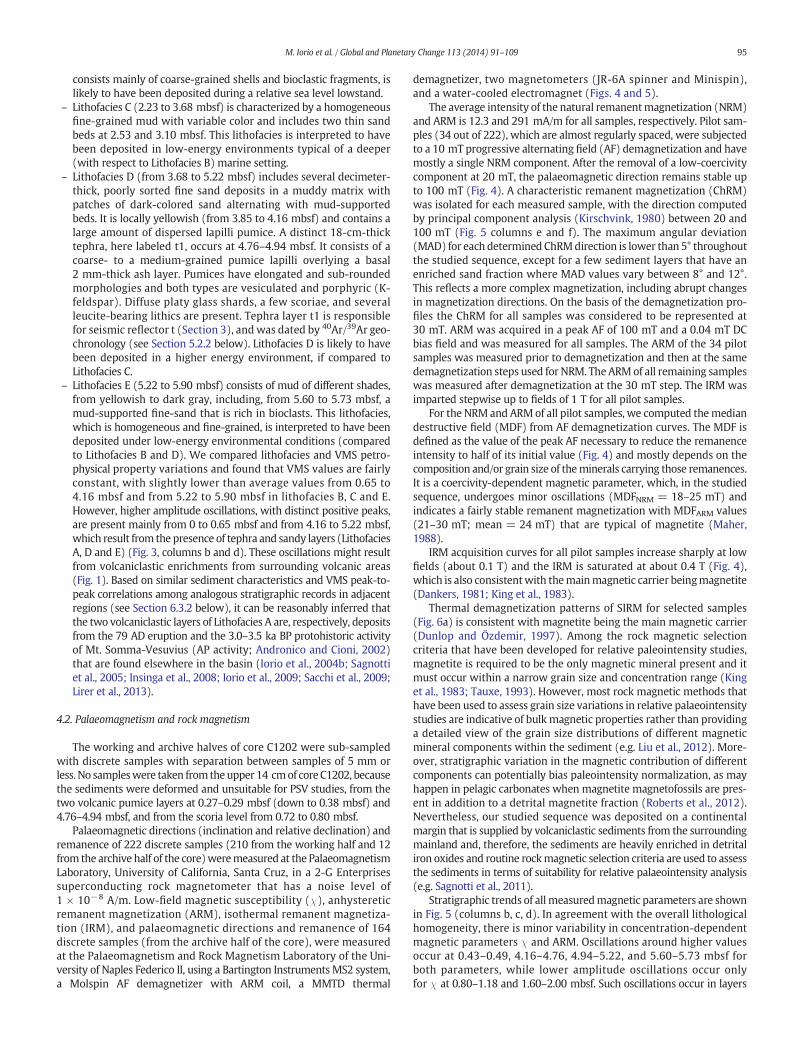
The average intensity of the natural remanentmagnetization (NRM)and ARM is 12.3 and 291 mA/m for all samples, respectively. Pilot sam-ples (34 out of 222), which are almost regularly spaced, were subjectedto a 10 mT progressive alternating field (AF) demagnetization and havemostly a single NRM component. After the removal of a low-coercivitycomponent at 20 mT, the palaeomagnetic direction remains stable upto 100 mT (Fig. 4). A characteristic remanent magnetization (ChRM)was isolated for each measured sample, with the direction computedby principal component analysis (Kirschvink, 1980) between 20 and100 mT (Fig. 5 columns e and f). The maximum angular deviation(MAD) for each determined ChRMdirection is lower than 5° throughoutthe studied sequence, except for a few sediment layers that have anenriched sand fraction where MAD values vary between 8° and 12°.This reflects a more complex magnetization, including abrupt changesin magnetization directions. On the basis of the demagnetization pro-files the ChRM for all samples was considered to be represented at30 mT. ARM was acquired in a peak AF of 100 mT and a 0.04 mT DCbias field and was measured for all samples. The ARM of the 34 pilotsamples was measured prior to demagnetization and then at the samedemagnetization steps used for NRM. The ARMof all remaining sampleswas measured after demagnetization at the 30 mT step. The IRM wasimparted stepwise up to fields of 1 T for all pilot samples.
For the NRM and ARMof all pilot samples, we computed themediandestructive field (MDF) from AF demagnetization curves. The MDF isdefined as the value of the peak AF necessary to reduce the remanenceintensity to half of its initial value (Fig. 4) and mostly depends on thecomposition and/or grain size of theminerals carrying those remanences.It is a coercivity-dependent magnetic parameter, which, in the studiedsequence, undergoes minor oscillations (MDFNRM = 18–25 mT) andindicates a fairly stable remanent magnetization with MDFARM values(21–30 mT; mean = 24 mT) that are typical of magnetite (Maher,1988).
IRM acquisition curves for all pilot samples increase sharply at lowfields (about 0.1 T) and the IRM is saturated at about 0.4 T (Fig. 4),which is also consistentwith themainmagnetic carrier beingmagnetite(Dankers, 1981; King et al., 1983).
Thermal demagnetization patterns of SIRM for selected samples(Fig. 6a) is consistent with magnetite being the main magnetic carrier(Dunlop and Özdemir, 1997). Among the rock magnetic selectioncriteria that have been developed for relative paleointensity studies,magnetite is required to be the only magnetic mineral present and itmust occur within a narrow grain size and concentration range (Kinget al., 1983; Tauxe, 1993). However, most rock magnetic methods thathave been used to assess grain size variations in relative palaeointensitystudies are indicative of bulk magnetic properties rather than providinga detailed view of the grain size distributions of different magneticmineral components within the sediment (e.g. Liu et al., 2012). More-over, stratigraphic variation in the magnetic contribution of differentcomponents can potentially bias paleointensity normalization, as mayhappen in pelagic carbonates when magnetite magnetofossils are pres-ent in addition to a detrital magnetite fraction (Roberts et al., 2012).Nevertheless, our studied sequence was deposited on a continentalmargin that is supplied by volcaniclastic sediments from the surroundingmainland and, therefore, the sediments are heavily enriched in detritaliron oxides and routine rockmagnetic selection criteria are used to assessthe sediments in terms of suitability for relative palaeointensity analysis(e.g. Sagnotti et al., 2011).
Stratigraphic trends of all measuredmagnetic parameters are shownin Fig. 5 (columns b, c, d). In agreement with the overall lithologicalhomogeneity, there is minor variability in concentration-dependentmagnetic parameters c and ARM. Oscillations around higher valuesoccur at 0.43–0.49, 4.16–4.76, 4.94–5.22, and 5.60–5.73 mbsf forboth parameters, while lower amplitude oscillations occur onlyfor c at 0.80–1.18 and 1.60–2.00 mbsf. Such oscillations occur in layers
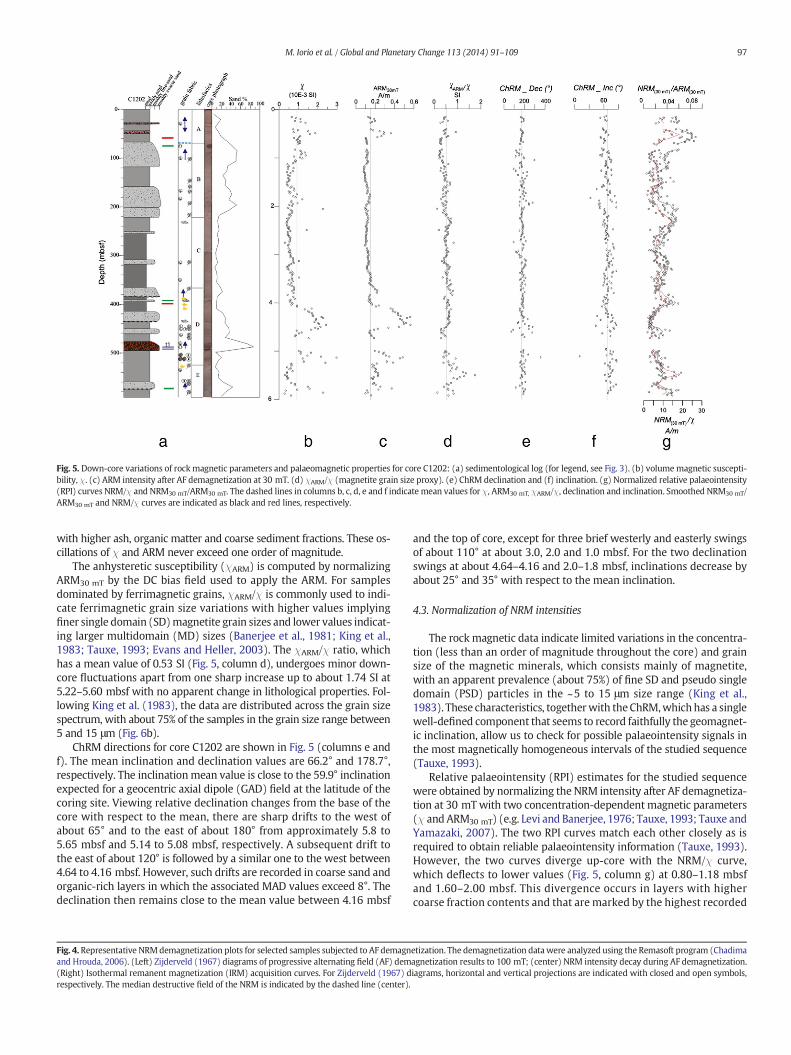
Fig. 5. Down-core variations of rock magnetic parameters and palaeomagnetic properties for core C1202: (a) sedimentological log (for legend, see Fig. 3). (b) volumemagnetic suscepti-bility, c. (c) ARM intensity after AF demagnetization at 30 mT. (d) cARM/c (magnetite grain size proxy). (e) ChRM declination and (f) inclination. (g) Normalized relative palaeointensity(RPI) curves NRM/c and NRM30 mT/ARM30 mT. The dashed lines in columns b, c, d, e and f indicate mean values for c, ARM30 mT, cARM/c, declination and inclination. Smoothed NRM30 mT/ARM30 mT and NRM/c curves are indicated as black and red lines, respectively.
97M. Iorio et al. / Global and Planetary Change 113 (2014) 91–109
with higher ash, organic matter and coarse sediment fractions. These os-cillations of c and ARM never exceed one order of magnitude.
The anhysteretic susceptibility (cARM) is computed by normalizingARM30 mT by the DC bias field used to apply the ARM. For samplesdominated by ferrimagnetic grains, cARM/c is commonly used to indi-cate ferrimagnetic grain size variations with higher values implyingfiner single domain (SD)magnetite grain sizes and lower values indicat-ing larger multidomain (MD) sizes (Banerjee et al., 1981; King et al.,1983; Tauxe, 1993; Evans and Heller, 2003). The cARM/c ratio, whichhas a mean value of 0.53 SI (Fig. 5, column d), undergoes minor down-core fluctuations apart from one sharp increase up to about 1.74 SI at5.22–5.60 mbsf with no apparent change in lithological properties. Fol-lowing King et al. (1983), the data are distributed across the grain sizespectrum, with about 75% of the samples in the grain size range between5 and 15 μm (Fig. 6b).
ChRM directions for core C1202 are shown in Fig. 5 (columns e andf). The mean inclination and declination values are 66.2° and 178.7°,respectively. The inclinationmean value is close to the 59.9° inclinationexpected for a geocentric axial dipole (GAD) field at the latitude of thecoring site. Viewing relative declination changes from the base of thecore with respect to the mean, there are sharp drifts to the west ofabout 65° and to the east of about 180° from approximately 5.8 to5.65 mbsf and 5.14 to 5.08 mbsf, respectively. A subsequent drift tothe east of about 120° is followed by a similar one to the west between4.64 to 4.16 mbsf. However, such drifts are recorded in coarse sand andorganic-rich layers in which the associated MAD values exceed 8°. Thedeclination then remains close to the mean value between 4.16 mbsf
Fig. 4. Representative NRMdemagnetization plots for selected samples subjected to AF demagnand Hrouda, 2006). (Left) Zijderveld (1967) diagrams of progressive alternating field (AF) dem(Right) Isothermal remanent magnetization (IRM) acquisition curves. For Zijderveld (1967) drespectively. The median destructive field of the NRM is indicated by the dashed line (center).
and the top of core, except for three brief westerly and easterly swingsof about 110° at about 3.0, 2.0 and 1.0 mbsf. For the two declinationswings at about 4.64–4.16 and 2.0–1.8 mbsf, inclinations decrease byabout 25° and 35° with respect to the mean inclination.
4.3. Normalization of NRM intensities
The rock magnetic data indicate limited variations in the concentra-tion (less than an order of magnitude throughout the core) and grainsize of the magnetic minerals, which consists mainly of magnetite,with an apparent prevalence (about 75%) of fine SD and pseudo singledomain (PSD) particles in the ~5 to 15 μm size range (King et al.,1983). These characteristics, togetherwith theChRM,whichhas a singlewell-defined component that seems to record faithfully the geomagnet-ic inclination, allow us to check for possible palaeointensity signals inthe most magnetically homogeneous intervals of the studied sequence(Tauxe, 1993).
Relative palaeointensity (RPI) estimates for the studied sequencewere obtained by normalizing the NRM intensity after AF demagnetiza-tion at 30 mTwith two concentration-dependent magnetic parameters(c and ARM30 mT) (e.g. Levi and Banerjee, 1976; Tauxe, 1993; Tauxe andYamazaki, 2007). The two RPI curves match each other closely as isrequired to obtain reliable palaeointensity information (Tauxe, 1993).However, the two curves diverge up-core with the NRM/c curve,which deflects to lower values (Fig. 5, column g) at 0.80–1.18 mbsfand 1.60–2.00 mbsf. This divergence occurs in layers with highercoarse fraction contents and that are marked by the highest recorded
etization. The demagnetization datawere analyzed using the Remasoft program (Chadimaagnetization results to 100 mT; (center) NRM intensity decay during AF demagnetization.iagrams, horizontal and vertical projections are indicated with closed and open symbols,
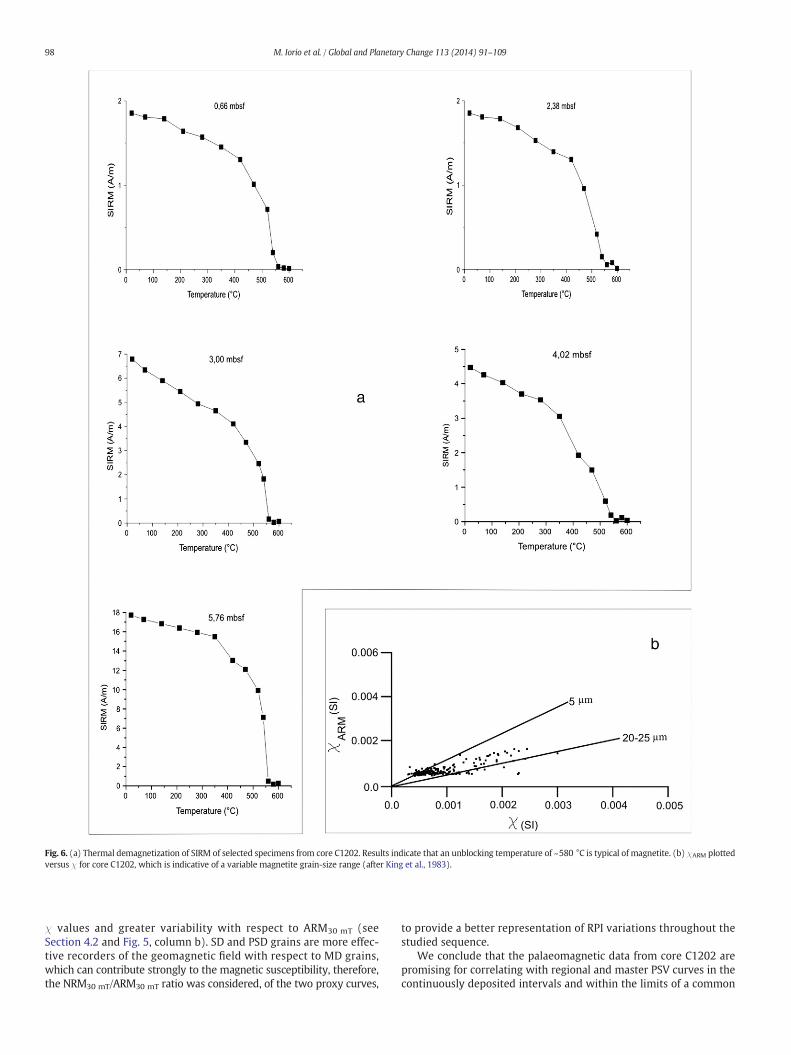
Fig. 6. (a) Thermal demagnetization of SIRM of selected specimens from core C1202. Results indicate that an unblocking temperature of ~580 °C is typical of magnetite. (b) cARM plottedversus c for core C1202, which is indicative of a variable magnetite grain-size range (after King et al., 1983).
98 M. Iorio et al. / Global and Planetary Change 113 (2014) 91–109
c values and greater variability with respect to ARM30 mT (seeSection 4.2 and Fig. 5, column b). SD and PSD grains are more effec-tive recorders of the geomagnetic field with respect to MD grains,which can contribute strongly to the magnetic susceptibility, therefore,the NRM30 mT/ARM30 mT ratio was considered, of the two proxy curves,
to provide a better representation of RPI variations throughout thestudied sequence.
We conclude that the palaeomagnetic data from core C1202 arepromising for correlating with regional and master PSV curves in thecontinuously deposited intervals and within the limits of a common
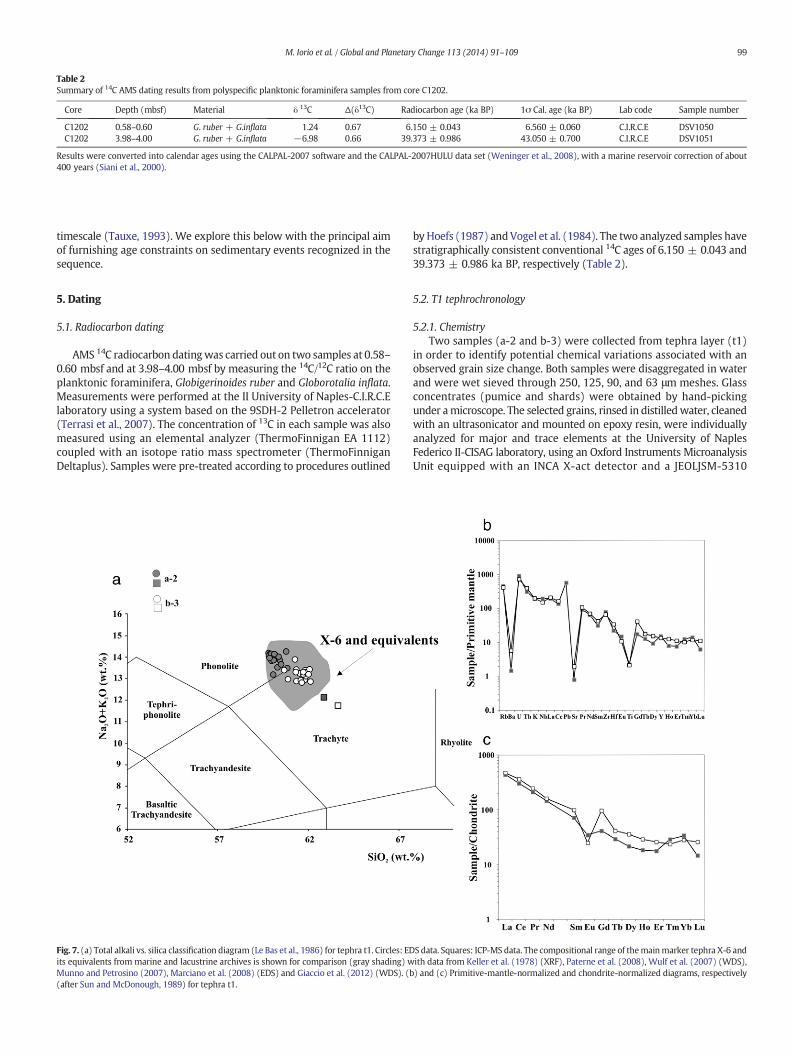
Table 2Summary of 14C AMS dating results from polyspecific planktonic foraminifera samples from core C1202.
Core Depth (mbsf) Material δ 13C Δ(δ13C) Radiocarbon age (ka BP) 1σ Cal. age (ka BP) Lab code Sample number
C1202 0.58–0.60 G. ruber + G.inflata 1.24 0.67 6.150 ± 0.043 6.560 ± 0.060 C.I.R.C.E DSV1050C1202 3.98–4.00 G. ruber + G.inflata −6.98 0.66 39.373 ± 0.986 43.050 ± 0.700 C.I.R.C.E DSV1051
Results were converted into calendar ages using the CALPAL-2007 software and the CALPAL-2007HULU data set (Weninger et al., 2008), with a marine reservoir correction of about400 years (Siani et al., 2000).
99M. Iorio et al. / Global and Planetary Change 113 (2014) 91–109
timescale (Tauxe, 1993). We explore this below with the principal aimof furnishing age constraints on sedimentary events recognized in thesequence.
5. Dating
5.1. Radiocarbon dating
AMS 14C radiocarbon datingwas carried out on two samples at 0.58–0.60 mbsf and at 3.98–4.00 mbsf by measuring the 14C/12C ratio on theplanktonic foraminifera, Globigerinoides ruber and Globorotalia inflata.Measurements were performed at the II University of Naples-C.I.R.C.Elaboratory using a system based on the 9SDH-2 Pelletron accelerator(Terrasi et al., 2007). The concentration of 13C in each sample was alsomeasured using an elemental analyzer (ThermoFinnigan EA 1112)coupled with an isotope ratio mass spectrometer (ThermoFinniganDeltaplus). Samples were pre-treated according to procedures outlined
Fig. 7. (a) Total alkali vs. silica classification diagram (Le Bas et al., 1986) for tephra t1. Circles: EDits equivalents from marine and lacustrine archives is shown for comparison (gray shading) wMunno and Petrosino (2007), Marciano et al. (2008) (EDS) and Giaccio et al. (2012) (WDS). (b(after Sun and McDonough, 1989) for tephra t1.
byHoefs (1987) andVogel et al. (1984). The two analyzed samples havestratigraphically consistent conventional 14C ages of 6.150 ± 0.043 and39.373 ± 0.986 ka BP, respectively (Table 2).
5.2. T1 tephrochronology
5.2.1. ChemistryTwo samples (a-2 and b-3) were collected from tephra layer (t1)
in order to identify potential chemical variations associated with anobserved grain size change. Both samples were disaggregated in waterand were wet sieved through 250, 125, 90, and 63 μm meshes. Glassconcentrates (pumice and shards) were obtained by hand-pickingunder amicroscope. The selected grains, rinsed in distilledwater, cleanedwith an ultrasonicator and mounted on epoxy resin, were individuallyanalyzed for major and trace elements at the University of NaplesFederico II-CISAG laboratory, using an Oxford Instruments MicroanalysisUnit equipped with an INCA X-act detector and a JEOLJSM-5310
S data. Squares: ICP-MS data. The compositional range of themainmarker tephra X-6 andith data from Keller et al. (1978) (XRF), Paterne et al. (2008), Wulf et al. (2007) (WDS),) and (c) Primitive-mantle-normalized and chondrite-normalized diagrams, respectively
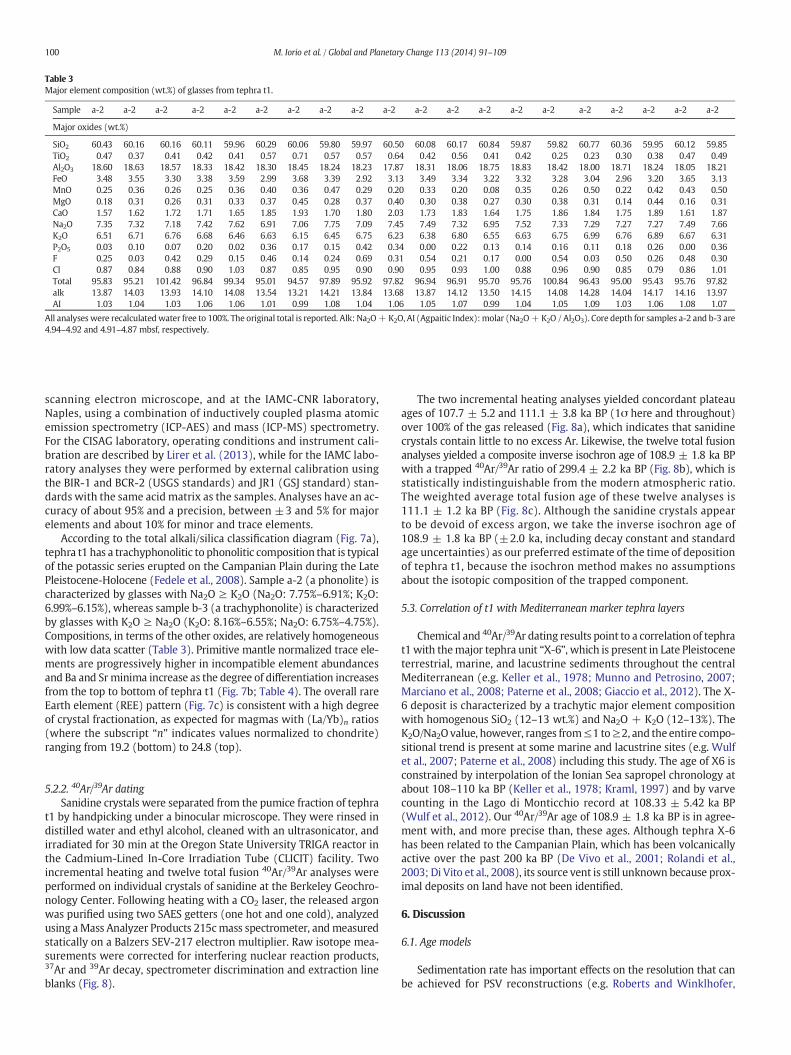
Table 3Major element composition (wt.%) of glasses from tephra t1.
Sample a-2 a-2 a-2 a-2 a-2 a-2 a-2 a-2 a-2 a-2 a-2 a-2 a-2 a-2 a-2 a-2 a-2 a-2 a-2 a-2
Major oxides (wt.%)
SiO2 60.43 60.16 60.16 60.11 59.96 60.29 60.06 59.80 59.97 60.50 60.08 60.17 60.84 59.87 59.82 60.77 60.36 59.95 60.12 59.85TiO2 0.47 0.37 0.41 0.42 0.41 0.57 0.71 0.57 0.57 0.64 0.42 0.56 0.41 0.42 0.25 0.23 0.30 0.38 0.47 0.49Al2O3 18.60 18.63 18.57 18.33 18.42 18.30 18.45 18.24 18.23 17.87 18.31 18.06 18.75 18.83 18.42 18.00 18.71 18.24 18.05 18.21FeO 3.48 3.55 3.30 3.38 3.59 2.99 3.68 3.39 2.92 3.13 3.49 3.34 3.22 3.32 3.28 3.04 2.96 3.20 3.65 3.13MnO 0.25 0.36 0.26 0.25 0.36 0.40 0.36 0.47 0.29 0.20 0.33 0.20 0.08 0.35 0.26 0.50 0.22 0.42 0.43 0.50MgO 0.18 0.31 0.26 0.31 0.33 0.37 0.45 0.28 0.37 0.40 0.30 0.38 0.27 0.30 0.38 0.31 0.14 0.44 0.16 0.31CaO 1.57 1.62 1.72 1.71 1.65 1.85 1.93 1.70 1.80 2.03 1.73 1.83 1.64 1.75 1.86 1.84 1.75 1.89 1.61 1.87Na2O 7.35 7.32 7.18 7.42 7.62 6.91 7.06 7.75 7.09 7.45 7.49 7.32 6.95 7.52 7.33 7.29 7.27 7.27 7.49 7.66K2O 6.51 6.71 6.76 6.68 6.46 6.63 6.15 6.45 6.75 6.23 6.38 6.80 6.55 6.63 6.75 6.99 6.76 6.89 6.67 6.31P2O5 0.03 0.10 0.07 0.20 0.02 0.36 0.17 0.15 0.42 0.34 0.00 0.22 0.13 0.14 0.16 0.11 0.18 0.26 0.00 0.36F 0.25 0.03 0.42 0.29 0.15 0.46 0.14 0.24 0.69 0.31 0.54 0.21 0.17 0.00 0.54 0.03 0.50 0.26 0.48 0.30Cl 0.87 0.84 0.88 0.90 1.03 0.87 0.85 0.95 0.90 0.90 0.95 0.93 1.00 0.88 0.96 0.90 0.85 0.79 0.86 1.01Total 95.83 95.21 101.42 96.84 99.34 95.01 94.57 97.89 95.92 97.82 96.94 96.91 95.70 95.76 100.84 96.43 95.00 95.43 95.76 97.82alk 13.87 14.03 13.93 14.10 14.08 13.54 13.21 14.21 13.84 13.68 13.87 14.12 13.50 14.15 14.08 14.28 14.04 14.17 14.16 13.97AI 1.03 1.04 1.03 1.06 1.06 1.01 0.99 1.08 1.04 1.06 1.05 1.07 0.99 1.04 1.05 1.09 1.03 1.06 1.08 1.07
All analyses were recalculatedwater free to 100%. The original total is reported. Alk: Na2O + K2O, AI (Agpaitic Index):molar (Na2O + K2O / Al2O3). Core depth for samples a-2 and b-3 are4.94–4.92 and 4.91–4.87 mbsf, respectively.
100 M. Iorio et al. / Global and Planetary Change 113 (2014) 91–109
scanning electron microscope, and at the IAMC-CNR laboratory,Naples, using a combination of inductively coupled plasma atomicemission spectrometry (ICP-AES) and mass (ICP-MS) spectrometry.For the CISAG laboratory, operating conditions and instrument cali-bration are described by Lirer et al. (2013), while for the IAMC labo-ratory analyses they were performed by external calibration usingthe BIR-1 and BCR-2 (USGS standards) and JR1 (GSJ standard) stan-dards with the same acid matrix as the samples. Analyses have an ac-curacy of about 95% and a precision, between ±3 and 5% for majorelements and about 10% for minor and trace elements.
According to the total alkali/silica classification diagram (Fig. 7a),tephra t1 has a trachyphonolitic to phonolitic composition that is typicalof the potassic series erupted on the Campanian Plain during the LatePleistocene-Holocene (Fedele et al., 2008). Sample a-2 (a phonolite) ischaracterized by glasses with Na2O ≥ K2O (Na2O: 7.75%–6.91%; K2O:6.99%–6.15%), whereas sample b-3 (a trachyphonolite) is characterizedby glasses with K2O ≥ Na2O (K2O: 8.16%–6.55%; Na2O: 6.75%–4.75%).Compositions, in terms of the other oxides, are relatively homogeneouswith low data scatter (Table 3). Primitive mantle normalized trace ele-ments are progressively higher in incompatible element abundancesand Ba and Srminima increase as the degree of differentiation increasesfrom the top to bottom of tephra t1 (Fig. 7b; Table 4). The overall rareEarth element (REE) pattern (Fig. 7c) is consistent with a high degreeof crystal fractionation, as expected for magmas with (La/Yb)n ratios(where the subscript “n” indicates values normalized to chondrite)ranging from 19.2 (bottom) to 24.8 (top).
5.2.2. 40Ar/39Ar datingSanidine crystals were separated from the pumice fraction of tephra
t1 by handpicking under a binocular microscope. They were rinsed indistilled water and ethyl alcohol, cleaned with an ultrasonicator, andirradiated for 30 min at the Oregon State University TRIGA reactor inthe Cadmium-Lined In-Core Irradiation Tube (CLICIT) facility. Twoincremental heating and twelve total fusion 40Ar/39Ar analyses wereperformed on individual crystals of sanidine at the Berkeley Geochro-nology Center. Following heating with a CO2 laser, the released argonwas purified using two SAES getters (one hot and one cold), analyzedusing aMass Analyzer Products 215cmass spectrometer, andmeasuredstatically on a Balzers SEV-217 electron multiplier. Raw isotope mea-surements were corrected for interfering nuclear reaction products,37Ar and 39Ar decay, spectrometer discrimination and extraction lineblanks (Fig. 8).
The two incremental heating analyses yielded concordant plateauages of 107.7 ± 5.2 and 111.1 ± 3.8 ka BP (1σ here and throughout)over 100% of the gas released (Fig. 8a), which indicates that sanidinecrystals contain little to no excess Ar. Likewise, the twelve total fusionanalyses yielded a composite inverse isochron age of 108.9 ± 1.8 ka BPwith a trapped 40Ar/39Ar ratio of 299.4 ± 2.2 ka BP (Fig. 8b), which isstatistically indistinguishable from the modern atmospheric ratio.The weighted average total fusion age of these twelve analyses is111.1 ± 1.2 ka BP (Fig. 8c). Although the sanidine crystals appearto be devoid of excess argon, we take the inverse isochron age of108.9 ± 1.8 ka BP (±2.0 ka, including decay constant and standardage uncertainties) as our preferred estimate of the time of depositionof tephra t1, because the isochron method makes no assumptionsabout the isotopic composition of the trapped component.
5.3. Correlation of t1 with Mediterranean marker tephra layers
Chemical and 40Ar/39Ar dating results point to a correlation of tephrat1with themajor tephra unit “X-6”, which is present in Late Pleistoceneterrestrial, marine, and lacustrine sediments throughout the centralMediterranean (e.g. Keller et al., 1978; Munno and Petrosino, 2007;Marciano et al., 2008; Paterne et al., 2008; Giaccio et al., 2012). The X-6 deposit is characterized by a trachytic major element compositionwith homogenous SiO2 (12–13 wt.%) and Na2O + K2O (12–13%). TheK2O/Na2O value, however, ranges from≤1 to≥2, and the entire compo-sitional trend is present at some marine and lacustrine sites (e.g. Wulfet al., 2007; Paterne et al., 2008) including this study. The age of X6 isconstrained by interpolation of the Ionian Sea sapropel chronology atabout 108–110 ka BP (Keller et al., 1978; Kraml, 1997) and by varvecounting in the Lago di Monticchio record at 108.33 ± 5.42 ka BP(Wulf et al., 2012). Our 40Ar/39Ar age of 108.9 ± 1.8 ka BP is in agree-ment with, and more precise than, these ages. Although tephra X-6has been related to the Campanian Plain, which has been volcanicallyactive over the past 200 ka BP (De Vivo et al., 2001; Rolandi et al.,2003; Di Vito et al., 2008), its source vent is still unknown because prox-imal deposits on land have not been identified.
6. Discussion
6.1. Age models
Sedimentation rate has important effects on the resolution that canbe achieved for PSV reconstructions (e.g. Roberts and Winklhofer,
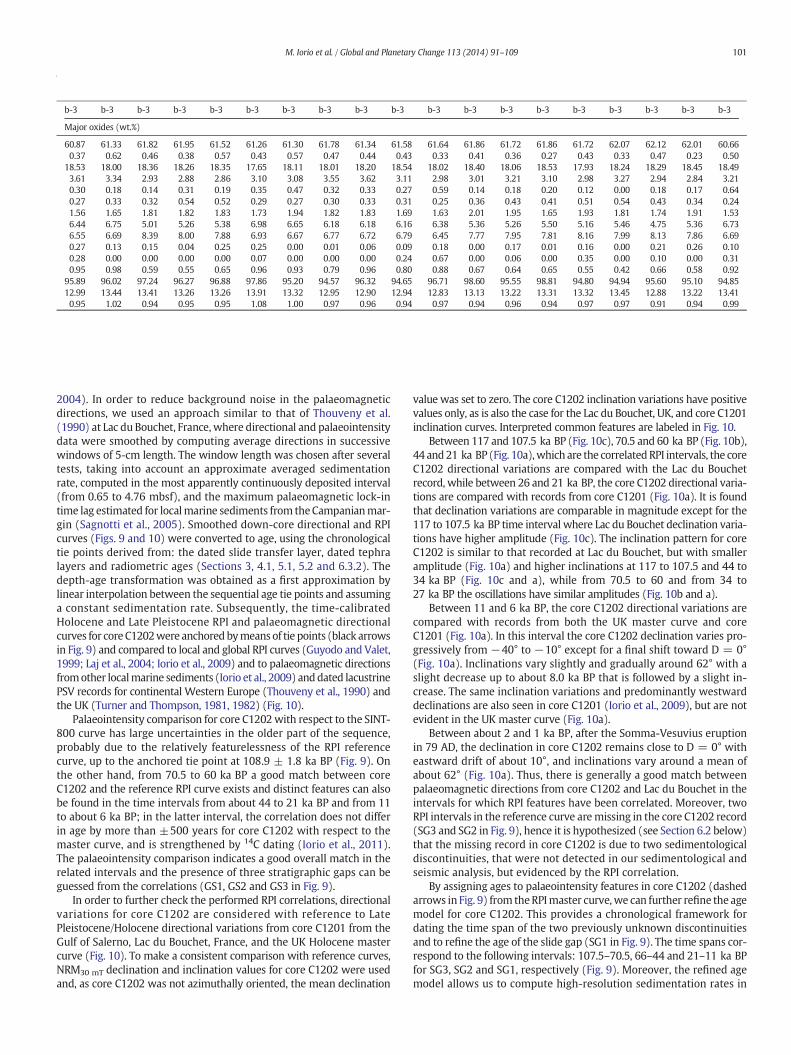
Table 3Major element composition (wt.%) of glasses from tephra t1.
b-3 b-3 b-3 b-3 b-3 b-3 b-3 b-3 b-3 b-3 b-3 b-3 b-3 b-3 b-3 b-3 b-3 b-3 b-3
Major oxides (wt.%)
60.87 61.33 61.82 61.95 61.52 61.26 61.30 61.78 61.34 61.58 61.64 61.86 61.72 61.86 61.72 62.07 62.12 62.01 60.660.37 0.62 0.46 0.38 0.57 0.43 0.57 0.47 0.44 0.43 0.33 0.41 0.36 0.27 0.43 0.33 0.47 0.23 0.50
18.53 18.00 18.36 18.26 18.35 17.65 18.11 18.01 18.20 18.54 18.02 18.40 18.06 18.53 17.93 18.24 18.29 18.45 18.493.61 3.34 2.93 2.88 2.86 3.10 3.08 3.55 3.62 3.11 2.98 3.01 3.21 3.10 2.98 3.27 2.94 2.84 3.210.30 0.18 0.14 0.31 0.19 0.35 0.47 0.32 0.33 0.27 0.59 0.14 0.18 0.20 0.12 0.00 0.18 0.17 0.640.27 0.33 0.32 0.54 0.52 0.29 0.27 0.30 0.33 0.31 0.25 0.36 0.43 0.41 0.51 0.54 0.43 0.34 0.241.56 1.65 1.81 1.82 1.83 1.73 1.94 1.82 1.83 1.69 1.63 2.01 1.95 1.65 1.93 1.81 1.74 1.91 1.536.44 6.75 5.01 5.26 5.38 6.98 6.65 6.18 6.18 6.16 6.38 5.36 5.26 5.50 5.16 5.46 4.75 5.36 6.736.55 6.69 8.39 8.00 7.88 6.93 6.67 6.77 6.72 6.79 6.45 7.77 7.95 7.81 8.16 7.99 8.13 7.86 6.690.27 0.13 0.15 0.04 0.25 0.25 0.00 0.01 0.06 0.09 0.18 0.00 0.17 0.01 0.16 0.00 0.21 0.26 0.100.28 0.00 0.00 0.00 0.00 0.07 0.00 0.00 0.00 0.24 0.67 0.00 0.06 0.00 0.35 0.00 0.10 0.00 0.310.95 0.98 0.59 0.55 0.65 0.96 0.93 0.79 0.96 0.80 0.88 0.67 0.64 0.65 0.55 0.42 0.66 0.58 0.92
95.89 96.02 97.24 96.27 96.88 97.86 95.20 94.57 96.32 94.65 96.71 98.60 95.55 98.81 94.80 94.94 95.60 95.10 94.8512.99 13.44 13.41 13.26 13.26 13.91 13.32 12.95 12.90 12.94 12.83 13.13 13.22 13.31 13.32 13.45 12.88 13.22 13.410.95 1.02 0.94 0.95 0.95 1.08 1.00 0.97 0.96 0.94 0.97 0.94 0.96 0.94 0.97 0.97 0.91 0.94 0.99
101M. Iorio et al. / Global and Planetary Change 113 (2014) 91–109
2004). In order to reduce background noise in the palaeomagneticdirections, we used an approach similar to that of Thouveny et al.(1990) at Lac du Bouchet, France, where directional and palaeointensitydata were smoothed by computing average directions in successivewindows of 5-cm length. The window length was chosen after severaltests, taking into account an approximate averaged sedimentationrate, computed in the most apparently continuously deposited interval(from 0.65 to 4.76 mbsf), and the maximum palaeomagnetic lock-intime lag estimated for localmarine sediments from theCampanianmar-gin (Sagnotti et al., 2005). Smoothed down-core directional and RPIcurves (Figs. 9 and 10) were converted to age, using the chronologicaltie points derived from: the dated slide transfer layer, dated tephralayers and radiometric ages (Sections 3, 4.1, 5.1, 5.2 and 6.3.2). Thedepth-age transformation was obtained as a first approximation bylinear interpolation between the sequential age tie points and assuminga constant sedimentation rate. Subsequently, the time-calibratedHolocene and Late Pleistocene RPI and palaeomagnetic directionalcurves for core C1202were anchored bymeansof tie points (black arrowsin Fig. 9) and compared to local and global RPI curves (Guyodo and Valet,1999; Laj et al., 2004; Iorio et al., 2009) and to palaeomagnetic directionsfromother localmarine sediments (Iorio et al., 2009) anddated lacustrinePSV records for continental Western Europe (Thouveny et al., 1990) andthe UK (Turner and Thompson, 1981, 1982) (Fig. 10).
Palaeointensity comparison for core C1202with respect to the SINT-800 curve has large uncertainties in the older part of the sequence,probably due to the relatively featurelessness of the RPI referencecurve, up to the anchored tie point at 108.9 ± 1.8 ka BP (Fig. 9). Onthe other hand, from 70.5 to 60 ka BP a good match between coreC1202 and the reference RPI curve exists and distinct features can alsobe found in the time intervals from about 44 to 21 ka BP and from 11to about 6 ka BP; in the latter interval, the correlation does not differin age by more than ±500 years for core C1202 with respect to themaster curve, and is strengthened by 14C dating (Iorio et al., 2011).The palaeointensity comparison indicates a good overall match in therelated intervals and the presence of three stratigraphic gaps can beguessed from the correlations (GS1, GS2 and GS3 in Fig. 9).
In order to further check the performed RPI correlations, directionalvariations for core C1202 are considered with reference to LatePleistocene/Holocene directional variations from core C1201 from theGulf of Salerno, Lac du Bouchet, France, and the UK Holocene mastercurve (Fig. 10). To make a consistent comparison with reference curves,NRM30 mT declination and inclination values for core C1202 were usedand, as core C1202 was not azimuthally oriented, the mean declination
value was set to zero. The core C1202 inclination variations have positivevalues only, as is also the case for the Lac du Bouchet, UK, and core C1201inclination curves. Interpreted common features are labeled in Fig. 10.
Between 117 and 107.5 ka BP (Fig. 10c), 70.5 and 60 ka BP (Fig. 10b),44 and21 ka BP (Fig. 10a),which are the correlatedRPI intervals, the coreC1202 directional variations are compared with the Lac du Bouchetrecord, while between 26 and 21 ka BP, the core C1202 directional varia-tions are compared with records from core C1201 (Fig. 10a). It is foundthat declination variations are comparable in magnitude except for the117 to 107.5 ka BP time interval where Lac du Bouchet declination varia-tions have higher amplitude (Fig. 10c). The inclination pattern for coreC1202 is similar to that recorded at Lac du Bouchet, but with smalleramplitude (Fig. 10a) and higher inclinations at 117 to 107.5 and 44 to34 ka BP (Fig. 10c and a), while from 70.5 to 60 and from 34 to27 ka BP the oscillations have similar amplitudes (Fig. 10b and a).
Between 11 and 6 ka BP, the core C1202 directional variations arecompared with records from both the UK master curve and coreC1201 (Fig. 10a). In this interval the core C1202 declination varies pro-gressively from −40° to −10° except for a final shift toward D = 0°(Fig. 10a). Inclinations vary slightly and gradually around 62° with aslight decrease up to about 8.0 ka BP that is followed by a slight in-crease. The same inclination variations and predominantly westwarddeclinations are also seen in core C1201 (Iorio et al., 2009), but are notevident in the UK master curve (Fig. 10a).
Between about 2 and 1 ka BP, after the Somma-Vesuvius eruptionin 79 AD, the declination in core C1202 remains close to D = 0° witheastward drift of about 10°, and inclinations vary around a mean ofabout 62° (Fig. 10a). Thus, there is generally a good match betweenpalaeomagnetic directions from core C1202 and Lac du Bouchet in theintervals for which RPI features have been correlated. Moreover, twoRPI intervals in the reference curve aremissing in the core C1202 record(SG3 and SG2 in Fig. 9), hence it is hypothesized (see Section 6.2 below)that the missing record in core C1202 is due to two sedimentologicaldiscontinuities, that were not detected in our sedimentological andseismic analysis, but evidenced by the RPI correlation.
By assigning ages to palaeointensity features in core C1202 (dashedarrows in Fig. 9) from theRPImaster curve,we can further refine the agemodel for core C1202. This provides a chronological framework fordating the time span of the two previously unknown discontinuitiesand to refine the age of the slide gap (SG1 in Fig. 9). The time spans cor-respond to the following intervals: 107.5–70.5, 66–44 and 21–11 ka BPfor SG3, SG2 and SG1, respectively (Fig. 9). Moreover, the refined agemodel allows us to compute high-resolution sedimentation rates in
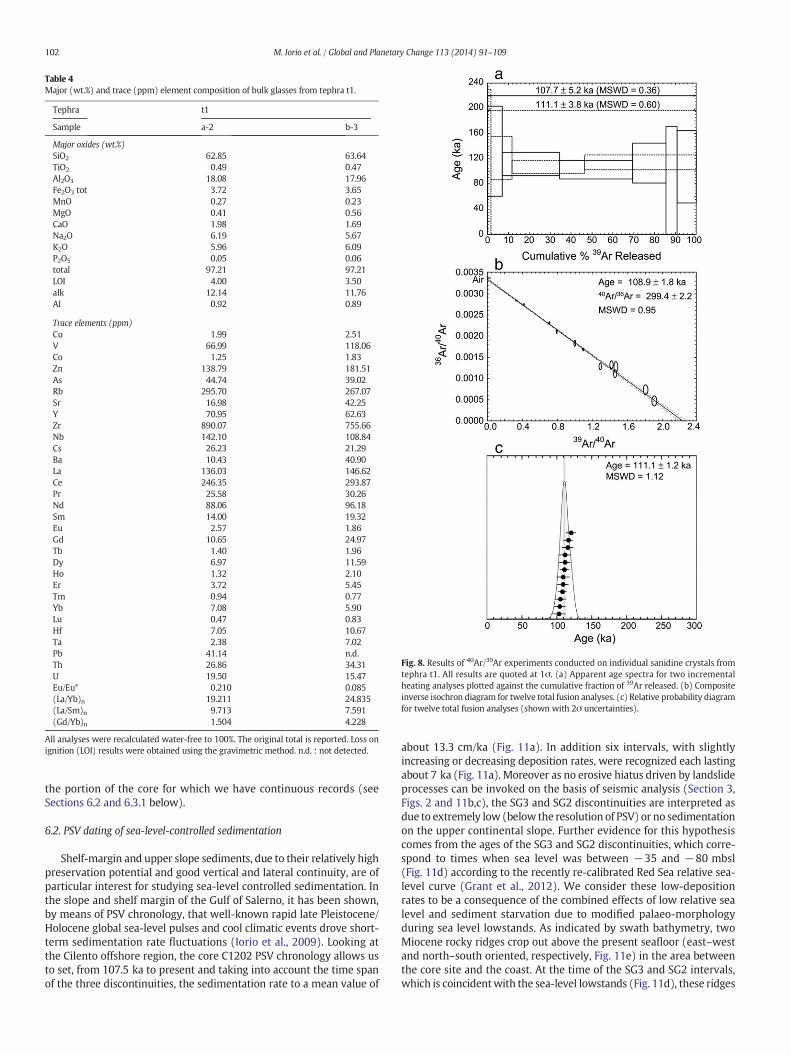
Table 4Major (wt.%) and trace (ppm) element composition of bulk glasses from tephra t1.
Tephra t1
Sample a-2 b-3
Major oxides (wt.%)SiO2 62.85 63.64TiO2 0.49 0.47Al2O3 18.08 17.96Fe2O3 tot 3.72 3.65MnO 0.27 0.23MgO 0.41 0.56CaO 1.98 1.69Na2O 6.19 5.67K2O 5.96 6.09P2O5 0.05 0.06total 97.21 97.21LOI 4.00 3.50alk 12.14 11.76AI 0.92 0.89
Trace elements (ppm)Cu 1.99 2.51V 66.99 118.06Co 1.25 1.83Zn 138.79 181.51As 44.74 39.02Rb 295.70 267.07Sr 16.98 42.25Y 70.95 62.63Zr 890.07 755.66Nb 142.10 108.84Cs 26.23 21.29Ba 10.43 40.90La 136.03 146.62Ce 246.35 293.87Pr 25.58 30.26Nd 88.06 96.18Sm 14.00 19.32Eu 2.57 1.86Gd 10.65 24.97Tb 1.40 1.96Dy 6.97 11.59Ho 1.32 2.10Er 3.72 5.45Tm 0.94 0.77Yb 7.08 5.90Lu 0.47 0.83Hf 7.05 10.67Ta 2.38 7.02Pb 41.14 n.d.Th 26.86 34.31U 19.50 15.47Eu/Eu* 0.210 0.085(La/Yb)n 19.211 24.835(La/Sm)n 9.713 7.591(Gd/Yb)n 1.504 4.228
All analyses were recalculated water-free to 100%. The original total is reported. Loss onignition (LOI) results were obtained using the gravimetric method. n.d. : not detected.
Fig. 8. Results of 40Ar/39Ar experiments conducted on individual sanidine crystals fromtephra t1. All results are quoted at 1σ. (a) Apparent age spectra for two incrementalheating analyses plotted against the cumulative fraction of 39Ar released. (b) Compositeinverse isochron diagram for twelve total fusion analyses. (c) Relative probability diagramfor twelve total fusion analyses (shown with 2σ uncertainties).
102 M. Iorio et al. / Global and Planetary Change 113 (2014) 91–109
the portion of the core for which we have continuous records (seeSections 6.2 and 6.3.1 below).
6.2. PSV dating of sea-level-controlled sedimentation
Shelf-margin and upper slope sediments, due to their relatively highpreservation potential and good vertical and lateral continuity, are ofparticular interest for studying sea-level controlled sedimentation. Inthe slope and shelf margin of the Gulf of Salerno, it has been shown,by means of PSV chronology, that well-known rapid late Pleistocene/Holocene global sea-level pulses and cool climatic events drove short-term sedimentation rate fluctuations (Iorio et al., 2009). Looking atthe Cilento offshore region, the core C1202 PSV chronology allows usto set, from 107.5 ka to present and taking into account the time spanof the three discontinuities, the sedimentation rate to a mean value of
about 13.3 cm/ka (Fig. 11a). In addition six intervals, with slightlyincreasing or decreasing deposition rates, were recognized each lastingabout 7 ka (Fig. 11a). Moreover as no erosive hiatus driven by landslideprocesses can be invoked on the basis of seismic analysis (Section 3,Figs. 2 and 11b,c), the SG3 and SG2 discontinuities are interpreted asdue to extremely low (below the resolution of PSV) or no sedimentationon the upper continental slope. Further evidence for this hypothesiscomes from the ages of the SG3 and SG2 discontinuities, which corre-spond to times when sea level was between −35 and −80 mbsl(Fig. 11d) according to the recently re-calibrated Red Sea relative sea-level curve (Grant et al., 2012). We consider these low-depositionrates to be a consequence of the combined effects of low relative sealevel and sediment starvation due to modified palaeo-morphologyduring sea level lowstands. As indicated by swath bathymetry, twoMiocene rocky ridges crop out above the present seafloor (east–westand north–south oriented, respectively, Fig. 11e) in the area betweenthe core site and the coast. At the time of the SG3 and SG2 intervals,which is coincidentwith the sea-level lowstands (Fig. 11d), these ridges
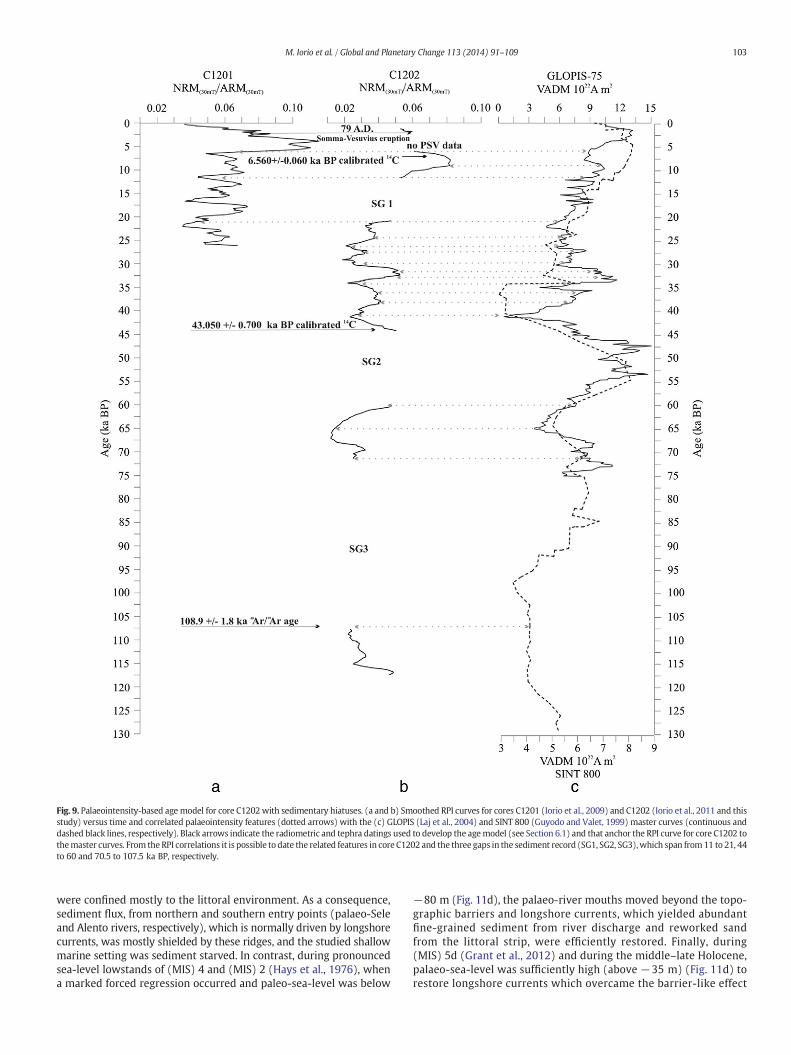
Fig. 9. Palaeointensity-based age model for core C1202with sedimentary hiatuses. (a and b) Smoothed RPI curves for cores C1201 (Iorio et al., 2009) and C1202 (Iorio et al., 2011 and thisstudy) versus time and correlated palaeointensity features (dotted arrows) with the (c) GLOPIS (Laj et al., 2004) and SINT 800 (Guyodo and Valet, 1999) master curves (continuous anddashed black lines, respectively). Black arrows indicate the radiometric and tephra datings used to develop the agemodel (see Section 6.1) and that anchor the RPI curve for core C1202 tothemaster curves. From the RPI correlations it is possible to date the related features in core C1202 and the three gaps in the sediment record (SG1, SG2, SG3),which span from11 to 21, 44to 60 and 70.5 to 107.5 ka BP, respectively.
103M. Iorio et al. / Global and Planetary Change 113 (2014) 91–109
were confined mostly to the littoral environment. As a consequence,sediment flux, from northern and southern entry points (palaeo-Seleand Alento rivers, respectively), which is normally driven by longshorecurrents, was mostly shielded by these ridges, and the studied shallowmarine setting was sediment starved. In contrast, during pronouncedsea-level lowstands of (MIS) 4 and (MIS) 2 (Hays et al., 1976), whena marked forced regression occurred and paleo-sea-level was below
−80 m (Fig. 11d), the palaeo-river mouths moved beyond the topo-graphic barriers and longshore currents, which yielded abundantfine-grained sediment from river discharge and reworked sandfrom the littoral strip, were efficiently restored. Finally, during(MIS) 5d (Grant et al., 2012) and during the middle–late Holocene,palaeo-sea-level was sufficiently high (above −35 m) (Fig. 11d) torestore longshore currents which overcame the barrier-like effect
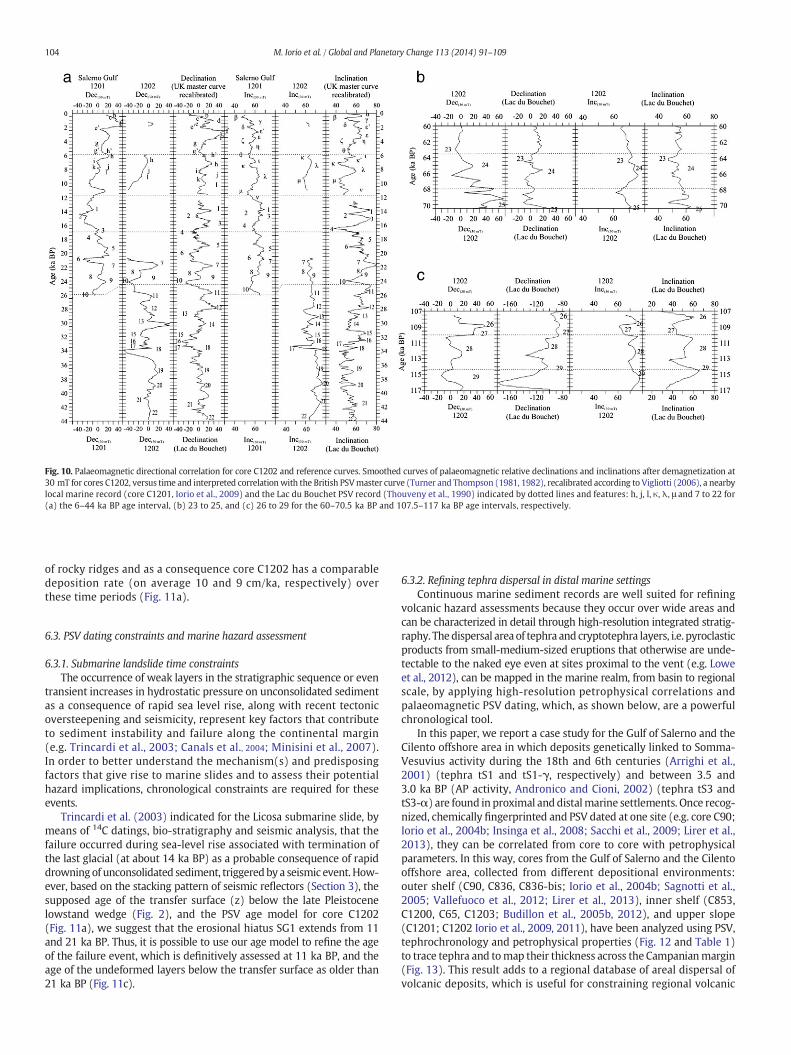
Fig. 10. Palaeomagnetic directional correlation for core C1202 and reference curves. Smoothed curves of palaeomagnetic relative declinations and inclinations after demagnetization at30 mT for cores C1202, versus time and interpreted correlationwith the British PSVmaster curve (Turner and Thompson (1981, 1982), recalibrated according to Vigliotti (2006), a nearbylocal marine record (core C1201, Iorio et al., 2009) and the Lac du Bouchet PSV record (Thouveny et al., 1990) indicated by dotted lines and features: h, j, l, κ, λ, μ and 7 to 22 for(a) the 6–44 ka BP age interval, (b) 23 to 25, and (c) 26 to 29 for the 60–70.5 ka BP and 107.5–117 ka BP age intervals, respectively.
104 M. Iorio et al. / Global and Planetary Change 113 (2014) 91–109
of rocky ridges and as a consequence core C1202 has a comparabledeposition rate (on average 10 and 9 cm/ka, respectively) overthese time periods (Fig. 11a).
6.3. PSV dating constraints and marine hazard assessment
6.3.1. Submarine landslide time constraintsThe occurrence of weak layers in the stratigraphic sequence or even
transient increases in hydrostatic pressure on unconsolidated sedimentas a consequence of rapid sea level rise, along with recent tectonicoversteepening and seismicity, represent key factors that contributeto sediment instability and failure along the continental margin(e.g. Trincardi et al., 2003; Canals et al., 2004; Minisini et al., 2007).In order to better understand the mechanism(s) and predisposingfactors that give rise to marine slides and to assess their potentialhazard implications, chronological constraints are required for theseevents.
Trincardi et al. (2003) indicated for the Licosa submarine slide, bymeans of 14C datings, bio-stratigraphy and seismic analysis, that thefailure occurred during sea-level rise associated with termination ofthe last glacial (at about 14 ka BP) as a probable consequence of rapiddrowningof unconsolidated sediment, triggeredby a seismic event.How-ever, based on the stacking pattern of seismic reflectors (Section 3), thesupposed age of the transfer surface (z) below the late Pleistocenelowstand wedge (Fig. 2), and the PSV age model for core C1202(Fig. 11a), we suggest that the erosional hiatus SG1 extends from 11and 21 ka BP. Thus, it is possible to use our age model to refine the ageof the failure event, which is definitively assessed at 11 ka BP, and theage of the undeformed layers below the transfer surface as older than21 ka BP (Fig. 11c).
6.3.2. Refining tephra dispersal in distal marine settingsContinuous marine sediment records are well suited for refining
volcanic hazard assessments because they occur over wide areas andcan be characterized in detail through high-resolution integrated stratig-raphy. Thedispersal area of tephra and cryptotephra layers, i.e. pyroclasticproducts from small-medium-sized eruptions that otherwise are unde-tectable to the naked eye even at sites proximal to the vent (e.g. Loweet al., 2012), can be mapped in the marine realm, from basin to regionalscale, by applying high-resolution petrophysical correlations andpalaeomagnetic PSV dating, which, as shown below, are a powerfulchronological tool.
In this paper, we report a case study for the Gulf of Salerno and theCilento offshore area in which deposits genetically linked to Somma-Vesuvius activity during the 18th and 6th centuries (Arrighi et al.,2001) (tephra tS1 and tS1-γ, respectively) and between 3.5 and3.0 ka BP (AP activity, Andronico and Cioni, 2002) (tephra tS3 andtS3-α) are found in proximal and distalmarine settlements. Once recog-nized, chemically fingerprinted and PSV dated at one site (e.g. core C90;Iorio et al., 2004b; Insinga et al., 2008; Sacchi et al., 2009; Lirer et al.,2013), they can be correlated from core to core with petrophysicalparameters. In this way, cores from the Gulf of Salerno and the Cilentooffshore area, collected from different depositional environments:outer shelf (C90, C836, C836-bis; Iorio et al., 2004b; Sagnotti et al.,2005; Vallefuoco et al., 2012; Lirer et al., 2013), inner shelf (C853,C1200, C65, C1203; Budillon et al., 2005b, 2012), and upper slope(C1201; C1202 Iorio et al., 2009, 2011), have been analyzed using PSV,tephrochronology and petrophysical properties (Fig. 12 and Table 1)to trace tephra and tomap their thickness across the Campanianmargin(Fig. 13). This result adds to a regional database of areal dispersal ofvolcanic deposits, which is useful for constraining regional volcanic
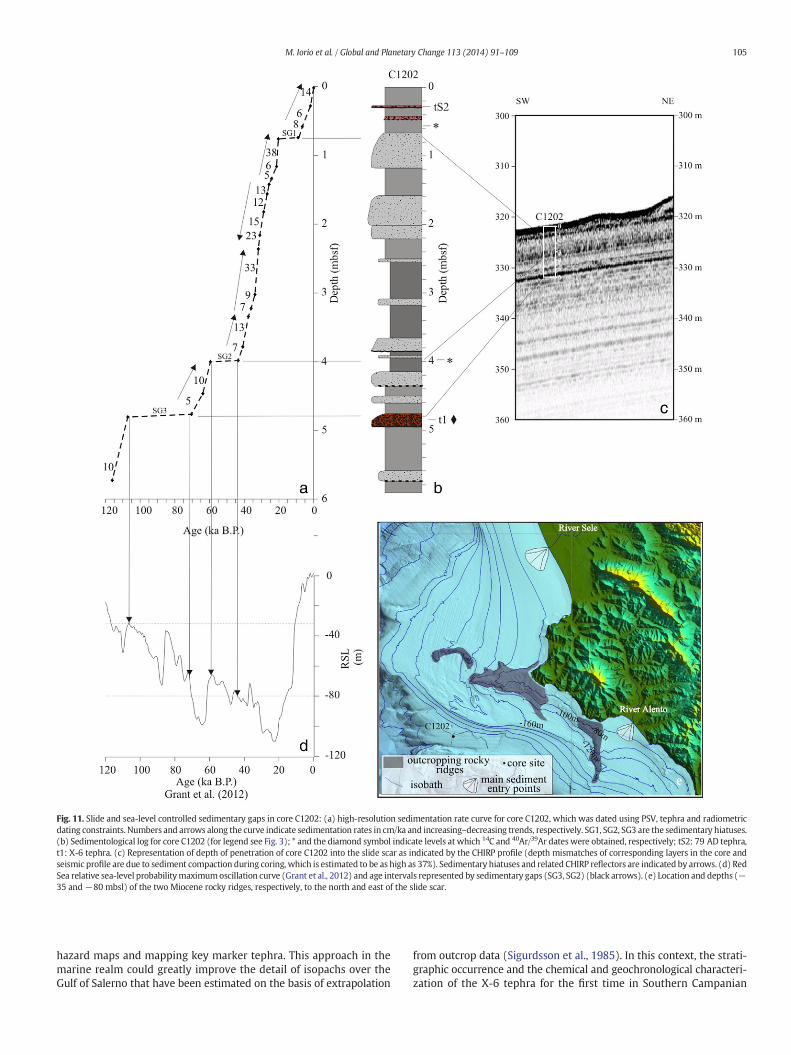
Fig. 11. Slide and sea-level controlled sedimentary gaps in core C1202: (a) high-resolution sedimentation rate curve for core C1202, which was dated using PSV, tephra and radiometricdating constraints. Numbers and arrows along the curve indicate sedimentation rates in cm/ka and increasing–decreasing trends, respectively. SG1, SG2, SG3 are the sedimentary hiatuses.(b) Sedimentological log for core C1202 (for legend see Fig. 3); * and the diamond symbol indicate levels at which 14C and 40Ar/39Ar dates were obtained, respectively; tS2: 79 AD tephra,t1: X-6 tephra. (c) Representation of depth of penetration of core C1202 into the slide scar as indicated by the CHIRP profile (depth mismatches of corresponding layers in the core andseismic profile are due to sediment compaction during coring, which is estimated to be as high as 37%). Sedimentary hiatuses and related CHIRP reflectors are indicated by arrows. (d) RedSea relative sea-level probabilitymaximumoscillation curve (Grant et al., 2012) and age intervals represented by sedimentary gaps (SG3, SG2) (black arrows). (e) Location and depths (−35 and−80 mbsl) of the two Miocene rocky ridges, respectively, to the north and east of the slide scar.
105M. Iorio et al. / Global and Planetary Change 113 (2014) 91–109
hazard maps and mapping key marker tephra. This approach in themarine realm could greatly improve the detail of isopachs over theGulf of Salerno that have been estimated on the basis of extrapolation
from outcrop data (Sigurdsson et al., 1985). In this context, the strati-graphic occurrence and the chemical and geochronological characteri-zation of the X-6 tephra for the first time in Southern Campanian
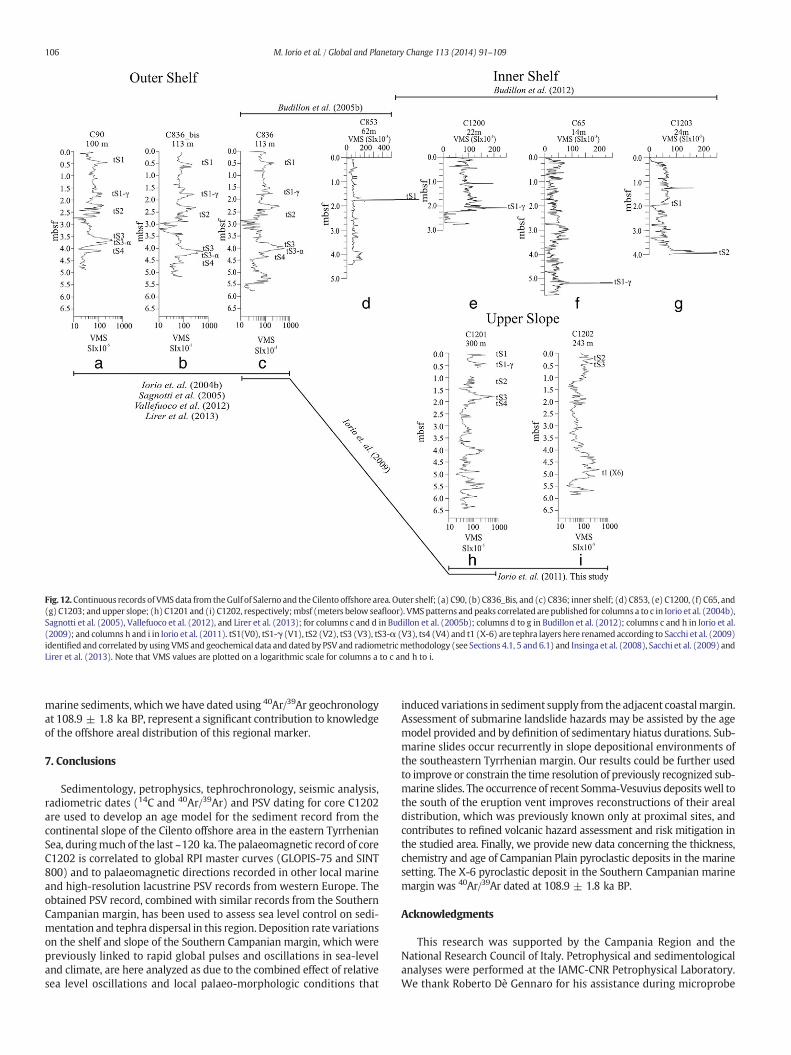
Fig. 12.Continuous records of VMSdata from theGulf of Salerno and theCilento offshore area. Outer shelf; (a) C90, (b) C836_Bis, and (c) C836; inner shelf; (d) C853, (e) C1200, (f) C65, and(g) C1203; andupper slope; (h) C1201 and (i) C1202, respectively;mbsf (meters below seafloor). VMSpatterns and peaks correlated are published for columns a to c in Iorio et al. (2004b),Sagnotti et al. (2005), Vallefuoco et al. (2012), and Lirer et al. (2013); for columns c and d in Budillon et al. (2005b); columns d to g in Budillon et al. (2012); columns c and h in Iorio et al.(2009); and columns h and i in Iorio et al. (2011). tS1(V0), tS1-γ (V1), tS2 (V2), tS3 (V3), tS3-α (V3), ts4 (V4) and t1 (X-6) are tephra layers here renamed according to Sacchi et al. (2009)identified and correlated by using VMS and geochemical data and dated by PSV and radiometricmethodology (see Sections 4.1, 5 and 6.1) and Insinga et al. (2008), Sacchi et al. (2009) andLirer et al. (2013). Note that VMS values are plotted on a logarithmic scale for columns a to c and h to i.
106 M. Iorio et al. / Global and Planetary Change 113 (2014) 91–109
marine sediments, whichwe have dated using 40Ar/39Ar geochronologyat 108.9 ± 1.8 ka BP, represent a significant contribution to knowledgeof the offshore areal distribution of this regional marker.
7. Conclusions
Sedimentology, petrophysics, tephrochronology, seismic analysis,radiometric dates (14C and 40Ar/39Ar) and PSV dating for core C1202are used to develop an age model for the sediment record from thecontinental slope of the Cilento offshore area in the eastern TyrrhenianSea, duringmuch of the last ~120 ka. The palaeomagnetic record of coreC1202 is correlated to global RPI master curves (GLOPIS-75 and SINT800) and to palaeomagnetic directions recorded in other local marineand high-resolution lacustrine PSV records from western Europe. Theobtained PSV record, combined with similar records from the SouthernCampanian margin, has been used to assess sea level control on sedi-mentation and tephra dispersal in this region. Deposition rate variationson the shelf and slope of the Southern Campanian margin, which werepreviously linked to rapid global pulses and oscillations in sea-leveland climate, are here analyzed as due to the combined effect of relativesea level oscillations and local palaeo-morphologic conditions that
induced variations in sediment supply from the adjacent coastalmargin.Assessment of submarine landslide hazards may be assisted by the agemodel provided and by definition of sedimentary hiatus durations. Sub-marine slides occur recurrently in slope depositional environments ofthe southeastern Tyrrhenian margin. Our results could be further usedto improve or constrain the time resolution of previously recognized sub-marine slides. The occurrence of recent Somma-Vesuvius depositswell tothe south of the eruption vent improves reconstructions of their arealdistribution, which was previously known only at proximal sites, andcontributes to refined volcanic hazard assessment and risk mitigation inthe studied area. Finally, we provide new data concerning the thickness,chemistry and age of Campanian Plain pyroclastic deposits in the marinesetting. The X-6 pyroclastic deposit in the Southern Campanian marinemargin was 40Ar/39Ar dated at 108.9 ± 1.8 ka BP.
Acknowledgments
This research was supported by the Campania Region and theNational Research Council of Italy. Petrophysical and sedimentologicalanalyses were performed at the IAMC-CNR Petrophysical Laboratory.We thank Roberto Dè Gennaro for his assistance during microprobe
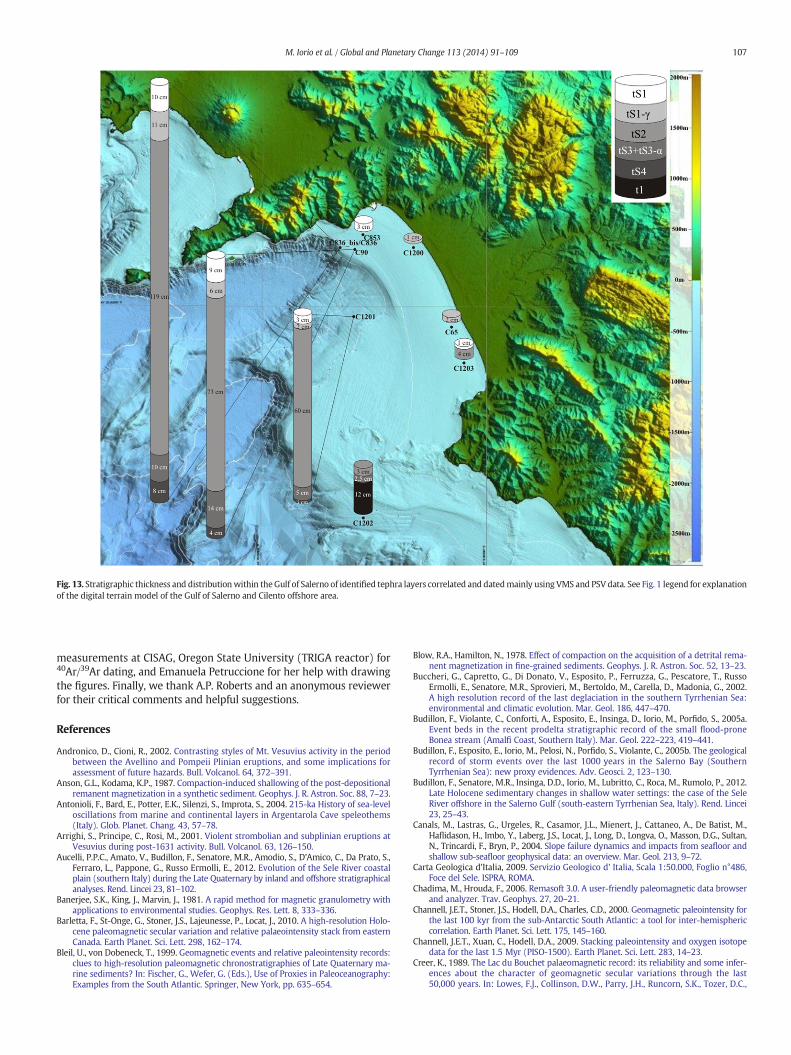
Fig. 13. Stratigraphic thickness and distributionwithin theGulf of Salerno of identified tephra layers correlated and datedmainly using VMS and PSV data. See Fig. 1 legend for explanationof the digital terrain model of the Gulf of Salerno and Cilento offshore area.
107M. Iorio et al. / Global and Planetary Change 113 (2014) 91–109
measurements at CISAG, Oregon State University (TRIGA reactor) for40Ar/39Ar dating, and Emanuela Petruccione for her help with drawingthe figures. Finally, we thank A.P. Roberts and an anonymous reviewerfor their critical comments and helpful suggestions.
References
Andronico, D., Cioni, R., 2002. Contrasting styles of Mt. Vesuvius activity in the periodbetween the Avellino and Pompeii Plinian eruptions, and some implications forassessment of future hazards. Bull. Volcanol. 64, 372–391.
Anson, G.L., Kodama, K.P., 1987. Compaction-induced shallowing of the post-depositionalremanent magnetization in a synthetic sediment. Geophys. J. R. Astron. Soc. 88, 7–23.
Antonioli, F., Bard, E., Potter, E.K., Silenzi, S., Improta, S., 2004. 215-ka History of sea-leveloscillations from marine and continental layers in Argentarola Cave speleothems(Italy). Glob. Planet. Chang. 43, 57–78.
Arrighi, S., Principe, C., Rosi, M., 2001. Violent strombolian and subplinian eruptions atVesuvius during post-1631 activity. Bull. Volcanol. 63, 126–150.
Aucelli, P.P.C., Amato, V., Budillon, F., Senatore, M.R., Amodio, S., D'Amico, C., Da Prato, S.,Ferraro, L., Pappone, G., Russo Ermolli, E., 2012. Evolution of the Sele River coastalplain (southern Italy) during the Late Quaternary by inland and offshore stratigraphicalanalyses. Rend. Lincei 23, 81–102.
Banerjee, S.K., King, J., Marvin, J., 1981. A rapid method for magnetic granulometry withapplications to environmental studies. Geophys. Res. Lett. 8, 333–336.
Barletta, F., St-Onge, G., Stoner, J.S., Lajeunesse, P., Locat, J., 2010. A high-resolution Holo-cene paleomagnetic secular variation and relative palaeointensity stack from easternCanada. Earth Planet. Sci. Lett. 298, 162–174.
Bleil, U., von Dobeneck, T., 1999. Geomagnetic events and relative paleointensity records:clues to high-resolution paleomagnetic chronostratigraphies of Late Quaternary ma-rine sediments? In: Fischer, G., Wefer, G. (Eds.), Use of Proxies in Paleoceanography:Examples from the South Atlantic. Springer, New York, pp. 635–654.
Blow, R.A., Hamilton, N., 1978. Effect of compaction on the acquisition of a detrital rema-nent magnetization in fine-grained sediments. Geophys. J. R. Astron. Soc. 52, 13–23.
Buccheri, G., Capretto, G., Di Donato, V., Esposito, P., Ferruzza, G., Pescatore, T., RussoErmolli, E., Senatore, M.R., Sprovieri, M., Bertoldo, M., Carella, D., Madonia, G., 2002.A high resolution record of the last deglaciation in the southern Tyrrhenian Sea:environmental and climatic evolution. Mar. Geol. 186, 447–470.
Budillon, F., Violante, C., Conforti, A., Esposito, E., Insinga, D., Iorio, M., Porfido, S., 2005a.Event beds in the recent prodelta stratigraphic record of the small flood-proneBonea stream (Amalfi Coast, Southern Italy). Mar. Geol. 222–223, 419–441.
Budillon, F., Esposito, E., Iorio, M., Pelosi, N., Porfido, S., Violante, C., 2005b. The geologicalrecord of storm events over the last 1000 years in the Salerno Bay (SouthernTyrrhenian Sea): new proxy evidences. Adv. Geosci. 2, 123–130.
Budillon, F., Senatore, M.R., Insinga, D.D., Iorio, M., Lubritto, C., Roca, M., Rumolo, P., 2012.Late Holocene sedimentary changes in shallow water settings: the case of the SeleRiver offshore in the Salerno Gulf (south-eastern Tyrrhenian Sea, Italy). Rend. Lincei23, 25–43.
Canals, M., Lastras, G., Urgeles, R., Casamor, J.L., Mienert, J., Cattaneo, A., De Batist, M.,Haflidason, H., Imbo, Y., Laberg, J.S., Locat, J., Long, D., Longva, O., Masson, D.G., Sultan,N., Trincardi, F., Bryn, P., 2004. Slope failure dynamics and impacts from seafloor andshallow sub-seafloor geophysical data: an overview. Mar. Geol. 213, 9–72.
Carta Geologica d'Italia, 2009. Servizio Geologico d' Italia, Scala 1:50.000, Foglio n°486,Foce del Sele. ISPRA, ROMA.
Chadima, M., Hrouda, F., 2006. Remasoft 3.0. A user-friendly paleomagnetic data browserand analyzer. Trav. Geophys. 27, 20–21.
Channell, J.E.T., Stoner, J.S., Hodell, D.A., Charles, C.D., 2000. Geomagnetic paleointensity forthe last 100 kyr from the sub-Antarctic South Atlantic: a tool for inter-hemisphericcorrelation. Earth Planet. Sci. Lett. 175, 145–160.
Channell, J.E.T., Xuan, C., Hodell, D.A., 2009. Stacking paleointensity and oxygen isotopedata for the last 1.5 Myr (PISO-1500). Earth Planet. Sci. Lett. 283, 14–23.
Creer, K., 1989. The Lac du Bouchet palaeomagnetic record: its reliability and some infer-ences about the character of geomagnetic secular variations through the last50,000 years. In: Lowes, F.J., Collinson, D.W., Parry, J.H., Runcorn, S.K., Tozer, D.C.,
108 M. Iorio et al. / Global and Planetary Change 113 (2014) 91–109
Soward, A.M. (Eds.), Geomagnetism and Palaeomagnetism. NATO ASI Ser. C. Mathe-matical and Physical Sciences, 261. Kluwer Academic, pp. 71–89.
Dankers, P., 1981. Relationship between median destructive field and remanent coerciveforces for dispersed natural magnetite, titanomagnetite and hematite. Geophys. J. R.Astron. Soc. 64, 447–461.
De Vivo, B., Rolandi, G., Gans, P.B., Calvert, A., Bohrson, W.A., Spera, F.J., Belkin, H.E., 2001.New constraints on the pyroclastic eruptive history of the Campanian volcanic Plain(Italy). Mineral. Petrol. 73, 47–65.
Di Vito, M.A., Sulpizio, R., Zanchetta, G., D'Orazio, M., 2008. The late Pleistocene pyroclasticdeposits of the Campanian Plain: new insights into the explosive activity of Neapolitanvolcanoes. J. Volcanol. Geotherm. Res. 177, 19–48.
Dunlop, D.J., Özdemir, Ö., 1997. Rock Magnetism, Fundamentals and Frontiers. CambridgeUniv. Press, Cambridge, U.K. http://dx.doi.org/10.1017/CBO9780511612794 (596 pp.).
Evans, M.E., Heller, F., 2003. Environmental Magnetism: Principles and Applications ofEnviromagnetics. Academic Press (299 pp.).
Fedele, L., Scarpati, C., Lanphere, M., Melluso, L., Morra, V., Perrotta, A., Ricci, G., 2008. TheBreccia Museo formation, Campi Flegrei, southern Italy: geochronology,chemostratigraphy and relationship with the Campanian Ignimbrite eruption. Bull.Volcanol. 70, 1189–1219.
Giaccio, B., Nomade, S., Wulf, S., Isaia, R., Sottili, G., Cavuoto, G., Galli, P., Messina, P.,Sposato, A., Sulpizio, R., Zanchetta, G., 2012. The late MIS 5 Mediterranean tephramarkers: a reappraisal from peninsular Italy terrestrial records. Quat. Sci. Rev. 56,31–45.
Giosan, L., Flood, R., Aller, R.C., 2002. Paleoceanographic significance of sediment color onwestern North Atlantic drifts: I. Origin of color. Mar. Geol. 189 (1–2), 25–41.
Grant, K.M., Rohling, E.J., Bar-Matthews, M., Ayalon, A., Medina-Elizalde, M., BronkRamsey, C., Satow, C., Roberts, A.P., 2012. Rapid coupling between ice volume andpolar temperature over the past 150,000 years. Nature 491, 744–747.
Guyodo, Y., Valet, J.P., 1999. Global changes in intensity in the Earth's magnetic fieldduring the past 800 kyr. Nature 399, 249–252.
Hagstrum, J.T., Champion, D.E., 2002. A Holocene paleosecular variation record from 14Cdated volcanic rocks in western North America. J. Geophys. Res. 107, 2025. http://dx.doi.org/10.1029/2001JB000524.
Hays, J.D., Imbrie, J., Shackleton, N.J., 1976. Variations in the Earth's orbit: pacemaker ofthe ice ages. Science 194, 1121–1132.
Helmke, J.P., Schulz,M., Bauch, H.A., 2002. Sediment-color record from the northeast Atlanticreveals patterns of millennial-scale climate variability during the past 500,000 years.Quat. Res. 57, 49–57.
Hoefs, J., 1987. Stable Isotope Geochemistry, Third edition. Springer-Verlag, Berlin (296 pp.).Hunt, D., Tucker, M., 1992. Stranded parasequences and the forced regressive wedge
systems tract: deposition during base level fall. Sediment. Geol. 81, 1–9.Hyodo, M., 1984. Possibility of reconstruction of the past geomagnetic field from
homogeneous sediments. J. Geomagn. Geoelectr. 36, 45–62.Insinga, D., Molisso, F., Lubritto, C., Sacchi, M., Passariello, I., Morra, V., 2008. The proximal
marine record of Somma-Vesuvius volcanic activity, in the Naples and Salerno Bays,Eastern Tyrrhenian Sea, during the last 3 kyrs. J. Volcanol. Geotherm. Res. 177,170–186.
Iorio, M.,Wolf-Welling, T., Moerz, T., 2004a. Antarctic sediment drifts and Plio-Pleistoceneorbital periodicities (ODP Sites 1095, 1096, and 1101). In: D'Argenio, B., Fischer, A.G.,Premoli Silva, I., Weissert, H., Ferreri, V. (Eds.), Cyclostratigraphy: An Essay ofApproaches and Case Histories. Society for Sedimentary Geology, SEPM, SpecialPublication, 81, pp. 231–244.
Iorio, M., Sagnotti, L., Angelino, A., Budillon, F., D'Argenio, B., Dinarès-Turell, J., Macrì, P.,Marsella, E., 2004b. High-resolution physical properties and palaeomagnetic studyof Late-Holocene shelf sediments, Salerno Gulf, Tyrrhenian Sea. The Holocene 14,426–435.
Iorio, M., Liddicoat, J., Budillon, F., Tiano, P., Incoronato, A., Coe, R., Marsella, E., 2009.Palaeomagnetic secular variation time constraint on Late Neogene geological eventsin slope sediment from the Eastern Tyrrhenian Sea. SEPM Spec. Publ. 92, 233–246.
Iorio, M., Liddicoat, J., Budillon, F., Coe, R., Incoronato, A., Insinga, D., Lubritto, C., Tiano, P.,2011. Paleomagnetism of Late Quaternary sediment from the Eastern Tyrrhenian Seaas a chronologic tool for marine geology investigations. In: Brugnoli, E., Cavarretta, G.,Mazzola, S., Trincardi, F., Ravaioli, M., Santoleri, R. (Eds.), Marine Research at CNR,Volume DTA/06-2011. National Research Council of Italy, pp. 741–755.
Keller, J., Ryan, W.B.F., Ninkovich, D., Altherr, R., 1978. Explosive volcanic activity in theMediterranean over the past 200,000 y as recorded in deep-sea sediments. Geol.Soc. Am. Bull. 89, 591–604.
King, R.F., 1955. The remanent magnetism of artificially deposited sediments. Mon. Not. R.Astron. Soc. 7, 115–134.
King, J.W., Banerjee, S.K., Marvin, J., 1983. A new rock-magnetic approach to selectingsediments for geomagnetic paleointensity studies: application to paleointensity forthe last 4000 years. J. Geophys. Res. 88, 5911–5921.
Kirschvink, J.L., 1980. The least squares line and plane and the analysis of palaeomagneticdata. Geophys. J. R. Astron. Soc. 62, 669–718.
Kraml, M., 1997. Laser-40Ar/39Ar-datierungen an distalen marinen tephren des jung-Quartären Mediterranen vulkanismus (Ionisches Meer, METEOR-Fahrt 25/4). (Ph.D.thesis) Albert-Ludwigs-Universiteit Freiburg (216 pp.).
Laj, C., Kissel, C., Mazaud, A., Channell, J.E.T., Beer, J., 2000. North Atlantic palaeointensitystack since 75 ka (NAPIS-75) and the duration of the Laschamp event. Philos. Trans.R. Soc. Lond. A 358, 1009–1025.
Laj, C., Kissel, C., Beer, J., 2004. High resolution global paleointensity stack since 75 kyr(GLOPIS-75) calibrated to absolute values. In: Channell, J.E.T., Kent, D.V., Lowrie, W.,Meert, J.G. (Eds.), Timescales of the Paleomagnetic Field. Geophysical Monograph,145. American Geophysical Union, Washington, D.C., pp. 255–265.
Le Bas, M.J., Le Maitre, R.W., Streckeisen, A., Zanettin, P., 1986. A chemical classification ofvolcanic rocks based on the total alkali–silica diagram. J. Petrol. 27, 745–750.
Leslie, B.W., Lund, S.P., Hammond, D.E., 1990a. Rock magnetic evidence for the dissolutionand authigenic growth of magnetic minerals within anoxic marine sediments of theCalifornia continental borderland. J. Geophys. Res. 95, 4437–4452.
Leslie, B.W., Hammond, D.E., Berelson, W.M., Lund, S.P., 1990b. Diagenesis in anoxicsediments from the California continental borderland and its influence on iron, sulfur,and magnetite behavior. J. Geophys. Res. 95, 4453–4470.
Levi, S., Banerjee, S.K., 1976. On the possibility of obtaining palaeointensities from lakesediments. Earth Planet. Sci. Lett. 29, 219–226.
Lirer, L., Pescatore, T., Booth, B., Walker, G.P.L., 1973. Two Plinian pumice-fall depositsfrom Somma-Vesuvius, Italy. Geol. Soc. Am. Bull. 84, 759–772.
Lirer, F., Sprovieri, M., Ferraro, L., Vallefuoco, M., Capotondi, L., Cascella, A., Insinga, D.D.,Pelosi, N., Tamburrino, S., Lubritto, C., Petrosino, P., 2013. Integrated stratigraphy forthe Late Quaternary in the eastern Tyrrhenian Sea. Quat. Int. 292, 71–85.
Lisé-Provonost, A., St-Onge, G., Brachfeld, S., Barletta, F., Darby, D., 2009. Paleomagneticconstraints on the Holocene stratigraphy of the Arctic Alaskan margin. Glob. Planet.Chang. 68, 85–99.
Liu, Q., Roberts, A.P., Larrasoaña, J.C., Banerjee, S.K., Guyodo, Y., Tauxe, L., Oldfield, F., 2012.Environmental magnetism: principles and applications. Rev. Geophys. 50, RG4002.http://dx.doi.org/10.1029/2012RG000393.
Lowe, J., Barton, N., Blockley, S., Ramsey, C.B., Cullen, V.L., Davies, W., Gamble, C., Grant, K.,Hardiman, M., Housley, R., Lane, C.S., Lee, S., Lewis, M., MacLeod, A., Menzies, M.,Müller, W., Pollard, M., Price, C., Roberts, A.P., Rohling, E.J., Satow, C., Smith, W.C.,Stringer, C.B., Tomlinson, E.L., White, D., Albert, P., Arienzo, I., Barker, G., Boric, D.,Carandente, A., Civetta, L., Ferrier, C., Guadelli, J., Karkanas, P., Koumouzelis, M.,Müller, U.C., Orsi, G., Pross, J., Rosi, M., Shalamanov-Korobar, L., Sirakov, N.,Tzedakis, P.C., 2012. Volcanic ash layers illuminate the resilience of Neanderthalsand early modern humans to natural hazards. Proc. Natl. Acad. Sci. U. S. A. 109,13532–13537.
Maher, B., 1988.Magnetic properties of some synthetic submicronmagnetites. Geophys. J.94, 83–86.
Marciano, R., Munno, R., Petrosino, P., Santangelo, N., Santo, A., Villa, I., 2008. Late Quater-nary tephra layers along the Cilento coastline (southern Italy). J. Volcanol. Geotherm.Res. 177, 227–243.
Miao, X., Mason, J., Swinehart, J., Loope, D., Hanson, P., Goble, R., Liu, X., 2007. A10,000 year record of dune activity, dust storms, and severe drought in the centralGreat Plains. Geology 35, 119–122.
Minisini, D., Trincardi, F., Asioli, A., Canu, M., Foglini, F., 2007. Morphologic variability ofexposedmass-transport deposits on the eastern slope of the Gela Basin (Sicily channel).Basin Res. 19, 217–240.
Moros, M., Endlet, R., Lackschewitz, K.S., Wallrabe-Adams, H.J., Mienert, J., Lemke, W.,1997. Physical properties of Reykjanes Ridge sediments and their linkage to high-resolution Greenland Sheet Ice Project 2 ice core data. Paleoceanography 12,687–695.
Munno, R., Petrosino, P., 2007. The late Quaternary tephrostratigraphical record of the SanGregorio Magno basin (Southern Italy). J. Quat. Sci. 22, 247–266.
Ortiz, J.D., Rack, F.R., 1999. Non-invasive sedimentmonitoringmethods. In: Abrantes, F., Mix,A. (Eds.), Reconstructing Ocean History: A Window into the Future. Kluwer/Plenum,New York, pp. 343–380.
Paterne, M., Guichard, F., Duplessy, J.C., Siani, G., Sulpizio, R., Labeyrie, J., 2008. A 90,000–200,000 yearsmarine tephra record of Italian volcanic activity in the Central Mediterra-nean Sea. J. Volcanol. Geotherm. Res. 177, 187–196.
Roberts, A.P., Winklhofer, M., 2004.Why are geomagnetic excursions not always recordedin sediments? Constraints from post-depositional remanent magnetization lock-inmodelling. Earth Planet. Sci. Lett. 227, 345–359.
Roberts, A.P., Chang, L., Heslop, D., Florindo, F., Larrasoaña, J.C., 2012. Searching for single do-main magnetite in the ‘pseudo-single-domain’ sedimentary haystack: implications ofbiogenic magnetite preservation for sediment magnetism and relative paleointensitydeterminations. J. Geophys. Res. 117, B08104. http://dx.doi.org/10.1029/2012JB009412.
Roberts, A.P., Tauxe, L., Heslop, D., 2013. Magnetic paleointensity stratigraphy and high-resolution Quaternary geochronology: successes and future challenges. Quat. Sci. Rev.61, 1–16.
Robinson, A., Spadini, G., Cloetingh, S., Rudat, J., 1995. Stratigraphic evolution of the BlackSea: inferences from basin modelling. Mar. Pet. Geol. 12, 821–835.
Rolandi, G., Bellucci, F., Heizler, M.T., Belkin, H.E., De Vivo, B., 2003. Tectonic controls on thegenesis of ignimbrites from the Campanian Volcanic Zone, southern Italy. Mineral.Petrol. 79, 3–31.
Sacchi, M., Molisso, F., Violante, C., Esposito, E., Insinga, D., Lubritto, C., Porfido, S., Tóth, T.,2009. Insights into flood-dominated fan-deltas: very high-resolution seismic examplesoff the Amalfi cliffed coasts, Eastern Tyrrhenian Sea. Geol. Soc. Lond. Spec. Publ. 322,33–71.
Sagnotti, L., Budillon, F., Dinarès-Turell, J., Iorio, M., Macrì, P., 2005. Evidence for a variablepaleomagnetic lock-in depth in the Holocene sequence from the Salerno Gulf (Italy):implications for “high-resolution” paleomagnetic dating. Geochem. Geophys.Geosyst. 6, Q11013. http://dx.doi.org/10.1029/2005GC001043.
Sagnotti, L., Smedile, A., De Martini, P.M., Pantosti, D., Speranza, F., Winkler, A., Del Carlo,P., Bellucci, L.G., Gasperini, L., 2011. A continuous palaeosecular variation record ofthe last four millennia from the Augusta Bay (Sicily, Italy). Geophys. J. Int. 184,191–202.
Siani, G., Paterne, M., Arnold, M., Bard, E., Meptivier, B., Tisnerat, N., Bassinot, F., 2000.Radiocarbon reservoir ages in the Mediterranean Sea and Black Sea coastal waters.Radiocarbon 42, 271–280.
Sigurdsson, H., Carey, S., Cornell, W., Pescatore, T., 1985. The eruption of Vesuvius in A.D.79. Natl. Geogr. Res. 1, 332–387.
Snowball, I., Zillén, L., Ojala, A., Saarinen, T., Sandgren, P., 2007. FENNOSTACK andFENNORPIS: varve dated Holocene palaeomagnetic secular variation and relativepalaeointensity stacks for Fennoscandia. Earth Planet. Sci. Lett. 255, 106–116.
109M. Iorio et al. / Global and Planetary Change 113 (2014) 91–109
Stoner, J.S., Laj, C., Channell, J.E.T., Kissel, C., 2002. South Atlantic and North Atlanticgeomagnetic paleointensity stacks (0–80 ka): implications for inter hemisphericcorrelation. Quat. Sci. Rev. 21, 1141–1151.
St-Onge, G., Stoner, J.S., Hillaire-Marcel, C., 2003. Holocene paleomagnetic records from theSt. Lawrence Estuary, eastern Canada: centennial- to millennial-scale geomagneticmodulation of cosmogenic isotopes. Earth Planet. Sci. Lett. 209, 113–130.
Suganuma, Y., Okuno, J., Heslop, D., Roberts, A.P., Yamazaki, T., Yokoyama, Y., 2011. Post-depositional remanent magnetization lock-in for marine sediments deduced from10Be and paleomagnetic records through the Matuyama–Brunhes boundary. EarthPlanet. Sci. Lett. 311, 39–52.
Sun, S., McDonough,W.F., 1989. Chemical and isotopic systematics of oceanic basalts: impli-cations for mantle composition and processes. Geol. Soc. Lond. Spec. Publ. 42, 313–345.
Tauxe, L., 1993. Sedimentary records of relative palaeointensity of the geomagnetic field:theory and practice. Rev. Geophys. 31, 319–354.
Tauxe, L., Yamazaki, T., 2007. Paleointensities. In: Kono, M. (Ed.), Treatise on Geophysics.Geomagnetism, vol. 5. Elsevier, pp. 509–563.
Terrasi, F., Rogalla, D., De Cesare, N., D'Onofrio, A., Lubritto, C., Marzaioli, F., Passariello, I.,Rubino, M., Sabbarese, C., Casa, G., Calmieri, A., Gialanella, L., Imbriani, G., Roca, V.,Romano, M., Sundquist, M., Loger, R., 2007. A new AMS facility in Caserta/Italy.Nucl. Inst. Methods Phys. Res. B 259, 14–17.
Thouveny, N., 1987. Variations of the relative paleointensity of the geomagneticfield in western Europe in the interval 25–10 kyr BP as deduced from analysesof lake sediments. Geophys. J. R. Astron. Soc. 91, 123–142.
Thouveny, N., Creer, K.M., Blunk, I., 1990. Extension of the Lac du Bouchet paleomagneticrecord over the last 120,000 years. Earth Planet. Sci. Lett. 97, 140–161.
Trincardi, F., Field, M., 1991. Geometry, lateral variation, and preservation of downlappingregressive shelf deposits: eastern Tyrrhenian Sea margin, Italy. J. Sediment. Petrol. 61(5), 775–790.
Trincardi, F., Field, M., 1992. Collapse and flow of lowstand shelf-margin deposits: anexample from the eastern Tyrrhenian Sea, Italy. Mar. Geol. 105, 77–94.
Trincardi, F., Cattaneo, A., Correggiari, A., Mongardi, S., Breda, A., Asioli, A., 2003. Submarineslides during relative sea level rise: two examples from the eastern Tyrrhenian margin.In: Locat, J., Mienert, J. (Eds.), Submarine Mass Movements and their Consequences.Kluwer Academic Publisher, Amsterdam, pp. 469–478.
Tucker, M., 1988. Techniques in Sedimentology. Blackwell Scientific Publications, Oxford(394 pp.).
Turner, G.M., Thompson, R., 1981. Lake sediment record of the geomagnetic secularvariation in Britain during the Holocene times. Geophys. J. R. Astron. Soc. 65,703–725.
Turner, G.M., Thompson, R., 1982. The transformation of the British geomagnetic secularvariation record for Holocene times. Geophys. J. R. Astron. Soc. 70, 789–792.
Vallefuoco, M., Lirer, F., Ferraro, L., Pelosi, N., Capotondi, L., Sprovieri, M., Incarbona, A., 2012.Climatic variability and anthropogenic signatures in the Gulf of Salerno (southern-eastern Tyrrhenian Sea) during the last half millennium. Rend. Lincei 23, 13–23.
Verosub, K.L., 1977. Depositional and post-depositional processes in the magnetization ofsediments. Rev. Geophys. Space Phys. 15, 129–143.
Verosub, K.L., 2000. Paleomagnetic dating in Quaternary geochronology: methods andapplications. In: Noller, J., Sower, J., Lettis, W.R. (Eds.), Reference Shelf, 4. AmericanGeophysical Union, Washington D.C., pp. 339–356.
Vigliotti, L., 2006. Secular variation record of the Earth's magnetic field in Italy during theHolocene: constraints for the construction of a master curve. Geophys. J. Int. 165,414–429.
Vogel, J.S., Southon, J.R., Nelson, D.E., Brown, T.A., 1984. Performance of catalyticallycondensed carbon for use in accelerator mass spectrometry. Nucl. Inst. MethodsPhys. Res. B 5, 289–293.
Weninger, B., Jöris, O., Danzeglocke, U., 2008. CalPal-2007. Cologne Radiocarbon Calibration& Palaeoclimate Research Package. http://www.calpal.de.
Wulf, S., Brauer, A., Mingram, J., Zolitschka, B., Negendank, J.F.W., 2007. Distal tephras inthe sediments of Monticchio maar lakes. In: Principe, C. (Ed.), La Geologia delMonte Vulture. Dipartimento Ambiente, Territorio e Politiche della Sostenibilità,Regione Basilicata, pp. 105–122.
Wulf, S., Keller, J., Paterne, M., Mingram, J., Lauterbach, S., Sottili, G., Giaccio, B., Albert, P.G.,Satow, C., Tomlinson, E.L., Brauer, A., Opitz, S., Viccaro, M., 2012. The 100–133 karecord of Italian explosive volcanism and revised tephrochronology of Lago Grandedi Monticchio. Quat. Sci. Rev. 58, 104–123.
Zijderveld, J.D.A., 1967. A.C. demagnetization of rocks: analysis of results. In: Collinson,D.W., Creer, K.M., Runcorn, S.K. (Eds.), Methods in Paleomagnetism. Elsevier,Amsterdam, New York, pp. 254–286.
Copyright © 2022 FDOKUMEN