HAZARD MITIGATION PLAN - UNM Health Sciences Center
282
HAZARD MITIGATION PLAN NOVEMBER 2015
-
Upload
khangminh22 -
Category
Documents
-
view
0 -
download
0
Transcript of HAZARD MITIGATION PLAN - UNM Health Sciences Center

HAZARD MITIGATION PLAN
NOVEMBER 2015
November 2015
i
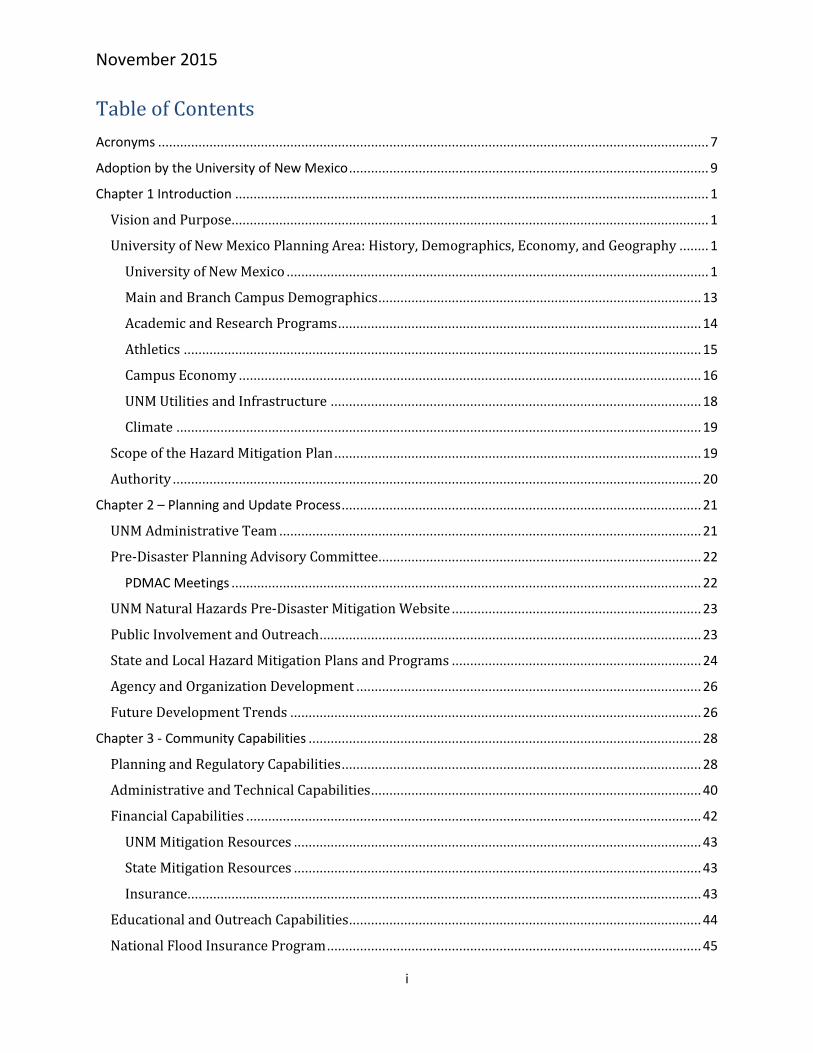
Table of Contents
Acronyms ...................................................................................................................................................... 7
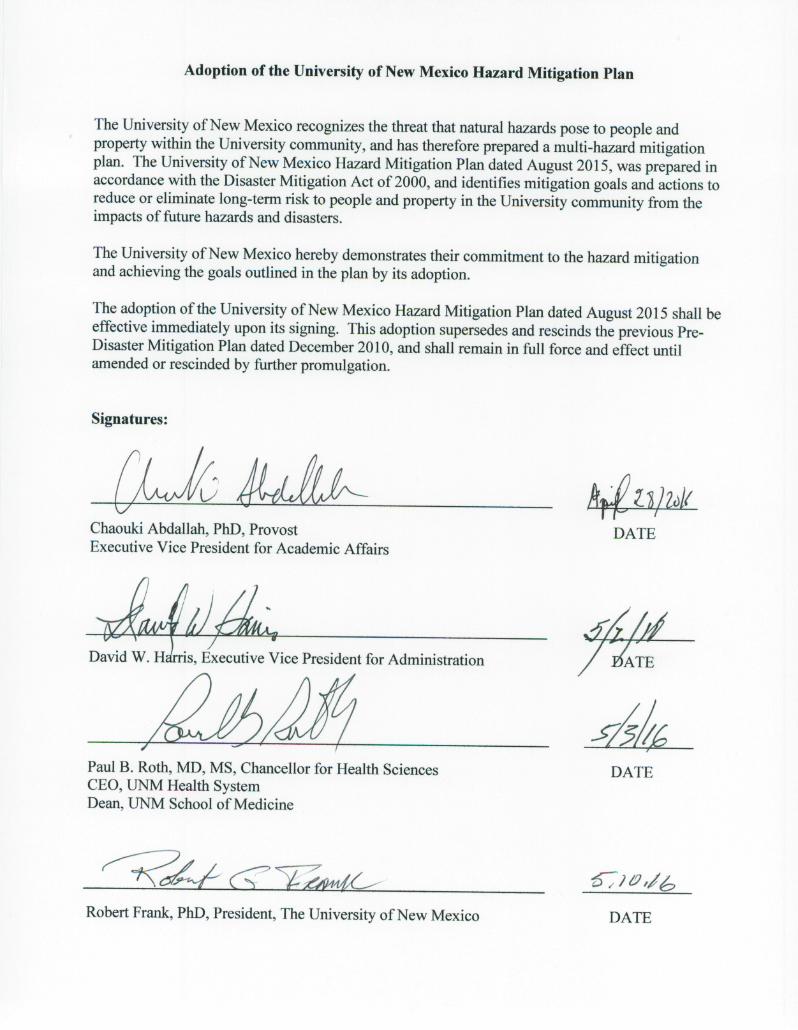
Adoption by the University of New Mexico .................................................................................................. 9
Chapter 1 Introduction ................................................................................................................................. 1
Vision and Purpose.................................................................................................................................. 1
University of New Mexico Planning Area: History, Demographics, Economy, and Geography ........ 1
University of New Mexico ................................................................................................................... 1
Main and Branch Campus Demographics ........................................................................................ 13
Academic and Research Programs ................................................................................................... 14
Athletics ............................................................................................................................................. 15
Campus Economy .............................................................................................................................. 16
UNM Utilities and Infrastructure ..................................................................................................... 18
Climate ............................................................................................................................................... 19
Scope of the Hazard Mitigation Plan .................................................................................................... 19
Authority ................................................................................................................................................ 20
Chapter 2 – Planning and Update Process .................................................................................................. 21
UNM Administrative Team ................................................................................................................... 21
Pre-Disaster Planning Advisory Committee........................................................................................ 22
PDMAC Meetings ................................................................................................................................ 22
UNM Natural Hazards Pre-Disaster Mitigation Website .................................................................... 23
Public Involvement and Outreach ........................................................................................................ 23
State and Local Hazard Mitigation Plans and Programs .................................................................... 24
Agency and Organization Development .............................................................................................. 26
Future Development Trends ................................................................................................................ 26
Chapter 3 - Community Capabilities ........................................................................................................... 28
Planning and Regulatory Capabilities .................................................................................................. 28
Administrative and Technical Capabilities .......................................................................................... 40
Financial Capabilities ............................................................................................................................ 42
UNM Mitigation Resources ............................................................................................................... 43
State Mitigation Resources ............................................................................................................... 43
Insurance............................................................................................................................................ 43
Educational and Outreach Capabilities ................................................................................................ 44
National Flood Insurance Program ...................................................................................................... 45
November 2015
ii
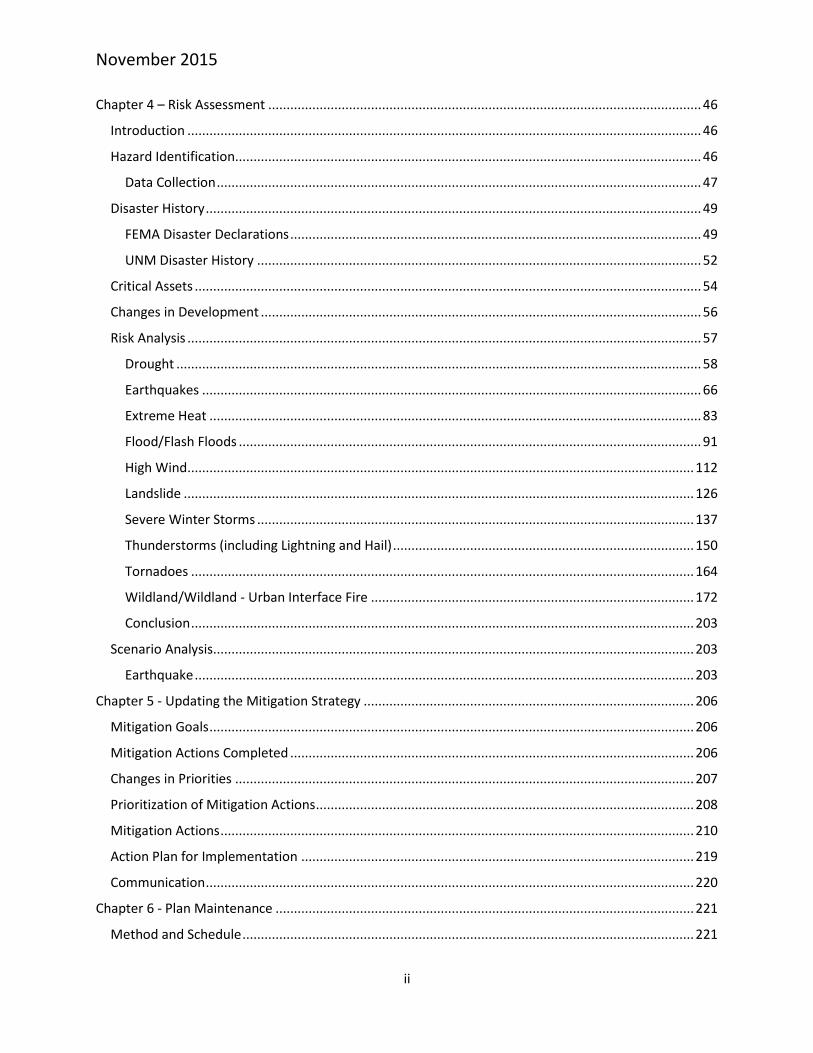
Chapter 4 – Risk Assessment ...................................................................................................................... 46
Introduction ............................................................................................................................................ 46
Hazard Identification ............................................................................................................................... 46
Data Collection .................................................................................................................................... 47
Disaster History ....................................................................................................................................... 49
FEMA Disaster Declarations ................................................................................................................ 49
UNM Disaster History ......................................................................................................................... 52
Critical Assets .......................................................................................................................................... 54
Changes in Development ........................................................................................................................ 56
Risk Analysis ............................................................................................................................................ 57
Drought ............................................................................................................................................... 58
Earthquakes ........................................................................................................................................ 66
Extreme Heat ...................................................................................................................................... 83
Flood/Flash Floods .............................................................................................................................. 91
High Wind .......................................................................................................................................... 112
Landslide ........................................................................................................................................... 126
Severe Winter Storms ....................................................................................................................... 137
Thunderstorms (including Lightning and Hail) .................................................................................. 150
Tornadoes ......................................................................................................................................... 164
Wildland/Wildland - Urban Interface Fire ........................................................................................ 172
Conclusion ......................................................................................................................................... 203
Scenario Analysis ................................................................................................................................... 203
Earthquake ........................................................................................................................................ 203
Chapter 5 - Updating the Mitigation Strategy .......................................................................................... 206
Mitigation Goals .................................................................................................................................... 206
Mitigation Actions Completed .............................................................................................................. 206
Changes in Priorities ............................................................................................................................. 207
Prioritization of Mitigation Actions ....................................................................................................... 208
Mitigation Actions ................................................................................................................................. 210
Action Plan for Implementation ........................................................................................................... 219
Communication ..................................................................................................................................... 220
Chapter 6 - Plan Maintenance .................................................................................................................. 221
Method and Schedule ........................................................................................................................... 221

November 2015
iii
Public Participation ............................................................................................................................... 222
Evaluation Process ................................................................................................................................ 222
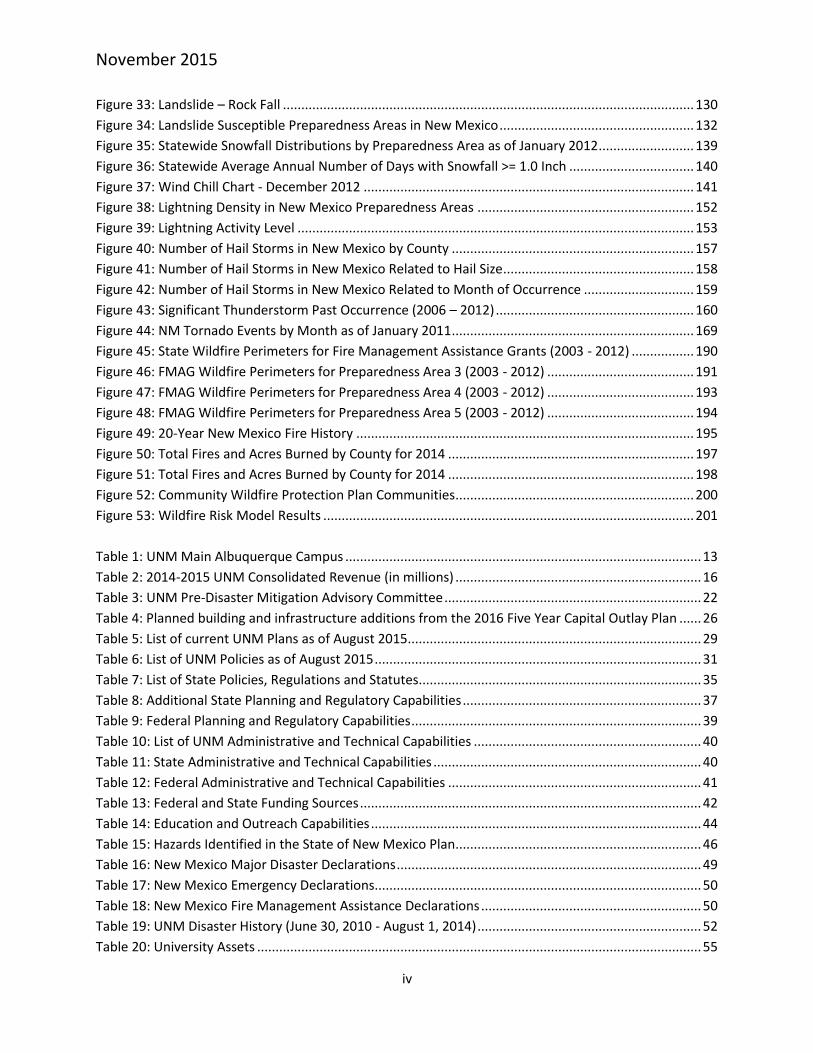
List of Figures and Tables
Figure 1: UNM Planning Area ........................................................................................................................ 2
Figure 2: Main Campus Map ......................................................................................................................... 5
Figure 3: UNM Gallup Branch Campus Map ................................................................................................. 7
Figure 4: UNM Los Alamos Branch Campus Map ......................................................................................... 9
Figure 5: UNM Taos Branch Campus Map .................................................................................................. 10
Figure 6: UNM Valencia Branch Campus Map ............................................................................................ 11
Figure 7: UNM Consolidated Revenues 2015-2016 Budget ....................................................................... 17
Figure 8: UNM Consolidated Expenditures 2015-2016 Budget .................................................................. 18
Figure 9: NMDHSEM 6 Preparedness Areas ............................................................................................... 25
Figure 10: Palmer Drought Severity Index .................................................................................................. 59
Figure 11: US Drought Monitor – New Mexico as of July 14, 2015 ............................................................ 60
Figure 12: Preparedness Areas and Fault Lines in New Mexico ................................................................. 70
Figure 13: Earthquakes in New Mexico, 1962 - 2012 ................................................................................. 71
Figure 14: Maximum Probable Earthquake Epicenter and Potential Peak Ground Acceleration .............. 77
Figure 15: Maximum Probable Earthquake Epicenter and Potential Peak Ground Acceleration,
Preparedness Area 3 ................................................................................................................................... 78
Figure 16: Maximum Probable Earthquake Epicenter and Potential Peak Ground Acceleration,
Preparedness Area 4 ................................................................................................................................... 79
Figure 17: Maximum Probable Earthquake Epicenter and Potential Peak Ground Acceleration,
Preparedness Area 5 ................................................................................................................................... 80
Figure 18: Heat Index as of June 2015 ........................................................................................................ 85
Figure 19: Average Temperature and Preparedness Area Map of New Mexico ........................................ 88
Figure 20: Daily Temperature Data - Albuquerque Area, NM .................................................................... 89
Figure 21: Flood Definition ......................................................................................................................... 91
Figure 22: UNM Central and North Campuses FEMA National Flood Hazard Layer (Data as of 9/27/13) . 96
Figure 23: UNM South Campus FEMA National Flood Hazard Layer (Data as of 9/27/13) ........................ 97
Figure 24: UNM Valencia Branch Campus National Flood Hazard Layer (Data as of 9/27/13) .................. 98
Figure 25: UNM Taos Branch Campus National Flood Hazard Layer (Data as of 9/27/13) ........................ 98
Figure 26: 2012 Monsoon Burst Periods................................................................................................... 108
Figure 27: Beaufort Scale, December 2012 .............................................................................................. 112
Figure 28: Wind Zones in the United States ............................................................................................. 113
Figure 29: Average Wind Speeds in by NM Preparedness Area – October 15, 2011 ............................... 115
Figure 30: Landslide – Debris Flow ........................................................................................................... 128
Figure 31: Landslide – Slump .................................................................................................................... 129
Figure 32: Landslide – Rock Slide .............................................................................................................. 129
November 2015
iv
Figure 33: Landslide – Rock Fall ................................................................................................................ 130
Figure 34: Landslide Susceptible Preparedness Areas in New Mexico ..................................................... 132
Figure 35: Statewide Snowfall Distributions by Preparedness Area as of January 2012 .......................... 139
Figure 36: Statewide Average Annual Number of Days with Snowfall >= 1.0 Inch .................................. 140
Figure 37: Wind Chill Chart - December 2012 .......................................................................................... 141
Figure 38: Lightning Density in New Mexico Preparedness Areas ........................................................... 152
Figure 39: Lightning Activity Level ............................................................................................................ 153
Figure 40: Number of Hail Storms in New Mexico by County .................................................................. 157
Figure 41: Number of Hail Storms in New Mexico Related to Hail Size .................................................... 158
Figure 42: Number of Hail Storms in New Mexico Related to Month of Occurrence .............................. 159
Figure 43: Significant Thunderstorm Past Occurrence (2006 – 2012) ...................................................... 160
Figure 44: NM Tornado Events by Month as of January 2011 .................................................................. 169
Figure 45: State Wildfire Perimeters for Fire Management Assistance Grants (2003 - 2012) ................. 190
Figure 46: FMAG Wildfire Perimeters for Preparedness Area 3 (2003 - 2012) ........................................ 191
Figure 47: FMAG Wildfire Perimeters for Preparedness Area 4 (2003 - 2012) ........................................ 193
Figure 48: FMAG Wildfire Perimeters for Preparedness Area 5 (2003 - 2012) ........................................ 194
Figure 49: 20-Year New Mexico Fire History ............................................................................................ 195
Figure 50: Total Fires and Acres Burned by County for 2014 ................................................................... 197
Figure 51: Total Fires and Acres Burned by County for 2014 ................................................................... 198
Figure 52: Community Wildfire Protection Plan Communities................................................................. 200
Figure 53: Wildfire Risk Model Results ..................................................................................................... 201
Table 1: UNM Main Albuquerque Campus ................................................................................................. 13
Table 2: 2014-2015 UNM Consolidated Revenue (in millions) ................................................................... 16
Table 3: UNM Pre-Disaster Mitigation Advisory Committee ...................................................................... 22
Table 4: Planned building and infrastructure additions from the 2016 Five Year Capital Outlay Plan ...... 26
Table 5: List of current UNM Plans as of August 2015................................................................................ 29
Table 6: List of UNM Policies as of August 2015 ......................................................................................... 31
Table 7: List of State Policies, Regulations and Statutes............................................................................. 35
Table 8: Additional State Planning and Regulatory Capabilities ................................................................. 37
Table 9: Federal Planning and Regulatory Capabilities ............................................................................... 39
Table 10: List of UNM Administrative and Technical Capabilities .............................................................. 40
Table 11: State Administrative and Technical Capabilities ......................................................................... 40
Table 12: Federal Administrative and Technical Capabilities ..................................................................... 41
Table 13: Federal and State Funding Sources ............................................................................................. 42
Table 14: Education and Outreach Capabilities .......................................................................................... 44
Table 15: Hazards Identified in the State of New Mexico Plan ................................................................... 46
Table 16: New Mexico Major Disaster Declarations ................................................................................... 49
Table 17: New Mexico Emergency Declarations......................................................................................... 50
Table 18: New Mexico Fire Management Assistance Declarations ............................................................ 50
Table 19: UNM Disaster History (June 30, 2010 - August 1, 2014) ............................................................. 52
Table 20: University Assets ......................................................................................................................... 55

November 2015
v
Table 21: Significant Past Occurrences-Drought ........................................................................................ 62
Table 22: State Disaster Event Information 2003 through 2012 ................................................................ 62
Table 23: Current Drought Conditions as of June 16, 2015 for Preparedness Areas 1-6 ........................... 63
Table 24: Potential Impacts from Drought ................................................................................................. 64
Table 25: Different Magnitudes of Earthquakes ......................................................................................... 68
Table 26: Earthquakes 4.5 and Greater in New Mexico (1869 - 2015) ....................................................... 73
Table 27: Significant Past Occurrence - Earthquake 1918 – 2010 .............................................................. 73
Table 28: Hazus Model Maximum Probable Magnitude for each Preparedness Area ............................... 76
Table 29: Potential Impacts from Earthquakes........................................................................................... 81
Table 30: Heat Index/Heat Disorders .......................................................................................................... 83
Table 31: Significant Past Occurrences - Extreme Heat (January 1, 2006 - December 1, 2012) ................ 86
Table 32: SHELDUS Previously Recorded Extreme Heat Events (1994-2014) ............................................. 87
Table 33: Probability of Future Occurrence - Extreme Heat ....................................................................... 89
Table 34: Extreme Heat Impacts ................................................................................................................. 90
Table 35: Flood Probability Terms .............................................................................................................. 92
Table 36: Flooding vs. Flash Floods – Cause ............................................................................................... 92
Table 37: Significant Past Occurrences of Flood/Flash Flood (as of 2012) ............................................... 100
Table 38: SHELDUS History of Flood/Flash Flood Events (1994 -2014) .................................................... 105
Table 39: Probability of Future Occurrence - Flood/Flash Flood .............................................................. 109
Table 40: Potential Impacts from Flood/Flash Flood Events .................................................................... 110
Table 41: Wind Speed Experienced by New Mexico Preparedness Areas ............................................... 114
Table 42: Significant Past Occurrence - High Wind ................................................................................... 116
Table 43: SHELDUS History of High Wind Events (1994-2014) ................................................................. 118
Table 44: Probability of Future Occurrence (annually) - High Wind ......................................................... 124
Table 45: Probability of Future Occurrence - Flood/Flash Flood .............................................................. 125
Table 46: Alexander Scale for Landslide Damage ..................................................................................... 130
Table 47: Significant Past Occurrence – Landslide .................................................................................... 133
Table 48: New Mexico Landslide Disaster Declarations (2003 – 2012) .................................................... 134
Table 49: Probability of Annual Occurrence of Landslide ......................................................................... 135
Table 50: Potential Landslide Impacts ...................................................................................................... 136
Table 51: Significant Past Occurrences - Severe Winter Storms ............................................................... 142
Table 52: State Disaster Event Information 2003 through 2012 .............................................................. 144
Table 53: Federal Disaster Event Information 2003 through 2012 .......................................................... 144
Table 54: SHELDUS History of Winter Weather Hazards (1995-2013) ..................................................... 145
Table 55: Probability of Future Occurrence - Severe Winter Storms ....................................................... 147
Table 56: Severe Winter Storm Impacts ................................................................................................... 148
Table 57: Combined NOAA/TORRO Hailstorm Intensity Scale ................................................................. 155
Table 58: SHELDUS Thunderstorm History by county (1994-2014) .......................................................... 161
Table 59: Probability of Future Occurrence (Thunderstorm Events) ........................................................ 162
Table 60: Potential Thunderstorm Impacts .............................................................................................. 163
Table 61: Fujita Tornado Damage Scale .................................................................................................... 165
Table 62: Enhanced Fujita (EF) Scale......................................................................................................... 166

November 2015
vi
Table 63: Tornado Risk Table as of December 2012 ................................................................................. 167
Table 64: SHELDUS History of Tornado and Funnel Cloud Events (1994-2014) ....................................... 168
Table 65: NM Tornado Events by Month as of January 2011 ................................................................... 170
Table 66: Impacts from Tornadoes ........................................................................................................... 171
Table 67: Land Ownership in New Mexico ............................................................................................... 174
Table 68: Fires on State and private land in 2011 and 2012 .................................................................... 175
Table 69: Fires on Federal land (2011-2012) ............................................................................................ 175
Table 70: Wildfire Susceptibility Matrix .................................................................................................... 178
Table 71: Fire Danger Rating System ........................................................................................................ 179
Table 72: Previous Occurrences – Wildland/WUI Fires ............................................................................ 182
Table 73: SHELDUS History of Wildland/Urban Interface Fires (1994-2014) ........................................... 186
Table 74: State Disaster Event Information 2003 through 2012 .............................................................. 188
Table 75: Federal Disaster Event Information 2003 through 2012 .......................................................... 188
Table 76: Summary of FMAG and Acreage by Preparedness Area ........................................................... 191
Table 77: Historical Fire Data (1992 – 2012) ............................................................................................. 196
Table 78: Potential Impacts from Wildland Fire ....................................................................................... 201
Table 79: Expected damage by general building type .............................................................................. 204
Table 80: Expected damage to utility system facilities (Albuquerque region) ......................................... 204
Table 81: STAPLEE Criteria ........................................................................................................................ 208
Table 82: Prioritization Categories ............................................................................................................ 209
List of Appendices
Appendix A: Local Mitigation Planning Tool
Appendix B: Committee Attachments
Appendix C: Outreach Attachments

November 2015
vii
Acronyms Acronym Term
ADA Americans with Disabilities Act
APPM Administrative Policies and Procedures Manual
CABQ City of Albuquerque
CCERT Campus Community Emergency Response Team
COC Capital Outlay Committee
COOP Continuity of Operations
CRS Community Rating System
CWPP Community Wildfire Protection Plans
DFIRMS Digital Flood Insurance Rate Maps
DR Disaster Recovery (Plans)
EAP Emergency Action Plan
EDAC Earth Data Analysis Center
EF Enhanced Fujita (Scale)
FEMA Federal Emergency Management Agency
FMAG Fire Management Assistance Grants
HMGP Hazard Mitigation Grant Program
HMP Hazard Mitigation Plan
HSC Health Science Center
ICS Incident Command System
IFCI International Fire Code Index
IT Information Technologies
LTER Long Term Ecological Research (Sevilleta)
mb body wave magnitude
ML Magnitude Level
MMI Modified Mercalli Intensity
ms surface wave magnitude
mw moment magnitude
NCDC National Climatic Data Center
NFIP National Flood Insurance Program
NMDHSEM New Mexico Department of Homeland Security and Emergency Preparedness
NOAA National Oceanic and Atmospheric Administration
NWR National Wildlife Refuge (Sevilleta)
NWS National Weather Service
OCP Office of Capital Planning
OEM Office of Emergency Management
OSE Office of the State Engineer
PDC Planning, Design and Construction
PDM Pre-Disaster Mitigation
PDMAC Pre-Disaster Mitigation Advisory Committee

November 2015
viii
PDSI Palmer Drought Severity Index
PGA Peak Ground Acceleration
PI Principal Investigator
PPD Physical Plant Department
RPM Reagents Policy Manual
SHELDUS Spatial Hazard Events and Losses Database for the United States
SRMC Sandoval Regional Medical Center
SRS Safety and Risk Services
STAPLEE Social, Technical, Administrative, Political, Legal, Economic, Environmental
TORRO Tornado and Storm Research Organization
UCAM University Communication and Marketing Office
UHERT UNM Healthcare Emergency Response Team
UNM University of New Mexico
UNMH University of new Mexico Hospital
USACE United States Army Corps of Engineers
USGS United States Geological Survey
WFU Wildland Fire Use
WUI Wildland-Urban Interface

November 2015
1
Chapter 1 Introduction
Vision and Purpose The Federal Emergency Management Agency defines hazard mitigation as “Any sustained action taken
to reduce or eliminate the long-term risk to human life and property from hazards.” In other words, the
investments made before a hazard event that will reduce disaster losses and break the cycle of disaster
damage, reconstruction, and repeated damage. However, mitigation is most effective when it is based
on a comprehensive, long-term plan that is developed before a disaster occurs. Mitigation planning
identifies policies, actions, people and other resources that can assist over the long term to reduce risk
and future losses from hazards. The hazard mitigation planning process is very important and creates a
framework for risk-based decision making to reduce damages to lives, property, and the economy from
future disasters.
The University of New Mexico (UNM) Hazard Mitigation Plan (HMP) identifies the hazards that can affect
the university and branch campuses and describes mitigation strategies to reduce or eliminate the
effects of those hazards. The plan provides guidance to university leadership and stakeholders by
identifying potential natural hazards and prioritizing mitigation goals and objectives, proposing solutions
to certain mitigation problems, and identifying possible funding sources for mitigation projects.
University of New Mexico Planning Area: History, Demographics, Economy, and
Geography
University of New Mexico
The University of New Mexico, home of the Lobos, is New Mexico’s flagship institution of higher
learning. Founded in 1889, UNM is a public university offering multiple bachelor, master, doctoral, and
professional degree programs in all areas of the arts and humanities, sciences, health, and engineering.
UNM’s mission is to serve as New Mexico’s flagship institution of higher learning through demonstrated
and growing excellence in teaching, research, patient care, and community service. UNM has more than
159,000 active alumni, with Lobos in every state and more than 1,400 alumni outside the U.S. More than
half of UNM’s alumni choose to remain in New Mexico.
The Main Campus in Albuquerque consists of the Central Campus, North Campus, and South Campus,
and includes the UNM Health Sciences Center and UNM Hospital. UNM has four branch campuses
across New Mexico located in Gallup/Zuni, Los Alamos, Taos, and Valencia County. Other UNM
properties include UNM West, an extension campus in Rio Rancho, New Mexico and the Sevilleta LTER
Field Station located in Socorro, New Mexico.

November 2015
2
Figure 1: UNM Planning Area
*UNM Young Ranch was completely destroyed in the 2011 Los Conchas Fire. The property is now owned by the New Mexico State Land Office.
UNM is led by a President, who is the Chief Executive Officer responsible for implementing university
policies for all campuses and extensions. The UNM Board of Regents, composed of seven members who
are appointed by the Governor of New Mexico, with the consent of the New Mexico State Senate, have
fiduciary responsibility for the assets and programs of the University. The Regents establish goals and

November 2015
3
policies to guide the University and have oversight of the functioning of the University. The Board vests
responsibility for the operation and management of the University in the President of the University.
UNM Main Campus
The Main Campus for UNM is located in Albuquerque, NM. With a grant from the Territory of New
Mexico in 1889, the University started with 20 acres of land located in the southwest corner of the
current day Central Campus. Today Main Campus boundaries are University Blvd. on the West, Central
Avenue on the South, Girard Blvd. on the East and Indian School Road on the North, containing
approximately 800 acres. Main Campus is divided into three geographical areas, Central Campus, North
Campus, and South Campus, and includes all programs and departments that report to Academic Affairs
and to the Health Sciences Center administrative areas. UNM's Main Campus offers 238 active degree
and certificate programs. There are 99 baccalaureate, 75 masters, and 40 doctoral level degree
programs. In addition, there are 5 doctoral professional practice programs—in law, medicine, nursing,
pharmacy, and physical therapy.
UNM continues to undergo construction of new buildings as well as renovations to existing buildings.
New major construction projects included the addition of the $7.6 million Collaborative Teaching and
Learning Building. Recent renovations completed include renovations totaling $14.2 million to the
Innovation, Discovery, and Training Complex, $4.8 million renovation to 1650 University Towers, and
$4.2 million to Logan Hall (Psychology). Other major capital projects completed include the Baseball
Facility Renovation.
Ongoing major projects include the 1650 University Tenant Improvement, the Biology Building
Renovation (Castetter Hall Phase 3), Clark Hall Renovations (Chemistry), Science and Math Learning
Center Phase 2, the McKinnon Family Tennis Center, the North Golf Course, and more.
Central Campus
The Central Campus is home to the main academic university. UNM Central Campus, the largest of all
UNM campuses, boundaries University Blvd. on the west, Central Avenue on the South, Girard Blvd. on
the East and Lomas Avenue on the North. UNM Central campus is noted for its unique Pueblo Revival
architectural style, introduced when the university's third president, William G. Tight, plastered over the
Victorian-style Hodgin Hall to create a monument to Pueblo Indian culture. John Gaw Meem, a famed
Santa Fe architect, designed many university buildings in the pueblo style and is credited with imbuing
the campus with its distinctive Southwestern feel. UNM Central Campus has 8 university buildings listed
separately on the National Register of Historic Places.
UNM Central Campus is home to educational, research, and laboratory facilities, residence halls, UNM
libraries, performance halls, museums and galleries, athletic spaces, and more.
North Campus
The North Campus is located north of Lomas Avenue and is home to the nationally recognized Health
Sciences Center (HSC) and University of New Mexico Hospital (UNMH). The UNM North Campus is
bordered on the west by Interstate 25 (I-25), on the east by Girard Boulevard, Lomas Boulevard on the
south, and Indian School Avenue on the north, with a small portion located within the Medical Arts
November 2015
4
Complex south of Lomas Boulevard. UNM HSC is the largest academic health complex in the state and
includes the College of Nursing, College of Pharmacy, and School of Medicine. UNMH is New Mexico's
only Level I Trauma Center, treating nearly 90,000 emergency patients and more than 450,000
outpatients annually. UNMH serves as the primary teaching hospital for the UNM School of Medicine
and participates in hundreds of advanced clinical trials annually. It also is the home of the highly
regarded UNM Children's Hospital.
Additional facilities located on North Campus include the School of Law, the North Campus Golf Course,
and Lands West. Lands West is home to the KNME-TV studios, UNM Carrie Tinley Hospital Outpatient
Clinic, UNM Children’s Campus, and the National Cancer Institute-designated UNM Cancer Center.
South Campus
The South campus is centered around the intersection of University Boulevard and Avenida César
Chavez and is home to the Science and Technology Park, Student Support and Services Center, UNM
Student Family Housing and most of UNM's athletic facilities. The Athletics Complex includes Wise Pies
Arena aka The PIT, Lobo Football Stadium, Tennis Courts, Baseball, Softball, and Soccer Fields.
Additionally, the City of Albuquerque’s AAA Baseball Team, the Isotopes, is also located in the Athletics
Complex.
The Science and Technology Park is comprised of 163 acres, 41 of which were developed during Phase I.
Phase II has begun with the development of an additional 42 acres. Phase II has commenced with the
development of an additional 42 acres. Future phases will encompass approximately 80 acres. Family
Student Housing is dedicated to those students with families and consists of 200 apartment units on 12
acres. It is estimated that 70% of UNM's students park on South Campus, with approximately 1.7 million
pickups/drop-offs yearly. University student shuttle services take students from South Campus to Main
Campus on a Monday-through-Friday schedule, operating from 7:00 a.m. to 10:00 p.m.

November 2015
5
Figure 2: Main Campus Map1
1 https://iss.unm.edu/PCD/campus-map.html
UNM Central Campus
Overview UNM Main Campus
UNM South Campus
UNM North Campus
Lands West
November 2015
6
UNM Branch Campuses
The University established 2-year branch colleges to serve the citizens of New Mexico more fully and to
provide the highest quality of education for students pursuing post-secondary education at different
locations throughout the state. Branch colleges respond specifically to the unique needs and
multicultural backgrounds of their respective communities by offering community education programs,
career education, including certificate and associate degree programs, and transfer programs that
prepare students for upper division entry into 4-year colleges and universities. Branch colleges utilize
many resources in their service districts and therefore function as integral parts of their surrounding
communities. They are thoroughly committed to assisting in the economic development of their service
areas. In addition, they serve the needs of their respective communities in the manner of a
comprehensive community college, offering a variety of academic, career, and community service
programs. The University has branch campuses in Gallup/Zuni, Los Alamos, Taos and Valencia.
Additionally, UNM has education centers located in Santa Fe, Farmington, and Kirtland Air Force Base
and Extended Learning online.
UNM –Gallup Branch Campus
The Gallup Branch Campus (UNM-Gallup) spreads over 64 acres (.26 km²) in New Mexico's High Desert
Country to include learning sites at Ramah, Navajo and Smith Lake. Founded in 1968, it serves
approximately 75,000 residents of the region, which includes the City of Gallup and McKinley County,
and is the largest of the four UNM branch campuses. UNM-Gallup includes the 25,000-square-foot Zuni
South Campus and a 2500-square-foot facility on Gallup’s North Side. The adobe-style facilities sit
amongst some of the most beautiful red rock country in the Southwest. The Gallup population of
approximately 21,000 may balloon to 100,000 and more on holidays and festival occasions because of
easy accessibility to the reservations. UNM Gallup is home to over 3,000 students. Located near the
Navajo, Zuni and Hopi Reservations, this campus has the largest Native American student body of any
public college in the world, and receives close to $7,000,000 annually in tribal, federal and state grants
as well as private, civic, and corporate grants and scholarships. The branch recently began to undertake
repairs to older structures with funds from an $8 million general obligation bond, passed by local voters.
They are also on course to complete the Technology Center and Classroom Building.

November 2015
7
Figure 3: UNM Gallup Branch Campus Map

November 2015
8
UNM – Los Alamos (UNM-LA) Branch Campus
The Los Alamos Branch Campus spreads over 184 acres (.75 km²) in northern New Mexico. The UNM-LA
campus consists of 8 buildings totaling 77,689 sq. ft. UNM-LA, in cooperation with Los Alamos National
Laboratory and the Albuquerque and branch campuses of UNM, delivers instruction in traditional face-
to-face teaching, as well as through a variety of technologies, including televised programming via
satellite, video conferencing or the Internet. UNM-LA offers a number of outstanding programs and
services including certificate programs and associate degree programs; community education and
customized training courses; small business development seminars through our Small Business
Development Centers (Los Alamos and Sandoval Counties); Adult Basic Education programs including
General Education Development (GED) and English as a Second Language (ESL); and bachelor and
graduate degree programs through UNM's Distance Education Program.
UNM began its presence in Los Alamos in 1956 with the establishment of the UNM–Los Alamos Center
for Graduate Studies, which has been in continuous operation since that time. The University of New
Mexico founded the UNM-LA campus officially on July 1st, 1980.

November 2015
9
Figure 4: UNM Los Alamos Branch Campus Map2
UNM – Taos Branch Campus
The UNM-Taos Branch Campus spreads over 45 acres (.18 km²). UNM-Taos is a two-year higher
education college located in north central New Mexico, situated in a high mountain valley between the
Rio Grande and the 1,000 year old Taos Pueblo. The UNM-Taos service area is rural, remote,
underserved, economically challenged, culturally diverse, and sparsely populated. Tourism and outdoor
recreation, health care, government, construction and real estate, retail entrepreneurship and
education are the primary sources of jobs and family income. UNM-Taos is a Hispanic Serving Institution
and the only institution of higher learning within a 50 mile radius. The service area includes the 30,000
residents of Taos County living in the outlying villages within a 2,203 square mile service area, as well as
the residents of two Native American Pueblos (Taos and Picuris).
2 http://losalamos.unm.edu/about/campus-map/index.html
November 2015
10
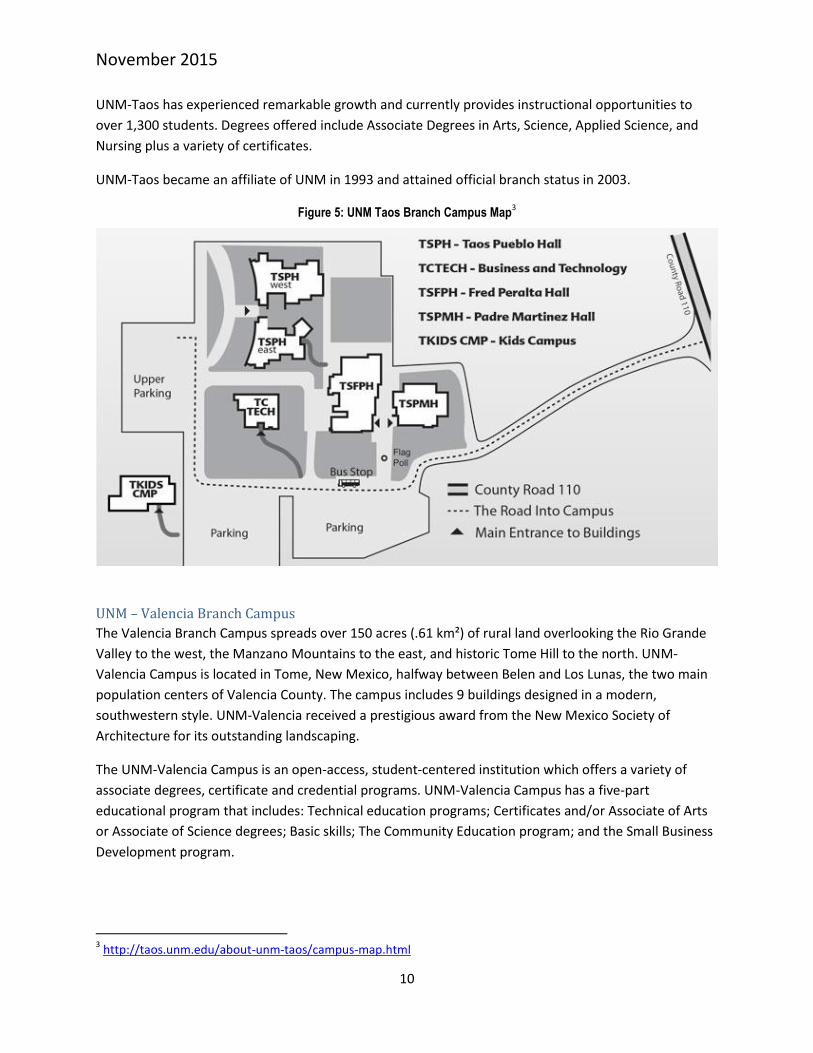
UNM-Taos has experienced remarkable growth and currently provides instructional opportunities to
over 1,300 students. Degrees offered include Associate Degrees in Arts, Science, Applied Science, and
Nursing plus a variety of certificates.
UNM-Taos became an affiliate of UNM in 1993 and attained official branch status in 2003.
Figure 5: UNM Taos Branch Campus Map3
UNM – Valencia Branch Campus
The Valencia Branch Campus spreads over 150 acres (.61 km²) of rural land overlooking the Rio Grande
Valley to the west, the Manzano Mountains to the east, and historic Tome Hill to the north. UNM-
Valencia Campus is located in Tome, New Mexico, halfway between Belen and Los Lunas, the two main
population centers of Valencia County. The campus includes 9 buildings designed in a modern,
southwestern style. UNM-Valencia received a prestigious award from the New Mexico Society of
Architecture for its outstanding landscaping.
The UNM-Valencia Campus is an open-access, student-centered institution which offers a variety of
associate degrees, certificate and credential programs. UNM-Valencia Campus has a five-part
educational program that includes: Technical education programs; Certificates and/or Associate of Arts
or Associate of Science degrees; Basic skills; The Community Education program; and the Small Business
Development program.
3 http://taos.unm.edu/about-unm-taos/campus-map.html

November 2015
11
The University of New Mexico began serving the educational needs of Valencia County in August 1978
with the establishment of the UNM-Eastern Valencia County Satellite Center. A formal proposal to
establish the branch was accepted by UNM in March 1981.
Figure 6: UNM Valencia Branch Campus Map4
UNM Other Site Locations
UNM Capillia Peak
Capillia Peak is an astronomical observatory owned and operated by UNM. It is located in the Manzano
Mountains of central New Mexico, approximately 30 miles southeast of Albuquerque. The observatory
contains a 24 inch Cassegrain optical telescope built by Boller and Chivens.
UNM DHL Ranch
The D.H. Lawrence Ranch, also known as the Kiowa Ranch, is located in San Cristobal, New Mexico,
approximately 20 miles north of Taos. Situated on Lobo Mountain and comprising 160 acres, it is located
at 8,500 feet. The ranch was entrusted to UNM for the purpose of creating a public memorial to the
world renowned write, D.H. Lawrence. According to the Taos tourist office, it is one of the most sought-
after sites for visitors, second only to Taos Pueblo. The ranch was closed to visitors from 2008 until
2013. It reopened to visitors in 2014.
UNM – Sevilleta Long Term Ecological Research (LTER) Field Station
The Sevilleta LTER Field station is approximately 220,000 acres (890.7 km²) in size, consisting of two
mountain ranges and the Rio Grande valley in between. The Sevilleta LTER is bounded on the east by the
Los Pinos Mountains ("Mountains of the Pines”) and on the west by the Sierra Ladrones ("Thieves 4 http://www.unm.edu/~unmvc/Map/campusmap.htm

November 2015
12
Mountains," in reference to 17th, 18th and 19th century bandit groups that would use these rugged
mountains as hideouts).
The Sevilleta LTER Field Station is operated by the University of New Mexico in collaboration with the
U.S. Fish and Wildlife Service's Sevilleta National Wildlife Refuge. The Sevilleta LTER Field Station is
located near the Headquarters of the U.S. Fish and Wildlife Service on the Sevilleta National Wildlife
Refuge (NWR), Socorro, NM. The Sevilleta NWR is approximately 60 miles south of Albuquerque and is
dissected by Interstate 25.
The Sevilleta LTER Field Station supports research and educational programs in biology, ecology,
geology, and anthropology. The field station serves as a meeting facility for conferences, workshops,
retreats and class field trips. Public access to the field station is permitted for scheduled activities;
however, all field activities on the Sevilleta NWR (research projects or educational field trips) are
required to have special use permits from the U.S. Fish and Wildlife Service.
The Sevilleta NWR was established in 1974 through a gift from the Campbell Family Foundation and The
Nature Conservancy to the U.S. Fish and Wildlife Service. The Sevilleta NWR lies at the junction of
several major biomes of the American Southwest; it is at the northern edge of the Chihuahuan Desert,
the western edge of the Great Plains Short-grass Prairie, and the southeastern edge of the Colorado
Plateau Shrub-Steppe. Along the Rio Grande are found gallery forests ("bosque") of cottonwood,
Russian olive, and salt cedar. Above the riparian corridor are the grasslands/shrublands/deserts, while
higher in the mountains are found the juniper savannas and piñon-juniper woodlands. Nearby mountain
ranges (the Magdalena Mountains to the southwest, and the Manzano Mountains to the northeast)
climb to nearly 10,800 feet elevation, and support old growth forests of ponderosa pine, limber pine,
Douglas fir, Engleman spruce, and quaking aspen. As a result of the variety of ecosystems in the region,
the biodiversity of the Sevilleta NWR is remarkably rich, supporting over 1,200 species of plants, 89
species of mammals, 353 species of birds, 58 species of reptiles, 15 species of amphibians, and
thousands of species of arthropods.
Sevilleta provides logistical support for the many field research and educational activities being
conducted in the Middle Rio Grande Valley. The station's research facilities include general laboratories,
specimen processing and storage facilities, reference collections of plant and animal specimens, a
computer center, a library, and a large conference room/classroom for group meetings. In addition, the
station has a shop and equipment storage facility, a fleet of four-wheel drive field vehicles, cargo
trailers, and a 4 x 4 ATV. The Field Station can provide housing for up to 82 people for periods ranging
from a single night to multiple months. The station has a total of 11 completely furnished residence
buildings.
UNM West
UNM West includes the UNM West Campus and Sandoval Regional Medical Center located in Rio
Rancho, NM. UNM West Campus has been offering lower-division, upper-division, and graduate level
courses at multiple sites on the “west side” of Albuquerque, since 1990. Sandoval Regional Medical
Center UNM (SRMC), opened in July of 2012, is a community-based academic healthcare facility that is

November 2015
13
served by UNM Faculty Physicians and community-based independent physicians. SRMC houses 72
acute-care inpatient beds that service two medical/surgical units, an Intensive Care Unit, an inpatient
Senior Behavioral Health unit, an Imaging department, and a 24-hour a day/7-days a week Emergency
Department.
Main and Branch Campus Demographics
UNM represents a cross-section of cultures and backgrounds. UNM employs more than 20,000 people
statewide, including the employees of University of New Mexico Hospital. In spring of 2015, 25,816
students attended the main campus with another 7,296 students at branch campuses.
Table 1: UNM Main Albuquerque Campus5
Populations on main campus and all branches are dynamic. Most employees and students are on the
campus between the hours of 8:00 a.m. and 5:00 p.m. Daytime populations are spread out among all
buildings. Night classes are held between 5:00 p.m. and 10:00 p.m. and have lower attendance than day
classes. Faculty and staff are dispersed in various buildings around campus and generally have offices
within their own departments. Senior administration staff (The President of UNM, the Regents, and
5 Data provided by official enrollment report spring 2015, office of the registrar Enrollments statistics as of the
census date February 6th, 2015 (http://oia.unm.edu/documents/enrollment-reports/spr-15-oer.pdf)
Campus Location Headcount 2011 2012 2013 2014 2015
Main Albuquerque Campus 27,305 27,278 27,197 26,749 25,816
Gallup Branch 2,895 2,768 2,643 2,501 2,276
Los Alamos Branch 915 906 922 900 1,009
Valencia Branch 2,536 2,566 2,507 2,455 2,404
Taos Branch 1,674 1,693 1,524 1,674 1,607
Branch Totals 8,020 7,933 7,596 7,530 7,296
EW-UNM West in Rio Ranho 478 536 498 582 657
EA-UNM Online and ITV 3,616 5,602 7,456 8,026 8,086
EKA-UNM Kirtland AFB 188 122 153 66 39
EG-Gallup Bachelors/Graduate 272 236 236 194 173
ELA-Los Alamos Bachelors/Graduate 60 73 37 51 39
EV-Valencia Bachelors/Graduate 49 44 34 10 12
ET-Taos Bachelors/Graduate 165 137 122 84 94
EF-San Juan Bachelors/Graduate 120 105 88 76 69
ESF-Santa Fe Bachelors/Graduate 20 14 10 10 16
Branch Campus's
Spring Semesters
As of Census Date, February 6, 2015
*Headcount presented for Extended University Campuses are included in the Albuquerque Campus totals.
Extended University Campus

November 2015
14
Provost, as well as many other top administrative positions) are located in Scholes Hall. Many other
administrative staff are scattered across the campus to include branch campuses.
Most UNMH employees, patients, and visitors are in the hospital between the hours of 8:00 a.m. and
5:00 p.m. However, UNMH provides many patient services 24 hours/7 days a week.
Visitors come to tour the main and branch campuses, visit students, and attend various cultural,
academic, and athletic activities. Athletic events such as football and basketball games often have a high
attendance of students and visitors. On average, the Main University Campus population can swell to
well over 150K during large sporting events, including current university daily population. (Athletic and
special events on campus are covered in detail in the Athletics section.)
Only 14% of UNM’s student population resides on campus in university housing. Student housing
facilities are located on UNM’s main and south campuses. Housing facilities consist of 37 free-standing
buildings which encompass nearly one million square feet of building space. On-campus living options
vary and students and guests can choose to stay in traditional halls, suites, or apartment style buildings.
Lodging and dining facilities include 10 residence halls and one dining facility. The total building
replacement costs for all Student Housing facilities combined is estimated to be $87M.
Residence Life and Student Housing provides lodging, community center and food service facilities to
approximately 3,000 UNM student residents during each academic year. There are 8 university-
managed resident halls/apartments for students, as well as 2 leased housing options. The La Posada
dining facility occupancy varies in size, but peaks at traditional meal times. During the academic year, La
Posada averages 380 for breakfast, 750 for lunch, and 850 residents for dinner. Peak occupancy period
for both lodging and food service occurs during the academic school year. In the summer months,
housing and dining facilities remain open to accommodate a smaller amount of conference guests and
summer school residents. An estimated 200 administrators, staff, and students work in Student Housing
and in the dining facilities year round.
Academic and Research Programs
UNM offers more than 215 degree and certificate programs, 94 bachelor’s degrees, 71 master’s degrees,
and 37 doctoral programs. All UNM graduate and undergraduate academic programs are fully
accredited by the Higher Learning Commission of the North Central Association of Colleges and
Universities. Many programs also have additional accreditation through specialized accrediting agencies.
UNM is the state’s flagship research institution and its research activities inject hundreds of millions of
dollars into New Mexico’s economy, fund new advancements in healthcare, and augment teaching –
giving students’ valuable hands-on training in state-of-the-art laboratories. UNM's Carnegie Basic
Classification is "Research University with Very High Research Activity." As a Hispanic-Serving
Institution6, the University represents a cross-section of cultures and backgrounds.
6 The Hispanic Association of Colleges & Universities (HACU) defines HSIs “as colleges, universities, or
systems/districts where total Hispanic enrollment constitutes a minimum of 25% of the total enrollment.

November 2015
15
The Health Sciences Center is the state's largest integrated health care treatment, research and
education organization. U.S. News and World Report’s 2015 edition of “America’s Best Graduate
Schools” ranks the UNM School of Medicine 40th in primary care and 83rd in research, while specific
areas also rank again among the top 10 – rural medicine, second, and family medicine, ninth.
Additionally, in health disciplines, UNM’s nursing/midwifery program is ranked fifth. Through the
Evening and Weekend Degree Program, nearly 40 degree programs are available with approximately
1,000 classes offered each semester after 4 p.m. or on weekends. About 12,000 non-traditional, working
students attend UNM at night each semester. Among the University's outstanding research units are
the Center for Advanced Research Computing, Cancer Center, New Mexico Engineering Research
Institute, Center for High Technology Materials, Design Planning Assistance Center, and the Mind
Research Network.
Athletics
UNM's Athletics Complex, located on the South Campus, consists of several major athletic facilities,
administration offices, practice fields and parking lots for students and athletic events. The athletic
facilities include University Stadium, WisePies Arena aka The Pit, Lobo Baseball field, Lobo Softball field,
McKinnon Family Tennis Stadium, Linda Estes Tennis Complex, and the Soccer/Track Complex.
WisePies Arena is home to UNM's men's and women’s basketball programs, as well as host to regional
and NCAA championships. It is the largest arena in the State of New Mexico with a capacity of 18,018
and hosts an average of 40 men's and women’s basketball games each year. It also hosts various events
ranging from state basketball tournaments, concerts, Gathering of Nations ("Pow Wow"), UNM and high
school graduations, and more. The University of New Mexico ticket office also is housed in the WisePies
Arena. All ticket sales, including online service, operate from the southeast section of the building. The
mid-ramp section of the WisePies Arena houses a primary phone/internet room for the campuses.
WisePies Arena underwent a massive upgrade and expansion that was completed in time for the 2010-
11 season that included $60 million of improvements. Among the improvements were the U.S. Bank
club/suites level seating, upgraded lower bowl seating, two end wall video boards, ribbon boards, a
unique graphics package showcasing the history of Lobo basketball and UNM athletics, upgraded
concessions area, the new Lobo Den Store, and a remodeled concourse. NBA locker rooms were added
for both the men's and women's teams along with a player's lounge.
University Stadium is home to the Lobo Athletics' football program. It includes the press box and the
L.F. "Tow" Diehm training complex. The press box stands approximately 70 feet above street level, with
five levels of seating, sky suites, press area and coaches’ boxes. The building also houses one of two
telecommunication hubs on the South Campus. Much of the internet and phone lines for South Campus
run through the press level of this facility.
Enrollment includes fulltime and part-time students, by campus, at the undergraduate or graduate level (including professional schools) of the institution, or both (i.e., headcount of for-credit students).
November 2015
16
Campus Economy
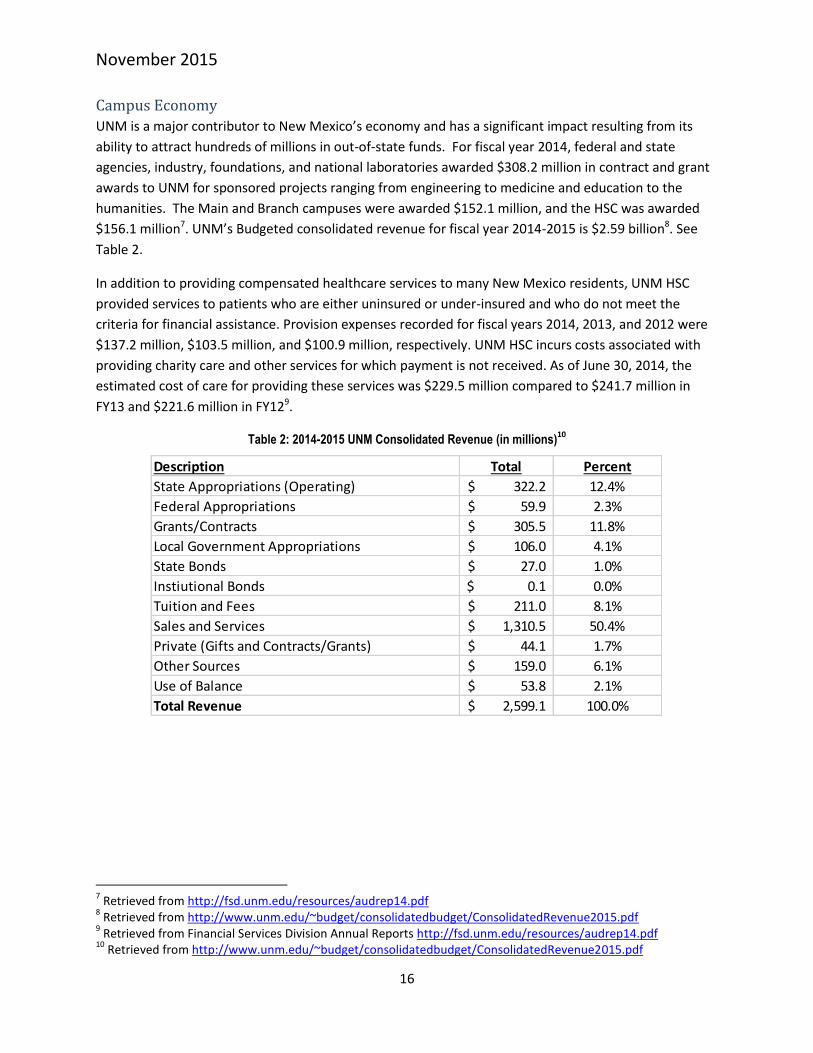
UNM is a major contributor to New Mexico’s economy and has a significant impact resulting from its
ability to attract hundreds of millions in out-of-state funds. For fiscal year 2014, federal and state
agencies, industry, foundations, and national laboratories awarded $308.2 million in contract and grant
awards to UNM for sponsored projects ranging from engineering to medicine and education to the
humanities. The Main and Branch campuses were awarded $152.1 million, and the HSC was awarded
$156.1 million7. UNM’s Budgeted consolidated revenue for fiscal year 2014-2015 is $2.59 billion8. See
Table 2.
In addition to providing compensated healthcare services to many New Mexico residents, UNM HSC
provided services to patients who are either uninsured or under-insured and who do not meet the
criteria for financial assistance. Provision expenses recorded for fiscal years 2014, 2013, and 2012 were
$137.2 million, $103.5 million, and $100.9 million, respectively. UNM HSC incurs costs associated with
providing charity care and other services for which payment is not received. As of June 30, 2014, the
estimated cost of care for providing these services was $229.5 million compared to $241.7 million in
FY13 and $221.6 million in FY129.
Table 2: 2014-2015 UNM Consolidated Revenue (in millions)10
7 Retrieved from http://fsd.unm.edu/resources/audrep14.pdf
8 Retrieved from http://www.unm.edu/~budget/consolidatedbudget/ConsolidatedRevenue2015.pdf
9 Retrieved from Financial Services Division Annual Reports http://fsd.unm.edu/resources/audrep14.pdf
10 Retrieved from http://www.unm.edu/~budget/consolidatedbudget/ConsolidatedRevenue2015.pdf
Description Total Percent
State Appropriations (Operating) 322.2$ 12.4%
Federal Appropriations 59.9$ 2.3%
Grants/Contracts 305.5$ 11.8%
Local Government Appropriations 106.0$ 4.1%
State Bonds 27.0$ 1.0%
Instiutional Bonds 0.1$ 0.0%
Tuition and Fees 211.0$ 8.1%
Sales and Services 1,310.5$ 50.4%
Private (Gifts and Contracts/Grants) 44.1$ 1.7%
Other Sources 159.0$ 6.1%
Use of Balance 53.8$ 2.1%
Total Revenue 2,599.1$ 100.0%
November 2015
17
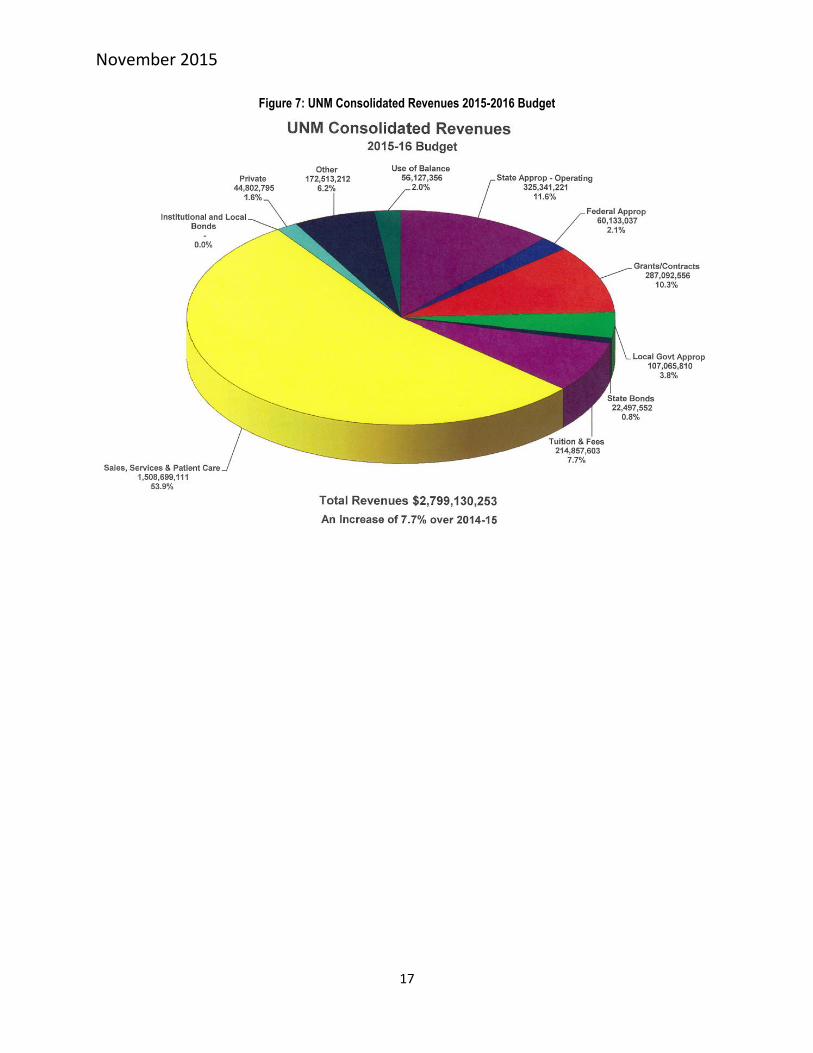
Figure 7: UNM Consolidated Revenues 2015-2016 Budget

November 2015
18
Figure 8: UNM Consolidated Expenditures 2015-2016 Budget
UNM’s fiscal year 2015-2016 (July 1, 2015-July 30, 2016) Operating Budget includes Operating Budgets
for the Main Campus; Health Sciences Center Academic Enterprise and Hospitals; the Gallup/Zuni,
Valencia, Los Alamos, and Taos Branch Campuses; as well as the Capital Budget for the entire University.
This provides the planned expenditure levels for the various programs and activities of the University.
The Board of Regents is required to determine budget category limits prior to approval of the budget
plan by the Higher Education Department and the State of New Mexico Department of Finance and
Administration Budget Division.
UNM Utilities and Infrastructure
The Physical Plant Department (PPD) is responsible for the care and upkeep of the physical campus
environment. This includes the indoor and outdoor environment of the north, main and south
campuses. Additionally, the department maintains the University’s district energy system providing
electricity, steam, chilled water for cooling, compressed air, and domestic water through its own
distribution systems while maintaining over 300 buildings and 350 acres of grounds. Electricity is
distributed underground from two electrical substations, while other utilities are primarily generated at
four locations across campus. The Ford Utilities Center has the ability to generate 188,000 pounds per
hour of steam, 4,000 tons of chilled water, six megawatts of electricity, and enough compressed air for
the campus. The center also operates two remote chilled water plants—the Lomas Chilled Water Plant
and the HSC Chilled Water Plant. These facilities have a combined chilled water capacity of 8,300 tons.
November 2015
19
The fourth location, the Cogeneration Plant, has the ability to generate 2.5 megawatts of electricity,
13,000 pounds per hour of steam, and 1,000 tons of chilled water.
Climate
Mean annual temperatures in New Mexico range from 64oF in the extreme southeast to 40oF or lower in
high mountains and valleys of the north. During the summer months, individual daytime temperatures
quite often exceed 100oF at elevations below 5,000 feet; but the average monthly maximum
temperatures during July, the warmest month, range from the low 90’s at lower elevations to the upper
70’s at high elevations. In January, the coldest month, average daytime temperatures range from the
middle 50s in the southern and central valleys to the low 20’s in the higher elevations of the north.
Minimum temperatures below freezing are common in all sections of the State during the winter, but
subzero temperatures are rare except in the mountains. The highest temperature recorded in New
Mexico is 122°F on June 27, 1994 at the Waste Isolation Pilot Plant (WIPP) site. The lowest temperature
recorded was -50 °F, on February 1, 1951 at Gavilan.
Average annual precipitation ranges from less than 10 inches over much of the southern desert and the
Rio Grande and San Juan Valleys to more than 40 inches at higher elevations in the State. Summer rains
fall almost entirely during brief, but frequently intense thunderstorms. July and August are the rainiest
months over most of the State, with from 30 to 40 percent of the year’s total moisture falling at that
time. During the warmest 6 months of the year, May through October, total precipitation averages from
60 percent of the annual total in the Northwestern Plateau to 80 percent of the annual total in the
eastern plains. Much of the winter precipitation falls as snow in the mountain areas, but it may occur as
either rain or snow in the valleys. Average annual snowfall ranges from about 3 inches at the Southern
Desert and Southeastern Plains stations to well over 100 inches at Northern Mountain stations. It may
exceed 300 inches in the highest mountains of the north.
The average number of hours of annual sunshine ranges from near 3,700 in the southwest to 2,800 in
the north-central portions.
Relative humidity ranges from an average of near 65 percent about sunrise to near 30 percent in mid-
afternoon; however, afternoon humidity in warmer months are often less than 20 percent and
occasionally may go as low as 4 percent. The low relative humidity during periods of extreme
temperatures eases the effect of summer and winter temperatures. These low humidity levels
contribute to decreased winter temperatures, since the atmosphere is unable to retain heat in the
evenings.
Scope of the Hazard Mitigation Plan The plan update process included seven major areas that were completed over the course of
approximately 12 months starting in December 2014. These areas included:
1. Planning and meetings
2. Outreach
3. Capabilities assessment

November 2015
20
4. Risk assessment including hazard identification and analysis
5. Mitigation strategy
6. Plan monitoring, evaluation, and updating
7. Plan adoption
The completion of each of these contributed to the overall HMP. The overall purpose of mitigation
planning is to identify and document local policies and actions that can be implemented over the long
term to reduce risk and future losses from hazards. The HMP helps UNM establish both short-term and
long-term goals.
In developing this HMP, UNM followed the most up-to-date FEMA guidance available, the March 2013
Local Mitigation Planning Handbook, as well as the September 2013 State of New Mexico Natural
Hazards Mitigation Plan (the most current State Mitigation Plan that was available), and the available
draft (August 2014) of the Bernalillo County/City of Albuquerque/Metropolitan Arroyo Flood Control
Authority/Village of Tijeras Hazard Mitigation Plan (hereafter referred to as the ‘local jurisdiction plan’).
Authority UNM is the authorizing jurisdiction for the HMP. Per 44 CFR Part 201.2, UNM is defined as a “local
government”. The key responsibilities of local governments are to:
1. Prepare and adopt a jurisdiction-wide natural hazard mitigation plan as a condition of receiving
project grant funds under the HMGP, in accordance with §201.6.
2. At a minimum, review and update the local mitigation plan every 5 years from date of plan
approval of the previous plan in order to continue program eligibility.
This HMP has been developed in accordance with current state and federal rules and regulations
governing local hazard mitigation plans:
1. Section 322, Mitigation Planning, of the Robert T. Stafford Disaster Relief and Emergency
Assistance Act, as enacted by Section 104 of the Disaster Mitigation Act of 2000 (P.L. 106-390)
2. Current Local Mitigation Planning requirements found in 44 CFR Part 201 – Mitigation Planning
This HMP shall be routinely monitored and revised to maintain compliance with the above provisions,
rules and legislation.

November 2015
21
Chapter 2 – Planning and Update Process The Planning and Update Process chapter describes how the plan was prepared for by the University of
New Mexico and includes the activities that make up the plan’s update, as well as the people that were
involved in the update process.
This section consists of the following subsections:
UNM Administrative Team
Pre-Disaster Mitigation Advisory Committee (PDMAC)
UNM Natural Hazards Pre-Disaster Mitigation Website
Meetings
Public Involvement and Outreach
State and Local Hazard Mitigation Plans
Agency and Organization Coordination
Future Development Trends
UNM Administrative Team A UNM Administrative Team led the planning and update process of the HMP Plan. The UNM
Administrative Team was led by the Principle Investigator (PI), Dr. Laura Banks, Director of the UNM
Center for Disaster Medicine and Assistant Professor for the UNM Department of Emergency Medicine.
The PI was responsible for meeting grant requirements, plan preparation, outreach and public meetings
and other administrative requirements deemed necessary for plan development. Assisting the PI was
Byron Piatt, Emergency Manager for the University of New Mexico and Ashley McConnell VanderJagt, a
Program Specialist with the Department of Emergency Medicine. Both have experience with mitigation
planning, critical infrastructure, risk assessment, and project management.
During the update process, the Administrative Team:
1. Collected data for the plan update
2. Developed outreach strategy
3. Launched and maintained the public PDM website 4. Met with the State Mitigation Officer
5. Organized PDMAC meetings
6. Reviewed the most up to date hazard information
7. Reviewed the Mitigation Workbook and Checklist
8. Updated the 2015 HMP document
The UNM HMP Administrative Team followed the hazard mitigation planning steps, activities and
process outlined in 44 CFR Part 201.6 and FEMA’s Local Mitigation Planning Handbook to develop this
Plan. The completed Local Mitigation Plan Review Tool in Appendix A provides the location of where
each requirement is met within the Plan.

November 2015
22
Pre-Disaster Planning Advisory Committee In the fall of 2014, the UNM Administrative Team reconvened the Pre-Disaster Mitigation Advisory
Committee (PDMAC). PDMAC consists of key stakeholders from multiple departments across UNM and
the surrounding jurisdiction, voluntarily advising the UNM Administrative Team in the update of the
HMP. These individuals are uniquely qualified to assist, have institutional knowledge, along with the
specific program experience of their current job positions. The 2015 PDMAC includes many who
participated in the creation of the 2010 plan as well as many new members. Individuals were invited to
participate in the PDMAC through email and telephone correspondence.
PDMAC Meetings
The members of the PDMAC met on the 2nd Wednesday of every month between December 2014 and
November 2015 (with the exception of April 2015). Meetings were scheduled in advance and posted on
the PDM website. Meetings were open to the public. Meeting agendas were distributed to members at
each meeting along with other documents pertinent to the agenda. Meeting minutes were taken at
each meeting and were posted to the PDM website. Documentation from the meetings are located in
Appendix B.
The PDMAC consists of the following members from a wide range of departments and agencies:
Table 3: UNM Pre-Disaster Mitigation Advisory Committee
Name Department Title
Adelicia Gunn UNM Office of Research Compliance Program Specialist
Alexandra Synder UNM Museum of Southwestern Biology
Collections Manager-Fishes
Ashley M. VanderJagt UNM Dept. of Emergency Medicine, Center for Disaster Medicine
Program Specialist
Ben Lawrence UNM Student Union Building Facilities Facilities Services Manager
Billy Hromas UNM Physical Plant Department Manager, Facilities Maintenance
Byron Piatt UNM Emergency Management University Emergency Manager
Chanda Cooper Begin UNM CCERT/Student Representative Student
Deborah Kuidis UNM Office of Research Compliance Manager, Industrial Security
Dianne Anderson UNM Communication and Marketing Director, University Communication
Edward Padilla UNM University Libraries Sr. Program Manager
Eric Woods UNM Information Technologies Information Security Manager
Gary Surad Bernalillo County Office of Emergency Management
Deputy Emergency Manager
James Shrum UNM Human Resources Client Services
Human Resources Consultant
Jeff Gassaway UNM Information Technologies University Information Security Officer
Jeffrey Zumwalt UNM Physical Plant Department Director
Joan Elizabeth Green UNM Accessibility Resource Center Director
Joshua Begaye UNM Student Union Building Facilities Facilities Services Manager
Kenedi Hubbard UNM Office of the President Strategic Support Manager

November 2015
23
Name Department Title
Laura Coffey Banks UNM Dept. of Emergency Medicine, Center for Disaster Medicine
Principle Investigator, Director
Mark Orgeron UNM Office of the Provost Professional Support Intern
Mark Reynolds UNM Information Technologies Associate Director
Matthew Jacob Gallegos
UNM Office of the Vice President for Research
Program Planning Officer
Michael Tuttle UNM Safety and Risk Services Associate Director
Peter Reickmann UNM Unrestricted Accounting, Main Financial Analyst
Robert Perry University of New Mexico Hospital Hospital Emergency Manager
Rodger Ebner City of Albuquerque, Office of Emergency Management
Director
Ruth Stoddard UNM Resident Life Student Housing Operations Manager
Scott Dotson UNM Athletics Manager, Sports Facilities and Events
Shirley Veronica Baros UNM Earth Data Analysis Center Director
Stephen Lockwood UNM Art Museums Collections Manager
Tim Gutierrez UNM Office of Student Services Associate Vice President
Tim Muller UNM HSC Office of Research University Biosafety Officer
Timothy Backes UNM Business Operations and Campus Dining Services
Associate Director
Heather Edgar Maxwell Museum Curator of Human Osteology
Wayne Sullivan UNM Residence Life Student Housing Director
UNM Natural Hazards Pre-Disaster Mitigation Website The PDM website was developed as a way to disseminate information on the HMP to PDMAC members
as well as UNM staff, faculty, and students, neighboring communities associations, and other
community stakeholders. Included on the website are meeting dates, meeting agendas, meeting notes,
Planning Team contact list, Advisory Committee members, and draft mitigation strategies. Draft versions
of the campus HMP are included so stakeholders can download the document for review purposes.
Reference materials such as relevant FEMA documents and county disaster plans are also available on
this website. The UNM Department of Emergency Medicine maintains the PDM website.
Public Involvement and Outreach The HMP Administrative Team used multiple methods to notify the UNM community of opportunities
available to participate in the HMP update. UNM staff, faculty, and students as well as local
neighborhood associations were sent email correspondence inviting them to attend PDMAC meetings.
UNM faculty and staff were notified via email correspondence. A formal letter was sent to all
departments across UNM to be emailed to their respective staff and faculty. UNM students were
notified via a similar letter that was sent out via email. Neighborhood associations were contacted via
email. All letters were similar, described the purpose of mitigation as well as the plan, the updating
process, and explained why their participation as a stakeholder was important. The general public was
invited via UNM Communication and Marketing Office to attend the meetings of the PDMAC and review

November 2015
24
the material available on-line via a UNM Newsroom article posted on May 14, 2015. These letters and
invitations are located in Appendix C.
Public outreach brought new members to the PDMAC from the University community, including UNM
staff and one UNM student. These individuals became members of the PDMAC and attended meetings
when possible. A meeting agenda was sent to all members of the PDMAC prior to the meetings for their
review. During meetings, all members of the PDMAC were encouraged to comment and give feedback.
Comments were also sent via email to the HMP administrative team from members of the PDMAC
throughout the updating process. Feedback from the PDMAC was incorporated into the entire update
process. As feedback was given, it was reviewed by the PDMAC and HMP administrative team, and using
group consensus, added into the plan or not. Multiple invitations were sent out to neighborhood
associations, however there was no feedback from this group.
Once a draft of the HMP was complete, the plan was posted on the website for general public to review
and comment, and the nearby neighborhood associations were again invited via email to review the
document and attend a meeting of the PDMAC.
The UNM community will be made aware of future opportunities for participation in HMP maintenance.
The PDM website will continue to be utilized to communicate opportunities with the public even after
the plan is approved and adopted. An up to date point of contact will be listed on the website for those
with questions or comments regarding the HMP.
State and Local Hazard Mitigation Plans and Programs In order to maintain consistency with local and State information, both the State of New Mexico and
Bernalillo County hazard mitigation plans were utilized as resources for valuable information on natural
hazards. The State of New Mexico’s Hazard Mitigation Plan was last updated in September of 2013. The
local jurisdiction finalized its hazard mitigation plan update during the development of this Plan.
The HMP addresses natural hazards covered in both the State Plan and the local jurisdiction plan. Many
of the hazards in the State Plan have a significant impact in the planning area. If a hazard has a very low
probability of occurring and/or has negligible impact (therefore is considered a nuisance), this is noted.
The Local Plan Integration section of the State Plan lists four hazards as the most significant in the state:
1. Wildland/Urban Interface Fire
2. Thunderstorm (including Lightning and Hail)
3. Flood
4. Drought
The State Plan divides New Mexico into 6 preparedness areas. UNM campuses and facilities are located
in 3 of these preparedness areas.
Preparedness Area #3
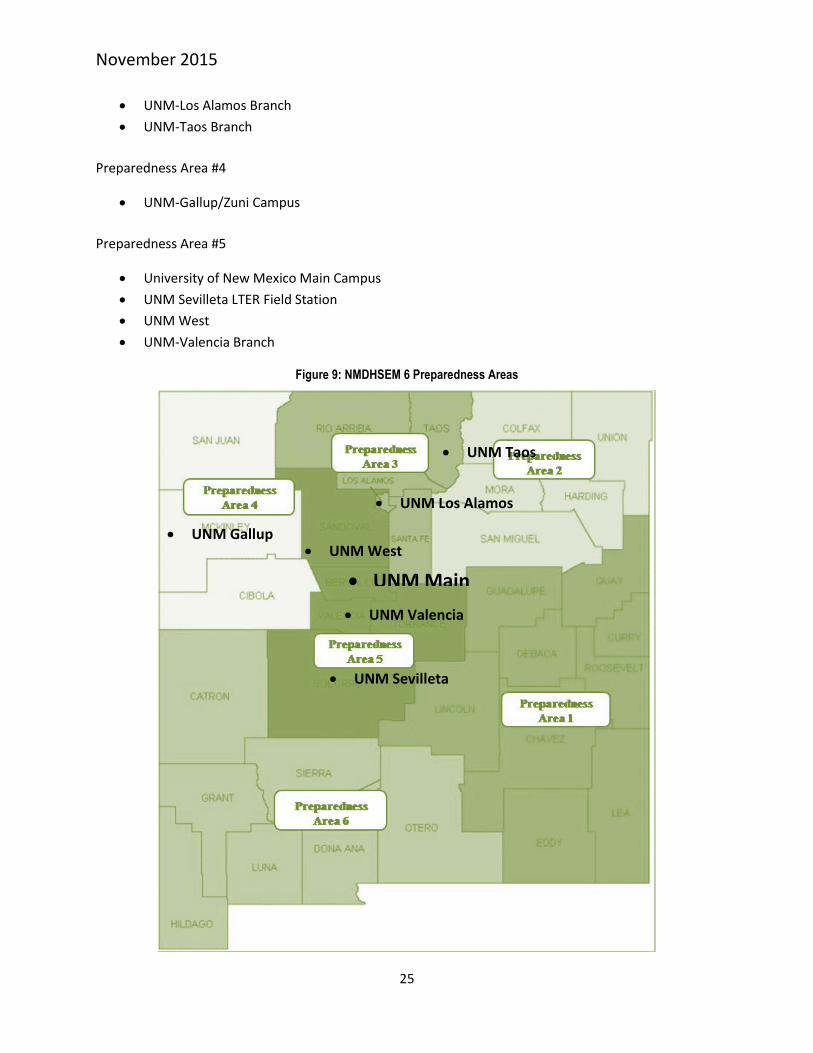
November 2015
25
UNM-Los Alamos Branch
UNM-Taos Branch
Preparedness Area #4
UNM-Gallup/Zuni Campus
Preparedness Area #5
University of New Mexico Main Campus
UNM Sevilleta LTER Field Station
UNM West
UNM-Valencia Branch
Figure 9: NMDHSEM 6 Preparedness Areas
UNM Taos
UNM Los Alamos
UNM Main
UNM Gallup
UNM Valencia
UNM Sevilleta
UNM West
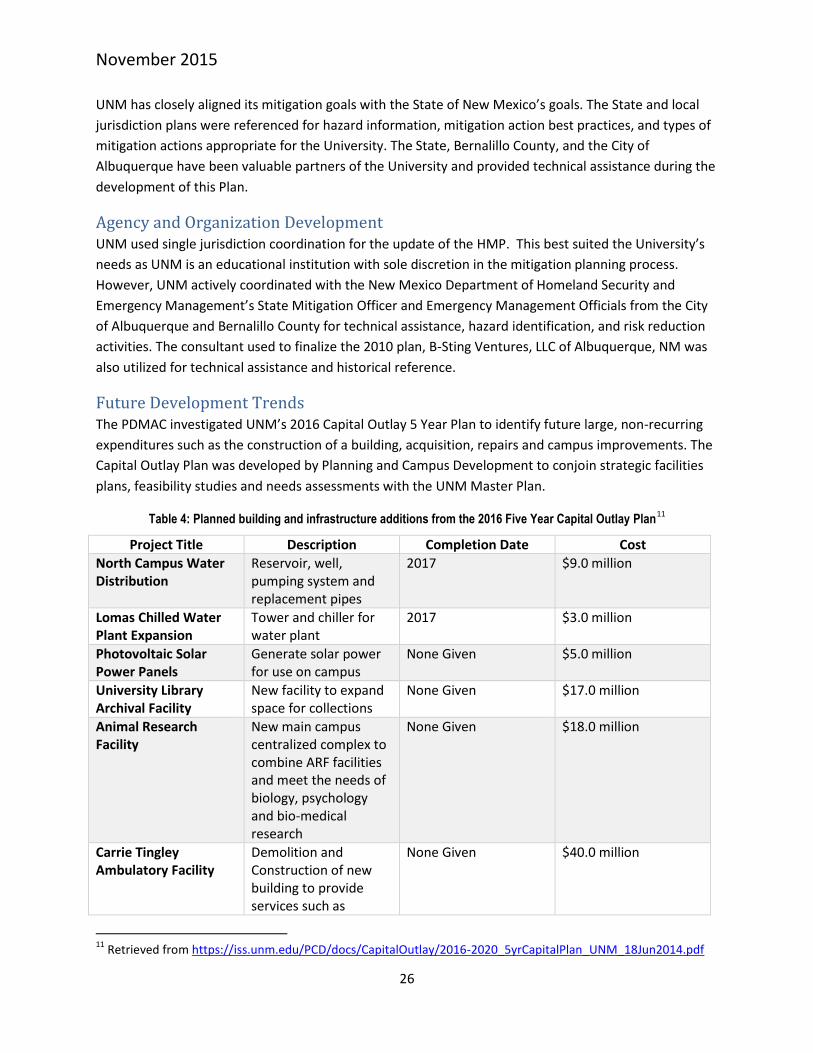
November 2015
26
UNM has closely aligned its mitigation goals with the State of New Mexico’s goals. The State and local
jurisdiction plans were referenced for hazard information, mitigation action best practices, and types of
mitigation actions appropriate for the University. The State, Bernalillo County, and the City of
Albuquerque have been valuable partners of the University and provided technical assistance during the
development of this Plan.
Agency and Organization Development UNM used single jurisdiction coordination for the update of the HMP. This best suited the University’s
needs as UNM is an educational institution with sole discretion in the mitigation planning process.
However, UNM actively coordinated with the New Mexico Department of Homeland Security and
Emergency Management’s State Mitigation Officer and Emergency Management Officials from the City
of Albuquerque and Bernalillo County for technical assistance, hazard identification, and risk reduction
activities. The consultant used to finalize the 2010 plan, B-Sting Ventures, LLC of Albuquerque, NM was
also utilized for technical assistance and historical reference.
Future Development Trends The PDMAC investigated UNM’s 2016 Capital Outlay 5 Year Plan to identify future large, non-recurring
expenditures such as the construction of a building, acquisition, repairs and campus improvements. The
Capital Outlay Plan was developed by Planning and Campus Development to conjoin strategic facilities
plans, feasibility studies and needs assessments with the UNM Master Plan.
Table 4: Planned building and infrastructure additions from the 2016 Five Year Capital Outlay Plan11
Project Title Description Completion Date Cost
North Campus Water Distribution
Reservoir, well, pumping system and replacement pipes
2017 $9.0 million
Lomas Chilled Water Plant Expansion
Tower and chiller for water plant
2017 $3.0 million
Photovoltaic Solar Power Panels
Generate solar power for use on campus
None Given $5.0 million
University Library Archival Facility
New facility to expand space for collections
None Given $17.0 million
Animal Research Facility
New main campus centralized complex to combine ARF facilities and meet the needs of biology, psychology and bio-medical research
None Given $18.0 million
Carrie Tingley Ambulatory Facility
Demolition and Construction of new building to provide services such as
None Given $40.0 million
11
Retrieved from https://iss.unm.edu/PCD/docs/CapitalOutlay/2016-2020_5yrCapitalPlan_UNM_18Jun2014.pdf

November 2015
27
Project Title Description Completion Date Cost
pediatric primary and specialty outpatient providers, rehabilitation services, diagnostic and imaging services, and more.
Future goals from the UNM Consolidated Master Plan (adopted 2011):
• Add a new adult acute care wing of the hospital located near I-25 and Lomas. Build new clinics
along University Boulevard.
• Develop a dedicated transit line linking new healthcare facilities west of University Blvd. with
existing UNM Hospital
• Add research and academic facilities on the east side of the campus.
• Place emphasis on pedestrian improvements, including the Healing Garden, Tucker Road, and
major street crossings.
• Expand the number of student beds by 2,000.
• Redevelop outdated dormitories and provide a wider range of housing options.
• Develop a student-centered recreation center.
• Increase allowable building heights to five stories.
• Reinforce existing pedestrian malls and strengthen east-west pedestrian routes to better
connect the residential side of the campus with the academic area on the west.
• Limit auto access to portions of Redondo Drive and prioritize transit and bike.
• Expand and renovate the primary athletic venues: the Pit and University Stadium.
• Develop retail and other commercial uses along Cesar Chavez and University.
• Develop a new housing village west of the Pit for upperclassmen.
• Strengthen the campus character of the Science and Technology Park. Add structured parking
and usable open space.
• Develop better pedestrian, bike, and transit connections to the Central and North Campuses.
• UNM IT data center planning
• Fiber connectivity build out for the State of New Mexico
In summary, the update process for the UNM HMP was open and comprehensive, and included input
from a wide variety of stakeholders, as well as the most current hazard and vulnerability data available
to the team.

November 2015
28
Chapter 3 - Community Capabilities The PDMAC conducted a thorough review of all capabilities and resources available to accomplish
mitigation and reduce long term vulnerability. This capability and resource assessment section identifies
and examines the existing capabilities of the University of New Mexico that currently reduce disaster
losses or could be used to reduce losses in the future, as well as capabilities that inadvertently increase
risks in the community. State and Federal resources are also identified. PDMAC collected and reviewed
information and divided the capabilities and resources into four categories:
Planning and Regulatory
Administrative and technical
Financial
Educational and Outreach
Planning and Regulatory Capabilities Planning and regulatory capabilities are plans, policies, and programs that relate to guiding and
managing the operations, growth and development of the University of New Mexico. These capabilities
can be used for mitigation planning and to implement specific mitigation actions. The planning and
regulatory capabilities documented below may enable or impede mitigation activities, which has been
taken into account in the creation of mitigation goals.

November 2015
29
Table 5: List of current UNM Plans as of August 2015
Department Title Last Modified
UNM Consolidated Master Plan 2015
UNM Capital Improvements Plan 2014
UNM College of University Libraries and Learning Sciences Response Manual
2015
UNM Museum of Southwest Biology Pre-Disaster Mitigation Plan 2008
UNM Information Technologies Strategic Plan 2012
UNM IT Organization Chart 2014/2015
UNM IT Standards (http://cio.unm.edu/standards/) various
UNM Crisis Communication Plan 2015 (draft)
UNM Communication and Marketing Department (CAM) Emergency Plan
August 2008
UNM Health Sciences Library and Informatics Center Area Emergency Plan with Special Emphasis on Disasters
March 2008
UNM Center on Alcoholism, Substance Abuse, and Addictions (CASAA) Environmental Plan
March 2006
UNM Department of Electrical & Computer Engineering Building Emergency Response Plan
November 2008
UNM Art Museum and ITS Jonson Gallery Emergency/Disaster Response and Preparedness Plan
2008
UNM Libraries Emergency Preparedness and Recovery Plan 2004
UNM Animal Resource Facility Crisis Plan 2008
UNM Physical Plant Department 5 Year Strategic Plan 2012-2017 2/24/15
UNM Hospital Communications Equipment Failure Plan 12/08/14
UNM Hospital Emergency Management Plan 2014-2015 2014
UNM Hospital Hazardous Materials and Waste Management Plan 2/13/15
UNM Hospital Life Safety Management Plan 2/13/15
UNM Hospital Safety Management Plan 2/13/15
UNM Hospital Utility Systems Management Plan 2/13/15

November 2015
30
Department Title Last Modified
UNM-Gallup UNM-Gallup Strategic Plan January 2012
UNM-Taos UNM-Taos Strategic Plan 2014-2019 August 2014
UNM-Valencia UNM-Valencia Strategic Plan for 2012-2017 Unknown

November 2015
31
Table 6: List of UNM Policies as of August 2015
Policy Description Effect
APPM-2100: Sustainability
Policy to maintain healthy relationships throughout the network of interactions that satisfy the basic needs of health, shelter, food, and transportation.
UNM encourages harmony between sustainable goals of environmental protection and economic opportunity within the context of its mission; could ease the way for a wide range of mitigation activities
APPM-2500: Acceptable Computer Use Policy
Outlines proper and improper behaviors, defines misuse and incidental use, explains rights and responsibilities, and briefly reviews the repercussions of violating these codes of conduct.
UNM encourages, supports, and protects freedom of expression as well as an open environment to pursue scholarly inquiry and to share information; could ease the way for improvements to IT infrastructure.
APPM-2520 Computer Security Controls and Access to Sensitive Information
Describes additional requirements and responsibilities applicable to faculty, staff, students, vendors and volunteers who are in IT-related positions or are in positions that have access to sensitive and protected information.
UNM must safeguard the rights and responsibilities provided for in Policy 2500 while also ensuring system and data availability, reliability, and integrity; could ease the way improvements to IT infrastructure as well as policy changes.
APPM-2550: Information Security
Policy and procedures for the basic components of the UNM Information Security Program which applies to employees, contractors, vendors, volunteers, and all other individuals who work with UNM data and information.
UNM is committed to protecting and safeguarding all data and information that it creates, collects, generates, stores, and/or shares; could ease the way for improvements to IT infrastructure.
APPM-2560 Information Technology Governance
Describes the IT Governance framework and defines the roles and responsibilities of individuals and groups involved with IT governance to ensure effective input and decision-making pertaining to IT policies, standards, guidelines, processes, and procedures.
UNM information technology (IT) resources, applications, and manpower must be managed in a manner that enables the University to apply new technologies and adopt new processes effectively while enhancing and encouraging the innovation required for the University to excel in all aspects of its mission; could ease the way for improvements to IT infrastructure.
APPM-3250: Employee Orientation
Defines responsibilities and describes the process to ensure consistency
UNM is committed to giving new employees information

November 2015
32
throughout the stages of orientation. they need to become productive members of the campus community; could ease the way for updated safety and security education and training.
APPM -3290: Professional Development and Training
Policy and Procedures for providing employees with opportunities to develop and advance skills and abilities for performance within their current position and career advancement within the University.
UNM is committed to providing employees with opportunities to develop and advance skills and training; could ease the way for updated safety and security training for current employees.
APPM-5150: University Wayfinding System and Sign Standards
Describes the requirements and procedures necessary to ensure a successful and cost effective Wayfinding System.
UNM is committed to providing a consistent and cohesive visual identity through signage and other mechanisms to guide individuals in finding their way to various destinations throughout UNM; could ease the way for additional mechanisms to enhance accessibility and public safety.
APPM-5310 Information Technology for Facilities
Defines the policies and procedures necessary to ensure that IT needs are adequately and cost effectively provided for in the University's facilities and utilities planning, design, and construction processes.
UNM recognizes the importance and cost of IT in the educational, administrative, research, and public service roles of the University; could ease the way for improvements to IT infrastructure.
APPM-6100: Risk Management
Defines responsibilities and describes the Policy and Procedures for UNM’s safety training and loss control program.
UNM is committed to protect the health and safety of the campus community and the public from hazards and to protect the reputation and physical resources of the University against loss or damage; could ease the way for a wide range of mitigation activities.
APPM-6110: Safety & Risk Services
Describes UNM’s safety and loss control program administered by the University’s Safety & Risk Services Department (described more fully in APPM-6100). Describes the responsibilities of UNM’s Safety & Risk Services Department.
UNM is committed to providing a safe and healthful work, educational, and living environment, to having a positive impact on the natural environment, and to protecting the University’s physical resources and financial assets; could ease the way for a wide

November 2015
33
range of mitigation activities
APPM-6130: Emergency Control
Describes the responsibilities of staff, faculty, and students at University entities in the city of Albuquerque during an incident.
UNM is obligated to conduct its education, business, clinical, and support activities on a regular basis unless conditions exist which may endanger the University community or impact the ability to operate; could ease the way for Continuity of Operations activities.
APPM-6150: Casualty and Liability Insurance and Claims
Describes procedures for reporting personal or property losses and provides general information on the University's insurance coverage.
Could assist with linking future claims from natural disasters with future mitigation planning. Could change and improve future plans and regulations.
APPM-6410: Museums and Collections
Policy and procedures for all UNM Museums and Collections to ensure proper preservation and accessibility for current and future generations.
Evidence that UNM Museums and Collections are essential to UNM's mission-material objects represent a tangible and irreplaceable source of information for teaching, research, and public appreciation; could ease the way for mitigation activities related to museums and collections.
RPM-Section 2.10.1: Historic Preservation
All buildings, landscapes and places or objects of historic significance will be preserved and protected. Removal of or major alteration to any buildings designated by the University Historic Preservation Committee to be of historic significance must be approved by the Board of Regents.
UNM believes these unique historic resources provide a connection to the past and are essential to alumni development, student recruitment, and the public image of the University; may inhibit mitigation activities that modify a buildings pueblo revival architectural style, especially those on the National Registry of Historical Places.
RPM-Section 2.10: Architectural Style of Campus Buildings and Campus Master Plan
All buildings constructed on the central campus continue to be designed in the Pueblo Revival style and that buildings on the north and south campuses reflect the general character of this style to the extent possible given the special needs for facilities in these areas.
UNM believes the pueblo revival architectural style is a unique feature of the central campus worth preservation and enhancement; may inhibit mitigation activities that modify a buildings pueblo revival architectural style, especially those on the National Registry

November 2015
34
of Historical Places.
UNMH Information Technology Security Policy
Sets forth the UNM Hospitals’ information security organizational structure that serves to preserve the confidentiality, integrity, and availability of UNM Hospitals’ information.
Evidence that UNMH believes protecting the integrity, confidentiality and availability of UNM Hospitals’ IT Systems and Information is important; could ease the way for improvements to IT infrastructure.
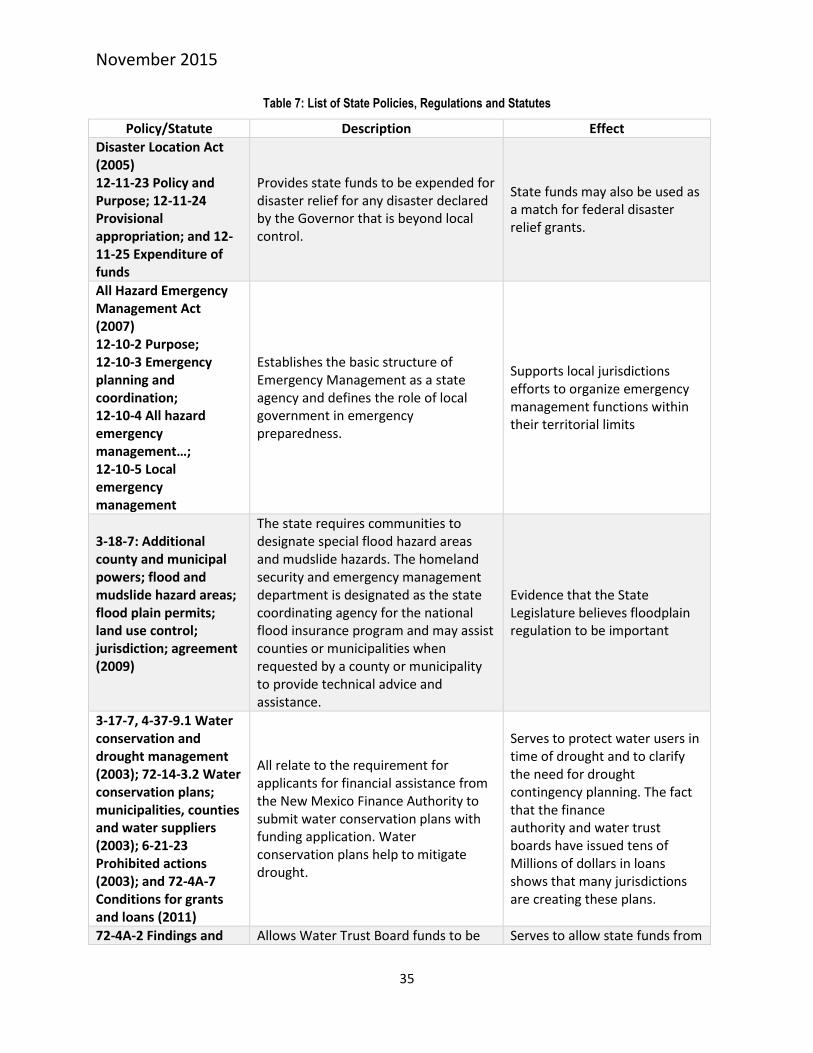
November 2015
35
Table 7: List of State Policies, Regulations and Statutes
Policy/Statute Description Effect
Disaster Location Act (2005) 12-11-23 Policy and Purpose; 12-11-24 Provisional appropriation; and 12-11-25 Expenditure of funds
Provides state funds to be expended for disaster relief for any disaster declared by the Governor that is beyond local control.
State funds may also be used as a match for federal disaster relief grants.
All Hazard Emergency Management Act (2007) 12-10-2 Purpose; 12-10-3 Emergency planning and coordination; 12-10-4 All hazard emergency management…; 12-10-5 Local emergency management
Establishes the basic structure of Emergency Management as a state agency and defines the role of local government in emergency preparedness.
Supports local jurisdictions efforts to organize emergency management functions within their territorial limits
3-18-7: Additional county and municipal powers; flood and mudslide hazard areas; flood plain permits; land use control; jurisdiction; agreement (2009)
The state requires communities to designate special flood hazard areas and mudslide hazards. The homeland security and emergency management department is designated as the state coordinating agency for the national flood insurance program and may assist counties or municipalities when requested by a county or municipality to provide technical advice and assistance.
Evidence that the State Legislature believes floodplain regulation to be important
3-17-7, 4-37-9.1 Water conservation and drought management (2003); 72-14-3.2 Water conservation plans; municipalities, counties and water suppliers (2003); 6-21-23 Prohibited actions (2003); and 72-4A-7 Conditions for grants and loans (2011)
All relate to the requirement for applicants for financial assistance from the New Mexico Finance Authority to submit water conservation plans with funding application. Water conservation plans help to mitigate drought.
Serves to protect water users in time of drought and to clarify the need for drought contingency planning. The fact that the finance authority and water trust boards have issued tens of Millions of dollars in loans shows that many jurisdictions are creating these plans.
72-4A-2 Findings and Allows Water Trust Board funds to be Serves to allow state funds from

November 2015
36
Policy/Statute Description Effect
purpose (2003) through 72-4A-7 Conditions for grants and loans (2011)
used for water conservation and water re-use activities. This serves to mitigate drought.
the water trust board to be used for water conservation and re-use activities, which had previously been prohibited. It will promote water conservation in drought prone areas.
72-14-3.1 State Water Plan: purpose; contents (2003)
Directs the Interstate Stream Commission to prepare a comprehensive state water plan. This plan helps mitigate drought.
Requires a state plan to allocate the state’s water resources and plan for future needs. It is beneficial to the entire state, which is facing drought conditions.
68-2-34 Fire planning task force; duties (2003)
Creates the Fire Planning Task Force and outlines its duties.
This statute is beneficial in that the Fire Planning Task Force must identify areas of unusually high fire hazard and propose mitigation measures.
International Building Code
All new buildings in the state are required to meet or exceed the standards in the International Building Code or the International Residential building code. This code requires a certain level of protection be installed in new buildings, to protect against wind, snow loads, fires, earthquakes and other natural hazards.
UNM is responsible for monitoring its own development and submits Capital Project requests. The State permits new construction through the NM Construction Industries Division and all buildings are inspected following the State adopted IBC. UNM is not self-regulating and therefore, is required to follow the Governor's mandate to build all new buildings at a minimum of LEED Silver.
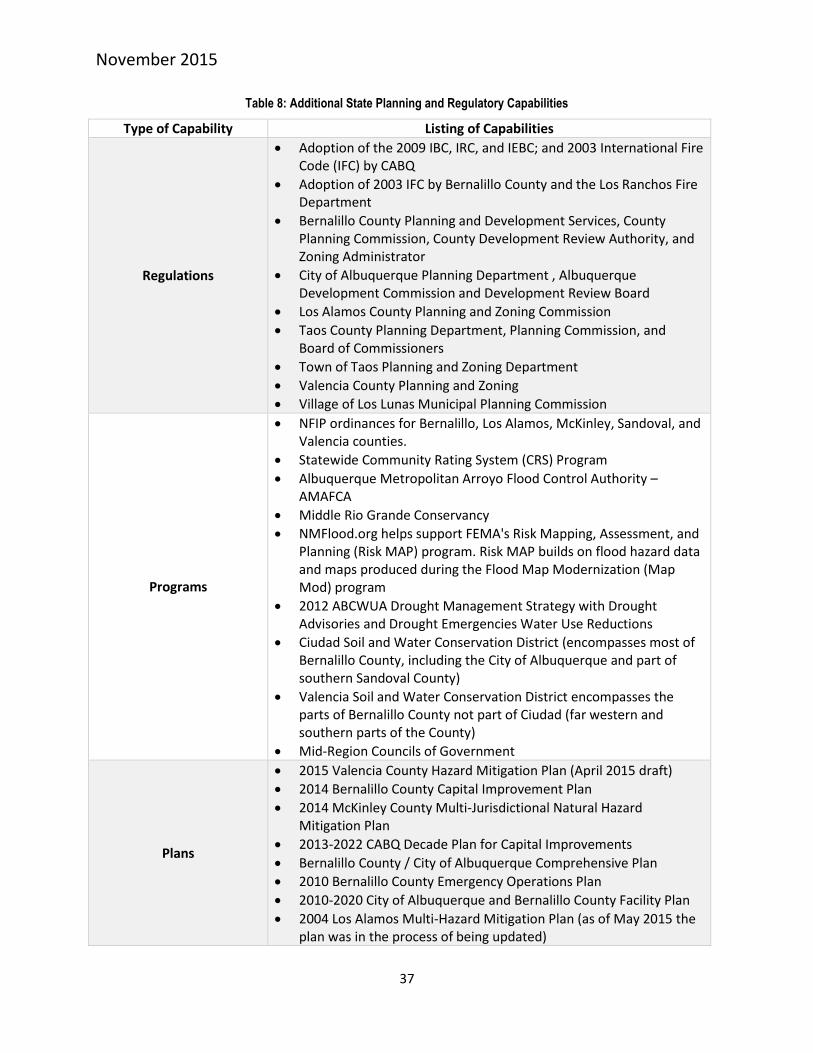
November 2015
37
Table 8: Additional State Planning and Regulatory Capabilities
Type of Capability Listing of Capabilities
Regulations
Adoption of the 2009 IBC, IRC, and IEBC; and 2003 International Fire Code (IFC) by CABQ
Adoption of 2003 IFC by Bernalillo County and the Los Ranchos Fire Department
Bernalillo County Planning and Development Services, County Planning Commission, County Development Review Authority, and Zoning Administrator
City of Albuquerque Planning Department , Albuquerque Development Commission and Development Review Board
Los Alamos County Planning and Zoning Commission
Taos County Planning Department, Planning Commission, and Board of Commissioners
Town of Taos Planning and Zoning Department
Valencia County Planning and Zoning
Village of Los Lunas Municipal Planning Commission
Programs
NFIP ordinances for Bernalillo, Los Alamos, McKinley, Sandoval, and Valencia counties.
Statewide Community Rating System (CRS) Program
Albuquerque Metropolitan Arroyo Flood Control Authority – AMAFCA
Middle Rio Grande Conservancy
NMFlood.org helps support FEMA's Risk Mapping, Assessment, and Planning (Risk MAP) program. Risk MAP builds on flood hazard data and maps produced during the Flood Map Modernization (Map Mod) program
2012 ABCWUA Drought Management Strategy with Drought Advisories and Drought Emergencies Water Use Reductions
Ciudad Soil and Water Conservation District (encompasses most of Bernalillo County, including the City of Albuquerque and part of southern Sandoval County)
Valencia Soil and Water Conservation District encompasses the parts of Bernalillo County not part of Ciudad (far western and southern parts of the County)
Mid-Region Councils of Government
Plans
2015 Valencia County Hazard Mitigation Plan (April 2015 draft)
2014 Bernalillo County Capital Improvement Plan
2014 McKinley County Multi-Jurisdictional Natural Hazard Mitigation Plan
2013-2022 CABQ Decade Plan for Capital Improvements
Bernalillo County / City of Albuquerque Comprehensive Plan
2010 Bernalillo County Emergency Operations Plan
2010-2020 City of Albuquerque and Bernalillo County Facility Plan
2004 Los Alamos Multi-Hazard Mitigation Plan (as of May 2015 the plan was in the process of being updated)

November 2015
38
Type of Capability Listing of Capabilities
2002 Bernalillo County Wildland Urban Interface Area Inventory Assessment
Taos County Hazard Mitigation Plan is out for RFP as of May 2015 and should be completed by the end of the 2015-2016 Fiscal Year.
Various Sector and Neighborhood Development Plans
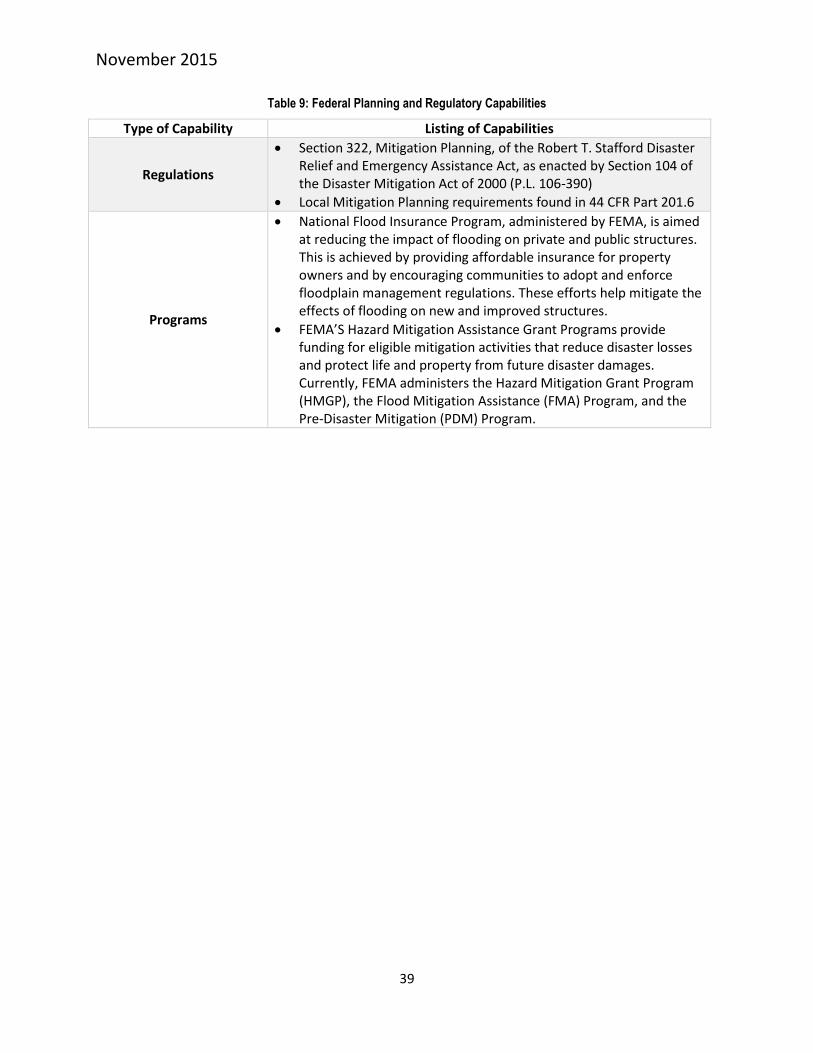
November 2015
39
Table 9: Federal Planning and Regulatory Capabilities
Type of Capability Listing of Capabilities
Regulations
Section 322, Mitigation Planning, of the Robert T. Stafford Disaster Relief and Emergency Assistance Act, as enacted by Section 104 of the Disaster Mitigation Act of 2000 (P.L. 106-390)
Local Mitigation Planning requirements found in 44 CFR Part 201.6
Programs
National Flood Insurance Program, administered by FEMA, is aimed at reducing the impact of flooding on private and public structures. This is achieved by providing affordable insurance for property owners and by encouraging communities to adopt and enforce floodplain management regulations. These efforts help mitigate the effects of flooding on new and improved structures.
FEMA’S Hazard Mitigation Assistance Grant Programs provide funding for eligible mitigation activities that reduce disaster losses and protect life and property from future disaster damages. Currently, FEMA administers the Hazard Mitigation Grant Program (HMGP), the Flood Mitigation Assistance (FMA) Program, and the Pre-Disaster Mitigation (PDM) Program.

November 2015
40
Administrative and Technical Capabilities Administrative and Technical capabilities refer to University of New Mexico staff, faculty, and students,
as well as state and federal partners, and their skills and tools that can be used for mitigation planning
and to implement specific mitigation actions.
Table 10: List of UNM Administrative and Technical Capabilities
Department Name Skills
UNM Art Museums Technical expertise on the collections of UNM
UNM Capital Outlay Committee (COC)
Administers the process and identifies potential capital outlay projects/targets for the following year
UNM Center for Disaster Medicine/Dept. of Emergency Medicine
Project management, mitigation planning, and emergency management
UNM Earth Data Analysis Center (EDAC)
Technical expertise, GEOSPATIAL SUPPORT, engineering, and building knowledge
UNM Emergency Manager
Oversees and coordinates all emergency planning and management operations for the University, to include University-wide emergency preparedness programs and initiatives.
UNM Physical Plant Department (PPD)
Knowledge and technical expertise on the physical campus (including all campuses and support for branch campuses)
UNM Safety and Risk Services Knowledge and technical expertise on risk management, environmental affairs, and more.
Table 11: State Administrative and Technical Capabilities
Agency Name Skills
Bernalillo County
Emergency response capacity includes 25 first responders and 6 fire rescue trucks
Bernalillo County Fire Districts (12)
Response capacity includes a daily minimum on-duty staffing level of 57 firefighters, paramedics, lieutenants, captains and battalion commanders.
Bernalillo County Office of Homeland Security and Emergency Management
Technical assistance, planning, and emergency management
Bernalillo County Sheriff’s Department
Largest sheriff department in the state
City of Albuquerque Office of Emergency Management
Technical assistance, planning, and emergency management
New Mexico Department of Homeland Security and Emergency Management (NMDHSEM)
State funded mitigation personnel, technical assistance, planning, and emergency management
Statewide Floodplain Managers Manage floodplain resources and flood mitigation
Statewide Police and Fire Departments
Technical assistance, planning, and emergency management and response

November 2015
41
Table 12: Federal Administrative and Technical Capabilities
Agency Name Skill
US Army Corps of Engineers (USACE) Technical and planning assistance needed to support effective floodplain management and the preparation of comprehensive plans for the development.
US Federal Emergency Management Agency (FEMA)
Funding and technical assistance, training in disaster mitigation, preparedness, and planning, NFIP, flood mapping, and more.
US National Earthquake Hazards Reduction Program
Training, planning and technical assistance under grants to States or local jurisdictions
National Science Foundation National Earthquake Hazard Reduction Program (NEHRP) in Earth Sciences, Hazard Reduction Program
New Mexico Department of Homeland Security and Emergency Management (NMDHSEM)
State funded mitigation personnel, technical assistance, planning, and emergency management
US United States Geological Survey (USGS) Expertise in mapping for use in floods and other hazards

November 2015
42
Financial Capabilities Financial capabilities are the resources UNM has access to or is eligible to use to fund mitigation actions.
The following grant programs are mostly federal in origin and directly or indirectly relate to mitigation.
Some are for specific hazards, while others can be applied to any hazard that UNM needs to address.
Table 13: Federal and State Funding Sources
Name of Program Primary Purpose
FEMA Public Assistance 406 Mitigation
For damaged public structures in a Presidential disaster declaration area that are otherwise eligible to receive Public Assistance funds, mitigation measures to reduce future risk can be considered. See http://www.fema.gov/public-assistance-local-state-tribal-and-non-profit/hazard-mitigation-funding-under-section-406-0 for more information.
FEMA Hazard Mitigation Grant Program (HMGP)
Following a Presidential disaster declaration, this program funds mitigation projects and actions that are projected to reduce future losses in excess of the projects’ costs. See http://www.fema.gov/hazard-mitigation-grant-program for more information.
FEMA Pre-Disaster Mitigation Program (PDM)
From an annual Congressional appropriation, this program funds mitigation projects and actions that are projected to reduce future losses in excess of the projects’ costs. See http://www.fema.gov/pre-disaster-mitigation-grant-program for more information.
National Flood Insurance Program
Formula grants to States to assist communities to comply with NFIP floodplain management requirements (Community Assistance Program) flood insurance rate maps and flood plain management maps for NFIP communities. UNM does not participate in the NFIP however, the communities that UNM is located within do.
USACE Section 205 Authority
Provides authority to the Corps of Engineers to plan and construct small flood damage reduction projects (structural and nonstructural) that have not already been specifically authorized by Congress.
USACE Section 219 of the Water Resources Development Act of 1992 (WRDA92), Environmental Infrastructure, as amended
Provides assistance to non-federal interests for carrying out water-related environmental infrastructure and resource protection and development projects, including wastewater treatment and related facilities, water supply, storage, treatment, and distribution facilities. Such assistance may be in the form of technical, planning, and design assistance as well as construction assistance for defined projects and locations with specific amounts authorized for each location. A non-federal cost share of not less than 25% is required for all assistance under Section 219.
USFS Collaborative Forest Restoration Program (CFRP)
Assists public or private forest owners with an opportunity to reduce wildfire dangers that threaten the community as a whole. 80% Federally funded.

November 2015
43
Name of Program Primary Purpose
USGS Earthquake Hazards Program
Annual Program announcement through http://www.grants.gov/ for competitive proposals for grants and cooperative agreements to support research in earthquake hazards, the physics of earthquakes, earthquake occurrence, and earthquake safety policy.
New Mexico Community Foundation (NMCF)
NMCF is a statewide endowment-building and grant-making organization that serves and invests in New Mexico’s people, communities and environment. With partners in every county, NMCF promotes philanthropy as a tool for building community assets, relationships and self-reliance. NMCF provides grants in several areas related to hazard mitigation and forest stewardship. See www.nmcf.org for more information.
UNM Mitigation Resources
UNM relies exclusively upon federal mitigation grant programs available through the NMDHSEM and
FEMA to fund mitigation projects. There is currently no university funding sources identified for
mitigation projects. UNM may pursue outside funding sources as identified by the State of New Mexico.
State Mitigation Resources
The State of New Mexico does not have any pre- or post-disaster mitigation grant programs or funding
of its own. The State acts as the grantee for federal mitigation grant programs, evaluates and
recommends projects to FEMA for funding, and passes federal grant funds through to the sub-grantees.
The non-federal share is usually borne by the applicant, although on rare occasions the state may
contribute to the non-federal share. Applicants may meet their match by cash, in-kind services, or a
combination of the two. Future funding of all federal grants depends upon continued funding by
Congress. Apart from meeting the requirements of federal programs and technical assistance, the State
and UNM have limited mitigation funding.
Insurance
UNM is insured by the State of New Mexico Property Certificate of Coverage. UNM is not insured by the
National Flood Insurance Program. The policy of insurance is "all risk", subject to exclusions. "Flood" is
not an exclusion. Some property is excluded, but primary buildings and property are not. Coverage
includes money and securities, valuable papers, and vehicles, now existing or hereafter acquired, owned
by the Governmental Entity, in the care, custody and control of the Governmental Entity for which the
Governmental Entity is legally liable, or for which the Governmental Entity has assumed liability prior to
loss wherever situated, not otherwise excluded. The Public Property Reserve Fund covers against all
risks of direct physical loss or damage not otherwise excluded occurring during the period of the
Certificate to covered property, including the expense of removal of debris of covered property
damaged by a covered peril.
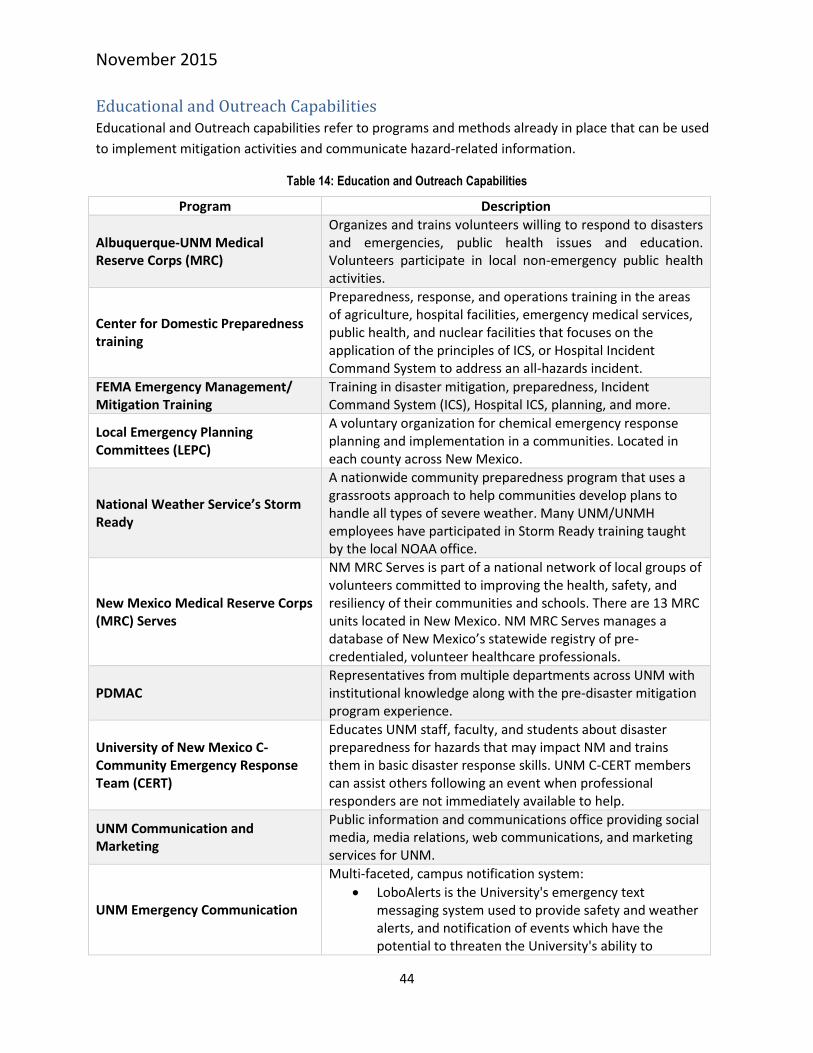
November 2015
44
Educational and Outreach Capabilities Educational and Outreach capabilities refer to programs and methods already in place that can be used
to implement mitigation activities and communicate hazard-related information.
Table 14: Education and Outreach Capabilities
Program Description
Albuquerque-UNM Medical Reserve Corps (MRC)
Organizes and trains volunteers willing to respond to disasters and emergencies, public health issues and education. Volunteers participate in local non-emergency public health activities.
Center for Domestic Preparedness training
Preparedness, response, and operations training in the areas of agriculture, hospital facilities, emergency medical services, public health, and nuclear facilities that focuses on the application of the principles of ICS, or Hospital Incident Command System to address an all-hazards incident.
FEMA Emergency Management/ Mitigation Training
Training in disaster mitigation, preparedness, Incident Command System (ICS), Hospital ICS, planning, and more.
Local Emergency Planning Committees (LEPC)
A voluntary organization for chemical emergency response planning and implementation in a communities. Located in each county across New Mexico.
National Weather Service’s Storm Ready
A nationwide community preparedness program that uses a grassroots approach to help communities develop plans to handle all types of severe weather. Many UNM/UNMH employees have participated in Storm Ready training taught by the local NOAA office.
New Mexico Medical Reserve Corps (MRC) Serves
NM MRC Serves is part of a national network of local groups of volunteers committed to improving the health, safety, and resiliency of their communities and schools. There are 13 MRC units located in New Mexico. NM MRC Serves manages a database of New Mexico’s statewide registry of pre-credentialed, volunteer healthcare professionals.
PDMAC Representatives from multiple departments across UNM with institutional knowledge along with the pre-disaster mitigation program experience.
University of New Mexico C-Community Emergency Response Team (CERT)
Educates UNM staff, faculty, and students about disaster preparedness for hazards that may impact NM and trains them in basic disaster response skills. UNM C-CERT members can assist others following an event when professional responders are not immediately available to help.
UNM Communication and Marketing
Public information and communications office providing social media, media relations, web communications, and marketing services for UNM.
UNM Emergency Communication
Multi-faceted, campus notification system:
LoboAlerts is the University's emergency text messaging system used to provide safety and weather alerts, and notification of events which have the potential to threaten the University's ability to

November 2015
45
Program Description
conduct regular activities. The system also includes a warning siren, email alerts, web page updates, LoboAlerts Twitter, and LoboAlerts Facebook.
UNM Community Communications is a free of charge service provided to the community at large that provides information to the surrounding campus community regarding important events.
UNM Emergency Alert Sirens are sounded in the event of an emergency that makes it dangerous to be outdoors, such as a severe lightning storm, an environmental hazard or a threat from an armed individual. During an alert, people who are not on campus and hear the siren should not come on campus. People who are on campus should seek shelter in the nearest building. The system is tested at the beginning each semester to help familiarize the campus community with the sounds. Tests are broadly announced in advance through the UNM Webpage, email messages and local notices.
UNM Emergency Preparedness website
Provides information and resources to ensure the safety of the UNM community such as a 10 minute Emergency Preparedness Training, campus preparedness, personal preparedness, and more.
UNM Healthcare Emergency Response Team (UHERT)
UHERT is a state-wide medical response team of volunteers primarily affiliated with UNMH and UNM. The team provides qualified medical personnel to the state in the event of an emergency.
National Flood Insurance Program The National Flood Insurance Program (NFIP) is aimed at reducing the impact of flooding on private and
public structures. This is achieved by providing affordable insurance for property owners and by
encouraging communities to adopt and enforce floodplain management regulations. These efforts help
mitigate the effects of flooding on new and improved structures. Overall, the program reduces the
socio-economic impact of disasters by promoting the purchase and retention of Risk Insurance in
general, and National Flood Insurance in particular. UNM is currently not participating in the NFIP. UNM
is insured by the State of New Mexico Property Certificate of Coverage.
The NFIP does have free resources available to UNM for mitigation planning purposes. One very
important resource available to all communities are digital maps created for floodplain management
and insurance purposes called Digital Flood Insurance Rate Maps (DFIRMs). A DFIRM will generally show
a community's base flood elevations, flood zones, and floodplain boundaries. For property
owners/renters, these maps are a reliable indication of flood zones. However, maps are constantly being
updated due to changes in geography, construction and mitigation activities, and meteorological events.
Therefore, for a truly accurate determination, the insurance agent or company, or community floodplain
manager should be contacted. There are currently 21 New Mexico Counties with DFIRMs, 2 counties
with DFIRMs pending, and 10 counties without DFIRMs.

November 2015
46
Chapter 4 – Risk Assessment
Introduction The risk assessment chapter reviews the 10 identified natural hazards and the impacts they have on the
UNM community, economy, and the natural and built environment. UNM followed the four
recommended steps in the Local Mitigation Planning Handbook for conducting a risk assessment. The
four steps are:
1. Describe natural hazards
2. Identify UNM critical assets
3. Analyze the risks
4. Summarize the impact to UNM
The risks assessment process utilizes the history of hazard events, an examination of the geographic
exposure to hazards, previous occurrences, and a disaster scenario.
Hazard Identification The University of New Mexico planning area spreads across six counties of the state, including 3
separate preparedness areas as defined by NMDHSEM. It is important for UNM to document natural
hazards that may affect the main campus, branch campuses, or other UNM properties, which are
located across the State.
In 2013, the NMDHSEM updated its State Hazard Mitigation Plan and identified 14 natural hazards
which had the greatest impact on the state.
Table 15: Hazards Identified in the State of New Mexico Plan
Hazard Category Hazard Type
Atmospheric
Extreme Heat High Wind Thunderstorm (Hail/Lightning) Tornado Severe Winter Storms
Hydrologic Drought Flood
Geologic
Earthquakes Expansive Soils Land Subsidence Volcano Landslide
Other Wildland/Urban Interface Fire Dam Failure

November 2015
47
Based on the information within the State Plan, the four most significant hazards for the state of New
Mexico are:
1. Wildland/Urban Interface Fire
2. Thunderstorm (including Lightning and Hail)
3. Flood
4. Drought
Four hazards listed in the State Hazard Mitigation Plan were excluded from additional consideration as
they present little to no risk to UNM. Hazards that were dropped from further evaluation are
summarized as follows:
Volcano - The 2013 State Plan states that there are no estimates of future occurrence of volcanic activity
in New Mexico in the near future. New Mexico’s numerous volcanoes are considered dormant, but not
extinct. The State Plan reports an extremely low probability of a volcano in the next 10 years (.01%) and
therefore the probability of volcanic eruption is considered “Highly Unlikely”. Given the very low
probability of occurring and the lack of previous occurrences, this hazard was not deemed a significant
threat to UNM and is not addressed further in the Plan.
Expansive Soils - There are no previous occurrences and expansive soils pose no risk to the University,
faculty, staff, or students. Due the low frequency of this hazard and its minor potential impact, the risk is
considered negligible and the hazard is addressed in the rest of the Plan.
Land Subsidence - Due to the low frequency of this hazard and it minor potential impact, it is considered
a nuisance and is not addressed in the rest of the Plan. Land subsidence is an issue for parts of the state
(Carlsbad) but not any location in close proximity to UNM campuses or properties.
Dam Failure – The HMP Administrative team conducted research on the New Mexico Rio Grande dams
to determine the risk of inundation from dam failure. Utilizing the NFHL Flood Data Application for dam
and flood data12, it was determined that UNM has no structures or properties at risk of inundation from
dam failure. The dam structures near UNM campuses and properties are arroyo/storm water/diversion
structures. The closest Rio Grande Dam is 38 miles north of UNM Main Campus. The closest dam
structure to UNM Main Campus is located 4.5 miles away from UNM Main Campus. The inundation risk
from these dam structures is negligible for all UNM Campuses and properties. Flooding is profiled and
mitigated in this plan separately from inundation.
Data Collection
Hazard information is referenced directly from the State Hazard Mitigation Plan. Because the State Plan
was last updated in 2012, revised and UNM specific information was added to this Plan when available.
Historical data was collected from multiple online resources for each New Mexico County with a UNM
property. Sites used for historical data included the National Climatic Data Center (NCDC) and Spatial
Hazard Events and Losses Database for the United States (SHELDUS). In some cases, the State’s
12
National Flood Hazard Layer Data Application, http://nmflood.org/MAPS/NFHL/ (October 26, 2015)

November 2015
48
Preparedness Area data was used when nothing more specific was available. Source information is cited
throughout this Plan.
In an effort to provide the most up to date information for each hazard, UNM updated the history for
each hazard through 2014/2015. Calculating mathematical probability of future occurrence of hazards
for small geographic areas such as the UNM campuses, with a limited history of hazard events, does not
produce actionable results. Therefore, the UNM Hazard Mitigation Plan will adopt the probabilities
calculated by the NMDHSEM for the 3 Preparedness Areas in which UNM campuses are located. The
probability or chance of occurrence was calculated based on historical data provided by local authorities
or databases. Probability was determined by dividing the number of events observed by the number of
years and multiplying by 100. The State Plan used a specific interval (2006-2012) to determine the
probability of each Preparedness Area experiencing future occurrences. Since the State’s Plan was last
updated, additional data has been made available, expanding the history for many hazards from 2006-
2012 to 1950-2015. However, data queries for each hazard result in different intervals due to the
limitations of NCDC (only 500 records are available for each inquiry) creating not-comparable results.
The previous calculations are more uniform and reliable and it is unlikely that probabilities have changed
since the original calculations were made in 2012.
NCDC
NOAA’s National Climatic Data Center maintains a Storm Events Database which contains the records
used to create the official NOAA Storm Data publication, documenting:
The occurrence of storms and other significant weather phenomena having sufficient intensity to
cause loss of life, injuries, significant property damage, and/or disruption to commerce;
Rare, unusual, weather phenomena that generate media attention, such as snow flurries in South
Florida or the San Diego coastal area; and
Other significant meteorological events, such as record maximum or minimum temperatures or
precipitation that occur in connection with another event.
The database currently contains data from January 1950 to April 2015, as entered by NOAA's National
Weather Service (NWS). Due to changes in the data collection and processing procedures over time,
there are unique periods of record available depending on the event type. NCDC has performed data
reformatting and standardization of event types but has not changed any data values for locations,
fatalities, injuries, damage, narratives and any other event specific information. Please refer to the
Database Details page for more information.
SHELDUS
The University of South Carolina’s Spatial Hazard Events and Losses Database for the United States is a
county-level hazard loss data set for the U.S. for 18 different natural hazard events types such
thunderstorms, hurricanes, floods, wildfires, and tornados. For each event the database includes the
beginning date, location (county and state), property losses, crop losses, injuries, and fatalities that
affected each county. The data set does not include Puerto Rico, Guam, or other U.S. territories.

November 2015
49
SHELDUS data equally distributes loss information across affected counties. Therefore fatalities and
injuries may be listed as a percentage rather than a whole number.
SHELDUS originally contained only those events that generated more than $50,000 in damage or at least
one death. SHELDUS is currently in the process of removing these thresholds and is adding every loss
causing (monetary and human) event as reported in the data sources.
Disaster History
FEMA Disaster Declarations
The Robert T. Stafford Disaster Relief and Emergency Assistance Act requires that: "All requests for a
declaration by the President that a major disaster exists shall be made by the Governor of the affected
State." Based on the Governor's request, the President may declare that a major disaster or emergency
exists, thus activating an array of Federal programs to assist in the response and recovery effort.
New Mexico has experienced numerous major Federal disaster and emergency declarations. Tables 16-
18 identify the major Federal disaster declarations in the state since 1950 as of July 2015. These tables
include the following information: FEMA Disaster Number, the date the disaster was declared, the
location of the disaster (UNM planning area locations are highlighted if the information was available),
and the incident description.
Table 16: New Mexico Major Disaster Declarations
Number Date Location Incident Description
4199 10/29/2014 Guadalupe, Lincoln, Otero, Rio Arriba, San Miguel and Sandoval, and the Pueblo of Acoma and Santa Clara Pueblo
Severe Storms and Flooding
4197 10/06/2014 Guadalupe, Lincoln, Otero, Rio Arriba, San Miguel and Sandoval, and the Pueblo of Acoma and Santa Clara Pueblo.
Severe Storms and Flooding
4152 10/29/2013 Catron, Chaves, Cibola, Colfax, Eddy, Guadalupe, Los Alamos, McKinley, Mora, Sandoval, San Miguel, Santa Fe, Sierra, Socorro, and Torrance
Severe Storms, Flooding, and Mudslides
4148 09/30/2013 Bernalillo, Colfax, Luna, Sandoval, and Socorro counties as well as the Cochiti, Kewa (Santa Domingo), San Felipe, and Sandia Pueblos
Severe Storms and Flooding
4047 11/23/2011 Cibola, Los Alamos, Sandoval counties as well as Acoma, Cochiti, and Santa Clara Pueblos.
Flooding
1962 03/24/2011 Lincoln, Otero, Rio Arriba, Sierra, Socorro and Taos counties and Santa Ana, Taos and, Santa Clara Pueblos, and the Mescalero Apache Tribe
Severe Winter Storm and Extreme Cold Temperatures
1659 08/30/2006 Rio Arriba and Taos Counties Severe Storms & Flooding
1329 05/13/2000 Bernalillo, Chaves, Cibola, DeBaca, Dona New Mexico Wildfire

November 2015
50
Number Date Location Incident Description
Ana, Eddy, Guadalupe, Lincoln, Los Alamos, McKinley, Mora, Otero, Rio Arriba, Sandoval, San Juan, San Miguel, Santa Fe, Sierra, Socorro, Taos and Torrance counties
1301 09/22/1999 Dona Ana, Luna, Mora, Rio Arriba, San Juan, Sandoval, Sierra and the Mescalero Indian Reservation
Severe Storms and Flooding
1202 01/29/1998 New Mexico Severe Winter Storms
992 06/07/1993 New Mexico Flooding, Severe Storm
945 06/18/1992 New Mexico Flooding, Hail, Thunderstorms
731 01/18/1985 New Mexico SEVERE STORMS, FLOODING
722 09/06/1984 New Mexico SEVERE STORMS, FLOODING
692 10/24/1983 New Mexico SEVERE STORMS, FLOODING
589 06/23/1979 New Mexico Severe Storms, Snowmelt, Flooding
571 01/29/1979 New Mexico FLOODING
380 05/11/1973 New Mexico SEVERE STORMS, SNOW MELT, FLOODING
361 11/20/1972 New Mexico Heavy Rains, Flooding
353 09/20/1972 New Mexico Heavy Rains, Flooding
346 08/01/1972 New Mexico SEVERE STORMS, FLOODING
202 07/01/1965 New Mexico SEVERE STORMS, FLOODING
38 08/15/1955 New Mexico FLOOD
27 10/13/1954 New Mexico FLOOD
Table 17: New Mexico Emergency Declarations
Number Date Location Incident Description
3229 09/07/2005 New Mexico Hurricane Katrina Evacuation
3154 05/10/2000 New Mexico New Mexico Fire
3128 07/02/1998 New Mexico Extreme Fire Hazard
3034 03/02/1977 New Mexico Drought
Table 18: New Mexico Fire Management Assistance Declarations
Number Date Location Incident Descriptions
5026 6/5/2013 New Mexico Tres Lagunas Fire
2982 6/20/2012 New Mexico Romero Fire
2981 6/18/2012 New Mexico Blanco (CR 4901) Fire
2979 6/9/2012 New Mexico Little Bear Fire
2978 5/26/2012 New Mexico Whitewater-Baldy Fire Complex
2935 6/30/2011 New Mexico Donaldson Fire
2934 6/29/2011 New Mexico Little Lewis Fire
2933 6/26/2011 New Mexico Las Conchas Fire

November 2015
51
Number Date Location Incident Descriptions
2918 6/12/2011 New Mexico Track Fire
2917 6/10/2011 New Mexico Wallow Fire
2897 4/17/2011 New Mexico Tire Fire
2880 4/3/2011 New Mexico White Fire
2866 3/8/2011 New Mexico Quail Ridge Fire
2843 6/2/2010 New Mexico Rio Fire
2842 5/24/2010 New Mexico Cabazon Fire
2818 5/7/2009 New Mexico Buckwood Fire
2777 6/25/2008 New Mexico Big Springs Fire
2762 4/21/2008 New Mexico Trigo Fire
2741 11/21/2007 New Mexico Ojo Peak Fire
2682 2/24/2007 New Mexico Belen Fire
2647 6/21/2006 New Mexico Rivera Mesa Fire
2644 6/16/2006 New Mexico Malpais Fire
2636 4/12/2006 New Mexico Ojo Feliz Fire
2631 3/1/2006 New Mexico Casa Fire
2600 1/2/2006 New Mexico Southeast New Mexico Fire
2522 6/18/2004 New Mexico Bernardo Fire
2518 5/25/2004 New Mexico Peppin Fire
2472 6/25/2003 New Mexico Atrisco Fire (Formerly Bosque Fire)
2467 5/10/2003 New Mexico Walker Fire
2459 8/26/2002 New Mexico Lakes Fire Complex
2424 6/13/2002 New Mexico Roybal Fire Complex
2416 6/6/2002 New Mexico Ponil Fire
2414 6/4/2002 New Mexico Turkey Fire
2415 6/4/2002 New Mexico Cerro Pelado Fire
2408 5/23/2002 New Mexico Borrego Fire
2404 5/7/2002 New Mexico Dalton Fire
2402 5/1/2002 New Mexico Penasco Fire
2398 3/23/2002 New Mexico Kokopelli Fire Complex
2364 6/3/2001 New Mexico Trap and Skeet Fire
2310 6/15/2000 New Mexico La Cueva Fire
2304 5/30/2000 New Mexico Viveash Fire
2297 5/14/2000 New Mexico Scott-Able Fire
2296 5/8/2000 New Mexico Cree Fire
2295 4/20/2000 New Mexico Rio Grande Fire Complex
2213 6/26/1998 New Mexico Osha Canyon Complex
2177 5/5/1996 New Mexico Hondo Fire
2025 6/18/1977 New Mexico Barker Fire
2015 5/21/1974 New Mexico Guadalupita Fire

November 2015
52
UNM Disaster History
Recent natural disasters and associated costs for UNM Main Campus and Sevilleta LTER Field Station are
shown in Table 19. Note: No data is available for the UNM Branch Campuses (Gallup, Los Alamos, Taos
and Valencia) on past natural hazard disasters exist. This is the most up to date information as of August
1, 2014.
UNM does not report any losses under $1,000 to insurance as a claim. Many of the losses fall in this
category. Maintenance issues identified above are not reported as an insurance claim based on standard
insurance language.
Table 19: UNM Disaster History (June 30, 2010 - August 1, 2014)
Date of Loss
TMA Project
# Project Name SRS# Actual Cost BLDG NAME/#
DISASTER TYPE
06/30/10 100630
ANTHRO FLD
Anthropology Flood - Bldg. 11
11-101 $12,830.66
011-Anthropology/
Maxwell Museum
Rain/Flood
07/26/10 100726
BIOLOGY FLD
Biology Flood 11-112 $6,150.45 021-Castetter Hall/Biology
Rain/Flood
07/26/10 100726 CARLISL
GYM
Carlisle Gym Flood
11-111 $12,004.05 004-Carlisle Gym Rain/Flood
08/08/10 100808 LOGAN FLOOD
Logan Hall Flood 11-117 $204,927.95 034-Logan Hall/
Psychology Rain/Flood
09/01/10 100901
ANTHRO ANNX
Anthropology Annex Flood -
Bldg. 12 11-129 $40,644.68
012-Anthropology
Annex Rain/Flood
01/01/11 110101
ATHL FLOOD
Athletic Building Flood
11-188 $106.30 307-Athletic
Building Freeze/ Flood
01/01/11 110101
EECE FLOOD
EECE Flood 11-188 $0.00 046-EECE-
Engineering & Sci Lib
Freeze/ Flood
01/01/11 110101 SOC SCI
AHU
Social Sciences Bldg. AHU
11-188 $24,955.88 078-Social Sciences
Freeze/ Flood
01/11/11 110111 SUB CW
COIL
Student Union Bldg. - Chilled
Water Coil 11-188 $49,010.60
060-Student Union (SUB)
Freeze/ Flood
02/02/11 110202
CGF FLOOD
Crystal Growth Facility Flood
11-202 $263.91 331-Crystal
Growth Facility Freeze/ Flood
02/02/11 110202
JNSN GYM
Johnson Gym Flood
11-202 $9,945.23 059-Johnson
Center Freeze/ Flood
02/02/11 110202 Mesa Vista Flood 11-202 $1,514.28 056-Mesa Vista Freeze/
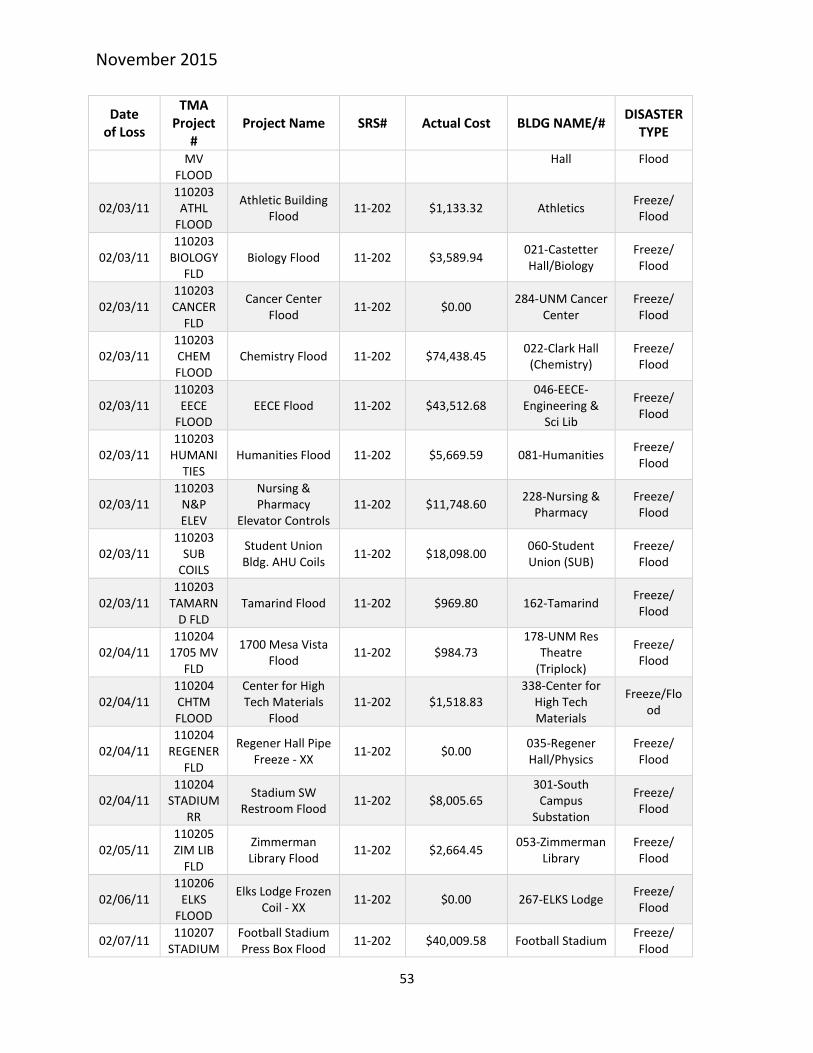
November 2015
53
Date of Loss
TMA Project
# Project Name SRS# Actual Cost BLDG NAME/#
DISASTER TYPE
MV FLOOD
Hall Flood
02/03/11 110203
ATHL FLOOD
Athletic Building Flood
11-202 $1,133.32 Athletics Freeze/ Flood
02/03/11 110203
BIOLOGY FLD
Biology Flood 11-202 $3,589.94 021-Castetter Hall/Biology
Freeze/ Flood
02/03/11 110203 CANCER
FLD
Cancer Center Flood
11-202 $0.00 284-UNM Cancer
Center Freeze/ Flood
02/03/11 110203 CHEM FLOOD
Chemistry Flood 11-202 $74,438.45 022-Clark Hall
(Chemistry) Freeze/ Flood
02/03/11 110203
EECE FLOOD
EECE Flood 11-202 $43,512.68 046-EECE-
Engineering & Sci Lib
Freeze/ Flood
02/03/11 110203
HUMANITIES
Humanities Flood 11-202 $5,669.59 081-Humanities Freeze/ Flood
02/03/11 110203
N&P ELEV
Nursing & Pharmacy
Elevator Controls 11-202 $11,748.60
228-Nursing & Pharmacy
Freeze/ Flood
02/03/11 110203
SUB COILS
Student Union Bldg. AHU Coils
11-202 $18,098.00 060-Student Union (SUB)
Freeze/ Flood
02/03/11 110203
TAMARND FLD
Tamarind Flood 11-202 $969.80 162-Tamarind Freeze/ Flood
02/04/11 110204
1705 MV FLD
1700 Mesa Vista Flood
11-202 $984.73 178-UNM Res
Theatre (Triplock)
Freeze/ Flood
02/04/11 110204 CHTM FLOOD
Center for High Tech Materials
Flood 11-202 $1,518.83
338-Center for High Tech Materials
Freeze/Flood
02/04/11 110204
REGENER FLD
Regener Hall Pipe Freeze - XX
11-202 $0.00 035-Regener Hall/Physics
Freeze/ Flood
02/04/11 110204
STADIUM RR
Stadium SW Restroom Flood
11-202 $8,005.65 301-South
Campus Substation
Freeze/ Flood
02/05/11 110205 ZIM LIB
FLD
Zimmerman Library Flood
11-202 $2,664.45 053-Zimmerman
Library Freeze/ Flood
02/06/11 110206
ELKS FLOOD
Elks Lodge Frozen Coil - XX
11-202 $0.00 267-ELKS Lodge Freeze/ Flood
02/07/11 110207
STADIUM Football Stadium Press Box Flood
11-202 $40,009.58 Football Stadium Freeze/ Flood
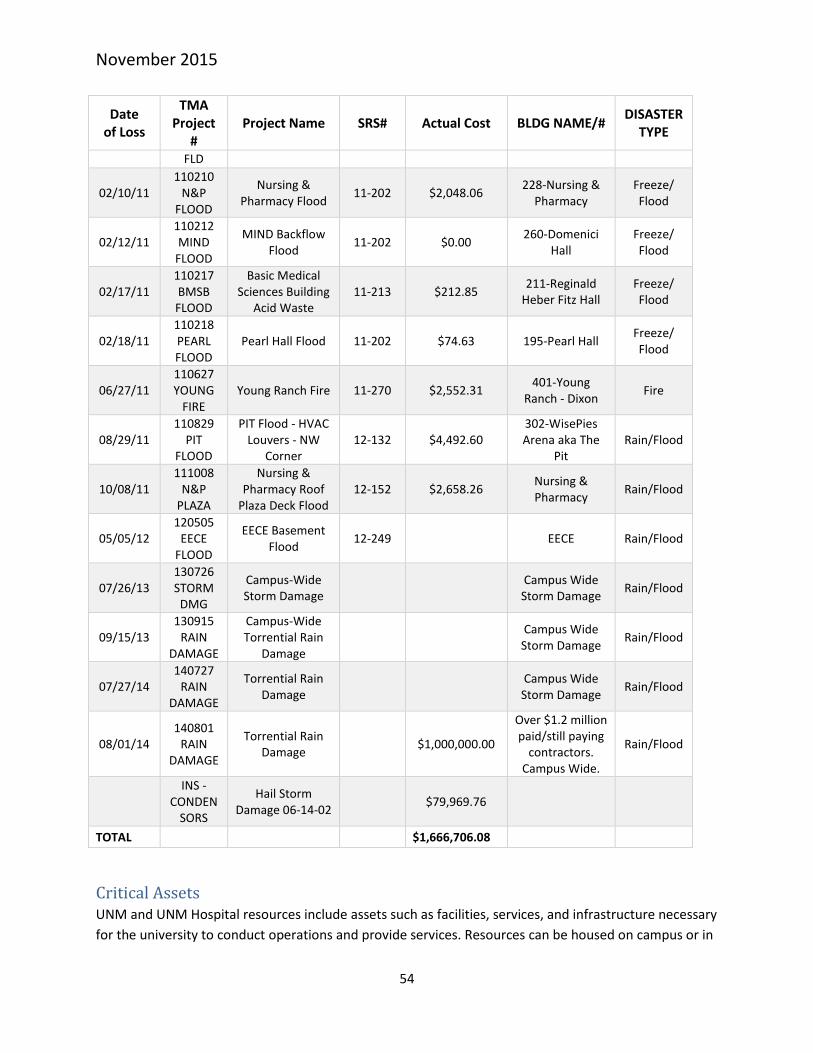
November 2015
54
Date of Loss
TMA Project
# Project Name SRS# Actual Cost BLDG NAME/#
DISASTER TYPE
FLD
02/10/11 110210
N&P FLOOD
Nursing & Pharmacy Flood
11-202 $2,048.06 228-Nursing &
Pharmacy Freeze/ Flood
02/12/11 110212 MIND
FLOOD
MIND Backflow Flood
11-202 $0.00 260-Domenici
Hall Freeze/ Flood
02/17/11 110217 BMSB FLOOD
Basic Medical Sciences Building
Acid Waste 11-213 $212.85
211-Reginald Heber Fitz Hall
Freeze/ Flood
02/18/11 110218 PEARL FLOOD
Pearl Hall Flood 11-202 $74.63 195-Pearl Hall Freeze/ Flood
06/27/11 110627 YOUNG
FIRE Young Ranch Fire 11-270 $2,552.31
401-Young Ranch - Dixon
Fire
08/29/11 110829
PIT FLOOD
PIT Flood - HVAC Louvers - NW
Corner 12-132 $4,492.60
302-WisePies Arena aka The
Pit Rain/Flood
10/08/11 111008
N&P PLAZA
Nursing & Pharmacy Roof
Plaza Deck Flood 12-152 $2,658.26
Nursing & Pharmacy
Rain/Flood
05/05/12 120505
EECE FLOOD
EECE Basement Flood
12-249
EECE Rain/Flood
07/26/13 130726 STORM DMG
Campus-Wide Storm Damage
Campus Wide Storm Damage
Rain/Flood
09/15/13 130915
RAIN DAMAGE
Campus-Wide Torrential Rain
Damage
Campus Wide Storm Damage
Rain/Flood
07/27/14 140727
RAIN DAMAGE
Torrential Rain Damage
Campus Wide Storm Damage
Rain/Flood
08/01/14 140801
RAIN DAMAGE
Torrential Rain Damage
$1,000,000.00
Over $1.2 million paid/still paying
contractors. Campus Wide.
Rain/Flood
INS - CONDEN
SORS
Hail Storm Damage 06-14-02
$79,969.76
TOTAL
$1,666,706.08
Critical Assets UNM and UNM Hospital resources include assets such as facilities, services, and infrastructure necessary
for the university to conduct operations and provide services. Resources can be housed on campus or in

November 2015
55
the community. The essential services performed by the University and hospital which are supported by
mitigation planning and actions include:
1. Medical and basic science research and development
2. Provision of clinical care
3. Post-secondary education and library services
4. Administration and finance
5. Housing and food services
6. Providing venues for community arts, entertainment, and sports
7. Preservation of historical structures and archival collections
8. Public safety and occupational health
9. Public broadcast via television and radio
For the purpose of this document 'critical asset' means: UNM and UNM Hospital people, functions, and
structures which are vital to maintain the health, safety, and well-being of university employees,
students, visitors, and patients, and the university's economic sustainability, history, and educational
functions during time of natural disaster.
University assets were categorized into three types: people, infrastructure and facilities. Each
participating PDMAC member was asked to review the current list of UNM buildings and infrastructure
components related to their area of responsibility and to the university as a whole, and to add assets
that had been created or expanded during the previous five-year period. The 5-Year Capital
Improvement Plan for the university was reviewed to determine if significant improvements or
replacements are being planned for the critical facilities on the list, and for new facilities that might be
deemed critical. In addition, the UNM Consolidated Master Plan (adopted in 2011) was analyzed to
determine the potential risk associated with future land use and development. Table 20 shows the
categories of assets addressed in the UNM HMP planning process, including people, infrastructure, and
facilities.
Table 20: University Assets
People
Undergraduate, graduate, and non-degree seeking students
Residential students
Patients and their families
Employees including temporary and permanent staff and faculty
Individuals with accessibility and functional needs, including children
Campus visitors for entertainment, sports, teaching, research, and business
Neighboring community members
Infrastructure
Communications and security technology
Utilities and power
Transportation and roadways

November 2015
56
Educational, administrative, and medical data maintenance
Natural environment
Critical Facilities
Research
Administration
Clinical
Housing and food services
Venues
Museums and collections
Historical buildings and structures
Public safety
Utilities
Transmission and broadcast
A database of the monetary values of critical facilities and infrastructures used to support the essential
functions of the university is maintained by the State of New Mexico General Services Department Risk
Management Division. This database will be used on an on-going basis to update the value of critical
facilities for mitigation planning.
A final, updated list of critical physical facilities and infrastructure was created, reviewed and accepted
by the PDMAC. The actual list of facilities and infrastructure - including their physical location, critical
nature, function, and economic valuation – can be requested by contacting the UNM OEM at: MSC11
6025, 1 University of New Mexico, Albuquerque, NM 87131 or the UNM Emergency Manager at
[email protected]. Distribution of the list will be at the discretion of UNM OEM.
UNM contains many historic resources of significance. These resources provide a connection to the past
for students, faculty, staff, alumni, and the general public. They are considered essential to alumni
development, student recruitment, the public image of the University, and create a sense of place. The
Campus Heritage Preservation Survey details these historic resources and can be viewed on the UNM
website (http://iss.unm.edu/PCD/docs/Getty_Report/GettyProject_Vol1_All.pdf).
The list of essential services and the list of critical infrastructure and facilities were utilized to conduct a
risk analysis and to develop or update the general and specific mitigation strategies included in the
HMP.
Changes in Development Since 2010, UNM has experienced tremendous growth and expansion. Based on the evaluation
conducted by the PDMAC (as described under the Critical Assets section), significant changes in
development have been documented. Only those changes in development relevant to the HMP are
described here.
UNM HSC expansion since 2010 has been both operational and geographical, with new construction and
renovation of pre-existing facilities. Relevant examples include:

November 2015
57
Research Incubator Building, Multidisciplinary Research Facility
Innovation, Discovery and Training Complex
Health Sciences Center Business and Communications Center
Domenici Center for Health Sciences Education and Gross Anatomy Lab
UNM expanded to the Rio Rancho community by opening the Sandoval Regional Medical Center (SRMC)
and UNM West located in Rio Rancho's City Center.
UNM SRMC opened in July 2012. UNM Sandoval Regional Medical Center is the first community-based
academic healthcare facility in the state of New Mexico. UNM SRMC is a 200,000 square foot acute care
facility houses 72-inpatient beds. UNM SRMC’S provides healthcare to the community and provides
healthcare and medical educational opportunities for UNM students. UNM SRMC is served by both
hospital-based UNM Faculty Physicians and community-based independent physicians.
UNM West opened in January of 2010. This 40,000 square foot facility houses general purpose
classrooms, a computer lab, a common area, quiet study space and office space, including meeting areas
for community groups. UNM West allows the University to create partnerships that will enhance
educational opportunities for current and prospective students, as well as the greater Rio Rancho
community.
The PDMAC determined that new facilities have no increased or decreased vulnerability to hazards. New
development has been similar in purpose and placement and therefore is deemed just as vulnerable to
hazards as pre-existing facilities.
Risk Analysis The risk analysis takes information relating to both UNM and the State of New Mexico as a whole. The
following hazard profiles describe different hazard characteristics. In some cases, hazards affect specific
geographic areas (i.e. Floods and Landslides). When this is the case, the hazard profile includes a map
identifying areas of the state where the hazard could occur. For hazards that could occur anywhere,
such as tornadoes and winter storms, the hazard profile identifies which portions of the state may be
more vulnerable to the hazard.
The remainder of this section presents hazard profiles and risk assessment information for the eleven
hazards applicable to UNM listed in Table 15. It includes a description of each hazard and historical
reviews of hazard occurrences in the State of New Mexico. The order in which the hazards are presented
does not reflect the relative levels of risk they pose to the state.
November 2015
58
Drought
Hazard Characteristics
Drought is a condition of climatic dryness that reduces soil moisture, water or snow levels below the
minimum necessary for sustaining plant, animal, and economic systems. Drought conditions are usually
not uniform over the entire state. Local and regional differences in weather, soil condition, geology,
vegetation, and human influence need to be considered when assessing the impact of drought on any
particular location.
The most commonly used drought definitions are based on meteorological, agricultural, hydrological,
and socio-economic effects.
Meteorological drought is defined by a period of substantially diminished precipitation duration
and/or intensity. The commonly used definition of meteorological drought is an interval of time,
generally on the order of months or years, during which the actual moisture supply at a given
place consistently falls below the climatically appropriate moisture supply.
Agricultural drought occurs when there is inadequate soil moisture to meet the needs of
particular crop at a particular time. Agricultural drought usually occurs after or during
meteorological drought, but before hydrological drought and can affect livestock and other
dryland agricultural operations.
Hydrological drought refers to deficiencies in surface and subsurface water supplies. It is
measured as stream flow, snow pack, and as lake, reservoir, and groundwater levels. There is
usually a delay between lack of rain or snow and less measurable water in streams, lakes, and
reservoirs. Therefore, hydrological measurements tend to lag behind other drought indicators.
Socio-economic drought occurs when physical water shortages start to affect the health,
wellbeing, and quality of life of the people, or when the drought starts to affect the supply and
demand of an economic product.
Drought increases the probability and severity of wildfire. Drought also increases the severity of flash
flooding due to soils becoming hydrophobic, repelling or incapable of dissolving in water, resulting in
increased runoff and erosion. Economically, prolonged drought can have devastating effects on
agriculture and food supply. In every drought, agriculture is adversely impacted, especially in non-
irrigated areas such as dry land farms and rangelands. Droughts impact individuals (farm owners,
tenants, and farm laborers), the agricultural industry, other agriculture related sectors, and other
industries such as tourism and recreation. There is increased danger of forest and wildland fires. Loss of
forests and trees increases erosion, causing serious damage to aquatic life, irrigation, and power
development by heavy silting of streams, reservoirs, and rivers.
Although different types of drought may occur at the same time, they can also occur independently of
one another. Drought differs from other natural hazards in three ways. First, the onset and end of a
drought are difficult to determine due to the slow accumulation and lingering of effects of an event after
its apparent end. Second, the lack of an exact and universally accepted definition adds to the confusion
of its existence and severity. Third, in contrast with other natural hazards, the impact of drought is less

November 2015
59
obvious and may be spread over a larger geographic area. These characteristics have hindered the
preparation of drought contingency or mitigation plans by many governments.
Drought status is calculated using several indices that measure how much precipitation for a given
period of time has deviated from historically established norms. The Palmer Drought Severity Index
(PDSI) (Figure 10) is based on the supply-and-demand concept of the water balance equation, taking
into account more than the precipitation deficit at specific locations. The PDSI provides a measurement
of moisture conditions that are “standardized” so that comparisons using the index can be made
between locations and months. PDSI is used by the U.S. Department of Agriculture (USDA) to determine
allocations of grant funds for emergency drought assistance
Figure 10: Palmer Drought Severity Index13
13
Source: http://www.drought.noaa.gov/

November 2015
60
According to the National Weather Service, drought has lessened its grip on New Mexico. 21% of the
state is in moderate to severe drought and 4% of the state is classified as in severe drought.14
Historically, drought in the state of New Mexico ranges from abnormally dry to exceptionally dry, with a
majority of the state hovering in a severe to extreme status. However, in 2015 drought intensity has
been in the abnormally dry to severe drought range (Figure 11).
Figure 11: US Drought Monitor – New Mexico as of July 14, 201515
Water Use at UNM
UNM Main Campus is a designated “large water system” by the New Mexico Environment Department.
Over 40,000 people using UNM’s water consistently. Because UNM is a “large water system,” it is bound
by the same regulations as the City of Albuquerque with regard to purity, cleanliness, testing and
licensure. UNM’s PPD is responsible for ensuring the water is clean and usable and is also committed to
reducing water waste on campus.
14
National Weather Service, http://www.srh.noaa.gov/abq/?n=drought (retrieved on July 17, 2015). 15
National Weather Service http://www.srh.noaa.gov/abq/?n=drought
November 2015
61
Water usage annually16:
UNM pumps about 276 million gallons of water are pumped from UNM’s wells
Approximately 16 million gallons are used in the dorms
5 million gallons are used at La Posada
3 million gallons are used at the Student Union Building
An estimated 40 million gallons are used in the medical buildings primarily located on the North
Campus.
Water is also used by utilities, landscaping and remaining campus buildings.
Accomplishments to reduce UNM’s water usage:
Installation of low-flow toilets and urinals
40,000 square feet of turf has removal for a more sustainable landscape
Electricity saving efforts in unoccupied buildings (holidays and weekends)
Precipitation and Reservoir Storage
According to the NWS, precipitation has been near to above normal across nearly all of New Mexico,
with the exception being the southwest corner (January-July 2015). Snowpack and spring
snowmelt/runoff started early and was well below normal for the 5th year in a row. The well above
normal temperatures through April were a major culprit for the receding snowpack this spring. May
arrived and a very active weather pattern ensued over central and eastern areas. Nearly daily rounds of
showers and thunderstorms produced heavy rainfall. June remained active with scattered to numerous
showers and thunderstorms. Locally heavy rainfall impacted the northern high terrain where flash
flooding was reported. Short-term drought conditions were cleared from the east while significant
improvements were made to central and portions of western New Mexico.17
Previous Occurrences
According to the New Mexico Drought Plan, the state has experienced droughts since prehistoric times.
Extended drought conditions in the region evidently led to the collapse of many early civilizations.
Periods of drought since 1950 have been documented during 1950-1957, 1963-1964, 1976-1978, 1989,
1996, 1998-1999, 1999-2003, 2003-2006. The most recent Drought Executive Order was signed by
Governor Martinez on May 11, 2012 (Executive Order 2012-006). This order summarized the drought
conditions at that time, and declared a state of emergency statewide due to the drought conditions. The
Executive Order further directed the continuation of the New Mexico Drought Task Force and for them
to meet on a quarterly basis. It also directed the following:
Assess the continued severity of the drought and its effects on the various sectors of the state’s
resources and economy.
16
“Water conservation top priority at PPD”, UNM Newsroom, http://news.unm.edu/news/water-conservation-top-priority-at-ppd, (July 20, 2015) 17
“Drought Summary”, National Weather Service, http://www.srh.noaa.gov/abq/?n=drought

November 2015
62
Make recommendations to the Governor for intermediate actions and long-term strategies to
mitigate drought conditions and impacts in the state.
Appoint such working groups as may be necessary and appropriate to examine and recommend
solutions regarding the drought conditions to the task force.
Provide information and guidance to the Governor regarding drought conditions.
All Preparedness Areas in New Mexico have experienced drought conditions over the last 9 years. The
online NCDC database was used to investigate past events from February 1, 2013 – April 1, 2015, as
entered by NOAA's NWS.18 Referencing this online database, NCDC currently does not have data on
drought losses.
Table 21 highlights significant past droughts by Preparedness Area. Only past occurrences in
preparedness areas with UNM properties are listed.
Table 21: Significant Past Occurrences-Drought19
Date Location Significant Event
Summer 2008 Northern New Mexico
(Preparedness Area 2 and 3)
In the summer of 2008, the agriculture community was in a panic as the state was dealing with the endangered silvery minnow. Farmers were faced with a low snowpack that feeds irrigation reservoirs in northern New Mexico and low rainfall with forecasted continuing dry conditions cut irrigation supplies dramatically. Compounding issues more, legal issues were being considered ordering farmers to share the river supply to save the silvery minnow. This impacts financial capabilities in the agricultural community and decreases agricultural supply.
Emergency Management Agency Declared Disasters from Drought
NMDHSEM reports one State-declared disaster for drought between 2003 and 2013 which had State
reimbursement funds available. This number is based on how many Executive Orders were signed by the
Governor for drought which resulted in local government or tribal reimbursement. According to
NMDHSEM records, the total cost for the 2006 State declared drought event was $500,000 (Table 22).
Research into locations for each disaster would need to be completed prior to breaking-out the figures
by Preparedness Area. There were no federal disaster declarations for drought from 2003 through 2012.
Table 22: State Disaster Event Information 2003 through 2012
Event Type State Executive Order Dollar Loss
Drought 06-012 $500,000.00
Total 1 $500,000.00
18
Due to the large amount of data (thousands of records) the dates were scaled down to the most recent 2 years. The NCDC database only shows 500 records per query. 19
Information is provided by the Drought Task Force Report at http://www.nmdrought.state.nm.us/

November 2015
63
Current Drought Conditions
Each NMDHSEM zoned Preparedness Area has experienced the effects of drought. According to the
National Weather Service, for the 2015 calendar year (Jan through May), statewide precipitation was
161 percent of normal (9th wettest on record). For the water year 2015 (October 2014-May 2015)
average statewide precipitation was 129 percent of normal. This was the 22nd wettest water year on
record (120 years).20
Table 23 provides an overview of the drought conditions of Preparedness Area’s with UNM campuses
and properties that exists as of June 16, 2015.
Table 23: Current Drought Conditions as of June 16, 2015 for Preparedness Areas 1-621
Preparedness Area 3 UNM-Los Alamos Branch and UNM-Taos Branch
Abnormally Dry/ Moderate Drought
Preparedness Area 4 UNM-Gallup Branch
Moderate Drought/ Severe Drought
Preparedness Area 5
UNM Main Campus, UNM Sevilleta Long Term Ecological Research (LTER) Field Station, UNM West, and UNM-Valencia Branch
None/Abnormally Dry
20
“NM Governor’s Drought Task Force: June Meeting Agenda”, http://www.nmdrought.state.nm.us/MonitoringWorkGroup/2015/06/(2)%20DMWG_DroughtReport-062315.pdf (July 20, 2015) 21
Source: US Drought Monitor (June 16, 2015)
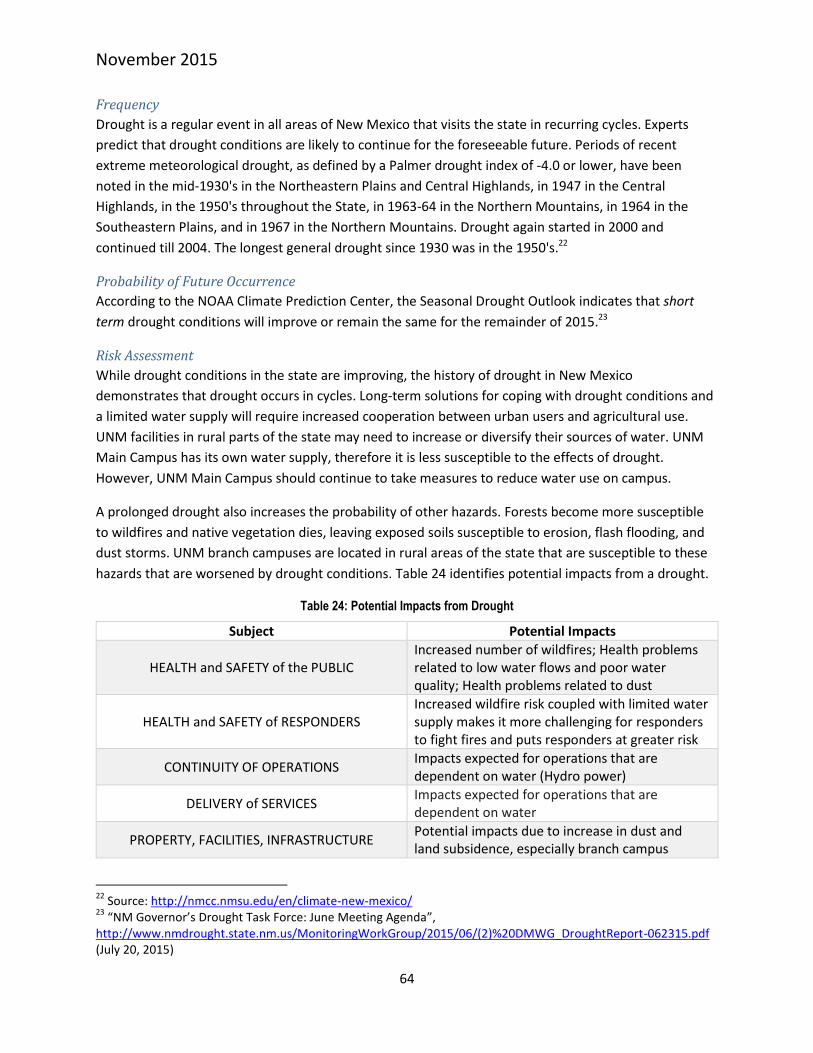
November 2015
64
Frequency
Drought is a regular event in all areas of New Mexico that visits the state in recurring cycles. Experts
predict that drought conditions are likely to continue for the foreseeable future. Periods of recent
extreme meteorological drought, as defined by a Palmer drought index of -4.0 or lower, have been
noted in the mid-1930's in the Northeastern Plains and Central Highlands, in 1947 in the Central
Highlands, in the 1950's throughout the State, in 1963-64 in the Northern Mountains, in 1964 in the
Southeastern Plains, and in 1967 in the Northern Mountains. Drought again started in 2000 and
continued till 2004. The longest general drought since 1930 was in the 1950's.22
Probability of Future Occurrence
According to the NOAA Climate Prediction Center, the Seasonal Drought Outlook indicates that short
term drought conditions will improve or remain the same for the remainder of 2015.23
Risk Assessment
While drought conditions in the state are improving, the history of drought in New Mexico
demonstrates that drought occurs in cycles. Long-term solutions for coping with drought conditions and
a limited water supply will require increased cooperation between urban users and agricultural use.
UNM facilities in rural parts of the state may need to increase or diversify their sources of water. UNM
Main Campus has its own water supply, therefore it is less susceptible to the effects of drought.
However, UNM Main Campus should continue to take measures to reduce water use on campus.
A prolonged drought also increases the probability of other hazards. Forests become more susceptible
to wildfires and native vegetation dies, leaving exposed soils susceptible to erosion, flash flooding, and
dust storms. UNM branch campuses are located in rural areas of the state that are susceptible to these
hazards that are worsened by drought conditions. Table 24 identifies potential impacts from a drought.
Table 24: Potential Impacts from Drought
Subject Potential Impacts
HEALTH and SAFETY of the PUBLIC Increased number of wildfires; Health problems related to low water flows and poor water quality; Health problems related to dust
HEALTH and SAFETY of RESPONDERS Increased wildfire risk coupled with limited water supply makes it more challenging for responders to fight fires and puts responders at greater risk
CONTINUITY OF OPERATIONS Impacts expected for operations that are dependent on water (Hydro power)
DELIVERY of SERVICES Impacts expected for operations that are dependent on water
PROPERTY, FACILITIES, INFRASTRUCTURE Potential impacts due to increase in dust and land subsidence, especially branch campus
22
Source: http://nmcc.nmsu.edu/en/climate-new-mexico/ 23
“NM Governor’s Drought Task Force: June Meeting Agenda”, http://www.nmdrought.state.nm.us/MonitoringWorkGroup/2015/06/(2)%20DMWG_DroughtReport-062315.pdf (July 20, 2015)
November 2015
65
Subject Potential Impacts
locations.
ENVIRONMENT
Animal habitat and food supply can dwindle causing species die-off; poor soil quality; loss of wetlands; increased soil erosion; migration of wildlife
ECONOMIC CONDITION
Decreased tourism; Crop loss; Decreased land prices; Unemployment from drought-related declines in production; Increased importation of food; Rural population loss
PUBLIC CONFIDENCE
Reduced incomes; Fewer recreational activities; Increase in food costs due to loss of crops and livestock; Loss of aesthetic values; Loss of cultural sites
Data Limitations
Given that drought is a slow-moving hazard without an event to mark its arrival, a one-time drought can
be difficult to define. In most cases, the dry weather conditions that cause droughts will need to persist
for a while before it becomes clear that drought conditions exist. There are also data limitations in
determining the available quantity and quality of groundwater. The costs associated with drought are
difficult to quantify and are not available on the NCDC.
Summary of Impact to UNM
All UNM campuses are equally vulnerable to drought conditions. Drought measurements are not very
precise, and often they are directed toward particular segments of the state. For example, there are
drought measurements based upon agricultural conditions; there are measurements of stream flow and
water storage in reservoirs; there are measurements of groundwater and effects upon drinking water
systems; and there are strictly meteorological and climatic measurements. Some drought indicators
might point toward an abatement of drought conditions for the agricultural sector, while the drought
continues for drinking water in the same area. Because of the limited agricultural activity, UNM Main
and Branch Campuses vulnerability to drought is determined low.

November 2015
66
Earthquakes
Hazard Characteristics
Earthquakes hazards principally arise from ground motions due to seismic waves (elastic waves traveling
through the earth). Such ground motions can be generated by explosions, or by other phenomena that
apply forces to the surface or interior of the earth. However, earthquakes are most commonly due to
rapid slip along a zone of weakness (a fault). This process releases internal stress and converts a small
portion (a few percent) of the associated strain energy into seismic waves that can propagate for great
distances. Earthquakes occur most frequently near the boundaries between tectonic plates, which
segment earth's crust and shallow mantle. However, damaging earthquakes can also occur within plate
interiors in regions where strain accumulates, or where the frictional properties of faults are perturbed,
due to volcanic, tectonic, or anthropogenic processes (e.g., fluid withdrawal or injection). Although
earthquakes in the United States during the past few decades have caused less economic loss annually
than other hazards, they have the potential to cause great and sudden losses. Within one to two
minutes, an earthquake can devastate a city through ground shaking, surface-fault ruptures, and ground
subsidence. Earthquakes furthermore often trigger other devastating hazards, such as landslides, fires,
and damage to dams and levees.
The actual movement of the ground in an earthquake is seldom the direct cause of injury or death.
Casualties typically result from falling objects and debris, or from forces that damage or demolish
buildings and other structures. Disruption of communications, electrical power supplies, and gas, sewer,
and water lines should be expected in a large earthquake. Earthquakes can trigger widespread fires,
dam failures, landslides, or releases of hazardous material, compounding their hazards.
The vibration or shaking of the ground during an earthquake is described by the time history of its
ground motion (when recorded, this record is called a seismogram). The severity of ground motion
generally increases with the amount of energy released and decreases with distance from the
earthquake hypocenter (the geographic location and depth of the earthquake source). Earthquakes
generate elastic waves, both in earth’s interior (body waves), and along the earth’s surface (surface
waves). P (primary) waves in the earth’s interior are physically similar in character to sound waves in air.
P waves have a back-and-forth (longitudinal) motion along their direction of travel. They move through
the shallow earth at speeds between approximately 1 to 4 km/s (roughly 2000 to 9000 miles/hour). P
waves typically produce predominantly vertical forces on buildings. S (secondary) waves, also known as
shear waves, have a transverse (side-to-side relative to their propagation direction) motion and travel
more slowly (by about a factor of 0.6) than P waves. S waves can cause significantly more damage than P
waves because their amplitudes are typically larger and their shear motion produces horizontal forces,
which structures are typically much less able to sustain without damage. Surface waves generate both
shear and vertical forces, and can be highly damaging in areas where development has occurred in low
seismic velocity basins (the extensive damage to Mexico City in 1985 is a type example of this).
Earthquakes are commonly described in terms of magnitude and intensity. Magnitude is a fixed property
of the earthquake source estimated from seismograms, and is proportional to the logarithm of the total
energy released (an increase of one in earthquake magnitude indicates an approximately 32-fold
increase in energy). Intensity, in contrast, varies spatially and with local geology, and describes the
November 2015
67
strength of ground motion at specific locations. Thus, a large, distant earthquake can generate the same
intensity at a given site than a much smaller, local earthquake.
There are several generally consistent magnitude scales in use by the scientific and hazard community,
based on different observable characteristics of seismic waves. The oft-noted Richter Scale is the original
magnitude scale, but it is technically applicable only to southern California and is scientifically obsolete.
The three extensively quoted scales are the body wave magnitude, mb the surface wave magnitude, ms,
and the moment magnitude, mw. Body and surface wave magnitudes vary because they are based on
the amplitudes of observed body and surface waves, respectively. These components of the seismic
wavefield can vary in relative size for a given earthquake (for example, earthquakes with shallower
hypocenters generally produce corresponding larger surface waves than those with deeper
hypocenters). The moment magnitude is based on the fundamental forces produced by the earthquake
fault motion, and is coming into increasing use as the de facto measure of earthquake size. All three
magnitudes usually agree to within 0.5 of a magnitude unit, with larger departures only commonly
occurring for very large earthquakes (magnitudes in excess of 7.5).
The commonly used Modified Mercalli Intensity (MMI) Scale is expressed in Roman numerals. It is based
on the amount of shaking and specific kinds of damage to man-made objects or structures. This scale
has twelve classes and ranges from I (not felt) to XII (total destruction). A quantitative method of
expressing an earthquake’s severity is to compare its acceleration history (commonly the peak
acceleration) to the normal acceleration due to gravity (g=9.8 meters per second squared, or 980
cm/sec/sec). Peak ground acceleration (PGA) measures the rate of change of motion relative to the rate
of acceleration due to gravity and is proportional to the forces exerted on a structure. For example, an
acceleration of the ground surface of 244 cm/sec/sec equals a PGA of 25.0 percent. A higher PGA means
a higher level of ground acceleration and a higher probability of structural damage. Ordinary structures
typically begin to be damaged structurally at about 10% PGA.
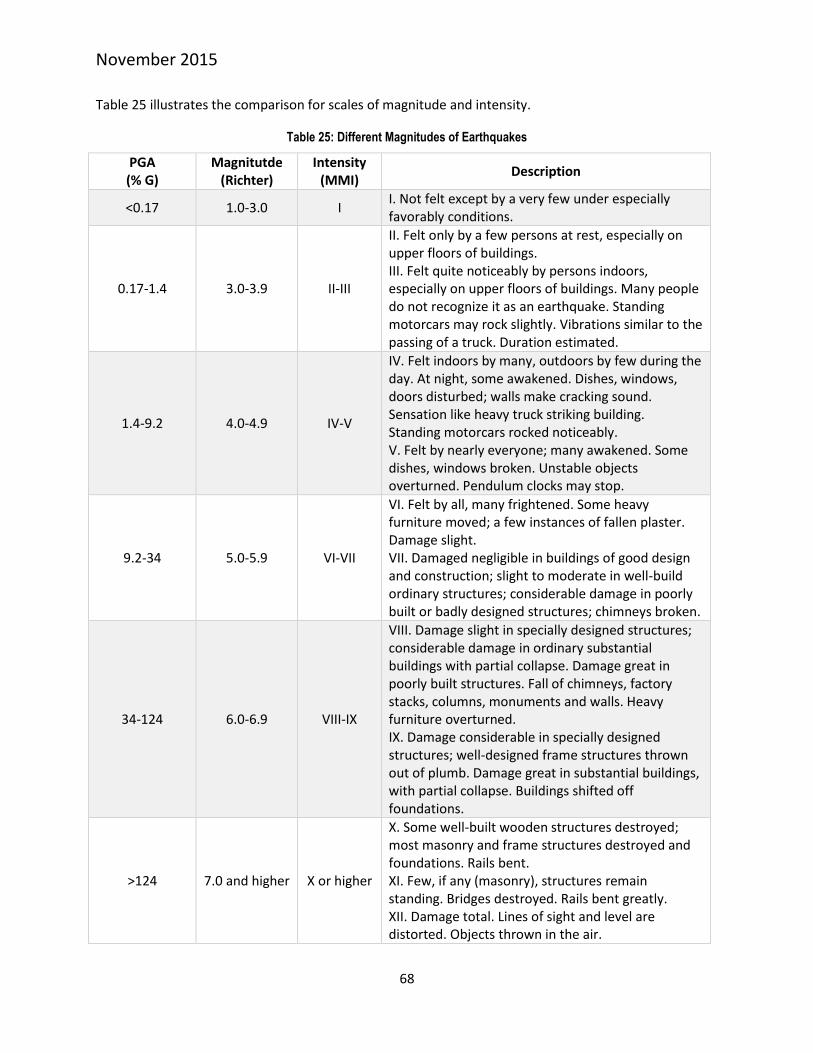
November 2015
68
Table 25 illustrates the comparison for scales of magnitude and intensity.
Table 25: Different Magnitudes of Earthquakes
PGA (% G)
Magnitutde (Richter)
Intensity (MMI)
Description
<0.17 1.0-3.0 I I. Not felt except by a very few under especially favorably conditions.
0.17-1.4 3.0-3.9 II-III
II. Felt only by a few persons at rest, especially on upper floors of buildings. III. Felt quite noticeably by persons indoors, especially on upper floors of buildings. Many people do not recognize it as an earthquake. Standing motorcars may rock slightly. Vibrations similar to the passing of a truck. Duration estimated.
1.4-9.2 4.0-4.9 IV-V
IV. Felt indoors by many, outdoors by few during the day. At night, some awakened. Dishes, windows, doors disturbed; walls make cracking sound. Sensation like heavy truck striking building. Standing motorcars rocked noticeably. V. Felt by nearly everyone; many awakened. Some dishes, windows broken. Unstable objects overturned. Pendulum clocks may stop.
9.2-34 5.0-5.9 VI-VII
VI. Felt by all, many frightened. Some heavy furniture moved; a few instances of fallen plaster. Damage slight. VII. Damaged negligible in buildings of good design and construction; slight to moderate in well-build ordinary structures; considerable damage in poorly built or badly designed structures; chimneys broken.
34-124 6.0-6.9 VIII-IX
VIII. Damage slight in specially designed structures; considerable damage in ordinary substantial buildings with partial collapse. Damage great in poorly built structures. Fall of chimneys, factory stacks, columns, monuments and walls. Heavy furniture overturned. IX. Damage considerable in specially designed structures; well-designed frame structures thrown out of plumb. Damage great in substantial buildings, with partial collapse. Buildings shifted off foundations.
>124 7.0 and higher X or higher
X. Some well-built wooden structures destroyed; most masonry and frame structures destroyed and foundations. Rails bent. XI. Few, if any (masonry), structures remain standing. Bridges destroyed. Rails bent greatly. XII. Damage total. Lines of sight and level are distorted. Objects thrown in the air.

November 2015
69
Historic and Prehistoric Earthquakes in New Mexico
The Rio Grande rift is a major tectonic feature of western North America (Wilson et al., 2005), and is
expressed on the surface of the earth as a series of elongate north-south trending basins that run from
central Colorado, through the central parts of New Mexico, into northern Mexico where it blends with
the greater Basin and Range Province. Because the rift guides the path of the Rio Grande in New Mexico,
it is the most highly populous sector of the state. Much of New Mexico’s historical seismicity has been
concentrated in the Rio Grande Valley between Socorro and Albuquerque, with about half of the
earthquakes of intensity VI or greater (MMI) that occurred in the state between 1868 and 1973 being
centered in this region. Los Alamos lies near several major boundary faults of the Rio Grande rift in
north-central New Mexico. The margin of the Rio Grande rift in the Los Alamos area is locally defined by
the Rio Grande rift-related Pajarito fault system.
Historic earthquakes in the southwestern U.S. and northern Mexico region include a magnitude ~7.2
earthquake in northern Mexico in 1887 (which is perhaps a good analogue for a large Rio Grande rift
earthquake in New Mexico), numerous magnitude 4 to 6 earthquakes in the Socorro areas throughout
the 20th century (most notably two earthquakes near magnitude 6 in 1906), and magnitude 4 to 5+
events in Cerrillos and Dulce in 1918 and 1966, respectively. The net earthquake threat to the state is
considered moderate in a national perspective. There have been at least eight earthquakes felt by the
residents of Los Alamos since its creation during World War II. The largest of these registered a
magnitude 4 that occurred in 1952 and a magnitude 3.3 in 1971; both earthquakes had reported MMIs
of V in Los Alamos. More recently, Los Alamos experienced very small magnitude (<2) earthquakes (1991
and 1998) that produced unusually high MMIs (up to V). Recent paleoseismic studies on the Pajarito
fault systems indicated that a large earthquake of approximately magnitude 7 occurred in recent
prehistoric times. An October 17, 2011 magnitude 3.8 earthquake generated MMI levels of III-IV in the
Espanola Basin/Pojoaque/Santa Fe region.
Thousands of recorded earthquakes have been measured in New Mexico and analyzed in recent
decades by the New Mexico Institute of Mining and Technology and/or the U.S. Geological Survey. The
Socorro area has been the most active earthquake region of the state during at least the past 150 years.
During the past 45 years, approximately 50% of the seismic energy generated by earthquakes in New
Mexico has been released in a region centered near Socorro, encompassing only about 2% of the state's
total land area. This relatively high rate of earthquake activity in the Socorro region is due to a slowly
inflating (~2 mm/year) sill of molten rock (magma) that is roughly 1300 square miles in area and sits
approximately 12 miles beneath the surface of the fault-bounded Rio Grande rift.
Some small earthquakes in New Mexico have also been triggered by human activity. Earthquake-like
ground shaking may be related to oil and gas production and fluid reinjection.

November 2015
70
Figure 12 shows the identified faults located in the state of New Mexico.24 Faults and associated folds
are included that are believed to be the source of earthquakes with a magnitude greater than 6 during
the Quaternary Period (the past 1,600,000 years).25
Figure 12: Preparedness Areas and Fault Lines in New Mexico
24
Source: http://earthquake.usgs.gov/regional/qfaults/nm/ 25
Maps of each geologic structure: http://earthquake.usgs.gov/hazards/qfaults/
UNM Taos
UNM Los Alamos
UNM Main UNM Gallup
UNM Valencia
UNM Sevilleta
UNM West

November 2015
71
Figure 13 illustrates the earthquake hazard areas in the state of New Mexico. There has been a
clustering of earthquake activity around the cities of Socorro and Albuquerque (both located in
Preparedness Area 5). Additionally, significant amounts of high-magnitude seismic activity has been
recorded in the northeast area of the state in Preparedness Areas 2 and 3.
Figure 13: Earthquakes in New Mexico, 1962 - 201226
The historic area of seismicity includes most of New Mexico’s major population and transportation
centers. The record of damaging earthquakes in the state does not support extreme earthquake
26
Aster, R., Bilek, S., Stankova, J., Morton, E., Earthquakes in the central Rio Grande rift and the Socorro magma body, Proc. Volcanism in the American Southwest, USGS Open File Report, Flagstaff, AZ, 2012.
UNM Taos
UNM Los Alamos
UNM Main UNM Gallup
UNM Valencia
UNM Sevilleta
UNM West
November 2015
72
mitigation measures, as are common in states like California or nations like Japan. However, the lack of
serious earthquake damage in the past should not be interpreted as evidence that such damage will not
occur in the future.
Previous Occurrences
The City of Socorro (Preparedness Area 5) is the earthquake capital of New Mexico. Socorro is 78 miles
south of Albuquerque. A 5,000 km2 (1,931 mi2) area, less than 2% of New Mexico, surrounding the town
has produced nearly 50% of the 30 natural earthquakes of magnitude 4.5 or greater in the state since
1869. Three of these shocks occurred during a very strong swarm from 2 July 1906 through early 1907
and were the strongest within the state from 1869 through 2012. Information on these shocks comes
from newspaper accounts and notably from a published paper by the noted seismologist H. F. Reid. His
paper on the 1906–1907 swarm in the first issue of the Bulletin of the Seismological Society of America
and presents Rossi-Forel earthquake intensity observations out to distances of several hundred
kilometers for the three strong earthquakes of the swarm.27
Earthquake swarms, defined as a series of earthquakes recurring for days in nearly the same location
within minutes of each other, are very common in this region. Historical accounts of these swarms date
back to the 1860s, and they have been recorded on local seismic instruments since the early 1960s. The
majority of the earthquakes in these swarms are shallow (3-8 miles beneath the surface), and relatively
small (M < 1.0). These small earthquakes are not damaging; however, based on historic seismicity and
geologic evidence, there is a chance for a larger, possibly damaging event in the future (Wong, 2009).
According to the US Geological Survey, there is an 18% chance of a large earthquake (M > 6.0) in the
Socorro region in the next 100 years.
Twelve strong felt earthquakes with estimated magnitudes of 4.5 or greater occurred in the Socorro
area from 1869 through 1961. Unlike the instrumental data from 1962 through 2004, nearly all of these
strong shocks appear to have had epicenters near Socorro rather than north of San Acacia. Also the
statistics for earthquakes with magnitudes of 4.5 or greater from 1869 to the present indicated the
Socorro-area seismic activity before the 1930s was significantly higher primarily because of prolonged
earthquake swam that commenced in July 1906 a few months following the San Francisco earthquake in
April of that year. Earthquakes were felt as early as July 2, 1906 and continued almost on a daily basis
well into 1907. Three shocks in the swarm had magnitudes of 5.5 to 6.1, strong enough to significantly
damage some adobe and masonry structures. The most unusual characteristic noted of the swarm was
the exceptionally large number of felt earthquakes over a six-month period. It is suspected that weak
shocks probably related to the swarm continuing into 1909.
The largest earthquakes of record in this region occurred during an ongoing earthquake swarm in 1906,
and the magnitudes of the two largest events were approximately 6.0. For comparison, the largest felt
and heard event from the most recent swarm in this region (August 2009) was M 2.6. This earthquake
27
Source: Reid, H.G. Remarkable earthquakes in central New Mexico in 1906 and 1907, Bulletin of the Seismological Society of America, 1, 10-16, 1911. Sanford, A.R., 2008, New Estimates of the magnitudes and locations for the strongest earthquakes in 1906-07 Socorro, New Mexico, earthquake swarm: New Mexico Geology, 30, 107-112.
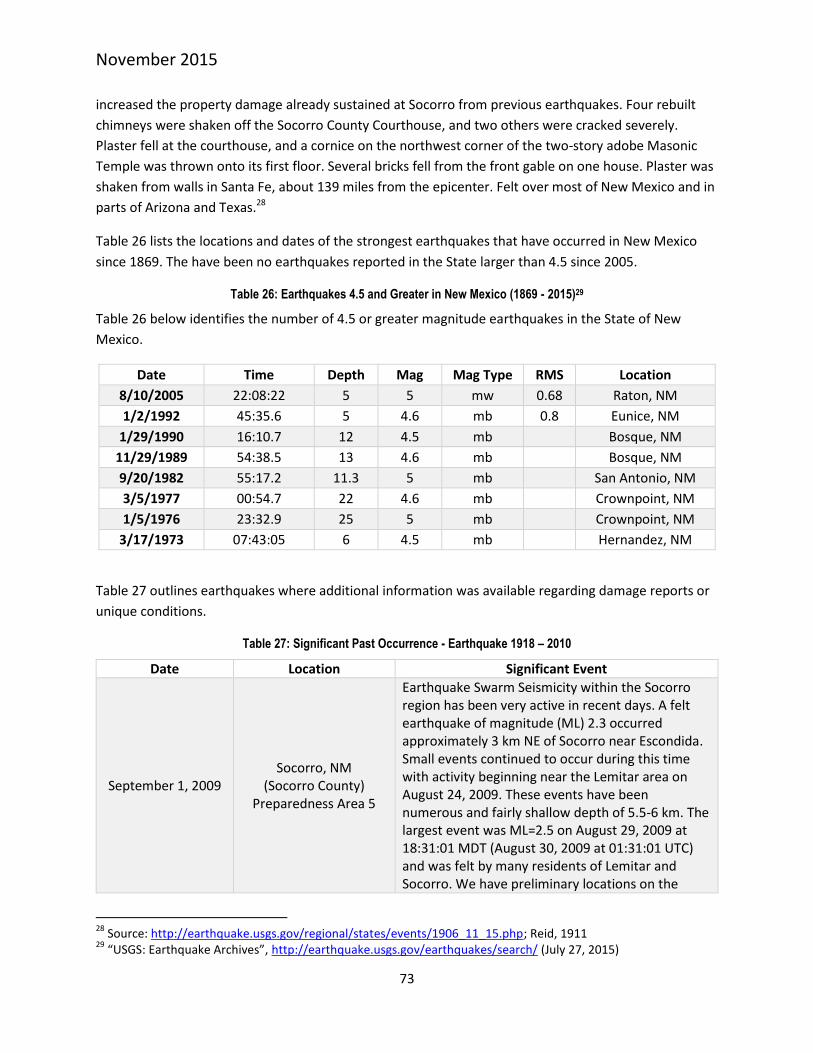
November 2015
73
increased the property damage already sustained at Socorro from previous earthquakes. Four rebuilt
chimneys were shaken off the Socorro County Courthouse, and two others were cracked severely.
Plaster fell at the courthouse, and a cornice on the northwest corner of the two-story adobe Masonic
Temple was thrown onto its first floor. Several bricks fell from the front gable on one house. Plaster was
shaken from walls in Santa Fe, about 139 miles from the epicenter. Felt over most of New Mexico and in
parts of Arizona and Texas.28
Table 26 lists the locations and dates of the strongest earthquakes that have occurred in New Mexico
since 1869. The have been no earthquakes reported in the State larger than 4.5 since 2005.
Table 26: Earthquakes 4.5 and Greater in New Mexico (1869 - 2015)29
Table 26 below identifies the number of 4.5 or greater magnitude earthquakes in the State of New
Mexico.
Date Time Depth Mag Mag Type RMS Location
8/10/2005 22:08:22 5 5 mw 0.68 Raton, NM
1/2/1992 45:35.6 5 4.6 mb 0.8 Eunice, NM
1/29/1990 16:10.7 12 4.5 mb
Bosque, NM
11/29/1989 54:38.5 13 4.6 mb
Bosque, NM
9/20/1982 55:17.2 11.3 5 mb
San Antonio, NM
3/5/1977 00:54.7 22 4.6 mb
Crownpoint, NM
1/5/1976 23:32.9 25 5 mb
Crownpoint, NM
3/17/1973 07:43:05 6 4.5 mb
Hernandez, NM
Table 27 outlines earthquakes where additional information was available regarding damage reports or
unique conditions.
Table 27: Significant Past Occurrence - Earthquake 1918 – 2010
Date Location Significant Event
September 1, 2009 Socorro, NM
(Socorro County) Preparedness Area 5
Earthquake Swarm Seismicity within the Socorro region has been very active in recent days. A felt earthquake of magnitude (ML) 2.3 occurred approximately 3 km NE of Socorro near Escondida. Small events continued to occur during this time with activity beginning near the Lemitar area on August 24, 2009. These events have been numerous and fairly shallow depth of 5.5-6 km. The largest event was ML=2.5 on August 29, 2009 at 18:31:01 MDT (August 30, 2009 at 01:31:01 UTC) and was felt by many residents of Lemitar and Socorro. We have preliminary locations on the
28
Source: http://earthquake.usgs.gov/regional/states/events/1906_11_15.php; Reid, 1911 29
“USGS: Earthquake Archives”, http://earthquake.usgs.gov/earthquakes/search/ (July 27, 2015)

November 2015
74
Date Location Significant Event
largest 53 events (ML range of 0.5 to 2.5); however, over 400 smaller events have also occurred since August 19, 2009. The locations of 53 of the largest earthquakes are very similar, suggesting that this is an earthquake swarm. Earthquake swarms are usually caused in response to tectonic or hydrological pressure changes in the crust. Minor felt earthquakes in this region are not uncommon, and have been documented by Dr. Allan Sanford in the past (figure below, blue squares). However, this was a swarm with unusually frequent, large earthquakes (14 earthquakes with ML > 1.4). For a size comparison, felt reports were noted for 4 events with ML 1.9 and greater.
January 4, 1971 City of Albuquerque (Bernalillo County)
Preparedness Area 5
Maximum Intensity VI earthquake felt within 600 square miles of the City of Albuquerque. Minor damage in the west and northwest of the City with reports of cracked walls/ plaster, broken windows and damage to fallen objects. Most damage reported at University of Albuquerque (now the location of St. Pius X High School) and West Mesa High School, both located on the west side of the City.
November 3, 1954 Albuquerque, NM (Bernalillo County)
Preparedness Area 5
Plaster cracks, broken windows, and cracked fireplaces have been reported from past earthquakes. Minor structural damage occurred to a bank in Albuquerque from an intensity V earthquake. Barns have collapsed and rooftop air-conditioners shaken loose.
May 28, 1918 Village of Cerrillos (Santa Fe, County)
Preparedness Area 3
An earthquake with strong local effects in Santa Fe County, where people in the village of Cerrillos were thrown off their feet and fallen plaster was reported (intensity VII - VIII).
November 15, 1906
Socorro, NM (Socorro County)
Preparedness Area 5 Santa Fe, NM
(Santa Fe, County) Preparedness Area 3
The largest historic earthquake in New Mexico: (Mercalli Intensity: VII): This earthquake, which was the culmination of a sustained earthquake swarm between 1904 through 1907, increased the property damage already sustained at Socorro from previous earthquakes. Four rebuilt chimneys were shaken off the Socorro County Courthouse, and two others were cracked severely. Plaster fell at the courthouse, and a cornice on the northwest corner of the two-story adobe Masonic Temple was thrown onto its first floor. Several bricks fell from the front gable on one house. Plaster was shaken from walls in Santa Fe about 200 kilometers from

November 2015
75
Date Location Significant Event
the epicenter. Felt over most of New Mexico and in parts of Arizona and Texas.30
Frequency
Based on state-wide date related to past seismic event, the frequency of magnitude 4.5 or larger
earthquakes in the State of New Mexico has been determined as low to medium. Historically, based on
available data related to previous earthquake events in New Mexico, every year there is a .22 chance of
a 4.5+ earthquake occurring in New Mexico.
Probability of Future Occurrence
Significant earthquakes (larger than 6.5 magnitude with more than $1 million in damage) with
epicenters in the State of New Mexico have not been felt in recent history, but the area has numerous
faults with the potential for a large magnitude earthquake. The potential for such a disaster is low. The
greatest threat is along the Rio Grande Rift and the Jemez Lineament that runs North-east to South-west
near Los Alamos.
Figures 14-17 provide a visual representation of the maximum probable earthquake epicenter and
potential peak ground acceleration (PGA) values for individual towns and cities across the state. The
location and magnitude for the epicenters were recommended by Subject Matter Experts for each
Preparedness Area.
Risk Assessment
Significant earthquakes (larger than 6.5 magnitude with more than $1 million in damage) with
epicenters in the State of New Mexico have not been felt in recent history. However, the state contains
numerous faults with potential for large magnitude earthquakes. The potential for such a disaster is low.
The greatest threat is along the Rio Grande Rift and the Jemez Lineament that runs northeast to
Southwest near Los Alamos. This area includes UNM Main Campus, UNM Valencia Branch, UNM West,
UNM Los-Alamos Branch, and the Sevilleta LTER Field station. According to Arup Maji (Professor Civil
and Structural Engineering, University of New Mexico) the likely consequence to New Mexico is partial
collapse of unreinforced masonry and old adobe buildings. Roads and bridges are unlikely to suffer
damage that would render them unusable.
According to Rick Aster (Chair of the Department of Earth and Environmental Science, New Mexico
Institute of Mining and Technology), if a major basin and range earthquake similar to the 1887 Sonoran
Earthquake were to occur in New Mexico, the state would suffer high levels of damage, with general
losses ranging from 10s to 100s of millions of dollars depending on the location of the event.
Furthermore, the area most subject to seismic activity, based on historic occurrence, is the Socorro-to-
Albuquerque segment of the Rio Grande valley. This area is densely populated and rapidly developing.
Present building codes require construction of certain occupancies (schools, hospitals, public buildings)
to high earthquake resistance standards, although seismic mitigating construction is not required for
residential buildings.
30
Source: http://earthquake.usgs.gov/regional/states/events/1906_11_15.php; Reid, 1911
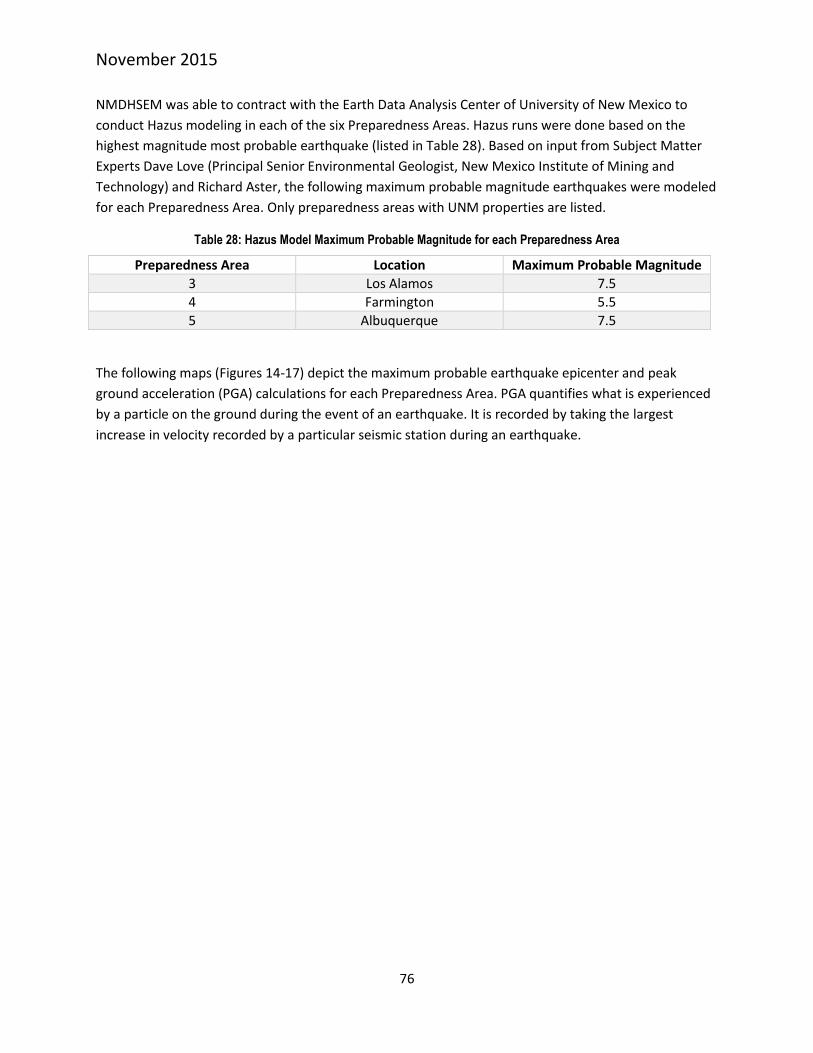
November 2015
76
NMDHSEM was able to contract with the Earth Data Analysis Center of University of New Mexico to
conduct Hazus modeling in each of the six Preparedness Areas. Hazus runs were done based on the
highest magnitude most probable earthquake (listed in Table 28). Based on input from Subject Matter
Experts Dave Love (Principal Senior Environmental Geologist, New Mexico Institute of Mining and
Technology) and Richard Aster, the following maximum probable magnitude earthquakes were modeled
for each Preparedness Area. Only preparedness areas with UNM properties are listed.
Table 28: Hazus Model Maximum Probable Magnitude for each Preparedness Area
Preparedness Area Location Maximum Probable Magnitude
3 Los Alamos 7.5
4 Farmington 5.5
5 Albuquerque 7.5
The following maps (Figures 14-17) depict the maximum probable earthquake epicenter and peak
ground acceleration (PGA) calculations for each Preparedness Area. PGA quantifies what is experienced
by a particle on the ground during the event of an earthquake. It is recorded by taking the largest
increase in velocity recorded by a particular seismic station during an earthquake.

November 2015
77
Figure 14: Maximum Probable Earthquake Epicenter and Potential Peak Ground Acceleration
UNM Taos
UNM Los Alamos
UNM Main
UNM Gallup
UNM Valencia
UNM Sevilleta
UNM West

November 2015
78
Figure 15: Maximum Probable Earthquake Epicenter and Potential Peak Ground Acceleration, Preparedness Area 3
UNM Los Alamos
UNM Taos

November 2015
79
Figure 16: Maximum Probable Earthquake Epicenter and Potential Peak Ground Acceleration, Preparedness Area 4
UNM Gallup

November 2015
80
Figure 17: Maximum Probable Earthquake Epicenter and Potential Peak Ground Acceleration, Preparedness Area 5
UNM Main
UNM Valencia
UNM Sevilleta
UNM West

November 2015
81
Table 29 identifies potential impacts from an earthquake.
Table 29: Potential Impacts from Earthquakes
Subject Potential Impacts
Health and Safety of the PUBLIC The public may be injured or killed by falling materials. Broken glass can cause injuries.
Health and Safety of RESPONDERS Responders face the same impacts as the public
CONTINUITY OF OPERATIONS Those operations that are in or near the impact area may be shut down or even destroyed.
DELIVERY of SERVICES Service delays are anticipated to operations within or near the damaged areas.
PROPERTY, FACILITIES, INFRASTRUCTURE
Earthquakes can cause widespread damages to buildings and infrastructure. Some buildings or bridges can be condemned. Water and gas lines as well as dams may rupture. Earthquake building codes have not been implemented consistently throughout the state, and this could be a serious problem.
ENVIRONMENT The cascading effects such as landslides are the main environmental issue.
ECONOMIC CONDITION A strong earthquake may cause severe damages within a community.
PUBLIC CONFIDENCE No impacted by the event itself, but may be damaged if the response to an event is poor.
Data Limitations
Present seismic monitoring in New Mexico is conducted by the New Mexico Institute of Mining and
Technology and the U.S. Geological Survey National Earthquake Information Center in Golden, CO.
Levels of instrumentation and staffing are presently sufficient to generally characterize events anywhere
within the state to magnitude levels of approximately 3.0 (and significantly smaller in better
instrumented areas, such as the vicinity of the WIPP/Carlsbad area and the Socorro region. Unusual
sequences of exceptional societal or scientific interest can be additionally studied with temporary
deployments of portable seismographs through the IRIS PASSCAL Instrument Center at the New Mexico
Institute of Mining and Technology and/or using USGS national resources. Los Alamos National
Laboratory also operates a regional seismographic network focused on the Pajarito fault zone and Valles
Caldera region.
Summary of Impact to UNM
Much of the UNM’s infrastructure, especially older construction, has not been designed with earthquake
resistance in mind. An earthquake of even moderate scale in the right place could cause extensive
damage. Based on peak acceleration values, it is apparent that the region roughly along the Rio Grande
from southern Socorro County north into Rio Arriba County is where seismic activity would be expected.
UNM Main Campus, UNM West, Los Alamos Branch Campus, Taos Branch Campus, Valencia County
Branch and Sevilleta LTER Field Station are located within Rio Grande fault line and are vulnerable to

November 2015
82
earthquake damage. The Gallup Branch Campus data is not available and further studies will be required
to determine those vulnerabilities.
There are no credible seismic damage estimates for UNM Main, Gallup, Los Alamos, Taos, Valencia
branch campuses, UNM West, and Sevilleta LTER Field Station. More information is needed on the types
of structures —their age, condition, and construction type—in order to rate their relative vulnerability.
For example, unreinforced masonry structures built before current building codes are more susceptible
to damage than others built to seismic-resistant codes. UNM Main Campus buildings range in age from
1889 to present day. Older buildings within the infrastructure are more susceptible to natural hazards
than newer constructed or reconstructed structures and become a challenge when determining the best
approach to implement a mitigation strategy. Facilities at the Branch locations are newer in design and
have fewer infrastructure concerns, based on past incidents. As buildings are being considered for
renovation or new facilities constructed, UNM Planning and Campus Development should consider
building design based on mandatory construction laws and regulations as well as best practices and
lessons learned from past natural hazard events.
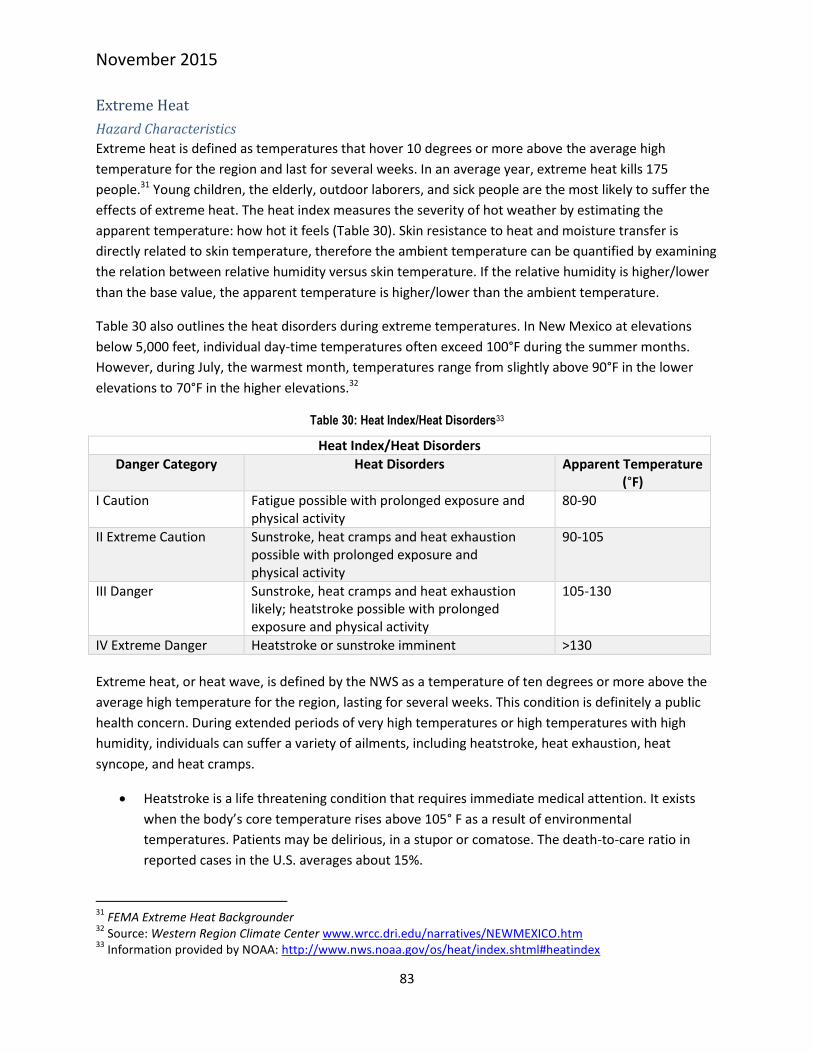
November 2015
83
Extreme Heat
Hazard Characteristics
Extreme heat is defined as temperatures that hover 10 degrees or more above the average high
temperature for the region and last for several weeks. In an average year, extreme heat kills 175
people.31 Young children, the elderly, outdoor laborers, and sick people are the most likely to suffer the
effects of extreme heat. The heat index measures the severity of hot weather by estimating the
apparent temperature: how hot it feels (Table 30). Skin resistance to heat and moisture transfer is
directly related to skin temperature, therefore the ambient temperature can be quantified by examining
the relation between relative humidity versus skin temperature. If the relative humidity is higher/lower
than the base value, the apparent temperature is higher/lower than the ambient temperature.
Table 30 also outlines the heat disorders during extreme temperatures. In New Mexico at elevations
below 5,000 feet, individual day-time temperatures often exceed 100°F during the summer months.
However, during July, the warmest month, temperatures range from slightly above 90°F in the lower
elevations to 70°F in the higher elevations.32
Table 30: Heat Index/Heat Disorders33
Heat Index/Heat Disorders
Danger Category Heat Disorders Apparent Temperature (°F)
I Caution Fatigue possible with prolonged exposure and physical activity
80-90
II Extreme Caution Sunstroke, heat cramps and heat exhaustion possible with prolonged exposure and physical activity
90-105
III Danger Sunstroke, heat cramps and heat exhaustion likely; heatstroke possible with prolonged exposure and physical activity
105-130
IV Extreme Danger Heatstroke or sunstroke imminent >130
Extreme heat, or heat wave, is defined by the NWS as a temperature of ten degrees or more above the
average high temperature for the region, lasting for several weeks. This condition is definitely a public
health concern. During extended periods of very high temperatures or high temperatures with high
humidity, individuals can suffer a variety of ailments, including heatstroke, heat exhaustion, heat
syncope, and heat cramps.
Heatstroke is a life threatening condition that requires immediate medical attention. It exists
when the body’s core temperature rises above 105° F as a result of environmental
temperatures. Patients may be delirious, in a stupor or comatose. The death-to-care ratio in
reported cases in the U.S. averages about 15%.
31
FEMA Extreme Heat Backgrounder 32
Source: Western Region Climate Center www.wrcc.dri.edu/narratives/NEWMEXICO.htm 33
Information provided by NOAA: http://www.nws.noaa.gov/os/heat/index.shtml#heatindex

November 2015
84
Heat exhaustion is much less severe than heatstroke. The body temperature may be normal or
slightly elevated. A person suffering from heat exhaustion may complain of dizziness, weakness,
or fatigue. The primary cause of heat exhaustion is fluid and electrolyte imbalance. The
normalization of fluids will typically alleviate the situation.
Heat syncope is typically associated with exercise by people who are not acclimated to physical
activity. The symptoms include a sudden loss of consciousness. Consciousness returns promptly
when the person lies down. The cause is primarily associated with circulatory instability because
of heat. The condition typically causes little or no harm to the individual.
Heat cramps are typically a problem for individuals who exercise outdoors but are
unaccustomed to heat. Similar to heat exhaustion, it is thought to be a result of a mild
imbalance of fluids and electrolytes.
The elderly, disabled, and debilitated are especially susceptible to heat stroke. Large and highly
urbanized cities can create an island of heat that can raise the area’s temperature by 3° to 5° F.
Populations of elderly, disabled, and debilitated people could face a significant medical emergency
during an extended period of excessive heat. The highest temperature on record for Albuquerque is
107°F on June 6th, 1994. Los Lunas, NM sees an average of 6 days in a year over 100 degrees. UNM
locations in higher elevations, such as Los Alamos and Taos don’t see temperatures rise over 100
degrees.
New Mexico is partially an arid desert state, and summer temperatures often exceed the 100-degree
mark under normal conditions. Nighttime temperatures are typically cool due to low humidity, and even
though daytime temperatures may be high, people experience relief at night. Heat waves in which daily
high temperatures exceed 110° F for many days in a row are rare. Such a heat wave in the higher
altitudes would probably have a more damaging effect because people would not be expecting such hot
conditions. However, anywhere in the state that experienced the humidity/temperature combination
could suffer ill effects from the event. A heat wave would also have a drying effect on vegetation,
facilitating the ignition of wildfires. If a heat wave were coupled with a power failure, the effect on the
population would be much more severe due to a lack of air conditioning. In general, it is safe to say that
there is no area of the state that is immune from the hazard of heat wave.
A unique aspect to extreme heat in New Mexico is the fact that UVB radiation also increases with
increasing altitude, or distance above the surface of the earth. For every 1,000 feet of altitude, the UV
radiation increases by about 4 percent. This means that approximately 20 percent more UV radiation
reaches the earth's surface in Santa Fe, than in a city that is at similar latitude but at sea level. This can
exacerbate heat effects at high altitude.

November 2015
85
In 1979, meteorologist R.G. Steadman developed a heat index (Figure 18) to illustrate the risks
associated with extreme summer heat. NOAA's heat alert procedures are based mainly on Heat Index
Values. The Heat Index, sometimes referred to as the “apparent temperature” is given in degrees
Fahrenheit. The Heat Index is a measure of how hot it really feels when relative humidity is factored
with the actual air temperature.
Figure 18: Heat Index as of June 201534
According to the Office of the Medical Investigator, there are two recorded events of extreme heat
causing death or injury within the state of New Mexico. Those deaths were due to negligence of parents
leaving children in the car for a long period of time. Periods of excessive heat usually result in high
electrical consumption for air conditioning, which can cause power outages and brownouts.
While PNM reports no wide spread power failures due to overuse, the large numbers of new homes and
conversion to air conditioning from evaporative coolers, could put a strain on the electrical grid.
34
Source: http://www.weather.gov/media/unr/heatindex.pdfb

November 2015
86
Previous Occurrences
The State of New Mexico experiences extreme heat events annually. Table 31 highlights past
occurrences recorded by NMDHSEM. Referencing the NCDC online database, there are three
occurrences entered for past events. The events on August 6, 2012 and July 14, 2010 left two fatalities.
Table 31: Significant Past Occurrences - Extreme Heat (January 1, 2006 - December 1, 2012)
Date Location Significant Event
June 10, 2013 Albuquerque, NM
Preparedness Area 5
A seven month old boy was in critical condition after being left inside a hot car for more than two hours during the afternoon of Monday, June 10th. Temperatures around the city at the time of the incident were in the upper 90s to low 100s. The ASOS at the Albuquerque Sunport recorded a maximum temperature of 99 degrees Fahrenheit, which tied the record maximum temperature for the date last observed in 1981.
August 6, 2012 Albuquerque, NM
Preparedness Area 5
A toddler died after being left inside a parked vehicle for over eight hours. Ambient air temperatures were in the lower to mid-90s. An Albuquerque toddler died Monday afternoon after being left inside a car for at least 8 hours. The boy was found Monday afternoon inside the car and was pronounced dead later at the hospital. High temperature recorded at the Albuquerque International Sunport was 93F.
July 14, 2010 Albuquerque, NM
Preparedness Area 5
A 2-year-old died after being left in a hot car for almost four hours at Southwestern Indian Polytechnic Institute. By noon MST, the outside air temperature was 93 degrees which may have resulted in temperatures exceeding 135 degrees in the vehicle.
July 2003
State of New Mexico
All Preparedness Areas
Hottest month ever recorded in New Mexico. There
were 14 days of highs of 100or more, and no cooling at night. A new all-time high low
temperature of 78is set. 21 days do not go below
70. Average temperature of 84.6for the entire
month shatters 1980 record of 82.7.
May 24. 2000
State of New Mexico
All Preparedness Areas
New daily high temperature records were set across the state as temperatures soared into the high 90s and 100s all across the east and south. Record highs in the mid and upper 80s were also set in the higher elevation communities of both the south central, central and northern mountains.
June 1998
State of New Mexico
All Preparedness Areas
Conditions were unusually warm and dry throughout the month of June, but the heat intensified beginning on the 20th with daily high temperatures climbing well above 100 degrees,

November 2015
87
Date Location Significant Event
except in mountain communities at elevations above 7500 feet. Readings in the southeast section of the state peaked at 108 to 113 degrees as these locations exceeded 10 consecutive days with daily highs above 100 degrees. New records for duration of 100 plus degree-days were set from Carlsbad north to Clovis and Tucumcari. The heat broke records that had lasted 60 to 70 years. By the end of the month a number of locations in the east had observed 16 to 20 days with a daily high over 100 degrees.
June 27, 1994 Albuquerque, NM
Preparedness Area 5
Albuquerque area hits 107, the highest temperature ever recorded in Albuquerque (the
104on June 26 tied the previous record).
Summer (June through August)
1980
Albuquerque, NM Preparedness Area 5
Record heat with 25 days of 100 or more in the Albuquerque metro area (prior record was 12
days). July average daytime high is 99.1.
Table 32 outlines previously recorded extreme heat events as reported by SHELDUS.
Table 32: SHELDUS Previously Recorded Extreme Heat Events (1994-2014)35
County Name Year Month Property Damage
Injuries Fatalities Records
Bernalillo 2013 6 0 1 0 1
Bernalillo 2012 8 0 0 1 1
Bernalillo 2010 7 0 0 1 1
35
SHELDUS, http://hvri.geog.sc.edu/SHELDUS/ (July 27, 2015

November 2015
88
Frequency
Patterns, frequency, and degree of severity of extreme heat events are difficult to predict. Referencing
the map in Figure 19, the state can experience average summer temperatures from 70 to well over 78
degrees with temperatures in the summer reaching up to 100 degrees plus. In temperatures exceeding
90°F, young children, the elderly, outdoor laborers, and sick people are the most likely to suffer from
sunstroke, heat cramps, heat exhaustion, and possibly heatstroke.
Figure 19: Average Temperature and Preparedness Area Map of New Mexico36
The National Weather Service Albuquerque reported above average monthly temperatures in New
Mexico for 2014. The average temperature in 2014 was 58.7°F. This was 1.5 degrees above the 30 year
normal (1981-2010) of 57.2°F. The long term annual normal (1893 to current) temperature is 56.4°F.
2014 was the 7th warmest year on record at the Albuquerque Sunport, going back to 1892. 2012 was
the warmest year on record with an average temperature of 59.9°F.
36
Source: 2010 NM State Hazard Mitigation Plan
UNM Taos
UNM Los Alamos
UNM Main
UNM Gallup
UNM Valencia
UNM Sevilleta
UNM West

November 2015
89
Figure 20: Daily Temperature Data - Albuquerque Area, NM37
Probability of Future Occurrence
To determine the probability of each Preparedness Area experiencing future extreme heat occurrences,
the probability or chance of occurrence was calculated based on historical data identified in Table 33.
Table 33 identifies the probability of each Preparedness Area experiencing some type of extreme heat
event annually. Probability was determined by dividing the number of events observed by the number
of years and multiplying by 100. This gives the percent chance of the event happening in any given year.
It should be noted that general inconsistencies in local event reporting to the NCDC would make this
probability seem low as extreme heat events are an annual occurrence.
Table 33: Probability of Future Occurrence - Extreme Heat
Probability of Future Occurrence
Preparedness Area Extreme Heat
Preparedness Area 3 1.2%
Preparedness Area 4 3.6%
Preparedness Area 5 1.2%
Risk Assessment
New Mexico experiences some form of extreme heat activity annually, based on seasonal
meteorological patterns and local topographical conditions. All UNM locations are susceptible to
extreme heat conditions, although local topography, such as elevation and land contours, plays a
significant part in how this extreme heat affects a particular area. The effects of extreme temperatures
generally affect at risk sectors of the population: the elderly, the young, the sick/infirmed, those living
below the poverty level and outdoor laborers.
37
“National Weather Service: 2014 Weather Highlights”, http://www.srh.noaa.gov/abq/?n=climonhigh2014annual-tempprecipabq (July 20, 2015)

November 2015
90
Table 34 outlines impacts from extreme heat events for each Preparedness Area to consider when
planning for these types of events.
Table 34: Extreme Heat Impacts
Subject Impacts
Health and Safety of The Public
Injuries and death have resulted from extreme heat events. Individuals caught out doors can suffer dehydration and death from high temperatures; Increased wildfire risk
Health And Safety of Responders Responders face the same impacts as the public.
Continuity of Operations Airport closures and local/regional power failures
Delivery of Services Airport closures and local/regional power failures
Property, Facilities, Infrastructure None anticipated
Environment Increased drought conditions (see Drought section for a list of associated environmental impacts)
Economic Condition Increased utility costs due to the extreme temperatures are anticipated; Loss of tourism; Decreased agricultural yields
Public Confidence No impacts anticipated
Data Limitations
Quantifying vulnerability of individual structures to damage from extreme heat hazards is difficult. The
NCDC and SHELDUS have limited information on extreme heat incidents that have occurred in New
Mexico.
Summary of Impact to UNM
Extreme heat can equally affect all UNM campuses, facilities, housing, high value research and art, and
some equipment, but it is generally a health risk, not a structural hazard. In temperatures exceeding
90°F, young children, the elderly, outdoor laborers, and people with pre-existing health conditions are
more likely to suffer from sunstroke, heat cramps, heat exhaustion, and possibly heatstroke. Extreme
heat is a concern for UNM because of the number of facilities which house many different specimens for
research. In an extreme heat condition, the loss of air conditioning can cause catastrophic loss to
experiments and specimens that requires a controlled environment. These losses of experiments are of
such significance they are considered irreplaceable due to the years of research in the process.
Vulnerability is viewed as low based on discussions with campus administration. Backup alternatives are
in place in the event of the loss of power (generators) but recognize these type alternatives can fail as
well. Students housed in UNM housing facilities could also be affected if there is a brownout. Loss of
power, and therefore loss of air conditioning, could force students to be temporarily moved out of UNM
dormitory facilitates due to high temperatures. UNM dormitories do not have generators but they do
have emergency power for lighting.

November 2015
91
Flood/Flash Floods
Hazard Characteristics
Flooding is one of the most common hazards in all 50 states and U.S. territories. Most injuries and
deaths from flooding happen when people are swept away by flood currents, and most property
damage results from inundation by sediment-filled water. The majority of flood events in the United
States involve inundation of floodplains. Figure 21 shows inundation of floodplains during a large-scale
weather system with prolonged rainfall from storms or snowmelt.
Figure 21: Flood Definition38
This type of flooding typically results from large-scale weather systems generating prolonged rainfall
from locally intense storms or snowmelt. For the purposes of this report, this type of flooding is referred
to as riverine flooding and is characterized by a gradual and predictable rise in a river or stream due to
persistent precipitation. After the stream or river overflows its banks the surrounding area often
remains under water for an extended period of time.
38
Source: FEMA’s “Understanding Your Risks – FEMA Publication 386-2, page 2-12.

November 2015
92
Riverine floods are described in terms of their extent (including the horizontal area affected and the
vertical depth of floodwaters) and the related probability of occurrence. Flood studies use historical
records to determine the probability of occurrence for different extents of flooding. The probability of
occurrence, shown in Table 35, is expressed as the percentage chance that a flood of a specific extent
will occur in any given year. Flash floods are usually the result of excessive precipitation or rapid
snowmelt and can occur suddenly. Although the State of New Mexico experiences riverine flooding,
flash flooding is a more common and a more damaging type of flooding.
Table 35: Flood Probability Terms39
Flood Recurrence Intervals Chance of occurrence in any given year
10-year 10%
50-year 2%
100-year 1%
500-year 0.2%
Flash floods are aptly named: they occur suddenly after a brief but intense downpour; they move quickly
and end abruptly. Although the duration of these events is usually brief, the damages can be quite
severe. People are often surprised at how quickly a normally dry arroyo can become a raging torrent.
Flash floods are the primary weather-related killer with around 140 deaths recorded in the United States
each year. Flash floods are common and frequent in New Mexico, and as a result, New Mexico has the
tenth highest flash flood fatality rate in the nation. Flash floods cannot be predicted.
Flash flooding is the second greatest weather hazard in New Mexico. New Mexico ranks 10th in the
nation in flash flood deaths per capita, using statistics based on storm data for 2006 - 2012. The flash
flooding problem stems from a number of factors. During the summer (June through August period),
thunderstorm frequency in certain parts of New Mexico is among the highest in the nation. Excessive
moisture during the summer can lead to large volume runoffs enhanced by the terrain. Table 36 lists the
major causes of riverine flooding vs. flash flooding.
Table 36: Flooding vs. Flash Floods – Cause40
Riverine Floods Flash Floods
Low lying, relatively undisturbed topography Hilly/mountainous areas
High season water tables High velocity flows
Poor drainage Short warning times
Excess paved surfaces Steep slopes
Constrictions – filling Narrow stream valleys
Obstructions – bridges Parking lots and other impervious surfaces
Soil characteristics Improper drainage
39
Source: USGS Water Science School: http://ga.water.usgs.gov/edu/100yearflood.html (December 2012) 40
Source: http://www.weatherexplained.com/Vol-1/Floods-Flash-Floods.html

November 2015
93
Alluvial Fans
Alluvial fans and alluvial fan flood hazards exist in the state. Alluvial fan flood hazard characteristics
include heavy sediment/debris loads and high velocity flows. According to FEMA, “an alluvial fan is a
sedimentary deposit located at a topographic break such as the base of a mountain front, escarpment,
or valley side, that is composed of stream flow and/or debris flow/sediments and has the shape of a fan,
either fully or partially extended.”41 New Mexico has more alluvial plains than alluvial fans due to the
natural apex, according to Paul Dugie, NM Floodplain Managers Association. Though the intense
rainstorms which produce fan floods occur randomly, they nevertheless can develop very rapidly at any
time and can recur with frequency.42 The California Alluvial Fan Task Force states, “When alluvial fan
flooding occurs, it is flashy and unpredictable and variable in magnitude. This type of flooding does not
necessarily occur as the result of large amounts of rain. Often, it is triggered by intense rainfall over
short periods of time. The natural flooding process that drives alluvial fan sedimentation tends to
produce thick deposits of sand and gravel, particularly near the apex of the fan, with relatively minor
proportions of fine-grained particles.” According to Dr. David Love, New Mexico Bureau of Geology and
Mining Resources, in the State of New Mexico, there have been no confirmed studies specific to alluvial
fan flooding risk.
According to multiple studies, alluvial fan flood risk can cause high velocity flow (as high as 15-30 feet
per second) producing significant hydrodynamic forces, erosion/scour to depths of several feet,
deposition of sediment and debris (to depths of several feet), deposition of sediment and debris (
depths of 15 – 20 feet have been observed), debris flows/impact forces, mudflows, inundation,
producing hydrostatic/buoyant forces (pressure against buildings caused by standing water), flash
flooding with little, if any, warning times.
Alluvial fans are often an overlooked as hazards and there is a tendency to underestimate both the
potential and severity of alluvial fan flood events. The infrequent rainfall, gently sloping terrain, and
often long time spans between successive floods contribute to a sense of complacency regarding the
existence of possible flood hazards. 43
Stormwater Runoff
When heavy precipitation falls stormwater runoff is possible. Stormwater runoff occurs when heavy
precipitation flows over the ground. Urban areas with water-resistant surfaces like driveways, sidewalks,
and streets can prevent the stormwater from naturally soaking into the ground. These surfaces should
direct water into the drainage systems for discharge. However, drainage systems may be overwhelmed
or at capacity causing excess water to seep into basements and through building walls and floors causing
flooding.
Flooding and Debris Flow Post-fire
Freshly burned landscapes are at risk of damage from post-wildfire erosion hazards such as those caused
by flash flooding and debris flows. Burn scar areas have a tremendous impact on flood and debris flow
41
Source: FEMA, MT-2 Procedures Manual, May 2009, p.30 42
FEMA, Alluvial Fans: Hazards and Management, 1989, p. 3 43
FEMA, MT-2 Procedures Manual, May 2009

November 2015
94
following short duration high intensity rainfall. These high volume low frequency floods result from
typical monsoon summer rains and occur in and downstream of the burn scar areas. Dramatic changes
in runoff, erosion, and deposition have been documented in watersheds affected by wildfire. These
post-fire changes have led to loss of life, damage to property, and significant impacts on infrastructure.
Extreme soil damage occurs within watersheds that experience a wildfire. Soil damage usually occurs
where burn intensities are severe to moderate. The loss of the organic components in the soil greatly
decreases the ability of rain to infiltrate. Within these burned areas, large floods result from average
monsoonal rainstorms. In combination with the damaged soil, the destruction of vegetation by wildfires
and in particular the forest canopy has created high potential for floods. In general, coniferous trees
intercept more rainfall than deciduous trees in full leaf. New Mexico forests are predominantly
Coniferous and the risk for flooding is increased when these forest types and others are drastically
reduced and destroyed by wildfires.
Increased long term risk of flooding will continue for years after a watershed has experienced a burn.
Ongoing concerns are the increased potential for flooding and debris flow plus large amounts of
sediment being transported from the burn scar areas. Additionally, debris flows could create temporary
dams or sediment plugs along drainage courses that could fill and breach, sending flood waves
downstream creating life safety issues. Life safety concerns are higher in those communities located
downstream of burned watersheds.
Debris flows are destructive, fast-moving slurries of water and sediment that can originate from rainfall
on recently burned, rugged areas and can have an enormous destructive power. The location, extent,
and severity of wildfire and the subsequent rainfall intensity and duration cannot be known in advance;
however, it is possible to determine likely locations and sizes of post-wildfire debris flows using available
geospatial data and mathematical models. Debris flow hazards can also be assessed for areas that have
not burned but are at high risk of wildfire.
The USGS, in cooperation with the U.S. Forest Service and NOAA, has conducted debris-flow analyses for
the Las Conchas fire, the Track fire, and the Little Bear Fire.44 Studies of these areas report high volume
floods downstream of burn scar areas. The models showed that for a 28 millimeter rain in 30 minutes
(equivalent to a 10-year recurrence interval), the debris flow probability increased by more than 80% for
67% of the basins burned by the Las Conchas Fire.
The models also showed that for a 38 millimeter rain in 30 minutes (equivalent to a 10-year recurrence
interval), the debris flow probability increased by more than 80% for Railroad Canyon and Lake Maloya
basins burned by the Track Fire (range of debris flow probability was from 2 to 97%). Lake Maloya is the
main water supply for the City of Raton. Maps shown in the USGS Post-wildfire Debris Flow Assessment
44
Tillery, A.C., Matherne, A.M., and Verdin K.L., 2012, Estimated probability of postwildfire debris flows in the 2012 Whitewater–Baldy Fire burn area, southwestern New Mexico: U.S. Geological Survey Open-File Report 2012–1188, 11 p., 3 pls: http://pubs.usgs.gov/of/2012/1188/

November 2015
95
for the Area Burned by the Track Fire can be used for prioritization of erosion mitigation or protective
measures.45
Basins with the highest probability of the highest debris flows include the upper Santa Clara Canyon (in
the northern burn scar area) and Peralta, Colle, Bland, Cochiti, Capulin, Alamo and Frijoles Canyons (in
the southern burn scar area). In the future, flood frequency predictions and debris flow hazard
assessments could help land managers plan for and mitigate the effects of post-fire flooding and debris
flows.
NFIP
UNM does not participate in the NFIP. However, the NFIP and FEMA supply many useful resources to
assist communities with planning for their flood risk. FEMA conducts a Flood Insurance Study that
includes statistical data for river flow, storm tides, hydrologic/hydraulic analyses, and rainfall and
topographic surveys. FEMA uses this data to create the flood hazard maps that outline a community's
different flood risk areas. These flood maps are useful tools for identifying where flood-prone areas are
and how frequently a floodplain will be inundated with water. This information contributes to the
development of strategies that may decrease or eliminate the potential impacts from a flooding event.
Maps that delineate special hazard areas and the risk premium zones applicable to the community are
termed Flood Insurance Rate Maps (FIRM) or Digital Flood Insurance Rate Maps (DFIRM).
New Mexico’s counties are in various stages of FEMA Flood Mapping programs. Current mapping status
can be retrieved by visiting NMFlood.org. All UNM campuses and properties are located within counties
with DFIRMs available.
Figures 22-25 show maps for all UNM campus and property locations that are within FEMA designated
flood zones. Current FEMA designated flood zones identified for New Mexico that apply to UNM areas
are described below46.
Zone A: Areas with a 1% annual chance of flooding and a 26% chance of flooding over the life of
a 30 year mortgage. Because detailed analyses are not performed for such areas; no depths or
base flood elevations are shown within these zones.
Zone AE and A1-A30: Areas with a 1% annual chance of flooding and a 26% chance of flooding
over the life of a 30 year mortgage. In most instances, base flood elevations derived from
detailed analyses are shown at selected intervals within these zones.
45
Source: Tillery, A.C., Darr, M.J., Cannon, S.H., and Michael, J.A., 2011, Postwildfire debris flow hazard assessment for the area burned by the 2011 Track Fire, northeastern New Mexico and Southern Colorado: U.S. Geological Survey Open-File Report 2011-1257. http://pubs.usgs.gov/of/2011/1257 46
Source: http://www.fema.gov/library/viewRecord.do?id=2324

November 2015
96
Figure 22: UNM Central and North Campuses FEMA National Flood Hazard Layer (Data as of 9/27/13)47
47
National Flood Hazard Layer Data Application, http://nmflood.org/MAPS/NFHL/ (July 23, 2015)

November 2015
97
Figure 23: UNM South Campus FEMA National Flood Hazard Layer (Data as of 9/27/13)48
48
National Flood Hazard Layer Data Application, http://nmflood.org/MAPS/NFHL/ (July 23, 2015)

November 2015
98
Figure 24: UNM Valencia Branch Campus National Flood Hazard Layer (Data as of 9/27/13)49
Figure 25: UNM Taos Branch Campus National Flood Hazard Layer (Data as of 9/27/13)50
49
National Flood Hazard Layer Data Application, http://nmflood.org/MAPS/NFHL/ (July 23, 2015)
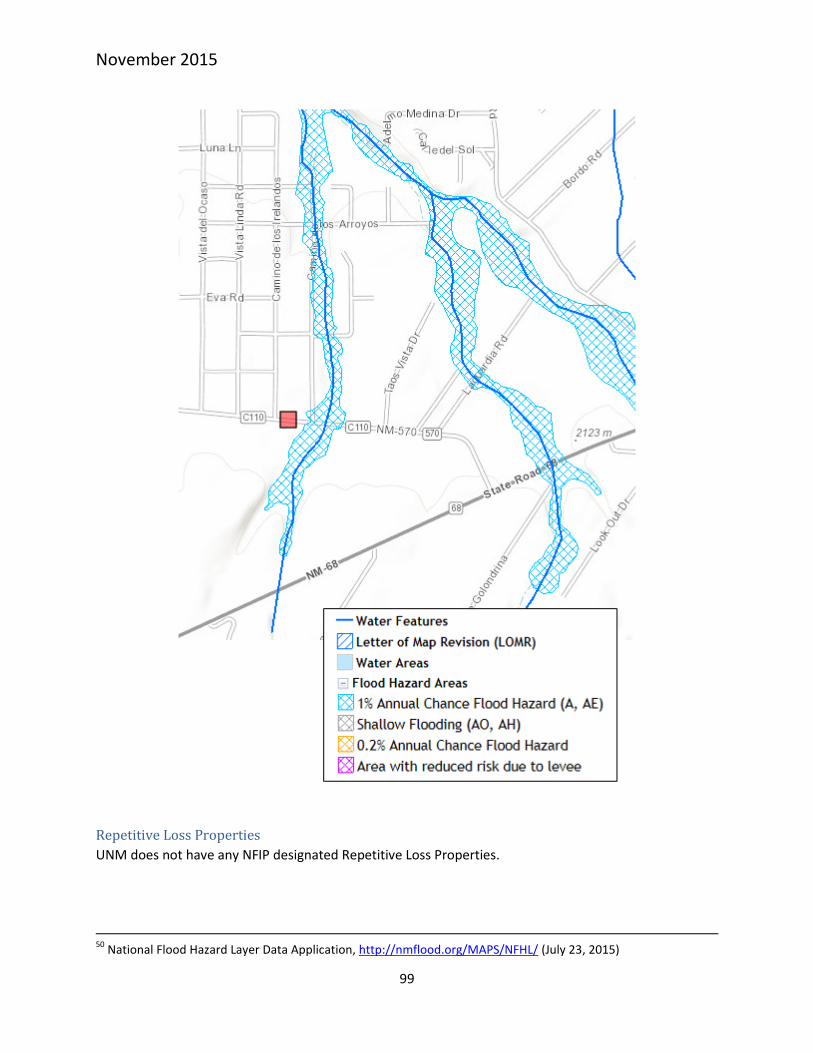
November 2015
99
Repetitive Loss Properties
UNM does not have any NFIP designated Repetitive Loss Properties.
50
National Flood Hazard Layer Data Application, http://nmflood.org/MAPS/NFHL/ (July 23, 2015)

November 2015
100
Previous Occurrences
On June 26 2011, the Los Conchas Fire moved along the mesas at the top of Cochiti Canyon where the
former John Young Ranch was located. The four buildings on the property in northern New Mexico were
damaged by the fire. The most serious damage was done to the main house where the UNM
Department of Anthropology conducted field schools for students. The fire left the structures within a
burn scar and vulnerable to erosion from the heavy rains during monsoon season. The NM State Land
Office and UNM took measures to protect the property from potential flooding due to the burn scar. On
August 3, 2011, significant rains at the top of the canyon caused partial flooding of the buildings. Then
heavy rains on August 14, 15 and 16 carried soil, ash, trees and boulders downstream, jumping the
banks of the creek and floating the debris downstream. This debris smashed into the walls of the bunk
house filling it with 4 feet of water, mud and debris completely destroying the property. The property is
now owned by the New Mexico State Land Office.
New Mexico has experienced numerous flood/flash flooding events in each county. The current online
NCDC database contains data from 1996 to 2014, as entered by NOAA's NWS. Referencing this online
database, NCDC reports a total of 226 flood/flash flood events with 9 deaths and $30.21 million in
property damage for those counties with UNM campuses and properties.51
Table 37: Significant Past Occurrences of Flood/Flash Flood (as of 2012)
Date Location Significant Event
August 1, 2014
Albuquerque Bernalillo County
Preparedness Area 5
Storms developed by mid to late afternoon on the 1st over northern New Mexico then pushed very slowly south through the evening and predawn hours on the 2nd. Storms developed over the Albuquerque Metro Area during the late evening and produced flash flood emergency-level flooding within the area from UNM campus into downtown on a busy Friday night. Numerous water rescues were reported. Several businesses reported water inside with just about the entire area of Central Avenue closed. Mud and rock slides created numerous lane closures around area roadways. An overnight deluge washed out ballasts along a portion of the Rail Runner tracks within Waldo Canyon, resulting in suspended service for the entire day Sunday. A large sink hole developed at the intersection of MLK Jr. and Broadway. The entire intersection was destroyed. Property damages were $1 million.
September 10, 2013
La Joya Socorro County
Preparedness Areas 5
The initial round of intense rainfall on the 10th and 11th flooded numerous roadways and homes then subsequent heavy rainfall through the 15th created extreme flooding. Socorro
51
“NOAA, NCDC: Storm Events Database”, https://www.ncdc.noaa.gov/stormevents/EXICO (July 23, 2015)
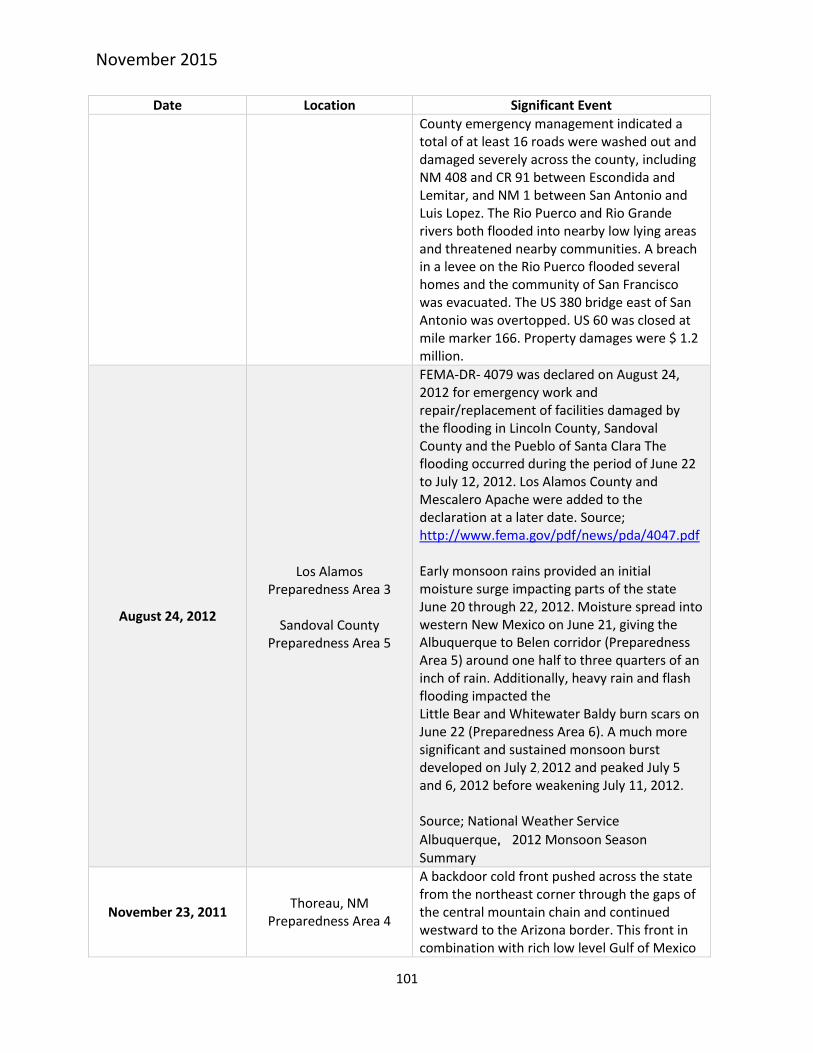
November 2015
101
Date Location Significant Event
County emergency management indicated a total of at least 16 roads were washed out and damaged severely across the county, including NM 408 and CR 91 between Escondida and Lemitar, and NM 1 between San Antonio and Luis Lopez. The Rio Puerco and Rio Grande rivers both flooded into nearby low lying areas and threatened nearby communities. A breach in a levee on the Rio Puerco flooded several homes and the community of San Francisco was evacuated. The US 380 bridge east of San Antonio was overtopped. US 60 was closed at mile marker 166. Property damages were $ 1.2 million.
August 24, 2012
Los Alamos
Preparedness Area 3
Sandoval County Preparedness Area 5
FEMA-DR- 4079 was declared on August 24, 2012 for emergency work and repair/replacement of facilities damaged by the flooding in Lincoln County, Sandoval County and the Pueblo of Santa Clara The flooding occurred during the period of June 22 to July 12, 2012. Los Alamos County and Mescalero Apache were added to the declaration at a later date. Source; http://www.fema.gov/pdf/news/pda/4047.pdf Early monsoon rains provided an initial moisture surge impacting parts of the state June 20 through 22, 2012. Moisture spread into western New Mexico on June 21, giving the Albuquerque to Belen corridor (Preparedness Area 5) around one half to three quarters of an inch of rain. Additionally, heavy rain and flash flooding impacted the Little Bear and Whitewater Baldy burn scars on June 22 (Preparedness Area 6). A much more significant and sustained monsoon burst developed on July 2, 2012 and peaked July 5 and 6, 2012 before weakening July 11, 2012. Source; National Weather Service
Albuquerque, 2012 Monsoon Season Summary
November 23, 2011 Thoreau, NM
Preparedness Area 4
A backdoor cold front pushed across the state from the northeast corner through the gaps of the central mountain chain and continued westward to the Arizona border. This front in combination with rich low level Gulf of Mexico

November 2015
102
Date Location Significant Event
moisture and mid- level monsoon moisture created a very unstable atmosphere. Precipitable water values were nearly 150% of normal across much of the state. Slow storm movement and repeated development of storms over the same general areas led to flash flooding in western New Mexico. Flooding was reported into Thoreau Baptist Church, Giant Gas Station, Thoreau Chapter House as well as multiple other businesses and 6 homes. Several bridges and roads were also washed over with debris, including state roads 118, 371 and 612 and county roads 61, 27, 51, and Castle Rock.
August 21, 2011
Sandoval County
Los Alamos, NM Preparedness Area 3
The first day of flash flooding over the Las Conchas burn scar was widespread. Early in the afternoon, showers and thunderstorms developed over the central and northern portions of the burn scar. Later in the afternoon and early evening, stronger and very slow moving storms developed across the southern portions of the burn scar. Radar estimated 3 to 4 inches of rain across a widespread area. Flash flooding was reported with each of these storms. 1 to 1.5 inches of rain fell on the northern portion of the Las Conchas burn scar, flash flooding was reported in Santa Clara Canyon. Four people that were working in the canyon had to be rescued by helicopter. Flows were reported to be 8 to 10 feet high when they reached Dixon's Apple Orchard. The flood waters damaged the owners personal residence, inundated the main storage facility with 10 feet of mud and debris, moved a semi-truck approximately 200 yards and destroyed approximately 10 percent of the apple orchard. The water also wiped out a 50 yard long 4 foot by 4 foot rock retaining wall that was built in 1942. Total reported property damage was $12 million.
August 14, 2008
Taos County
Preparedness Area 3
McKinley County Preparedness Area 4
Severe storms and flooding between July 26 and Sept. 18, 2006 lead to disaster declaration FEMA 1659. In what was determined to be a 500-yr event, strong thunderstorms developed over the southern Sacramento Mountains and along the eastern heights of Alamogordo. One storm in particular dropped about an inch and
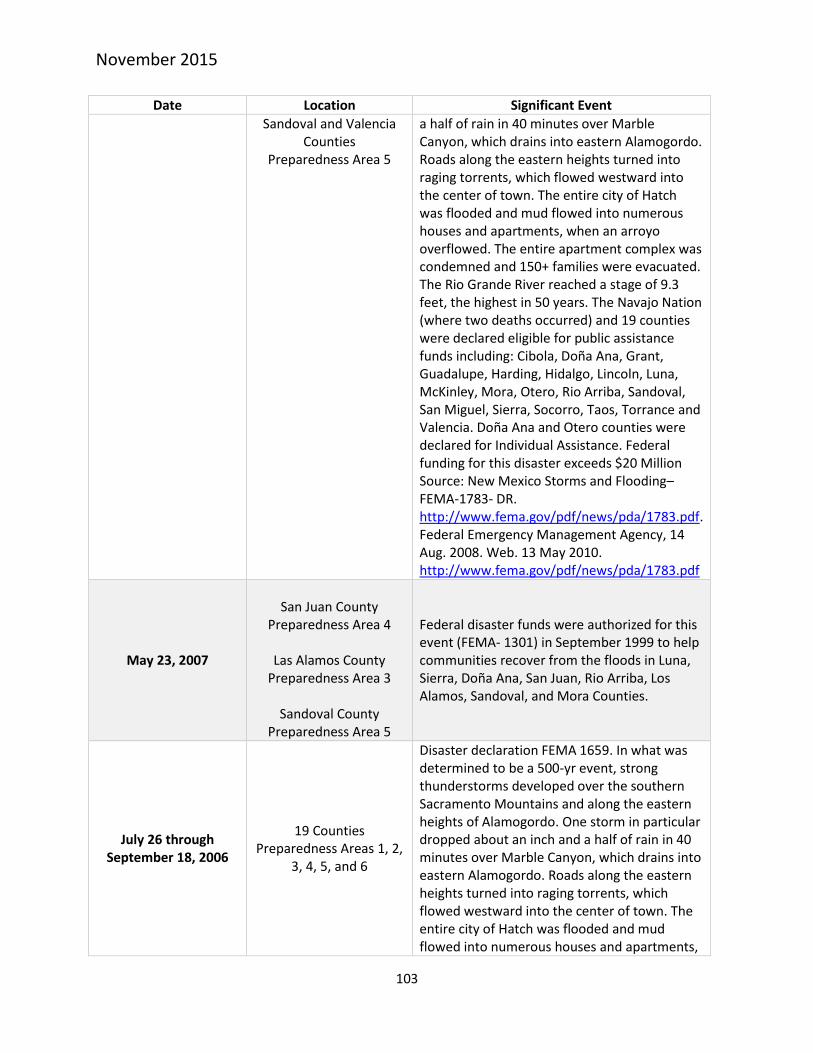
November 2015
103
Date Location Significant Event
Sandoval and Valencia Counties
Preparedness Area 5
a half of rain in 40 minutes over Marble Canyon, which drains into eastern Alamogordo. Roads along the eastern heights turned into raging torrents, which flowed westward into the center of town. The entire city of Hatch was flooded and mud flowed into numerous houses and apartments, when an arroyo overflowed. The entire apartment complex was condemned and 150+ families were evacuated. The Rio Grande River reached a stage of 9.3 feet, the highest in 50 years. The Navajo Nation (where two deaths occurred) and 19 counties were declared eligible for public assistance funds including: Cibola, Doña Ana, Grant, Guadalupe, Harding, Hidalgo, Lincoln, Luna, McKinley, Mora, Otero, Rio Arriba, Sandoval, San Miguel, Sierra, Socorro, Taos, Torrance and Valencia. Doña Ana and Otero counties were declared for Individual Assistance. Federal funding for this disaster exceeds $20 Million Source: New Mexico Storms and Flooding– FEMA-1783- DR. http://www.fema.gov/pdf/news/pda/1783.pdf. Federal Emergency Management Agency, 14 Aug. 2008. Web. 13 May 2010. http://www.fema.gov/pdf/news/pda/1783.pdf
May 23, 2007
San Juan County
Preparedness Area 4
Las Alamos County Preparedness Area 3
Sandoval County
Preparedness Area 5
Federal disaster funds were authorized for this event (FEMA- 1301) in September 1999 to help communities recover from the floods in Luna, Sierra, Doña Ana, San Juan, Rio Arriba, Los Alamos, Sandoval, and Mora Counties.
July 26 through September 18, 2006
19 Counties Preparedness Areas 1, 2,
3, 4, 5, and 6
Disaster declaration FEMA 1659. In what was determined to be a 500-yr event, strong thunderstorms developed over the southern Sacramento Mountains and along the eastern heights of Alamogordo. One storm in particular dropped about an inch and a half of rain in 40 minutes over Marble Canyon, which drains into eastern Alamogordo. Roads along the eastern heights turned into raging torrents, which flowed westward into the center of town. The entire city of Hatch was flooded and mud flowed into numerous houses and apartments,

November 2015
104
Date Location Significant Event
when an arroyo overflowed. The entire apartment complex was condemned and 150+ families were evacuated. The Rio Grande River reached a stage of 9.3 feet, the highest in 50 years. The Navajo Nation (where two deaths occurred) and 19 counties were declared eligible for public assistance funds including: Cibola, Doña Ana, Grant, Guadalupe, Harding, Hidalgo, Lincoln, Luna, McKinley, Mora, Otero, Rio Arriba, Sandoval, San Miguel, Sierra, Socorro, Taos, Torrance and Valencia. Doña Ana and Otero counties were declared for Individual Assistance. Federal funding exceeded $20 million. Source: http://www.fema.gov/pdf/news/pda/1783.pdf
April 2004 Bernalillo County
Preparedness Area 5
Heavy thunderstorms caused flash flooding in several areas of the state. This flooding lead to federal disaster (FEMA- 1514) funds being authorized for four counties (Bernalillo, Eddy, Mora, and San Miguel). Damage costs for this event were approximately $5.8 million.
July 2, 2001 Los Alamos County
Preparedness Area 3
A storm with heavy rain of 1 to 2 inches in an hour developed over Pueblo Canyon on the west edge of Los Alamos. Storm runoff from the burned forest was brief, but intense with water and mudflows estimated at 1,500 cubic feet per second, which overwhelmed the inlet structure west of North Road and then breached the street 60 feet above. A 150-yard section of road surface was destroyed and one of the city's main sewer lines was undercut and then broken. Debris filled the basements of at least five homes along Alabama Avenue. The total damage estimate for this event was $3.5 million.
July 29, 1999 Rio Rancho, NM Sandoval County
Preparedness Area 5
A flash flood event from heavy rain of 2 inches in about 2 hours caused road and soil erosion in northern Rio Rancho. No injuries were reported, but residents in some of the newer or remote subdivisions on the far north edge of the city were stranded after numerous dirt roads and low water arroyo crossings were washed out. Some roads became gullies 4 feet deep and 14 feet wide. The area around the city landfill, along with Waste Water Treatment

November 2015
105
Date Location Significant Event
Plant #2, suffered heavily, with 2 miles of roads isolated by at least five deep cuts. Damage costs were estimated at $1 million.
June 16, 1999 Albuquerque, NM Bernalillo County
Preparedness Area 5
Heavy rains up to 2 inches in a 45-minute period flooded streets and dry arroyos across northern Albuquerque. Over 100 new automobiles on a dealer lot were flooded by rapidly rising water. Poor or clogged drainage was partially to blame for these losses. The total losses were estimated at $1.2 million.
Declared Disasters from Flood/Flash Flooding
DHSEM reports 40 State Declared Disasters for flooding between 2003 and 2013. This number is based
on how many Executive Orders were signed by the Governor for flooding or flood threat. According to
DHSEM records, the total cost for State declared flood events from 2003 through 2012 was $31,866,315.
The total does not reflect all costs for federal disasters 4047 and 4079 which are still being tallied.
Six of the 40 State flood disasters were also federally declared disasters. The total Public Assistance
dollar losses from federal, State and local government entities and all tribal entities was $113,382,188.
The State contributed between 12.5% and 18.74% of the total cost for the disasters. The percentage of
State contribution varied with each disaster.
Table 38 is a tally of flood damage as reported by SHELDUS broken out by county from 1994 through
2014.
Table 38: SHELDUS History of Flood/Flash Flood Events (1994 -2014)
County Name
Year Month Property Damage
Property Damage
(ADJ 2014) Injuries Fatalities Records
Bernalillo 1996 7 $35,000.00 $52,809.18 0 0 1
Bernalillo 1997 7 $100,000.00 $147,499.07 0 0 1
Bernalillo 1998 7 $30,000.00 $43,571.04 0 0 1
Bernalillo 1999 6 $1,200,000.00 $1,705,181.27 0 0 1
Bernalillo 2006 7 $100,000.00 $117,428.57 0 0 1
Bernalillo 2007 7 $4,000.00 $4,567.06 0 0 1
Bernalillo 2008 7 $22,500.00 $24,739.83 0 0 3
Bernalillo 2008 8 $351,500.00 $386,491.14 0 0 4
Bernalillo 2009 7 $2,000.00 $2,206.95 0 0 1
Bernalillo 2009 9 $1,000.00 $1,103.47 0 1 1
Bernalillo 2010 7 $11,000.00 $11,942.33 0 0 4
Bernalillo 2010 9 $0.00 $0.00 0 1 1
Bernalillo 2012 7 $2,000.00 $2,062.21 0 0 1

November 2015
106
County Name
Year Month Property Damage
Property Damage
(ADJ 2014) Injuries Fatalities Records
Bernalillo 2013 7 $146,000.00 $148,368.39 0 0 7
Bernalillo 2013 9 $65,000.00 $66,054.42 0 0 2
Bernalillo 2014 7 $212,000.00 $212,000.00 0 0 3
Bernalillo 2014 8 $1,090,000.00 $1,090,000.00 0 0 5
Los Alamos 2001 7 3,500,000.00 4,678,577.07 0 0 1
Los Alamos 2001 8 100,000.00 133,673.63 0 0 1
Los Alamos 2008 8 10,000.00 10,995.48 0 0 1
Los Alamos 2011 8 6,000,000.00 6,314,671.98 0 0 1
Los Alamos 2012 7 50,000.00 51,555.35 0 0 1
Los Alamos 2001 7 3,500,000.00 4,678,577.07 0 0 1
McKinley 1997 9 $0.00 $0.00 1 2 2
McKinley 2002 7 $100,000.00 $131,593.11 0 0 1
McKinley 2005 5 $3,750.00 $4,545.62 0 0 1
McKinley 2005 6 $5,000.00 $6,060.83 0 0 1
McKinley 2006 8 $0.00 $0.00 0 2 1
McKinley 2007 8 $28,000.00 $31,969.44 0 0 2
McKinley 2008 7 $0.00 $0.00 0 3 1
McKinley 2008 8 $5,500.00 $6,047.51 0 0 2
McKinley 2009 9 $35,000.00 $38,621.59 0 0 3
McKinley 2010 7 $190,000.00 $206,276.55 0 0 3
McKinley 2010 8 $325,000.00 $352,841.47 0 0 6
McKinley 2011 8 $5,000.00 $5,262.23 0 0 1
McKinley 2012 8 $150,000.00 $154,666.06 0 0 1
McKinley 2013 8 $100,000.00 $101,622.18 0 0 2
McKinley 2013 9 $155,000.00 $157,514.39 0 0 3
McKinley 2014 8 $100,000.00 $100,000.00 0 0 1
Sandoval 1997 8 $5,000.00 $7,374.95 0 0 1
Sandoval 1999 7 $1,000,000.00 $1,420,984.39 0 0 1
Sandoval 1999 8 $600,000.00 $852,590.64 0 0 1
Sandoval 2000 8 $20,000.00 $27,495.47 0 0 1
Sandoval 2006 7 $800,000.00 $939,428.57 0 0 2
Sandoval 2007 7 $5,000.00 $5,708.83 0 0 1
Sandoval 2007 8 $500.00 $570.88 0 0 1
Sandoval 2008 2 $40,000.00 $43,981.92 0 0 1
Sandoval 2008 8 $29,000.00 $31,886.89 0 0 6
Sandoval 2008 10 $40,000.00 $43,981.92 0 0 1
Sandoval 2010 7 $1,000.00 $1,085.67 0 0 1
Sandoval 2010 8 $32,000.00 $34,741.31 0 0 3
Sandoval 2011 8 $6,750,000.00 $7,104,005.97 0 0 2
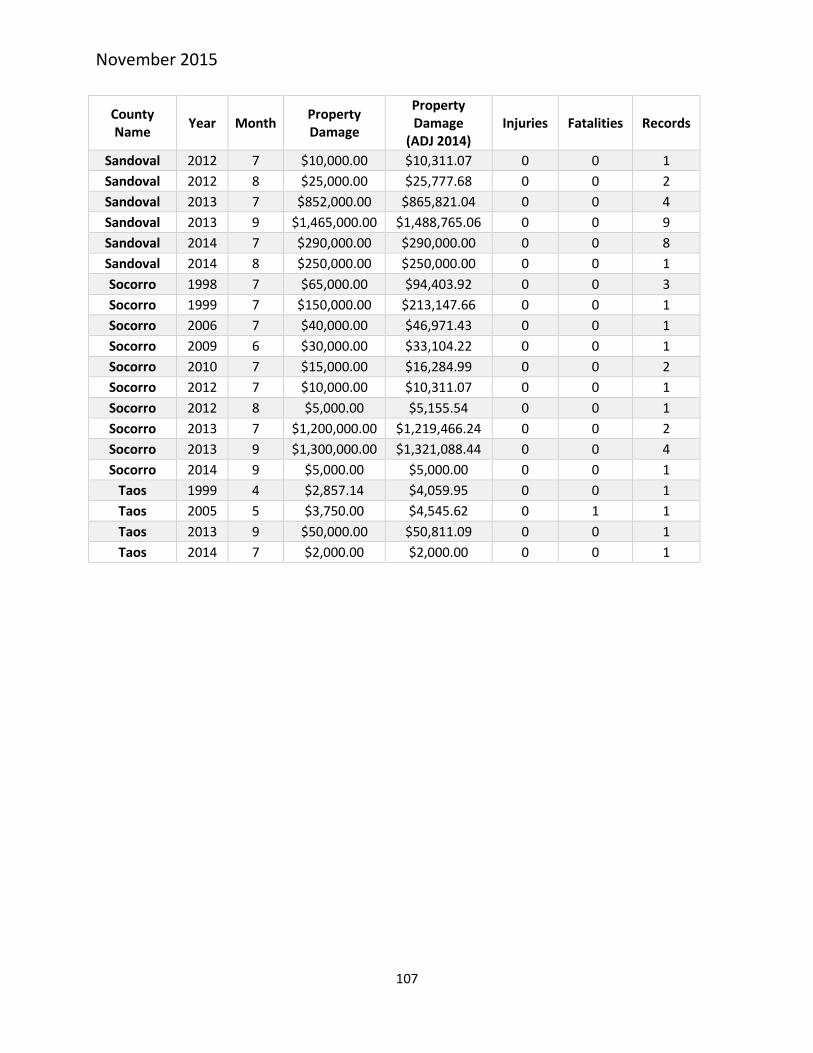
November 2015
107
County Name
Year Month Property Damage
Property Damage
(ADJ 2014) Injuries Fatalities Records
Sandoval 2012 7 $10,000.00 $10,311.07 0 0 1
Sandoval 2012 8 $25,000.00 $25,777.68 0 0 2
Sandoval 2013 7 $852,000.00 $865,821.04 0 0 4
Sandoval 2013 9 $1,465,000.00 $1,488,765.06 0 0 9
Sandoval 2014 7 $290,000.00 $290,000.00 0 0 8
Sandoval 2014 8 $250,000.00 $250,000.00 0 0 1
Socorro 1998 7 $65,000.00 $94,403.92 0 0 3
Socorro 1999 7 $150,000.00 $213,147.66 0 0 1
Socorro 2006 7 $40,000.00 $46,971.43 0 0 1
Socorro 2009 6 $30,000.00 $33,104.22 0 0 1
Socorro 2010 7 $15,000.00 $16,284.99 0 0 2
Socorro 2012 7 $10,000.00 $10,311.07 0 0 1
Socorro 2012 8 $5,000.00 $5,155.54 0 0 1
Socorro 2013 7 $1,200,000.00 $1,219,466.24 0 0 2
Socorro 2013 9 $1,300,000.00 $1,321,088.44 0 0 4
Socorro 2014 9 $5,000.00 $5,000.00 0 0 1
Taos 1999 4 $2,857.14 $4,059.95 0 0 1
Taos 2005 5 $3,750.00 $4,545.62 0 1 1
Taos 2013 9 $50,000.00 $50,811.09 0 0 1
Taos 2014 7 $2,000.00 $2,000.00 0 0 1

November 2015
108
Frequency
Most of the flash floods in New Mexico are associated with the summer monsoon season.
Approximately 60% of all flash floods in the state occur in July and August. The monsoon season
generally dissipates in the northern part of the state (Preparedness Area 4) in early September. In mid to
late summer, the pacific winds bring humid subtropical air into the state. Solar heating trigger afternoon
thunderstorms that can be devastating. July and August 2012 brought intense flooding with burn scar
areas producing up to 400% greater flows than the calculated 1% chance storm event. Figure 26 shows
the monsoon burst periods that caused numerous flood events. Information provided by the National
Weather Service in Albuquerque, 2012 Monsoon Season Summary.
Figure 26: 2012 Monsoon Burst Periods
Because of too much rain, in too small an area, in too short a time, flash flooding may result. These flash
floods generally travel down arroyos (normally dry streambed) and can involve a rapid rise in water
level, high velocity, and large amounts of debris, which can lead to significant damage that includes the
uprooting of trees, undermining of buildings and bridges, and scouring new channels. The intensity of
flash flooding is a function of the intensity and duration of rainfall, steepness of the watershed, stream
gradients, watershed vegetation, natural and artificial flood storage areas, and configuration of the
streambed and floodplain. Dam failure and ice jams may also lead to flash flooding. Urban areas are
increasingly subject to flash flooding due to the removal of vegetation, replacement of ground cover
with impermeable surfaces, and construction of drainage systems. Local drainage floods may occur
outside of recognized drainage channels or delineated floodplains due to a combination of locally heavy
precipitation, a lack of infiltration, inadequate facilities for drainage and storm water conveyance, and
increased surface runoff.
Winter flash flood events usually result from unseasonably high-level rain on top of a snow pack.
Excessive runoff allows the combined release of the water in the snow pack along with the rain. These
can be flash flood events lasting less than a day, or they can evolve into longer-term flooding events
lasting from 1 day to a couple of weeks. Winter flooding occurs between November and February and
usually affects the southwest portion of the state.
Most spring events occur between April and June. They vary between winter type events where the rain
falls over the remaining winter snow pack in or near the mountains to events in the eastern plains,
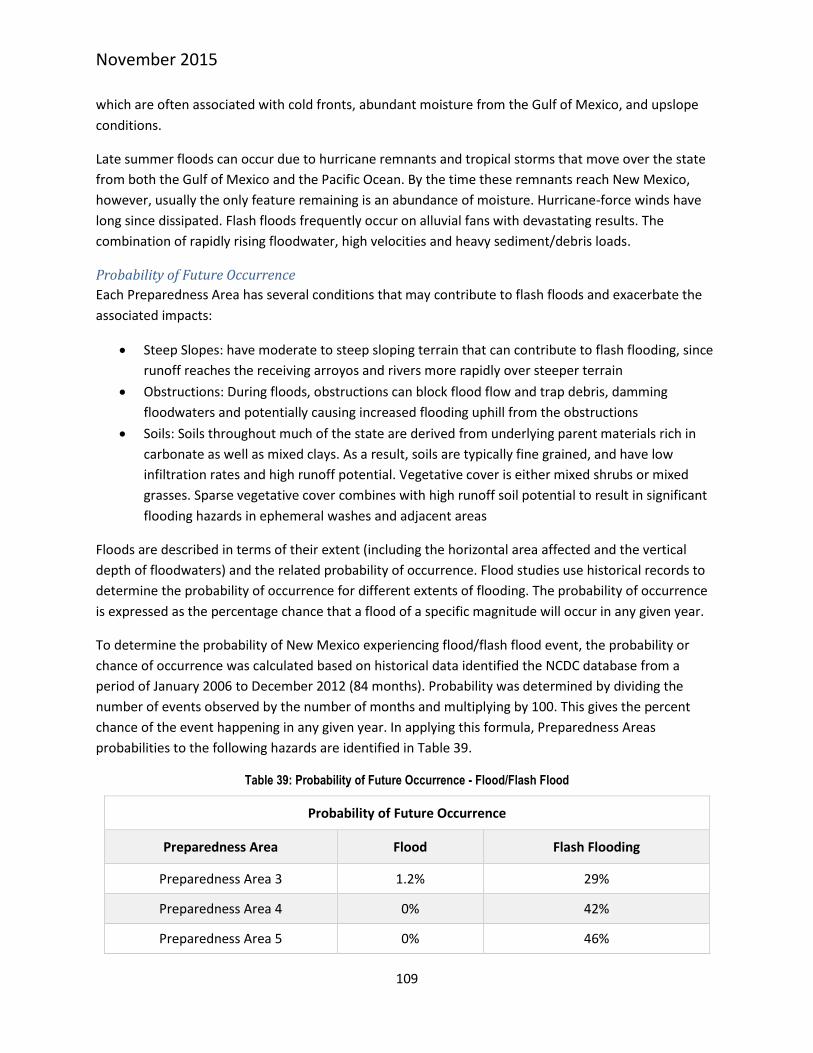
November 2015
109
which are often associated with cold fronts, abundant moisture from the Gulf of Mexico, and upslope
conditions.
Late summer floods can occur due to hurricane remnants and tropical storms that move over the state
from both the Gulf of Mexico and the Pacific Ocean. By the time these remnants reach New Mexico,
however, usually the only feature remaining is an abundance of moisture. Hurricane-force winds have
long since dissipated. Flash floods frequently occur on alluvial fans with devastating results. The
combination of rapidly rising floodwater, high velocities and heavy sediment/debris loads.
Probability of Future Occurrence
Each Preparedness Area has several conditions that may contribute to flash floods and exacerbate the
associated impacts:
Steep Slopes: have moderate to steep sloping terrain that can contribute to flash flooding, since
runoff reaches the receiving arroyos and rivers more rapidly over steeper terrain
Obstructions: During floods, obstructions can block flood flow and trap debris, damming
floodwaters and potentially causing increased flooding uphill from the obstructions
Soils: Soils throughout much of the state are derived from underlying parent materials rich in
carbonate as well as mixed clays. As a result, soils are typically fine grained, and have low
infiltration rates and high runoff potential. Vegetative cover is either mixed shrubs or mixed
grasses. Sparse vegetative cover combines with high runoff soil potential to result in significant
flooding hazards in ephemeral washes and adjacent areas
Floods are described in terms of their extent (including the horizontal area affected and the vertical
depth of floodwaters) and the related probability of occurrence. Flood studies use historical records to
determine the probability of occurrence for different extents of flooding. The probability of occurrence
is expressed as the percentage chance that a flood of a specific magnitude will occur in any given year.
To determine the probability of New Mexico experiencing flood/flash flood event, the probability or
chance of occurrence was calculated based on historical data identified the NCDC database from a
period of January 2006 to December 2012 (84 months). Probability was determined by dividing the
number of events observed by the number of months and multiplying by 100. This gives the percent
chance of the event happening in any given year. In applying this formula, Preparedness Areas
probabilities to the following hazards are identified in Table 39.
Table 39: Probability of Future Occurrence - Flood/Flash Flood
Probability of Future Occurrence
Preparedness Area Flood Flash Flooding
Preparedness Area 3 1.2% 29%
Preparedness Area 4 0% 42%
Preparedness Area 5 0% 46%

November 2015
110
Risk Assessment
New Mexico is affected by the North American Monsoon System every summer, and the “Monsoon
Season” is designated as the period lasting from June 15th through September 30th. With the onset of
the Monsoon, New Mexico is typically impacted by a variety of weather hazards that can often put the
population at risk for serious injury or death Thunderstorm frequency increases during this period, while
exceptionally hot days are common as well. Impacts from Floods/Flash Flooding to New Mexico are
identified in Table 40.
Table 40: Potential Impacts from Flood/Flash Flood Events
Subject Potential Impacts
Health and Safety of the Public
Flooding in the state has been known to sweep people away and be drowned
Health and Safety of Responders
Same impact as the public
Continuity of Operations
While the flooding in New Mexico is generally short lives the long-term impacts such as in the Village of Hatch can shut down an entire community for weeks.
Delivery of Services Delivery of services may be impossible for weeks.
Property, Facilities, Infrastructure
Facilities in the flooded areas will sustain damages, up to and including total loss. Utilities such as water and sewage may be completely unusable
Environment
Long term severe impacts are possible due to the severe contamination often found in flood waters. Fortunately for us, flash flooding passes quickly and doses not linger. However the strong forces of the water can cause massive amounts of erosion and can divert natural waterways.
Economic Condition As we saw in 2006, communities can have severe economic losses in the form of damages, and business shutdowns.
Public Confidence If a community is impacted by flooding, the public may very well be angry for allowing development to occur in hazardous areas, or for allowing adverse impacts downstream form development.
Data Limitations
In order to address the data deficiency, a team of subject matter experts (NM Floodplain Managers
Association, local research scientists in geomorphology or geology) would study the probability, extent,
vulnerability and impact of post-fire flooding and alluvial fan flood hazards.
Summary of Impact to UNM
Virtually every jurisdiction in the state is subject to flooding, given the right conditions. Historically,
flooding on UNM Main Campus has occurred due to heavy precipitation and stormwater runoff in
properties located underground or at ground level. Based on the locations of all the UNM campuses, the

November 2015
111
only campus that lies within a flood zone and is vulnerable to a flooding event is the Valencia Branch
Campus. UNM Main Campus (Central, North, and South campuses) and UNM Taos Branch Campus are
located adjacent to areas designated as flood zones. UNM Main Campus has an arroyo running adjacent
to and through the campus. UNM Taos has a water body adjacent to the campus. The Sevilleta LTER
Field Station is relatively close to the Rio Grande but is situated west of the river located on much higher
terrain. No official data is available for the Sevilleta location. UNM West, UNM Gallup, and UNM Los
Alamos are not located in or near FEMA designated flood zones. All campuses could potentially
experience flooding due to stormwater runoff.
UNM Taos and UNM Los Alamos Branch Campuses are located in areas at risk for wildfires. Therefore
these campuses are also at risk for flooding and debris flow post wildfire. Infrastructure near or in a burn
scars can suffer catastrophic damage from heavy precipitation as was seen with the John Young Ranch
following the Las Conchas Fire.
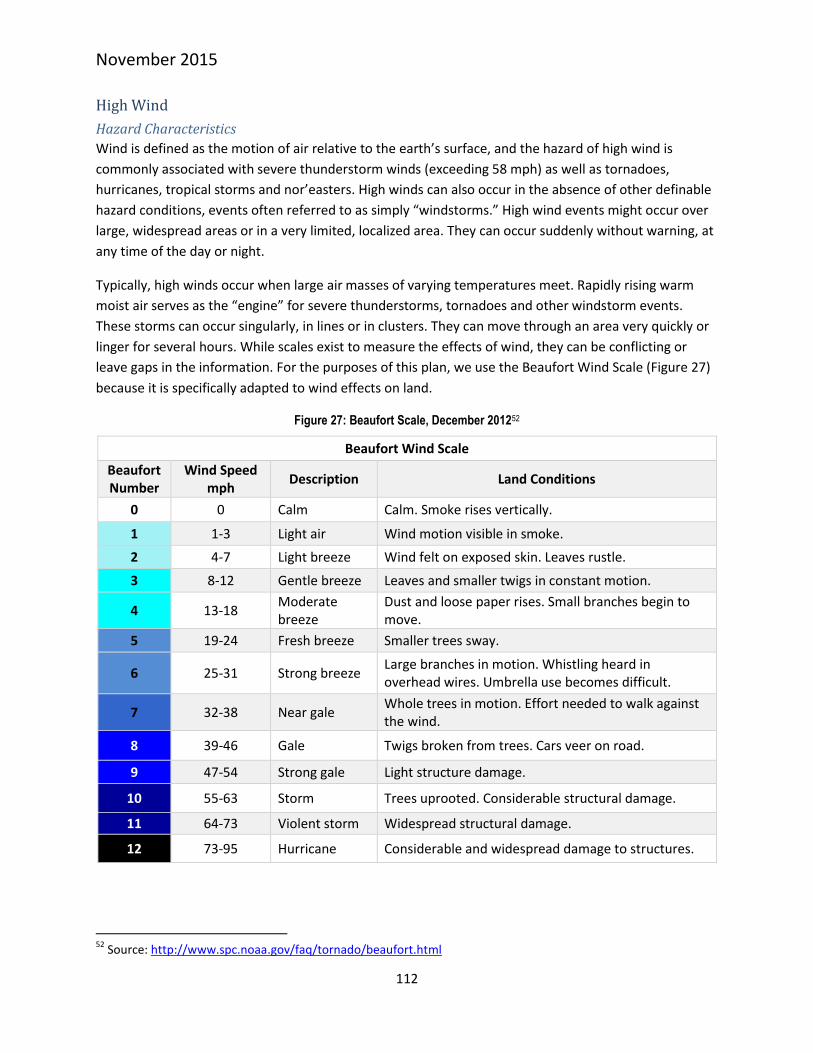
November 2015
112
High Wind
Hazard Characteristics
Wind is defined as the motion of air relative to the earth’s surface, and the hazard of high wind is
commonly associated with severe thunderstorm winds (exceeding 58 mph) as well as tornadoes,
hurricanes, tropical storms and nor’easters. High winds can also occur in the absence of other definable
hazard conditions, events often referred to as simply “windstorms.” High wind events might occur over
large, widespread areas or in a very limited, localized area. They can occur suddenly without warning, at
any time of the day or night.
Typically, high winds occur when large air masses of varying temperatures meet. Rapidly rising warm
moist air serves as the “engine” for severe thunderstorms, tornadoes and other windstorm events.
These storms can occur singularly, in lines or in clusters. They can move through an area very quickly or
linger for several hours. While scales exist to measure the effects of wind, they can be conflicting or
leave gaps in the information. For the purposes of this plan, we use the Beaufort Wind Scale (Figure 27)
because it is specifically adapted to wind effects on land.
Figure 27: Beaufort Scale, December 201252
Beaufort Wind Scale
Beaufort Number
Wind Speed mph
Description Land Conditions
0 0 Calm Calm. Smoke rises vertically.
1 1-3 Light air Wind motion visible in smoke.
2 4-7 Light breeze Wind felt on exposed skin. Leaves rustle.
3 8-12 Gentle breeze Leaves and smaller twigs in constant motion.
4 13-18 Moderate breeze
Dust and loose paper rises. Small branches begin to move.
5 19-24 Fresh breeze Smaller trees sway.
6 25-31 Strong breeze Large branches in motion. Whistling heard in overhead wires. Umbrella use becomes difficult.
7 32-38 Near gale Whole trees in motion. Effort needed to walk against the wind.
8 39-46 Gale Twigs broken from trees. Cars veer on road.
9 47-54 Strong gale Light structure damage.
10 55-63 Storm Trees uprooted. Considerable structural damage.
11 64-73 Violent storm Widespread structural damage.
12 73-95 Hurricane Considerable and widespread damage to structures.
52
Source: http://www.spc.noaa.gov/faq/tornado/beaufort.html

November 2015
113
All areas of the state can experience all 12 Beaufort categories. As used in this section, windstorms are
both high velocity straight-line winds and violent wind gusts not associated with thunderstorms. Dust
storms are strong windstorms that fill the air with thick dust, sometimes reducing visibility to resemble a
dense fog. Other wind events include wet or dry microbursts that may produce damaging convective
winds and dust devils even on a clear and otherwise calm day.
Figure 28 illustrates various wind zones throughout the country based on design wind speeds
established by the American Society of Civil Engineers. It divides the country into four wind zones,
geographically representing the frequency and magnitude of potential high wind events including severe
thunderstorms, tornadoes and hurricanes. The figure shows that New Mexico is located Zone I, II and III
wind speeds for shelters of up to 160 mph.
Figure 28: Wind Zones in the United States
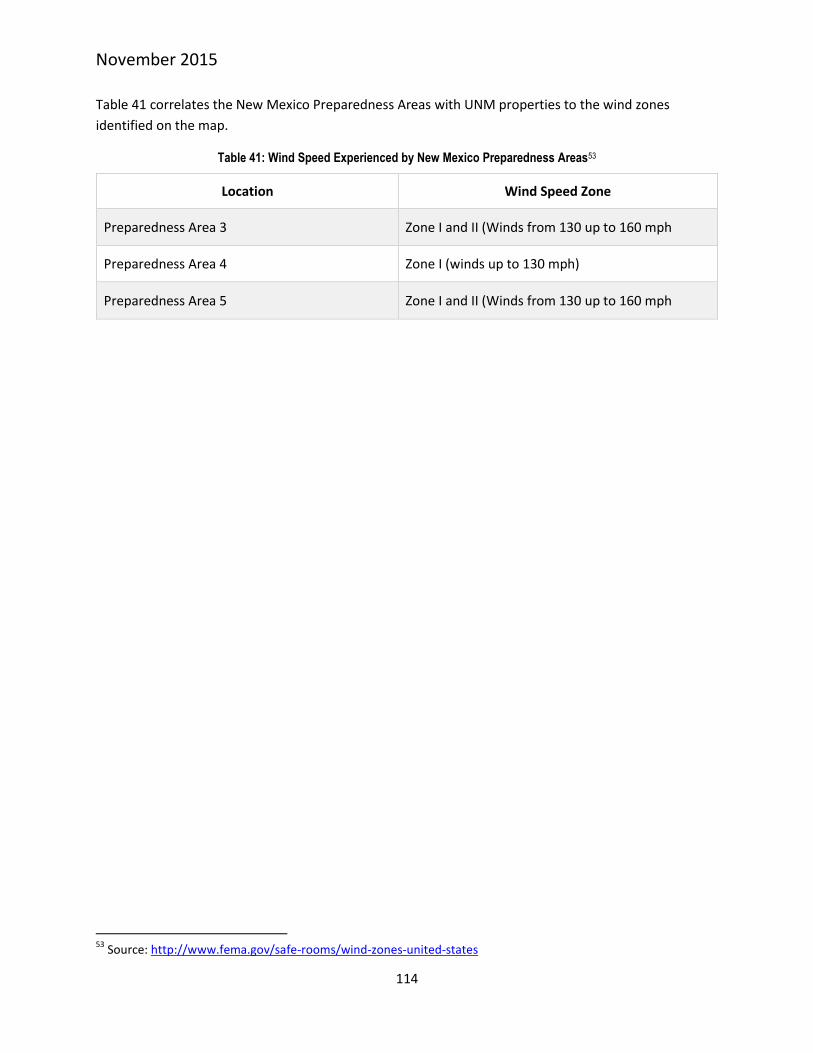
November 2015
114
Table 41 correlates the New Mexico Preparedness Areas with UNM properties to the wind zones
identified on the map.
Table 41: Wind Speed Experienced by New Mexico Preparedness Areas53
Location Wind Speed Zone
Preparedness Area 3 Zone I and II (Winds from 130 up to 160 mph
Preparedness Area 4 Zone I (winds up to 130 mph)
Preparedness Area 5 Zone I and II (Winds from 130 up to 160 mph
53
Source: http://www.fema.gov/safe-rooms/wind-zones-united-states
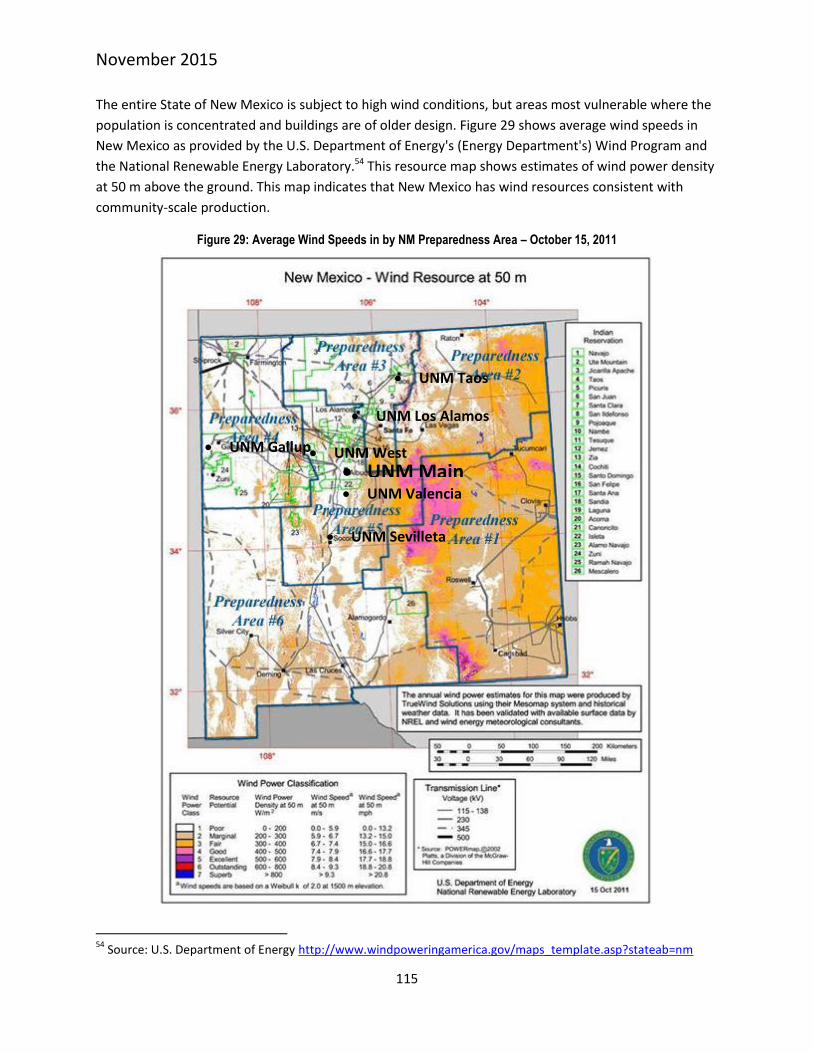
November 2015
115
The entire State of New Mexico is subject to high wind conditions, but areas most vulnerable where the
population is concentrated and buildings are of older design. Figure 29 shows average wind speeds in
New Mexico as provided by the U.S. Department of Energy's (Energy Department's) Wind Program and
the National Renewable Energy Laboratory.54 This resource map shows estimates of wind power density
at 50 m above the ground. This map indicates that New Mexico has wind resources consistent with
community-scale production.
Figure 29: Average Wind Speeds in by NM Preparedness Area – October 15, 2011
54
Source: U.S. Department of Energy http://www.windpoweringamerica.gov/maps_template.asp?stateab=nm
UNM Taos
UNM Los Alamos
UNM Main UNM Gallup
UNM Valencia
UNM Sevilleta
UNM West
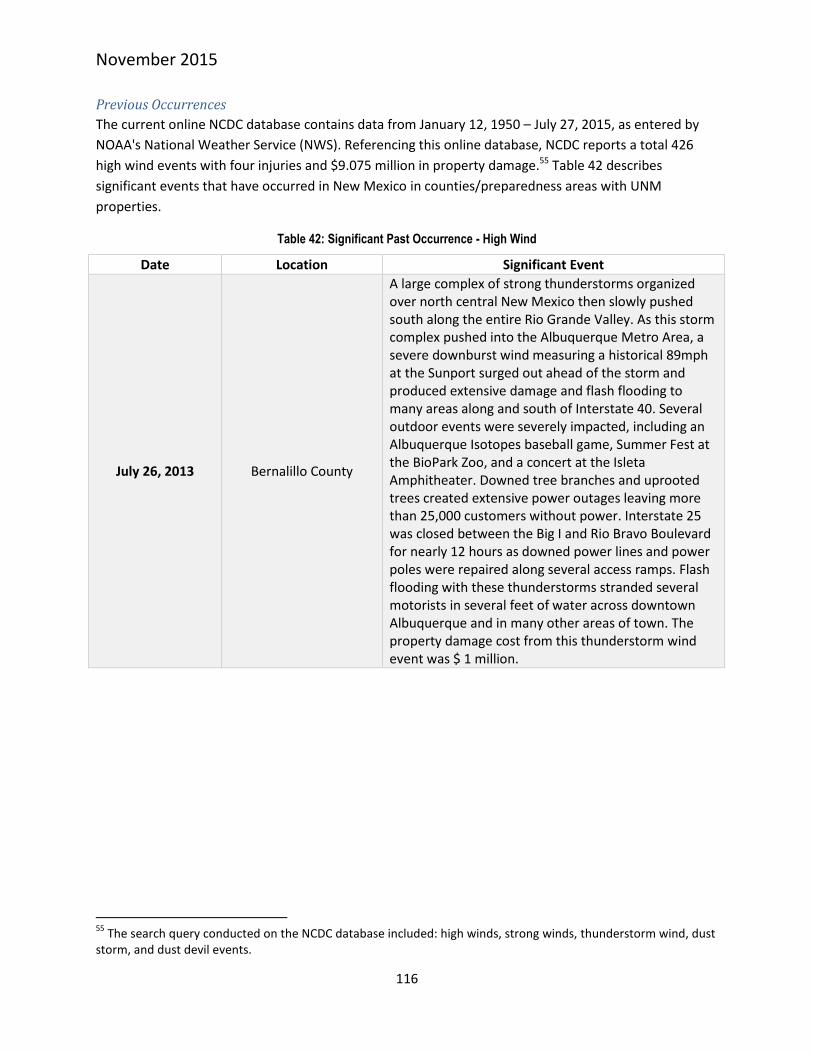
November 2015
116
Previous Occurrences
The current online NCDC database contains data from January 12, 1950 – July 27, 2015, as entered by
NOAA's National Weather Service (NWS). Referencing this online database, NCDC reports a total 426
high wind events with four injuries and $9.075 million in property damage.55 Table 42 describes
significant events that have occurred in New Mexico in counties/preparedness areas with UNM
properties.
Table 42: Significant Past Occurrence - High Wind
Date Location Significant Event
July 26, 2013 Bernalillo County
A large complex of strong thunderstorms organized over north central New Mexico then slowly pushed south along the entire Rio Grande Valley. As this storm complex pushed into the Albuquerque Metro Area, a severe downburst wind measuring a historical 89mph at the Sunport surged out ahead of the storm and produced extensive damage and flash flooding to many areas along and south of Interstate 40. Several outdoor events were severely impacted, including an Albuquerque Isotopes baseball game, Summer Fest at the BioPark Zoo, and a concert at the Isleta Amphitheater. Downed tree branches and uprooted trees created extensive power outages leaving more than 25,000 customers without power. Interstate 25 was closed between the Big I and Rio Bravo Boulevard for nearly 12 hours as downed power lines and power poles were repaired along several access ramps. Flash flooding with these thunderstorms stranded several motorists in several feet of water across downtown Albuquerque and in many other areas of town. The property damage cost from this thunderstorm wind event was $ 1 million.
55
The search query conducted on the NCDC database included: high winds, strong winds, thunderstorm wind, dust storm, and dust devil events.
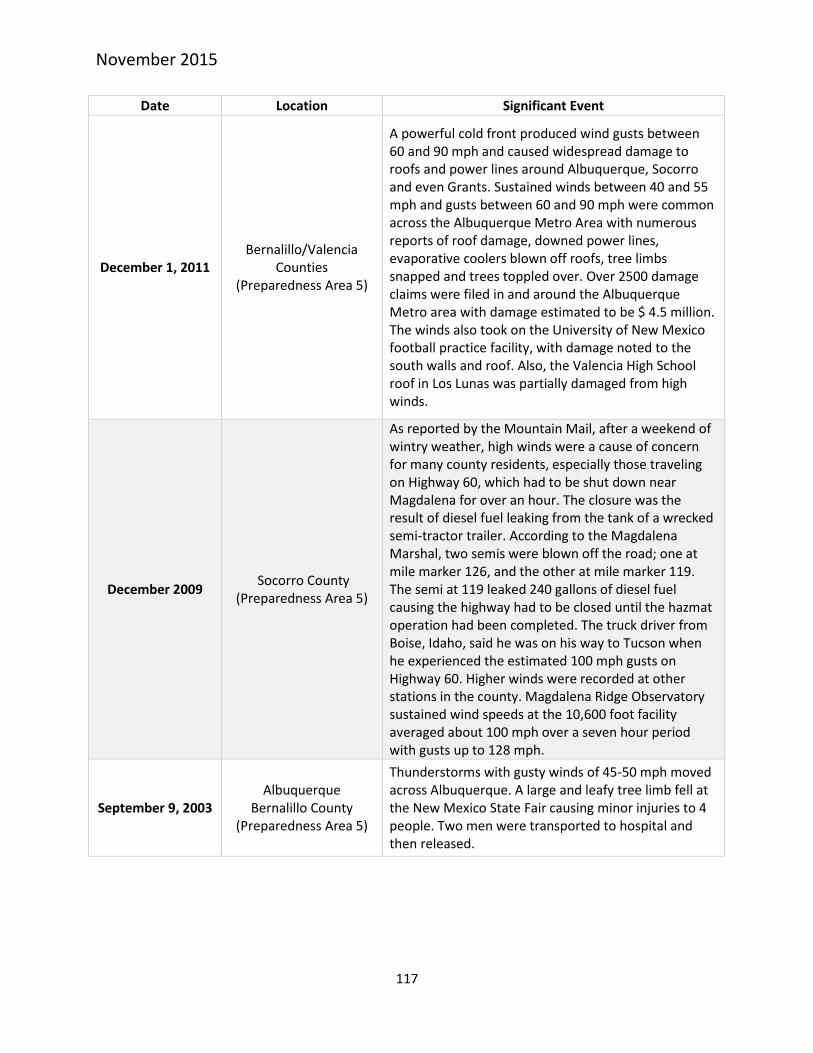
November 2015
117
Date Location Significant Event
December 1, 2011 Bernalillo/Valencia
Counties (Preparedness Area 5)
A powerful cold front produced wind gusts between 60 and 90 mph and caused widespread damage to roofs and power lines around Albuquerque, Socorro and even Grants. Sustained winds between 40 and 55 mph and gusts between 60 and 90 mph were common across the Albuquerque Metro Area with numerous reports of roof damage, downed power lines, evaporative coolers blown off roofs, tree limbs snapped and trees toppled over. Over 2500 damage claims were filed in and around the Albuquerque Metro area with damage estimated to be $ 4.5 million. The winds also took on the University of New Mexico football practice facility, with damage noted to the south walls and roof. Also, the Valencia High School roof in Los Lunas was partially damaged from high winds.
December 2009 Socorro County
(Preparedness Area 5)
As reported by the Mountain Mail, after a weekend of wintry weather, high winds were a cause of concern for many county residents, especially those traveling on Highway 60, which had to be shut down near Magdalena for over an hour. The closure was the result of diesel fuel leaking from the tank of a wrecked semi-tractor trailer. According to the Magdalena Marshal, two semis were blown off the road; one at mile marker 126, and the other at mile marker 119. The semi at 119 leaked 240 gallons of diesel fuel causing the highway had to be closed until the hazmat operation had been completed. The truck driver from Boise, Idaho, said he was on his way to Tucson when he experienced the estimated 100 mph gusts on Highway 60. Higher winds were recorded at other stations in the county. Magdalena Ridge Observatory sustained wind speeds at the 10,600 foot facility averaged about 100 mph over a seven hour period with gusts up to 128 mph.
September 9, 2003 Albuquerque
Bernalillo County (Preparedness Area 5)
Thunderstorms with gusty winds of 45-50 mph moved across Albuquerque. A large and leafy tree limb fell at the New Mexico State Fair causing minor injuries to 4 people. Two men were transported to hospital and then released.
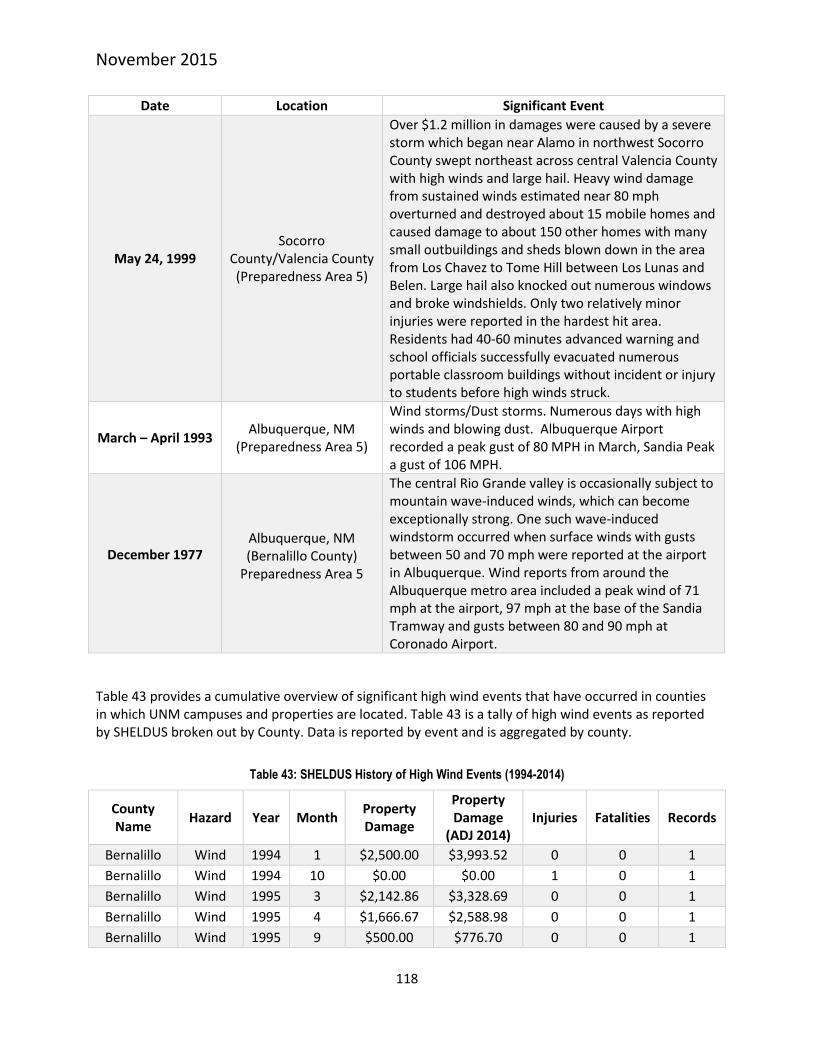
November 2015
118
Date Location Significant Event
May 24, 1999 Socorro
County/Valencia County (Preparedness Area 5)
Over $1.2 million in damages were caused by a severe storm which began near Alamo in northwest Socorro County swept northeast across central Valencia County with high winds and large hail. Heavy wind damage from sustained winds estimated near 80 mph overturned and destroyed about 15 mobile homes and caused damage to about 150 other homes with many small outbuildings and sheds blown down in the area from Los Chavez to Tome Hill between Los Lunas and Belen. Large hail also knocked out numerous windows and broke windshields. Only two relatively minor injuries were reported in the hardest hit area. Residents had 40-60 minutes advanced warning and school officials successfully evacuated numerous portable classroom buildings without incident or injury to students before high winds struck.
March – April 1993 Albuquerque, NM
(Preparedness Area 5)
Wind storms/Dust storms. Numerous days with high winds and blowing dust. Albuquerque Airport recorded a peak gust of 80 MPH in March, Sandia Peak a gust of 106 MPH.
December 1977
Albuquerque, NM (Bernalillo County)
Preparedness Area 5
The central Rio Grande valley is occasionally subject to mountain wave-induced winds, which can become exceptionally strong. One such wave-induced windstorm occurred when surface winds with gusts between 50 and 70 mph were reported at the airport in Albuquerque. Wind reports from around the Albuquerque metro area included a peak wind of 71 mph at the airport, 97 mph at the base of the Sandia Tramway and gusts between 80 and 90 mph at Coronado Airport.
Table 43 provides a cumulative overview of significant high wind events that have occurred in counties in which UNM campuses and properties are located. Table 43 is a tally of high wind events as reported by SHELDUS broken out by County. Data is reported by event and is aggregated by county.
Table 43: SHELDUS History of High Wind Events (1994-2014)
County Name
Hazard Year Month Property Damage
Property Damage
(ADJ 2014) Injuries Fatalities Records
Bernalillo Wind 1994 1 $2,500.00 $3,993.52 0 0 1
Bernalillo Wind 1994 10 $0.00 $0.00 1 0 1
Bernalillo Wind 1995 3 $2,142.86 $3,328.69 0 0 1
Bernalillo Wind 1995 4 $1,666.67 $2,588.98 0 0 1
Bernalillo Wind 1995 9 $500.00 $776.70 0 0 1

November 2015
119
County Name
Hazard Year Month Property Damage
Property Damage
(ADJ 2014) Injuries Fatalities Records
Bernalillo Wind 1996 1 $6,333.33 $9,555.94 0 0 1
Bernalillo Wind 1996 3 $11,666.66 $17,603.05 0 0 2
Bernalillo Wind 1996 12 $4,285.71 $6,466.42 0 0 1
Bernalillo Wind 1997 4 $28,750.00 $42,405.98 0 0 2
Bernalillo Wind 1997 10 $4,545.45 $6,704.50 0 0 1
Bernalillo Wind 1998 2 $11,538.46 $16,758.09 0 0 1
Bernalillo Wind 1998 3 $0.00 $0.00 1 0 1
Bernalillo Wind 1998 4 $5,300.00 $7,697.55 0 0 2
Bernalillo Wind 1999 2 $1,176.47 $1,671.75 0 0 1
Bernalillo Wind 1999 4 $10,000.00 $14,209.84 0 0 1
Bernalillo Wind 2000 4 $8,888.89 $12,220.21 0 0 1
Bernalillo Wind 2000 9 $15,000.00 $20,621.60 0 0 1
Bernalillo Wind 2000 12 $4,166.67 $5,728.23 0 0 1
Bernalillo Wind 2001 6 $428.57 $572.89 0 0 1
Bernalillo Wind 2001 7 $15,000.00 $20,051.05 0 0 1
Bernalillo Wind 2003 9 $0.00 $0.00 2 0 1
Bernalillo Wind 2004 6 $1,500.00 $1,879.85 0 0 1
Bernalillo Wind 2007 6 $277.78 $317.16 0 0 1
Bernalillo Wind 2007 12 $769.23 $878.28 0 0 1
Bernalillo Wind 2008 2 $2,500.00 $2,748.87 0 0 1
Bernalillo Wind 2008 5 $4,000.00 $4,398.20 0 0 2
Bernalillo Wind 2008 10 $2,500.00 $2,748.87 0 0 1
Bernalillo Wind 2009 2 $1,000.00 $1,103.47 0 0 1
Bernalillo Wind 2009 4 $7,044.45 $7,773.37 0 0 3
Bernalillo Wind 2009 6 $2,800.00 $3,089.73 0 0 1
Bernalillo Wind 2009 7 $750.00 $827.61 0 0 1
Bernalillo Wind 2009 12 $34,366.67 $37,922.73 0 0 1
Bernalillo Wind 2010 3 $66.67 $72.38 0 0 1
Bernalillo Wind 2010 4 $1,666.67 $1,809.45 0 0 1
Bernalillo Wind 2010 6 $136,666.66 $148,374.35 0 0 2
Bernalillo Wind 2011 3 $3,333.33 $3,508.15 0 0 1
Bernalillo Wind 2011 4 $4,333.34 $4,560.60 0 0 3
Bernalillo Wind 2011 6 $416.67 $438.52 0 0 1
Bernalillo Wind 2012 3 $13,500.00 $13,919.94 0 0 2
Bernalillo Wind 2012 4 $22,166.67 $22,856.20 0 0 3
Bernalillo Wind 2012 12 $166.67 $171.85 0 0 1
Bernalillo Wind 2013 3 $666.67 $677.48 0 0 1
Bernalillo Wind 2013 6 $15,166.67 $15,412.70 0 0 4
Bernalillo Wind 2013 7 $579,000.00 $588,392.46 0 0 6

November 2015
120
County Name
Hazard Year Month Property Damage
Property Damage
(ADJ 2014) Injuries Fatalities Records
Bernalillo Wind 2013 10 $8,000.00 $8,129.77 0 0 1
Bernalillo Wind 2014 2 $600.00 $600.00 0 0 1
Bernalillo Wind 2014 4 $2,285.72 $2,285.72 0 0 4
Bernalillo Wind 2014 6 $33,500.00 $33,500.00 0 0 3
Bernalillo Wind 2014 7 $857.14 $857.14 0 0 2
Bernalillo Wind 2014 9 $60,000.00 $60,000.00 0 0 2
Bernalillo Wind 2014 10 $500.00 $500.00 0 0 1
Los Alamos Wind 1995 11 $2,000.00 $3,106.77 0 0 1
Los Alamos Wind 1998 4 $2,300.00 $3,340.45 0 0 1
Los Alamos Wind 1999 4 $6,666.67 $9,473.23 0 0 1
Los Alamos Wind 2000 7 $10,000.00 $13,747.74 0 0 1
Los Alamos Wind 2007 6 $277.78 $317.16 0 0 1
Los Alamos Wind 2009 3 $1,875.00 $2,069.01 0 0 1
Los Alamos Wind 2009 4 $100.00 $110.35 0 0 1
Los Alamos Wind 2010 10 $1,000.00 $1,085.67 0 0 1
Los Alamos Wind 2013 5 $30,000.00 $30,486.66 0 0 1
McKinley Wind 1995 3 $2,142.86 $3,328.69 0 0 1
McKinley Wind 1995 11 $2,000.00 $3,106.77 0 0 1
McKinley Wind 1996 3 $8,333.33 $12,573.61 0 0 1
McKinley Wind 1996 12 $4,285.71 $6,466.42 0 0 1
McKinley Wind 1997 4 $8,750.00 $12,906.17 0 0 1
McKinley Wind 1998 4 $2,300.00 $3,340.45 0 0 1
McKinley Wind 1998 6 $1,000.00 $1,452.37 0 0 1
McKinley Wind 1998 7 $25,000.00 $36,309.20 0 0 1
McKinley Wind 1999 2 $1,176.47 $1,671.75 0 0 1
McKinley Wind 1999 4 $31,666.67 $44,997.84 0 0 3
McKinley Wind 2000 4 $8,888.89 $12,220.21 0 0 1
McKinley Wind 2000 7 $15,000.00 $20,621.60 0 0 1
McKinley Wind 2001 6 $428.57 $572.89 0 0 1
McKinley Wind 2002 3 $0.00 $0.00 2 0 1
McKinley Wind 2003 7 $7,500.00 $9,649.57 0 0 1
McKinley Wind 2005 4 $2,187.50 $2,651.61 0 0 1
McKinley Wind 2007 6 $277.78 $317.16 0 0 1
McKinley Wind 2009 1 $0.00 $0.00 0 0.25 1
McKinley Wind 2009 3 $1,875.00 $2,069.01 0 0 1
McKinley Wind 2009 4 $2,600.00 $2,869.03 0 0 2
McKinley Wind 2011 1 $0.00 $0.00 0 0.5 2
McKinley Wind 2011 2 $0.00 $0.00 0 0.165 1
McKinley Wind 2011 4 $2,833.33 $2,981.92 0 0 2

November 2015
121
County Name
Hazard Year Month Property Damage
Property Damage
(ADJ 2014) Injuries Fatalities Records
McKinley Wind 2011 6 $416.67 $438.52 0 0 1
McKinley Wind 2013 10 $8,000.00 $8,129.77 0 0 1
McKinley Wind 2014 3 $5,000.00 $5,000.00 0 0 2
Sandoval Wind 1995 3 $2,142.86 $3,328.69 0 0 1
Sandoval Wind 1995 4 $1,666.67 $2,588.98 0 0 1
Sandoval Wind 1995 11 $2,000.00 $3,106.77 0 0 1
Sandoval Wind 1996 1 $6,333.33 $9,555.94 0 0 1
Sandoval Wind 1996 3 $8,333.33 $12,573.61 0 0 1
Sandoval Wind 1996 6 $20,000.00 $30,176.67 0 0 1
Sandoval Wind 1996 12 $4,285.71 $6,466.42 0 0 1
Sandoval Wind 1997 4 $8,750.00 $12,906.17 0 0 1
Sandoval Wind 1997 10 $4,545.45 $6,704.50 0 0 1
Sandoval Wind 1998 2 $11,538.46 $16,758.09 0 0 1
Sandoval Wind 1998 4 $2,300.00 $3,340.45 0 0 1
Sandoval Wind 1999 2 $1,176.47 $1,671.75 0 0 1
Sandoval Wind 1999 4 $6,666.67 $9,473.23 0 0 1
Sandoval Wind 1999 6 $7,500.00 $10,657.39 0 0 1
Sandoval Wind 2000 4 $8,888.89 $12,220.21 0 0 1
Sandoval Wind 2000 12 $4,166.67 $5,728.23 0 0 1
Sandoval Wind 2001 6 $428.57 $572.89 0 0 1
Sandoval Wind 2001 7 $10,000.00 $13,367.37 0 0 1
Sandoval Wind 2001 12 $10,000.00 $13,367.36 0 0 1
Sandoval Wind 2002 8 $0.00 $0.00 1 0 1
Sandoval Wind 2002 9 $2,500.00 $3,289.83 0 0 1
Sandoval Wind 2005 4 $2,187.50 $2,651.61 0 0 1
Sandoval Wind 2007 6 $277.78 $317.16 0 0 1
Sandoval Wind 2007 12 $50,769.23 $57,966.57 0 0 2
Sandoval Wind 2008 3 $500.00 $549.77 0 0 1
Sandoval Wind 2009 2 $1,000.00 $1,103.47 0 0 1
Sandoval Wind 2009 3 $1,875.00 $2,069.01 0 0 1
Sandoval Wind 2009 4 $7,044.45 $7,773.37 0 0 3
Sandoval Wind 2009 6 $2,800.00 $3,089.73 0 0 1
Sandoval Wind 2009 12 $34,366.67 $37,922.73 0 0 1
Sandoval Wind 2010 3 $66.67 $72.38 0 0 1
Sandoval Wind 2010 4 $2,666.67 $2,895.12 0 0 3
Sandoval Wind 2010 5 $1,000.00 $1,085.67 0 0 1
Sandoval Wind 2010 6 $137,666.66 $149,460.02 0 0 3
Sandoval Wind 2010 8 $50.00 $54.28 0 0 1
Sandoval Wind 2010 10 $1,500.00 $1,628.51 0 0 2
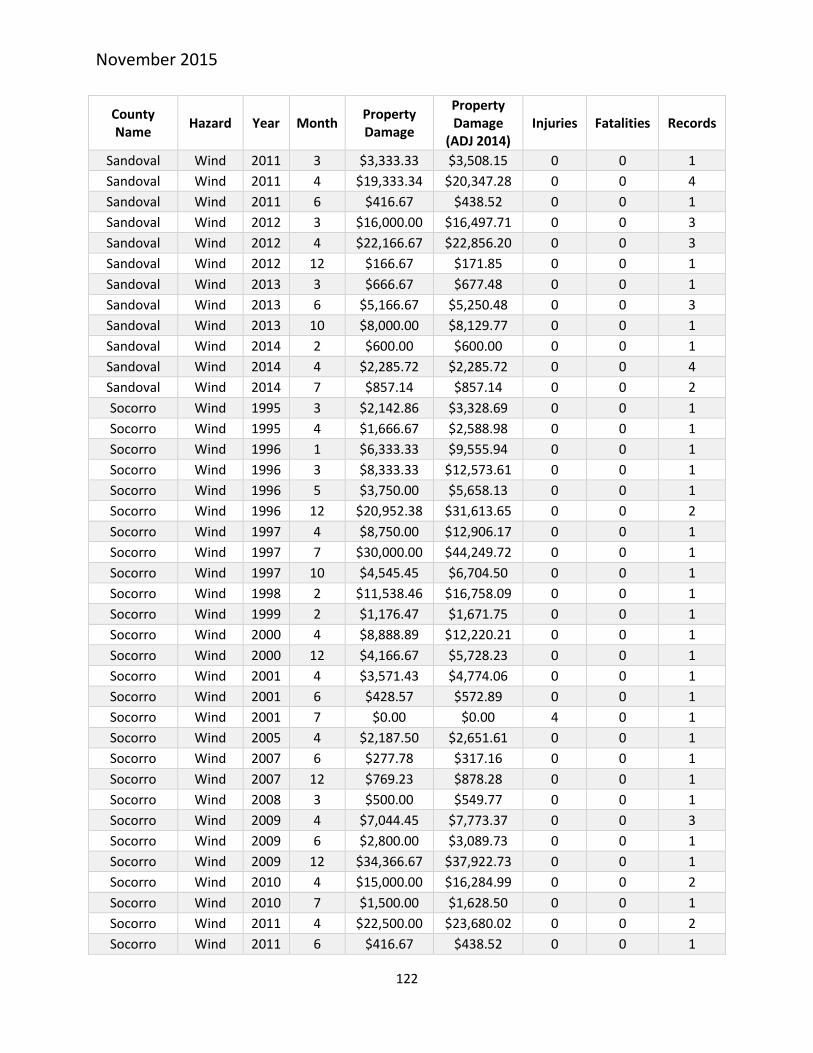
November 2015
122
County Name
Hazard Year Month Property Damage
Property Damage
(ADJ 2014) Injuries Fatalities Records
Sandoval Wind 2011 3 $3,333.33 $3,508.15 0 0 1
Sandoval Wind 2011 4 $19,333.34 $20,347.28 0 0 4
Sandoval Wind 2011 6 $416.67 $438.52 0 0 1
Sandoval Wind 2012 3 $16,000.00 $16,497.71 0 0 3
Sandoval Wind 2012 4 $22,166.67 $22,856.20 0 0 3
Sandoval Wind 2012 12 $166.67 $171.85 0 0 1
Sandoval Wind 2013 3 $666.67 $677.48 0 0 1
Sandoval Wind 2013 6 $5,166.67 $5,250.48 0 0 3
Sandoval Wind 2013 10 $8,000.00 $8,129.77 0 0 1
Sandoval Wind 2014 2 $600.00 $600.00 0 0 1
Sandoval Wind 2014 4 $2,285.72 $2,285.72 0 0 4
Sandoval Wind 2014 7 $857.14 $857.14 0 0 2
Socorro Wind 1995 3 $2,142.86 $3,328.69 0 0 1
Socorro Wind 1995 4 $1,666.67 $2,588.98 0 0 1
Socorro Wind 1996 1 $6,333.33 $9,555.94 0 0 1
Socorro Wind 1996 3 $8,333.33 $12,573.61 0 0 1
Socorro Wind 1996 5 $3,750.00 $5,658.13 0 0 1
Socorro Wind 1996 12 $20,952.38 $31,613.65 0 0 2
Socorro Wind 1997 4 $8,750.00 $12,906.17 0 0 1
Socorro Wind 1997 7 $30,000.00 $44,249.72 0 0 1
Socorro Wind 1997 10 $4,545.45 $6,704.50 0 0 1
Socorro Wind 1998 2 $11,538.46 $16,758.09 0 0 1
Socorro Wind 1999 2 $1,176.47 $1,671.75 0 0 1
Socorro Wind 2000 4 $8,888.89 $12,220.21 0 0 1
Socorro Wind 2000 12 $4,166.67 $5,728.23 0 0 1
Socorro Wind 2001 4 $3,571.43 $4,774.06 0 0 1
Socorro Wind 2001 6 $428.57 $572.89 0 0 1
Socorro Wind 2001 7 $0.00 $0.00 4 0 1
Socorro Wind 2005 4 $2,187.50 $2,651.61 0 0 1
Socorro Wind 2007 6 $277.78 $317.16 0 0 1
Socorro Wind 2007 12 $769.23 $878.28 0 0 1
Socorro Wind 2008 3 $500.00 $549.77 0 0 1
Socorro Wind 2009 4 $7,044.45 $7,773.37 0 0 3
Socorro Wind 2009 6 $2,800.00 $3,089.73 0 0 1
Socorro Wind 2009 12 $34,366.67 $37,922.73 0 0 1
Socorro Wind 2010 4 $15,000.00 $16,284.99 0 0 2
Socorro Wind 2010 7 $1,500.00 $1,628.50 0 0 1
Socorro Wind 2011 4 $22,500.00 $23,680.02 0 0 2
Socorro Wind 2011 6 $416.67 $438.52 0 0 1

November 2015
123
County Name
Hazard Year Month Property Damage
Property Damage
(ADJ 2014) Injuries Fatalities Records
Socorro Wind 2013 7 $10,000.00 $10,162.22 0 0 1
Socorro Wind 2013 10 $8,500.00 $8,637.88 0 0 2
Socorro Wind 2014 4 $1,000.00 $1,000.00 0 0 2
Taos Wind 1995 11 $2,000.00 $3,106.77 0 0 1
Taos Wind 1996 12 $16,666.67 $25,147.23 0 0 1
Taos Wind 1997 7 $30,000.00 $44,249.72 0 0 1
Taos Wind 1998 2 $11,538.46 $16,758.09 0 0 1
Taos Wind 1999 2 $1,176.47 $1,671.75 0 0 1
Taos Wind 2007 6 $277.78 $317.16 0 0 1
Taos Wind 2008 5 $10,000.00 $10,995.48 0 0 1
Taos Wind 2009 4 $6,944.45 $7,663.02 0 0 2
Taos Wind 2013 4 $125.00 $127.03 0 0 1
Taos Wind 2013 12 $8,333.34 $8,468.52 0 0 1
Frequency
The State of New Mexico experiences high wind events annually, based on seasonal meteorological
patterns and local topographical conditions. One type of wind event is the gap wind or canyon wind.
This occurs as the wind rushes over mountain passes, “gaps,” in the ridgeline of a mountain chain. Wind
speeds are generally strongest at narrow canyon openings. Another type of wind event is referred to as
the spillover wind, which occurs when cold air to the east of the mountains has a sufficient depth
(approximately 10,000 feet above sea level) to overtop the Sandia and Manzano Mountain ranges and
spill over to the west, typically down slope toward the Albuquerque metropolitan area (Preparedness
Area 5).
Wind speeds over the State are usually moderate, although relatively strong winds often accompany
occasional frontal activity during late winter and spring months and sometimes occur just in advance of
thunderstorms. Frontal winds may exceed 30 mph for several hours and reach peak speeds of more
than 50 mph. Spring is the windy season in New Mexico. Blowing dust and serious soil erosion of
unprotected fields may be a problem during dry spells. Winds are generally stronger in the eastern
plains than in other parts of the State. Winds generally predominate from the southeast in summer and
from the west in winter, but local surface wind directions will vary greatly because of local topography
and mountain and valley breezes.
A study was conducted by the National Weather Service – Albuquerque titled, “A Climatology of High
Wind Warning Events for Northern and Central New Mexico: 1976-2005.” The study conducted an
assessment of climatological wind data across northern and central New Mexico in an effort to provide
forecasters with supplemental knowledge of the synoptic regimes and frequency of high wind events.

November 2015
124
The climatological record of high wind events was built for eight observational sites across New Mexico
utilizing a 30 year period of record from 1976 to 2005. Locations included Albuquerque – Preparedness
Area 1, Clayton – Preparedness Area 2, Farmington – Preparedness Area 4, Gallup – Preparedness Area
4, Los Vegas – Preparedness Area 2, Roswell – Preparedness Area 1, Santa Fe – Preparedness Area 3 and
Tucumcari – Preparedness Area 1. NWS staff conducted hourly, monthly, seasonal, and yearly intervals
and interim surface observations from these eight sites to determine the frequency of high wind events.
The observations provided the NWS with information that with continued future work will hopefully
include the construction of a database that will allow improved methods for inter-site comparisons of
events on an individual and collective basis.56
Probability of Future Occurrence
High winds are difficult to predict precisely in pattern, frequency, and degree of severity. The windiest
time of the year is during the spring months of April and May, with March and June often times not far
behind. The graphs below depict mean monthly wind speeds at seven locations across the state – the
spring wind maximum is evident at all sites.
To determine the probability of New Mexico experiencing future high wind occurrences, the probability
or chance of occurrence was calculated based on historical data identified the NCDC database from a
period of January 1, 2006 – December 1, 2012 (84 months) and from local emergency management
officials. Probability was determined by dividing the number of events observed by the number of
months and multiplying by 100. This gives the percent chance of the event happening in any given year.
Table 44 provides the probability of future occurrence in each Preparedness Area based on the
probability formula.
Table 44: Probability of Future Occurrence (annually) - High Wind
Probability of Future Occurrence
Preparedness Area High Wind Strong Wind Dust Storm
Preparedness Area 1 100% 4.8% 0%
Preparedness Area 2 8.3% 2.3% 0%
Preparedness Area 3 2.3% 6.0% 0%
Preparedness Area 4 4.8% 2.3% 0%
Preparedness Area 5 30% 3.6% 1.2%
Preparedness Area 6 11% 0% 1.2%
56
Source: http://www.srh.noaa.gov/media/abq/LocalStudies/hww_studyBTS2010.pdf
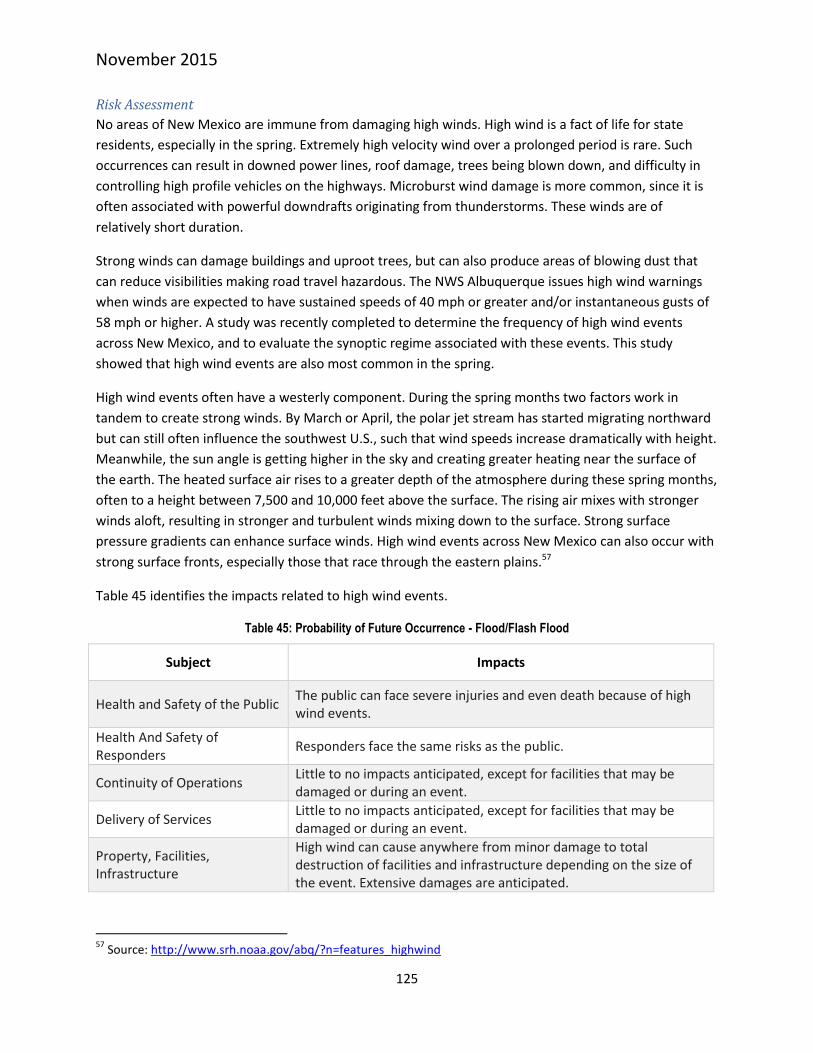
November 2015
125
Risk Assessment
No areas of New Mexico are immune from damaging high winds. High wind is a fact of life for state
residents, especially in the spring. Extremely high velocity wind over a prolonged period is rare. Such
occurrences can result in downed power lines, roof damage, trees being blown down, and difficulty in
controlling high profile vehicles on the highways. Microburst wind damage is more common, since it is
often associated with powerful downdrafts originating from thunderstorms. These winds are of
relatively short duration.
Strong winds can damage buildings and uproot trees, but can also produce areas of blowing dust that
can reduce visibilities making road travel hazardous. The NWS Albuquerque issues high wind warnings
when winds are expected to have sustained speeds of 40 mph or greater and/or instantaneous gusts of
58 mph or higher. A study was recently completed to determine the frequency of high wind events
across New Mexico, and to evaluate the synoptic regime associated with these events. This study
showed that high wind events are also most common in the spring.
High wind events often have a westerly component. During the spring months two factors work in
tandem to create strong winds. By March or April, the polar jet stream has started migrating northward
but can still often influence the southwest U.S., such that wind speeds increase dramatically with height.
Meanwhile, the sun angle is getting higher in the sky and creating greater heating near the surface of
the earth. The heated surface air rises to a greater depth of the atmosphere during these spring months,
often to a height between 7,500 and 10,000 feet above the surface. The rising air mixes with stronger
winds aloft, resulting in stronger and turbulent winds mixing down to the surface. Strong surface
pressure gradients can enhance surface winds. High wind events across New Mexico can also occur with
strong surface fronts, especially those that race through the eastern plains.57
Table 45 identifies the impacts related to high wind events.
Table 45: Probability of Future Occurrence - Flood/Flash Flood
Subject Impacts
Health and Safety of the Public The public can face severe injuries and even death because of high wind events.
Health And Safety of Responders
Responders face the same risks as the public.
Continuity of Operations Little to no impacts anticipated, except for facilities that may be damaged or during an event.
Delivery of Services Little to no impacts anticipated, except for facilities that may be damaged or during an event.
Property, Facilities, Infrastructure
High wind can cause anywhere from minor damage to total destruction of facilities and infrastructure depending on the size of the event. Extensive damages are anticipated.
57
Source: http://www.srh.noaa.gov/abq/?n=features_highwind

November 2015
126
Environment Wind can cause widespread extensive damage to the environment in the form of damaged or downed trees and crops, and debris or contamination dispersal.
Economic Condition A small community can be heavily damaged and by wind. The economic base (businesses) and individuals can lose everything, and recovery may require substantial investment.
Public Confidence Not impacted by the event itself, but may be damaged if the response to an event is poor.
Data Limitations
UNM events that take place outdoors such as sporting events, are susceptible to high wind events. In
the past, downed power lines, roof damage, trees being blown down, and collapse of outdoor structures
has occurred. These incidents can result in injuries and possible death. Structures that are not
adequately anchored such as portable buildings are also vulnerable for damage from high wind events.
The amount of business lost due to high wind events has not been calculated due to the difficulty of
attaining this information.
Summary of Impact to UNM
All UNM campuses can be affected by high wind storm events. UNM campuses could experience high
wind events between 0 and 63 mph. UNM main campus identifies high winds as being medium based on
past occurrence recorded. UNM Branch Campuses and the Sevilleta LTER identified winds as being a
low risk.
Landslide
Hazard Characteristics
Landslides are the downward and outward movement of loose material on slopes. Landslides include a
wide range of ground movement, such as rock falls, deep failure of slopes, and shallow debris flows.
Although gravity acting on and over steepened slopes is the primary reason for a landslide, landslides
are often prompted by the occurrence of other disasters such as seismic activity of heavy rain fall. Other
contributing factors include the following:
Erosion by rivers, glaciers, or waves creating over-steepened slopes;
Rock and soil slopes weakened through saturation by snowmelt or heavy rains;
Earthquakes creating stresses that make weak slopes fail;
Volcanic eruptions producing loose ash deposits, heavy rain, and debris flows;
Excess weight from accumulation of rain or snow, stockpiling of rock or ore, from waste piles, or
from manmade structures stressing weak slopes;
Floods or long duration precipitation events creating saturated, unstable soils that are more
susceptible to failure;
Addition of water from irrigation ditches crossing steep slopes and saturating the substrate; and
Moist clay on slopes deform, slide, and flow easily.
November 2015
127
Slope material often becomes saturated with water and may develop a debris or mudflow. If the ground
is saturated, the water weakens the soil and rock by reducing cohesion and friction between particles.
Cohesion, which is the tendency of soil particles to "stick" to each other, and friction affect the strength
of the material in the slope and contribute to a slope's ability to resist down slope movement. Moist
clays on slopes are plastic, deforming and sliding under slight loads and also prevent water from
percolating downward. Saturation also increases the weight of the slope materials and, like the addition
of material on the upper portion of a slope, increases the gravitational force on the slope. Undercutting
of a slope reduces the slope's resistance to the force of gravity by removing much-needed support at the
base of the slope. Alternating cycles of freeze and thaw can result in a slow, virtually imperceptible
loosening of rock, thereby weakening the rock and making it susceptible to slope failure. The resulting
slurry of rock and mud can pick up trees, houses, and cars, and block bridges and tributaries, causing
flooding along its path. Additionally, removal of vegetation can leave a slope much more susceptible to
superficial landslides because of the loss of the stabilizing root systems.
Geologists identify active landslides and areas subject to slope instability so that they may be avoided or
mitigated. Together, geologists and civil engineers develop and implement measures to improve the
stability of slopes, repair existing landslides, and prevent damage from future landslides. Slope stability
can be improved by removing material from the top of the slope, adding material or retaining structures
to the base of the slope, and reducing the degree of saturation by improving drainage within the slope.

November 2015
128
Landslide Types
Debris Flows – a mixture of rock fragments, soil, vegetation, water and, in some cases, entrained air
that flows downhill as a fluid. Debris flows can range in consistency from that of freshly mixed concrete
to running water. Debris flows can be further classified as mudflows and earth flows depending on the
ratio of water to soil and rock debris. Lahars are a special form of debris flow caused by volcanic
eruptions (Figure 30).
Figure 30: Landslide – Debris Flow58
58 USGS, http://pubs.usgs.gov/fs/2004/3072/fs-2004-3072.html (December 2012)

November 2015
129
Slump – a landslide consisting of a mass of material moving down slope as a unit, usually along a curved
plane of failure. The removed mass of soil and rock leave an abrupt drop-off at the top of the landslide
known as a scarp. Repeated slumping can often result in terracing, or series of scarps, as secondary
failures occur within the landslide mass (Figure 31).
Figure 31: Landslide – Slump59
Slide – the rapid movement of a large mass of rock along a plane of weakness, such as a bedding plane
or joint. In general, rockslides occur on steep mountain faces, but have been known to occur on slopes
as low as 15 degrees (Figure 32).
Figure 32: Landslide – Rock Slide60
Rock Fall – the freefall of rock from a cliff. Rock falls are often the result of physical weathering such as
ice wedging. The rock typically accumulates at the base of the cliff in the form of talus (loose rock). Rock
falls are often triggered by earthquakes (Figure 33).61
59
USGS, http://pubs.usgs.gov/fs/2004/3072/fs-2004-3072.html (December 2012). 60
USGS http://pubs.usgs.gov/fs/2004/3072/fs-2004-3072.html (December 2012)
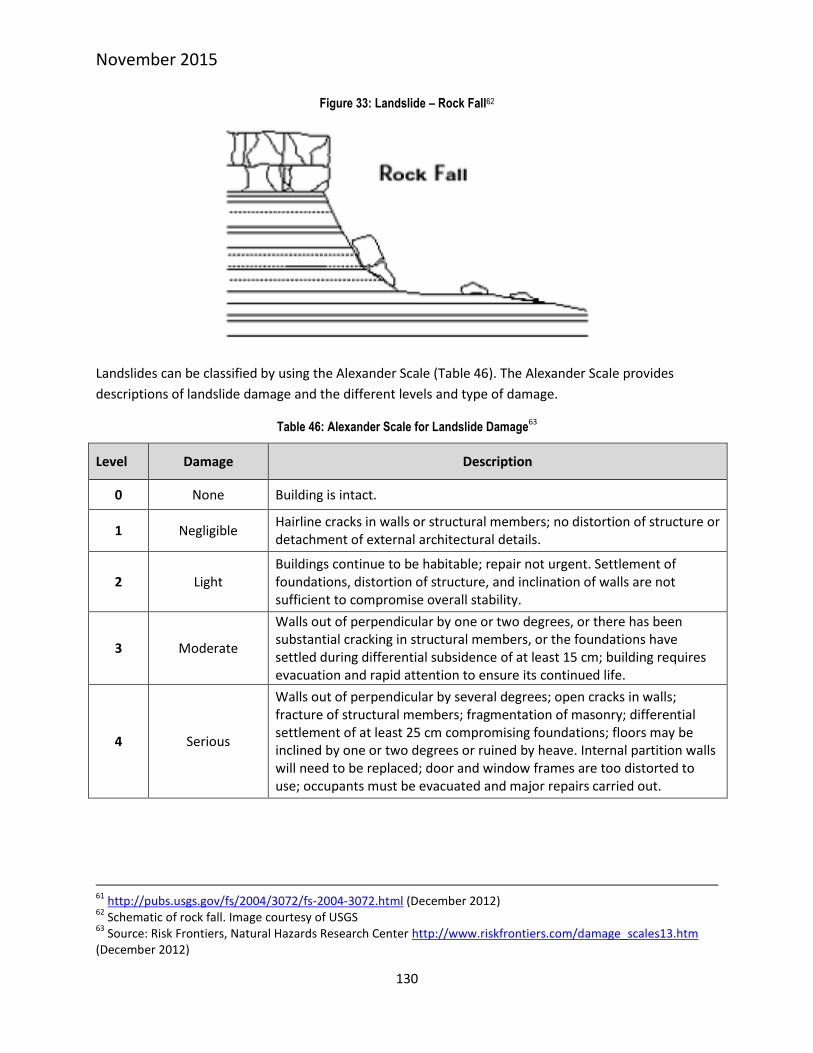
November 2015
130
Figure 33: Landslide – Rock Fall62
Landslides can be classified by using the Alexander Scale (Table 46). The Alexander Scale provides
descriptions of landslide damage and the different levels and type of damage.
Table 46: Alexander Scale for Landslide Damage63
Level Damage Description
0 None Building is intact.
1 Negligible Hairline cracks in walls or structural members; no distortion of structure or detachment of external architectural details.
2 Light Buildings continue to be habitable; repair not urgent. Settlement of foundations, distortion of structure, and inclination of walls are not sufficient to compromise overall stability.
3 Moderate
Walls out of perpendicular by one or two degrees, or there has been substantial cracking in structural members, or the foundations have settled during differential subsidence of at least 15 cm; building requires evacuation and rapid attention to ensure its continued life.
4 Serious
Walls out of perpendicular by several degrees; open cracks in walls; fracture of structural members; fragmentation of masonry; differential settlement of at least 25 cm compromising foundations; floors may be inclined by one or two degrees or ruined by heave. Internal partition walls will need to be replaced; door and window frames are too distorted to use; occupants must be evacuated and major repairs carried out.
61
http://pubs.usgs.gov/fs/2004/3072/fs-2004-3072.html (December 2012) 62
Schematic of rock fall. Image courtesy of USGS 63
Source: Risk Frontiers, Natural Hazards Research Center http://www.riskfrontiers.com/damage_scales13.htm (December 2012)

November 2015
131
5 Very Serious
Walls out of plumb by five or six degrees; structure grossly distorted; differential settlement has seriously cracked floors and walls or caused major rotation or slewing of the building [wooden buildings are detached completely from their foundations]. Partition walls and brick infill will have at least partly collapsed; roofs may have partially collapsed; outhouses, porches, and patios may have been damaged more seriously than the principal structure itself. Occupants will need to be re-housed on a long- term basis, and rehabilitation of the building will probably not be feasible.
6 Partial Collapse Requires immediate evacuation of the occupants and cordoning of the site to prevent accidents with falling masonry.
7 Total Collapse Requires clearance of the site.
Landslides occur in every state and U.S. territory. Although frequently associated with areas of high
rainfall, landslides are a potential hazard in arid or semi-arid states like New Mexico. Landslides in New
Mexico range from large, slow-moving, deep-seated masses, which can destroy structures by gradual
movement, to shallow, fast-moving debris flows that threaten life and property. The USGS National
Landslide Hazards Program has mapped the landslide risk for the entire conterminous U.S.

November 2015
132
Figure 34 provides a view of landslide susceptible areas in New Mexico along with the six Preparedness
Area boundaries.64 Most of New Mexico is mapped in the lowest risk zone where there is a low landslide
incidence that involves less than 1.5% of the land area.
Figure 34: Landslide Susceptible Preparedness Areas in New Mexico
The areas shown in yellow include the northern edge of Rio Arriba County (Preparedness Area 3),
Sandoval (Preparedness Area 5) and San Juan County (Preparedness Area 4), and portions of Socorro
(Preparedness Area 5) represent areas of moderate susceptibility and involve 1.5% to 15% of the land
area. This can be based on steep slopes in the area, natural or artificial cutting, or high precipitation in
the area. Although these areas have a moderate susceptibility to landslides, they also have a low
64
Source: http://landslides.usgs.gov/html_files/landslides/nationalmap/
UNM Taos
UNM Los Alamos
UNM Main UNM Gallup
UNM Valencia
UNM Sevilleta
UNM West
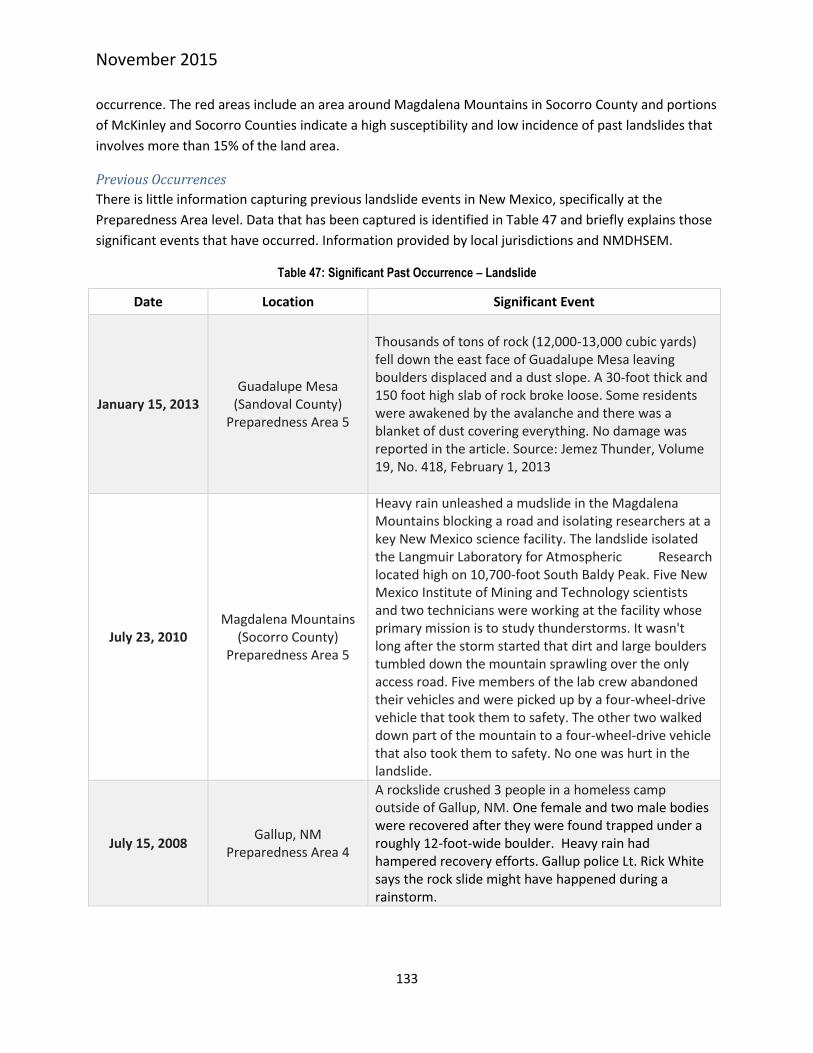
November 2015
133
occurrence. The red areas include an area around Magdalena Mountains in Socorro County and portions
of McKinley and Socorro Counties indicate a high susceptibility and low incidence of past landslides that
involves more than 15% of the land area.
Previous Occurrences
There is little information capturing previous landslide events in New Mexico, specifically at the
Preparedness Area level. Data that has been captured is identified in Table 47 and briefly explains those
significant events that have occurred. Information provided by local jurisdictions and NMDHSEM.
Table 47: Significant Past Occurrence – Landslide
Date Location Significant Event
January 15, 2013 Guadalupe Mesa
(Sandoval County) Preparedness Area 5
Thousands of tons of rock (12,000-13,000 cubic yards) fell down the east face of Guadalupe Mesa leaving boulders displaced and a dust slope. A 30-foot thick and 150 foot high slab of rock broke loose. Some residents were awakened by the avalanche and there was a blanket of dust covering everything. No damage was reported in the article. Source: Jemez Thunder, Volume 19, No. 418, February 1, 2013
July 23, 2010 Magdalena Mountains
(Socorro County) Preparedness Area 5
Heavy rain unleashed a mudslide in the Magdalena Mountains blocking a road and isolating researchers at a key New Mexico science facility. The landslide isolated the Langmuir Laboratory for Atmospheric Research located high on 10,700-foot South Baldy Peak. Five New Mexico Institute of Mining and Technology scientists and two technicians were working at the facility whose primary mission is to study thunderstorms. It wasn't long after the storm started that dirt and large boulders tumbled down the mountain sprawling over the only access road. Five members of the lab crew abandoned their vehicles and were picked up by a four-wheel-drive vehicle that took them to safety. The other two walked down part of the mountain to a four-wheel-drive vehicle that also took them to safety. No one was hurt in the landslide.
July 15, 2008 Gallup, NM
Preparedness Area 4
A rockslide crushed 3 people in a homeless camp outside of Gallup, NM. One female and two male bodies were recovered after they were found trapped under a roughly 12-foot-wide boulder. Heavy rain had hampered recovery efforts. Gallup police Lt. Rick White says the rock slide might have happened during a rainstorm.

November 2015
134
Date Location Significant Event
September 1998 Taos, NM (Taos County)
Preparedness Area 3
A falling boulder (270,000 kg) struck a bus, killed five people, and injured 14, along HWY 68. The boulder left a 5x5x14 meter crater in the highway. The highway was closed for 19 hours and clean-up costs were approximately $75,000.
June 1977 Taos, NM (Taos County)
Preparedness Area 3 A landslide event caused $50,000 in property damage.
Declared Disasters from Landslide
DHSEM reports one State Declared Disaster for landslide between 2003 and 2013 (Table 48). According
to DHSEM records, the total cost for the 2007 landslide disaster was $291,137. All associated damages
were within San Juan County which (in Preparedness Area 4). There were no federal disaster
declarations for landslide from 2003 through 2012.
Table 48: New Mexico Landslide Disaster Declarations (2003 – 2012)
Event Type State Executive Order Dollar Loss
Landslide 07-021 $291,137.00
Total 1 $291,137.00
Frequency
The frequency of landslides in New Mexico is low based on previous occurrences. An issue for
consideration is landslide events that do occur that are not reported and unpopulated land area where
landslides go un-noticed.
Probability of Future Occurrence
Landslides can result in serious structural damage to roads, buildings, irrigation channels, utilities and
pipelines. To determine the probability of each Preparedness Area experiencing future landslide
occurrences, the probability or chance of occurrence was calculated based on historical data provided
by local authorities. Probability was determined by dividing the number of events observed by the
number of years and multiplying by 100. This gives the percent chance of the event happening in any
given year.

November 2015
135
Table 49 provides the probability of each Preparedness Area experiencing a landslide event.
Table 49: Probability of Annual Occurrence of Landslide
Probability of Future Occurrence
Preparedness Area Landslide
Preparedness Area 3 7%
Preparedness Area 4 7%
Preparedness Area 5 3%
One concern that is under review is landslides following a wildfire. In June 2011, the Track Fire burned
113 square kilometers in Colfax County, northeastern New Mexico, and Las Animas County,
southeastern Colorado, including the upper watersheds of Chicorica and Raton Creeks. The burned
landscape is now at risk of damage from post wildfire erosion, such as that caused by debris flows and
flash floods. Small debris flows may affect structures at or downstream from basin outlets and increase
the threat of flooding downstream by damaging or blocking flood mitigation structures.
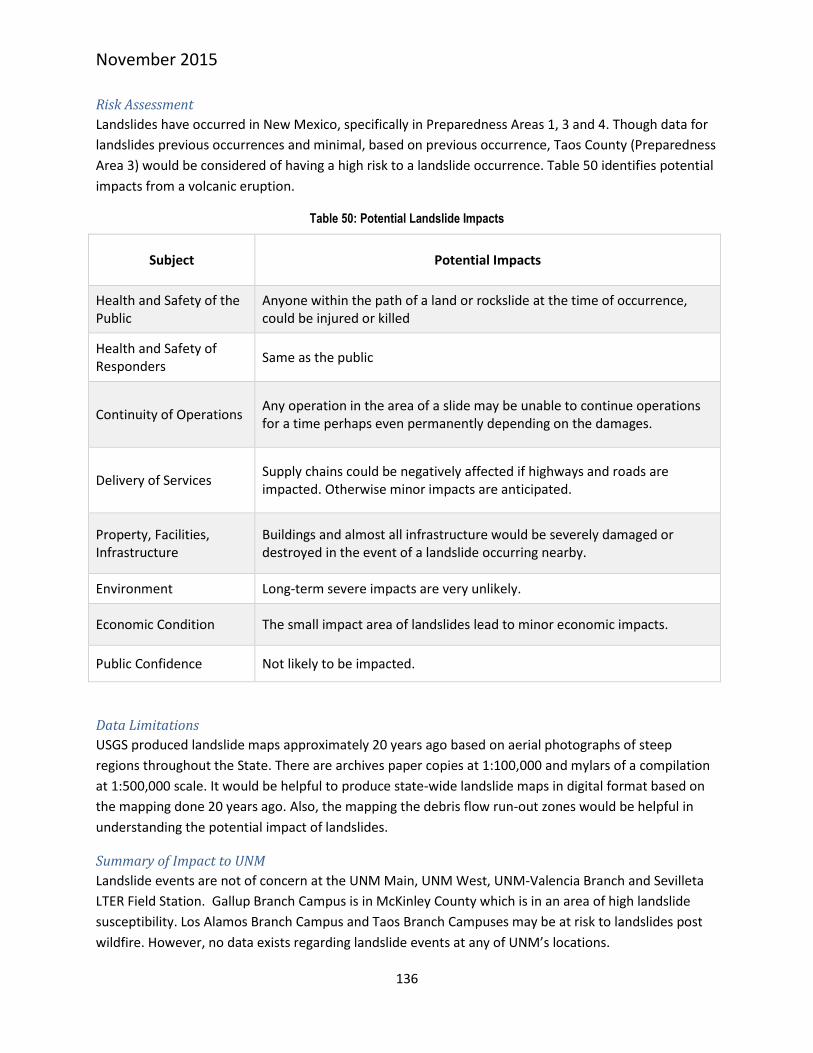
November 2015
136
Risk Assessment
Landslides have occurred in New Mexico, specifically in Preparedness Areas 1, 3 and 4. Though data for
landslides previous occurrences and minimal, based on previous occurrence, Taos County (Preparedness
Area 3) would be considered of having a high risk to a landslide occurrence. Table 50 identifies potential
impacts from a volcanic eruption.
Table 50: Potential Landslide Impacts
Subject Potential Impacts
Health and Safety of the Public
Anyone within the path of a land or rockslide at the time of occurrence, could be injured or killed
Health and Safety of Responders
Same as the public
Continuity of Operations Any operation in the area of a slide may be unable to continue operations for a time perhaps even permanently depending on the damages.
Delivery of Services Supply chains could be negatively affected if highways and roads are impacted. Otherwise minor impacts are anticipated.
Property, Facilities, Infrastructure
Buildings and almost all infrastructure would be severely damaged or destroyed in the event of a landslide occurring nearby.
Environment Long-term severe impacts are very unlikely.
Economic Condition The small impact area of landslides lead to minor economic impacts.
Public Confidence Not likely to be impacted.
Data Limitations
USGS produced landslide maps approximately 20 years ago based on aerial photographs of steep
regions throughout the State. There are archives paper copies at 1:100,000 and mylars of a compilation
at 1:500,000 scale. It would be helpful to produce state-wide landslide maps in digital format based on
the mapping done 20 years ago. Also, the mapping the debris flow run-out zones would be helpful in
understanding the potential impact of landslides.
Summary of Impact to UNM
Landslide events are not of concern at the UNM Main, UNM West, UNM-Valencia Branch and Sevilleta
LTER Field Station. Gallup Branch Campus is in McKinley County which is in an area of high landslide
susceptibility. Los Alamos Branch Campus and Taos Branch Campuses may be at risk to landslides post
wildfire. However, no data exists regarding landslide events at any of UNM’s locations.
November 2015
137
Severe Winter Storms
Hazard Characteristics
Winter storms have significant snowfall, ice, and/or freezing rain, with the quantity of precipitation
variable by elevation. According to the NWS, heavy snowfall is four inches or more in a 12-hour period,
or six or more inches in a 24-hour period in non-mountainous areas; and 12 inches or more in a 12-hour
period or 18 inches or more in a 24- hour period in mountainous areas. Winter storms vary in size and
strength and include heavy snowfalls, blizzards, freezing rain, sleet, ice storms, blowing and drifting
snow conditions, and extreme cold.
A variety of weather phenomena and conditions can occur during winter storms. For clarification, the
following are NWS approved definitions of winter storm elements:
Heavy snowfall - the accumulation of 6 or more inches of snow in a 12-hour period or 8 or more
inches in a 24-hour period
Blizzard - the occurrence of sustained wind speeds in excess of 35 mph accompanied by heavy
snowfall or large amounts of blowing or drifting snow
Ice storm - an occurrence where rain falls from warmer upper layers of the atmosphere to the
colder ground, freezing upon contact with the ground and exposed objects near the ground
Freezing drizzle/freezing rain - the effect of drizzle or rain freezing upon impact on objects that
have a temperature of 32F or below
Sleet - solid grains or pellets of ice formed by the freezing of raindrops or the refreezing of
largely melted snowflakes. This ice does not cling to surfaces
Wind chill - an apparent temperature that describes the combined effect of wind and low air
temperatures on exposed skin
A blizzard is a winter storm with considerable falling and/or blowing snow combined with sustained
winds or frequent gusts of 35 mph or greater that frequently reduces visibility to less than one-quarter
mile. Extremely cold temperatures accompanied by strong winds can result in wind chills that cause
bodily injury such as frostbite and death. Winter storm occurrences tend to be very disruptive to
transportation and commerce. Trees, cars, roads, and other surfaces develop a coating or glaze of ice,
making even small accumulations of ice extremely hazardous to motorists and pedestrians. The most
prevalent impacts of heavy accumulations of ice are slippery roads and walkways that lead to vehicle
and pedestrian accidents, collapsed roofs from fallen trees and limbs, heavy ice and snow loads, and
downed telephone poles and lines, electrical wires, and communication towers. Such storms can also
cause exceptionally high rainfall that persists for days, resulting in heavy flooding.
A severe winter storm for New Mexico as defined by the National Weather Service:
4 or more inches of snowfall below 7,500 ft. or
6 or more inches of snowfall above 7,500 ft. in a 12 hour period, or
6 or more inches of snowfall below 7,500 ft. or
9 inches of snowfall above 7,500 ft. in a 24-hour period

November 2015
138
Most winter precipitation in New Mexico is associated with Pacific Ocean storms as they move across
the state from west to east. As the storms move inland, moisture falls on the coastal and inland
mountain ranges of California, Nevada, Arizona, and Utah. If conditions are right, the remaining
moisture falls on the slopes of New Mexico’s high mountain chains.
Much of the precipitation that falls as snow in the mountain areas may occur as either rain or snow in
the valleys. The average annual snowfall ranges from about 3 inches in the southern desert and
southeastern plains to over 100 inches in the northern mountains. It can, on rare occasions, exceed 300
inches in the highest mountains. January is usually the coldest month, with average daytime
temperatures ranging from the middle 50s in the southern and central valleys to the middle 30s in the
higher elevations. Minimum temperatures below freezing are common in all sections of the state during
the winter.65
65
Source: http://www.wrcc.dri.edu/narratives/NEWMEXICO.htm

November 2015
139
The following two maps (Figures 35-36) depict statewide snowfall distributions by average inches and
average numbers of days with snowfall over 1 inch.
Figure 35: Statewide Snowfall Distributions by Preparedness Area as of January 201266
66
Source: http://www.srh.noaa.gov/abq/?n=prepwinterwxclimo
UNM Taos
UNM Los Alamos
UNM Main
UNM Gallup
UNM Valencia
UNM Sevilleta
UNM West

November 2015
140
Figure 36: Statewide Average Annual Number of Days with Snowfall >= 1.0 Inch
Severe winter storms can vary in size and strength and include heavy snowstorms, blizzards, ice storms,
freezing drizzle or rain, sleet, and blowing and drifting snow. Extremely cold temperatures accompanied
by strong winds result in potentially lethal wind chills.
The Wind Chill is the temperature your body feels when the air temperature is combined with the wind
speed. It is based on the rate of heat loss from exposed skin caused by the effects of wind and cold. As
the speed of the wind increases, it can carry heat away from your body much more quickly, causing skin
UNM Taos
UNM Los Alamos
UNM Main
UNM Gallup
UNM Valencia
UNM Sevilleta
UNM West

November 2015
141
temperature to drop. The Wind Chill chart (Figure 37) shows the difference between actual air
temperature and perceived temperature, and amount of time until frostbite occurs.
Figure 37: Wind Chill Chart - December 201267
Extreme cold occurs when temperatures drop below normal and wind speeds increase, as this occurs,
the body is cooled at a faster rate than normal, causing the skin temperature to drop, which can lead to
frostbite (when body tissues freeze) and hypothermia (abnormally low body temperature, <95°F).
Extreme cold is measured by the wind chill temperature index. The index is based on heat loss from
exposed skin and includes a frostbite indicator.
In New Mexico, January is the coldest month. Day-time temperatures range from the mid-50s in the
southern and central valleys to the mid-30s in the north’s higher elevations. Minimum temperatures
below freezing are common throughout the state; however, subzero temperatures are rare, even in the
mountains.68
Minimum temperatures below freezing are common in all sections of the state during the winter.
Subzero temperatures are rare, except in the mountains. The lowest temperature ever officially
recorded was -50°F at Gavilan on February 1, 1951. An unofficial low temperature of -57°F at Ciniza was
reported by the press on January 13, 1963.69
The entire state of New Mexico experiences some form severe winter storm event. Based on the
topography of the state, such as elevation and land contours, this all plays a significant part in winter
weather affects a particular area. The effects of severe winter storm events vary according to the type of
hazard. Winter storms often have the effect of disrupting transportation and commerce. Injury to
people and property result from heavy loads of snow and ice causing collapse of roofs of buildings,
67
http://www.weather.com/outlook/recreation/ski/tools/windchill/ 68
Western Region Climate Center http://www.wrcc.dri.edu/narratives/NEWMEXICO.htm 69
http://www.wrcc.dri.edu/narratives/NEWMEXICO.htm

November 2015
142
falling trees and telephone poles, knocking down electrical lines, and creating slippery conditions for
pedestrians and vehicles.
Previous Occurrences
The State of New Mexico experiences severe winter storm events annually. Referencing the NCDC, the
six counties with UNM properties experienced a total of 32 winter storm events between April 1, 2000
and July 20, 2015.70 For the same time period, 3 deaths and $50,000 in property damage were reported.
Table 51 briefly explains those significant winter storm events that have occurred. Source information is
from the NCDC and data provided by local authorities.
Table 51: Significant Past Occurrences - Severe Winter Storms
Date Name/Location Significant Event
December 24, 2011 Albuquerque, NM
Preparedness Area 5
A major winter storm event moving through the Albuquerque Metro area caused the shutdown of I-25 / I- 40 for over 18 hours stranding passengers.
December 15, 2008
Upper Rio Grande Valley
Preparedness Area 5
A deep low pressure area centered over California continued to pump moisture into Mew Mexico on the 15th and 16th. A strong short wave trough ejected out of the low and helped bring widespread, heavy snow to much of the area near and north of Interstate 40. Eight to 12 inches of snow fell over much of the Upper Rio Grande Valley. Two deaths was reported from this storm event.
December 16, 2008 Upper Rio Grande
Preparedness Area 3
8 – 10 inches of snow fell on “much of the Upper Rio Grande”. Two fatalities were reported.
December 25, 2006 Preparedness
Area 2, 3 and 5
A storm spinning over New Mexico for nearly 36 hours dumped up to 36 inches of snow, stranding New Mexicans in their homes and forced the closure of roads across the state. Most highways including I-25 and I-40 were closed for extensive periods. The National Guard preformed training missions to airlift supplies to trapped residents and hay to stranded livestock for five days afterward. Eighteen counties reported storm related damages, as snow remained on the ground until January 12. The Governor issued a State Declaration of emergency. Estimated response costs are up to $5 million. The Governor made a request to FEMA for a Presidential Disaster Declaration.
70
NCDC event type search included: Cold/Wind Chill, Extreme Cold/Wind Chill, Frost/Freeze, Winter Storm, and Winter Weather

November 2015
143
Date Name/Location Significant Event
January 1, 2001 McKinley County
Preparedness Area 4
A slow-moving winter storm howled into northern and central New Mexico with gusty winds and heavy snow, which closed state highways and many rural roads and contributed to two deaths from exposure. Tribal police found one body just north of Gallup and another near Bluewater. The storm produced 18 to 36 inches of heavy snow that engulfed snow removal and closed roads from the eastern Sangre de Cristo Mountains south over Las Vegas into the central highlands to Vaughn and Corona and westward over the Estancia Valley and the east slope communities of the Sandia and Manzano Mountains. Some residents remained trapped in their homes for 4-5 days before enough snow removal opened both the major and minor county roads. A state of emergency was declared in several counties including Mora, San Miguel and Torrance.
January 1997
Albuquerque, NM Preparedness
Area 5
Winter storms produced widespread heavy snow and icy roads across much of New Mexico. Icy roads were the direct cause of numerous auto mishaps as road conditions deteriorated very quickly. At least two fatal accidents were directly related to the weather, with weather an indirect cause of a third fatal crash. A car spun while in snow south of Carrizozo and collided with a school bus killing a 27- year-old passenger. A passenger was also killed near Tucumcari when a van slid off the road in a snowstorm and overturned several times. A 30 year old woman and her 3 year old son were also killed when their automobile crashed into the rear a semi-truck stopped at the end of traffic tie-up about 15 miles west of Grants. In Rio Rancho, an elderly woman slipped and fell on ice in her driveway January 13; she could not get up and died of exposure before anyone found her. The interstate had been closed 3 miles away to clear other accidents. Roads were snow packed and icy. Snow totals in many areas averaged 7 inches with amounts of 10 to 19 inches reported on the Highlands between Edgewood and Santa Rosa and south to Carrizozo. Amounts of 14 inches were also recorded near Zuni and Pietown in west central sections of the state. Many rural roads remained snow clogged for several days and large sections of the interstate highways leading to Albuquerque in all directions were closed overnight until late on the 16th.

November 2015
144
Declared Disasters from Severe Winter Storm, Snow Storm and Freeze
NMDHSEM reports 10 State Declared Disasters for severe winter storms between 2003 and 2013. This
number is based on how many Executive Orders were signed by the Governor for severe winter storm,
snow storm and freeze. According to DHSEM records, the total cost for State declared flood events from
2003 - 2012 was $6,052,869 (Table 52). The total does not reflect all costs for Executive Order 09-048
which is still being tallied. The data is not broken out by County or Preparedness Area.
Table 52: State Disaster Event Information 2003 through 2012
Event Type State Executive Order Dollar Loss
Severe Winter Storm 04-031 $176,513
Snow Storm 05-012 $384,269
Snow Storm 05-016 $906,396
Snow Storm 06-070 $2,013,953
Snow Storm 08-005 $1,386,815
Snow Storm 09-001 $71,427
Snow/Wind Storm 09-048** $54,040
Snow Storm 10-005 $209,456
Severe Cold 11-014 $750,000
Navajo Freeze 13-004 $100,000
Total 10 $6,052,869
One of the 10 State severe winter storm disasters was also a federally declared disaster Table 53. The
total Public Assistance dollar losses from federal, State and local government entities and all tribal
entities was $2,393,376. The State contributed 12.5% of the total cost for this disaster. Data is not
broken out by County or Preparedness Area. However, for this one disaster damage was calculated from
Preparedness Areas 1, 3, 5 and 6.
Table 53: Federal Disaster Event Information 2003 through 2012
Event Type/Name Event
Number Federal Share
State Share
Total Cost State % of
Total
Severe Winter Storm and Extreme Cold Temperatures
1962 $1,795,032 $299,172 $2,393,376 12.50%
Total 1 $1,795,032 $299,172 $2,393,376

November 2015
145
Another source of severe winter storm damage information is SHELDUS. Below is a tally of severe winter
storm damage as reported by SHELDUS broken out by County (Table 54). Data is reported by event and
is aggregated by county.
Table 54: SHELDUS History of Winter Weather Hazards (1995-2013)
County Name
Year Month Property Damage
Property Damage
(ADJ 2014) Injuries Fatalities Records
Bernalillo 1995 1 $0.00 $0.00 0.26 0 1
Bernalillo 1997 4 $65,217.39 $96,195.04 0 0 1
Bernalillo 1997 12 $131,578.95 $194,077.72 0 1 2
Bernalillo 1998 3 $2,500.00 $3,630.92 0 0 1
Bernalillo 1999 3 $8,333.33 $11,841.53 0 0 1
Bernalillo 1999 10 $16,666.67 $23,683.08 0 0 1
Bernalillo 2000 10 $8,333.33 $11,456.44 0 0 2
Bernalillo 2008 12 $0.00 $0.00 0 0.41 3
Bernalillo 2009 1 $0.00 $0.00 0 0.08 1
Bernalillo 2013 12 $0.00 $0.00 0 0.33 1
Los Alamos 1995 1 $0.00 $0.00 0.26 0 1
Los Alamos 1995 12 $0.00 $0.00 0.42 0 1
Los Alamos 1996 10 $0.00 $0.00 0 0.09 1
Los Alamos 1997 4 $65,217.39 $96,195.04 0 0 1
Los Alamos 1999 3 $8,333.33 $11,841.53 0 0 1
Los Alamos 2008 12 $0.00 $0.00 0 0.26 2
Los Alamos 2009 12 $1,538.46 $1,697.65 0 0 1
McKinley 1995 1 $0.00 $0.00 0.26 0 1
McKinley 1995 12 $0.00 $0.00 0.42 0 1
McKinley 1996 10 $0.00 $0.00 0 0.09 1
McKinley 1997 1 $0.00 $0.00 0 3 3
McKinley 1997 4 $65,217.39 $96,195.04 0 0 1
McKinley 1997 12 $0.00 $0.00 0 1 1
McKinley 1998 3 $2,500.00 $3,630.92 0 0 1
McKinley 1999 3 $8,333.33 $11,841.53 0 0 1
McKinley 2001 1 $0.00 $0.00 0 1 1
McKinley 2008 12 $0.00 $0.00 0 0.41 3
McKinley 2009 1 $0.00 $0.00 0 0.33 2
McKinley 2009 12 $1,538.46 $1,697.65 0 0 1
McKinley 2011 1 $0.00 $0.00 0 0.5 2
McKinley 2011 2 $0.00 $0.00 0 0.165 1
McKinley 2013 11 $12,500.00 $12,702.78 0.25 0.25 1
Sandoval 1995 1 $0.00 $0.00 0.26 0 1
Sandoval 1995 12 $0.00 $0.00 0.42 0 1

November 2015
146
County Name
Year Month Property Damage
Property Damage
(ADJ 2014) Injuries Fatalities Records
Sandoval 1996 10 $0.00 $0.00 0 0.09 1
Sandoval 1997 4 $65,217.39 $96,195.04 0 0 1
Sandoval 1997 12 $131,578.95 $194,077.72 0 0 1
Sandoval 1998 3 $2,500.00 $3,630.92 0 0 1
Sandoval 1999 3 $8,333.33 $11,841.53 0 0 1
Sandoval 1999 10 $16,666.67 $23,683.08 0 0 1
Sandoval 2000 10 $8,333.33 $11,456.44 0 0 2
Sandoval 2008 12 $0.00 $0.00 0 0.41 3
Sandoval 2009 1 $0.00 $0.00 0 0.08 1
Sandoval 2009 12 $1,538.46 $1,697.65 0 0 1
Sandoval 2013 12 $0.00 $0.00 0 0.33 1
Socorro 1995 1 $0.00 $0.00 0.26 0 1
Socorro 1997 4 $65,217.39 $96,195.04 0 0 1
Socorro 1997 12 $131,578.95 $194,077.72 0 0 1
Socorro 1998 3 $2,500.00 $3,630.92 0 0 1
Socorro 1999 3 $8,333.33 $11,841.53 0 0 1
Socorro 1999 10 $16,666.67 $23,683.08 0 0 1
Socorro 2000 10 $8,333.33 $11,456.44 0 0 2
Socorro 2008 12 $0.00 $0.00 0 0.41 3
Socorro 2009 1 $0.00 $0.00 0 0.08 1
Socorro 2009 12 $1,538.46 $1,697.65 0 0 1
Taos 1995 1 $0.00 $0.00 0.26 0 1
Taos 1995 12 $0.00 $0.00 0.42 0 1
Taos 1996 10 $0.00 $0.00 0 0.09 1
Taos 1997 4 $65,217.39 $96,195.04 0 0 1
Taos 1997 12 $0.00 $0.00 0 1 1
Taos 1998 3 $2,500.00 $3,630.92 0 0 1
Taos 1999 3 $8,333.33 $11,841.53 0 0 1
Taos 1999 10 $16,666.67 $23,683.08 0 0 1
Taos 2008 12 $0.00 $0.00 0 0.26 2
Taos 2009 1 $0.00 $0.00 0 0.08 1
Taos 2009 12 $1,538.46 $1,697.65 0 0 1
Taos 2013 12 $8,333.34 $8,468.52 0 0 1
Frequency
No part of the state is immune from the severe winter storms, whether extreme cold, heavy snow, ice
storm, or other cold weather condition. The mountainous areas of the state, which includes all

November 2015
147
Preparedness Areas, are more likely to receive snow and cold than the plains and desert, and residents
of high altitude areas are more likely to be prepared for these conditions, even if they become extreme.
Probability of Future Occurrence
To determine the probability of New Mexico experiencing severe winter storms in the future, the
probability or chance of occurrence was calculated based on historical data identified the NCDC
database from a period of January 1, 2006 – December 1, 2012. Probability was determined by dividing
the number of events observed for each of the four NCDC categories by the number of months and
multiplying by 100. This gives the percent chance of the event happening in any given year. Table 60
provides the probability of future occurrence in each Preparedness Area based on the probability
formula. In addition, the column to the far right of Table 55 shows the overall winter storm probability
for all four categories for each Preparedness Area. Overall probability for winter storms was determined
by the number of events for all four NCDC categories for each Preparedness Area divided by the number
of months and multiplying by 100.
Table 55: Probability of Future Occurrence - Severe Winter Storms
Probability of Future Occurrence
Preparedness Area Extreme
Cold/Wind Chill Freezing
Fog Heavy Snow
Winter Storm
Overall Winter Storm
Preparedness Area 1 .01% 3.6% 42% 8.3% 55.4%
Preparedness Area 2 1.2% 0% 3.6% 0% 4.8%
Preparedness Area 3 1.2% 0% 1.2% 0% 2.4%
Preparedness Area 4 3.6% 0% 1.2% 0% 1.2%
Preparedness Area 5 1.2% 0% 11% 0% 12.0%
Preparedness Area 6 6.0% 0% 0% 0% 6.0%
Risk Assessment
Severe winter storms are difficult to predict precisely in pattern, frequency, and degree of severity. The
impact from severe winter storm events (heavy snowfall, blizzard, ice storm, freezing drizzle/freezing
rain, sleet, wind chill, and extreme temperatures) has been moderate with impact to widespread area of
crops and livestock depending on the time of year when it occurs. Highly vulnerable populations include
those in mobile home parks, recreational vehicles, and aged or dilapidated housing, but no area is safe.
Severe winter weather is much more likely to have a serious impact on major population centers and
transportation routes, most of which are not located in the high mountains. This actually occurred on
December 24, 2011 during a serve snow storm when motorists traveling through Albuquerque, NM
(Preparedness Area 5) interstate system were stranded for up to 18 hours. The plains and desert areas
are more susceptible to high winds that contribute to the drifting of snow, and a snow storm that would

November 2015
148
hardly be noticed in the higher altitudes could present a serious hazard to people in the lower altitudes.
If a severe winter storm were cause a power failure, as would be likely with an ice storm, the effect
could be very serious anywhere in the state. Any accumulation of ice or snow on the roads is a
hazardous situation and can lead to wide spread road and highway closures, that can strand motorists.
Table 56 outlines Impacts from severe winter storm events for each Preparedness Area to consider
when planning for these types of events.
Table 56: Severe Winter Storm Impacts
Subject Impacts
Health and Safety of The Public
Injuries and death have resulted from winter storm events. Individuals caught out doors can suffer frostbite, hypothermia, and death from low temperatures.
Health And Safety of Responders
Responders face the same impacts as the public.
Continuity of Operations
Travel to key facilities and places of employment may be impossible, and those entities may not be able to function.
Delivery of Services Facilities that are unable to be reached or if supply lines are blocked, widespread denial of services may result.
Property, Facilities, Infrastructure
Winter storms can cause ice to form on roads and bridges rendering them impassible, can accumulate on power lines and cause them to break, can cause water pipes to burst, and heavy snows can collapse roofs
Environment Winter storms can cause damages to trees and plants as well as to crops and animals.
Economic Condition The negative effects to the economic condition are generally from the damages the hazard causes to infrastructure and agriculture. Individuals and businesses can suffer unanticipated expenses.
Public Confidence Winter storms are an expected event in the state, but a slow response such as road clearing or restoration of utilities can cause an erosion of the public’s confidence in the government.
Data Limitations
Accurate methods to quantify potential future damages are not readily available. The amount of
business lost due to winter storms and road closures has not been calculated due to the difficulty of
attaining this information.
Summary of Impact to UNM
Winter storms occur frequently on an annual basis and impact all UNM Campuses. As with State and
County jurisdictions, all UNM campuses can be affected by winter storm events. The average snowfall
UNM campuses could receive ranges from 1 to 40 inches of snow. UNM Campuses located in higher
elevations (Los Alamos and Taos Campuses) could receive up to 60 inches in a given year.
The threat winter storm events pose is primarily to electric utilities when snow and ice-laden branches
fall across power lines, breaking them and interrupting service. Additionally, due to the location of our
rural Branch Campuses (Gallup, Los Alamos, Taos), access in and out can be limited due to roads

November 2015
149
becoming risky and or closed. The UNM Main Campus has maintained a list of past occurrences
highlighting their vulnerabilities in damages caused by winter storms. The probability of a winter storm
causing structure damage or risking life safety are considered low.

November 2015
150
Thunderstorms (including Lightning and Hail)
Hazard Characteristics
Thunderstorms are produced when warm moist air is overrun by dry cool air. As the warm air rises,
thunderheads form and cause strong winds, lightning, hail, and heavy rains. Atmospheric instability can
be caused by surface heating or by upper tropospheric (>50,000 feet) divergence. Rising air parcels can
also result from airflows over mountainous areas. Generally, the former “air mass” thunderstorms form
on warm-season afternoons and are not severe. The latter “dynamically-driven” thunderstorms, which
generally form in association with a cold front or other regional atmospheric disturbance, can become
severe, thereby producing strong winds, frequent lightning, hail, downburst winds, heavy rain, and
occasional tornadoes.
All UNM Campuses and properties experience thunderstorms. According to NWS, the thunderstorm
season in New Mexico begins over the high plains in the eastern part of the state in mid to late April,
peaks in May and June, declines in July and August, and then drops sharply in September and October.
In the western part of the state, thunderstorms are infrequent during April, May, and June, increase in
early July and August, and then decrease rapidly in September. Over the central mountain chain,
thunderstorms occur almost daily during July and August, especially over the northwest and north
central mountains.
Thunderstorms tend to have different characteristics in different regions of the state. Across the eastern
plains, thunderstorms tend to be more organized, long-lived, and occasionally severe, producing large
hail, high winds, and tornadoes. Thunderstorms in the western part of the state tend to be less severe
on average, occasionally producing life-threatening flash floods and small hail accumulations. Most of
the storms in western New Mexico are associated with the southwest monsoons, which mainly produce
flash floods.
Severe thunderstorms are reported each year in nearly all New Mexico counties. The NWS definition of
a severe thunderstorm is a thunderstorm with any of the following attributes: downbursts with winds of
58 miles (50 knots) per hour or greater (often with gusts of 74 miles per hour or greater), hail 0.75 of an
inch in diameter or greater, or a tornado. Typical thunderstorms can be 3 miles wide at the base, rise to
40,000-60,000 feet into the troposphere, and contain half a million tons of condensed water.
Thunderstorm frequency is measured in terms of incidence of thunderstorm days or days on which
thunderstorms are observed. Any county (or Preparedness Area) may experience 10 or more
thunderstorm days per year. According to the NWS Publication, Storm Data, in the past 30 years New
Mexico has experienced over 50 reported events 75 mph or higher associated with thunderstorms, with
a single occurrence of 115 mph winds. This means that in New Mexico winds similar to a Category 1
Hurricane (Saffir-Simpson Scale) are experienced on average about 1 day every 1.5 years.
Lightning is defined as a sudden and violent discharge of electricity, usually from within a thunderstorm,
due to a difference in electrical charges. Lightning is a flow of electrical current from cloud to cloud or
cloud to ground. Nationwide, lightning is the cause of extensive damage to buildings and structures,
death or injury to people and livestock, the cause of wildfires, and the disruption of electromagnetic

November 2015
151
transmissions. Lightning is extremely dangerous during dry lightning storms because people often
remain outside, rather than taking shelter.
To the general public, lightning is often perceived as a minor hazard. However, lightning-caused damage,
injuries, and deaths establish lightning as a significant hazard associated with any thunderstorm.
Damage from lightning occurs four ways:
1. Electrocution or severe shock of humans and animals;
2. Vaporization of materials along the path of the lightning strike;
3. Fire caused by the high temperatures (10,000-60,000°F); and
4. A sudden power surge that can damage electrical or electronic equipment.
Large outdoor gatherings (sporting events, concerts, campgrounds, etc.) are particularly vulnerable to
lightning strikes. New Mexico ranks sixth in the nation in lightning fatalities with 0.55 deaths per million
people annually. New Mexico ranks 22nd in lightning frequency overall.71
According to the National Weather Service, New Mexico suffered 90 lightning related fatalities between
1959 and 2011 (52 years). Overall New Mexico has a 100% probability of a lightning event every year
and there is a 100% chance of a lightning fatality each year. According to NWS, New Mexico experienced
614,898 lightning flashes in 2011. Between 1997 and 2011 the average number of lightning flashes
totaled 879,282 per year.72
Recent storms monitored by the New Mexico Institute of Mining and Technology produced between 65
and 1062 lightning flashes per minute. Additionally, lightning strikes the ground or objects on average
once in every five to 10 cloud flashes. Based on New Mexico Institute of Mining and Technology studies,
New Mexico routinely has thunderstorms that have between 13 and 106 lightning strikes per minute.
While the entire state is at risk for lightning events, some areas of the state have higher concentrations
of them.
71
http://www.lightningsafety.com/nlsi_lls/fatalities_us.html 72
http://www.lightningsafety.noaa.gov/stats/Table-Flashes_by_State_1997-2011.pdf

November 2015
152
Figure 38 shows areas of lightning density in the state. Based on the maps in Figure 38, higher
concentrations of lightning strikes occur in Preparedness Areas 1, 2, 5 and 6.
Figure 38: Lightning Density in New Mexico Preparedness Areas
UNM Taos
UNM Los Alamos
UNM Main
UNM Gallup
UNM Valencia
UNM Sevilleta
UNM West
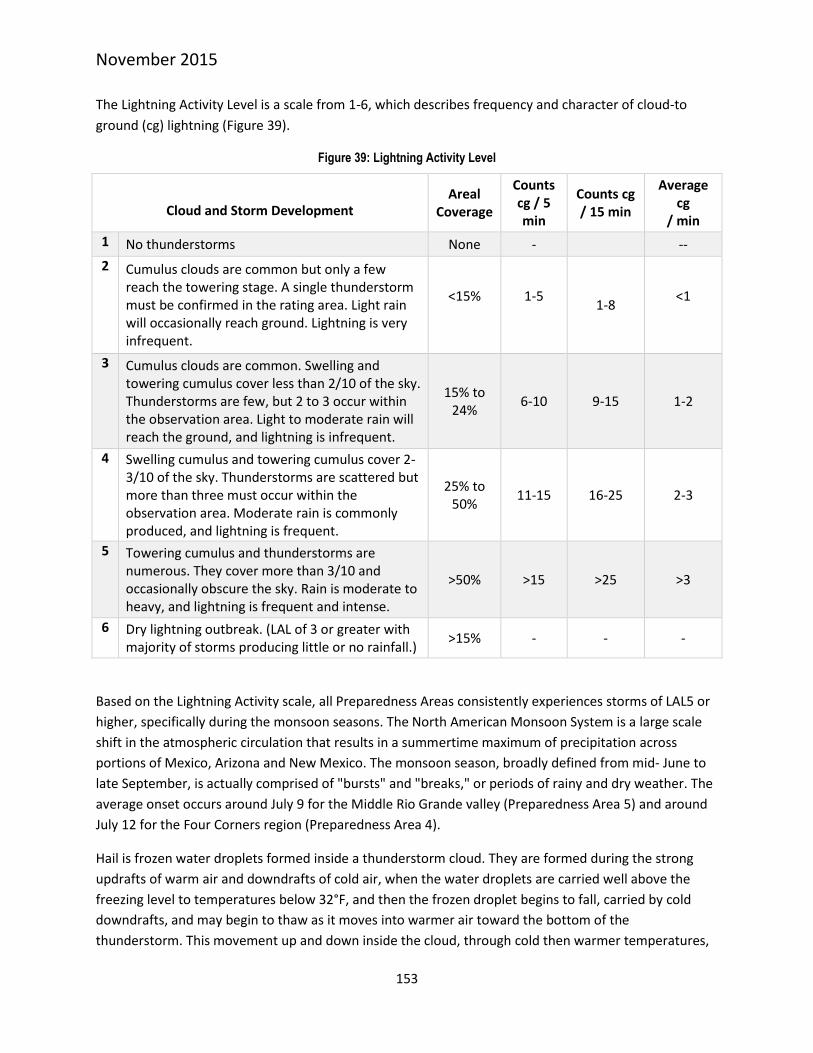
November 2015
153
The Lightning Activity Level is a scale from 1-6, which describes frequency and character of cloud-to
ground (cg) lightning (Figure 39).
Figure 39: Lightning Activity Level
Cloud and Storm Development Areal
Coverage
Counts cg / 5 min
Counts cg / 15 min
Average cg
/ min
1 No thunderstorms None - --
2
Cumulus clouds are common but only a few reach the towering stage. A single thunderstorm must be confirmed in the rating area. Light rain will occasionally reach ground. Lightning is very infrequent.
<15%
1-5
1-8 <1
3 Cumulus clouds are common. Swelling and towering cumulus cover less than 2/10 of the sky. Thunderstorms are few, but 2 to 3 occur within the observation area. Light to moderate rain will reach the ground, and lightning is infrequent.
15% to 24%
6-10 9-15 1-2
4 Swelling cumulus and towering cumulus cover 2- 3/10 of the sky. Thunderstorms are scattered but more than three must occur within the observation area. Moderate rain is commonly produced, and lightning is frequent.
25% to 50%
11-15 16-25 2-3
5 Towering cumulus and thunderstorms are numerous. They cover more than 3/10 and occasionally obscure the sky. Rain is moderate to heavy, and lightning is frequent and intense.
>50% >15 >25 >3
6 Dry lightning outbreak. (LAL of 3 or greater with majority of storms producing little or no rainfall.)
>15% - - -
Based on the Lightning Activity scale, all Preparedness Areas consistently experiences storms of LAL5 or
higher, specifically during the monsoon seasons. The North American Monsoon System is a large scale
shift in the atmospheric circulation that results in a summertime maximum of precipitation across
portions of Mexico, Arizona and New Mexico. The monsoon season, broadly defined from mid- June to
late September, is actually comprised of "bursts" and "breaks," or periods of rainy and dry weather. The
average onset occurs around July 9 for the Middle Rio Grande valley (Preparedness Area 5) and around
July 12 for the Four Corners region (Preparedness Area 4).
Hail is frozen water droplets formed inside a thunderstorm cloud. They are formed during the strong
updrafts of warm air and downdrafts of cold air, when the water droplets are carried well above the
freezing level to temperatures below 32°F, and then the frozen droplet begins to fall, carried by cold
downdrafts, and may begin to thaw as it moves into warmer air toward the bottom of the
thunderstorm. This movement up and down inside the cloud, through cold then warmer temperatures,

November 2015
154
causes the droplet to add layers of ice and can become quite large, sometimes round or oval shaped and
sometimes irregularly shaped, before it finally falls to the ground as hail.
Hail usually occurs during severe thunderstorms, which also produce frequent lightning, flash flooding
and strong winds, with the potential of tornadoes. The hail size ranges from smaller than a pea to as
large as a softball, and can be very destructive to buildings, vehicles and crops. Even small hail can cause
significant damage to young and tender plants. Hail usually lasts an average of 10 to 20 minutes but may
last much longer in some storms. Hail causes $1 billion in damage to crops and property each year in the
U.S. The costliest hailstorm in the United States was in Denver in July 1990 with damage of $625 million.
No part of the state is immune to hailstorms. Once the summer monsoon starts, thunderstorms often
develop in the afternoons and evenings. Mountainous areas usually see more storms than the plains
and desert, although mountain storms tend to be less severe and produce smaller hail. In the plains and
over the desert, monsoon thunderstorms sometimes reach severe levels and can produce large hail.
Table 62 shows hail sizes and possible damages from hail events.
According to the NWS, oversized and severe hailstorms occur most frequently in May, followed by June,
July, and April. Most counties across the eastern half of the state will see large hail ranging from golf ball
to softball at least 6 to 8 times during the spring and also during the summer thunderstorm season.
Smaller hail is much more frequent and common in all counties across the east. Counties in the central
and western areas will see damaging hail at least twice each year. Hail the size of baseballs or softballs
has been reported near Albuquerque, Santa Fe and Las Cruces within the past 3 to 6 years. The Socorro
hail storm in October 2004 caused nearly 40 million dollars in damage from baseball sized hail.73
73
Source: http://www.srh.noaa.gov/abq/?n=prephazards

November 2015
155
Table 57 combines the NOAA and TORRO hailstorm intensity scales as a way of describing the size of hail
based on the intensity and diameter of the hail.74
Table 57: Combined NOAA/TORRO Hailstorm Intensity Scale
Combined NOAA/TORRO Hailstorm Intensity Scales
Intensity Category
Typical Hail
Diameter (mm)*
Probable Kinetic
Energy, J- m2
Description Typical Damage Impacts
H0 Hard Hail 5 0-20 Pea No damage
H1 Potentially Damaging
5-15 >20 Mothball Slight general damage to plants, crops
H2 Significant 10-20 >100 Marble, grape
Significant damage to fruit, crops, vegetation
H3 Severe 20-30 >300 Walnut Severe damage to fruit and crops, damage to glass and plastic structures, paint and wood scored
H4 Severe 25-40 >500 Pigeon’s
Egg > Squash ball
Widespread glass damage, vehicle bodywork damage
H5
Destructive 30-50
>800
Golf ball > Pullet’s egg
Wholesale destruction of glass, damage to tiled roofs, significant risk of injuries
H6 Destructive 40-60
Hen’s egg Bodywork of grounded aircraft dented, brick walls pitted
H7 Destructive 50-75 >800 Tennis ball > cricket
ball
Severe roof damage, risk of serious injuries
H8 Destructive 60-90 >800 Large
orange > Softball
(Severest recorded in the British Isles) Severe damage to aircraft bodywork
H9 Super
Hailstorms 75-100 >800 Grapefruit
Extensive structural damage. Risk of severe or even fatal injuries to persons caught in the open
H10 Super
Hailstorms >100 >800 Melon Extensive structural
Previous Occurrences
Thunderstorm activity in New Mexico is consistent due to seasonal meteorological patterns and local
topographical conditions. The entire state is susceptible to a full range of weather conditions, including
74
Source: Tornado and Strom Research Organization http://www.torro.org.uk/site/hscale.php
November 2015
156
thunderstorms, lightning and hail. All areas of state are susceptible to thunderstorm conditions,
although local topography, such as elevation and land contours, plays a significant part in how weather
affects a particular area. For the purpose of this report, all areas of the state are considered equally
vulnerable to all types of thunderstorm activity.
The impacts of thunderstorms vary according to the types of secondary hazards they produce.
Thunderstorms can cause substantial rainfall leading to localized flash flooding. Additionally,
thunderstorms can cause lightning strikes that have the potential to ignite wildfires and lead to injury
and death. Hailstorms are another potential result of thunderstorms and they can sometimes damage
agricultural crops and cause property damage.
Referencing the NCDC database, from January 2000 to July 30, 2015, 240 thunderstorm events
(including lightening and hail) have caused 1 death, 15 injuries, and $54.170 million in property damage.
New Mexico averages 25 thunderstorm events per year. Essentially New Mexico has a 100% probability
of a thunderstorm, and .3% chance of a fatality from thunderstorms every year.
The following four Figures illustrate the number of hail storms in the state of New Mexico by hail size,
the number of hail storms by month of occurrence, and the number of recorded hail storms by county.
This information offers insight into potential high risk counties and particularly risky times of the year for
hail storms. Additionally, the data offers insight into the probability that the state will experience a high
number of large hail-stone events.

November 2015
157
Figure 40 shows the number of hail storms by County between 1955 and 2012.
Figure 40: Number of Hail Storms in New Mexico by County75
75
Source: http://www.srh.noaa.gov/abq/?n=svrwxclimo
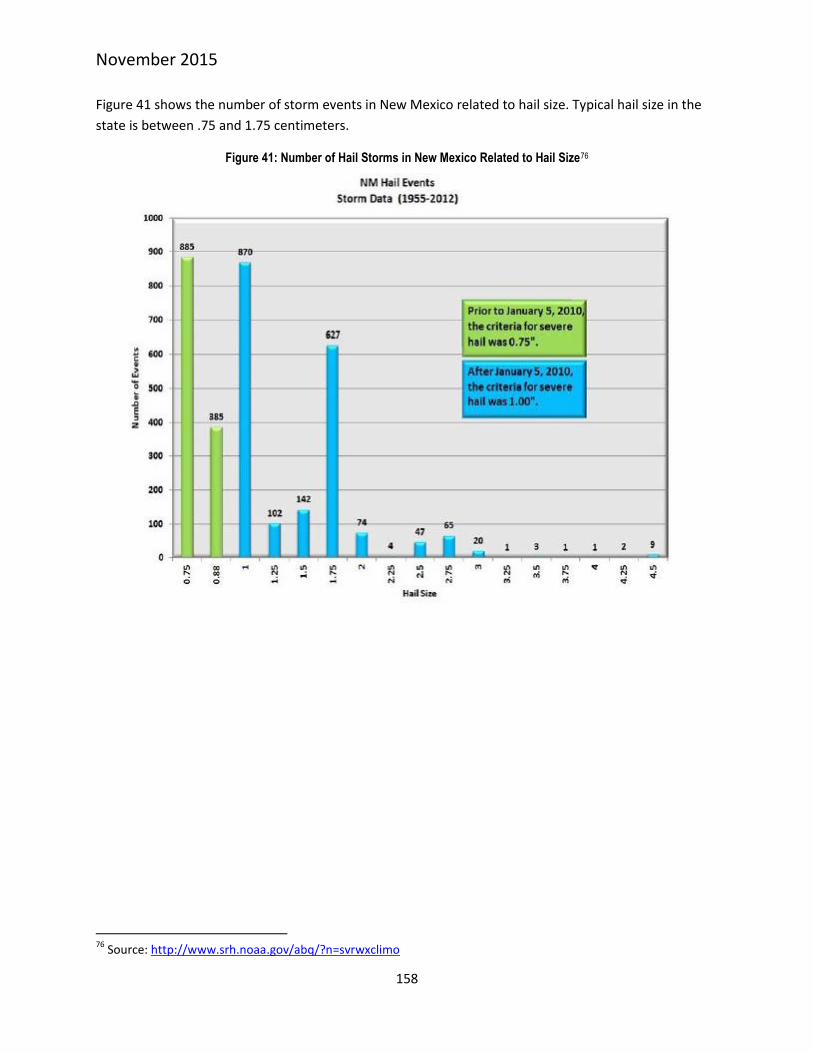
November 2015
158
Figure 41 shows the number of storm events in New Mexico related to hail size. Typical hail size in the
state is between .75 and 1.75 centimeters.
Figure 41: Number of Hail Storms in New Mexico Related to Hail Size76
76
Source: http://www.srh.noaa.gov/abq/?n=svrwxclimo

November 2015
159
Figure 42, illustrates the number of hail storms in New Mexico by their month of occurrence. From the
data we see that hail events tend to occur between March and October with the majority of occurrences
being in May and June.
Figure 42: Number of Hail Storms in New Mexico Related to Month of Occurrence77
77
Source: http://www.srh.noaa.gov/abq/?n=svrwxclimo

November 2015
160
Figure 43 briefly explains the most significant thunderstorm events (includes lightning and hail) that
have occurred in the State of New Mexico from January 1, 2006 to December 1, 2012. The location of
the events are identified by city or county and Preparedness Area. Source information is from the NCDC
and data provided by local authorities.
Figure 43: Significant Thunderstorm Past Occurrence (2006 – 2012)
Date Location Significant Event
October 2, 2010 Cedar Crest, NM
Preparedness Area 5
A lone severe thunderstorm developed near San Felipe Pueblo and moved east-southeast along the east mountains. Hail up to 2 inches in diameter fell and devastated trees, roofs, windshields and windows across the area. Golf ball sized hail accumulated 2 inches deep on the ground. Over 200 houses sustained significant damage including roof and window damage. Multiple vehicles were also dented and damaged by the large hail. Over $6M in property damage was reported.
July 4, 2009 Bernalillo and
Sandoval counties Preparedness Area 5
A 26 year old man, was killed by a lightning strike in the parking lot of Rio Rancho High School before a fireworks show. His wife, 26, was also struck and sustained serious injuries. Their 4 kids, ranging from 18 months to 7 years in age, as well as the wife's 21 year old sister also sustained injuries. The family was headed for their vehicle to seek shelter from the storm.
August 17, 2006 Santa Fe, NM
Preparedness Area 3
Two men in their 20s were struck by lightning while standing on rebar rods at a Santa Fe construction site. One man recovered immediately, but the other had to be revived with CPR.
October 5, 2015
Socorro, Bernalillo, and Los Lunas
counties Preparedness Area 5
Strong thunderstorms developed during the mid-morning along the continental divide west of Albuquerque then swept eastward with brief hail again reaching the Albuquerque metro area. A trailing, southern storm that formed over west central Socorro County became intense as it reached the City of Socorro which was pounded by 5 to 10 minutes of baseball size hail with estimated terminal velocities of near 100 mph. This record hail storm produced widespread and intense damage to automobiles, broken windows and screens as well has destroying home and commercial roofs. Damage estimates included $15 million to the New Mexico Tech campus where nearly every building was damaged and the fleet of university vehicles was almost a total loss. County wide insurance claims had reached $40 million. The storm passed east into rural and unpopulated areas of Socorro County where it likely produced several small tornadoes.

November 2015
161
Analysis of the number of reported occurrences for the six counties with UNM branch campuses and
properties from 1994-2014 by the SHELDUS shows a clear concentration of thunderstorm activity in
Bernalillo and Sandoval counties. Table 58 provides an overview of the total number of thunderstorms
by each Preparedness Area.
Table 58: SHELDUS Thunderstorm History by county (1994-2014)
County Name
Year Month Property Damage
Property Damage
(ADJ 2014) Injuries Fatalities Records
Bernalillo 1994 1 $2,500.00 $3,993.52 0 0 1
Bernalillo 1995 9 $500.00 $776.70 0 0 1
Bernalillo 1997 7 $0.00 $0.00 1 0 1
Bernalillo 1998 8 $50,000.00 $72,618.40 0 0 1
Bernalillo 2001 7 $15,000.00 $20,051.05 0 0 1
Bernalillo 2003 9 $0.00 $0.00 2 0 1
Bernalillo 2004 6 $1,500.00 $1,879.85 0 0 1
Bernalillo 2004 10 $1,000,000.00 $1,253,234.52 0 0 1
Bernalillo 2006 8 $0.00 $0.00 1 0 1
Bernalillo 2008 2 $2,500.00 $2,748.87 0 0 1
Bernalillo 2008 5 $4,000.00 $4,398.20 0 0 2
Bernalillo 2008 10 $2,500.00 $2,748.87 0 0 1
Bernalillo 2009 7 $750.00 $827.61 0 0 1
Bernalillo 2010 7 $4,000.00 $4,342.66 0 0 1
Bernalillo 2013 6 $10,000.00 $10,162.22 0 0 1
Bernalillo 2013 7 $849,000.00 $862,772.37 0 0 8
Bernalillo 2014 6 $33,500.00 $33,500.00 0 0 3
Bernalillo 2014 8 $0.00 $0.00 2 0 1
Bernalillo 2014 9 $60,000.00 $60,000.00 0 0 2
Bernalillo 2014 10 $500.00 $500.00 0 0 1
McKinley 2003 7 $7,500.00 $9,649.57 0 0 1
McKinley 2005 8 $15,000.00 $18,182.49 0 0 1
Sandoval 1996 6 $20,000.00 $30,176.67 0 0 1
Sandoval 1999 6 $7,500.00 $10,657.39 0 0 1
Sandoval 2001 7 $10,000.00 $13,367.37 0 0 1
Sandoval 2002 9 $2,500.00 $3,289.83 0 0 1
Sandoval 2007 12 $50,000.00 $57,088.29 0 0 1
Sandoval 2010 5 $1,000.00 $1,085.67 0 0 1
Sandoval 2010 10 $500.00 $542.84 0 0 1
Socorro 1997 7 $30,000.00 $44,249.72 0 0 1
Socorro 1997 9 $200,000.00 $294,998.13 0 0 1
Socorro 1998 8 $5,000.00 $7,261.84 0 0 1
Socorro 2010 7 $1,500.00 $1,628.50 0 0 1

November 2015
162
County Name
Year Month Property Damage
Property Damage
(ADJ 2014) Injuries Fatalities Records
Socorro 2013 7 $10,000.00 $10,162.22 0 0 1
Taos 2008 5 $10,000.00 $10,995.48 0 0 1
Frequency
All UNM campuses and properties can be affected by thunderstorms, hail, and lightning. The state has
maintained a list of past thunderstorm occurrences highlighting their vulnerabilities as medium in
damage from hail and lightning strikes. Preparedness Area 5 has recorded only 49 events with almost
the same amount in damages. This can be contributed to this area being more dense population and
infrastructure.
Probability of Future Occurrence
During the spring, from April through June, storms are at a peak mainly in the eastern areas of the state.
Storms become more numerous statewide from July through August. Although the vulnerability is state
wide those areas with a larger vulnerability to the effects include those areas where the population is
concentrated and buildings are of older design.
To determine the probability of New Mexico experiencing thunderstorm occurrences, the probability or
chance of occurrence was calculated based on historical data identified the NCDC database from a
period of January 2006 to December 2012 (84 months). Probability was determined by dividing the
number of events observed by the number of years and multiplying by 100. This gives the percent
chance of the event happening in any given year. In applying this formula, Preparedness Areas
probabilities to the following hazards are identified in Table 59. Those Preparedness Areas with the least
probability of a Thunderstorm event occurring is in Preparedness Areas 3 and 4.
Table 59: Probability of Future Occurrence (Thunderstorm Events)
Probability of Future Occurrence
Preparedness Area Hail Heavy Rain Lightning Thunderstorm Wind
Preparedness Area 3 16% 0% 33% 7%
Preparedness Area 4 16% 33% 1.6% .3%
Preparedness Area 5 81% 16% 33% 3.6%
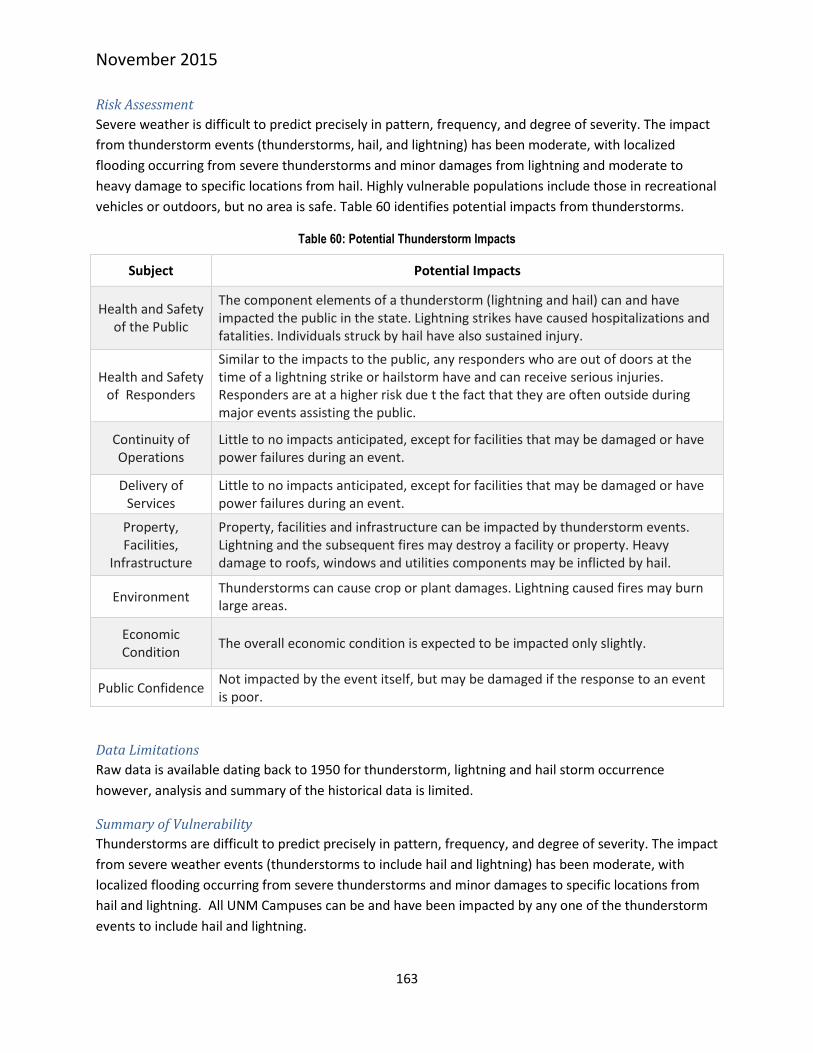
November 2015
163
Risk Assessment
Severe weather is difficult to predict precisely in pattern, frequency, and degree of severity. The impact
from thunderstorm events (thunderstorms, hail, and lightning) has been moderate, with localized
flooding occurring from severe thunderstorms and minor damages from lightning and moderate to
heavy damage to specific locations from hail. Highly vulnerable populations include those in recreational
vehicles or outdoors, but no area is safe. Table 60 identifies potential impacts from thunderstorms.
Table 60: Potential Thunderstorm Impacts
Subject Potential Impacts
Health and Safety of the Public
The component elements of a thunderstorm (lightning and hail) can and have impacted the public in the state. Lightning strikes have caused hospitalizations and fatalities. Individuals struck by hail have also sustained injury.
Health and Safety of Responders
Similar to the impacts to the public, any responders who are out of doors at the time of a lightning strike or hailstorm have and can receive serious injuries. Responders are at a higher risk due t the fact that they are often outside during major events assisting the public.
Continuity of Operations
Little to no impacts anticipated, except for facilities that may be damaged or have power failures during an event.
Delivery of Services
Little to no impacts anticipated, except for facilities that may be damaged or have power failures during an event.
Property, Facilities,
Infrastructure
Property, facilities and infrastructure can be impacted by thunderstorm events. Lightning and the subsequent fires may destroy a facility or property. Heavy damage to roofs, windows and utilities components may be inflicted by hail.
Environment Thunderstorms can cause crop or plant damages. Lightning caused fires may burn large areas.
Economic Condition
The overall economic condition is expected to be impacted only slightly.
Public Confidence Not impacted by the event itself, but may be damaged if the response to an event is poor.
Data Limitations
Raw data is available dating back to 1950 for thunderstorm, lightning and hail storm occurrence
however, analysis and summary of the historical data is limited.
Summary of Vulnerability
Thunderstorms are difficult to predict precisely in pattern, frequency, and degree of severity. The impact
from severe weather events (thunderstorms to include hail and lightning) has been moderate, with
localized flooding occurring from severe thunderstorms and minor damages to specific locations from
hail and lightning. All UNM Campuses can be and have been impacted by any one of the thunderstorm
events to include hail and lightning.

November 2015
164
Tornadoes
Hazard Characteristics
A tornado is an intense rotating column of air, extending from a thunderstorm cloud system. Average
winds in a tornado, although never accurately measured, are thought to range between 100 and 200
mph, but some may have winds exceeding 300 mph. The following are NWS definitions of a tornado and
associated terms:
Tornado – A violently rotating column of air that is touching the ground
Funnel cloud – A rapidly rotating column of air that does not touch the ground
Downburst – A strong downdraft, initiated by a thunderstorm, which induces an outburst of
straight-line winds on or near the ground. They may last anywhere from a few minutes in small
scale microbursts to periods of up to 20 minutes in larger, longer macro-bursts. Wind speeds in
downbursts can reach 150 mph and therefore can result in damages similar to tornado
damages.

November 2015
165
Tornadoes are classified by the degree of damage they cause. The tornado classification, shown in Table
61, is called the Fujita Scale. The Fujita Scale is used to rate the intensity of a tornado by examining the
damage caused by the tornado after it has passed over a man-made structure.
Table 61: Fujita Tornado Damage Scale78
Fujita Scale
F-Scale Number
Intensity Phrase
Wind Speed
Type of Damage
F0 Gale tornado 40-72 mph
Some damage to chimneys; breaks branches off trees; pushes over shallow-rooted trees; damages signboards.
F1 Moderate tornado
73-112 mph
The lower limit is the beginning of hurricane wind speed; peels surface off roofs; mobile homes pushed off foundations or overturned; moving autos pushed off the roads; attached
garages may be destroyed.
F2 Significant
tornado 113-157
mph
Considerable damage. Roofs torn off frame houses; mobile homes demolished; boxcars pushed over; large trees snapped
or uprooted; light object missiles generated.
F3 Severe
tornado 158-206
mph
Roof and some walls torn off well-constructed houses; trains overturned; most trees in forest uprooted
F4 Devastating
tornado 207-260
mph
Well-constructed houses leveled; structures with weak foundations blown off some distance; cars thrown and large
missiles generated.
F5 Incredible tornado
261-318 mph
Strong frame houses lifted off foundations and carried considerable distances to disintegrate; automobile sized missiles fly through the air in excess of 100 meters; trees
debarked; steel reinforced concrete structures badly damaged.
F6 Inconceivable
tornado 319-379
mph
These winds are very unlikely. The small area of damage they might produce would probably not be recognizable along with the mess produced by F4 and F5 wind that would surround the
F6 winds. Missiles, such as cars and refrigerators would do serious
secondary damage that could not be directly identified as F6 damage. If this level is ever achieved, evidence for it might only
be found in some manner of ground swirl pattern, for it may never be identifiable through engineering studies
78
Information provided by NOAA at http://www.spc.noaa.gov/faq/tornado/f-scale.html
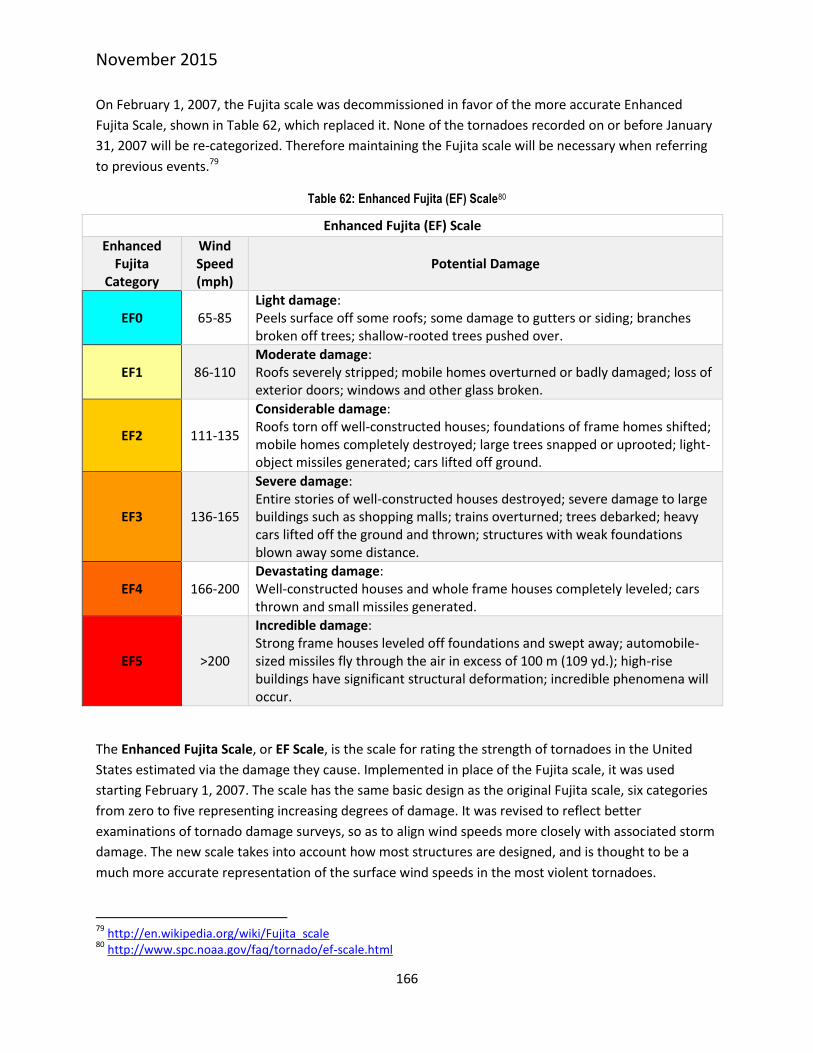
November 2015
166
On February 1, 2007, the Fujita scale was decommissioned in favor of the more accurate Enhanced
Fujita Scale, shown in Table 62, which replaced it. None of the tornadoes recorded on or before January
31, 2007 will be re-categorized. Therefore maintaining the Fujita scale will be necessary when referring
to previous events.79
Table 62: Enhanced Fujita (EF) Scale80
Enhanced Fujita (EF) Scale
Enhanced Fujita
Category
Wind Speed (mph)
Potential Damage
EF0 65-85 Light damage: Peels surface off some roofs; some damage to gutters or siding; branches broken off trees; shallow-rooted trees pushed over.
EF1 86-110 Moderate damage: Roofs severely stripped; mobile homes overturned or badly damaged; loss of exterior doors; windows and other glass broken.
EF2 111-135
Considerable damage: Roofs torn off well-constructed houses; foundations of frame homes shifted; mobile homes completely destroyed; large trees snapped or uprooted; light-object missiles generated; cars lifted off ground.
EF3 136-165
Severe damage: Entire stories of well-constructed houses destroyed; severe damage to large buildings such as shopping malls; trains overturned; trees debarked; heavy cars lifted off the ground and thrown; structures with weak foundations blown away some distance.
EF4 166-200 Devastating damage: Well-constructed houses and whole frame houses completely leveled; cars thrown and small missiles generated.
EF5 >200
Incredible damage: Strong frame houses leveled off foundations and swept away; automobile-sized missiles fly through the air in excess of 100 m (109 yd.); high-rise buildings have significant structural deformation; incredible phenomena will occur.
The Enhanced Fujita Scale, or EF Scale, is the scale for rating the strength of tornadoes in the United
States estimated via the damage they cause. Implemented in place of the Fujita scale, it was used
starting February 1, 2007. The scale has the same basic design as the original Fujita scale, six categories
from zero to five representing increasing degrees of damage. It was revised to reflect better
examinations of tornado damage surveys, so as to align wind speeds more closely with associated storm
damage. The new scale takes into account how most structures are designed, and is thought to be a
much more accurate representation of the surface wind speeds in the most violent tornadoes.
79
http://en.wikipedia.org/wiki/Fujita_scale 80
http://www.spc.noaa.gov/faq/tornado/ef-scale.html

November 2015
167
Tornadoes cause an average of 70 fatalities and 1,500 injuries in the U.S. each year. The strongest
tornadoes have rotating winds of more than 250 mph and can be one mile wide and stay on the ground
over 50 miles. Tornadoes may appear nearly transparent until dust and debris are picked up or a cloud
forms within the funnel. The average tornado moves from southwest to northeast, but tornadoes have
been known to move in any direction. The average forward speed is 30 mph but may vary from nearly
stationary to 70 mph.81
Damages from tornadoes result from extreme wind pressure and windborne debris. Because tornadoes
are generally associated with severe storm systems, they are often accompanied by hail, torrential rain,
and intense lightning. Depending on their intensity, tornadoes can uproot trees, bring down power lines,
and destroy buildings. Flying debris is the main cause of serious injury and death. New Mexico lies along
the southwestern edge of the nation's maximum frequency belt for tornadoes, often referred to as
“tornado alley,” which extends from the Great Plains through the central portion of the U.S. Broadly
speaking, the eastern portions of New Mexico have a higher frequency of tornadoes; however, every
county in the state has the potential to experience tornadoes. The publication “FEMA 320 Taking Shelter
from the Storm”, August 2008, presents a method where by residents can determine their tornado risk.
Table 63 describes the risks associated to tornadoes for determining shelter requirements.
Table 63: Tornado Risk Table as of December 201282
Wind Zone
I II III IV
Torn
ado
es
per
3,7
00
Sq
uar
e
Mile
s
<1 Low Risk
Low Risk Low Risk Moderate Risk
1-5 Low Risk
Moderate Risk High Risk High Risk
6-10 Low Risk
Moderate Risk High Risk High Risk
11-15 High Risk
High Risk High Risk High Risk
>15 High Risk
High Risk High Risk High Risk
Low Risk
Moderate Risk
High Risk
High-wind Shelters are a matter of homeowner preference
Shelter should be considered for
protection from high winds
Shelter is the preferred method of protection from
high winds
81
Source: http://www.noaawatch.gov/themes/severe.php 82
Source: FEMA publication “FEMA 320 Taking Shelter from the Storm”

November 2015
168
Previous Occurrences
Tornadoes have been verified in most New Mexico counties. The highest risk of tornadoes is in the east
during April through July, but tornadoes are possible with any thunderstorm. New Mexico averages
about 10 tornadoes in a year.
New Mexico experiences mostly weak, short-lived tornadoes. Strong tornadoes, while rare, are possible
and occur about once every 10 years. 75 percent of severe storms with tornadoes occur in eastern New
Mexico and are most likely to occur between April and July. However, the latest tornado fatalities in
New Mexico occurred on March 23, 2007 when two people died, 1 near Clovis (and 33 were injured) and
one in Quay County. Another fatality occurred west of Albuquerque in October 1974 and a rare winter
tornado was reported southwest of Roswell in December 1997. This shows that tornadoes can be deadly
at any time and nearly anywhere within the state, even at both low and high elevations.
NCDC reports 33 tornado and funnel cloud events between January 1, 1950 and July 30, 2015 with 0
deaths and injuries and $566 thousand dollars in property damage. UNM has experienced zero
significant tornado events.
Declared Disasters from Tornado
NMDHSEM reports one State Declared Disaster for tornado between 2003 and 2013. This number is
based on how many Executive Orders were signed by the Governor. According to NMDHSEM records,
the total cost for the 2007 State declared tornado was $848,660. Research into damage amount per
County has yet to be completed. However, all damage associated with this Executive Order was
sustained within Preparedness Area 1. There were no federal disaster declarations for tornado from
2003 through 2012.
According to SHELDUS there have been 2 tornados in counties with UNM campuses and properties.
Table 64: SHELDUS History of Tornado and Funnel Cloud Events (1994-2014)
County Name
Hazard Year Month Property Damage
Property Damage
(ADJ 2014) Injuries Fatalities Records
Socorro Tornado 2012 5 $1,000.00 $1,031.11 0 0 1
Taos Tornado 2009 7 $10,000.00 $11,034.74 0 0 1
Frequency
The State of New Mexico experiences some tornado activity annually, based on seasonal meteorological
patterns and local topographical conditions. New Mexico's complex terrain favors the formation of
numerous small landspouts, a weak and short-lived variation of the tornado similar to a dust devil.
Landspouts may form without the presence of a strong thunderstorm. The complex terrain in New
Mexico, ranging from the eastern plains, to the high mountains across the northern and western
regions, creates weather regimes that change quickly over relatively short distances. Highway travelers,
especially truckers, hit by strong gusts of wind that can make driving hazardous. New Mexico

November 2015
169
experiences mostly weak, short-lived tornadoes. Strong tornadoes, while rare, are possible and occur
about once every 10 years.
Figure 44 provides an overview of the number of tornado events by month in New Mexico. Based on the
data collected by the National Weather Service – Albuquerque, tornado frequency is seen most in the
May and June time frame. This is consistent with the NWS’s assessment in that:
During the spring, from April through June, storms are at a peak mainly in the eastern areas of
the state. Storms become more numerous statewide from July through August.
Tornadoes have been verified in most New Mexico counties. The highest risk of tornadoes is in
the east during April through July, but tornadoes are possible with any thunderstorm. New
Mexico averages about 10 tornadoes in a year.
Figure 44: NM Tornado Events by Month as of January 2011
Probability of Future Occurrence
To determine the probability of each Preparedness Area experiencing future tornado occurrences, the
probability or chance of occurrence was calculated based on historical data identified in the NCDC.
Probability was determined by dividing the number of events observed by the number of years and

November 2015
170
multiplying by 100. This gives the percent chance of the event happening in any given year. Table 65
provides the probability of each Preparedness Area experiencing a tornado event in any given year.
Table 65: NM Tornado Events by Month as of January 2011
Probability of Future Occurrence
Preparedness Area Tornado
Preparedness Area 3 86%
Preparedness Area 4 0%
Preparedness Area 5 14%
Risk Assessment
Based on the assessment from data collected in Table 70, Preparedness Area 3 is at risk to experience a
tornado event in any given year is great then those in the Preparedness Areas 4 or 5. For those
Preparedness Areas with the greatest risk, assessments should be taken in consideration and determine
what mitigation actions are appropriate for that location. Risks for consideration include manufactured
homes that are not adequately anchored are the most vulnerable structures for damage from tornado
events. Other risks for consideration include:
Environmental Risks: Tornadoes pose several risks to the environment. The potential for property
damage and disruption of vital, natural resources as a result of a tornado is often very high and
increases in proportion to the strength of the storm. Tornadoes produce winds that are strong enough
to destroy whole towns. These storms can damage water treatment facilities, block roadways, and
destroy animal habitats.
Biological Risks: Tornadoes also pose great risks to living things. The most powerful tornadoes are
capable of killing hundreds of people. People are not only killed by the strong winds, flooding and
debris, but also by fires, exposure to the elements and loss of electricity. Endangered animals and plants
in national parks and forests are also killed during tornadoes.
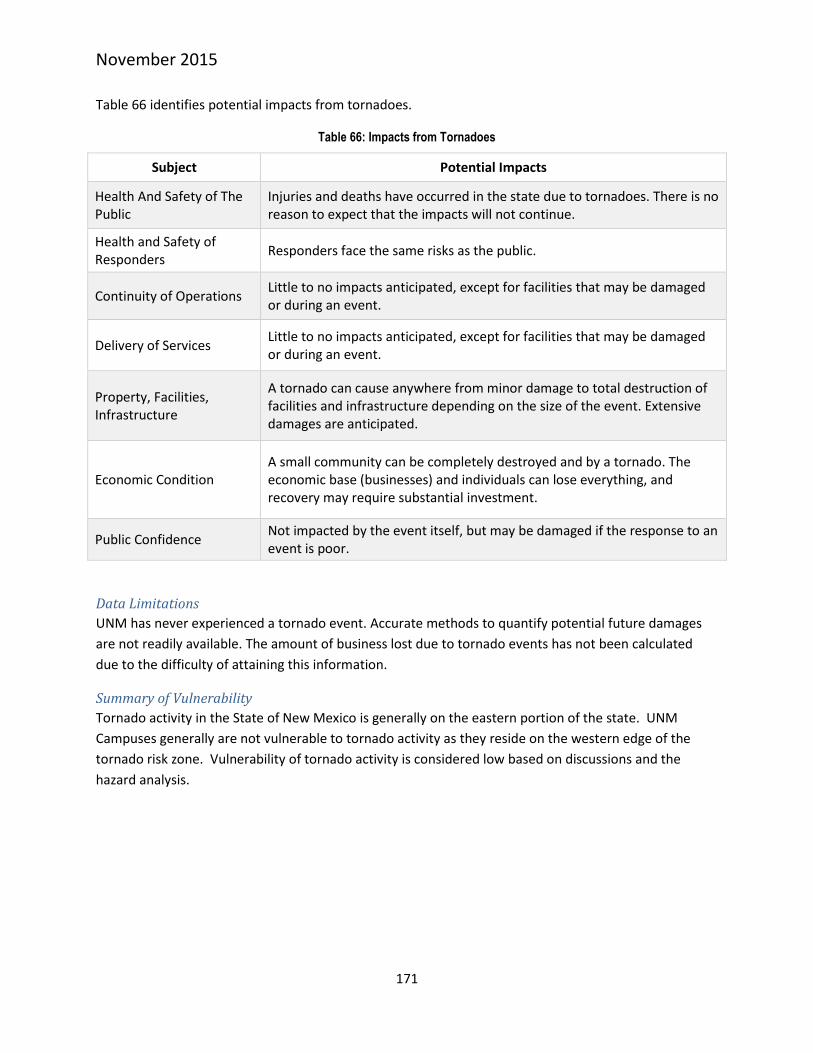
November 2015
171
Table 66 identifies potential impacts from tornadoes.
Table 66: Impacts from Tornadoes
Subject Potential Impacts
Health And Safety of The Public
Injuries and deaths have occurred in the state due to tornadoes. There is no reason to expect that the impacts will not continue.
Health and Safety of Responders
Responders face the same risks as the public.
Continuity of Operations Little to no impacts anticipated, except for facilities that may be damaged or during an event.
Delivery of Services Little to no impacts anticipated, except for facilities that may be damaged or during an event.
Property, Facilities, Infrastructure
A tornado can cause anywhere from minor damage to total destruction of facilities and infrastructure depending on the size of the event. Extensive damages are anticipated.
Economic Condition A small community can be completely destroyed and by a tornado. The economic base (businesses) and individuals can lose everything, and recovery may require substantial investment.
Public Confidence Not impacted by the event itself, but may be damaged if the response to an event is poor.
Data Limitations
UNM has never experienced a tornado event. Accurate methods to quantify potential future damages
are not readily available. The amount of business lost due to tornado events has not been calculated
due to the difficulty of attaining this information.
Summary of Vulnerability
Tornado activity in the State of New Mexico is generally on the eastern portion of the state. UNM
Campuses generally are not vulnerable to tornado activity as they reside on the western edge of the
tornado risk zone. Vulnerability of tornado activity is considered low based on discussions and the
hazard analysis.
November 2015
172
Wildland/Wildland - Urban Interface Fire
Hazard Characteristics
A wildfire means a fire burning uncontrolled on lands covered wholly or in part by timber, brush, grass,
grain or other inflammable vegetation. This is increasing the size of the wildland-urban interface (WUI),
defined as the area where structures and other human development meet or intermingle with
undeveloped wildland.
Topography, fuel, and weather are the three main factors that influence the behavior of a wildfire.
Topography can direct the course of a fire. Depressions, such as canyons, funnel air and act as chimneys,
intensifying the fire, causing a faster rate of spread. Saddles on ridge tops draw fires and steep slopes
can double the rate of spread, due to the close proximity of fuel (vegetation). The rate of spread is
generally stated in chains per hour, feet per minute, or meters per minute.
Fuel type, continuity of fuel, and the moisture content of the fuel all effect wildfire behavior. Continuity
of fuel applies both horizontally across the landscape and vertically, from the ground surface up to tree
crowns via the understory. Weather can have a profound influence on wildfires. Wind can direct the
course of a fire and increase the rate of spread. High temperatures and low humidity can intensify fire,
while low temperatures and high humidity can greatly limit the potential of a fire.
There are several types of wild fires. Prescribed fires are planned fires ignited by land managers to
accomplish specific natural resource improvement objectives. Fires that occur from natural causes, such
as lightning, that are then used to achieve management purposes under carefully controlled conditions
with minimal suppression costs are known as wildland fire use (WFU). Wildfires are unwanted and
unplanned fires that result from natural ignition, unauthorized human-caused fire, escaped WFU, or
escaped prescribed fire. A wildland-urban interface (WUI) fire is a wildfire occurring in areas where
structures and other human developments meet or intermingle with wildland vegetation-fuels. WUI
fires are a specific concern because they directly pose risks to human lives, property, structures, and
critical infrastructure more so than the other types of wildland fires.
A WUI fire involves areas where communities and wildland fuel intermix. Every fire season, catastrophic
losses occur as a result of wildfire in WUI areas throughout the western United States. Homes are lost,
businesses are destroyed, community infrastructure is damaged, and most tragically, lives are lost.
Precautionary action taken before a wildfire strikes often makes the difference between saving and
losing a structure. Creating a defensible space around homes, businesses, and other structures is an
important component in wildfire hazard reduction. Providing an effective defensible space can be as
basic as pruning trees, planting low-flammable vegetation, and cleaning up surface vegetation-fuels and
other hazards near a home. These efforts are typically concentrated at a minimum of 30 feet from a
building to increase the chance for structure survival and to create an area for firefighters to safely
work.
WUI studies suggest that the intense radiant heat of a wildfire is unlikely to ignite a structure that is
more than 30 feet away as long as there is no direct flame impingement. Studies of home survivability
indicate that homes with noncombustible roofs and a minimum of 30 feet of defensible space have an

November 2015
173
85-percent survival rate (Cohen and Saveland 1997). Conversely, homes with wood shake roofs and less
than 30 feet of defensible space have a 15 percent survival rate. During a wildfire, structures will burn,
wildlife will die or be injured due to burns or smoke inhalation, and death/injury to humans may occur.
Wildfires may also create mudslides, landslides by removing the vegetative covering along slopes, and
floods and flashfloods due to heat damaged soils that can resist water penetration.
Wildfires can occur at any time of day and during any month of the year, but the peak fire season in New
Mexico is normally from March through June. The length of the fire season and the peak months vary
appreciably from year to year. Land use, vegetation, amount of combustible materials present, and
weather conditions such as wind, low humidity, and lack of precipitation are the chief factors in
determining the number of fires and acreage burned. Generally, fires are more likely when vegetation is
dry from a winter with little snow and/or a spring and summer with sparse rainfall.
Wildfires are capable of causing significant injury, death, and damage to property. The potential for
property damage from fire increases each year as more recreational properties are developed on
forested land and increased numbers of people use these areas. Fires can extensively affect the
economy of an affected area, especially the logging, recreation, and tourism industries, upon which
many counties depend. Major direct costs associated with wildfires are the salvage and removal of
downed timber and debris and the restoration of the burned area. Additionally, agricultural production
and food processing systems are highly vulnerable to the effects of wildfire.
The indirect effects of wildfires can also be catastrophic. In addition to stripping the land of vegetation
and destroying forest resources, large, intense fires can harm the soil, waterways and the land itself. Soil
exposed to intense heat may lose its capability to absorb moisture and support life. If burned-out
woodlands and grasslands are not replanted quickly, widespread soil erosion, mudflows and siltation of
rivers could result, thereby enhancing flood potential, harming aquatic life and degrading water quality.
Lands stripped of vegetation by wildfires are also subject to increased landslide hazards. Smoke from
fires threatens air quality and can affect both human and livestock production and health.
Along the Rio Grande and other major rivers in the state occurs what is known as the “Bosque,” which is
a riparian forest ecosystem consisting largely of cottonwoods, willows, salt cedar, and other native and
invasive species. When these areas are stressed by drought, as has happened in recent years, they
become tinderboxes.
Land Ownership
Wildfires that occur in New Mexico affect lands of various ownership types including State, private,
Tribal and/or federal lands. Diverse and complex landownership presents many different challenges
when dealing with wildfires.
The majority of the land acreage in New Mexico is privately owned (44%). Approximately 34% of the
land is federally owned. Responsibility for stewardship and management of the forests and woodlands
in New Mexico falls primarily to federal agencies and about 43% of the State’s acreage is managed by
federal agencies. The primary federal agency that manages forest and woodland acreage in New Mexico
is the United States Forest Service; they manage 7.6 million acres (46% of all forest and woodland

November 2015
174
acreage). Approximately 7% of forest and woodlands are under State ownership, while Native American
tribes own 15%. Table 67 shows land ownership in total acres, forest acres and woodland acres. Percent
of total acres, forest acres and woodland acres is also presented.
Table 67: Land Ownership in New Mexico
Ownership Area
(acres) % of NM
Forest (acres)
Woodland (acres) % of NM
Forest & Woodland
Federal
Bureau of Land Management
13,481,000 17 97,800 2,161,100 10
Department of Defense
2,552,000 3 7,000 156,700 1
Bureau of Reclamation
54,500 <1 0 0 0
Fish and Wildlife Service
383,000 <1 1,500 42,600 0
National Park Service 379,000 <1 11,000 42,600 0
Forest Service 9,223,000 12 4,811,600 2,785,500 35
Other Federal 237,000 <1
0
Federal , Total 26,309,500 34 4,928,900 5,188,500 46
State 9,171,000 12 150,500 1,326,700 7
Private 34,157,000 44 1,654,800 5,617,600 33
Tribal 8,178,000 10 802,700 2,284,600 14
Local 3,000 <1 0 0 0
TOTAL 77,818,500 100 7,536,900 14,417,400 100
The State Forestry Division does not own and manage land within New Mexico, but works with partners
to promote healthy, sustainable forests in New Mexico through its various programs, encouraging
sustainable economic growth while protecting and enhancing watershed health and community safety.
The State Forestry Division provides technical and financial assistance to state, private, and tribal
landowners and land managers.83
Wildfires happen on private, municipal, County, State and/or federal lands. Ownership is made up of
private land owners, the State of New Mexico, Indian Reservations and the Federal Government which
include the Forest Service, Bureau of Land Management (BLM), Fish and Wildlife Service, National Park
Service, Bureau of Indian Affairs, Bureau of Reclamation and the Military. When wildfires happen they
either happen on private, state and/or federal lands. These wildfires are capable of causing significant
injury, death, and damage to property. The potential for property damage from fire, increases each
year, as more recreational and residential properties are developed on both non-forested and forested
83
New Mexico State Hazard Mitiagtion Plan (2010)

November 2015
175
land and because of the increase of people using these areas. With increased residential growth in or
near federal and state lands, both on forested and non-forested land areas and in or near the Bosque
areas (WUI), risk from catastrophic wildfire has increased dramatically. Private in holdings are being
developed with multiple structures and limited access. This growth has also increased the traffic on
roadways, resulting in safety concerns both for emergency response and urban interface fire
evacuations.
The only natural cause of wildfire is lightning; however, human carelessness and arson account for the
larger portion of all wildfires in the State. Table 68 below is based on State Forestry Division figures for
fires on State and private land in 2011 and 2012. Please note that Table 68 is based on State and private
land only.84
Table 68: Fires on State and private land in 2011 and 2012
Human Caused Fires Lighting Caused Fires
Number of Fires
% of Yearly
Number
Acres Burned
% of Yearly Acres
Number of Fires
% of Yearly
Number
Acres Burned
% of Yearly Total
2012 263 57% 20,403 80% 194 42% 5,073 20%
2011 706 63% 438,727 67% 411 37% 217,085 33%
Fires on federal land are tallied separately. Below is listing of human caused and lighting caused fires for
2011 and 2012 for the federal land management agencies in New Mexico (Table 69). These figures are
taken from the Southwest Coordination Center.
Table 69: Fires on Federal land (2011-2012)
Human Caused Fires Lightening Caused Fires
Agency Number of Fires
% of Yearly
Number
Acres Burned
% of Yearly Acres
Number of Fires
% of Yearly Number
Acres Burned
% of Yearly Acres
BIA 2011
203 80% 20,684 67 % 49 19% 9,896 32%
BIA 2012
119 70% 243 33% 51 30% 494 67%
BLM 2011
100 50% 50,677 49 % 100 50% 53,655 51%
BLM 2012
45 41% 998 56% 64 63% 771 44%
USFW 2011
3 75% 9 9% 1 25% 92 91%
USFW 2012
1 50% 1 1% 1 50% 66 99%
NPS 2011
1 33% 29,078 100% 2 66% 1 Less than
84
http://www.emnrd.state.nm.us/SFD/FireMgt/Historical.html

November 2015
176
Human Caused Fires Lightening Caused Fires
.01%
NPS 2012
0 - 0 - 8 100% 1,853 100%
USFS 2011
140 25% 265,924 88% 412 75% 35,872 12%
USFS 2012
135 36% 1,938 Less than .01%
242 63% 340,189 99%
Federal 2- year Totals
747
369,552
930 442,880
State 2- year Totals
969
459,130
605 222,158
Average per year
1,716 53% 828,682 55% 1,535 47% 665,038 45%
For general comparative purposes only, the State and private land fire data was collapsed with the
federal fire data. A total of 3,251 fires burned on federal, State and private land in 2011 and 2012. Of
that number, 1,716 (53%) were human-caused and 1,535 (47%) were lightning caused. A total of
1,493,720 acres burned on federal, State and private land in 2011 and 2012. Of that number, 828,682
acres (55%) were human-caused and 665,038 acres (45%) were lightning caused. From these figures, we
can generalize that more fires and more acres are burned from human caused fires than lightning.
Firefighters use several methods to express fire potential. Some of the indicators are:
Relative Humidity (RH): the ratio of the amount of moisture in the air to the amount of moisture
necessary to saturate the air at the same temperature and pressure. Relative humidity is expressed in
percent. RH is measured directly by automated weather stations or manually by wet and dry bulb
readings taken with a psychrometer and applying the National Weather Service, psychrometric tables
applicable to the elevations where the reading were taken.
Fuel moisture: Fuel moistures are measured for live Herbaceous (annual and perennial), Woody (shrubs,
branches and foliage) fuels, and Dry (dead) fuels. These are calculated values representing approximate
moisture content of the fuel. Fuel moisture levels are measured in 1, 10, 100 and 100-hour increments.
The Lower Atmosphere Stability Index or Haines Index: is computed from the morning (12Zulu)
soundings from Radiosonde Observation (RAOB) stations across North America. The index is composed
of a stability term and a moisture term. The stability term is derived from the temperature difference at
two atmosphere levels. The moisture term is derived from the dew point depression at a single
atmosphere level. This index has been shown to correlate with large fire growth on initiating and
November 2015
177
existing fires where surface winds do not dominate fire behavior. Haines Indexes range from 2 to 6 for
indicating potential for large fire growth:
2 Very Low Potential (Moist Stable Lower Atmosphere)
3 Very Low Potential
4 Low Potential
5 Moderate Potential
6 High Potential (Dry Unstable Lower Atmosphere)
Keetch-Byram Drought Index (KBDI): used to measure the effects of seasonal drought on fire potential.
The actual numeric value of the index is an estimate of the amount of precipitation (in 100ths of inches)
needed to bring soil back to saturation (a value of 0 being saturated). The index deals with the top 8
inches of soil profile so the maximum KBDI value is 800 (8 inches), the amount of precipitation needed
to bring the soil back to saturation. The index's relationship to fire is that as the index values increase,
the vegetation is subjected to greater stress because of moisture deficiency. At higher values, living
plants die and become fuel, and the duff/litter layer becomes more susceptible to fire.
KBDI = 0–200 - Soil moisture and large class fuel moistures are high and do not contribute much
to fire intensity. This is typical of spring dormant season following winter precipitation.
KBDI = 200–400 - Typical of late spring, early growing season. Lower litter and duff layers are
drying and beginning to contribute to fire intensity.
KBDI = 400–600 - Typical of late summer, early fall. Lower litter and duff layers actively
contribute to fire intensity and will burn actively.
KBDI = 600–800 - Often associated with more severe drought with increased wildfire
occurrence. Intense, deep burning fires with significant downwind spotting can be expected.
Live fuels can also be expected to burn actively at these levels.
The Energy Release Component (ERC): the estimated potential available energy released per unit area
in the flaming front of a fire. The day-to-day variations of the ERC are caused by changes in the moisture
contents of the various fuel classes, including the 1,000-hour time lag class. The ERC is derived from
predictions of the rate of heat release per unit area during flaming combustion and the duration of
flaming.
The Ignition Component: a number that relates the probability that a fire will result if a firebrand is
introduced into a fine fuel complex. The ignition component can range from zero, when conditions are
cool and damp, to 100 on days when the weather is dry and windy. Theoretically, on a day when the
ignition component registers a 60 approximately 60% of all firebrands that encounter wildland fuels will
require suppression action.

November 2015
178
The Spread Component: a numerical value derived from a mathematical model that integrates the
effects of wind and slope with fuel bed and fuel particle properties to compute the forward rate of
spread at the head of the fire. Output is in units of feet per minute. A Spread Component of 31 indicates
a worst-case, forward rate of spread of approximately 31 feet per minute. The inputs required in to
calculate the SC are wind speed, slope, fine fuel moisture (including the effects of green herbaceous
plants), and the moisture content of the foliage and twigs of living, woody plants. Since the
characteristics through which the fire is burning are so basic in determining the forward rate of spread
of the fire front, a unique SC table is required for each fuel type.85
Another is the International Fire Code Index (IFCI) (Table 70), which combines slope and fuel levels:
Table 70: Wildfire Susceptibility Matrix
FEMA/IFCI Wildfire Susceptibility Matrix
Fuel Class
Critical Fire Weather Frequency
<1 day per year 2-7 days per year 8+ days per year
Slope % Slope % Slope %
<40 41-40 61+ <40 41-40 61+ < 40 41-40 61+
Light M M M M M M M M H
Medium M M H H H H E E E
Heavy H H H H E E E E E
Note: M = Medium, H = High, E = Extreme. Source: International Fire Code Institute, January 2000
85
Source: http://www.nps.gov/nifc/public/pub_und_understandingfire.cfm
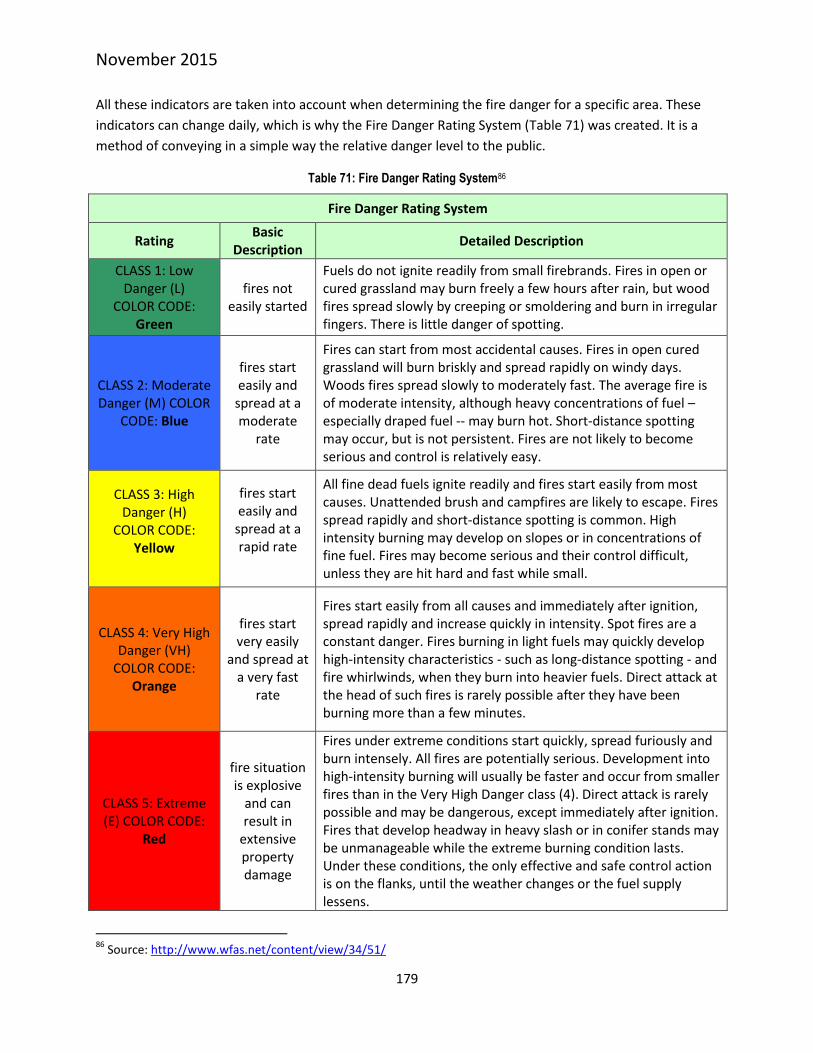
November 2015
179
All these indicators are taken into account when determining the fire danger for a specific area. These
indicators can change daily, which is why the Fire Danger Rating System (Table 71) was created. It is a
method of conveying in a simple way the relative danger level to the public.
Table 71: Fire Danger Rating System86
Fire Danger Rating System
Rating Basic
Description Detailed Description
CLASS 1: Low Danger (L)
COLOR CODE: Green
fires not easily started
Fuels do not ignite readily from small firebrands. Fires in open or cured grassland may burn freely a few hours after rain, but wood fires spread slowly by creeping or smoldering and burn in irregular fingers. There is little danger of spotting.
CLASS 2: Moderate Danger (M) COLOR
CODE: Blue
fires start easily and
spread at a moderate
rate
Fires can start from most accidental causes. Fires in open cured grassland will burn briskly and spread rapidly on windy days. Woods fires spread slowly to moderately fast. The average fire is of moderate intensity, although heavy concentrations of fuel – especially draped fuel -- may burn hot. Short-distance spotting may occur, but is not persistent. Fires are not likely to become serious and control is relatively easy.
CLASS 3: High Danger (H)
COLOR CODE: Yellow
fires start easily and
spread at a rapid rate
All fine dead fuels ignite readily and fires start easily from most causes. Unattended brush and campfires are likely to escape. Fires spread rapidly and short-distance spotting is common. High intensity burning may develop on slopes or in concentrations of fine fuel. Fires may become serious and their control difficult, unless they are hit hard and fast while small.
CLASS 4: Very High Danger (VH)
COLOR CODE: Orange
fires start very easily
and spread at a very fast
rate
Fires start easily from all causes and immediately after ignition, spread rapidly and increase quickly in intensity. Spot fires are a constant danger. Fires burning in light fuels may quickly develop high-intensity characteristics - such as long-distance spotting - and fire whirlwinds, when they burn into heavier fuels. Direct attack at the head of such fires is rarely possible after they have been burning more than a few minutes.
CLASS 5: Extreme (E) COLOR CODE:
Red
fire situation is explosive
and can result in
extensive property damage
Fires under extreme conditions start quickly, spread furiously and burn intensely. All fires are potentially serious. Development into high-intensity burning will usually be faster and occur from smaller fires than in the Very High Danger class (4). Direct attack is rarely possible and may be dangerous, except immediately after ignition. Fires that develop headway in heavy slash or in conifer stands may be unmanageable while the extreme burning condition lasts. Under these conditions, the only effective and safe control action is on the flanks, until the weather changes or the fuel supply lessens.
86
Source: http://www.wfas.net/content/view/34/51/

November 2015
180
Wildland Fire Readiness Levels
The State Forestry Division’s Fire Policy and Procedures established the Wildland Fire Readiness Levels
as a method for dictating the overall preparedness levels for the Division. District Foresters and District
Fire Management Officers shall assess the following criteria in determining readiness levels:
Current and long-range forecasted weather;
Current and forecasted fire behavior;
Current and trend of five-day average energy release component (ERC);
Comparison of current and trend of the seasonal ERC chart;
Southwest Area preparedness levels; and
Individual agency or district fire activity.
Because of the extreme geographical and topographical differences in the state, the Division’s districts
may be at different levels of fire readiness throughout the year District Foresters and District Fire
Management Officers shall determine fire readiness levels for their respective districts as determined by
the following criteria and notify the State Fire Management Officer of the situation.
FIRE READINESS LEVEL 1:
Most areas have low fire danger.
Fire activity is light (occasional A, B, and C class fires) and all wildland fires are of short duration,
usually lasting only one burning period.
Moisture content in light fuels is high and heavy fuels are moist.
State resources and interagency dispatch center cooperators are capable of handling fire
incidents with minimum staffing levels.
Initial attack forces are suppressing wildland fires.
There is little or no commitment of state resources besides volunteer fire departments.
ERC-5 day mean average is consistently below 30
FIRE READINESS LEVEL 2:
Fire danger is moderate.
Class A, B, and C fires may occur and the potential exists for escapes to become larger but only
have a potential duration of two burning periods.
Heavy fuels are drying; frontal system winds increase the potential for rapid fire spread over a
36 to 48 hour period.
State and volunteer fire department resources with limited assistance from the individual
dispatch centers are capable of handling the situation.
Fire department cooperators provide initial attack.
High wind warnings and “Red Flag” alerts the National Weather Service issues are indicators that
the districts may need additional resources.
ERC-5-day mean average is consistently between 30 and 45.

November 2015
181
FIRE READINESS LEVEL 3:
Generally, all agencies are experiencing high fire danger.
Numerous A, B, and C class fires, with a high potential for wildland fires to become Class D or
larger in size, that may require additional resources.
Light fuels are cured and heavy fuels are rapidly drying.
Fires are escaping initial attack on a consistent basis and require extended attack support.
The initial attack dispatch centers are requesting additional resources to increase initial attack
capabilities.
Federal cooperators provide critical initial attack and extended attack support during fire
suppression.
FEMA Fire Suppression Grants apply to urban/interface fires. The State Forester initiates FEMA
Presidential Emergency Declaration requests.
ERC-5 day mean average is consistently between 45 and 60.
FIRE READINESS LEVEL 4:
Division and cooperating agencies are experiencing very high or greater fire danger.
Numerous A, B, C, and D class fires that have the potential to exhaust dispatch area, state,
Southwest Area, and national resources are common within the region.
Division personnel implement and enforce fire restrictions.
The Division may have Type 1 and Type 2 Incident Management Teams committed to incidents
under this readiness level within the state.
ERC-5 day mean average is consistently between 60 and 80.
FIRE READINESS LEVEL 5:
All criteria for Fire Readiness Level 4 plus the following additional criteria are met:
Fire danger is extreme throughout the state and region;
Several dispatch centers and agencies are experiencing major fires and national resources are
exhausted;
Air resources are in short supply;
Fire restrictions require closures;
EOC is activated;
Area Command has been implemented;
High potential for catastrophic fires exists;
Extreme fire behavior, scarce resources, and extremely unsafe working conditions for fire
fighters hinder efforts of Type 1 and 2 Incident
Management Teams;
A multi-agency Coordination (MAC) Group is allocating resources to high priority fires; and
ERC-5 day average is consistently at or above 80.
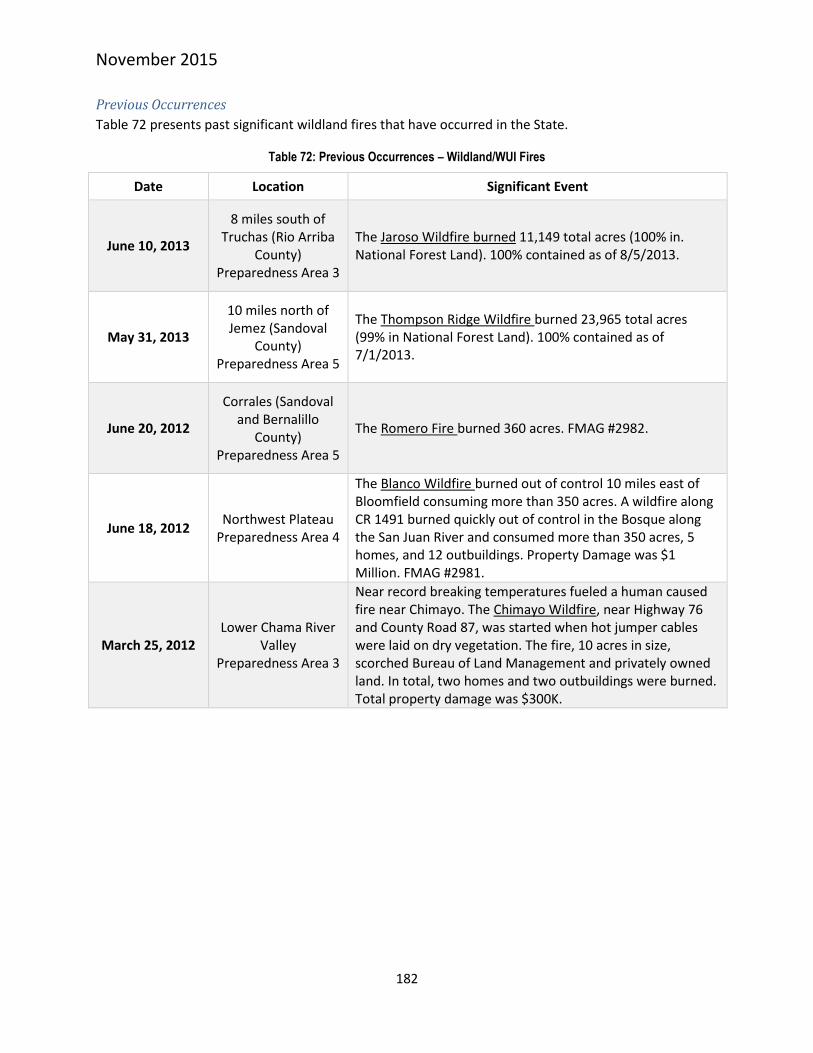
November 2015
182
Previous Occurrences
Table 72 presents past significant wildland fires that have occurred in the State.
Table 72: Previous Occurrences – Wildland/WUI Fires
Date Location Significant Event
June 10, 2013
8 miles south of Truchas (Rio Arriba
County) Preparedness Area 3
The Jaroso Wildfire burned 11,149 total acres (100% in. National Forest Land). 100% contained as of 8/5/2013.
May 31, 2013
10 miles north of Jemez (Sandoval
County) Preparedness Area 5
The Thompson Ridge Wildfire burned 23,965 total acres (99% in National Forest Land). 100% contained as of 7/1/2013.
June 20, 2012
Corrales (Sandoval and Bernalillo
County) Preparedness Area 5
The Romero Fire burned 360 acres. FMAG #2982.
June 18, 2012 Northwest Plateau
Preparedness Area 4
The Blanco Wildfire burned out of control 10 miles east of Bloomfield consuming more than 350 acres. A wildfire along CR 1491 burned quickly out of control in the Bosque along the San Juan River and consumed more than 350 acres, 5 homes, and 12 outbuildings. Property Damage was $1 Million. FMAG #2981.
March 25, 2012 Lower Chama River
Valley Preparedness Area 3
Near record breaking temperatures fueled a human caused fire near Chimayo. The Chimayo Wildfire, near Highway 76 and County Road 87, was started when hot jumper cables were laid on dry vegetation. The fire, 10 acres in size, scorched Bureau of Land Management and privately owned land. In total, two homes and two outbuildings were burned. Total property damage was $300K.
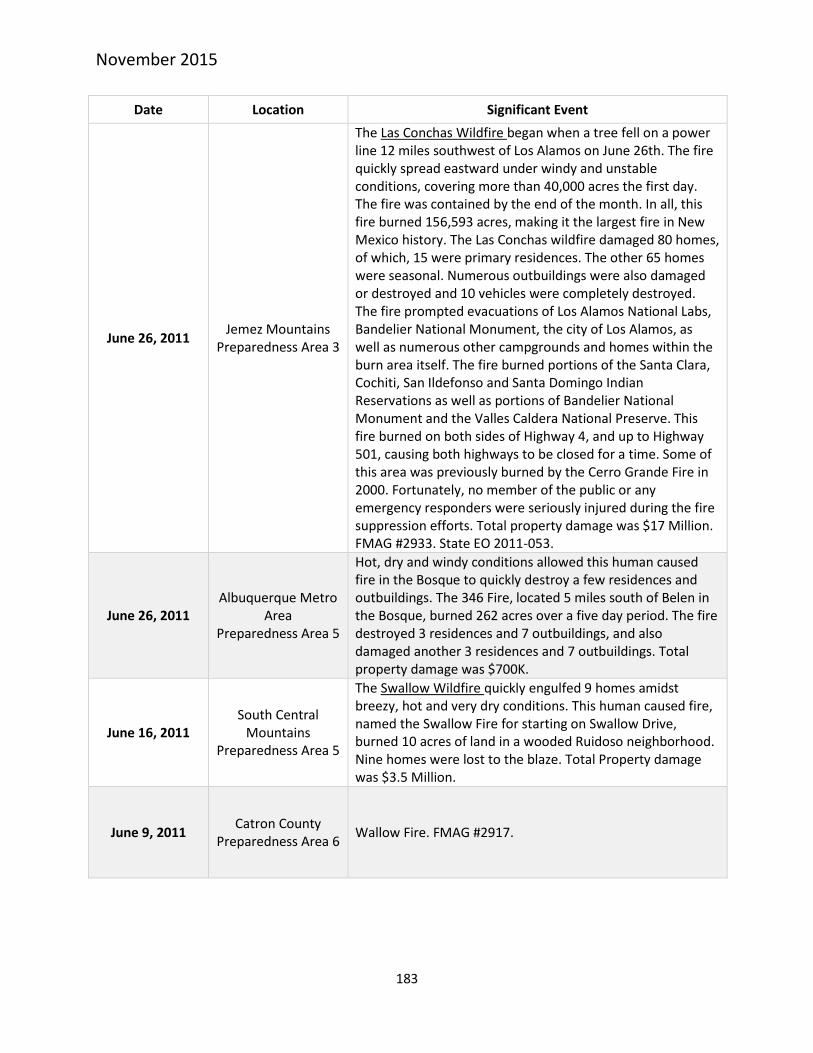
November 2015
183
Date Location Significant Event
June 26, 2011 Jemez Mountains
Preparedness Area 3
The Las Conchas Wildfire began when a tree fell on a power line 12 miles southwest of Los Alamos on June 26th. The fire quickly spread eastward under windy and unstable conditions, covering more than 40,000 acres the first day. The fire was contained by the end of the month. In all, this fire burned 156,593 acres, making it the largest fire in New Mexico history. The Las Conchas wildfire damaged 80 homes, of which, 15 were primary residences. The other 65 homes were seasonal. Numerous outbuildings were also damaged or destroyed and 10 vehicles were completely destroyed. The fire prompted evacuations of Los Alamos National Labs, Bandelier National Monument, the city of Los Alamos, as well as numerous other campgrounds and homes within the burn area itself. The fire burned portions of the Santa Clara, Cochiti, San Ildefonso and Santa Domingo Indian Reservations as well as portions of Bandelier National Monument and the Valles Caldera National Preserve. This fire burned on both sides of Highway 4, and up to Highway 501, causing both highways to be closed for a time. Some of this area was previously burned by the Cerro Grande Fire in 2000. Fortunately, no member of the public or any emergency responders were seriously injured during the fire suppression efforts. Total property damage was $17 Million. FMAG #2933. State EO 2011-053.
June 26, 2011 Albuquerque Metro
Area Preparedness Area 5
Hot, dry and windy conditions allowed this human caused fire in the Bosque to quickly destroy a few residences and outbuildings. The 346 Fire, located 5 miles south of Belen in the Bosque, burned 262 acres over a five day period. The fire destroyed 3 residences and 7 outbuildings, and also damaged another 3 residences and 7 outbuildings. Total property damage was $700K.
June 16, 2011 South Central
Mountains Preparedness Area 5
The Swallow Wildfire quickly engulfed 9 homes amidst breezy, hot and very dry conditions. This human caused fire, named the Swallow Fire for starting on Swallow Drive, burned 10 acres of land in a wooded Ruidoso neighborhood. Nine homes were lost to the blaze. Total Property damage was $3.5 Million.
June 9, 2011 Catron County
Preparedness Area 6 Wallow Fire. FMAG #2917.
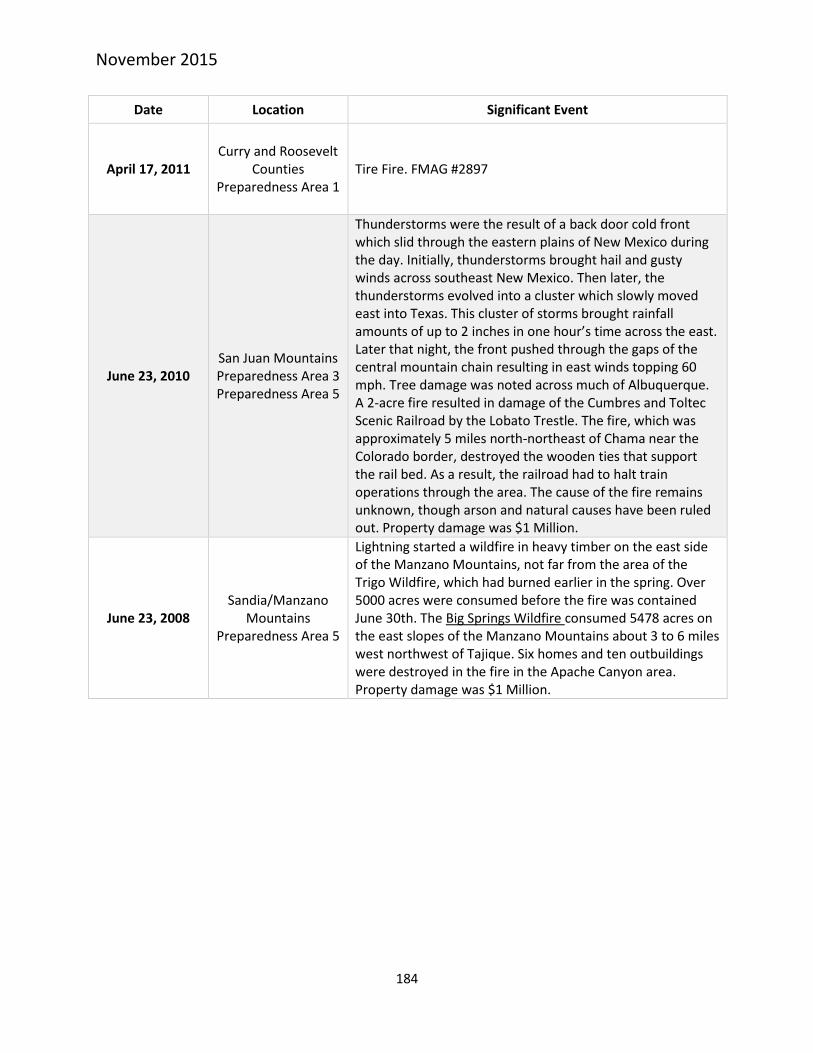
November 2015
184
Date Location Significant Event
April 17, 2011 Curry and Roosevelt
Counties Preparedness Area 1
Tire Fire. FMAG #2897
June 23, 2010 San Juan Mountains Preparedness Area 3 Preparedness Area 5
Thunderstorms were the result of a back door cold front which slid through the eastern plains of New Mexico during the day. Initially, thunderstorms brought hail and gusty winds across southeast New Mexico. Then later, the thunderstorms evolved into a cluster which slowly moved east into Texas. This cluster of storms brought rainfall amounts of up to 2 inches in one hour’s time across the east. Later that night, the front pushed through the gaps of the central mountain chain resulting in east winds topping 60 mph. Tree damage was noted across much of Albuquerque. A 2-acre fire resulted in damage of the Cumbres and Toltec Scenic Railroad by the Lobato Trestle. The fire, which was approximately 5 miles north-northeast of Chama near the Colorado border, destroyed the wooden ties that support the rail bed. As a result, the railroad had to halt train operations through the area. The cause of the fire remains unknown, though arson and natural causes have been ruled out. Property damage was $1 Million.
June 23, 2008 Sandia/Manzano
Mountains Preparedness Area 5
Lightning started a wildfire in heavy timber on the east side of the Manzano Mountains, not far from the area of the Trigo Wildfire, which had burned earlier in the spring. Over 5000 acres were consumed before the fire was contained June 30th. The Big Springs Wildfire consumed 5478 acres on the east slopes of the Manzano Mountains about 3 to 6 miles west northwest of Tajique. Six homes and ten outbuildings were destroyed in the fire in the Apache Canyon area. Property damage was $1 Million.
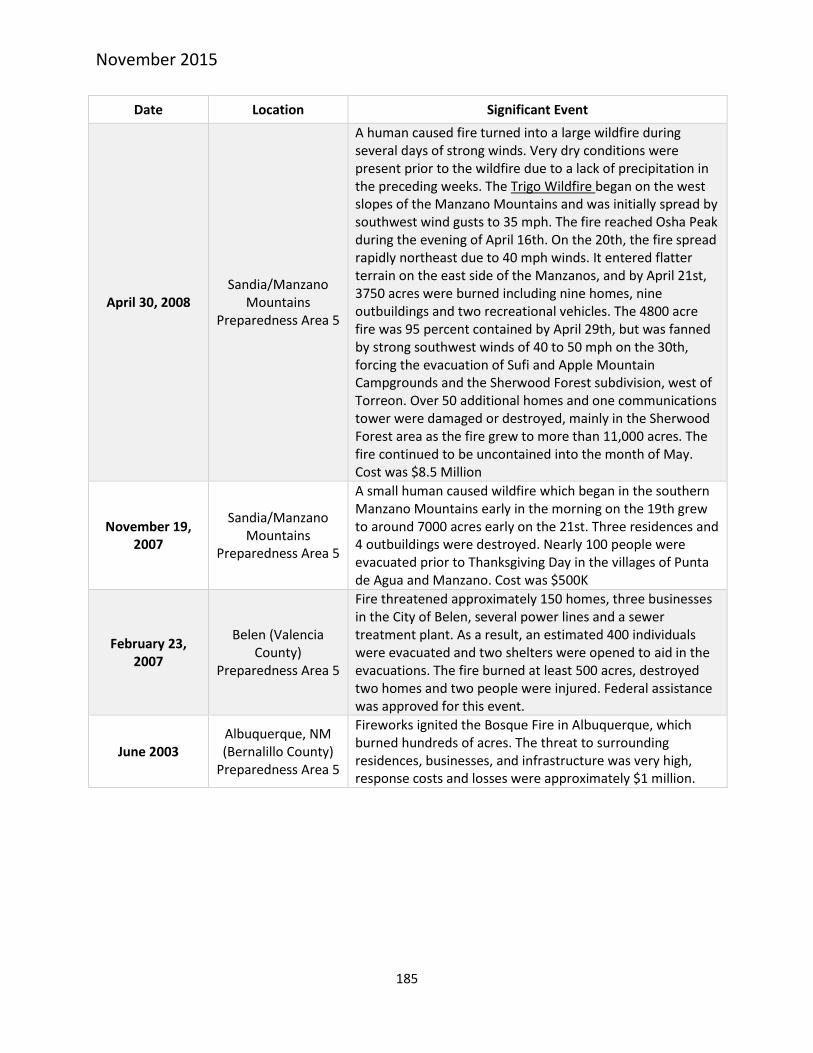
November 2015
185
Date Location Significant Event
April 30, 2008 Sandia/Manzano
Mountains Preparedness Area 5
A human caused fire turned into a large wildfire during several days of strong winds. Very dry conditions were present prior to the wildfire due to a lack of precipitation in the preceding weeks. The Trigo Wildfire began on the west slopes of the Manzano Mountains and was initially spread by southwest wind gusts to 35 mph. The fire reached Osha Peak during the evening of April 16th. On the 20th, the fire spread rapidly northeast due to 40 mph winds. It entered flatter terrain on the east side of the Manzanos, and by April 21st, 3750 acres were burned including nine homes, nine outbuildings and two recreational vehicles. The 4800 acre fire was 95 percent contained by April 29th, but was fanned by strong southwest winds of 40 to 50 mph on the 30th, forcing the evacuation of Sufi and Apple Mountain Campgrounds and the Sherwood Forest subdivision, west of Torreon. Over 50 additional homes and one communications tower were damaged or destroyed, mainly in the Sherwood Forest area as the fire grew to more than 11,000 acres. The fire continued to be uncontained into the month of May. Cost was $8.5 Million
November 19, 2007
Sandia/Manzano Mountains
Preparedness Area 5
A small human caused wildfire which began in the southern Manzano Mountains early in the morning on the 19th grew to around 7000 acres early on the 21st. Three residences and 4 outbuildings were destroyed. Nearly 100 people were evacuated prior to Thanksgiving Day in the villages of Punta de Agua and Manzano. Cost was $500K
February 23, 2007
Belen (Valencia County)
Preparedness Area 5
Fire threatened approximately 150 homes, three businesses in the City of Belen, several power lines and a sewer treatment plant. As a result, an estimated 400 individuals were evacuated and two shelters were opened to aid in the evacuations. The fire burned at least 500 acres, destroyed two homes and two people were injured. Federal assistance was approved for this event.
June 2003 Albuquerque, NM (Bernalillo County)
Preparedness Area 5
Fireworks ignited the Bosque Fire in Albuquerque, which burned hundreds of acres. The threat to surrounding residences, businesses, and infrastructure was very high, response costs and losses were approximately $1 million.
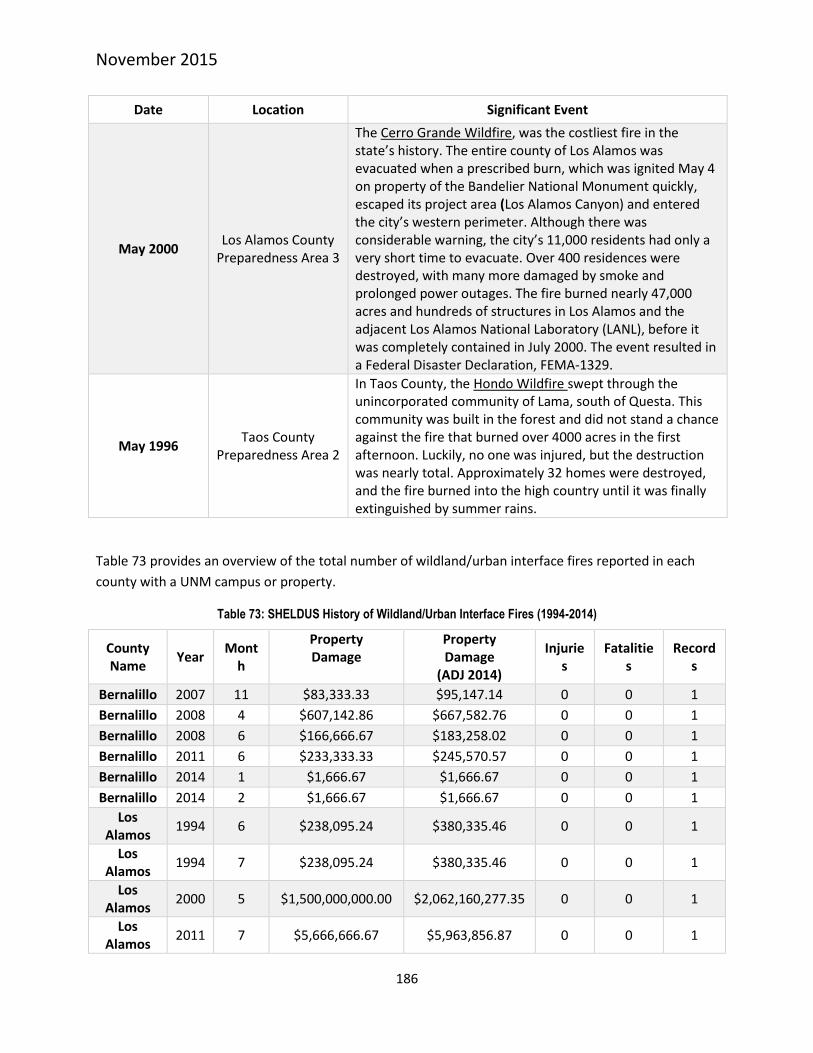
November 2015
186
Date Location Significant Event
May 2000 Los Alamos County
Preparedness Area 3
The Cerro Grande Wildfire, was the costliest fire in the state’s history. The entire county of Los Alamos was evacuated when a prescribed burn, which was ignited May 4 on property of the Bandelier National Monument quickly, escaped its project area (Los Alamos Canyon) and entered the city’s western perimeter. Although there was considerable warning, the city’s 11,000 residents had only a very short time to evacuate. Over 400 residences were destroyed, with many more damaged by smoke and prolonged power outages. The fire burned nearly 47,000 acres and hundreds of structures in Los Alamos and the adjacent Los Alamos National Laboratory (LANL), before it was completely contained in July 2000. The event resulted in a Federal Disaster Declaration, FEMA-1329.
May 1996 Taos County
Preparedness Area 2
In Taos County, the Hondo Wildfire swept through the unincorporated community of Lama, south of Questa. This community was built in the forest and did not stand a chance against the fire that burned over 4000 acres in the first afternoon. Luckily, no one was injured, but the destruction was nearly total. Approximately 32 homes were destroyed, and the fire burned into the high country until it was finally extinguished by summer rains.
Table 73 provides an overview of the total number of wildland/urban interface fires reported in each
county with a UNM campus or property.
Table 73: SHELDUS History of Wildland/Urban Interface Fires (1994-2014)
County Name
Year Mont
h
Property Damage
Property Damage
(ADJ 2014)
Injuries
Fatalities
Records
Bernalillo 2007 11 $83,333.33 $95,147.14 0 0 1
Bernalillo 2008 4 $607,142.86 $667,582.76 0 0 1
Bernalillo 2008 6 $166,666.67 $183,258.02 0 0 1
Bernalillo 2011 6 $233,333.33 $245,570.57 0 0 1
Bernalillo 2014 1 $1,666.67 $1,666.67 0 0 1
Bernalillo 2014 2 $1,666.67 $1,666.67 0 0 1
Los Alamos
1994 6 $238,095.24 $380,335.46 0 0 1
Los Alamos
1994 7 $238,095.24 $380,335.46 0 0 1
Los Alamos
2000 5 $1,500,000,000.00 $2,062,160,277.35 0 0 1
Los Alamos
2011 7 $5,666,666.67 $5,963,856.87 0 0 1

November 2015
187
County Name
Year Mont
h
Property Damage
Property Damage
(ADJ 2014)
Injuries
Fatalities
Records
Los Alamos
2013 5 $1,666.67 $1,693.71 0 0 1
McKinley 1994 6 $238,095.24 $380,335.46 0 0 1
McKinley 1994 7 $238,095.24 $380,335.46 0 0 1
McKinley 2012 6 $500,000.00 $515,553.54 0 0 1
McKinley 2014 6 $250,000.00 $250,000.00 0 0 2
Sandoval 1994 6 $238,095.24 $380,335.46 0 0 1
Sandoval 1994 7 $238,095.24 $380,335.46 0 0 1
Sandoval 2007 11 $83,333.33 $95,147.14 0 0 1
Sandoval 2008 4 $607,142.86 $667,582.76 0 0 1
Sandoval 2008 6 $166,666.67 $183,258.02 0 0 1
Sandoval 2011 5 $100,000.00 $105,244.53 0 0 1
Sandoval 2011 6 $233,333.33 $245,570.57 0 0 1
Sandoval 2011 7 $5,666,666.67 $5,963,856.87 0 0 1
Sandoval 2013 5 $1,666.67 $1,693.71 0 0 1
Sandoval 2014 1 $1,666.67 $1,666.67 0 0 1
Sandoval 2014 2 $1,666.67 $1,666.67 0 0 1
Socorro 1994 6 $238,095.24 $380,335.46 0 0 1
Socorro 1994 7 $238,095.24 $380,335.46 0 0 1
Socorro 2007 11 $83,333.33 $95,147.14 0 0 1
Socorro 2008 4 $607,142.86 $667,582.76 0 0 1
Socorro 2008 6 $166,666.67 $183,258.02 0 0 1
Socorro 2011 5 $75,000.00 $78,933.40 6.5 0 1
Socorro 2012 5 $1,250,000.00 $1,288,883.86 2.5 0 1
Socorro 2012 6 $1,125,000.00 $1,159,995.47 0 0 1
Taos 1994 6 $238,095.24 $380,335.46 0 0 1
Taos 1994 7 $238,095.24 $380,335.46 0 0 1
Taos 1996 5 $1,500,000.00 $2,263,250.48 0 0 1
Taos 2011 4 $2,666.67 $2,806.52 0 0 1
Taos 2011 7 $2,400.00 $2,525.87 0 0 1
Taos 2012 3 $100,000.00 $103,110.71 0 0 1
Taos 2013 5 $1,250.00 $1,270.28 0 0 1
Taos 2013 6 $250,000.00 $254,055.47 0 0 0

November 2015
188
Declared Disasters from Wildfire
NMDHSEM reports seven State Declared Disasters for wildfire between 2003 and 2013. This number is
based on how many Executive Orders were signed by the Governor for wildfire. According to NMDHSEM
records, the total cost for State declared wildfire events between 2003 and 2012 was $2,681,694 (Table
74). Research into locations for each disaster would need to be completed prior to breaking-out the
figures by Preparedness Area.
Table 74: State Disaster Event Information 2003 through 2012
Event Type State Executive Order Dollar Loss*
Fire Preparedness 06-009 $6,662.00
Wildfire 08-018 $375,032.00
Wildfire 11-047* $200,000.00
Wildfire 11-053* $750,000.00
Wildfire 11-061* $100,000.00
Wildfire 12-014* $500,000.00
Wildfire 12-015* $750,000.00
Total 7 $2,681,694.00
*The total does not reflect all costs for Executive Orders from 2011 and 2012 which are still being tallied.
There were 29 Fire Management Assistance Grants at the federal level between 2003 and 2012 (Table
75). The total Public Assistance dollar losses from federal, NMDHSEM and local government entities and
all tribal entities was $28,356,974.
Table 75: Federal Disaster Event Information 2003 through 2012
Event Type/Name Event
Number Federal Share
State (DHSEM)
Share
Total Cost State % of
Total
Wildfire - Atrisco Fire 2472 $1,749,609 $583,203 $2,332,812 25%
Wildfire - Walker Fire 2467 $76,176 $25,392 $101,568 25%
Wildfire - Peppin Fire 2518 $283,186 $94,395 $377,581 25%
Wildfire - Bernardo Fire 2522 $238,140 $79,380 $317,520 25%
Wildfire - Casa Fire 2631 $262,647 $87,549 $350,196 25%
Wildfire - Southeast NM Fire
2600 $107,390 $35,797 $143,187 25%
Wildfire - Ojo Feliz Fire 2636 $2,406,369 $802,123 $3,208,492 25%
Wildfire - Malpais Fire 2644 $113,353 $37,784 $151,137 25%
Wildfire - Rivera Mesa Fire 2647 $2,718,248 $906,083 $3,624,331 25%
Wildfire - Belen Fire 2682 $89,839 $29,946 $119,785 25%
Wildfire - Ojo Peak Fire 2741 $17,400 $5,800 $23,200 25%
Wildfire - Trigo Fire 2762 $2,175,243 $725,081 $2,900,324 25%
Wildfire - Big Springs Fire 2777 $406,862 $135,621 $542,483 25%
Wildfire - Buckwood Fire 2818 $339,716
$452,955 0%

November 2015
189
Wildfire - Cabezon Fire 2842 $55,680 $0 $74,239 0%
Wildfire - Rio Fire 2843 $55,983
$74,645 0%
Wildfire - Quail Ridge Fire 2866 $267,934 $89,311 $357,245 25%
Wildfire - White Fire 2880 $124,694 $41,565 $166,259 25%
Wildfire - Tire Fire 2897 $75,184 $25,061 $100,245 25%
Wildfire - Wallow Fire 2917 $515,274 $171,758 $687,033 25%
Wildfire - Track Fire 2918 $4,300,099 $1,433,366 $5,733,465 25%
Wildfire - Los Conchas Fire 2933 $1,640,181 $546,727 $2,186,909 25%
Wildfire - Little Lewis Fire 2934 $75,494 $25,165 $100,659 25%
Wildfire - Donaldson Fire 2935 $3,173,028 $1,057,676 $4,230,704 25%
Wildfire - Whitewater/Baldy Complex Fire
2978* NA NA NA NA
Wildfire - Little Bear 2979* NA NA NA NA
Wildfire - Blanco Fire 2981* NA NA NA NA
Wildfire - Romero Fire 2982* NA NA NA NA
Total 29 $21,267,731 $6,938,784 $28,356,974
*NMDHSEM as the State emergency management agency contributed either 25% of the total cost or zero.

November 2015
190
Figure 45 shows a map of statewide wildfire perimeters (including County boundaries) for Fire Management Assistance Grants (FMAGs) between 2003 and 2012.
Figure 45: State Wildfire Perimeters for Fire Management Assistance Grants (2003 - 2012)
UNM Taos
UNM Los Alamos
UNM Main
UNM Gallup
UNM Valencia
UNM Sevilleta
UNM West

November 2015
191
Figures 46 through 48 on the following pages show maps of wildfire perimeters for FMAGs in each of the
six state Preparedness Areas. The following chart (Table 76) summarizes the number of FMAGs and
acreage for each Preparedness Areas with UNM campuses and properties.
Table 76: Summary of FMAG and Acreage by Preparedness Area87
Preparedness Area
Number of FMAGs
Number of Acers per event
Notes
3 1 156,593
Las Conchas Fire impacted area in Los Alamos, Rio Arriba and Santa Fe Counties (Preparedness Area 3) and Sandoval County (Preparedness Area 5)
4 1 352 All acreage in San Juan County
5 12 28,621 Majority of area in Torrance County. Las Conchas Fire impacted Sandoval County but was reported with Preparedness Area 3.
Total 14 185,566
Figure 46: FMAG Wildfire Perimeters for Preparedness Area 3 (2003 - 2012)
87
Source: University of New Mexico Earth Data Analysis Center

November 2015
192
UNM Taos
UNM Los Alamos
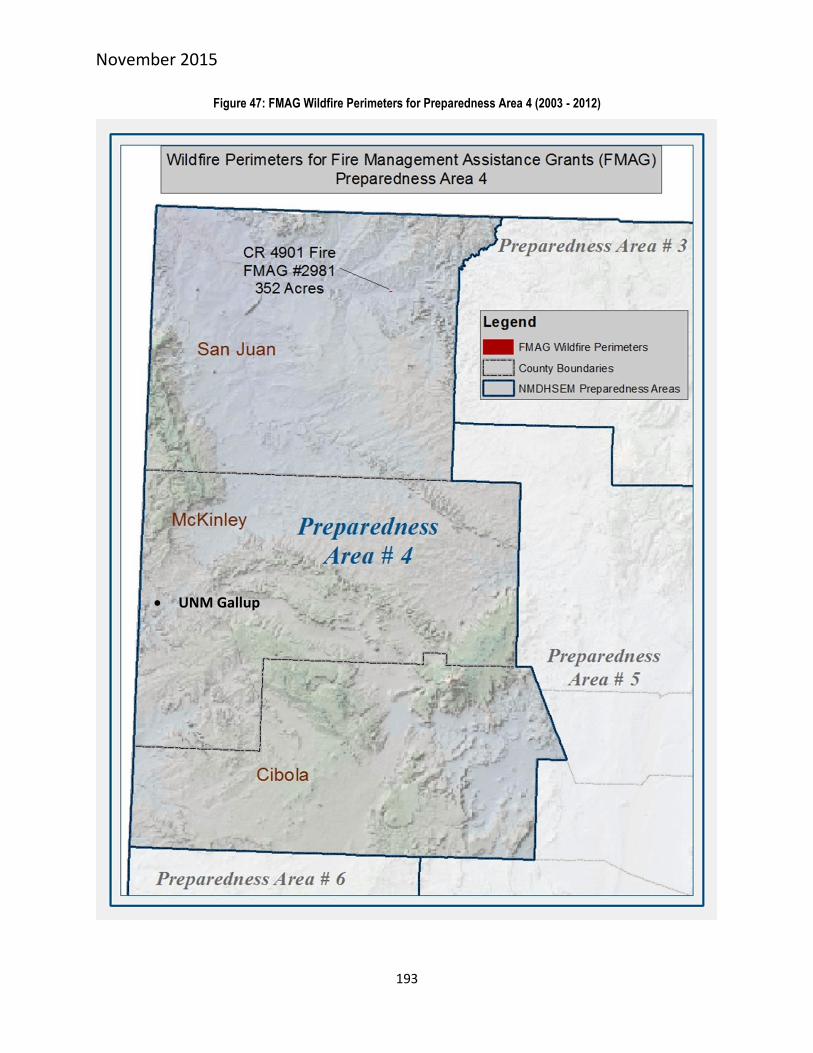
November 2015
193
Figure 47: FMAG Wildfire Perimeters for Preparedness Area 4 (2003 - 2012)
UNM Gallup

November 2015
194
Figure 48: FMAG Wildfire Perimeters for Preparedness Area 5 (2003 - 2012)
UNM Main
UNM Valencia
UNM Sevilleta
UNM West
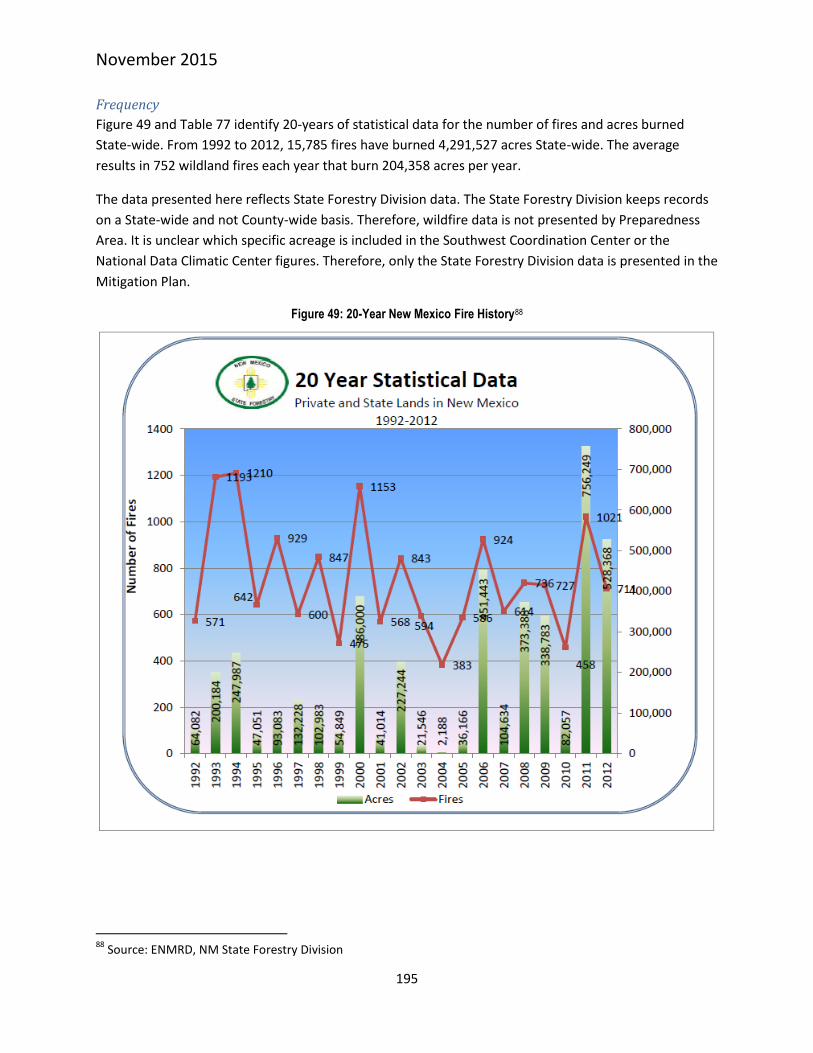
November 2015
195
Frequency
Figure 49 and Table 77 identify 20-years of statistical data for the number of fires and acres burned
State-wide. From 1992 to 2012, 15,785 fires have burned 4,291,527 acres State-wide. The average
results in 752 wildland fires each year that burn 204,358 acres per year.
The data presented here reflects State Forestry Division data. The State Forestry Division keeps records
on a State-wide and not County-wide basis. Therefore, wildfire data is not presented by Preparedness
Area. It is unclear which specific acreage is included in the Southwest Coordination Center or the
National Data Climatic Center figures. Therefore, only the State Forestry Division data is presented in the
Mitigation Plan.
Figure 49: 20-Year New Mexico Fire History88
88
Source: ENMRD, NM State Forestry Division

November 2015
196
Table 77: Historical Fire Data (1992 – 2012)89
20 Year Historical Fire Data (1992-2012)
Date Number of Fires Number of Acres
1992 571 64,082
1993 1,193 200,184
1994 1,210 247,987
1995 642 47,051
1996 929 93,083
1997 600 132,228
1998 847 102,983
1999 475 54,849
2000 1,153 386,000
2001 568 41,014
2002 843 227,244
2003 594 21,546
2004 383 2,188
2005 586 36,166
2006 924 451,443
2007 614 104,634
2008 736 373,388
2009 727 338,783
2010 458 82,057
2011 1,021 756,249
2012 711 528,368
Total 15,785 4,291,527
Average 752 204,358
89
Adapted from 20-year Statistical Data Chart from State Forestry Division

November 2015
197
Figure 50: Total Fires and Acres Burned by County for 2014

November 2015
198
Figure 51: Total Fires and Acres Burned by County for 2014
Probability of Future Occurrence
The threat of wildland/urban interface fires continues to be the number one natural hazard facing the
state. Each Preparedness Area has experienced the effects of wildfire. The annual probability of a large
fire event is 100%. There are hundreds of communities that are embedded in the forest, are surrounded
by the forest, or have their major routes of egress surrounded by forest. This greatly increases the
amount of people and infrastructure that are exposed to wildfire risks. With drought conditions
persisting and more people locating their residences in the forest, it seems inevitable that all
Preparedness Areas will become more susceptible to fires occurring with increased consequences to the
population, property, and natural resources.
Risk Assessment
The US Forest Service estimates that approximately 942 thousand acres are in the New Mexican
Wildland Urban Interface.
In 2012, the New Mexico Forestry Division updated the Community at Risk Assessment Plan, which ranks
communities and tribal areas by how vulnerable they are to wildland-urban interface fires.90
The vulnerability criteria used to rank the communities include:
90
The Plan can be found by visiting the following link: http://www.emnrd.state.nm.us/SFD/FireMgt/documents/2012_CAR_Planreduced.pdf

November 2015
199
Proximity of vegetation types to homes
Availability of water
Ease of evacuation
Topography – ridge, valley, slope, and exposure
Types of fuel (forest type)
Number and size of previous fires
Direction of prevailing and local winds in each community
Ability of community/subdivision to protect homes
The number of Community Wildfire Protection Plans (CWPP) in New Mexico has increased since 2010.
Currently, there are 58 CWPPs in the state. These 58 CWPPs identify 630 communities at risk from
wildland fire. Of the 630 communities, 296 are listed as high risk, 224 are listed as moderate risk and 110
are listed as low risk from wildland fire.

November 2015
200
The New Mexico Fire Planning Task Force requires that CWPPs be updated within 5 years of adoption. A
letter was sent to all CWPP participants to advise them of the updated requirements. Figure 52 is a map
showing the communities covered by a CWPP. A full listing of communities and their level of wildfire risk
can be found in the Community at Risk Assessment Plan.
Figure 52: Community Wildfire Protection Plan Communities
The Statewide Natural Resource Assessment & Strategy and Response Plans document produced by
New Mexico State Forestry in June 2010 includes an analysis of wildfire risk. The document explains
UNM Taos
UNM Los Alamos
UNM Main
UNM Gallup
UNM Valencia
UNM Sevilleta
UNM West

November 2015
201
several data gaps that would need to be addressed in order to improve the wildfire risk map. The
document also includes a more detailed wildfire risk analysis for each of the six State Forestry Districts.
Figure 53 displays the state wildfire risk model results by Preparedness Area.
Figure 53: Wildfire Risk Model Results91
Table 78 identifies potential impacts from a wildland fire.
Table 78: Potential Impacts from Wildland Fire
Subject Potential Impacts
Health and Safety of the PUBLIC The public is at risk to injuries from heat and smoke.
Health and Safety of RESPONDERS Responders are at risk from heat exposure, burns, dehydration, smoke inhalation, etc.
CONTINUITY OF OPERATIONS Those operations that are in or near the wildfire are may be shut down or even destroyed by the fire.
DELIVERY of SERVICES Service delays are anticipated to operations within or near the fire areas.
91
The US Forest Service developed a national-scale 2013 wildfire potential map. It is available for download at: http://www.firelab.org/fmi/data-products/229-wildland-fire-potential-wfp
UNM Taos
UNM Los Alamos
UNM Main
UNM Gallup
UNM Valencia
UNM Sevilleta
UNM West
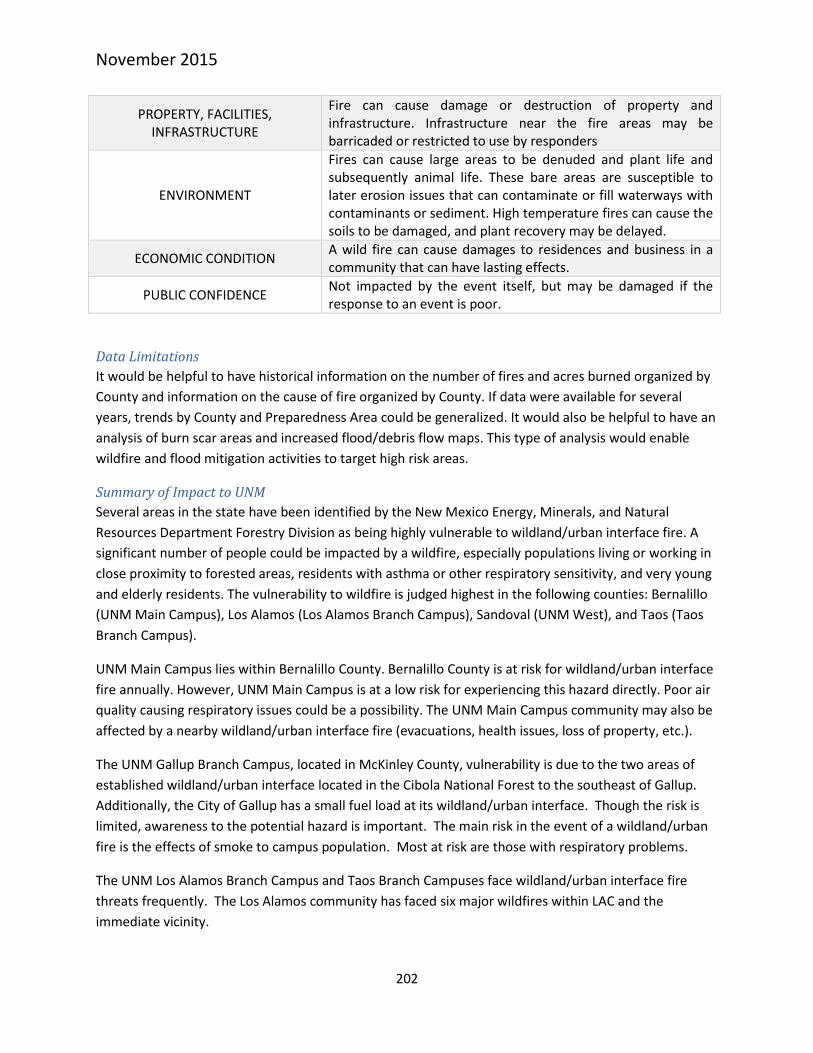
November 2015
202
PROPERTY, FACILITIES, INFRASTRUCTURE
Fire can cause damage or destruction of property and infrastructure. Infrastructure near the fire areas may be barricaded or restricted to use by responders
ENVIRONMENT
Fires can cause large areas to be denuded and plant life and subsequently animal life. These bare areas are susceptible to later erosion issues that can contaminate or fill waterways with contaminants or sediment. High temperature fires can cause the soils to be damaged, and plant recovery may be delayed.
ECONOMIC CONDITION A wild fire can cause damages to residences and business in a community that can have lasting effects.
PUBLIC CONFIDENCE Not impacted by the event itself, but may be damaged if the response to an event is poor.
Data Limitations
It would be helpful to have historical information on the number of fires and acres burned organized by
County and information on the cause of fire organized by County. If data were available for several
years, trends by County and Preparedness Area could be generalized. It would also be helpful to have an
analysis of burn scar areas and increased flood/debris flow maps. This type of analysis would enable
wildfire and flood mitigation activities to target high risk areas.
Summary of Impact to UNM
Several areas in the state have been identified by the New Mexico Energy, Minerals, and Natural
Resources Department Forestry Division as being highly vulnerable to wildland/urban interface fire. A
significant number of people could be impacted by a wildfire, especially populations living or working in
close proximity to forested areas, residents with asthma or other respiratory sensitivity, and very young
and elderly residents. The vulnerability to wildfire is judged highest in the following counties: Bernalillo
(UNM Main Campus), Los Alamos (Los Alamos Branch Campus), Sandoval (UNM West), and Taos (Taos
Branch Campus).
UNM Main Campus lies within Bernalillo County. Bernalillo County is at risk for wildland/urban interface
fire annually. However, UNM Main Campus is at a low risk for experiencing this hazard directly. Poor air
quality causing respiratory issues could be a possibility. The UNM Main Campus community may also be
affected by a nearby wildland/urban interface fire (evacuations, health issues, loss of property, etc.).
The UNM Gallup Branch Campus, located in McKinley County, vulnerability is due to the two areas of
established wildland/urban interface located in the Cibola National Forest to the southeast of Gallup.
Additionally, the City of Gallup has a small fuel load at its wildland/urban interface. Though the risk is
limited, awareness to the potential hazard is important. The main risk in the event of a wildland/urban
fire is the effects of smoke to campus population. Most at risk are those with respiratory problems.
The UNM Los Alamos Branch Campus and Taos Branch Campuses face wildland/urban interface fire
threats frequently. The Los Alamos community has faced six major wildfires within LAC and the
immediate vicinity.

November 2015
203
1. Water Canyon Fire, 1953, 6,000 acres
2. La Mesa Fire, 1977, 15,444 acres
3. Dome Fire, 1996, 16,683 acres
4. Oso Complex Fire, 1998, 5,820 acres
5. Cerro Grande Fire, 2000, 47,658 acres
6. Los Conchas Fire, 2011, 150,000 acres
Based on the number of fires within the last 50 years, the risk of another fire occurring can be viewed as
moderate. Though local officials highlight fire safety and awareness through many outlets to the
general public, the possibility of a fire starting through natural occurrences (lightning strike) are real.
The risks to the Los Alamos Branch and Taos Campuses include respiratory issues from smoke to
complete campus evacuation to loss of facilities should a fire become uncontrollable.
The Sevilleta LTER Field Station vulnerability to wildfires is considered moderate. This location recently
experienced a wildfire that burned over 12,000 acres of the LTER site. The site is a research site and
instituting fire wise projects is difficult without disrupting the scientific location. The biggest concern
for this site is the ongoing research that is being conducted, some 10 years plus. The loss of this site and
the experiments will have a huge impact on studies being conducted that are of irreplaceable value.
Conclusion
The hazard identification and risk assessment presented in this section was carried out using best
available data and state-specific information. Based on guidance from FEMA’s “How-to” document
entitled Understanding Your Risks: Identifying Hazards and Estimating Losses (FEMA Publication 386-2),
the assessment relies heavily on historical and anecdotal data, stakeholder input, and professional and
experienced judgment regarding observed and/or anticipated hazard impacts. This hazard identification
and risk assessment presents a reasonable range of hazards that have affected the state in the past.
Additionally, it is likely that new hazards (or old hazards in new forms) will affect New Mexico in the
future. To contribute the contextual relevance and accuracy of the plan the hazard identification and
risk assessment carefully considers and incorporates the findings from other relevant plans, studies and
technical reports.
Scenario Analysis
Earthquake
In April of 2015, the FEMA Region 6 Operational Planning Branch provided an earthquake scenario for
the Greater Albuquerque, New Mexico area based on a Magnitude 7.0 event involving the Sandia-
Rincon Fault. The data for the scenario is based on a US Geologic Survey ShakeMap, a Hazus-MH
Earthquake Event analysis, and the Threat and Hazard Identification and Risk Assessment conducted in
partnership with stakeholders in the region in support of the New Mexico Rio Grande Rift Catastrophic
Earthquake Plan. The availability of this scenario allowed the PDMAC to evaluate the risk and potential
impact of an earthquake for the all but two of the UNM campus locations and outposts (UNM Taos and
Gallup campuses are not in an area expected to be impacted by a Sandia-Rincon fault event.) The full
scenario, including the overview of the project, the analysis, and the damage estimates for the entire

November 2015
204
region is available upon request and is also on file with the New Mexico Department of Homeland
Security and Emergency Management. The elements of the scenario that were considered by the
PDMAC to be important for mitigation planning for the UNM campuses are below and include building
and infrastructure damage and casualties, with details extracted from the overall scenario report
provided by FEMA.
Damage assessment
The MH-Hazus analysis produced estimates that about 25% of the buildings in the region will be at least
moderately damaged, including buildings that will be damaged beyond repair. (The definition of the
‘damage states’ is provided in Volume 1: Chapter 5 of the Hazus technical manual.) Table 79 below
summarizes the expected damage by general building type.
Table 79: Expected damage by general building type
Type Level of Damage / % of total structures
None (%) Slight (%) Moderate
(%) Extensive (%) Complete (%)
Wood 66.09 72.56 36.99 9.49 0.67
Steel 0.78 0.96 3.73 4.91 4.54
Concrete 0.79 1.06 2.92 4.16 4.00
Precast 0.69 0.76 2.45 4.45 5.45
RM 17.26 12.07 31.36 50.78 41.85
URM 1.58 2.68 3.81 4.71 9.23
MH 12.80 9.92 18.74 26.50 34.26
*Note: RM= Reinforced Masonry; URM= Unreinforced Masonry; MH = Manufactured Housing
Table 80 summarizes the expected damage to utility system facilities in the region impacted by the
earthquake.
Table 80: Expected damage to utility system facilities (Albuquerque region)
System Component
Percent with at least moderate damage
Potable Water 0.0%
Waste Water 7.7%
Natural Gas 1.3%
Oil Systems 10.0%
Electrical Power 18.3%
Communication 35.7%

November 2015
205
Casualties
Hazus-MH estimates the number of people that will be injured and killed by an earthquake. The
casualties are broken down into four severity levels that describe the extent of the injuries as follows:
1. Severity Level 1: Injuries will require medical attention but hospitalization is not needed.
2. Severity Level 2: Injuries will require hospitalization but are not considered life-threatening.
3. Severity Level 3: Injuries will require hospitalization and can become life threatening if not
promptly treated.
4. Severity Level 4: Victims are killed by the earthquake.
Across the entire region impacted by the 7.0 Sandia-Rincon Fault event, the analysis estimates 16,169
Level 1 injuries, 4,452 Level 2 injuries, 772 Level 3 injuries, and 1,377 deaths. The casualty estimates are
further detailed for three times of day: 2:00 AM, 2:00 PM and 5:00 PM, and are distributed according to
the type or use of the occupied building. These times represent the periods of the day that different
sectors of the community are at their peak occupancy loads. The 2:00 AM estimate considers that the
residential occupancy load is maximum, the 2:00 PM estimate considers that the educational,
commercial and industrial sector loads are maximum and 5:00 PM represents peak commute time. In
general, UNM campuses would expect the highest number of casualties to occur within structures used
for administration and research (commercial), educational buildings, and residential structures.

November 2015
206
Chapter 5 - Updating the Mitigation Strategy The mitigation strategy chapter is made of the following components: mitigation goals, mitigation
actions, changes in mitigation priorities, and action plan for implementation.
Mitigation Goals Mitigation goals are the guidelines that explain what UNM wants to achieve with the plan. The five
mitigation goals are:
1. Save lives, reduce injuries, property damage and recovery
2. Reduce the cost and burden of disasters to UNM
3. Protect UNM’s critical assets and facilities
4. Reduce exposure to liability and minimize community disruption
5. Improve preparedness, response, and recovery measures that support the concept of mitigation
and may directly support identified mitigation actions.
Mitigation Actions Completed Several successes have been achieved in the last five years which will help UNM be more resilient to
natural disasters in the future. These achievements include:
1. Creation and implementation of evacuation videos for athletic venues – The UNM Athletics
Department brought in a professional videographer who created 2 minute videos that explain
the emergency procedures for University Stadium and The Pit. This video is shown prior to each
home game.
2. StormReady status – Working with the NWS, the Office of Emergency Management showed
compliance with the StormReady standards. In 2012, the NWS presented the University with
the title StormReady University – the first one in New Mexico, and only the third community in
the state.
3. Creation of the campussafety.unm.edu website – The Student Affairs Office, along with the
Dean of Student’s, Campus Police, University Communications and Marketing and the Office of
Emergency Management developed a website to compile all of the University’s safety and
emergency preparedness information. Students, faculty, staff, parents, and visitors have easy
access to the information from this single web source.
4. Creation of educational opportunities for students, faculty and staff
a. Working with the Provost’s Office and the Health, Exercise and Sports Sciences
Department, the Office of Emergency Management created a 3 semester hour, for-
credit course, offered both at the undergraduate and graduate levels titled “Emergency
Management and Preparedness”. This course provides a solid foundation of emergency
preparedness, teaches skills that the students can use throughout their lifetime, and
covers the Community Emergency Response Team (CERT) curricula.
b. Working with the Academic Communities Program, the Center for Disaster Medicine
created a Freshmen Learning Community course titled “Management of Disasters”. This
course was paired with “Human Geography” and helps show students how
November 2015
207
communities, including UNM, work to mitigate the natural disasters they face based
upon where they live.
5. Creation of Campus Community Emergency Response Team (CCERT) – The Office of Emergency
Management created an emergency response team on campus. Comprised of students, faculty
and staff, the CCERT could be used to assist with any incident on campus. They have
participated in several exercises and planned events since their inception.
6. Creation of University Healthcare Emergency Response Team (UHERT) – The Emergency
Managers for UNMH and UNM created a state-wide medical response team of volunteers
primarily affiliated with UNMH and UNM. The goal of this team is to provide qualified medical
personnel to the state in the event of an emergency. They were first deployed to the Bataan
Memorial Death March/Marathon of 2015, where the 100 volunteers helped treat almost 2,000
patients in a 12-hour period.
7. Requests for state/federal funding of mitigation activities – the University is beginning to benefit
from the FEMA-approved HMP which makes the institution eligible for mitigation funding. The
two items for which funding has been sought include:
a. Earthquake bars for specimen collections – This project was funded and implemented,
and provides additional protection for valuable research and collections in the event of
an earthquake.
b. Lightning prediction system – Protecting students, faculty, staff and visitors from the
effects of a severe storm is a high priority for the University. As such, UNM has
requested mitigation funds to install a system to warn the public of a pending electrical
storm.
Changes in Priorities UNM’s 2010 Mitigation Strategy was a broad-based, action-oriented plan to identify and address the
natural hazard vulnerabilities. Over the life of the plan, UNM determined that the previous plan
unintentionally created barriers which prevented a successful implementation of the findings. The
update of the plan identified the following problems:
1. Multiple action items were created, many intertwined or closely related to others, and they
were not problem-based;
2. The HMP does not dovetail into UNM’s institutional strategic plan;
3. UNM has multiple operating units. Organizing the strategies based upon a hierarchical chart
does not address the units equally;
4. UNM has a very broad-based educational mission. The diversity of efforts makes it difficult to
address particular issues equally; and,
5. UNM branch campuses are pieces of many other systems (local government infrastructure, local
community relations, institution educational mission, institution infrastructure, etc.).
In order to address these shortcomings, UNM has made the following changes in priorities:
1. Streamline mitigation activities by grouping them to address problems identified, and then
categorizing and prioritizing efforts;

November 2015
208
2. Establish a subcommittee charged with integrating the HMP and strategies into the institutional
strategic plan;
3. Increase chances of implementation and effectiveness of mitigation strategies by leveraging use
of community capabilities;
4. Assign strategies to engaged partners based upon functional purpose and need rather than
strictly upon organizational lines;
5. Address educational mission strategies based upon function rather than strictly by organization
and location; and,
6. Encourage branch campuses to work within their local governments as readily as they do within
the institutional structure on preparedness and mitigation efforts.
Prioritization of Mitigation Actions A comprehensive approach of review and consensus building was utilized to sort and group strategies to
create specific, measurable, achievable, realistic and timely (SMART) solutions.
The mitigation actions and strategies address, to the extent possible, the risk from the hazards described
in Chapter 4. The actions and strategies are the specific measures to help meet the identified goals and
include estimated timeframes for completion. Where a specific dollar estimate for completion of the
action was not available, a range of costs was used:
High – Over $500,000
Medium - $100,000 to $499,000
Low – $5,000 to $100,000
Minimal – Less than $5,000
FEMA developed a comprehensive set of criteria and categories that allow communities to evaluate
proposed actions in ways that reflect community values and sound principles for finding appropriate and
cost-effective mitigation actions (Table 81).
Table 81: STAPLEE Criteria
Evaluation Criteria Considerations
Social Does the measure treat people fairly? (i.e., Are different social and demographic groups, different generations, different creeds treated equally?)
Technical Will it work? (i.e., Does it actually solve the problem and is it feasible?)
Administrative Does the County and/or its municipalities have the capacity to implement and manage the project?
Political Does support exist from public and political stakeholders?
Legal Does the County and/or its municipalities have the legal authority to implement and assume any reasonable liability?
Economic
Is it cost-effective? Is there a federal, state or non-profit source for funding? If federal, can the non-federal match bet met locally or through another source? Does it contribute to the local economy?

November 2015
209
Environmental Does it comply with environmental regulations? Will it preserve, protect, or enhance existing natural resources?
Table 82: Prioritization Categories
Category Timeframe Comments
High Begin within 1 year from Plan
adoption
Top organizational priority and is generally a well-detailed project idea. Protects population, resource or property at high risk. Uses feasible methods, techniques or technology.
Medium 2-3 years from Plan adoption A good idea that needs more information or is an action that addresses a moderate hazard.
Low 3-5 years from Plan adoption An idea that needs a lot more information or will take a lot of preliminary action to build support.
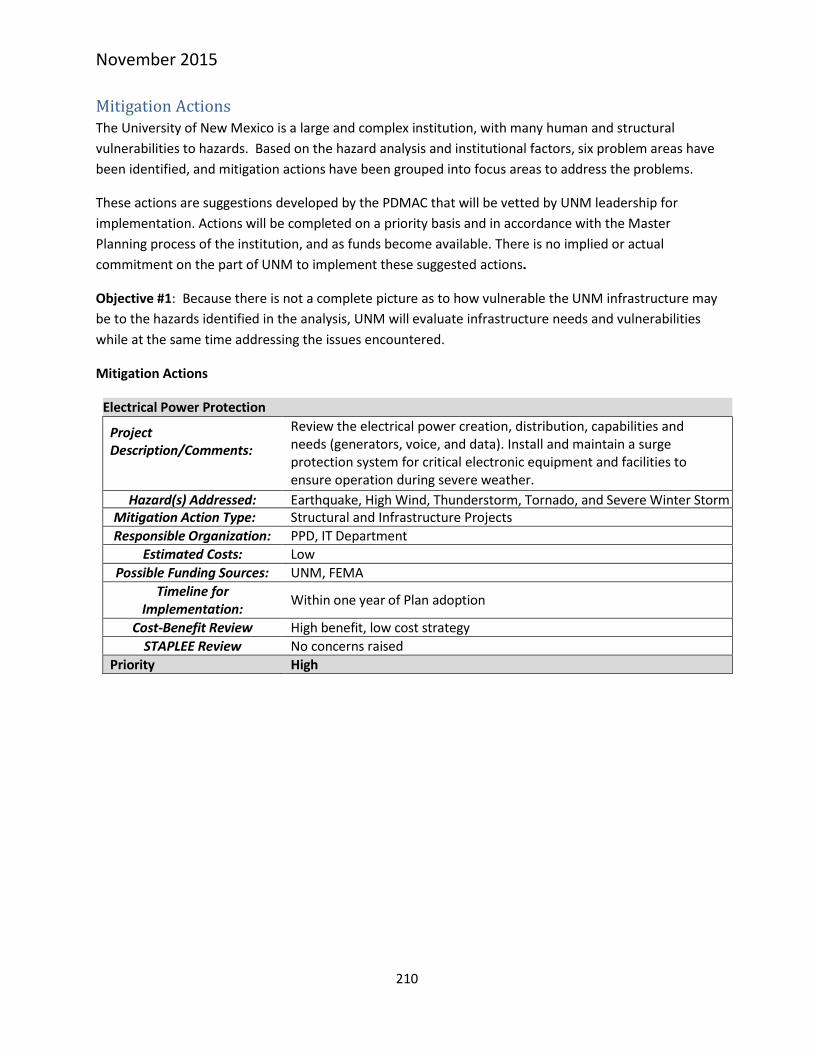
November 2015
210
Mitigation Actions The University of New Mexico is a large and complex institution, with many human and structural
vulnerabilities to hazards. Based on the hazard analysis and institutional factors, six problem areas have
been identified, and mitigation actions have been grouped into focus areas to address the problems.
These actions are suggestions developed by the PDMAC that will be vetted by UNM leadership for
implementation. Actions will be completed on a priority basis and in accordance with the Master
Planning process of the institution, and as funds become available. There is no implied or actual
commitment on the part of UNM to implement these suggested actions.
Objective #1: Because there is not a complete picture as to how vulnerable the UNM infrastructure may
be to the hazards identified in the analysis, UNM will evaluate infrastructure needs and vulnerabilities
while at the same time addressing the issues encountered.
Mitigation Actions
Electrical Power Protection
Project Description/Comments:
Review the electrical power creation, distribution, capabilities and needs (generators, voice, and data). Install and maintain a surge protection system for critical electronic equipment and facilities to ensure operation during severe weather.
Hazard(s) Addressed: Earthquake, High Wind, Thunderstorm, Tornado, and Severe Winter Storm Mitigation Action Type: Structural and Infrastructure Projects
Responsible Organization: PPD, IT Department
Estimated Costs: Low
Possible Funding Sources: UNM, FEMA
Timeline for Implementation:
Within one year of Plan adoption
Cost-Benefit Review High benefit, low cost strategy
STAPLEE Review No concerns raised
Priority High

November 2015
211
ADA Compliant Emergency Communication System
Project Description/Comments:
Review the emergency communication system to ensure that it is ADA compliant and accessible. Retrofit gaps in ADA compliancy to ensure that all are able to access the emergency communication system.
Hazard(s) Addressed: Drought, Earthquakes, Extreme Heat, Flood, High Wind, Landslide, Thunderstorm, Tornado, Severe Winter Storms, and Wildland/Urban Interface Fire
Mitigation Action Types: Structural and Infrastructure Projects
Responsible Organization: OEM, Accessibility Resource Center, Communication And Marketing
Estimated Costs: Low
Possible Funding Sources: FEMA, UNM
Timeline for Implementation:
Within one year of Plan adoption
Cost-Benefit Review High benefit, low cost strategy
STAPLEE Review No concerns raised Priority High
ADA Compliant Facilities
Project Description/Comments:
Retrofit gaps in ADA compliancy for all buildings to ensure that all are able to access and evacuate to ADA standards.
Hazard(s) Addressed: Drought, Earthquakes, Extreme Heat, Flood, High Wind, Landslide, Thunderstorm, Tornado, Severe Winter Storms, and Wildland/Urban Interface Fire
Mitigation Action Types: Structural and Infrastructure Projects
Responsible Organization: OEM, Accessibility Resource Center, Communication And Marketing
Estimated Costs: Low-Medium
Possible Funding Sources: FEMA, UNM
Timeline for Implementation:
Within one year of Plan adoption
Cost-Benefit Review High benefit, low-medium cost strategy
STAPLEE Review No concerns raised Priority High

November 2015
212
Water Rationing Plan
Project Description/Comments:
Assess impact of severe drought on institution and activities. Work with the local water authorities of each campus to enhance water distribution between UNM and local jurisdictions. Develop a plan to identify trigger points for potential mandatory water rationing, as well as an enforcement plan for such actions.
Hazard(s) Addressed: Drought Mitigation Action Type: Local Plans and Regulations
Responsible Organization: OEM, PPD
Estimated Costs: Low
Possible Funding Sources: FEMA, UNM
Timeline for Implementation:
Within two to three years from Plan adoption
Cost-Benefit Review High benefit, low cost strategy
STAPLEE Review No concerns raised
Priority Medium

November 2015
213
Objective #2: Hazard mitigation planning at UNM will be more closely aligned with the institutional
strategic planning process, and therefore implemented more effectively.
Mitigation Actions
Incorporation of Mitigation Strategies
Project Description/Comments:
Establish on-going reviews and updates of vulnerabilities, strategies, losses and changes in infrastructure. Form a subcommittee to enhance the COC’s awareness of HMP projects. Incorporate mitigation strategies into UNM’s Capital Projects Plan and future maintenance and construction projects.
Hazard(s) Addressed: Drought, Earthquakes, Extreme Heat, Flood, High Wind, Landslide, Thunderstorm, Tornado, Severe Winter Storms, and Wildland/Urban Interface Fire
Mitigation Action Types: Local Plans and Regulations, Structural and Infrastructure Projects
Responsible Organization: PPD, SRS, OEM
Estimated Costs: Low-High
Possible Funding Sources: FEMA, UNM
Timeline for Implementation:
Within one year of Plan adoption
Cost-Benefit Review High benefit, cost incorporated into maintenance and construction project budget. Long term investment for the institution. Pays for itself over time.
STAPLEE Review No concerns raised
Priority High
Continuity of Operations Plans and Disaster Recovery Plans
Project Description/Comments:
Create Continuity of Operations Plans (COOP) and Disaster Recovery
Plans (DR) for individual business units as well as University-wide.
Hazard(s) Addressed: Drought, Earthquakes, Extreme Heat, Flood, High Wind, Landslide, Thunderstorm, Tornado, Severe Winter Storms, and Wildland/Urban Interface Fire
Mitigation Action Type: Local Plans and Regulations
Responsible Organization: OEM
Estimated Costs: Low
Possible Funding Sources: UNM
Timeline for Implementation:
Within one year of Plan adoption
Cost-Benefit Review High benefit, low cost strategy
STAPLEE Review No concerns raised
Priority High
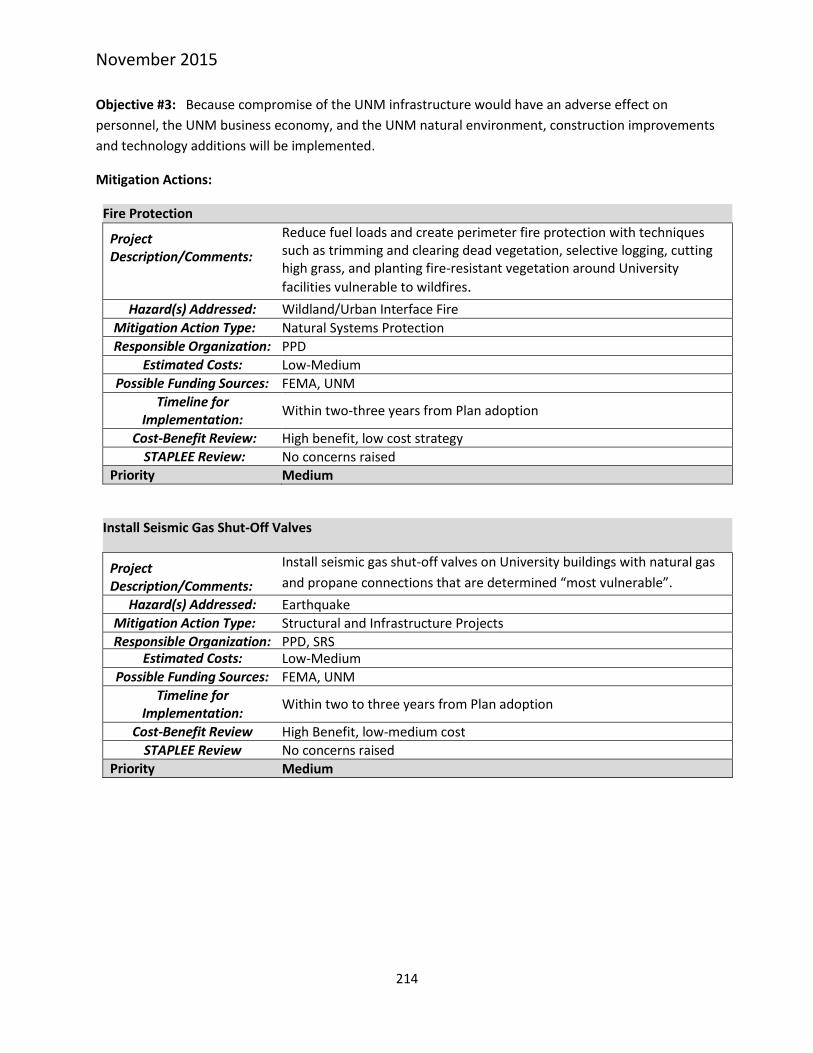
November 2015
214
Objective #3: Because compromise of the UNM infrastructure would have an adverse effect on
personnel, the UNM business economy, and the UNM natural environment, construction improvements
and technology additions will be implemented.
Mitigation Actions:
Fire Protection
Project Description/Comments:
Reduce fuel loads and create perimeter fire protection with techniques such as trimming and clearing dead vegetation, selective logging, cutting high grass, and planting fire-resistant vegetation around University
facilities vulnerable to wildfires.
Hazard(s) Addressed: Wildland/Urban Interface Fire
Mitigation Action Type: Natural Systems Protection
Responsible Organization: PPD Estimated Costs: Low-Medium
Possible Funding Sources: FEMA, UNM Timeline for
Implementation: Within two-three years from Plan adoption
Cost-Benefit Review: High benefit, low cost strategy
STAPLEE Review: No concerns raised
Priority Medium
Install Seismic Gas Shut-Off Valves
Project Description/Comments:
Install seismic gas shut-off valves on University buildings with natural gas
and propane connections that are determined “most vulnerable”.
Hazard(s) Addressed: Earthquake Mitigation Action Type: Structural and Infrastructure Projects
Responsible Organization: PPD, SRS Estimated Costs: Low-Medium
Possible Funding Sources: FEMA, UNM
Timeline for Implementation:
Within two to three years from Plan adoption
Cost-Benefit Review High Benefit, low-medium cost STAPLEE Review No concerns raised
Priority Medium

November 2015
215
Installation of Window Film
Project Description/Comments:
Install window film in critical facilities to control the amount of heat that enters the building and to prevent injuries from shattered glass.
Hazard(s) Addressed: Extreme Heat, High Wind, and Thunderstorm
Mitigation Action Type: Structural and Infrastructure Projects
Responsible Organization: PPD, SRS
Estimated Costs: Low-Medium
Possible Funding Sources: FEMA, UNM
Timeline for Implementation:
Within two to three years from Plan adoption
Cost-Benefit Review Relatively low cost, high benefit strategy STAPLEE Review No concerns raised
Priority Medium
Install Alarm System and Notification System
Project Description/Comments:
Install a University-wide centralized, monitored, and secure alarm and
disbursed notification system to protect critical building systems including
HVAC, surveillance, and access in all critical health, research, utility and
information technologies facilities from natural hazard occurrences.
Hazard(s) Addressed: Earthquakes, Extreme Heat, Flood, High Wind, Thunderstorm, Tornado, and Severe Winter Storms
Mitigation Action Type: Structural and Infrastructure Projects
Responsible Organization: PPD
Estimated Costs: High Possible Funding Sources: FEMA, UNM
Timeline for Implementation:
Within three-five years from Plan adoption
Cost-Benefit Review Benefits of protecting infrastructure will exceed high cost
STAPLEE Review No concerns raised
Priority Low (will take a lot of preliminary action to build support)
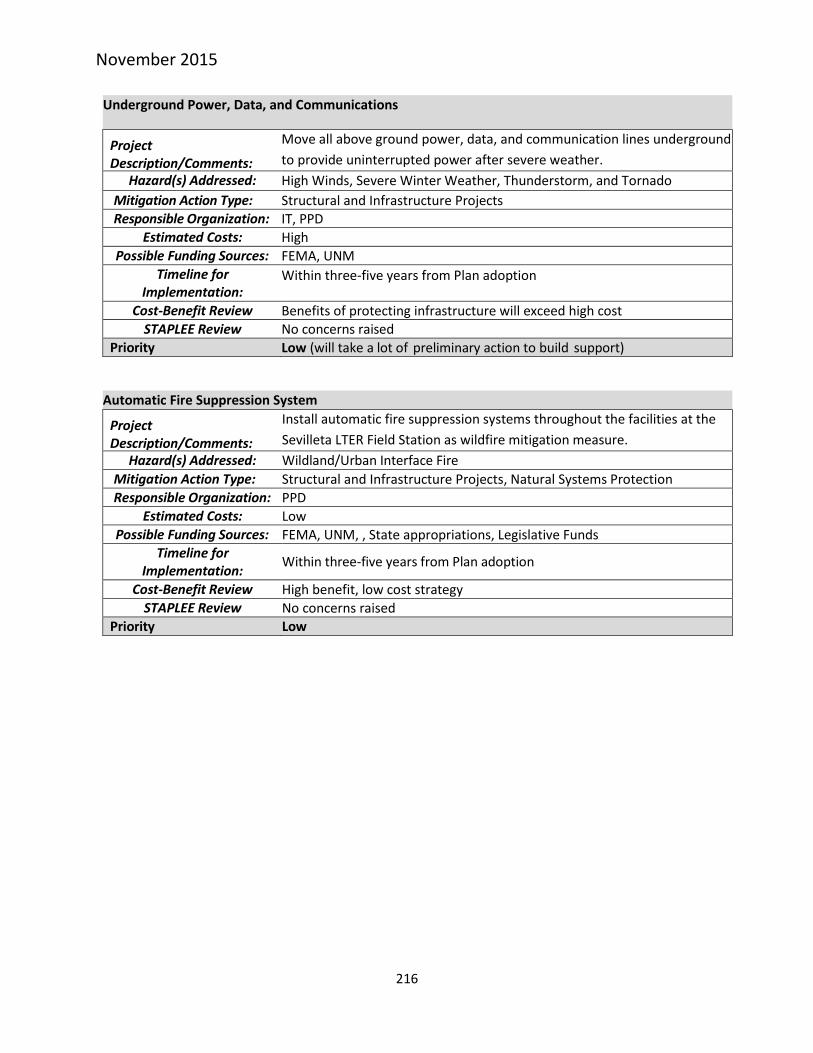
November 2015
216
Underground Power, Data, and Communications
Project Description/Comments:
Move all above ground power, data, and communication lines underground
to provide uninterrupted power after severe weather.
Hazard(s) Addressed: High Winds, Severe Winter Weather, Thunderstorm, and Tornado
Mitigation Action Type: Structural and Infrastructure Projects Responsible Organization: IT, PPD
Estimated Costs: High Possible Funding Sources: FEMA, UNM
Timeline for Implementation:
Within three-five years from Plan adoption
Cost-Benefit Review Benefits of protecting infrastructure will exceed high cost
of project. STAPLEE Review No concerns raised
Priority Low (will take a lot of preliminary action to build support)
Automatic Fire Suppression System
Project Description/Comments:
Install automatic fire suppression systems throughout the facilities at the
Sevilleta LTER Field Station as wildfire mitigation measure.
Hazard(s) Addressed: Wildland/Urban Interface Fire
Mitigation Action Type: Structural and Infrastructure Projects, Natural Systems Protection Responsible Organization: PPD
Estimated Costs: Low Possible Funding Sources: FEMA, UNM, , State appropriations, Legislative Funds
Timeline for Implementation:
Within three-five years from Plan adoption
Cost-Benefit Review High benefit, low cost strategy STAPLEE Review No concerns raised
Priority Low

November 2015
217
Objective #4: Remove barriers to effective communication regarding the hazards that could impact the
campus and people, in order to serve the broad mission of the university to provide educational
opportunities at all academic levels, and to serve a wide and diverse community.
Mitigation Actions:
Create Multi-Lingual, Mufti-Cultural, and Multi-Media Crisis Communication and Education Materials
Project Description/Comments:
Create and disseminate multi-lingual, multi-cultural and multi-media
crisis communication and education materials designed to reduce hazard
risk in formats readily accessible and available to all members of the
UNM community.
Hazard(s) Addressed: Drought, Earthquakes, Extreme Heat, Flood, High Wind, Landslide, Thunderstorm, Tornado, Severe Winter Storms, and Wildland/Urban Interface Fire
Mitigation Action Type: Public Education and Awareness
Responsible Organization: UCAM, OEM, SRS
Estimated Costs: Low
Possible Funding Sources: FEMA, UNM
Timeline for Implementation:
Within one year of Plan adoption
Cost-Benefit Review High benefit, low cost strategy
STAPLEE Review No concerns raised
Priority High
Public Awareness / Education Program
Project Description/Comments:
Create a public awareness / education program, which identifies educational resources and training opportunities for all members of the UNM community.
Hazard(s) Addressed: Drought, Earthquakes, Extreme Heat, Flood, High Wind, Landslide, Thunderstorm, Tornado, Severe Winter Storms, and Wildland/Urban Interface Fire
Mitigation Action Type: Public Education and Awareness
Responsible Organization: UCAM, HSC Communications
Estimated Costs: Low
Possible Funding Sources: FEMA, UNM
Timeline for Implementation:
Begin within one year of Plan adoption
Cost-Benefit Review High benefit, low cost strategy
STAPLEE Review No concerns raised
Priority High
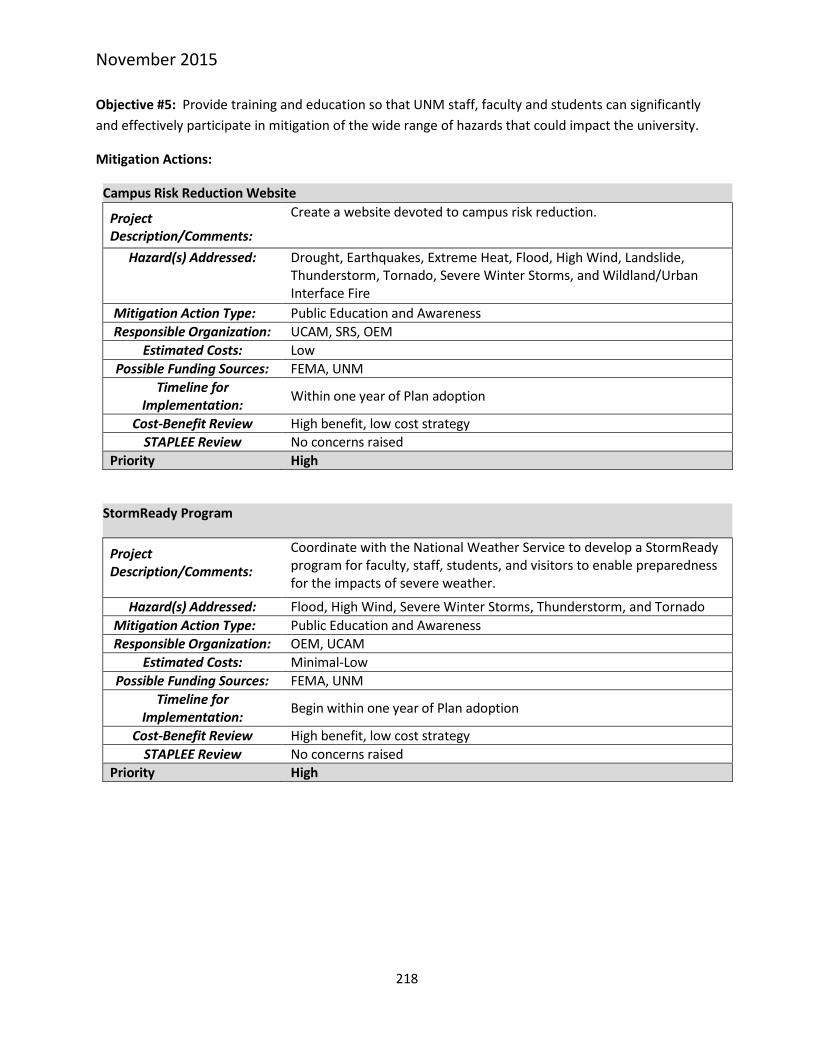
November 2015
218
Objective #5: Provide training and education so that UNM staff, faculty and students can significantly
and effectively participate in mitigation of the wide range of hazards that could impact the university.
Mitigation Actions:
Campus Risk Reduction Website
Project Description/Comments:
Create a website devoted to campus risk reduction.
Hazard(s) Addressed: Drought, Earthquakes, Extreme Heat, Flood, High Wind, Landslide, Thunderstorm, Tornado, Severe Winter Storms, and Wildland/Urban Interface Fire
Mitigation Action Type: Public Education and Awareness
Responsible Organization: UCAM, SRS, OEM
Estimated Costs: Low
Possible Funding Sources: FEMA, UNM
Timeline for Implementation:
Within one year of Plan adoption
Cost-Benefit Review High benefit, low cost strategy
STAPLEE Review No concerns raised
Priority High
StormReady Program
Project Description/Comments:
Coordinate with the National Weather Service to develop a StormReady program for faculty, staff, students, and visitors to enable preparedness for the impacts of severe weather.
Hazard(s) Addressed: Flood, High Wind, Severe Winter Storms, Thunderstorm, and Tornado
Mitigation Action Type: Public Education and Awareness Responsible Organization: OEM, UCAM
Estimated Costs: Minimal-Low
Possible Funding Sources: FEMA, UNM
Timeline for Implementation:
Begin within one year of Plan adoption
Cost-Benefit Review High benefit, low cost strategy
STAPLEE Review No concerns raised
Priority High

November 2015
219
Training
Project Description/Comments:
Provide training for UNM employees and affiliates on emergency preparedness, mitigation strategies and any other plans developed through this process.
Hazard(s) Addressed: Drought, Earthquakes, Extreme Heat, Flood, High Wind, Landslide, Thunderstorm, Tornado, Severe Winter Storms, and Wildland/Urban Interface Fire
Mitigation Action Type: Public Education and Awareness
Responsible Organization: SRS, OEM, UCAM
Estimated Costs: Low
Possible Funding Sources: FEMA, UNM
Timeline for Implementation:
Within one year of Plan adoption
Cost-Benefit Review Low cost, high benefit STAPLEE Review No concerns raised
Priority High
While these mitigation actions represent the current priorities (high, medium, and low) of the mitigation
planning process, further actions will be addressed as an on-going process. The PDMAC will continue to
utilize the STAPLEE criteria, changing hazard conditions, and the institutions progress toward long-term
goals to determine the priority and implementation schedule other mitigation actions.
Action Plan for Implementation The grouping of strategies leads to a cycle of activity which should serve as a long-term model for
implementation and success. The cycle begins with a study of existing infrastructure and vulnerabilities.
From there, the planning process will establish the tactics to address opportunities that lead to long-
term resilience. Next is the incorporation of these strategies into ongoing maintenance and
construction projects through active involvement with the COC. The COC administers the process,
identifies potential targets for the following year in conjunction with Deans and Leadership, facilitates
communications with the Higher Education Department, and reviews the Comprehensive Capital Outlay
List for completeness, cost, and phasing. Capital Outlay projects are submitted annually for NM
Legislative funding after approval by the Dean (project specific), Provost, Executive Vice President of
Health Sciences Center, Executive Vice President of Administration, President and the Board of Regents.
This is the best opportunity to prevent future occurrences, or limit their impact by incorporating
mitigation actions into the UNM Master Plan and the 5 and 10-year Capital Outlay Plans. Finally, the
process will be maintained for long-term success by establishing on-going reviews and updates of the
vulnerabilities, strategies, and changes in infrastructure.
To institutionalize the mitigation planning process, the whole community must be engaged. This will be
accomplished through the communication of risks, strategies and expected actions, and by soliciting
feedback to improve the process. Training students, faculty, staff and visitors in risk reduction strategies
and responsibilities is the next step to make the process permanent.

November 2015
220
To overcome the organizational structure issues, planning and action will be at the function and
capability level rather than managerial or administrative unit. Strategies will be assigned to those
engaged partners and encourage partnerships. Planning will acknowledge the diverse educational
mission which may have roots in many different units across the campuses. Branch campuses will be
encouraged to work within their local governments as readily as they do within the institutional
structure for their mutual preparedness and mitigation efforts.
Any mitigation actions involving improvements or additions to UNM’s existing authorities, policies, and
programs and resources will follow the process by which UNM has set forth through the University
Administrative Policies and Procedures Manual. The UNM Policy Office develops new policies and
revises existing policies through a collaborative process. Input is solicited from representatives of
campus constituencies, including subject matter experts, Faculty Senate, Staff Council, Associated
Students of UNM, Graduate and Professional Students Association, Deans' Council, Health Sciences
Center Academic Affairs Office, Executive Vice President for Administration, Office of University Counsel,
and Executive Cabinet. After the Executive Cabinet has an opportunity to review and comment on
policy drafts, the entire campus community is given an opportunity to review and comment on the
policy drafts during a 30-day review and comment period.
The UNM Office of Emergency Management has been charged with the implementation of this plan. All
of the identified actions have been prioritized and assigned to specific individuals and functional
positions within the institution. The committee has agreed to meet on an annual basis at a minimum to
assure that implementation continues as scheduled, and that any issues that are identified are
addressed appropriately. The committee will also meet if a loss is suffered as a result of natural
disaster, or if the footprint or infrastructure of the institution changes so that the plan can be adjusted
accordingly.
Communication An effective communications plan is imperative for full implementation and institutionalization. Several
strategies will be engaged in order to gain buy-in, solicit input, and provide updates to those working
within the plan as well as members of the community at large. First, the website being used to inform
the public of the plan update progress will be modified to announce the final version. Notification will
also be given as a press release and released through the University Communications and Marketing
department via the website news.unm.edu. The community will also be notified through updates
provided through the University President, Provost, Executive Vice-President and Chancellor. Students,
Faculty and Staff will also receive updates as part of the semesterly test of the Campus Warning Siren
System. Finally, as the new training modules are built and implemented, all of the above methods will
again be activated to share the information.

November 2015
221
Chapter 6 - Plan Maintenance The UNM HMP is a living document that will guide UNM’s actions over the next five years. In this plan
maintenance section the method and schedule and evaluation process is discussed.
Method and Schedule The lead agency for coordinating and monitoring the plan will be the UNM Office of Emergency
Management (OEM). OEM and PDMAC will work together to review and monitor the UNM HMP at a
minimum of every six months to assure that no required actions fall behind schedule. Any changes to
the HMP will be updated as plan maintenance is conducted. OEM will stay current with federal and state
laws, statutes, and grant programs and will advise UNM of changes that affect them.
OEM, or designated member(s) of the PDMAC, will ensure that the HMP remains up to date and that
UNM is ready for the next 5-year update. Specific tasks OEM is responsible for include:
1. Maintain a list of “in progress” and “completed” mitigation action items
2. Prepare reports, perform site visits, and maintain files for mitigation grants received
3. Document UNM’s physical and functional changes and additions
4. Document changes in natural hazards
5. Maintain an up to date list of UNM’s disaster history
6. Maintain an up to date list of UNM’s critical assets and infrastructure
7. Advocate for progress in achieving mitigation goals
8. Submit annual reports to NMDHSEM and the PDMAC
9. Hold an annual meeting with the NMDHSEM Mitigation Officer (at a minimum)
10. Hold meetings with the PDMAC as necessary (at least once a year).
11. Attend Capital Outlay meetings
12. Keep the PDM website up to date
13. Document records of correspondence, phone calls, financial transactions, meetings, and other
pertinent information regarding the HMP
Annual meetings will be planned with the PDMAC and NMDHSEM over the next three years. Ad hoc and
meetings to address critical issues will be held in the interim as needed. At the annual PDMAC meeting,
OEM will report the status of various mitigation projects being funded by the State/FEMA throughout
UNM. These reports will include, but are not limited to, the following information:
1. Name of FEMA grant program
2. Applicant name
3. Title of project
4. Brief description of project
5. Location of project
6. Which goal and objective this project works toward
7. Amount of funding requested, allocated, and obligated
8. Amount of funding paid

November 2015
222
9. Problems encountered
10. Benefits achieved
11. Projected completion date
In OEM’s report, each on-going project will be linked to one or more of the action items identified in the
mitigation strategies. Action items for which there are no projects will also be identified. This process
will allow the PDMAC to focus on action items that either might be favored for future funding or be
deleted from the list. These reports will be available through the UNM mitigation website for public
review and comment.
In November of 2018, OEM will reconvene monthly meetings with the PDMAC to ramp up mitigation
planning activities in preparation for the 2020 mitigation plan update.
Public Participation Public participation in plan maintenance will be accomplished by utilizing the University Communication
and Marketing Office (UCAM) and the mitigation website. UCAM provides news, social media, and
media relations services. UCAM staff participate in in the PDMAC and have agreed to assist in delivering
messages regarding the plan, risks, risk reduction strategies, expected actions, and more to the public
through the plan maintenance stage. The mitigation website will continue to host all information
pertaining to the plan, including the plan itself. The public will be invited to annual mitigation meetings
over the next five years. These meetings will be announced on both the mitigation website and through
UCAM outlets.
Evaluation Process Progress will be evaluated to gauge effectiveness of the plan, mitigation goals, and actions items. OEM
will convene annual meeting with PDMAC to review the plan. PDMAC will assist OEM in reviewing and
evaluating the mitigation goals and objectives with respect to continuing relevance and will consider
priorities. The PDMAC may change the wording of goals and objectives, and may write new ones.
OEM will perform interim inspections (if needed) and final inspections of mitigation projects funded by
federal grants. These inspections will include whatever paperwork is required by the granting agency as
well as photographs and other documentation from the grant recipient that may be useful in
establishing the value and importance of the project. These reports will be incorporated into the annual
update.
OEM will attempt to document these cases whenever there is anything specific to record. However,
often when mitigation is successful, often nothing happens, and one must presume that something
serious would have happened had not the project been done.
OEM will also collect and report examples of situations where mitigating actions would probably have
prevented significant damage, as well as examples of failed mitigation projects, should any occur.

November 2015
223
OEM will report any mitigation success stories at the annual meeting for inclusion in the yearly annex.
Additionally, mitigation success stories will be posted on the UNM mitigation website for the public to
review and provide comment as necessary.

November 2015
Appendix A: Local Mitigation Planning Tool

LOCAL MITIGATION PLAN REVIEW TOOL The Local Mitigation Plan Review Tool demonstrates how the Local Mitigation Plan meets the regulation in 44 CFR §201.6 and offers States and FEMA Mitigation Planners an opportunity to provide feedback to the community.
• The Regulation Checklist provides a summary of FEMA’s evaluation of whether the Plan has addressed all requirements.
• The Plan Assessment identifies the plan’s strengths as well as documents areas for future improvement.
• The Multi-jurisdiction Summary Sheet is an optional worksheet that can be used to document how each jurisdiction met the requirements of the each Element of the Plan (Planning Process; Hazard Identification and Risk Assessment; Mitigation Strategy; Plan Review, Evaluation, and Implementation; and Plan Adoption).
The FEMA Mitigation Planner must reference this Local Mitigation Plan Review Guide when completing the Local Mitigation Plan Review Tool. Jurisdiction: University of New Mexico
Title of Plan: University of New Mexico Hazard Mitigation Plan
Date of Plan: August 2015
Local Point of Contact: Laura Banks Address: 1 University of New Mexico MSC 11 6025 Albuquerque, NM 87131
Title: Principal Investigator
Agency: UNM Department of Emergency Medicine
Phone Number: (505) 272-6240 [email protected]
State Reviewer: Denay Webb Title: H2O Partners, Mitigation Associate
Date: Oct. 7, 2015
FEMA Reviewer:
Title:
Date:
Date Received in FEMA Region VI
Plan Not Approved
Plan Approvable Pending Adoption
Plan Approved

SECTION 1: REGULATION CHECKLIST
INSTRUCTIONS: The Regulation Checklist must be completed by FEMA. The purpose of the Checklist is to identify the location of relevant or applicable content in the Plan by Element/sub-element and to determine if each requirement has been ‘Met’ or ‘Not Met.’ The ‘Required Revisions’ summary at the bottom of each Element must be completed by FEMA to provide a clear explanation of the revisions that are required for plan approval. Required revisions must be explained for each plan sub-element that is ‘Not Met.’ Sub-elements should be referenced in each summary by using the appropriate numbers (A1, B3, etc.), where applicable. Requirements for each Element and sub-element are described in detail in this Plan Review Guide in Section 4, Regulation Checklist.
1. REGULATION CHECKLIST Location in Plan (section and/or page number) Met
Not Met Regulation (44 CFR 201.6 Local Mitigation Plans)
ELEMENT A. PLANNING PROCESS
A1. Does the Plan document the planning process, including how it was prepared and who was involved in the process for each jurisdiction? (Requirement §201.6(c)(1))
How - pgs. 19-26 Who - pgs. 21-23 X
A2. Does the Plan document an opportunity for neighboring communities, local and regional agencies involved in hazard mitigation activities, agencies that have the authority to regulate development as well as other interests to be involved in the planning process? (Requirement §201.6(b)(2))
pgs. 22-24, 26, app. B & C
X
A3. Does the Plan document how the public was involved in the planning process during the drafting stage? (Requirement §201.6(b)(1))
pgs. 23-24, app. C X
A4. Does the Plan describe the review and incorporation of existing plans, studies, reports, and technical information? (Requirement §201.6(b)(3))
CH. 4 -
incorporated into
each hazard pgs.
46-203 Earthquake
Scenario - pg.
203-205
X
A5. Is there discussion of how the community(ies) will continue public participation in the plan maintenance process? (Requirement §201.6(c)(4)(iii))
Communication pg. 220 Public participation pg. 222 X
A6. Is there a description of the method and schedule for keeping the plan current (monitoring, evaluating and updating the mitigation plan within a 5-year cycle)? (Requirement §201.6(c)(4)(i))
Method and
Schedule - pgs. 221-
222
Evaluation - pgs. 222-223
X
ELEMENT A: REQUIRED REVISIONS ELEMENT A: RECOMMENDED REVISIONS

ELEMENT B. HAZARD IDENTIFICATION AND RISK ASSESSMENT
B1. Does the Plan include a description of the type, location, and extent of all natural hazards that can affect each jurisdiction(s)? (Requirement §201.6(c)(2)(i))
Ch. 4 - incorporated
into each hazard
starts on pg. 46-203
X
B2. Does the Plan include information on previous occurrences of hazard events and on the probability of future hazard events for each jurisdiction? (Requirement §201.6(c)(2)(i))
Ch. 4 -
incorporated into
each hazard under
Previous
Occurrences and
Probabilities
Sections pgs.46-
203
X
B3. Is there a description of each identified hazard’s impact on the community as well as an overall summary of the community’s vulnerability for each jurisdiction? (Requirement §201.6(c)(2)(ii))
Ch. 4 - incorporated into each hazard under Impact to UNM Sections pgs. 46-203
X
B4. Does the Plan address NFIP insured structures within the jurisdiction that have been repetitively damaged by floods? (Requirement §201.6(c)(2)(ii))
pg. 99 X
ELEMENT B: REQUIRED REVISIONS
ELEMENT B: RECOMMENDED REVISIONS
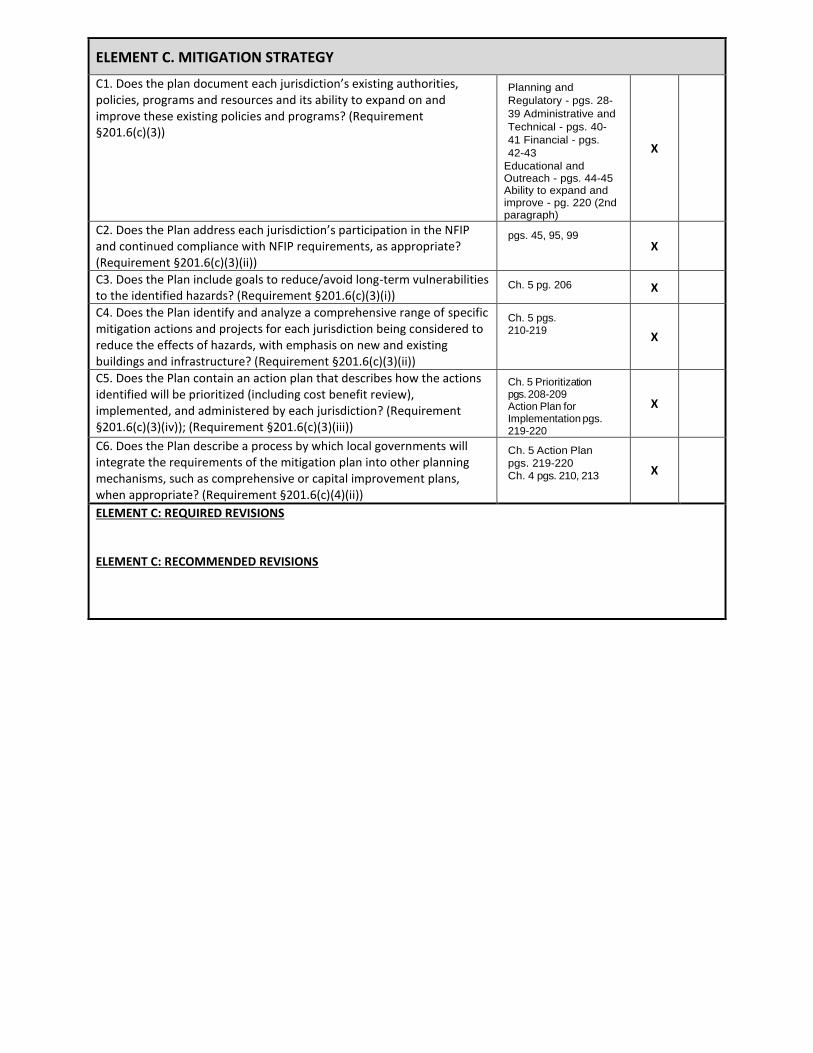
ELEMENT C. MITIGATION STRATEGY
C1. Does the plan document each jurisdiction’s existing authorities, policies, programs and resources and its ability to expand on and improve these existing policies and programs? (Requirement §201.6(c)(3))
Planning and
Regulatory - pgs. 28-
39 Administrative and
Technical - pgs. 40-
41 Financial - pgs.
42-43
Educational and Outreach - pgs. 44-45 Ability to expand and improve - pg. 220 (2nd paragraph)
X
C2. Does the Plan address each jurisdiction’s participation in the NFIP and continued compliance with NFIP requirements, as appropriate? (Requirement §201.6(c)(3)(ii))
pgs. 45, 95, 99 X
C3. Does the Plan include goals to reduce/avoid long-term vulnerabilities to the identified hazards? (Requirement §201.6(c)(3)(i))
Ch. 5 pg. 206 X
C4. Does the Plan identify and analyze a comprehensive range of specific mitigation actions and projects for each jurisdiction being considered to reduce the effects of hazards, with emphasis on new and existing buildings and infrastructure? (Requirement §201.6(c)(3)(ii))
Ch. 5 pgs. 210-219
X
C5. Does the Plan contain an action plan that describes how the actions identified will be prioritized (including cost benefit review), implemented, and administered by each jurisdiction? (Requirement §201.6(c)(3)(iv)); (Requirement §201.6(c)(3)(iii))
Ch. 5 Prioritization pgs. 208-209 Action Plan for Implementation pgs. 219-220
X
C6. Does the Plan describe a process by which local governments will integrate the requirements of the mitigation plan into other planning mechanisms, such as comprehensive or capital improvement plans, when appropriate? (Requirement §201.6(c)(4)(ii))
Ch. 5 Action Plan
pgs. 219-220
Ch. 4 pgs. 210, 213 X
ELEMENT C: REQUIRED REVISIONS ELEMENT C: RECOMMENDED REVISIONS

ELEMENT D. PLAN REVIEW, EVALUATION, AND IMPLEMENTATION (applicable to plan updates only)
D1. Was the plan revised to reflect changes in development? (Requirement §201.6(d)(3))
pgs. 26-27, 56-57 X
D2. Was the plan revised to reflect progress in local mitigation efforts? (Requirement §201.6(d)(3))
Ch. 5 pgs. 206-207 X
D3. Was the plan revised to reflect changes in priorities? (Requirement §201.6(d)(3))
Ch. 5 pgs. 207-208 X
ELEMENT D: REQUIRED REVISIONS
ELEMENT E. PLAN ADOPTION
E1. Does the Plan include documentation that the plan has been formally adopted by the governing body of the jurisdiction requesting approval? (Requirement §201.6(c)(5))
X
E2. For multi-jurisdictional plans, has each jurisdiction requesting approval of the plan documented formal plan adoption? (Requirement §201.6(c)(5))
X
ELEMENT E: REQUIRED REVISIONS
ELEMENT F. ADDITIONAL STATE REQUIREMENTS (OPTIONAL FOR STATE REVIEWERS ONLY; NOT TO BE COMPLETED BY FEMA)
F1.
F2.
ELEMENT F: REQUIRED REVISIONS

November 2015
Appendix B: Committee Attachments

FEMA Pre-Disaster Mitigation Plan Update
Meeting Agenda
Date: Wednesday, December 17, 2014 Time: 10:00am - 11:00 Location: Anthropology Rm 248
I. Welcome and introductions
II. Overview of the current UNM Pre-Disaster Mitigation Plan and planning process
III. Overview of the requirements for the 5-year plan update
IV. Discussion of planning team roles
V. Discussion of near-term tasks for planning team
a. Finalize team membership and meeting schedule
b. Identify UNM disaster events since 2010
c. Re-establish public outreach and participation
VI. Discussion of future tasks for planning team
a. Review progress toward mitigation priorities from current plan
b. Update the hazard analysis
c. Update the university profile, vulnerabilities, and list of critical infrastructure
d. Create new or carry forward priorities for next 5-year period
e. Other tasks
VII. Other discussion
Future meetings will be held on the second Wednesday of each month from 10:00 - 11:00 in the Roberts Room in Scholes Hall. Please send a proxy to the meeting if you cannot attend. The dates are as follows: 1/14/2015, 2/11/2015, 3/11/2015, 4/8/2015, 5/13/2015, 6/10/2015, 7/8/2015, 8/12/2015, 9/9/2015, 10/14/2015 and 11/11/2015. Contact information: Byron Piatt UNM Emergency Manager 277-0330 [email protected] Dr. Laura Banks Principal Investigator 272-6279 [email protected] Ashley M. VanderJagt Program Specialist 272-4523 [email protected]

1 | P a g e
FEMA Pre-Disaster Mitigation Plan Update
Meeting Minutes
Date: Wednesday, December 17, 2014 Time: 10:00am - 11:00 Location: Anthropology Rm 248 In attendance: Mark Reynolds, Byron Piatt, Laura Banks, Ashley M. Vanderjagt, Gary Surad, Deb Kuidis, Adelicia Gunn, Ed Padilla, Scott Dotson, Stephen Lockwood, Michael Tuttle, Jeff Zumwalt, Shirley Baros, Tim Muller, Rodger Ebner, Robert Perry, Wayne Sullivan and Kevin Ferrell Project overview and timeline: An approved Pre-Disaster Mitigation (PDM) Plan is required by FEMA and other departments in the federal government in order to commit funding for many types of research and other contracts, as well as for the disbursement of disaster mitigation and recovery funds. UNM currently has an approved PDM plan developed by this committee in 2010, but that plan is set to expire in 2015. The UNM Department of Emergency Medicine, with Dr. Laura Banks as the Principal Investigator, received a contract from FEMA via the New Mexico Department of Homeland Security and Emergency Management (NMDHSEM), to provide partial funding to assist with the required update of the PDM plan. The original committee, plus new members, has been re-convened to update the plan and will meet monthly through November of 2015. At that time, the final draft of the updated plan will be submitted to NMDSHEM and then to FEMA for approval. The format of the updated PDM plan will differ slightly from the current plan, and will follow the new format of the State's PDM plan. The PDM plan addresses only natural hazards, whereas other types of hazards are addressed by the UNM Emergency Management Committee and other coordinated plans. Committee tasks: The members of the committee are asked to consider five potential types of updates that have occurred at the main or branch campuses since 2010 and be ready to report at the next meeting: 1. Buildings added to the campus domain 2. Buildings removed from the campus domain 3. Other infrastructure changes 4. Natural hazard incidences/events that have impacted any part of the campus 5. Physical damage from natural hazards that has occurred on any part of the campus The next meeting will include a review of the current Hazard and Vulnerability Analysis results and the plan to update the data in that portion of the plan.
2 | P a g e
Committee Membership: Many of the previous members of the committee have agree to participate in the plan update and are either present at this first meeting, or have contacted Byron Piatt to re-commit to the project. Branch campus membership on the committee will be directed by the UNM Offices of the President and Provost. The committee members are asked to review the list of previous members and identify individuals who have retired or moved to different positions, and suggest alternatives. Communication: Committee communication and sharing of documents among UNM employees will be done through the UNM SharePoint site. The site can be accessed by logging into the UNM's Outlook account. (Log in to lobomail.unm.edu using your UNM NetID and Password, click on the OneDrive in the blue menu bar, then click on "Shared with me" in the left frame. If you don't have access, please send Byron an email and ask him to Share the folder with you.) Committee communication and sharing of documents for non-UNM members will be done via email. Public outreach and communication will be an important part of the process in order to gain input from non-committee members and the general public. This will be done through a general website which is under development, and via press releases. In addition, individual neighborhood associations and other interested stakeholders will be contacted for input and participation. Future meetings: Future meetings will be held on the second Wednesday of each month from 10:00 - 11:00 in the Roberts Room on the second floor of Scholes Hall. Please send a proxy to the meeting if you cannot attend. The dates are as follows: 1/14/2015, 2/11/2015, 3/11/2015, 4/8/2015, 5/13/2015, 6/10/2015, 7/8/2015, 8/12/2015, 9/9/2015, 10/14/2015 and 11/11/2015. Contact information: Byron Piatt UNM Emergency Manager 277-0330 [email protected] Dr. Laura Banks Principal Investigator 272-6279 [email protected] Ashley M. VanderJagt Program Specialist 272-4523 [email protected]


FEMA Pre-Disaster Mitigation Plan Update
Meeting Agenda
Date: Wednesday, January 14, 2015 Time: 10:00am - 11:00 Location: UNM, Scholes Hall, Roberts Room
I. Welcome and introductions
II. Review of PDM planning committee and vacancies
III. Questions/comments regarding committee task to review 2010 plan
IV. Progress update from administrative team
V. Homework for committee
a. Hazard vulnerability update
b. Identify UNM disaster events since 2010
c. Update critical infrastructure list
VI. Discussion of future tasks for planning team
a. Review progress toward mitigation priorities from current plan
b. Create new or carry forward priorities for next 5-year period
c. Other tasks
VII. Other discussion
Meetings will be held on the second Wednesday of each month from 10:00 - 11:00 in the Roberts Room in Scholes Hall. Please send a proxy to the meeting if you cannot attend. The dates are as follows: 2/11/2015, 3/11/2015, 4/8/2015, 5/13/2015, 6/10/2015, 7/8/2015, 8/12/2015, 9/9/2015, 10/14/2015 and 11/11/2015. Contact information: Byron Piatt UNM Emergency Manager 277-0330 [email protected] Dr. Laura Banks Principal Investigator 272-6279 [email protected] Ashley M. VanderJagt Program Specialist 272-4523 [email protected]

1 | P a g e
FEMA Pre-Disaster Mitigation Plan Update
Meeting Minutes
Date: Wednesday, January 14, 2015 Time: 10:00am - 11:00 Location: UNM, Scholes Hall, Roberts Room In attendance: Mark Reynolds, Byron Piatt, Laura Banks, Ashley M. Vanderjagt, Deb Kuidis, Scott Dotson, Stephen Lockwood, Jeff Zumwalt, Shirley Baros, Robert Perry, Wayne Sullivan, Joan Green, Ruth Stoddard, Jim Shrum, Jeff Gassaway, Eric Wood, Tim Gutierrez, and Billy Hromas. Update on project purpose: An approved Pre-Disaster Mitigation (PDM) Plan is required by FEMA and other departments in the federal government in order to commit funding for many types of research and other contracts, as well as for the disbursement of disaster mitigation and recovery funds. UNM currently has an approved PDM plan developed by this committee in 2010, but that plan is set to expire in 2015. The original committee, plus new members, has been re-convened to update the plan and will meet monthly through November of 2015. At that time, the final draft of the updated plan will be submitted to NMDSHEM and then to FEMA for approval. The format of the updated PDM plan will differ slightly from the current plan, and will follow the new format of the State's PDM plan. The PDM plan addresses only natural hazards, whereas other types of hazards are addressed by the UNM Emergency Management Committee and other coordinated plans. Public outreach and communication update: The project’s public website is currently off-line and being migrated to the UNM IT server. The target time frame for re-activation with the current project information is within 3 weeks. The site will be used for sharing project information with the public as well as among Committee members. The website will likely replace SharePoint for Committee communication. [Instructions for using SharePoint are in the December 2014 meeting minutes.] Questions and comments regarding the current PDM plan and planning process: The Maxwell Museum was not evaluated in the 2010 plan, and there are likely other museum collections throughout the UNM system that are also not represented or are undervalued. This will be a priority update for the 2015 plan. The current version of the PDM Committee does not have representatives from the branch campus or the student body. The Committee members present offered suggestions for remedy including contacting the Provost office and investigating the use of video conferencing to facility participation.

2 | P a g e
The PDM administrative team is working on updating the UNM background section of the current plan, and confirming and updating the hazard profiles. Hazard and Vulnerability Analysis update: The committee discussed the various methods available to review and update the campus vulnerability to hazards. The PDM administrative team will review the methods used in the previous plan and meet with the State planning officer to determine the best way to move forward. Updated information and recommendations for next steps will be sent to the Committee vie email or on SharePoint. Committee members are requested to review the critical facilities section of the current plan (Chapter 6) and recommend updates or edits to the Committee. Future meetings: Future meetings will be held on the second Wednesday of each month from 10:00 - 11:00 in the Roberts Room on the second floor of Scholes Hall. Please send a proxy to the meeting if you cannot attend. The dates are as follows: 2/11/2015, 3/11/2015, 4/8/2015, 5/13/2015, 6/10/2015, 7/8/2015, 8/12/2015, 9/9/2015, 10/14/2015 and 11/11/2015. Contact information: Byron Piatt UNM Emergency Manager 277-0330 [email protected] Dr. Laura Banks Principal Investigator 272-6279 [email protected] Ashley M. VanderJagt Program Specialist 272-4523 [email protected]
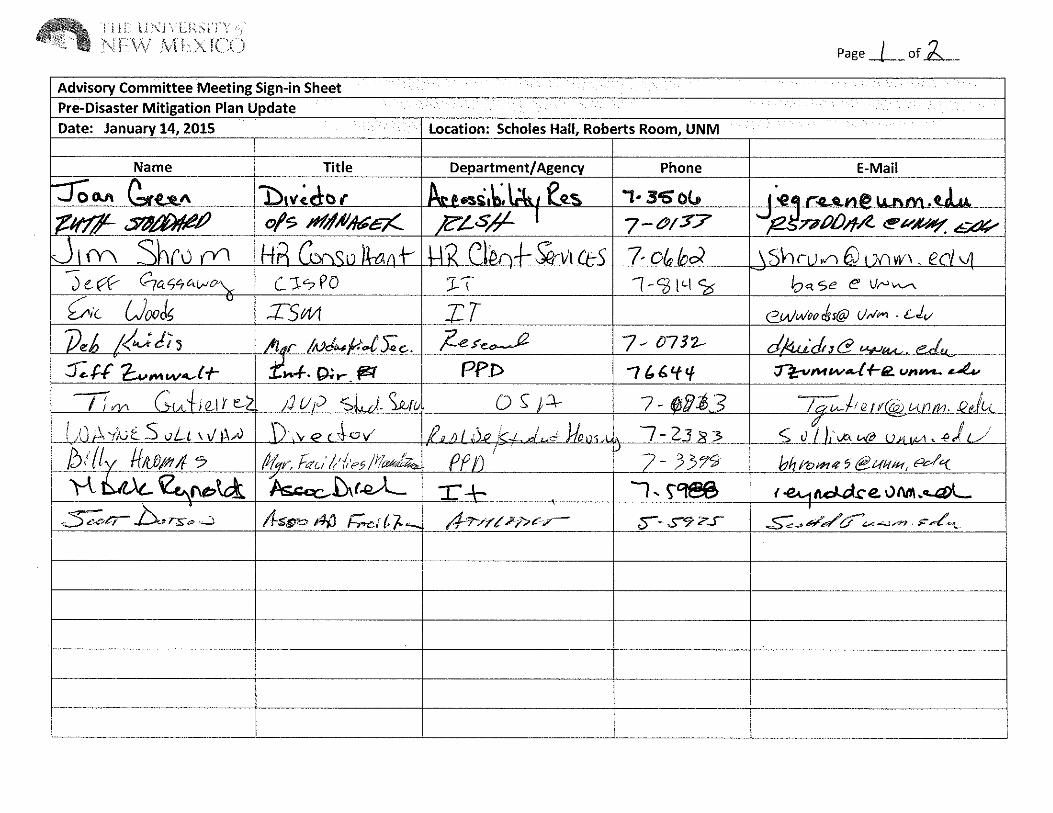
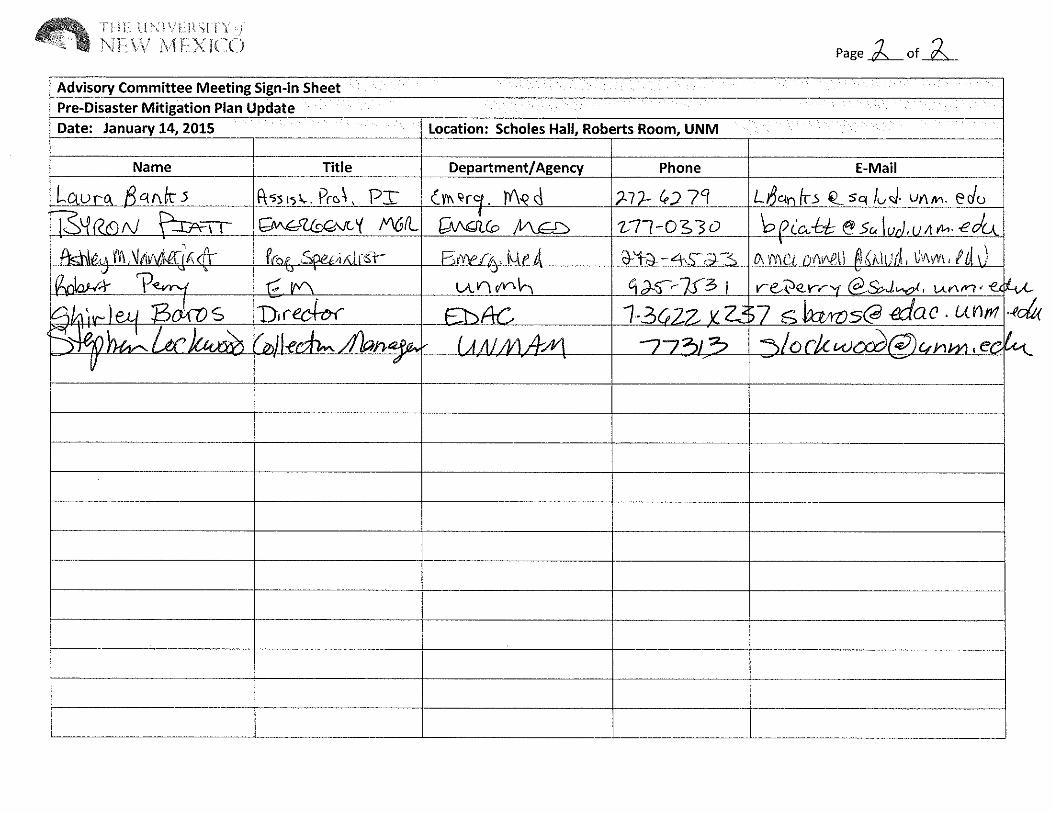

FEMA Pre-Disaster Mitigation Plan Update
Meeting Agenda
Date: Wednesday, February 11, 2015 Time: 10:00am - 11:00 Location: UNM, Scholes Hall, Roberts Room
I. Welcome and introductions
II. Outreach plan and progress
a. Website is up and running - http://mitigationplan.unm.edu
b. Outreach to partners and stakeholders
III. Report on the meeting with our representative from the NM Department of Homeland Security and Emergency Management regarding the requirement for the plan update process and product
a. Local Mitigation Planning Handbook - https://www.fema.gov/media-library/assets/documents/31598
IV. Critical facilities list - need to update
V. History of UNM hazard events - need to update
VI. Discussion of future tasks for planning team
a. Review progress toward mitigation priorities from current plan
b. Create new or carry forward priorities for next 5-year period
c. Other tasks
VII. Other discussion
Meetings will be held on the second Wednesday of each month from 10:00 - 11:00 in the Roberts Room in Scholes Hall. Please send a proxy to the meeting if you cannot attend. The dates are as follows: 3/11/2015, 4/8/2015, 5/13/2015, 6/10/2015, 7/8/2015, 8/12/2015, 9/9/2015, 10/14/2015 and 11/11/2015. Contact information: Byron Piatt UNM Emergency Manager 277-0330 [email protected] Dr. Laura Banks Principal Investigator 272-6279 [email protected] Ashley M. VanderJagt Program Specialist 272-4523 [email protected]

FEMA Pre-Disaster Mitigation Plan Update
Meeting Minutes
Date: Wednesday, February 11, 2015 Time: 10:00am - 11:00 Location: UNM, Scholes Hall, Roberts Room In attendance: Byron Piatt, Laura Banks, Jim Shrum, Tim Muller, Joan Green, Ruth Stoddard, Rodger Abner, Robert Perry, Mark Reynolds, Billy Hromas, Shirley Baros, Deb Kuidis, Lex Snyder, Stephen Lockwood, and Ashley M. Vanderjagt. Outreach plan and progress: The project website is up and running and can be found at: http://mitigationplan.unm.edu . We will use the site to post general project information for both the public and the committee. Material that is sensitive for security purposes will be posted on the secured UNM Sharepoint site or sent via email. Members of the student body as well as members of the adjacent neighborhood associations will be invited to provide input to the PDM plan update. The administrative staff will identify appropriate contact sources, and meet with these representatives at their convenience. We will also seek input from the UNM branch campuses, but a representative has not yet been identified. Report on the meeting with our representative from the NM Department of Homeland Security and Emergency Management: The administrative team met on February 4th with Wendy Blackwell, our State Mitigation Officer, regarding the requirement for the plan update process and product. She recommended that we follow the guidance available in the FEMA document, Local Mitigation Planning Handbook (available at https://www.fema.gov/media-library/assets/documents/31598), to guide our update. The document includes the checklist items that will be used by NMDHSEM and FEMA to review our plan. She also encouraged UNM to work with the City of Albuquerque and Bernalillo County emergency management agencies to ensure that we align the hazard profiles used for the entire jurisdiction .
Critical facilities list: The committee reviewed the current list and discussed various facilities and locations that should be investigated as possible additions to the list. The committee came to a general consensus that detailed information regarding the vulnerability and value of specific facilities and assets should be redacted from openly posted documents for security reasons, but made available upon request and to FEMA for review. The discussion items were recorded by the administrative team which will follow up on the list update items.

History of UNM hazard events: Members of the committee with knowledge of hazard events that have occurred on UNM campuses since 2010 will submit those events to the administrative team for incorporation into the update. The committee also discussed additions to the "capacity and capabilities" description for UNM, to include the CCERT team, designation of UNM as a Storm Ready campus, and shared resources with other facilities. Funded mitigation projects for UNM: The committee discussed the outcomes of the successful application for funds to mitigate earthquake hazards for the UNM Museum of Southwest Biology (shelving anchors), and the pending application for funds for a lightening prediction system for Johnson Field and the north campus golf course. Future tasks for planning committee: In the upcoming months, the committee will review progress toward mitigation priorities from current plan, and create new or carry forward priorities for next 5-year period. Future meetings: Meetings will be held on the second Wednesday of each month from 10:00 - 11:00 in the Roberts Room in Scholes Hall. Please send a proxy to the meeting if you cannot attend. The dates are as follows: 3/11/2015, 4/8/2015, 5/13/2015, 6/10/2015, 7/8/2015, 8/12/2015, 9/9/2015, 10/14/2015 and 11/11/2015. Contact information: Byron Piatt UNM Emergency Manager 277-0330 [email protected] Dr. Laura Banks Principal Investigator 272-6279 [email protected] Ashley M. VanderJagt Program Specialist 272-4523 [email protected]

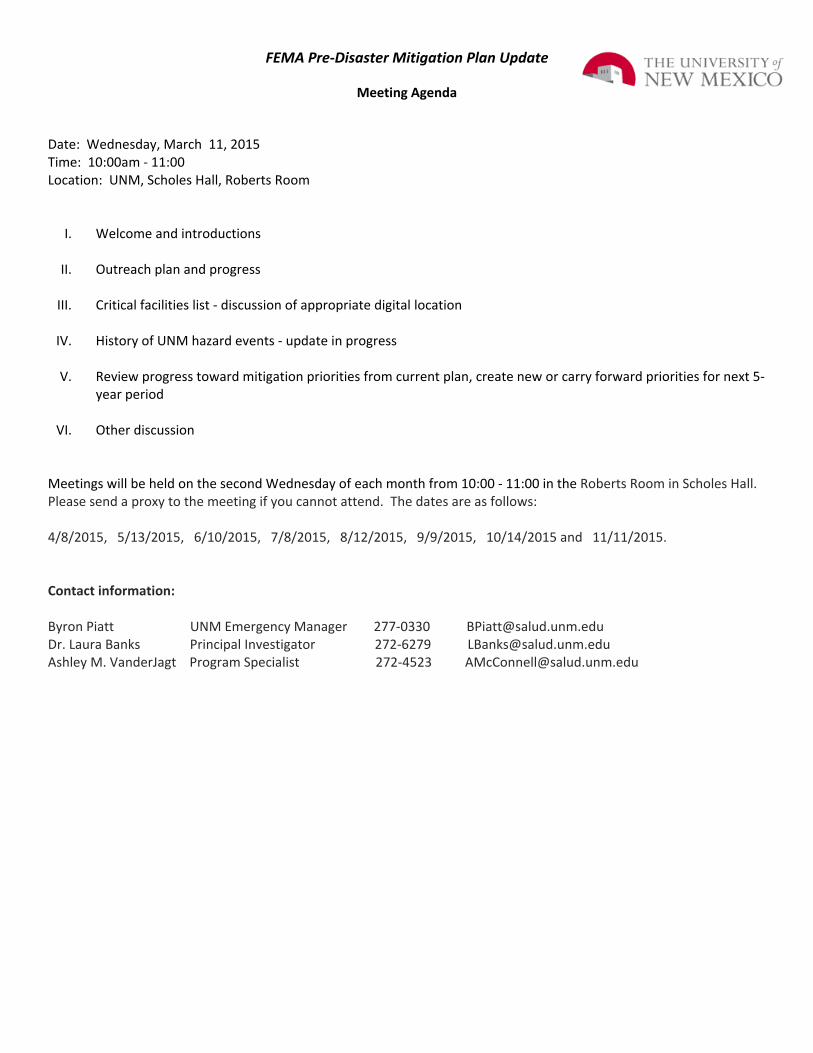
FEMA Pre‐Disaster Mitigation Plan Update
Meeting Agenda
Date: Wednesday, March 11, 2015 Time: 10:00am ‐ 11:00 Location: UNM, Scholes Hall, Roberts Room
I. Welcome and introductions
II. Outreach plan and progress
III. Critical facilities list ‐ discussion of appropriate digital location
IV. History of UNM hazard events ‐ update in progress
V. Review progress toward mitigation priorities from current plan, create new or carry forward priorities for next 5‐year period
VI. Other discussion
Meetings will be held on the second Wednesday of each month from 10:00 ‐ 11:00 in the Roberts Room in Scholes Hall. Please send a proxy to the meeting if you cannot attend. The dates are as follows: 4/8/2015, 5/13/2015, 6/10/2015, 7/8/2015, 8/12/2015, 9/9/2015, 10/14/2015 and 11/11/2015. Contact information: Byron Piatt UNM Emergency Manager 277‐0330 [email protected] Dr. Laura Banks Principal Investigator 272‐6279 [email protected] Ashley M. VanderJagt Program Specialist 272‐4523 [email protected]

FEMA Pre-Disaster Mitigation Plan Update
Meeting Minutes
Date: Wednesday, March 11, 2015 Time: 10:00am - 11:00 Location: UNM, Scholes Hall, Roberts Room In attendance: Mark Reynolds, Laura Banks, Ashley M. Vanderjagt, Deb Kuidis, Scott Dotson, Stephen Lockwood, Shirley Baros, Joan Green, Ruth Stoddard, Jim Shrum, and Billy Hromas, Mark Orgeron, Alexandra Snyder, Tim Muller, Chandra Begin Outreach plan and progress: All nearby neighborhood associations have been invited to participate in the planning process. Their input has been requested via an email invitation but so far we have not heard back from any of them. They have also been given the website address. Members of the Campus-CERT (students, staff and faculty) have been invited to participate via email. Administrative team is working with Diane Anderson to get a message posted in the Daily Lobo or on the news feed regarding the Mitigation Plan Update. Critical Facilities List: After further review of the City of Albuquerque/Bernalillo County Mitigation Plan it was realized that the critical infrastructure was not included in that plan but rather referenced in the Emergency Operations Plan. UNM would like to follow this model since there has been growing concern regarding the sensitivity of UNM’s critical infrastructure list. We may or may not still group critical infrastructure into categories depending on how large the list gets. History: The committee reviewed the History of UNM Hazard events. The list was categorized according to natural vs. unnatural hazards - making it easier to focus only on natural events. Mitigation Actions: The committee will rank the mitigation actions into a tiered system – high, medium, and low priority. The committee reviewed the mitigation actions from the 2010 update. The list of actions can probably be condensed. Some actions have been completed since the 2010 update. Items that the committee discussed were places of refuge (including signage), visual alert systems, and COOP (high priority tier critical infrastructure). There was discussion of conducting a survey of the volunteers for UNM events on their level of evacuation and emergency training. It was mentioned that a list of all building construction dates should be compiled (from PPD). It would then be easier to prioritize mitigation actions within the older buildings since they may be most susceptible. Mitigation actions from 2010 have been requested for review as follows: PPD # 1, 3, 36, 44, 45, 48 IT # 22, 23, 25, 27, 41

UNM Art Museum # 21, 22 EDAC # 49, 50, 51, 52, 53 To do list:
1. Add new critical infrastructure to the master list 2. Add Mark Reynolds’ list of IT critical infrastructure to the master list 3. Contact Roger about how detailed CI list is in the Albuquerque EOP 4. Circulate the list of UNM Hazard events to make certain no events are missing 5. Review the mitigation actions for completed items, for items that can be condensed, and think
about new items that should be added. Departments should submit these items. Future meetings: Meetings will be held on the second Wednesday of each month from 10:00 - 11:00 in the Roberts Room in Scholes Hall. Please send a proxy to the meeting if you cannot attend. The dates are as follows: 4/8/2015, 5/13/2015, 6/10/2015, 7/8/2015, 8/12/2015, 9/9/2015, 10/14/2015 and 11/11/2015 Contact information: Byron Piatt UNM Emergency Manager 277-0330 [email protected] Dr. Laura Banks Principal Investigator 272-6279 [email protected] Ashley M. VanderJagt Program Specialist 272-4523 [email protected]

FEMA Pre-Disaster Mitigation Plan Update
Meeting Agenda
Date: Wednesday, May 13, 2015 Time: 10:00am - 11:00 Location: UNM, Scholes Hall, Roberts Room
I. Welcome and introductions
II. Plan update progress report
III. Critical facilities list (UNM, HSC, UNMH) - work in progress
a. Items for discussion b. New facilities and planned improvements added for 2015 c. Facilities updated from 2010
IV. Review of guidance documents and plans
V. Additional mitigation priorities
VI. Other discussion
Meetings will be held on the second Wednesday of each month from 10:00 - 11:00 in the Roberts Room in Scholes Hall. Please send a proxy to the meeting if you cannot attend. The dates are as follows: 6/10/2015, 7/8/2015, 8/12/2015, 9/9/2015, 10/14/2015 and 11/11/2015. Contact information: Byron Piatt UNM Emergency Manager 277-0330 [email protected] Dr. Laura Banks Principal Investigator 272-6279 [email protected] Ashley M. VanderJagt Program Specialist 272-4523 [email protected]
FEMA Pre-Disaster Mitigation Plan Update
Meeting Minutes
Date: Wednesday, May 13, 2015 Time: 10:00am - 11:00 Location: UNM, Scholes Hall, Roberts Room In attendance: Byron Piatt, Laura Banks, Ashley M. Vanderjagt, Deb Kuidis, Stephen Lockwood, Billy Hromas, Alexandra Snyder, Diane Anderson, Melissa Vargas Plan progress report: A Table of Contents (TOC) has been created using the FEMA Local Mitigation Planning Handbook (March 2013) and local and state mitigation plans. The TOC will serve as a guide and checklist as the plan gets updated. The TOC was distributed to all attendees for review and comment. Comments should be sent to Laura Banks. Critical Facilities list: Reviewed the criteria for UNM’s critical facilities. Critical facilities are defined as those facilities that contribute to the essential functions of UNM. Without these facilities, the university couldn’t fulfill its mission. The critical facilities have been sorted into multiple categories, using the FEMA categories as a guide. The 4 FEMA categories are: people, economy, built environment, and natural environment. The critical facilities list will not be made available to the public. The committee reviewed the latest critical facilities list draft. This list included facilities from the 2010 plan and suggested 2015 update additions. Facilities with at least one loss since 2010 were highlighted. The group discussed some possible additions to the list such as new/future UNM acquisitions and the 4 UNM Branch campuses. Discussed the Continuity of Operations Plan (COOP) for the University. Must make sure that the mitigation plan and the emergency operations plan address items that will enable UNM’s continuity of operations. Byron and Melissa are working on the COOP. Plan maintenance: A list of running changes that need to be made will be cataloged in the beginning of the plan. The committee needs to determine how often they will meet over the next 5 years. It was mentioned that that plan maintenance and updates could dovetail off the capital improvements/projects meetings. Review of guidance documents and plans: Reviewed the plans and documents used in the 2010 plan. Reviewed the 7 additions/new versions submitted. All plans will be combined into the community capabilities section of the 2015 update. Critical assets and risk analysis (chapter 5) are addressed in the plan in 3 ways: scenarios, historical analysis, and risk analysis. FEMA requests problem statements also be used. 5-10 problem statements will be added at the end of chapter 5 as a summary.

To do list:
1. Review critical facilities list – items to take off and items to add 2. Continue to think about new mitigation actions. Departments should submit these items. 3. Contact departments for latest versions of plans 4. Send out community capabilities list for review 5. Organize critical facilities list by geographical location for easier review
Future meetings: Meetings will be held on the second Wednesday of each month from 10:00 - 11:00 in the Roberts Room in Scholes Hall. Please send a proxy to the meeting if you cannot attend. The dates are as follows: 6/10/2015, 7/8/2015, 8/12/2015, 9/9/2015, 10/14/2015 and 11/11/2015 Contact information: Byron Piatt UNM Emergency Manager 277-0330 [email protected] Dr. Laura Banks Principal Investigator 272-6279 [email protected] Ashley M. VanderJagt Program Specialist 272-4523 [email protected]

FEMA Pre-Disaster Mitigation Plan Update
Meeting Agenda
Date: Wednesday, June 10, 2015 Time: 10:00am - 11:00 Location: UNM, Scholes Hall, Roberts Room
I. Welcome and introductions
II. Confirmation of committee member names and agencies as listed on sign-in sheet
III. Timeline for plan review and submission
a. PDMAC review of Chapters 1-3 completed by June 24th b. PDMAC review of Chapters 4-7 completed by July 8th (sent by June 24th) c. Post final draft and public invitation to July 8th meeting d. Submit final draft to DHSEM by July 20th e. Seeking volunteers for proofreading
IV. Discussion of process for Pre-Disaster Mitigation Plan maintenance a. Includes documentation of UNM physical and functional changes and additions, and progress toward
mitigation goals b. Role of current committee member c. Methods to review and update
V. Discussion regarding Table of Contents, and Chapters 1-3
a. Campus descriptions and assets b. Planning activities and capabilities c. State of New Mexico property coverage as a mitigation resource
VI. Other discussion
Meetings will be held on the second Wednesday of each month from 10:00 - 11:00 in the Roberts Room in Scholes Hall. Please send a proxy to the meeting if you cannot attend. The dates are as follows: 7/8/2015, 8/12/2015, 9/9/2015, 10/14/2015 and 11/11/2015. Contact information: Byron Piatt UNM Emergency Manager 277-0330 [email protected] Dr. Laura Banks Principal Investigator 272-6279 [email protected] Ashley M. VanderJagt Program Specialist 272-4523 [email protected]
FEMA Pre-Disaster Mitigation Plan Update
Meeting Minutes
Date: Wednesday, June 10, 2015 Time: 10:00am - 11:00 Location: UNM, Scholes Hall, Roberts Room 1. In attendance: Laura Banks, Bryon Piatt, Robert Perry, Mark Reynolds, James Shrum, Deborah Kuidis, Melissa Vargas, Alexandra Snyder, Stephen Lockwood, and Shirley Baros
2. We are moving forward with finalizing a draft of the Pre-Disaster Mitigation Plan to be submitted to our Mitigation Officer at NMDHSEM and then FEMA. The first 3 chapters and the table of contents were sent to the committee via email on June 9th. The approximate timeline for plan review and submission is: • PDMAC review of Chapters 1-3 completed by June 24th • PDMAC review of Chapters 4-7 completed by July 8th (sent by June 24th) • Post final draft and public invitation to July 8th meeting • Submit final draft to DHSEM by July 20th Committee members can submit comments, questions or edit suggestions to any of the Administrative Team members listed below by email using track changes, or in paper format through interoffice mail at MSC11 6025. We are also seeking volunteers for proofreading. 3. In order to make sure that the Pre-Disaster Mitigation Plan, once completed, remains up to date and that UNM is ready for the next 5-year update, the committee discussed the preferred process for on-going planning and plan maintenance. The committee agreed that this is a legitimate role for the committee and the current committee members. Plan maintenance and on-going mitigation planning will include: • documentation of UNM physical and functional changes and additions • regular meetings with the NMDHSEM Mitigation Officer • progress toward mitigation goals • tracking changes in regulations or requirements for mitigation planning at the federal or state level • being involved in any request for funding for mitigation activities that originate from UNM, and providing
technical assistance for those requests and follow up (we will do this through our Mitigation Officer) The committee agreed that annual meetings should be planned, with the allowance for interim, ad hoc meetings as needed to address critical issues. The committee will keep a formal “Record of Changes” document in progress for additions or edits to the plan document. 4. The committee discussed examples of past damage and losses incurred by UNM that have been addressed by a combination of operational and property coverage funds. A key mitigation strategy is to ensure that funds for remediation are spent in a way that prevents future losses whenever possible and allowable.

5. Outreach to the Branch Campuses is on-going. They will be provided a summary of the goals and purpose of the plan update and reminded that they are being included as a critical educational function of the university. A representative of each campus will be asked to identify any operational elements on their campus that they feel are at greater than typical risk of damage due to natural hazards. 7. The next meeting will be held on July 8th. Future meetings will continue to be held on the second Wednesday of each month from 10:00 - 11:00 in the Roberts Room in Scholes Hall. Member are asked to send a proxy to the meeting if they cannot attend. The dates are as follows: 8/12/2015, 9/9/2015, 10/14/2015 and 11/11/2015. Contact information: Byron Piatt UNM Emergency Manager 277-0330 [email protected] Dr. Laura Banks Principal Investigator 272-6279 [email protected] Ashley M. VanderJagt Program Specialist 272-4523 [email protected]

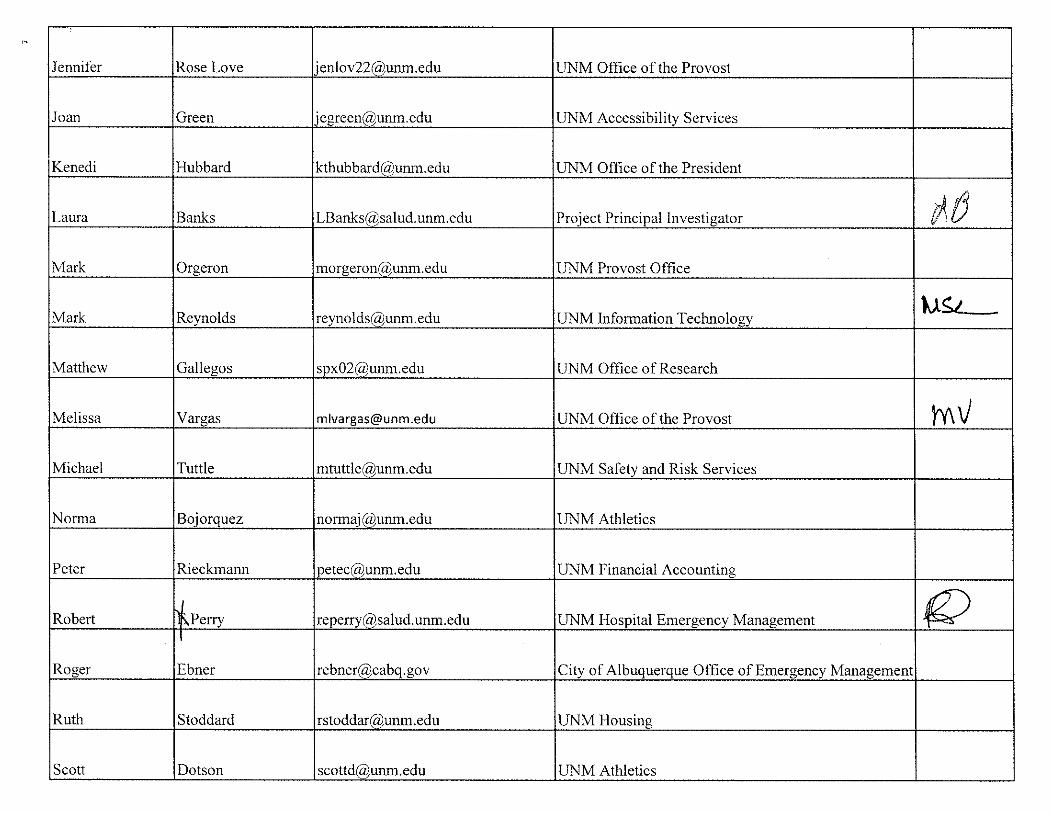


FEMA Pre-Disaster Mitigation Plan Update
Meeting Agenda
Date: Wednesday, July 8, 2015 Time: 10:00am - 11:00 Location: UNM, Scholes Hall, Roberts Room
I. Welcome and introductions
II. Site visit
III. Amended timeline for plan review and submission
a. PDMAC review of Chapters 4-6 - target: completed by July 15th
Submit via email in sections, or by paper to MSC11 6025
b. Conference call with State Mitigation Officer July 16th at 2:00 for initial review
Contact Laura Banks if you would like to participate (see below)
c. Post final draft and public invitation to August 12th meeting
d. Submit final draft to NMDHSEM by August 20th
e. Seeking volunteers for proofreading
IV. Review of Pre-Disaster Mitigation Plan maintenance - in draft plan
V. Other discussion regarding Chapter 4-6
a. Hazard descriptions b. Vulnerability analysis
VI. Other discussion
Meetings will be held on the second Wednesday of each month from 10:00 - 11:00 in the Roberts Room in Scholes Hall. Please send a proxy to the meeting if you cannot attend. The dates are as follows: 8/12/2015, 9/9/2015, 10/14/2015 and 11/11/2015. Contact information: Byron Piatt UNM Emergency Manager 277-0330 [email protected] Dr. Laura Banks Principal Investigator 272-6279 [email protected] Ashley M. VanderJagt Program Specialist 272-4523 [email protected]

FEMA Pre‐Disaster Mitigation Plan Update
Meeting Minutes
Date: Wednesday, July 8, 2015 Time: 10:00am ‐ 11:00 Location: UNM, Scholes Hall, Roberts Room 1. In attendance: Laura Banks, Ashley M. Vanderjagt, Mark Reynolds, Dianne Anderson, Billy Hromas, Tim Muller, Mark Orgeron, Jim Shrum, Robert Perry, Deborah Kuidis, Alexandra Snyder, Shirley Baros
2. Site visit ‐ Laura Banks, Alexandra Synder and representatives from FEMA Region 6 will be participating in a site visit on July 9th at the UNM Museum of Southwestern Biology. The site visit is a follow up to a mitigation project funded by FEMA. The museum installed seismic bars to their vast collection of specimens. These bars will help protect the collection from earthquake disturbances caused by shaking. Alexandra would like to get the Maxwell Museum thinking about mitigation activities as well. 3. Conference call – July 16th at 2 pm the Advisory team will hold a conference call with Wendy Blackwell from
DHSEM. All PDMAC members are welcome to participate in the call. Comments on the plan should be submitted
by July 15 prior to the conference call.
4. Updated schedule – Final draft will be posted to the website by mid‐August. The final draft will be submitted to the state in late August. 5. Review of PDM Plan –
Mitigation action items have been trimmed down from previous plan. They have been lumped together and prioritized.
Plan maintenance chapter – chapter sites that either the admin team or committee will be responsible for items listed. No one person was named responsible.
Annual meetings – annual meetings will be held the 4 years following the adoption of the plan. In the 5th year the committee will commence meeting more frequently. Meetings will be called ad hoc if needed.
Earthquake scenario – committee can review this to see if more needs to be added into the PDM plan.
Committee would like admin team to talk to the state about trimming down the plan. Feels cumbersome and overly detailed. Potential trimming could come from the hazards chapter.
6. Plan Outreach and Communication – Diane Anderson mentioned that the admin team should reach out to UCAM for a media push. Although the admin team has conducted outreach to neighborhood associations and the UNM community perhaps more can be done before the plan draft is submitted to the state. This could help get more feedback from the community.

7. Technical support and resource page – Alexandra Snyder recommended a technical support and resource section for the website. Since she has seen a mitigation project from start to finish, it was recommended that posting documents and resources on the website could help other departments through the mitigation process. 8. The next meeting will be held on August 12th. Future meetings will continue to be held on the second Wednesday of each month from 10:00 ‐ 11:00 in the Roberts Room in Scholes Hall. Members are asked to send a proxy to the meeting if they cannot attend. Future dates are as follows: 9/9/2015, 10/14/2015 and 11/11/2015. Contact information: Byron Piatt UNM Emergency Manager 277‐0330 [email protected] Dr. Laura Banks Principal Investigator 272‐6279 [email protected] Ashley M. VanderJagt Program Specialist 272‐4523 [email protected]
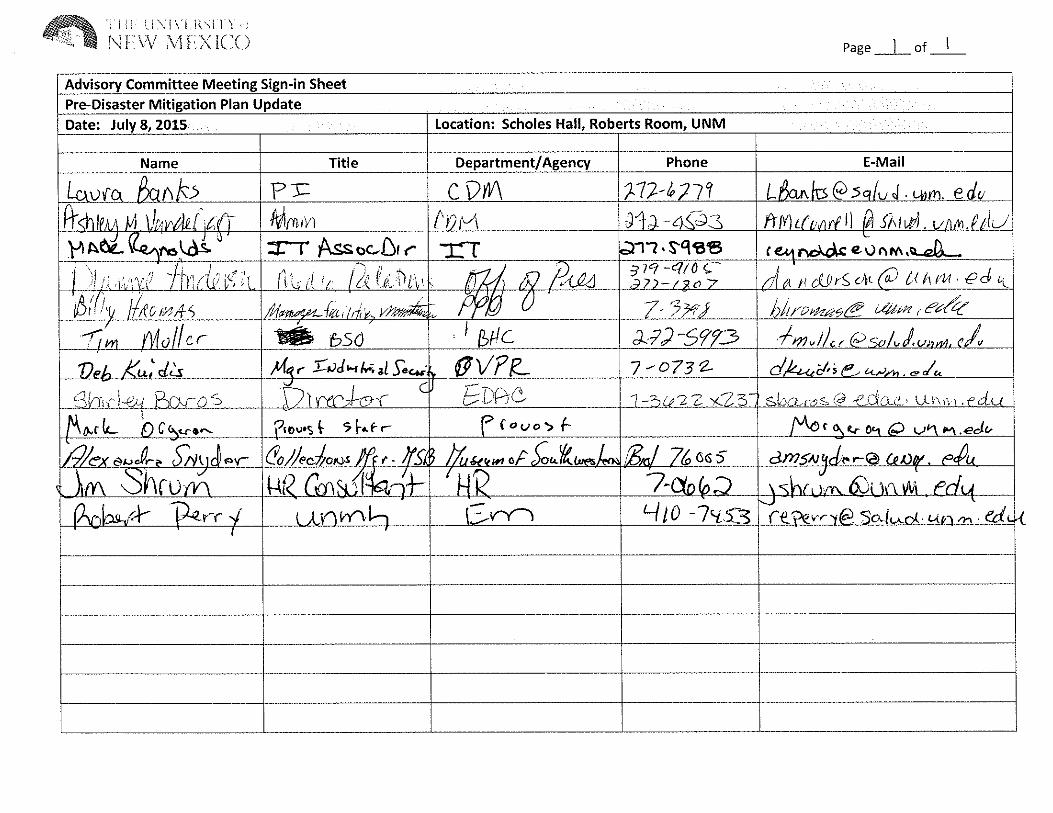

November 2015
Appendix C: Outreach Attachments

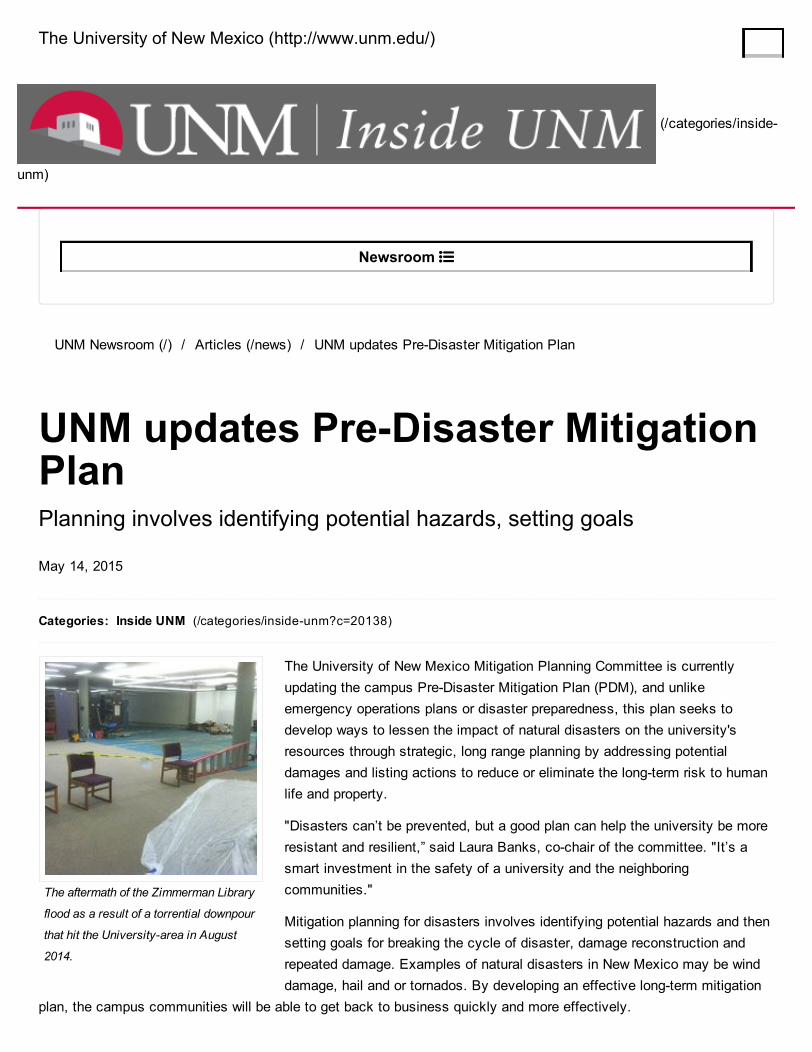
The University of New Mexico (http://www.unm.edu/)
The aftermath of the Zimmerman Library
flood as a result of a torrential downpour
that hit the Universityarea in August
2014.
(/categories/inside
unm)
Newsroom
UNM Newsroom (/) / Articles (/news) / UNM updates PreDisaster Mitigation Plan
UNM updates PreDisaster MitigationPlanPlanning involves identifying potential hazards, setting goals
May 14, 2015
Categories: Inside UNM (/categories/insideunm?c=20138)
The University of New Mexico Mitigation Planning Committee is currentlyupdating the campus PreDisaster Mitigation Plan (PDM), and unlikeemergency operations plans or disaster preparedness, this plan seeks todevelop ways to lessen the impact of natural disasters on the university'sresources through strategic, long range planning by addressing potentialdamages and listing actions to reduce or eliminate the longterm risk to humanlife and property.
"Disasters can’t be prevented, but a good plan can help the university be moreresistant and resilient,” said Laura Banks, cochair of the committee. "It’s asmart investment in the safety of a university and the neighboringcommunities."
Mitigation planning for disasters involves identifying potential hazards and thensetting goals for breaking the cycle of disaster, damage reconstruction andrepeated damage. Examples of natural disasters in New Mexico may be winddamage, hail and or tornados. By developing an effective longterm mitigation
plan, the campus communities will be able to get back to business quickly and more effectively.
The Hazard Mitigation Program is authorized under the Robert T. Stafford Disaster Relief and Emergency AssistanceAct of 1988, which was reauthorized in 2010. The program, administered by the Federal Emergency ManagementAgency (FEMA), provides financial and technical assistance to state and local governments in the case of naturaldisasters. UNM created the first university approved plan in New Mexico.
Now it is time for an update. The current plan expires at the end of this year. The new one must address recentchanges on the campus such as new buildings and activities in order to maintain the university’s eligibility to receivedisaster funds.
“In order to develop a plan, we need to identify and assess the hazards, vulnerabilities and risks to the campus,” Bankssaid. “That work requires participation of a wide range of stakeholders and the public in the planning process.”
A website has been established to provide additional information regarding mitigation planning in general and theprocess that is ongoing at UNM, as well as a copy of the current plan (http://mitigationplan.unm.edu).
The campus community and surrounding neighborhoods are invited to participate by reviewing the posted material,attending meetings of the planning committee, sending questions or comments via email or U.S. Mail, or meeting witha member of the planning committee individually.
The University is working in partnership with the New Mexico Department of Homeland Security and EmergencyManagement and FEMA to insure that UNM's mitigation planning will be successful in minimize the impact of naturaldisasters on our campuses. The update of the plan will be completed by December of 2015.
For more information, contact Laura Banks at [email protected] or (505) 2726279.
Share: 0 Shares (http://www.addthis.com/bookmark.php)
For more news, visit the UNM Newsroom and follow us on Twitter.
Related Images

The aftermath of the Zimmerman Library flood as a result of a torrential downpour that hit the Universityarea inAugust 2014.
Useful Links
PreDisaster Mitigation Plan (http://mitigationplan.unm.edu)
Library Flood
View Download (51.8 kB) (/_gallery/get_file/?file_id=555509885e8eef2e2e576c44&file_ext=.jpg)

1
Laura Banks
From: Laura BanksSent: Thursday, March 12, 2015 7:56 AMTo: ASUNM Group; ASUNM President; ASUNM Vice PresidentCc: Chanda Cooper BeginSubject: UNM hazard preparednessAttachments: Student letter.pdf
Dear Student and ASUNM leader, The University of New Mexico emergency planning group is in the process of updating the Pre‐Disaster Mitigation Plan for the campus. The purpose of this plan is to address potential damages from natural hazards and includes actions to be taken to reduce or eliminate the long‐term risk to human life and property. The current UNM Pre‐Disaster Mitigation Plan was finalized and approved by FEMA and the New Mexico Department of Homeland Security and Emergency Management in 2010. The plan expires at the end of 2015 and must be updated in order to address changes that have occurred on the campus (i.e. new buildings and activities) and to maintain the university’s eligibility to receive disaster funds. Mitigation is most effective when it is based on a comprehensive, long‐term plan that is developed before a disaster occurs. Mitigation policies and actions are identified based on an assessment of hazards, vulnerabilities, and risks and the participation of a wide range of stakeholders and the public in the planning process. The Pre‐Disaster Mitigation Plan is intended to identify actions that can be taken before a disaster strikes, and is not the same as the UNM Emergency Operations Plan which addresses how the university would respond to an actual disaster. As a UNM student, we invite your input into the update of the Pre‐Disaster Mitigation Plan. We have created a website that provides additional information regarding mitigation planning in general and the process that is on‐going at UNM (http://mitigationplan.unm.edu). The website also provides a copy of the current Pre‐Disaster Mitigation Plan. Please review the website and the current plan, and feel free to contact me with any questions. Your participation in this process can include simply becoming aware of the update activities by reviewing the posted material, attending meetings of the planning committee, sending questions or comments via email or U.S. Mail, or meeting with a member of the planning committee individually. We would also be happy to provide an informational presentation to any interested student group. Warmest regards, Dr. Laura Banks UNM Center for Disaster Medicine 272‐6279
March 5, 2015 To: UNM Staff and Faculty
The University of New Mexico emergency planning group is in the process of updating the Pre-Disaster Mitigation Plan for the campus. The purpose of this plan is to address potential damages from natural hazards and includes actions to be taken to reduce or eliminate the long-term risk to human life and property. The current UNM Pre-Disaster Mitigation Plan was finalized and approved by FEMA and the New Mexico Department of Homeland Security and Emergency Management in 2010. The plan expires at the end of 2015 and must be updated in order to address changes that have occurred on the campus (i.e. new buildings and activities) and to maintain the university’s eligibility to receive disaster funds. Mitigation is most effective when it is based on a comprehensive, long-term plan that is developed before a disaster occurs. Mitigation policies and actions are identified based on an assessment of hazards, vulnerabilities, and risks and the participation of a wide range of stakeholders and the public in the planning process. The Pre-Disaster Mitigation Plan is intended to identify actions that can be taken before a disaster strikes, and is not the same as the UNM Emergency Operations Plan which addresses how the university would respond to an actual disaster. As a staff or faculty member of UNM , we invite your input into the update of the Pre-Disaster Mitigation Plan. We have created a website that provides additional information regarding mitigation planning in general and the process that is on-going at UNM (http://mitigationplan.unm.edu). The website also provides a copy of the current Pre-Disaster Mitigation Plan. Please review the website and the current plan, and feel free to contact me with any questions. Your participation in this process can include simply becoming aware of the update activities by reviewing the posted material, attending meetings of the planning committee, sending questions or comments via email or U.S. Mail, or meeting with a member of the planning committee individually. We would also be happy to provide an informational presentation to any interested campus group. Warmest regards, Dr. Laura Banks Assistant Professor University of New Mexico [email protected] 505-272-6279

University of New Mexico area neighborhood associations Nob Hill Neighborhood Association Susan Michie, President, 918-399-4410
Katie Curry, [email protected] Skye Devore, [email protected]
Campus Neighborhood Association
PRESIDENT: Glen Spinelli [email protected]
University Heights Neighborhood Association
Joe Gallegos, President [email protected]
Silver Hill Neighborhood Association
President Gordon Reiselt [email protected]
Spruce Park Neighborhood Association
President Valerie St.John [email protected]
Netherwood Neighborhood Association
President Chuck Maguire [email protected]

March 2, 2015
Dear Neighborhood Association President,
The University of New Mexico emergency planning group is in the process of updating the Pre-Disaster
Mitigation Plan for the campus. The purpose of this plan is to address potential damages from natural hazards
and includes actions to be taken to reduce or eliminate the long-term risk to human life and property. The
current UNM Pre-Disaster Mitigation Plan was finalized and approved by FEMA and the New Mexico
Department of Homeland Security and Emergency Management in 2010. The plan expires at the end of 2015
and must be updated in order to address changes that have occurred on the campus (i.e. new buildings and
activities) and to maintain the university’s eligibility to receive disaster funds.
Mitigation is most effective when it is based on a comprehensive, long-term plan that is developed before a
disaster occurs. Mitigation policies and actions are identified based on an assessment of hazards, vulnerabilities,
and risks and the participation of a wide range of stakeholders and the public in the planning process. The Pre-
Disaster Mitigation Plan is intended to identify actions that can be taken before a disaster strikes, and is not the
same as the UNM Emergency Operations Plan which addresses how the university would respond to an actual
disaster.
As the President of a neighborhood association that is adjacent to the campus, we invite you and your
association's input into the update of the Pre-Disaster Mitigation Plan. We have created a website that provides
additional information regarding mitigation planning in general and the process that is on-going at UNM
(http://mitigationplan.unm.edu). The website also provides a copy of the current Pre-Disaster Mitigation Plan.
Please review the website and the current plan, and feel free to contact me with any questions. Your
participation in this process can include simply becoming aware of the update activities by reviewing the posted
material, attending meetings of the planning committee, sending questions or comments via email or U.S. Mail,
or meeting with a member of the planning committee individually. We would also be happy to provide an
informational presentation to your neighborhood association.
Thank you for your service to our community!
Warmest regards,
Dr. Laura Banks
Assistant Professor
University of New Mexico
505-272-6279