Hazard Mitigation Field Operations Mentoring Guide and Job ...
Upload
khangminh22Category
view
1download
0
Region L Multi-Jurisdictional Hazard Mitigation Plan 2013 - 2018
Hazard Mitigation “…any sustained action taken to reduce or eliminate long-term risk to human life and property from a hazard event” (FEMA).

Special Thanks and Acknowledgement
Leavenworth County
Wyandotte County
Johnson County
The help and support of the following individuals were instrumental in ensuring a smooth transition of information. Without their selfless dedication, sacrifice, and perseverance this plan would have been close to impossible.
To: Kim Buchanan, Assistant Director of Emergency Management Operations for Leavenworth County.
To: Mike Baughman, Program Coordinator, Emergency Operation Management Operations for the Unified Government of Wyandotte County.
To: Cary Gerst, Assistant Director Emergency Management Operations, Planning, for Johnson County.
To: The Planning Committee for their relentless questions, input, corrections, critique’s, and presence.
AMEC – for their superior facilitation and writing of the State HMP in a regional format. Many thanks for setting the ‘stage’ for the Regional Plan.

Region L Hazard Mitigation Plan, 2013 iv
Executive Summary
The Regional Hazard Mitigation Plan is a multi-jurisdictional plan written and prepared with the participation of Johnson, Leavenworth, and Wyandotte County governments and the following communities, school districts, special districts, universities:
Johnson County USD229
• *City of DeSoto USD230 • *City of Edgerton USD231 • *City of Fairway USD232 • *City of Gardner USD233 • *City of Lake Quivira USD 512 • *City of Leawood • *City of Lenexa • *City of Merriam • *City of Mission • *City of Mission Hills • *City of Mission Woods • *City of Olathe • *City of Overland Park • *City of Prairie Village • *City of Roeland Park • *City of Shawnee • *City of Spring Hill • *City of Westwood • *City of Westwood Hills • *County • *Consolidated Fire District No. 2 • *Fire District No. 1 • *Fire District No. 2 • *Fire District No. 3 • *Johnson County Community College • *University of Kansas Edwards Campus • *KSSDB (Blind) (common) (common to Johnson County and Wyandotte County)
Leavenworth County • *City of Basehor *USD207 • *City of Easton *USD449 • *City of Lansing *USD453 • *City of Leavenworth *UDF458 • *City of Linwood *USD464 • *City of Tonganoxie *USD469 • *County *University of Saint Mary • *RWD 7
Wyandotte County
• *Board of Public Utilities • *City of Bonner Springs • *City of Edwardsville • *Fairfax Drainage District

Region L Hazard Mitigation Plan, 2013 v
• *Kansas City Community College • *KSSDB (Blind) (common) (common to Johnson County and Wyandotte County) • *Kansas University Medical Center • *Kaw Valley Drainage District • *Unified Government of Wyandotte County and Kansas City, Kansas • *University of Kansas Hospital • Kansas City Power and Light • Kansas Gas Service • *USD 204 Bonner-Edwardsville • *Lake Quivira
Non- Profit Heart of America Boy Scouts
This Regional Hazard Mitigation Plan profiles the 22 hazards which the State of Kansas has identified as being the greatest threats to lives and property within its borders. These hazards were evaluated with regard to historical occurrences, probability, magnitude, duration, warning time, existing mitigation strategies, and the potential impacts on each jurisdiction. The mitigation strategy contained within this update was developed through the consideration of potential threats, hazards, resources, and the willpower available to mitigate their effects. The planning committee for the Region has defined the following goals to support this mitigation strategy:
• Goal 1: Reduce or eliminate risk to the people and property of Region L from the impacts of the identified hazards in this plan.
• Goal 2: Strive to protect all vulnerable populations, structures, and critical facilities in
Region L from the impacts of the identified hazards.
• Goal 3: Improve public outreach initiatives to include education, awareness and partnerships with all entities in order to enhance understanding of the risk the Region faces due to the impacts of the identified hazards.
• Goal 4: Enhance communication and coordination among all agencies and between
agencies and the public. Mitigation actions have been developed and prioritized to further the goals of the overall mitigation strategy in each jurisdiction. Upon a final draft approval by FEMA, the Regional Hazard Mitigation Plan will be formally adopted by each of the participating jurisdictions. This plan will be updated in five years, as required by FEMA. It will be evaluated and maintained on an annual basis prior to this update. Prerequisites: Regional Plan Adoption Requirement For multi-jurisdictional plans, each jurisdiction requesting approval §201.6(c)(5): of the plan must document that is has been formally adopted.

Region L Hazard Mitigation Plan, 2013 vi
Resolutions adopting the plan for the participating jurisdictions are included in Appendix A.

Region L Hazard Mitigation Plan, 2013 Final
Table of Contents
Executive Summary ................................................................................................................... iv
Prerequisites ............................................................................................................................... v
Chapters
1 Introduction and Planning Process 1.1
1.1 Purpose ............................................................................................................................. 1.1 1.2 Background and Scope ..................................................................................................... 1.1 1.3 Plan Organization .............................................................................................................. 1.2 1.4 Planning Process ............................................................................................................... 1.2 1.5 Update Process ................................................................................................................. 1.6 1.6 Public Involvement ............................................................................................................ 1.8 2 Region L Jurisdictional Profiles and Capabilities 2.1 2.1 Region L Planning Are Profile 2.1
2.1.1 Topography .................................................................................................................... 2.1 2.1.2 Population ...................................................................................................................... 2.3 2.1.3 Housing Trends .............................................................................................................. 2.3 2.1.4 Economics .................................................................................................................... 2.4 2.1.5 Climate .......................................................................................................................... 2.4 2.1.6 Capabilities ................................................................................................................... 2.4 2.1.7 Exposure of Built Environment/Cultural Resources 2.5 2.2 Johnson County Planning Area Profile 2.8 2.2.1 Geography/Topography ................................................................................................. 2.8 2.2.2 Climate ........................................................................................................................ 2.10 2.2.3 Population/Demographics ........................................................................................... 2.10 2.2.4 Economics .................................................................................................................. 2.11 2.2.5 Capabilities .................................................................................................................. 2.13 2.2.6 Critical Facilities .......................................................................................................... 2.20 2.2.7 Other Assets ............................................................................................................... 2.20 2.2.8 Cities ............................................................................................................................ 2.21 2.2.9 Unified School Districts ............................................................................................... 2.87 2.2.10 Kansas School for the Deaf ..................................................................................... 2.100 2.2.11 Community College and University ........................................................................... 2.101 2.2.12 Fire Districts ............................................................................................................. 2.102
2.3 Leavenworth County Planning Area Profile ………….……………………..….….2.106

Region L Hazard Mitigation Plan, 2013 Final
2.3.1 Geography/Topography 2.107 2.3.2 Climate ........................................................................................................................ 2.109 2.3.3 Population/Demographics ........................................................................................... 2.109 2.3.4 Economics ................................................................................................................. 2.110 2.3.5 Capabilities ............................................................................................................... 2.111 2.3.6 Critical Facilities ......................................................................................................... 2.117 2.3.7 Other Assets ............................................................................................................. 2.118 2.3.8 Cities .......................................................................................................................... 2.119 2.3.9 Unified School Districts ............................................................................................. 2.139 2.3.10 University .................................................................................................................. 2.148 2.4 Wyandotte County Planning Area Profile ...................................................... 2.150 2.4.1 Geography/Topography .............................................................................................. 2.151 2.4.2 Climate ....................................................................................................................... 2.152 2.4.3 Population/Demographics ........................................................................................... 2.153 2.4.5 Capabilities ................................................................................................................. 2.155 2.4.6 Critical Facilities .......................................................................................................... 2.169 2.4.7 Other Assets ............................................................................................................... 2.169 2.4.8 Cities ........................................................................................................................... 2.171 2.4.9 Unified School Districts ............................................................................................... 2.182 2.4.10 Kansas School for the Blind .................................................................................... 2.184 2.4.11 Community College ................................................................................................. 2.185 2.4.12 Medical Care Entities .............................................................................................. 2.186 2.4.13 Drainage and Water Districts ................................................................................... 2.187 2.4.14 Private Non-Profits ................................................................................................... 2.189
3 Risk Assessment .................................................................................................... 3.1
3.1 Hazard Identification ....................................................................................................... 3.2 3.1.1 Methodology……………………………………………………………………………………..3.3 3.1.2 Disaster Declaration History ........................................................................................... 3.5 3.2 Hazard Profiles .............................................................................................................. 3.10 3.2.1 Consequence (Impact) Analysis Methodology ............................................................... 3.11 3.2.2 Agricultural Infestation ................................................................................................... 3.13 3.2.3 Civil Disorder ................................................................................................................. 3.23 3.2.4 Dam and Levee Failure ................................................................................................. 3.30 3.2.5 Drought ......................................................................................................................... 3.55 3.2.6 Earthquake .................................................................................................................... 3.71 3.2.7 Expansive Soils ............................................................................................................. 3.81 3.2.8 Extreme Temperatures .................................................................................................. 3.89 3.2.9 Flood ........................................................................................................................... 3.100 3.2.10 Hailstorm ................................................................................................................... 3.167 3.2.11 Hazardous Materials ................................................................................................. 3.176 3.2.12 Land Subsidence ...................................................................................................... 3.190 3.2.13 Landslide ................................................................................................................... 3.200

Region L Hazard Mitigation Plan, 2013 Final
3.2.14 Lightning ................................................................................................................... 3.207 3.2.15 Major Disease Outbreak ............................................................................................ 3.215 3.2.16 Radiological .............................................................................................................. 3.225 3.2.17 Soil Erosion and Dust ................................................................................................ 3.231 3.2.18 Terrorism/Agro-terrorism ........................................................................................... 3.236 3.2.19 Tornado..................................................................................................................... 3.244 3.2.20 Utility/Infrastructure Failure........................................................................................ 3.257 3.2.21 Wildfire ...................................................................................................................... 3.266 3.2.22 Windstorm ................................................................................................................. 3.275 3.2.23 Winter Storm ............................................................................................................. 3.285 3.2.24.Summary of Key Issues ............................................................................................ 3.295 3.2.25 References ................................................................................................................ 3.297 4 Mitigation Strategy ........................................................................................................... 4.1 4.1 Goals ................................................................................................................................. 4.2 4.2 Mitigation Actions ............................................................................................................ 4.2 4.3 Implementation of Mitigation Actions ............................................................................. 4.3
Actions ....................................................................................................................... 4.16 5 Plan Maintenance Process ............................................................................................ 5.1 5.1 Plan Monitoring and Evaluation .......................................................................................... 5.1 5.2 Plan Updating .................................................................................................................... 5.1 5.3 Incorporation of Mitigation Plan .......................................................................................... 5.2 5.4 Incorporating Plans, Studies .............................................................................................. 5.3 5.5 Public Participation in Plan Maintenance ............................................................................ 5.9
Appendices
Appendix A: Adoption Resolutions Appendix B: Planning Process Documentation Appendix C: Critical Facilities (secure Appendix) Appendix D: References and Contacts

Region L Hazard Mitigation Plan, 2013 Final 1.1
1 Introduction/Planning Process
1.1 Purpose
In accordance with the DMA 2000, the purpose of this plan is to identify and sustain actions designed to reduce or eliminate long-term risk to people and property from natural and other hazards, as well as to ensure that each participating jurisdiction is eligible to obtain federal funding under the Hazard Mitigation Grant (HMGP) and the Flood Mitigation Grant (FMA) Program. Through this plan Region L, and its participating jurisdictions, have evaluated the hazards affecting the area, updated the risks these hazards present to the respective jurisdictions, revised their mitigation goals, and identified and/or updated feasible mitigation activities for the participating entities.
1.2 Background and Scope
Natural, man-made, and technological disasters affect people every day, taking lives, injuring people, and destroying property. Every year billions of dollars of tax payer money goes toward helping communities recover from disasters and their aftermath. While we cannot control the weather, we can mitigate to reduce or eliminate the risk to people and property due to these damaging weather events.
Hazard mitigation, as defined by FEMA, is “any sustained action taken to reduce or eliminate long-term risk to human life and property from a hazard event.” Hazard mitigation planning is the process through which hazards that threaten communities are identified, impacts of those hazards are determined, mitigation goals and strategies are determined, and actions are prioritized and implemented.
This plan documents Region Ls planning process and identifies relevant hazards, vulnerabilities, and strategies the participating jurisdictions will use to decrease vulnerability and increase resiliency and sustainability in the Region.
Region L in the State of Kansas consists of three counties, Johnson, Leavenworth, and Wyandotte, and has a population of 777,911 people (U.S. Census 2010), an increase of 14.8% since the 2000 census. Within the three counties of Region L, 59 entities were identified as being potential officially participating jurisdictions in the plan, including the counties, communities, and school districts. Others were encouraged to support the planning process, including townships, fire districts, and businesses. While these entities were not included in the count listed above, they were considered supporting stakeholders, but not jurisdictions in the plan. See Table 1.1 below for a complete listing of the entities in the planning area. A description of how each entity was involved in the planning process is provided in Table 1.3.
Information in this Regional Mitigation Plan will be used to help guide and coordinate mitigation activities and decisions for local land use policy. Mitigation planning will help reduce the cost of disaster response and recovery to communities and their residents by protecting critical community facilities, reducing liability exposure, and minimizing overall community impacts.
Region L Hazard Mitigation Plan, 2013 Final 1.2
1.3 Plan Organization The Region L Mitigation Plan for the counties of Johnson, Leavenworth and Wyandotte is organized as follows:
• Executive Summary • Prerequisites • Chapter 1: Introduction and Planning Process • Chapter 2: Jurisdictional Profiles and Capabilities • Chapter 3: Risk Assessment • Chapter 4: Mitigation Strategy • Chapter 5: Plan Implementation and Maintenance • Appendices
1.4. Planning Process 44 CFR Requirement 201.6(c)(1): [The plan shall document] the planning process used to develop the plan, including how it was prepared, who was involved in the process, and how the public was involved.
In 2012, the State of Kansas, through a lot of thought and consideration, presented the various options available to the different regions on how they would like to proceed with the updating of their plans. These options consisted of: 1) do nothing and let the plans expire, 2) the county’s could update their own plans or contract out utilizing their own funds, or 3) the State of Kansas would provide funding for regional plans for those county’s that wished to participate. The counties of Region L decided cooperatively that the Kansas Division of Emergency Management would proceed with the regional plan for this area with the full cooperation, input, and participation of the three counties that make up the region. Having made this monumental decision, the planning team was assembled using personnel from each agency that was familiar with the local hazards and capable of generating public interest in the project. AMEC was hired as the contracting firm to facilitate the kickoff meetings and perform follow-up on informational guides.
1.4.2. Regional Multi-Jurisdictional Participation 44 CFR Requirement §201.6(a)(3): Multi-jurisdictional plans may be accepted, as appropriate, as long as each jurisdiction has participated in the process and has officially adopted the plan. Johnson, Leavenworth, and Wyandotte counties invited all incorporated cities, public entities, school districts, medical entities, special districts, and private non-profits in the Region to participate in the Regional Plan. The planning committee, with a lot of thought and discussion, decided that while actual physical presence at the meetings was preferred, it would not be a requirement. Because some of the entities, such as the Unified School Districts, had a hard time being present at the meetings, the planning committee decided that a physical presence

Region L Hazard Mitigation Plan, 2013 Final 1.3
would not be a requirement but highly encourage and recommended. In addition, a combination of face-to-face meetings, phone interviews, follow-ups, and email correspondence were utilized in order to keep the process going. Table 1.1 provides participation information details for the jurisdictions that participated in this plan. Each participating jurisdiction in the planning process and plan development was required to meet plan participation requirements defined at the beginning of the process, which included the following:
• Attend meetings (encouraged, but not required as long as all other criteria are met) • Provide information to support the plan development by completing and returning the
Data Collection Guide, pictures, etc. • Identify Mitigation Actions for the plan • Review and comment on plan drafts • Inform the public, local officials, and other interested parties about the planning process
and provide an opportunity for them to comment on the plan • Formally adopt the plan
Private and non-profit organizations are not required to be official participants of the plan. They do not have to formally adopt the plan; however, for future mitigation grant applications to be considered, they must be consistent with the mitigation strategy. As such, private non-profit organizations in the planning area were invited to participate in this planning effort and were encouraged to provide data to support the risk assessment as well as mitigation actions for incorporation in the mitigation strategy. The Regional Hazard Mitigation Plan is a multi-jurisdictional plan that geographically covers everything with the boundaries of the participating jurisdictions, hereafter referred to as the planning area.
The following Table 1.1 indicates the jurisdictions that participated in the planning process: Note that the Fire Districts and County Health Departments are included in the County.
Table 1.1. Plan Participants (* denotes participation in prior plan)
Johnson County *USD229
• *City of DeSoto *USD230 • *City of Edgerton *USD231 • *City of Fairway *USD232 • *City of Gardner *USD233 • *City of Lake Quivira *USD 512 • *City of Leawood • *City of Lenexa • *City of Merriam • *City of Mission • *City of Mission Hills • *City of Mission Woods • *City of Olathe • *City of Overland Park • *City of Prairie Village • *City of Roeland Park

Region L Hazard Mitigation Plan, 2013 Final 1.4
• *City of Shawnee • *City of Spring Hill • *City of Westwood • *City of Westwood Hills • *County • *Consolidated Fire District No. 2 • *Fire District No. 1 • *Fire District No. 2 • *Fire District No. 3 • *Johnson County Community College • *KSSDB (Deaf) • *University of Kansas Edwards Campus
Leavenworth County
• *City of Basehor *USD207 • *City of Easton *USD449 • *City of Lansing *USD453 • *City of Leavenworth *UDF458 • *City of Linwood *USD464 • *City of Tonganoxie *USD469 • *County *University of Saint Mary • *RWD 7
Wyandotte County
• Board of Public Utilities • *City of Bonner Springs • *City of Edwardsville • *Fairfax Drainage District • *Lake Quivira • *Kansas City Community College • *KSSDB (Blind) • *Kansas University Medical Center • *Kaw Valley Drainage District • *Unified Government of Wyandotte County and Kansas City, Kansas • *University of Kansas Hospital • *USD 204 Bonner-Edwardsville • Kansas City Power and Light • Kansas Gas Service
Non- Profit Heart of America Boy Scouts
In addition to the local governments, one private non-profit entity participated in this planning effort:
• *Heart of America Council, Boy Scouts of America Jurisdictions that were reached out to, but did not participate in this plan update were the Wyandotte Nation and USDs 202, 203, and 500, and Rainbow Mental Health, located in Wyandotte County. A description of the jurisdictions participation is provided in Table 1.2.

Region L Hazard Mitigation Plan, 2013 Final 1.5
Table 1.2. Jurisdictions Participation Description (including stakeholders)
Organization Meeting 1 Meeting 2 Meeting 3 Email
Correspondence Data Collection
Guide Mitigation Action(s)
Participating Jurisdictions Johnson County X X X X X X JoCo Health Dept. X X X X X X Cities DeSoto X X X Edgerton X X X Fairway X X X X X Gardner X X X Lake Quivira X X X Leawood X X X X Lenexa X X X X Merriam X X X X X X Mission X X X Mission Hills X X X Mission Woods X X X Olathe X X X X X Overland Park X X X X X X Prairie Village X X X X X Roeland Park X X X X Shawnee X X X X X Spring Hill X X X Westwood X X X Westwood Hills X X X *Board of Public Utilities
X X X X X X
Consolidated FD No. 2
X X X
Fire District No. 1 X X X X Fire District No. 2 X X X Fire District No. 3 X X X Johnson County Community College
X X X X X
Kansas City Power & Light
X X X X X
Kansas Gas Service
X X X X
Kansas School for the Deaf
X X X
University of Kansas Edwards Campus
X X X X X
USD 229 X X X X X X USD 230 X X X X X X USD 231 X X X USD 232 X X X USD 233 X X X X USD 512 X X X
Leavenworth County
X X X X X X
Cities Basehor X X X X X X Easton X X X Lansing X X X X X X Leavenworth X X X X X X Linwood X X X X X Tonganoxie X X X X
Leavenworth County Health Department
X X X X X
Leavenworth Water X X X X RWD #7 X X X X X University of Saint Mary
X X X
USD 207 X X X X USD 449 X X X USD 453 X X X X X

Region L Hazard Mitigation Plan, 2013 Final 1.6
USD 458 X X X USD 464 X X X X USD 469 X X X Wyandotte Co./Unified Government
X X X X X
Cities Bonner Springs X X X X Edwardsville X X X X X
Board of Public Utilities (BPU)
X X X X X
Fairfax Drainage District
X X X X X
Kansas City Community College
X X X
KCK Fire X X X X X Kansas State School for the Deaf and Blind (Blind)
X X X X X
Kansas University Medical Center
X X X X X
Kaw Valley Drainage District
X X X X
Unified Government Health Department
X X X X X
University of Kansas Hospital
X X X X X
USD 204 X X X
Heart of America Boy Scouts
X X X X X
The initial kickoff meetings were coordinated with the Emergency Manager for the respective counties in Region L. Once an agreed upon time and place was established, the emergency managers sent out notifications to all jurisdictions within their county. This included all participating jurisdictions in their current plan, along with those that did not participate during the last plan process. Special Districts, United School Districts, fire departments, surrounding counties, and private non-profits were invited to attend and participate. A brief summary of each of the three meetings is reflected in Table 1.3. Agenda’s and minutes can be found in Appendix B. Table 1.3. Meeting Summaries for Region L Table 1.3
Planning Committee Meetings Meeting Agenda Date(s)
Kickoff Meeting Planning Process, Regional Approach, Planning Requirements, Data Collection Guides, Action Worksheets, Next Steps
15 February 2013 – LV County 20 February 2013 – Johnson County 23 April 2013 – Wyandotte county
2nd Planning Meeting Regional Risk Assessment, Mitigation Goals, Mitigation Actions, Public Comment
24 May 2013 – Leavenworth County 30 May 2013 – Johnson County 04 June 2013 – Wyandotte County
Final Meeting Question and Comments, final discussion on Actions, Risk Assessment, and goals.
15 June 2013 – Johnson County 16 July 2013 – Leavenworth County 17 July 2013 – Wyandotte County
Public Meeting Planning Process, Regional Approach, NFIP, CRS
24 September 2013 – Open to the public for Leavenworth, Johnson, and Wyandotte Counties. Held in Johnson County.
1.5 The Update Process 44 CFR Requirement §201.6(c)(1): [The plan shall document] the planning process used to develop the plan, including how it was prepared, who was involved in the process, and how the public was involved.

Region L Hazard Mitigation Plan, 2013 Final 1.7
A Hazard Mitigation Plan must be updated and adopted by the participating jurisdictions every five years. This plan update took into consideration the current plans for each county within the Region in order to come to a consensus on a completion date that would benefit all the jurisdictions, without letting any plan expire. Because the Johnson County plan was the first to expire, the completion date for this plan was no later than 1 September 2013. Jeanne Bunting, State Mitigation Planner, was the lead planner for the consolidation of the three affected counties into the Regional Mitigation Plan. AMEC was tasked with writing the State Mitigation Plan in a regional format in order to facilitate the data needed for the Regional plan. AMEC was also tasked with conducting the initial kickoff meetings in each of the three counties that reside within Region L, and conducting follow-up for missing information requested at the kick-off. In addition, Ben Grover, State GIS Specialist was in charge of developing the updated maps. The Planning Committee was instrumental in the writing of this plan through their subject matter expertise as well as their dedication to ensuring that the information was gathered and submitted in a timely fashion. The distinction between being a participant and planning committee member versus being a participant only of this plan, was whether the jurisdiction had a physical presence at the meetings. Only those jurisdictional representatives that were physically present at the meeting(s) were on the committee. Following is the list of members of the primary planning committee. Table 1.4. Primary Planning Committee
Planning Committee Jurisdiction Name Position
Johnson County
Cary Gerst Emergency Management Assistant Director, Planning
Rita Hoffman Volunteer/Amateur Radio Operator Trent Pittman Emergency Planner Liz Ticer Johnson County Department of Health and
Environment Jerry Mallory Emergency Management Building Official
City of Fairway Mike Fleming Fairway Police Department City of Leawood David Williams City of Leawood Fire Chief City of Lenexa Eric Ramsey Lenexa Fire Department Division Chief City of Merriam Doug Crockett Merriam Fire Department Assistant Fire
Chief City of Olathe Tim Richards Olathe Fire Department Assistant Fire
Chief
City of Overland Park Ruth Hamel City of Overland Park Management
Assistant Tim Lynch Administrator for EM and HLS
City of Prairie Village Danielle Dulin City of Prairie Village City Manager
Assistant Byron Roberson Prairie Village Sergeant
City of Roeland Park Rex Taylor Roeland Park Chief of Police City of Shawnee Terrance Kegin Shawnee Police Department/Emergency
Mgmt Coordinator
Kansas Gas Service Belinda Ciemiega Operations Clerk Scott Coffee Director, Kansas Gas Service
Kansas City Power & Light Les Boatright KCP&L Emergency Response Manager
Johnson County Community College Alias Pacer Emergency Preparedness Manager Mary Ryan Associate Dean, Academic and Student
Affairs University of Kansas Edwards Campus Sidney Cumberland USD 229 Risk Manager USD 229 Blue Valley Wayne Burke USD 230 Assistant Superintendent USD 230 Spring Hill Trig Morley na Fire District No. 1 James B. Francis Fire Chief Fire District No. 2 Kim Buchannan Emergency Management Deputy
Leavenworth County
David Dalecky Leavenworth County Planning and Zoning Deputy Director
Chuck Magaha Emergency Management Director Krystal Teichmann Leavenworth County Health Department
Emergency Preparedness Coordinator

Region L Hazard Mitigation Plan, 2013 Final 1.8
Mickey Schwartzkopf County Public Works Deputy Director Lloyd Martley Interim City Administrator and Basehor
Chief of Police
City of Basehor Gene Myracle, Jr. Basehor City Superintendent John Young Director of Public Works, Lansing City
City of Lansing Fred Grenier Lansing Police Department, Lieutenant
Patrol Division Mark Nietzke Leavenworth Fire Department Chief
City of Leavenworth
Mike McDonald Leavenworth City Public Works Director John Kanfiman Leavenworth Water Department Manager Shawn Kell Leavenworth City Fire Department
Assistant Chief
City of Linwood Karen kane Linwood City Clerk City of Tonganoxie Jennifer Jones-Lacy Tonganoxie Assistant City Administrator USD 207 Ft Leavenworth Bill Heinen USD 207 Chief Financial Officer USD 453 Amy Sloan USD 453 Director of Support Services Bob Evans Emergency Management Director
Unified Government of Wyandotte County
Mike Baughman Emergency Management Program Coord. Joel Thornton Emergency Management Program
Coordinator Jeff Froman MMRS Program Coordinator Gay Hall UG Health Department Daniel Soptic County Sheriff Melissa Mitchell Unified Government Development Support
Specialist Anthony Hutchinson Building Inspector
Rob Richards Planning George Sooter Public Works Cadi Sanchez Health Center John Helin City Manager, Bonner Springs City of Bonner Springs Kevin Schuler Edwardsville fire Department City of Edwardsville Steve Dailey General Manager, Fairfax Drainage District Fairfax Drainage District Jim Jenkins President – Board member Kaw Valley Drainage District Michelle Protte Administrator Assistant, Sr. Kansas State School for the Deaf and Blind (Blind)
John Martello Deputy Superintendent of Facility Operations and Services
Kelly Morken Emergency Management Coordinator for University of Kansas Medical Center
Kansas University Medical Center Steve Hoeger Regional Hospital Emergency Preparedness Coordinator, University of Kansas Hospital
University of Kansas Hospital Mike Wilson Senior Assistant Chief, KCKFD Kansas City, Kansas Craig Duke Fire Department Patrick Cassidy Director, Environmental Services
BPU
Phil Musser na Chris Stewart Director of Civil Engineering Board of
Public Utilities Ron Wilson Contract Employee
na Heart of America Boy Scouts Rob Richardson Council President
Public Involvement 44 CFR Requirement 201.6(b): An open public involvement process is essential to the development of an effective plan. In order to develop a more comprehensive approach to reducing the effects of natural, man-made, and technological disasters, the planning process shall include: (1) An opportunity for the public to comment on the plan during the drafting stage and prior to plan approval.
Options were discussed at the initial kickoff meetings for solicitation of public input and comments on the mitigation plan. During the second planning meeting a volunteer sign-up sheet was sent around so that the plan participants could indicate their willingness to put a

Region L Hazard Mitigation Plan, 2013 Final 1.9
public notice on their organizations website. Hard copies were put in Public Libraries and Courthouses to make the draft plan readily available to all for comments and input. In addition, the State of Kansas sponsored a facebook page dedicated to the Region L planning process with a link to survey monkey for public feedback. Copies of the survey and links can be found in appendix B.
A second public comment period was held during July 2013. A press release was issued on facebook and through the Counties public information channels that notified the public that the plan summary and questionnaire were available on the County’s website and the State Sponsored facebook page.
The questionnaire that was made available to the public asked them to rank the hazards according to what they believed the biggest threats were, any issues they felt impacted their community that was not addressed, and if they even knew what mitigation was. They were also asked to review mitigation actions considered by the planning committee and place a check next to the ones they felt should be given the highest priority.
Following are some of the public comments received and charts that reflect answers to various questions. For the first public comment period there were 85 responses.
Figure 1.1. Jurisdiction
Leavenworth 50
Johnson 12
Wyandotte 23
1. What Jurisdiction do you live in?

Region L Hazard Mitigation Plan, 2013 Final 1.10
Figure 1.2. Public Ranked Hazards
The public rated the hazards they feel are the greatest threat to the planning area slightly different than the planning committee. In the top five the public had drought, whereas the planning committee indicated Utility/Infrastructure failure with drought as number six.

Region L Hazard Mitigation Plan, 2013 Final 1.11
Figure 1.3. NFIP Importance
According to the public survey, 61.2% stated that the NFIP is very important, with 25.9% indicating it was somewhat important. 8.2% felt it was not important and 4.7% had no opinion.

Region L Hazard Mitigation Plan, 2013 Final 1.12
Figure 1.4. Opportunity to Read HMP
Yes 16.50%
No 41.2%
Not Known42.4%
Figure 1.5. Knowledge of Location of Mitigation Plan
In addition to the data gathered on surveymonkey.com above, there were also 44 responses from the public via hard copy survey’s left in public venues such as courthouses and post offices. Following are some of the pertinent feedback:
NFIP is: Very important 18 Somewhat important 23 Not important 2 No opinion 1
Read HMP: yes: 4 no: 36 no response: 4
Because of the large amount of the respondents who had not read the Hazard Mitigation Plan, we were curious as to who knew where to find it to read. Following is the response:
Know location of HMP: Yes: 13 No: 27 No response: 4
The public was asked to comment on issues the planning committee should address and projects they would like to see implemented. There were 39 responses with the following representing a few of them:
When the public was asked if they had read their local mitigation plan 42.4% indicated they did not know their county had one, 41.2% said no, and 16.5% had read the plan.
Of the public that knew a mitigation plan existed, 61.2% indicated they did not know where the plan could be located in order to read it, and 38.8% stated they knew the location of the plan.
Yes 38.8%
No 61.2%

Region L Hazard Mitigation Plan, 2013 Final 1.13
Coordination of 1st responders and regular training excersizes. More funding for water rescue, emergency response, confined space rescue, ect. 6/20/2013 12:00 AMView Responses
Since utilizing county resources to respond to emergency situations costs taxpayer money, I feel it is important to ensure that these resources are focused on preserving county and state facilities that are built and operated with the same funds. While it is important to ensure that there is as much work done to preserve life and avert suffering, in the end a person's personal property is their responsibility to protect. While it is vital that the county provide as many resources and tools and information for people to enterprise on as possible, but when it comes to the actual adjudication of manpower and funds vital infrastructure elements need to be of the utmost priority. Preserving the power grid, establishing routes of transportation, and maintaining the various utilities that make current established life safe, hygienic, and efficient is a far more valuable use of limited county resources than trying to save every individual affected by a disaster. 6/19/2013 2:16 PMView Responses
Every school should have shelters for all staff and students to protect them against EF5 level tornadoes. This should be mandatory for every school, regardless of age. 6/19/2013 2:16 PMView Responses
I appreciate that power line upgrades and protection of ciritcal facilities are high on the list of priorities. Publication of the mitigation plan (perhaps on local government channels or the internet) should be more visible. 6/19/2013 12:01 AMView Responses
One of the biggest threats for damage in a wind/ice storm are broken tree branches impacting power lines and service to building lines. Those branches are also the biggest cause of major outages and outages that are the most difficult to repair, since damage is so wide spread. BPU does tree trimming to clear transmission lines, but there is no program to educate home owners about that problem nor is there any program to assist home/business owners to abate tree limbs that threaten in bad weather. 6/11/2013 2:17 PMView Responses
better monitoring of questionable potentially hazardous waste emissions from industrial plants 6/11/2013 11:02 AMView Responses
Create resources to enable the counties to have readily available emergency supplies in a self contained trailer that can be immediately dispatched to critical areas. The supplies should include food, water, first aid, lighting, backup generator, and hot and cold weather supplies. This would greatly reduce the time needed to get supplies to the public and first responders. Should hold 48 hours worth of supplies. 5/30/2013 11:56 AMView Responses
Stop builders and developers from building in flood planes. 5/29/2013 9:04 AMView Responses
I would like to see a serious look in to road improvements. Leavenworth County is so far behind in road improvements that could save life and property damage. I am tired of seeing so much money being spent on parks and trails instead of where it is needed. 6/19/2013 8:28 PMView Responses
Assistance to those affected by man made flooding, such as levees being broken north of us that impacted our area by no fault of our own. Some insurance companies would not cover loss because it was man made not natural. 6/19/2013 4:18 PMView Responses
I wish there was a stronger way to volunteer during natural disasters or heavy snowfall. I have yet to find an option to participate in relief efforts for civilian volunteers. This last snow fall I called in to both the Sheriff’s Office and Emergency Management to ask if any help was needed and I was told that county workers had it covered. While I don’t doubt the skill of the county relief workers I highly doubt that there was nothing that someone with time and inclination could help out with, especially in unskilled avenues such as hand shoveling. It’d be nice to have some sort of volunteer coordinator or system for those who wish to volunteer not through an organization like Red Cross but the county itself. 6/19/2013 2:16 PMView Responses

Region L Hazard Mitigation Plan, 2013 Final 1.14
Less red tape for organizations wanting to help. Our church is no longer qualifed as a Red Cross shelter because we don't have the space to store cots and supplies. (or so I've heard). Seems if an organization wants to donate space for temporary shelter, they would be welcome and other arrangements could be made for storage of the materials. 6/19/2013 12:01 AMView Responses
I would like to see a County wide emergency management rehersal, with limited access to electricity, telephone and computer, cell phone connections. 6/4/2013 8:33 PMView Responses
I don't understand what a mitigation project is. 6/1/2013 5:15 PMView Responses
The second public comment period opened on June 15th and lasted until August 1, 2013. There were 102 responses on surveymonkey.com, which mirrored the first public comment period. The majority of the public that responded agreed with the ranking of the hazards and felt NFIP was very important to their community. It is also interesting to note that the majority of the public that responded did not know where their mitigation plan was located or what exactly it is.
On September 24, 2013 a public meeting was held at the Emergency Operations Center in Johnson County for all the counties in Region L. This was advertised via newspaper advertisements, Facebook, and on the Emergency Management websites. While no members of the public participated, it was a chance for the Emergency Managers of the three counties, and the floodplain managers to get together and have an in-depth question and answer session of NFIP, CRS, and the plan as a whole. The meeting was productive. Following are the individuals and jurisdictions that participated:
Jurisdiction Name Unified Government of Wyandotte County Melissa Mitchell Kansas Department of Agriculture/Division of Water Resources
Steve Samuelson
Leavenworth County Jeff Joseph, Floodplain Manager City of Merriam Hye Jin Lee, City Engineer/Floodplain Manager City of Shawnee Jonathon Wiles, Emergency Management City of Shawnee Terry Keglin, Floodplain Management Wyandotte County Mike Baughman, Emergency Manager Johnson County Cary Gerst, Emergency Management Leavenworth County Kim Buchanan, Emergency Management Leavenworth County Chuck Magaha, Leavenworth County Emergency
Manager City of Overland Park Tom Meyers, City

Region L Hazard Mitigation Plan, 2013 Final 1.15
Coordination with Other Departments and Agencies
44 CFR Requirement 201.6(b): An open public involvement process is essential to the development of an effective plan. In order to develop a more comprehensive approach to reducing the effects of natural, man-made, and technological disasters, the planning process shall include: (2) An opportunity for neighboring communities, local and regional agencies involved in hazard mitigation activities, and agencies that have the authority to regulate development, as well as businesses, academia and other private and non-profit interests to be involved in the planning process. (3) Review and incorporation, if appropriate, of existing plans, studies, reports, and technical information.
Local, State, and Federal agencies and departments were invited to the planning meetings in order to learn about, and contribute to the planning process. All organizations that were invited are included in Appendix B. Unique to the Regional Planning process is the invitation for surrounding counties to attend the meetings. Because it is a Regional Plan, it is a multiple county plan. However, the Kansas Division of Emergency Management posted all the meetings in their quarterly newsletter, and sent calendar invites to various state, federal and local governments. Following are some of these entities which attended:
• Federal Emergency Management Personnel • Kansas Division of Water Resources • Kansas Department of Agriculture • Kansas Division of Emergency Management
The planning committee reached out to other organizations and agencies as part of the collaboration initiative in order to collect and review technical data, reports, and plans. These include the State Hazard Mitigation Plan, Multi-jurisdictional Hazard Mitigation Plans for Johnson, Leavenworth, and Wyandotte counties, Metro area Commodity Flow Study, available DFIRMS, Emergency Action Plans, Kansas Department of Health and Environment studies and statistical analysis, United States Corps of Engineers high and significant dam studies, as well as levee information. The United States Department of Agriculture and Unites States Census Bureau were invaluable for their demographic and agricultural information, and the National Weather Service was instrumental in statistical data on weather events. All of the above entities, and those not named, were paramount to the analysis of and identification of hazards, vulnerabilities, capabilities, and the formation of goals and actions. These sources are documented throughout the plan. A list of contacts that were repeatedly contacted can be found in Appendix D.
Identify and Profile the Hazards
The planning committee was unanimous in its decision to incorporate all 22 identified hazards in their plan that the State of Kansas has listed in the State Hazard Mitigation Plan. It was agreed that all of these hazards could affect the planning area, albeit at different degrees. Past events

Region L Hazard Mitigation Plan, 2013 Final 1.16
and impacts were discussed at the kick off meetings, which led to the affirmation and/or changing of the calculated priority risk index for each hazard. Historical events, topography, and undocumented events were used to determine the probability, magnitude, duration, and warning time of each of the 22 hazards. The methodology and resources used to identify and profile the hazards can be found in Sections 3.1 and 3.2.
Assets
The planning committee collected information on the likely impacts of future events on the jurisdictions that participated in the plan. The assets are integral to the vulnerability and capability assessment.
Vulnerability Assessment
The Vulnerability of a community begins with its assets which include the total number and value of structures; critical facilities and infrastructure; natural, man made, and technological, historic and cultural assets, economic assets, and vulnerable populations. Development trends were also analyzed. The assets at risk were discussed for the planning area as a whole for those hazards that do not vary geographically.
Capability Assessment
The capability assessment is accomplished by identifying the existing mitigation capabilities of the participating jurisdictions. This includes existing government programs, policies, regulations, ordinances, plans and policies. Technological and fiscal resources were assessed as well as on-going mitigation initiatives that include public outreach. This data is available in more detail in Section 2 Jurisdictional Profiles.
Estimate Losses
Hazards that received a high or moderate planning significance were also subjected to an estimated loss using best available data. HAZUS was utilized to estimate losses in the planning area for flood and earthquake events. This methodology is further detailed for each hazard that included a loss estimate in section 3. Another path to estimated losses was the utilization of scenario events. These are hypothetical but give a good indication of losses should a hazard event strike.
Goals
During the second planning meeting the discussion was centered on the goals for the Region. It was decided that the Region would not list objectives for this plan update. The risk assessment, issues identified, and concerns were all scrutinized for the profiled hazards. After a lot of thought and deliberation, the planning committee refined the wording of the goals, achieving a consensus which is described in Chapter 4.

Region L Hazard Mitigation Plan, 2013 Final 1.17
Activities
During the kick off meetings, each jurisdiction was given a worksheet in order to put down any mitigation actions they wanted to see incorporated into the plan. They were also given a table that reflected the current mitigation actions that resided in the current plan so that they could review them for accuracy, and delete them if they were no longer applicable. During the second planning meeting it was decided that the STAPLEE process of prioritization would be reviewed based on the prior actions, but was not an accurate depiction of the community’s true process on how they rate their actions. It was decided that the planning committee would rate the new actions with a High, Medium, or Low ranking, and not utilize the STAPLEE criteria as laid out. This process is described in more detail in Chapter 4 Mitigation Strategy.
Draft the Plan
The first complete draft of the plan was made available prior to the second meeting of the committee. Comments, suggestions, and concerns were incorporated into the final draft of the plan which was available for the third meeting in July. The plan was made available to the general public and other agencies during the same timeframes for review and comment. These comments, when applicable, were incorporated into the final draft for submission to FEMA VII.
Adopt the Plan
Appendix A of this plan houses the signed resolutions adopting the plan.
Implement, Evaluate, and Revise the Plan
The planning committee reviewed and agreed upon an overall strategy to implement the plan, monitor and maintain the plan during meeting 3. Chapter 5 Plan Maintenance Process further defines this process.

Region L Hazard Mitigation Plan, 2013 Final 2.1
2 Jurisdictional Profiles
2.1.1 Topography
The topography of Region L is comprised of two distinct geographical areas: the Glaciated Region and the Osage Cuestas.
The Glaciated Region is a result of glaciers that moved through the area twice between 1.6 million and 10,000 years ago. This topographical region is distinct for its silt, pebbles, and boulders that remained after the glaciers melted away.
The Osage Cuestas are predominantly in the southeastern portion of the State of Kansas and are noted for its foundation rocks which are among the oldest exposed in Kansas. The Cuestas are comprised of rolling hills and low ridges that are steep on one side and gently sloping on the other.
The Missouri River borders Leavenworth and Wyandotte Counties, which creates a known flooding risk. The last flood event that affected Leavenworth and Wyandotte County was the Missouri River flood of 2011.
Figure 2.1 and 2.2 show the distinct regions of Kansas:

Region L Hazard Mitigation Plan, 2013 Final 2.2

Region L Hazard Mitigation Plan, 2013 Final 2.3
2.1.2 Population
The following summarizes the population within Region L, followed by Table 2.1 which shows the population data broken out for each county.
According to the 2010 U.S. Census Bureau, the regional population in 2010 was 777,911. The population in the region has increased by 14.79% from 2000 to 2010. Table 2.1 shows the population trend for the past decade in the three counties that makeup the Region. With the exception of Wyandotte County, the Region has seen substantial growth in the prior decade, and is expected to continue these gains.
The most densely populated area within this region, and Kansas as a whole, is Johnson County with 1,149.6 people per square mile. Wyandotte County has 1,039 people per square mile, and Leavenworth County is the least densely populated with 164.7 people per square mile.
Table 2.1. Region L Population, 2000 to 2010, and 2011 Estimates
County 2000 Census Population
2010 Census Population
Population Change
(Numerical) 2000-2010
Population Change
(Percent) 2000-2010
2011 Population Estimates
July 1, 2011
Johnson 451,086 544,179 93,093 20.64% 552,991
Leavenworth 68,691 76,227 7,536 10.97% 77,176
Wyandotte 157,882 157,505 -377 -0.24% 158,224
Subtotal 677,659 777,911 100,252 14.79% 788,391
Source: U.S. Census Bureau 2010, www.census.govkansas
2.1.3 Housing Trends
An indicator of growth for any given jurisdiction is the number of housing units. The U.S. Census Bureau defines a housing unit as; a house, an apartment, a mobile home or trailer, a group of rooms, or a single room that is occupied, or, if vacant, is intended for occupancy as separate living quarters. As indicated in table 2.2, overall Region L has seen gains in housing units with a total increase of 18.43%. Johnson County had the largest increase in housing units with an additional 44,959.

Region L Hazard Mitigation Plan, 2013 Final 2.4
Table 2.2. Housing Unit Gains 2000-2010
County 2000 Census Housing
Units
2010 Census Housing Units
Housing Unit Change
(Numerical) 2000-2010
Housing Unit Change (Percent)
2000-2010
Johnson 181,612 226,571 44,959 24.76%
Leavenworth 24,401 28,697 4,296 17.61%
Wyandotte 65,892 66,747 855 1.30%
Total 271,905 322,015 50,110 18.43%
Source: U.S. Census Bureau 2010, www.census.gov
2.1.4 Economics
Region L has a wide and diverse economic footprint. The agriculture industry holds the smallest percent of employment in the three counties. The highest percentage of employment, across the board in Region L is in educational services and health care. The highest class of worker for all three counties is private wage and salary workers, with Leavenworth County notable for having 25% of its workforce in the government sector. As far as income and benefits, Leavenworth County and Johnson County are predominantly in the $100,000 to $149,999 range, with Wyandotte County in the $50,000 to $74,999 range per total household income.
2.1.5 Climate
The climate in Region L is consistent among all three counties, with each having four distinct seasons: winter, summer, spring, and fall. Average rainfall for Region L is 37.86 inches per year, with an average of 216 days of sunshine. Snowfall averages are 16.83 inches. The average July high for the region is 89.76 degrees, and the average January low is 19.7 degrees. While the aforementioned are averages for the region, currently all of Kansas is in a severe to exceptional drought, which has been ongoing for several of years. Since drought can skew the averages, the past several years were not included in the precipitation totals.
2.1.6 Capabilities
Region L’s funding capabilities exceed most of the state of Kansas. While funding is an issue everywhere, Johnson, Wyandotte, and Leavenworth Counties are more able to withstand the staffing and budgetary constraints that come with an economic downturn.
More economic details for the region is discussed further within the county sections.

Region L Hazard Mitigation Plan, 2013 Final 2.5
2.1.7 Exposure of Built Environment/Cultural Resources
This section quantifies the buildings exposed to potential hazards, by county. Table 2.3 and Table 2.4 provide the value of the counties built environment and its contents, which in addition to the population information presented above, forms the basis of the vulnerability and risk assessment presented in this plan. This information was compiled from inventory data associated with FEMA’s loss estimation software HAZUS-MH 2.1. Buildings are classified into seven categories: residential, commercial, industrial, agriculture, religious, government, and educational. Values reflect 2006 valuations, published by R.S. Means Company (Means Square foot Costs, 2006) with replacement costs.

Region L Hazard Mitigation Plan, 2013 Final 2.6
Table 2.3. Estimated Replacement Value of Buildings by Category for Region L (2006)
County Residential ($1,000s)
Commercial ($1,000s)
Industrial ($1,000s)
Agriculture ($1,000s)
Religion ($1,000s)
Government ($1,000s)
Education ($1,000s) Total ($1,000s)
Mitigation Planning Region L Johnson $32,813,492 $8,111,879 $1,699,112 $112,125 $612,676 $143,472 $378,712 $43,871,468 Leavenworth $3,928,203 $578,117 $104,793 $27,384 $81,685 $41,955 $115,646 $4,877,783 Wyandotte $8,317,902 $2,408,512 $739,055 $22,467 $346,313 $68,468 $163,949 $12,066,666 Region L Total $45,059,597 $11,098,508 $2,542,960 $161,976 $1,040,674 $253,895 $658,307 $60,815,917
Table 2.4. Estimated Replacement Value of Building’s contents by Category for Region L (2006)
County Residential ($1,000s)
Commercial ($1,000s)
Industrial ($1,000s)
Agriculture ($1,000s)
Religion ($1,000s)
Government ($1,000s)
Education ($1,000s) Total ($1,000s)
Mitigation Planning Region L Johnson $16,411,492 $8,556,170 $2,361,961 $112,125 $612,676 $160,661 $428,039 $28,643,124 Leavenworth $1,965,410 $622,375 $130,698 $27,384 $81,685 $46,187 $119,213 $2,992,952 Wyandotte $4,161,308 $2,573,106 $1,049,118 $22,467 $346,313 $72,009 $196,832 $8,421,153 Region L Total $22,538,210 $11,751,651 $3,541,777 $161,976 $1,040,674 $278,857 $744,084 $40,057,229

Region L Hazard Mitigation Plan, 2013 Final 2.7
Cultural Resources
When determining mitigation strategies for Region L, historic and cultural resources should be considered. The following provides the number of National and State Historic Register Listings in the region by county. These will be further detailed in the respective county section that follows.
• Johnson County 32
• Leavenworth County 43
• Wyandotte county 43
Existing Plans and Policies for Region L are a localized concern which can ultimately affect the whole region. Each jurisdiction maintains plans, policies and codes in order to preserve and develop their geographic limits, to include the incorporation of mitigation thoughts, ideas, and actions into their local plans. One area that is very well spelled out in the local plans and policies is their commitment to floodplain management and storm water runoff. With few exceptions the Region has heavily endorsed the NFIP program and public education about various hazards affecting their jurisdictional boundaries and beyond. Building codes are in place to ensure the safety of the population and Comprehensive plans lay out future development in order to mitigate for known problem areas such as flood, wildfire, utility/infrastructure failure, and more. Green and open space is a common thread throughout their plans, and ensuring the integrity of the floodplain. Another common theme throughout their plans as it relates to mitigation is the wildfire-urban interface which poses a problem for various jurisdictions within the region. Through their firewise and other fire prevention plans they are seeking to mitigate for this hazard. Wildfire actions can be found in Chapter 4 that help address mitigation efforts that have been identified. The list of the incorporation of mitigation into their local plans is exhaustive, and the jurisdictions welcome the public to view their local websites for more information. These websites can be found under each jurisdiction under the heading of Land Use and Development Trends.

Region L Hazard Mitigation Plan, 2013 Final 2.8
2.2 Johnson County History
The first inhabitants of Johnson County were the Shawnee and Kansas Indians who found a plethora of bears, beavers, mink, otters, and wolves for sustenance. In 1825, the Shawnee reservation was set aside for these Indians and by 1844 the reservation had more than 1,600,000 acres.
The county was officially established in 1855. The first battle of the Civil War that occurred within Johnson County was the battle of Blow-hard. Among Johnson County’s colorful past was the raid on Olathe by C.R. Jenison, followed by Quantrill. Quantrill next raided Shawnee - nearly burning the entire city down.
After the Civil War years, Johnson County grew at a rapid pace. In 1870 the population was 13,000 and by 1910 it had risen to 18,288. After WWII the population had grown to 63,000 and by the 60s that figure doubled. After the opening of Interstates 35 and 435, rural areas were opened to new development, ultimately increasing the employment number for businesses by 200%.1
2.2.1 County Geography/Topography
Johnson County is bordered by Leavenworth and Wyandotte Counties on the north, the State of Missouri to the east, Miami County on the south and Douglas County on the west. The area is approximately 480 square miles. Johnson County lies partly within the Attenuated Drift Border division of the Dissected Till Plains (Glaciated Region) and partly in the Osage Cuestas division of the Osage Plains (Schoewe, 1949). Much of the area consists of gently rolling uplands with hilly areas along the streams. North-flowing streams are tributaries of the Kansas River, such as Kill Creek, Cedar Creek, Mill Creek, and have steeper gradients and greater local relief than east-flowing and south-flowing streams. Relief of 150 to 250 feet is common within a mile of the north-flowing streams in their more hilly parts. Local relief along the east-flowing tributaries of the Missouri River and the south-flowing tributaries of the Marais des Cygnes River within a mile of the stream generally is less than 150 feet.
Figure 2.3 reflects a map of the Johnson County planning area:

Region L Hazard Mitigation Plan, 2013 Final 2.9
Figure 2.3. Johnson County Planning Area

Region L Hazard Mitigation Plan, 2013 Final 2.10
2.2.2 Johnson County Climate
Johnson County, KS, receives 38 inches of rain per year, on average. The US average is 37. Snowfall average is 17 inches, while the average US city gets 25 inches of snow per year. The number of days with any measurable precipitation is 89. On average, there are 216 sunny days per year in Johnson County, KS. The July high is around 89 degrees. The January low is 20. The comfort index, which is based on humidity during the summer months, is a 34 out of 100, with higher values being more comfortable. The US average on the comfort index is 44. The aforementioned climate statistics do not account for the severe drought that the State of Kansas has been in for 2 years. Since the beginning of 2012, Johnson County has received an average of 56% of their normal precipitation.
2.2.3 County Population/Demographics
According to the U.S. Census Bureau, the total population of Johnson County in 2010 was 544,179. The population in the County has increased over the past decade by 20.64%. Table 2.5 below shows the population trends for the participating jurisdictions within Johnson County:
Table 2.5. Johnson County Jurisdictional Population/Changes from, 2000 to 2010
Jurisdiction 2000 Population 2010 Population Difference 2000 – Desoto 4,561 5,720 1,169
Edgerton 1,440 1,671 231 Fairway 3,952 3,882 (70) Gardner 9,396 19,123 9,727.0 Lake Quivira 932 906 (26) Leawood 27,656 31,867 4,211 Lenexa 40,238 48,190 7,952 Merriam 11,008 11,003 (5) Mission 9,727 9,323 (404) Mission Hills 3,593 3,498 (95) Mission Woods 165 178 13 Olathe 92,962 125,872 32,910 Overland Park 149,080 173,372 24,292 Prairie Village 22,072 21,447 (625) Roeland Park 6,817 6,731 (86) Shawnee 47,996 62,209 14,213 Spring Hill 2,727 5,437 2,710 Westwood 1,533 1,506 (27) Westwood Hills 378 359 (19) Unicorporated Johnson
14,853 11,885 (2968)
Total County 451,086 544179 93,093 Source: US Census Bureau

Region L Hazard Mitigation Plan, 2013 Final 2.11
In Table 2.6 are Census Bureau demographics and societal characteristics for Jurisdictions within Johnson County.
Table 2.6. Johnson County Jurisdictional Demographics
Jurisdiction White % Black or African American
Hispanic/Latin (Any Race) (%)
Average Household Size (people)
Bachelor Degree or Higher (%)
DeSoto 89.7 .8 14.6 2.81 27.9 Edgerton 93.7 .8 4.3 2.79 15.3 Fairway 95.3 .8 3.0 2.24 39.1 Gardner 89.7 3.0 6.2 2.83 32.1 Lake Quivira 96.4 .6 1.8 2.5 33.8 Leawood 92.3 1.9 2.2 2.66 74.7 Lenexa 84.4 5.8 7.3 2.5 51.6 Merriam 83.4 6.1 10.7 2.24 33.9 Mission 84.6 5.5 8.2 1.82 48.0 Mission Hills 96.8 .2 1.8 2.79 49.0 Mission Woods 97.8 06 0 2.31 40.8 Olathe 83.1 5.3 10.2 2.79 44.7 Overland park 84.4 4.3 6.3 2.37 56.6 Prairie Village 95.3 1.0 3.4 2.16 63.6 Roeland Park 87.6 3.7 10.4 2.24 51.4 Shawnee 86.3 5.3 7.5 2.64 41.7 Spring Hill 93.7 1.6 4.0 2.95 27.0 Westwood 94.6 .9 7.7 2.18 35.4 Westwood Hills 94.4 1.7 3.1 2.15 46.6 Johnson Co. 88.2 4.7 7.3 2.51 51.3 Source: U.S. Census Bureau
According to the U.S. Census Bureau, by gender breakdown, males represent 48.9 percent of the population, and females represent 51.1 percent of the population.
2.2.4. County Economics
INDUSTRY Estimated Employees % Civilian employed population 16 years and over 308,370 74.7 Agriculture, forestry, fishing and hunting, and mining 1275 0.4% Construction 13,745 4.7% Manufacturing 24,737 8.4% Wholesale trade 12,734 4.3% Retail trade 33,519 11.4% Transportation and warehousing, and utilities 11,721 4.0%

Region L Hazard Mitigation Plan, 2013 Final 2.12
INDUSTRY Estimated Employees % Information 14,006 4.8% Finance, insurance, real estate and rental and leasing 29,645 10.1% Professional, scientific, management, administrative and waste
43,011 14.7%
Educational services, health care and social assistance 65,100 22.2% Arts, entertainment, recreation, accommodation and food services 21,565 7.4% Other services, except public administration 13,556 4.6% Public administration 8,593 2.9% Source: U.S. Census Bureau
According to data provided by the United States Census Bureau, Education Services, Health Care and Social Assistance are the leading Industry in Johnson County at 22.2%. At the bottom of the Industry list is agriculture, forestry, fishing and hunting, along with mining, with .4% of the workforce.
The lead in occupations in Johnson County is management, business, science, and the arts. At the bottom of the occupation list is employment in natural resources, construction, and maintenance. Private wage and salary workers make up 83.1% of the class of workers, with government second at 11.2%.. Self-employed in own not incorporated business workers is 5.7%.. The following is a chart that shows the top four occupational fields in Johnson County:
51%
13%
29%
7%
Management,business, science,and artsService
Sales and Office
Production &Transportation

Region L Hazard Mitigation Plan, 2013 Final 2.13
2.2.5 Johnson County Capabilities
The mitigation capabilities are profiled in the following section and include: organizational structure; staff, fiscal, and technical resources; adopted plans, policies, and regulations, if any.
Johnson County
Overview
The jurisdiction Johnson County includes all unincorporated areas within the County boundaries, and 7 townships. Johnson County is a full service local government including the following departments and agencies:
Airport Commission District Court Trustee Library Appraiser Election Office Mapping / GIS - AIMS Archives & Records Mgmt Emergency Communications Med-Act Audit Services Emergency Mgmt & Homeland Security Mental Health Budget & Financial Planning Environmental Motor Vehicle Building Codes Extension Office Museums Bus - The JO Facilities Management Park & Recreation Collections Unit Financial Management Planning & Development Community Development Grants Management Public Health Contractor Licensing Human Resources Public Works Corrections Human Services & Aging Records & Tax Admin County Manager's Office Information Technology Services Sheriff's Office Court Services Law Library Treasurer's Office Developmental Supports Legal Wastewater District Attorney's Office District Courts
Land Use and Development Trends
As depicted in the regional information section, Johnson County is the fastest growing of all the counties in the region, as well as the State of Kansas. Since 2000, the population has grown by 20.64%, which contributes to construction, employment, services, and all other aspects of the economy. Because of its urban landscape it is attractive to young adults and the elderly who are entering retirement and/or want to be closer to advanced medical facilities. Currently, land uses within Johnson County’s unincorporated area are pre-dominantly agriculture and scattered residential development. More concentrated residential areas are found in and around the Aubry-Stillwell area, Gardner Lake, and the Blue River Valley area. Except for some areas on U.S. Highway 69, U.S. Highway 169, I-35, and at the New Century AirCenter, commercial and industrial uses primarily are found in the cities. A significant amount of single-family residential land uses are located east of the U.S. 69 Highway corridor to the southern County line (215th street). There are also small pockets of residential development that existed prior to 1986 throughout the unincorporated area. The following figure depicts the current land use for Johnson County.

Region L Hazard Mitigation Plan, 2013 Final 2.14
Figure 2.4. Johnson County Existing Land Uses
Johnson County is committed to floodplain management through its mitigation, policies, and activities.
Region L Hazard Mitigation Plan, 2013 Final 2.15
In their Rural Comprehensive Plan, Johnson County has set the following goals and policies, which can be found in their entirety at www.jocogov.org, for current and future land use.
1. Public Participation.
2. Coordinated approach to development. Political and service jurisdictions throughout Johnson County have a coordinated decision-making framework for ensuring the orderlylocation and orientation of future land uses with adequate public improvements and services.
3. Regional Coordination. Johnson County coordinates its planning and development to contribute to the physical, social, and economic well being of the greater Kansas City region.
4. Environmental Quality. Development is integrated with the natural environment, respects the limitations imposed by environmental factors, and protects the amenities that natural assets offer. Use the County’s Stormwater Management Program recommendations to guide and coordinate stormwater management. Continue to update and implement the county’s Floodplain Management program. Floodplains should be considered as part of the County’s infrastruc-ture and should be managed to protect the environment as well as to minimize the impact of flooding on development. Consider adopting and im-plementing the stormwater en-gineering standards, and design guidelines prepared with the Kansas City Metropolitan Chapter of the American Public Works Association and the Mid-America Regional Council in 2003. These include the “Stormwater Standards” known as Section 5600, the “Erosion/ Sediment Control Standards and Specifica-tions” known as Sections 2100 and 5100, and the “Best Management Practices Manual for Stormwater Quality.”
5. Land Use. Johnson County has achieved the compatible physical and economic coexistence of rural residences, agriculture uses, and cities.
6. Urban Fringe Policy Area. The purpose of the Urban Fringe Policy Area is to allow for "balanced and orderly" growth - preserving existing residences, active agricultural uses, and valuable open space, while enabling the gradual transition of portions of this area to development through close cooperation between the County and adjacent cities as well as through coordinated planning with utility and other service providers (e.g., electricity, fire protection, and schools). Standard Residential Density: 1 dwelling unit per 2 acres.
7. Rural Policy Area. The purpose of the Rural Policy Area is to maintain the existing open space amenities and rural character, while allowing limited residential development that incorporates rural characteristics, and, to the extent reasonable, protects and promotes open space systems, wildlife habitats, riparian areas, and scenic views. The purpose of this policy area is also to ensure the efficient allocation of limited public resources and to assure that there is adequate infrastructure to support development. Proposed

Region L Hazard Mitigation Plan, 2013 Final 2.16
developments that do not meet this standard may be viewed as premature and inappropriate. Standard Residential Density: 1 dwelling unit per 10 acres.
8. Rural Traditional Policy Area. The purpose of the Rural Traditional Policy Area is to maintain and support the area for continued farming and agricultural production with only very low levels of farming-related residential development due to the limited availability of public infrastructure and services to support it. Non-agricultural related development that is incompatible or may interfere with agricultural operations in the Rural Traditional Policy Area is discouraged. Standard Residential Density: 1 dwelling unit per 10 acres.
Figure 2.5. Unincorporated Johnson County Policy Area Map

Region L Hazard Mitigation Plan, 2013 Final 2.17
Technical and Fiscal Resources
Johnson County is included in the definition of the Metro Region, and along with that nomenclature, it has the resources to fund a plethora of staff resources in planning, engineering, floodplain management, storm water management, emergency management, and GIS services. The Johnson County Emergency Communications Center (ECC) dispatches all 911 calls to Fire and Emergency Medical Services for 14 departments throughout the county. Table 2.8 depicts Johnson County personnel resources in 2013.
Table 2.8. Johnson County Administrative and Technical Resources
Personnel Resources Filled(?) Department/Position Building Code Official Yes Planning and Development Building Inspector Yes Planning and Development Mapping Specialist (GIS) Yes AIMS Engineer Yes Planning & Development/Public Works Development Planner Yes Planning & Development/Public Works Public Works Official Yes Public Works Emergency Management
Yes Emergency Management & Homeland Security
NFIP Floodplain Administrator Yes Emergency Management Bomb Squad Yes Arson Squad Yes Emergency Response Team Yes Hazardous Materials Expert Yes Local Emergency Planning Committee
No Johnson County is part of the Mid-America Regional LEPC
County Emergency Management Commission
Yes County maintains a fully staffed emergency management division
Sanitation Department Yes Handles through private sector Transportation Department Yes Economic Development Department
Yes
Housing Department Yes Johnson county Housing Authority via Human Services Historic Preservation Yes
Fiscally, Johnson County has a wide array of funding sources that can help them to achieve the goals of their mitigation actions. These include:
• Capital improvement project funds
• Levy Taxes for specific purposes
• Community Development Block Grant (CDBG)

Region L Hazard Mitigation Plan, 2013 Final 2.18
• Impact fees for new development
Existing Plans and Policies
Table 2.9 below lists the plans and policies that exist within Johnson County:
Table 2.9. Johnson County Plans and Policies
Element In Use, Yes, No, N/A Comments Planning Capabilities
Comprehensive Plan Yes Capital Improvement Plan Yes City Emergency Operations Plan N/A County Emergency Operations Plan
Yes - 2011 Under annual update
Local Recovery Plan N/A County Recovery Plan Yes Debris Management Plan Yes – 2009 Under revision for 2013 update Economic Development Plan Yes Transportation Plan Yes Land-use Plan Yes Flood Mitigation Assistance (FMA) Plan
Yes
Watershed Plan Yes Firewise or other fire mitigation plan
Yes No firewise
Critical Facilities Plan Yes
Policies/Ordinance Zoning Ordinance Yes Building Code Yes Version 2012 Floodplain Ordinance Yes Subdivision Ordinance N/A Tree Trimming Ordinance N/A Storm Water ordinance Yes Drainage Ordinance Yes Site Plan Review Requirements Yes Historic Preservation Ordinance Yes
Landscape Ordinance Yes Wetlands/Riparian Areas Conservation Plan
Yes

Region L Hazard Mitigation Plan, 2013 Final 2.19
Other Mitigation Activities
Johnson County is proactive in its stance for programs that alleviate the threat of hazards, whether natural, man-made, or technological. Table 2.10 below depicts various programs that the County uses as a mitigation tool:
Table 2.10. Johnson County Program Mitigation Tools
Element In Use, Yes, No, N/A Comments Program
Zoning/Land use Restrictions Yes Codes Building Site/Design Yes Hazard Awareness Program Yes National Flood Insurance Program
Yes
National Weather Service (NWS) Storm Ready Certification
Yes Waiting on renewal for 2013. Granted, not yet received
Land Use Program Yes Public Education/Awareness Yes JCEM has a full community
preparedness program
Property Acquisition Yes Planning/Zoning boards Yes Stream Maintenance Program Yes Engineering Studies for Streams (Local/County/Regional)
Yes
Mutual Aid Agreements Yes Mutual aid agreements are in place in various departments for numerous reasons
Johnson County has numerous studies, reports, and maps in order to illustrate what and where their hazards and vulnerabilities are.
Table 2.11. Johnson County Studies, Reports, and Maps
Element In Use, Yes, No, N/A Comments Studies/Reports/Maps
Hazard Analysis/Risk Assessment (County)
Yes
Evacuation Route Map Yes Maps can be generated at any time through AIMS
Critical Facilities Inventory Yes Vulnerable Population Inventory Yes County maintains access through
the Vulnerable Needs Registry Land Use Map Yes

Region L Hazard Mitigation Plan, 2013 Final 2.20
2.2.6 Critical Facilities and Infrastructure
A critical facility is defined as one that is essential in providing utility or direction either during the response to an emergency or during the recovery operation. Appendix C has an inventory of critical facilities and infrastructure in Johnson County. It includes their replacement value and capacity information when available. These are specific assets identified by the planning committee as the structures and facilities that should receive priority consideration in efforts to minimize risk.
2.2.7 Other Assets
The vulnerability of Johnson County to disaster also involves inventorying the natural, historic, cultural, and economic assets of the area. This is important for the following reasons: • These types of resources warrant a greater degree of protection due to their unique and irreplaceable nature and contribution to the overall economy. • Knowing about them ahead of time allows for a proactive stance to prepare before a disaster hits. In the immediate aftermath, when the potential for additional impacts is higher, it allows for an immediate response in order to lessen any damages. • The rules for reconstruction, restoration, rehabilitation, and/or replacement are often different for these types of designated resources and knowing ahead of time can save time, money, and other resources.. • Natural resources can have beneficial functions that reduce the impacts of natural hazards, such as wetlands and riparian habitat, which help absorb and attenuate floodwaters. • Losses to economic assets (e.g., major employers or primary economic sectors) could have severe impacts on a community and its ability to recover from a disaster. • Historic resources: There are 30 Johnson County properties on the National Register of Historic Places:
• Blackfeather Farm 8140 W. 183rd Street Stilwell 8/22/1996
• Dutton-Thomas-Soule Farm 7925 Sunflower Rd De Soto 8/26/2006
• Edgerton-Grange Hall 400 Nelson Edgerton
• Ensor Farm 18995 W. 183rd Street Olathe 2/27/2004
• Foster, Herman D. House 204 W. Main Street Gardner 11/28/2007
• Franklin R. Lanter House 562 W. Park Street Olathe 10/10/2007
• Harkey House 224 E. Main Gardner
• Hodges House 425 S. Harrison Olathe
• Horn-Vincent-Russell Estate 6624 Wenonga Road Mission Hills 7/25/1997
• Hyer House 505 East Cedar Olathe

Region L Hazard Mitigation Plan, 2013 Final 2.21
• Lackman-Thompson Farm 11180 Lackman Road Lenexa 5/06/1988
• Lanesfield School 18745 S. Dillie Road Edgerton 10/13/1988
• Loomis Historic District 8325 Johnson Dr, 5900 Hadley Merriam 5/17/2006
• Mahaffie House 1100 Kansas City Road Olathe 8/29/1977
• Majors House 8145 State Line Road Leawood 12/29/1970
• McCarthy House 19700 Sunflower Edgerton 7/10/2000
• Ott House 401 S. Harrison Street Olathe 4/01/1998
• Overland Theater 7204 W. 80th Street Overland Park 2/09/2005
• Parker House 631 W. Park Olathe 8/29/1988
2.2.8 Cities City of De Soto
De Soto was founded in 1857 and is located between Lawrence and Kansas City on highway K- 10. The northern border is the Kansas River. According to the 2010 U.S. Census, the population of De Soto is 5,720, an increase of 1,169 since 2000.
Land Use and Development Trends
With the growth in population over the past 10 years comes the need for more housing. Land area of the city is 11.32 square miles, and the population density in 2010 was 516.8 people per square mile. According to the Census Bureau, the City of De Soto had 2,204 housing units. One area the city is seeking to improve is the Residential – Historic ‘Old Town’ District through a revitalization plan. The guide to the City of De Soto ‘Guide to Development’ can be found at www.desotoks.us. The following figure shows the De Soto zoning map as of 2010.
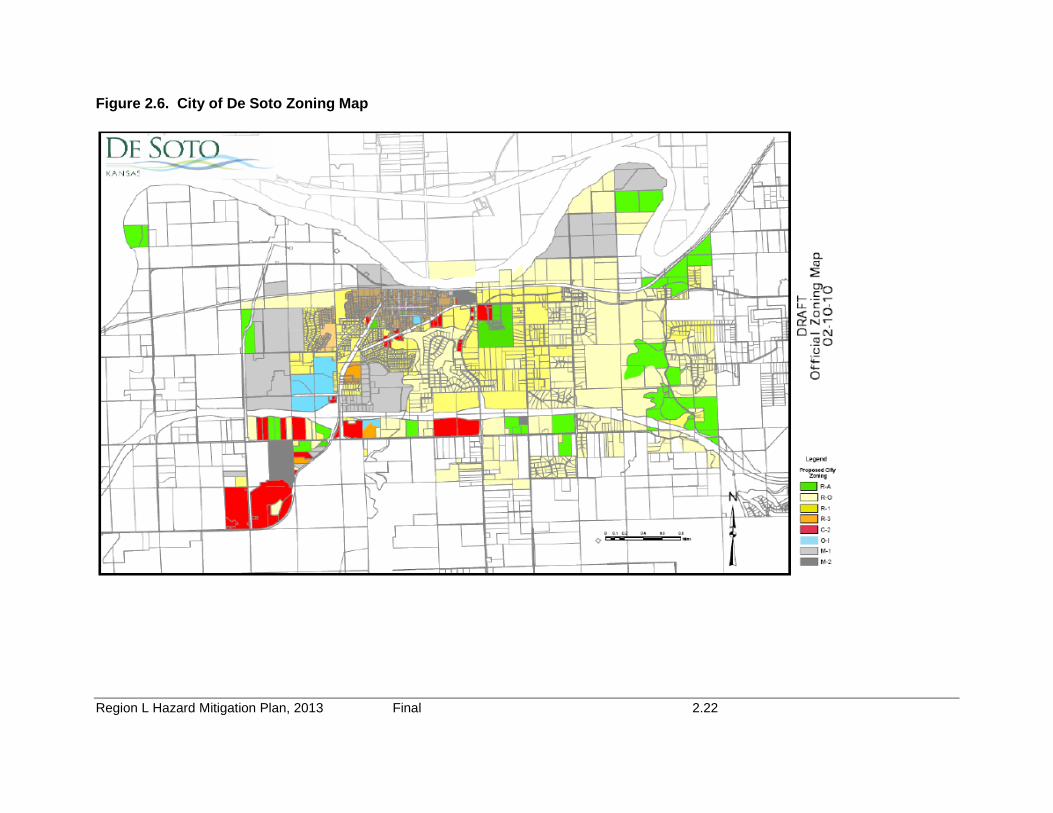
Region L Hazard Mitigation Plan, 2013 Final 2.22
Figure 2.6. City of De Soto Zoning Map

Region L Hazard Mitigation Plan, 2013 Final 2.23
Technical and Fiscal Resources
The City of De Soto has departments that include street, fire, water, wastewater, parks and recreation, planning & zoning, building & inspections, codes enforcement, city clerk, & court clerk. The Fire Chief of Fire District 1 also serves as the Emergency Manager. All other functions are supported by Johnson County.
Financial tools that the City of De Soto could use to help fund mitigation projects include:
• Community Development Block Grants • Capital Improvements project funding • Johnson County Stormwater Management Program • Taxes for specific purposes • Water or Sewer fees • Impact fees for new development • Debt through general obligation bonds • Debt through special tax bonds • Withholding spending in hazard prone areas
Existing Plans and Policies De Soto is a participant in the National Flood Insurance Program (NFIP) and has the following plans and policies in place:
• Comprehensive Plan • Zoning Ordinance • Subdivision Ordinance • Site Plan Review Requirements • Flood Mitigation Plan • Floodplain Management Ordinance • Capital Improvements Program • Building Code • Sewer Master Plan Study • Guide to Development Plan
The City of DeSoto incorporates mitigation into their local planning efforts. One example is their commitment to issues relating to flooding, which is well addressed in their plans, ordinances, and codes. Action DeSoto-1 addresses some of the flood control projects that the city has addressed in order to mitigate for flooding. Other Mitigation Activities None since the last update.

Region L Hazard Mitigation Plan, 2013 Final 2.24
Property Valuation Table 2.12 below depicts the appraised values from the 2013 Abstract of Appraised and Assessed Values report. Table 2.12. Appraised Property Valuation, 2013
Appraised Property Valuation Building Type Real Estate Structures ($) Median Home Value
(2011)($) Residential 223,695,910 211,100
Agricultural 5,026,060
Commercial/Industrial 48,183,507
Not for Profit 294,900
Total $277,200,377 Source: Johnson County Assessor Office/U.S. Census Bureau
City of Edgerton
Overview
Edgerton is considered a small rural town in a very fast growing county. Edgerton sits on highway 56 and is two miles north of Interstate 35. The City became incorporated in 1883 and was named for the chief railroad engineer who helped lay the railroad tracks. According to the 2010 U.S. Census, manufacturing was the highest percentage of Edgerton’s labor force.

Region L Hazard Mitigation Plan, 2013 Final 2.25
Figure 2.7. Edgerton Location
Land Use and Development Trends
In 2010, the population of Edgerton was 1,671, a 13.8% increase since 2000. The land area is 1.28 square miles, and the population density in 2010 was 1,305 people per square mile. With this increase in population comes an increase in construction for new homes. The greatest growth is concentrated just to the north of Interstate 35. Edgerton website is not available. Technical and Fiscal Resources
Edgerton has a governing body and two departments to implement policies, the administration department and public works department. Positions include a part-time building official, a part-time floodplain manager, a part-time emergency manager, and a part-time grant writer. The engineering services are contracted to a consultant and geographic information system (GIS) services are provided by Johnson County.
Financial tools that the city can use to help fund mitigation projects include the following:
• Community Development Block Grants • Capital Improvements Project Funding • Johnson County Stormwater Management program • Taxes for Specific Purposes • Fees for water or sewer • Impact fees for New Development • Debt through General Obligation Bonds • Debt through Special Tax Bonds
Existing Plans and Policies

Region L Hazard Mitigation Plan, 2013 Final 2.26
Edgerton has been a participant in the NFIP since 08/01/1979. It also has the following plans and policies in place.
• Comprehensive Plan • Zoning Ordinance • Subdivision Ordinance • Floodplain Ordinance • Capital Improvements Program • Building Code • Site Plan Review Requirements • Capital Improvements Plan
Other Mitigation Activities
None as of the last plan, dated 2009.
Property Valuation Table 2.13 below depicts the appraised values from the 2013 Abstract of Appraised and Assessed Values report. Table 2.13. Appraised Property Valuation, 2013
Appraised Property Valuation Building Type Real Estate Structures ($) Median Home Value
(2011)($) Residential 44,987,500 $107,300
Agricultural 804,810
Commercial/Industrial 1,650,240
Not for Profit 0
Total $47,442,550 Source: Johnson County Assessor Office/U.S. Census Bureau
City of Fairway
Fairway is located in northeast Johnson County and is encompassed by Roeland Park, Mission Woods, Prairie Village, and Mission. It became incorporated in 1949 and the City is known for its trees and parks. The City is governed by a Mayor and eight City Council members. Consolidated Fire District No.2 provides fire

Region L Hazard Mitigation Plan, 2013 Final 2.27
protection services for the City. City departments include the following:
• Administration • Finance • Building & Planning • Parks & Recreation • Municipal Court • Police • Public Work
Land Use and Development Trends In 2010, the population of Fairway was 3,882, a difference of 50 people since the last plan update. However, this is a decrease of 70 people since the census of 2000. Land area of the city is 1.14 square miles, and population density in 2010 was 3,405 people per square mile. Some of the issues that the City of Fairway has discussed that need further review for planning efforts are: Stormwater; City Hall and whether to build a new one or continue the current lease; the Park and Pool Master Plan, and Public Works. Following is the zoning map for the City of Fairway. The City of Fairway is committed to its floodplain management program through its ordinances, mitigation efforts, and actions. www.fairwaykansas.org. Figure 2.8. City of Fairway Zoning Map.
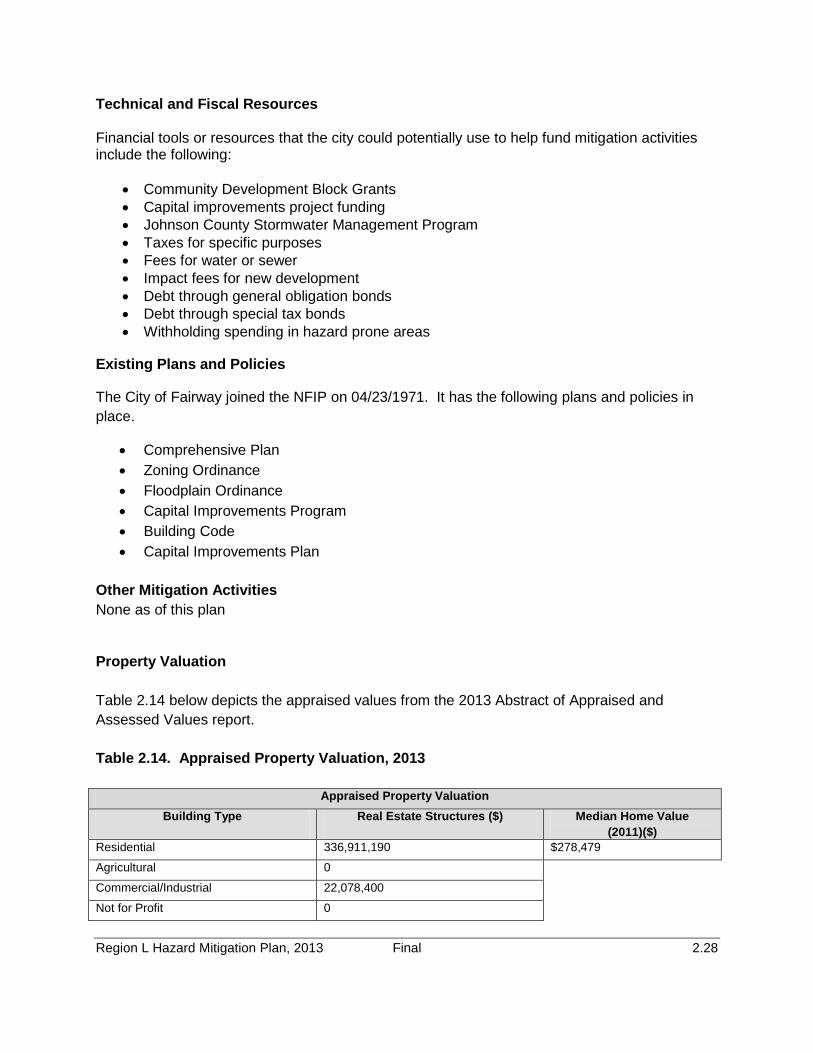
Region L Hazard Mitigation Plan, 2013 Final 2.28
Technical and Fiscal Resources Financial tools or resources that the city could potentially use to help fund mitigation activities include the following:
• Community Development Block Grants • Capital improvements project funding • Johnson County Stormwater Management Program • Taxes for specific purposes • Fees for water or sewer • Impact fees for new development • Debt through general obligation bonds • Debt through special tax bonds • Withholding spending in hazard prone areas
Existing Plans and Policies
The City of Fairway joined the NFIP on 04/23/1971. It has the following plans and policies in place.
• Comprehensive Plan • Zoning Ordinance • Floodplain Ordinance • Capital Improvements Program • Building Code • Capital Improvements Plan
Other Mitigation Activities None as of this plan
Property Valuation Table 2.14 below depicts the appraised values from the 2013 Abstract of Appraised and Assessed Values report. Table 2.14. Appraised Property Valuation, 2013
Appraised Property Valuation Building Type Real Estate Structures ($) Median Home Value
(2011)($) Residential 336,911,190 $278,479
Agricultural 0
Commercial/Industrial 22,078,400
Not for Profit 0

Region L Hazard Mitigation Plan, 2013 Final 2.29
Total $358,989,590 Source: Johnson County Assessor Office/U.S. Census Bureau
City of Gardner
This community was settled mainly by Free State men. Unlike their neighboring State of Missouri that supported slavery. This created many border war raids and ignited the beginning of the Civil War. Gardner became an incorporated town in 1886 and was named in honor of Governor Gardner of Massachusetts, where Free State settlers originated. Though many travelers of the westward expansion had already traveled through Gardner by 1886, it was known as the location where the trails divide. The Santa Fe Trail, the Oregon Trail, and the California Trail all split at this location. Gardner is located in the southwest part of the county and is surrounded by unincorporated Johnson County. The City is operated by a mayor and city council that appoint a city administrator that is responsible for the daily operations of the City. There are also five departments within the City government: Finance, Public Works, Community Development, Public Safety, and Parks & Recreation. The City uses the public safety concept where the police, fire, and medical are all cross-trained and can be a first responder for any public safety concern.
Land Use and Development Trends In 2010, the population of Gardner was 19,123, a 49.1% percent increase since 2007. Today, Gardner has 9.79 square miles of land. Its population density in 2010 was 1,953 people per square mile. The city continues to encourage new growth and development, while at the same time it considers the fiscal constraints of their budget and resources. Key strategies of the comprehensive plan as it relates to current and future land development can be found in its entirety at www.gardnerkansas.gov. Following are some of the strategies identified in the plan:
• The plan encompasses goals and policies that are representative of the community’s desires for the future. It recognizes the numerous plans, projects and studies that are underway or pending, and it anticipates that the plan will be reviewed and potentially revised annually when significant land use changes occur within the planning area.
• The plan promotes development in defined growth areas based on fiscally responsible utility, infrastructure, and annexation plans and policies. By coordinating public and private investments, new urban development can be anticipated to occur in areas most easily served by public facilities and services. Future growth and

Region L Hazard Mitigation Plan, 2013 Final 2.30
development can be scheduled in concert with planned infrastructure improvements.
• The plan defines the limits of urban growth for the planning period.
• The plan proposes the progression of land uses to help achieve a transition in land use and intensity levels, and avoid major or abrupt changes in density and building type.
• The plan supports infill redevelopment and new development which provides a range of residential, commercial, office, industrial and public uses consistent and compatible with the established land use patterns.
• The plan directs new residential development to the north and west of Downtown rather than to the east of Interstate 35 Highway.
• The plan encourages the development of neighborhoods in a range of densities to provide a sense of community, and to complement and preserve natural features in the area.
• The plan seeks compatible densities and housing types in neighborhoods by providing appropriate transitions between low-density residential land uses and more intensive residential developments and non-residential development.
• The plan strives to preserve and enhance downtown Gardner as the primary commercial / civic hub and activity center of the community.
• The plan is based on preserving the land areas east of Interstate 35 and south of New Century AirCenter for future employment, industrial, office, and other nonresidential land uses that are compatible to the airport and the near-by interstate transportation system.
• The plan recommends the protection and preservation of the floodplains and riparian ways throughout the planning area. These resources often are a constraint to urban development.
• The plan encourages the conservation of sensitive natural and environmental features and discourages development that would result in costly public improvement projects. With the new growth in population, the City is currently developing more miles of streets, water lines, storm sewers, and sanitary sewer lines.

Region L Hazard Mitigation Plan, 2013 Final 2.31
Figure 2.9. City of Gardner Future Land Use Map
Technical and Fiscal Resources The City of Gardner has a planner, floodplain manager, emergency manager, and building official. There is also City personnel skilled in GIS. The City has an outdoor storm siren warning system operated by the Gardner Public Safety Department. Financial tools or resources that the city could potentially use to help fund mitigation activities include the following:
• Community Development Block Grants • Capital improvements project funding • Johnson County Stormwater Management Program • Taxes for specific purposes • Fees for water and sewer • Impact fees for new development • Debt through general obligation bonds • Withholding spending in hazard prone areas
Existing Plans and Policies
Gardner has been a participating member of the NFIP since joining on 04/15/1977. Gardner has

Region L Hazard Mitigation Plan, 2013 Final 2.32
the following plans and policies in place.
• Comprehensive plan • Zoning ordinance • Subdivision ordinance • Floodplain ordinance • Capital improvements program • Building code • Economic development plan • Capital improvements plan
Other Mitigation Activities
None available
Property Valuation Table 2.14 below depicts the appraised values from the 2013 Abstract of Appraised and Assessed Values report. Table 2.14. Appraised Property Valuation, 2013
Appraised Property Valuation Building Type Real Estate Structures ($) Median Home Value
(2011)($) Residential 686,675,823 160,800
Agricultural 1,569,280
Commercial/Industrial 56,157,807
Not for Profit 40,700
Total $744,443,610 Source: Johnson County Assessor Office/U.S. Census Bureau
City of Lake Quivira
Lake Quivira is located in the northern section of Johnson County surrounded by the city of Shawnee and Wyandotte County. This small residential suburb has its own 225-acre lake, golf course and amenities. The City has a mayor/city council form of government with several city departments. Departments are Administration, City Clerk, Fire and Police. Land Use and Development Trends In 2010, the population of Lake Quivira was 906, a decrease of 26 people since 2000. Land area of the city is 1.30 square miles, and population density in 2010 was 696.9 people per

Region L Hazard Mitigation Plan, 2013 Final 2.33
square mile. While the majority of the land in the city is already developed, there are a few parcels of land that have the potential to be developed at some time in the future. The city maintains a strict 50% policy whereby 50% of it land must remain for recreation and open space. The City of Lake Quivira has a Comprehensive Plan has the objectives and future recommendations for the city. The following are a few of the objectives and recommendations (the plan can be found in its entirety on the City of Quivira’s webpage). Objectives -
• Maintain the City of Lake Quivira’s current character • Maintain High Development Standards, but allow diversity. • Avoid overburdening city services • Maintain accessibility and quality of recreational facilities.
Figure 2.9a. Existing Land Use for the City of Lake Quivira.
Future land use in the city must maintain its 50% recreational and open space requirement, however, there are a few areas under consideration for development:
• Winding Ridge and Lakeshore East under consideration for large-lot residences. • Northwest corner of the city under consideration for residential use. • Northeast corner of the City is under consideration for residential with a mix of densities
and dwelling types.

Region L Hazard Mitigation Plan, 2013 Final 2.34
• Intersection of Quivira lane and Holliday Drive calls for realignment of Quivira lane to the east side of Holliday Drive with a project use of open space.
• South of Holliday Drive and West of the Main Gate under consideration for continued mixture of public and Quivira, Inc. facilities along with higher-density housing.
Figure 2.9b. City of Lake Quivira Future Land Use Map
Technical and Fiscal Resources Lake Quivira has a planner experienced in land management and engineering infrastructure. The Fire Chief also serves as the City’s Emergency Manager. There is a part-time building official as well as a part-time treasurer.
Financial tools or resources that the city could potentially use to help fund mitigation activities include the following:
• Capital improvements project funding • Johnson County Stormwater Management Program • Taxes for specific purposes • Impact fees for new development • Debt through general obligation bonds • Debt through special tax bonds
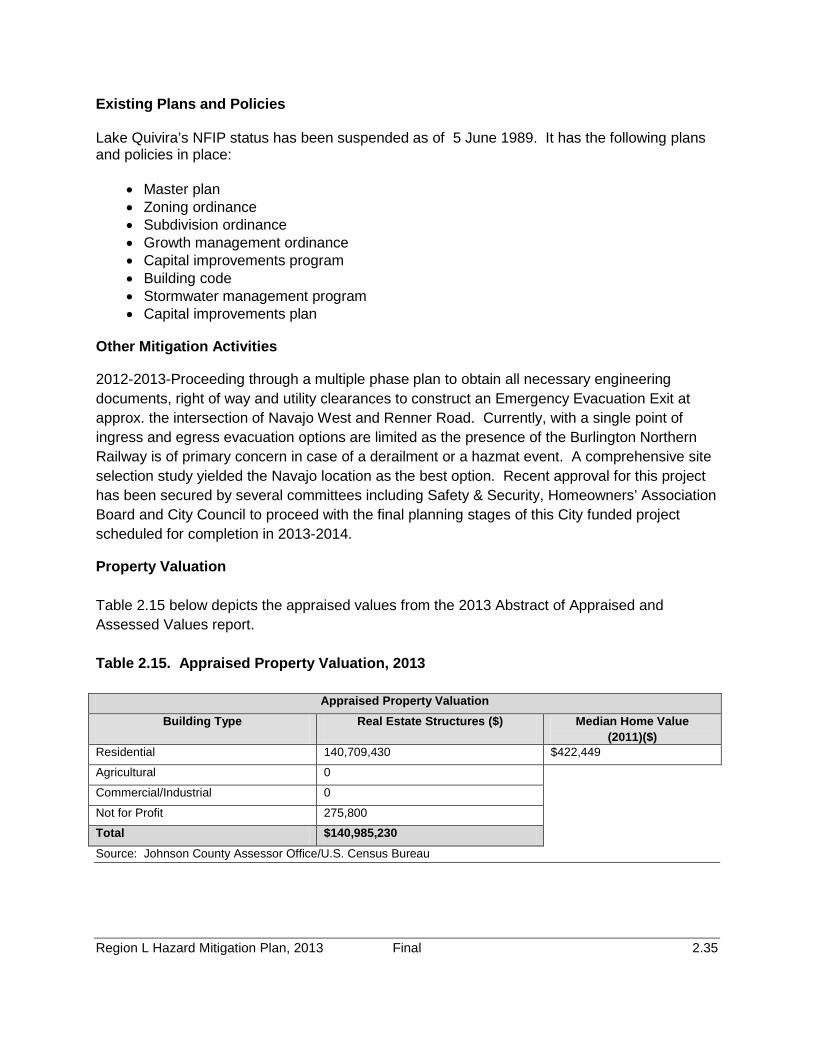
Region L Hazard Mitigation Plan, 2013 Final 2.35
Existing Plans and Policies Lake Quivira’s NFIP status has been suspended as of 5 June 1989. It has the following plans and policies in place:
• Master plan • Zoning ordinance • Subdivision ordinance • Growth management ordinance • Capital improvements program • Building code • Stormwater management program • Capital improvements plan
Other Mitigation Activities
2012-2013-Proceeding through a multiple phase plan to obtain all necessary engineering documents, right of way and utility clearances to construct an Emergency Evacuation Exit at approx. the intersection of Navajo West and Renner Road. Currently, with a single point of ingress and egress evacuation options are limited as the presence of the Burlington Northern Railway is of primary concern in case of a derailment or a hazmat event. A comprehensive site selection study yielded the Navajo location as the best option. Recent approval for this project has been secured by several committees including Safety & Security, Homeowners’ Association Board and City Council to proceed with the final planning stages of this City funded project scheduled for completion in 2013-2014.
Property Valuation Table 2.15 below depicts the appraised values from the 2013 Abstract of Appraised and Assessed Values report. Table 2.15. Appraised Property Valuation, 2013
Appraised Property Valuation Building Type Real Estate Structures ($) Median Home Value
(2011)($) Residential 140,709,430 $422,449
Agricultural 0
Commercial/Industrial 0
Not for Profit 275,800
Total $140,985,230 Source: Johnson County Assessor Office/U.S. Census Bureau
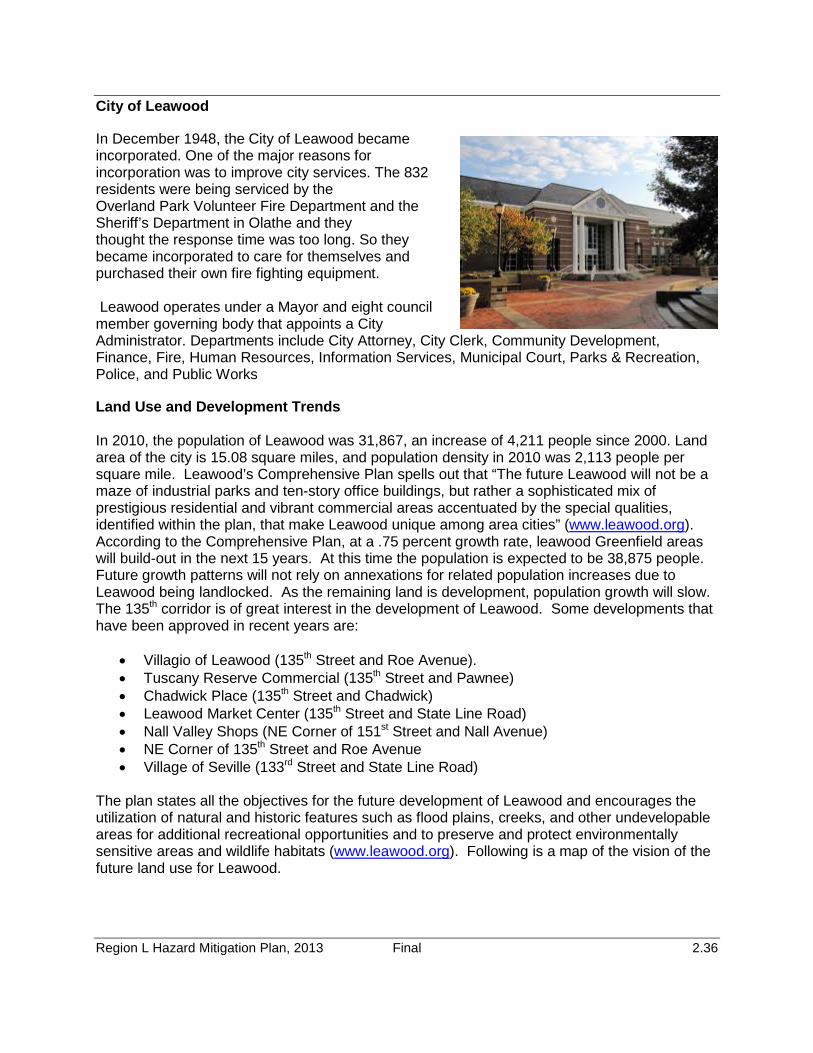
Region L Hazard Mitigation Plan, 2013 Final 2.36
City of Leawood
In December 1948, the City of Leawood became incorporated. One of the major reasons for incorporation was to improve city services. The 832 residents were being serviced by the Overland Park Volunteer Fire Department and the Sheriff’s Department in Olathe and they thought the response time was too long. So they became incorporated to care for themselves and purchased their own fire fighting equipment. Leawood operates under a Mayor and eight council member governing body that appoints a City Administrator. Departments include City Attorney, City Clerk, Community Development, Finance, Fire, Human Resources, Information Services, Municipal Court, Parks & Recreation, Police, and Public Works
Land Use and Development Trends In 2010, the population of Leawood was 31,867, an increase of 4,211 people since 2000. Land area of the city is 15.08 square miles, and population density in 2010 was 2,113 people per square mile. Leawood’s Comprehensive Plan spells out that “The future Leawood will not be a maze of industrial parks and ten-story office buildings, but rather a sophisticated mix of prestigious residential and vibrant commercial areas accentuated by the special qualities, identified within the plan, that make Leawood unique among area cities” (www.leawood.org). According to the Comprehensive Plan, at a .75 percent growth rate, leawood Greenfield areas will build-out in the next 15 years. At this time the population is expected to be 38,875 people. Future growth patterns will not rely on annexations for related population increases due to Leawood being landlocked. As the remaining land is development, population growth will slow. The 135th corridor is of great interest in the development of Leawood. Some developments that have been approved in recent years are:
• Villagio of Leawood (135th Street and Roe Avenue). • Tuscany Reserve Commercial (135th Street and Pawnee) • Chadwick Place (135th Street and Chadwick) • Leawood Market Center (135th Street and State Line Road) • Nall Valley Shops (NE Corner of 151st Street and Nall Avenue) • NE Corner of 135th Street and Roe Avenue • Village of Seville (133rd Street and State Line Road)
The plan states all the objectives for the future development of Leawood and encourages the utilization of natural and historic features such as flood plains, creeks, and other undevelopable areas for additional recreational opportunities and to preserve and protect environmentally sensitive areas and wildlife habitats (www.leawood.org). Following is a map of the vision of the future land use for Leawood.

Region L Hazard Mitigation Plan, 2013 Final 2.37
Figure 2.10. City of Leawood Future Land Use Vision

Region L Hazard Mitigation Plan, 2013 Final 2.38
Technical and Fiscal Resources
Leawood has a staff experienced in land management and engineering infrastructure. Floodplain manager duties are handled by the Public Works Department and the Fire Chief serves as the City’s Emergency Manager. The following table details staff and technical resources for Leawood. Table 2.13. City of Leawood Personnel Resource and Warning Systems
Personnel Resources Yes/No Department/Position Comments Planner/Engineer with knowledge of land development/land management practices
Yes Community Development Director & Public Works Director
Engineer/Professional trained in construction practices related to buildings and/or infrastructure
Yes Community Development Director & Public Works Director
Planner/Engineer/Scientist with an understanding of natural hazards
Yes Public Works Engineering
Personnel skilled in GIS Yes Public Works Engineering and Community Development
Johnson County AIMS
Full Time Building Official Yes Public Works Floodplain Manager Yes Public Works Engineering Emergency Manager Yes Fire Department
Personnel Resources Yes/No Department/Position Comments Grant Writer No Warning System/Services (Reverse 9-11, cable override, outdoor warning signals)
Yes Police Department & Fire Department
Outdoor Warning Sirens, Neighborhood Alert Telephone System, City Website
Reverse 9-11 Yes Police Department This system is provided by the Prairie Village P.D.
Financial tools or resources that the City can use to help fund mitigation initiatives include the following:
• Capital Improvements Project Funding • Johnson County Stormwater Management Program • Taxes for Specific Purposes • Impact Fees for New Development • Debt through General Obligation Bonds
Existing Plans and Policies The City of Leawood joined the NFIP program on 09/30/1977. It also has the following plans and policies in place.
• Master Plan • Zoning Ordinance
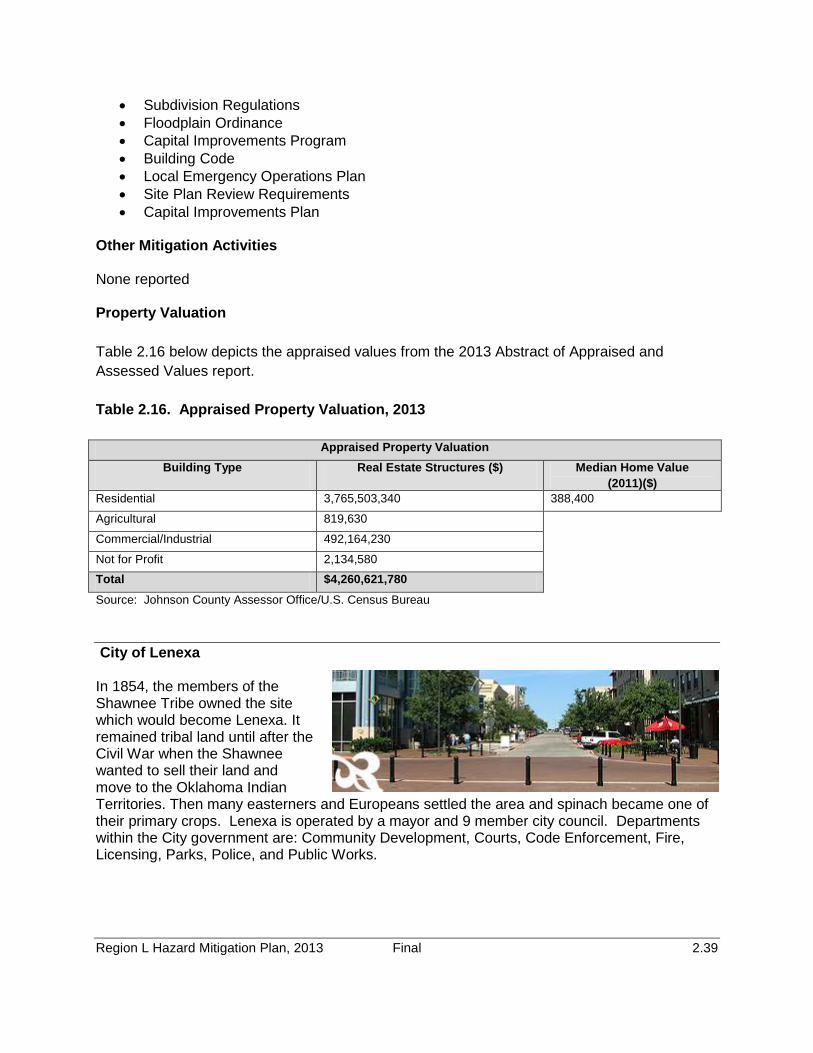
Region L Hazard Mitigation Plan, 2013 Final 2.39
• Subdivision Regulations • Floodplain Ordinance • Capital Improvements Program • Building Code • Local Emergency Operations Plan • Site Plan Review Requirements • Capital Improvements Plan
Other Mitigation Activities None reported Property Valuation Table 2.16 below depicts the appraised values from the 2013 Abstract of Appraised and Assessed Values report. Table 2.16. Appraised Property Valuation, 2013
Appraised Property Valuation Building Type Real Estate Structures ($) Median Home Value
(2011)($) Residential 3,765,503,340 388,400
Agricultural 819,630
Commercial/Industrial 492,164,230
Not for Profit 2,134,580
Total $4,260,621,780 Source: Johnson County Assessor Office/U.S. Census Bureau City of Lenexa In 1854, the members of the Shawnee Tribe owned the site which would become Lenexa. It remained tribal land until after the Civil War when the Shawnee wanted to sell their land and move to the Oklahoma Indian Territories. Then many easterners and Europeans settled the area and spinach became one of their primary crops. Lenexa is operated by a mayor and 9 member city council. Departments within the City government are: Community Development, Courts, Code Enforcement, Fire, Licensing, Parks, Police, and Public Works.

Region L Hazard Mitigation Plan, 2013 Final 2.40
Land Use and Development Trends
According to the U.S. Census Bureau, in 2010 Lenexa’s population was 48,190, an increase of 7,952 people since 2000. Land area is 34.4 square miles giving Lenexa a population density of 1,401 people per square mile. The City of Lenexa is landlocked by other municipalities, yet still has a lot of room to grown. East of I435, much of the land is already developed, so new growth opportunities will come in the form of redevelopment and infill. Development is trending westward, with the property between I435 and K-7 seeing renewed interest. West of K-7 the majority of property is either undeveloped or used agriculturally. www.lenexa.com
Some of the Pending Plans and projects for the City of Lenexa are:
• 95th Street Corridor Study – an area of expected proposed improvements.
• Surface hydrologic conditions within Lenexa that should be considered with respect to land use and planning include perennial streams, intermittent streams, the 100-year flood plain, the 500-year flood plain, and ponds. These hydrologic features are among the most important environmental conditions because most other natural processes are dependent upon the area’s hydrologic cycle. The major hydrologic features in Lenexa are Mill Creek, a perennial stream, and the 100-year floodplain located along Mill Creek. A number of intermittent streams wind through the area west of I-435, including Coon Creek branches. The City of Lenexa is committed to its floodplain management program. Development is restricted in the floodplain through use of their stream setback and floodplain development ordinances. Following is a map of the Future Land Use for the City of Lenexa.

Region L Hazard Mitigation Plan, 2013 Final 2.41
Figure 2.11. City of Lenexa Future Land Use Map

Region L Hazard Mitigation Plan, 2013 Final 2.42
Technical and Fiscal Resources The Emergency Manager for Lenexa is the Fire Chief, and floodplain manager responsibilities belong to the Public Works Department. The City has a grant writer and GIS resource under the Department of Administration. Table 2.14 shows the staff and technical resources in more detail.
Table 2.14. City of Lenexa Personnel Resources and Warning Systems
Personnel Resources Yes/No Department/Position
Planner/Engineer with knowledge of land development/land management practices
Yes Community Development Director
Personnel Resources Yes/No Department/Position
Engineer/Professional trained in construction practices related to buildings and/or infrastructure
Yes Public Works/City Engineer and/or Community Development Engineering Administrator
Planner/Engineer/Scientist with an understanding of natural hazards
Yes Public Works/City Engineer
GIS personnel Yes Administrations/GIS Manager
Building Official, full time Yes Community Development/Building Code Administrator
Floodplain Manager Yes Public Works/Stormwater Engineer
Emergency Manager Yes Fire/Fire Chief
Grant Writer Yes All Departments/Various
Warning Systems/Services (Reverse 9-11, cable override, outdoor warning signals)
Yes Police Department/Communications
Financial tools or resources that the City can use to help fund mitigation initiatives include the following.
• Community Development Block Grants • Capital Improvements project funding • Johnson county Stormwater Management Program • Taxes for Specific Purposes • Impact fees for New Development • Debt through General Obligation Bonds • Debt through Special Tax Bonds • Debt through Private Activities
Existing Plans and Policies Lenexa joined the NFIP on 08/01/1977. The city has the following plans and policies in place.

Region L Hazard Mitigation Plan, 2013 Final 2.43
• Master Plan • Zoning Ordinances • Subdivision Ordinances • Growth Management Ordinance • Floodplain Ordinance • Capital Improvements Plan • Building code • Site Plan Review Requirements • Capital Improvements Plan • Local Emergency Operations Plan • Vision 2030
Other Mitigation Activities The City of Lenexa has continued with their ongoing Public Education and information programs since the last plan. This includes Fire Prevention, Rain-to-Recreation, Storm Water Run Off Education, and Emergency Preparedness Education. They have also completed hazard mitigation flood buyouts as follows: Whispering Hills Buyout 6/12/01, 20706 Mill Road closing; $260,096.12 5/07/01, 20702 Mill Road closing; $238,008.97 4/30/01, 20610 Mill Road closing; $223,176.04 Clare Road Buyout 4/27/01, 8401 Clare Road closing; $128,170.96 Pennycross ( 9/11/01-Overfield Property Closing; $150,341.89 9/24/01-Stultz Property Closing; $142,246.32 10/15/01-Nutt Property Closing; $140,338.30 11/30/01 - Eggerman Property Closing; $139,483.74. Property Valuation Table 2.17 below depicts the appraised values from the 2013 Abstract of Appraised and Assessed Values report. Table 2.17. Appraised Property Valuation, 2013
Appraised Property Valuation Building Type Real Estate Structures ($) Median Home Value
(2011)($) Residential 2,780,219,253 216,900
Agricultural 13,081,140
Commercial/Industrial 1,133,232,251
Not for Profit 270,860

Region L Hazard Mitigation Plan, 2013 Final 2.44
Total $3,926,803,504 Source: Johnson County Assessor Office/U.S. Census Bureau City of Merriam Merriam was incorporated as a city of the third class in October 1950 and established status as a city of the second class in January 1957. The City is located in northeastern Johnson County and the city is bisected by Interstate-35. The city of Merriam has an elected Mayor, a City Administer, as well as eight city council members from the four wards in Merriam. City Departments are Administration/Finance, Community Development, Fire Department, Municipal Court, Parks & Recreation, Police Department, and Public Works Department. As a part of these departments they have filled positions of building code official, building inspector, engineer, development planner, public works official, emergency management coordinator, and an NFIP floodplain administrator. Land Use and Development Trends In 2010, the population of Merriam was 11,003, which reflects a loss of 3 people since the 2000 census. The land area of the city is 4.32 square miles, which makes for a population density of 2,547 people per square mile. The City of Merriam is land-locked which restricts their development trends, however, there is projected development on W 67th Street and Interstate 35 for retail and auto dealerships in Merriam Point, and at Merriam Village at the intersection of Johnson Drive and Interstate 35, there are plans for construction to house IKEA, and other retail and restaurants. www.merriam.org. Technical and Fiscal Resources Funding opportunities for the City of Merriam to fund mitigation activities are as follows.
• Community Development Block Grants • Capital Improvements Funding • Taxes for Specific Purposes • Debt through General Obligation Bonds
Existing Plans and Policies The City of Merriam has been a participant in the NFIP since 05/15/1978. Other plans and policies include the following.
• Comprehensive Plan • Capital Improvement Plan
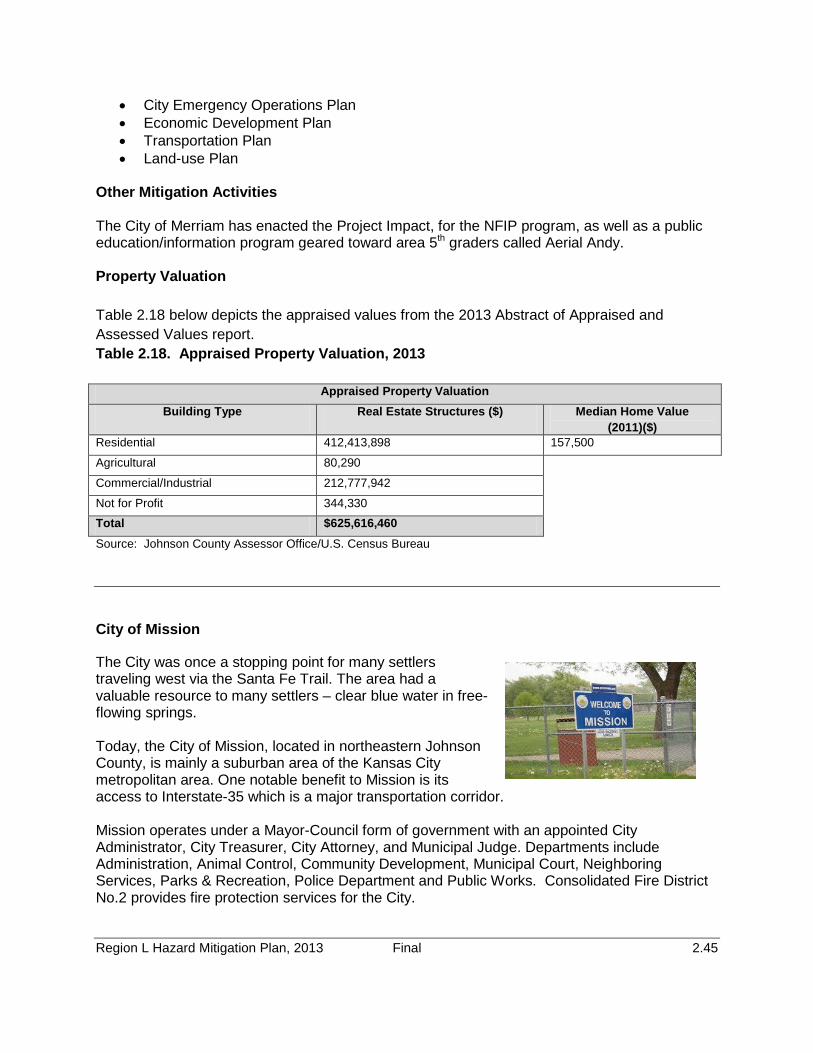
Region L Hazard Mitigation Plan, 2013 Final 2.45
• City Emergency Operations Plan • Economic Development Plan • Transportation Plan • Land-use Plan
Other Mitigation Activities The City of Merriam has enacted the Project Impact, for the NFIP program, as well as a public education/information program geared toward area 5th graders called Aerial Andy. Property Valuation Table 2.18 below depicts the appraised values from the 2013 Abstract of Appraised and Assessed Values report. Table 2.18. Appraised Property Valuation, 2013
Appraised Property Valuation Building Type Real Estate Structures ($) Median Home Value
(2011)($) Residential 412,413,898 157,500
Agricultural 80,290
Commercial/Industrial 212,777,942
Not for Profit 344,330
Total $625,616,460 Source: Johnson County Assessor Office/U.S. Census Bureau
City of Mission
The City was once a stopping point for many settlers traveling west via the Santa Fe Trail. The area had a valuable resource to many settlers – clear blue water in free-flowing springs. Today, the City of Mission, located in northeastern Johnson County, is mainly a suburban area of the Kansas City metropolitan area. One notable benefit to Mission is its access to Interstate-35 which is a major transportation corridor. Mission operates under a Mayor-Council form of government with an appointed City Administrator, City Treasurer, City Attorney, and Municipal Judge. Departments include Administration, Animal Control, Community Development, Municipal Court, Neighboring Services, Parks & Recreation, Police Department and Public Works. Consolidated Fire District No.2 provides fire protection services for the City.

Region L Hazard Mitigation Plan, 2013 Final 2.46
Land Use and Development Trends
In 2010, the Census Bureau put the population in the City of Mission at 9,323 which is a loss of 404 people since the census of 2000. Land area of the city is 2.53 square miles, giving the City a population density of 3,685 people per square mile. The density of the population has led to the multi-model development as key to creating walkable communities, which in turn is key to mixed use development, because these urban forms and modalities require higher-density development – denser than traditional suburban developments. The existing land use in the corporate limits of Mission are shown in the figure below, illustrating the centralized location of commercial uses along the Johnson Drive “spine” of the city; and the largely single-family residential neighborhoods. Higher-density residential land uses are planned in the Gateways and Downtown.
The City of Mission has goals, objectives and an action plan within their Comprehensive Plan which can be seen in its entirety at www.missionks.org. Some of the objectives which cover natural features and the environment, including flooding, are below:
1. Objective: Make flood improvements environmentally responsible, ensuring against increases in peak flow at points downtown.
a. Action: Adopt standards and amend codes to require on-site storm water management methods so that improvement projects will, to the extent possible, include components which improve the storm water runoff quality and reduce the runoff quantity.
b. Action: Prohibit private improvements that cause an increase in peak flow, or other negative impact, to any property downstream and to the downstream reach of Rock Creek in Fairway.
2. Objective: preserve green space to minimize storm water runoff.
a. Action: Update subdivision and zoning regulations to require Low Impact Development standards to be met at the parcel level of development.
3. Objective: Provide redevelopment options for community consideration by adopting a City plan for the flood-affected area.
a. Action: The City Council should continue implementing the engineering and redevelopment concepts that address flooding issues for Rock Creek in the Central Business District according to plans recommended by study Task Forces and adopted by the City Council.
The following figure depicts the current land usage map for the City of Mission.

Region L Hazard Mitigation Plan, 2013 Final 2.47
Figure 2.12. City of Mission Existing Land Use Map

Region L Hazard Mitigation Plan, 2013 Final 2.48
Future land use in the City of Mission is centered around two ideas:
1. The demographics of the City now make it imperative for an older, aged-in-place populace to manage their dependent care housing needs in new ways; and
2. The public and private response to these needs – true mixed use hosing choices – makes it imperative for the City to provide for related needs, such as multimodal transportation.
Following is the map that depicts the future land use for the City of Mission.

Region L Hazard Mitigation Plan, 2013 Final 2.49
Figure 2.13. City of Mission Future Land Use

Region L Hazard Mitigation Plan, 2013 Final 2.50
Technical and Fiscal Resources
The city of Mission has a planner, floodplain manager, and emergency manager. Other technical resources include personnel skilled in a land development, construction practices, GIS, and a grant writer. Mission has an outdoor siren warning system. Financial tools or resources that the City can potentially use to help fund mitigation activities include the following:
• Community Development Block Grants • Capital Improvements Project Funding • Johnson County Stormwater Management Program • Taxes for specific Purposes • Fees for water or sewer • Impact Fees for New Development • Debt through General Obligation Bonds • Debt through Special Tax Bonds • Withholding spending in Hazard Prone Areas
Existing Plans and Policies The City of Mission has participated in the NFIP since 05/15/1978. The following plans and policies are also utilized in Mission:
• Master Plan • Storm water Management Program • Comprehensive Plan • Local Emergency Management Plan • Zoning Regulations • Subdivision Regulations • Floodplain Ordinance • Capital Improvements Program • Building Code • Site Plan Review Requirements • Capital Improvements Plan
Other Mitigation Activities In 2011 a large generator was added to the Sylvester Powell Jr. Community Center, via a DHS Grant through MARC, to incorporate the center as a full service safe room. Property Valuation Table 2.19 below depicts the appraised values from the 2013 Abstract of Appraised and Assessed Values report. Table 2.19. Appraised Property Valuation, 2013
Appraised Property Valuation Building Type Real Estate Structures ($) Median Home Value
(2011)($)

Region L Hazard Mitigation Plan, 2013 Final 2.51
Residential 425,202,880 164,800
Agricultural 0
Commercial/Industrial 122,773,890
Not for Profit 0
Total $547,976,770 Source: Johnson County Assessor Office/U.S. Census Bureau
City of Mission Hills Mission Hills is located in northeastern Johnson County and is known for their many county club golf courses. The City is surrounded by Mission Woods, Fairway, Prairie Village, and Kansas City, Missouri. It has maintained its original plan conceived in the early 1900s of being a garden community. Mission Hills elects a Mayor and five citizens to the City Council. An appointed City Administrator is responsible for the City as the chief administrative officer. Consolidated Fire District No.2 provides fire protection services for the City. Land Use and Development Trends In 2010, the population of Mission Hills was 3,498, a decrease of 95 people since the 2000 census. Land area of the city is 2.02 square miles, and the population density is 1,732 people per square mile. The City of Mission Hills is landlocked and completely built out for future developments of any kind. However, the City does have plans to build a garage and public restroom on City Hall property. While the Comprehensive plan for Mission Hills can be found at www.misionhillsks.gov in its entirety, it is especially important to note in this plan of their environmental concerns. The three objectives for this area are:
• Objective 6- To encourage and promote energy conservation and use of renewable energy sources in the City.
• Objective 7- To improve water quality and recapture the natural environment of the City’s
open channels.
• Objective 8- To preclude the development of land, the result of which will substantially increase surface water run-off leading to further flood control problems.
The City of Mission Hills is committed via planning, mitigation, and actions to maintaining the integrity of the environment and in essence to preclude the act of flooding through man made development.

Region L Hazard Mitigation Plan, 2013 Final 2.52
Figure 2.14. City of Mission Hills Zoning Map
Technical and Fiscal Resources Police protection is offered by the City of Prairie Village Police Department and fire protection is provided by Johnson County Consolidated Fire District No. 2. Mission Hills, in conjunction with

Region L Hazard Mitigation Plan, 2013 Final 2.53
Prairie Village, has an ultra high speed telephone communications service for emergency notifications called Code RED. This is used to alert residents of emergency or life-threatening situations and public safety issues. Financial tools and resources that could potentially help Mission Hills fund mitigation initiatives is as follows.
• Capital Improvements Funding • Taxes for Specific Purposes • Fees for water, sewer, gas, or electric services • Impact fees for new development • Debt through General Obligation Bonds • Debt through Special Tax Bonds • Debt through Private Activities • Withhold spending in hazard prone areas
Existing Plans and Policies The City of Mission Hills joined the NFIP in 9/29/1979. It also has the following plans and policies in place.
• Comprehensive Plan • Capital Improvement Plan • City Emergency Operations Plan • County Emergency Operations plan • Local Recovery Plan (in EOP) • Zoning Ordinance • Building Code • Floodplain Ordinance • Site Plan Review Requirements • Tree Trimming Ordinance • Storm Water Ordinance • Drainage Ordinance • Wetlands/Riparian Areas Conservation Plan
Other Mitigation Activities Since the last plan, the identified project to reduce flooding on the roadway in Peetwood Park has been completed. The City also removed City Hall and a church from a flooding area through the Mission Drive Channel Project (2012). The City also has a public education program in place to educate the public on hazards. On their Capital Improvement Plan for 2013, they have identified various projects to fix catchbasins, pipes, etc., in order to facilitate the mitigation of flooding. Property Valuation Table 2.20 below depicts the appraised values from the 2013 Abstract of Appraised and Assessed Values report.
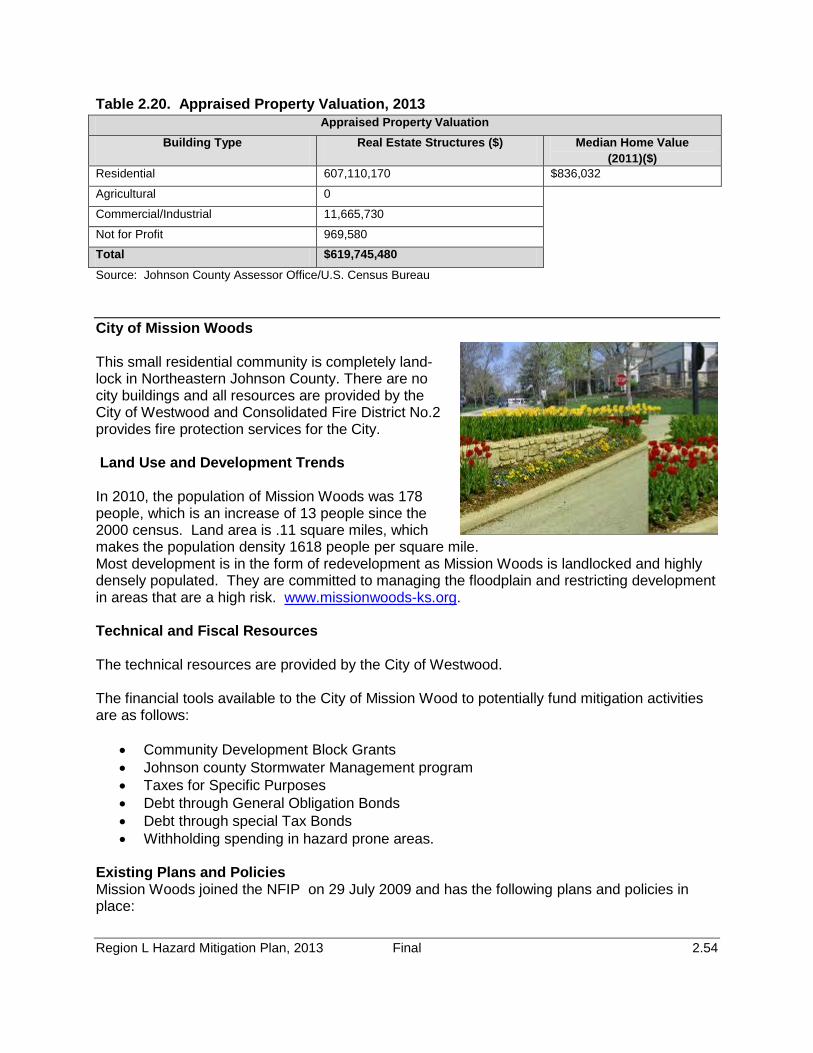
Region L Hazard Mitigation Plan, 2013 Final 2.54
Table 2.20. Appraised Property Valuation, 2013 Appraised Property Valuation
Building Type Real Estate Structures ($) Median Home Value (2011)($)
Residential 607,110,170 $836,032
Agricultural 0
Commercial/Industrial 11,665,730
Not for Profit 969,580
Total $619,745,480 Source: Johnson County Assessor Office/U.S. Census Bureau City of Mission Woods This small residential community is completely land-lock in Northeastern Johnson County. There are no city buildings and all resources are provided by the City of Westwood and Consolidated Fire District No.2 provides fire protection services for the City. Land Use and Development Trends In 2010, the population of Mission Woods was 178 people, which is an increase of 13 people since the 2000 census. Land area is .11 square miles, which makes the population density 1618 people per square mile. Most development is in the form of redevelopment as Mission Woods is landlocked and highly densely populated. They are committed to managing the floodplain and restricting development in areas that are a high risk. www.missionwoods-ks.org. Technical and Fiscal Resources The technical resources are provided by the City of Westwood. The financial tools available to the City of Mission Wood to potentially fund mitigation activities are as follows:
• Community Development Block Grants • Johnson county Stormwater Management program • Taxes for Specific Purposes • Debt through General Obligation Bonds • Debt through special Tax Bonds • Withholding spending in hazard prone areas.
Existing Plans and Policies Mission Woods joined the NFIP on 29 July 2009 and has the following plans and policies in place:
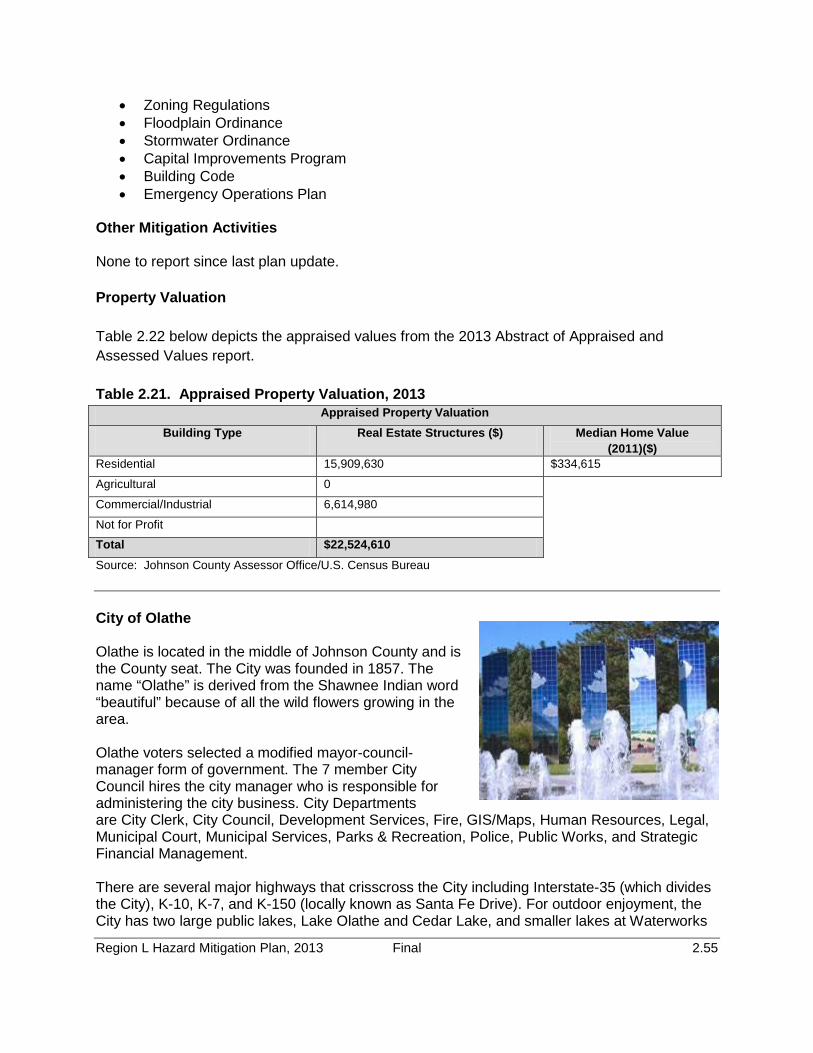
Region L Hazard Mitigation Plan, 2013 Final 2.55
• Zoning Regulations • Floodplain Ordinance • Stormwater Ordinance • Capital Improvements Program • Building Code • Emergency Operations Plan
Other Mitigation Activities None to report since last plan update. Property Valuation Table 2.22 below depicts the appraised values from the 2013 Abstract of Appraised and Assessed Values report. Table 2.21. Appraised Property Valuation, 2013
Appraised Property Valuation Building Type Real Estate Structures ($) Median Home Value
(2011)($) Residential 15,909,630 $334,615
Agricultural 0
Commercial/Industrial 6,614,980
Not for Profit
Total $22,524,610 Source: Johnson County Assessor Office/U.S. Census Bureau City of Olathe Olathe is located in the middle of Johnson County and is the County seat. The City was founded in 1857. The name “Olathe” is derived from the Shawnee Indian word “beautiful” because of all the wild flowers growing in the area. Olathe voters selected a modified mayor-council-manager form of government. The 7 member City Council hires the city manager who is responsible for administering the city business. City Departments are City Clerk, City Council, Development Services, Fire, GIS/Maps, Human Resources, Legal, Municipal Court, Municipal Services, Parks & Recreation, Police, Public Works, and Strategic Financial Management. There are several major highways that crisscross the City including Interstate-35 (which divides the City), K-10, K-7, and K-150 (locally known as Santa Fe Drive). For outdoor enjoyment, the City has two large public lakes, Lake Olathe and Cedar Lake, and smaller lakes at Waterworks

Region L Hazard Mitigation Plan, 2013 Final 2.56
Park and Southlake Park. Land Use and Development Trends In 2010, the population of Olathe was 125,872, and increase of 24,292 people since the census of 2000. The land area of Olathe is 54.16 square miles, and the population density is 2,324 people per square mile. Olathe is a quickly growing city and housing developments, building and shopping developments are on the rise. Johnson County has an intense screening program before any new development can be done, to include ensuring the floodplain is protected. The guidelines for the City of Olathe’s land use and development can be found in its entirety in their Comprehensive Plan at www.olathe.org. Following are a few of the guidelines as they relate to open storm drainage and detention:
1. Natural drainage areas should be preserved with adequate green space to protect existing riparian systems and to allow maintenance access. When natural areas are altered, landscaping should be planted to reestablish the previous riparian habitat. Walks are encouraged to facilitate pedestrian circulation throughout the site, to adjacent streets and properties, and to the city’s trail system.
2. Detention basins serving multiple owners and/or development sites within a single large
development are recommended in order to reduce the number of basins, to create watersheds of adequate size to support wet-bottom basins or wetlands, and to distribute the cost and maintenance of the basins.
3. All detention basins and open drainage areas shall be readily accessible for inspection,
and to maintenance equipment. All detention basins shall be mowed routinely, unless designed as wetlands. Wetlands shall be defined as areas which are predominantly covered with shallow water or wet soils for the majority of the growing season for most years and be capable of supporting water tolerant plants.
The City of Olathe has adopted and integrated area and corridor plans to their Comprehensive Plan. As follows: Coffee Creek Master Plan: The Coffee Creek Master Plan is the City’s newest area plan and provides guidance for the development of an area south of the City. The area is generally bounded by existing development to the north, Black Bob Road, the half-section line south of 175th Street, and the half-section line west of Ridgeview Road. The Coffee Creek Master plan details the future road and greenway network that will serve this area in addition to the recommending future land uses. K-150 Corridor Study. The K-150 (Santa Fe) Corridor Study was a joint study done by Leawood, Olathe, Overland Park, and Johnson County. The study corridor includes an area that is within one (1) mile of Santa Fe from Mur-Len Road to State Line Road. The majority of the corridor is fully built out, but there are a few remaining pockets of undeveloped property within the study area. One of the largest undeveloped areas is in Olathe from Black Bob Road to Pflumm Road.

Region L Hazard Mitigation Plan, 2013 Final 2.57
Lone Elm Vicinity Plan. The Lone Elm Vicinity Plan examines an area south of the Olathe. The area can generally described as being bounded by 159th Street, the half-section line east of US 169 Hwy, the half-section line south of 175th Street, Clare Road, and I-35. The Lone Elm Vicinity Plan discusses the infrastructure needs for the area and provides recommended land uses. The Plan was recently updated and adopted on August 21, 2007.
Woodland Road Corridor Plan. The Woodland Road Corridor Plan was implemented to guide new and in-fill development occurring in the Woodland Road Corridor. The Corridor is generally bounded by K-10, the BNSF railroad tracks, Harold Street, and Lone Elm Road.
The following map shows the current land use for the City of Olathe.
Technical and Fiscal Resources The Fire Chief serves as Olathe’s Emergency Manager and floodplain manager duties are handled by the Public Works Department. The City does have a GIS manager that maintains their GIS data. Table 2.16. City of Olathe Personnel Resources and Warning Systems
Personnel Resources Yes/No Department/Position Comments Building Code Official and Inspector
Yes Chief building Official Development Srv-Coces
GIS Yes GIS Manager ITS Engineers Yes Asst Director Development
Srv-Planning; Engineer Development coord. Public Works
Development Planner Yes Engineer Development Coord. Public Works
Public Works Official Public Works Emergency Mgmt Coord Yes Fire Administration NFIP Floodplain Mgr Yes Design Engineer Public
Works
Hazardous Material Experts
Yes
Warning Systems/Services (Reverse 9-11, cable override, outdoor warning signals)
Yes CityWatch Notification System, called OCEANS. 34 outdoor warning signals.
Financial tools or resources that the City can potentially use to help fund mitigation activities include the following:
• Community Development Block Grants • Capital Improvements Funding • Taxes for Specific Purposes • Fees for water, sewer, gas, or electric services • Impact Fees for New Development • Debt through General Obligation Bonds • Debt through special Tax Bonds

Region L Hazard Mitigation Plan, 2013 Final 2.58
• Withhold spending in hazard prone areas Existing Plans and Policies Olathe became a member in good standing of the NFIP on 11/15/1978 and is also a participant of the Community Rating System (CRS). Olathe has the following plans and policies in place.
• Comprehensive Plan • Capital Improvement Plan • City Emergency Operations Plan • County Emergency Operations Plan • Local Recovery Plan • County Recovery Plan • Debris Management Plan • Economic Development Plan • Transportation Plan • Land-use Plan • Flood Mitigation Assistance Plan • Watershed Plan • Critical Facilities Plan
Other Mitigation Activities The City of Olathe has an extensive history of mitigation activities that are completed and on-going. The following includes:
• A plant berm was elevated and extended as part of the Cedar Creek WWTP Expansion. This mitigated flooding of wastewater treatment plant which is now protected above the 100 year flood.
• A current project that is on-going is alongthe creek at 147th & Brougham to reduce road
overtopping for safe vehicle access, and to reduce the risk of flooding for multiple homes.
• A projected project is the E. Mulberry Street and N. Cherry Street Storm Drainage
Improvements, which is designed to reduce the risk of home and street flooding in the vicinity of E. Mulberry Street and N. Cherry Street. This project will include road culvert improvements, two home buy outs, and channel stabilization.
• The City of Olathe is pro-active when it comes to flood control issues, and has numerous
projects on their Capital Improvement Plan. Property Valuation Table 2.23 below depicts the appraised values from the 2013 Abstract of Appraised and Assessed Values report. Table 2.23. Appraised Property Valuation, 2013

Region L Hazard Mitigation Plan, 2013 Final 2.59
Appraised Property Valuation Building Type Real Estate Structures ($) Median Home Value
(2011)($) Residential 5,949,677,230 194,600
Agricultural 5,251,460
Commercial/Industrial 858,348,620
Not for Profit 1,547,040
Total $6,814,824,350 Source: Johnson County Assessor Office/U.S. Census Bureau
City of Overland Park Overland Park was incorporated as a city of the first-class in 1960. It is located in the southwest quadrant of the Kansas City Metropolitan area. Overland Park operates under a Mayor, City Manager, and 12 elected council representatives. Land Use and Development Trends Overland Park had a population of 173,372 people as of the 2010 census. This is an increase of 24,292 people since the 2000 census was taken. The land area of the city is 56.75 square miles, with a population density of 3,055 people per square mile. Construction and development are ongoing for Overland Park, in order to provide housing, business, and facilities for its growing population. The major areas for future growth and development in Overland Park are in the southern portions of the city, especially south of 151st Street. Redevelopment is also anticipated, especially along the Metcalf corridor north of 123rd Street. The Overland Park Fire Station 45 is planned for demolition and reconstruction at a new location which is to be determined. The City of Overland Park is committed to a balance between natural and man-made environments to preserve and protect natural features while allowing for new development. Within their Comprehensive Plan they have stated goals and policies which address their open space land use, floodplain, and floodway. The goals of the Comprehensive Plan can be found in its entirety at www.opkansas.org, however, a few are listed below.
1. Preserve the Floodplain and Floodway. Preserve as much as possible the natural attributes of both the floodplain and floodway to avoid loss of life and property while providing open space.
2. Provide Nonrecreational Open Space Areas - Encourage the preservation of significant
stands of trees, natural vegetation, wetlands, stream corridors, and environmentally sensitive areas as part of a passive use open space system and permit
Region L Hazard Mitigation Plan, 2013 Final 2.60
other uses as allowed by the stream corridor and floodplain ordinances.
3. Maintain Close Relationship between Open Space and Development - Maintain a close relationship between the natural environment and developed areas through an extensive parks, recreation, and open space system connecting developed areas.
4. Preserve Natural Areas - Preserve stream corridors and other riparian areas to ensure
habitat preservation, protection of water quality, stream bank stability and open space opportunities.
5. Preserve Park, Recreation, and Open Space Sites - Acquire or otherwise preserve
future park, recreation, and open space sites within growth areas prior to extensive new development in order to ensure adequate land is available and to avoid prohibitive acquisition costs.
6. Preserve Special Landscapes - Preserve and protect special landscapes such as areas
with sensitive slopes or dramatic topographic changes, waterways, floodplains, stream corridors, areas of dense natural vegetation, and sites of particular aesthetic or historic value.
7. Use Appropriate Transitional Methods - Appropriate transitional methods should be
considered at all locations where the development or expansion of parks, recreation, and open space land uses abut residential property (either built or zoned). In general, transitions between different types of intensities of land use should be made gradually, particularly where natural or man-made buffers are not available. The City strives to meet the following additional objectives when compatible transition is necessary:
a. a. Land Features: i. (1) Promote the retention of stands of trees, natural vegetation, wetlands,
stream corridors, and environmentally sensitive areas whenever possible to separate residential developments from recreational facilities such as ball fields, golf driving ranges, swimming pools, tennis courts, and associated parking lots.
b. (2) Where possible, use existing differences in topography to naturally separate residential developments from active recreation areas.
The City of Overland park has undertaken various studies to address special issues or needs such as neighborhood or corridor studies, design concept plans, and studies resulting in future land use plans and goals for newly annexed areas. These can be found at www.opkansas.org, however, a few are annotated below:
• Vision Metcalf Form-Based Code - Long term study of Metcalf Avenue, from Interstate 35 to 123rd Street, including some neighborhoods east and west of Metcalf, such as the downtown area, 95th and 103rd streets.
• West Aubry Study Area - Future land use plan and goals were developed by a task force
as a commitment to residents and landowners in a 8.35 square-mile area south of the city annexed in 2008. Adopted as part of the city's Comprehensive Plan in 2009.

Region L Hazard Mitigation Plan, 2013 Final 2.61
• The Blue Valley Plan / Urban Fringe Area - Joint study between Johnson County and Overland Park for a 21-square mile area south of the city; adopted as part of the county's Rural Comprehensive Plan.
• Blue Valley Study Area Future Land Use Plan and Goals - Developed by a task force as
a commitment to areas residents and landowners in a 4.7 square-mile area south of the city annexed in 2002.
• 151st Street Corridor Design Concept Plan - Plan showing acceptable land uses and
architectural and site plan design features for 151st Street as it runs through neighborhoods in the south part of the city.
• Morse Study Area - The Morse Neighborhood, along with the Stanley Neighborhood to
the east, was annexed into the City of Overland Park in August 1985. A new study of the Morse Neighborhood is needed to determine if the existing future land use plan for the neighborhood is still appropriate.
The following is a map depicting the future development plan for the City of Overland Park.

Region L Hazard Mitigation Plan, 2013 Final 2.62
Figure 2.16. City of Overland Park Future Development Plan
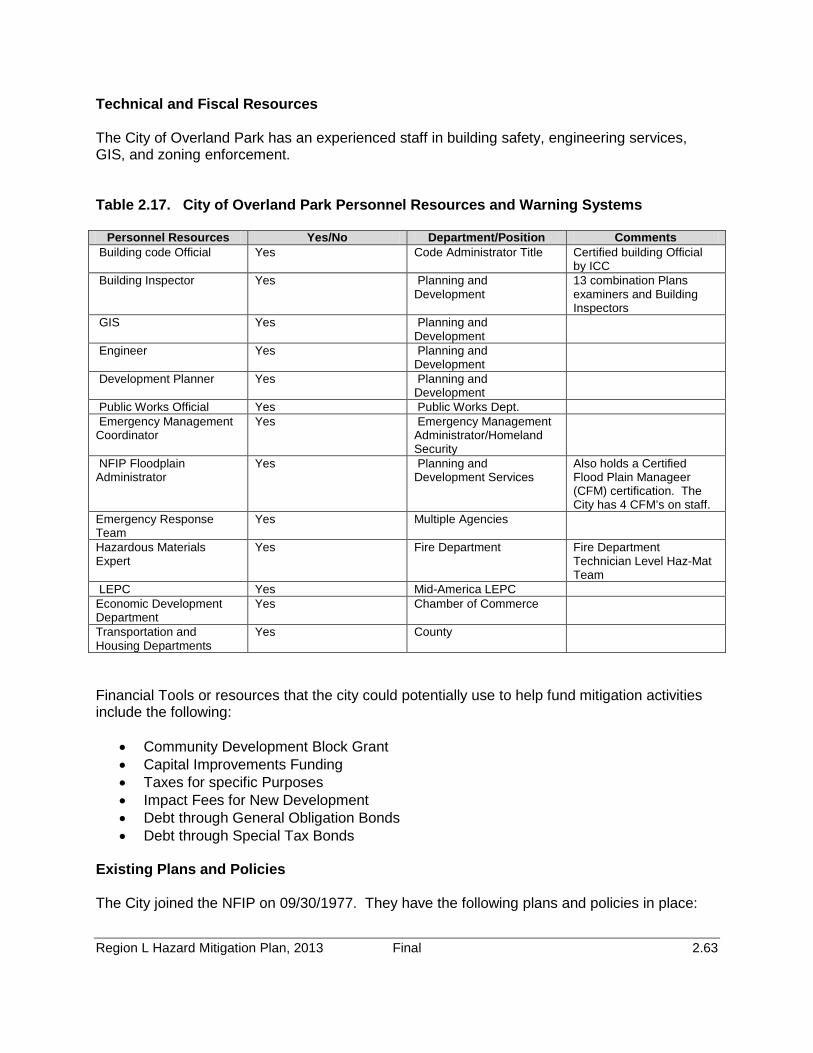
Region L Hazard Mitigation Plan, 2013 Final 2.63
Technical and Fiscal Resources The City of Overland Park has an experienced staff in building safety, engineering services, GIS, and zoning enforcement. Table 2.17. City of Overland Park Personnel Resources and Warning Systems
Personnel Resources Yes/No Department/Position Comments Building code Official Yes Code Administrator Title Certified building Official
by ICC Building Inspector Yes Planning and
Development 13 combination Plans examiners and Building Inspectors
GIS Yes Planning and Development
Engineer Yes Planning and Development
Development Planner Yes Planning and Development
Public Works Official Yes Public Works Dept. Emergency Management Coordinator
Yes Emergency Management Administrator/Homeland Security
NFIP Floodplain Administrator
Yes Planning and Development Services
Also holds a Certified Flood Plain Manageer (CFM) certification. The City has 4 CFM’s on staff.
Emergency Response Team
Yes Multiple Agencies
Hazardous Materials Expert
Yes Fire Department Fire Department Technician Level Haz-Mat Team
LEPC Yes Mid-America LEPC Economic Development Department
Yes Chamber of Commerce
Transportation and Housing Departments
Yes County
Financial Tools or resources that the city could potentially use to help fund mitigation activities include the following:
• Community Development Block Grant • Capital Improvements Funding • Taxes for specific Purposes • Impact Fees for New Development • Debt through General Obligation Bonds • Debt through Special Tax Bonds
Existing Plans and Policies The City joined the NFIP on 09/30/1977. They have the following plans and policies in place:

Region L Hazard Mitigation Plan, 2013 Final 2.64
• Comprehensive Plan • Capital Improvement Plan • City Emergency Operations Plan • County Emergency Operations Plan • Local Recovery Plan • County Recovery Plan • Debris Management Plan • Economic Development Plan • Transportation Plan • Land-use Plan • Firewise or other Fire Mitigation Plan • Critical Facilities Plan
Other Mitigation Activities The City of Overland Park has a plethora of public education and information programs that are ongoing. These include: Juvenile Fire-Setters Program School Career Day Presentations, Fire Safety for Special Needs Community Program, FD Fund Day for special Needs Children, Explorer Program, Capt Inferno Program, Water quality and environmental education programs. The City also has provisions in the Floodplain Ordinance requiring 500 year flood protection for any new critical facilities including access routes to such facilities. As part of their participation in the CRS program they have completed and perform annual reviews to a Repetitive Flood Loss Area Analysis (RLLA) which reviews progress towards reducing or eliminating risks to properties with repetitive losses. The City is in the process of purchasing one of the repetitive loss properties in their jurisdiction to construct a flood control project in the vicinity of 103rd and Rosewood. This acquisition should be completed by the middle of 2013. Property Valuation Table 2.24 below depicts the appraised values from the 2013 Abstract of Appraised and Assessed Values report. Table 2.24. Appraised Property Valuation, 2013
Appraised Property Valuation Building Type Real Estate Structures ($) Median Home Value
(2011)($) Residential 11,177,465,740 224,200
Agricultural 33,345,640
Commercial/Industrial 2,643,031,072
Not for Profit 12,018,950
Total $13,865,861,402 Source: Johnson County Assessor Office/U.S. Census Bureau

Region L Hazard Mitigation Plan, 2013 Final 2.65
City of Prairie Village Prairie Village became a city of the first class in 1957. It was the vision of the late J.C. Nichols to create a planned community of beautiful homes and shopping centers. Prairie Village is a land-locked, fully developed suburban city in northeastern Johnson County. Prairie Village operates under the Mayor and 12 city council members form of government. The City Departments provide services in Management, Planning and Administrative Services, Public Works, Public Safety, Municipal Justice, Parks and Recreation, and Community Programs. The Prairie Village Police Department provides police protection services for Prairie Village and Mission Hills. Fire protection is provided by Consolidated Fire District No. 2 Land Use and Development Trends According the 2010 census, the City of Prairie Village has a population of 21,447 people, a loss of 625 people since the 2000 census. The land area is 6.7 square miles, and the population density is 3,201 people per square mile. During the planning process for their Master Plan, the City of Prairie Village encountered some key findings:
1. Maintaining a high quality of life for Prairie Village residents is a high priority. 2. As a landlocked community, Prairie Village has limited growth opportunities. 3. Prairie Village’s population is declining. 4. Prairie Village’s housing stock is aging. 5. Prairie Village’s retail destinations are strong anchors in the community, but they are
aging. 6. Prairie village should consider developing a citywide approach to redevelopment through
neighborhood and site based planning, and should consider providing financial incentives to encourage redevelopment where appropriate.
7. Redevelopment and reinvestment can help stabilize the City’s sales and property tax base.
Some of the proposed developments for the city include:
1. Make the 75th Street more attrac6tive to motorists and pedestrians. Perhaps create a boulevard along the 75th Street corridor through elements such as narrowing traffic lanes and strategically locating landscaped medians within the roadway.
2. Exploring the redevelopment potential of the Corinth Square Shopping Center as a
mixed-use center. Within the plan, the City of Prairie Village stated some development principles to be adhered to:

Region L Hazard Mitigation Plan, 2013 Final 2.66
1. Development should help “repair” or enhance existing neighborhoods or create new ones and should not take the form of an isolated project.
2. Areas within existing neighborhoods or along corridors should be reclaimed by using redevelopment strategically to leverage current investment and strengthen social fabric.
3. The creation of mixed-use developments should be promoted that support the functions of daily life: employment, recreation, retail and civic and cultural institutions.
The principles can be found in their entirety at www.pvkansas.com. The following figure shows the City of Prairie Village composite land use. Figure 2.17. City of Prairie Village current Composite Land Use Map

Region L Hazard Mitigation Plan, 2013 Final 2.67
The City of Prairie Village is unique in that it has no downtown core. Instead there are several centrally located shopping centers that serve as the center hub of the city. Creating future development opportunities in a stable community where less than one percent of the total land is vacant points to making better use of land resources, i.e., locating neighborhood retail, office, and higher density housing at the edge of the neighborhoods on underutilized sites along corridors and at major intersections, subdivisions vs. neighborhoods, mobility vs. accessibility, etc. The list of ideas can be found at www.pvkansas.com in its entirety. The City of Prairie Village has extensive zoning and building codes that define how and where development can be performed. The floodway and floodplain are no exceptions. Chapter 19.26 of the Zoning Regulations for the city goes into explicit detail about the floodway overlay and the floodway fringe overlay districts. This can be found at http://pvkansas.com/Modules/ShowDocument.aspx?documentid=53 . Technical and Fiscal Resources Tools and resources that the City can use to help fund mitigation activities include the following:
• Community Development Block Grants • Capital Improvements Funding • Taxes for Specific Purposes
Existing Plans and Policies Praire Village has participated in the NFIP since September 29, 1978 and has the following plans and policies in place:
• Capital Improvement Plan • City Emergency Operations Plan • Debris Management Plan • Zoning Ordinance • Building Code • Storm Water Ordinance • Site Plan Review Requirements
Other Mitigation Activities In 2011, the City of Prairie Village submitted an application, and was approved for two warning sirens. The funding was from the HMGP through FEMA. Property Valuation Table 2.25 below depicts the appraised values from the 2013 Abstract of Appraised and Assessed Values report.

Region L Hazard Mitigation Plan, 2013 Final 2.68
Table 2.25. Appraised Property Valuation, 2013 Appraised Property Valuation
Building Type Real Estate Structures ($) Median Home Value (2011)($)
Residential 1,518,001,790 207,600
Agricultural 2,613,500
Commercial/Industrial 89,546,850
Not for Profit 118,280
Total $1,610,280,420 Source: Johnson County Assessor Office/U.S. Census Bureau City of Roeland Park The City of Roeland Park was originally named after John Roe, an immigrant that settled in the area. Roeland Park is in the northeastern part of the County. The boundaries are 47th Street or County Line Road on the north, 53rd Street or Johnson Drive on the south, Mission Road on the east and Nall Avenue on the west. Roeland Park has a mayor/city council form of government. The City Administrator is responsible for the daily operations of the City. Departments include: Administration, Building/Codes, Forestry, Municipal Court, Police Department, and Public Works. Consolidated Fire District No.2 provides fire protection services for the City. Land Use and Development Trends In 2010, the population of Roeland Park was 6,731, a decrease of 86 people from the census of 2000. The land area is 1.62 square miles, and the population density is 4,154 people per square mile. The City is landlocked by the surrounding jurisdictions of Kansas City, KS, Westwood, Fairway, and Mission. In the city’s Comprehensive Plan they identified key issues as the focus of the plan: (www.roelandpark.net)
• Support the redevelopment plans currently underway for the 47th and Mission Road Neighborhood Center. Refer to Section 3 (New & Neighboring Developments).
• Amend as necessary and adopt the recommendation of the East Gateway
Redevelopment Plan. Refer to Section 3 (New & Neighboring Developments), for the description of this joint planning effort.
• Promote quality development at the two cloverleaf sites at Roe Boulevard and Johnson
Drive.

Region L Hazard Mitigation Plan, 2013 Final 2.69
• Utilize the development opportunity at Roe Boulevard and Johnson Drive as a formal southern gateway to the City and create a northern gateway to the City.
• Minimize the physical barriers for vehicles and pedestrians crossing Roe Boulevard. • Promote somewhat higher densities of owner occupied residential redevelopment that
adhere to the plan and direction set forth in this Comprehensive Plan. Examples of higher densities include townhouses and senior citizen facilitie
• Redevelop the old City Pool site and Roe Lane corridor to be a more viable establishment within the Town Village Center.
• Implement the recommendations of the Park Master Plan on City park properties.
• Encourage upkeep and worth of the Bella Roe Plaza development at Town Center
• Support quality development in the City
• Encourage development that maximizes revenue for the City.
• Create and preserve revenue for the City in all development.
The City of Roeland Park is a community made up of neighborhoods. Town Center is its only commercial area, with the heart of the center at the 51st Street intersection. Other small businesses do exist in the city, but Town Center is the hub. The following figure shows the current land usage for the City of Roeland Park.

Region L Hazard Mitigation Plan, 2013 Final 2.70
Figure 2.18. City of Roeland Park Current Land Use Map
Future development and land use for Roeland park is guided by the ideas below:
• Preserve and enhance the existing single family residential neighborhoods
• Create a quality retail destination by transforming existing commercial from auto-oriented to pedestrian friendly development
• Promote owner occupied higher density uses, such as townhouses and senior citizen
facilities, within and adjacent to the village centers
• Use existing churches, government institutions and other semi-public uses as anchors for the centers

Region L Hazard Mitigation Plan, 2013 Final 2.71
• Connect neighborhoods to other neighborhoods and to commercial activities through a pedestrian/bicycle trail system
• Minimize the physical and perceived divide that Roe Blvd creates through such means as pedestrian crosswalks, landscaping and other traffic calming methods stated in this plan
The following figure depicts the future land use for the City of Roeland Park. Figure 2.19. City of Roeland Park Future Land Use
The City of Roeland Park maintains its commitment to the NFIP. In addition, in the early 1990’s the City created one of its first benefit districts to construct storm water improvements in the Elledge Drive / Fontana Drive (Turkey Creek Drainage areas). To date nine benefit districts have been created encompassing approximately 2260 properties or 80% of the City. The

Region L Hazard Mitigation Plan, 2013 Final 2.72
purpose of any storm water improvement project is to reduce flooding and potentially redefine certain properties that are no longer in designated flood zones. Technical and Fiscal Resources The city of Roeland Park is a combination of local staff and contracted out staff. Following is a Table of the details for the staff and resources for the city: Table 2.18. City of Roeland Park Personnel Resources and Warning Systems
Personnel Resources Yes/No Department/Position Comments Planner/Engineer with knowledge of land development/land management practices
Yes Administration/City Administrator
NA
Engineer/Professional trained in construction practices related to buildings and/or infrastructure
Yes Contract Engineer NA
Planner/Engineer/Scientist with an understanding of natural hazards
No NA
GIS No NA Full Time Building Official Yes Administration/Building
Inspector NA
Floodplain Manager No NA Emergency Manager Yes Police/Chief of Police NA
Personnel Resources Yes/No Department/Position Comments Grant Writer No NA Warning Systems (Reverse 9-11, cable override, outdoor warning signals)
Yes Outdoor Warning (911 with Johnson County)
NA
Financial tools or resources that the city could potentially use to help fund mitigation activities include the following:
• Community Development Block Grants • Capital Improvements Project Funding • Johnson County Stormwater Management Program • Taxes for specific Purposes • Debt through General Obligation Bonds • Debt through Special Tax Bonds • Withholding spending in hazard prone areas
Existing Plans and Policies

Region L Hazard Mitigation Plan, 2013 Final 2.73
Roeland Park participates in the NFIP since 06/30/1976. Roeland Park has the following plans and policies in place.
• Comprehensive Plan • Zoning Regulations • Subdivision Regulations • Floodplain Ordinance • Capital Improvements program • Building Code • Site Plan Review Requirements • Capital Improvements Plan
Other Mitigation Activities No information available Property Valuation Table 2.26 below depicts the appraised values from the 2013 Abstract of Appraised and Assessed Values report Table 2.26. Appraised Property Valuation, 2013
Appraised Property Valuation Building Type Real Estate Structures ($) Median Home Value
(2011)($) Residential 310,135,520 158,200
Agricultural 0
Commercial/Industrial 19,900,220
Not for Profit 74,480
Total $330,110,220 Source: Johnson County Assessor Office/U.S. Census Bureau City of Shawnee Shawnee is located in northern Johnson County surrounded by Kansas City, Kansas, Merriam, Lenexa, and De Soto. Shawnee has a part time mayor/City Manager, and a city council form of government. The City Administrator is responsible for the daily operations of the City. City departments are City Clerk, Codes, Development Services/Engineering, Finance, Fire, Government/City Manager, Human Resources, Municipal Court, Parks & Recreation, Planning, Police, Public Works, and Shawnee Town.

Region L Hazard Mitigation Plan, 2013 Final 2.74
Land Use and Development Trends According to the 2010 Census, the City of Shawnee’s population was 62,209, an increase of 14,213 people since the 2000 census. Land area is 41.74 square miles, with a population density of 1,490 people per square mile. Growth over the past few years since the last plan update has been fairly stagnant due to the downturn in the economy; however development has slowly picked up. The City is expected to develop in a westerly direction as far as new housing is concerned. In their Comprehensive Plan, the City of Shawnee outlined their general land use policies:
1. Apparent or actual changes in any plan concept, whether on narrative or graphics, will be formally incorporated into the plan. Such formal changes shall be incorporated on at least an annual basis.
2. All areas designated as subject to flooding in or a drainage course, shall generally be
promoted for use as agricultural, open space, recreations or similar use which will be most compatible to intermittent flooding. Fill in the floodway fringe will be discouraged, especially in areas which has witnessed rises in the floodplain elevation in the past.
3. Steep slopes (topography having an incline in excess of 15%) generally will not be
permitted to be used for urban or suburban development. However, on review, the Planning Commission may permit limited development where due to the unique character of the site or the development itself the environmental, ecological and open space concerns of this plan will not be jeopardized. This does not mean that steep slopes cannot be integrated into a development proposal. In can be expected that such proposals will provide environmental easements to protect the slopes and natural vegetation.
4. The approval process of site development proposals for uses other than single family
dwellings shall emphasize the need for buffering of adjacent uses from: dust, litter, light glare, noise, water runoff, undue traffic problems, and safety or health hazards. In addition, the visual character shall receive critical review with emphasis on screening and landscaping.
5. Forested areas and windbreaks should be preserved wherever possible.
6. Ponds and natural drainage ways should be preserved in natural condition and dedicated as open space wherever feasible.
7. Where intensive development forms are designated in an area adjacent to low density residential, site planning shall provide for a lessening of activity along these areas relative to other portions of the site, and be complimented by large setbacks and extensive screening and buffering features.
The corridor plans for the City of Shawnee were originally adopted as addenda to the comprehensive Plan. They establish a rationale for anticipated land use patterns, and establish

Region L Hazard Mitigation Plan, 2013 Final 2.75
a design criteria for development along the corridor acting as a means to achieve the desires land use results.
• Johnson Drive Corridor - Improvements to Johnson Drive provide the City of Shawnee with a northern arterial route from the eastern City limits to Clare Road. In addition to providing residents of northwestern Shawnee ready access to the eastern portion of the City and its services, Johnson Drive provides the opportunity for growth in a variety of land use sectors. This section provides a rationale for land use decisions along this corridor. The goal is to provide orderly and sequential growth. Other factors such as the provision of adequate water and sewer facilities will have an affect on the location of new development. Currently, most development is located at the eastern and western edges of the study boundary. This narrative was initially adopted as Addendum C of the Comprehensive Plan.
Topography within the Johnson Drive corridor plays a large role in the type of development which will occur. The topography is rolling between Rosehill Road and Barker Road. The slope direction off Johnson Drive varies from primarily downward slopes east of I-435 to upward slopes along the street west of I-435. The land use narrative for the Johnson Drive corridor will proceed from east to west beginning at Rosehill Road. The Land Use Guide adopted in 1989 provides the basis for comparison in this narrative.
• Rosehill Road to Lackman Road - The opening of Pflumm Road between Johnson Drive
and 51st Street should spur continued development in the area east of Alden extended. This area, unlike other portions of the corridor, is sewered providing the opportunity for fairly rapid development in the area. Johnson Drive becomes an even more important arterial carrying new Pflumm Road collected traffic from the north. This portion of the street is also a major carrier of traffic from Broken Arrow Elementary School located at Alden and Johnson Drive.
• Lackman Road to Maurer Road - This area is one of two along the corridor which has a
relatively thick stand of trees on both sides of the street. In order to protect this natural environment and to retain the pleasing vistas afforded by Johnson Drive, the creation of an environment easement is recommended. Subdivision design should be made with lots backing up to Johnson Drive with no access, except at entrance points to the subdivision as a whole. This not only limits the number of curb cuts in the area along Johnson Drive, but also will allow for the establishment of a 100' environmental easement along Johnson Drive. Environmental easements have been used in the past to ensure the preservation of existing trees and steep slopes. Subdivisions platted in this area should note on the final plat, as well as in covenants and restrictions for these subdivisions that within the environmental easements the ground area must remain in a natural state with no fence enclosure and no removal of trees or natural vegetation.
A medium density residential use is recommended at the northeast corner of Maurer Road and 63rd Street. This would provide for a uniform density on the east side of Maurer. A lower density recommendation at this corner not only reduces traffic generation near the intersection, but also utilizes Maurer as a boundary between intense commercial and residential development and less dense residential development. Low density residential uses are indicated east of Maurer between 55th and 57th Streets to

Region L Hazard Mitigation Plan, 2013 Final 2.76
buffer the City of Lake Quivira and to take advantage of two small lakes and a stream providing a basis for quality development. Timing of development in this area hinges on the provision of sewers. Landowners are working with engineering firms providing information to the Board of County Commissioners to determine needs and costs for sewering the area.
• Maurer Road to I-435 - The dominant future land use feature in this area is the proposed regional mall site on the south side of Johnson Drive. It is the intent of this area to develop with retail and office uses as opposed to warehousing or self storage units. The area also is the selected location for creation of a biosciences technology campus. Additionally, this area features office/service development and a variety of residential development. A strip of low density residential development is recommended between Maurer Road and Renner Road north of 57th Street. This provides for consistent development in land uses bordering in Lake Quivira, and also the ability to develop a heavily wooded terrain at a low density.
• I-435 to A.T.&S.F. Railroad - Unlike the intersection of I-435 and Shawnee Mission
Parkway which provides access constraints due to right-of-way necessary at that location to accommodate the three leafed clover type intersection, the I-435 and Johnson Drive intersection was constructed in a different manner which allows access to Johnson Drive relatively near the interstate. The entire area contains the most rugged terrain along the route, and also provides some of Shawnee's most scenic views for residential development. Due to the terrain, we can expect development of large lot residential development as infrastructure costs will be expensive and limited due to the topography. Development of the Shawnee West Industrial Park will provide initial extensions of water and sewer lines into the area. The Deffenbaugh landfill on the north side of the road represents the only significant land use in the study area. The settlement of a lawsuit between Deffenbaugh and the City of Shawnee governs the future for the land immediately south of the landfill along Johnson Drive as an industrial park. A greenbelt of open space is proposed to encircle the landfill site to buffer other development from that site.
• A.T.& S.F. Railroad to Woodland Road - This short portion of the study provides a
variety of land uses in a small area. An old existing manufacturing area exists on the south side of Johnson Drive near the railroad tracks. Except for a 300-foot wide strip along Woodland Road, the land is zoned Planned Industrial. There are no spur lines along the route making a large portion of the land questionable for industrial use, given its distance from K-7 Highway and I-435. The northeast corner of Johnson Drive and Woodland is designated for commercial development. Small retail uses should be encouraged to locate on the site, which can serve not only the residents in the area, but also those attending sporting events at the Johnson County Parks and Recreation venues nearby. Millwood Business Park provides a buffer between the residential structures along Woodland and the sports complex.
• K-7 Highway to Clare Road - Commercial development should focus upon 55th Street
and not strip out along K-7 Highway to the north. Single family residential development continues in the Monticello Meadows and City View Farms. Additional commercial development will add to the desirability of the neighborhood. The Land Use Guide also

Region L Hazard Mitigation Plan, 2013 Final 2.77
indicates an area for office/service development east of the Heartland Hills subdivision. Commercial development on the north side of 55th Street should be limited to the existing depth as currently developed. Single family residential development occurring between Gleason Road and Mize Road will be expected, at a minimum, to be platted meeting Residential Suburban zoning district standards.
• Shawnee Mission Corridor - Shawnee Mission Parkway is the City of Shawnee's major
east/west arterial street. The initial beginning point of the parkway is at Ward Parkway in Kansas City, Missouri and extends to Hedge Lane Road in Shawnee. Eight and one-half miles of its length are in the City of Shawnee. The parkway is a divided four lane highway, taking on interstate highway features west of Pflumm Road with a wide divided grass median strip and limited access points. The road will be widened to a six lane thoroughfare during 1994 between the eastern City limits and Halsey. The road is a former link in the State of Kansas highway system. The information provided in this report was previously approved as Addendum E of the Comprehensive Plan. Intense commercial development has occurred between the east City limits and Pflumm Road. Residential development has occurred between Pflumm Road and Lackman Road on both sides; between I-435 and Midland Road on the south, and at the northwest corner of Woodland Road. Remaining development is scattered.
The Corridor plans can be viewed in their entirety at gsh.cityofshawnee.org. The plan also shows the commitment by the City of Shawnee in its floodplain management program: The following development policies are adopted for land located in the Mill Creek floodplain and at elevations susceptible to being included in the floodplain as development continues to occur:
1. Allow development in floodplain which will not require the ground to be raised, such as ball diamonds, jogging trails, farming, etc., provided the existing elevation of the site is not raised;
2. Allow construction of accessory buildings in the floodplain which will not raise the base flood elevation on the owner's property, or on other's property; and
3.If free discharge into the 100-year floodplain is allowed for a development, the developer shall also be required to pay into the stormwater detention fund to assist in construction of upstream or downstream improvements.
The following map shows the land use guide for the City of Shawnee.

Region L Hazard Mitigation Plan, 2013 Final 2.78
Figure 2.20. City of Shawnee Land Use Guide

Region L Hazard Mitigation Plan, 2013 Final 2.79
Technical and Fiscal Resources The Floodplain Manager continues to be located in the Engineering Department and the Emergency Manager is the Fire chief. The staff for all departments are knowledgeable about land development and have an understanding of natural hazards. Table 2.19 details the staff and technical resources for the City of Shawnee. Table 2.19. City of Shawnee Personnel Resources and Warning Systems
Personnel Resources Yes/No Department/Position Comments Planner/Engineer with knowledge of land development/land management practices
Yes Planning Dept.
Engineer/Professional trained in construction practices related to buildings and/or infrastructure
Yes Engineering
Planner/Engineer/Scientist with an understanding of natural hazards
Yes Engineering
GIS Yes IT Dept/GIS Division Full Time Building Official Yes Codes Department Floodplain Manager Yes Engineering Emergency Manager Yes Emergency Management
Coordinator
Grant Writer Yes Various Departments Warning Systems (Reverse 9-11, cable override, outdoor warning signals)
Yes IT Dept/GIS Division
Financial tools and resources that the City of Shawnee could use to fund mitigation initiatives:
• Community Development Block Grants • Capital Improvements Project Funding • Johnson County Stormwater Management Program • Taxes for Specific Purposes • Impact Fees for New Development • Debt through General Obligation Bonds • Debt through Special Tax Bonds • Withholding spending in the hazard prone areas
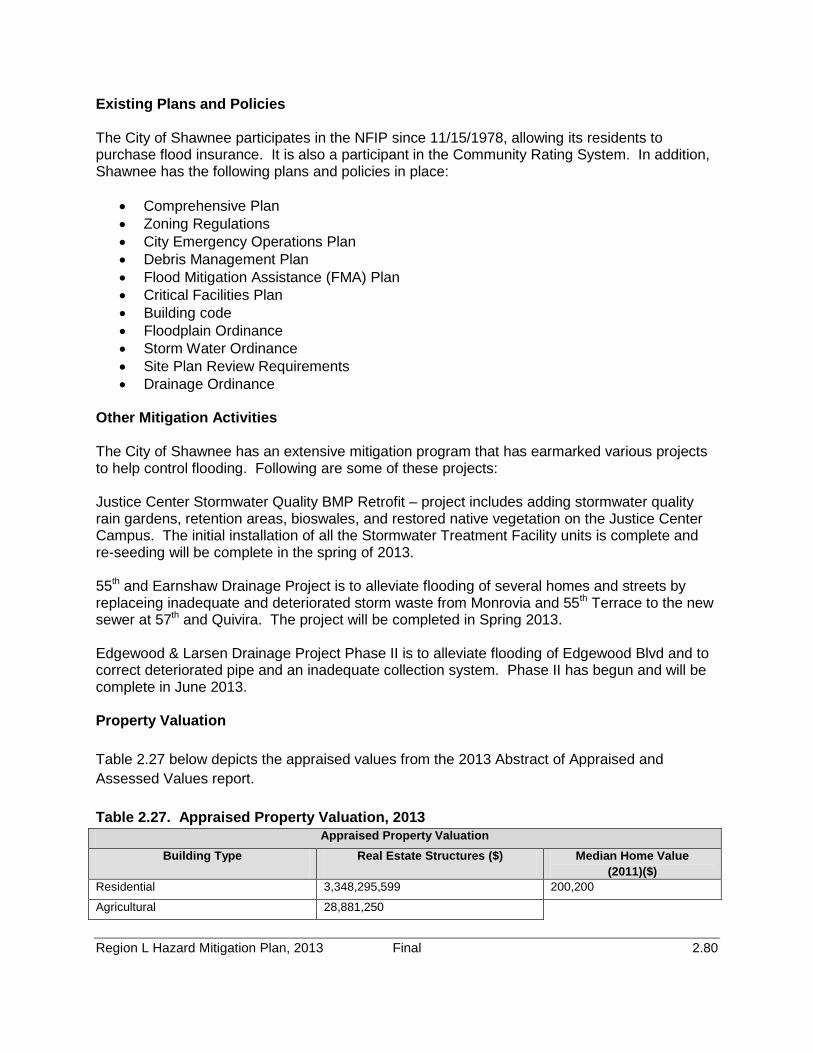
Region L Hazard Mitigation Plan, 2013 Final 2.80
Existing Plans and Policies The City of Shawnee participates in the NFIP since 11/15/1978, allowing its residents to purchase flood insurance. It is also a participant in the Community Rating System. In addition, Shawnee has the following plans and policies in place:
• Comprehensive Plan • Zoning Regulations • City Emergency Operations Plan • Debris Management Plan • Flood Mitigation Assistance (FMA) Plan • Critical Facilities Plan • Building code • Floodplain Ordinance • Storm Water Ordinance • Site Plan Review Requirements • Drainage Ordinance
Other Mitigation Activities The City of Shawnee has an extensive mitigation program that has earmarked various projects to help control flooding. Following are some of these projects: Justice Center Stormwater Quality BMP Retrofit – project includes adding stormwater quality rain gardens, retention areas, bioswales, and restored native vegetation on the Justice Center Campus. The initial installation of all the Stormwater Treatment Facility units is complete and re-seeding will be complete in the spring of 2013. 55th and Earnshaw Drainage Project is to alleviate flooding of several homes and streets by replaceing inadequate and deteriorated storm waste from Monrovia and 55th Terrace to the new sewer at 57th and Quivira. The project will be completed in Spring 2013. Edgewood & Larsen Drainage Project Phase II is to alleviate flooding of Edgewood Blvd and to correct deteriorated pipe and an inadequate collection system. Phase II has begun and will be complete in June 2013. Property Valuation Table 2.27 below depicts the appraised values from the 2013 Abstract of Appraised and Assessed Values report. Table 2.27. Appraised Property Valuation, 2013
Appraised Property Valuation Building Type Real Estate Structures ($) Median Home Value
(2011)($) Residential 3,348,295,599 200,200
Agricultural 28,881,250

Region L Hazard Mitigation Plan, 2013 Final 2.81
Commercial/Industrial 366,435,737
Not for Profit 915,220
Total $3,744,527,806 Source: Johnson County Assessor Office/U.S. Census Bureau City of Spring Hill Spring Hill is located along highway 169 and on both sides of southern Johnson County and northern Miami County. Spring Hill has a mayor/city council form of government. The City Administrator is responsible for the daily operations of the City. City departments are Administration, Animal Control, City Clerk, Community Development, Economic Development, Finance, Municipal Court, Police, Public Works, and Utilities. Land Use and Development Trends In 2010, the population of Spring Hill was 5,437 people, an increase of 2,710 since the 2000 census. Land area of the City is 3.45 square miles, with a population density of 1,576 people per square mile. Spring Hill is growing at a steady pace. Their Comprehensive Plan suggest five sites that were selected for development analysis based on three key factors: (www.springhillks.com)
• Access to U.S. 169 Highway and to a local arterial road, • Access to City of Spring Hill sanitary sewer service, and • Related development considerations, such as water service and land conditions.
The five site the city has identified as potential areas of development are:
A: 183rd Street east of U.S. 169 Highway B: 191st Street west of U.S. 169 Highway C: 223rd Street west of U.S. 169 Highway D: 223rd Street east Woodland Road, and E: N. Webster Street on west side, south of 199th Street/U.S. 169 Highway
The following map shows the future land use for the City of Spring Hill. Identifying the potential areas of development.

Region L Hazard Mitigation Plan, 2013 Final 2.82
Figure 2.21. City of Spring Hill Future Land Use Map

Region L Hazard Mitigation Plan, 2013 Final 2.83
Key issues identified during the Comprehensive Plan process for land usage were the following principles:
• Any new site must be planned based on both local and regional market trends. • The business park must help support the goals of the Spring Hill long range land use
plan and economic development strategy, education and training, • Each park plan site must be planned to minimize development problems that hinder
that goal or add undue costs. • Each opportunity must benefit the greater Spring Hill community. • Key arterial roads, water, City sanitary sewer, and other infrastructure investments must
be planned to maximize standing public investments in those systems. Spring Hill is committed to maintaining its NFIP status, and actively engages in floodplain management via its plans, policies, and actions. Technical and Fiscal Resources The Planning Coordinator holds many positions in the City of Spring Hill, serving as Floodplain Manager, Emergency Manager, and is knowledgeable of land development and management practices for the City. Johnson County Fire District No. 2 provides fire and rescue services to the City. Table 2.20 details staff and technical resources for Spring Hill. Table 2.20. City of Spring Hill Personnel Resources and Warning Systems
Personnel Resources Yes/No Department/Position Planner/Engineer with knowledge of land development/land management practices
Yes Planning Coordinator
Engineer/Professional trained in construction practices related to buildings and/or infrastructure
Yes City Engineer
Planner/Engineer/Scientist with an understanding of natural hazards
Yes Planning coordinator
GIS Full Time Building Official Yes Chief Building Inspector/Bldg
Inspector Floodplain Manager Yes Planning Coordinator Emergency Manager Yes Planning Coordinator Grant Writer No Warning Systems (Reverse 9-11, cable override, outdoor warning signals)
Yes Johnson County
Financial tools and resources that the City can use to fund mitigation initiatives include the following:
• Community Development Block Grants • Capital Improvements Project Funding • Johnson County Stormwater Management program

Region L Hazard Mitigation Plan, 2013 Final 2.84
• Taxes for Specific Purposes • Fees for water or sewer • Impact Fees for New Development • Debt through General Obligation Bonds • Debt through Special Tax bonds
Existing Plans and Policies Spring Hill joined the NFIP program in Johnson County on 09/03/2003. They also have and maintain the following plans and policies in place:
• Comprehensive Plan • Unified Zoning Ordinance • Unified subdivision Ordinance • Floodplain Ordinance • Emergency Management Plan • Capital Improvements program • Building code • Site Plan Review Requirements • Capital Improvements Plan
Other Mitigation Activities None identified Property Valuation Table 2.28 below depicts the appraised values from the 2013 Abstract of Appraised and Assessed Values report. Table 2.28. Appraised Property Valuation, 2013
Appraised Property Valuation Building Type Real Estate Structures ($) Median Home Value
(2011)($) Residential 64,354,170 159,100
Agricultural 0
Commercial/Industrial 28,499,850
Not for Profit 0
Total $92,854,020 Source: Johnson County Assessor Office/U.S. Census Bureau

Region L Hazard Mitigation Plan, 2013 Final 2.85
City of Westwood Westwood is situated in the Northeast corner of Johnson County & shares its borders with the Cities of Roeland Park, Fairway, Mission Woods, Mission Hills, Westwood Hills, Kansas City, Kansas and Kansas City, Missouri on the east. Westwood has a mayor/city council form of government and the city departments include: administration, parks & recreation, public safety, and public works. Consolidated Fire District No. 2 provides fire protection services for the City. Land Use and Development Trends The census of 2010 shows Westwood with a population of 1,506, a decrease of 27 people since the 2000 census. Land area is .40 square miles and population density is 3,765 people per square mile. The City of Westwood has approved growth in development within its limits, one of the most recent being the 47th and Mission Road Redevelopment project, as well as the Woodside Village Development near 47th and Rainbow Boulevard. The City of Westwood is committed to maintaining its NFIP status and the integrity of its floodplain and stormwater ordinances. In addition, chapter 15 of its City Code, the city details in depth its surface water management policies and guidelines. www.westwoodks.org. Technical and Fiscal Resources The Public Works Director serves as the floodplain manager and Police Chief seves as the Emergency Manager. All engineering services are outsourced to private companies. Financial tools that the City can use to help fund mitigation activities include the following:
• Community Development block Grants • Johnson county Stormwater Management Program • Taxes for Specific Purposes • Debt through General Obligation Bonds • Debt through Special Tax Bonds • Withholding spending in hazard prone areas
Existing Plans and Policies Westwood became a member of the NFIP on 06/25/1976 and has a NSFHA status. The city has the following plans and policies in place:
• Comprehensive Plan • Zoning Regulations • Floodplain Ordinance • Stormwater Ordinance • Capital Improvements Program

Region L Hazard Mitigation Plan, 2013 Final 2.86
• Building Code • Emergency Operations Plan
Other Mitigation Activities None identified at this time Property Valuation Table 2.29 below depicts the appraised values from the 2013 Abstract of Appraised and Assessed Values report. Table 2.29. Appraised Property Valuation, 2013
Appraised Property Valuation Building Type Real Estate Structures ($) Median Home Value
(2011)($) Residential 88,753,930 $155,900
Agricultural 0
Commercial/Industrial 15,340,300
Not for Profit 1,145,150
Total $105,239,380 Source: Johnson County Assessor Office/U.S. Census Bureau
City of Westwood Hills This small residential community is completely land-lock in Northeastern Johnson County. There are no city buildings and all resources are provided by the City of Westwood and Consolidated Fire District No.2 provides fire protection services for the City. Land Use and Development Trends The 2010 census shows Westwood Hills has a population of 359 people, a decrease of 19 since the 2000 census. The land area is .07 square miles and the population density is 5,128 people per square mile. There has not been any significant development in this residential community. The city continues to be committed to its participation in the NFIP, and maintains a floodplain ordinance and zoning regulations that reinforce their position. While no development for the future is currently being considered, the City of Westwood Hills is concerned about the development of the Westwood Village by the City of Westwood as it pertains to ground water runoff and sewage. www.westwoodhills.org. Technical and Fiscal Resources The City of Westwood provides all technical resources, or they are outsourced to private entities.

Region L Hazard Mitigation Plan, 2013 Final 2.87
Financial tools and resources that could help the city fund mitigation activities include:
• Community Development Block Grants • Johnson County Stormwater Management program • Taxes for Specific Purposes • Debt through General Obligation Bonds • Debt through special Tax Bonds • Withholding spending in hazard prone areas
Existing Plans and Policies The City of Westwood Hills has adopted the plans and policies from the city of Westwood. It has been a member of the NFIP since 08/03/1984, and has a NSFHA status.
• Comprehensive Plan • Zoning Regulations • Floodplain Ordinance • Capital Improvements Program • Building Code • Emergency Operations Plan
Other Mitigation Activities None at this time Property Valuation Table 2.30 below depicts the appraised values from the 2013 Abstract of Appraised and Assessed Values report. Table 2.30. Appraised Property Valuation, 2013
Appraised Property Valuation Building Type Real Estate Structures ($) Median Home Value
(2011)($) Residential 37,029,050 $219,000
Agricultural 0
Commercial/Industrial 214,750
Not for Profit 0
Total $37,243,800 Source: Johnson County Assessor Office/U.S. Census Bureau 2. 2.9. Unified School Districts Johnson County has six Unified School Districts (USD), as well as a State School, the Kansas School for the Deaf in Olathe. Figure 2.21 shows the USD boundaries.

Region L Hazard Mitigation Plan, 2013 Final 2.88
Figure 2.22. USD’s in Johnson County
U.S.D. 229 Blue Valley USD 229 serves the cities of Olathe, Leawood, and Overland Park, in addition to Johnson County. It covers 91 square mile and has five high schools, nine middle schools and 20 elementary schools. The enrollment for the 2012-2013 school year is 22,392 students. Technical and Fiscal Resources The District employs the following staff:
• Building Official – Principal • Emergency Manager • Grant Writer • Public Information Officer
Fiscal Resources Fiscal resources that the district can draw upon for the funding of mitigation activities are:

Region L Hazard Mitigation Plan, 2013 Final 2.89
• Capital Improvements Project Funding • General Obligation Bonds • Special Tax bonds • State and Federal Funds
Existing Plans and Policies USD 229, Blue Valley has plans and policies in places. These are as follows:
• Master Plan • Capital Improvement Plan • School Emergency Plan • Shelter in Place Protocols • Evacuation Protocols • Weapons Policy
Other Mitigation Activities USD 229 conducts fire, tornado, and evacuation drills on a scheduled basis. Fire drills are monthly, and tornado drills are three times per year. They have also completed an upgrade to their school safe rooms. In addition, USD 229 has an on-going public education programs, such as responsible water use, fire safety, household preparedness, environmental education, and fire and severe weather safety. Table 2.31. USD 229 Blue Valley Asset Inventory
Facility Name Address City Insured Value
($)
School Blue River Elementary 5101 W 163rd Ter Overland Park 10,126,150
School Blue Valley Academy 7500 W 149th Ter Overland Park 15,010,999
School Blue Valley High 6001 W 159th St Johnson County 47,793,303
School Blue Valley Middle 5001 W 163rd Ter Overland Park 19,279,200
School Blue Valley North High 12200 Lamar Ave Overland Park 62,717,640
School Blue Valley Northwest High 13260 Switzer Rd Overland Park 53,093,193
School Blue Valley West High 16200 Antioch Road Overland Park 72,386,767
School Cedar Hills Elementary 9100 W 165th St Johnson County 11,180,925

Region L Hazard Mitigation Plan, 2013 Final 2.90
School Cottonwood Point Elementary 10521 W 129th St Overland Park 8,858,300
School District Office Campus 15020 Metcalf Ave Overland Park 8,917,713
School Harmony Elementary 14140 Grant St Overland Park 8,658,300
School Harmony Middle 10101 W 141st St Overland Park 18,714,120
School Heartland Elementary 12775 Goodman St Overland Park 8,835,000
School Indian Valley Elementary 11600 Knox St Overland Park 10,546,200
School Lakewood Elementary 14600 Lamar Ave Overland Park 10,008,195
School Lakewood Middle 6601 Edgewater Dr Overland Park 20,409,360
School Leawood Elementary 2400 W 123rd St Leawood 8,947,840 School Leawood Middle 2410 W 123rd St Leawood 17,171,285
School Liberty View Elementary 14800 S Greenwood St Olathe 11,655,690
School Mission Trail Elementary 13200 Mission Rd Leawood 9,316,585
School Morse Elementary 15201 Monrovia St Overland Park 7,756,200
School Oak Hill Elementary 10200 W 124th St Overland Park 7,998,000
School Overland Trail Elementary 6225 W 133rd St Overland Park 8,658,300
School Overland Trail Middle 6201 W 133rd St Overland Park 18,714,120
School Oxford Middle 12500 Switzer Rd Overland Park 16,083,174
School Pleasant Ridge Middle 9000 W 165th St Overland Park 19,910,760
School Prairie Star Elementary 3800 W 143rd St Leawood 8,658,300 School Prairie Star Middle 14201 Mission Rd Leawood 19,406,675
School Stanley Elementary 6121 W 158th St Overland Park 8,075,500
School Stilwell Elementary 6410 W 199th St Johnson County 10,222,250
School Sunrise Point 15800 Roe Ave Overland Park 11,780,000
School Sunset Ridge Elementary 14901 England Ave Overland Park 9,610,000
School Valley Park Elementary 12301 Lamar Ave Overland Park 10,059,500

Region L Hazard Mitigation Plan, 2013 Final 2.91
U.S.D. 230 Spring Hill USD 230 serves 71 square miles in the southern Johnson and Northern Miami County which includes the Spring Hill area. Enrollment for the 2013-2014 school year is 3,000 students. The district has three elementary schools, one middle school, one high school and one virtual high school. Technical and Fiscal Resources The school currently employs the following positions as technical resources for the purpose of this plan:
• Full Time Building Official (all Principals) • Emergency Manager (Superintendent) • Grant Writer (Administration) • Public Information Officer (Director of Communications)
Fiscal Resources available to the school district include:
• Capital Improvements Project Funding • Local Funds • General Obligation Bonds • State and Federal Funds
Existing Plans and Policies The following plans and policies are in place at USD 230:
• Master Plan • Capital Improvement Plan • School Emergency Plan
o Shelter in Place protocols o Evacuation Protocols
• Weapons Policy Other Mitigation Activities The following activities are on-going at the school district: Water conservation Bullying Prevention Safe Driving Alcohol Awareness Electricity Conservation Stranger Danger Recycling Environmental Education Narcotics Awareness Gun Safety Fire Safety Swimming Eduction In addition, USD 230 conducts fire drills monthly, and tornado drills four times a year, are equipped with weather radios, and conduct lock-down security training for the staff and students. Another mitigation activity currently on-going is the upgrading of the entrances in

Region L Hazard Mitigation Plan, 2013 Final 2.92
every building within the district. These upgrades include: line-of-sight entrances, cameras, sound system, protective glass, etc. Table 2.31. USD 230 Asset Inventory
U.S.D. 231 Gardner/Edgerton
USD 231 serves the communities of Gardner and Edgerton. The school district has six elementary schools, two middle schools, and one high school. It also has one alternative education attendance center. The enrollment for the 2012-2013 school year is approximately 5,450 students. Technical and Fiscal Resources The Superintendent and the Director of Secondary Education can serve as the Emergency Manager. The district also has a Community Relations Director. Financial resources that the district can use to facilitate mitigation activities include the Capital Improvements Project Funds, General Obligation Bonds, and State and Federal Funds. Existing Plans and Policies In partnership with public safety agencies and crisis consultants, the school district has a
Name of Asset Address Square
Feet
Replacement t Value
(insured) Contents
Value Occupancy/Capacity # Board of Education Office 101 E. South Street
Spring Hill, KS 66083 10,000 $1,106,694 $286,110 256 cap.
Spring Hill High School 19701 Ridgeview Rd, Spring Hill, KS 66083
181,670 $28,000,000 $5,800,000 Student cap. 850 Total cap. 1816
Spring Hill Middle School - South
301 E. South Street Spring Hill, KS 66083
98,130 $13,942,330 $3,000,000 Student cap. 528 Total cap. 622
Spring Hill Intermediate School will become Spring Hill Middle School -North in August 2013
300 E. South Street Spring Hill, KS 66083
62,260 $8,452,755 $2,001,392 Student cap. 400 Total cap. 622
Spring Hill Elementary School
300 S. Webster Street Spring Hill, KS 66083
84,000 $13,290,345 $2,658,069 Student cap.616 Total cap. 840
Prairie Creek Elementary S h l
17077 W. 165th Street Ol h KS 66062
52,150 $8,680,000 $2,081,329 Student cap.528 Total cap. 528
*Wolf Creek Elementary School will open in August 2013
19250 Ridgeview Rd, Spring Hill, KS 66083
52,150 $8,680,000 $8,680,000 Student cap.528 Total cap. 529

Region L Hazard Mitigation Plan, 2013 Final 2.93
complete Crisis Communication and Response Plan for the safety and security of district students and staff. It includes such topics as utility failure, off-site emergencies, hazardous materials, severe weather, fire, and code red and yellow. Other Mitigation Activities USD 231 conducts routine fire, tornado, intruder, and evacuation drills in each of their school buildings. The district also proved CPR/AED training and re-certification training offered free-of-charge to all staff members. Asset Inventory Table 2.32. USD 231 Asset Inventory
Facility Name Address City Occupancy School Edgerton Elementary 400 W. Nelson Edgerton
School Education Admin. Office
314 E. Washington St Gardner
School Gardner Elementary 218 E Shawnee St Gardner 405 School Gardner-Edgerton High 425 N Waverly Rd Gardner 1275 School Madison Elementary 800 W Madison St Gardner 450
School Moonlight Elementary 17960 S Moonlight Rd Gardner 566
School Nike Elementary 19500 S Gardner Rd. Gardner 393
School Pioneer Ridge Middle 16200 Kill Creek Rd Gardner 695 School Sunflower Elementary 775 N Center St Gardner 365
School Wheatridge Middle 318 E Washington St Gardner 806
School Maintenance/Transportation 1950 S. Gardner Rd Gardner
U.S.D. 232 De Soto The largest school district in Johnson County, USD 232 covers 100+ square miles. It services the jurisdictions of the City of De Soto, Lenexa (40%), a portion of Olathe and Shawnee (60%), and the Lexington and Olathe Townships. The enrollment for the 2012 – 2013 school year was 6,977 students. The school district has seven elementary schools, three middle schools, and two high schools.

Region L Hazard Mitigation Plan, 2013 Final 2.94
Technical and Fiscal Resources USD 232 has a Director of Operations that serves as the Emergency Manager and a Director of Communications for public information. Fiscal resources consist of Capital Improvements Project Funding, Local Funds, General Obligation Bonds, Private activities/donations, and State and Federal Funds. Existing Plans and Policies USD 232 has established plans and policies which include a Capital Improvement Plan, School Emergency Plan (Shelter in place protocols, Evacuation protocols) and a Weapons Policy. Other Mitigation Activities USD 232 conducts the routine fire, tornado, and evacuation drills in all of their school buildings. Each school facility is secure during school days with an ADT security system and there is a district-wide email alert system to keep parents informed. USD 232 submitted an application and was approved for a FEMA Approved Safe room during this planning period. It is estimated to be complete during the 2013 – 2014 school year. Asset Inventory Table 2.32. USD232 Asset Inventory
Facility Name Address City Insured Value Occupancy
School Clear Creek Elementary 5815 Monticello Rd Shawnee $ 12,832,400 600 School Horizon Elementary 7210 Chouteau St Shawnee $ 15,600,000 600 School Mill Creek Middle 8001 Mize Rd Lenexa $ 21,000,000 750 School Mill Valley High 5900 Monticello Rd Shawnee $ 31,500,000 1450 School Mize Elementary 7301 Mize Rd Shawnee $ 13,504,600 600 School Monticello Trails Middle 6100 Monticello Rd Shawnee $ 20,314,400 750
School Prairie Ridge Elementary 22405 Clear Creek Pkwy Shawnee $ 16,100,000 600
School Riverview Elementary 21550 W 47th St Shawnee $ 13,543,400 600
Transportation Center Bus Depot 8020 Monticello Terr Shawnee $ 2,000,000 School Starside Elementary 35400 W 91st De Soto $ 128,324,000 600
School Lexington Trails Middle School 8800 Denver De Soto $ 21,751,600 750
School DeSoto High School 35000 W 91st De Soto $ 23,708,600 750
School Country Side Learning Center 10120 Lexington De Soto $ 5,339,400 250
School Administration Office 35200 W. 91st De Soto $ 3,400,000 200 School Technology Center 8305 Peoria De Soto $ 755,850 100

Region L Hazard Mitigation Plan, 2013 Final 2.95
U.S.D. 233 Olathe USD 233 serves Olathe with 34 elementary schools, nine middle schools, four high schools and seven specialty school programs. It continues to be one of the fastest growing school districts in the area. The enrollment for the 2012 – 2013 school year is 29,031 students. Technical and Fiscal Resources The Principal serves as the full-time building official, and the Manager of Safety and Security serves as the Emergency Manager for the school district. Fiscal resources available to the district for mitigation activities include:
• Capital Improvements Project Funding • Local Funds • General Obligation Bonds • Private activities/donations • State and Federal Funds
Existing Plans and Policies The established plans and policies for the school district include a capital improvement plan, school emergency plan, weapons policy and a master plan. Other Mitigation Activities The Olathe School District continues their Safe Schools for All policy that emphasizes a safe environment. They work hand-in-hand with the community, including the Olathe Police Department and other law enforcement agencies to support safe schools. There is also a certified law enforcement officer in the high schools and one per two middle schools with the School Resource Officer (SRO) program. USD 233 also holds regular fire, tornado, and evacuation drills on a scheduled basis. Asset Inventory Table 2.33. U.S.D. 233 Asset Inventory
Facility Name Address City
School ACCESS Program 650 SLindenwood Dr Olathe
School Activity Center 21201 W 159th St Olathe
School Arbor Creek Elementary 16150 S Brougham Dr Olathe
School Bentwood Elementary 13000 Bond St Overland Park

Region L Hazard Mitigation Plan, 2013 Final 2.96
School Black Bob Elementary 14701 S Brougham Dr Olathe
School Briarwood Elementary 14101 S Brougham Dr Olathe
School Brougham Elementary 15500 S Brougham Dr Olathe
School California Trail Middle 13775 W 133rd St Olathe School Cedar Creek Elementary 11150 S Clare Rd Olathe School Central Elementary 324 S Water St Olathe
Facility Name Address City School Chisholm Trail Middle 16700 W 159th St Olathe
School Clare Alternative Learning Center 540 S Rogers Rd Olathe
School Clearwater Creek Elementary
930 S Clearwater Creek Dr Olathe
School College Blvd Activity Center 11031 S. Valley Rd Olathe
School Countryside Elementary 15800 W 124th Ter Olathe School Education Admin. Office 14160 Black Bob Rd Olathe School Fairview Elementary 600 N Marion St Olathe School Food Production Center 14140 Black Bob Rd Olathe School Forest View Elementary 12567 S Canyon Dr Olathe School Frontier Trail Middle 15300 W 143rd St Olathe School Green Springs Elementary 14675 S Alden St Olathe
School Harmony Early Childhood Center
14030 S Black Bob Rd Olathe
School Havencroft Elementary 1700 E Sheridan St Olathe School Heartland Learning Center 1700 W Sheridan St Olathe School Heatherstone Elementary 13745 W 123rd St Olathe School Heritage Elementary 1700 E Pawnee Dr Olathe
School Indian Creek Elementary 15800 W Indian Creek Pkwy Olathe
School Indian Trail Middle 1440 E 151st St Olathe
School Instructional Materials Center 14090 Black Bob Rd Olathe
School Jo Co Detention Center 915 W Spruce St Olathe
School Mission Trail Middle 1001 N. Persimmion Dr. Olathe
School Lone Elm Service Building 21800 W 107th St Olathe School Madison Place Elementary 16651 S Warwick St Olathe School Mahaffie Elementary 1300 N Nelson Rd Olathe
School Manchester Park Elementary
9810 Prairie Creek Rd Lenexa
School Meadow Lane Elementary 21880 College Blvd Olathe School Millcreek Center 311 E Park St Olathe
School N. Lindenwood Support Center
315 N Lindenwood St Olathe
School Northview Elementary 905 N Walker St Olathe School Olathe East High 14545 W 127th St Olathe

Region L Hazard Mitigation Plan, 2013 Final 2.97
School Olathe North High 600 E Prairie St Olathe
School Olathe Northwest High School
21300 W College Blvd Olathe
School Olathe South High 1640 E 151st St Olathe School Operational Service Center 1500 W 56 Hwy Olathe School Oregon Trail Middle 1800 W Dennis Ave Olathe School Pioneer Trail Middle 15100 W 127th St Olathe
School Pleasant Ridge Elementary 12235 Rosehill Rd Overland Park
School Prairie Center Elementary 629 N Persimmon Dr Olathe
School Prairie Learning Center 1400 W Santa Fe St Olathe School Prairie Trail Middle 21600 W 107th St Olathe School Ravenwood Elementary 12211 S Clinton St Olathe
School Regency Place Elementary 13250 S Greenwood St Olathe
School Ridgeview Elementary 1201 E Elm St Olathe School Rolling Ridge Elementary 1500 W Elm Ter Olathe
School Santa Fe Trail Middle 1100 N Ridgeview Rd Olathe
School Scarborough Elementary 2000 S Lindenwood Dr Olathe
School Sunny Side Elementary 16025 S Lindenwood Dr Olathe
School Tomahawk Elementary 13820 S Brougham Dr Olathe
School Walnut Grove Elementary 11800 Pflumm Rd Olathe
School Washington Elementary 1202 N Ridgeview Rd Olathe
School Westview Elementary 601 S Lee St Olathe
School Woodland Elementary 11601 S Woodland Rd Olathe
U.S.D. 512 Shawnee Mission The Shawnee Mission USD covers 72 square miles of northeastern Johnson County with almost 27,500 students and over 3,500 faculty/staff. It serves the cities of Fairway, Lake Quivira, Lenexa, Merriam, Mission, Mission Hills, Mission Woods, Prairie Village, Roeland Park, Shawnee, Westwood, Westwood Hills and sections of Overland Park with three school buildings; 33 elementary schools, five middle schools, and five high schools. The District is comprised of three departments - administrative services, operations, and educational services.

Region L Hazard Mitigation Plan, 2013 Final 2.98
Technical and Fiscal Resources Shawnee Mission USD has their own Campus Police at each of the five high schools. Fiscal resource include: Capital improvements project funding, local funds, general obligation bonds, private activities/donations, and State and Federal Funds. Existing Plans and Policies USD 512 has a master plan, capital improvement plan, crisis management plan, and a weapons policy. Other Mitigation Activities Security measures at all the schools include visitor check-in requirements, designated safe areas in each building, with School Resource Officers and Campus Police at the high schools. Schools practice fire, tornado, lockdown, and evacuation procedures yearly. Asset Inventory Table 2.34. U.S.D. 512 Shawnee Mission
Facility Name Address City Insured Value
School Antioch Middle 8200 W 71st St Overland Park $14,248,450
School Apache Elementary 8910 Goddard St Overland Park $9,931,763
School Arrowhead Administrative Center 6601 Santa Fe Dr
Overland Park $6,106,146
School Belinder Elementary 7230 Belinder Ave Prairie Village $9,978,966
School Bluejacket-Flint Elementary 11615 W 49th Ter Shawnee $13,383,499
School Briarwood Elementary 5300 W 86th St Prairie Village $11,250,490
School Broadmoor Technical Center 6701 W 83rd St
Overland Park $12,660,342
School Broken Arrow Elementary 5901 Alden Rd Shawnee $11,525,371
School Brookridge Elementary 9920 Lowell St Overland Park $9,990,093
School Brookwood Elementary 3411 W 103rd St Leawood $8,304,956
School Christa McAuliffe Elementary 15600 W 83rd St Lenexa $4,717,150
School Comanche Elementary 8200 Grant St Overland Park $11,734,938
School Corinth Elementary 8301 Mission Rd Prairie Village $10,313,989
School Crestview Elementary 6101 Craig Rd Merriam $8,337,088
School Crestview Elementary trailers 6102 Craig Rd Merriam $25,628
School Don Bonjour Elementary 9400 Pflumm Rd Lenexa $88,842,344

Region L Hazard Mitigation Plan, 2013 Final 2.99
School Dorothy Moody Elementary 10101 England
Overland Park $9,520,808
School East Antioch Elementary 7342 Lowell St Overland Park $9,463,847
School Highlands Elementary (existing) 6200 Roe Ave Mission
9,037,387.00
School Highlands Elementary (New)
-
School Hocker Grove Middle 10400 Johnson Dr Shawnee $14,696,041 School Horizons High 5900 Lamar Ave Mission $11,029,166
School Indian Creek Technology Center 4401 W 103rd St
Overland Park $22,381,650
School Indian Hills Middle 6400 Mission Rd Prairie Village $16,863,660
School Indian Woods Middle 9700 Woodson St Overland Park $18,059,867
School John Diemer Elementary 9600 Lamar Ave Overland Park $8,497,602
McAuliffe Elementary 15600 W. 83rd St. Lenexa $12,244,192
School McEachen Admin. Center 7235 Antioch Rd Overland Park $6,265,501
School Merriam Park Elementary 6100 Mastin St Merriam $11,798,437 School Mill Creek Elementary 13951 W 79th St Lenexa $9,437,164
School Mission Valley Middle 8500 Mission Rd Prairie Village $16,706,604
School Nieman Elementary 10917 W 67th St Shawnee $12,495,967
School Oak Park-Carpenter Elementary 10000 Nieman Rd
Overland Park $12,686,871
School Overland Park Elementary 8150 Santa Fe Dr Overland Park $11,370,582
School Pawnee Elementary 9501 W 91st St Overland Park $10,620,746
School Prairie Elementary 6642 Mission Rd Prairie Village $10,655,372
School Raymond Marsh Elementary 5642 Rosehill Rd Shawnee $11,589,133
School Rhein Benninghoven Elementary 6720 Caenen St Shawnee $9,524,598
School Rising Star Elementary 8600 Candlelight Ln Lenexa $14,785,521
School Roesland Elementary 4900 Parish Dr Roeland Park $12,131,628
School Rosehill Elementary 9801 RoseHill Rd Lenexa $13,923,736 School Rushton Elementary 6001 W 52nd St Mission $811,932
School Santa Fe Trail Elementary 7100 Lamar Ave Overland Park $9,836,846
School Shawanoe Elementary 11230 W 75th St Shawnee $8,757,744
School
Shawnee Mission Operations and Maintenance 11475 W 93rd St
Overland Park $7,049,441
School SM East High 7500 Mission Rd Prairie Village $52,490,747

Region L Hazard Mitigation Plan, 2013 Final 2.100
School SM Instructional Support Center 9700 W 96th St
Overland Park $8,543,386
School SM North High 7401 Johnson Dr Overland Park $66,685,085
School SM Northwest High 12701 W 67th St Shawnee $54,572,614
School SM South High 5800 W 107th St Overland Park $62,049,137
School SM West High 8800 W 85th St Overland Park $55,331,108
School Soccer Complex 9300 Nieman Road Overland Park $280,577
School Softball Complex 6101 Maurer Shawnee $770,732
School Somerset Elem (closed after2003-04 school year) 2700 Somerset Dr.
Prairie Village $6,352,020
School South Park Elementary 8715 W 49th Terrace Merriam $5,952,420
School Stadium North $7,063,629
School Stadium South 5800 W. 107th St. Overland Park $9,188,279
School Sunflower Elementary 8955 Loiret Blvd. Lenexa $13,262,052
School Supply Center 14850 W. 101st Terrace Lenexa $11,599,648
School Tomahowk Elementary 6301 W. 78th Overland Park $9,322,323
School Trailridge Middle 7500 Quivira Rd Lenexa $20,254,925
School Trailwood Elementary 5101 W. 95th St. Overland Park $10,883,926
School Westridge Middle 9300 Nieman Rd Overland Park $21,492,432
School Westwood View Elementary 2511 W. 50th Westwood $7,012,035
2.2.10 Kansas School for the Deaf (KSD) The Kansas School for the Deaf is located in Olathe between Santa Fe and Park Drive and today includes nine buildings on approximately 12 acres. KSD serves 130 deaf students in grades pre- K through 12th grade. There is approximately 150 staff that provides services to teach, house, feed, and provide health services during the week for ten months of the year. Dormitory housing is available for approximately 60 students that live more than 25 miles from the KSD. Technical and Fiscal Resources The Human Resources/Capital Improvements Director serves as a full-time building official and the Superintendent serves as the Public Information Officer for KSD. The Maintenance Specialist serves as the Emergency Manager. KSD can access capital improvements funds along with state and federal funds for fiscal resources. Existing Plans and Policies KSD has an existing capital improvements plan and a school emergency plan that addresses

Region L Hazard Mitigation Plan, 2013 Final 2.101
shelter in place and evacuation protocols that are revised annually. Other Mitigation Activities None at this time. 2.2.11 Community College and University Johnson County Community College Johnson County Community College (JCCC) is a participating jurisdiction in this multi-hazard mitigation plan. As a public institution, it has a shared interest in public safety and in achieving the county’s mitigation goals. JCCC is centrally located in Johnson County on 234 acres with 25 major buildings on the main campus. Each semester, it averages 34,000 students enrolled in credit and continuing education classes. Technical and Fiscal Resources JCCC has a warning and emergency notification system for faculty, staff, and students and has upgraded the cell phone alert system. There is an emergency manager, building official, grant writer, and public information officer. Fiscal resources available include capital improvements project funds, local funds, general obligation bonds, special tax bonds, private donations, and state and federal funds. Existing Plans and Policies All the existing plans have been updated as of January 2008. Plans maintained by the college include a master plan, capital improvement plan, shelter in place, and evacuation policies as well as site security protocols. Other Mitigation Activities None available at this time. University of Kansas Edwards Campus As a public institution in Johnson County since 1993, the University of Kansas (KU) Edwards Campus has designed itself for the adult learner, not the full-time student, with many evening and weekend classes. The enrollment has varied each semester ranging from a 1,000 to 1,557 students in 2007. The 30 acre campus is located in Overland Park and currently has three buildings, but there are no dormitories. Technical and Fiscal Resources Personnel resources for the Edwards Campus include the Vice Chancellor who serves as a building official as well as a Facilities Operations Manager and a Director of Public Relations. All the financial resources are provided by the KU Lawrence campus.

Region L Hazard Mitigation Plan, 2013 Final 2.102
Existing Plans and Policies Existing plans include master plan, school emergency plan, and a weapons policy. Other Mitigation Activities The administrative staff reviews the crisis management plan on a yearly basis. There is also fire safety training and security training for staff and students as an on-going safety measure. 2.2.12 Fire Districts There are four (4) fire districts participating as special districts in the development of the Johnson County Multi-Hazard Mitigation Plan. They include Consolidated Fire District No. 2, Johnson County Fire District No. 1, Johnson County Fire District No. 2, and Fire District No. 3. The cities of Leawood, Lenexa, Merriam, Olathe, Overland Park, and Shawnee have their own fire fighting capabilities. Figure 2.5 on the next page depicts the fire districts in Johnson County. Figure 2.23. Johnson County Fire Districts
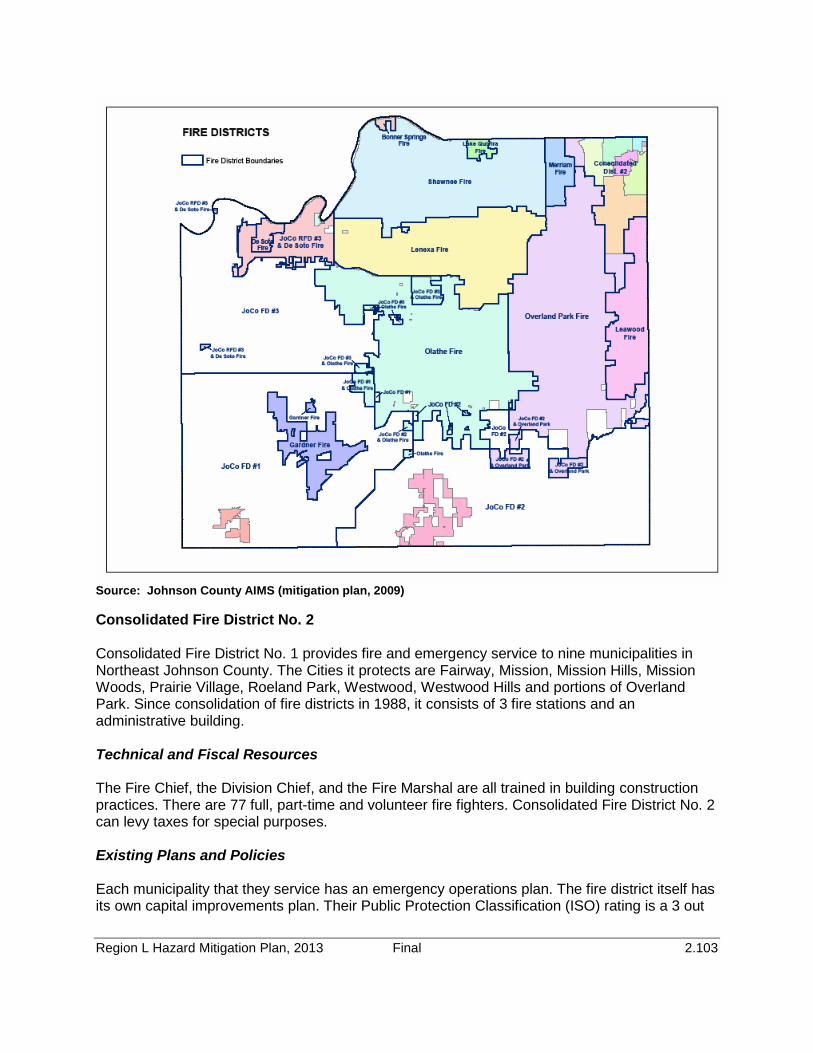
Region L Hazard Mitigation Plan, 2013 Final 2.103
Source: Johnson County AIMS (mitigation plan, 2009) Consolidated Fire District No. 2 Consolidated Fire District No. 1 provides fire and emergency service to nine municipalities in Northeast Johnson County. The Cities it protects are Fairway, Mission, Mission Hills, Mission Woods, Prairie Village, Roeland Park, Westwood, Westwood Hills and portions of Overland Park. Since consolidation of fire districts in 1988, it consists of 3 fire stations and an administrative building. Technical and Fiscal Resources The Fire Chief, the Division Chief, and the Fire Marshal are all trained in building construction practices. There are 77 full, part-time and volunteer fire fighters. Consolidated Fire District No. 2 can levy taxes for special purposes. Existing Plans and Policies Each municipality that they service has an emergency operations plan. The fire district itself has its own capital improvements plan. Their Public Protection Classification (ISO) rating is a 3 out

Region L Hazard Mitigation Plan, 2013 Final 2.104
of 10, with 1 being the highest score possible. The fire district is engaged in public education and provides free fire inspects for all the homes in the district. They participate in many public functions such as station tours, block parties, and festivals. Johnson County Fire district No. 1 Through the consolidation of Edgerton Community Fire Department, Gardner Rural Fire Department, and Johnson County Fire Rescue in 1992 Johnson County Fire District No. 1 was created. The communities Fire District No. 1 serves encompass approximately 100 square miles in South Central Johnson County and a variety of environments. It is the primary Fire Department for the cities of Edgerton and Gardner, and the unincorporated areas surrounding these cities. The service areas consist primarily of farmland and a rural population of approximately 7,000 residents. It also services the busiest airport in Kansas at New Century Air Center. In addition to air traffic, New Century has an extensive industrial park and office complex with a daytime population of approximately 5,000 people. The fire district also has responsibility to the cover nearly 13 miles of Interstate 35. Currently the fire district has the only true Aircraft Rescue and Firefighting vehicle in the county. All of the front line engines are equipped with extrication equipment to deal with the many rescue possibilities that could present themselves from incidents on the highway or the industrial complex. The fleet also includes four grass fire fighting rigs and three tankers to help in the rural environment. Technical and Fiscal Resources Fire District No. 1 has 3 fire stations with the main station located at the New Century Airport. The District is equipped with 1 crash truck for the airport location, and 3 tanker trucks, 3 brush trucks, and 3 engine trucks for each fire station in the district. Existing Plans and Policies Their Public Protection Classification (ISO) rating is a 5 out of 10 for 90 percent of the jurisdiction and an ISO rating of a 9 in 6 to 9 square mile area. Ten percent of this score is based on how well the fire district receives fire alarms and dispatches fire fighting resources. Fifty percent of the score is based on the number of engine companies available and the amount of water the community needs to fight a fire. Forty percent of the ISO rating is based on the community’s supply of available water for fire suppression purposes. Fire District No. 1 is involved with the public in many different avenues. It provides CERT training, CPR and First Aid Training to the public, public safety messages, issues burn permits, and education during fire prevention week. Johnson County Fire District No. 2 Fire District No. 2 serves unincorporated southern Johnson County, portions of southern Overland Park, the city of Spring Hill, and approximately 70 square miles of north central Miami County, which includes most of Hillsdale Lake. This District is responsible for providing fire and

Region L Hazard Mitigation Plan, 2013 Final 2.105
rescue services to a mixture of agricultural areas, residential areas, light industry, and other commercial development located within the service area of the Fire District. Technical and Fiscal Resources Fire District No. 2 provides fire and rescue services from four locations all staffed 24/7 by full-time personnel. The District also operates a water rescue team consisting of two boats and 15 personnel trained in swift water rescue. The Fire District operates two, type 2a licensed ambulances and has advanced life support capabilities. The Fire District has a total of 45 full-time personnel, 15 part-time personnel, and 5 volunteer firefighters. Fiscal resources are the ability to levy taxes and the ability to incur debt through general obligation bonds to fund facilities, equipment, or apparatus. Existing Plans and Policies The Public Protection Classification (ISO) rating is a three for all areas served that are located within five road miles of a fire station. All areas served in the Johnson County response district are rated as a class three. The District provides life safety fire inspections in the city of Spring Hill and provides public education programs throughout the District. The District operates under the County’s (Johnson and Miami) ordinances, codes, and plans outside the city of Spring Hill and the Overland Park area served. Johnson County Fire District No. 3. Fire District No. 3 serves Northwestern Johnson County and merged with the De Soto Fire District on January 1, 2010. Technical and Fiscal Resources Fire District No. 3 has two stations with 10 full-time, 17 part-time, and 20 volunteer fire fighters. Fiscal resources are the ability to levy taxes and the ability to incur debt through general obligation bonds to be used on the fire station buildings and the purchase of apparatuses. Existing Plans and Policies The Public Protection Classification (ISO) rating is a six out of 10 in the hydrated areas and a nine rating in the non-hydrated areas of the jurisdiction. The district is engaged in providing fire prevention presentations at USD 232 schools and issues burn permits for residents.

Region L Hazard Mitigation Plan, 2013 Final 2.106
2.3 Leavenworth
2.3 Leavenworth County History
Named after Henry Leavenworth, an officer in the War of 1812, Leavenworth County was formed from free territory on August 30, 1866. Its earliest know inhabitants were the Kansa Indians, although the name of their tribe has been spelled many ways, from Kanza, Canceas and Kaw to Konza. Moving their Nation to the land now known as Manhattan, the Kansas Indians ceded their land to the United States by treaty on June 3, 1825, at which time the Delaware Trust Lands was set up. The last remaining tract of this land was called the Delaware Reserve and was ceded to the United States on May 30, 1860.
The first land occupied or claimed in Kansas by citizens of the United State, after passage of the Kansas-Nebraska act was within the present limits of Leavenworth City. Because of its close proximity to Missouri, which was a pro-slavery state, conflicts and controversy sometimes led to bloodshed.
In 1863, the Kansas State Penitentiary was approved to be built in Lansing by the legislature. Due to lack of funding because of the Civil War, the penitentiary was not outfitted with prisoners until 1868.
In 1875, Fort Leavenworth was chosen as the site for a military prison. This ‘early’ prison housed more than 300 prisoners in a remodeled, supple-depot building. In 1896 it was recommended the current ‘prison’ be replaced and Congress authorized a new federal penitentiary. Interesting to note that in 1897, Warden French marched prisoners every morning two and a half miles from Ft. Leavenworth to the new site of the federal penitentiary to work. This work went on for two and a half decades. In 1903 there was enough space under the new roof to permit the first 418 prisoners to move into the new penitentiary. By 1906 all prisoners were housed at the new facility.
Notable explorers to Leavenworth County were Lewis and Clark as well as Daniel Boone.

Region L Hazard Mitigation Plan, 2013 Final 2.107
2.3.1 Leavenworth County Geography/Topography
Leavenworth is located in the northeastern portion of the State of Kansas. Bounded on the north by Atchison County, northeast by the Missouri River (which serves to separate Kansas from Missouri), the east by Wyandotte County and on the south by the Kansas River (which separates it from Johnson County and Douglas County), and the west by Douglas and Jefferson counties.
Leavenworth County lies totally within the Glaciated Region of the Central Lowlands physiographic province. The glaciated region is characterized by rolling hills and scattered deposits of rocks and boulders transported from other geographic areas as glacial debris.
The Missouri River lies in the northeast corner of the county, with the Kansas River in the extreme southern portion. The Stranger Creek basin is the most significant of the Kansas River tributaries and drains nearly the entire county from north to south. The Missouri River and its tributaries drain the northeastern corner of the County. In the northwest corner lies the highest point of the county at 1,550 feet above sea level and the lowest point of 680 feet above sea level is located along the southern and eastern edges of the county.
The four river basins that hold Leavenworth County are the Missouri River Drainage Basin, Lower Kansas River Drainage Basin, Lower Republican River Drainage Basin, and the Independence/Sugar Creek River Drainage Basin. Along with the 34 streams and creeks located within the county, it’s 9 lakes, and river boundaries, Leavenworth has an issue with flooding. Specifically, where it abuts the border of the Missouri River.
Following is a map of the Leavenworth County planning area:

Region L Hazard Mitigation Plan, 2013 Final 2.108
Figure 2.24. Leavenworth County Planning Area

Region L Hazard Mitigation Plan, 2013 Final 2.109
2.3.2 Leavenworth County Climate
The average rainfall in Leavenworth County is 38.6 inches per year, with the national average being 36.5. Average snowfall is 14.8 inches per year, with the national average being 25 inches.
There are approximately 218 sunny days in the county. The average July high is 90 degrees, and the average January low is 18.1. The comfort index, which is based on humidity during the hot months is a 32 out of 100, with the national average being 44 out of a 100 – higher values being more comfortable.
The aforementioned climate statistics do not account for the severe drought that the State of Kansas has been in for 2 years. As of the end of 2012, Leavenworth County was down 16.45 inches of precipitation, and for year 2012 they were down 6.55 inches from the average.
2.3.3 County Population/Demographics
According to the U.S. Census Bureau, the total population of Leavenworth County in 2010 was 76,227. The population in the County has increased over the past decade by 10.97%. Table 2.35 below shows the population trends for the participating jurisdictions within Leavenworth County:
Table 2.35. Leavenworth County Jurisdiction Population
Jurisdiction 2007 Population 2010 Population Difference 2000 – Leavenworth City 35420 35,251 (169)
Lansing City 10,705 11,265 560 Fairmount Township 4,191 8,788 4,597 Tonganoxie City 2,728 4,996 2,268 Basehor City 2,238 4,613 2,375 High Prairie Township 1,939 2,002 63 Kickapoo Township 1,928 1,770 (158) Reno Township 1,293 1,398 105 Delaware Township 1,027 1,019 (8) Alexandria Township 1,019 882 (137) Linwood City 374 375 1 Easton City 362 253 (109) Bonner Springs (pt) 8 6 (2) Unincorporated 10,395 3,609 (6786) Total County 73,628 76,227 2,599

Region L Hazard Mitigation Plan, 2013 Final 2.110
Bonner Springs’ jurisdictional profile is included under the Wyandotte County section and the De Soto profile is included under the Johnson County profile.
In Table 2.36 are Census Bureau demographic and social characteristics for Jurisdictions within Johnson County.
Table 2.36. Leavenworth County Jurisdictional Demographics
Jurisdiction White % Black or African
American
Hispanic/Latin (Any Race) (%)
Average Per Household (people)
Bachelor Degree or Higher (%)
Leavenworth 84.9 9.7 6.0 2.67 28.7 Leavenworth
74.5 15.1 8.1 2.56 29.6
Lansing City 80.2 13.2 5.1 2.93 29.7 Fairmont
94.8 1.8 3.1 2.73 NA
Tonganoxie
95.2 1.0 3.8 2.6 22.2 Basehor City 94.1 2.5 3.6 2.63 16.2 High Prairie
94.5 1.3 2.4 2.72 NA
Kickapoo
95.8 .7 1.5 2.64 NA Reno
95.6 .9 2.8 2.66 NA
Delaware
93.4 1.0 1.8 2.79 NA Alexandria
96.4 .3 1.1 2.75 NA
Linwood City 92.5 0 6.9 2.70 10.3 Easton City 98.8 .4 1.2 2.64 8.0 Total County 84.9 9.7 6.0 2.67 28.7
According to the U.S. Census Bureau, by gender breakdown, males represent 53.1 percent of the population, and females represent 46.9 percent of the population.
2.3.4 County Economics
INDUSTRY Estimate % Civilian employed population 16 years and over 31,931 74.7 Agriculture, forestry, fishing and hunting, and mining 326 1.0 Construction 2,648 8.3 Manufacturing 2,359 7.4 Wholesale trade 701 2.2 Retail trade 3,713 11.6 Transportation and warehousing, and utilities 1,875 5.9 Information 636 2.0 Finance and insurance, and real estate and rental and leasing 2,204 6.9 Professional, scientific, and management, and administrative and waste management
2,705 8.5
Educational services, and health care and social assistance 7,630 23.9 INDUSTRY Estimate %
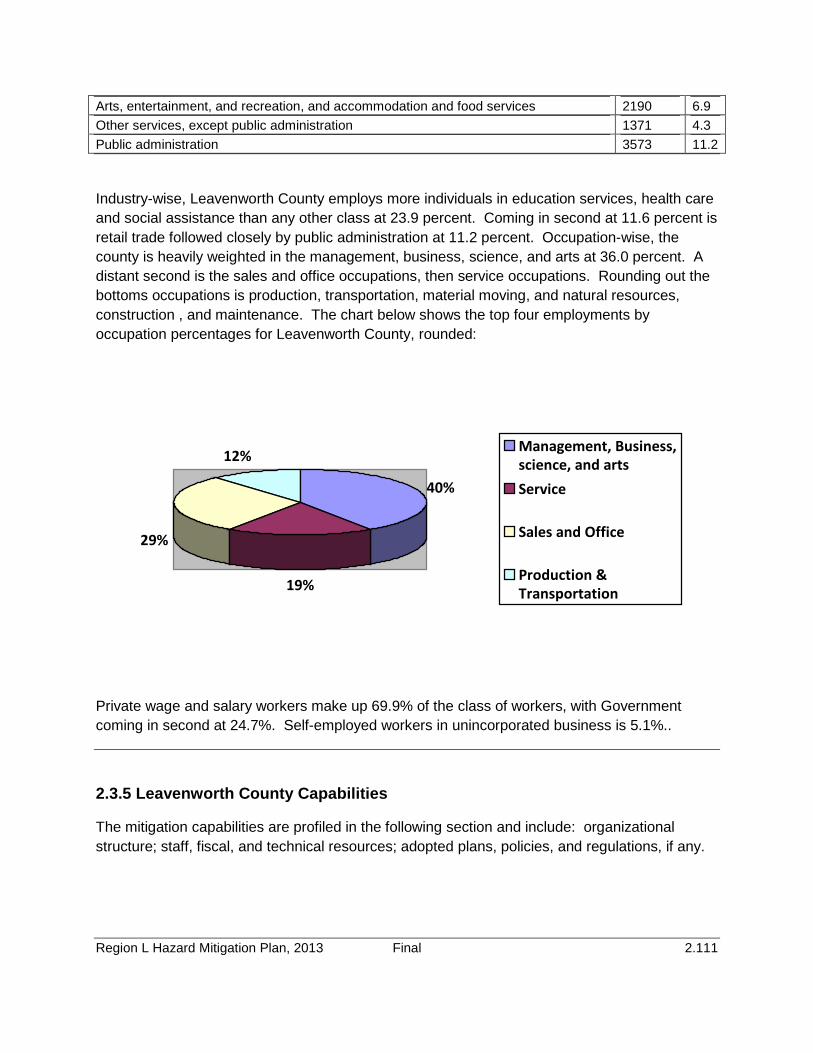
Region L Hazard Mitigation Plan, 2013 Final 2.111
Arts, entertainment, and recreation, and accommodation and food services 2190 6.9 Other services, except public administration 1371 4.3 Public administration 3573 11.2
Industry-wise, Leavenworth County employs more individuals in education services, health care and social assistance than any other class at 23.9 percent. Coming in second at 11.6 percent is retail trade followed closely by public administration at 11.2 percent. Occupation-wise, the county is heavily weighted in the management, business, science, and arts at 36.0 percent. A distant second is the sales and office occupations, then service occupations. Rounding out the bottoms occupations is production, transportation, material moving, and natural resources, construction , and maintenance. The chart below shows the top four employments by occupation percentages for Leavenworth County, rounded:
40%
19%
29%
12% Management, Business,science, and artsService
Sales and Office
Production &Transportation
Private wage and salary workers make up 69.9% of the class of workers, with Government coming in second at 24.7%. Self-employed workers in unincorporated business is 5.1%..
2.3.5 Leavenworth County Capabilities
The mitigation capabilities are profiled in the following section and include: organizational structure; staff, fiscal, and technical resources; adopted plans, policies, and regulations, if any.
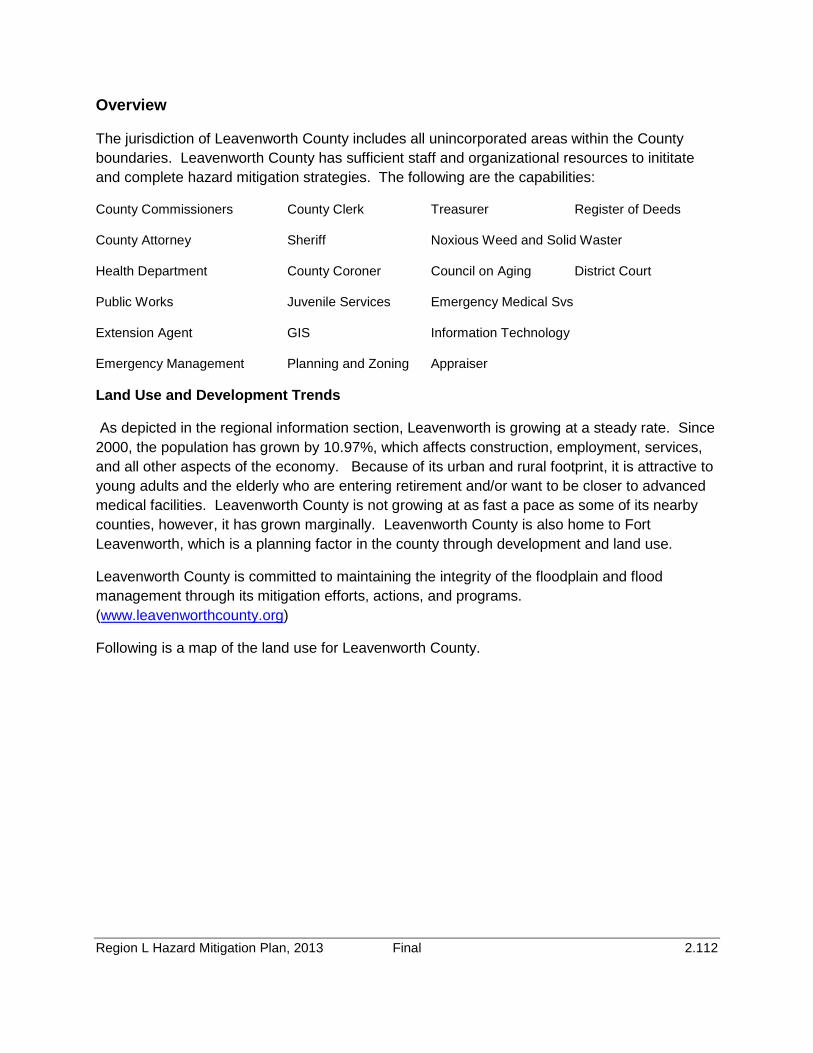
Region L Hazard Mitigation Plan, 2013 Final 2.112
Overview
The jurisdiction of Leavenworth County includes all unincorporated areas within the County boundaries. Leavenworth County has sufficient staff and organizational resources to inititate and complete hazard mitigation strategies. The following are the capabilities:
County Commissioners County Clerk Treasurer Register of Deeds
County Attorney Sheriff Noxious Weed and Solid Waster
Health Department County Coroner Council on Aging District Court
Public Works Juvenile Services Emergency Medical Svs
Extension Agent GIS Information Technology
Emergency Management Planning and Zoning Appraiser
Land Use and Development Trends
As depicted in the regional information section, Leavenworth is growing at a steady rate. Since 2000, the population has grown by 10.97%, which affects construction, employment, services, and all other aspects of the economy. Because of its urban and rural footprint, it is attractive to young adults and the elderly who are entering retirement and/or want to be closer to advanced medical facilities. Leavenworth County is not growing at as fast a pace as some of its nearby counties, however, it has grown marginally. Leavenworth County is also home to Fort Leavenworth, which is a planning factor in the county through development and land use.
Leavenworth County is committed to maintaining the integrity of the floodplain and flood management through its mitigation efforts, actions, and programs. (www.leavenworthcounty.org)
Following is a map of the land use for Leavenworth County.

Region L Hazard Mitigation Plan, 2013 Final 2.113
Figure 2.25. Leavenworth County Land Use Map

Region L Hazard Mitigation Plan, 2013 Final 2.114
Figure 2.26. Leavenworth County Future Land Use Map

Region L Hazard Mitigation Plan, 2013 Final 2.115
Technical and Fiscal Resources
Leavenworth County is included in the definition of the Metro Region, and along with that nomenclature, it has the resources to fund staff resources in planning, engineering, floodplain management, storm water management, emergency management, and GIS services. Table 2.37 depicts Leavenworth County personnel resources in 2013.
Table 2.37. Leavenworth County Administrative and Technical Resources
Personnel Resources Filled(?) Department/Position Building Code Official No Do have a code enforcement Officer Building Inspector No Mapping Specialist (GIS) Yes Engineer Yes Development Planner Yes Public Works Official Yes Public Works Emergency Management
Yes Emergency Management & Homeland Security
NFIP Floodplain Administrator Yes Emergency Management Personnel Resources Filled(?) Department/Position
Bomb Squad Yes Arson Squad Yes Emergency Response Team No Hazardous Materials Expert Yes Local Emergency Planning Committee
Yes
County Emergency Management Commission
No Have a community partners committee
Sanitation Department Yes Transportation Department Yes Economic Development Department
Yes
Housing Department No Historic Preservation No
Fiscally, Leavenworth County has a wide array of funding sources that could help them to achieve the goals of their mitigation actions. These include:
• Capital improvement Project Funds • Levy Taxes for specific purposes • Fees for water, sewer, gas, or electric services (sewer connection fees) • Impact fees for new development (transportation and roads) • Debt through Special Tax Bonds

Region L Hazard Mitigation Plan, 2013 Final 2.116
• Withhold spending in hazard prone areas (by board only).
Existing Plans and Policies
The following table lists the plans and policies that exist in Leavenworth County:
Table 2.38. Leavenworth County Plans and Policies
Element In Use, Yes, No, N/A Comments Planning Capabilities
Comprehensive Plan Yes Capital Improvement Plan Yes City Emergency Operations Plan N/A County Emergency Operations Plan
Yes - 2011
Local Recovery Plan No County Recovery Plan No Do have a COOP plan Debris Management Plan Yes – 2011 Fema approved
Economic Development Plan No Element In Use, Yes, No, N/A Comments
Planning Capabilities Transportation Plan Yes Land-use Plan Yes Flood Mitigation Assistance (FMA) Plan
No
Watershed Plan Yes Stream studies on Stranger Creek and 5 mile creek
Firewise or other fire mitigation plan
No
Critical Facilities Plan No
Other Mitigation Activities
Leavenworth County is proactive in its stance for programs that alleviate the threat of hazards, whether natural, man-made, or technological. The following table depicts various programs that the County uses as a mitigation tool:
Policies/Ordinance Zoning Ordinance Yes Building Code No Floodplain Ordinance Yes Subdivision Ordinance Yes Tree Trimming Ordinance N/A Storm Water ordinance Yes
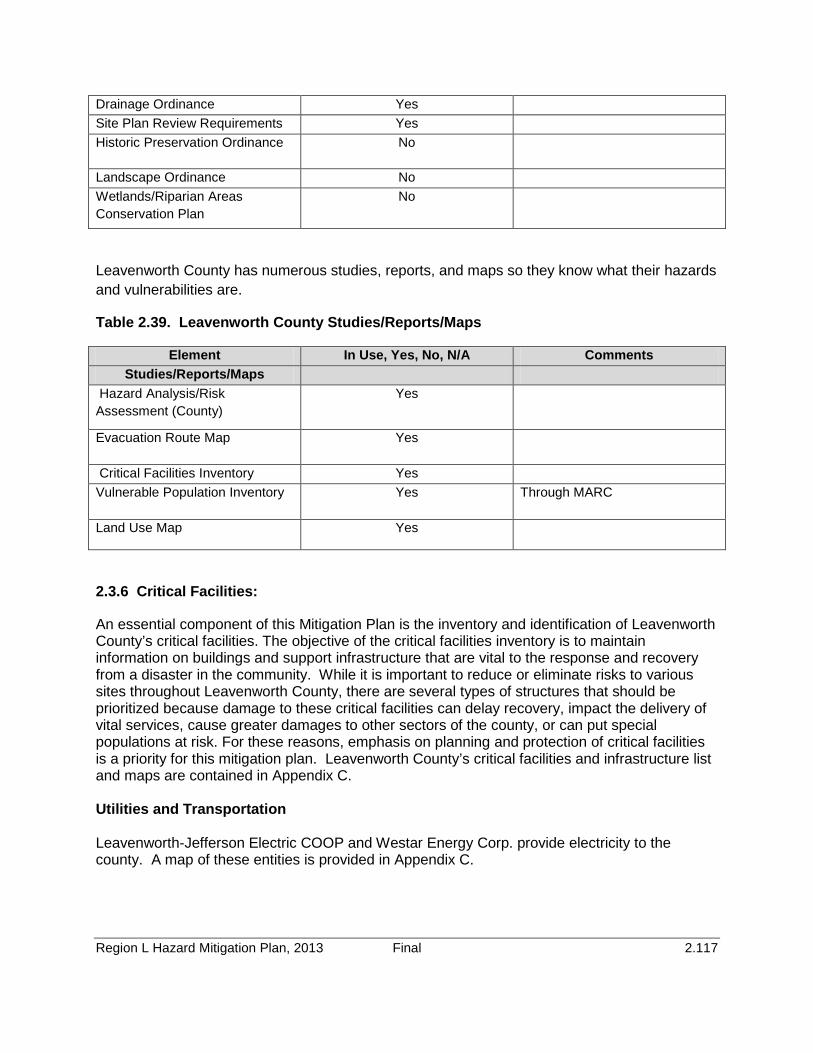
Region L Hazard Mitigation Plan, 2013 Final 2.117
Drainage Ordinance Yes Site Plan Review Requirements Yes Historic Preservation Ordinance No
Landscape Ordinance No Wetlands/Riparian Areas Conservation Plan
No
Leavenworth County has numerous studies, reports, and maps so they know what their hazards and vulnerabilities are.
Table 2.39. Leavenworth County Studies/Reports/Maps
Element In Use, Yes, No, N/A Comments Studies/Reports/Maps
Hazard Analysis/Risk Assessment (County)
Yes
Evacuation Route Map Yes
Critical Facilities Inventory Yes Vulnerable Population Inventory Yes Through MARC
Land Use Map Yes
2.3.6 Critical Facilities:
An essential component of this Mitigation Plan is the inventory and identification of Leavenworth County’s critical facilities. The objective of the critical facilities inventory is to maintain information on buildings and support infrastructure that are vital to the response and recovery from a disaster in the community. While it is important to reduce or eliminate risks to various sites throughout Leavenworth County, there are several types of structures that should be prioritized because damage to these critical facilities can delay recovery, impact the delivery of vital services, cause greater damages to other sectors of the county, or can put special populations at risk. For these reasons, emphasis on planning and protection of critical facilities is a priority for this mitigation plan. Leavenworth County’s critical facilities and infrastructure list and maps are contained in Appendix C. Utilities and Transportation Leavenworth-Jefferson Electric COOP and Westar Energy Corp. provide electricity to the county. A map of these entities is provided in Appendix C.

Region L Hazard Mitigation Plan, 2013 Final 2.118
Water
The Leavenworth Water Department provides water for the Lan Del Water District (which includes the City of Lansing), and six rural water districts surrounding the city of Leavenworth. Water systems in the county include the City of Easton, Ft Leavenworth American Water Ent. Inc., Lan Del Water District, Lansing Correctional Facility, Leavenworth Co. Consolidated RWD 1, Leavenworth Co. RWD 1, 10, 2, 5, 6, 7, 8, 9, Leavenworth Water Department, city of Linwood, Paradise park mobile home court, Public wholesale WSD 6, Suburban Water Co., the City of Tonganoxie, and Heartland Community Church.
Water treatment plants are operated by the Lansing Correctional Facility, City of Lansing, City of Leavenworth, City of Tonganoxie, and Leavenworth Water Works (Kansteiner Plant), Easton, Linwood, and Basehor, Ft. Leavenworth, and the US Federal Penitentiary. Telecommunications Telecommunications for Leavenworth County are provided by Sprint and AT&T. Appendix C contains a map that shows the telecommunications grids. Transportation There are three Federal highways and four State highways that traverse Leavenworth County. Total estimated mileage for state and federal roadways in the county is 108.4 miles. The total estimated mileage for federal, state, and county roads is 1,455.8 miles. A map of this infrastructure can be found in Appendix C. 2.3.7 Other Assets The vulnerability of Leavenworth to disaster also involves inventorying the natural, historic, cultural, and economic assets of the county. This is important for the following reasons: • These types of resources warrant a greater degree of protection due to their unique and irreplaceable nature and contribution to the overall economy. • A proactive stance before a disaster strikes can potentially reduce the damages incurred. • The rules for reconstruction, restoration, rehabilitation, and/or replacement are often complex. • Loss of these economic assets could potentially have severe impacts on a community and its ability to recover from disaster. • Historic resources: There are 34 Leavenworth County properties on the National Register of Historic Places. Information on these properties is provided below:
• Abernathy Furniture Company, 200-210 Seneca St, Leavenworth, 2004 • Angell, A.J., House, 714 S. Broadway, Leavenworth, 1977 • Arch Street Historic District, Bounded by Arch, Pine, S. Second, and S. Third St,
Leavenworth, 2002
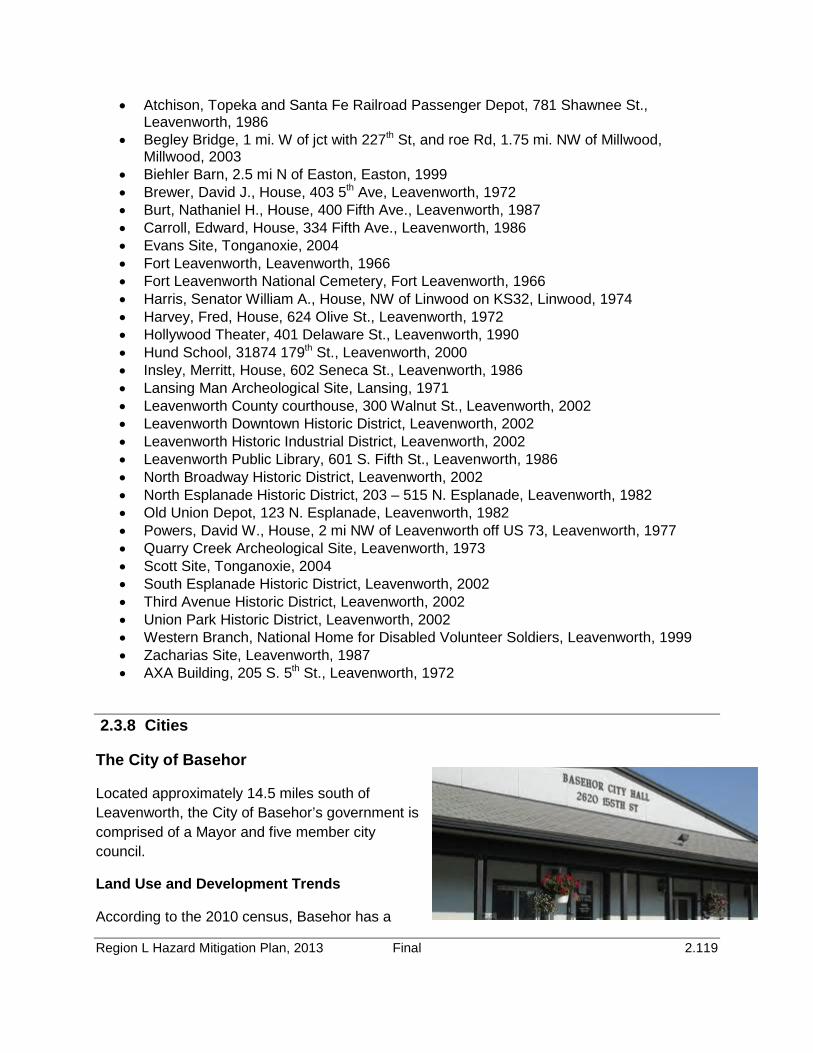
Region L Hazard Mitigation Plan, 2013 Final 2.119
• Atchison, Topeka and Santa Fe Railroad Passenger Depot, 781 Shawnee St., Leavenworth, 1986
• Begley Bridge, 1 mi. W of jct with 227th St, and roe Rd, 1.75 mi. NW of Millwood, Millwood, 2003
• Biehler Barn, 2.5 mi N of Easton, Easton, 1999 • Brewer, David J., House, 403 5th Ave, Leavenworth, 1972 • Burt, Nathaniel H., House, 400 Fifth Ave., Leavenworth, 1987 • Carroll, Edward, House, 334 Fifth Ave., Leavenworth, 1986 • Evans Site, Tonganoxie, 2004 • Fort Leavenworth, Leavenworth, 1966 • Fort Leavenworth National Cemetery, Fort Leavenworth, 1966 • Harris, Senator William A., House, NW of Linwood on KS32, Linwood, 1974 • Harvey, Fred, House, 624 Olive St., Leavenworth, 1972 • Hollywood Theater, 401 Delaware St., Leavenworth, 1990 • Hund School, 31874 179th St., Leavenworth, 2000 • Insley, Merritt, House, 602 Seneca St., Leavenworth, 1986 • Lansing Man Archeological Site, Lansing, 1971 • Leavenworth County courthouse, 300 Walnut St., Leavenworth, 2002 • Leavenworth Downtown Historic District, Leavenworth, 2002 • Leavenworth Historic Industrial District, Leavenworth, 2002 • Leavenworth Public Library, 601 S. Fifth St., Leavenworth, 1986 • North Broadway Historic District, Leavenworth, 2002 • North Esplanade Historic District, 203 – 515 N. Esplanade, Leavenworth, 1982 • Old Union Depot, 123 N. Esplanade, Leavenworth, 1982 • Powers, David W., House, 2 mi NW of Leavenworth off US 73, Leavenworth, 1977 • Quarry Creek Archeological Site, Leavenworth, 1973 • Scott Site, Tonganoxie, 2004 • South Esplanade Historic District, Leavenworth, 2002 • Third Avenue Historic District, Leavenworth, 2002 • Union Park Historic District, Leavenworth, 2002 • Western Branch, National Home for Disabled Volunteer Soldiers, Leavenworth, 1999 • Zacharias Site, Leavenworth, 1987 • AXA Building, 205 S. 5th St., Leavenworth, 1972
2.3.8 Cities
The City of Basehor
Located approximately 14.5 miles south of Leavenworth, the City of Basehor’s government is comprised of a Mayor and five member city council.
Land Use and Development Trends
According to the 2010 census, Basehor has a

Region L Hazard Mitigation Plan, 2013 Final 2.120
population of 4,613 people, an increase of 2,375 people since 2007. Comprised of 6.68 square miles, the population density of Basehor is 691 people per square mile. Extrapolating Basehor’s growth rate, Basehor has the potential to grow to 15,000 or more in the next 20 years with a footprint of 15 square miles. Basehor’s growth is limited to K-7 going East, Lansing’s city limits North, Tonganoxie’s city limits west, and I-70 towards the south. In the near term, growth will continue along K-7 and US-24/40.The city has in development the plans for a new city hall and police station that includes a community room. The following maps show Basehor’s current zoning, and future land use for the city. www.cityofbasehor.org.
Figure 2.27. City of Basehor Current Zoning Map

Region L Hazard Mitigation Plan, 2013 Final 2.121
Figure 2.28. City of Basehor Future Land Use

Region L Hazard Mitigation Plan, 2013 Final 2.122
Technical and Fiscal Resources
Basehor is a small community that utilized the county for many of their technical resources such as the Emergency Management Coordinator and NFIP Floodplain Administrator.
The Fiscal resources that the City can use in order to fund mitigation activities, include:
• The Community Development Block Grants • Capital Improvements Funding • Taxes for Specific Purposes • Fees for Solid Waste and Sewer Services • Fees for New Development • Debt through General Obligation Bonds
Basehor joined the NFIP on December 7, 1984 and has maintained its good standing.
Other Mitigation Activities
The City of Basehor has developed plans to include a saferoom in their new city hall and police station when construction begins. This will be a community saferoom for the whole populace.
Property Valuation Table 2.45 below depicts the appraised values from the 2013 Abstract of Appraised and Assessed Values report. Table 2.45. Appraised Property Valuation, 2013
Appraised Property Valuation Building Type Real Estate Structures ($) Median Home Value
(2011)($) Residential 267,178,900 $183,438
Agricultural 3,103,160
Commercial/Industrial 16,599,130
Not for Profit 0
Total $286,881,190 Source: Leavenworth County Assessor Office/U.S. Census Bureau

Region L Hazard Mitigation Plan, 2013 Final 2.123
City of Easton Easton is located approximately 13.5 miles northwest of Leavenworth, and is mainly a rural area. It has a Mayor and City Council style of government.
Land Use and Development Trends
According to the 2010 census, Easton has a population of 253 people, a decrease of 109 since 2007. The land area is 0.1 square mile, and the population density is 10 per square mile. New development is not at the forefront for the city, mainly due to the loss of population.
Figure 2.28a. City of Easton Land Use Map
Technical and Fiscal Resources
Easton is a small city and staffing is sparse. They do have a city clerk who also serves as the NFIP Floodplain Administrator. The County supplements staffing services for the city.
Fiscal resources are available to the City for funding of mitigation activities:
• Community Development Block Grants • Capital Improvements Funding • Taxes for Specific Purposes • Fees for water, sewer, gas, or electric services • Debt through General Obligation Bonds • Debt through Special Tax Bonds • Debt through Private Activities
Existing Plans and Policies

Region L Hazard Mitigation Plan, 2013 Final 2.124
Easton has been a member of the NFIP since November 1, 1979.
• Floodplain Ordinance • National Flood Insurance Program
Other Mitigation Activities There have been no mitigation activities since the last plan, however, the City of Easton is pursuing funding for a new water plant and the replacement of distribution lines. Property Valuation Table 2.47 below depicts the appraised values from the 2013 Abstract of Appraised and Assessed Values report. Table 2.47. Appraised Property Valuation, 2013
Appraised Property Valuation Building Type Real Estate Structures ($) Median Home Value
(2011)($) Residential 3,518,200 $56,031
Agricultural 9,030
Commercial/Industrial 587,380
Not for Profit 0
Total $4,114,610 Source: Leavenworth County Assessor Office/U.S. Census Bureau
City of Lansing
The City of Lansing is the second largest city in Leavenworth County and is located approximately five miles south of the City of Leavenworth. Lansing is a semi-urban city.
The City of Lansing’s government is made up of a Mayor and 8 member City Council, two from each ward. The Mayor is elected at large.
Land Use and Development Trends
According to the 2010 census, the City of Lansing has a population of 11,265 people, a gain of 560 people since the 2007 census. The land area is 8.6 square miles, and the population density is 1,310 people per square mile. Primary growth is 22 S.F./ 30 M.F 90% located west of Main Street and South of 4-H. Mixed Use and Retail and Office commercial growth potential

Region L Hazard Mitigation Plan, 2013 Final 2.125
along the K-7 corridor and Eisenhower Road Corridor within the MSOD boundary. The city is committed to to maintain the following guidelines: (www.lansing.ks.us)
• Open space, greenways and pedestrian connections within developments, between adjacent developments, and throughout the community;
• Business developments that are aesthetic and incorporate high quality building materials, appropriate building orientation, and parking designed to minimize impact on the overall development;
• Diverse development opportunities for residential neighborhoods, including cluster housing and rural residential; and significant landscape and street tree amenities throughout the community.
• Anchor business districts that complement existing and future businesses and incorporate uniform architectural and landscaping themes.
• Commercial services that are easily and safely accessible and attract residents and visitors to the area.
• A range of commercial services that satisfies the full spectrum of consumer requirements.
• Aggressive control of commercial planning and development programs in order to facilitate and enhance future growth.
Maintaining open and green space is important to the current and future land use, and ensuring development includes conservation easements or land dedications that protect valuable
natural resources (flood plain, excessive slopes, trees) so that those areas can continue to benefit the entire community.
The map below depicts the future land use for the city.

Region L Hazard Mitigation Plan, 2013 Final 2.126
Figure 2.29. City of Lansing Future Land Use

Region L Hazard Mitigation Plan, 2013 Final 2.127
Technical and Fiscal Resources
The City of Lansing is a fully functioning entity and has all the technical resources typical of a city. Following are these staff and technical resources:
Table 2.42. City of Lansing Technical Resources
Personnel Resources Yes/No Comments Building Code Official Yes Building Inspector Yes GIS Yes Engineer Yes Contract Development Planner Yes Public Works Official Yes Emergency Manager No NFIP Floodplain Administrator
Yes
Economic Development Department
Yes
The following are the fiscal resources that can be used to fund potential mitigation activities:
• Capital Improvements Funding • Taxes for Specific Purposes • Fees for sewer services • Impact Fees for New Development • Debt through General Obligation Bonds • Debt Through Special Tax Bonds
Existing Plans and Policies In addition to being a member in good standing with the NFIP since August 15, 1980, Lansing also maintains the following plans and policies:
• Comprehensive Plan • Capital Improvement Plan • Emergency Operations Plan • County Emergency Operations Plan • Transportation Plan • Land-use Plan • Zoning Ordinance • Building code • Floodplain Ordinance • Subdivision Ordinance • Storm Water Ordinance • Drainage ordinance

Region L Hazard Mitigation Plan, 2013 Final 2.128
Other Mitigation Activities The City of Lansing has ongoing public education programs for water use, fire safety, environmental education, Community Rating System, flood awareness, flood safety, etc. The City also has a storm water detention requirement for new development that has been implemented. Property Valuation Table 2.43 below depicts the appraised values from the 2013 Abstract of Appraised and Assessed Values report. Table 2.43. Appraised Property Valuation, 2013
Appraised Property Valuation Building Type Real Estate Structures ($) Median Home Value
(2011)($) Residential 403,454,660 163,900
Agricultural 6,966,620
Commercial/Industrial 34,161,181
Not for Profit 9,050
Total $444,591,511 Source: Leavenworth County Assessor Office/U.S. Census Bureau
City of Leavenworth
The City of Leavenworth is a semi-urban community, as well as the county seat. The City of Leavenworth’s government consists of a Mayor and five member Commission.
Land Use and Development Trends
According to the 2010 census, the City of Leavenworth has a population of 32,251 people, a gain of 167 people since 2007. The land area is 23.5 square miles, with a population density of 1,372 people per square mile. Current land use in the city shows older residential single-family homes which surround the original central business district. Growth has primarily occurred to the south in the form of commercial land-uses and to the south and west for residential and additional uses.
The City of Leavenworth has a Comprehensive Plan that lays out the ground work for the redevelopment of its downtown area, and includes the northeastern area of the city. A city-wide integrating bicycle and pedestrian arterials into the city’s existing transportation mix is on-schedule. Future land use avoids environmentally sensitive areas, high slope areas, or other

Region L Hazard Mitigation Plan, 2013 Final 2.129
areas possessing high development risk. The strategies that the City of Leavenworth have adopted are intended to improve the visual appearance of the gateway including greater setbacks, native vegetation, a community trail, welcome center, and Metropolitan Avenue bridge improvements.
Land use action steps for the City of Leavenworth can be found at www.lvks.org in its entirety, however a few are shown below:
1. Promote in-fill redevelopment over growth into new areas.
2. Conduct a thorough review of city codes, subdivision regulations, and zoning ordinances and revise all ineffective, obsolete, or inconsistent requirements and definitions.
3. Develop and adopt new street design and storm water management standards.
4. Adopt stream setback standards.
5. Promote and allow for public input.
The follow figure shows the future land use map for the City of Leavenworth.

Region L Hazard Mitigation Plan, 2013 Final 2.130
Figure 2.30. City of Leavenworth Future Land Use
Technical and Fiscal Resources
The City of Leavenworth is a fully functioning entity and has all the technical resources typical of a city. The following table lists the staff and technical resources.
Table 2.40. City of Leavenworth Technical Resources
Personnel Resources Yes/No Comments Building Code Official Yes Building Inspector Yes GIS Yes Engineer Yes
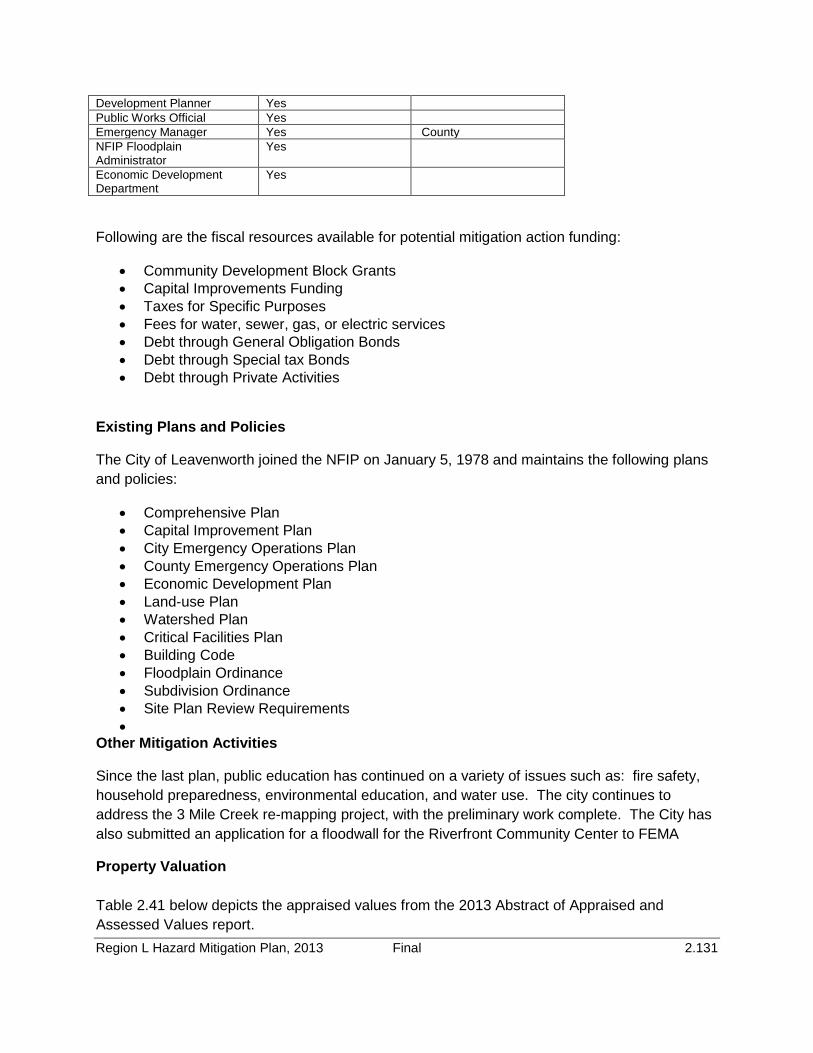
Region L Hazard Mitigation Plan, 2013 Final 2.131
Development Planner Yes Public Works Official Yes Emergency Manager Yes County NFIP Floodplain Administrator
Yes
Economic Development Department
Yes
Following are the fiscal resources available for potential mitigation action funding:
• Community Development Block Grants • Capital Improvements Funding • Taxes for Specific Purposes • Fees for water, sewer, gas, or electric services • Debt through General Obligation Bonds • Debt through Special tax Bonds • Debt through Private Activities
Existing Plans and Policies
The City of Leavenworth joined the NFIP on January 5, 1978 and maintains the following plans and policies:
• Comprehensive Plan • Capital Improvement Plan • City Emergency Operations Plan • County Emergency Operations Plan • Economic Development Plan • Land-use Plan • Watershed Plan • Critical Facilities Plan • Building Code • Floodplain Ordinance • Subdivision Ordinance • Site Plan Review Requirements •
Other Mitigation Activities
Since the last plan, public education has continued on a variety of issues such as: fire safety, household preparedness, environmental education, and water use. The city continues to address the 3 Mile Creek re-mapping project, with the preliminary work complete. The City has also submitted an application for a floodwall for the Riverfront Community Center to FEMA
Property Valuation Table 2.41 below depicts the appraised values from the 2013 Abstract of Appraised and Assessed Values report.
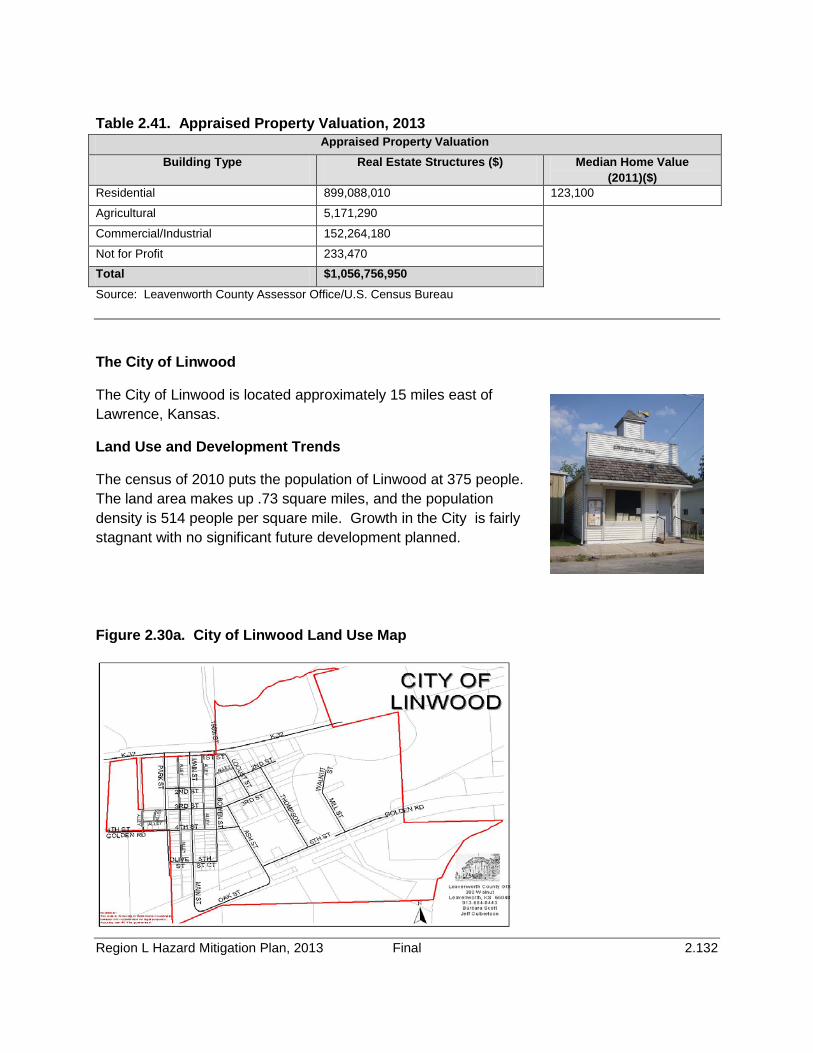
Region L Hazard Mitigation Plan, 2013 Final 2.132
Table 2.41. Appraised Property Valuation, 2013
Appraised Property Valuation Building Type Real Estate Structures ($) Median Home Value
(2011)($) Residential 899,088,010 123,100
Agricultural 5,171,290
Commercial/Industrial 152,264,180
Not for Profit 233,470
Total $1,056,756,950 Source: Leavenworth County Assessor Office/U.S. Census Bureau
The City of Linwood
The City of Linwood is located approximately 15 miles east of Lawrence, Kansas.
Land Use and Development Trends
The census of 2010 puts the population of Linwood at 375 people. The land area makes up .73 square miles, and the population density is 514 people per square mile. Growth in the City is fairly stagnant with no significant future development planned.
Figure 2.30a. City of Linwood Land Use Map

Region L Hazard Mitigation Plan, 2013 Final 2.133
Technical and Fiscal Resources
The City of Linwood has staff on its payroll to ensure mitigation projects have oversight. They are:
• Building Code Official • Mapping Specialist (GIS) • Engineer • Public Works Official • Emergency Management Coordinator • NFIP Floodplain Administrator • Emergency Response Team
Linwood also has financial resources available in order to help fund mitigation projects:
• Community Development Block Grants • Capital Improvements Funding • Taxes for Specific Purposes • Fees for water, sewer, gas, or electric services • Debt through General Obligation Bond
Existing Plans and Policies Linwood joined the NFIP on August 1, 1979. The following plans and policies are maintained by the city:
• Comprehensive plan • Capital Improvement Plan • City Emergency Operations Plan • County Emergency Operations Plan • Flood Mitigation Assistance Plan • Watershed plan • Firewise or other fire mitigation Plan • Critical Facilities Plan • Zoning Ordinance • Building Code • Floodplain Ordinance • Subdivision Ordinance
Other Mitigation Activities None Property Valuation Table 2.46 below depicts the appraised values from the 2013 Abstract of Appraised and Assessed Values report.
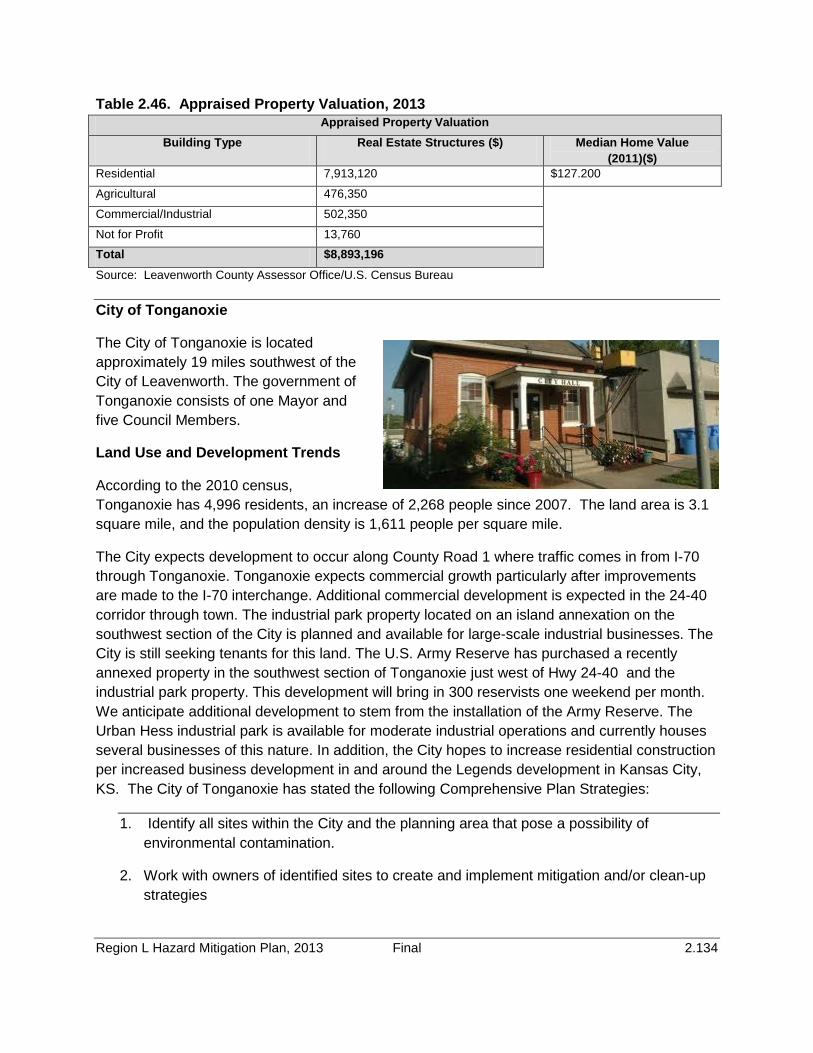
Region L Hazard Mitigation Plan, 2013 Final 2.134
Table 2.46. Appraised Property Valuation, 2013 Appraised Property Valuation
Building Type Real Estate Structures ($) Median Home Value (2011)($)
Residential 7,913,120 $127.200
Agricultural 476,350
Commercial/Industrial 502,350
Not for Profit 13,760
Total $8,893,196 Source: Leavenworth County Assessor Office/U.S. Census Bureau
City of Tonganoxie
The City of Tonganoxie is located approximately 19 miles southwest of the City of Leavenworth. The government of Tonganoxie consists of one Mayor and five Council Members.
Land Use and Development Trends
According to the 2010 census, Tonganoxie has 4,996 residents, an increase of 2,268 people since 2007. The land area is 3.1 square mile, and the population density is 1,611 people per square mile.
The City expects development to occur along County Road 1 where traffic comes in from I-70 through Tonganoxie. Tonganoxie expects commercial growth particularly after improvements are made to the I-70 interchange. Additional commercial development is expected in the 24-40 corridor through town. The industrial park property located on an island annexation on the southwest section of the City is planned and available for large-scale industrial businesses. The City is still seeking tenants for this land. The U.S. Army Reserve has purchased a recently annexed property in the southwest section of Tonganoxie just west of Hwy 24-40 and the industrial park property. This development will bring in 300 reservists one weekend per month. We anticipate additional development to stem from the installation of the Army Reserve. The Urban Hess industrial park is available for moderate industrial operations and currently houses several businesses of this nature. In addition, the City hopes to increase residential construction per increased business development in and around the Legends development in Kansas City, KS. The City of Tonganoxie has stated the following Comprehensive Plan Strategies:
1. Identify all sites within the City and the planning area that pose a possibility of environmental contamination.
2. Work with owners of identified sites to create and implement mitigation and/or clean-up strategies

Region L Hazard Mitigation Plan, 2013 Final 2.135
3. Revise regulations to establish zoning strategies to strictly regulate uses with the city that may cause a risk to the public health and welfare.
4. Idenfify areas to protect, including, but not limited to, flood hazard areas, wetlands, prairie grasslands, ponds, and drainage ways, and areas containing steep slopes with soils unsuitable for development.
5. Continue to limit or restrict development in areas highly susceptible to irreparable damage.
6. Identify areas with quality natural vegetation that should be protected withing the city and planning area.
7. Protecyt important existing hydrologic feathrues such as the 100-year flood plain to restrict growth that harms the environment.
8. Review all development plans using the Stormwater Detention Plan.
9. Create Comprehensive Stormwater Management Plan for the City.
10. Review and revise Floodplain Plan every five years.
The City of Tonganoxie’s strategies and objectives can be found in its entirety at www.tonganoxie.org.
The following maps show the current Land Usage and the Future Land Usage for the City of Tonganoxie.

Region L Hazard Mitigation Plan, 2013 Final 2.136
Figure 2.31. City of Tonganoxie Current Land Use

Region L Hazard Mitigation Plan, 2013 Final 2.137
Figure 2.32. City of Tonganoxie Future Land Use

Region L Hazard Mitigation Plan, 2013 Final 2.138
Technical and Fiscal Resources
Tonganoxie is a small city that has the staff needed to oversee mitigation activities as well as day-to-day business. Following are the positions on staff:
• Building Code Official • Building Inspector • Engineer • Development Planner • Public Works Official • Emergency Management Coordinator • NFIP Floodplain Administrator • County Emergency Management Commission
The Fiscal resources that the City can use in order to fund mitigation activities, include:
• The Community Development Block Grants • Capital Improvements Funding • Taxes for Specific Purposes • Fess for Water and Sewer Services • Fees for New Development • Debt through General Obligation Bonds • Debt Through Special Tax Bonds • Withhold Spending in Hazard Prone Areas
Existing Plans and Policies Tonganoxie joined the NFIP on November 1, 1979 and has the following plans and policies in place:
• Comprehensive Plan • Capital Improvement Plan • County Emergency Operations Plan • County Recovery Plan • Economic Development Plan • Transportation Plan • Land-use Plan • Watershed Plan • Firewise or other fire mitigation Plan • Zoning Ordinance • Floodplain Ordinance • Subdivision Ordinance
Other Mitigation Activities The City of Tonganoxie continues with its public outreach programs such as the fire pup program for fire prevention. They have also received a firefighter grant through FEMA/DHS –

Region L Hazard Mitigation Plan, 2013 Final 2.139
critical facilities fire station upgrade generator and smoke exhaust removal. Another grant in 1993 allowed the city to do an acquisition of a mobile home park for flood mitigation. Property Valuation Table 2.44 below depicts the appraised values from the 2013 Abstract of Appraised and Assessed Values report. Table 2.44. Appraised Property Valuation, 2013
Appraised Property Valuation Building Type Real Estate Structures ($) Median Home Value
(2011)($) Residential 175,617,330 149,500
Agricultural 1,627,430
Commercial/Industrial 17,582,310
Not for Profit 37,760
Total $194,864,830 Source: Leavenworth County Assessor Office/U.S. Census Bureau 2.3.9 Unified School Districts Leavenworth County has six Unified School Districts and the University of St. Mary’s. Following are the profiles for each one. Figure 2.7 on the next page shows the district lines.

Region L Hazard Mitigation Plan, 2013 Final 2.140
Figure 2.33. Leavenworth County Unified School Districts
USD 207 Fort Leavenworth USD 207 serves Fort Leavenworth Army Post in Leavenworth County. Enrollment for the 2012 – 2013 school year is 2,224 students. The district consists of three elementary schools, one middle school, and zero high schools. Senior high school students attend the Leavenworth High School, USD453.
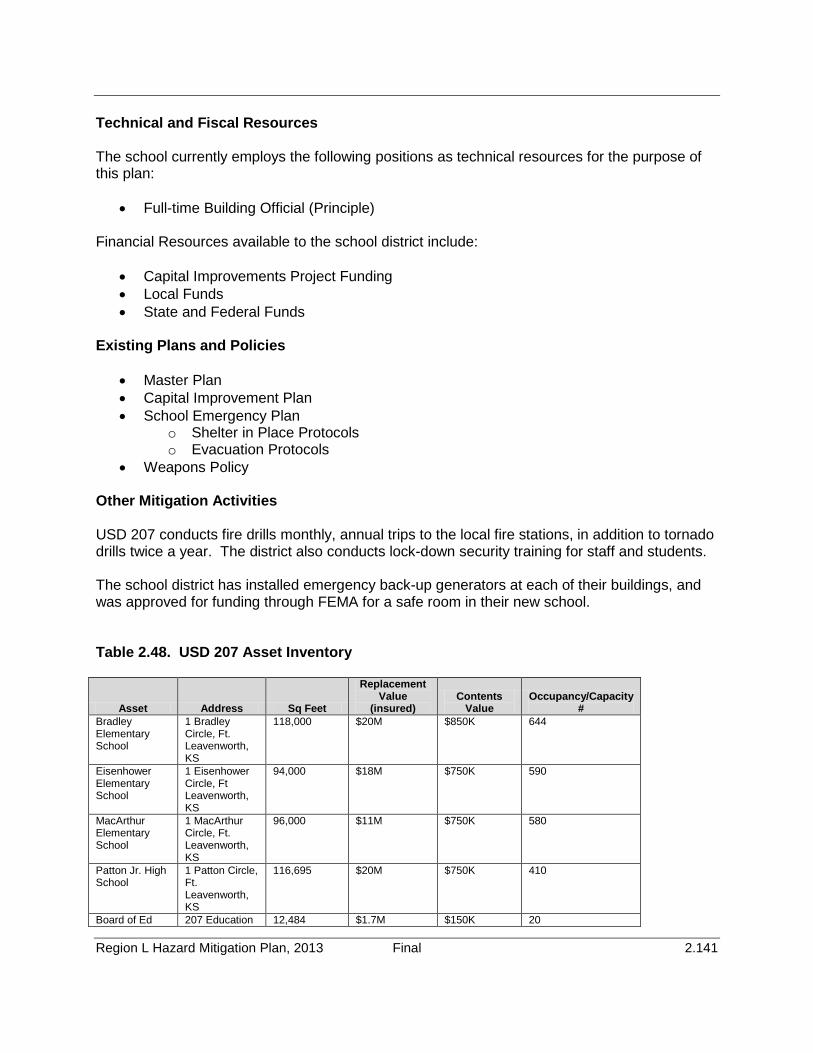
Region L Hazard Mitigation Plan, 2013 Final 2.141
Technical and Fiscal Resources The school currently employs the following positions as technical resources for the purpose of this plan:
• Full-time Building Official (Principle) Financial Resources available to the school district include:
• Capital Improvements Project Funding • Local Funds • State and Federal Funds
Existing Plans and Policies
• Master Plan • Capital Improvement Plan • School Emergency Plan
o Shelter in Place Protocols o Evacuation Protocols
• Weapons Policy Other Mitigation Activities USD 207 conducts fire drills monthly, annual trips to the local fire stations, in addition to tornado drills twice a year. The district also conducts lock-down security training for staff and students. The school district has installed emergency back-up generators at each of their buildings, and was approved for funding through FEMA for a safe room in their new school. Table 2.48. USD 207 Asset Inventory
Asset Address Sq Feet
Replacement Value
(insured) Contents
Value Occupancy/Capacity
# Bradley Elementary School
1 Bradley Circle, Ft. Leavenworth, KS
118,000 $20M $850K 644
Eisenhower Elementary School
1 Eisenhower Circle, Ft Leavenworth, KS
94,000 $18M $750K 590
MacArthur Elementary School
1 MacArthur Circle, Ft. Leavenworth, KS
96,000 $11M $750K 580
Patton Jr. High School
1 Patton Circle, Ft. Leavenworth, KS
116,695 $20M $750K 410
Board of Ed 207 Education 12,484 $1.7M $150K 20

Region L Hazard Mitigation Plan, 2013 Final 2.142
Central Office Way, Ft. Leavenworth, KS
Maintenance & Transportation Facility
207 Warehouse Road, Ft. Leavenworth, KS
21,769 $3.7M $20K 25
Total $74.4M $3.27M 2269
USD 449 Easton USD 449 serves 117 square miles in Leavenworth County. Enrollment for the 2012 – 2013 school year is 668 students and consists of one elementary school, one middle school, and one high school. The District also operates a Vocational Education program for grades 9 – 12 that consists of curriculums in the Industrial Arts and Vocational Agriculture. Technical and Fiscal Resources The school currently employees the following positions as technical resources for the purpose of this plan:
• Full-time Building Official – superintendent Financial resources available to the district to help fund mitigation activities include:
• Capital Improvements Project Funding • Local Funds • General Obligation Bonds
Existing Plans and Policies The following plans and policies are in place at USD 449:
• Master Plan • Capital Improvement Plan • School Emergency Plan
o Shelter in Place Protocols o Evacuation Protocols
• Weapons Policy Other Mitigation Activities

Region L Hazard Mitigation Plan, 2013 Final 2.143
USD 449 conducts fire and tornado drills once a month, in addition to lock-down security training for all staff and students. Also, the County Sheriff Office conducts emergency preparedness drills in all the schools. Table 2.49. USD449 Asset Inventory
Asset Address Sq Feet Replacement
Value (insured) Contents Value Occupancy/Capacity # Pleasant Ridge High School
32500 Easton Rd. Easton, KS
72,530 $9M $1.7M 275
Pleasant Ridge Middle School
32504 Easton Rd. Easton, KS
50,000 $6.5M $800K 188
Asset Address Sq Feet Replacement
Value (insured) Contents Value Occupancy/Capacity # Pleasant Ridge Elementary
20753 Easton Rd., Easton, KS
60,892 $9.2M $1M 270
Vocation Education Bldg
32501 Easton Rd., Easton, KS
8,500 $1.2M $65K 30
Board of Education Office
32502 Easton Rd., Easton, KS
2,100 $78K $64K 3
Total $25,978,000 $3,629,000 766 USD 453 Leavenworth USD 453 services the City of Leavenworth. Enrollment for the 2012-2013 school year is 3,539 students and consists of four elementary schools, one middle school, and one high school. Technical and Fiscal Resources The school district currently employs the following positions as technical resources for the purposes of this plan:
• Full-time Building Official (Principal) • Emergency Manager (Director of Support Services) • Public Information Officer (Director of Public Relations)
Financial resources available to the district to help fund mitigation activities include the following:
• Capital Improvements Project Funding • Local Funds • General Obligation Bonds • Private Activities/Donations

Region L Hazard Mitigation Plan, 2013 Final 2.144
• State and Federal Funds Existing Plans and Policies The plans and policies in place for USD 453 include the following:
• Master Plan • Capital Improvement Plan • Weapons Policy • School emergency Plan
o Shelter in place protocols o Evacuation protocols
Other Mitigation Activities Fire drills are conducted on a monthly basis. Tornado drills are conducted three times each year, and a Bus Evacuation drill is conducted once a year. In addition, USD 453 practices intruder drills and Emergency Medical drills. Lockdown security training is provided for staff and students, as well as ongoing public education for water use, fire safety, household preparedness and environmental education. All buildings are equipped with intercom systems and the newly renovated buildings have new alert tones included. Other mitigation activities include new safe rooms being added to renovated buildings and a new elementary school. Asset Inventory Table 2.50. USD 453 Asset Inventory
Asset Address Replacement Value (insured)
High School 2012 10th Ave 142,569,653
West Junior High School 1901 Spruce 10,400,000
Anthony Elementary 570 Evergreen 14,000,000
David Brewer Elementary 401 N. 17th St 14,000,000
Lawson Elementary 820 N. 5th St. 14,000,000 Nettie Hartnett Elementary Bett 1000 3rd Ave 8,033,000 Service Center 401 S. 3rd St 546,250
Total 152,069,653 USD 458 Basehor-Linwood
USD 458 services the Cities of Basehor and Linwood. Enrollment for the 2012-2013 school year is 2,200 students and consists of three elementary schools, one intermediate school, one middle school, and one high school. Technical and Fiscal Resources

Region L Hazard Mitigation Plan, 2013 Final 2.145
The school district currently employs the following positions as technical resources for the purpose of this plan:
• Full-time Building Official (Principals) • Public Information Officer (District Office)
The financial resources available to the district to help fund mitigation activities include the following:
• Capital Improvements Project Funding • Local Funds • Private Activities/Donations • State and Federal Funds
Existing Plans and Policies The plans and policies in place for USD 458 include the following:
• Weapons Policy • School Emergency Plan
o Shelter in Place Protocols o Evacuation Protocols
Other Mitigation Activities Fire drills are conducted on a monthly basis, and tornado drills are performed 3 to 4 times per year. The district has a public address system and is equipped with NOAA weather radios. Lock-down security training is conducted for the staff and students. Table 2.51. USD458 Asset Inventory
Asset Address Sq Feet Replacement
Value (insured) Contents Value Occupancy/Capacity # Basehor-Linwood High School
2108 N. 155th St 130,000 $40M $1M 900
Basehor-Linwood Middle School
15900 Conley Road
110,000 $25M $1M 750
Basehor Elementary
15602 Leavenworth Rd.
50,000 $15M $500K 415
Basehor Intermediate
15241 Basehor Blvd.
53,000 $15M $700K 400
Glenwood Ridge Elementary
17550 157th Terrace
50,000 $15M $700K 400
Linwood Elementary
215 Park Street Linwood
75,000 $12M $500K 200
Total $122,000,000 $4,400,000 3065

Region L Hazard Mitigation Plan, 2013 Final 2.146
USD 464 Tonganoxie USD 464 serves the cities of Tonganoxie, and parts of Linwood, Basehor, Lawrence, and McLouth. Enrollment for the 2012-2013 school year is 1,999 students and consists of one elementary school, one middle school, and one high school that is divided between the east and the west. Technical and Fiscal Resources Currently the school has the following staffed positions as technical resources for the purpose of this plan:
• Full-time Building Official (Principals) • Emergency Manager • Grant Writer
Fiscal resources available to fund mitigation initiatives include:
• Capital Improvements Project Funding • Local Funds • General Obligation Bonds • Special Tax Bonds • State and Federal Funds •
Existing Plans and Policies The following plans and policies are currently in place at USD 464:
• Master Plan • Capital Improvement Plan • Weapons Policy • School Emergency Plan
o Shelter in Place Protocols o Evacuation Protocols
Other Mitigation Activities The school district conducts fire and tornado drills once a month in addition to conducting lock-down security training for all staff and students. They are equipped with a public address system, video surveillance, fire alarms, and do have weather radios. The school district is currently in the process of building a covered walkway between the east and west high school buildings. Table 2.52. USD 464 Asset Inventory
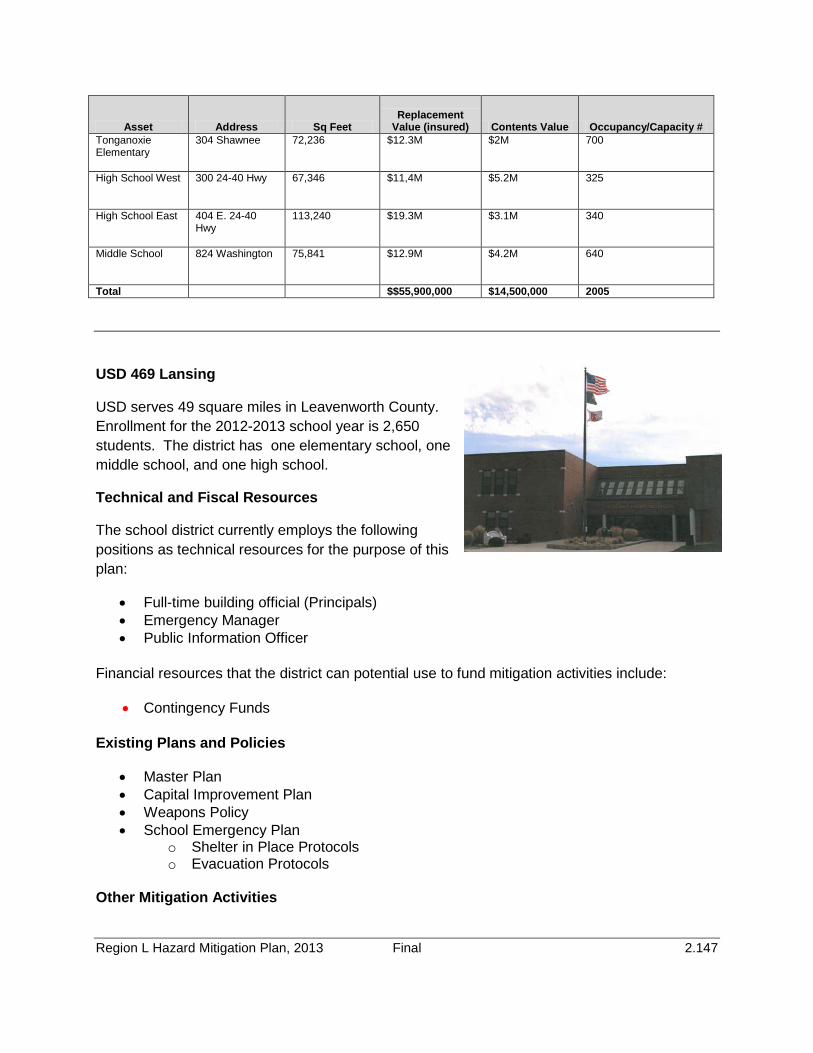
Region L Hazard Mitigation Plan, 2013 Final 2.147
Asset Address Sq Feet Replacement
Value (insured) Contents Value Occupancy/Capacity # Tonganoxie Elementary
304 Shawnee 72,236 $12.3M $2M 700
High School West 300 24-40 Hwy 67,346 $11,4M $5.2M 325
High School East 404 E. 24-40 Hwy
113,240 $19.3M $3.1M 340
Middle School 824 Washington 75,841 $12.9M $4.2M 640
Total $$55,900,000 $14,500,000 2005
USD 469 Lansing
USD serves 49 square miles in Leavenworth County. Enrollment for the 2012-2013 school year is 2,650 students. The district has one elementary school, one middle school, and one high school.
Technical and Fiscal Resources
The school district currently employs the following positions as technical resources for the purpose of this plan:
• Full-time building official (Principals) • Emergency Manager • Public Information Officer
Financial resources that the district can potential use to fund mitigation activities include:
• Contingency Funds Existing Plans and Policies
• Master Plan • Capital Improvement Plan • Weapons Policy • School Emergency Plan
o Shelter in Place Protocols o Evacuation Protocols
Other Mitigation Activities

Region L Hazard Mitigation Plan, 2013 Final 2.148
USD 469 conducts fire and tornado drills in accordance with state and municipal regulation. They rely on a variety of technology for emergency alerts such as the intercom, radios/buses, text, and the internet.
Table 2.53. USD 469 Asset Inventory
Asset Address Sq Feet Replacement
Value (insured) Contents Value Occupancy/Capacity # Lansing High School
220 Lion Lane, Lansing, KS
125,000 $25.8M $1.6M 750
Old HS & Int. Bldg
300 E. Olive, Lansing, KS
44,545 $11.1M Leased to others 228
Vocation Education Bldg.
220 Lion Lane, Lansing, KS
2,000 $2.8M $26.4K 0
District Office 200 E. Mary, Lansing KS
15,327 $2.5M 162K 0
Asset Address Sq Feet Replacement
Value (insured) Contents Value Occupancy/Capacity # Special Education 210 E. Mary,
Lansing KS 34,817 $5.2M 1.1M 0
Leased by LV Co. Ext.
613 Holiday Plaza, Lansing, KS
2,800 $584.2K Leased to others 0
Lansing Middle School
509 W. Ida, Lansing, KS
128,000 $18.6M $1.4M 750
Industrial Bldg (Bus Barn)
1102 Industrial St., Lansing, KS
25,000 $2.3M 0 0
Lansing Elementary
450 W. Mary St., Lansing, KS
147,000 $20.9M $1.3M 900+
Total $89,784,200 $5,588,400 2628+
2.3.10 University of Saint Mary
The University of Saint Mary serves Leavenworth and the surround communities. This is a private university that currently has 1,100 students enrolled for the 2012 – 2013 school year.
Technical and Fiscal Resources
The University currently employs the following positions as technical resources for the purpose of this plan:
• Full-time Building Official (President) • Emergency Manager (Facilities/EHS Engineer) • Public Information Officer (Director of Marketing)
Fiscal resources available to the University for the funding of mitigation activities include:
• Capital Improvements Project Funding • Private Activities/Donations

Region L Hazard Mitigation Plan, 2013 Final 2.149
Existing Plans and Policies The University of Saint Mary has the following plans and policies currently in place:
• Master Plan • Capital Improvement Plan • Weapons Policy • School Emergency Plan
o Shelter in Place protocols o Evacuation Protocols
Other Mitigation Activities
Fire evacuation drills are conducted quarterly and tornado sheltering exercises are conducted yearly for the staff and students who live in the two dorms. Campus-wide drills will also be conducted.
Text alerts are utilized to alert staff and students during an emergency, as well as a phone alert system that is available to the two dorms. While the University does not hold lock-down security training, discussions are on-going about conducting some table-top exercises once the Emergency Management Plan is updated this year.
Table 2.54. University of Saint Mary Asset Inventory
Asset Address Sq Feet Replacement Value
(insured) Maria Hall 4100 S. 4th St. 59,388
Berkel Hall 4100 S. 4th St. 28.500 DePaul Library 4100 S. 4th St. 38,086 Miege Hall 4100 S. 4th St. 50,176
McGilley field House 4100 S. 4th St. 29,725 Ryan Sports Center 4100 S. 4th St. 29,703 Berchman’s Hall 4100 S. 4th St. 73,100
Saint Joseph Dining Hall 4100 S. 4th St. 4,500 Mead Hall 4100 S. 4th St. 60,821
Saint Mary Hall 4100 S. 4th St. 33,975 Xavier Hall 4100 S. 4th St. 26,287
Brooder House 4100 S. 4th St. 800
Total for all 435,061 sq ft $178,495,000
Leavenworth Rural Water District #7
RWD7 services the counties of Leavenworth and Wyandotte. They currently employ a mapping specialist and an engineer. Funding they have available includes Capital
Region L Hazard Mitigation Plan, 2013 Final 2.150
Improvements Funds, Fees for water, sewer, gas, or electric services, impact fees for new development, debt through general obligation bonds, and special tax bonds.
RWD 7 sends out responsible water use flyers as part of their mitigation activities. They currently have a new water district office at 142nd St. and K-32 Hwy.

Region L Hazard Mitigation Plan, 2013 Final 2.151
2.4 Wyandotte County
Wyandotte County History
Wyandotte County is named after the Wyandot Indians, also known as the Huron by the French in Canada. The Wyandotte of today was once divided between Leavenworth and Johnson counties, much to the chagrin of the population that inhabited this land. Having little say in the affairs of government and politics, and tired of the influx of Missourians, the people living in this area were determined to become their own political force.
It was the Wyandotte Constitutional Convention that created Wyandotte County in 1859. This Constitutional Convention was a key event in the creation of the present Constitution of the State of Kansas also. This Convention ensured that Kansas; became a state, was a state that was free from slavery, women were given some rights in voting and holding property, and Wyandotte County was created and established as a free and independent political entity.
In 1997, Wyandotte County through a unanimous vote, consolidated the city and county governments to become the Unified Government of Wyandotte County/Kansas City, Kansas.
2.4.1 Wyandotte County Geography/Topography
The 143 square miles that make up Wyandotte County resides within the Kansas-Lower Republican basin. The planning area boast six major waterways which are the Kansas, Republican, Big Blue, Little Blue, Delaware, and Wakarusa Rivers. Streams and lakes cover 16 square miles of Wyandotte County and include the Vermillion and Stranger creeks.
Roughly triangular in shape, Wyandotte County lies principally between the Missouri and Kansas Rivers and is completely enveloped within the Glaciated Region. Leavenworth County borders it on the north and west, the Missouri River on the east, and to the south by Johnson County and the Kansas River.
The uplands in the western part of the county are comprised of deeply dissected hills and are approximately 1,060 feet above sea level.. Steep slopes and breaks formed by differential erosion of limestone, shale, and sandstone lie along the Kansas River and its tributaries. The lower level of the county is 740 feet above sea level where the Kansas and Missouri Rivers meet. Wyandotte County is the smallest county within the State of Kansas, yet boasts a hearty population of 157,505 people.
The following is a map of the Wyandotte County planning area:
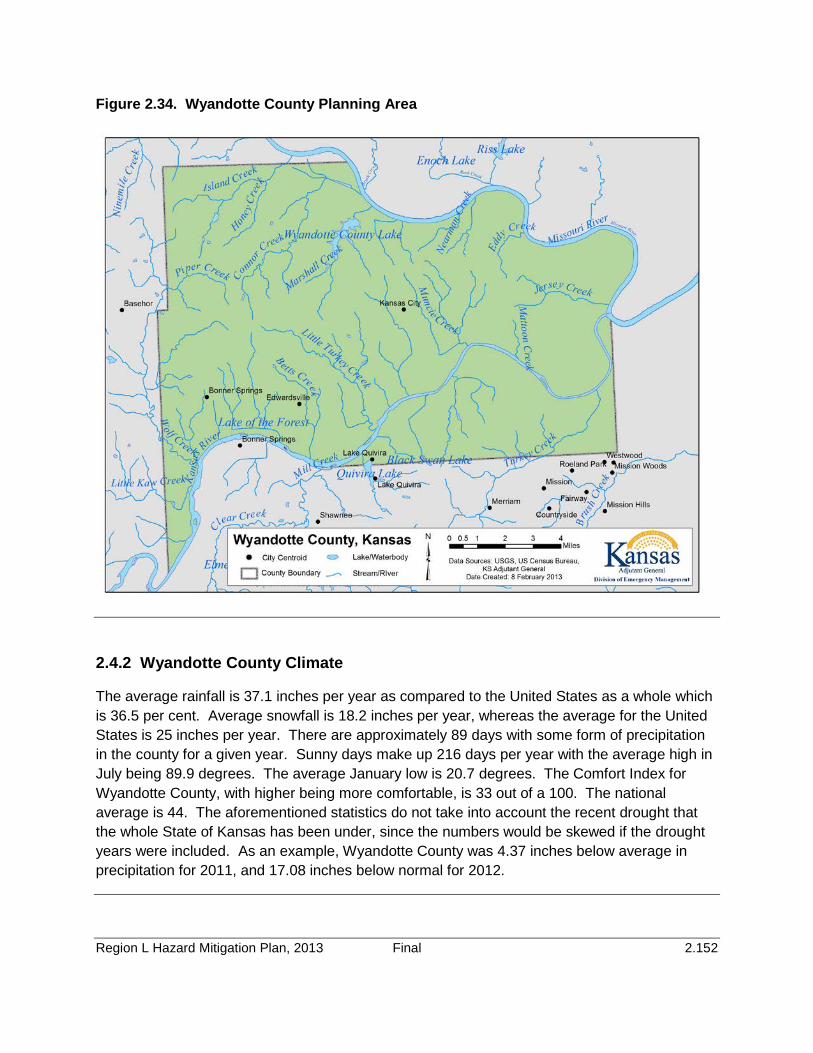
Region L Hazard Mitigation Plan, 2013 Final 2.152
Figure 2.34. Wyandotte County Planning Area
2.4.2 Wyandotte County Climate
The average rainfall is 37.1 inches per year as compared to the United States as a whole which is 36.5 per cent. Average snowfall is 18.2 inches per year, whereas the average for the United States is 25 inches per year. There are approximately 89 days with some form of precipitation in the county for a given year. Sunny days make up 216 days per year with the average high in July being 89.9 degrees. The average January low is 20.7 degrees. The Comfort Index for Wyandotte County, with higher being more comfortable, is 33 out of a 100. The national average is 44. The aforementioned statistics do not take into account the recent drought that the whole State of Kansas has been under, since the numbers would be skewed if the drought years were included. As an example, Wyandotte County was 4.37 inches below average in precipitation for 2011, and 17.08 inches below normal for 2012.

Region L Hazard Mitigation Plan, 2013 Final 2.153
2.4.3 County Population/Demographics
According to the U.S. Census Bureau, the total population of Wyandotte County in 2010 was 157,505. The population between the 2000 and the 2010 census decreased by 377 people, or .24%. Table 2.34 belows shows the population trends for the participating jurisdictions that make up Wyandotte County:
Table 2.34. Wyandotte County Jurisdictional Population/Demographics, 2000 to 2010.
Jurisdiction 2000 Population 2010 Population Difference 2000 – 2010
Bonner Springs (pt) 6,767 7,314 547 Edwardsville 4,146 4,340 194 Kansas City 146,866 145,786 (1,080) Bal. of Wyandotte Co. 54 65 11 Total County 157,882 157,505 (377)
In Table 2.35 are the 2010 Census Bureau demographic and social characteristics for jurisdictions within Wyandotte County:
Table 2.35. Wyandotte County Jurisdictional Demographics
Jurisdiction White % Black or African
Hispanic/Latin (Any Race) (%)
Average Household
Bachelor Degree or
Bonner Springs (pt) 84.8 5.4 10.8 2.70 27.8 Edwardsville 86.6 6.0 7.3 2.55 10.1 Kansas City 52.2 26.8 27.8 2.68 10.1 Wyandotte Co. 67.6 25.1 26.7 2.71 15.2 Source: U.S. Census Bureau (2010)
According to the U.S. Census Bureau for 2010, by gender breakdown, males represent 49.3% of the populations for Wyandotte County, and females represent 50.7%.
2.4.4 County Economics
Table 2.36 shows the industry trends for Wyandotte County:

Region L Hazard Mitigation Plan, 2013 Final 2.154
Table 2.36. Wyandotte County Economics
INDUSTRY Estimate % Civilian employed population 16 years and over 68,067 Agriculture, forestry, fishing and hunting, and mining 514 .8 Construction 6,242 9.2 Manufacturing 8,652 12.7 Wholesale trade 1,775 2.6 Retail trade 7,040 10.3 Transportation and warehousing, and utilities 5,149 7.6 Information 1,214 1.8 Finance and insurance, and real estate and rental and leasing 3,957 5.8 Professional, scientific, and management, and administrative and waste management
7,087 10.4
Educational services, and health care and social assistance 13,628 20.0 Arts, entertainment, and recreation, and accommodation and food services 5,960 8.8 Other services, except public administration 3,401 5.0 Public administration 3,448 5.1 Source: U.S. Census Bureau (2010)
According to the data collected by the U.S. Census Bureau (2010), educational services, and health care and social assistance were the leading industries in Wyandotte County at 20%, followed by manufacturing by a distant second at 12.7%. Rounding out the bottom is agriculture at .8% of the workforce.
By occupation, sales and office constitutes 24.8% of the sector, followed closely by management, business, science, and arts at 23.2%. Service occupations round out the top three at 20.3%. Last on the list are occupations dealing with natural resources, construction, and maintenance at 12.6% Production, transportation, and material moving occupations are second to last at 19%.
Following is a chart that depicts the top four occupational fields within Wyandotte County:

Region L Hazard Mitigation Plan, 2013 Final 2.155
28%
27%23%
22%
Sales & Office
Management,Business,Science,ArtsService
Production/Transportation,Material Moving
2.4.5 Wyandotte Capabilities
Mitigation capabilities are profiled in the following section and include: organizational structure, staff, fiscal, and technical resources; adopted plans, policies, and regulations, if any.
As mentioned in the history of Wyandotte County, the county and city governments joined together in 1997 to form the Unified Government of Wyandotte County, which services the entire County for county level services and City level municipal services for the City of Kansas City, Kansas. For this reason Kansas City, Kansas will not be profiled separately from the county in this plan. Currently, the Unified Government is staffed and managed by the following 51 offices and departments:
3-1-1 Call Center Economic Development Neighborhood Resource Center Air Quality Election Commissioner Operation Brightside Animal Control Emergency Management Parks and Recreation Appraiser Ethics Commission Police Department Area Agency on Aging Finance Property Management/Marketing Auto Licensing Fire Department Public Health Department Building Inspection Housing and Urban
Redevelopment (Community Development)
Public Relations Public Safety Business Office
Business License Human Resources Public Works Code Enforcement Human Services Purchasing Commissioner’s Office K State Research & Extension Register of Deeds Community Policing Land Bank Rental Licensing County Administrator Legal Department Sheriff County Clerk’s Office Legislative Auditor's Office Technology

Region L Hazard Mitigation Plan, 2013 Final 2.156
Court Trustee Liveable Neighborhoods UG Transit Delinquent Real Estate Office Maps Urban Planning and Land Use District Attorney Mayor’s Office Water Pollution Control District Court Municipal Court Wyandotte County Museum
Land Use and Development Trends
Wyandotte County is the only county in Region L to lose a percentage of their population; however, it is unique due to its large Kansas City urban area, which tends to the industrial. While Wyandotte is the smallest county in Kansas, Kansas City makes up a large percentage of the county. The county must also deal with the Missouri and Kansas River flooding that can be problematic in some years. This occurred as recently as 2011 with the Missouri River flood which caused damage in Wyandotte County.
While Wyandotte County has seen a decrease in population between the 2000 and 2010 census, it continues to have housing gains. During the ten year period between 2000 and 2010, housing increased by 1.3%. One area of immense growth is the Legends shopping area which is also home to a casino, speedway, Cabela’s, and Nebraska Furniture Mart. The Legends shopping area brings in consumers across Kansas and surrounding states as well. The following map shows the Land Use for the Unified Government of Wyandotte County. (www.wycokck.org)
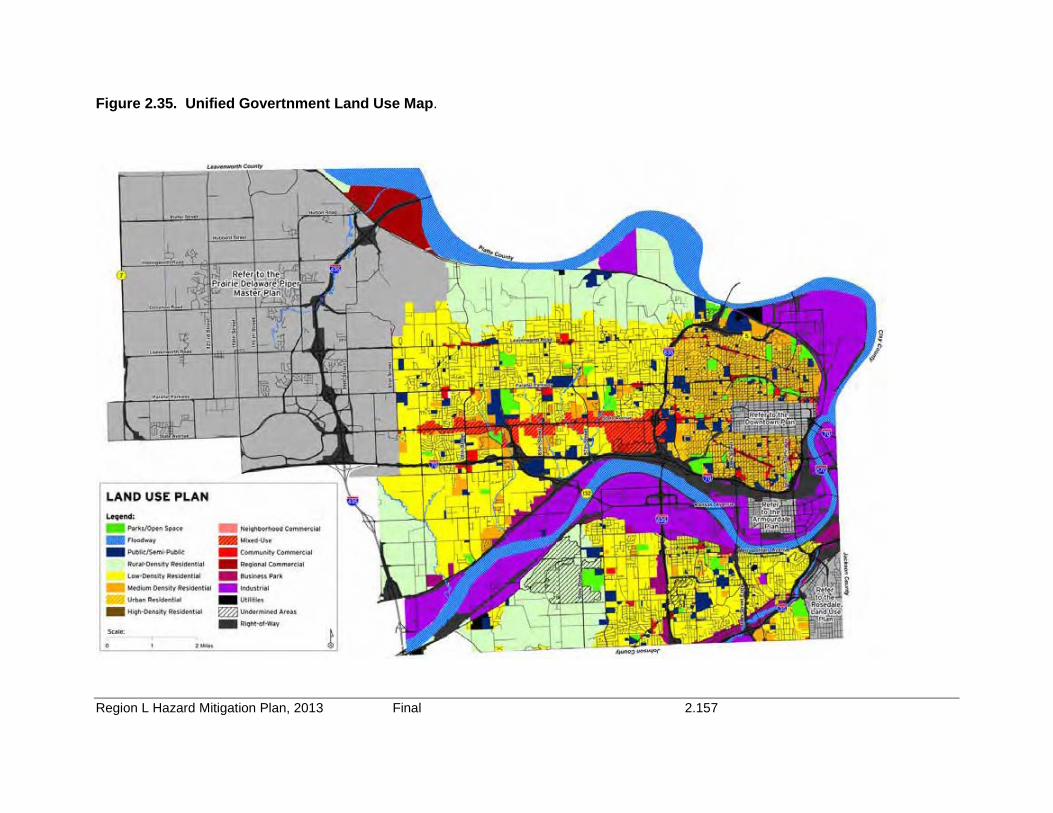
Region L Hazard Mitigation Plan, 2013 Final 2.157
Figure 2.35. Unified Govertnment Land Use Map.

Region L Hazard Mitigation Plan, 2013 Final 2.158
The Unified Government of Wyandotte County has a comprehensive Land Use Plan that details future development. In their plan they indicate that they want to ‘….balance the desire to protect and enhance the natural environment through green principles and sustainable development approaches with the need to create jobs and diversify the local economy. The Plan also places a significant emphasis on quality neighborhoods through guidelinesfor infill development, redevelopment and new development’ (Land Use Plan, Unified Government of Wyandotte County/Kansas City, Kansas). They have incorporated guiding principle that discuss the following:
• Future development will emphasize storm water detention and flood control and or mitigation approaches which enhance environmental stewardship and natural resource preservation.
• Provide incentives for community economic generators east of I-635 and along I-35.
• Incentives for retail uses should be targeted to existing key intersections or activity centers on State Avenue and nodes east of I-635.
• New industrial, commercial and office development should use high quality and environmentally sustainable materials. Leadership in Energy and Environmental Design (LEED) compliant construction and National Association of Home Builders (NAHB) Green Building Council standards should be encouraged for all new construction. In addition, all new developments should strive to meet the Environmental Protection Agency (EPA) benchmarks for achieving an Energy Star Qualified rating for industrial, commercial and office buildings as well as single-family homes and multi-family residences.
• Protect established neighborhoods from incompatible development. New, infill and redevelopment should be compatible in terms of design, density, massing and scale to adjacent uses.
• Infill development and redevelopment should be well integrated with existing development and the natural environment.
• Restrict intrusion of intensive land uses within established residential areas. Intensive uses include businesses that generate excessive traffic, noise, noxious uses, outdoor storage, etc. These uses are the least compatible with residential areas and should be encouraged to locate in areas of the City where such uses already occur.
• Enhance neighborhood cultural amenities and resources; use these amenities as:
—— An opportunity to preserve, enhance and celebrate historic buildings, structures and sites.
—— A catalyst for development and reinvestment.
—— To reinforce and enhance neighborhood identity.
—— A source community pride.

Region L Hazard Mitigation Plan, 2013 Final 2.159
• Walkability and access to transit should be a priority within all new development and redevelopment projects
Projects that are approved, incorporating the guiding principles, will utilitzie the following potential financing strategies and incentive programs:
Impact Fees: Defined as new growth’s fair share of the cost to provide necessary capital facilities.
Excise Taxes: Often used to fund new infrastructure and services necessitated by new growth.
Special Assessment District: an area in which property owners voluntarily tax themselves to provide public improvement projects designed to help upgrad the area and establish a district identity.
Developer Exactions: Developer funded in-kind contributions of land, facilities, or services that are demanded as a condition of development approval.
CDBD: Directed by the Department of Housing and Urban Development, it provides funding for a wide variety of community development projects via annual direct grants.
STAR Bonds: These provide Kansas municipalities the opportunity to issue bonds to finance the development of major commercial entertainment and tourism areas and use sales tax revenue generated by the development to pay off the bonds.
Tax Increment financing District: Allows the Unified Government to use its power of eminent domain to acquire property needed for a development project and to use the funds generated by the tax increment in the projects.
Transportation Development District: Established by voluntary petition for a specific area by resolution and public hearing to fund, promote, plan, design, construct, improve, maintain, and operate one or more transportation projects.
Unified Government Existing Plans:

Region L Hazard Mitigation Plan, 2013 Final 2.160
Existing Area Plans
The following Unified Government area plans were prior to the completion of the Master Plan, however are current for specific land use recommendations, policies and strategies for these areas. As a result of the Master Plan process, some strategic updates were identified. A brief summary of each plan as well as a list of modifications and additions are noted for each plan on the following pages. The following communities are integral to the make-up of the Unified Government/Kansas City area.
Downtown, Kansas City, Plan
The Downtown Plan, adopted in 2007, is intended to serve as the vision and development frame- work for future actions in the downtown and its surrounding areas. The following general principles serve as the foundation for creation of the land use, mobility and design frameworks depicted in the Downtown Plan.
• Place Diversity - Encourage and promote the cultural, historic and ethnic diversity unique to Downtown and surrounding neighborhoods by maximizing opportunities created by such diversity.
• Safety and Image - Acknowledge and proactively address negative perceptions and realities tied to safety, cleanliness and image.
• History of Place - Protect and promote the local and regionally significant historical assets of Downtown Kansas City, Kansas and Wyandotte County.
• Connections - Promote movement through a variety of transportation methods within downtown and between the adjacent neighborhoods and the Riverfront.

Region L Hazard Mitigation Plan, 2013 Final 2.161
Figure 2.36. Land Use Kansas City
• Location - Take full advantage of the central geographic location of Downtown within the context of the metropolitan area.
• Vitality - Improve the vitality of Down- town through the creation of an influx of people seeking housing, employ- ment, commerce, entertainment and arts, education, and regional destina- tion opportunities.
• Infrastructure and Facilities - Plan, provide and maintain efficient and ef- fective infrastructure and facilities that promote sustained development, connect neighborhoods and centers, are aesthetically pleasing and environ- mentally sound, and evoke community pride.
• Economic Development - Create an economic environment that attracts business, encourages entrepreneur- ship and seeks diversified employment growth and opportunities that support surrounding neighborhoods and draw people into downtown.
Prairie Delaware Piper Master Plan The Prairie Delaware Piper Master Plan was last updated in 2004. The recommendations in the plan are organized around four plan components:
• Future Land Use Plan • Development Policy/Phasing Plan • Transportation Plan

Region L Hazard Mitigation Plan, 2013 Final 2.162
Figure 2.37. Land Use Prairie Delaware Piper
• Open Space Plan
Since 2004, major changes include: • K-7 Corridor Management Plan. This study was ongoing at the time the Prai- rie Delaware Piper Plan was adopted. Some of the initial access recommendations were modified within the final plan. Property owners along K-7 should review the Corridor Management Plan to understand how future improvements may impact future development. • New Market Development. This development within this area will is based on the principles of traditional neighbor- hood design (TND).
• The Schlitterbahn Development Plan. The 376 acre project’s first portion, the 40 acre Schlitterbahn Water Resort, will open in summer 2009 and include the water park, several lodging compo- nents, and shops and restaurants. Ad- ditional components will open through the summer of 2011, when the project will offer an enclosed climate-controlled area for year-round operation, more than 750,000 square feet of retail and more than 1,500 lodging units. • A potential casino. Senate Bill No. 66 adopted by the 2007 Kansas Legislature, signed by the Governor provides the authorization and legal framework for the establishment and operation of State owned gaming facilities in four geographically

Region L Hazard Mitigation Plan, 2013 Final 2.163
defined zones through- out the State of Kansas. Wyandotte County in its entirety comprises one gaming zone. The Unified Government, Edwardsville and Bonner Springs each are in the process of evaluating proposals, which include potential sites within the Prairie Delaware Piper area. Figure 2.38. Rosedale Land Use Plan
Rosedale Land Use Plan

Region L Hazard Mitigation Plan, 2013 Final 2.164
Adopted in 2005, the Rosedale Land Use Plan has had no significant changes. It was created with the input of Rosedale’s residents, community leaders and shareholders. Key plan goals include:
• Make Rosedale an ideal community for family housing.
• Encourage new housing and retail/community services.
— Create 39th Street Mixed-Use Center.
— Develop/Redevelop Rainbow Boulevard and Southwest Boulevard.
— Promote business attraction, retention and expansion.
— Develop a community center.
• Plan for the necessary expansion of the University of Kansas Medical Center (KUMC).
• Improve Rosedale’s image and make it a place of beauty.
• Provide improved transportation, infrastructure and services.
• Increase safety and the perception of safety.
Several concerns identified by participants were identified below:
• The City should continue to work with the Rosedale Development Association (RDA) to proactively address land use issues, housing, crime, youth programming, business recruitment and retention and other area needs.
• The City should continue to work with KUMC and adjacent neighborhoods to plan for future needs and facilities.
• Industrial uses should be limited to the areas identified on the Future Land Use Plan along I-35 and the rail tracks.
• Commercial and commercial/mixed use areas should be limited to existing nodes and major corridors as shown on the Future Land Use Map. Intrusions into adjacent single family neighborhoods is highly discouraged.

Region L Hazard Mitigation Plan, 2013 Final 2.165
Armourdale Land Use Plan
Adopted in 1979, the Armourdale Land Use Plan is intended to provide a long term land use vision for the area. The primary recommendations in this plan include the following:
• The City strives to reinforce the residential quality of Armourdale through the neighborhood stabilization and rehabilitation capabilities of the Community Development Program.
• The City should refrain from approving additional non-residential zoning and development.
• A code enforcement program concentrating on exterior problems and nuisances be initiated to help improve the overall visual image.
Figure 2.39. Armourdale Land Use Map.
• City Commissioners should encourage financial institutions to provide assistance for improvements with- in the Armourdale area.
While this plan was adopted in 1979, the community has noted that the recommendations were still valid. Implementation of the plan continues to be problematic in regards to industrial and commercial intrusions into established residential areas.

Region L Hazard Mitigation Plan, 2013 Final 2.166
As noted in the original Armourdale Plan, the relatively low price of land, vacant parcels and under-utilized buildings, combined with its proximity to major transportation corridors, makes this area desirable for industrial and service uses. Due to these factors, the City should consider the following approaches:
• Existing residential pockets and established neighborhoods should be protected from industrial intrusions.
• Where practical, vacant buildings or structures within established single family areas should be redeveloped for residential uses.
• Industrial developments should be limited to large tracks adjacent to existing industrial areas.
• New industrial development on the fringe of residential areas should be required to provide buffer zones and adequate screening of potential visual blight including but limited to outdoor storage, etc.
• The City should continue to emphasize code enforcement to protect established residential areas.
In general, growth in the area that makes up the Unified Government of Wyandotte County is anticipated and planned for. One area of concern for the planning area is the floodway. These are areas that carry the runoff from the adjacent floodplain without causing the flood elevation to increase by 1 foot or more at any point along the basin. The following guiding principles have been established:
• Allowed uses are passive parks and open space.
• Discouraged uses are permanent structures. Significant disturbances or development would require construction of a levee and other improvements upon approval by the Army Corps of Engineers

Region L Hazard Mitigation Plan, 2013 Final 2.167
Technical and Fiscal Resources
Planning, engineering, floodplain management and emergency management are fully staffed positions within the Unified Government. They have a 911 dispatch center as well as 76 outdoor warning sirens. Table 2.37 depicts the Unified Government personnel resources in 2013.
Table 2.37. Personnel Resources
Personnel Resources Yes/No Department/Position
Planner/Engineer with knowledge of land development/land management practices
Yes Director of Planning
Engineer/Professional trained in construction practices related to buildings and/or infrastructure
Yes County Engineer
Planner/Engineer/Scientist with an understanding of natural hazards
Yes County Engineer
GIS Yes Director, Geo-Spatial Services
Full time building official Yes Director, Neighborhood Resource Center
Personnel Resources Yes/No Department/Position
Floodplain Manager Yes Director of Planning
Emergency Manager Yes Emergency Management Department
Grant Writer Yes Director, Economic Development
Fiscally, Wyandotte County has several funding resources that can potentially fund mitigation activities. The following is a list of these resources:
• Community Development Block Grants • Capital Improvements project funding • Authority to levy taxes for specific purposes • Fees for water, sewer, gas, or electric services • Authority for impact fees for new development • Ability to withhold spending in hazard prone areas • Ability to incur debt through general obligation bonds, special tax bonds, and private
activities Existing Plans and Policies The following table list the plans and policies that exist within Wyandotte County:

Region L Hazard Mitigation Plan, 2013 Final 2.168
Element In Use, Yes, No, N/A Comments Planning Capabilities
Comprehensive Plan Yes All 3 Cities Capital Improvement Plan Yes All 3 Cities County Emergency Operations Plan
Yes
Debris Management Plan Yes County
Economic Development Plan No
Flood Mitigation Assistance (FMA) Plan
No
Firewise or other Fire Mitigation Plan
No
Transportation Plan Yes County
Other Mitigation Activities
Wyandotte County is proactive in its stance for programs that alleviate the threat of hazards, whether natural, man-made, or technological. The following table depicts various programs that the County uses as a mitigation tool:
Policies/Ordinance Zoning Ordinance Yes
Building Code Yes Varies by City Floodplain Ordinance Yes Varies by City Storm Water Ordinance Yes All 3 Cities Drainage Ordinance Yes All 3 Cities
Site Plan Review Requirements Yes All 3 Cities
Landscape Ordinance Yes All 3 Cities Historic Preservation Ordinance Yes Kansas City, KS Zoning/Land Use Restrictions Yes Tree Trimming Ordinance Yes Unitlity Contracts
Wyandotte County has expended many resources into various studies, reports, and maps in order to illustrate what their hazards and vulnerabilities are.
The following table represents some of these:
Element In Use, Yes, No, N/A Comments Studies/Reports/Maps
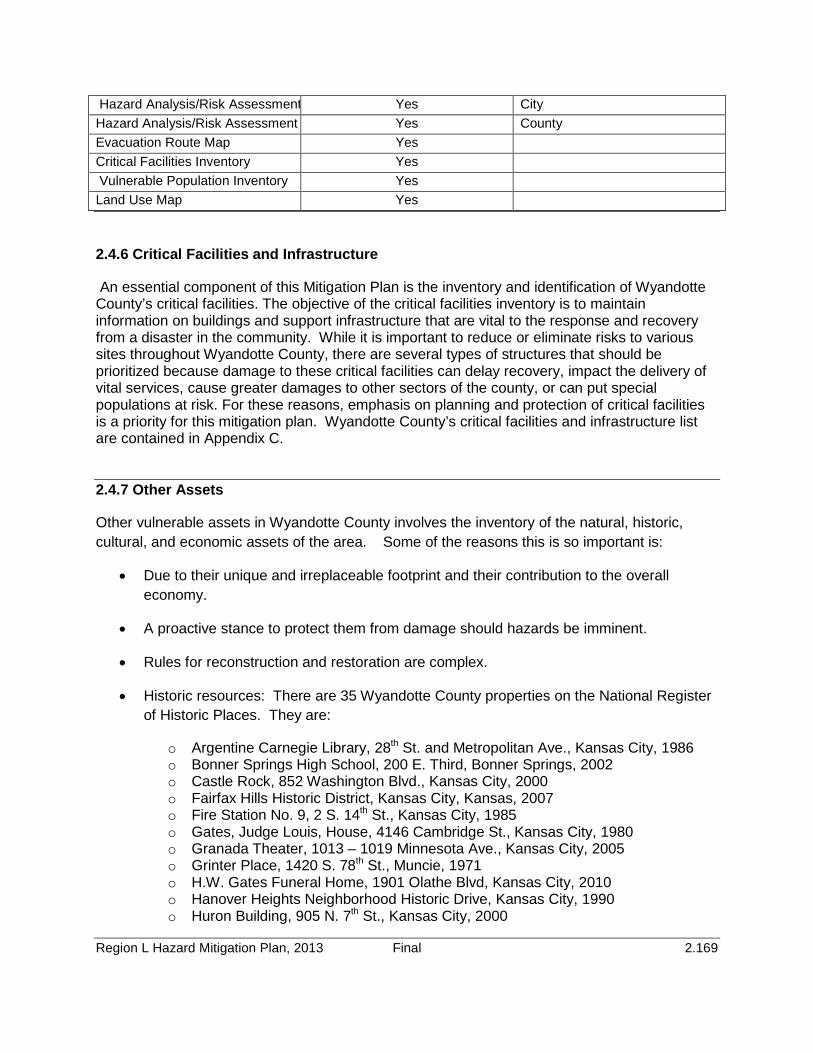
Region L Hazard Mitigation Plan, 2013 Final 2.169
Hazard Analysis/Risk Assessment Yes City Hazard Analysis/Risk Assessment Yes County Evacuation Route Map Yes Critical Facilities Inventory Yes Vulnerable Population Inventory Yes Land Use Map Yes
2.4.6 Critical Facilities and Infrastructure
An essential component of this Mitigation Plan is the inventory and identification of Wyandotte County’s critical facilities. The objective of the critical facilities inventory is to maintain information on buildings and support infrastructure that are vital to the response and recovery from a disaster in the community. While it is important to reduce or eliminate risks to various sites throughout Wyandotte County, there are several types of structures that should be prioritized because damage to these critical facilities can delay recovery, impact the delivery of vital services, cause greater damages to other sectors of the county, or can put special populations at risk. For these reasons, emphasis on planning and protection of critical facilities is a priority for this mitigation plan. Wyandotte County’s critical facilities and infrastructure list are contained in Appendix C.
2.4.7 Other Assets
Other vulnerable assets in Wyandotte County involves the inventory of the natural, historic, cultural, and economic assets of the area. Some of the reasons this is so important is:
• Due to their unique and irreplaceable footprint and their contribution to the overall economy.
• A proactive stance to protect them from damage should hazards be imminent.
• Rules for reconstruction and restoration are complex.
• Historic resources: There are 35 Wyandotte County properties on the National Register of Historic Places. They are:
o Argentine Carnegie Library, 28th St. and Metropolitan Ave., Kansas City, 1986 o Bonner Springs High School, 200 E. Third, Bonner Springs, 2002 o Castle Rock, 852 Washington Blvd., Kansas City, 2000 o Fairfax Hills Historic District, Kansas City, Kansas, 2007 o Fire Station No. 9, 2 S. 14th St., Kansas City, 1985 o Gates, Judge Louis, House, 4146 Cambridge St., Kansas City, 1980 o Granada Theater, 1013 – 1019 Minnesota Ave., Kansas City, 2005 o Grinter Place, 1420 S. 78th St., Muncie, 1971 o H.W. Gates Funeral Home, 1901 Olathe Blvd, Kansas City, 2010 o Hanover Heights Neighborhood Historic Drive, Kansas City, 1990 o Huron Building, 905 N. 7th St., Kansas City, 2000

Region L Hazard Mitigation Plan, 2013 Final 2.170
o Huron Cemetery, Minnesota Ave., Kansas City, 1971 o KCK Hall and Fire Headquarters, 805 & 815 N. Sixth St., Kansas City, 1986 o Lake of the Forest Historic District, KS 32, 9 mi. W. of Edwardsville, Bonner
springs, 1996 o Lowell Elementary School, 1040 Orville Ave., Kansas City, 2008 o NE Junior High School, 400 Troup Ave, Kansas City, 2008 o Quindaro Townsite, Kansas City, 2002 o Rosedale WWI Memorial Arch, Kansas City, 1977 o Sauer Castle, 945 Shawnee Dr., Kansas City, 1977 o Schleifer-McAlpine House, 608 Splitlog Ave., Kansas City, 2007 o Scottish Rite Temple, 803 N. 7th St., Kansas City, 1985 o Shafer, Theodore, House, 2518 N. 10th St., Kansas City, 2000 o Shawnee St. Overpass, NW of US35, Kansas City, 1984 o Soldiers and Sailors Memorial Building, 600 N. 7th St., Kansas City, 1985 o St. Augustine Hall, 3301 Parallel Ave., Kansas City, 1971 o St. Mary’s Church, 800 N. Fifth St., Kansas City, 1982 o Sumner High School and Athletic Field, 1610 N. 8th St., Kansas City, 2005 o Trowbridge Archeological Site, Kansas City, 1971 o Westheight Manor District, 18th and 24th Sts., Kansas City, 1975 o Westheight Manor Historic District, Kansas City, 1982 o White church Memorial Church & Delaware Indian Cemetery, Kansas City, 1982 o Whitefeather Spring, 3818 Ruby Ave., Kansas City, 1982 o Williamson, Roy, House, 1865 Edwardsville Dr., Edwardsville, 2007 o Wyandotte County Courthouse, 710 N. 7th St., Kansas City, 2002 o Wyandotte High School, 2500 Minnesota, Kansas City, 1986
Property Valuation Table 2.)) below depicts the appraised values from the 2013 Abstract of Appraised and Assessed Values report for Kansas City, KS. Table 2.. Appraised Property Valuation, 2013, Kansas City, Kansas
Appraised Property Valuation
Building Type Real Estate Structures ($) Median Home Value (2011)($)
Residential 3,122,017,860 93,300
Agricultural 50,937,720
Commercial/Industrial 1,078,387,860
Not for Profit 2,421,240
Total 4,253,764,680 Source: Wyandotte County Assessor Office/U.S. Census Bureau

Region L Hazard Mitigation Plan, 2013 Final 2.171
2.4.7 Cities
City of Bonner Springs
Bonner Springs was the first commercial center and white settlement in Kansas in 1812. It is governed by a Mayor-Council-Manager form of government consisting of eight council members elected from four wards and a Mayor elected at large.
Land Use and Development Trends
Potential growth areas for the City are west of the city limits into Leavenworth County and the northern portion of the City, north of 1-70. Because there is no sewer to serve these two areas, it will be many years before anything develops at either location. Other tends and patterns contained in the Comprehensive Master Plan for the City of Bonner Springs can be summarized as follows: (www.bonnersprings.org)
• Housing is still relatively affordable in Bonner Springs, which helps attract new home buyers.
• The Wolf Creek basin and the area in proximity to the new Wolf Creek sanitary sewer interceptor should be considered the most appropriate area for new growth.
• An area for long-term business and industrial development needs to be identified and supported. Possible areas may include the Shawnee Rock property and the Nettleton interchange east of K-7 Highway. The Loring area is not conveniently located to regional highways, complicating its potential: traffic generated by new development in the Loring area and Wolf Creek basin needs to be addressed for east-west thoroughfares, including K-32 and Front Street through downtown.
• The K-7 Corridor will likely accommodate new commercial and office uses in upcoming years. However, the frontage road system must be funded and developed to support new development.
• The city needs to establish a development policy and address issues such as developer and city infrastructure responsibilities, development guidelines, etc. so developers know what to expect and that the requirements will be applied consistently and equitably.
• A development / growth financing system based on a consistently applied formula should be developed.
• Standards for new development and redevelopment should be promoted to establish and maintain a unique character.
• Planning for future annexation of growth areas should occur, and outline the appropriate considerations and procedures to annex growth areas.

Region L Hazard Mitigation Plan, 2013 Final 2.172
• The Park Master Plan will address new park needs and facilities. However potential parks and recreation uses along the Kansas River have been identified as desirable opportunities.
• Riverfront trails and river access opportunities have been discussed for further study.
In addition to the trends, the City of Bonner Springs has identified some key objectives for the future development of their jurisdiction. This list in its entirety can be found on their website at www.bonnersprings.org:
• Limit development in the 100-year floodplain to recreational uses and parks.
• Promote annexation of unincorporated “infill” areas contiguous to the city limits in response to growth.
• Require developments to analyze their impact on public utilities and to make improvements to accommodate the development’s impact.
• Create a new Mixed Use zoning district classification to accommodate changing market demand and avoid multiple zoning map amendments.
• Locate new developments in areas which are free of environmental hazards or problems relating to soil, slope, bedrock and water table.
• Implement practices in new developments that increase storm water infiltration and adequately treat storm water runoff from a site before discharge.
• Standards for new development and redevelopment should be promoted to establish and maintain a unique character.
• Update high-density land use development standards to include:
a. Location on a major thoroughfare street,
b. Incentives for enhanced building design and amenities,
c. Incentives for enhanced site design and amenities, and
d. Assurances of compatibility with neighboring land uses of lesser intensity.
• Revise the regulations and list of permitted uses in the downtown zoning districts to ensure development consistent with the character of downtown.
• Coordinate with the updated Parks Master Plan and plan for improvement of future park locations for land acquisition.
• Study how to connect more to the Kansas River, including linear park linkages to Johnson County systems.
Region L Hazard Mitigation Plan, 2013 Final 2.173
• Possible development of a grassy area along the river, from the industrial park.
• Plan for a trail along abandoned railroad from 138th at K-32 Highway, west and north, with a small park at head of trail south of Whispering Woods.
• Pursue land and easement donation / dedications for trails and bike lanes, and secure land or easements from landowners and new developments.
• Promote retail-commercial along K-7Highway and at new KTA interchange at I-70.
• Promote new developments: hotel and hospital development.
• Create zoning overlay regulations to promote positive gateway images/maintenance at key gateway entrances to the city, including standards to promote attractive architecture, lighting, signage, parking, etc.
• Develop and promote continued development of business areas for long term office and employment growth.
• Develop non-residential south on Front Street along Loring Lane.
• Provide a major street system which allows safe and efficient travel citywide.
• Evaluate the impact of new development to determine Road Impact Fees, including: Woodend, Stilwell, and Riverview west of K7; KDOT plans for 136th Street; and Kansas Avenue east of Hwy 7; Kump Street; Metropolitan; and 138th Street.
• Require new developments to fund infrastructure improvements, both on-site and a proportionate share of off-site improvements, that primarily serve property owners of that subdivision (i.e. deceleration lanes, drainage structures, etc.).
• Implement the K-7 corridor study access management standards over time in cooperation with KDOT as corridor development continues in the future.
• Encourage city/county coordination and cooperation regarding municipal infrastructure extension into growth area to maximize resources, supply, facilities and distribution of utility services.
• Consider regional storm water detention options rather than individual site by site facilities—a stormwater utility fund should be considered as an option to fund regional improvements
• Implement stream buffer standards to all stream corridors identified.
On-going and short term action items can be found in the Comprehensive Plans at www.bondersprings.org.

Region L Hazard Mitigation Plan, 2013 Final 2.174
Following is a map that depicts the future land use of the City of Bonner Springs.
Figure 2.40. Future Land Use Map for the City of Bonner Springs, Kansas

Region L Hazard Mitigation Plan, 2013 Final 2.175
Technical and Fiscal Resources
Table 2. details staff resources for Bonner Springs:
Personnel Resources Yes/No Comments Planner/Engineer with knowledge of land development/land management practices
Yes City Planner
Engineer/Professional trained in construction practices related to buildings and/or infrastructure
Yes Private – outsourced
Planner/Engineer/Scientist with an understanding of natural hazards
Yes Project Manager Public Works Director
GIS Yes Project Manager Public Works Director
Full time building official Yes Building Official Floodplain Manager Yes City Planner Emergency Manager Yes Grant Writer No
Financial tools that the city can potentially use to help fund mitigation activities include:
• Taxes for Specific Purposes • Fees for Water, Sewer, or gas • Impact Fees for New Development • Debt through General Obligation Bonds • Withhold spending in Hazard Prone Areas • Debt through Special tax bonds
Existing Plans and Policies Bonner Springs joined the NFIP on January 3, 1979 and has the following plans and policies in place:
• Master Plan • Zoning Ordinance • Subdivision Ordinance • Floodplain Ordinance • Stormwater Ordinance • Building Code • Fire Department ISO Rating 5 • Site Plan Review Requirements

Region L Hazard Mitigation Plan, 2013 Final 2.176
• Local Emergency Operations Plan • Flood Insurance Study • Elevation Certificates • Comprehensive Plan
Other Mitigation Activities The City of Bonner Springs has seven outdoor warning sirens which are activated by the county Emergency Management Department Command Center. We have built a new library in the past several years with a partially funded FEMA approved safe room. We purchased five homes that were in the flood plain with FEMA mitigation funds and put a walking trail across that location. Along Spring Creek, the city has done stabilization work due to its flood prone nature as well as constructed a bridge over Spring Creek at Kump Avenue which elimated an old, undersized culvert. Property Valuation Table 2.)) below depicts the appraised values from the 2013 Abstract of Appraised and Assessed Values report. Table 2.. Appraised Property Valuation, 2013
Appraised Property Valuation
Building Type Real Estate Structures ($) Median Home Value (2011)($)
Residential 254,702,280 153,200
Agricultural 6,394,810
Commercial/Industrial 41,092,660
Not for Profit 16,230
Total 302,205,980 Source: Wyandotte County Assessor Office/U.S. Census Bureau
City of Edwardsville
Located south of the Kansas Speedway adjacent to I-70 and I-435, Edwardsville is governed by a Mayor/Council/Administrator form of governance.
Land Use and Development Trends
According to the 2010 census, the population of Edwardsville was 4,340, an increase of 194 people since the 2000 census was taken. Land are of the city is 9.2 square miles, and population density is 472 people per square mile.

Region L Hazard Mitigation Plan, 2013 Final 2.177
According the the City of Edwardsville Comprehensive Plan, development trends have resulted in a moderate pattern for residential developments and a consistent immigration of new industries. Commercial developments are concentrated along K-32 and 4th street and while this is expected to continue. K-32 east of 4th street has less probability of developing due to the steep terrain on the north, and floodplain designation on the south. Following is a map of the existing land use in the City of Edwarsville: (www.edwardsvilleks.org)

Region L Hazard Mitigation Plan, 2013 Final 2.178
Figure 2.41. City of Edwardsville Land Use

Region L Hazard Mitigation Plan, 2013 Final 2.179
The City of Edwardsville has a comprehensive plan that outlines future land use and takes into consideration the following policies:
• Adhere to the Future Development Plan
• Neighborhoods in a Range of Densities. Encourage the development of neighborhoods in a range of densities to provide a sense of community, and to complement and preserve natural features in the area.
• Encourage Proper Lot Orientation. Encourage subdivision design in which peripheral lots face inward toward the neighborhood, of which they are a part, especially those lots which are adjacent to collectors or thoroughfares. No home shall front on a designated thoroughfare.
• Allow Small-Lot and Duplex Subdivisions.
• Commercial Development. Target specific areas for commercial development that will meet the community’s needs through the planning period.
• Use Appropriate Transitional Methods. Appropriate transitional methods should be considered at all locations where the development or expansions of nonresidential and medium-density residential land uses abut low-density residential property (either built or zoned). In general, transitions between different types of intensities of land use should be made gradually, particularly where natural or man-made buffers are not available.
• Promote the assembling of small tracts to form larger, more cohesive parcels to enable well planned, and orderly development to occur.
• Allow the Option of Parks, Recreation and Open Space as a Transitional Use.
These policies can be found at www.edwardsvilleks.org in their entirety.
Following is the Future Land Use Map for the City of Edwardsville, Kansas.

Region L Hazard Mitigation Plan, 2013 Final 2.180
Figure 2.42. Future Land Use Map for the City of Edwardsville, KS

Region L Hazard Mitigation Plan, 2013 Final 2.181
Technical and Fiscal Resources
The City of Edwardsville retains technical staff on contract for the positions of Building Code Official, Building Inspector, Development Planner and Public Works Official.
Fiscal resources that the city can use to potentially fund mitigation activities are as follows:
• Community Development Block Grants • Capital Improvements Funding • Taxes for Specific Purposes • Fees for Water, Sewer, Gas, or Electric Services • Debt through General Obligation Bonds • Debt through Special Tax Bonds • Debt through Private Activities
Existing Plans and Policies The City of Edwardsville has been a participant in the NFIP since September 29, 1978 and has the following plans and policies in place:
• Comprehensive Plan • Land-use Plan • Zoning Ordinance • Building Code • Floodplain Ordinance • Subdivision Ordinance • Storm Water Ordinance • Site Plan Review Requirements • Codes Building Site/Design • National Flood Insurance Program
Other Mitigation Activities The City of Edwardsville has incorporated a safe room/storm shelter into its community center to protect its citizens from increment weather. They continue to participate in the NFIP, and also provide public education through various programs to include the Fire Alarm Program. Property Valuation Table 2.)) below depicts the appraised values from the 2013 Abstract of Appraised and Assessed Values report. Table 2.. Appraised Property Valuation, 2013
Appraised Property Valuation
Building Type Real Estate Structures ($) Median Home Value (2011)($)
Residential 117,909,040 $83,400
Agricultural 7,548,050

Region L Hazard Mitigation Plan, 2013 Final 2.182
Commercial/Industrial 61,432,410
Not for Profit 0
Total 186,889,500 Source: Wyandotte County Assessor Office/U.S. Census Bureau Lake Quivira – profile and demographics can be found on page 2.225 – 2.226.
2.4.9 Unified School Districts
Wyandotte County has four Unified School Districts (USD), as well as a State School - the Kansas School for the Blind in Kansas City. Turner USD 202, Piper USD 203, Bonner-Edwardsville USD 204, and Kansas City USD 500, as well as the Kansas School for the Blind. Only USD 204, Bonner – Edwardsville, and the Kansas School for the Deaf and Blind participated in this plan. However, all are represented on the following map.

Region L Hazard Mitigation Plan, 2013 Final 2.183
Figure 2.43. Unified School Districts of Wyandotte County
Source: Kansas Data and Access Support Center, Wyandotte County/AIMS, Wyandotte Multi-jurisdictional Hazard Mitigation Plan, 2009.

Region L Hazard Mitigation Plan, 2013 Final 2.184
U.S.D. 204 Bonner-Edwardsville
Bonner Springs and Edwardsville is serviced by USD 204. The enrollment for the 2012 – 2013 school year was 2,500 students. The district has one high school, one middle school, three elementary schools, and an early childhood center.
Technical and Fiscal Resources
The Superintendent has the dual role of Emergency Manager for the district. Fiscal resource to help fund potential mitigation activities include a capital improvements project fund, local funds, general obligation bonds, private donations, and state and federal funds.
Existing Plans and Policies
The Bonner-Edwardsville school district has a master plan, school emergency plan, and a weapons policy.
Other Mitigation Activities
The school district performs routine fire, tornado, and evacuation drills yearly. All school buildings are equipped with NOAA weather radios and public address systems in all classrooms.
2.4.10. Kansas School for the Blind
Since the last plan, the Kansas School for the Blind has merged with the School for the Deaf and is now the KSSB&D. For the purposes of this plan, the School for the Deaf is contained in Johnson County and the School for the Blind is contained within Wyandotte’s portion.
The Kansas School for the Blind is located in Kansas City, Kansas on State Avenue and sets on approximately 10 acres. With approximately 88 staff members, the school serves 120 blind/visually impaired children through 12th grade. More than 300 students have access to KSSB Outreach Services. The school houses, feeds, provides health services, teaches, and provides outreach during the week for ten months out of the year.
Technical and Fiscal Resources
The Superintendent serves as the full-time building official and PIO. The Human Resources Director and Facilities Operations Manager serves as the Emergency manager with a team approach for emergencies. The KSSB can access capital improvements funds, state and federal funds with the approval of the state legislature for fiscal resource to fund potential mitigation activities.
Existing Plans and Policies
Region L Hazard Mitigation Plan, 2013 Final 2.185
The School for the Blind has a master plan, a capital improvements plan, and a school emergency plan.
Other Mitigation Activities
The KSSB provides fire safety, environmental education, and household preparedness as part of the curriculum. By law, the school conducts routine fire, tornado, and evacuation drills. The emergency alert system uses the phone lines. Any employee can access the emergency announcements. All buildings are equipped with NOAA weather radios.
2.4.11 Kansas City, Kansas Community College
Kansas City Kansas Community College is centrally located in Wyandotte County with 14 major buildings on the main campus. The average student enrollment per semester is approximately 7,200 students.
Technical and Fiscal Resources
KCKCC has an Emergency Response Plan which details the warning and emergency notification system for faculty, staff, and students. The Director of Campus Police acts as an emergency manager, the Dean of Finance & Administration is the full-time building official, and the Director of College Advancement is the public information officer. Fiscal resources include a capital improvements project funds, local funds, general obligation bonds, special tax bonds, private donations, and state and federal funds.
Existing Plans and Policies
The college maintains a master plan, capital improvement plan, school emergency plan, disease containment plan, and a weapons policy.
Other Mitigation Activities
None reported.
Asset Inventory
Located on Main Campus of 7250 State Ave:
Baseball Office/Locker Room, Fieldhouse, Flint, Nursing, Math, Jewell, Performing Arts Center, Science, Henry Louis, Humanities, Library, Allied Health, Community Education Building, Print Shop, Conference Center, Child Care Center, Maintenance Building, Motorcycle Training Building, Lustrum House, Baseball and Softball Bathroom/Concession buildings.
Located at 6565 State Avenue: The Dr. Thomas R. Burke Technical Education Building and Plaza.
Located at 6736 State Avenue: The Dr. Thomas R. Burke Technical Education Auto Collision and Auto Mechanical Buildings, and student union.

Region L Hazard Mitigation Plan, 2013 Final 2.186
Total of replacement value insured: $180,700,000
Total of Contents Value: $32,595,000
Occupancy of all buildings: 7,965
2.4.12 Medical Care Entities
The University of Kansas Hospital is a non-profit, academic medical center located in Kansas City, Kansas. The hospital provides opportunities for clinical experience and residency positions.
University of Kansas Hospital is a participating jurisdiction in this plan update.
The community hospitals in Wyandotte County participate in the Kansas City Hospital Bioterrorism Preparedness Region which consists of Wyandotte, Johnson, and Leavenworth counties. The hospital region, as well as each community hospital receives funding from the Kansas Department of Health and Environment’s Center for Public Health Preparedness as a part of the Health and Human Services (HHS) Hospital Preparedness Program (HPP) grant. The hospitals also participate in the Mid-America Regional Council (MARC) Regional Homeland Security Coordinating Committee Hospital Subcommittee. MARC serves counties in the Kansas City Metropolitan Area.
The University of Kansas Hospital has approximately 4,599 full time employees. They have 644 licensed beds, 508 staffed beds, and an admission rate of 19,992 people per year. Emergency room visits exceed 41,194. Planning resources the hospital maintains are:
• On Site Security • Comprehensive Plan • Capital Improvement Plan • Disease Outbreak Protocols • Pandemic Influenza plan • Mass Prophylaxis Plan • Emergency Operations Plan
University of Kansas Medical Center
The University of Kansas Medical Center is located on Rainbow Boulevard in Kansas City, KS and is considered a campus of the University of Kansas. It offers educational programs through its Schools of Allied Health, Medicine, Nursing, and Graduate Studies. The campus is comprised of academic units operating alongside the University of Kansas Hospital, which provides opportunities for clinical experience and residency positions.

Region L Hazard Mitigation Plan, 2013 Final 2.187
Technical and Fiscal Resources
The full-time building official is the Administration/Vice Chancellor of Administration. The Chief of Police for the University of Kansas Medical Center Police serves as the emergency manager. The Public Information Officer is the full-time Senior Director for Public Affairs.
Financial tools available that could potentially be used to fund mitigation activities are:
• Capital Improvements Project Funding • Debt through General Obligation Bonds • Debt through Special Tax Bonds • Private Activities/Donations • State and Federal Funds
Existing Plans and Policies
UKMC has established plans and policies. These include a Comprehensive Plan and a Hazard Awareness program.
Other Mitigation Activities
The faculty and staff have annual safety training in order to keep up to date on evacuation and safety procedures.
All campus buildings are equipped with ALERTUS alarm units. There is also a wireless warning system called RAVE and a web-based system that can provide alert notifications via email.
There is a full police department that has authority “on property owned or operated by the University, on the streets, property and highways immediately adjacent to the university, within the city limits (Kansas City, Kansas), with appropriate agreement by the local law enforcement agencies, and in any area (in Kansas) when a request for assistance has been made by the law enforcement officers from the area for which assistance is requested".
The Medical Center is working towards an outdoor notification systems and an approved FEMA safe room.
2.4.13 Drainage and Water Districts
The Fairfax and Kaw Valley Drainage Districts, along with representatives from the Leavenworth Rural Water District #7 and WaterOne (Johnson Water District #1) participated in the planning process. The drainage district’s levee responsibilities are discussed in chapter 3 under the Dam and Levee Hazard.

Region L Hazard Mitigation Plan, 2013 Final 2.188
Fairfax Drainage District
The Fairfax Drainage District (FDD) is located along the right bank of the Missouri River between river mile 367.9 and river mile 373.9. These river miles correlate approximately to levee stations 31+50 and 313+72, respectively.
The FDD is responsible for routine maintenance and operation of the upstream portion of Kansas City’s flood control project that is designated as the Fairfax-Jersey Creek Unit. This Unit protects approximately 2,036 acres of developed and undeveloped industrial property in the northeast corner of the City of Kansas City, KS. The Fairfax-Jersey Creek Levee Unit includes levees, floodwalls, stop log gap and riprap slope protection, drainage structures, pressure relief wells, seepage collection systems, interior drainage systems, the Jersey Creek box sewer, and eleven active pump stations.
Technical and Fiscal Resources
The FDD employs a General Manager, four maintenance and operations staff, and an administrative assistant. Governance is by three Board Members. The General Manager is a planner/engineer and also serves as the emergency manager in flood events.
Financial tools and resources available for potential mitigation activities include:
• Capital Improvements Funding • Taxes for Specific Purposes • Debt through General Obligation Bonds
Existing Plans and Policies The FDD is a participating member of the NFIP, and maintains an Emergency Flood Plan that defines procedures for levee protection and sandbagging operations among other things. Other Mitigation Activities The FDD provides annual information regarding drainage district matters via Fairfax Industrial Association luncheon meetings and newsletter. They are also regular participants in the Corps of Engineer sponsored flood fighting seminars. Improvements to the concrete floodwall at BPU/Quidero Power Plant are being planned for eventual construction in 2014-2015.
Kaw Valley Drainage District
The southern portion of the Fairfax-Jersey Creek Levee Unit, Argentine Levee Unit, Armourdale Levee Unit, and Central Industrial District levee Unit are maintained by the Kaw Valley Drainage District (KVDD). Several of the flood protection facilities within the KVDD directly affect the FDD’s operations. These facilities extend along the right bank of the Missouri River from Station 31+50 to near the mouth of the Kansas River. FDD and KVDD share responsibility for operation and maintenance of the Fairfax-Jersey Creek Unit.

Region L Hazard Mitigation Plan, 2013 Final 2.189
Technical and Fiscal Resources
The KVDD has a General Manager and five maintenance and operations staff to manage their district. They are governed by a three Member Board. The General Manager also acts as the emergency manager in flood events.
Financial resources available for potential mitigation activities include:
• Capital Improvements Project Funding via government Obligation Bonds • Debt through Special Tax Bonds such as No Fund Warrants
Existing Plans and Policies The KVDD has a Flood Plan that includes emergency procedures for levee protection and sandbagging operations. Other Mitigation Activities The KVDD annually provides flood protection updates to the Fairfax Industrial Association.
Kansas City Power and Light
KCP&L is an electric utility company that services more than 800,000 customers, to include eastern Kansas Counties. Its service territory covers approximately 18,000 square miles in NW Missouri and Eastern Kansas with over 3,000 miles of transmission lines, 24,000 miles of distribution lines and 320 substations. KCP&L has 3 Director’s, a Chief Executive Officer and numerous vice presidents that oversee its day to day operations.
Kansas Gas Service
Kansas Gas Service is the largest natural gas distribution company in Kansas, operating in 82 counties which include Region L.
Leavenworth Rural Water District #7
(See page 2.103. RWD#7 services Wyandotte and Leavenworth Counties).
2.4.14 Private Non-Profits
The following private non-profit organization(s) participated in the planning process:
• Boy Scouts of America – The Boy Scouts of America provides a program for young people that builds character, trains them in the responsibilities of participating

Region L Hazard Mitigation Plan, 2013 Final 2.190
citizenship, and helps them to develop personal fitness. The Heart of America Council, Boy Scouts of America services the areas of eastern Kansas and Western Missouri, of which Region L falls within. They are proactive in mitigation, not only in their teaching and education of their members about the environment and natural resources, but also in their efforts to protect them from natural disasters. The Heart of America Council of the Boy Scouts of America, founded and runs the Theodore Naish Scout Reservation which is a camp located in Bonner Springs, Kansas. In 2011 the camp completed the installation of 11 safe rooms built in accordance with FEMA 361 to protect its visitors from various disaster scenario’s which include tornadoes and wind storms.

Region L Hazard Mitigation Plan, 2013 Final 3.1
3 Risk Assessment
44 CFR Requirement §201.6(c)(2): [The plan shall include] A risk assessment that provides the factual basis for activities proposed in the strategy to reduce losses from identified hazards. Local risk assessments must provide sufficient information to enable the jurisdiction to identify and prioritize appropriate mitigation actions to reduce losses from identified hazards.
The risk assessment identifies and profiles hazards that are relevant to Region L as they pertain to lives, property, and infrastructure. The goal is to estimate the potential for loss of life, personal injury, property damage or loss, and economic loss from a hazard event. This assessment encourages communities within Johnson, Leavenworth, and Wyandotte to understand their potential risk, and to help them develop and prioritize mitigation actions that can reduce these risks in future hazard events.
The Federal Emergency Management Agency (FEMA) defines risk assessment terminology as follows:
• Hazard—A hazard is an act or phenomenon that has the potential to produce harm or other undesirable consequences to a person or thing.
• Vulnerability—Vulnerability is susceptibility to physical injury, harm, damage or economic loss. It depends on an asset’s construction, contents and economic value of its functions.
• Exposure—Exposure describes the people, property, systems, or functions that could be lost to a hazard. Generally, exposure includes what lies in the area the hazard could affect.
• Risk—Risk depends on hazards, vulnerability, and exposure. It is the estimated impact that a hazard would have on people, services, facilities and structures in a community. It refers to the likelihood of a hazard event resulting in an adverse condition that causes injury or damage.
• Risk Assessment—Risk assessment is the process of measuring the potential loss of life, personal injury, economic injury, and property damage resulting from hazards.
The risk assessment in this 2013 plan update for Region L will reflect recent events, the availability of new information, and a reevaluation of the hazards that threaten the region. This section will summarize Region L as a whole, followed by the counties of Johnson, Wyandotte, and Leavenworth. Only in the case of unique or varied hazards will any participating jurisdictions be assessed. The three parts to be covered in this chapter are:
• Section 3.1 Hazard Identification identifies the hazards that threaten the planning area and describes why some hazards have been omitted from further consideration. • Section 3.2 Hazard Profiles discusses the threat to the planning area and describes previous occurrences of hazard events and the probability of future occurrence. • Section 3.3 Vulnerability Assessment assesses the Region’s total exposure to natural hazards, considering critical facilities and other community assets at risk, and assessing growth and development trends. Hazards that vary geographically across the planning area

Region L Hazard Mitigation Plan, 2013 Final 3.2
are addressed in greater detail. This section includes an inventory of assets and estimates losses from the identified hazards.
3.1 Hazard Identification Requirement §201.6(c)(2)(i): [The risk assessment shall include a] description of the type…of all natural hazards that can affect the jurisdiction. The Planning Committee reviewed data and discussed each of the 22 natural, man-made, and technological hazards identified in the State of Kansas Hazard Mitigation Plan (SHMP). It was noted that while fog was removed from the SHMP, civil disorder was added as its own entity. The Region L Planning Committee supports these changes, agrees that all 22 hazards currently identified in the SHMP could affect the region and has modified its list of hazard profiles to match the State plan. The Planning Committee also noted that in previous plans, counties within Region L addressed slightly different lists of hazards; these variations are identified in summaries for individual counties at the end of each hazard section.
Profiled hazards, listed alphabetically, are:
Agricultural Infestation Hailstorm Soil Erosion and Dust
Civil Disorder Hazardous Materials Terrorism/Agro-Terrorism Dam and Levee Failure Land Subsidence Tornado Drought Landslide Utility/Infrastructure Failure Earthquake Lightning Wildfire
Expansive Soils Major Disease Outbreak Windstorm Extreme Temperatures Radiological Winter Storm Flood
The following natural hazards identified by FEMA are not included in this analysis because they do not threaten Kansas: avalanche, coastal erosion, coastal storm, hurricane, tsunami and volcano.

Region L Hazard Mitigation Plan, 2013 Final 3.3
3.1.1 Methodology The first part of the risk assessment is an analysis of the overall risk for each hazard with a tool called the Calculated priority Risk Index (CPRI). The CPRI value is obtained by assigning a numerical ranking to each of four hazard characteristics, then calculating an index value based on a weighting scheme. The characteristics, definitions of rankings and weighting scheme are presented below.
The CPRI is the methodology that the State of Kansas has adopted to utilize as the basis for the hazard rankings and, as such, this regional plan uses the same methodology in order to maintain consistency. It is not a 100% accurate methodology, however, it offers a platform for discussion so that the planning committee can make a more informed determination on the ranking of each hazard. Another area of consideration is noting that even though a jurisdiction may have a high probability to experiencing a hazard, it does not necessarily mean their vulnerability is higher. For instance, the denser the population is the more vulnerable they are to the impacts of an EF1 tornado, whereas a sparsely populated area may have a high probability for an EF1 tornado, but their vulnerability overall is less.
Table 3.1 Calculated Priority Risk Index (CPRI)
Characteristic Ranking Definition
Probability*
4 - Highly Likely
Event is probable within the calendar year Event has up to 1 in 1 year chance of occurring (1/1=100%) History of events is greater than 33% likely per year Event is "Highly Likely" to occur
3 - Likely
Event is probable within the next three years
Event has up to 1 in 3 years chance of occurring (1/3=33%)
History of events is greater than 20% but less than or equal to 33% likely per year Event is "Likely" to occur
2 - Possible
Event is probable within the next five years Event has up to 1 in 5 years chance of occurring (1/5=20%) History of events is greater than 10% but less than or equal to 20% likely per year Event could "Possibly" occur
1 - Unlikely
Event is possible within the next 10 years Event has up to 1 in 10 years chance of occurring (1/10=10%) History of events is less than or equal to 10% likely per year Event is "Unlikely" but is possible of occurring
Magnitude / Severity**
4 - Catastrophic Multiple deaths Complete shutdown of facilities for 30 or more days More than 50% of property is severely damaged
3 - Critical Injuries and/or illnesses result in permanent disability Complete shutdown of critical facilities for at least two weeks 25–50% of property is severely damaged

Region L Hazard Mitigation Plan, 2013 Final 3.4
Characteristic Ranking Definition
2 - Limited Injuries and/or illnesses do not result in permanent disability Complete shutdown of critical facilities for more than one week 10–25% of property is severely damaged
1 - Negligible
Injuries and/or illnesses are treatable with first aid Minor quality of life lost Shutdown of critical facilities and services for 24 hours or less Less than 10% of property is severely damaged
Warning Time 4 Less Than 6 Hours 3 6-12 Hours 2 12-24 Hours 1 24+ Hours Duration 4 More Than 1 Week 3 Less Than 1 Week 2 Less Than 1 Day 1 Less Than 6 Hours
* Based on history, using the definitions given, the likelihood of future events is quantified. ** According to the severity associated with past events or the probable worst case scenario possible in the state. Using the rankings described in Table 3.1, the following formula is used to determine each hazard’s CPRI. (Probability x .45) + (Magnitude/Severity x .30) + (Warning Time x .15) + (Duration x .10)=CPRI
Based on their CPRI, the hazards were separated into three categories of planning significance: High (3.0-4.0), Moderate (2.0-2.95) and Low (1.1-1.95). These categories determin the level of analysis given to a hazard in subsequent the risk assessment process; they do not suggest that a hazard would have only a limited impact. In order to focus on the most critical hazards, those assigned a level of high or moderate significance were given more extensive attention in the remainder of this analysis (e.g., quantitative analysis or loss estimation), while those with a low planning significance were addressed in more general or qualitative ways.
Hazards, and their corresponding CPRI ranking were reviewed and verified by all members of the planning committee during the plan update. The hazard ranking was based on the CPRI for the Region as a whole, followed by the county. Table 3.2 indicates the ranking established by the Region using the method described above.
Table 3.2 Region L Hazard Rankings
Hazard Type Probability Magnitude Warning Time Duration CPRI Planning
Significance
Regional CPRI
Tornado 4 4 4 1 3.70 High
Flood 4 3 3 4 3.55 High

Region L Hazard Mitigation Plan, 2013 Final 3.5
Winter Storm 4 3 2 3 3.30 High
Windstorm 4 2 3 2 3.05 High
Utility/Infrastructure Failure 4 1 4 3 3.00 High
Drought 4 2 3 4 2.95 Moderate
Hazardous Materials 4 1 4 2 2.90 Moderate
Lightning 4 2 2 1 2.80 Moderate
Wildfire 4 1 4 1 2.80 Moderate
Civil Disorder 2 4 4 1 2.80 Moderate
Major Disease Outbreak 2 4 1 4 2.75 Moderate
Hailstorm 4 1 2 1 2.65 Moderate
Terrorism/Agro-terrorism 1 4 4 4 2.65 Moderate
Extreme Temperatures 3 2 1 4 2.50 Moderate
Agricultural Infestation 3 2 1 4 2.50 Moderate
Expansive Soils 3 1 1 4 2.20 Moderate
Dam and Levee Failure 1 3 3 3 2.10 Moderate
Radiological 1 3 3 3 2.10 Moderate
Landslide 1 2 4 1 1.75 Low
Soil Erosion and Dust 2 1 1 4 1.75 Low
Earthquake 1 2 4 1 1.75 Low
Land Subsidence 1 1 3 2 1.40 Low
Each hazard is profiled on a regional basis; distinctive local circumstances or conditions relative to the hazard are noted when appropriate.
3.1.2 Disaster Declaration History
Historical events of significant magnitude or impact can result in a Secretarial or Presidential Disaster Declaration. Disaster Declarations within Region L are provided in the tables below.
Table 3.3 Presidential Declarations that Include Region L, 1967 – Present
Declaration Number
Declaration Date*
Disaster Description Counties Involved Disaster Cost
Major Disaster Declarations
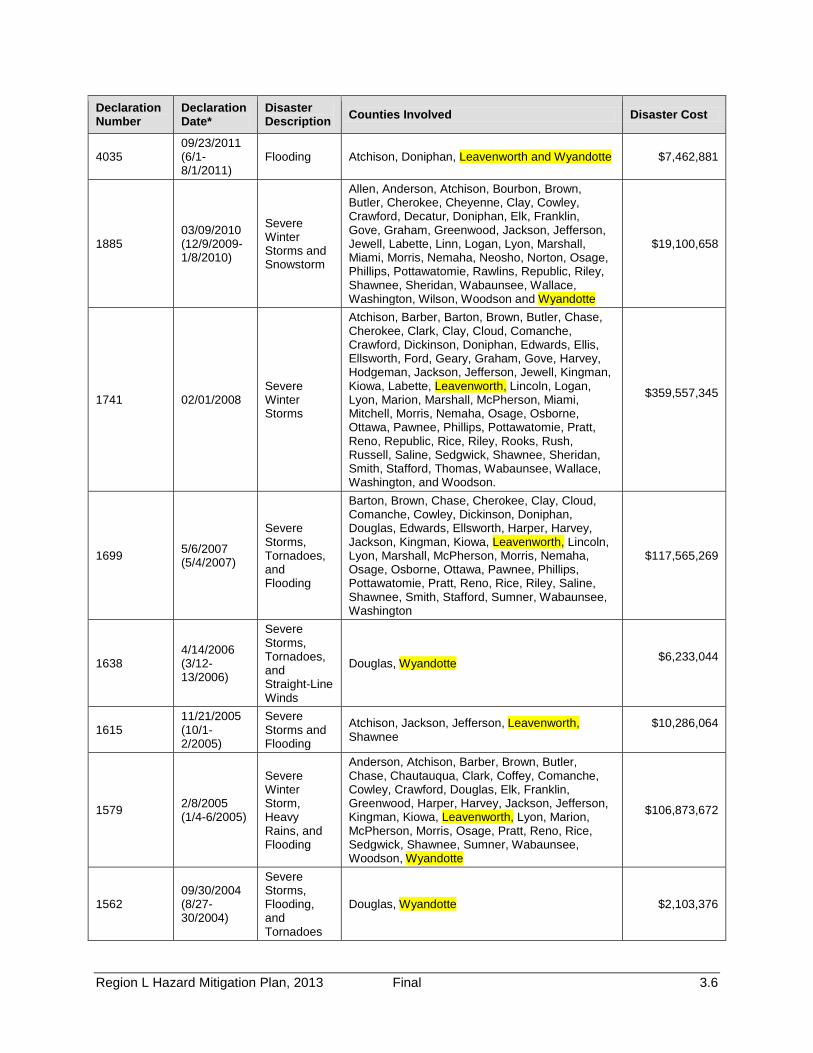
Region L Hazard Mitigation Plan, 2013 Final 3.6
Declaration Number
Declaration Date*
Disaster Description Counties Involved Disaster Cost
4035 09/23/2011 (6/1-8/1/2011)
Flooding Atchison, Doniphan, Leavenworth and Wyandotte $7,462,881
1885 03/09/2010 (12/9/2009-1/8/2010)
Severe Winter Storms and Snowstorm
Allen, Anderson, Atchison, Bourbon, Brown, Butler, Cherokee, Cheyenne, Clay, Cowley, Crawford, Decatur, Doniphan, Elk, Franklin, Gove, Graham, Greenwood, Jackson, Jefferson, Jewell, Labette, Linn, Logan, Lyon, Marshall, Miami, Morris, Nemaha, Neosho, Norton, Osage, Phillips, Pottawatomie, Rawlins, Republic, Riley, Shawnee, Sheridan, Wabaunsee, Wallace, Washington, Wilson, Woodson and Wyandotte
$19,100,658
1741 02/01/2008 Severe Winter Storms
Atchison, Barber, Barton, Brown, Butler, Chase, Cherokee, Clark, Clay, Cloud, Comanche, Crawford, Dickinson, Doniphan, Edwards, Ellis, Ellsworth, Ford, Geary, Graham, Gove, Harvey, Hodgeman, Jackson, Jefferson, Jewell, Kingman, Kiowa, Labette, Leavenworth, Lincoln, Logan, Lyon, Marion, Marshall, McPherson, Miami, Mitchell, Morris, Nemaha, Osage, Osborne, Ottawa, Pawnee, Phillips, Pottawatomie, Pratt, Reno, Republic, Rice, Riley, Rooks, Rush, Russell, Saline, Sedgwick, Shawnee, Sheridan, Smith, Stafford, Thomas, Wabaunsee, Wallace, Washington, and Woodson.
$359,557,345
1699 5/6/2007 (5/4/2007)
Severe Storms, Tornadoes, and Flooding
Barton, Brown, Chase, Cherokee, Clay, Cloud, Comanche, Cowley, Dickinson, Doniphan, Douglas, Edwards, Ellsworth, Harper, Harvey, Jackson, Kingman, Kiowa, Leavenworth, Lincoln, Lyon, Marshall, McPherson, Morris, Nemaha, Osage, Osborne, Ottawa, Pawnee, Phillips, Pottawatomie, Pratt, Reno, Rice, Riley, Saline, Shawnee, Smith, Stafford, Sumner, Wabaunsee, Washington
$117,565,269
1638 4/14/2006 (3/12-13/2006)
Severe Storms, Tornadoes, and Straight-Line Winds
Douglas, Wyandotte $6,233,044
1615 11/21/2005 (10/1-2/2005)
Severe Storms and Flooding
Atchison, Jackson, Jefferson, Leavenworth, Shawnee
$10,286,064
1579 2/8/2005 (1/4-6/2005)
Severe Winter Storm, Heavy Rains, and Flooding
Anderson, Atchison, Barber, Brown, Butler, Chase, Chautauqua, Clark, Coffey, Comanche, Cowley, Crawford, Douglas, Elk, Franklin, Greenwood, Harper, Harvey, Jackson, Jefferson, Kingman, Kiowa, Leavenworth, Lyon, Marion, McPherson, Morris, Osage, Pratt, Reno, Rice, Sedgwick, Shawnee, Sumner, Wabaunsee, Woodson, Wyandotte
$106,873,672
1562 09/30/2004 (8/27-30/2004)
Severe Storms, Flooding, and Tornadoes
Douglas, Wyandotte $2,103,376

Region L Hazard Mitigation Plan, 2013 Final 3.7
Declaration Number
Declaration Date*
Disaster Description Counties Involved Disaster Cost
1535 8/3/2004 (6/12-7/25/2004)
Severe Storms, Flooding, and Tornadoes
Barton, Butler, Cherokee, Decatur, Ellis, Geary, Graham, Jewell, Labette, Lyon, Marion, Mitchell, Morris, Ness, Osborne, Pawnee, Phillips, Rooks, Rush, Russell, Shawnee, Sheridan, Smith, Thomas, Trego, Wabaunsee, Wallace, Woodson, Wyandotte
$12,845,892
1462 5/6/2003 (5/4-30/2003)
Severe Storms, Tornadoes, and Flooding
Allen, Anderson, Cherokee, Crawford, Douglas, Haskell, Labette, Leavenworth, Meade, Miami, Neosho, Osage, Seward, Woodson, Wyandotte
$988,056
1402 2/6/2002 (1/29-2/15/2002)
Ice Storm
Allen, Anderson, Barber, Bourbon, Butler, Chautauqua, Cherokee, Coffey, Comanche, Cowley, Crawford, Douglas, Elk, Franklin, Greenwood, Harper, Jefferson, Johnson, Kingman, Kiowa, Labette, Leavenworth, Linn, Lyon, Miami, Montgomery, Neosho, Osage, Pratt, Sedgwick, Shawnee, Sumner, Wilson, Woodson, Wyandotte
$60,185,754
1258 11/5/1998 (10/30-11/15/1998)
Severe Storms and Flooding
Butler, Chase, Coffey, Cowley, Douglas, Franklin, Greenwood, Harper, Harvey, Johnson, Leavenworth, Lyon, Marion, Neosho, Saline, Sedgwick, Sumner, Wilson, Woodson, Wyandotte
1254 10/14/1998 (10/1-10/8/1998)
Severe Storms, Flooding, and Tornadoes
Bourbon, Cherokee, Douglas, Franklin, Jackson, Jefferson, Johnson, Leavenworth, Linn, Seward, Wabaunsee, Wyandotte

Region L Hazard Mitigation Plan, 2013 Final 3.8
Declaration Number
Declaration Date*
Disaster Description Counties Involved Disaster Cost
1000 7/22/1993 (6/28-10/5/1993)
Flooding, Severe Storms
Atchison, Barton, Brown, Chase, Cherokee, Clay, Cloud, Crawford, Dickinson, Doniphan, Douglas, Edwards, Ellis, Ellsworth, Geary, Graham, Harvey, Hodgeman, Jackson, Jefferson, Jewell, Johnson, Lane, Leavenworth, Lincoln, Lyon, Marion, Marshall, McPherson, Mitchell, Morris, Nemaha, Ness, Osage, Osborne, Ottawa, Pawnee, Pottawatomie, Reno, Republic, Rice, Riley, Rooks, Rush, Russell, Saline, Sedgwick, Shawnee, Sheridan, Smith, Stafford, Sumner, Thomas, Trego, Wabaunsee, Washington, Wyandotte
$99,790,368
539 9/20/1977 Severe Storms, Flooding
Atchison, Brown, Doniphan, Jackson, Jefferson, Johnson, Leavenworth, Nemaha, Shawnee, Wyandotte
$4,041,566
403 9/28/1973
Severe Storms, Tornadoes, Flooding
Atchison, Barber, Barton, Brown, Butler, Chase, Clay, Cloud, Coffey, Comanche, Cowley, Dickinson, Doniphan, Douglas, Edwards, Ellsworth, Franklin, Geary, Greenwood, Harper, Harvey, Jackson, Jefferson, Kingman, Kiowa, Leavenworth, Lincoln, Linn, Lyon, Marion, Marshall, McPherson, Miami, Morris, Nemaha, Osage, Ottawa, Pawnee, Pottawatomie, Pratt, Reno, Republic, Rice, Riley, Saline, Sedgwick, Shawnee, Stafford, Sumner, Wabaunsee, Washington, Woodson, Wyandotte
$4,296,913
378 5/2/1973 Severe Storms, Flooding
Atchison, Barber, Barton, Bourbon, Brown, Butler, Chautauqua, Cherokee, Clark, Coffey, Crawford, Dickinson, Doniphan, Douglas, Edwards, Ellsworth, Ford, Franklin, Gray, Greenwood, Harper, Harvey, Haskell, Hodgeman, Jackson, Jefferson, Kingman, Kiowa, Labette, Leavenworth, Lincoln, Linn, Lyon, Marion, Marshall, McPherson, Meade, Miami, Montgomery , Morris, Nemaha, Ness, Osage, Osborne, Ottawa, Pawnee, Pottawatomie, Pratt, Reno, Republic, Rice, Rush, Russell, Saline, Sedgwick, Seward, Shawnee, Stafford, Stevens, Sumner, Wabaunsee, Washington, Woodson, Wyandotte
$1,954,624
267 7/15/1969
Tornadoes, Severe Storms, Flooding
Allen, Anderson, Bourbon, Crawford, Dickinson, Douglas, Ellsworth, Franklin, Johnson, Leavenworth, Linn, Lyon, McPherson, Miami, Morris, Neosho, Osage, Saline, Woodson, Wyandotte
$733,524
229 7/18/1967
Tornadoes, Severe Storms, Flooding
Anderson, Atchison, Chase, Cloud, Coffey, Crawford, Doniphan, Douglas, Finney, Franklin, Harper, Jackson, Jefferson, Kingman, Leavenworth, Linn, Lyon, Marion, Miami, Mitchell, Nemaha, Ness, Osage, Pottawatomie, Republic, Washington, Wabaunsee
$847,439
Emergency Declarations

Region L Hazard Mitigation Plan, 2013 Final 3.9
Declaration Number
Declaration Date*
Disaster Description Counties Involved Disaster Cost
3324 6/25/2011 Flooding
Atchison, Doniphan, Leavenworth and Wyandotte
n/a
3282 12/12/2007 Severe Winter Storms
All n/a
3236 9/1/0/2005 Hurricane Katrina Evacuation
All n/a
Table 3.4 lists the U.S. Department of Agriculture Secretarial Disaster Declarations relevant to Region L for the period 2010 – 2012. Secretarial Disasters are designated from a natural disaster and require a minimum production loss of 30 percent for at least one crop.
Table 3.4 USDA Secretarial Disaster Declarations for Region L
Declaration Number
Declaration Date
Disaster Description Counties Involved
S3313 07/24/2012 Drought-Fast Track
Primary: Atchison, Brown, Doniphan, Jackson, Contiguous: Jefferson, Leavenworth, Nemaha, Pottawatomie, Shawnee
S3302 07/17/2012 Drought-Fast Track
Primary: Chase, Dickinson, Douglas, Ellis, Ellsworth, Franklin, Geary, Jefferson, Johnson, Leavenworth, Lincoln, Marion, Miami, Mitchell, Morris, Ness, Osage, Osborne, Ottawa, Rush, Russell, Saline, Shawnee, Smith, Wabaunsee, Wyandotte; Contiguous: Anderson, Atchison, Barton, Butler, Clay, Cloud, Coffey, Greenwood, Harvey, Jackson, Jewell, Linn, Lyon, McPherson, Pawnee, Phillips, Pottawatomie, Rice, Riley, Rooks, Trego,
S3299 04/1/2012 Drought and Heat
Primary: Missouri counties, Contiguous: Atchison, Bourbon, Cherokee, Crawford, Doniphan, Johnson, Leavenworth, Linn, Miami, Wyandotte
S3209 12/08/2011
Severe Storms, Thunderstorms, Hail & High Winds
Primary: Missouri counties: Contiguous: Atchison, Doniphan, Leavenworth, Wyandotte
S3186 10/14/2011 Drought & excessive heat
Primary: Missouri counties; Contiguous: Atchison, Bourbon, Cherokee, Crawford, Johnson,
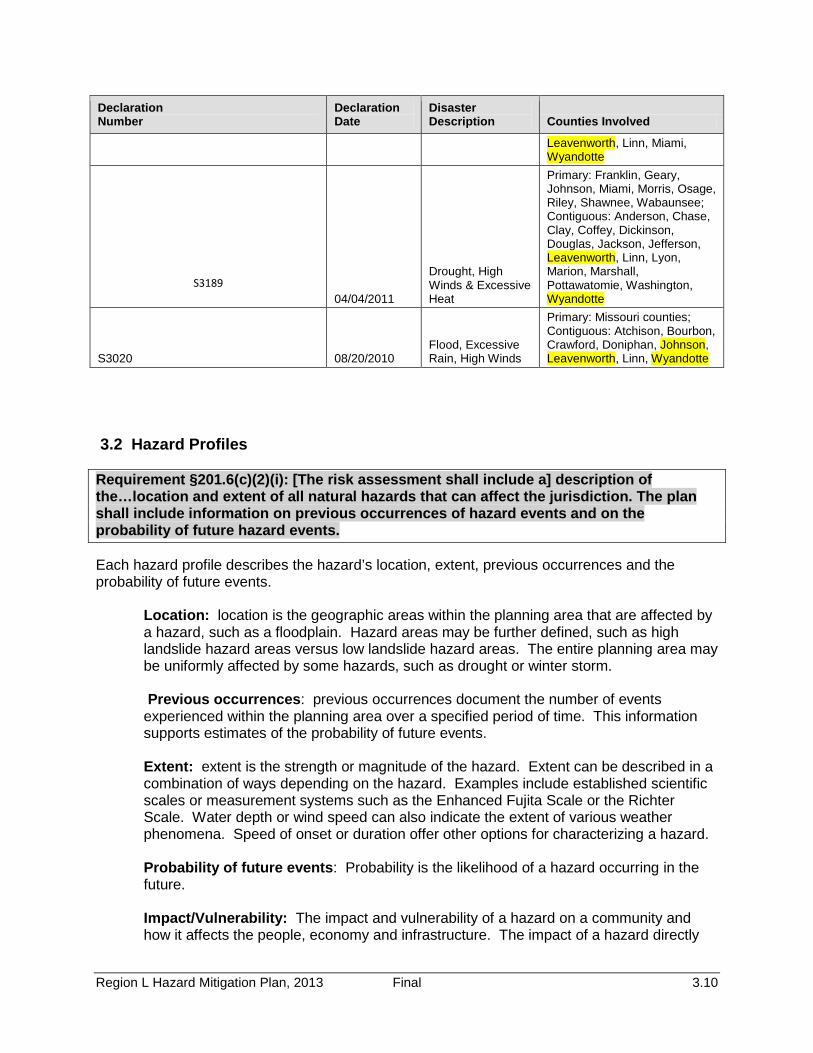
Region L Hazard Mitigation Plan, 2013 Final 3.10
Declaration Number
Declaration Date
Disaster Description Counties Involved
Leavenworth, Linn, Miami, Wyandotte
S3189 04/04/2011
Drought, High Winds & Excessive Heat
Primary: Franklin, Geary, Johnson, Miami, Morris, Osage, Riley, Shawnee, Wabaunsee; Contiguous: Anderson, Chase, Clay, Coffey, Dickinson, Douglas, Jackson, Jefferson, Leavenworth, Linn, Lyon, Marion, Marshall, Pottawatomie, Washington, Wyandotte
S3020 08/20/2010 Flood, Excessive Rain, High Winds
Primary: Missouri counties; Contiguous: Atchison, Bourbon, Crawford, Doniphan, Johnson, Leavenworth, Linn, Wyandotte
3.2 Hazard Profiles
Requirement §201.6(c)(2)(i): [The risk assessment shall include a] description of the…location and extent of all natural hazards that can affect the jurisdiction. The plan shall include information on previous occurrences of hazard events and on the probability of future hazard events.
Each hazard profile describes the hazard’s location, extent, previous occurrences and the probability of future events.
Location: location is the geographic areas within the planning area that are affected by a hazard, such as a floodplain. Hazard areas may be further defined, such as high landslide hazard areas versus low landslide hazard areas. The entire planning area may be uniformly affected by some hazards, such as drought or winter storm. Previous occurrences: previous occurrences document the number of events experienced within the planning area over a specified period of time. This information supports estimates of the probability of future events. Extent: extent is the strength or magnitude of the hazard. Extent can be described in a combination of ways depending on the hazard. Examples include established scientific scales or measurement systems such as the Enhanced Fujita Scale or the Richter Scale. Water depth or wind speed can also indicate the extent of various weather phenomena. Speed of onset or duration offer other options for characterizing a hazard.
Probability of future events: Probability is the likelihood of a hazard occurring in the future. Impact/Vulnerability: The impact and vulnerability of a hazard on a community and how it affects the people, economy and infrastructure. The impact of a hazard directly

Region L Hazard Mitigation Plan, 2013 Final 3.11
affects the vulnerability of the people, property, and environment, but so too does the vulnerability determine the level of the impact.
All profiles have been updated to include events that have occurred since the last plans were completed, amended to reflect any subsequent changes in probability and realigned to follow the organization of the SHMP. Profiles were further updated with more historical impact information where it was available. The vulnerability assessment and regional estimates of potential losses have been expanded, and statewide flood and earthquake losses have been quantified using HAZUS-MH. Resources used to compile these profiles can be found in Appendix D. 3.2.1 EMAP Consequence Analysis A consequence analysis of the potential for detrimental impacts of each hazard was conducted for the Emergency Management Accreditation Program (EMAP ). The analyses are included at the end of each hazard profile to support plan accreditation through that program. Each analysis addresses the following elements: • Impact on the Public:
− Health and safety of persons in the area of the incident • Impact on Responders:
− Health and safety of responders (i.e., firefighters, law enforcement, emergency management personnel, etc) in the area responding to the incident
• Continuity of Operations: − Activation of the Continuity of Operations Plan – will organization need to relocate in order to fulfill duties
• Delivery of Services: − Delivery of services such as food, medical, or any other life sustaining entities
• Impact on Property, Facilities, and Infrastructure: − Damages to structures (private and public), utilities, treatment plants, electric grid, roads, bridges, etc.
• Impact on the Environment: − How has the incident affected the surrounding environment, i.e., contamination (water , soil or air), erosion, crop damage, etc.
• Impact on the Economy: − Affects to the economy due to loss of revenue, clean up efforts, and reconstruction
• Impact of the Public Confidence in the jurisdiction‘s governance − How has the hazard affected public confidence
The Consequence Analysis includes ranking determinations for each of the above elements. The ranking elements are categorized as Minimal, Moderate, or Severe. The Hazard

Region L Hazard Mitigation Plan, 2013 Final 3.12
Identification and Risk Assessment portion of the Regional Mitigation Plan was used to ascertain prior damages in an effort to estimate ratings on future impacts. The ratings are meant to be a guide, and not all inclusive, due to the variances that could apply such as population, location, time, hazard type, and the amount of jurisdictions within the hazard area. For instance, an F5 tornado in Overland Park at 2:00 p.m. would have a greater impact than an F5 tornado in western Kansas at the same time but located in a set- aside field. Table 3.5 presents the methodology for determination of the ranking level (minimal, moderate, or severe) Table 3.5. Methodology for Consequence Analysis Ranking Levels
Impact On: Minimal Moderate Severe Public (people) < 5 = 5<15 15 or > Responders (people) <5 =5<15 15 or > COOP (days) Based of the tiers of the Coop
<0 1 to 7 8 or more
Delivery of Svcs (days) Based on the Tiers of the Coop
<1 1 to 7 8 or more
Property, Facilities, & Infrastructure ($ per capita) Based on FEMA minimum disaster requirements
<1.37 1.37 to 10.00 10.01 and up
Environment (%) <10 10 – 20 20.01 and up Economy (%) Based on unemployment percentage, applied as an indicator of the economy for the jurisdiction affected
<8% 8% to 15% 15% or more
Public Confidence (%) <1% 1.0% - 10% 10% or more The actual ranking for each hazard listed was based on the proximity of the hazard on the specific entity. Some were ranked across the board, due to the variances that could apply. For instance, Lightening has a severe impact if a home is directly hit. This could cause a fire that could spread to nearby homes. However, if a shed is hit then the impact would not be severe, therefore the ranking would be minimal to severe. Another example is hail. If individuals are in their home then impact to their health and safety would be minimal. However, if they are caught outdoors at a golf course or lake then the impacts could be severe.
The Hazard Profiles and Regional Risk Assessment that follow in are in alphabetical order by hazard title for ease of reference. The Regional CPRI is addressed first, followed by the county CPRI.
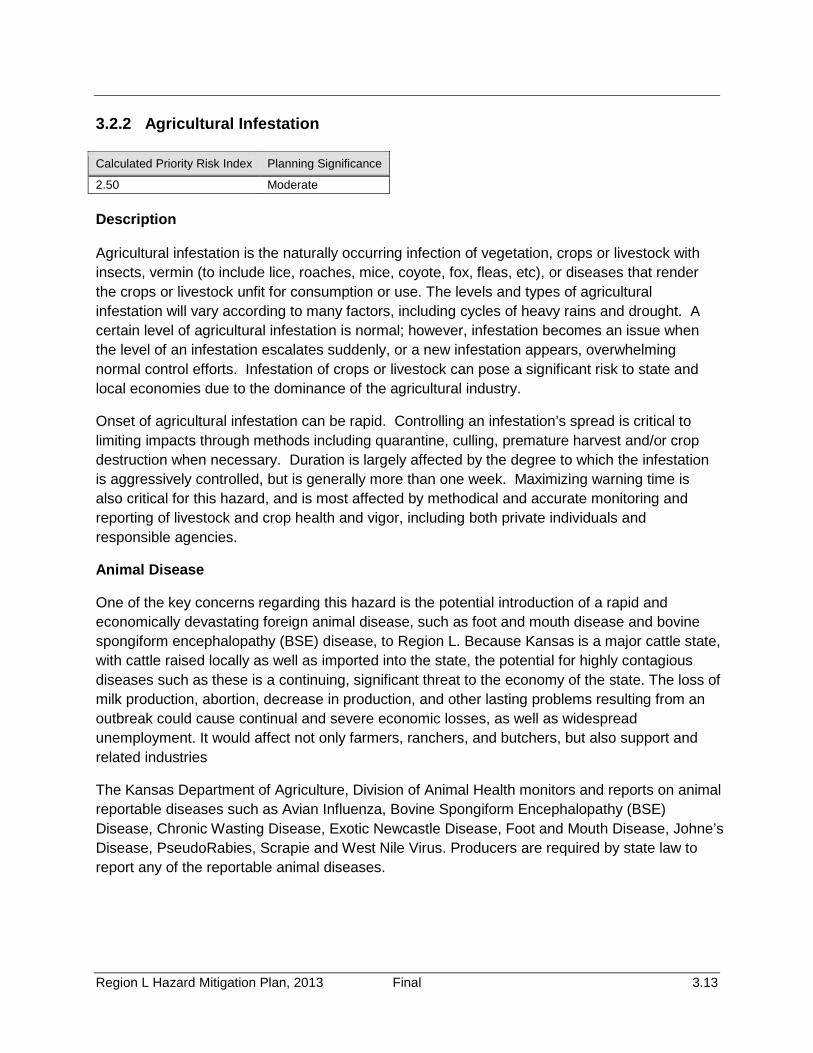
Region L Hazard Mitigation Plan, 2013 Final 3.13
3.2.2 Agricultural Infestation Calculated Priority Risk Index Planning Significance
2.50 Moderate Description Agricultural infestation is the naturally occurring infection of vegetation, crops or livestock with insects, vermin (to include lice, roaches, mice, coyote, fox, fleas, etc), or diseases that render the crops or livestock unfit for consumption or use. The levels and types of agricultural infestation will vary according to many factors, including cycles of heavy rains and drought. A certain level of agricultural infestation is normal; however, infestation becomes an issue when the level of an infestation escalates suddenly, or a new infestation appears, overwhelming normal control efforts. Infestation of crops or livestock can pose a significant risk to state and local economies due to the dominance of the agricultural industry.
Onset of agricultural infestation can be rapid. Controlling an infestation’s spread is critical to limiting impacts through methods including quarantine, culling, premature harvest and/or crop destruction when necessary. Duration is largely affected by the degree to which the infestation is aggressively controlled, but is generally more than one week. Maximizing warning time is also critical for this hazard, and is most affected by methodical and accurate monitoring and reporting of livestock and crop health and vigor, including both private individuals and responsible agencies.
Animal Disease
One of the key concerns regarding this hazard is the potential introduction of a rapid and economically devastating foreign animal disease, such as foot and mouth disease and bovine spongiform encephalopathy (BSE) disease, to Region L. Because Kansas is a major cattle state, with cattle raised locally as well as imported into the state, the potential for highly contagious diseases such as these is a continuing, significant threat to the economy of the state. The loss of milk production, abortion, decrease in production, and other lasting problems resulting from an outbreak could cause continual and severe economic losses, as well as widespread unemployment. It would affect not only farmers, ranchers, and butchers, but also support and related industries
The Kansas Department of Agriculture, Division of Animal Health monitors and reports on animal reportable diseases such as Avian Influenza, Bovine Spongiform Encephalopathy (BSE) Disease, Chronic Wasting Disease, Exotic Newcastle Disease, Foot and Mouth Disease, Johne’s Disease, PseudoRabies, Scrapie and West Nile Virus. Producers are required by state law to report any of the reportable animal diseases.
Region L Hazard Mitigation Plan, 2013 Final 3.14
Crop Pests/Diseases
Many factors influence disease development in plants, including hybrid/variety genetics, plant growth stage at the time of infection, weather (e.g., temperature, rain, wind, hail, etc.), single versus mixed infections, and genetics of the pathogen populations.
Field crops in the region are also subject to various types of infestation. Significant wheat crop losses because of these diseases are well documented in various areas of this region. Sorghum losses can occur when a crop is infected with sooty stripe early in the growing season. Aspergillus Ear Rot (Alfatoxin) is a growing problem for corn crops.
According to the Kansas Department of Agriculture, Plant Protection and Weed Control Division, the following are the highest risk crop pests to to this region:
• Corn – Aspergillus Ear Rot (Alfatoxin) • Soybean – Austro-Asian Rust • Wheat – Black Stem Rust, Blast – South American strains, Stripe Rust, Leaf Rust, Karnal
Bunt Infestation is not only a risk to crops in the field, but insect infestation can also cause major losses to stored grain. It is estimated that damage to stored grain by the lesser grain borer, rice weevil, red flour beetle, and rusty grain beetle costs the United States about $500 million annually.
Tree Pests
According to the Kansas Department of Agriculture, Plant Protection and Weed Control Division, the following are the highest risk plant pests by host to Kansas:
• Ash Trees – Emerald Ash Borer • Maple, Birch, Willow, Mimosa, Ash, Sycamore & Poplar Trees – Asian Longhorned
Beetle • Walnut Trees – Thousand Cankers
The Asian Longhorned Beetle is an exotic insect that threatens a wide variety of hardwood trees in Kansas. It is suspected that Asian Longhorned Beetle came to the U.S. via wood packing material from Asia. Tens of thousands of trees have been destroyed since it was first discovered in Brooklyn, New York in 1996. This beetle feeds on a wide variety of hardwood tree species that are native or planted in Kansas. It kills trees by creating large tunnels as larvae causing branches or stems to break and eventually lead to tree death. Because this beetle is not native to North America, it has no known natural enemies, and our trees have low resistance to this pest. While it has not been detected in Kansas, vigilance is paramount to prevention.
The Thousand Cankers is newly recognized disease in 2008 and first noticed in the western U.S. Currently it is located in both the east and western parts of the U.S. It has not been detected in Kansas. This disease is caused by a combination of a fungus and the walnut twig

Region L Hazard Mitigation Plan, 2013 Final 3.15
beetle. The walnut twig beetles carries fungal spores, and when they tunnel through the outer bark into the tree the fungus is transmitted during gallery construction. This has also been found if the beetle “tastes” the tree and does not produce a gallery. The fungus kills an area under the bark and the areas of dead tissue are called cankers. When the walnut twig beetles are abundant, numerous cankers can form and coalesce to girdle twigs and branches, restricting movement of water and nutrients. Black walnut, the most valuable native species to the state, is the most susceptible to this disease.
Emerald ash borer is a pest of ash trees native to Asia. This pest is a slender, emerald green beetle that is ½ inch long, and responsible for the destruction of approximately 20 million ash trees in Indiana, Illinois, Iowa, Kentucky, Maryland, Michigan, Minnesota, Missouri, New York, Ohio, Pennsylvania, Tennessee, Virginia, West Virginia, Wisconsin and Ontario, Canada. In 2012, it was detected in Kansas, Connecticut and Massachusetts. Financially, the United States risks an economic loss of $20 billion to $60 billion because of this pest. A complete devastation of ash trees could seriously affect our ecosystem.
According to the Kansas Forest Action Plan, revised 2011 from Kansas State University, ash trees are the third most common species of trees found in the native woodlands of Kansas. The Thousand Cankers Disease has not yet been found in Kansas. However, there are an estimated 26.2 million black walnut (35.3 million cubic feet) and 56.1 million green and white ash (60.8 million cubic feet) in Kansas rural and urban landscapes at risk. Most of these trees occur in the rural landscape (94 percent black walnut and 97 percent ash). It also estimates that there are 1.5 million ash trees in Kansas towns and cities.
On August 29, 2012, the Emerald Ash Borer pest was confirmed at the Wyandotte County Lake in Wyandotte County, Kansas. Previously in July 2012, it had been detected in Parkville, Missouri which is four miles from the Wyandotte County line. Immediately after confirmation by USDA, the Kansas Secretary of Agriculture implemented an emergency intrastate quarantine for Wyandotte County.
Figure 3.1 is a map of the Cooperative Emerald Ash Borer Project from the USDA, Animal and Plant Health Inspection Service. It shows the Federal Emerald Ash Borer (EAB) Quarantine and Authorized Transit areas as of October 1, 2012. Kansas is not shown as a Federal EAB Quarantine area. Neighboring Clay and Platte, Missouri counties are in the quarantine area.

Region L Hazard Mitigation Plan, 2013 Final 3.16
Figure 3.1 Map of Cooperative Emerald Ash Borer Project in the U.S. October 1, 2012
Source: USDA, Animal and Plant Health Inspection Service http://www.aphis.usda.gov/plant_health/plant_pest_info/emerald_ash_b/index.shtml
Region L Hazard Mitigation Plan, 2013 Final 3.17
Wildlife Pests
The region’s farmers also lose a significant amount of crops each year as a result of wildlife foraging. This can be particularly problematic in areas where natural habitat has been diminished or in years where weather patterns such as early/late frost deep snow, or drought has caused the wild food sources to be limited.
Also there are several fatal diseases that can affect the deer or captive elk population in Kansas. One is the Chronic Wasting Disease (CWD) and there is no known treatment or eradiation method. There have been 48 positive cases of CWD found in Kansas since surveillance started in 1996. The only preventive measure is for people to not transport live or dead deer or elk to those areas which have not been exposed to CWD.
Another disease called Hemorrhagic Disease (HD) is the most devastating viral disease of white-tailed deer in the U.S. according to the Southeastern Cooperative Wildlife Disease Study. The HD is transmitted by biting flies and the HD occurs seasonally in late summer and fall. Death losses during outbreaks are usually well below 25 percent of the deer population, but in a few instances have been 50 percent or more. There are no wildlife management tools or strategies available to prevent or control HM.
Other diseases such as bovine tuberculosis and a host of detrimental parasites such as exotic lice, meningeal worms, flukes, and stomach worms are fatal to deer and are transmitted more efficiently when deer are concentrated in a small area.
These diseases can seriously damage the populations of the captive deer and elk farms and the wild deer populations but also affect the annual $350 million dollar hunting economy in Kansas.
Location
The entire planning area may be affected by agricultural infestation. While rural areas within the region are more susceptible to crop and livestock infestation, urban and suburban areas are also at risk: landscaping, urban gardens and parks, all of which add value to homes and communities, may be susceptible to damage or loss. Agricultural infestation does not cause damage to buildings or critical facilities.
Previous Occurrences
• August 29, 2012: The emerald ash borer pest was confirmed at the Wyandotte County Lake in Wyandotte County, Kansas. Immediately after confirmation by USDA, the Kansas Secretary of Agriculture implemented an emergency intrastate quarantine for Wyandotte County. The stipulations for the quarantine can be found on the Kansas Department of Agriculture’s website: http://www.ksda.gov/plant_protection/content/379.
• 2001: A major infestation of webworms attacked the State’s alfalfa crop particularly in eastern Kansas.
• 1989: Gray leaf spot of corn was first identified in the State in the Republican River Valley. The disease reached economic threshold levels by 1992 and has caused economic damages somewhere in the State every year from 1992 to 1998. In 1998, it was the most

Region L Hazard Mitigation Plan, 2013 Final 3.18
severe in northeast Kansas and in the irrigated areas of south central and southwest Kansas.
Extent The magnitude and severity of an Agricultural Infestation is relative to the type of infestation. A foreign animal disease like foot and mouth could potentially cause the economy to crumble, whereas an infestation of fleas would be manageable. The planning committee has determined that the magnitude of this hazard in the planning area would be limited, as most infestations are manageable in scope. Probability of Future Hazard Events
Region L experiences agricultural losses every year as a result of insects, vermin or diseases that impact plants and livestock. The Probability for this hazard is “Highly Likely”. This probability does not denote that a major incidence will occur, but rather that incidences of any etiology will occur, regardless of the size.
Impact and Vulnerability
Table 3.6 provides an indication of the impact of agricultural infestation in Region L. This table only reflects insured losses that were claimed. According to the 2011 Kansas Crop Insurance profile Report issued by the USDA Risk Management Agency, 82 percent of Kansas row crops were insured in 2011 (there is no information available for the 18 percent of uninsured crop losses).
Data regarding the number or value of livestock and wildlife lost to disease or infestation was not available for this planning effort. An action for the Region has been submitted to facilitate a process by which animal loss can be tracked due to disease or infestation.
Table 3.6 Total Insured Crop Insurance paid per County in Region L from 2002 -2007, Top Livestock Inventory Number and Top Crop in Acres from USDA Census 2007
County Ann
ualiz
ed C
rop
Insu
ranc
e P
aid
for
Agr
icul
tura
l Inf
esta
tion
Dam
age
All
Goa
ts
Inve
ntor
y
Cat
tle &
Cal
ves
Inve
ntor
y
Hog
s &
Pig
s In
vent
ory
Hor
ses
& P
onie
s In
vent
ory
She
ep &
Lam
b In
vent
ory,
Woo
l P
rodu
ctio
n
Cor
n H
arve
sted
in
Acr
es
Fora
ge H
arve
sted
in
Acr
es
Sor
ghum
For
Gra
in
Har
vest
ed in
Acr
es
Soy
bean
s fo
r B
eans
Har
vest
ed
in A
cres
Whe
at H
arve
sted
in
Acr
es
Mitigation Planning Region L Johnson $2,501 659 13,911 2,717 2,303 2,519 11,992 17,841 941 20,993 5,755 Leavenworth $2,038 367 28,134 1,919 1,796 576 15,736 38,890 0 25,687 6,804 Wyandotte $0 225 1,734 37 368 0 1,963 2,814 0 6,013 (D) Total $4,538 1,251 43,779 4,673 4,467 3,095 29,691 59,545 941 52,693 12,559
Source: USDA Risk Management Agency, 2012; USDA Census of Agriculture, 2007.

Region L Hazard Mitigation Plan, 2013 Final 3.19
Note: (D) is cannot be disclosed. Depending on the type of infestations and location, the impact of an agricultural infestation could be moderate to severe. Leavenworth County has 1203 farms, which provides a market value of $33,219,000 of products sold. 63% is in crop sales and 37% is in livestock sales. Johnson County has 610 farms, which provides a market value of $40,659,000 in products sold. 72% is in crop sales and 28% is in livestock sales. Wyandotte County elected to not disclose this information for public use.
Should Region L have an agricultural infestation that affects crops or livestock, the impacts would reverberate throughout the community. With potential losses in the millions of dollars, the vulnerability of the Region would be felt throughout the economy.
Summary
Agricultural Infestation is a concern in the planning area as it pertains to crops, livestock, cultivated and landscaped gardens. While Leavenworth County is in the top 10 counties of Kansas for total number of farms with 1203, Johnson County has the highest market value of crop sales at $40,659.000. Should a potential infestation affect the Region, both counties could potentially take a large revenue loss which would hurt the local economy. Livestock sales in Leavenworth County supersede the value of livestock in Johnson or Wyandotte Counties at an estimated $12,236,000. Should a FAD or other infestation occur in this region the losses due to livestock contamination could also greatly hurt the farmers and the economy. While Wyandotte does not give actual market value of crops and livestock, at $5,112,000 total its loss would be less, but still painful.
Local Mitigation Concerns
• Region L has growers of sensitive and organic crops such as blueberries, grapes, fruit and nut trees, strawberries, and tomatoes which are vulnerable to vermin and disease. Another concern is the risk of pesticides used for crops to the west of the Region that through the easterly flow of the wind can damage these crops. The Kansas Department of Agriculture hosts a sensitive crop registry where growers can make their sensitive crop locations known. Pesticide applicators can use this registry to identify where extra care should be taken to protect these vulnerable crops. http://www.ksda.gov/pesticides_fertilizer/content/177
• There is the possibility of the Emerald Ash Borer pest spreading in Kansas. Cooperation from the public, firewood dealers, arborists, and the nursery industry to prevent further spreading is paramount to the success of isolating this pests. Prevention is far more cost-effective than trying to contain it as an established pest. The 1.5 million ash trees that grow in Kansas towns and cities will pose a great cost to Kansas in removal, stump grinding and replacement if the pest is found throughout the State.
• While Wyandotte County has the least amount of agricultural land in the state, it does have meat processing/distribution plants, and dairy processing/distribution facilities. These entities could be greatly impacted should a foreign animal disease hit any part of Kansas.

Region L Hazard Mitigation Plan, 2013 Final 3.20
• Johnson County saw a 7% decrease in the number of farms between the years of 2002 – 2007. Total land in farms decreased by 23%, and the average size of farms decreased by 17% (see Table 3.8). With the decrease in agricultural land comes a decrease in agricultural infestation. However, domesticated plants are still at risk, which include nurseries, and landscapes in residential and commercial areas.
Table 3.7. Johnson County Agricultural Land, 2002 – 2007
Farms 2007 2002 % Change
Number of farms 610 659 (7)
Land in farms 114,202 acres 148,606 acres (23) acres
Average Size of Farm 187 acres 226 acres (17) acres
Source: USDA, 2007 Census of Agriculture, www.agcensus.usda.gov
• According to the USDA, Leavenworth County has 1,203 farms, ranking it in the top 10 counties in Kansas. While the amount of land used for agricultural purposes decrease between the years 2002 – 2007, the number of farms increased, which lends itself to a higher risk of crop or animal infestation.
• Table 3.8. Leavenworth County Agricultural Land, 2002 - 2007
Farms 2007 2002 % Change
Number of farms 1203 1094 10
Land in farms 194,854 acres 197,168 acres (1)
Average Size of Farm 162 acres 180 acres (10)
Source: USDA, 2007 Census of Agriculture, www.agcensus.usda.gov
• Wyandotte County saw an increase of farms by 19% between the years 2002 – 2007. The amount of land in farms increased by 31%. This statistically raises the potential for agricultural infestation in the county.
Table 3.9. Wyandotte County Agricultural Land, 2002 - 2007
Farms 2007 2002 % Change
Number of farms 191 161 19
Land in farms 18,107 acres 13,804 acres 31 acres
Average Size of Farm 95 acres 86 acres 10 acres
Source: USDA, 2007 Census of Agriculture, www.agcensus.usda.gov

Region L Hazard Mitigation Plan, 2013 Final 3.21
The CPRIs for each county of Region L is provided below:
Johnson County
Johnson County CPRI: 2.65 – Moderate planning significance
Table 3.10. Johnson County Agricultural Infestation Ranking
Hazard Type Probability Magnitude Warning
Time Duration CPRI Planning
Significance
Agricultural Infestation 4 1 1 4 2.65 Moderate
Leavenworth County
Leavenworth County CPRI: 2.95 – Moderate planning significance
Table 3.11 Leavenworth County Agricultural Infestation Ranking
Hazard Type Probability Magnitude Warning
Time Duration CPRI Planning
Significance
Agricultural Infestation 4 2 1 4 2.95 Moderate
Wyandotte County
Wyandotte County CPRI: 2.65 – Moderate planning significance
Table 3.12 Wyandotte County Agricultural Infestation Ranking
Hazard Type Probability Magnitude Warning
Time Duration CPRI Planning
Significance
Agricultural Infestation 4 1 1 4 2.65 Moderate
Development in Hazard Prone Areas
Agricultural Infestation does not cause damage to buildings and critical facilities; however, as more agricultural land is converted to developed land, it will decrease agriculture infestation.
Consequence (Impact) Analysis
The information in Table 3.11 provides the Consequence Analysis of Potential for Detrimental Impacts of Hazards done for accreditation with the Emergency management Accreditation Program (EMAP).

Region L Hazard Mitigation Plan, 2013 Final 3.22
Table 3.13. EMAP Consequence Analysis: Agricultural Infestation
Subject Ranking Impacts/Agricultural Infestation Health and Safety of Persons in the Area of the Incident
Minimal Impact for this incidence on the Health and Safety of Persons in the area would be minimal. If the infestation is unrecognized, then there is the potential for the food supply to be contaminated.
Responders Minimal Impact to responders would be minimal with protective clothing, gloves, etc as these diseases cause no risk to humans.
Continuity of Operations Minimal Minimal expectation of execution of the COOP.
Property, Facilities, and Infrastructure Minimal Localized impact to facilities and infrastructure in the incident area is minimal to non-existent.
Delivery of Services Minimal Impacts to the delivery of services would be non-existent to minimal. Impact could be larger depending on the extent of the contaminated crop/crop loss.
Environment Minimal to Severe Impact could be severe to the incident area, specifically, plants, trees, bushes, and crops.
Economic Conditions Minimal to Severe Impacts to the economy will depend on the severity of the infestation. The potential for economic loss to the community and state could be severe if the infestation is hard to contain, eliminate, or reduce. Impact could be minimized due to crop insurance.
Public Confidence in Jurisdiction’s Governance
Minimal to Severe Confidence could be in question depending on timeliness and steps taken to warn the producers and public, and treat/eradicate the infestation.

Region L Hazard Mitigation Plan, 2013 Final 3.23
3.2.3 Civil Disorder Regional Calculated Priority Risk Index Planning Significance
2.80 Moderate
Description Civil disorder is a term that generally refers to groups of people purposely choosing not to observe a law, regulation, or rule, usually in order to bring attention to their cause, concern, or agenda. According to U.S. Code (18 U.S.C. §232), civil disorder is “any public disturbance involving acts of violence by a group of three or more persons causing immediate danger, damage, or injury to the property or person of another individual.” In Kansas, civil disorder is recognized as a societal hazard because of the associated potential for injury, loss of life, property damage, and economic disruption. Civil disorder can take the form of small gatherings or large groups impeding access to a building or disrupting normal activities by generating noise and intimidating people. They can range from a peaceful sit-in to a full-scale riot. Even in its more passive forms, a group that blocks roadways, sidewalks, or buildings interferes with public order.
Types of Crowds
Crowds can be classified into four general categories:
• Casual Crowd—A casual crowd is merely a group of people who happen to be in the same place at the same time. Examples of this type include shoppers and sightseers. The likelihood of violent conduct is all but nonexistent.
• Cohesive Crowd—A cohesive crowd consists of members who are involved in some type of unified behavior. Members of this group are involved in some type of common activity, such as worshiping, dancing, or watching a sporting event. Although they may have intense internal discipline (e.g., rooting for a team), they require substantial provocation to arouse to action.
• Expressive Crowd—An expressive crowd is one held together by a common commitment
or purpose. Although they may not be formally organized, they are assembled as an expression of common sentiment or frustration. Members wish to be seen as a formidable influence. One of the best examples of this type is a group assembled to protest something.
• Aggressive Crowd—An aggressive crowd is made up of individuals who have assembled for a specific purpose. This crowd often has leaders who attempt to arouse the members or motivate them to action. Members are noisy and threatening and will taunt authorities. They tend to be impulsive and highly emotional and require only minimal stimulation to arouse them to violence. Examples of this type of crowd include demonstrations and strikers.
Region L Hazard Mitigation Plan, 2013 Final 3.24
Types of Mobs
A mob can be defined as a large disorderly crowd or throng. Mobs are usually emotional, loud, tumultuous, violent, and lawless. Like crowds, mobs have different levels of commitment and can be classified into four categories:
• Aggressive Mob—An aggressive mob is one that attacks, riots, and terrorizes. The object of violence may be a person, property, or both. An aggressive mob is distinguished from an aggressive crowd only by lawless activity. Examples of aggressive mobs are the inmate mobs in prisons and jails, mobs that act out their frustrations after political defeat, or violent mobs at political protests or rallies.
• Escape Mob—An escape mob is attempting to flee from something such as a fire, bomb, flood, or other catastrophe. Members of escape mobs have lost their capacity to reason and are generally impossible to control. They are characterized by unreasonable terror.
• Acquisitive Mob—An acquisitive mob is one motivated by a desire to acquire something. Riots caused by other factors often turn into looting sprees. This mob exploits a lack of control by authorities in safeguarding property. Examples of acquisitive mobs would include the looting in South Central Los Angeles in 1992, or food riots in other countries.
• Expressive Mob—An expressive mob is one that expresses fervor or revelry following some sporting event, religious activity, or celebration. Members experience a release of pent up emotions in highly charged situations. Examples of this type of mob include the June 1994 riots in Canada following the Stanley Cup professional hockey championship, European soccer riots, and those occurring after other sporting events in many countries, including the United States.
Although members of mobs have differing levels of commitment, as a group they are far more committed than members of a crowd. As such, a “mob mentality” sets in, which creates a cohesiveness and sense of purpose that is generally lacking in crowds. Location The entire planning area of Region L is susceptible to Civil Disorder. Region L is the most densely populated portion of Kansas, making it easier for crowds or mobs to gather for a purported cause. The arena venues available for large crowds is also greater in this region, such as the Kansas Speedway, Sprint Center, and ABA sports arenas, and the shopping malls that cater to not only the residents of the region, but outside the region also. While the region varies in its economic interest, this does not negate the risk to the people and property. Leavenworth has a high military footprint, whereas Wyandotte County is more industrialized. Johnson County is the most populated county in Kansas and has an urban landscape. Each of these counties carry their own risk for Civil Disorder, from protest at the Leavenworth Penitentiary to Fighting Clubs in Wyandotte County. This hazard carries the risk to both people and property.
Region L Hazard Mitigation Plan, 2013 Final 3.25
Previous Occurrences The following are isolated events that show that the potential for civil disorder of any etiology or size can occur.
• Summer of 2012 saw a Bradley Manning Protest in North Leavenworth. Bradley Manning was arrested on suspicion of leaking information which contributed to the Wiki Leaks controversy. While being incarcerated at the Leavenworth Prison, the County spent over 30,000 in protecting or mitigation the protest of people in support of Manning. Business was at a standstill for over 6 hours to maintain a safe and secure passage of people traveling through Leavenworth City. This event involved over 80 officers from the Leavenworth area, along with the Kansas Highway Patrol. While there were no injuries, and Leavenworth County saw minimal damage, this event could have escalated but for Leavenworth’s proactive stance
• While not considered a civil disorder event, in November 2012 a video surfaced of a “Fight Club” at Wyandotte High School. This club was allegedly set up for entertainment for the kids involved, and there was no adult supervision or referees. These type of events could potentially get out of control, resulting in a civil disorder event, particularly in the case of a knife or gun being drawn
Extent While civil disorder is not an everyday occurrence in the planning area, when they do occur they are extremely disruptive and difficult to control. Law enforcement presence is often staffed below the peak loads at the start of an event like civil disorder, which in turn gives the event time to escalate. This hazard can occur anytime a large group gathers, which makes Region L particularly susceptible due to its venues for large gatherings and events. Political, social, or other causes make it difficult to determine when and where they will occur. Pre-planning is done to quell potential civil disturbances simply through the presence of sufficient law enforcement personnel and pre-planning for crowd control. Because Region L , specifically Johnson County, is the most densely populated area in Kansas, it is even more important that pre-planning be considered during events that have large crowd participation. Should a civil disorder event occur in the planning area the result could be measured in loss of life, economic upheaval, and destruction of property.
Probability of Future Hazard Events
Nationally, riots and civil disorder are likely to be a feature of life. Region L will no doubt not be unaffected by events that could lead to civil disorder, due to protests, demonstrations, or marches. Of notable concern is the rise nationally in school shootings and random shootings by individuals looking to make a statement or incite the masses. As depicted in the previous occurrences above, there have been only a couple of notable incidents in the past couple of years. While this is not a statistically significant amount, it does show that incidents are becoming disconcerting enough to report. The probability of this type of hazard occurring in Region L is “Possible” within the next 5 years.

Region L Hazard Mitigation Plan, 2013 Final 3.26
Impact and Vulnerability
Potential losses from Civil Disorder include infrastructure, critical facilities, and human life. The degree of impact would be directly related to the type of incident and the target. Potential losses could include cost of repair or replacement of damaged facilities, lost economic opportunities for businesses, loss of human life, injuries to persons, and immediate damage to the surrounding environment.
While it is not possible to predict the location of civil disorders, those locations with a higher population count are somewhat more likely to be susceptible to such incidents. The cost of a response and recovery from a civil disorder is difficult to determine.
As discussed previously, it is difficult to quantify potential losses in terms of the jurisdictions most threatened by Civil Disorder due to the many variables and human elements. Therefore, for the purposes of this plan, the loss estimates will take into account a hypothetical scenario. Please note that the hypothetical scenarios are included to provide a sample methodology for local jurisdictions to estimate potential losses.
****THE FOLLOWING HYPOTHETICAL SCENARIO IS FOR INSTRUCTIONAL AND ILLUSTRATIVE PURPOSES ONLY****
Riot Event
Scenario Overview: A large mob is formed following a football game which descends on the local downtown area. Potential losses with this type of scenario include both human and structural assets.
Assumptions: (1) The population density in the parking lot during the beginning and ending of the games is high, at least 5 persons per 25 square feet. (2) The level of violence among persons is moderate. (3) 6,000 persons crowd the streets.
Table 3.14. Described Losses:
Total Traumatic Injuries 250 persons
Total Urgent Care Injuries 1,000 persons
Injuries not Requiring Hospitalization 2,500 persons
Structures and Other Physical Assets (Damages would certainly occur to vehicles and depending on the proximity of other structures. The exact amount of these damages is difficult to predict because of the large numbers of factors, including the type of violence and the amount of insurance held by vehicle owners. )
Vehicles – Window /headlight replacement cost for approximately 200 vehicles @ $400 = $ 8,000 Repair / repainting cost for approximately 200 vehicles @ $ 4,000 per vehicle inside the BATF described Falling Glass Hazard = $800,000 Buildings – Window replacement cost for approximately 50 buildings @ $1600 per building = $80,000
Source: Kansas State Hazard Mitigation Plan

Region L Hazard Mitigation Plan, 2013 Final 3.27
Summary With a dense population of 1,149.6 people per square mile in Johnson County, 1,039 per square mile in Wyandotte County, and 164.7 people per square mile in Leavenworth County, a Civil Disorder event has the potential to affect a multitude of people. The more densely populated an area, the more damage that can be inflicted. This Region also has large venues for outdoor gatherings which can create the atmosphere for unrest, such as the Kansas Speedway, and large shopping malls. Leavenworth County has a presence of penitentiaries that can invite protest such as in the Bradley Manning case. These protest affect the businesses in the community and create an unsafe atmosphere for the residents, costing the community revenue.
Local Mitigation Concerns
• Region L is the most densely populated area in the State of Kansas, making it a high visibility region for the gathering of crowds and mobs. It is also a part of the Kansas City Metro area which also lends itself to varying degrees of emotions as they relate to current issues that can spark protest, whether controlled or uncontrolled. While there has not been any noteworthy riots or protest that have caused catastrophic economic, structural, or population loss, the potential is there due to the make-up of the region.
• Leavenworth County houses the Leavenworth Federal Penitentiary which has documented protests aimed at subject matter that creates a high emotional impact in various groups. The military presence itself is a deterrent to uncontrolled mobs, however, the risk remains due to the various high profile inmates that are serving their time there.
• Leavenworth, Wyandotte, and Johnson County’s are located approximately 65 miles from Topeka, KS, which is home to the Westboro Church. Known as a hate group due to its extreme ideologies and protest against gays, it is significant to the planning area due to its close proximity to the church’s headquarters. Headed by Fred Phelps, it is mainly made up of his large extended family who gather and protest at the funerals of fallen soldiers. Region L has been the recipient of these protest, and while they are normally peaceful, the potential for violence is always there.
Future Development
With human-caused hazards such as this that can have multiple variables involved, increases in development, and increases in the replacement cost of the built environment, can be a factor in increased cost of the event. The cost for such an event is largely related to the location and the level of violence the crowd chooses.
The CPRI for each county of Region L is broken out below:
Johnson County
Table 3.15. Johnson County CPRI:

Region L Hazard Mitigation Plan, 2013 Final 3.28
Hazard Type Probability Magnitude Warning
Time Duration CPRI Planning
Significance
Johnson County Civil Disorder 2 4 4 1 2.80 Moderate
Leavenworth County
Table 3.16. Leavenworth County CPRI:
Hazard Type Probability Magnitude Warning
Time Duration CPRI Planning
Significance
Leavenworth County Civil Disorder 2 4 4 1 2.80 Moderate
Wyandotte County
Table 3.17. Wyandotte County CPRI:
Hazard Type Probability Magnitude Warning
Time Duration CPRI Planning
Significance
Wyandotte Civil Disorder 2 4 4 1 2.80 Moderate
Hazard Consequence Analysis Impact Overview
When rioting does break out, it generally proves extremely difficult for law enforcement authorities to stop the violence promptly. The rules of constitutional law set stringent limits on how police officers can behave toward the people they try to arrest. Restraint also plays a crucial part in avoiding any action that “fans the flames.” Initial police presence is often undermined because forces may be staffed below the peak loads needed to bring things back under control. As a result, the riot may continue until enough state police or National Guard units arrive to bolster the arrest process and subsequently restore order. In many cases, damage to life and property may already be extensive.
The information in Table 3.18 provides the Impact Analysis of Potential for Detrimental Impacts of Hazards done for accreditation with the Emergency Management Accreditation Program (EMAP).
Table 3.18. Regional Consequence Analysis: Civil Disorder
Subject Ranking Impacts/Civil Disorder
Health and Safety of Persons in the Area of the Incident
Severe Impact could be severe for persons in the incident area.

Region L Hazard Mitigation Plan, 2013 Final 3.29
Responders Minimal to Severe Impact to responders could be severe if not trained and properly equipped. Responders that are properly trained and equipped will have a low to moderate impact.
Continuity of Operations Minimal to Severe Depending on damage to facilities/personnel in the incident area, re-location may be necessary and lines of succession execution (minimal to severe).
Property, Facilities, and Infrastructure
Severe Impact within the incident area could be severe for explosion, moderate to low for Hazmat.
Delivery of Services Minimal to Severe Delivery of services could be affected within and around the affected area especially if communications, road and railways, and facilities incur damage (minimal to severe).
Environment Minimal to Severe Localized impact within the incident area could be severe depending on the type of human caused incident.
Economic Conditions Minimal to Severe Economic conditions could be adversely affected and dependent upon time and length of clean up and investigation (minimal to severe).
Public Confidence in Jurisdiction’s Governance
Minimal to Severe Impact will be dependent on whether or not the incident could have been avoided by government or non-government entities, clean-up and investigation times, and outcomes. (minimal to severe)

Region L Hazard Mitigation Plan, 2013 Final 3.30
3.2.4 Dam and Levee Failure
Calculated Priority Risk Index Planning Significance
2.10 Moderate
Description Region L has with many dams and levees. The failure of these structures could result in injuries, loss of life and property, and environmental and economic damage. While levees are built solely for flood protection, dams often serve multiple purposes, one of which may be flood control. Severe flooding and other storms can increase the potential that dams and levees will be damaged and fail as a result of the physical force of the flood waters or overtopping.
Dams and levees are usually engineered to withstand a flood with a computed risk of occurrence. If a larger flood occurs, then that structure will likely be overtopped. If during the overtopping the dam or levee fails or is washed out, the water behind it is released as a flash flood. Failed dams and levees can create floods that are catastrophic to life and property because of the tremendous energy of the released water.
Dams
A dam is defined by the National Dam Safety Act as an artificial barrier that impounds or diverts water and (1) is more than 6 feet high and stores 50 acre feet or more or (2) is 25 feet or more high and stores more than 15 acre feet. Dam owners have primary responsibility for the safe design, operation, and maintenance of their dams. They also have responsibility for providing early warning of problems at the dam, for developing an effective emergency action plan, and for coordinating that plan with local officials.
Dams can fail for many reasons. The most common are as follows:
• Piping—Internal erosion caused by embankment leakage, foundation leakage, and/or deterioration of pertinent structures appended to the dam;
• Erosion—Inadequate spillway capacity causing overtopping of the dam, flow erosion, and/or inadequate slope protection;
• Structural Failure—Caused by an earthquake, slope instability, and/or faulty construction.
State-Regulated Dams In Kansas, the State has regulatory jurisdiction over non-federal dams that meet the following definition of a “jurisdictional” dam as defined by K.S.A. 82a-301 et seq, and amendments thereto:
any artificial barrier including appurtenant works with the ability to impound water, waste water or other liquids that has a height of 25 feet or more; or has a height of six feet or greater and also has the capacity to impound 50 or more acre feet. The height of a dam or barrier shall be determined as follows: (1) A

Region L Hazard Mitigation Plan, 2013 Final 3.31
barrier or dam that extends across the natural bed of a stream or watercourse shall be measured from the downstream toe of the barrier or dam to the top of the barrier or dam; or (2) a barrier or dam that does not extend across a stream or watercourse shall be measured from the lowest elevation of the outside limit of the barrier or dam to the top of the barrier or dam.
The Kansas Department of Agriculture, Division of Water Resources (KDA-DWR) is the State agency responsible for regulation of jurisdictional dams. Within the Division of Water Resources, the Water Structures Program has the following Responsibilities: reviewing and approving of plans for constructing new dams and for modifying existing dams, ensuring quality control during construction, and monitoring dams that, if they failed, could cause loss of life, or interrupt public utilities or services
Dam classifications have been developed to describe the level of risk associated with dam failure. These classifications do not reflect the physical condition of the dams, but rather describe areas downstream of the dams that could be impacted in the event of failure, which is generally unlikely. The KDA-DWR classifies jurisdictional dams as follows:
• Class C (high hazard)—A “hazard class C dam” shall mean a dam located in an area where failure could result in any of the following: extensive loss of life, damage to more than one home, damage to industrial or commercial facilities, interruption of a public utility serving a large number of customers, damage to traffic on high-volume roads that meet the requirements for hazard class C dams or a high-volume railroad line, inundation of a frequently used recreation facility serving a relatively large number of persons, or two or more individual hazards described in hazard class B. Emergency Action Plans (EAPs) are required for all High Hazard Dams.
• Class B (significant hazard)—A “hazard class B dam” means a dam located in an area where failure could endanger a few lives, damage an isolated home, damage traffic on moderate volume roads that meet the requirements for hazard class B dams, damage low-volume railroad tracks, interrupt the use or service of a utility serving a small number of customers, or inundate recreation facilities, including campground areas intermittently used for sleeping and serving a relatively small number of persons.
• Class A (low hazard)—A “hazard class A dam” means a dam located in an area where failure could damage only farm or other uninhabited buildings, agricultural or undeveloped land including hiking trails, or traffic on low-volume roads that meet the requirements for hazard class A dams.
At the time this plan was developed there were 320 state-regulated jurisdictional dams in Region L. Of those, 73 were Class C (High Hazard Dams), 14 were Class B (Significant Hazard Dams), and 256 were Class A (Low Hazard Dams).
Location
Table 3.19 provides the numbers of state-regulated low, significant, and high hazard dams for each county in Region L.

Region L Hazard Mitigation Plan, 2013 Final 3.32
County Low Hazard
Dams Significant
Hazard Dams High Hazard
Dams
High Hazard Dams Without
EAP Total Dams
The map in Figure 3.2 provides the point locations of Significant and High Hazard State-regulated dams in the Region L planning area. High and Significant Hazard Dams for each county will be listed under the county summary.
Region L Johnson 68 9 31 15 108 Leavenworth 159 3 6 3 168 Wyandotte 29 2 13 5 44 Total 256 14 50 23 320

Region L Hazard Mitigation Plan, 2013 Final 3.33
Figure 3.2. High and Significant Dams
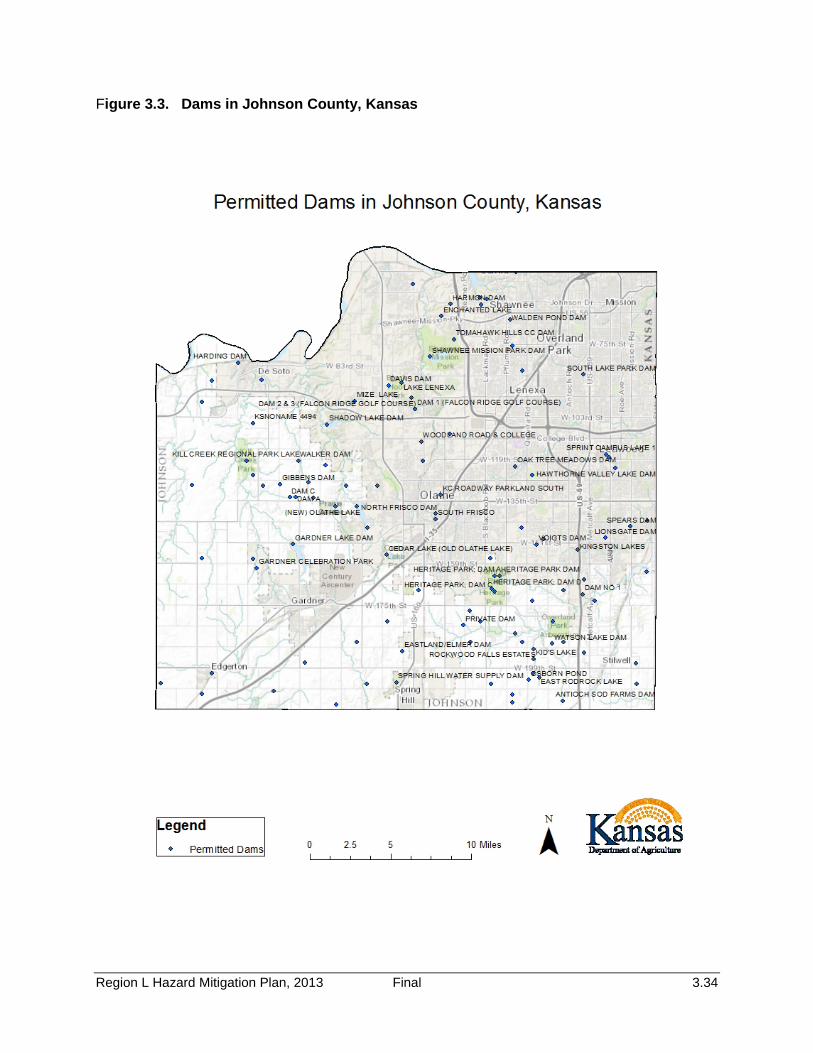
Region L Hazard Mitigation Plan, 2013 Final 3.34
Figure 3.3. Dams in Johnson County, Kansas

Region L Hazard Mitigation Plan, 2013 Final 3.35
Figure 3.4. Dams in Leavenworth County, Kansas

Region L Hazard Mitigation Plan, 2013 Final 3.36
Figure 3.5. Dams in Wyandotte County, Kansas

Region L Hazard Mitigation Plan, 2013 Final 3.37
Federal Dams/Reservoirs
Within the planning area there are 3 dams that are maintained and operated by the federal government. The following table shows the federally operated reservoirs in Region L.
Table 3.20 Federal Reservoirs in Region L
MT Planning Region
Reservoir County
Year Storage Began
Operating Agency*
River Basin
Contributing Drainage Area (Sq.
miles)
Surface Area
(acres)
Est. Storage Capacity
(acre feet)
L Merritt Lake Leavenworth 1/1/1942 US ARMY NR NR 19 L Smith Lake Leavenworth 1/1/1942 US ARMY NR NR 9 L Sunflower
Pond B Dam Johnson 1/1/1943 US ARMY NR NR 36
Of particular interest for Region L are the Dams/Reservoirs in Nebraska. As evidenced during the 2011 Missouri River flooding, the dams upstream can play a huge role in what happens downstream. When releases exceed capacity it creates a domino effect on the dams and levees downstream in Kansas, ultimately leading to the planning area via the Missouri River.
Nebraska: There are nine high hazard dams in southern Nebraska Counties that border Kansas as follows:
• Harlan county-Harlan County Dam • Thayer County-Hebron Dam • Gage County-Little Indian Creek 15A Dam, Upper Big Nemaha 25C Dam, Mud Creek 2A
Dam, and Big Indian Creek 14B Dam. • Richardson County-Long Branch 21 Dam
Page 3.46 describes the impact of the 2011 Missouri River Flood on the levee’s in Kansas.
Levees
Levees are earth embankments constructed along rivers and coastlines to protect adjacent lands from flooding. Floodwalls are concrete structures, often components of levee systems, designed for urban areas where there is insufficient room for earthen levees. Levees are usually engineered to withstand a flood with a computed risk of occurrence. When a larger flood occurs and/or levees and floodwalls and their appurtenant structures are stressed beyond their capabilities to withstand floods, levee failure can result in loss of life and injuries as well as damages to property, the environment, and the economy. In Kansas, there are hundreds of levees ranging in size from small agricultural levees that were constructed primarily to protect farmland from high frequency flooding to large urban levees that were constructed to protect people and property from larger, less frequent flooding events, such as the 100-year and 500-year flood events. For purposes of this plan, the levee failure hazard will refer to both

Region L Hazard Mitigation Plan, 2013 Final 3.38
overtopping and breach of a levee as defined in FEMA’s publication “So You Live Behind a Levee” (http://content.asce.org/ASCELeveeGuide.html)
• Overtopping: When a Flood Is Too Big—Overtopping occurs when floodwaters exceed the height of a levee and flow over its crown. As the water passes over the top, it may erode the levee, worsening the flooding and potentially causing an opening, or breach, in the levee.
• Breaching: When a Levee Gives Way—A levee breach occurs when part of a levee gives way, creating an opening through which floodwaters may pass. A breach may occur gradually or suddenly. The most dangerous breaches happen quickly during periods of high water. The resulting torrent can quickly swamp a large area behind the failed levee with little or no warning.
Levees are usually engineered to withstand a flood with a computed risk of occurrence. Many levees in the planning are were largely constructed to protect agricultural land and are not built to design standards established to protect people and property. Their presence can, in some cases, generate a false sense of security. Levees have been constructed across the region by public and private entities with varying levels of protection, inspection oversight, and maintenance. Currently there is no one comprehensive database of all levees in the planning area. However, significant strides have been made toward compiling such an inventory. In 2010, FEMA published the Midterm Levee Inventory (MLI) database of levees. The MLI contains levee data gathered primarily for structures that were designed to provide protection from at least the base (1-percent-annual-chance) flood. Levees that provide protection for less than the base flood event are included, but only were data was readily available. The MLI was developed to complement the USACE National Levee Database (NLD). During development of this plan update, USACE was in the process of integrating the MLI with the NLD to provide a more comprehensive database of levees. Every effort was made during development of this plan to consider all known levees from both databases. The levee failure hazard profile and risk assessment in this plan are further discussed in four categories: 1. Levees in the USACE levee Safety Program 2. FEMA Accredited Levees 3. Levees that are both in the USACE Levee Safety Program and Accredited by FEMA 4. All other levees Levees in the USACE Levee Safety Program The Levee Safety program (LSP) was created by the USACE in 2006 to assess the integrity and viability of levees and to make sure levee systems do not present unacceptable risk to the public, property, and environment. Under this program the USACE conducts levee inspections. These inspections are used to rate levee systems to determine compliance with operation and maintenance requirements, understand the overall levee condition, and determine eligibility for federal rehabilitation assistance under P.L. 84-99.
Region L Hazard Mitigation Plan, 2013 Final 3.39
According to the National Levee Database managed by USACE, there are currently 12 levees in Region L that are included in the Levee Safety Program, of which 7 are rated minimally acceptable, and 5 were not reported. See Table 3.22 for ratings of specific levees in the USACE Levee Safety Program.
FEMA Accredited Levees
Many levees shown on effective Flood Insurance Rate Maps (FIRM) were mapped in the 1970s and 1980s and have never been remapped by FEMA. Prior to 1986, levees were shown on FIRMs as providing protection from the base flood when they were designed and constructed in accordance with sound engineering practices. Since 1986, levees have been shown as accredited on FIRMs only when they meet the requirements of 44 CFR 65.10 “Mapping Areas Protected by Levee Systems”, including certification by a registered professional engineer or a Federal agency with responsibility for levee design.
Levees that do not meet the requirements of 44 CFR 65.10 cannot be shown as accredited on a FIRM. Furthermore, floodplain areas behind the levee are at risk to base flood inundation and are mapped as high risk areas subject to FEMA’s minimum floodplain management regulations and mandatory flood insurance purchase requirement.
In 2004, as it initiated work under the Flood Map Modernization Initiative (Map Mod), FEMA determined that analysis of the role of levees in flood risk reduction would be an important part of the mapping efforts. A report issued in 2005 noted that the status of the Nation‘s levees was not well understood and the condition of many levees and floodwalls had not been assessed since their original inclusion in the NFIP. As a result, FEMA established policies to address existing levees.
For the remainder of this discussion, FEMA Accredited levees will be discussed in two main types: Those mapped on Digital Flood Insurance Rate Maps (DFIRM) since the Flood Map Modernization Initiative and those that were mapped prior to the Flood Map Modernization Initiative and are not mapped on DFIRMs.
FEMA Accredited Levees mapped on DFIRMs
As DFIRMs are developed, levees fall under one of the three following categories:
Accredited Levee - With the except of areas of residual flooding (interior drainage), if the data and documentation specified in 44 CFR 65.10 is readily available and provided to FEMA, the area behind the levee will be mapped as a moderate-risk area. There is no mandatory flood insurance purchase requirement in a moderate-risk area, but flood insurance is strongly recommended.
Provisionally Accredited Levee (PAL) - If data and documentation is not readily available, and no known deficiency precludes meeting requirements of 44 CFR 65.10, FEMA can allow the party seeking recognition up to two years to compile and submit full documentation to show compliance with 44 CFR 65.10. During this two-year period of provisional accreditation, the area

Region L Hazard Mitigation Plan, 2013 Final 3.40
behind the levee will be mapped as moderate-risk with no mandatory flood insurance purchase requirement.
De-Accredited Levees – If the information established under 44 CFR 65.10 is not readily available and provided to FEMA, and the levee is not eligible for the PAL designation, the levee will be de-accredited by FEMA. If a levee is de-accredited, FEMA will evaluate the level of risk associated with each non-accredited levee through their Levee Analysis Mapping Procedures (LAMP) criteria to consider how to map the floodplain and which areas on the dry side of the levee will be shown as high risk. The mapping will then be updated to reflect this risk..
Location – Levee’s
Region L has all of their accredited levees through FEMA on DFIRMs. Figure 3.6 shows the status within the region.

Region L Hazard Mitigation Plan, 2013 Final 3.41
Figure 3.6. Status of DFIRMs

Region L Hazard Mitigation Plan, 2013 Final 3.42
Table 3.21. Region L DFIRM With Levees
Mitigation Planning Region DFIRM Counties with Levees
L Leavenworth
L Wyandotte
FEMA Accredited Levees not Mapped on DFIRMs
All accredited levees in Region L have been mapped on DFIRMs.
Levees that are both in the USACE Levee Safety Program and Accredited by FEMA
Table 3.22 shows the list of levees in Region L that are in the USACE levee Safety Program and accredited through FEMA.
Table 3.22. Levees in Region L
Mitigation Planning Region County Levee Name
USACE LSP
USACE District
USACE Inspection Rating MLI
Flooding Source Accredited
DFIRM
Design Frequency
L Johnson Johnson_Kansas_River_1 No N/A N/A Yes
KANSAS RIVER No Yes Unknown
L Johnson Johnson_Kansas_River_2 No N/A N/A Yes
KANSAS RIVER No Yes Unknown
L Leavenworth Fall Leaf Drainage District Yes KC
Minimally Acceptable Yes
KANSAS RIVER No Yes
< 1% Annual Chance
L Leavenworth Ft. Leavenworth Yes KC Not Reported Yes
MISSOURI RIVER No Yes
<1% Annual Chance
L Leavenworth
Grape-Bollin-Schwartz Levee Association-Leavenworth Yes KC
Not Reported Yes
MISSOURI RIVER No Yes
< 1% Annual Chance
L Leavenworth Kansas Department Of Corrections Yes KC
Minimally Acceptable Yes
MISSOURI RIVER No Yes
< 1% Annual Chance
L Leavenworth Lawrence Unit-Leavenworth Yes KC
Minimally Acceptable Yes
KANSAS RIVER Yes Yes
1% Annual Chance
L Leavenworth Lower Iatan Bend No N/A N/A Yes MISSOURI RIVER No Yes
< 1% Annual Chance
L Leavenworth Wolcott Drainage District Section 1 Yes KC
Not Reported Yes
MISSOURI RIVER No Yes
< 1% Annual Chance
L Wyandotte Argentine Unit Yes KC Minimally Acceptable Yes
KANSAS RIVER Yes Yes
1% Annual Chance
L Wyandotte Armourdale Unit Yes KC Minimally Acceptable Yes
KANSAS RIVER Yes Yes
1% Annual Chance
L Wyandotte Cid, Kansas Yes KC Minimally Acceptable Yes
MISSOURI RIVER Yes Yes
1% Annual Chance
L Wyandotte Fairfax-Jersey Creek Yes KC Minimally Acceptable Yes
KS & MO RIVERS Yes Yes
1% Annual Chance
L Wyandotte Lower Fairfax No N/A N/A Yes KS & MO RIVERS Yes Yes
1% Annual Chance
L Wyandotte Nearman Creek Power Station Levee No N/A N/A Yes
MISSOURI RIVER Yes Yes
1% Annual Chance
L Wyandotte Wolcott Drainage District Section 2 Yes KC
Not Reported Yes
MISSOURI RIVER No Yes
< 1% Annual Chance
L Wyandotte Wolcott Drainage District Section 3 Yes KC
Not Reported No
Not Reported No
Unknown

Region L Hazard Mitigation Plan, 2013 Final 3.43
Figure 3.7 Shows the location of the accredited levees in Leavenworth County, and Figure 3.8 and 3.8a show the location of the Levees in Wyandotte County.
Figure 3.7. Levee’s In Leavenworth County
Source: FEMA.gov
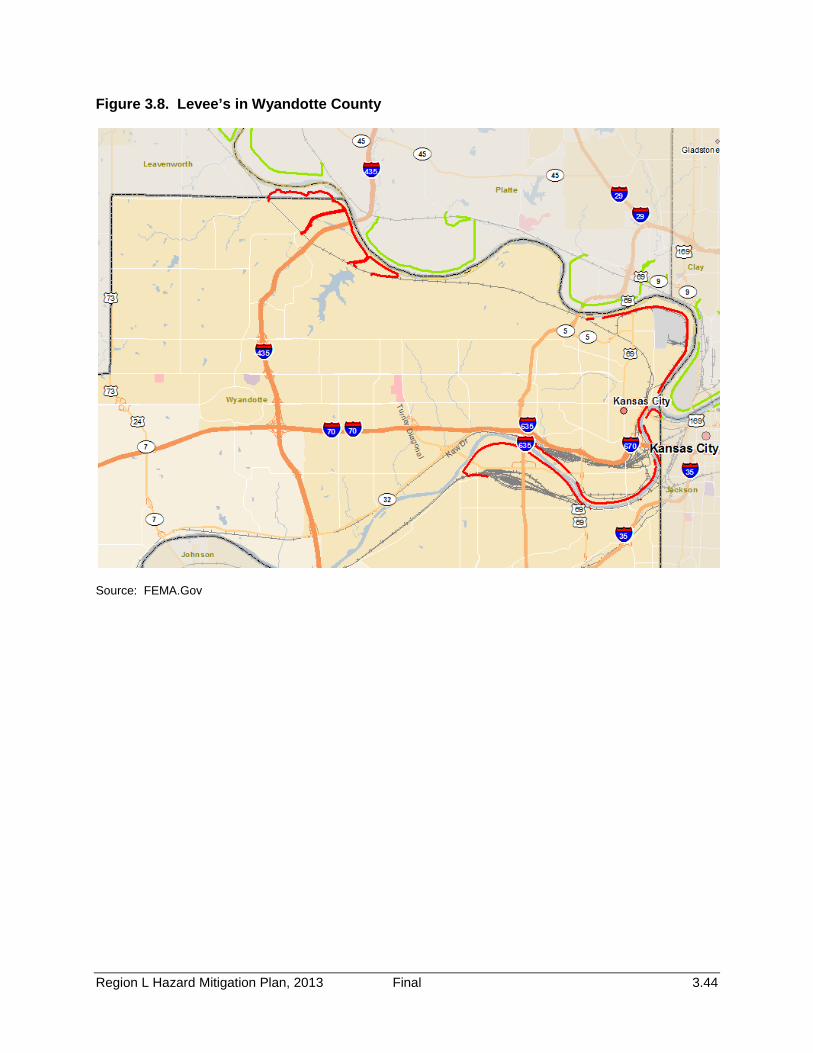
Region L Hazard Mitigation Plan, 2013 Final 3.44
Figure 3.8. Levee’s in Wyandotte County
Source: FEMA.Gov

Region L Hazard Mitigation Plan, 2013 Final 3.45
Figure 3.8A. Levee’s in Wyandotte County
Previous Occurrences
This section discusses previous occurrences for dam and levee failure in Region L:
Dam Failure
According to Stanford University‘s National Performance of Dams Program, there were 31 dam incidents in Kansas between 1925 and 2002. Of these 31 incidents, 7 (23 percent) of them were failures. While Region L had 4 incidences, none of them were dam failures. Table 3.23 reflects the dams in Region L that had incidences.

Region L Hazard Mitigation Plan, 2013 Final 3.46
Table 3.23. Region L Dam Incidence
MT Planning Region
County
NID # Dam Name Incident Date Incident Type
Dam Failure
L Wyandotte KS02987 Ksnoname 2987 5/14/1997 Seepage; Piping No
L Leavenworth KS01253
Demaranville, Don, Sarcoxie Lake Dam 7/25/2001
Seepage; Headcut in the emergency spillway No
L Leavenworth KS01251 Larson, Dr. O.M. 1/22/2001 Piping; Seepage No L Wyandotte KS02987 Ksnoname 2987 3/6/2002 Seepage No
Source: Stanford University’s National Performance of Dams Program, http://ce-npdp-serv2.stanford.edu/DamDirectory/DamIncidentQuery/IncidentForm.jsp; *=These dams could not be located in the current state inventory. It is possible that these dams have been removed.
Levee Failure
• 2011 Flood: USACE reported that every non-federal levee from Rulo to Wolcott, Kansas on both sides of the river were either overtopped or breached as a result of this flood. Specifically, the following levees along the Missouri River and tributaries in Leavenworth County were breached.
− Grape Bollin-Schwartz levee − Sherman Airfield Levee (federal levee)—water reached the hangars which had been
evacuated. − Ft. Leavenworth levee − Kansas Department of Corrections Levee
The Levee Repair Working Group of the Missouri River Flood Task Force, established in response to the Missouri River Basin flood of 2011, reported that the following federal and non-federal levees in Region L were damaged by the flooding.
Table 3.24 Region L levees damaged during Missouri River Flooding of 2011
Project Type Project Name MR Mile Markers State City
Non-Federal Grape-Bollin-Schwartz Levee Association 409.9 to 406.2 KS Leavenworth
Non-Federal Kansas Department of Corrections 394.0 to 388.0 KS Leavenworth Non-Federal Wolcott Drainage District Section 1 386.4 to 383.7 KS Wyandotte Non-Federal Wolcott Drainage District Section 2 386.4 to 383.7 KS Wyandotte Non-Federal Wolcott Drainage District Section 3 382.3 to 381.3 KS Wyandotte
Source: Missouri River Flood Task Force, http://www.nwdmr.usace.army.mil/rcc/MRFTF/docs/20JunListofLeveeRehabsv1.pdf
• 2009 Flooding: Two non-federal Kansas levees were damaged by flooding in 2009 as follows: Wolcott Levee Section 1 and Wolcott Levee Section 2.

Region L Hazard Mitigation Plan, 2013 Final 3.47
Figure 3.9. 2009 Flood Damaged Levees in Region L
Source: USACE KC District Website, http://www.nwk.usace.army.mil/Portals/29/docs/emergencymanagement/leveerehab/2009-LeveeRepairs-Status-MO.pdf
• 1993 Floods: During the spring floods of 1993, which covered nine Midwest states, a high percentage of crop acres in the U.S. Army Corps of Engineers KC District floodplain areas suffered losses because of overtopping of nine of the 15 units in the federally constructed Missouri River Levee System and virtually all the nonfederal farm levees in the district
Extent
Region L is a highly populated and traveled area within the state which is co-located with the Missouri and Kansas Rivers. The levees and dams that protect the planning area are critical to ensuring the safety of the population, property, and infrastructure. The planning committee has determined that a dam or levee failure could be critical to population and property in the Region.
Probability of Future Hazard Events Dam Failure
Due to the variability of the size and construction of the dams in Region L, estimating the probability of dam failure is difficult on any scale greater than a case-by-case basis. The limited data on previous occurrences indicates that in the last 87 years, there have been 7 recorded dam failure events in Kansas which is less than 1 event in 10 years, and no failures within the Region. Therefore, this hazard’s CPRI probability is “Unlikely” (event is possible within the next 10 years)
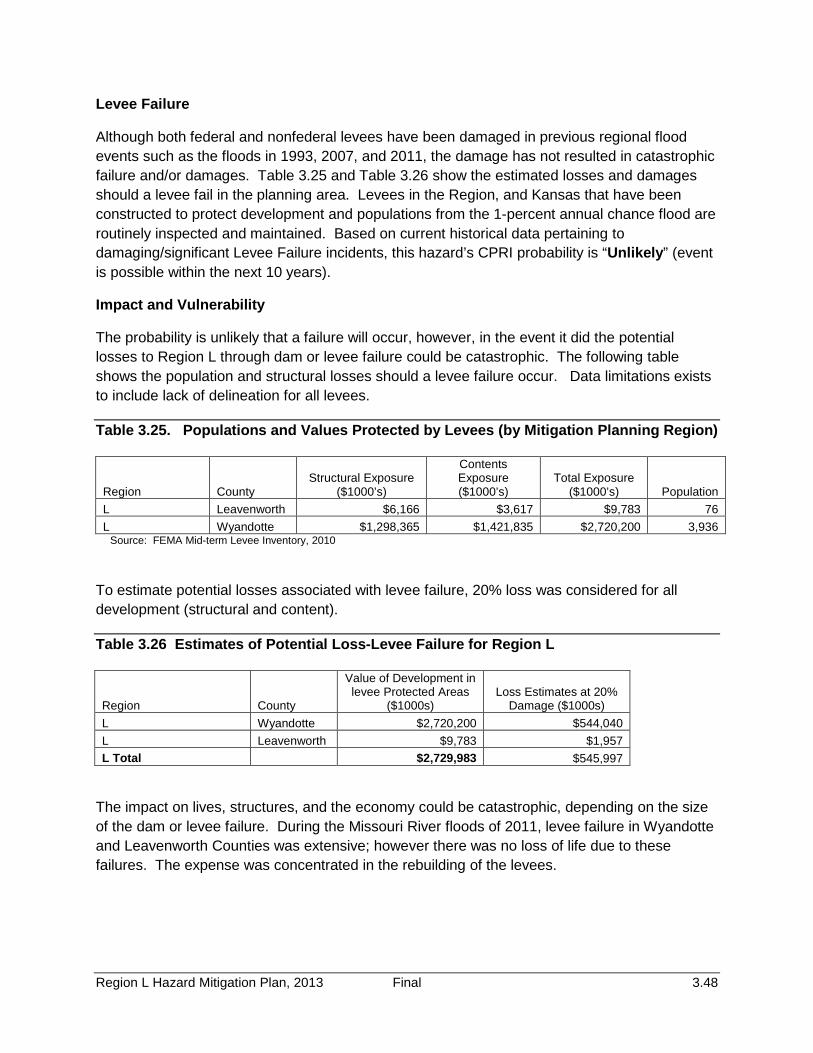
Region L Hazard Mitigation Plan, 2013 Final 3.48
Levee Failure
Although both federal and nonfederal levees have been damaged in previous regional flood events such as the floods in 1993, 2007, and 2011, the damage has not resulted in catastrophic failure and/or damages. Table 3.25 and Table 3.26 show the estimated losses and damages should a levee fail in the planning area. Levees in the Region, and Kansas that have been constructed to protect development and populations from the 1-percent annual chance flood are routinely inspected and maintained. Based on current historical data pertaining to damaging/significant Levee Failure incidents, this hazard’s CPRI probability is “Unlikely” (event is possible within the next 10 years).
Impact and Vulnerability
The probability is unlikely that a failure will occur, however, in the event it did the potential losses to Region L through dam or levee failure could be catastrophic. The following table shows the population and structural losses should a levee failure occur. Data limitations exists to include lack of delineation for all levees.
Table 3.25. Populations and Values Protected by Levees (by Mitigation Planning Region)
Region County Structural Exposure
($1000’s)
Contents Exposure ($1000’s)
Total Exposure ($1000’s) Population
L Leavenworth $6,166 $3,617 $9,783 76 L Wyandotte $1,298,365 $1,421,835 $2,720,200 3,936
Source: FEMA Mid-term Levee Inventory, 2010
To estimate potential losses associated with levee failure, 20% loss was considered for all development (structural and content).
Table 3.26 Estimates of Potential Loss-Levee Failure for Region L
Region County
Value of Development in levee Protected Areas
($1000s) Loss Estimates at 20%
Damage ($1000s) L Wyandotte $2,720,200 $544,040 L Leavenworth $9,783 $1,957 L Total
$2,729,983 $545,997
The impact on lives, structures, and the economy could be catastrophic, depending on the size of the dam or levee failure. During the Missouri River floods of 2011, levee failure in Wyandotte and Leavenworth Counties was extensive; however there was no loss of life due to these failures. The expense was concentrated in the rebuilding of the levees.

Region L Hazard Mitigation Plan, 2013 Final 3.49
Dams
All high and significant hazard dams are required to have and maintain emergency action plans in the event of an incident. This has not been re-enforced and throughout the state the number of dams far exceeds the number that have plans. State-wide this number is 111 plans for the 227 high hazard dams, and only 19 plans for the 209 significant dams.
The Kansas Water Plan noted in 2009 that some of the dams are exhibiting structural deficiencies due to age, and post-construction development downstream of others has raised their hazard class.
Some of the common problems seen with aging dams are:
• Deteriorating metal pipes and structural components
• Inadequate hydrologic capacity
• Increased runoff because of upstream development
To complete an analysis of vulnerability to dam failure as well as attempt to describe vulnerability in terms of the jurisdictions most threatened by dam failure, points were assigned to each type of dam and then aggregated for a total point score for each county. Points were assigned as follows for each dam: Low Hazard Dams, 1 point, Significant Hazard Dams, 2 points, High Hazard Dams, 3 points, High Hazard Dams without an EAP, an additional 2 points, Federal Reservoir Dams, 3 points. This analysis does not intend to demonstrate vulnerability in terms dam structures that are likely to fail, but rather provides a general overview of the counties that have a high number of dams, with weighted consideration given to dams whose failure would result in greater damages. Table 3.27 shows the results of this analysis for each county in Region L.
Table 3.27 Dam Failure Vulnerability Analysis
County
Low Hazard Dams
Significant Hazard Dams
High Hazard Dams
High Hazard Dams
Without EAP
Federal Reservoirs
Vulnerability Rating
Vulnerability Level
Mitigation Planning Region L
Johnson 68 9 31 15 1 212 High
Leavenworth 159 3 6 3 2 195 Medium-High
Wyandotte 29 2 13 5
82 Medium
Total 256 14 50 23 3 489 Source: Kansas Department of Agriculture, Division of Water Resources, Water Structures program, U.S. Army Corps of Engineers, Bureau of Reclamation, U.S. Army, U.S. Fish and Wildlife, State Hazard Mitigation Plan
Table 3.28 shows the top ten counties by dam failure vulnerability rating based on the vulnerability analysis methodology described above. The top ten counties for the state are shown to put the placement of the counties of Region L in perspective.

Region L Hazard Mitigation Plan, 2013 Final 3.50
Table 3.28 Top 10 Counties by Dam Failure Vulnerability Rating
Mitigation Planning Region County
Vulnerability Rating
K Jefferson 327 G Butler 277 K Jackson 267 K Brown 243 K Atchison 225 L Johnson 212 K Nemaha 206 L Leavenworth 195 J Shawnee 190 H Greenwood 187
Source: State Hazard Mitigation Plan, 2013
Levees
Delineation of areas protected is included in the MLI geo-database for 107 of the 136 levees cataloged. To complete an analysis of vulnerability to levee failure as well as attempt to describe vulnerability in terms of the jurisdictions most threatened by levee failure, this data was used, along with census block data available in HAZUS MH 2.1 to determine the number of people and the value of development in these identified levee protected areas. This analysis does not attempt to evaluate which levees are more prone to overtopping or failure, but rather provide a general picture of those counties that have more people and property protected by levees and therefore the potential for more damage if failure or overtopping were to occur.
Table 3.29 provides a breakdown by county of the population, structure value, contents value, and total value in levee protected areas for the planning area levees in the MLI with available delineated protection areas. This data is to be used only for general determination of those areas of the state that could suffer the greatest losses in the event of levee failure events. Data limitations prevent a more accurate analysis including: lack of delineation of protected areas for all levees and, lack of statewide parcel-type data which would provide more accurate results in determining structures and values within levee protected areas.
Table 3.29 Populations and Values Protected by Levees
Mitigation Planning Region
County Structure Exposure (1,000s)
Contents Exposure (1000s)
Total Exposure (1000s) Population
L Leavenworth $6,166 $3,617 $9,783 76 L Wyandotte $1,298,365 $1,421,835 $2,720,200 3,936 L Total
$1,304,531 $1,425,452 $2,729,983 4,012

Region L Hazard Mitigation Plan, 2013 Final 3.51
Table 3.30 Top 10 Counties – Development and Populations Protected by Levees
Development Population
Mitigation Planning Region
County Total Development in Levee Protected Areas
Mitigation Planning Region
County Population
G Sedgwick $18,180,862 G Sedgwick 140,247 G Reno $5,090,378 G Reno 45,171 F Saline $4,621,575 F Saline 41,580 L Wyandotte $2,720,200 J Shawnee 19,047 J Shawnee $2,278,254 E Barton 16,751 E Barton $1,848,122 G Cowley 12,904 G Cowley $1,441,248 B Ellis 9,603 B Ellis $1,164,170 D Ford 4,728 I Riley $521,874 L Wyandotte 3,936 F Dickinson $438,595 F Dickinson 3,543
Source: State Hazard Mitigation Plan, 2013
Summary
Region L has low, significant and high hazard dams within its borders (see page 3.32, Table 3.19), and numerous accredited and unaccredited levees. The levees provide protection to $2,729,983 in property with a 20% loss estimate of $545,997, and approximately 4000 individuals. A levee failure could be catastrophic for the planning area, however, the probability of this happening is unlikely. While there have been four dam incidences in Region L (see Table 3.23), there have been no dam failures within the planning area. The criticality of dams and levees in this particular region is the large population and property base. Maintaining and inspecting the dams and levees in the region is paramount for the safety and well-being of these individuals. Actions for maintenance, upgrades, inspections, and continued public education on this hazard are addressed in Chapter 4.
Local Mitigation Concerns
• Region L has its borders on the Missouri River and the Kansas River, which are prone to flooding during high precipitation events. As with the floods of 2011, even states as far north as Montana can add to this problem when they have record snow or rainfall, even when Kansas is in a drought. Ensuring that the levees and dams maintain their structural integrity to protect against breeches, overtopping, and failure continues to be a main priority.
• Johnson and Leavenworth County have grown since the census of 2000 was taken and with that population growth is the critical area of housing growth, and ensuring that the floodplains remain in a green zone as construction on new housing ensues (see the land use maps in Section 2, Jurisdictional Profiles).

Region L Hazard Mitigation Plan, 2013 Final 3.52
• While Wyandotte County has not seen the growth of Johnson and Leavenworth Counties, it does have a high industrial and commercial footprint. Mitigating against commercial loss can be an expensive endeavor for the county and its residents.
• The USACE maintains many levee’s in and around the planning area, however, there are also levees that are not federally maintained, so local jurisdictions or private property owners are responsible for maintaining the structures. As the levees age, the costs to repair and rebuild them will increase.
Development in Hazard Prone Areas Of the top 10 counties with the highest vulnerability rating for dam failure, 4 were also in the top 10 for greatest housing unit gains from 2000 to 2010. Two of those four counties are Johnson and Leavenworth. The potential exists for development to occur within the Region’s many dam inundation zones, increasing the vulnerability of the population and structures, however, Region L has strict policies, ordinances, and codes in place that all developers must adhere to in order to prevent damages that could incur. (Future land use maps can be found in Chapter 2). While no dam failures have occurred in the planning area, the ageing of the existing dams suggest that it could happen. Reasons attributed to an ageing dam failure could be deteriorating metal pipes and structural components, inadequate hydrologic capacity, and increased runoff because of upstream development. Ensuring the maintenance, inspections, and needed repairs of the dams and levees in the region can help prevent the potential for loss of life and property, as well as carefully managing any development in the vicinity of the dams in the area. The region has numerous actions identified to address this hazard to include repairs, upgrades, and maintenance which can be found in their entirety in chapter 4.
Levee Failure
Of the top 10 counties in terms of development protected by levees, none in Region L made the list. However, Leavenworth and Wyandotte counties do have numerous levees that do protect property and lives. If additional development and population growth is occurring in levee protected areas this increases the vulnerability should a levee failure or overtopping occur. It is paramount to the Region to monitor development in the areas that have levee’s, and maintain, upgrade, and mitigate repairs when needed. The region has identified a multitude of actions in Chapter 4 that address these steps in order to protect the population and structures that are protected by levees.
Johnson County
Table 3.31. Johnson County CPRI
Hazard Type Probability Magnitude Warning
Time Duration CPRI Planning
Significance
Johnson County Dam and Levee Failure 1 3 2 3 1.95 Low

Region L Hazard Mitigation Plan, 2013 Final 3.53
Leavenworth County
Table 3.32. Leavenworth County CPRI
Hazard Type Probability Magnitude Warning
Time Duration CPRI Planning
Significance
Leavenworth County Dam and Levee Failure 1 3 4 4 2.35 Moderate
Wyandotte County
Table 3.33. Wyandotte County CPRI
Hazard Type Probability Magnitude Warning
Time Duration CPRI Planning
Significance
Leavenworth County Dam and Levee Failure 1 4 3 3 2.40 Moderate
Consequence (Impact) Analysis When a dam fails, the stored water can be suddenly released and have catastrophic effects on life and property downstream. Homes, bridges, and roads can be demolished in minutes. At least 7 dam failures have occurred in Kansas since 1924. Residents near a Significant or High Hazard dam should become familiar with the dam’s emergency actions plans, if available. Emergency plans written for dams include procedures for notification and coordination with law enforcement and other governmental agencies, information on the potential inundation area, plans for warning and evacuation, and procedures for making emergency repairs.
The impact of levee failure during a flooding event can be very similar to a dam failure in that the velocity of the water caused by sudden release as a result of levee breach can result in a flood surge or flood wave that can cause catastrophic damages. If the levee is overtopped as a result of flood waters in excess of the levee design, impacts are similar to flood impacts.
The information in Table 3.30 provides the Consequence Analysis of Potential for Detrimental Impacts of Hazards done for accreditation with the Emergency Management Accreditation Program (EMAP).
Table 3.34 Consequences Analysis: Dam and Levee Failure
Subject Ranking Impacts/Dam and Levee Failure
Health and Safety of Persons in the Area of the Incident
Severe Localized impact expected to be severe for the inundation area and moderate to minimal for other affected areas.
Responders Minimal Impact to responders is expected to be minimal with proper training. Impact could be severe if there is lack of training.
Continuity of Operations Minimal Temporary relocation may be necessary

Region L Hazard Mitigation Plan, 2013 Final 3.54
if inundation affects government facilities.
Property, Facilities, and Infrastructure Minimal to Severe Localized impact could be severe in the inundation area of the incident to facilities and infrastructure. The further away from the incident area the damage lessens to minimal to moderate.
Delivery of Services Minimal to Severe Delivery of services could be affected if there is any disruption to the roads and/or utilities due to the inundation. Minimal to severe depending on area size and location affected.
Environment Severe Impact will be severe for the immediate impacted area. Impact will lessen as distance increases from the immediate incident area.
Economic Conditions Minimal to Severe Impacts to the economy will greatly depend on the scope of the inundation and the amount of time it takes for the water to recede.
Public Confidence in Jurisdiction’s Governance
Minimal to Severe Depending on the perception of whether the failure could have been prevented, warning time, and the time it takes for response and recovery will greatly impact the public’s confidence.

Region L Hazard Mitigation Plan, 2013 Final 3.55
3.2.5 Drought
Calculated Priority Risk Index Planning Significance
2.95 Moderate
Description
Drought is defined as a condition of moisture levels significantly below normal for an extended period of time over a large area that adversely affects plants, animal life, and humans. It can also be defined in terms of meteorology, agricultural, hydrological and socio-economic.
Meteorological drought is defined on the basis of the degree of dryness (in comparison to some “normal” or average amount) and the duration of the dry period. A meteorological drought must be considered as region-specific since the atmospheric conditions that result in deficiencies of precipitation are highly variable from region to region.
Agricultural drought links various characteristics of meteorological (or hydrological) drought to agricultural impacts, focusing on precipitation shortages, differences between actual and potential evaporation, soil water deficits, reduced ground water or reservoir levels, and so forth. Plant water demand depends on prevailing weather conditions, biological characteristics of the specific plant, its stage of growth, and the physical and biological properties of the soil. Deficient topsoil moisture at planting may hinder germination, leading to low plant populations per hectare and a reduction of final yield. However, if topsoil moisture is sufficient for early growth requirements, deficiencies in subsoil moisture at this early stage may not affect final yield if subsoil moisture is replenished as the growing season progresses or if rainfall meets plant water needs.
Hydrological drought is associated with the effects of periods of precipitation (including snowfall) shortfalls on surface or subsurface water supply (i.e., streamflow, reservoir and lake levels, ground water). The frequency and severity of hydrological drought is often defined on a watershed or river basin scale. Although all droughts originate with a deficiency of precipitation, hydrologists are more concerned with how this deficiency plays out through the hydrologic system. Hydrological droughts are usually out of phase with or lag the occurrence of meteorological and agricultural droughts. It takes longer for precipitation deficiencies to show up in components of the hydrological system such as soil moisture, streamflow, and ground water and reservoir levels. As a result, these impacts are out of phase with impacts in other economic sectors.
Socioeconomic drought refers to when physical water shortage begins to affect people.
The four different definitions all have significance in the planning area. A meteorological drought is the easiest to determine based on rainfall data and is an easier drought to monitor from rain gauges and reports. A hydrological drought means that stream and river levels are low, which also has an impact for surface water and ground water irrigators. In addition, discharges from reservoirs that are made to meet in stream targets, further reduce the levels in

Region L Hazard Mitigation Plan, 2013 Final 3.56
the reservoirs—some of which are set to protect threatened and endangered mussel populations. An agricultural drought represents difficulty for the region’s agricultural-based economy and is also relatively easy to monitor based on crop viabilities for different regions.
Periods of drought are normal occurrences in the region as a whole. Drought in the area is caused by severely inadequate amounts of precipitation that adversely affect farming and ranching, surface and ground water supplies, and uses of surface waters for navigation and recreation. Drought can also create favorable conditions for wildfires and wind erosion (See Section 3.3.20 Wildfire and Section 3.3.16 Soil Erosion and Dust).
The impacts of drought can be categorized as economic, environmental, or social. Many economic impacts occur in agriculture and related sectors, including increasing food prices globally. In addition to obvious losses in yields in both crop and livestock production, drought is associated with increases in insect infestations, plant disease, and wind erosion. Droughts also bring increased problems with insects and disease to forests and reduce growth. The incidence of wildfires increases substantially during extended droughts, which in turn places both human and wildlife populations at higher levels of risk. Income loss is another indicator used in assessing the impacts of drought because so many sectors are affected.
Although environmental losses are difficult to quantify, increasing public awareness and concern for environmental quality has forced public officials to focus greater attention and resources on these effects. Environmental losses are the result of damages to plant and animal species, wildlife habitat, and air and water quality, wildfires, degradation of landscape quality, loss of biodiversity, and soil erosion. Some of the effects are short-term and conditions quickly return to normal following the end of the drought. Other environmental effects linger for some time or may even become permanent. Wildlife habitat, for example may be degraded through the loss of wetlands, lakes, and vegetation. However, many species will eventually recover from this temporary aberration. The degradation of landscape quality, with increased soil erosion, may lead to a more permanent loss of biological productivity of the landscape.
Although drought is not predictable, long-range outlooks may indicate an increased chance of drought, which can serve as a warning (P.L. 109-430 established a National Integrated Drought Information System within the National Oceanic and Atmospheric Administration to improve drought monitoring and forecasting capabilities http://www.drought.gov/drought/). A drought period can last for months, years, or even decades. It is rarely a direct cause of death, though the associated heat, dust, and stress can all contribute to increased mortality.
Location
All of Region L is at risk, and has been in a drought 10% to 14.9% of the 100 years that span 1895 – 1995. Drought affects agricultural land as well as the urban landscape and can put stress on homeowners should their property have structural issues due to lack of moisture content in the soil. Another issue would be power production should the Missouri and Kansas Rivers become extremely low, and wildfires could increase threatening land, property, and people.

Region L Hazard Mitigation Plan, 2013 Final 3.57
Figure 3.10. Region L Drought Index 1895-1995

3.58
In Region L, the primary source of water is surface water from rivers, federal reservoirs, multipurpose small lakes, and municipal lakes. Region L is bordered by the Missouri River and the Kansas River at various points, which are a main source of water for the Region.
As of 26 Feburary 2013, the U.S. Drought Monitor shows Region L as being in a severe drought, down from an exceptional drought, as shown in figure 3.10.
Previous Occurrences
Drought specifics that apply to only Region L are difficult to ascertain due to the wide area of land mass that is affected. Because of this hazard anomaly, the following depicts drought for the whole state and not just the region.
Kansas has had recurring periods of drought throughout history, some of them lasting for extended periods of time. Figure 3.10 shows Kansas was in severe or extreme drought between 10 and 14.9% Percent of the last century. The Dust Bowl years of the 1930s being the most well known. But, as Table 3.34 shows, drought in Kansas is a recurring theme.
Table 3.34. Drought State Declaration Summary 2000-2012
Date Executive Order Emergency Warning Watch Total
Counties
7/24/2012 12-10 105 0 0 105 7/03/2012 12-08 36 55 14 105 5/04/2012 12-07 0 16 75 91 11/21/2011 11-48 40 24 37 101 10/05/2011 11-37 30 29 27 86 9/02/2011 11-29 17 42 21 80 8/24/2011 11-27 15 26 36 77 4/07/2011 11-06 0 20 27 47 8/22/2008 08-11 0 4 7 11 6/11/2008 08-07 0 5 8 13 5/14/2007 07-13 0 0 0 0 3/06/2007 07-04 0 3 57 60 8/21/2006 06-09 0 105 0 105 3/20/2006 06-04 0 80 25 105 2/07/2006 06-03 0 6 66 69 9/08/2004 04-09 0 6 9 15 6/15/2004 04-08 31 12 14 57 10/27/2003 03-22 28 77 0 105 8/22/2003 03-19 11 0 0 11 8/22/2003 03-18 0 94 0 94 7/31/2003 03-163 0 0 52 52 7/31/2003 03-153 0 53 0 53 7/30/2002 0 83 22 105 7/03/2002 0 61 0 61 5/03/2002 0 0 41 41

3.59
Date Executive Order Emergency Warning Watch Total
Counties
7/12/2000 UREP & SO
6/09/2000 KLR & MO
Source: Kansas Water Office, www.kwo.org/Reports%20&%20Publications/Drought/Tbl_drought_declarations_051107_twl.pdf No declarations were made in 2001, 2005, 2009, or 2010 Declaration issued for river basins rather than counties. URER (Upper Republican) and SO (Solomon); KLR (Kansas Lower Republic and MO (Missouri) River Basins.
Because drought has affected the whole state, the data provided below includes Region L in its synopsis:
• 2012: The Kansas Water Office increased the frequency of the Drought/Climate report (found at www.kwo.org) to weekly for much of the year due to intensity of conditions. The Governor signed 3 executive orders this year for drought with all 105 counties were declared in emergency drought status with the last order. The Governor approved the June 2012 Operations Plan for the Governor‘s Drought Response Team which updated activities and responses. The Governor’s Office created a Drought Resources Website, http://governor.ks.gov/kansasdrought-resources, to provide drought information for all Kansans and to utilize drought relief assistance initiatives. Drought conditions continued from 2011, although appeared to lessen in the early months of 2012, when above normal precipitation occurred in February, March and April compared to 30 year averages. By May 3rd however, precipitation was well below normal and temperatures above. These conditions prompted the first 2012 Executive Order for drought watch and warning declarations for 91 counties. Conditions also included extremely low soil moisture for crops and vegetation. May was the second driest and third warmest on record. By June 5th, 58 percent of the State was in moderate drought (D2) according to the U.S. Drought Monitor, with drought affecting all but portions of the south east to some degree. By the end of June, severe (D2) and extreme drought (D3) impacted in the majority of the State with the worst in western areas. By July, the entire state was in severe (D2) or worse, with areas of extreme (D3) and exceptional (D4) expanding. The areas of severity of drought changed, but the entire state remained at some level of drought for the rest of 2012. Temperatures and precipitation both contributed to the severity of drought conditions. July thru August was the warmest period on record, with numerous months ranking as driest or warmest for various locations, regions or the entire state. October to September was also the warmest on record. Overall, only two small areas of the State received near normal precipitation in 2012 with the majority receiving 25-90 percent of normal precipitation (through Dec 5). As of December 1, precipitation needed to return to normal moisture levels using the Palmer Drought Severity Index ranged from 3.5 inches in the southwest to 9.31inches in east central division. USDA agricultural disaster due to drought was declared for all 105 counties in Kansas based on crop losses through a series of six designations in July and August. This makes producers eligible for certain emergency. The crop losses were estimated at $1.5 billion. At

3.60
least 197communities and rural water districts in Kansas had voluntary or mandatory restrictions on water use as drought and high demand depleted public water supplies and challenged treatment and distribution. Mandatory restrictions were placed on water right holders junior to minimum desirable streamflow (MDS) in as many as 17 locations affecting 540 water appropriations. Livestock ponds, feed and pasture were insufficient to meet needs. Contingencies for feed and water were made available to producers through hay networks, motor carrier authorities and emergency water from state fishing lakes and federal reservoirs. Despite these efforts, livestock numbers in June marked the lowest cattle inventory since 1973. The risk of wildfires was high throughout the State with as many as 78 counties issuing burn bans over some period of 2012. At least 41,000 acres burned. Dry conditions in the fall resulted in dust storms visible by satellite.
• 2011: Precipitation for 2011 was -8.92 inches below normal for the year statewide, with climatic divisions varying from -3.51 to -14.36 inches below normal. The Governor signed 6 executive orders between April and November for various drought stages over the year, increasing the number of counties to 100 in the November order including 40 counties in emergency stage. The year began with extraordinarily low winter moisture and the very little precipitation continued throughout the year. Throughout the year the severity and area affected varied. Drought conditions reached their greatest extent as reflected by the Drought Monitor October 4 when exceptional drought (D4) covered 18 percent of the State while 93 percent of the State was shown as abnormally dry (D1-D4), 54 percent severe (D2-D4) and 33 percent extreme (D3-D4). Conditions improved slightly through the end of the year. USDA agricultural disaster due to drought was declared for 70 counties in Kansas based on crop losses. Kansas agricultural losses were estimated by the Kansas Department of Agriculture at over $1.77 billion due to drought. The hot dry conditions in Kansas were centered in southwest and south central Kansas, being the hottest and driest for these climatic areas since 1895. Many locations set new records for the number of days with temperatures of 100o F or more, June through August. Statewide, soil moisture was around 50 percent adequate as 2011 began but never exceeded 55 percent for topsoil moisture until November. Very little surplus existed all year for topsoil or subsoil moisture. The U.S. Army Corps of Engineer lakes and most rivers in Kansas received less than normal inflow during 2011, but the total reservoir inflows were sufficient to allow the lakes to operate near normal levels.
At least 38 public water suppliers in 22 counties initiated conservation measures due to drought conditions. These include municipal, rural water districts and a community college. In 2011 MDS administration occurred on at least eight river systems effecting about 279 water rights. 2011 marked the lowest January 1 cattle inventory in the U.S since 1958. Drought contributed to a three percent decrease in inventory by January 2012.
• May 4, 2002–October 1, 2003: Beginning on May 4, 2002, the Palmer Drought Severity Index reached -2.5 in the northwest and southwest districts of the state and remained below that value, triggering activation of the Governor’s Drought Response Team. At its worst in

3.61
2002, the PDSI was below -3.0 in six of nine meteorological districts. In 2002, rainfall was less than the Dust Bowl years in some parts of western Kansas. Lakes decreased significantly in size and ground water levels dropped. Low water in the Missouri River interfered with river barge traffic and necessitated the release of water from Milford, Tuttle Creek, and Perry Lakes. This drought caused many counties to impose water use restrictions and burn bans. Grazing was prohibited on government lands to protect the drought-stressed grass, affecting thousands of cattle. Emergency haying and grazing was allowed by the U.S. Department of Agriculture (USDA) on Conservation Reserve Program lands. All 105 counties were eligible for federal assistance through the U.S. Department of Agriculture (USDA). The drought had a $1.1 billion impact on crop production.
• 1988–1992: The severity of this drought varied across the state. It was most severe in the southwestern, central, and northeastern parts of the state but minimal in the northwestern and southeastern parts. Surface-water supplies were sufficient to meet demands through the end of water year 1988, but rainfall during this period was less than 50% of the long-term average, so quantities were insufficient to maintain soil moisture or contribute to ground-water supplies. Estimated drought-related losses to 1988 crops were $1 billion. Water levels in shallow aquifers declined rapidly and led to the abandonment of many domestic water wells. The drought of 1988 continued into the 1990s, but at a reduced level.
• 1974–1982: This appeared to be a series of relatively short droughts at some stream gauging stations, but longer droughts at others (similar to the 1962–1972 droughts). The recurrence interval of this drought was greater than 25 years in the north-central and southeastern parts but was between 10 and 25 years across the remaining eastern two-thirds of the state. The severity of this drought could not be determined for the western third of the state.
• 1962–1972: The duration of this regional drought varied considerably across Kansas. Many of the stream flow records indicated alternating less than average and greater-than-average flows, while others indicated less than average flows for the entire period. The recurrence interval was generally greater than 25 years but was between 10 and 25 years in parts of the northwestern, northeastern, southern, and southeastern areas of the state.
• 1952–1957: This regional drought had a recurrence interval greater than 25 years statewide. One exception was in the Big Blue River Basin, where the recurrence interval was 10-25 years. Because of its severity and areal extent, this drought is used as the base period for studies of reservoir yields in Kansas. In 1954, 41 counties were declared eligible for aid under the Emergency Feed program. During this period, 175 cities reported water shortages, most of which restricted water use.
• 1929–1942: This drought, which includes the Dust Bowl of the 1930s, was regional in scale and affected many of the Midwestern and western states. Nevertheless, it ranks among the most significant national events of the twentieth century. The recurrence interval was greater than 25 years throughout Kansas. Drought, wind, and poor agricultural practices combined

3.62
to result in enormous soil erosion. Agricultural losses were extreme, and many farms were abandoned. Effects of the drought sent economic and social ripples throughout the country, contributing to the economic, physical, and emotional hardships of the Great Depression.
Extent
The severity of a drought in Kansas has been deemed to be limited in nature by the planning committee. Injuries and illness would not result in permanent disability and critical facilities would not be shut down for extemded periods. Figure 3.11 shows the extent of the drought in the planning area for the period ending February 26, 2013. Region L’s drought is categorized as severe.
Figure 3.11
Figure 3.12 shows the amount of precipitation needed to bring the PDI to -0.5, with Region L needing 3 – 9 inches.

3.63
Figure 3.12. Region L Additional Precipitation Needed
Probability of Future Hazard Events
Based on historical data for Kansas, (26 disasters in 11 years), the State of Kansas, and by extension Region L, will experience drought conditions on a yearly basis. This hazard’s CPRI probability is “Highly Likely” (probable within the calendar year). With the advent of climate change, the hazard of drought may become a ‘normal’ condition for the state.
Impact and Vulnerability
There are 3 phased drought stages (Watch, Warning, and Emergency Stages) that mirror the stages used in the Kansas 2007 Municipal Water Conservation Plan Guidelines. The following are all factors monitored to determine the drought stage: Palmer Drought Severity Index, Standardized Precipitation Index, Percent of Normal Precipitation, Soil Moisture Percentile, Crop Moisture Index, Satellite Vegetative Health Index and the 7-Day Median Flow Percentile.
The stages identified consider impacts along with moisture/water resource conditions. Kansas drought response transitions from primarily local response under a Drought Watch, with increases in the State and Federal roles at the Drought Warning and Drought Emergency stages. Table 3.35 shows the drought stage descriptions and impacts as a combination of U.S. Drought Monitor and the Municipal Guidelines.

3.64
Table 3.35 Phased Drought Response Summary
Stage
U.S. Drought Monitor Description
Declared by Possible Impacts Response Summary
Drought Watch
Moderate Drought
Governor Some damage to crops and pastures; high rangeland fire danger, streams or reservoirs low, serious public water system shortage not imminent, but likelihood of shortages growing.
Governor notified by Kansas Water Office, Governor’s Drought Response Team activated, public notification, outdoor burning bans may be imposed; public water systems may implement State 1 Water Watch phase of municipal water conservation plan, Governor may request USDA disaster Declaration for drought.
Drought Warning
Severe Drought
Governor Crop damage to crops and pastures; high rangeland fire danger; streams or reservoirs low, serious public water system water shortages not imminent, but likelihood of shortages growing.
Public water systems may implement Stage 2 Water Warning phase of municipal water conservation plan; Hay and Pasture Exchange activated; urgent surplus water contracts from state controlled storage authorized; Governor may request authorization for haying and grazing of Conservation Reserve Program acres; Governor may request USDA disaster declaration for drought.
Drought Emergency
Extreme and Exceptional Drought
Governor Widespread major crop and pasture losses; extreme rangeland fire danger; stock water shortage; widespread public water system water shortages or restrictions; streamflow targets not met; reservoir supplies low.
Governor may declare outdoor burning ban upon advice of Adjutant General; public water systems may implement Stage 3 Water Emergency phase of municipal water conservation plans; emergency surplus water contracts from state controlled storage authorized; emergency water withdrawals from USACE emergency water assistance; Governor may request Presidential disaster declaration and/or USDA disaster declaration for drought.
Source: Kansas Drought Operations Plan, Governors Drought Team, June 2012 Note: Adopted from U.S. Drought Monitor and Kansas 2007 Municipal Water Conservation Plan Guidelines.
One of the most costly impacts of drought is the damage to foundations, parking lots, and other asphalt or concrete structures that are damaged as a result of the shrinking off soil that occurs along with drought, followed by the rapid swell that can occur when rains do come. Determining the direct and indirect costs associated with droughts is difficult because of the broad impacts of drought and the difficulty in establishing when droughts begin and end.
Another impact due to drought is its ability to severely challenge a public water supplier through depletion of the raw water supply and greatly increased customer water demand. Even if the raw water supply remains adequate, problems due to limited treatment capacity or limited distribution system capacity may be encountered. A 2007 assessment of 800 city or rural water district drinking water systems by the Kansas Water Office found 132 to be drought vulnerable. Also, in the drought of 2012, there are 197 communities and rural water districts, some that are also on the 2007 list, that have triggered some sort of water conservation to extend their supply (Source: http://www.kwo.org/reports_publications/Drought.htm). These two lists have been combined in Table 3.36 and create a new list of Drought Vulnerable Public Water Suppliers. Basic source limitations were the most common cause of drought vulnerability, followed by distribution system limitations.

3.65
Table 3.36. Region L Drought Vulnerable Public Water Suppliers
Public Water Supplier County
2007 Limitation Category List* and/or 2012 Conservation Stage** 2007 List
2012 Conservation Stage
Mitigation Planning Region L Bonner Springs Wyandotte Water Watch X Desoto Johnson Water Watch X Easton Leavenworth Basic Source X Edgerton Johnson Water Watch X Gardner Johnson Water Watch X Johnson RWD 06c Johnson Water Watch X Johnson RWD 07 Johnson Water Watch X Leavenworth RWD 06 Leavenworth Unknown X Leavenworth RWD 07 Leavenworth Contractual X Leavenworth RWD 10 Leavenworth Water Watch X Leawood (WaterOne customer) Johnson Water Watch X Olathe Johnson Water Watch X Prairie Village (WaterOne customer) Johnson Water Watch X Spring Hill Johnson Water Watch X Tonganoxie Leavenworth Contractual X
The statistical analysis below uses two significant factors in determining the drought vulnerability for Region L. One is the USDA Risk Management Agency’s annualized insured crop losses as a result of drought conditions during the ten-year period of 2002-2011 and the number of drought vulnerable public water suppliers in Kansas from Table 3.25 from above. It was determined that all counties in Region L have either insured crop loss and/or drought vulnerable public water suppliers thus all counties are rated at least at a medium vulnerability rating since agriculture is a major economic factor in most of the Region L counties and public water supply is an essential service to all of the region.
The rating values of the two factors were divided by 50 percent to determine the total drought vulnerability rating. The total drought vulnerability rating put all counties in either the medium, medium-high or high category. Table 3.37 provides the factors considered and the rating values assigned.
medium-high or high category. Table 3.26 provides the factors considered and the rating values assigned.
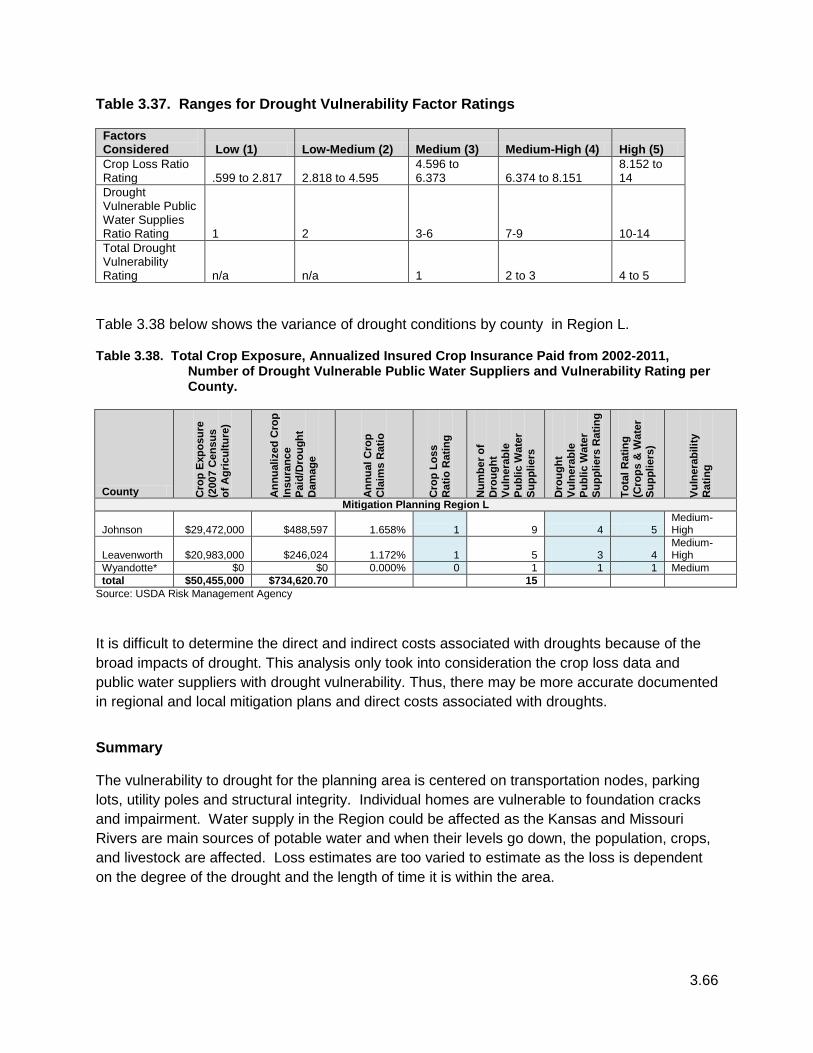
3.66
Table 3.37. Ranges for Drought Vulnerability Factor Ratings
Factors Considered Low (1) Low-Medium (2) Medium (3) Medium-High (4) High (5) Crop Loss Ratio Rating .599 to 2.817 2.818 to 4.595
4.596 to 6.373 6.374 to 8.151
8.152 to 14
Drought Vulnerable Public Water Supplies Ratio Rating 1 2 3-6 7-9 10-14 Total Drought Vulnerability Rating n/a n/a 1 2 to 3 4 to 5
Table 3.38 below shows the variance of drought conditions by county in Region L.
Table 3.38. Total Crop Exposure, Annualized Insured Crop Insurance Paid from 2002-2011, Number of Drought Vulnerable Public Water Suppliers and Vulnerability Rating per County.
County Cro
p Ex
posu
re
(200
7 C
ensu
s
of A
gric
ultu
re)
Ann
ualiz
ed C
rop
In
sura
nce
Paid
/Dro
ught
D
amag
e
Ann
ual C
rop
Cla
ims
Rat
io
Cro
p Lo
ss
Rat
io R
atin
g
Num
ber o
f D
roug
ht
Vuln
erab
le
Publ
ic W
ater
Su
pplie
rs
Dro
ught
Vu
lner
able
Pu
blic
Wat
er
Supp
liers
Rat
ing
Tota
l Rat
ing
(Cro
ps &
Wat
er
Supp
liers
)
Vuln
erab
ility
R
atin
g
Mitigation Planning Region L
Johnson $29,472,000 $488,597 1.658% 1 9 4 5 Medium-High
Leavenworth $20,983,000 $246,024 1.172% 1 5 3 4 Medium-High
Wyandotte* $0 $0 0.000% 0 1 1 1 Medium total $50,455,000 $734,620.70 15
Source: USDA Risk Management Agency
It is difficult to determine the direct and indirect costs associated with droughts because of the broad impacts of drought. This analysis only took into consideration the crop loss data and public water suppliers with drought vulnerability. Thus, there may be more accurate documented in regional and local mitigation plans and direct costs associated with droughts.
Summary
The vulnerability to drought for the planning area is centered on transportation nodes, parking lots, utility poles and structural integrity. Individual homes are vulnerable to foundation cracks and impairment. Water supply in the Region could be affected as the Kansas and Missouri Rivers are main sources of potable water and when their levels go down, the population, crops, and livestock are affected. Loss estimates are too varied to estimate as the loss is dependent on the degree of the drought and the length of time it is within the area.

3.67
Local Mitigation Concerns
• Drought can severely challenge a public water supplier through depletion of the raw water supply and greatly increased customer water demand. Even if the raw water supply remains adequate, problems due to limited treatment capacity or limited distribution system capacity may be encountered.
• http://www.kwo.org/reports_publications/Drought.htm). These two lists have been combined in Table 3.39 and create a new list of Drought Vulnerable Public Water Suppliers for Region L. Basic source limitations were the most common cause of drought vulnerability, followed by distribution system limitations. Table 3.39 shows these drought vulnerable public water suppliers by county.
Table 3.39 Drought Vulnerabilities of Public Water Suppliers by Region L County
Public Water Supplier County 2007 Limitation Category List* 2012 And/or Conservation 2012 conservation State ** 2007 List List
Region L Bonner Springs Wyandotte Water Watch X Desoto Johnson Water Watch X Easton Leavenworth Basic Source X Edgerton Johnson Water Watch X Gardner Johnson Water Watch X Johnson RWD 06c Johnson Water Watch X Johnson RWD 07 Johnson Water Watch X Leavenworth RWD 06 Leavenworth Unknown X Leavenworth RWD 07 Leavenworth Contractual X Leavenworth RWD 10 Leavenworth Water Watch X Leawood (WaterOne customer) Johnson Water Watch X Olathe Johnson Water Watch X Prairie Village (WaterOne customer) Johnson Water Watch X Spring Hill Johnson Water Watch X Tonganoxie Leavenworth Contractual X
Source: Kansas Water Office * Drought Limitation Categories Basic Source Limitation—The supplier’s primary raw water source is particularly sensitive to drought as evidenced by depleted streamflow, depleted reservoir inflow and storage, or by declining water levels in wells. Restrictions imposed due to inability to use a well(s) because water quality problems were considered indicative of a basic source limitation. Contractual Limitation—The supplier’s sole water source is purchased from another system that is drought vulnerable and there is a drought-cut-off clause in their water purchase contract. In such situations where there is not a drought cut-off clause, the purchaser is considered drought vulnerable under the same limitation category as the seller. Distribution System Limitation—The supplier has difficulty or is unable to meet drought-induced customer demand for water because of inadequate finished water storage capacity, inadequate finished water pumping capacity, inadequate transmission line sizes, etc. Minimum Desirable Streamflow—The supplier reported imposing restrictions because of minimum desirable streamflow administration. Water rights junior to those granted for maintenance of established minimum desirable flows are subject to such administration.

3.68
Single Well Source—The supplier relies upon a single well as its sole source for raw water. Suppliers with one active well and one emergency well were considered drought vulnerable because emergency wells are not a dependable long-term water source. Excessive hours of operation to meet drought-induced customer demand for water will result in the increased likelihood of mechanical breakdown with no alternative water supply source available. Treatment Capacity Limitation—The supplier has difficulty or is unable to meet drought-induced customer demand for water due to inadequate raw water treatment capacity. Water Right Limitation—The supplier reported imposing restrictions because the quantity of water they are authorized to divert under their water right(s) was insufficient to meet customer demands. ** 2012 Conservation Implementation Stages are Water Watch =1, Water Warning = 2 and Water Emergency =3 as per local water conservation plans. State level may reflect State Drought Stages but should be tied to local supply conditions. Source: Kansas Drought Operations Plan, June 2012
• The Missouri River flows to the east of Leavenworth and Wyandotte counties, and is a main navigation route for commercial vessels. With the decrease in precipitation, the Missouri River water levels could potentially hurt the shipping industry as well as power production for the extended Region.
• Agricultural crops and livestock could potentially be affected should the drought continue. Both of these entities require water in order to flourish and should water levels become restricted they will suffer, ultimately affecting the farmers that rely on the agricultural industry as their livelihood.
• Drought comes with a host of other issues that can affect the property and people that live in the Region. With low moisture content wildfires could potentially increase, threatening crops, livestock, and urban living areas.
Development in Hazard Prone Areas
Drought does not normally cause damage to buildings and critical facilities, however, severe and exceptional drought over an extended period of time can cause integrity issues to foundations. This in turn can affect new development as construction of new buildings are built on soil that has been depleted of its moisture content leading to instability when rains do come.
Another issue for development is the increase of populations within the planning area will create greater demands on the public water suppliers.
Johnson County Table 3.40. Johnson County CPRI for Drought
Hazard Type Probability Magnitude Warning
Time Duration CPRI Planning
Significance
Johnson County Drought 4 2 1 4 2.95 Moderate
*Drought for Johnson County went from a low to a Moderate ranking due to various factors. The county has been included in no less than four drought warnings in the past 10 years. This does not include the watch declarations they were included in between the years 2003 – 2012. The probability of a drought affecting Johnson County is 40% in any given year. In order to have a Highly Likely probability the percentage is 33% probability in any given year. In addition, the

3.69
magnitude increase from a negligible to a limited due to the damages the drought inflicts on structural foundations, agriculture, and the water supply. Leavenworth County Table 3.41. Leavenworth County CPRI: Drought
Hazard Type Probability Magnitude Warning
Time Duration CPRI Planning
Significance
Leavenworth County Drought 4 2 1 4 2.95 Moderate Wyandotte County Table 3.42. Wyandotte County CPRI: Drought
Hazard Type Probability Magnitude Warning
Time Duration CPRI Planning
Significance
Leavenworth County Drought 4 2 1 4 2.95 Moderate
Consequence (Impact) Analysis The information in Table 3.43 provides the Consequence Analysis of Potential for Detrimental Impacts of Hazards done for accreditation with the Emergency Management Accreditation Program (EMAP).
Table 3.43. Consequence Analysis: Drought
Subject Ranking Impacts/Drought
Health and Safety of Persons in the Area of the Incident Minimal - Moderate
Drought impact tends to be agricultural, however, because of the lack of precipitation that precipitates drought, water supply disruptions can occur which can affect people. Impact is expected to be minimal.
Responders Minimal With proper preparedness and protection, impact to the responders is expected to be minimal.
Continuity of Operations Minimal Minimal expectation for utilization of the COOP.
Property, Facilities, and Infrastructure Minimal to Severe
Impact to property, facilities, and infrastructure could be minimal to severe, depending on the length and intensity of the drought. Structural integrity of buildings, and buckling of roads could occur.
Delivery of Services Minimal
Impact on the delivery of services should be non-existent to minimal, unless transportation nodes are affected.
Environment Minimal to Severe
The impact to the environment could be severe. Drought can severely affect farming, ranching, wildlife and plants due to the lack of precipitation.
Economic Conditions Minimal to Moderate
Impacts to the economy will be dependent on how extreme the drought is and how long it lasts. Communities that depend on water recreation could be tested, as well as agricultural. Minimal to Moderate.
Public Confidence in Jurisdiction’s Minimal Confidence could be at issue during periods of

3.70
Governance extreme drought if planning is not in place to address intake needs and loss of agricultural crops.
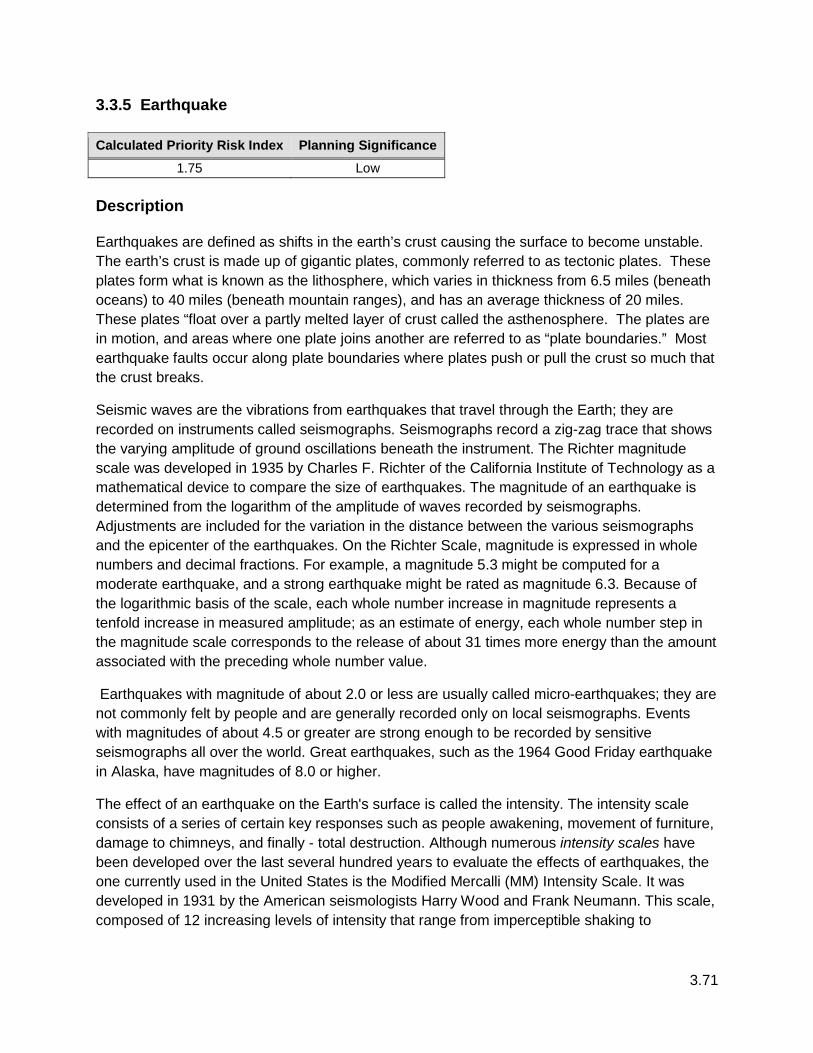
3.71
3.3.5 Earthquake Calculated Priority Risk Index Planning Significance
1.75 Low Description Earthquakes are defined as shifts in the earth’s crust causing the surface to become unstable. The earth’s crust is made up of gigantic plates, commonly referred to as tectonic plates. These plates form what is known as the lithosphere, which varies in thickness from 6.5 miles (beneath oceans) to 40 miles (beneath mountain ranges), and has an average thickness of 20 miles. These plates “float over a partly melted layer of crust called the asthenosphere. The plates are in motion, and areas where one plate joins another are referred to as “plate boundaries.” Most earthquake faults occur along plate boundaries where plates push or pull the crust so much that the crust breaks.
Seismic waves are the vibrations from earthquakes that travel through the Earth; they are recorded on instruments called seismographs. Seismographs record a zig-zag trace that shows the varying amplitude of ground oscillations beneath the instrument. The Richter magnitude scale was developed in 1935 by Charles F. Richter of the California Institute of Technology as a mathematical device to compare the size of earthquakes. The magnitude of an earthquake is determined from the logarithm of the amplitude of waves recorded by seismographs. Adjustments are included for the variation in the distance between the various seismographs and the epicenter of the earthquakes. On the Richter Scale, magnitude is expressed in whole numbers and decimal fractions. For example, a magnitude 5.3 might be computed for a moderate earthquake, and a strong earthquake might be rated as magnitude 6.3. Because of the logarithmic basis of the scale, each whole number increase in magnitude represents a tenfold increase in measured amplitude; as an estimate of energy, each whole number step in the magnitude scale corresponds to the release of about 31 times more energy than the amount associated with the preceding whole number value.
Earthquakes with magnitude of about 2.0 or less are usually called micro-earthquakes; they are not commonly felt by people and are generally recorded only on local seismographs. Events with magnitudes of about 4.5 or greater are strong enough to be recorded by sensitive seismographs all over the world. Great earthquakes, such as the 1964 Good Friday earthquake in Alaska, have magnitudes of 8.0 or higher.
The effect of an earthquake on the Earth's surface is called the intensity. The intensity scale consists of a series of certain key responses such as people awakening, movement of furniture, damage to chimneys, and finally - total destruction. Although numerous intensity scales have been developed over the last several hundred years to evaluate the effects of earthquakes, the one currently used in the United States is the Modified Mercalli (MM) Intensity Scale. It was developed in 1931 by the American seismologists Harry Wood and Frank Neumann. This scale, composed of 12 increasing levels of intensity that range from imperceptible shaking to

3.72
catastrophic destruction, is designated by Roman numerals. It does not have a mathematical basis; instead it is an arbitrary ranking based on observed effects.
The Modified Mercalli Intensity value assigned to a specific site after an earthquake has a more meaningful measure of severity to the nonscientist than the magnitude because intensity refers to the effects actually experienced at that place.
The lower numbers of the intensity scale generally deal with the manner in which the earthquake is felt by people. The higher numbers of the scale are based on observed structural damage. Structural engineers usually contribute information for assigning intensity values of VIII or above.
The following is an abbreviated description of the 12 levels of Modified Mercalli intensity from the U.S. Geological Survey.
I. Not felt except by a very few under especially favorable conditions.
II. Felt only by a few persons at rest, especially on upper floors of buildings.
III. Felt quite noticeably by persons indoors, especially on upper floors of buildings. Many people do not recognize it as an earthquake. Standing motor cars may rock slightly. Vibrations similar to the passing of a truck. Duration estimated.
IV. Felt indoors by many, outdoors by few during the day. At night, some awakened. Dishes, windows, doors disturbed; walls make cracking sound. Sensation like heavy truck striking building. Standing motor cars rocked noticeably.
V. Felt by nearly everyone; many awakened. Some dishes, windows broken. Unstable objects overturned. Pendulum clocks may stop.
VI. Felt by all, many frightened. Some heavy furniture moved; a few instances of fallen plaster. Damage slight.
VII. Damage negligible in buildings of good design and construction; slight to moderate in well-built ordinary structures; considerable damage in poorly built or badly designed structures; some chimneys broken.
VIII. Damage slight in specially designed structures; considerable damage in ordinary substantial buildings with partial collapse. Damage great in poorly built structures. Fall of chimneys, factory stacks, columns, monuments, walls. Heavy furniture overturned.
IX. Damage considerable in specially designed structures; well-designed frame structures thrown out of plumb. Damage great in substantial buildings, with partial collapse. Buildings shifted off foundations.

3.73
X. Some well-built wooden structures destroyed; most masonry and frame structures destroyed with foundations. Rails bent.
XI. Few, if any (masonry) structures remain standing. Bridges destroyed. Rails bent greatly.
XII. Damage total. Lines of sight and level are distorted. Objects thrown into the air.
Location
Region L is in an area of relatively low seismic activity. The Region does lie between three earthquake fault zones, the Humboldt Fault and the associated Nemaha Ridge, also known as the Nemaha Uplift, in central Kansas and the New Madrid Fault in eastern Missouri. All counties in the region carry the same low risk of seismic activity.
Figure 3.13 shows the probability of an earthquake with a magnitude greater than or equal to 4.75 within 100 years in Region L.
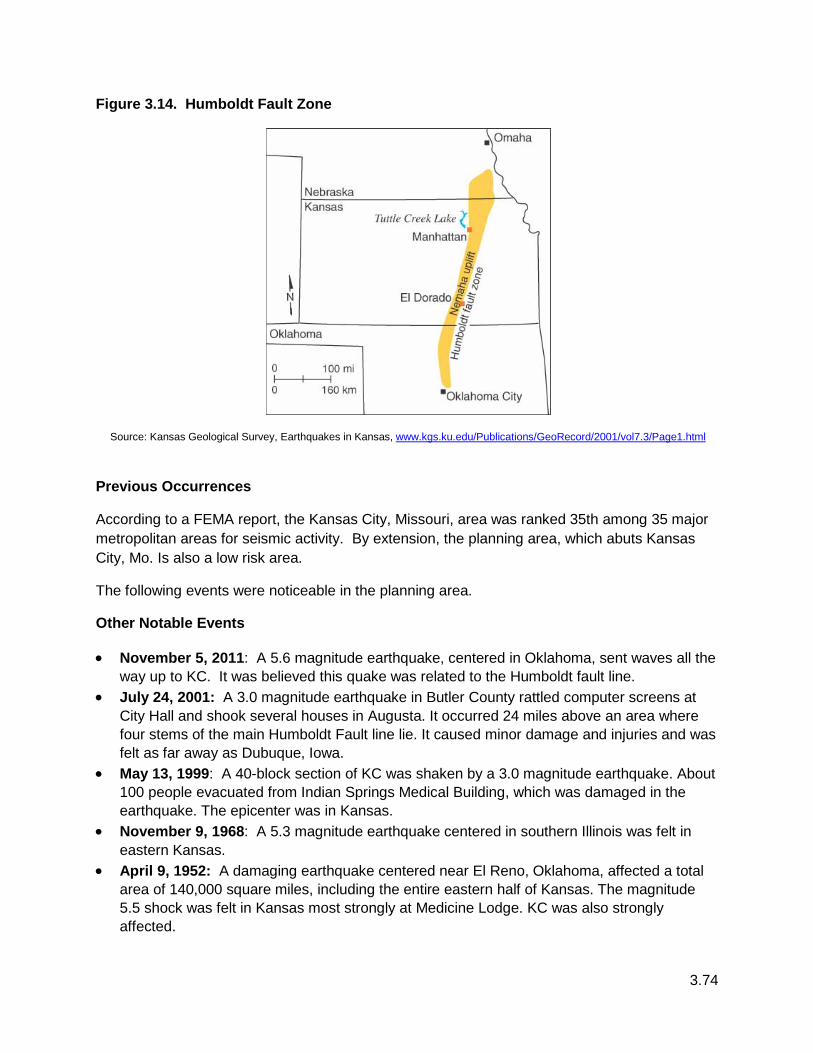
3.74
Figure 3.14. Humboldt Fault Zone
Source: Kansas Geological Survey, Earthquakes in Kansas, www.kgs.ku.edu/Publications/GeoRecord/2001/vol7.3/Page1.html
Previous Occurrences
According to a FEMA report, the Kansas City, Missouri, area was ranked 35th among 35 major metropolitan areas for seismic activity. By extension, the planning area, which abuts Kansas City, Mo. Is also a low risk area.
The following events were noticeable in the planning area.
Other Notable Events
• November 5, 2011: A 5.6 magnitude earthquake, centered in Oklahoma, sent waves all the way up to KC. It was believed this quake was related to the Humboldt fault line.
• July 24, 2001: A 3.0 magnitude earthquake in Butler County rattled computer screens at City Hall and shook several houses in Augusta. It occurred 24 miles above an area where four stems of the main Humboldt Fault line lie. It caused minor damage and injuries and was felt as far away as Dubuque, Iowa.
• May 13, 1999: A 40-block section of KC was shaken by a 3.0 magnitude earthquake. About 100 people evacuated from Indian Springs Medical Building, which was damaged in the earthquake. The epicenter was in Kansas.
• November 9, 1968: A 5.3 magnitude earthquake centered in southern Illinois was felt in eastern Kansas.
• April 9, 1952: A damaging earthquake centered near El Reno, Oklahoma, affected a total area of 140,000 square miles, including the entire eastern half of Kansas. The magnitude 5.5 shock was felt in Kansas most strongly at Medicine Lodge. KC was also strongly affected.

3.75
• March 18, 1927: An earthquake near White Cloud, in the extreme northeastern portion of the state, rocked houses such that people rushed out of them.
• January 7, 1906: A magnitude 4.7 earthquake affected an area of about 10,000 square miles in Kansas, Missouri, and Nebraska. Chimneys were thrown down and some cracks in walls were observed.
• October 31, 1895: This earthquake near Charleston, Missouri, affected a million square miles over 23 states, including Region L.
Extent
Overall, Region L is in a low seismic activity area. The Nemaha fault would directly affect Riley and Pottawatomie Counties, and the New Madrid Seismic Zone follows the Mississippi River valley and is not expected to cause Region L any significant damage. Missourian’s trying to escape the carnage of the New Madrid Fault having a seismic event could inundate the Region, leading to sheltering and feeding issues. The magnitude of an earthquake in the planning area has been determined to be limited. Injuries and illnesses would not result in permanent disability, and shutdown of critical facilities would not last for more than a week. Probability of Future Hazard Events Figure 3.15 below depicts the probability that ground motion will reach a certain level during an earthquake. The data shows peak horizontal ground acceleration (the fastest measured change in speed for a particle at ground level that is moving horizontally because of an earthquake). The shaking level that has a 10 percent chance of being exceeded over a period of 50 years, which is more of a worst-case scenario, depicts the shaking level that has a 2 percent chance of being exceeded over a period of 50 years. Typically, significant earthquake damage occurs when accelerations are greater than 30% of gravity
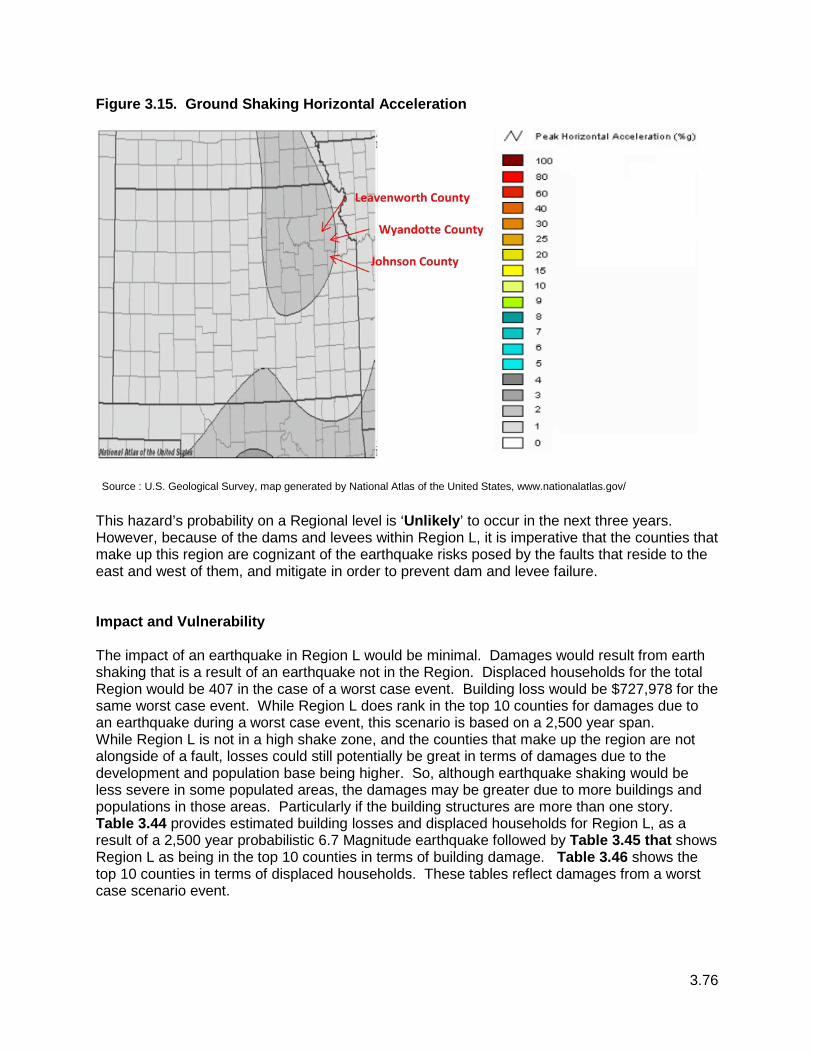
3.76
Figure 3.15. Ground Shaking Horizontal Acceleration
Source : U.S. Geological Survey, map generated by National Atlas of the United States, www.nationalatlas.gov/
This hazard’s probability on a Regional level is ‘Unlikely’ to occur in the next three years. However, because of the dams and levees within Region L, it is imperative that the counties that make up this region are cognizant of the earthquake risks posed by the faults that reside to the east and west of them, and mitigate in order to prevent dam and levee failure. Impact and Vulnerability The impact of an earthquake in Region L would be minimal. Damages would result from earth shaking that is a result of an earthquake not in the Region. Displaced households for the total Region would be 407 in the case of a worst case event. Building loss would be $727,978 for the same worst case event. While Region L does rank in the top 10 counties for damages due to an earthquake during a worst case event, this scenario is based on a 2,500 year span. While Region L is not in a high shake zone, and the counties that make up the region are not alongside of a fault, losses could still potentially be great in terms of damages due to the development and population base being higher. So, although earthquake shaking would be less severe in some populated areas, the damages may be greater due to more buildings and populations in those areas. Particularly if the building structures are more than one story. Table 3.44 provides estimated building losses and displaced households for Region L, as a result of a 2,500 year probabilistic 6.7 Magnitude earthquake followed by Table 3.45 that shows Region L as being in the top 10 counties in terms of building damage. Table 3.46 shows the top 10 counties in terms of displaced households. These tables reflect damages from a worst case scenario event.

3.77
Table 3.44. Worst-Case 2,500 Year, 6.7 Magnitude Earthquake Total Building Loss and Displaced Households by County
County Total Earthquake Losses
(1000’s) Displaced
Households Johnson $522,644 282 Leavenworth $52,209 29 Wyandotte $153,125 96 Total $727,978 <408
Source: State Hazard Mitigation Plan 2013
Overall, Region L is in a low seismic activity area. The Nemaha fault would directly affect Riley and Pottawatomie Counties, and the New Madrid Seismic Zone follows the Mississippi River valley and is not expected to cause Region L any significant damage. Missourian’s trying to escape the carnage of the New Madrid Fault having a seismic event could inundate the Region. Leading to sheltering and feeding issues. In Table 3.47 data taken from Hazus-MH 2.1 indicates the shake zones in the counties within Region L.
Table 3.45. Worst-Case 2,500 Year, 6.7 Magnitude Earthquake Top 10 Counties by Building Loss (1000s)
Mitigation Planning Region County
Total Earthquake
Losses (1000s)
L Johnson $522,644
G Sedgwick $352,186
J Shawnee $175,161
L Wyandotte $153,125
K Douglas $84,716
I Riley $71,807
L Leavenworth $52,209
H Crawford $45,280
G Reno $37,342
G Butler $34,313
Source: State Hazard Mitigation Plan 2013

3.78
Table 3.46. Worst-Case 2,500 Year, 6.7 Magnitude Earthquake Top 10 Counties by Displaced Households
Mitigation Planning Region County
Displaced Households
L Johnson 282 G Sedgwick 233 J Shawnee 112 L Wyandotte 96 K Douglas 86 I Riley 68 L Leavenworth 29 H Crawford 24 I Lyon 20 U Geary 20
Source: State Hazard Mitigation Plan 2013 In Table 3.47 data taken from Hazus-MH 2.1 indicates the shake zones that could potentially affect the counties within Region L. This analysis is based on a worst case 2500 year, 6.7 magnitude earthquake. Table 3.47. Worst-Case 2500-Year, 6.7 Magnitude Earthquake Ground Shaking
Potential for Each Kansas County in Region L.
County
0% to 4.2% PGA
4.3% to 5.0% PGA
5.1% to 6.0% PGA
6.1% to 7.5% PGA
7.6% PGA and Higher
Johnson
x Leavenworth
x
Wyandotte
x Subtotal 0 0 3 0 0
Source: State Hazard Mitigation Plan 2013
Summary
The planning area is at a low risk for seismic activity. It lies between two faults, the New Madrid, and the Humboldt Fault, but far enough away that any damages would be due to earth shaking and not a direct quake. At issue for the region would be the influx of people from the fault zones and the subsequent feeding and sheltering of these individuals for an extended period of time. Local Mitigation Concerns
• Region L is in a low seismic activity area, however, earth shaking at a low magnitude can still cause damage to property and people. The counties that make up the region have tall buildings that are prone to the effects of shaking. Along with the hilly terrain in the region, earth shaking could cause extensive damage.
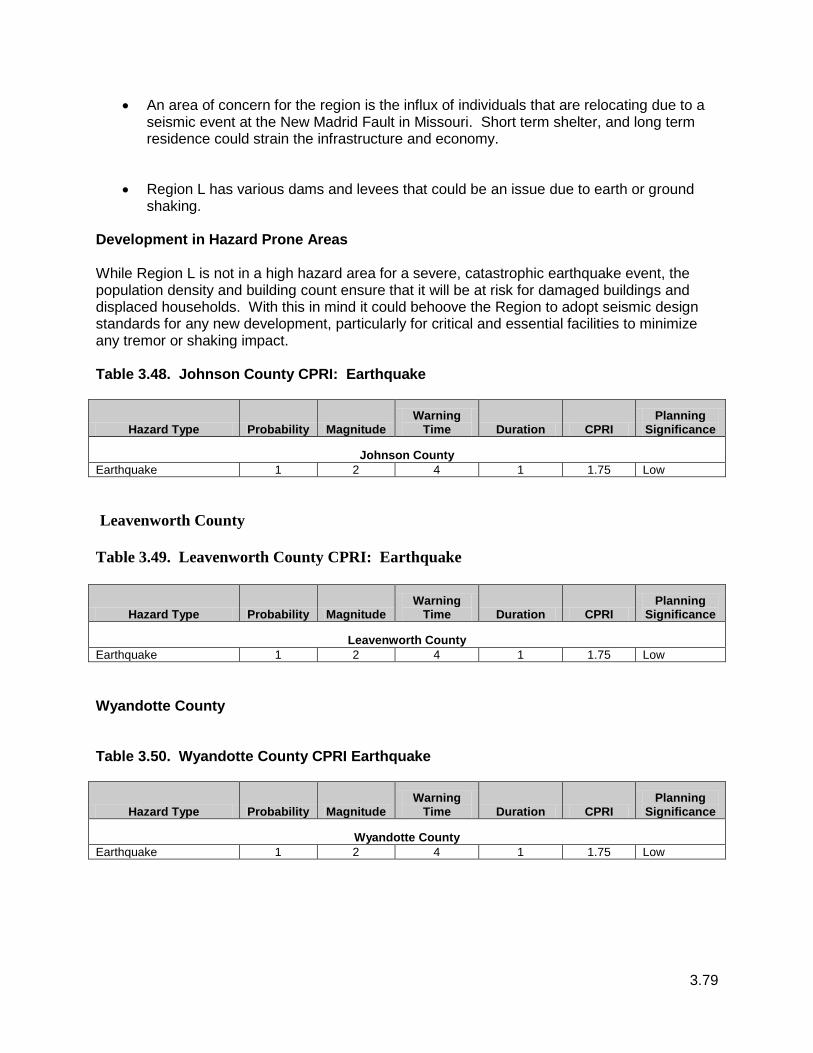
3.79
• An area of concern for the region is the influx of individuals that are relocating due to a seismic event at the New Madrid Fault in Missouri. Short term shelter, and long term residence could strain the infrastructure and economy.
• Region L has various dams and levees that could be an issue due to earth or ground shaking.
Development in Hazard Prone Areas While Region L is not in a high hazard area for a severe, catastrophic earthquake event, the population density and building count ensure that it will be at risk for damaged buildings and displaced households. With this in mind it could behoove the Region to adopt seismic design standards for any new development, particularly for critical and essential facilities to minimize any tremor or shaking impact. Table 3.48. Johnson County CPRI: Earthquake
Hazard Type Probability Magnitude Warning
Time Duration CPRI Planning
Significance
Johnson County Earthquake 1 2 4 1 1.75 Low Leavenworth County Table 3.49. Leavenworth County CPRI: Earthquake
Hazard Type Probability Magnitude Warning
Time Duration CPRI Planning
Significance
Leavenworth County Earthquake 1 2 4 1 1.75 Low Wyandotte County Table 3.50. Wyandotte County CPRI Earthquake
Hazard Type Probability Magnitude Warning
Time Duration CPRI Planning
Significance
Wyandotte County Earthquake 1 2 4 1 1.75 Low

3.80
Hazard Consequence (Impact) Analysis The information in Table 3.51 provides the Consequence Analysis of Potential for Detrimental Impacts of Hazards done for accreditation with the Emergency Management Accreditation Program (EMAP).
Table 3.51. EMAP Consequence Analysis: Earthquake
Subject Ranking Impacts/Earthquake
Health and Safety of Persons in the Area of the Incident
Minimal Impact in the incident area expected to be minimal in the State of Kansas.
Responders Minimal With proper preparedness and protection, impact to the responders is expected to be non-existent to minimal.
Continuity of Operations Minimal COOP is not expected to be activated (minimal).
Property, Facilities, and Infrastructure
Minimal Impact to property, facilities, and infrastructure could be minimal. Facilities, Infrastructure, and personnel could be minimally affected.
Delivery of Services Minimal No expectation of impact on services (minimal).
Environment Minimal No expectation of environmental impact (minimal).
Economic Conditions Minimal No expectation of economic conditions being impacted (minimal).
Public Confidence in Jurisdiction’s Governance
Minimal No change in confidence in jurisdictions governance (minimal).

3.81
3.2.7 Expansive Soils Calculated Priority Risk Index Planning Significance
2.20 Moderate Description A relatively widespread geologic hazard for Kansas, and by extension Region L, is the presence of soils that expand and shrink in relation to their water content. Expansive soils can cause physical damage to building foundations, roadways, and other components of the infrastructure when clay soils swell and shrink as a result of changes in moisture content. For Kansas, the vulnerability to this hazard most frequently is associated with soils shrinking during periods of drought.
Thirty-six states have expansive soils within their jurisdiction. Expansive soils are so extensive within parts of the United States that alteration of the highway routes to avoid expansive soils is virtually impossible. The Midwest is particularly problematic for construction because of the varied mixture of clay soils. Each year in the United States, expansive soils cause billions of dollars in damage to buildings, roads, pipelines, and other structures. This is more damage than that typically caused by floods, hurricanes, tornadoes, and earthquakes combined. It is estimated that approximately 10 percent of the homes built on expansive soils experience significant damage. Because there is limited available data on this hazard and no reported occurrences, the previous plan’s assessment remains valid and will be applicable for the 2013 update.
Location Expansive soils are a moderate risk that is largely uniform across the Region. Related hazard events are correlated with periods of drought in eastern Kansas. However, developed and developing communities in the Region in the areas of high clay content soils, which commonly experience fluctuations in the water table, are probably the most vulnerable to expansive soils. The distribution of clay soils is an indication of the extent of the vulnerability to this hazard in the Region. Nearly the entire Region has clay containing soils with at least a slight potential for swelling and shrinking that could damage building foundations, roadways, and similar properties.
Per the map below, Region L is located in an area where part of the soil unit consists of clay having slight to moderate swelling potential. While more detail is not available, all jurisdictions within the Region are affected.

3.82
Figure 3.16 Swelling Soils Map of Kansas
MAP LEGEND Red Unit contains abundant clay having high swelling potential Blue Part of unit (generally less than 50%) consists of clay having high swelling potential Rust Unit contains abundant clay having slight to moderate swelling potential Green Part of unit (generally less than 50%) consists of clay having slight to moderate swelling potential Brown Unit contains little or no swelling clay Yellow Data insufficient to indicate clay content of unit and/or swelling potential of clay Source: U.S. Geological Survey publication, http://arcvoid.com/surevoid_web/soil_maps/ks.html
Figure 3.17 depicts the general soil content of Leavenworth and Wyandotte Counties in Region L, which contribute to expansive soils. Figure 3.17a shows the general soil content for Johnson County.

3.83
Figure: 3.17. General Soil Content: Leavenworth and Wyandotte Counties
Previous Occurrences

3.84
Figure 3.17a. General Soil Content: Johnson County

3.85
Previous Occurrences
Highways, airport runways, streets, walkways and parking lots with layers of concrete and asphalt throughout the State are damaged every year by the effects of expansive soils. The frequency of damage from expansive soils can be associated with the cycles of drought and heavy rainfall, which reflect changes in moisture content. Building settlements associated with drought have been noted in Kansas for many years, particularly in buildings located on high ground, further from the water table.
The 2011 - present drought has likely been the worst for home foundations since the late 1950s drought, stated a board member of the Basement Health Association, a Dayton, Ohio-based trade group for basement and foundation repair businesses. Homes from the Dakotas through Louisiana were faring the worst, but damage to foundations from drought has been reported in 40 of the contiguous U.S. Experts estimate that drought damage to houses could reach $1 billion or more. Source: U.S. News and World Report, Aug. 31, 2012
Expansive soil events around Kansas City, Missouri are detailed below. No data is available for events in Region L.
• 1985: Expansive Soil Event - movement in expansive shales caused damage to St. Teresa’s Academy, the 7th Church of Christ, the Kansas City Public Library Country Club Plaza Branch, and the University Center at the University of Missouri, all in Kansas City, Missouri.
• 1950: Expansive Soil Event - Many homes and buildings in the Kansas City metropolitan area experienced minor damage as a result of the 1950s’ drought. Up to 65 percent of the homes were damaged at an estimated cost of $30-$40 million.
• 2012: According to a report on Fox4 KC.com, the metro area has seen extensive damage to foundations of homes and other structures. Down more than 17 inches of rain, as of December 0f 2012, foundation repair companies are reporting that they have not been this busy in 34 years. The full extent of the issue will hit once the rains do begin again, expanding the soil that has shrunk and leaking into all the cracks brought on by the drought.
Extent
While Region L has a lower clay content overall than many counties in Kansas they are still susceptible to expansive soil damage. The magnitude of expansive soils would be negligible for the planning area. Injuries could be treated with first aid, critical facilities would not be shut down for more than 24 hours.
Probability of Future Hazard Events
Based on the widespread distribution of soils and dry and wet cycles in Kansas, this hazard’s CPRI probability (for a damaging swelling soils event) is “Likely” within the next three years.

3.86
Impact and Vulnerability While Region L has lower clay content overall than many counties in Kansas they are still susceptible to expansive soil damage. A dollar amount for damages is difficult to ascertain or assign to this particular hazard since very little incident record keeping is done. Highways probably are most susceptible to damage from soil problems but those are usually resolved by using improved construction methods. The impact of expansive soils in the planning area is ultimately an area of concern for the infrastructure such as roads, bridges, utilities. Any building impacts would be the concern of the building owner whether insured or uninsured. Loss of life is not a concern unless the event is catastrophic to the point of collapsing bridges or buildings where individuals are in close proximity. The impact of this hazard could be minimal to moderate, depending on the location.
Since this hazard develops gradually, it seldom presents a threat to life. Houses and one-story commercial buildings are more apt to be damaged by the expansion of swelling clays than are multi-story buildings, which usually are heavy enough to counter swelling pressures.
Summary Expansive soils is a common hazard in the planning area due to the clay content of the soil and the rise and fall of the moisture levels due to heavy rains and drought conditions. While the hazard is common it does not severely affect the economy other than fixing damages done to roads and buildings. Because this damage is hit or miss it is not possible to have a loss estimate.
Local Mitigation Concerns
• The main issues confronting the Region are the transportation nodes in and around the tri-state area. These traffic ways are heavily travelled and when damaged due to expansive soils they become a threat to human life.
• The structural integrity of the buildings in and around the area are tested during periods of expansive soil, caused by drought and heavy rains, which can create a safety issue. Reparation can be expensive for public buildings, and for private individuals.
Development in Hazard Prone Areas
The presence of clays with high swelling and shrinking potential are lower in the planning area than the rest of the state, however it does still exists. Development in this Region is increasing as the population base increases, however, damage from expansive soil to new construction is often mitigated with modern construction practices.
Soil engineers and engineering geologists test soils for swell potential when designing a building's foundation. Simple observation often can reveal the presence of expansive soils and

3.87
can make recommendations for septic systems, grading, earth support, drainage, foundation design, concrete slab on grade construction and site remediation. Johnson County
Table 3.52. Johnson County CPRI – Expansive Soil
Hazard Type Probability Magnitude Warning
Time Duration CPRI Planning
Significance
Johnson County Expansive Soil 3 1 1 4 2.20 Moderate
Leavenworth County
Table 3.53. Leavenworth County CPRI – Expansive Soils
Hazard Type Probability Magnitude Warning
Time Duration CPRI Planning
Significance
Leavenworth County Expansive Soil 3 1 1 4 2.20 Moderate
Wyandotte County Table 3.54. Wyandotte County CPRI: Expansive Soil
Hazard Type Probability Magnitude Warning
Time Duration CPRI Planning
Significance
Wyandotte County Expansive Soil 3 1 1 4 2.20 Moderate
Consequence (Impact) Analysis Even though expansive soils cause enormous amounts of damage to buildings and infrastructure most people have never heard of them. This is because their damage is done slowly and cannot be attributed to a specific event. The damage done by expansive soils is then attributed to poor construction practices or a misconception that all buildings experience this type of damage as they age.
The information in Table 3.55 provides the Consequence Analysis of Potential for Detrimental Impacts of Hazards done for accreditation with the Emergency Management Accreditation Program (EMAP).

3.88
Table 3.55. Consequence Analysis: Expansive Soils
Subject Ranking Impacts/Expansive Soils Health and Safety of Persons in the Area of the Incident Minimal Minimal impact. Responders Minimal Minimal impact.
Continuity of Operations Minimal
Minimal expectation for utilization of the COOP unless facility structures have extensive damage.
Property, Facilities, and Infrastructure Minimal to Moderate
Localized impact could be moderate as it relates to property, facilities, and infrastructure. Expansive soils could cause structural integrity to be lost, and roadways, railways, etc., to buckle.
Delivery of Services Minimal
Delivery of services could be impacted if roadways, railways, and all other infrastructure is impacted (minimal).
Environment Moderate
Expansive soils could cause moderate damage to the environment, particularly dams, levees, watersheds, etc.
Economic Conditions Minimal to Moderate
The impact to the economy is with the rebuilding of the property, facility, and infrastructure issues that expansive soils cause. During years of drought and extreme rain events the damage could be moderate.
Public Confidence in Jurisdiction’s Governance Minimal
Confidence will be dependent on development trends and mitigation efforts at reducing the effect of expansive soils on new construction and roadways (minimal).

3.89
3.2.8 Extreme Temperatures Calculated Priority Risk Index Planning Significance
2.50 Moderate Description Extreme temperature events, both hot and cold, can have severe impacts in Region L on human health and mortality, natural ecosystems, agriculture, and other economic sectors.
Heat
According to the Centers for Disease Control and Prevention, 3,981 people died in the United States from heat-related deaths during 1999 and 2005. Those at greatest risk for heat-related illness include older adults and young children. However, even young and healthy individuals are susceptible if they participate in strenuous physical activities during hot weather. Also, during extreme heat events, infrastructure, energy sources in particular, can be stressed, and long-term extreme heat can stress water sources, particularly if occurring during a period of drought.
The contiguous United States now has the summer of 2012 as its third hottest summer on record since recordkeeping began in 1895. According to NOAA’s National Climatic Data Center, the average temperature for the contiguous United States between June and August was over 74 degrees F, which is more the 2 degrees above the twentieth-century average. Only the summers of 2011 and 1936 have had higher summer temperatures.
According to information provided by FEMA, extreme heat is defined as temperatures that hover 10 degrees or more above the average high temperature for the region and last for several weeks. Ambient air temperature is one component of heat conditions, with relative humidity being the other. The relationship of these factors creates what is known as the apparent temperature. The Heat Index chart shown in Figure 3.18 uses both of these factors to produce a guide for the apparent temperature or relative intensity of heat conditions.

3.90
Figure 3.18. Heat Index (HI) Chart
Source: National Weather Service (NWS) Note: Exposure to direct sun can increase Heat Index values by as much as 15°F. The shaded zone above 105°F corresponds to a HI that may cause increasingly severe heat disorders with continued exposure and/or physical activity.
The National Weather Service has a system in place to initiate alert procedures (advisories or warnings) when the Heat Index is expected to have a significant impact on public safety. The expected severity of the heat determines whether advisories or warnings are issued. A common guideline for issuing excessive heat alerts is when the maximum daytime Heat Index is expected to equal or exceed 105 degrees Fahrenheit (°F) and the night time minimum Heat Index is 80°F or above for two or more consecutive days.
Warm summer days also encourages the growth of blue-green algae blooms in Kansas ecosystems. Blue-green algae are a normal part of the environmental when they are present in low numbers. But in the summer heat, these blooms grow very quickly to extreme numbers and produce chemical compounds which are toxic to warm-blooded creatures (people, pets and livestock),and some are toxic to other organisms like fish. The biggest risk to health comes from coming into contact with or ingesting the toxins produced by the algae while engaging in what is called “full body contact” (during swimming, skiing or jet skiing, for example), or from inhaling spray cast up from the water’s surface by recreational activities or by the wind. Blue-green algae can also cause dermatological symptoms with prolonged skin contact with water or wet clothes. Children and pets are most at risk while engaging in recreation in the water because they are more likely to accidently or intentionally swallow lake water. Pets can become ill after being exposed to spray, or even from eating dried algae along the shore or after licking algae from

3.91
their fur. No antidote exists for any known algal toxin currently. This makes prevention the best option for protecting human and animal health during a bloom (source: Kansas Department of Health & Environment, http://www.kdheks.gov/algae-illness/index.htm).
Cold
Extreme cold can cause hypothermia (an extreme lowering of the body’s temperature), frostbite and death. Infants and the elderly are particularly at risk, but anyone can be affected. While there are no specific data sources recording hypothermia (cold) death rates, it is estimated that 25,000 older adults die from hypothermia each year. The National Institute on Aging estimates that more than 2.5 million Americans are especially vulnerable to hypothermia, with the isolated elderly being most at risk. About 10 percent of people over the age of 65 have some kind of temperature-regulating defect, and 3-4 percent of all hospital patients over 65 are hypothermic.
Also at risk are those without shelters, who are stranded, or who live in a home that is poorly insulated or without heat. Other impacts of extreme cold include asphyxiation (unconsciousness or death from a lack of oxygen) from toxic fumes from emergency heaters; household fires, which can be caused by fireplaces and emergency heaters; and frozen/burst water pipes.
Wind can greatly amplify the impact of cold ambient air temperatures. Provided by the National Weather Service, Figure 3.19 below shows the relationship of wind speed to apparent temperature and typical time periods for the onset of frostbite. The combination of these elements affects the wind chill factor. The wind chill factor is the perceived temperature. As the speed of wind increases, the skin temperature drops as the heat is carried away from the body. As the perceived temperature increases, the risk of frostbite and hypothermia increases.
Figure 3.19. Wind Chill Chart

3.92
Location
All of Region L is susceptible to extreme temperatures. The heat risk to humans is generally uniform across the State of Kansas, but is slightly higher in the eastern portion that Region L resides in because of a relatively higher heat index. Extreme cold is a factor throughout the Region also, with all jurisdictions susceptible.
Previous Occurrences
For extreme heat, the Kansas Department of Health and Environment’s Kansas Environmental Public Health Tracking Program has kept records of the fatalities of Kansas residents since 2000. There have been at least 144 fatalities of Kansas residents since 2000 due to heat. The year of 2011 had the most recorded fatalities with 37.
Recorded temperatures in Kansas have ranged from –40 degrees °F (Lebanon, February 1905) to 121 degrees °F (Alton, July 1934). Also, the average number of days with temperatures over 90 degrees has been recorded from 1981 to 2010 as reflected in Figure 3.20. This map shows that over 2/3rd of the State had over a month of high temperatures over 90 degrees and the southwestern counties that border Oklahoma, average two months of temperatures over 90 degrees. This map does not depict the overnight minimum temperature averages. If the temperature does not drop overnight, it is more important in a global sense than the record highs. People, mainly those without air conditioning and crops need the temperature to drop during the overnight so that they can sustain the heat during the next day. The following figure shows the average number of days per year with high temperatures over 90 from 1981 to 2010.
Figure 3.20. Average Number of Days Per Year with High Temperatures Over 90, 1981 – 2012
Source: Kansas State Research and Extension, Climatic Maps of Kansas, http://www.ksre.ksu.edu/wdl/ClimaticMaps.htm , date October 2012.
3.93
Region L falls in the 0 – 22 days over 90 degree category. Note that a graphic is not available for cold temperatures at this time.
Notable Extreme Temperature Events for Region L
• Summer 2012: A large high pressure area settled over the Central High Plains resulting in high temperature records being tied or broken in Goodland, Hill City and other Kansas towns. Region L was affected by this high pressure. http://www.crh.noaa.gov/news/display_cmsarchive.php?wfo=gld and Topeka, KS http://www.crh.noaa.gov/news/display_cmsarchive.php?wfo=top ).
• June 2009—The Kansas City, Kan. Fire Department responded to a number of heat related calls. The Fire Department was dispatched to the Wyandotte County Courthouse on a case ofheat exposure and the Unified Government's Fleet Center at 50th and State on a case of possible heat stroke. Officials also determined high temperatures may have been the cause of death for two elderly people in the 2500 block of Stewart Avenue (Kansas City Kansan, June 23, 2009).
• August 1, 2006—Oppressive heat and humidity continued from July...with heat indices in the 105 to 115 degree range through August 2nd.
• July 29, 2006--Oppressive heat and humidity drove heat indices into the 105 to 115 degree range, from July 29th through July 31st.
• July 15, 2006--Oppressive heat and humidity drove afternoon and early evening heat indices into the 105 to 115 degree range, from July 16th through July 20th.
• July 21, 2005--Oppressive heat and humidity was observed across the area from July 21st to July 25th. Afternoon heat indices ranged from 105 to 110 degrees. A 78 year old female from Bonner Springs in Wyandotte county died from heat related causes on July 23rd.
• August 24, 2003--High temperatures and humidity caused heat indices to reach the 105 degree range
• August 17, 2003--High temperatures and humidity caused heat indices to reach the 105 to 110 degree range.
• July 26, 2003--Afternoon heat indices ranged from 103 to 106 degrees, from July 26th through July 27th.
• July 14, 2003--Oppressive heat and humidity over extreme eastern Kansas from July 14th through July 18th. Heat indices reached 110 degrees
• August 9, 2001--Excessive heat and humidity again was observed over eastern Kansas on August 9th. Afternoon heat indices ranged from 105 to 110 degrees.
• August 1-5, 2001--Excessive heat and humidity dominated the weather across eastern Kansas. August 1st through August 5th. Afternoon heat indices ranged from 105 to 113 degrees. • July 17-24, 2001--Excessive heat with afternoon heat indices 105 to 110
degrees...dominated the weather across eastern Kansas from July 17th to July 24th. • December 10-31, 2000--Arctic air gripped northeast Kansas for the final 3 weeks of
December. Except for a few hours on the 15th and 16th, temperatures remained below freezing for the entire period. Daily temperatures were 10 to 20 degrees below normal through the period. Average highs were in the teens and twenties with average lows in the single digits. Olathe dropped to 10 below zero on the 22nd. Snow cover persisted across the

3.94
area from the 13th through the end of the month. Numerous water pipes and water mains were broken, especially in the Kansas City area.
• October 6-10, 2000--Unusually strong Arctic high pressure built southward into the central Plains in early October, bringing 4 days of record breaking cold to northeast Kansas. High temperatures did not break the 50 degree mark on October 6th through 8th, and low temperatures dropped into the 20s each day from the 7th through the 9th. After starting the day near freezing on October 10, temperatures finally rebounded into the 60s that afternoon.
• August 2000: This August will be remembered as one of the hotter Augusts on record for north-central and northeastern Kansas. The last half of the month was especially hot with nearly all of the monthly highest temperatures reached during this time period. At least 14 people were treated for heat-related illnesses.
• July 1999: Excessive heat occurred over north-central and northeastern Kansas throughout the month, but during a two-week period at the end of the month, temperatures exceeded 100 °F in many areas on many days. Two deaths were attributed to the heat.
• February 1996: Record setting to near record setting cold covered northeast and north-central Kansas from the 1st through the 4th. Daytime highs in some areas failed to reach zero. These readings were quite extreme and rare for the local area where little if any snow was on the ground during the coldest time. Low temperatures plunged to between 10 below and 20 below zero with wind chills of 40 below to 60 below zero. These extreme readings caused water pipes to burst, water meters to freeze, inoperative vehicles, overworked heating systems and a host of other problems associated with prolonged extreme cold. Most schools, especially rural areas, cancelled classes while many businesses and activities were curtailed or cancelled.
• September 1995: The earliest freeze on record hit most of north-central and northeast Kansas causing widespread and heavy damage to immature crops. Damage likely exceeded $25 million.
Extent
The magnitude of extreme temperatures in the Planning area is limited. Injuries and illnesses do not normally result in permanent disability and complete shutdown of critical facilities for more than one week. Property is not expected to be affected.
According the National Climatic Data Center, out of the past 12 years (2000 – 2012), Region L experienced the following extreme temperatures:
Johnson County: 3 events of excessive heat were reported; one in 2007 and two in 2012. 2 events of extreme cold were reported, both of them in 2000.
Leavenworth County: 3 events of excessive heat were reported; one in 2007 and two in 2012. 2 events of extreme cold were reported; both in the year 2000.
Wyandotte County: 3 events of excessive heat were reported; one in 2007, and two in 2012. 2 events of extreme cold were reported, both in 2000.

3.95
Probability of Future Occurrences
This hazards CPRI probability is ‘Likely’ within a 3 year time period, and could very well get worse. The EPA has projected that with climate changes in the plain states, temperatures will continue to increase and affect all of Kansas to include Region L. A repercussion of this is that people will tend to stay in air conditioned environments to stay cool, or heated environments to stay warm, thus outdoor recreational activities will decline. Another concern is as people move to urban areas, older residents in rural areas may be particularly susceptible to the extreme temperatures as they are isolated from younger family members to assist them in times of need. Region L is particularly vulnerable due to the heat indices that it experiences during the warmer weather.
Impact and Vulnerability
Specific groups of the population such as people aged 65 and older, infants and children, people with chronic medical conditions, low income, outdoor workers and athletes are more at risk because of the heightened vulnerability of this segment of the population. Two specific segments have been looked at closely which are the people aged 65 and older and children under the age of 5 that may be more at risk. The greatest population of under age 5 resides in the counties of Johnson, Sedgwick and Wyandotte in Kansas. According to the Kansas Department of Health and Environment, from 2000 to 2011, Region L experience 21 fatalities with extreme heat as the underlying cause of death. Seventeen of those decedents were male. The youngest was 11 months old, and the oldest was 95 years old. The average age of the decedents were 50.8 years old. The year with the highest number of deaths was 2011 which had 5.
From 2000 – 2011, in Wyandotte, Johnson, and Leavenworth counties, there were 12 deaths with exposure to natural cold as the underlying cause. Eight of those decedents were female. The youngest was 23 years old and the oldest was 90 years old. The average age of the decedents was 66.17 years old. The year with the highest number of deaths was 2010 with four.
Extreme cold often accompanies a winter storm or is left in its wake. Prolonged exposure to the cold can cause frostbite or hypothermia and become life-threatening. Infants and elderly people are most susceptible. Freezing temperatures can cause severe damage to crops and other critical vegetation. Pipes may freeze and burst in homes or businesses that are poorly insulated or without heat. Structure fires occur more frequently in the winter due to lack of proper safety precautions and present a greater danger because water supplies may freeze, and impede firefighting efforts. People die of hypothermia from prolonged exposure to the cold. Indigent and elderly people are most vulnerable to winter storms and account for the largest percentage of hypothermia victims largely due to improperly or unheated homes. The leading cause of death during winter storms is from automobile or other transportation accidents. According to the USDA Risk Management Agency’s insured crop losses as a result of heat and hot wind conditions and freeze and frost conditions during the ten-year period of 2002 – 2011,

3.96
Region L has experienced an average loss of $207,324.70 in crop losses. Table 3.56 shows the total insured crop insurance paid per county from 2002-2011 for Region L. Table 3.56. Total Insured Crop Insurance Paid from 2002 – 2011 for Region L
Source: USDA Risk Management Agency This hazard can become more serious when combined with a utility/infrastructure failure or winter storm hazard. Sometimes this hazard contributes to the infrastructure failure, such as overloading of the power grid during hot summer months. Severe temperatures could impact the agriculture industry statewide. Historically the highest temperatures in Region L occur in June, July, August, and September of every summer. Therefore, the majority of direct and indirect exposure to excessive heat that has caused fatalities also occurs during these months. There is greater elderly population risk in the urban counties of Johnson, Sedgwick and Shawnee, but overall the State of Kansas has a higher than average elderly population. The two ages the most vulnerable to temperature extremes are individuals 65 years and over, and individuals under 5 years of age. The following table reflects the percentages of these two age groups by jurisdiction within the Region. Townships were not included due to the sampling error size which was not deemed a true reflection of the data required. The following table shows the combined vulnerability for the participating jurisdictions within the region according to the Census Bureau:. Table 3.57. Region L Vulnerable Population to Extreme Temperatures
Jurisdiction 65 Years and Over (%)
Less than 5 years (%)
Total Vulnerable Population
(%) Johnson County
Desoto 9 6.6 15.6 Edgerton 5.2 7.6 12.8 Fairway 16.7 7.3 24.0 Gardner 5.3 11.5 16.8 Lake Quivira 24.7 2.2 26.9 Leawood 15.3 5.5 20.8 Lenexa 10.3 7.1 17.4 Merriam 13.9 6.4 20.3 Mission 13.4 5.6 19.0 Mission Hills 16.5 3.1 19.6 Mission Woods 24.2 9.6 33.8 Olathe 7.2 8.9 16.1 Overland Park 12.3 6.4 18.7 Prairie Village 17.9 6.2 24.1
County Total Insured Crop Insurance Paid for Annualized Insured Extreme Temperature Damages Crop Insurance Paid For Extreme Temperature Damages
Mitigation Planning Region I Johnson $1,410,575 $141,058 Leavenworth $474,195 $47,420 Wyandotte $0 $0 Subtotal $1,884,770 $188,477

3.97
Roeland 11.1 7.0 18.1 Leavenworth County
Leavenworth, City of
10 8.1 18.1
Lansing 8.3 5.4 13.7 Tonganoxie 11.8 8.8 20.6 Basehor 11.7 6.2 17.9 Linwood 12.3 7.2 19.5 Easton 22.3 6.4 28.7
Wyandotte County Bonner Springs 11.8 7.0 18.8 Edwardsville 13.9 8.0 21.9 Lake Quivira (pt) 0 0 0 Kansas City, Ks 10.5 8.8 19.3 Source: U.S. Census Bureau
As a comparison, the Census Bureau reflects the State of Kansas as follows: Under 5 years: 7.1% 65 years and older: 13.1% Summary Region L is vulnerable to extreme temperatures of hot and cold, specifically the population over the age of 65 and under 5 years of age. Johnson, Wyandotte, and Leavenworth Counties counter attack these temperature extremes by providing warming and cooling shelters for individuals in need. Crop damage is susceptible to extreme temperatures which cause a loss of revenue that reverberates throughout the economy. In a ten year period from 2002 – 2011, the total crop insurance paid was $1,884,770.
Local Mitigation Concerns
• Extreme temperatures affect the population of the whole Region, with the under 5 and over 65 age groups being the most susceptible. However, all ages can succumb to extreme temperatures. Protecting the vulnerable populations is a priority with various programs in place to ensure they are not overlooked or forgotten. Leavenworth County opens warming and cooling centers at the Community Center and relies on the Red Cross to assist in locating other centers when the need arises.
• Another mitigation concern with extreme heat is wildfires. When the region has periods of drought, coupled with extreme heat, the incidence of wildfires can increase as the fauna, grass, and crops dry out they become a tinder box that is more susceptible to igniting
Development in Hazard Prone Areas
Extreme heat and cold affect people and livestock more than property. This hazard is not expected to cause concern in developing trends within the Region.
Johnson County

3.98
Table 3.58. Johnson County CPRI: Extreme Temperatures
Hazard Type Probability Magnitude Warning
Time Duration CPRI Planning
Significance
Johnson County Extreme Temperatures 3 2 1 4 2.50 Moderate Leavenworth County Table 3.59. Leavenworth County CPRI: Extreme Temperatures
Hazard Type Probability Magnitude Warning
Time Duration CPRI Planning
Significance
Leavenworth County Extreme Temperatures 3 2 1 3 2.40 Moderate Wyandotte County Table 3.60. Wyandotte County CPRI: Extreme Temperatures
Hazard Type Probability Magnitude Warning
Time Duration CPRI Planning
Significance
Wyandotte County Extreme Temperatures 3 2 1 3 2.40 Moderate
Consequence (Impact) Analysis Extremes of heat and cold environmental conditions can be detrimental to the health and comfort as human bodies attempt to maintain a core temperature of about 98.6 degrees F.
Extreme heat is the number one weather-related killer in the U.S. resulting in hundreds of fatalities each year. In fact, on average, extreme heat claims more lives each year than floods, lightning, tornadoes and hurricanes combined.
The hazard of extreme heat is when the body heats too quickly to cool itself safely, or when too much fluid or salt is lost through dehydration or sweating, body temperature rises and heat-related illness may develop.
The severity of heat disorders tends to increase with age. Conditions that cause heat cramps in a 17-year-old may result in heat exhaustion in someone 40 years old and in heat stroke in a person over 60.
Table 3.61 provides the Consequence Analysis of Potential for Detrimental Impacts of Hazards for EMAP purposes.

3.99
Table 3.61. Consequence Analysis: Extreme Temperatures
Subject Ranking Impacts/Extreme Temperatures
Health and Safety of Persons in the Area of the Incident Minimal - Severe
Depending on the duration of the event, Impact in the incidence area is expected to be severe for unprepared and unprotected persons. Impact will be minimal to moderate for prepared and protected persons.
Responders Minimal to Severe
Impact could be severe if proper precautions are not taken, i.e. hydration in heat, clothing in extreme cold. With proper preparedness and protection the impact would be minimal.
Continuity of Operations Minimal Minimal expectation for utilization of the COOP.
Property, Facilities, and Infrastructure Minimal to Sever
Impact to infrastructure could be minimal to severe depending on the temperature extremes.
Delivery of Services Minimal Impact on the delivery of services should be non-existent to minimal.
Environment Severe
The impact to the environment could be severe. Extreme heat and extreme cold have the potential to seriously damage wildlife and plants, trees, crops, etc.
Economic Conditions Minimal to Severe
Impacts to the economy will be dependent on how extreme the temperatures get, but only in the sense of whether people will venture out to spend money. Utility bills could shoot up causing more financial hardship and could put a strain on infrastructure and crops (minimal to severe).
Public Confidence in Jurisdiction’s Governance Minimal to Moderate
Confidence will be dependent on how well utilities hold up as they are stretched to provide heat and cool air, depending on the extreme. Planning and response could be challenged (minimal to moderate).

3.100
3.2.9 Flood Calculated Priority Risk Index Planning Significance
3.55 High Description The two types of flooding that affect Region L are flash flooding and riverine flooding, which will be the focus of this section. Flash Flooding
A flash flood is an event that occurs with little or no warning where water levels rise at an extremely fast rate. Flash flooding results from intense rainfall over a brief period, and can be associated with rapid snowmelt, ice jam release, frozen ground, saturated soil or impermeable surfaces
Flash Flood is caused by excess water usually from a storm. Flash floods occur whenever water enters into an area faster than it can be absorbed or drained. With no place to go, the water will find the lowest elevations–areas that are often not in a floodplain. This type of flooding, often referred to as sheet flooding, is becoming increasingly prevalent as development outstrips the ability of the drainage infrastructure to properly carry and disperse the water flow.
Flash flooding is an extremely dangerous form of flooding which can reach full peak in only a few minutes and allows little or no time for protective measures to be taken by those in its path. Flash flood waters move at very fast speeds and can move boulders, tear out trees, scour channels, destroy buildings, and obliterate bridges. Flash flooding often results in higher loss of life, both human and animal, than slower developing river and stream flooding.
In certain areas, aging storm sewer systems are not designed to carry the capacity currently needed to handle the increased storm runoff. Typically, the result is water backing into basements, which damages mechanical systems and can create serious public health and safety concerns. This combined with rainfall trends and rainfall extremes all demonstrate the high probability, yet generally unpredictable nature of flash flooding in the planning area.
Flash floods are unpredictable, however, there are factors that can point to the likelihood of flash floods occurring. Weather surveillance radar is being used to improve monitoring capabilities of intense rainfall. This, along with knowledge of the watershed characteristics, modeling techniques, monitoring, and advanced warning systems increases the warning time for flash floods.
Flash flooding occurs in those locations of the planning area that are low-lying and/or do not have adequate drainage to carry away the amount of water that falls during intense rainfall events. Precipitation in the planning area, between 1971 and 2000, averaged 37.14 inches to 42.30 inches. The very tip of the Northeastern portion of Johnson County, and the eastern 1/3 of Wyandotte County averaged 42 – 47 inches. Figure 3.21 shows the planning area as having greater precipitation amounts then the majority of the state.

3.101
Figure 3.21 Annual Precipitation Norms, 1971 – 2000.
Riverine Flooding
Riverine flooding is defined as the overflow of rivers, streams, drains, and lakes due to excessive rainfall, rapid snowmelt or ice melt. The areas adjacent to rivers and stream banks that carry excess floodwater during rapid runoff are called floodplains. A floodplain is defined as the lowland and relatively flat area adjoining a river or stream. The terms “special flood hazard area” and “100-year flood” refer to the area in the floodplain that is subject to a one percent or greater chance of flooding in any given year. Floodplains are part of a larger entity called a basin, which is defined as all the land drained by a river and its branches.
Location
All of Region L is susceptible to flash flooding and riverine flooding. The surface waters of the planning area flow through 2 water basins: The Kansas Lower Republican and the Marais des Cygnes as shown in Figure 3.22 shows the Marais des Cygnes and Figure 3.23 shows the Kansas Lower Republican.

3.102
Figure 3.22. Marais des Cygnes Basin

3.103
Figure 3.23. Kansas-Lower Republican Basin
Previous Occurrences Major floods impacted Kansas in 1844, 1903, 1935, 1951, 1965, 1973, 1976, 1981, 1986, 1993, 1998, 2001, 2007, 2009, and most recently in 2011. Region L has been included in 16 of the past 34 Presidential Disaster Declarations that included flooding. Table 3.62 lists Disaster Declarations for flooding which included the counties that make up Region L. Summary tables of flood events in each county and excerpts of narratives describing some of those events follow.

3.104
Table 3.62. Disaster Declarations for Flooding that Have Included Region L
Declaration Number
Declaration Date*
Disaster Description
Counties Involved Disaster Cost
Presidential Declarations 4035 09/23/2011
(6/1-8/1/2011)
Flooding Atchison, Doniphan, Leavenworth and Wyandotte $7,462,881
1699 5/6/2007 (5/4/2007)
Severe Storms, Tornadoes, and Flooding
Barton, Brown, Chase, Cherokee, Clay, Cloud, Comanche, Cowley, Dickinson, Doniphan, Douglas, Edwards, Ellsworth, Harper, Harvey, Jackson, Kingman, Kiowa, Leavenworth, Lincoln, Lyon, Marshall, McPherson, Morris, Nemaha, Osage, Osborne, Ottawa, Pawnee, Phillips, Pottawatomie, Pratt, Reno, Rice, Riley, Saline, Shawnee, Smith, Stafford, Sumner, Wabaunsee, Washington
$117,565,269
1615 11/21/2005 (10/1-2/2005)
Severe Storms and Flooding
Atchison, Jackson, Jefferson, Leavenworth, Shawnee
$10,286,064
1579 2/8/2005 (1/4-6/2005)
Severe Winter Storm, Heavy Rains, and Flooding
Anderson, Atchison, Barber, Brown, Butler, Chase, Chautauqua, Clark, Coffey, Comanche, Cowley, Crawford, Douglas, Elk, Franklin, Greenwood, Harper, Harvey, Jackson, Jefferson, Kingman, Kiowa, Leavenworth, Lyon, Marion, McPherson, Morris, Osage, Pratt, Reno, Rice, Sedgwick, Shawnee, Sumner, Wabaunsee, Woodson, Wyandotte
$106,873,672
1562 09/30/2004 (8/27-30/2004)
Severe Storms, Flooding, and Tornadoes
Douglas, Wyandotte $2,103,376
1535 8/3/2004 (6/12-7/25/2004)
Severe Storms, Flooding, and Tornadoes
Barton, Butler, Cherokee, Decatur, Ellis, Geary, Graham, Jewell, Labette, Lyon, Marion, Mitchell, Morris, Ness, Osborne, Pawnee, Phillips, Rooks, Rush, Russell, Shawnee, Sheridan, Smith, Thomas, Trego, Wabaunsee, Wallace, Woodson, Wyandotte
$12,845,892
1462 5/6/2003 (5/4-30/2003)
Severe Storms, Tornadoes, and Flooding
Allen, Anderson, Cherokee, Crawford, Douglas, Haskell, Labette, Leavenworth, Meade, Miami, Neosho, Osage, Seward, Woodson, Wyandotte
$988,056
1258 11/5/1998 (10/30-11/15/1998)
Severe Storms and Flooding
Butler, Chase, Coffey, Cowley, Douglas, Franklin, Greenwood, Harper, Harvey, Johnson, Leavenworth, Lyon, Marion, Neosho, Saline, Sedgwick, Sumner, Wilson, Woodson, Wyandotte
1254 10/14/1998 (10/1-10/8/1998)
Severe Storms, Flooding, and Tornadoes
Bourbon, Cherokee, Douglas, Franklin, Jackson, Jefferson, Johnson, Leavenworth, Linn, Seward, Wabaunsee, Wyandotte
1000 7/22/1993 (6/28-10/5/1993)
Flooding, Severe Storms
Atchison, Barton, Brown, Chase, Cherokee, Clay, Cloud, Crawford, Dickinson, Doniphan, Douglas, Edwards, Ellis, Ellsworth, Geary, Graham, Harvey, Hodgeman, Jackson, Jefferson, Jewell, Johnson, Lane, Leavenworth, Lincoln, Lyon, Marion, Marshall, McPherson, Mitchell, Morris, Nemaha, Ness, Osage, Osborne, Ottawa, Pawnee, Pottawatomie, Reno, Republic, Rice, Riley, Rooks, Rush, Russell, Saline, Sedgwick, Shawnee, Sheridan, Smith, Stafford,
$99,790,368

3.105
Sumner, Thomas, Trego, Wabaunsee, Washington, Wyandotte
663 6/28/1982 Severe Storms, Flooding
Jackson, Shawnee $804,048
539 9/20/1977 Severe Storms, Flooding
Atchison, Brown, Doniphan, Jackson, Jefferson, Johnson, Leavenworth, Nemaha, Shawnee, Wyandotte
$4,041,566
403 9/28/1973 Severe Storms, Tornadoes, Flooding
Atchison, Barber, Barton, Brown, Butler, Chase, Clay, Cloud, Coffey, Comanche, Cowley, Dickinson, Doniphan, Douglas, Edwards, Ellsworth, Franklin, Geary, Greenwood, Harper, Harvey, Jackson, Jefferson, Kingman, Kiowa, Leavenworth, Lincoln, Linn, Lyon, Marion, Marshall, McPherson, Miami, Morris, Nemaha, Osage, Ottawa, Pawnee, Pottawatomie, Pratt, Reno, Republic, Rice, Riley, Saline, Sedgwick, Shawnee, Stafford, Sumner, Wabaunsee, Washington, Woodson, Wyandotte
$4,296,913
378 5/2/1973 Severe Storms, Flooding
Atchison, Barber, Barton, Bourbon, Brown, Butler, Chautauqua, Cherokee, Clark, Coffey, Crawford, Dickinson, Doniphan, Douglas, Edwards, Ellsworth, Ford, Franklin, Gray, Greenwood, Harper, Harvey, Haskell, Hodgeman, Jackson, Jefferson, Kingman, Kiowa, Labette, Leavenworth, Lincoln, Linn, Lyon, Marion, Marshall, McPherson, Meade, Miami, Montgomery , Morris, Nemaha, Ness, Osage, Osborne, Ottawa, Pawnee, Pottawatomie, Pratt, Reno, Republic, Rice, Rush, Russell, Saline, Sedgwick, Seward, Shawnee, Stafford, Stevens, Sumner, Wabaunsee, Washington, Woodson, Wyandotte
$1,954,624
267 7/15/1969 Tornadoes, Severe Storms, Flooding
Allen, Anderson, Bourbon, Crawford, Dickinson, Douglas, Ellsworth, Franklin, Johnson, Leavenworth, Linn, Lyon, McPherson, Miami, Morris, Neosho, Osage, Saline, Woodson, Wyandotte
$733,524
229 7/18/1967 Tornadoes, Severe Storms, Flooding
Anderson, Atchison, Chase, Cloud, Coffey, Crawford, Doniphan, Douglas, Finney, Franklin, Harper, Jackson, Jefferson, Kingman, Leavenworth, Linn, Lyon, Marion, Miami, Mitchell, Nemaha, Ness, Osage, Pottawatomie, Republic, Washington, Wabaunsee
$847,439
Emergency Declarations 3324 6/25/2011 Flooding Atchison, Doniphan, Leavenworth and Wyandotte n/a
Table 3.63. NCDC Flood Events for Johnson County, KS for the period from 1/1/2000 to 12/31/2012 Location Date Event Deaths Injuries Property
Damages Crop Damages
Johnson Co 03/04/2004 Flood 0 0 0.00K 0.00K Johnson Co 05/19/2004 Flood 0 0 0.00K 0.00K Johnson Co 07/24/2004 Flood 0 0 0.00K 0.00K Johnson Co 08/27/2004 Flood 0 0 0.00K 0.00K Johnson Co 06/04/2005 Flood 0 0 0.00K 0.00K Merriam 06/03/2008 Flood 0 0 0.00K 0.00K

3.106
Merriam 06/03/2008 Flood 0 0 0.00K 0.00K Merriam 06/03/2008 Flood 0 0 0.00K 0.00K Totals: 8 0 0 0.00K 0.00K Source: http://www.ncdc.noaa.gov/stormevents/choosedates.jsp?statefips=20%2CKANSAS Table 3.64. NCDC Flash Flood Events for Johnson County, KS for the period from 1/1/2000 to 12/31/2012 Location Date Event Deaths Injuries Property
Damages Crop Damages
OVERLAND PARK 06/20/2000 Flash Flood 0 0 0.00K 0.00K OLATHE 06/01/2001 Flash Flood 0 0 5.00K 0.00K LEAWOOD 06/01/2001 Flash Flood 0 0 0.00K 0.00K OVERLAND PARK 06/05/2001 Flash Flood 0 0 0.00K 0.00K STILWELL 05/11/2002 Flash Flood 0 0 0.00K 0.00K OVERLAND PARK 06/22/2003 Flash Flood 0 0 0.00K 0.00K OVERLAND PARK 08/31/2003 Flash Flood 1 0 0.00K 0.00K OVERLAND PARK 03/04/2004 Flash Flood 0 0 0.00K 0.00K OLATHE 05/19/2004 Flash Flood 0 0 0.00K 0.00K DE SOTO 07/06/2004 Flash Flood 0 0 0.00K 0.00K GARDNER 07/16/2004 Flash Flood 0 0 0.00K 0.00K STANLEY 08/23/2004 Flash Flood 0 0 0.00K 0.00K STANLEY 08/24/2004 Flash Flood 0 0 0.00K 0.00K MISSION 08/27/2004 Flash Flood 0 0 500.00K 0.00K MISSION 08/27/2004 Flash Flood 0 0 0.00K 0.00K SHAWNEE 08/28/2004 Flash Flood 0 0 0.00K 0.00K GARDNER 06/04/2005 Flash Flood 0 0 0.00K 0.00K OVERLAND PARK 08/13/2005 Flash Flood 0 0 0.00K 0.00K GARDNER 08/19/2005 Flash Flood 0 0 0.00K 0.00K LENEXA 08/19/2005 Flash Flood 0 0 0.00K 0.00K MISSION 08/20/2005 Flash Flood 0 0 0.00K 0.00K GARDNER 07/11/2006 Flash Flood 0 0 0.00K 0.00K GARDNER 07/11/2006 Flash Flood 0 0 0.00K 0.00K SPRING HILL 07/11/2006 Flash Flood 0 0 0.00K 0.00K GARDNER 08/27/2006 Flash Flood 0 0 0.00K 0.00K SPRING HILL 08/27/2006 Flash Flood 0 0 0.00K 0.00K PRAIRIE VLG 08/27/2006 Flash Flood 0 0 0.00K 0.00K LENEXA 02/28/2007 Flash Flood 0 0 0.00K 0.00K MISSION 02/28/2007 Flash Flood 0 0 0.00K 0.00K MISSION 03/01/2007 Flash Flood 0 0 0.00K 0.00K LENEXA 03/01/2007 Flash Flood 0 0 0.00K 0.00K MISSION HILLS 04/25/2007 Flash Flood 0 0 0.00K 0.00K OVERLAND PARK 05/06/2007 Flash Flood 0 0 0.00K 0.00K STANLEY 06/29/2007 Flash Flood 0 0 0.00K 0.00K OVERLAND PARK 06/29/2007 Flash Flood 0 0 0.00K 0.00K GARDNER 06/30/2007 Flash Flood 0 0 0.00K 0.00K LENEXA 07/09/2007 Flash Flood 0 0 0.00K 0.00K OVERLAND PARK 07/09/2007 Flash Flood 0 0 0.00K 0.00K OVERLAND PARK 07/09/2007 Flash Flood 0 0 0.00K 0.00K EDGERTON 06/02/2008 Flash Flood 0 0 0.00K 0.00K

3.107
WESTWOOD 06/03/2008 Flash Flood 0 0 0.00K 0.00K OLATHE 06/03/2008 Flash Flood 0 0 0.00K 0.00K LEAWOOD 07/30/2008 Flash Flood 0 0 0.00K 0.00K FAIRWAY 06/24/2009 Flash Flood 0 0 0.00K 0.00K WESTWOOD 08/17/2009 Flash Flood 0 0 0.00K 0.00K LENEXA 06/08/2010 Flash Flood 0 0 0.00K 0.00K STANLEY 06/08/2010 Flash Flood 0 0 0.00K 0.00K LEAWOOD 06/08/2010 Flash Flood 0 0 0.00K 0.00K LEAWOOD 06/12/2010 Flash Flood 0 0 0.00K 0.00K MORSE 06/14/2010 Flash Flood 0 0 0.00K 0.00K STILWELL HILLSIDE AR
06/16/2010 Flash Flood 0 0 0.00K 0.00K
STILWELL MISSION ARP
07/20/2010 Flash Flood 0 0 0.00K 0.00K
GARDNER ARPT 07/20/2010 Flash Flood 0 0 0.00K 0.00K OLATHE 05/06/2012 Flash Flood 0 0 0.00K 0.00K Totals: 54 1 0 505.00K 0.00K Source: http://www.ncdc.noaa.gov/stormevents/choosedates.jsp?statefips=20%2CKANSAS Table 3.65. NCDC Flood Events for Leavenworth County, KS for the period from 1/1/2000 to 12/31/2012
Location Date Event Deaths Injuries Property Damages
Crop Damages
LEAVENWORTH Co. 6/24/2000 Flood 0 0 0.00K 0.00K
LEAVENWORTH Co. 3/15/2001 Flood 0 0 0.00K 0.00K
LEAVENWORTH Co. 5/06/2001 Flood 0 0 0.00K 0.00K
LEAVENWORTH Co. 6/19/2001 Flood 0 0 2.010M 0.00K
LEAVENWORTH Co. 7/12/2001 Flood 0 0 0.00K 0.00K
LEAVENWORTH Co. 7/19/2001 Flood 0 0 0.00K 0.00K
LEAVENWORTH Co. 7/19/2001 Flood 0 0 0.00K 0.00K
LEAVENWORTH Co. 9/17/2001 Flood 0 0 0.00K 0.00K
LEAVENWORTH Co. 5/11/2002 Flood 0 0 0.00K 0.00K
LEAVENWORTH Co. 5/19/2004 Flood 0 0 0.00K 0.00K
LEAVENWORTH Co. 2/13/2005 Flood 0 0 0.00K 0.00K
LEAVENWORTH Co. 5/13/2005 Flood 0 0 0.00K 0.00K
LEAVENWORTH Co. 6/04/2005 Flood 0 0 0.00K 0.00K
LEAVENWORTH Co. 6/06/2005 Flood 0 0 0.00K 0.00K
LEAVENWORTH Co. 6/11/2005 Flood 0 0 0.00K 0.00K
LEAVENWORTH Co. 10/02/2005 Flood 0 0 2.800M 300.00K
EASTON 4/30/2006 Flood 0 0 0.00K 0.00K
LOWEMONT 5/07/2007 Flood 0 0 750.00K 100.00K
TONGANOXIE 5/07/2007 Flood 0 0 0.00K 0.00K

3.108
EASTON 10/18/2007 Flood 0 0 0.00K 0.00K
EASTON 12/11/2007 Flood 0 0 0.00K 0.00K
EASTON 3/03/2008 Flood 0 0 0.00K 0.00K
LENAPE 6/13/2010 Flood 0 0 0.00K 0.00K
Totals: 23
0 0 5.560M 400.00K Source: http://www.ncdc.noaa.gov/stormevents/choosedates.jsp?statefips=20%2CKANSAS Table 3.66. NCDC Flash Flood Events for Leavenworth County, KS for the period from 1/1/2000 to 12/31/2012
Location Date Event Deaths Injuries Property Damages
Crop Damages
Tonganoxie 06/01/2001 Flash Flood 0 0 0.00K 0.00K
Leavenworth 6/1/2001 Flash Flood 0 0 0.00K 0.00K
Leavenworth 6/1/2001 Flash Flood 0 0 0.00K 0.00K
Easton 6/19/2001 Flash Flood 0 0 0.00K 0.00K
Easton 6/20/2001 Flash Flood 0 0 0.00K 0.00K
Tonganoxie 6/12/2003 Flash Flood 0 0 0.00K 0.00K
Tonganoxie 6/12/2003 Flash Flood 0 0 0.00K 0.00K
Leavenworth 3/04/2004 Flash Flood 0 0 0.00K 0.00K
Tonganoxie 7/06/2004 Flash Flood 0 0 0.00K 0.00K
Tonganoxie 08/27/2004 Flash Flood 0 0 0.00K 0.00K
Tonganoxie 08/27/2004 Flash Flood 0 0 0.00K 0.00K
Leavenworth 4/11/2005 Flash Flood 0 0 0.00K 0.00K
Leavenworth 5/11/2005 Flash Flood 0 0 0.00K 0.00K
Tonganoxie 6/04/2005 Flash Flood 0 0 0.00K 0.00K
Leavenworth 6/04/2005 Flash Flood 0 0 0.00K 0.00K
Leavenworth 6/08/2005 Flash Flood 0 0 0.00K 0.00K
Jarbalo 06/12/2005 Flash Flood 0 0 0.00K 0.00K
Basehor 6/30/2005 Flash Flood 0 0 0.00K 0.00K
Lansing 6/30/2005 Flash Flood 0 0 0.00K 0.00K
Basehor 8/19/2005 Flash Flood 0 0 0.00K 0.00K
Easton 10/02/2005 Flash Flood 0 0 1.200M 0.00K
Leavenworth 10/02/2005 Flash Flood 0 0 1.000M 0.00K
Lenape 6/07/2007 Flash Flood 0 0 2.00K 0.00K
Tonganoxie 6/02/2008 Flash Flood 0 0 0.00K 0.00K
Linwood 6/03/2008 Flash Flood 0 0 0.00K 0.00K

3.109
Loring 6/05/2008 Flash Flood 0 0 0.00K 0.00K
Leavenworth 7/02/2008 Flash Flood 0 0 0.00K 0.00K
Leavenworth 7/02/2008 Flash Flood 0 0 0.00K 0.00K
Lansing 7/02/2008 Flash Flood 0 0 0.00K 0.00K
Lansing 9/12/2008 Flash Flood 0 0 0.00K 0.00K
Easton 9/13/2008 Flash Flood 0 0 0.00K 0.00K
Tonganoxie 4/25/2009 Flash Flood 0 0 0.00K 0.00K
Lansing 4/26/2009 Flash Flood 0 0 0.00K 0.00K
Reno 4/26/2009 Flash Flood 0 0 0.00K 0.00K
Reno 5/15/2009 Flash Flood 0 0 0.00K 0.00K
Leavenworth 8/17/2009 Flash Flood 0 0 0.00K 0.00K
Lansing 8/17/2009 Flash Flood 0 0 0.00K 0.00K
Leavenworth 8/17/2009 Flash Flood 0 0 0.00K 0.00K
Fairmount 7/11/2010 Flash Flood 0 0 0.50K 0.00K
Leavenworth 6.16.2919 Flash Flood 0 0 0.00K 0.00K
Lansing 7/16/2010 Flash Flood 0 0 0.00K 0.00K
Leavenworth 7.20/2010 Flash Flood 0 0 0.00K 0.00K
Leavenworth 7/20/2010 Flash Flood 0 0 0.00K 0.00K
Totals: 43
0 0 2.202M 0.00K Source: NCDC. http://www.ncdc.noaa.gov/stormevents/choosedates.jsp?statefips=20%2CKANSAS Table 3.67. NCDC Flood Events for Wyandotte County, KS for the period from 1/1/2000 to 12/31/2012 Location Date Event Deaths Injuries Property
Damages Crop Damages
Wyandotte Co. 5/03/2001 Flood 0 0 0.00K 0.00K Wyandotte Co. 6/20/2001 Flood 0 0 0.00K 0.00K Wyandotte Co. 5/19/2004 Flood 0 0 0.00K 0.00K Wyandotte Co. 8/27/2004 Flood 0 0 0.00K 0.00K Kansas City 5/07/2007 Flood 0 0 0.00K 0.00K Kansas Ctiy 5/08/2007 Flood 0 0 0.00K 0.00K Totals: 6 0 0 0.00K 0.00K Source: NCDC. http://www.ncdc.noaa.gov/stormevents/choosedates.jsp?statefips=20%2CKANSAS

3.110
Table 3.68. NCDC Flash Flood Events for Wyandotte County, KS for the period from 1/1/2000 to 12/31/2012 Location Date Event Deaths Injuries Property
Damages Crop Damages
Kansas City 4/03/2001 Flash Flood 0 0 0.00K 0.00K Kansas City 4/14/2001 Flash Flood 0 0 0.00K 0.00K Kansas City 6/05/2001 Flash Flood 0 0 0.00K 0.00K Kansas City 5/19/2004 Flash Flood 0 0 0.00K 0.00K Kansas City 5/19/2004 Flash Flood 0 0 0.00K 0.00K Kansas City 7/06/2004 Flash Flood 0 0 0.00K 0.00K Bonner Spgs 8/27/2004 Flash Flood 0 0 1.000M 0.00K Kansas City 8/27/2004 Flash Flood 0 0 500.00K 0.00K Kansas City 8/27/2004 Flash Flood 0 0 0.00K 0.00K Kansas City 8/28/2004 Flash Flood 0 0 0.00K 0.00K Kansas City 5/12/2005 Flash Flood 0 0 0.00K 0.00K Kansas City 8/27/2006 Flash Flood 0 0 0.00K 0.00K Kansas City 5/06/2007 Flash Flood 0 0 0.00K 0.00K Bonner Spgs 6/07/2007 Flash Flood 0 0 0.00K 0.00K Sunflower 10/17/2007 Flash Flood 0 0 0.00K 0.00K Kansas City 7/02/2008 Flash Flood 0 0 0.00K 0.00K Kansas City 7/02/2008 Flash Flood 0 0 30.00K 0.00K Turner 7/27/2009 Flash Flood 0 0 00.0K 00.0K Pomeroy 7/27/2009 Flash Flood 0 0 5.00K 0.00K Muncie 8/17/2009 Flash Flood 0 0 0.00K 0.00K Turner 7/11/2010 Flash Flood 0 0 0.00K 0.00K Totals: 21 0 0 1.530M 0.00K Source: NCDC. http://www.ncdc.noaa.gov/stormevents/choosedates.jsp?statefips=20%2CKANSAS
Selected Event Narratives
FEMA-4035-DR: Flooding—September 23, 2011
Four counties in Northeast Kansas were declared for flooding that occurred from June 1 to August 1, 2011 along the Missouri River. These Counties included Atchison, Doniphan, Leavenworth, and Wyandotte. Damages as a result of this event were estimated to be nearly $1,211,416.62 and primarily involved damages to roads and bridges.
Record snowfall in the Rocky Mountains of Montana and Wyoming along with near record spring rainfall in central and eastern Montana triggered severe flooding within the Upper Missouri River Basin. According to the National Weather Service, in the second half of the month of May 2011, almost a year’s worth of rain fell over the upper Missouri River Basin. This extremely heavy rainfall, in conjunction with an estimated 212 percent of normal snowpack in the Rocky Mountains, contributed to this flooding event.
All six major dams along the Missouri River released record amounts of water to prevent overflow and devastating consequences to towns and cities along the river from Montana to Missouri.

3.111
The Corps of Engineers reported that every non-federal levee from Rulo to Wolcott, Kansas in Wyandotte County on both sides of the river were either overtopped or breached. Included in the over toppings was Kansas Department of Corrections land below the Lansing Correctional Facility in Leavenworth County. The federal levee at Fort Leavenworth by Sherman Army Airfield was also breached. Water reached the previously evacuated hangars.
Figure 3.24. Missouri River Flooding 2011 – Figure 3.25. Missouri River Flooding 2011 showing Gauge at 29 ft. Leavenworth County
Other Notable Flood Events • June 2001: Storms dumped 5½ inches of rain on Easton in Leavenworth County. Stranger
Creek overflowed and tore through houses, mobile homes, and fields and closed the Kansas Turnpike. Officials estimated 75 to 100 households in the town of about 360 residents were flooded. Twenty-six homes were destroyed, 21 received major damage, and 25 others had minor damage.
• March 2004: Heavy rains caused flooding on area streams and creeks. Indian Creek at
Overland Park crested at 12.69 feet or 0.69 feet above flood stage. The Blue River at Stanley crested at 19.44 feet. 3.44 feet above flood stage.
• May 2004: Stranger Creek at Easton crested at 18.45 feet, or 1.45 feet above flood stage. The Blue River near Stanley crested at 20.12 feet, or 4.12 feet above flood stage.
• May 2007: A slow moving cold front combined with an upper level storm system, produced
widespread flash flooding and large hail across the area from late on May 5th through May 6th 2007. The Kansas River at the 23rd Street Bridge crested at 40.96 feet, or 7.96 feet above flood stage in Wyandotte County.
• June 2008: Severe thunderstorms erupted across the area on June 3, 2008. There were reports of large hail and very heavy rains with flash flooding. An underpass was reported full of standing water, and several roads were washed out 3 miles west of Linwood. The planning area reported flooding in various jurisdictions.

3.112
• June 2010: A frontal boundary continued to meander around the region. Thunderstorms
with very heavy rains, caused several reports of flash flooding across the area, in the late evening and early morning hours of, June 13th and 14th, 2010. Up to four inches of water was reported over 174th Street and Hemphill Road and up to two feet of water was reported on area roads in Johnson County.
Extent The reported flooding events according to the NCDC database for the three counties that make up Region L are as follows:
• Within the last twelve years, Johnson County has experienced 8 floods and 54 flash floods. During the flood events, various rivers and creeks within Johnson County have crested at 0.22 to 4.12 feet above their respective flood stages. The following are the documented events for these crest:
o 05/19/2004 Stranger Creek at Easton crested at 18.45 feet, or 1.45 feet above flood stage. The Blue River near Stanley crested at 20.12 feet, or 4.12 feet above flood stage.
o 07/24/2004 Indian Creek in Overland Park crested at 12.22 feet, or 0.22 feet above flood stage.
• Between 2000 and 2012, Leavenworth County experienced 23 floods and 43 flash floods. The rivers and creeks within Leavenworth County crested during these flood events at .25 feet to 10.80 feet above the flood stage. Following are the events that detail these flood stages.
o 02/14/2005 - The Stranger Creek near Easton crested at 17.25 feet, or 0.25 feet
above flood stage.
o 05/9/2007 - The Stranger Creek at Easton had its highest crest ever on May 7,2007. It crested at 27.80 feet, or 10.80 feet above flood stage. Several homes and businesses suffered damage.
• Wyandotte County experienced 6 floods and 21 flash flood events between the years
2000 and 2012. During the flood events, various rivers and creeks crested at .19 feet to 7.96 feet above flood stage. Following are the documented events for these crest:
o 05/19/2004 - Turkey Creek at Southwest Blvd in Kansas City, Kansas crested at
61.19 feet, or 0.19 of a foot above flood stage.
o 05/07/2007 to 05/11/2007 - A slow moving cold front combined with an upper level storm system, produced widespread flash flooding and large hail across the area from late on May 5th through May 6th 2007. The Kansas River at the 23rd Street Bridge crested at 40.96 feet, or 7.96 feet above flood stage.
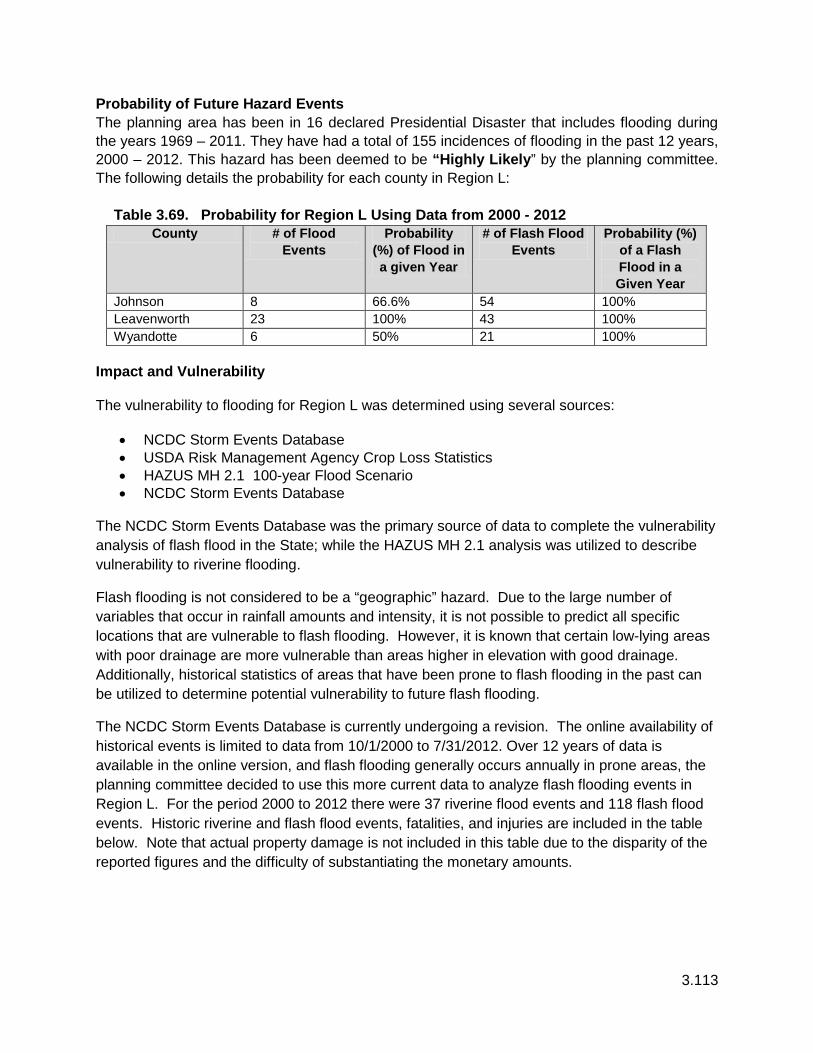
3.113
Probability of Future Hazard Events The planning area has been in 16 declared Presidential Disaster that includes flooding during the years 1969 – 2011. They have had a total of 155 incidences of flooding in the past 12 years, 2000 – 2012. This hazard has been deemed to be “Highly Likely” by the planning committee. The following details the probability for each county in Region L:
Table 3.69. Probability for Region L Using Data from 2000 - 2012 County # of Flood
Events Probability
(%) of Flood in a given Year
# of Flash Flood Events
Probability (%) of a Flash Flood in a Given Year
Johnson 8 66.6% 54 100% Leavenworth 23 100% 43 100% Wyandotte 6 50% 21 100%
Impact and Vulnerability The vulnerability to flooding for Region L was determined using several sources:
• NCDC Storm Events Database • USDA Risk Management Agency Crop Loss Statistics • HAZUS MH 2.1 100-year Flood Scenario • NCDC Storm Events Database
The NCDC Storm Events Database was the primary source of data to complete the vulnerability analysis of flash flood in the State; while the HAZUS MH 2.1 analysis was utilized to describe vulnerability to riverine flooding.
Flash flooding is not considered to be a “geographic” hazard. Due to the large number of variables that occur in rainfall amounts and intensity, it is not possible to predict all specific locations that are vulnerable to flash flooding. However, it is known that certain low-lying areas with poor drainage are more vulnerable than areas higher in elevation with good drainage. Additionally, historical statistics of areas that have been prone to flash flooding in the past can be utilized to determine potential vulnerability to future flash flooding.
The NCDC Storm Events Database is currently undergoing a revision. The online availability of historical events is limited to data from 10/1/2000 to 7/31/2012. Over 12 years of data is available in the online version, and flash flooding generally occurs annually in prone areas, the planning committee decided to use this more current data to analyze flash flooding events in Region L. For the period 2000 to 2012 there were 37 riverine flood events and 118 flash flood events. Historic riverine and flash flood events, fatalities, and injuries are included in the table below. Note that actual property damage is not included in this table due to the disparity of the reported figures and the difficulty of substantiating the monetary amounts.

3.114
Table 3.70. Summary of Reported Flood Events in the Planning Area, 2000 - 2012
County # of Flood
Events Deaths Injuries
Johnson 62 1 0
Leavenworth 66 0 0
Wyandotte 27 0 0
Total 155 1 0
USDA Risk Management Agency Crop Insurance Payments
Table 3.71 provides total crop insurance payments and annualized crop insurance payments for flood damage in Region L over the 10-year period from 2002 to 2011. The USDA does not differentiate damages from riverine flooding and flash flooding. These losses include combined losses for both types of flooding. The crop exposure value from the 2007 Census of Agriculture is provided to provide the basis for an annualized ratio of insurance payments to total value. Please note that this data only applies to insured crops. According to the 2011 Kansas Crop Insurance Profile Report issued by the USDA Risk Management Agency 82 percent of Kansas’ row crops were insured in 2011. The crop exposure values have not been adjusted in the table below:
Table 3.71. Flood-Related Crop Insurance Payments Analysis (2002-2011)
County
Crop Exposure Value (2007 Census of
Agriculture)
Flood-Related Crop Insurance payments 2002-
2011
Annualized Crop Insurance payments
Annualized Flood-
Related Crop
Insurance Payment
Ratio Mitigation Planning Region L
Johnson $29,472,000 $1,070,834 $107,083 0.36% Leavenworth $20,983,000 $3,290,635 $329,064 1.57% Wyandotte Not Reported $0 $0 Not Reported Total $50,455,000 $4,361,469 $436,147
Source: USDA Risk Management Agency; 2007 USDA Census of Agriculture; Note: Crop Exposure for Elk, Wichita & Wyandotte Counties was not published to avoid disclosure of individual operations.
HAZUS MH 2.1 100-year Food Scenario
The results of the HAZUS analysis were utilized to estimate potential losses for riverine flooding. The intent of this analysis was to enable the planning area to estimate where flood losses could occur and the degree of severity using a consistent methodology. The HAZUS model helps quantify risk along known flood-hazard corridors as well as lesser streams and rivers that have a drainage area of 10 square miles or more.

3.115
The HAZUS-MH analysis provides the number of buildings impacted, estimates of the building repair costs, as well as the associated loss of building contents and business inventory. This analysis is based on riverine flooding. Building damage can also cause additional losses to a community as a whole by restricting a building’s ability to function properly. Income loss data accounts for losses such as business interruption and rental income losses as well as the resources associated with damage repair and job and housing losses. These losses are calculated by HAZUS-MH using a methodology based on the building damage estimates.
Among other factors, flood damage is related to the depth of flooding. HAZUS-MH takes into account flood depth when modeling damage (based on FEMA’s depth-damage functions). The HAZUS-MH reports capture damage by occupancy class (in terms of square footage impacted) by damage percent classes. Occupancy classes in HAZUS-MH include agriculture, commercial, education, government, industrial, religion, and residential. Damage percent classes are grouped by 10 percent increments 1-10 percent, 11-20 percent, etc., up to 50 percent. Buildings that sustain more than 50 percent damage are considered to be “substantially” damaged.
The displaced population is based on the inundation area. Individuals and households will be displaced from their homes even when the home has suffered little or no damage either because they were evacuated or there was no physical access to the property because of flooded roadways. Displaced people using shelters will most likely be individuals with lower incomes and those who do not have family or friends within the immediate area. HAZUS-MH does not model flood casualties.
According to the HAZUS MH2 2.1 one percent annual chance flood scenario results, there are 3,523 buildings in the one percent annual chance floodplain. Additionally, the planning area population vulnerable to displacement from the one percent annual chance flood scenario is 15,972. Table 3.72 provides the HAZUS results for the number of vulnerable buildings and population vulnerable to displacement for Region L.
Table 3.72. Vulnerable Buildings and Population, HAZUS One Percent Annual Chance Flood Scenario
County Vulnerable Buildings
Population Vulnerable to Displacement
Mitigation Planning Region L Johnson 1,896 8,853 Leavenworth 97 1,541 Wyandotte 1,530 5,578 Total 3,523 15,972
Source: State Hazard Mitigation Plan, 2013
Table 3.73 that follows provides total direct building loss and income loss for each county in the region. Table 3.74 provides the HAZUS results for vulnerable populations and the population estimated to seek short term shelter as well as the numbers of damaged and substantially damaged buildings for each county.
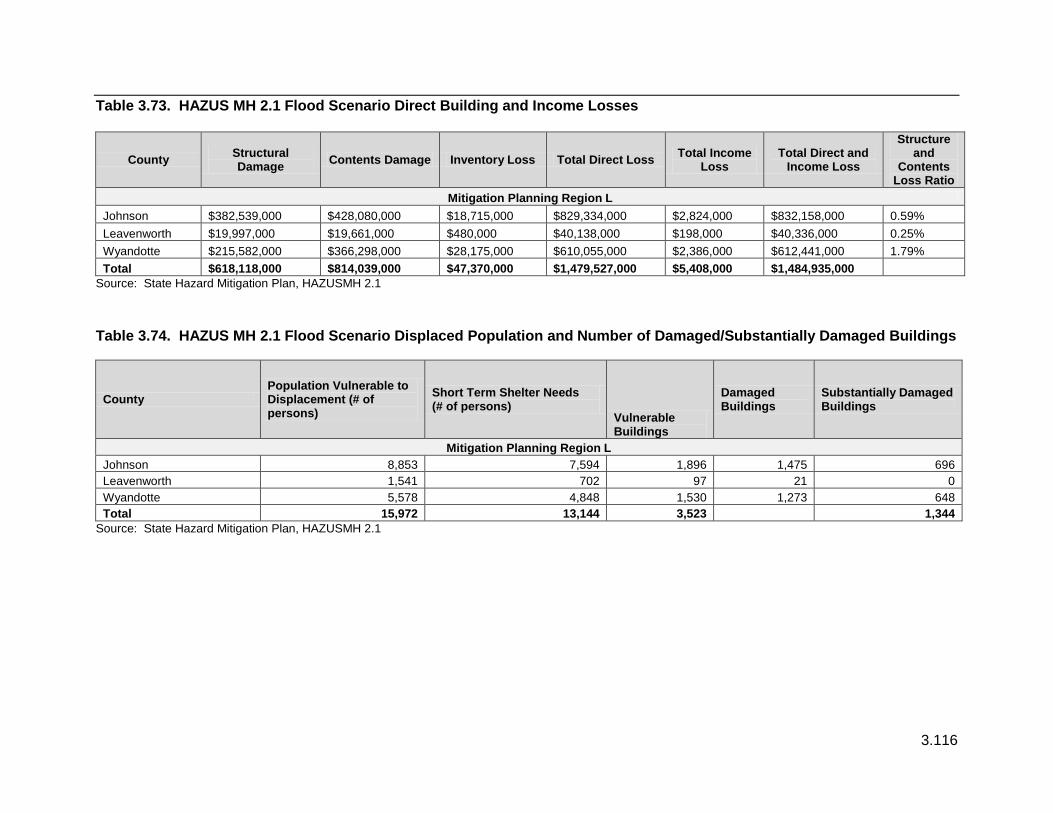
3.116
Table 3.73. HAZUS MH 2.1 Flood Scenario Direct Building and Income Losses
County Structural Damage Contents Damage Inventory Loss Total Direct Loss Total Income
Loss Total Direct and
Income Loss
Structure and
Contents Loss Ratio
Mitigation Planning Region L Johnson $382,539,000 $428,080,000 $18,715,000 $829,334,000 $2,824,000 $832,158,000 0.59% Leavenworth $19,997,000 $19,661,000 $480,000 $40,138,000 $198,000 $40,336,000 0.25% Wyandotte $215,582,000 $366,298,000 $28,175,000 $610,055,000 $2,386,000 $612,441,000 1.79% Total $618,118,000 $814,039,000 $47,370,000 $1,479,527,000 $5,408,000 $1,484,935,000
Source: State Hazard Mitigation Plan, HAZUSMH 2.1 Table 3.74. HAZUS MH 2.1 Flood Scenario Displaced Population and Number of Damaged/Substantially Damaged Buildings
County Population Vulnerable to Displacement (# of persons)
Short Term Shelter Needs (# of persons)
Vulnerable Buildings
Damaged Buildings
Substantially Damaged Buildings
Mitigation Planning Region L Johnson 8,853 7,594 1,896 1,475 696 Leavenworth 1,541 702 97 21 0 Wyandotte 5,578 4,848 1,530 1,273 648 Total 15,972 13,144 3,523
1,344
Source: State Hazard Mitigation Plan, HAZUSMH 2.1

3.117
NFIP Participation and Repetitive Flood Losses Information on NFIP participation and flood loss claims were obtained from FEMA’s Policy and Claim Statistics for Flood Insurance. This source provides losses from 1978 to August 2012. As of October 2012, Region L had a total of 1,571 insurance policies in force. There are several limitations to this data, including:
• Only losses to participating NFIP communities are represented, • Communities joined the NFIP at various times since 1978, • The number of flood insurance policies in effect may not include all structures at risk to
flooding, and • Some of the historical loss areas have been mitigated with property buyouts. • Some properties are under-insured. The flood insurance purchase requirement is for flood
insurance in the amount of federally-backed mortgages, not the entire value of the structure. Additionally, contents coverage is not required.
Table 3.75. NFIP Status for Region L Jurisdictions
Community CID Curr Eff Map Date Johnson County
Desoto, City of 200161 08/03/09 Edgerton, City of 200162 08/03/09 Fairway, City of 205185 08/03/09 Gardner, City of 200164 08/03/09 Johnson County 200159 08/03/09 Lake Quivira, City of 200166 Suspended Leawood, City of 200167 08/03/09 Lenexa, City of 200168 08/03/09 Merriam, City of 200169 08/03/09 Mission, City of 200170 08/03/09 Mission Hills, City of 200171 08/03/09 Mission Woods, City of 200172 08/03/09 Olathe, City of 200173 08/03/09 Overland Park, City of 200174 08/03/09 Prairie Village, City of 200175 08/03/09 Roeland Park, City of 200176 08/03/09 Shawnee, City of 200177 08/03/09 Spring Hill, City of 200178 08/03/09 Westwood, City of 200179 NFSHA Westwood Hills, City of 200180 NFSHA
Leavenworth County Basehor, City of 200187 08/18/09 Easton, City of 200188 08/18/09 Lansing, City of 200189 08/18/09 Leavenworth County 200186 08/18/09 Leavenworth, City of 200190 08/18/09

3.118
Linwood, City of 200191 08/18/09 Tonganoxie, City of 200192 08/18/09
Wyandotte County Bonner Springs, City of 200361 09/02/11 Edwardsville, City of 200362 09/02/11 Kansas City, City of 200363 09/02/11 Wyandotte County 200562 09/02/11
The NFIP Policy and Loss statistics show a pattern of historical flood losses for the counties of Johnson, Leavenworth, and Wyandotte. The greatest losses have been in Wyandotte and Johnson Counties. Table 3.76 provides summary data on NFIP policies and losses
Table 3.76. Summary of Policies, Insurance, and Closed Losses for Region L
County
Number of Policies in
Force Insurance in Force Total Payments (1978 – 8/2012)
Johnson 1,005 $250,485,700 $8,651,619 Leavenworth 264 $53,334,200 $2,647,895 Wyandotte 302 $83,151,500 $9,955,138 Subtotal 1,571 $386,971,400 $21,254,652
Source: FEMA, http://bsa.nfipstat.fema.gov/reports/1040.htm#20
Table 3.77 show a breakdown of claims for local jurisdictions.
Table 3.77. Claims for Local Jurisdictions in Region L
Johnson County
Jurisdiction Total Losses Total Payments Desoto 1 .00 Edgerton 2 3142.55 Fairway 100 1,349,913.69 Johnson County 37 358,147.50 Leawood 80 1,034,552.28 Lenexa 17 53,342.46 Merriam 96 1,675,284.70 Mission Hills 56 1.336.277.00 Mission 69 332,542.10 Olathe 23 71,187.75 Overland Park 288 1,286,883.32 Prairie Village 111 552,074.57 Roeland park 40 145,364.37 Shawnee 61 429,871.38
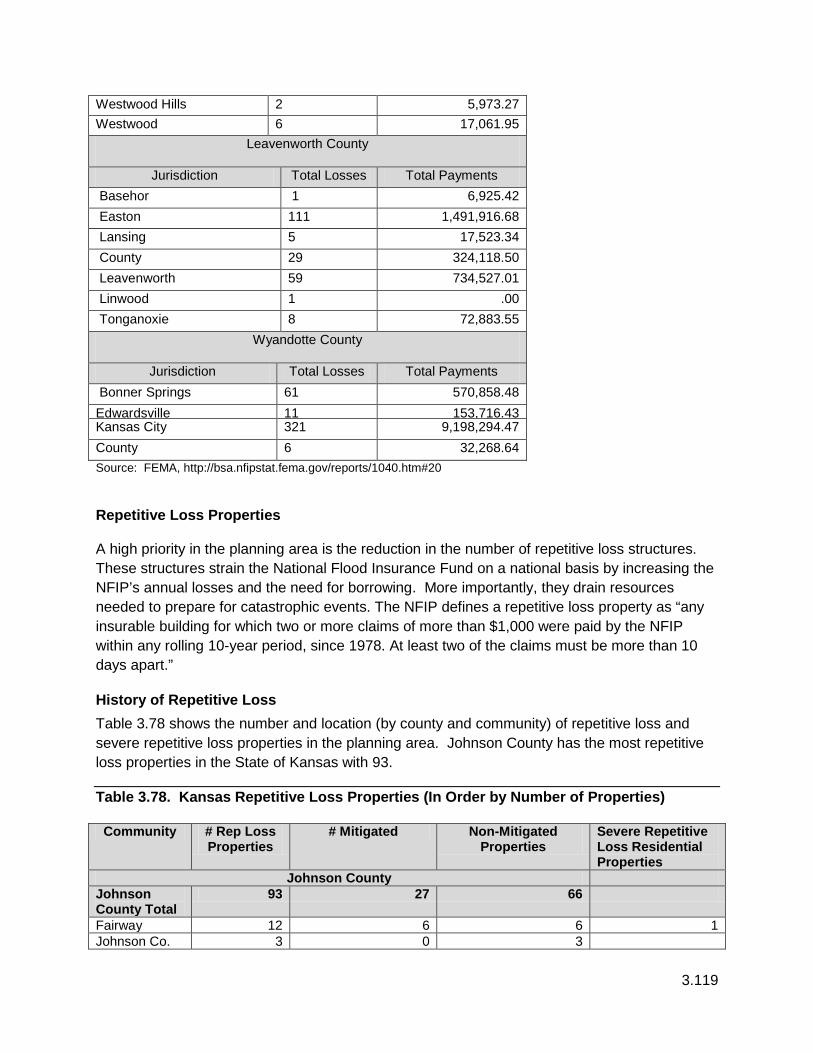
3.119
Westwood Hills 2 5,973.27 Westwood 6 17,061.95
Leavenworth County
Jurisdiction Total Losses Total Payments Basehor 1 6,925.42 Easton 111 1,491,916.68 Lansing 5 17,523.34 County 29 324,118.50 Leavenworth 59 734,527.01 Linwood 1 .00 Tonganoxie 8 72,883.55
Wyandotte County
Jurisdiction Total Losses Total Payments Bonner Springs 61 570,858.48 Edwardsville 11 153,716.43 Kansas City 321 9,198,294.47 County 6 32,268.64 Source: FEMA, http://bsa.nfipstat.fema.gov/reports/1040.htm#20
Repetitive Loss Properties A high priority in the planning area is the reduction in the number of repetitive loss structures. These structures strain the National Flood Insurance Fund on a national basis by increasing the NFIP’s annual losses and the need for borrowing. More importantly, they drain resources needed to prepare for catastrophic events. The NFIP defines a repetitive loss property as “any insurable building for which two or more claims of more than $1,000 were paid by the NFIP within any rolling 10-year period, since 1978. At least two of the claims must be more than 10 days apart.”
History of Repetitive Loss Table 3.78 shows the number and location (by county and community) of repetitive loss and severe repetitive loss properties in the planning area. Johnson County has the most repetitive loss properties in the State of Kansas with 93.
Table 3.78. Kansas Repetitive Loss Properties (In Order by Number of Properties)
Community # Rep Loss Properties
# Mitigated Non-Mitigated Properties
Severe Repetitive Loss Residential Properties
Johnson County Johnson County Total
93 27 66
Fairway 12 6 6 1 Johnson Co. 3 0 3

3.120
Leawood 6 1 5 Lenexa 3 2 1 Merriam 16 9 7 Mission Hills 8 0 8 2 Mission 6 3 3 Olathe 1 1 0 Overland Park 22 5 17 Prairie Village 13 0 13 Roeland Park 1 0 1 Westwood 1 0 1 Shawnee 4 3 1
Wyandotte County Wyandotte County Total
46 8 41
Edwardsville 2 0 2 Kansas City 36 5 31 Bonnie Springs
8 0 8
Leavenworth County
Leavenworth County Total
25 14 10
Easton 16 12 4 Leavenworth Co.
3 2 1
Leavenworth City of
5 0 5
Tonganoxie 1 1 0 Source: KS State Hazard Mitigation Program
Severe Repetitive Loss
The Flood Insurance Reform Act of 2004 identified another category of repetitive loss, categorized as Severe Repetitive Loss (SRL). SRL properties are defined it as “a single family property (consisting of one-to-four residences) that is covered under flood insurance by the NFIP and has incurred flood-related damage for which four or more separate claims payments have been paid under flood insurance coverage with the amount of each claim payment exceeding $5,000 and with cumulative amounts of such claims payments exceeding $20,000; or for which at least two separate claims payments have been made with the cumulative amount of such claims exceeding the reported value of the property. As of October 1, 2012, there are 3 validated insured residential properties in the planning area that meet the qualifications of SRL and the requirements to be considered for possible mitigation activities under FEMA’s SRL criteria. Table 3.79 provides additional information on losses associated with these 3 properties.

3.121
Table 3.79. Verified Residential Insured Severe Repetitive Loss Properties
Name Community Name Total Paid Losses SRL Status
Mitigation Planning Region L Johnson Fairway, City Of $74,824 5 V
Johnson Mission Hills, City Of $307,482 4 V
Johnson Mission Hills, City Of $343,821 4 V Source: Flood Insurance Administration as of Oct 2, 2012. V – validated.
History of Severe Repetitive Loss In addition to the verified residential, insured properties above, the NFIP tracks other categories of properties, including unverified properties, commercial properties, previously mitigated properties, and currently uninsured properties that meet the loss criteria.
The following table shows the communities with the repetitive loss properties.
Table 3.80. Kansas Severe Repetitive Loss Claims
County Community Name Total Paid Losses SRL Status
Mitigation Planning Region L Johnson Fairway, City Of $74,824 5 V* Johnson Johnson County $125,677 5 VU Johnson Merriam, City Of $171,306 8 VU Johnson Mission Hills, City Of $307,482 4 V* Johnson Mission Hills, City Of $343,821 4 V* Johnson Roeland Park, City Of $97,503 15 VU Johnson Shawnee, City Of $177,471 5 PN Leavenworth Easton, City Of $77,843 2 MV Wyandotte Kansas City, City Of $121,269 4 VNU Wyandotte Kansas City, City Of $98,585 4 PNU Wyandotte Kansas City, City Of $514,926 8 VN Wyandotte Kansas City, City Of $147,317 4 VNU Wyandotte Kansas City, City Of $599,430 10 PNU Wyandotte Kansas City, City Of $1,288,116 8 PN Wyandotte Kansas City, City Of $324,730 16 PN Wyandotte Kansas City, City Of $829,891 7 PN Wyandotte Kansas City, City Of $213,479 5 VNU Wyandotte Kansas City, City Of $44,288 7 VU Total
$5,557,959 121
Source: Flood Insurance Administration (current as of October 2, 2012): MV-Mitigated Validated, MVU-Mitigated Validated Uninsured, V- Validated, VU-Validated Uninsured, VN-Validated Non Residential, VNU-Validated Nonresidential Uninsured, P-Pending, PU-Pending Uninsured, PN-Pending Non Residential PNU- Pending Nonresidential Uninsured

3.122
Mitigation of Severe Repetitive Loss
Of the 18 SRL properties in the planning area, only one has been mitigated The property located in Easton, Leavenworth County, was mitigated through ICC (Increased Cost of Compliance).
Mitigation of Repetitive Loss Properties Region L has flooding as a known hazard, and has adopted the State of Kansas policy of mitigating repetitive loss properties as a priority use of mitigation funds. Of the 164 properties that meet the definition of repetitive loss in the planning area, 49 have been mitigated, leaving just 117 unmitigated repetitive loss properties. A summary is provided below of the mitigation methods utilized for the 49 mitigated properties.
• The majority of the properties that received mitigation funds were a part of the acquisition/demolition program
• Merriam, in Johnson County, provided their own funds to mitigate for repetitive properties through acquisition/demolition.
Community Rating System For communities that participate in the NFIP, any development in the floodplain should be built according to its corresponding floodplain management ordinance. According to the State’s minimum standards, the first floor elevations of residential property must be a minimum of one foot above the base flood elevation. For non-residential properties, the standard is to either elevate or flood proof to one foot above the base flood elevation. Additionally, the communities listed in Table 3.81 are part of the NFIPs Community Rating System (CRS) and are taking steps above and beyond the minimum requirements to qualify for reductions in flood insurance premiums. Additionally, the floodplain management practices for CRS communities are reviewed on a periodic cycle, typically every five years.
Table 3.81. Kansas Communities in the NFIP’s Community Rating System (CRS)
Mitigation Planning Region Community County
CRS Entry Date
Current class
% Discount for SFHA
% Discount for Non-SFHA
L Lansing, City of Leavenworth 5/1/2011 8 10 5 L Kansas City Wyandotte 5/1/2013 7 20 10 L Lenexa, City of Johnson 10/1/2011 8 10 5 L Olathe, City of Johnson 10/1/1993 8 10 5 L Overland Park, City of Johnson 10/1/2009 8 10 5 L Shawnee, City of Johnson 10/1/1991 8 10 5
Source: State Hazard Mitigation Plan 2013 There are many different ways to earn CRS points in order to move up the coveted levels and reduce NFIP payment amounts. Following are a few of them: organize to prepare the plan; involve the Public; coordinate; assess the hazard; assess the problem; set goals; review possible activities; draft an action plan; adopt the plan; implement, evaluate, and revise. For a
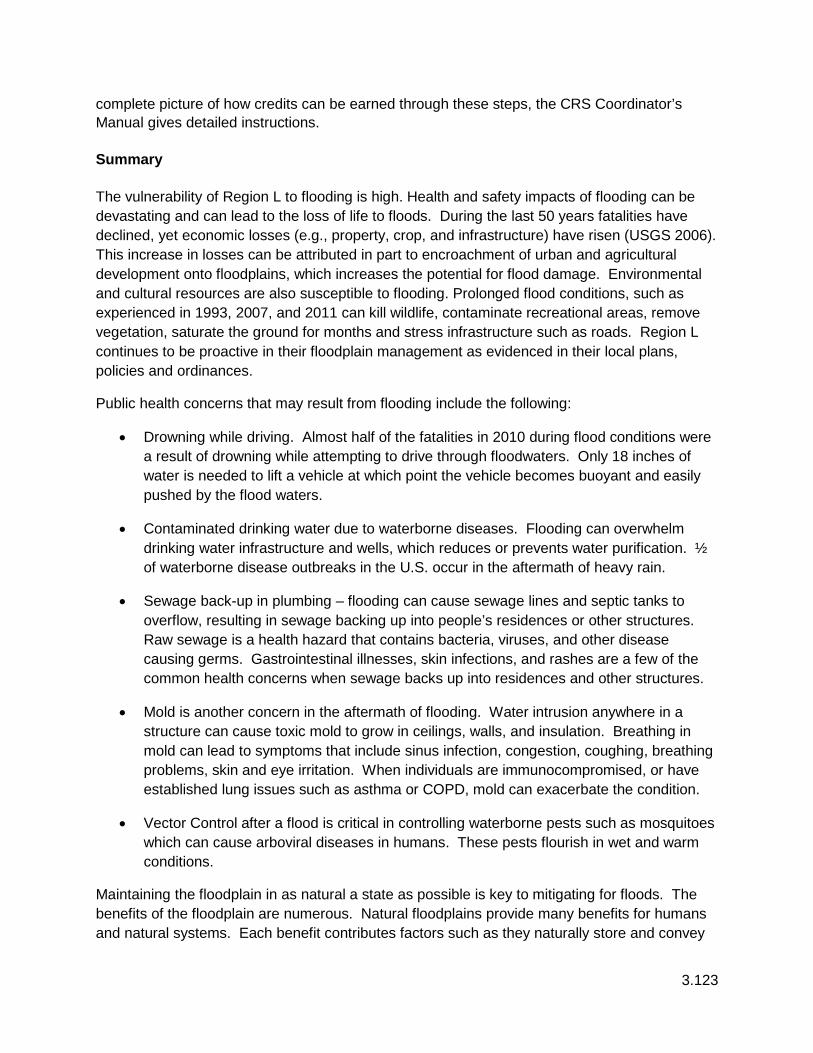
3.123
complete picture of how credits can be earned through these steps, the CRS Coordinator’s Manual gives detailed instructions. Summary The vulnerability of Region L to flooding is high. Health and safety impacts of flooding can be devastating and can lead to the loss of life to floods. During the last 50 years fatalities have declined, yet economic losses (e.g., property, crop, and infrastructure) have risen (USGS 2006). This increase in losses can be attributed in part to encroachment of urban and agricultural development onto floodplains, which increases the potential for flood damage. Environmental and cultural resources are also susceptible to flooding. Prolonged flood conditions, such as experienced in 1993, 2007, and 2011 can kill wildlife, contaminate recreational areas, remove vegetation, saturate the ground for months and stress infrastructure such as roads. Region L continues to be proactive in their floodplain management as evidenced in their local plans, policies and ordinances.
Public health concerns that may result from flooding include the following:
• Drowning while driving. Almost half of the fatalities in 2010 during flood conditions were a result of drowning while attempting to drive through floodwaters. Only 18 inches of water is needed to lift a vehicle at which point the vehicle becomes buoyant and easily pushed by the flood waters.
• Contaminated drinking water due to waterborne diseases. Flooding can overwhelm drinking water infrastructure and wells, which reduces or prevents water purification. ½ of waterborne disease outbreaks in the U.S. occur in the aftermath of heavy rain.
• Sewage back-up in plumbing – flooding can cause sewage lines and septic tanks to overflow, resulting in sewage backing up into people’s residences or other structures. Raw sewage is a health hazard that contains bacteria, viruses, and other disease causing germs. Gastrointestinal illnesses, skin infections, and rashes are a few of the common health concerns when sewage backs up into residences and other structures.
• Mold is another concern in the aftermath of flooding. Water intrusion anywhere in a structure can cause toxic mold to grow in ceilings, walls, and insulation. Breathing in mold can lead to symptoms that include sinus infection, congestion, coughing, breathing problems, skin and eye irritation. When individuals are immunocompromised, or have established lung issues such as asthma or COPD, mold can exacerbate the condition.
• Vector Control after a flood is critical in controlling waterborne pests such as mosquitoes which can cause arboviral diseases in humans. These pests flourish in wet and warm conditions.
Maintaining the floodplain in as natural a state as possible is key to mitigating for floods. The benefits of the floodplain are numerous. Natural floodplains provide many benefits for humans and natural systems. Each benefit contributes factors such as they naturally store and convey

3.124
floodwaters, maintain water quality, recharge groundwater and naturally regulate flows into rivers and lakes. They support large and diverse populations of plants and animals, and provide historical, scientific, recreational, and economical benefits to communities. Wyandotte County Lake is a great example in Region L of a floodplain that contributes natural habitat for plants and animals as well as recreational use for the community. This is a country lake located at the northwest edge of Kansas City, Kansas. The 1,500 acres are positioned in a setting of hillside oak-hickory woodlands and lakeside sycamores. The 456 acre lake with marina was constructed in the 1930’s by the Works Progress Administration.
Local Mitigation Concerns
• Flooding concerns for the planning area are not solely affected by the weather in Kansas. As seen during the 2011 Missouri River Floods, events up stream can have significant impacts on downstream communities. Montana had an unprecedented snowfall and precipitation amount during the winter of 2010-2011, which caused flooding in Region L. Levee breaches and over topping occurred frequently during this event, affecting Leavenworth and Wyandotte Counties.
• Flooding is a hazard that can also contribute to soil erosion, landslides and land subsidence. The impacts to transportation nodes, bridges, and industry along the rivers are also at risk during flooding events, which can affect lives and property.
• Flooding concerns along Stranger Creek running North to South through the central part
of Leavenworth county which affects the cities of Eason and Linwood. Economic development in this area is hampered due to flooding concerns.
• Significant flood and erosion issues are present along Indian Creek in Olathe.
• An issue in Johnson County is the upstream development impact on downstream
flooding. Historically, development does not account for downstream impact which creates flooding issues where before there were none.
• Flooding can contribute to contaminated waters, especially standing water that can cause public health concerns of infectious disease and bacterial illness. Cleanup of these waters will require diligence also so that the responders are not infected.
• Flooding issues on the Kansas River, in and around the DeSoto Bottoms can contaminate water wells that feed the Olathe Water production Center.
Development in the Hazard Area Region L is the mostly densely populated area in Kansas, and is also the fastest growing. With that growth comes the need for more housing, businesses, health facilities, etc. Floodplain management practices must continue to be a priority to ensure that development is not

3.125
occurring in areas at risk to flooding. All of the counties in Region L participate in the NFIP, so any development in the floodplain should be built according to its corresponding floodplain management ordinance. Additionally, the jurisdictions that participate in the NFIP and the Community Rating System (CRS) periodically review their floodplain management programs. The Department of Agriculture, Division of Water Resources also conducts Community Assistance Contacts (CAC) which offer assistance to the participating communities and assess the floodplain program. Community Assistance Visits (CAV), which is similar to full audits, are also conducted by the Division of Water Resources in order to ensure communities are in compliance with the floodplain management program. In the jurisdictions Land Use and Policy, Floodplain Management Ordinance, and Comprehensive Plans, maintaining the integrity of the floodplain is front and center. All the jurisdictions are committed to mitigating for the flood hazard by keeping the floodplain areas devoid of development. In cases where existing development exist they have identified actions in Chapter 4 to educating the public, and when funds are available, providing acquisition/demolition projects in order to prevent further damage to property. By the very nature of its topographical/geographical make-up, Region L has a known flooding risk that they take seriously and actively mitigate for. Table 3.82. Johnson County CPRI: Flood
Hazard Type Probability Magnitude Warning
Time Duration CPRI Planning
Significance
Johnson County Flood 4 3 3 4 3.55 High Table 3.83. Leavenworth County CPRI: Flood
Hazard Type Probability Magnitude Warning
Time Duration CPRI Planning
Significance
Leavenworth County Flood 4 3 3 4 3.55 High Table 3.84. Wyandotte County CPRI: Flood
Hazard Type Probability Magnitude Warning
Time Duration CPRI Planning
Significance
Wyandotte County Flood 4 3 3 4 3.55 High

3.126
Figure 3.26. Planning Region L Hazus One Percent Annual Chance Floodplains

3.127
Figure 3.27, 3.28, and 3.29 show the DFIRM maps for Johnson, Leavenworth, and Wyandotte counties. Figure 3.27. Johnson County DFIRM
Note: 0 .2 % = up to the 500 year flood A = Area subject to inundation by a 100-year flood.
AE = Areas subject to inundation by a 100-year flood as determined by detailed methods. Base Flood elevations are shown within these zones.

3.128
Figure 3.28. Leavenworth County DFIRM
Note: 0 .2 % = up to the 500 year flood A = Area subject to inundation by a 100-year flood.
AE = Areas subject to inundation by a 100-year flood as determined by detailed methods. Base Flood elevations are shown within these zones.

3.129
Figure 3.29. Wyandotte County DFIRM
Note: 0 .2 % = up to the 500 year flood A = Area subject to inundation by a 100-year flood.
AE = Areas subject to inundation by a 100-year flood as determined by detailed methods. Base Flood elevations are shown within these zones.
The following maps depict the special flood hazard areas for jurisdictions within the planning area.
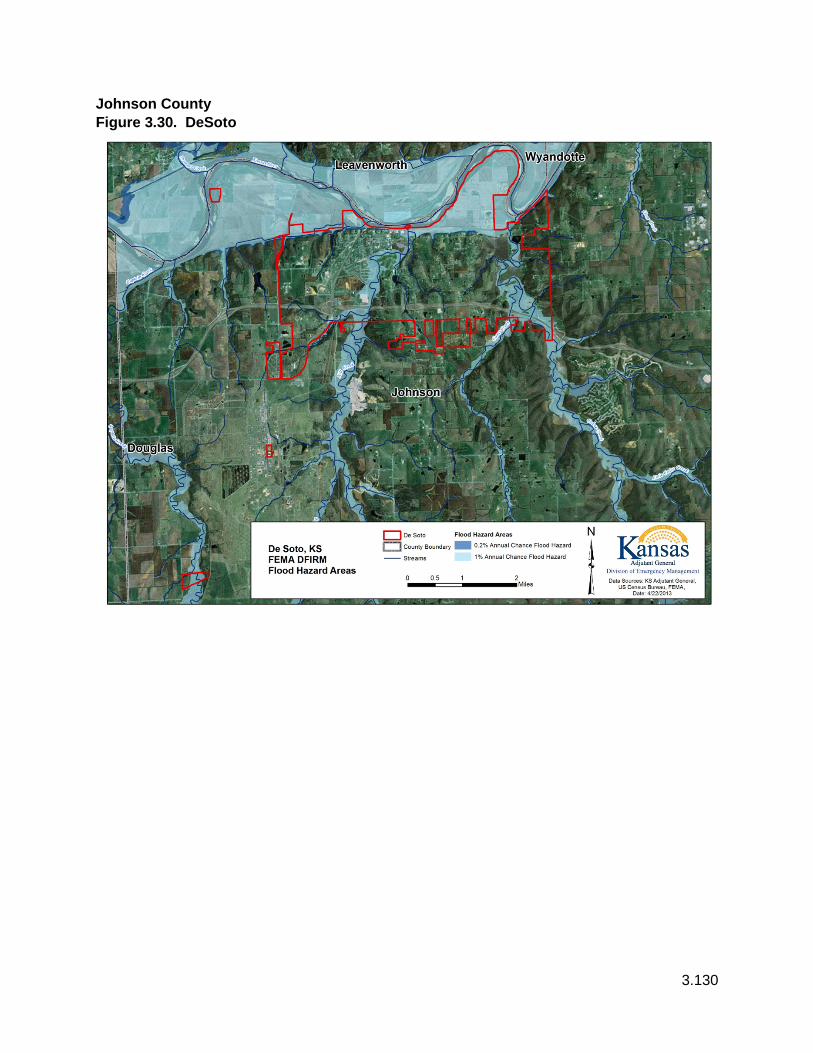
3.130
Johnson County Figure 3.30. DeSoto
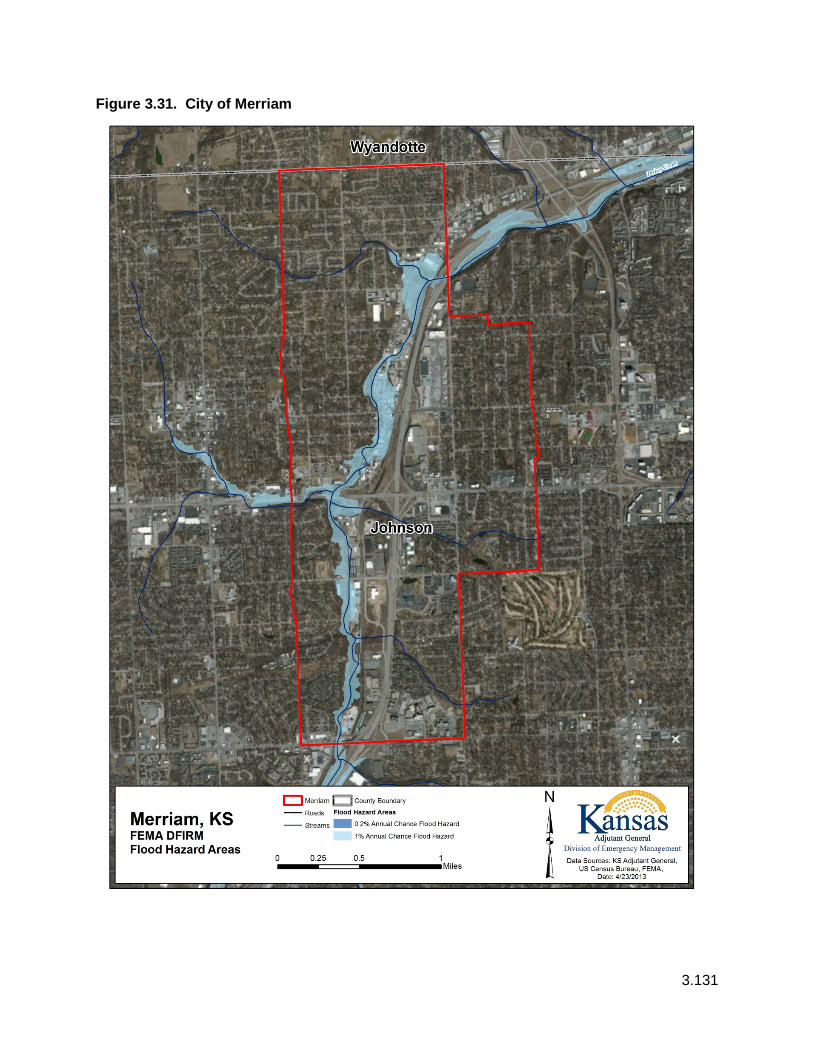
3.131
Figure 3.31. City of Merriam

3.132
Figure 3.32. Cities of Mission, Mission Hills and Merriam
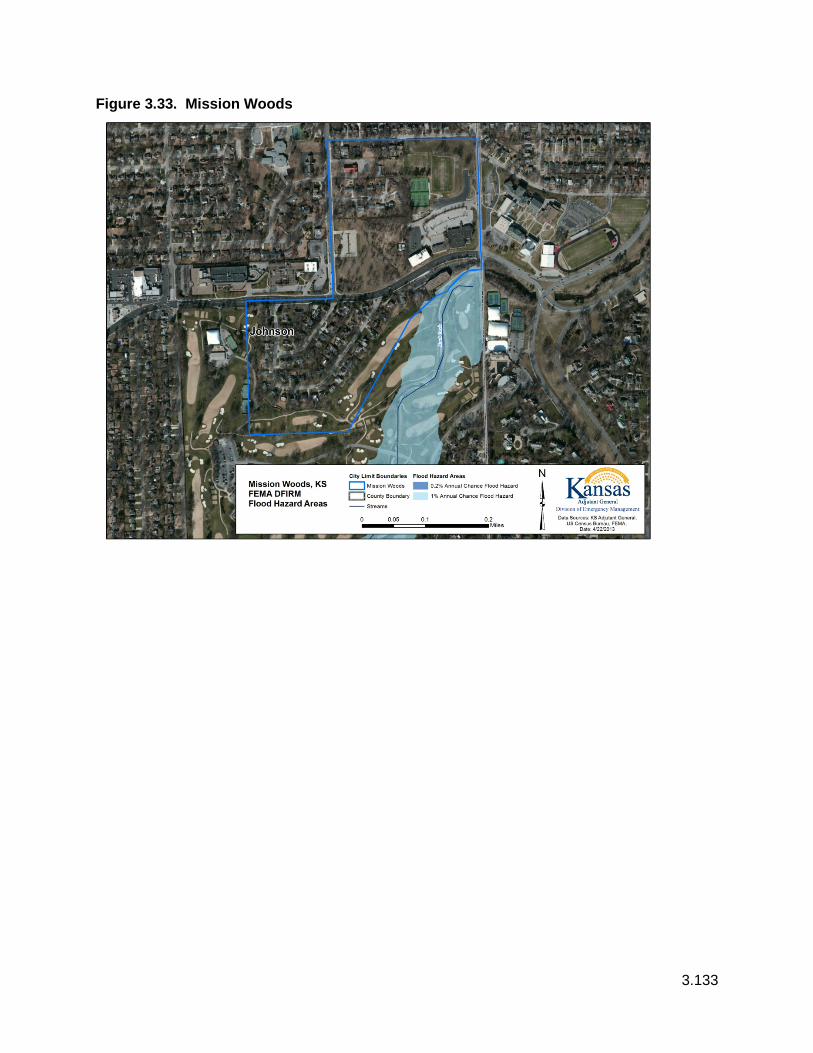
3.133
Figure 3.33. Mission Woods

3.134
Figure 3.34. City of Olathe

3.135
Figure 3.35. City of Overland Park

3.136
Figure 3.36. City of Prairie Village

3.137
Figure 3.37. City of Shawnee

3.138
Figure 3.38. City of Westwood and Westwood Hills

3.139
Figure 3.39. USD230

3.140
Figure 3.40. USD231

3.141
Figure 3.41. USD229

3.142
Figure 3.42. Johnson County Community College

3.143
Figure 3.43. University of Kansas, Edwards Campus
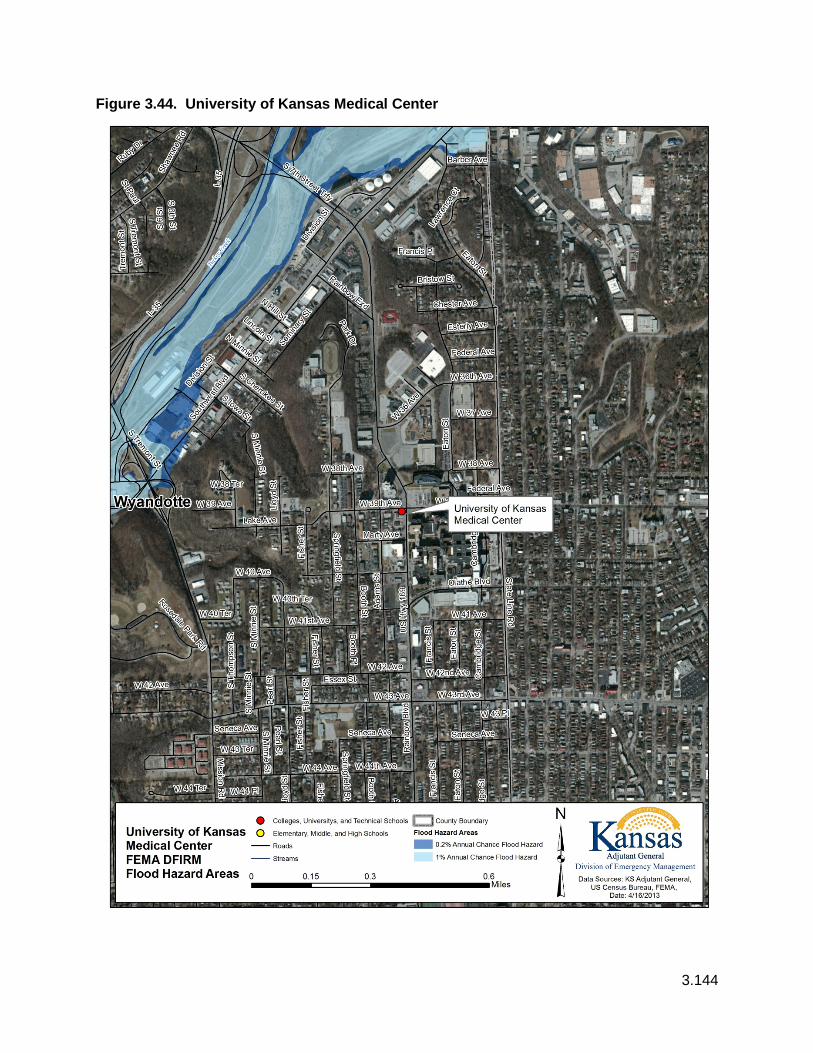
3.144
Figure 3.44. University of Kansas Medical Center

3.145
Leavenworth County: Figure 3.45. City of Basehor

3.146
Figure 3.46. City of Easton

3.147
Figure 3.47. City of Lansing

3.148
Figure 3.48. City of Leavenworth

3.149
Figure 3.49. City of Tonganoxie

3.150
Figure 3.50. USD207 & USD453

3.151
Figure 3.51. University of Saint Mary

3.152
Figure 3.52. USD458

3.153
Figure 3.53. USD449

3.154
Figure 3.54. USD469

3.155
Figure 3.55. USD453
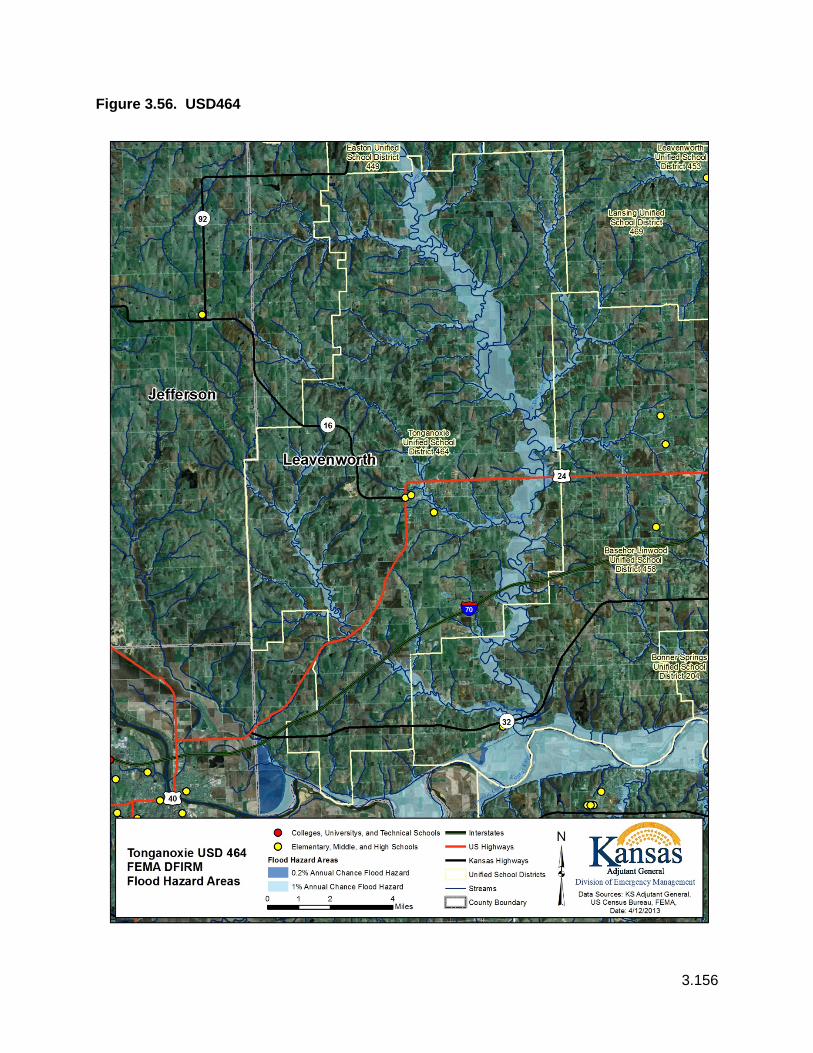
3.156
Figure 3.56. USD464

3.157
Figure 3.57. University of Saint Mary

3.158
Wyandotte County Figure 3.58. City of Kansas City, KS

3.159
Figure 3.59. USD202

3.160
Figure 3.60. USD203
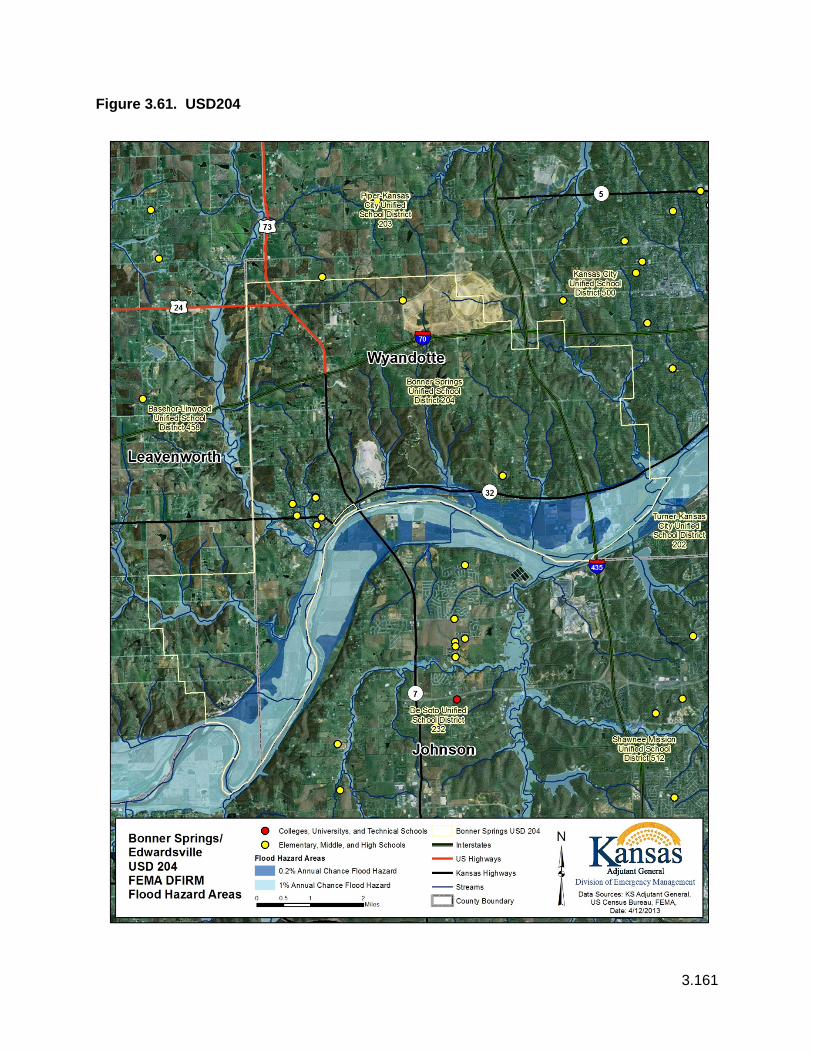
3.161
Figure 3.61. USD204

3.162
Figure 3.62. USD500

3.163
Figure 3.63. Kansas City Kansas Community College

3.164
Figure 3.64. Kansas State School for the Blind

3.165
Figure 3.65 RL Properties – Wyandotte County

3.166
Consequence (Impact) Analysis The information in Table 3.85 provides the Consequence Analysis of Potential for Detrimental Impacts of Hazards done for accreditation with the Emergency Management Accreditation Program (EMAP).
Table 3.85. EMAP Consequence Analysis: Flood
Subject Ranking Impacts/Flood
Health and Safety of Persons in the Area of the Incident
Severe Impact of the immediate area could be severe depending on the level of flood waters. Individuals further away from the incident area are at a lower risk of being affected. Casualties are dependent on warning time.
Responders Minimal Impact to responders is expected to be minimal unless responders live within the affected area.
Continuity of Operations Minimal to Severe Temporary relocation may be necessary if inundation affects government facilities (minimal to severe).
Property, Facilities, and Infrastructure
Severe Localized impact could be severe in the inundation area of the incident to facilities and infrastructure. The further away from the incident area the damage lessens to minimal to moderate.
Delivery of Services Minimal to Severe Delivery of services could be affected if there is any disruption to the roads and/or utilities due to the flood waters (minimal to severe).
Environment Severe Impact will be severe for the immediate impacted area. Impact will lessen as distance increases from the immediate incident area.
Economic Conditions Minimal to Severe Impacts to the economy will greatly depend on the area flooded, depth of water, and the amount of time it takes for the water to recede (minimal to severe).
Public Confidence in Jurisdiction’s Governance
Minimal to Severe Depending on the perception of whether the flood could have been prevented, warning time, and the time it takes for response and recovery will greatly impact the public’s confidence (minimal to severe).

3.167
3.2.10 Hailstorm Calculated Priority Risk Index Planning Significance
2.50 Moderate Description Hail is precipitation that is formed when updrafts in thunderstorms carry raindrops upward into extremely cold areas of the atmosphere causing them to freeze. The raindrops form into small frozen droplets and then continue to grow as they come into contact with super-cooled water which will freeze on contact with the frozen rain droplet. This frozen rain droplet can continue to grow and form hail. As long as the updraft forces can support or suspend the weight of the hailstone, hail can continue to grow. When the updraft can no longer support the hailstone, it will fall down to the earth. For example, a ¼” diameter or pea sized hail requires updrafts of 24 mph, while a 2 ¾” diameter or baseball sized hail requires an updraft of 81 mph.
Hailstorms can cause damage to property, crops and the environment and kill and injure livestock. Because of the agricultural footprint in the planning area, crop damage and livestock losses due to hail are of concern. Even relatively small hail can shred plants to ribbons in a matter of minutes. Vehicles, roofs of buildings and homes, and landscaping are other concerns most commonly damaged by hail. Hail has been known to cause injury to humans, occasionally fatal injury.
Based on information provided by the Tornado and Storm Research Organization, Table 3.86 below describes typical damage impacts of the various sizes of hail.
Table 3.86. Tornado and Storm Research Organization Hailstorm Intensity Scale
Intensity Category
Diameter (mm)
Diameter (inches) Size Description Typical Damage Impacts
Hard Hail 5-9 0.2-0.4 Pea No damage Potentially Damaging 10-15 0.4-0.6 Mothball Slight general damage to plants, crops Significant 16-20 0.6-0.8 Marble, grape Significant damage to fruit, crops, vegetation
Severe 21-30 0.8-1.2 Walnut
Severe damage to fruit and crops, damage to glass and plastic structures, paint and wood scored
Severe 31-40 1.2-1.6 Pigeon's egg > squash ball
Widespread glass damage, vehicle bodywork damage
Destructive 41-50 1.6-2.0 Golf ball > Pullet's egg
Wholesale destruction of glass, damage to tiled roofs, significant risk of injuries
Destructive 51-60 2.0-2.4 Hen's egg Bodywork of grounded aircraft dented, brick walls pitted
Destructive 61-75 2.4-3.0 Tennis ball > cricket ball Severe roof damage, risk of serious injuries
Destructive 76-90 3.0-3.5 Large orange > Soft ball Severe damage to aircraft bodywork
Super Hailstorms 91-100 3.6-3.9 Grapefruit
Extensive structural damage. Risk of severe or even fatal injuries to persons caught in the open
Super Hailstorms >100 4.0+ Melon
Extensive structural damage. Risk of severe or even fatal injuries to persons caught in the open

3.168
Location
Hail can happen anywhere within Region L. The planning area consists of agricultural and urban landscapes, each being vulnerable in their own way. The agricultural areas of the planning area are vulnerable in terms of crops and livestock, directly affecting farmer’s economic outlook. The urban areas are vulnerable in terms of people, infrastructure, and buildings.
Between the years 2000 and 2012, the hail events in Region L have been considerable. The following table shows the events by county for the period 2000-2012.
Table 3.87. Hail Events by County in Region L
County Event (#) Johnson 247 Leavenworth 188 Wyandotte 63 Total 498 Source: National Climatic Database
Previous Occurrences
Due to the large number of hail events in the planning area since the last plan updates, the following occurrences are a sample taken from the past few years that reflect the extent of hail occurrences in Region L.
• Jun 2009 - Severe thunderstorms produced several reports of large hail. This was during the evening hours of June 9, 2009, as a cold front pushed through the area. Several cities in the planning area reported up to 1.75 inch in diameter hail.
• April 2010 - Severe thunderstorms brought large hail and damaging winds to the area, during the morning hours of April 30, 2010 in Leavenworth and Wyandotte Counties. Hail was reported at some locations as 1.50 inches in diameter.
• Sep 2010 - A warm and unstable air mass was located over the region, during the afternoon and evening hours of September 18, 2010. A cold front moved southeast across the Leavenworth area in the afternoon and evening hours. There were numerous reports of hail up to 1.75 inches in diameter.
• Aug 2011 - The storms formed along a boundary of very warm temperatures in the Southern Plains, and cooler temperatures in the Mid-Missouri River valley. A developing cluster of storms over east central Kansas rapidly transitioned into a wind producing MCS, as it approached and crossed the Kansas City metro. However, ahead of this complex, a very strong storm dropped south out of Nebraska, and produced extreme hail up to the size of 4.5 inches in the cities of Easton and Leavenworth. This storm however decreased in intensity as it entered Kansas City, setting the stage for the strong wind producing MCS in east central Kansas to become the main threat. Measured wind

3.169
speeds between 60 and 80 mph, raced through extreme eastern Kansas, causing additional tree and power line damage leading to power outages.
• May 2012 - A cold front moved southeast across the area, during the afternoon through evening hours, of May 6, 2012. The front produced scattered thunderstorms, with a|few becoming severe. There were numerous reports in Johnson County of hail up to 1 inch, along with two reported tornadoes.
• Aug 2012 - A cold front brought severe thunderstorms to portions of extreme eastern Kansas, during the late afternoon and evening hours of August 8, 2012. Hail was reported as up to 1 inch in diameter
Extent
Hail is a common occurrence across the planning area, specifically in the spring and summer months. The severity of the incidence is tied to the size of the hail, and the location of the event. The planning committee has determined that the magnitude of this hazard is negligible. Injuries and/or injuries could be treated with first aid.
Probability of Future Events
According to the National Climatic Data Center Storm Events, there were 498 hail events in the planning area between the years 2000 and 2012 (12 years). Based on this information, the probability of at least one hail event in any given year in Region L is “Highly Likely”.
Impact and Vulnerability
Severe thunderstorms and associated hail events will continue to cause damage to anything and everything exposed to the weather elements. To determine potential financial loss estimates to hail in Region L, the available historical loss data was annualized. In the case of frequently occurring weather-related hazards such as hail, annualized historical loss data is considered to be the best resource for determining future potential losses. The planning team obtained loss data for the National Climatic Data Center (NCDC) storm events (2006 – 2012) and the USDA Risk Management Agency insured crop loss payments (2002 – 2011) since agriculture plays such as important role in the various sectors of Region Ls economy. According to this data, in the past 12 years there have been 498 hail events in the Region, with an average of 41.5 events per year. Because this data was based on each county’s data, one hail event could be included three times; one for each county. Loss estimates are difficult to provide because so much of it is private insurance and not available for this plan. However, Region L saw annualized property damages between 2006 and 2012 at $265,357, and crop insurance paid for the same time period at $6,633 for the planning area.
All 3 counties in the planning area are vulnerable to hailstorms. The statistical analysis method was used to refine and assess the relative vulnerability of each of these counties to hail. Ratings were assigned to pertinent factors that were examined at the county level. These factors are: social vulnerability index, prior events, prior annualized property damage, building exposure valuation, population density, crop exposure and annualized insured crop loss. Then a rating

3.170
value of 1-10 was assigned to the data obtained for each factor and then weighted equally and factored together to obtain overall vulnerability scores for comparison and to determine the most vulnerable counties.
The following are the data sources for the rating factors: Social Vulnerability Index for the counties from the Hazards and Vulnerability Research Institute at the University of South Carolina, National Climatic Data Center (NCDC) storm events (2006 – 2012), U.S. Census Bureau (2010), USDA’s Census of Agriculture (2007) and USDA Risk Management Agency (2002 – 2011). Please note that the data on crop losses only applies to insured crops. According to the 2011 Kansas Crop Insurance Profile Report issued by the USDA Risk Management Agency 82 percent of Kansas’ row crops were insured in 2011.
It was determined that since hail is a common occurrence in the region, that using historical events and property damages from 2006 forward provides adequate events to describe the hail hazard in Kansas.
Table 3.88 provides the data obtained for each of the factors by county. Table 3.89 that follows provides the ranges that were used to determine the resulting ratings.
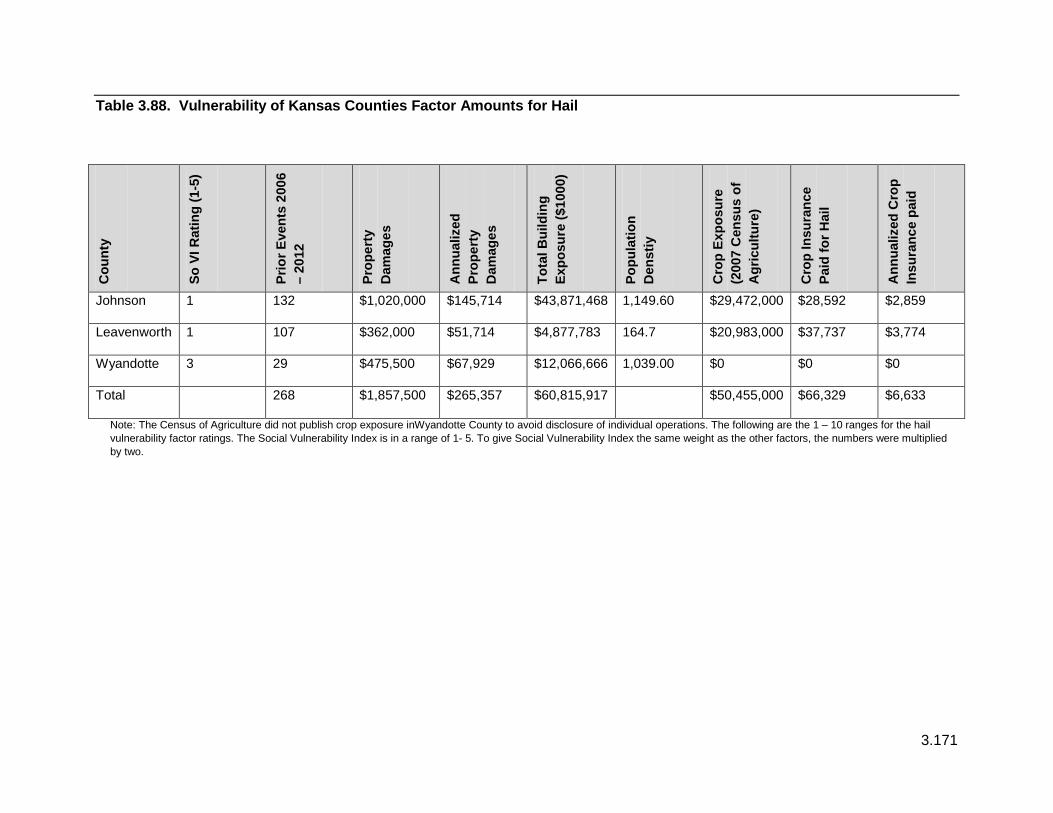
3.171
Table 3.88. Vulnerability of Kansas Counties Factor Amounts for Hail
Cou
nty
So V
I Rat
ing
(1-5
)
Prio
r Eve
nts
2006
–
2012
Prop
erty
D
amag
es
Ann
ualiz
ed
Prop
erty
D
amag
es
Tota
l Bui
ldin
g Ex
posu
re ($
1000
)
Popu
latio
n D
enst
iy
Cro
p Ex
posu
re
(200
7 C
ensu
s of
A
gric
ultu
re)
Cro
p In
sura
nce
Paid
for H
ail
Ann
ualiz
ed C
rop
Insu
ranc
e pa
id
Johnson 1 132 $1,020,000 $145,714 $43,871,468 1,149.60 $29,472,000 $28,592 $2,859
Leavenworth 1 107 $362,000 $51,714 $4,877,783 164.7 $20,983,000 $37,737 $3,774
Wyandotte 3 29 $475,500 $67,929 $12,066,666 1,039.00 $0 $0 $0
Total 268 $1,857,500 $265,357 $60,815,917 $50,455,000 $66,329 $6,633
Note: The Census of Agriculture did not publish crop exposure inWyandotte County to avoid disclosure of individual operations. The following are the 1 – 10 ranges for the hail vulnerability factor ratings. The Social Vulnerability Index is in a range of 1- 5. To give Social Vulnerability Index the same weight as the other factors, the numbers were multiplied by two.
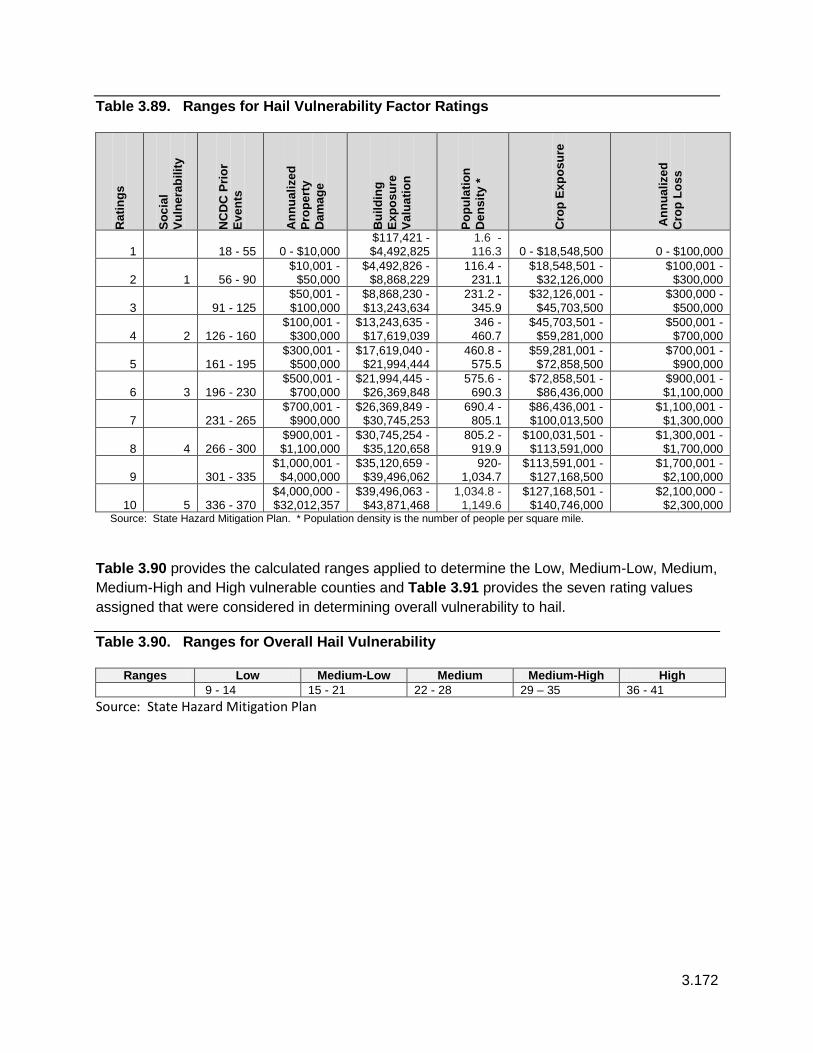
3.172
Table 3.89. Ranges for Hail Vulnerability Factor Ratings R
atin
gs
Soci
al
Vuln
erab
ility
NC
DC
Prio
r Ev
ents
Ann
ualiz
ed
Prop
erty
D
amag
e
Bui
ldin
g Ex
posu
re
Valu
atio
n
Popu
latio
n D
ensi
ty *
Cro
p Ex
posu
re
Ann
ualiz
ed
Cro
p Lo
ss
1 18 - 55 0 - $10,000 $117,421 - $4,492,825
1.6 - 116.3 0 - $18,548,500 0 - $100,000
2 1 56 - 90 $10,001 -
$50,000 $4,492,826 -
$8,868,229 116.4 -
231.1 $18,548,501 -
$32,126,000 $100,001 -
$300,000
3 91 - 125 $50,001 - $100,000
$8,868,230 - $13,243,634
231.2 - 345.9
$32,126,001 - $45,703,500
$300,000 - $500,000
4 2 126 - 160 $100,001 -
$300,000 $13,243,635 -
$17,619,039 346 - 460.7
$45,703,501 - $59,281,000
$500,001 - $700,000
5 161 - 195 $300,001 -
$500,000 $17,619,040 -
$21,994,444 460.8 -
575.5 $59,281,001 -
$72,858,500 $700,001 -
$900,000
6 3 196 - 230 $500,001 -
$700,000 $21,994,445 -
$26,369,848 575.6 -
690.3 $72,858,501 -
$86,436,000 $900,001 - $1,100,000
7 231 - 265 $700,001 -
$900,000 $26,369,849 -
$30,745,253 690.4 -
805.1 $86,436,001 - $100,013,500
$1,100,001 - $1,300,000
8 4 266 - 300 $900,001 - $1,100,000
$30,745,254 - $35,120,658
805.2 - 919.9
$100,031,501 - $113,591,000
$1,300,001 - $1,700,000
9 301 - 335 $1,000,001 -
$4,000,000 $35,120,659 -
$39,496,062 920-
1,034.7 $113,591,001 -
$127,168,500 $1,700,001 -
$2,100,000
10 5 336 - 370 $4,000,000 - $32,012,357
$39,496,063 - $43,871,468
1,034.8 - 1,149.6
$127,168,501 - $140,746,000
$2,100,000 - $2,300,000
Source: State Hazard Mitigation Plan. * Population density is the number of people per square mile.
Table 3.90 provides the calculated ranges applied to determine the Low, Medium-Low, Medium, Medium-High and High vulnerable counties and Table 3.91 provides the seven rating values assigned that were considered in determining overall vulnerability to hail.
Table 3.90. Ranges for Overall Hail Vulnerability
Ranges Low Medium-Low Medium Medium-High High 9 - 14 15 - 21 22 - 28 29 – 35 36 - 41
Source: State Hazard Mitigation Plan

3.173
Table 3.91. Vulnerability of Kansas Counties to Hail
Cou
nty
SoVi
Rat
ing
NC
DC
Prio
r Ev
ent R
atin
g
Ann
ualiz
ed
Prop
erty
Dam
age
Rat
ing
Bld
g Ex
posu
re
Valu
atio
n R
atin
g
Popu
latio
n D
ensi
ty R
atin
g
Cro
p Ex
posu
re
Rat
ing
Ann
ualiz
ed C
rop
Loss
Rat
ing
Ove
rall
Vuln
erab
ility
R
atin
g
Hai
l Vul
nera
bilit
y
Mitigation Planning Region L Johnson 2 4 4 10 10 2 1 33 Medium-High Leavenworth 2 3 3 2 2 2 1 15 Medium-Low Wyandotte 6 1 3 3 10 1 1 25 Medium Source: State Hazard Mitigation Plan 2013
Johnson County ranks 5th in the State of Kansas for vulnerability to Hail. Leavenworth and Wyandotte did not make the top 10, however this does not negate the risk of this hazard that they face as a normal occurrence.
Severe thunderstorms and the associated hail events will continue to cause damage to anything and everything exposed to the weather elements, including people, crops, livestock, and structures.
Summary
The entire planning area is susceptible to hail, to include agricultural land, livestock, people, and property. Mitigating for hail is difficult because there is no way to predict with 100% accuracy on when or where it will happen.
Local Mitigation Concerns
• According to the Census of Agriculture, the planning area has 327,163 acres that is used for agricultural purposes. It is this agricultural footprint that has the potential to have an economic impact from hail damages sustained during a hail event. All the counties within the Region are susceptible to this hazard, which is difficult to mitigate for when large areas of land are affected.
• Region L has the highest incidence of growth in the state of Kansas. While buildings and people are relatively safe from hail events, the potential is there for injuries or death related to this hazard, normally dependent on where an individual is when an event occurs and the intensity of the event itself. Driving the transportation nodes, or playing golf can be dangerous pastimes if an individual is caught unaware during an event with 4.5 inch diameter hail, as seen on the previous occurrence of August 2011 . Infrastructure and buildings can also see damage with large hail.
Development in Hazard Prone Areas
The increased level of new development is not as significant to hail damage as the agricultural losses. The economic result due to hail damage can reverberate throughout the local

3.174
communities. Counties in the planning area that have the most farmland acreage will bear a larger loss than the counties that are mainly industrialized and business leaning. In the more urbanized counties such as Johnson and Wyandotte the impact is no less severe, just different. Nurseries, residential landscaping, and inner city landscaping improvements can take a heavy toll due to hail.
Johnson County
Table 3.92. Johnson County CPRI: Hail
Hazard Type Probability Magnitude Warning
Time Duration CPRI Planning
Significance
Johnson County Hail 4 1 2 1 2.50 Moderate
Leavenworth County
Table 3.93. Leavenworth County CPRI: Hail
Hazard Type Probability Magnitude Warning
Time Duration CPRI Planning
Significance
Leavenworth County Hail 4 1 2 1 2.50 Moderate
Wyandotte County
Table 3.94. Wyandotte County CPRI: Hail
Hazard Type Probability Magnitude Warning
Time Duration CPRI Planning
Significance
Wyandotte County Hail 4 1 2 1 2.50 Moderate
Consequence (Impact) Analysis
The information in Table 3.95 provides the Consequence Analysis of Potential for Detrimental Impacts of Hazards done for accreditation with the Emergency Management Accreditation Program (EMAP).

3.175
Table 3.95. Consequence Analysis, Hail
Subject Ranking Impacts/Hailstorm
Health and Safety of Persons in the Area of the Incident Severe
Impact of the immediate area could be severe for affected areas and moderate to light for other less affected areas depending on whether individuals are caught outside during the event and size of hail.
Responders Minimal Impact to responders is expected to be non-existent to minimal.
Continuity of Operations
Minimal to Moderate
Temporary relocation may be necessary if government facilities experience damage (minimal to moderate).
Property, Facilities, and Infrastructure
Minimal to Severe
Localized impact could be severe to facilities and infrastructure in the incident area. Utility lines, roads, residential and business properties will be most affected.
Delivery of Services Minimal to Severe
Delivery of services could be affected if there is any disruption to the roads and/or utilities due to damages sustained (minimal to severe).
Environment Severe
Impact could be severe for the immediate impacted area, depending on the size of the event. Impact will lessen as distance increases from the immediate incident area.
Economic Conditions Minimal to Severe
Local economy and finances may be adversely affected, depending on damages sustained (minimal to severe).
Public Confidence in Jurisdiction’s Governance
Minimal to Moderate
Response and recovery will be in question if not timely and effective. Warning systems in place and the timeliness of those warnings could be questioned (minimal to moderate).

3.176
3.2.11. Hazardous Materials
Calculated Priority Risk Index Planning Significance 2.90 Moderate
Description Hazardous materials and waste are a concern for Region L because a sudden accidental or intentional release (see Section 3.3.17 Terrorism/Agri-terrorism) of such materials can be dangerous to human health and safety, to property, and to the quality of the environment. Such releases may come from both fixed sources, such as a manufacturing or storage facility, or from a transportation source, such as a truck or pipeline. Accidental releases may be due to equipment failure, human error, or a natural or manmade hazard event.
Generally, with a fixed facility, the hazards are pre-identified, and the facility is required by law to prepare a risk management plan and provide a copy to the local emergency planning committee (LEPC) and local fire departments.
Agricultural facilities throughout the planning area are likely to have dangerous materials present that could pose a threat to surrounding populations in the event of an emergency or disaster. Facilities that store or use chemicals considered unusually dangerous to human safety are required by Section 112R of the Clear Air Act Amendments to assess the potential impacts of an accidental release of the chemical at their facility and to prepare risk management plans (RMP). Of particular interest to the Region and all of Kansas is that ammonia is one of the covered hazardous materials. Numerous Kansas ammonia storage and distribution facilities have filed an RMP with the U.S. Environmental Protection Agency (EPA). A database with information about Kansas facilities that have RMPs is available through the EPA at www.rtknet.org/rmp/KS.php .
Location
The primary agency responsible for hazardous materials within the State of Kansas is the Kansas Department of Health and Environment, Division of Environment http://www.kdheks.gov/environment/index.html . The Kansas Response Plan, Emergency Support Function #10 – Oil and Hazardous Materials is another resource for response information. (The Kansas Response Plan is not added as an appendix to this mitigation plan for security reasons.)
Hazardous materials pose a threat to communities in all areas of the Region. Localities where hazardous materials are fabricated processed and stored as well as those where hazardous waste is treated, stored and disposed of are most at risk for hazardous materials incidents. Additionally, localities along transportation corridors that carry these materials to their final destinations are at risk.
The planning committee considers the risk level from hazardous materials accidents to be moderate due to expanded development and industrialization of the Kansas City Metropolitan

3.177
area. Generally, it is the developed areas or environmental resources in the immediate vicinity of facilities or transportation routes that would be at risk.
Fixed Facility Locations
In 2011, there were 373 facilities housing hazardous chemicals in the planning area, identified by the Community Right to Know Act. The breakdown by counties can be seen in Table 3.96.
Table 3.96. Number of Facilities Housing Hazardous Chemicals by County, 2011.
County Number of Facilities Johnson 205 Leavenworth 29 Wyandotte 139 Total 373 Source: State Hazard Mitigation Plan
Table 3.97 shows the U.S. Environmental Protection Agency Superfund sites in Region L. A Superfund site is an uncontrolled or abandoned place where hazardous waste is located, which may affect local ecosystems and/or people. Two sites are currently on the Superfund National Priority list for the planning area. The proposed date and final date are the National Priority Listing history information.
Table 3.97. Superfund National Priorities List Sites in Kansas
National Priority Li t Sit
City County Proposed Date Final Date Chemical C
Olathe Johnson 1/18/1994 5/31/1994 Doepke Disposal ( )
Johnson 12/30/1982 9/8/1993 Source: U.S. Environmental Protection Agency, http://www.epa.gov/region7/cleanup/index.htm
Pipelines
According to the U.S. Department of Transportation, Pipeline & Hazardous Materials Safety Administration’s Pipeline Safety Stakeholder Communications, Region L’s gas transmission line and hazardous liquid line mileage are seen in Table 3.98. All mileages are for 2010 and are approximate as some data sources may not have contained a complete record of pipeline mileage.
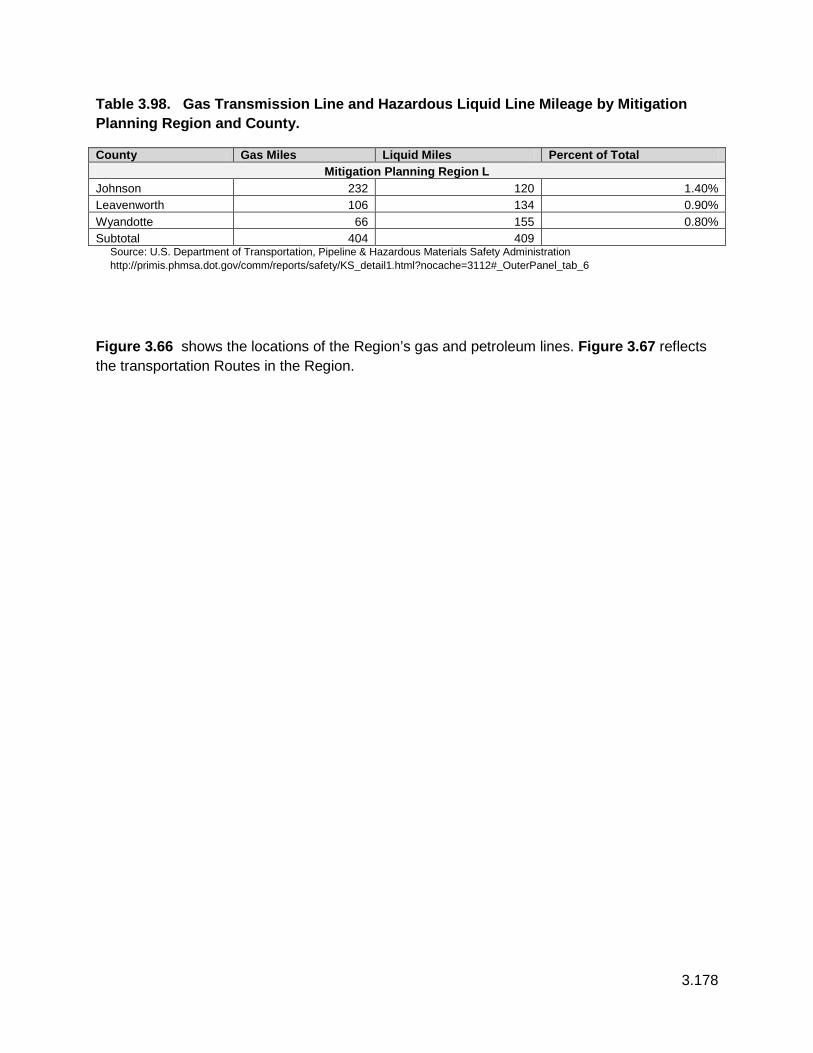
3.178
Table 3.98. Gas Transmission Line and Hazardous Liquid Line Mileage by Mitigation Planning Region and County.
County Gas Miles Liquid Miles Percent of Total Mitigation Planning Region L
Johnson 232 120 1.40% Leavenworth 106 134 0.90% Wyandotte 66 155 0.80% Subtotal 404 409
Source: U.S. Department of Transportation, Pipeline & Hazardous Materials Safety Administration http://primis.phmsa.dot.gov/comm/reports/safety/KS_detail1.html?nocache=3112#_OuterPanel_tab_6
Figure 3.66 shows the locations of the Region’s gas and petroleum lines. Figure 3.67 reflects the transportation Routes in the Region.

3.179
Figure 3.66 Region L’s Gas Transmission and Petroleum Lines
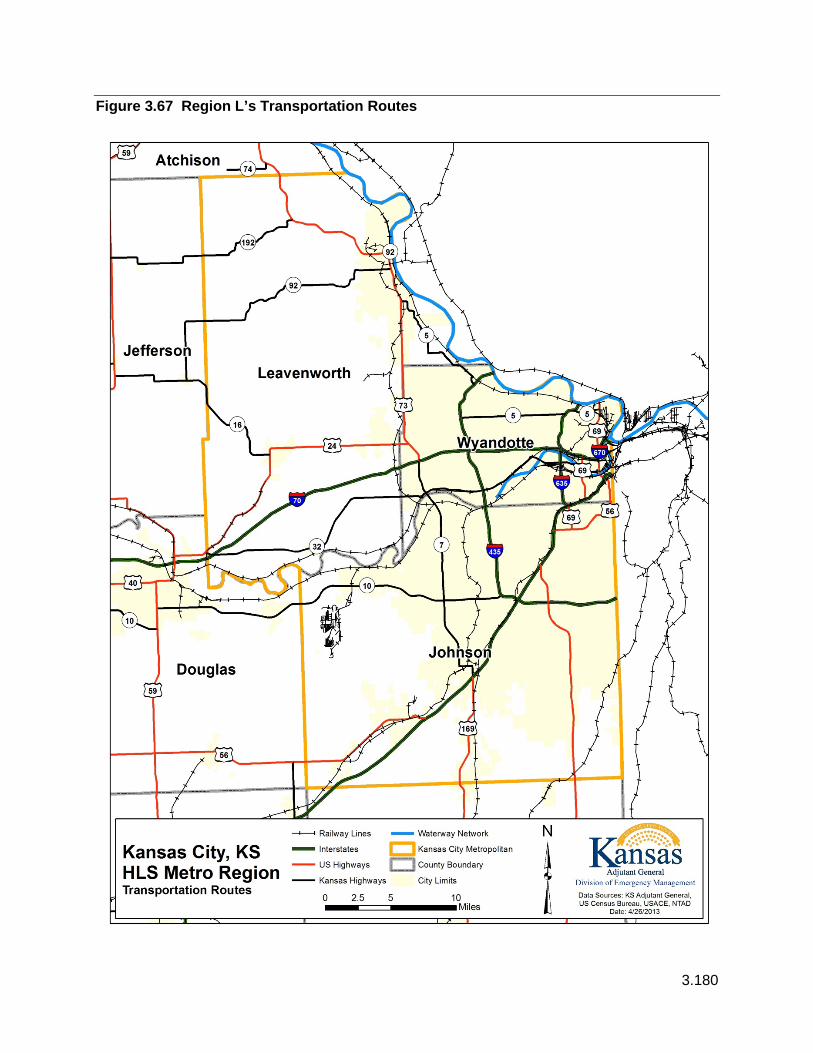
3.180
Figure 3.67 Region L’s Transportation Routes

3.181
Previous Occurrences
When viewed statewide, hazardous materials accidents are frequent events. Annualized statistics from the Kansas Division of Emergency Management, Technological Hazards Section in Table 3.99 indicates the number of Region L incidents at the primary locations of fixed facility, motor carrier, pipeline and rail during the 10-year period of 2003-2012. The largest number of incidents occurred at fixed facilities in Wyandotte County, and by motor carrier for Johnson and Leavenworth Counties during this timeframe.
The spiller is responsible to report to all the appropriate agencies depending on the material and volume spilled. To satisfy the requirement of Kansas Regulation K.A.R. 28-48 all spills that impact the soils or waters must be reported to the KDHE or in the case that it originates from an oil or gas production leases, be reported to the Kansas Corporation Commission.
If the release is not contained, or threatens the health or safety of the local population, the Local Emergency Planning Committee (LEPC) within the county of the release, must be notified first by dialing 911. Hazardous materials spills and air releases that meet federal reportable quantities and oil and petroleum spills over 110 gallons must also be reported to KDEM
Table 3.99. Primary Locations of Hazardous Materials Incidents, 2003-2012
Johnson County
Year Fixed
Facility Motor Carrier Pipeline Rail OTHER
2003 8 15 6 1 0
2004 3 7 0 0 2
2005 2 2 0 0 1
2006 3 0 0 0 0
2007 3 0 1 0 1
2008 1 2 0 0 2
2009 4 5 0 0 3
2010 5 5 0 1 0
2011 0 1 0 1 2
2012 0 6 1 0 2
Total 29 43 8 3 13 Source: Kansas Division of Emergency Management, Technological Hazards Section

3.182
Leavenworth County
Year Fixed
Facility Motor Carrier Pipeline Rail OTHER
2003 0 1 0 0 0
2004 0 1 0 0 0
2005 1 1 0 1 0
2006 1 0 0 0 0
2007 1 3 0 0 1
2008 1 7 1 0 1
2009 3 5 1 0 3
2010 2 5 1 0 2
2011 0 3 0 0 0
2012 0 4 0 0 0
Total 9 30 3 4 7 Source: Kansas Division of Emergency Management, Technological Hazards Section
Wyandotte County
Year Fixed
Facility Motor Carrier Pipeline Rail OTHER
2003 21 4 0 6 0
2004 9 3 2 11 3
2005 9 2 2 6 2
2006 15 1 0 7 2
2007 5 1 0 2 0
2008 6 1 0 3 0
2009 18 2 0 7 0
2010 11 2 0 8 4
2011 5 1 0 3 1
2012 8 2 1 8 4
Total 107 19 5 61 16 Source: Kansas Division of Emergency Management, Technological Hazards Section
Table 3.100 shows that the major cause of hazardous material incidents in Region L, broken out by County, was due to spills for incidents from 2003-2012. Note that the total number of causes may be greater than the total number of spills. Each release can have multiple causes.

3.183
Table 3.100. Causes of Hazardous Materials Incidents in Region L, by County., 2003-2012
Johnson County
Source: Kansas Division of Emergency Management, Technological Hazards Section
Leavenworth County
Source: Kansas Division of Emergency Management, Technological Hazards Section
Year Explosion Fire Spill
Equipment Failure
Operator Error Natural Dumping Other
2003 1 3 17 6 4 0 0 0
2004 0 0 3 7 2 0 0 1
2005 0 0 2 3 2 0 0 1
2006 0 0 2 2 0 0 0 1
2007 0 0 1 3 1 0 0 1
2008 0 1 4 0 1 0 0 1
2009 0 1 6 3 2 1 0 2
2010 0 0 7 4 1 0 0 4
2011 0 0 4 1 0 0 0 1
2012 0 1 6 2 1 0 0 1
Total 1 6 52 31 14 1 0 13
Year Explosion Fire Spill
Equipment Failure
Operator Error Natural Dumping Other
2003 0 0 1 1 0 0 0 0
2004 0 0 0 0 0 0 0 1
2005 0 1 2 1 1 0 1 0
2006 0 1 0 0 0 0 0 0
2007 0 0 2 1 2 0 0 2
2008 0 0 5 2 4 0 0 5
2009 0 1 3 2 3 0 4 1
2010 1 1 5 3 1 0 0 4
2011 0 0 0 0 0 0 0 3
2012 0 0 3 0 1 0 0 2
Total 1 4 21 10 12 0 5 18

3.184
Wyandotte County
Source: Kansas Division of Emergency Management, Technological Hazards Section
U.S. Department of Transportation’s Pipeline & Hazardous Materials Safety Administration Reports from the U.S. Department of Transportation’s Pipeline & Hazardous Materials Safety Administration’s provides detail and incident history for the pipeline systems in the planning area between 2001 and 2012. Significant incidents are those incidents reported by pipeline operators with any of the following conditions met: 1) fatality or injury requiring in-patient hospitalization; 2) $50,000 or more in total costs, measured in 1984 dollars; 3) highly volatile liquid releases of five barrels or more or other liquid releases of 50 barrels or more; 4) liquid releases resulting in an unintentional fire or explosion. According to these reports, there were 147 pipeline incidents that caused four fatalities, 24 injuries and $69.5 million in damages over the 12 year period (2001-2012). Table 3.101 gives the incident details by county for the Region
Table 3.101. Details of Kansas Pipeline Incidents by Mitigation Planning Region and County, 2001-2012
County Tota
l Nat
ural
G
as
Tran
smis
sion
In
cide
nts
Tota
l Nat
ural
G
as D
istr
ibut
ion
Inci
dent
s
Tota
l Haz
ardo
us
Liqu
id In
cide
nts
Tota
l Fat
aliti
es
Tota
l Inj
urie
s
Tota
l Dam
age
Gro
ss B
arre
ls
Lost
Tota
l Bar
rels
R
ecov
ered
Mitigation Planning Region L Johnson 3 1 1 0 0 $1,897,704 258 196 Leavenworth 1 0 0 0 1 $80,160 0 0 Wyandotte 2 0 7 1 3 $14,724,798 6,800 5,089 Total 6 1 8 1 4 $16,702,662 7,058 5,285
Source: U.S. Department of Transportation, Pipeline & Hazardous Materials Safety Administration, http://primis.phmsa.dot.gov/comm/reports/safety/IncDetSt_st_KS_flt_sig.html?nocache=999#_all
Year Explosion Fire Spill
Equipment Failure
Operator Error Natural Dumping Other
2003 0 0 15 12 1 2 0 2
2004 0 0 12 6 5 0 1 12
2005 0 1 3 9 3 0 0 5
2006 0 0 10 7 4 0 0 9
2007 0 0 2 5 0 0 0 1
2008 0 0 4 2 1 0 0 7
2009 0 0 8 15 0 1 0 10
2010 0 0 18 9 0 0 0 4
2011 0 0 7 4 0 0 0 1
2012 0 1 18 4 3 0 0 4
Total 0 2 97 73 17 3 1 55

3.185
Notes: The costs shown are in 2011 dollars. For years 2002 and later, property damage is estimated as the sum of all public and private costs reported in the 30-day incident report. For years prior to 2002, accident report forms did not include a breakdown of public and private costs so property damage for these years is reported total property damage field in the report.
Notable Hazardous Materials Incidents
• 15 Feb 2010 a fuel tanker spill near the 18th expressway & Kansas in Kansas City, Kansas. 800 gallong of gasoline flowed into the storm sewer in Wyandotte County.
• 16 Feb 2010 an oil lease spill of 4000 gallons of crude oil in a rural area threatening waterways in Leavenworth County.
• 15 Jul 2012 a fuel tanker truck wrecked in a ditch near I-435 and State Line, Overland Park. 2000 gallons of diesel fuel spilled causing road closures.
Extent The extent of a Hazardous Material incident would depend greatly on the type of Hazardous Material, the location, and the amount of material that is released. Due to the variables of this hazard, the planning committee has determined that this hazard would be negligible. The event would not result in injuries or illness that could not be treated by first aid. Probability The release of hazardous materials, whether through accidental spills, human error, or other etiology is not in and of itself uncommon in the planning area. Minor occurrences happen fairly frequently. Precautions, laws, regulations, and checklist are all utilized to avoid this hazard, however they continue to happen. During the last three full years, 2010 – 2012, there were 357 hazardous incidents in the planning area. This results in a 100% chance of this hazard occurring in any given year. The planning committee has assigned this hazard a probability of “Highly Likely.” Impact and Vulnerability Table 3.102 lists the number of hazardous materials incidents, injuries, fatalities and people evacuated from the public and facilities by county in the Region over the 10-year period of 2003-2012. There were a total of 357 incidents reported to KDEM
Table 3.102. Reported Number of Hazardous Materials incidents, Injuries, Fatalities and People Evacuated by County, 2003-2012
Incident County Incidents Injuries Fatalities People Evacuated Mitigation Planning Region L
Johnson 96 4 0 81 Leavenworth 53 49 3 152 Wyandotte 208 6 0 87 Total 357 59 3 320
Source: Kansas Division of Emergency Management, Technological Hazards Section

3.186
The impact of this type of disaster will likely be localized to the immediate area surrounding the incident. The initial concern will be for people and then the environment. If contamination occurs, the spiller is responsible for the cleanup actions and will work close with local responders, KDHE, KCC, KDEM, and EPA to ensure that cleanup is done safely and in accordance with federal and state laws.
As mentioned, it is difficult to determine the potential losses to existing development because of the variable nature of a hazardous materials spill. For example, a spill of a toxic airborne chemical in a populated area could have great potential for loss of life and by contrast, the spill of a very small amount of a chemical in a rural agricultural area would be much less costly and possible limited to remediation of soil.
For discussion purposes, the materials needed for a spill at a fixed facility at an easily remediated area are listed below in Table 3.103. The costs for the cleanup are estimated from the current State of Kansas Unified HazMat Response Program statewide contract # 35167.
Table 3.103 Potential Cost Estimate for HAZ-MAT Spill Remediation
Classification Rates Per Hour/Unit Number of Hours/Units Total Cost Project Manager $90.00 24 $2,160 Health & Safety Supervisor $86.00 24 $2,064 Environmental Tech $50.00 12 $600 Foreman $55.00 24 $1,320 Equipment Operator $56.50 24 $1,356 Laborer $45.00 24 $1,080 Truck, 4 wheel drive $680/wk 1 $680 Backhoe, Case 416B $320.00/day 2 $640 Forklift, 3 ton all terrain $160.00/day 2 $320 Skimmer $250.00/day 2 $500 Pump, 4” $80.00/day 3 $240 Drums, chemical, 17H or 17E $90.00 25 $2,250 Drums, 95 gallon $295.00 25 $7,375 Vermiculite per bag $15.00 6 $90 Acid Suits $70.00/each 6 $420 Gloves $4.00/pair 30 $120 Total $21,215
Source: State of Kansas Unified HazMat Response Program statewide contract # 35167.
According to the Kansas Division of Emergency Management, Technological Hazards Section there are 7 facilities subject to the Risk Management Plan requirements in the planning area as of December 2012. The top ranked facilities for Region L are listed in Table 3.104 and are ranked based on population affected according to the Risk Management Plan’s Worst Case Scenario. Statewide, Wyandotte has the 2nd most worst case scenario facilities, following Sedgwick County who is first with 7. Information concerning these facilities is limited in this plan because of security and liability issues.

3.187
Table 3.104. Top Ranked Worst Case Scenario Facilities in Kansas, 2012
Mitigation Planning Region County Type of Facility L Wyandotte Chemical Production and Processing L Wyandotte Specialty Gas L Wyandotte Water Treatment L Wyandotte Refrigerated Warehouse L Johnson Refrigerated Warehouse & Distribution L Johnson Food Manufacturing L Leavenworth Water Treatment
Source: State Hazard Mitigation Plan
Special populations are particularly vulnerable because of the inherent potential difficulties involved in the evacuation should the necessity arise. Table 3.105 shows the number of special population facilities in each county that is located within ½ mile of a chemical facility. Table 3.105. Number of Special Population Facilities Within ½ Mile of a Chemical Facility
County Health Facilities Colleges
Educational Facilities
Aging Facilities Child Care
Correctional Institutions
Mitigation Planning Region L Johnson 4 14 53 37 340 5 Leavenworth 1 1 12 2 31 2 Wyandotte 2 2 33 3 102 5 Total 7 17 98 42 473 12 Source: State Hazard Mitigation Plan
Summary
Region L is vulnerable to a Hazardous Material Incident due to its large industrial base in Kansas City area of Wyandotte County, its farmland footprint in Leavenworth County, and the major transportation nodes that run through the planning area. Pipelines, railroads, highways, chemical plants and use of those chemicals are all issues that make Region L vulnerable. The initial concern during an incident is for the large amount of people that live in this Region, then the environment.
Local Mitigation Concerns
• As mentioned in the vulnerability overview, the transportation nodes are a susceptible to a hazardous material incident. Whether due to transportation trucks carrying freight that is classified as hazardous material, railroad cars carrying potentially dangerous loads, or the waterways that have barges carrying freight subject to an incident. All are concerns that require a proactive approach.
• Wyandotte County is 2nd on the top 10 worst case scenario facilities list for the State of Kansas., with four facilities that have the potential to create a major hazardous incident. Added to this is their high industrial footprint that requires the use and storage of hazardous materials.

3.188
• Gas and Petroleum pipelines are numerous within the Region, transporting highly flammable and toxic products throughout the area and state. A release, or fire, at any of these locations could be catastrophic to the lives and property of individuals that live or travel near to any of these areas. Individuals downwind could suffer repercussions also.
• Millions of gallons of gas is stored underground in this Region. This storage is located under the Central West portion of the county from West of the county shop – south of Spring Dale, East of McLouth.
• With the KU Cancer Center moving into Northeast Johnson County, and the Bio-Hazard Facility being built in Manhattan, KS, the interstate highway systems which run through Region L could be at an increased risk of a hazardous material spill, sometimes of unknown etiology.
Development in Hazard prone Areas
As the infrastructure and population of Region L increases, along with the number and type of hazardous chemicals stored and transported through the area, the amount of potential losses will increase.
Johnson County
Table 3.106. Johnson County CPRI: Hazardous Materials
Hazard Type Probability Magnitude Warning
Time Duration CPRI Planning
Significance
Johnson County Hazardous Materials 4 1 4 2 2.90 Moderate Leavenworth County Table 3.107. Leavenworth County CPRI: Hazardous Materials
Hazard Type Probability Magnitude Warning
Time Duration CPRI Planning
Significance
Leavenworth County Hazardous Materials 4 1 4 2 2.90 Moderate Wyandotte County Table 3.108. Wyandotte County CPRI: Hazardous Materials
Hazard Type Probability Magnitude Warning
Time Duration CPRI Planning
Significance
Wyandotte County Hazardous Materials 4 1 4 2 2.90 Moderate

3.189
Consequence (Impact) Analysis This hazard could have a significant impact on the public health, the environment, private property and the economy. The impact of this type of disaster will likely be localized to the immediate area surrounding the incident. The initial concern will be for people, then the environment. If contamination occurs, the spiller is responsible for the cleanup actions and will work closely with the KDHE, KDEM, KCC, EPA and the local jurisdiction to ensure that cleanup is done safely and in accordance with federal and state laws.
The information in provides the Impact Analysis of Potential for Detrimental Impacts of Hazards done for accreditation with the Emergency Management Accreditation Program (EMAP).
Table 3.109. EMAP Consequences Analysis: Hazardous Materials
Subject Ranking Impacts/Hazardous Materials Health and Safety of Persons in the Area of the Incident
Severe Localized impact will be severe within the plume/spill area, depending on the type of chemical/material released. As distance is increased from the plume area, the impact will become minimal to moderate.
Responders Severe Impact to responders could be severe if not trained and properly equipped. Responders that are properly trained and equipped will have a minimal to moderate impact.
Continuity of Operations Minimal to Severe Temporary relocation could be necessary if government facilities are in close proximity to the incident area. This temporary relocation could become significant depending on clean-up (minimal to severe).
Property, Facilities, and Infrastructure Minimal – Severe Impact is expected to be minimal for actual structural properties, facilities, and infrastructure. Unless it is accompanied by an igniting device in which case it could be severe.
Delivery of Services Minimal to Severe Delivery of services could be affected within and around the plume/spill area (minimal to severe).
Environment Severe Localized impact within the plume/spill area could be severe to native plants, wildlife and natural habitats. Clean up and remediation will be required.
Economic Conditions Minimal to Severe Economic conditions could be adversely affected depending on whether agriculture is affected, what type of material is released, is the company a major employer, etc.
Public Confidence in Jurisdiction’s Governance
Minimal to Severe Impact will be dependent on whether or not the release could have been avoided by government or non-government entities, clean-up and investigation times, and outcomes.

3.190
3.2.12 Land Subsidence Calculated Priority Risk Index Planning Significance
1.30 Low Description Subsidence is caused when the ground above manmade or natural voids collapses. Subsidence can be related to mine collapse, water and oil withdrawal, or natural causes such as shrinking of expansive soils, salt dissolution (which may also be related to mining activities), and cave collapses. The surface depression is known as a sinkhole. If sinkholes appear beneath developed areas, damage or destruction of buildings, roads and rails, or other infrastructure can result. The rate of subsidence, which ranges from gradual to catastrophic, correlates to its risk to public safety and property damage.
The development of sinkhole and subsidence areas can be grouped into three major categories:
1. Natural dissolution of soluble minerals, causing the development of sinkholes, 2. Extraction of minerals by either solution mining or shaft mining which leaves a void
space where subsidence can occur, and 3. Downward drainage of fresh water, via a drill hole or unplugged oil or gas well which
penetrates a soluble mineral formation and has an outlet for the solution cavity water to be disposed.
Major materials or minerals present in Kansas that are associated with subsidence and sinkhole development include: salt, limestone and dolomite, gypsum, coal, lead and zinc.
Underground limestone mines have contributed to a subsidence problem in the Kansas City metropolitan area, on the Missouri side.
Location
The planning area does have some areas of concern for this hazard, although it is not a wide spread hazard.
The Kansas Department of Health and Environment in 2006 prepared a report on “Subsurface Void Space and Sinkhole/Subsidence Area Inventory for the State of Kansas.” The report inventoried subsurface void space from oil and gas exploration and production, natural sources, shaft mining, and solution mining. Because some areas were corrected the revised total void space inventory for all sources in the state is 119,136 acres. The distribution of total acres and major cause of void spaces are shown for Leavenworth, Wyandotte, and Johnson Counties in Figure 3.68. Notable to this region are the limestone mines in all the counties, and the coal mines in Leavenworth County. These void spaces could be susceptible to collapse resulting in land subsidence and sinkholes in the area. Additional information from this report is discussed in the Extent Section below.

3.191
Figure 3.68. Total Subsurface Void Space by County (in acres)
Source http://www.engg.ksu.edu/CHSR/outreach/tosnac/sites/docs/04.pdf

3.192
Another area of concern is karst; a terrain or type of topography generally underlain by soluble rocks, such as limestone, gypsum, and dolomite, in which the topography is chiefly formed by dissolving the rock, are also particularly prone to sinkholes.
Figure 3.69 illustrates the location of karst features and features analogous to karst in Kansas. The green areas shown in the map show fissures, tubes, and caves generally less than 1,000 feet long with 50 feet or less vertical extent in gently dipping to flat-lying carbonate rock. The planning area shows karst features in all three counties. There are limited documented problems associated with natural limestone subsidence and sinkholes in Kansas. However, eastern Kansas has anthropogenic risk associated with limestone mines.
Figure 3.69. Karst Features in Kansas
Previous Occurrences
The following map shows one-mile square sections of land in the eastern side of the state where sinkhole locations have been documented in writing. Red indicates sinkhole occurrences and yellow indicates springs. Region L, indicated by LV, WY, and JO show that Wyandotte and Johnson County have had documented sinkhole locations.

3.193
Figure 3.70. Sinkholes in Eastern Kansas
Records maintained by KDHE, indicate that $1,144.39 has been spent in Leavenworth County during the years that records were available for the Abandoned Mine Land Program. Historical costs capture only the remediation costs eligible for KDHE’s programs. The potential for other structural damage and economic impacts exists for all counties that have subsurface void spaces.
The Kansas Department of Health and Environment’s Surface Mining Section is the agency responsible for the reclamation of abandoned coal mines in Kansas under the Surface Mining and Control Reclamation Act of 1977 (P.L. 95-87). Federal funds are available through the office of Surface Mining Reclamation and Enforcement for the reclamation of past mining problems which are hazardous to the health, safety, and general welfare of the public. The Abandoned Mine Land (AML) Program receives reports yearly on coal mine subsidence alone. KDHA provided the following data:
• Coal Subsidence Projects,

3.194
• Coal Emergency Program Projects for the remediation of sites which are in immediate threat to the health and safety of the general public.
The following Table shows the Coal Emergency Fund Expenditures from 1980 to October 2012 for the state of Kansas. Table 3.110. Coal Emergency Fund Expenditures by County, 1980 to Oct. 2012)
County # of projects cost Bourbon 9 $58,815 Cherokee 734 $2,880,030 Crawford 1851 $4,535,670 Crawford/ck 1 $723 Leavenworth 2 $37,765 Linn 2 $0 Neosho 1 $0 Osage 3 $0 Shawnee 1 $0 Wabaunsee 3 $96,660 Wyandotte 1 $0 Total $7,609,662
Source: State Hazard Mitigation Plan
Other Notable Land Subsidence Events • 2010: Kansas City, MO. - Ramps to a major highway shut down because of a growing
sinkhole in the pavement. I-470 westbound near the Three Trails Interchange is closed because of a partial collapse where Westbound I-470 meets westbound I-435.
• 1998–1999: Two medical buildings were damaged in Wyandotte County. • 1965–1966: Subsidence over abandoned limestone mines in Wyandotte County damaged
roads and destroyed houses. Extent
The planning committee has deemed that land subsidence in the area of concern would be negligible.
Probability of Future Events Based on historical records, the planning region is “Unlikely” to have an event happen within a 10 year window. Impact and Vulnerability The KDHE Abandoned Mine Land Program estimates there are over 350 abandoned coal mine sites in the State of Kansas that alone identified with health and safety problems. While not all abandoned mines include subsidence issues it is a concern.
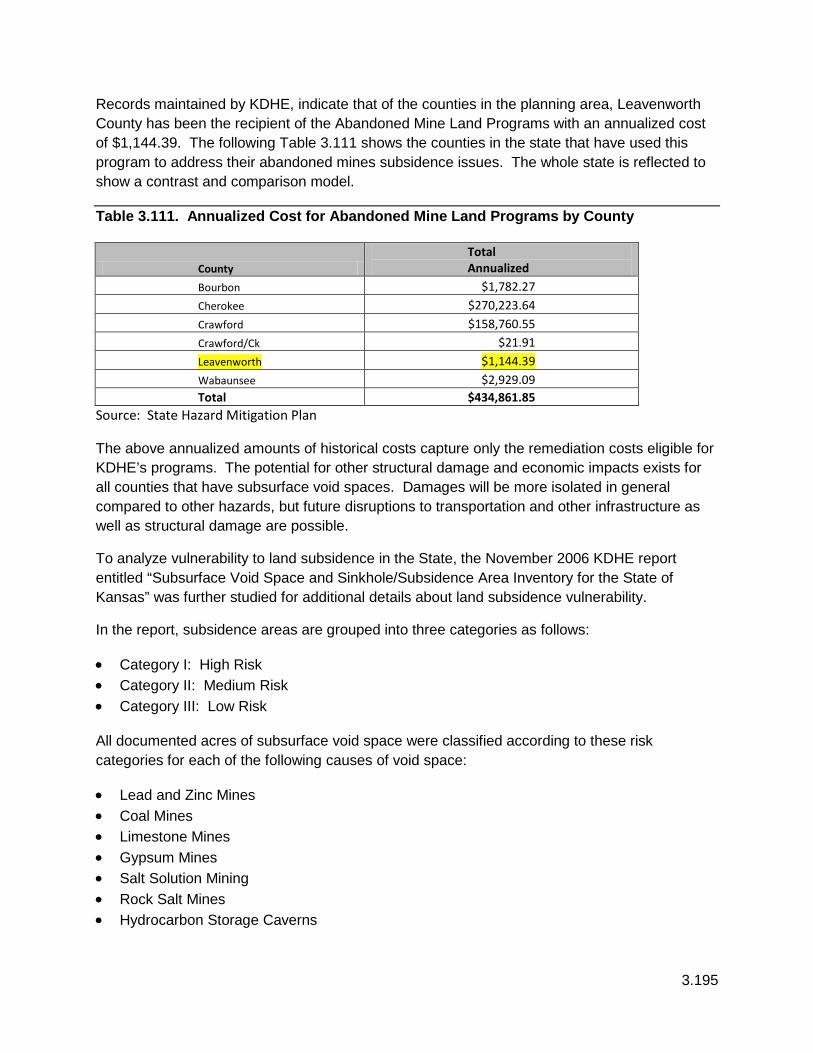
3.195
Records maintained by KDHE, indicate that of the counties in the planning area, Leavenworth County has been the recipient of the Abandoned Mine Land Programs with an annualized cost of $1,144.39. The following Table 3.111 shows the counties in the state that have used this program to address their abandoned mines subsidence issues. The whole state is reflected to show a contrast and comparison model.
Table 3.111. Annualized Cost for Abandoned Mine Land Programs by County
County Total Annualized
Bourbon $1,782.27 Cherokee $270,223.64 Crawford $158,760.55 Crawford/Ck $21.91 Leavenworth $1,144.39 Wabaunsee $2,929.09 Total $434,861.85
Source: State Hazard Mitigation Plan
The above annualized amounts of historical costs capture only the remediation costs eligible for KDHE’s programs. The potential for other structural damage and economic impacts exists for all counties that have subsurface void spaces. Damages will be more isolated in general compared to other hazards, but future disruptions to transportation and other infrastructure as well as structural damage are possible.
To analyze vulnerability to land subsidence in the State, the November 2006 KDHE report entitled “Subsurface Void Space and Sinkhole/Subsidence Area Inventory for the State of Kansas” was further studied for additional details about land subsidence vulnerability.
In the report, subsidence areas are grouped into three categories as follows:
• Category I: High Risk • Category II: Medium Risk • Category III: Low Risk
All documented acres of subsurface void space were classified according to these risk categories for each of the following causes of void space:
• Lead and Zinc Mines • Coal Mines • Limestone Mines • Gypsum Mines • Salt Solution Mining • Rock Salt Mines • Hydrocarbon Storage Caverns

3.196
With the known number of acres in each risk category for each county with documented subsurface void spaces, a weighted vulnerability calculation was completed. Acreage in risk Category I (High Risk) received a multiplier of three, acreage in risk Category II (Moderate Risk) received a multiplier of two and acreage in risk Category III (Low Risk) received a multiplier of one. Table 3.112 provides the results of this vulnerability analysis for counties with known subsurface void spaces, organized by Mitigation Planning Region.

3.197
Table 3.112. Subsurface Void Space Vulnerability Analysis
County Lead
/ Zi
nc C
at. I
A
cres
Coa
l C
ateg
ory
I
Coa
l C
ateg
ory
II
Coa
l C
ateg
ory
III
Lim
esto
ne
Cat
egor
y I
Lim
esto
ne
Cat
egor
y II
Lim
esto
ne
Cat
egor
y III
Gyp
sum
C
ateg
ory
II
Salt
Solu
tion
Cat
egor
y I
Salt
Solu
tion
Cat
egor
y II
Salt
Solu
tion
Cat
egor
y III
Roc
k Sa
lt C
ateg
ory
III
Hyd
roca
rbon
St
orag
e C
ateg
ory
III
Tota
l Sub
-su
rfac
e Vo
id
Spac
e
Wei
ghte
d C
alcu
latio
n
Mitigation Planning Region L Johnson 209 209 277 695 1,322 Leavenworth 1100 40 40 40 1,220 1,340 Wyandotte 394 323 347 1,064 2,175 Subtotal 0 0 0 1100 643 572 664 0 0 0 0 0 0 2,979 4,837
Source: Data from KDHE, “Subsurface Void Space and Sinkhole/Subsidence Area Inventory for the State of Kansas” November 2006; Data tabulated and assigned weighted scores by AMEC; Void Space Unknown indicates that known coal mines are present. However subsurface void space is not known
Table 3.113. Top 10 Counties Vulnerable to Land Subsidence According to Weighted Calculation
Mitigation Planning Region County
Total Sub-surface Void Space
Weighted Calculation
H Crawford 69,000 150,100 H Cherokee 33,769 85,753 J Osage 4,000 8,000 G Reno 2,889 3,949 L Wyandotte 1,064 2,175 F Ellsworth 2,134 2,158 G Rice 1,141 1,350 L Leavenworth 1,220 1,340 L Johnson 695 1,322 E Barber 520 1,040
Source: State Hazard Mitigation Plan
Weighted Calculation: With the known number of acres in each risk category for each county with documented subsurface void spaces, a weighted vulnerability calculation was completed. Acreage in risk Category I (High Risk) received a multiplier of three, acreage in risk Category II (Moderate Risk) received a multiplier of two and acreage in risk Category III (Low Risk) received a multiplier of one.

3.198
Summary
Land subsidence is a concern in Region L, but is considered a rare occurrence. When it does happen the cost can be high. All three counties in the planning area are rated in the top 10 most vulnerable counties in Kansas for this hazard due to the coal mines in Leavenworth County and the make-up of the land in the Region which has a high limestone component. Both of these are highly susceptible to collapse. Local Mitigation Concerns
• Comparison of the weighted vulnerability calculation considering known subsurface void spaces with the top 10 counties for housing unit gains and populations gains shows that Leavenworth and Johnson Counties are in the top 10 for both housing and population gains, and scored within the top 10 counties in the weighted vulnerability calculation for land subsidence. With these growths, and the developments that are associated with them, land subsidence could become an even bigger issue as the urban areas spread out toward the more susceptible land areas that pose the most risk for subsidence, such as the coal mines in Leavenworth County.
• Wyandotte County is not growing at as fast a pace as Leavenworth and Johnson counties, yet it is the county on record as having the notable incidents with the latest being in 1999. The Kansas City incident was not on the Kansas side, but it was close enough to Wyandotte County to merit concern. Known for its industrial areas, Wyandotte could experience heavy financial burdens should sinkholes develop in this area.
Development in Hazard Prone Areas
Comparison of the weighted vulnerability calculation considering known subsurface void spaces with the top 10 counties for housing unit gains and populations gains reveals that Leavenworth and Johnson Counties are in the top 10 for both housing and population gains and scored within the top 10 counties in the weighted vulnerability calculation for land subsidence. However, land subsidence is very uncommon in the planning area. Leavenworth County has worked with KDHE through the Abandoned Mine Land Program to provide land clearing, backfilling, grading, erosion and site drainage control, guardrail and fence installation, demolition and disposal, and re-vegetation to mitigate for potential subsidence issues and to protect the public. Current mining operations are responsible for these same actions via the Kansas Statute Annotated 49-401. Land subsidence in Johnson and Wyandotte Counties is also uncommon because there is very little extraction of underground water which would affect the make-up of the soil that would lead to subsidence. By following regulatory guidelines during development procedures and construction, the hazards risk are negligible to development in the region.
Johnson County Table 3.114. Johnson County CPRI: Land Subsidence
Hazard Type Probability Magnitude Warning
Time Duration CPRI Planning
Significance

3.199
Johnson County Land Subsidence 1 1 4 1 1.30 Low Leavenworth County Table 3.115. Leavenworth County CPRI: Land Subsidence
Hazard Type Probability Magnitude Warning
Time Duration CPRI Planning
Significance
Leavenworth County Land Subsidence 1 1 4 1 1.30 Low Wyandotte County Table 3.116. Wyandotte County CPRI: Land Subsidence
Hazard Type Probability Magnitude Warning
Time Duration CPRI Planning
Significance
Wyandotte County Land Subsidence 1 1 4 1 1.30 Low
Consequence (Impact) Analysis The information in Table 3.117 provides the Consequence Analysis of Potential for Detrimental Impacts of Hazards done for accreditation with the Emergency Management Accreditation Program (EMAP). Table 3.117. EMAP Consequence Analysis: Land Subsidence
Subject Ranking Impacts/Land Subsidence
Health and Safety of Persons in the Area of the Incident
Moderate to Severe Local impact expected to be moderate to severe for the incident area.
Responders Minimal Impact to responders would be minimal. Continuity of Operations Minimal Minimal expectation of execution of the
COOP, unless a facility is impacted. Property, Facilities, and Infrastructure Severe Localized impact to facilities and
infrastructure in the incident area has the potential to do severe damage.
Delivery of Services Minimal Impacts to the delivery of services could be severe if roads/utilities are affected. Otherwise impact would be non-existent to minimal.
Environment Minimal Impact to the area would be minimal. Economic Conditions Minimal Impacts to the economy will depend on
the severity of the damage. Public Confidence in Jurisdiction’s Governance
Minimal to Severe Local development policies will be questioned (minimal to severe)

3.200
3.2.13 Landslide
Calculated Priority Risk Index Planning Significance 1.75 Low
Description
Landslides are a phenomenon that is not new to the planning area. A landslide is the downhill movement of soil and rock by gravity. The basic ingredients for landslides are gravity, susceptible soil or rock, sloping ground, and water. Types of landslides that occur in Kansas are rockfalls, block slides, slumps, earth flows, and creep. Creep is widespread on hillsides throughout Kansas.
Landslides must have an elevated terrain, with the potential for landslides increasing as the slope angle increases in degrees. Anything that increases the slope angle can trigger a landslide (e.g., a stream actively eroding a hill, construction practices). Slope steepness is the primary factor determining slope stability, but soil and rock types are also important. The most common rocks found in Kansas are shale’s, limestone, and sandstones. Shale’s—rocks composed of clay- and silt-sized grains—are most often associated with landslides. When shale is near the ground surface where the water content fluctuates, it weathers into a clayey soil that could be landslide prone. Limestone and sandstones exposed in cliffs or roadcuts can pose a risk for rock fall, especially when they overlie shale’s.
Landslides may occur when soil on hillsides is saturated following extended periods of rainfall or snow melt. Landslides can damage or destroy structures, roadways, and utilities as well as block roadways with debris. They are often associated with other hazard events (e.g., earthquakes, flooding, and heavy rainfall).
Landslides occur occasionally in Region L and are a localized problem, but growth of cities provides potential for more property losses. Landslides can occur when underlying shale’s become saturated with water in wet years. Rocks and overlying soils then slip down slope and are a particular problem in areas of housing or where road construction has occurred.
Location
While the probability of a landslide happening in Region L is unlikely, Johnson County historically shows the event is possible in a 5 year window. Vulnerability to landslide hazards is a function of location, type of human activity, use, and frequency of landslide events. The risk posed by landslide to the planning area is low, but not impossible in the metro area.
According to the U.S. Geological Survey, the areas of Kansas that are most prone to landslides are the Missouri River Corridor in northeastern Kansas, including the Kansas City metropolitan area within the boundaries of Region L (see Figure 3.71).

3.201
Figure 3.71. Landslide-Prone Areas of Kansas
Source: Kansas Geological Survey, http://www.kgs.ku.edu/Publications/AnnRep02/hazards/hazards.html

3.202
Landslides in the hilly terrain along the Kansas and Missouri rivers in and around the planning area have caused millions of dollars in property damage. In 1997, the Kansas Geological Survey began an effort to map the landslide hazards of northeastern Kansas. The pilot area was Atchison, because of the steep bluffs along the Missouri River. A statistical method called multiple logistic regression has been used to create a landslide-hazard map for Atchison, Kansas, and surrounding areas. Data included digitized geology, slopes, and landslides, manipulated using ArcView GIS. Additional information including landslide hazard maps is available for the study area from the Kansas Geological Survey (reference the KGS M Series Maps).
Previous Occurrences
The most costly landslide in Kansas was in 1995 in Overland park. Two houses were destroyed and four lots were damaged with an estimated value of $1.5 million. Other landslides in the planning area include:
• July 2001: Mission, Kansas (Johnson County). A 180 foot wide landslide accord along the north side of Foxridge Drive. The earthen mass moved laterally and downward approximately 2 feet.
• 1998: Kansas City intense rainfall on October 4, 1998 caused excessive pressure on retaining walls at the Woodlawn Cemetery in Kansas City, KS (north of Parallel and
east of 9th St). Also several roads throughout the County, (51st & Douglas Ave, and Barnes Dr between Pomeroy Dr & 74th St) experienced landslide damage. The total
landslide damage was over $1 million to repair through FEMA’s Public Assistance funds. • 1990: Leawood, Kansas (Johnson County): two homes were damaged at an estimated
cost of $120,000. • 1995: Johnson County saw a couple of homes destroyed in a landslide in
1995, resulting in a total of $1.5 million dollars in damages. (see Figure 3.72).
Extent
A Landslide in the Region is not expected to be of a catastrophic nature. The planning committee has determined the extent of this hazard is: Limited.
Probability of Future Events
According to the Geological Survey, Region L is in an area that is more prone to landslides, due to its co-location to the Missouri River. However, while it is prone to landslides, historically the incidences are few and far between. The planning committee has ranked this hazard’s probability as “Unlikely”, with a 1 in 10 years chance of occurring.

3.203
Impact and Vulnerability
While not a regular or normal event, losses due to landslides in the planning area will continue. Landslide losses are primarily related to damage to property. However, if a sudden landslide impacts an inhabited structure, injuries or deaths could occur. Historically, landslides in Kansas have been isolated events impacting a few properties or a particular area. Often, damages in terms of estimated losses are not reported. Additionally, there is not a repository for damages to be reported, other than NCDC. The NCDC database does not include any previous landslide events in the Region, let alone in Kansas. This is likely because the events are generally isolated and do not impact large areas.
It is not possible at this time to determine quantitative estimates for potential losses associated with the landslide hazard.
Landslides were ranked 19th on the planning significance for area. Region L is notable for its hills, oftentimes having steep slopes. These slopes are prone to landslides, especially during periods of heavy rain. Wildfire can exacerbate a landslide by depleting the soil of its ‘anchor’. Region L has been noted to have wildfires and landslides, with the worst being in Johnson County.
Local Mitigation Concerns
• Region L is located along the Missouri River corridor and the Kansas River, which according the U.S. Geological Survey makes it more prone to landslides. Coupled with increased development trends to accommodate the increase in the population base and the hilly terrain, a landslide could potentially cause the loss of life and property.
• Areas that have seen wildfires or human modification of the land that have destroyed vegetation are prone to landslides, specifically during rain events. With the drought from 2011 to present, the Region has seen an increase in the incidence of wildfires (discussed in the Wildfire section). Human modification to include landscaping or development also brings the risk of landslides. Particularly if a home or business is on a hill, which includes slopes that have been altered for construction of buildings and roads. Johnson County saw a couple of homes destroyed in a landslide in 1995, causing a total of $1.5 million dollars. Figure 3.72 shows one of the homes that was destroyed in this 1995 disaster.

3.204
Figure 3.72. 1995 Johnson County Landslide
Source: Kansas Geological Survey, http://www.kgs.ku.edu/Publications/AnnRep02/hazards/hazards.html
• Landslides have a significant impact on transportation corridors, fuel and energy conduits,
and communications linkages. Ground-failure events have devastating economic effects on Federal, State, local, and private roads, and bridges. Railroads, electric and telecommunication lines, dams, levees, and waste repositories can be affected by land movement. Road building and construction often exacerbate the landslide problem in hilly areas by altering the landscape, slopes, and drainages and by changing and channeling runoff, thereby increasing the potential for landslides. Landslides and others forms of ground failure also have adverse environmental consequences, such as dramatically increased soil erosion, siltation of streams and reservoirs, blockage of stream drainages, and loss of valuable watershed, grazing, and timber lands.
Development in Hazard Prone Areas Of the landslide-prone areas, Johnson and Leavenworth are also rated in the top 10 Kansas Counties for Housing Unit Gains Additionally, these two counties are in the top 10 Kansas Counties for Population Gains If construction is occurring in or near landslide hazard areas, more structures/population will be at risk to damage/injury from landslides.
The effects of landslides on people and structures can be lessened by total avoidance of landslide hazard areas or by restricting, prohibiting, or imposing conditions on hazard-zone activity. The hazard from landslides can be reduced by avoiding construction on steep slopes and existing landslides, or by stabilizing the slopes. Stability increases when ground water is prevented from rising in the landslide mass by (1) covering the landslide with an impermeable membrane, (2) directing surface water away from the landslide, (3) draining ground water away from the landslide, and (4) minimizing surface irrigation. Slope stability is also increased when a retaining structure and/ or the weight of a soil/rock berm are placed at the toe of the landslide or

3.205
when mass is removed from the top of the slope. While landslides have occurred in in the planning region, they are not widespread or common. Development in the area has not been stymied due to the low risk of landslides, however, the low risk can be mitigated by using construction methods that can stand up to this hazard should it occur such as water drainage design, foundation design requirements that accommodate the type of soils being built on, the cut, fill, and sloping of the lot in relationship to the location of the foundation, and setback requirements. One way to ensure the proper construction techniques are applied is by having a geotechnical report accomplished. Building lower density in residential lots on slopes can also reduce the potential for landslides by reducing the number of cuts and fills for driveways and house pads. In short, development that fits the terrain and does not use extensive excavation and drainage alterations will reduce risk from landslide hazards in the planning area.
Johnson County Table 3.118. Johnson County CPRI: Landslide
Hazard Type Probability Magnitude Warning
Time Duration CPRI Planning
Significance
Johnson County Landslide 1 2 4 1 1.75 Low
Leavenworth County
Table 3.119. Leavenworth County CPRI: Landslide
Hazard Type Probability Magnitude Warning
Time Duration CPRI Planning
Significance
Leavenworth County Landslide 1 2 4 1 1.75 Low
Wyandotte County
Table 3.120. Wyandotte County CPRI: Landslide
Hazard Type Probability Magnitude Warning
Time Duration CPRI Planning
Significance
Wyandotte County Landslide 1 2 4 1 1.75 Low

3.206
Consequence (Impact) Analysis The information in Table 3.121 provides the Consequence Analysis of Potential for Detrimental Impacts of Hazards done for accreditation with the Emergency Management Accreditation Program (EMAP).
Table 3.121. EMAP Consequence Analysis: Landslide
Subject Ranking Impacts/Landslide
Health and Safety of Persons in the Area of the Incident
Moderate to Severe Localized impact could be moderate to severe for the incident area.
Responders Minimal Impact to responders would be minimal. Continuity of Operations Minimal Minimal expectation of execution of the
COOP, unless a facility is impacted. Property, Facilities, and Infrastructure
Minimal to Severe Localized impact to facilities and infrastructure in the incident area has the potential to do severe damage if they are on, or in, the area of the landslide.
Delivery of Services Minimal Impacts to the delivery of services could be severe if roads/utilities are affected. Otherwise impact would be non-existent to minimal.
Environment Minimal Impact to the area would be minimal other than the immediate area.
Economic Conditions Minimal Impacts to the economy will depend on the severity of the damage, i.e., are roads blocked, did any businesses get caught in the landslide.
Public Confidence in Jurisdiction’s Governance
Minimal to Severe Local development policies will be questioned (minimal to severe).

3.207
3.2.14 Lightning Calculated Priority Risk Index Planning Significance
2.80 Moderate Description According to the National Weather Service, lightning is one of the most underrated severe weather hazards. The second deadliest weather killer in the United States, it ranks above hurricanes or tornadoes. Of the estimated 1,000 people who are struck by lightning each year on the U.S., only 10 percent are killed, but survivors may suffer life-long disabilities.
Severe thunderstorms strike the region on a regular basis. In addition to the heavy rains that cause floods, high winds, tornadoes and thunderstorms, lightning often accompanies thunderstorms and can cause injury, death, property damage and wild land fires. The widespread and frequent nature of thunderstorms makes lightning a relatively common occurrence. Of particular concern to the planning area is protection of facilities and communications systems that are important to emergency response operations, protection of public health and maintenance of the jurisdictional economies. The threat to communications systems includes tornado sirens, which could get knocked out just when they are needed most.
According to the National Oceanic and Atmospheric Association, there are 7 main types of lightning:
Intra – Cloud: This is the most common type of lightning and completely inside of a cloud.
Cloud to Cloud: This type of lightning occurs between two or more clouds.
Cloud to Air: Lightning that is generated in a positively charged cloud top and reaches out to negatively charged air around it.
Bolt from the blue: Originates within the updraft of a storm, travels horizontally for many miles, then strikes the ground.
Anvil Lightning: Lightning that develops in the anvil of a thunderstorm cloud and travels straight down to strike the ground.
Heat Lightning: Lightning from a thunderstorm that is too far away to be heard.
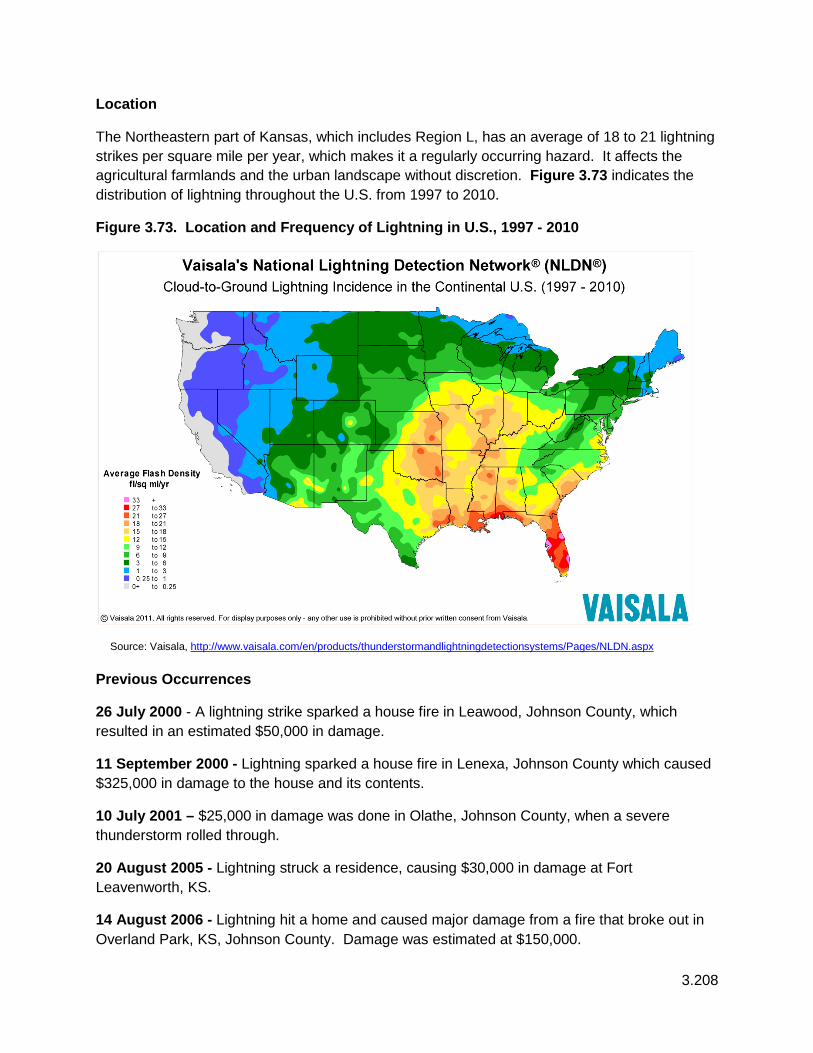
3.208
Location
The Northeastern part of Kansas, which includes Region L, has an average of 18 to 21 lightning strikes per square mile per year, which makes it a regularly occurring hazard. It affects the agricultural farmlands and the urban landscape without discretion. Figure 3.73 indicates the distribution of lightning throughout the U.S. from 1997 to 2010.
Figure 3.73. Location and Frequency of Lightning in U.S., 1997 - 2010
Source: Vaisala, http://www.vaisala.com/en/products/thunderstormandlightningdetectionsystems/Pages/NLDN.aspx Previous Occurrences
26 July 2000 - A lightning strike sparked a house fire in Leawood, Johnson County, which resulted in an estimated $50,000 in damage.
11 September 2000 - Lightning sparked a house fire in Lenexa, Johnson County which caused $325,000 in damage to the house and its contents.
10 July 2001 – $25,000 in damage was done in Olathe, Johnson County, when a severe thunderstorm rolled through.
20 August 2005 - Lightning struck a residence, causing $30,000 in damage at Fort Leavenworth, KS.
14 August 2006 - Lightning hit a home and caused major damage from a fire that broke out in Overland Park, KS, Johnson County. Damage was estimated at $150,000.
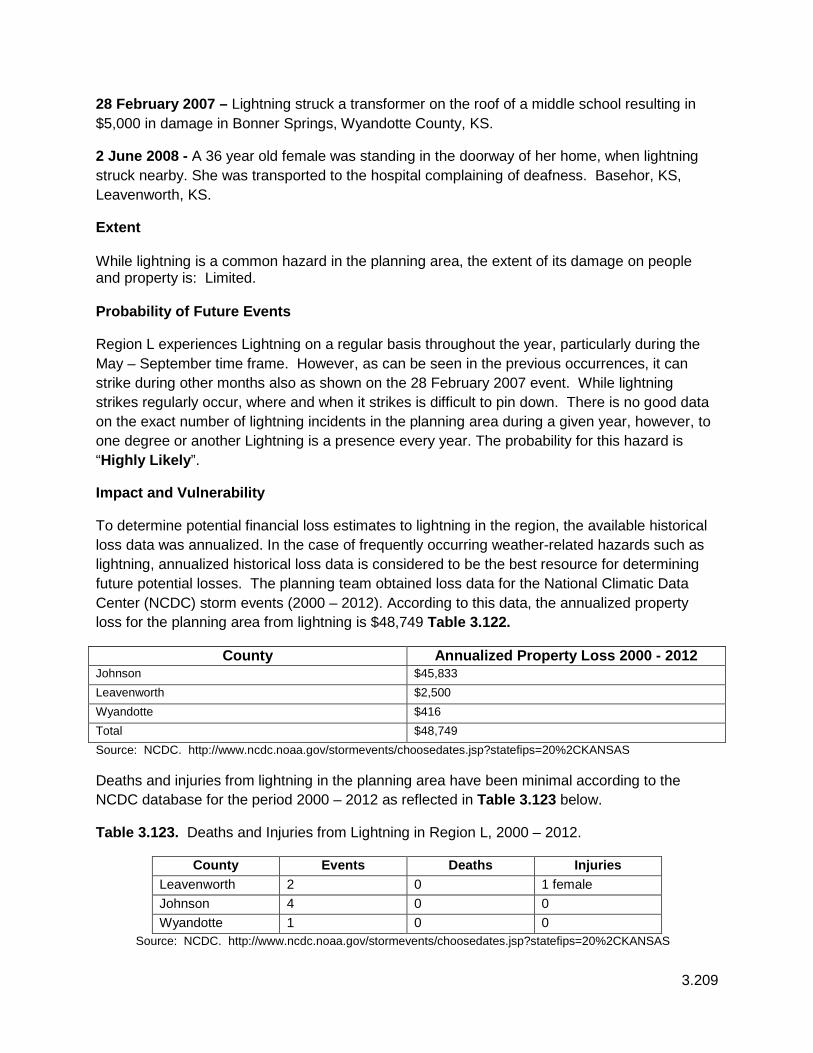
3.209
28 February 2007 – Lightning struck a transformer on the roof of a middle school resulting in $5,000 in damage in Bonner Springs, Wyandotte County, KS.
2 June 2008 - A 36 year old female was standing in the doorway of her home, when lightning struck nearby. She was transported to the hospital complaining of deafness. Basehor, KS, Leavenworth, KS.
Extent While lightning is a common hazard in the planning area, the extent of its damage on people and property is: Limited. Probability of Future Events
Region L experiences Lightning on a regular basis throughout the year, particularly during the May – September time frame. However, as can be seen in the previous occurrences, it can strike during other months also as shown on the 28 February 2007 event. While lightning strikes regularly occur, where and when it strikes is difficult to pin down. There is no good data on the exact number of lightning incidents in the planning area during a given year, however, to one degree or another Lightning is a presence every year. The probability for this hazard is “Highly Likely”.
Impact and Vulnerability
To determine potential financial loss estimates to lightning in the region, the available historical loss data was annualized. In the case of frequently occurring weather-related hazards such as lightning, annualized historical loss data is considered to be the best resource for determining future potential losses. The planning team obtained loss data for the National Climatic Data Center (NCDC) storm events (2000 – 2012). According to this data, the annualized property loss for the planning area from lightning is $48,749 Table 3.122.
County Annualized Property Loss 2000 - 2012 Johnson $45,833 Leavenworth $2,500 Wyandotte $416 Total $48,749 Source: NCDC. http://www.ncdc.noaa.gov/stormevents/choosedates.jsp?statefips=20%2CKANSAS
Deaths and injuries from lightning in the planning area have been minimal according to the NCDC database for the period 2000 – 2012 as reflected in Table 3.123 below.
Table 3.123. Deaths and Injuries from Lightning in Region L, 2000 – 2012.
County Events Deaths Injuries Leavenworth 2 0 1 female Johnson 4 0 0 Wyandotte 1 0 0
Source: NCDC. http://www.ncdc.noaa.gov/stormevents/choosedates.jsp?statefips=20%2CKANSAS

3.210
Severe thunderstorms and the associated lightning events will continue to cause damage to anything and everything exposed to the weather elements. Historically NCDC has reported 1 injury in the Region from 2000 through 2012.
Lightning is a regular occurrence in the planning area and is a known hazard as it pertains to buildings, crops, and people. It can affect communication systems which include warning systems and power. The most common months for lightning strikes is May through September, the very time period that people are enjoying recreational activities outdoors such as the golf course and lakeside. The statistical analysis method was used to refine and assess the relative vulnerability of each of Region L’s counties to lightning. The planning committee assigned ratings to pertinent factors that were examined at the county level. These factors are: social vulnerability index, prior events, prior annualized property damage, building exposure valuation, population density and crop exposure (annualized crop losses were not used since USDA did not have insured crop loss amounts to use in the tabulation). Then a rating value of 1-10 was assigned to the data obtained for each factor and then weighted equally and factored together to obtain overall vulnerability scores for comparison and to determine the greatest vulnerable counties.
The following are the data sources of the six factors: Social Vulnerability Index for Region L’s counties from the Hazards and Vulnerability Research Institute at the University of South Carolina, National Climatic Data Center (NCDC) storm events (2006 – 2012), U.S. Census Bureau (2010) and USDA’s Census of Agriculture (2007). It was determined that since lightning is a common occurrence in Kansas, that using historical events and property damages from 2006 forward provides adequate events to describe the lightning problem in the planning area.
Table 3.124 below provides the data for each of the six factors described above taken into consideration to determine overall vulnerability to lightning. The data is provided by county.
Table 3.124. Vulnerability of Kansas Counties Factor Amounts for Lightning
County
SoVI Rating (1-5)
Prior Events 2006-2012
Property Damages
Annualized Property Damages
Total Building Exposure
($000) Population
Density
Crop Exposure (2007 Census of
Agriculture)
Region L Johnson 1 1 $150,000 $21,429 $43,871,468 1,149.60 $29,472,000 Leavenworth 1 1 $0 $0 $4,877,783 164.7 $20,983,000 Wyandotte 3 1 $5,000 $714 $12,066,666 1,039.00 $0 total 3 $155,000 $22,143 $60,815,917 $50,455,000
Note: The Census of Agriculture did not publish crop exposure in Wyandotte County to avoid disclosure of individual operations.
Table 3.125 provides the ranges for the 1-10 lightning vulnerability factor ratings. The Social Vulnerability Index is in a range of 1- 5. To give Social Vulnerability Index the same weight as the other factors, the numbers were multiplied by two.

3.211
Table 3.125. Ranges for Lightning Vulnerability Factor Ratings So
cial
Vu
lner
abili
ty
NC
DC
Prio
r Ev
ents
Ann
ualiz
ed
Prop
erty
D
amag
e
Bui
ldin
g Ex
posu
re
Valu
atio
n
Popu
latio
n D
ensi
ty *
Cro
p Ex
posu
re
1 1 $143 - $3,600
$117,421 - $4,492,825
1.6 - 116.3 0 - $18,548,500
2 1 2 $3,601 - $7,200
$4,492,826 - $8,868,229
116.4 - 231.1
$18,548,501 - $32,126,000
3 3 $7,201 - $10,800
$8,868,230 - $13,243,634
231.2 - 345.9
$32,126,001 - $45,703,500
4 2 4 $10,801 - $14,400
$13,243,635 - $17,619,039
346 - 460.7
$45,703,501 - $59,281,000
5 5 $14,401 - $18,000
$17,619,040 - $21,994,444
460.8 - 575.5
$59,281,001 - $72,858,500
6 3 n/a $18,001 - $21,600
$21,994,445 - $26,369,848
575.6 - 690.3
$72,858,501 - $86,436,000
7 n/a $21,601 - $ 25,200
$26,369,849 - $30,745,253
690.4 - 805.1
$86,436,001 - $100,013,500
8 4 n/a $25,201 - $28,000
$30,745,254 - $35,120,658
805.2 - 919.9
$100,031,501 - $113,591,000
9 n/a $28,801 - $33,000
$35,120,659 - $39,496,062
920- 1,034.7
$113,591,001 - $127,168,500
10 5 n/a $33,001 and up
$39,496,063 - $43,871,468
1,034.8 - 1,149.6
$127,168,501 - $140,746,000
Source: State Hazard Mitigation Plan Table 3.126 provides the calculated ranges applied to determine the Low, Medium-Low, Medium, Medium-High and High vulnerable counties and Table 3.127 provides the rating values assigned that were considered in determining overall vulnerability to lightning.
Table 3.126. Ranges for Overall Lightning Vulnerability
Ranges Low Medium-Low Medium Medium-High High 7 - 13 14 – 18 19 – 23 24 – 28 29 - 34
Source: State Hazard Mitigation Plan
Table 3.127. Vulnerability of Region L Counties to Lightning
Cou
nty
SoVi
Rat
ing
NC
DC
Prio
r Ev
ent R
atin
g
Ann
ualiz
ed
Prop
erty
D
amag
e R
atin
g
Bld
g Ex
posu
re
Valu
atio
n R
atin
g
Popu
latio
n D
ensi
ty
Rat
ing
Cro
p Ex
posu
re
Rat
ing
Ove
rall
Vuln
erab
ility
R
atin
g
Ligh
tnin
g Vu
lner
abili
ty
Region L Johnson 2 1 6 10 10 2 31 High Leavenworth 2 1 0 2 2 2 9 Low Wyandotte 6 1 1 3 10 1 22 Medium
Source: State Hazard Mitigation Plan

3.212
Table 3.128 below lists the top ten vulnerable counties in Kansas relative to each other concerning lightning events. This table gives the top ten counties in Kansas in order to put the counties of Region L in perspective as to their vulnerability.
Table 3.128. Top Ten Counties: Vulnerable to Lightning
Mitigation Planning Region County
Lightning Vulnerability
G Sedgwick High L Johnson High A Rawlins High A Thomas High I Riley Medium G Cowley Medium L Wyandotte Medium K Brown Medium F Dickinson Medium J Shawnee Medium
Source: State Hazard Mitigation Plan
Summary
The entire region is susceptible to lighting strikes. Of great concern is lightning during periods of drought which can result in wildfires and damage property and put lives in danger. Johnson County and Wyandotte County are in the Top 10 counties in Kansas for being the most vulnerable to lightning strikes.
Local Mitigation Concerns
• As with many hazards, lightning can go hand in hand with other natural disasters. With the drought of 2011 to present, lightning can cause a fire risk should it strike within the planning area. The dry grass is ripe for an ignition, and lightning can be the spark that could create a wildfire that threatens crops, buildings, and lives.
• Outdoor recreation within the planning area is a major concern when it comes to lighting due to the mass number of people that attend various events. Places such as the Kansas Speedway, which can hold approximately 80,000 individuals, offers no protection in the event of a thunderstorm associated with lightning. The result could be a stampede to get out of the strike zone which lends itself to casualties and potential fatalities.
Development in Hazard Prone Areas
Virtually all structures, communication towers, power systems and electrical components in the planning area are vulnerable to lightning. Lightning causes untold numbers of dollars in damages to homes, schools, businesses and barns each year. Fires, electrical fires, electricity loss and damage to equipment are a few of the problems associated with lightning strikes.

3.213
Johnson County
Table 3.129. Johnson County CPRI: Lightning
Hazard Type Probability Magnitude Warning
Time Duration CPRI Planning
Significance
Johnson County Lightning 4 2 2 1 2.80 Moderate
Leavenworth County
Table 3.130. Leavenworth County CPRI: Lightning
Hazard Type Probability Magnitude Warning
Time Duration CPRI Planning
Significance
Leavenworth County Lightning 4 2 2 1 2.80 Moderate
Wyandotte County
Table 3.131. Wyandotte County CPRI: Lightning
Hazard Type Probability Magnitude Warning
Time Duration CPRI Planning
Significance
Leavenworth County Lightning 4 2 2 1 2.80 Moderate
Consequence (Impact) Analysis The information in Table 3.132 provides the Consequence Analysis of Potential for Detrimental Impacts of Hazards done for accreditation with the Emergency Management Accreditation Program (EMAP).

3.214
Table 3.132. EMAP Consequence Analysis: Lightning
Subject Ranking Impacts/Lightning Health and Safety of Persons in the Area of the Incident Minimal to Severe
Impact to the health and safety of persons could be minimal to severe if within the incident area.
Responders Minimal Impact to responders is expected to be minimal unless responders live within the affected area.
Continuity of Operations Minimal Temporary relocation may be necessary if government facilities experience damage (Minimal).
Property, Facilities, and Infrastructure Minimal to Severe
Impact could be severe if property, facilities or infrastructure take a direct hit which could result in fire or destruction.
Delivery of Services Minimal to Severe
Delivery of services could be affected if there is any disruption to the roads and/or utilities due to damages sustained (minimal to severe).
Environment Minimal to Severe
Impact will be isolated, yet severe to any trees, animals, etc., that take a direct hit, or is in the path of any fire that may be generated due to the lighting strike.
Economic Conditions Minimal
Local economy impact should be fairly minimal, unless the lightening causes fires which damage businesses and stops revenue (minimal to severe).
Public Confidence in Jurisdiction’s Governance Minimal
Response and recovery will be in question if not timely and effective, specifically if electricity and other utilities are affected (minimal).

3.215
3.2.15 Major Disease Outbreak
Calculated Priority Risk Index Planning Significance 2.75 Moderate
Description
Infectious diseases are human illnesses caused by microscopic agents, including viruses, bacteria, parasites, and fungi or by their toxins. They may be spread by direct contact with an infected person or animal, ingesting contaminated food or water, vectors such as mosquitoes or ticks, contact with contaminated surroundings such as animal droppings, infected droplets, or by aerosolization. Kansas’s public health and health care communities must be prepared to rapidly identify and contain a wide range of biological agents. Each year local public health departments and the Kansas Department of Health & Environment investigate disease “outbreaks” of routine illnesses such as food borne illness and sexually transmitted diseases. There have also been outbreaks of vaccine-preventable diseases such as mumps. During 2009, a pandemic “scare” served as a wake-up call to the public health and medical care communities regarding the requirements for personnel, pharmaceuticals, equipment and public education during large scale disease outbreaks.
While there are a number of biological diseases/agents that are of concern to the planning area, the following categories of disease are being addressed in this plan: vaccine preventable disease, food borne disease, and community associated infections as having significant recurring impact on the potential morbidity of Region L. The following descriptions are general and it should be noted that individuals may experience more or less severe consequences based upon their own circumstances.
While there are a number of biological diseases that are of concern to the planning area, the planning committee chose to focus its narrative on the ones being followed the most closely, which are measles, mumps, pertussis, influenza, pandemic influenza, and food borne illnesses.
Vaccine Preventable Disease
Measles Measles (rubeola) is a respiratory disease caused by a virus. The disease of measles and the virus that causes it share the same name. The measles virus normally grows in the cells that line the back of the throat and lungs. Measles typically causes fever, runny nose, cough and a rash all over the body.
About one out of 10 children with measles also gets an ear infection, and up to one out of 20 gets pneumonia. About one out of 1,000 gets encephalitis, and one or two out of 1,000 die. While measles is almost gone from the United States, it still kills nearly 200,000 people each year around the world. Measles can also make a pregnant woman have a miscarriage or give birth prematurely. Measles spreads through the air by breathing, coughing or sneezing. It is so contagious that any child who is exposed to it and is not immune will probably get the disease.

3.216
Mumps Mumps is a contagious disease that is caused by the mumps virus. Mumps typically start with a few days of fever, headache, muscle aches, tiredness, and loss of appetite, and is followed by swelling of salivary glands. Anyone who is not immune from either a previous mumps infection or from vaccination can get mumps.
Most people with mumps recover fully. However, mumps can occasionally cause complications, and some of them can be serious. Complications may occur even if a person does not have swollen salivary glands (parotitis) and are more common in people who have reached puberty.
Complications of mumps can include:
• Inflammation of the testicles (orchitis) in males who have reached puberty, which rarely leads to sterility
• Inflammation of the brain (encephalitis) and/or tissue covering the brain and spinal cord (meningitis)
• Inflammation of the ovaries (oophoritis) and/or breasts (mastitis) in females who have reached puberty
• Temporary or permanent deafness
Pertussis Pertussis is a highly communicable, vaccine-preventable disease that lasts for many weeks and is typically manifested in children with paroxysmal spasms of severe coughing, whooping, and posttussive vomiting. Major complications are most common among infants and young children and include hypoxia, apnea, pneumonia, seizures, encephalopathy, and malnutrition. Young children can die from pertussis. In 2007, 10 children died in the United States from Pertussis. Most deaths occur among unvaccinated children or children too young to be vaccinated. Children who are too young to be fully vaccinated and those who have not completed the primary vaccination series are at highest risk for severe illness. Like measles, pertussis is highly contagious with up to 90% of susceptible household contacts developing clinical disease following exposure to an index case. Adolescents and adults become susceptible when immunity wanes, but can receive a booster shot of the new combination vaccine called Tdap.
Influenza Influenza (flu) is a viral infection of the nose, throat, bronchial tubes, and lungs. There are two main types of virus: A and B. Each type includes many different strains, which tend to change each year. In Kansas, influenza occurs most often in the winter months. Illnesses resembling influenza may occur in the summer months, but these are usually the result of other viruses that exhibit symptoms commonly referred to as influenza-like illness or ILI.
Influenza is highly contagious and is easily transmitted through contact with droplets from the nose and throat of an infected person during coughing and sneezing. Typical symptoms include headache, fever, chills, cough, and body aches. Although most people are ill for only a few days some may have secondary infections, such as pneumonia, and may need to be hospitalized.

3.217
Anyone can get influenza, but it is typically more serious in the elderly and people with chronic illnesses such as cancer, emphysema, or diabetes or weak immune systems. It is estimated that thousands of people die each year in the United States from flu or related complications.
Pandemic Influenza A pandemic is a global disease outbreak. A pandemic flu is a human flu that causes a global outbreak, or pandemic, of serious illness. A flu pandemic occurs when a new influenza virus emerges for which people have little or no immunity, and for which there is no vaccine.
This disease spreads easily person-to-person, causing serious illness, and can sweep across the country and around the world in a very short time. The Centers for Disease Control and Prevention (CDC) has been working closely with other countries and the World Health Organization to strengthen systems to detect outbreaks of influenza that might cause a pandemic and to assist with pandemic planning and preparation.
During 2009 and 2010 health professionals around the globe worked to combat the H1N1 influenza virus. This relatively mild and stable influenza virus circulated across the globe and caused one of the most robust worldwide vaccination campaigns since the 1970s. Health professionals continue to monitor the possibility of an avian (bird) flu pandemic associated with a highly pathogenic avian H5N1 virus. Since 2003, avian influenza has been spreading through Asia. A growing number of human H5N1 cases contracted directly from handling infected poultry have been reported in Asia, Europe, and Africa, and more than half the infected people have died. There has been no sustained human-to-human transmission of the disease, but the concern is that H5N1 will evolve into a virus capable of human-to-human transmission.
An especially severe influenza pandemic could lead to high levels of illness, death, social disruption, and economic loss. Impacts could range from school and business closings to the interruption of basic services such as public transportation, health care, and the delivery of food and essential medicines.
Pandemics are generally thought to be the result of novel strains of viruses. Because of the process utilized to prepare vaccines, it is impossible to have vaccine pre-prepared to combat pandemics. A portion of the human and financial cost of a pandemic is related to lag time to prepare a vaccine to prevent future spread of the novel virus. In some cases, current vaccines may have limited activity against novel strains.
Food borne Disease
Norovirus Noroviruses are a group of related, single-stranded RNA, non-enveloped viruses that cause acute gastroenteritis in humans. The most common symptoms of acute gastroenteritis are diarrhea, vomiting, and stomach pain. Norovirus is the official genus name for the group of viruses previously described as “Norwalk-like viruses” (NLV).
The incubation period for norovirus-associated gastroenteritis in humans is usually between 24 and 48 hours, but cases can occur within 12 hours of exposure. Norovirus infection usually
3.218
presents as acute-onset vomiting, watery non-bloody diarrhea with abdominal cramps, and nausea. Low-grade fever also occasionally occurs, and diarrhea is more common than vomiting in children. Dehydration is the most common complication, especially among the young and elderly, and may require medical attention. The symptoms of norovirus infection usually last 24 to 72 hours.
Recovery is usually complete and there is no evidence of any serious long-term sequelae. Studies with volunteers given the virus have shown that asymptomatic infection may occur in as many as 30% of infections, although the role of asymptomatic infection in norovirus transmission is not well understood.
Noroviruses are transmitted primarily through the fecal-oral route, either by consumption of fecally contaminated food or water or by direct person-to-person spread. Environmental and fomite contamination may also act as a source of infection. Good evidence exists for transmission due to aerosolization of vomitus that presumably results in droplets contaminating surfaces or entering the oral mucosa and being swallowed. No evidence suggests that infection occurs through the respiratory system.
Noroviruses are highly contagious and as few as 10 viral particles may be sufficient to infect an individual. During outbreaks of norovirus gastroenteritis, several modes of transmission have been documented; for example, initial food borne transmission in a restaurant, followed by secondary person-to-person transmission to household contacts. Although pre-symptomatic viral shedding may occur, shedding usually begins with the onset of symptoms and may continue for two weeks or more after recovery. It is unclear to what extent viral shedding over 72 hours after recovery signifies continued infectivity.
Salmonellosis Salmonellosis is an infection with bacteria called Salmonella. Most persons infected with Salmonella develop diarrhea, fever, and abdominal cramps 12 to 72 hours after infection. The illness usually lasts four to seven days, and most persons recover without treatment. However, in some persons, the diarrhea may be so severe that the patient needs to be hospitalized. In these patients, the Salmonella infection may spread from the intestines to the blood stream, and then to other body sites and can cause death unless the person is treated promptly with antibiotics. The elderly, infants, and those with impaired immune systems are more likely to have a severe illness.
Salmonella is actually a group of bacteria that can cause diarrheal illness in humans. They are microscopic living creatures that pass from the feces of people or animals to other people or other animals. There are many different kinds of Salmonella bacteria. Salmonella serotype Typhimurium and Salmonella serotype Enteritidis are the most common in the United States. Salmonella germs have been known to cause illness for over 100 years. They were discovered by an American scientist named Salmon, for whom they are named.
Many different kinds of illnesses can cause diarrhea, fever, or abdominal cramps. Determining that Salmonella is the cause of the illness depends on laboratory tests that identify Salmonella

3.219
in the stool of an infected person. Once Salmonella has been identified, further testing can determine its specific type.
Location
Region L is vulnerable to outbreaks causes by viruses and bacteria due to the dense population base, which increases the amount of institutional settings such as dormitories, daycares, and other avenues where groups of people are in contact, which can lead to the spread of diseases.
Previous Occurrences
• During the summer of 2012, the planning area saw the closing of outdoor pools early due to an outbreak of a highly contagious disease caused by the cryptosporidium parvum. Cryptosporidium is a waterborne disease that can cause gastrointestinal illness associated with diarrhea.
• The Johnson County Department of Health and Environment reported a community-wide outbreak of Pertussis. 485 cases reported in Johnson County as of December 2012.
Table 3.133 and Table 3.134 show other reportable diseases, by county, in the Region.
Table 3.133. Reportable disease by county for the planning area for 2002 – 2011 (part 1 of 2).
Cou
nty
Am
ebia
sis
Arb
ovira
l Dis
ease
Bot
ulis
m
Cam
pylo
bact
erio
sis
Chl
amyd
ia
Cho
lera
Cry
ptos
porid
iosi
s
Ehrli
chio
sis/
Ana
plas
mos
is
Gia
rdia
sis
Gon
orrh
ea
H. i
nflu
enza
e, in
vasi
ve
Hem
olyt
ic U
rem
ic S
yndr
ome
(HU
S)
Hep
atiti
s A
Hep
atiti
s B
, acu
te
Hep
atiti
s C
, acu
te
HIV
/AID
S
Legi
onel
losi
s
List
erio
sis
Mitigation Planning Region L Johnson 0 0 0 37 1,312 0 18 2 38 187 3 1 1 3 0 48 7 3 Leavenworth 0 0 0 5 264 0 0 0 1 53 1 0 0 0 0 * 0 0 Wyandotte 0 0 0 7 1,187 0 7 0 6 389 2 0 1 1 0 19 2 1 Total 0 0 0 49 2,763 0 25 2 45 629 6 1 2 4 0 67 9 4
Source: Kansas Department of Health and Environment, *Zero to five cases reported. Not shown to protect confidentiality.

3.220
Table 3.134. Reportable disease by county for the planning area for 2002 – 2011 (part 2 of 2).
Cou
nty
Lym
e D
isea
se
Mal
aria
Mea
sles
Men
ingi
tis, n
on-H
iB, n
on-N
eiss
eria
Men
ingo
cocc
al D
isea
se
Mum
ps
Pert
ussi
s
Rab
ies,
ani
mal
Salm
onel
losi
s
Shig
a to
xin-
prod
ucin
g E.
col
i
Shig
ello
sis
Stre
p., G
roup
A, i
nvas
ive
Stre
p. p
neum
onia
e, in
vasi
ve
Syph
ilis,
1° &
2°
Syph
ilis,
ear
ly la
tent
TSE
or P
rion
Dis
ease
Tube
rcul
osis
, act
ive
Tula
rem
ia
Typh
oid
Feve
r
Varic
ella
Mitigation Planning Region L Johnson 3 4 6 1 2 0 2 0 68 21 8 11 13 8 5 1 7 0 2 16
Leavenworth 2 0 0 0 0 0 0 0 8 0 2 1 1 0 0 0 1 0 0 2 Wyandotte 1 1 0 0 1 0 10 0 20 1 9 3 10 3 3 0 5 0 0 0 Total 6 5 6 1 3 0 12 0 96 22 19 15 24 11 8 1 13 0 2 18
Source: Kansas Department of Health and Environment, *Zero to five cases reported. Not shown to protect confidentiality.
Previous Occurrences of Pandemic Influenza
There have been four acknowledged pandemics in the past century:
• 1918–19 Spanish flu (H1N1): This flu is estimated to have sickened 20-40% of the world’s population. Over 20 million people lost their lives. Between September 1918 and April 1919, 500,000 Americans died. The flu spread rapidly; many died within a few days of infection, others from secondary complications. The attack rate and mortality was highest among adults 20-50 years old; the reasons for this are uncertain. Recently, the origin of the pandemic was traced to an outbreak of influenza in Haskell County, Kansas, in January 1918. Army personnel in Haskell County reported to Camp Funston (now Ft. Riley), which meant soldiers and their friends and families likely carried the virus from the county to the camp. Camp Funston sent a constant stream of soldiers to other American locations and to Europe, enabling the spread of the disease throughout the country and around the world. By the end of 1918, the Kansas death toll was around 12,000.
• 1957–58 Asian flu (H2N2): This virus was quickly identified because of advances in technology, and a vaccine was produced. Infection rates were highest among school children, young adults, and pregnant women. The elderly had the highest rates of death. A second wave developed in 1958. In total, there were about 70,000 deaths in the United States. Worldwide deaths were estimated between one and two million. Information about how this pandemic affected Kansas was not available.
• 1968–69 Hong Kong flu (H3N2): This strain caused approximately 34,000 deaths in the United States and more than 700,000 deaths worldwide. It was first detected in Hong Kong in early 1968 and spread to the United States later that year. Those over age 65 were most likely to suffer fatal consequences. This virus returned in 1970 and 1972 and still circulates today.

3.221
• 2009 H1N1 Influenza: The 2009 H1N1 Pandemic Influenza began in Kansas with the first identified case on April 24, 2009. Kansas was the third state to positively identify this novel strain of influenza and was the first non-border state to confirm a positive identification. During the 2009 H1N1 Pandemic a total of 29 Kansans died as a result of confirmed infection with the disease.
Extent
The severity and magnitude of a Major Disease Outbreak are dependent on the etiology of the disease. A highly contagious disease could spread like wildfire throughout the planning area, because of the density of the population. The planning committee has determined that in the case of a contagious Major Disease Outbreak, the extent could be catastrophic and multiple deaths could occur.
Probability of Future Events
While it is impossible to predict outbreaks, the local Health Agencies in conjunction with KDHE, report to, and provide data on, the reportable diseases that affect each county, bringing awareness to the population. These agencies also promote vaccinations to prevent against contagious diseases for adults and children in order to protect against an outbreak. In the planning area the probability of a future event is ‘Possible’ for a large-scale major disease outbreak.
Impact and Vulnerability
It is difficult to ascertain the Regional cost for the impacts of Major Disease Outbreaks. However, according to The annual impact of seasonal influenza in the US: Measuring disease burden and costs by Molinari et al., nationally the economic burden of influenza medical costs, medical costs plus lost earnings, and the total economic burden were $10.4 billion, $26.8 billion and $87.1 billion respectively. The financial burden of healthcare-associated infections nationally has been estimated at $33 billion annually. There is no data currently available on the economic impact of previous illness in Kansas. Using pandemic influenza as the worst case scenario for estimating potential losses, the Kansas Department of Health and Environment’s Pandemic Influenza Planning includes the following vulnerability estimates. It has been estimated that a medium-level pandemic could cause, in Kansas:
• Between 229,203 and 534,807 persons may require outpatient care • Between 5,016 and 11,706 may require hospitalization • Between 1,163 and 2,714 individuals may die
The majority of these deaths, hospitalizations, etc. would occur in more highly populated counties. The U.S. Centers for Disease Control and Prevention (CDC) estimates 76 million people suffer foodborne illnesses each year in the United States, accounting for 325,000 hospitalizations and more than 5,000 deaths. Foodborne disease is extremely costly. Health experts estimate that the yearly cost of all foodborne diseases in this country is $5 to $6 billion in direct medical ex-

3.222
penses and lost productivity. Infections with the bacteria Salmonella alone account for $1 billion yearly in direct and indirect medical costs.
The entire planning area is vulnerable to a major disease outbreak. As evidenced by the Annual Infectious Disease Summaries completed by the KDHE Bureau of Surveillance and Epidemiology (http://www.kdheks.gov/epi/index.html) the planning area has connections with one or multiple disease outbreaks each year, with few exceptions. Due to the density of the population base, and the higher pediatric and elderly populations, potential casualty losses are expected to be higher than the rest of the state. Region L has an advantage over other Regions in that they are in closer proximity to more Health professionals and medical capabilities. With the new health care laws being enacted, insurance will potentially become a lesser issue with access to these facilities in the case of a disease outbreak.
Although infectious diseases do not respect geographic boundaries, several populations in the planning area are at specific risk to infectious diseases. Communicable diseases are most likely to spread quickly in institutional settings such as dormitories, long-term care facilities, day care facilities, schools, etc.
The planning committee ranked the disease outbreak as possible based on a pandemic scenario within the next five years. The magnitude of an infectious disease outbreak is related to the ability of the public health and medical communities to stop the spread of the disease. Most disease outbreaks that cause catastrophic numbers of deaths are infectious in nature, meaning that they are spread from person to person. The key to reducing the catastrophic nature of the event is to stop the spread of disease. This is generally done in three ways: (1) identification and isolation of the ill, (2) quarantine of those exposed to the illness to prevent further spread, and (3) education of the public about methods to prevent transmission. The public health and health care providers in Region L routinely utilize all three methods to reduce morbidity and mortality from infectious disease. Other less common ways to contain the spread of any disease outbreaks would be to close schools, day cares, and other public events. These measures could have far-reaching economic impacts on the community and might shutdown facilities for 30 days or more. Day care and school closures could have a serious impact on businesses as parents might not be able to find child care services in order to report to work.
Summary
The entire planning area is vulnerable to a major disease outbreak. The Annual Infectious Disease Summaries completed by the KDHE Bureau of Surveillance and Epidemiology (http://www.kdheks.gov/epi/index.html) shows that all counties in the Region have connections with multiple disease outbreaks each year.
The demographics of Region L show a higher vulnerability to disease outbreaks due to the dense population base, and the number of elderly and very young people. Within the planning area there is also a higher number of institutional settings such as dormitories, long-term care facilities, day care facilities, schools, etc., which also lend themselves to infectious disease outbreaks.

3.223
Local Mitigation Concerns
• Major Disease Outbreak in the human population tends to occur where groups of people gather. Region L is the most densely population area in Kansas, and as such large numbers of the population are in direct contact daily with each other. From schools to sporting events, to concerts, the planning area provides many outlets for a major disease outbreak to spread. Daycares, nursing homes, and hospitals also contribute to this hazard event, particularly with the large over 65 and under 5 year age groups.
• A major area of concern is parents deciding not to vaccinate their children due to the perceived repercussions in doing so. Vaccinations have been tied unscientifically to an increase in autism and other disorders which make parents wary of vaccinating their children, regardless of the scientific benefits. This lack of vaccinations give rise to incidents of pertussis, mumps, measles, and other predominantly childhood diseases. 2012 saw an outbreak of Pertussis in Johnson County with 485 reported cases. Lack of vaccinations in a densely populated area contributes to contagious disease spreading.
Development in Hazard Prone Areas
Water-borne illness is very common, although the drinking water system as a source of contamination is not. The impacts and potential losses are largely economic and are dependent on the type, extent, and duration of the illness. As the population in the planning area grows in size, and ages, the vulnerability to this hazard is likely to increase.
Johnson County
Table 3.135. Johnson County CPRI: Major Disease Outbreak
Hazard Type Probability Magnitude Warning
Time Duration CPRI Planning
Significance
Johnson County Major Disease Outbreak 3 4 1 4 3.10 High
*The hazard of Major Disease Outbreak went from a moderate planning significance to a high significance during this planning period due to the probability increasing from an event could possibly happen in the next five years, to it is likely to be experienced in the next three years. Historically, the pertussis outbreak in 2012 and the waterborne illnesses over the past couple of years were the main events that increased the CPRI for Johnson County. Further detail of the events that affected the CPRI can be found on page 3.218 – 3.219.
Leavenworth County
Table 3.136. Leavenworth County CPRI: Major Disease Outbreak
Hazard Type Probability Magnitude Warning
Time Duration CPRI Planning
Significance
Leavenworth County Major Disease Outbreak 2 4 2 4 2.80 Moderate

3.224
Wyandotte County
Table 3.137. Wyandotte County CPRI: Major Disease Outbreak
Hazard Type Probability Magnitude Warning
Time Duration CPRI Planning
Significance
Wyandotte County Major Disease Outbreak 2 3 1 4 2.35 Moderate
Consequence (Impact) Analysis
The information in Table 3.138 provides the Impact Analysis of Potential for Detrimental Impacts of Hazards done for accreditation with the Emergency Management Accreditation Program (EMAP)
Table 3.138. EMAP Impact Analysis: Major Disease Outbreak
Subject Ranking Impacts/Major Disease Outbreak
Health and Safety of Persons in the Area of the Incident
Severe Impact over a widespread area could be severe depending on type of outbreak and whether it is a communicable disease. Casualties are dependent on warning systems, warning times and the availability of vaccines, antidotes, & medical svc.
Responders Severe Impact to responders could be severe, especially if they reside in the area and or their type of exposure during response. With proper precautions and safety nets in place the impact is lessened.
Continuity of Operations Minimal Continuity of Operations will be greatly dependent on availability of healthy individuals. COOP is not expected to be exercised (minimal).
Property, Facilities, and Infrastructure
Minimal Access to facilities and infrastructure could be affected until decontamination is completed
Delivery of Services Minimal Delivery of services could be affected if there are road blocks or mass hysteria of any level (minimal).
Environment Severe Impact could be severe for the immediate impacted area depending on the source of the outbreak. Impact could have far-reaching implications if disease is transferable between humans and animals or to wildlife.
Economic Conditions Severe Impacts to the economy could be severe if the disease is communicable. Loss of tourism, revenue, and business as usual will greatly affect the local economy and the state as a whole.
Public Confidence in Jurisdiction’s Governance
Severe Response and recovery will be in question if not timely and effective. Availability of medical supplies, vaccines, and treatments will come into question (minimal to severe).

3.225
3.2.16 Radiological
Calculated Priority Risk Index Planning Significance
2.10 Moderate
Description
A Radiological event in the planning area could happen as a result of transportation accidents, hazardous materials, industrial and medical uses and lost or stolen sources to which the public could be exposed, or contaminated, with a high level of radiation. Radiological accidents could cause injury or death, contaminate property and valuable environmental resources, as well as disrupt the functioning of communities and their economies. There have been no reported events of this type in the planning area, and all information contained in this hazard profile remains valid and current for the 2013 update.
The planning area has one commercial plant that they plan for: The Wolf Creek Nuclear Power Plant in Coffey County. Because Region L is not located in the 10-mile, and only slightly in the 50-mile emergency planning zones (EPZ) for this plant (see figure 3.73a), this mitigation plan will not address it as a hazard to the planning area. However, the nuclear fuel rods in transit, along with diagnostic and therapy medical radioactive materials used in hospitals, and other materials, including pharmaceuticals and industrial sources can be an issue for the planning area.

3.226
Figure 3.73a. 50 mile Wolf Creek IPZ, which includes a small portion of Johnson County
Another radiological concern in the region is Radon. Radon is a radioactive, colorless, odorless, tasteless noble gas that occurs naturally as an indirect decay product of uranium or thorium. Radon is one of the densest substances that remains a gas under normal conditions. It is also the only gas under normal conditions that only has radioactive isotopes. Because it is gaseous it is easily inhaled and is responsible for the majority of the public exposure to ionizing radiation. Because of its density, radon can accumulate to higher than normal concentrations in buildings, especially in low areas such as basements and crawls spaces. It is considered a health hazard and epidemiological studies have shown a clear link between radon and the incidence of lung cancer. During the 2008 legislative session in Kansas, a law was passed, K.S.A. 58-3078a, which requires information about radon and a recommendation to test for radon be provided to all homebuyers on their residential real estate contract.
Location
Region L is vulnerable to transportation accidents, hazardous material, industrial, and medical uses that have radiation as a component. Johnson County has a higher percentage of hospitals and medical centers that could facilitate a higher incidence of exposure should an accident or thefts occur. All three counties in the planning area have a highly visible transportation node
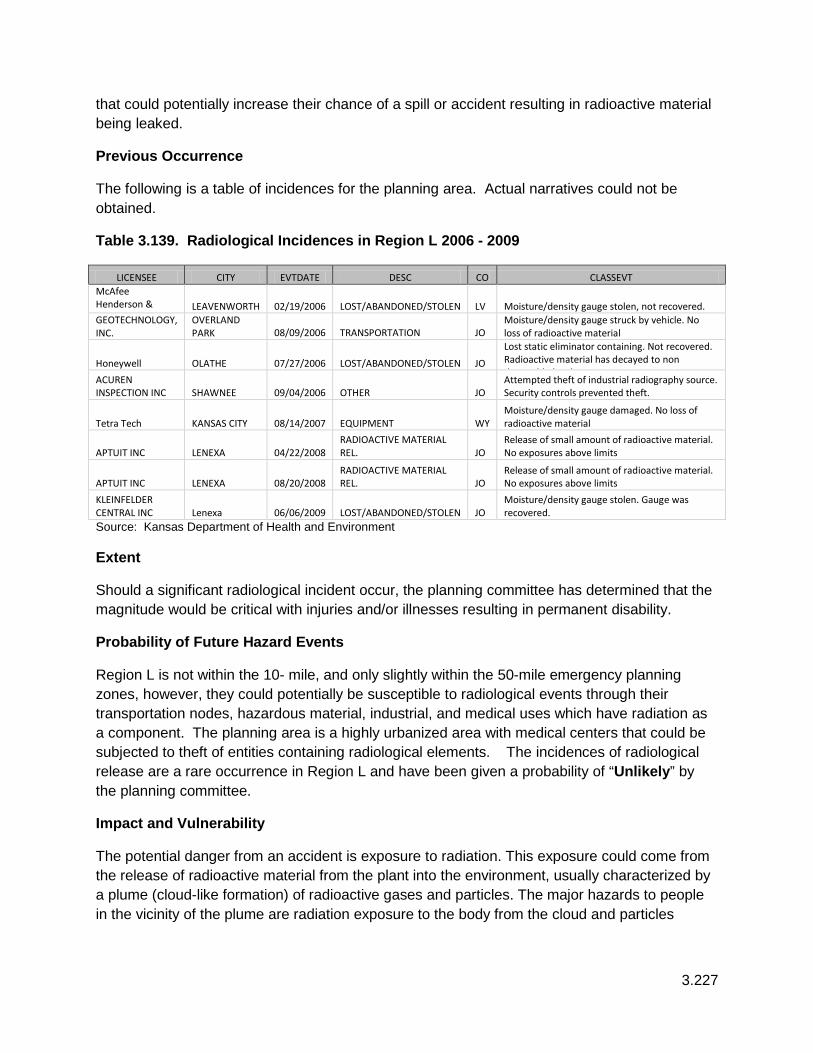
3.227
that could potentially increase their chance of a spill or accident resulting in radioactive material being leaked.
Previous Occurrence
The following is a table of incidences for the planning area. Actual narratives could not be obtained.
Table 3.139. Radiological Incidences in Region L 2006 - 2009
LICENSEE CITY EVTDATE DESC CO CLASSEVT McAfee Henderson &
LEAVENWORTH 02/19/2006 LOST/ABANDONED/STOLEN LV Moisture/density gauge stolen, not recovered.
GEOTECHNOLOGY, INC.
OVERLAND PARK 08/09/2006 TRANSPORTATION JO
Moisture/density gauge struck by vehicle. No loss of radioactive material
Honeywell OLATHE 07/27/2006 LOST/ABANDONED/STOLEN JO
Lost static eliminator containing. Not recovered. Radioactive material has decayed to non d t t bl l l
ACUREN INSPECTION INC SHAWNEE 09/04/2006 OTHER JO
Attempted theft of industrial radiography source. Security controls prevented theft.
Tetra Tech KANSAS CITY 08/14/2007 EQUIPMENT WY Moisture/density gauge damaged. No loss of radioactive material
APTUIT INC LENEXA 04/22/2008 RADIOACTIVE MATERIAL REL. JO
Release of small amount of radioactive material. No exposures above limits
APTUIT INC LENEXA 08/20/2008 RADIOACTIVE MATERIAL REL. JO
Release of small amount of radioactive material. No exposures above limits
KLEINFELDER CENTRAL INC Lenexa 06/06/2009 LOST/ABANDONED/STOLEN JO
Moisture/density gauge stolen. Gauge was recovered.
Source: Kansas Department of Health and Environment
Extent
Should a significant radiological incident occur, the planning committee has determined that the magnitude would be critical with injuries and/or illnesses resulting in permanent disability.
Probability of Future Hazard Events
Region L is not within the 10- mile, and only slightly within the 50-mile emergency planning zones, however, they could potentially be susceptible to radiological events through their transportation nodes, hazardous material, industrial, and medical uses which have radiation as a component. The planning area is a highly urbanized area with medical centers that could be subjected to theft of entities containing radiological elements. The incidences of radiological release are a rare occurrence in Region L and have been given a probability of “Unlikely” by the planning committee.
Impact and Vulnerability
The potential danger from an accident is exposure to radiation. This exposure could come from the release of radioactive material from the plant into the environment, usually characterized by a plume (cloud-like formation) of radioactive gases and particles. The major hazards to people in the vicinity of the plume are radiation exposure to the body from the cloud and particles

3.228
deposited on the ground, inhalation of radioactive materials and ingestion of radioactive materials.
The planning area is not within the 10 mile and only slightly within the 50 mile emergency planning zone of Wolf Creek nuclear plant, however the transportation nodes increase the vulnerability to the Region. A truck transporting fuel rods, or medical equipment that is involved in an accident can put the entire population at risk. Region L is also a very urbanized area with multiple hospitals, elderly care and hospice institutions. An accident, spill or theft in one of these places that handle radioactive material on a daily basis could be catastrophic.
Summary
The threat of a radiological incident to the region is not through nuclear power plants, but through everyday uses within the workplace. Hazardous materials, industrial, and medical uses that have radiological elements are the threat to the planning area. The incidents would tend to be human caused whether through human error, theft, or neglect.
Local Mitigation Concerns
• Region L is a highly urbanized area that has a dense population and transportation nodes that are thoroughfares for the movement of goods and materials to the continental United States. The make-up of these goods and materials include the movement of radiological elements at any given time through the planning area. Of high concern to the planning committee is a potential accident on their nodes that could lead to the release of radiological materials putting the citizens, motorists, and tourist at risk of exposure.
• As the most urbanized and densely populated portion of the State of Kansas, Region L has a high medical footprint. The hospitals, Medical Centers, and nursing homes all utilize medical entities that contain radiological elements that could be subject to release or even theft.
• The planning area is not within the 10, and only slightly within the 50 mile emergency planning zone for a nuclear power plant incident. However, a concern is if the weather makes for conditions that could move a plume from Wolf Creek in its direction and thus endanger the population. While this is not an expected concern, it is notable for its potential.
Development in Hazard Prone Areas
Contaminated sites in urban environments are a concern as often the sewer system and other underground structures can act as conduits for the migration of non-soluble radionuclides in the subsurface. This should be a consideration for excavation near or down gradient from a known contaminated site.
During all lawful operations of radioactive materials, the licensee is responsible for ensuring that the area around the source material is cordoned off or shielding is used to prevent unnecessary

3.229
exposures. Inspections of practices and security measures are regularly conducted to ensure compliance and conformity to regulations in order to protect the public. The frequency of inspections can be adjusted in response to perceived risk. Public risk can be reduced by minimizing the duration of exposure, shielding the source material and maximizing the distance from the source.
Johnson County
Table 3.140. Johnson County CPRI: Radiological
Hazard Type Probability Magnitude Warning
Time Duration CPRI Planning
Significance
Johnson County Radiological 1 3 4 3 2,25 Moderate
Leavenworth County
Table 3.141. Leavenworth County CPRI: Radiological
Hazard Type Probability Magnitude Warning
Time Duration CPRI Planning
Significance
Leavenworth County Radiological 1 3 2 3 1.95 Low
Wyandotte County
Table 3.142. Wyandotte County CPRI: Radiological
Hazard Type Probability Magnitude Warning
Time Duration CPRI Planning
Significance
Wyandotte County Radiological 1 2 4 2 1.85 Low
Consequence (Impact) Analysis The information in Table 3.143 provides the Consequence Analysis of Potential for Detrimental Impacts of Hazards done for accreditation with the Emergency Management Accreditation Program (EMAP).
Table 3.143. Consequence (Impact) Analysis: Radiological
Subject Ranking Impacts/Radiological
Health and Safety of Persons in the Area of the Incident Severe
Impact expected to be severe for persons within the incident area. Protection capabilities and warning times will greatly affect the severity.

3.230
Responders Severe
Impact to responders could be severe if not trained and properly equipped. Responders that are properly trained and equipped will have a low to moderate impact.
Continuity of Operations Minimal to Severe
Temporary relocation could be necessary if government facilities are in close proximity to the incident area. This temporary relocation could become significant depending on clean-up (minimal to severe).
Property, Facilities, and Infrastructure Severe
Impact within the incident area could be severe to property, facilities, and infrastructure.
Delivery of Services Minimal to Severe Delivery of services could be affected within and around the affected area (minimal to severe).
Environment Severe
Localized impact within the incident area could be severe to native plants, wildlife and natural habitats. Clean up and remediation will be required.
Economic Conditions Minimal to Severe
Economic conditions could be adversely affected and dependent upon time and length of clean up and investigation (minimal to severe).
Public Confidence in Jurisdiction’s Governance Minimal to Severe
Impact will be dependent on whether or not the incident could have been avoided by government or non-government entities, clean-up and investigation times, and outcomes (minimal to severe).

3.231
3.2.17 Soil Erosion and Dust
Calculated Priority Risk Index Planning Significance
1.75 Low
Description
Soil erosion and dust are both ongoing problems for the planning area. Both can cause significant loss of valuable agricultural soils, damage crops, harm environmental resources and have adverse economic impacts. Soil erosion in the region is largely associated with periods of drought, when winds are able to move tremendous quantities of exposed dry soil (wind erosion), and flooding (stream bank erosion). Improper agricultural and grazing practices can also contribute to soil erosion.
The United States is losing soil 10 times faster than the natural replenishment rate, and related production losses cost the country about $37.6 billion each year. On average, wind erosion is responsible for about 40 percent of this loss and can increase markedly in drought years. Wind erosion physically removes the lighter, less dense soil constituents such as organic matter, clays and silts. Thus it removes the most fertile part of the soil and lowers soil productivity, which can result in lower crop yields or poorer grade pastures and increase economic costs.
Stream bank erosion, which can remove agricultural land and damage or destroy roads and bridges and utility lines, occurs each year, particularly in the spring when high runoff is most common. A large proportion of all eroded soil material ends up in rivers, streams and lakes, which makes waterways more prone to flooding and contamination and reduces water supply storage space.
Erosion increases the amount of dust carried by wind. Dust can also threaten agriculture and have economic impacts by reducing seedling survival and growth, increasing the susceptibility of plants to certain stressors, and damaging property and equipment (e.g., clogging machinery parts). It is also a threat to health and safety. It acts as an abrasive and air pollutant and carries about 20 human infectious disease organisms (including anthrax and tuberculosis). There is evidence that there is an association between dust and asthma. Some studies indicate that as much as 20 percent of the incidences of asthma are related to dust. Blowing dust can be severe enough to necessitate highway closures because of low visibility, which can cause vehicle accidents. The risk rating for dust or wind erosion is relatively low for the planning area.
Location
Soil Erosion and Dust is a concern for the planning area. During periods of drought and wind events, soil erosion and dust can aggravate allergies and asthma, deplete farmland of vital top soil, disperse cropland seeds, and cause revenue losses due to clogged machinery and crop loss. Soil Erosion also affects all the counties in the planning area, as they all border major rivers.

3.232
Figure 3.74. Locations of Excessive Erosion of Farmland, 1997
Source: Kansas Hazard Mitigation Plan, 2007
Legend Red: 5,000 acres of highly erodible land Yellow: 5,000 acres of non-highly erodible land with excessive erosion above the tolerable soil erosion rate. Previous Occurrences
No prior occurrences are on record for this region. Because the effects of soil erosion and dust are normally cumulative it is difficult to gauge when or if it has happened.
Extent
While soil erosion is not uncommon in the planning are, the extent of damages to people and property would be: Negligible. There have been no prior occurrences of a worthy note.
Probability of Future Events
There are no solid historical events that can give a good probability, which resulted in the planning committee rating this hazard as “Possible” within the next five years.

3.233
Impact and Vulnerability
There have not been any regional or state-wide studies to estimate the dollar value of top soil lost to soil erosion and dust. However, Table 3.144 shows the historical estimates for tons per acres soil lost annually for cultivated cropland, non-cultivated cropland, conservation Reserve Program (CRP) land and pastureland, for the State of Kansas.
Table 3.144. Kansas Average Wind Erosion in Tons/Acre/Year by Broad Cover/Use and Year
Broad Cover/Use 1982 1987 1992 1997 2002 2007 Cultivated Cropland 2.747 2.963 2.062 1.482 1.463 1.734 Noncultivated Cropland .907 .830 .887 .339 .413 .501 CRP Land n/a 10.478 .640 .328 .394 .860 Pastureland .009 .016 .022 .015 .019 .034
Source: 2007 National Resources Inventory, http://www.ks.nrcs.usda.gov/technical/ks_nri.html, dated April 22, 2010 Note: Estimated average annual wind erosion is tons per acre per year with margins of error.
The impact of this hazard on the Region would be difficult to detect to the time factor involved before noticeable differences in loss of soil were apparent. Wind erosion can cause crop loss, fertility loss, moisture loss and loss of valuable top soil. Blowing soil causes dirt clouds, drifting sand and hard feelings between neighbors. Blowing soil cuts off growing crops, covers fences, closes roads and gives rural and urban communities a bad perception of farmers.
Agricultural land, bridges, and roads are the most susceptible to soil erosion and dust. Flood waters are the main culprit to these commodities, as the water erodes the soil by washing it out. Dust is exacerbated during drought conditions and can cause havoc on agricultural fields and can potential be a health hazard for individuals suffering from pulmonary disease.
Local Mitigation Concerns
• The main mitigation concern for this hazard, in the planning area, is the structural integrity of the bridges and roads as soil erosion occurs. During periods of heavy rains, soil erosion can wash the ground anchor away from the support structure causing them to collapse. This, in turn, puts lives in danger along with property loss.
Development in Hazard Prone Areas
Buildings and infrastructure are generally not affected by dust. Buildings and infrastructure can be affected by soil erosion if the erosion creates an unstable building, bridge or infrastructure.

3.234
Johnson County
Table 3.145. Johnson County CPRI: Soil Erosion and Dust
Hazard Type Probability Magnitude Warning
Time Duration CPRI Planning
Significance
Johnson County Soil Erosion and Dust 2 1 1 4 1.75 Low
Leavenworth County
Table 3.146. Leavenworth County CPRI: Soil Erosion and Dust
Hazard Type Probability Magnitude Warning
Time Duration CPRI Planning
Significance
Leavenworth County Soil Erosion and Dust 2 1 1 4 1.75 Low
Wyandotte County
Table 3.147. Wyandotte County CPRI: Soil Erosion and Dust
Hazard Type Probability Magnitude Warning
Time Duration CPRI Planning
Significance
Wyandotte County Soil Erosion and Dust 2 1 1 4 1.75 Low
Consequence (Impact) Analysis Wind erosion can cause crop loss, fertility loss, moisture loss and loss of valuable top soil. Blowing soil causes dirt clouds, drifting sand and hard feelings between neighbors. Blowing soil cuts off growing crops, covers fences, closes roads and gives rural and urban communities a bad perception of farmers.
The information in Table 3.148 provides the Consequence Analysis of Potential for Detrimental Impacts of Hazards done for accreditation with the Emergency Management Accreditation Program (EMAP).
Table 3.148. EMAP Consequence Analysis: Soil Erosion and Dust
Subject Ranking Impacts/Soil Erosion and Dust Health and Safety of Persons in the Area of the Incident Minimal
Impact tends to be agricultural; however, dust can be a danger to susceptible individuals in the form of air pollutants (minimal).
Responders Minimal With proper preparedness and protection, impact to the responders is expected to be minimal.
Continuity of Operations Minimal Minimal expectation for utilization of the COOP. Property, Facilities, and Minimal to Impact to property, facilities, and infrastructure could be severe,
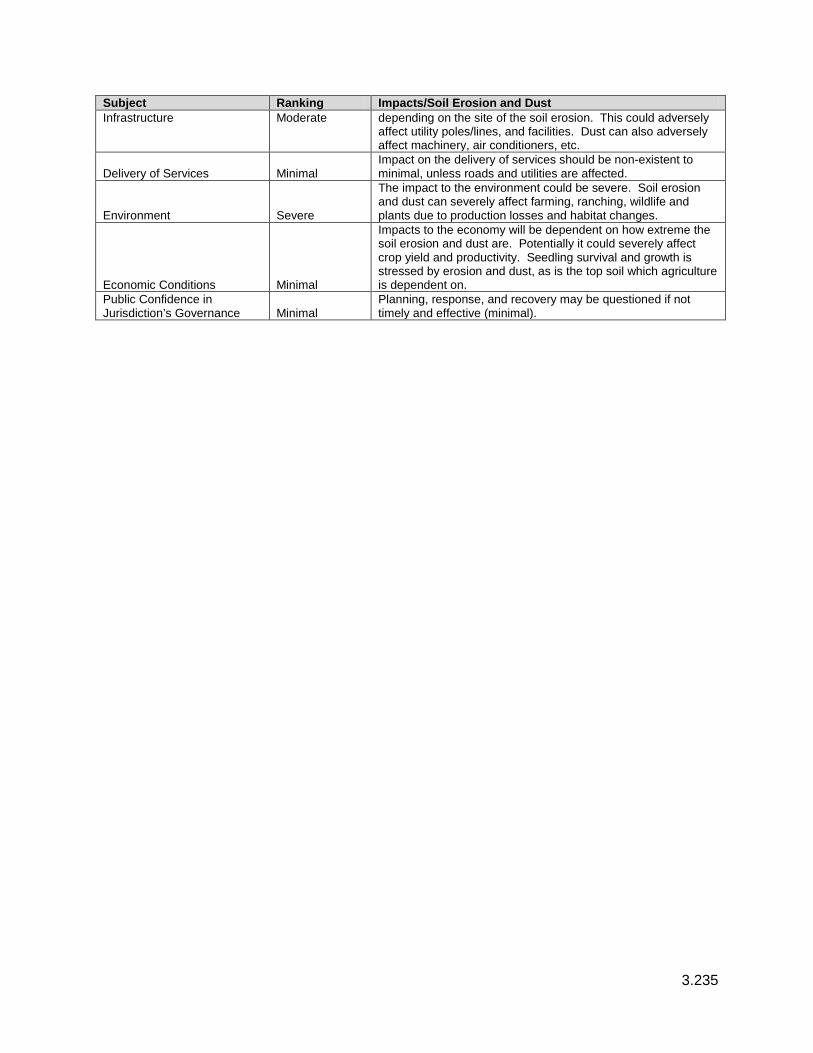
3.235
Subject Ranking Impacts/Soil Erosion and Dust Infrastructure Moderate depending on the site of the soil erosion. This could adversely
affect utility poles/lines, and facilities. Dust can also adversely affect machinery, air conditioners, etc.
Delivery of Services Minimal Impact on the delivery of services should be non-existent to minimal, unless roads and utilities are affected.
Environment Severe
The impact to the environment could be severe. Soil erosion and dust can severely affect farming, ranching, wildlife and plants due to production losses and habitat changes.
Economic Conditions Minimal
Impacts to the economy will be dependent on how extreme the soil erosion and dust are. Potentially it could severely affect crop yield and productivity. Seedling survival and growth is stressed by erosion and dust, as is the top soil which agriculture is dependent on.
Public Confidence in Jurisdiction’s Governance Minimal
Planning, response, and recovery may be questioned if not timely and effective (minimal).

3.236
3.2.18 Terrorism/Agro-terrorism
Calculated Priority Risk Index Planning Significance 2.65 Moderate
Description
The Federal Bureau of Investigation defines terrorism as “the unlawful use of force or violence against persons or property to intimidate or coerce a government, the civilian population, or any segment thereof, in furtherance of political or social objectives.” The threat of terrorism, both international and domestic, is ever present, and an attack is likely to occur when least expected.
The Southern Poverty Law Center reported that in 2012, there were three active hate groups in Kansas: one neo-Nazi group (National Socialist Movement in Lansing), one racist skinhead group (Midland Hammerskins in Wichita), and one anti-gay group (Westboro Baptist Church in Topeka). Other groups, such as the Animal Liberation Front (ALF), Earth Liberation Front (ELF), and People for the Ethical Treatment of Animal (PETA) have sympathizers in the state. Although no major terrorist acts have been attributed to any of these latter groups, their involvement in violent acts is meant to disrupt governmental functions and cannot be discounted.
Agro-terrorism consists of acts to intentionally contaminate, ruin, or otherwise make agricultural products unfit or dangerous for consumption or further use. Agriculture is an important industry in Kansas. The introduction of a biological agent into the population of 6.4 million cattle or the nearly 10 million acres of wheat would be financially devastating and would have a major impact on the food supply of the state and the nation. A major attack involving the nation’s food supply could be launched in a rural area that has little capacity to respond. Potential terrorists’ targets for livestock disease introduction would be concentration points, such as the state’s licensed feedlots livestock markets. Additionally, Kansas has over 120 agricultural crop-dusters, many of which are configured for chemical spraying.
Location
The planning area is susceptible to terrorism of any ideology due to the large population base, and the available transportation nodes. Terrorist tend to strike where large venues of people are likely to be, such as malls, Kansas Speedway, Sprint Center, and other entertainment venues. Densely populated areas also facilitate terrorist being able to blend in better so they can strike with as little warning as possible. The transportation corridor within the Region is attractive for their escape, should a terrorism campaign be successful. Another attraction for terrorist in the planning area is the Missouri and Kansas River, which could also aid in their initial campaign and their exit strategy.
Agro-terrorism is a concern across the state, as well as in Region L. All three counties have an agricultural footprint that could facilitate an agro-terrorism event that would affect many people.

3.237
Previous Occurrences
No previous terrorist or agro-terrorism events have been noted in the planning area. However, there are sympathies for terrorist groups.
• January 2009, according to the Kansas City Tribune, a chapter of the Muslim American Society (MAS-KC), held a rally in support of Hamas, a group that the United States has cited as being a terrorist group.
• 1989 at a Kansas City auditorium, a masked man described in Arabic the ‘oceans of blood’ spilled in Hamas’ armed attacks on Israeli soldiers and civilians, thanking two nonprofit organizations for being allies.
• May 2005, Daveed Gartenstein-Ross stated in an interview in The Weekly Standard that, “MAS is a U.S. front group for the Muslim Brotherhood, which was a claim supported by a Chicago Tribune story that ran in 2004. Their goal is to see sharia law as the law of the United States. In 2007 MAS’s ties to the Brotherhood were confirmed as reported by the Investigative Project on Terrorism.
Extent
While there have not been any terrorist events in the planning area, should a worse case scenario occur the planning committee has determined that extent could potentially be Catastrophic. In a hypothetical situation the event could result in multiple deaths, although it is unlikely to occur.
Probability of Future Events
Region L could potentially be attractive to a Terrorist Cell due to its central location in the United States, its large population base, and the transportation nodes. It is also an area that is full of historical and cultural buildings, with a military presence. Based on the three historical events, of which none were violent, the probability of this hazard affecting the planning area with the next 10 years is “Unlikely”.
Impact and Vulnerability
The impact to the planning area could potentially include all infrastructure, critical facilities, crops, humans and animals. The degree of impact would be directly related to the type of incident and the target. Potential losses could include cost of repair or replacement of damaged facilities, lost economic opportunities for businesses, loss of human life, injuries to persons, loss of food supplies, disruption of the food supply chain, and immediate damage to the surrounding environment. Secondary effects of infrastructure failure could include public safety hazards, spread of disease, increased morbidity and mortality among the local and distant populations, public panic and long-lasting damage to the environment. Terrorism events are rare occurrences and specific amounts of estimated losses for previous occurrences are not available due to the complexity and multiple variables associated with these types of hazards.

3.238
In some instances, information about these events is secure and unavailable to the public in order to maintain national security and prevent future attacks.
As discussed previously, it is difficult to quantify potential losses in terms of the jurisdictions most threatened by CBRNE (chemical, biological, radiological, nuclear, and high yield explosive) attack events due to the many variables and human element. Therefore, for the purposes of this plan, the loss estimates will take into account several hypothetical scenarios. Please note that these hypothetical scenarios are included to provide a sample methodology for local jurisdictions to estimate potential losses. The hypothetical scenarios include: a chemical attack, a biological attack, an improvised explosive device (IED) attack, and a radiological attack. For comparative purposes, these hypothetical attack scenarios will all be staged at the same venue, a college football stadium in the planning area during a home football game. The hypothetical stadium is situated on less than one square mile in an urban area and has a seating capacity of approximately 35,000 persons. Surface area and parking structures are located adjacent to the stadium.
Analysis of vulnerable populations is aided by a program developed by Johns Hopkins University in 2006 called Electronic Mass Casualty Assessment and `Planning Scenarios
(EMCAPS) http://www.hopkins-cepar.org/EMCAPS/EMCAPS.html which utilizes scenarios developed by the Department of Homeland Security.
****THE FOLLOWING HYPOTHETICAL SCENARIOS ARE FOR INSTRUCTIONAL AND ILLUSTRATIVE PURPOSES ONLY****
Chemical Attack – Mustard Gas
Scenario Overview: Mustard gas is released from a light aircraft onto the stadium during a home football game. The agent directly contaminates the stadium and the immediate surrounding area. This particular type of attack would cause harm to humans and could render portions of the stadium unusable for a short time period in order to allow for a costly clean-up. There might also be a fear by the public of long-term contamination of the stadium and subsequent boycott of games resulting in a loss of revenue and tourism dollars.
Assumptions: (1) The population density at the stadium on game day is high – approximately 93 percent of the seats, 33,250 are filled and an additional 5,000 persons remain outside the stadium in the adjacent parking areas. (2) Sulphur mustards are extremely toxic and may damage eyes, skin and respiratory tract. Death sometimes results from secondary respiratory infections. (3) The rate of “worried well” is equal to 9 times the number of infected cases.
Described Losses:
Severe Eye Injuries (1-2 hours) 28,688 persons
Severe Airway Injuries (1-2 hours) 28,688 persons
Severe Skin Injuries (2 hrs to days) 34,425 persons
Total “Worried Well” Cases (9 times the number of affected cases) 309,825 persons
Deaths 765 persons

3.239
Cost of Decontamination @ $12/person (assumes all persons with skin injuries will require decontamination and approximately 1/10 of the worried well will demand to be decontaminated) - total persons = 65,408
$ 784,896
Notes: Victims will require decontamination and both long and short term treatment. Services may need to be suspended at the area until all investigations are conducted.
Biological Attack – Pneumonic Plague
Scenario Overview: Canisters containing aerosolized pneumonic plague bacteria are opened in public bathrooms. Each release location will directly infect 110 people; hence, the number of release locations dictates the initial infected population. The secondary infection rate is used to calculate the total infected population. This particular weapon of mass destruction (WMD) attack method would not cause damages to buildings or other infrastructure, only to human populations.
Assumptions: (1) The population density at the stadium on game day is high. (2) The population density of the stadium city is high (5,572 persons / sq mile – assumes that the normal population is doubled on game day). (3) The number of dispersion devices is 30. Devices are assumed to be placed in crowded seating areas. (4) Pneumonic plague has a 1-15 percent mortality rate in treated cases and a 40-60 percent mortality rate in untreated cases. (5) The rate of “worried well” is equal to 9 times the number of infected cases.
Described Losses:
Initial Infected Populations 3,300 persons
Secondary Infected Population 6,623 persons
Total Plague Cases 9,923 persons
Total Deaths (Treated Cases 7%) 694 persons
Total “Worried Well” Cases (9 times the number of infected cases) 89,307 persons
Improvised Explosive Device Attack – ANFO
Scenario Overview: An Improvised Explosive Device (IED) utilizing an ammonium nitrate/fuel oil (ANFO) mixture is carried in a panel van to a parking area during a time when stadium patrons are leaving their cars and entering the stadium and detonated. Potential losses with this type of scenario include both human and structural assets.
Assumptions: (1) The population density in the parking lot during the beginning and ending of the games is high, at least 1 person /25 square feet. (2) The quantity of ANFO used is 4,000 lbs, similar to that used by Timothy McVeigh in the Oklahoma City bombing. (3) The Lethal Air Blast Range for such a vehicle is 200 feet according to the Bureau of Alcohol, Tobacco, Firearms and Explosives (BATF) Standards. (4) The Falling Glass Hazard distance is 2,750 feet according to BATF Explosive Standards.
Described Losses:

3.240
Total Dead 1,391 persons
Total Traumatic Injuries 2,438 persons
Total Urgent Care Injuries 11,935 persons
Injuries not Requiring Hospitalization 4,467 persons
Structures and Other Physical Assets (Damages would certainly occur to vehicles and depending on the proximity of other structures, damages would occur to the stadium complex itself. The exact amount of these damages is difficult to predict because of the large numbers of factors, including the type of structures nearby and the amount of insurance held by vehicle owners. )
Vehicles – Replacement cost for approximately 100 vehicles @ $15,000 per vehicle inside the 200 ft BATF described Lethal Air Blast range = $ 150,000 Repair / repainting cost for approximately 500 vehicles @ $ 4,000 per vehicle inside the BATF described Falling Glass Hazard = $2,000,000
Radiological Dispersion Device – Dirty Bomb Attack
Scenario Overview: An Improvised Explosive Device (IED) utilizing an ammonium nitrate/fuel oil (ANFO) mixture is carried in a panel van to a parking area during a time when stadium patrons are leaving their cars and entering the stadium and detonated. Potential losses with this type of scenario include both human and structural assets. The bomb also contains 2,700 Curies of Cesium-137 (Cs-137).
Assumptions: (1) The population density in the parking lot during the beginning and ending of the games is high, at least 1 person /25 square feet. (2) The quantity of ANFO used is 4,000 lbs, similar to that used by Timothy McVeigh in the Oklahoma City bombing. (3) The Lethal Air Blast Range for such a vehicle is 200 feet according to the Bureau of Alcohol, Tobacco, Firearms and Explosives (BATF) Standards. (4) The Falling Glass Hazard distance is 2,750 feet according to BATF Explosive Standards.
Described Losses:
Total Dead 1,391 persons
Total Traumatic Injuries 2,438 persons
Total Urgent Care Injuries 11,935 persons
Injuries not Requiring Hospitalization 4,467 persons
Radiological Poisoning Injuries that Need Aggressive Treatment
13
Radiological Poisoning Injuries that Need Non-Critical Treatment
440
Radiological Poisoning Injuries that could Self Medicate with Proper Public Information
62,378
Structures and Other Physical Assets (Damages would certainly occur to vehicles and depending on the proximity of other structures, damages would occur to the stadium complex itself. The exact amount of these damages is difficult to predict because of the large numbers of factors, including the type of structures nearby and the amount of insurance held by vehicle owners. )
Vehicles – Replacement cost for approximately 100 vehicles @ $15,000 per vehicle inside the 200 ft BATF described Lethal Air Blast range = $ 150,000 Repair / repainting cost for approximately 500 vehicles @ $ 4,000 per vehicle inside the BATF described Falling Glass Hazard = $2,000,000

3.241
The vulnerability of the planning area to a terrorism or agro-terrorism event is low. However, the planning significance is moderate in order to be better prepared should this man made hazard occur. Leavenworth, Johnson, and Wyandotte counties have thousands of small businesses, along with national and international corporations that, if interrupted by an event, could potentially cause significant economic loss. The loss of life because of the densely populated area would be catastrophic, and if the transportation nodes were targeted could result in more lives and economic loss as freight does not reach its intended destination. The resulting paranoia and fear after an attack could set the Region back, much as the country was set back after 911. Some of the interest in Region L that could be at risk of a terrorist attack, include:
• Dense Population
• Active Military installation at Fort Leavenworth
• Close vicinity to a nationwide telecommunication provider
• Venues for large amounts of people to congregate
While agri-terrorism is not as huge of a concern in the planning area as many areas of the state are, it is still a high visibility area due to its close proximity to large amounts of people and marketplaces.
A strategic nuclear, biological, or chemical attack on the United States could have the most devastating and far-reaching consequences. The use of these weapons against the United States is unlikely. Unfortunately, however, as long as such weapons exist, there is always a chance that they could be used. The potential for traditional war-related attacks, using conventional weapons, is a scenario that is more likely to occur, based on currently available information, however even attacks of that variety are rare. Attackers are likely to have either very specific targets such as Women’s clinics, or desire large publicity from the attacks.
It is expected that the likelihood of attack is directly related to population density or more likely to an event that is occurring or to a specific location of importance to the attacker. For example, a large venue event, such as a sporting event attended by tens of thousands of people might be considered a desirable target. Most large public venues occur in densely populated areas since those areas are able to provide the infrastructure support (hotels, eateries, etc) for large numbers of people.
Summary
Dense populations, quickly accessible transportation modes, large venues for people, i.e., concerts, active military installations, and an industrial and agricultural foothold are all entities that are attractive to terrorist. All of these entities are provided in Region L, making it vulnerable to a terrorist/agri-terrorist attack. While this is unlikely to occur, the planning significance is moderate in order to prepare for an event in case it should happen.

3.242
Local Mitigation Concerns
• Because the Region is bordered by the Missouri River and Kansas River, the concern of waterway access for terrorist is greater. These are also major sources of the water supply for agriculture and drinking water and should these rivers be disrupted due to a chemical release the entire region could potentially be at risk to sickness, death, or disruption. These rivers also provide electricity to the Region and should a terrorist take out the plants it could throw the region into economic, sustainment, and personal havoc.
• The location of the region in the United States is of concern. To hit the middle of the United States would be a bold move by any terrorist, but it would make the point that no one or place is safe. While this is a difficult concept to mitigate, extra vigilance could help stop any attack.
• Leavenworth County is rated in the top 10 counties in Kansas for the number of farms. Agricultural terrorism is a concern, not only for the economy, but also for the lives that depend on the agricultural product. Should terrorist use chemicals on the crops and they make it to tables, loss of life could be huge. Tainting the livestock feedlots could also cause a severe disruption in the food chain. By hitting Region L with agricultural terrorism, terrorist could access a lot of people with half the work. This is a big concern.
• Of concern for Region L is the new Burlington Northern and Santa Fe Intermodel that introduces risk for terrorism.
Development in Hazard Prone Areas
As more and more large public events are held in Region L, more potential may exist for these venues to become targets of attack. With human-caused hazards such as this that can have multiple variables involved, increases in development are not necessarily always factors in determining risk, although the physical cost of the event may increase with the increased or newly developed areas.
Johnson County
Table 3.149. Johnson County CPRI: Terrorism/Agro-terrorism
Hazard Type Probability Magnitude Warning
Time Duration CPRI Planning
Significance
Johnson County Terrorism/Agro-terrorism 1 4 4 4 2.65 Moderate

3.243
Leavenworth County
Table 3.150. Leavenworth County CPRI: Terrorism/Agro-terrorism
Hazard Type Probability Magnitude Warning
Time Duration CPRI Planning
Significance
Leavenworth County Terrorism/Agro-terrorism 1 4 4 4 2.65 Moderate Wyandotte County
Table 3.151. Wyandotte County CPRI: Terrorism/Agro-terrorism
Hazard Type Probability Magnitude Warning
Time Duration CPRI Planning
Significance
Wyandotte County Terrorism/Agro-terrorism 1 4 4 4 2.65 Moderate
Consequence (Impact) Analysis
Table 3.152. EMAP Impact Analysis: Terrorism/ Agri-terrorism
Subject Ranking Impacts/Terrorism/Agri-Terrorism
Health and Safety of Persons in the Area of the Incident
Severe Impact could be severe for persons in the incident area.
Responders Minimal to Severe Impact to responders could be severe if not trained and properly equipped. Responders that are properly trained and equipped will have a low to moderate impact.
Continuity of Operations Minimal to Severe Depending on damage to facilities/personnel in the incident area, re-location may be necessary and lines of succession execution (minimal to severe).
Property, Facilities, and Infrastructure
Severe Impact within the incident area could be severe for explosion, moderate to low for Hazmat.
Delivery of Services Minimal to Severe Delivery of services could be affected within and around the affected area especially if communications, road and railways, and facilities incur damage (minimal to severe).
Environment Minimal to Severe Localized impact within the incident area could be severe depending on the type of human caused incident.
Economic Conditions Minimal to Severe Economic conditions could be adversely affected and dependent upon time and length of clean up and investigation (minimal to severe).
Public Confidence in Jurisdiction’s Governance
Minimal to Severe Impact will be dependent on whether or not the incident could have been avoided by government or non-government entities, clean-up and investigation times, and outcomes. (minimal to severe)

3.244
3.2.19 Tornado
Calculated Priority Risk Index Planning Significance
3.70 High
Description
The National Weather Service defines a tornado as “a violently rotating column of air extending from a thunderstorm to the ground.” Tornadoes are the most violent of all atmospheric storms and are capable of tremendous destruction. Wind speeds can exceed 250 mph, and damage paths can be more than one mile wide and 50 miles long. In an average year, more than 900 tornadoes are reported in the United States, resulting in approximately 80 deaths and more than 1,500 injuries. High winds not associated with tornadoes are profiled separately in this document in Section 3.2.21 Windstorm.
Although tornadoes have been documented on every continent, they occur most frequently in the United States east of the Rocky Mountains. Region L is situated in an area that is generally known as “Tornado Alley.” Climatologically conditions are such that warm and cold air masses meet in the center of the country to create conditions of great instability and fast-moving air at high pressure that can ultimately result in the formation of tornado funnels.
Most tornadoes and tornado-related deaths and injuries occur during the months of April, May, and June. However, tornadoes have struck in every month. Similarly, while most tornadoes occur between 3:00 and 9:00 p.m., a tornado can strike at any time.
Location
Tornadoes can happen anywhere in the planning area. Figure 3.75 shows the tornado activity in the United States. Region L shows 5 – 10 recorded EF3 – EF5 tornadoes between the years 1950 and 2006.

3.245
Figure 3.75. Tornado Activity in the United States
Source: FEMA 320, Taking Shelter from the Storm, 3rd edition
Figure 3.76 shows the Wind Zones in the United States, with Region L being in Zone IV (250 mph).

3.246
Figure 3.76. Wind Zones in the United States
Previous Occurrences
There have been no tornadoes of a catastrophic nature in the planning area since the last plan. However, there have been several strong systems that have spawned funnel clouds and EF0 and EF1 tornadoes, resulting in property damage.
• June 2008 - Brief EF0 tornado touchdown on open country near 166th and Kansas Avenue at 1905CST. No damage reported.
• September 2008 - Several small severe thunderstorms, spawned several brief tornadoes over parts of east central Kansas, during the late afternoon and early evening hours of Friday, September 12, 2008. Most of the tornadoes were observed in open country and caused no damage. However, one did cause some minor house damage near Desoto Kansas. All of the tornadoes were classified as EF0. Heavy rains also caused flash flooding in Leavenworth county.
• April 2009 - An Ef1 tornado touched down at 1735 CST near the intersection of 238th Street and Loring Street. The tornado crossed Interstate 70, and then remained nearly parallel to the Interstate, before lifting at 1750 CST, near the intersection of Metro Avenue and 190th Street. Two homes sustained major damage and several barns were destroyed. Numerous trees were uprooted and several outbuildings were damaged.

3.247
• May 2012 – two tornadoes reported in Olathe, KS. This system brought thunderstorms, heavy rain, and hail to the area.
Extent
Tornadoes are classified according to the EF- Scale (the original F – Scale was developed by Dr. Theodore Fujita, a renowned severe storm researcher). The Enhanced F- Scale (see Table 3.153) attempts to rank tornadoes according to wind speed based on the damage caused. This update to the original F scale was implemented in the U.S. on February 1, 2007.
Table 3.153. Enhanced Fujita Scale with Potential Damage
Enhanced Fujita Scale
Scale Wind Speed (MPH)
Relative Frequency
Potential Damage
EF0 65 – 85 53.5% Light. Peels surface off some roofs; some damage to gutters or siding; branches broken off trees; shallow-rooted trees pushed over. Confirmed tornadoes with no reported damage (i.e. those that remain in open fields) are always rated EF0).
EF1 86 – 110 31.6% Moderate. Roofs severely stripped; mobile homes overturned or badly damaged; loss of exterior doors; windows and other glass broken.
EF2 111 – 135 10.7% Considerable. Roofs torn off well constructed houses; foundations of frame homes shifted; mobile homes complete destroyed; large trees snapped or uprooted; light object missiles generated; cars lifted off ground.
EF3 136 – 165 3.4% Severe. Entire stores of well-constructed houses destroyed; severe damage to large buildings such as shopping malls; trains overturned; trees debarked; heavy cars lifted off the ground and thrown; structures with weak foundations blown away some distance.
EF4 166 – 200 0.7% Devastating. Well-constructed houses and whole frame houses completely leveled; cars thrown and small missiles generated.
EF5 >200 <0.1% Explosive. Strong frame houses leveled off foundations and swept away; automobile-sized missiles fly through the air in excess of 300 ft.; steel reinforced concrete structure badly damaged; high rise buildings have significant structural deformation; incredible phenomena will occur.
Source: NOAA Storm Prediction Center
In the past 12 years, Johnson County has experienced 9 tornado events. These have all been rated on the Enhanced Fujita Scale as EFO’s.
In the past 12 years, 2000 – 2012, Leavenworth County has experienced 10 tornado events. Five of these have been rated as EF0, four have been rated as EF1, and one event on May 5,

3.248
2003 was rated as an EF2. Total damages to property were reported as $7.023 million, with 2 injuries during the EF2 event.
Between the years 2000 and 2012, Wyandotte County had a total of 3 tornado events. Two were rated as EF0s, and one on 4 May 2002 was rated an EF4. This tornado caused $15.5 million in property damage and resulted in 2 deaths and 30 injuries.
Because it was determined that Region L is in Zone IV due to potential wind speeds, and due to historic events, the planning committee determined that the planning area could experience an EF5 tornado. The magnitude of a tornado this size would be catastrophic. It could result in multiple deaths.
Probability of Future Events
All of Kansas is susceptible to tornadoes, and Region L is no exception. While there have not been any tornadoes greater than an EF1 since the last plan, the probability remains “Highly Likely” that an event of any size will occur within the next three years.
• Johnson County has had 9 tornado events within the last 12 years, resulting in a 75% chance of this occurring in a given year.
• Leavenworth County has had 10 tornado events within the last 12 years, resulting in an 83% chance of a tornado occurring in any given year.
• Wyandotte County has had 3 tornadoes within the last 12 years, resulting in a 25% chance of the county having another tornado within the year.
Impact and Vulnerability
When Figures 3.75 and 3.76 above are compared, it is apparent that Region L is in a high tornado activity area. Region L resides in Zone IV, which is the highest wind zone there is, and is a good indicator of the potential for tornadoes.
Table 3.154 shows the incidence of tornadoes and statistics in the Region from 1952 – 2011.
Table 3.154. Tornado Statistics for the Planning Area, 1952 – 2011
County Tornadoes Fatalities Injuries Longest Path Widest Path Johnson 38 44 224 69 miles 440 yards Leavenworth 32 2 63 66 miles 880 yards Wyandotte 10 2 50 26 miles 500 yards Source: Tornado Project, http://www.tornadoproject.com/
Insured Crop Loss Data
According to the USDA Risk Management Agency, insured crop losses for Region L as a result of tornado damage for the ten year period of 2002-2011 totaled $0.00 as shown in Table 3.155.
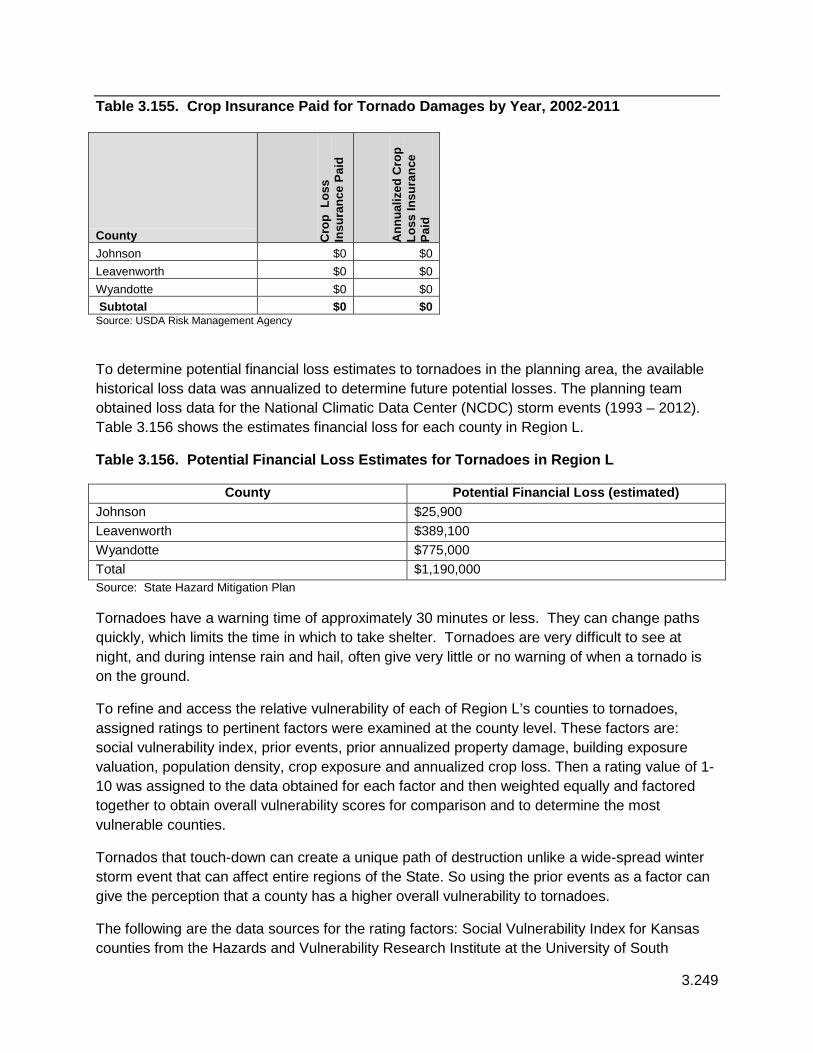
3.249
Table 3.155. Crop Insurance Paid for Tornado Damages by Year, 2002-2011
County Cro
p L
oss
Insu
ranc
e Pa
id
Ann
ualiz
ed C
rop
Lo
ss In
sura
nce
Paid
Johnson $0 $0 Leavenworth $0 $0 Wyandotte $0 $0 Subtotal $0 $0 Source: USDA Risk Management Agency
To determine potential financial loss estimates to tornadoes in the planning area, the available historical loss data was annualized to determine future potential losses. The planning team obtained loss data for the National Climatic Data Center (NCDC) storm events (1993 – 2012). Table 3.156 shows the estimates financial loss for each county in Region L.
Table 3.156. Potential Financial Loss Estimates for Tornadoes in Region L
County Potential Financial Loss (estimated) Johnson $25,900 Leavenworth $389,100 Wyandotte $775,000 Total $1,190,000 Source: State Hazard Mitigation Plan
Tornadoes have a warning time of approximately 30 minutes or less. They can change paths quickly, which limits the time in which to take shelter. Tornadoes are very difficult to see at night, and during intense rain and hail, often give very little or no warning of when a tornado is on the ground.
To refine and access the relative vulnerability of each of Region L’s counties to tornadoes, assigned ratings to pertinent factors were examined at the county level. These factors are: social vulnerability index, prior events, prior annualized property damage, building exposure valuation, population density, crop exposure and annualized crop loss. Then a rating value of 1-10 was assigned to the data obtained for each factor and then weighted equally and factored together to obtain overall vulnerability scores for comparison and to determine the most vulnerable counties.
Tornados that touch-down can create a unique path of destruction unlike a wide-spread winter storm event that can affect entire regions of the State. So using the prior events as a factor can give the perception that a county has a higher overall vulnerability to tornadoes.
The following are the data sources for the rating factors: Social Vulnerability Index for Kansas counties from the Hazards and Vulnerability Research Institute at the University of South

3.250
Carolina, National Climatic Data Center (NCDC) storm events (2006 – 2012), U.S. Census Bureau (2010), USDA’s Census of Agriculture (2007) and USDA Risk Management Agency
(2002 – 2011). It was determined that for tornado, historical events and property damages are needed back to 1993 to adequately describe the tornado hazard in the planning area.
Table 3.157 below provides the factor’s amount per county that are considered for tornado vulnerability.

3.251
Table 3.157. Vulnerability of Region L Counties Factor Amounts for Tornadoes
County SoVI
Rat
ing
(1-5
)
Prio
r Eve
nts
1993
-201
2
Prop
erty
D
amag
es
Ann
ualiz
ed
Prop
erty
Dam
age
Tota
l Bui
ldin
g Ex
posu
re ($
000)
Popu
latio
n D
ensi
ty
Cro
p Ex
posu
re
Cro
p L
oss
Insu
ranc
e Pa
id
Ann
ualiz
ed C
rop
Lo
ss In
sura
nce
Paid
Mitigation Planning Region L Johnson 1 8 $518,000 $25,900 $43,871,468 1,149.60 $29,472,000 $0 $0 Leavenworth 1 15 $7,782,000 $389,100 $4,877,783 164.7 $20,983,000 $0 $0 Wyandotte 3 3 $15,500,000 $775,000 $12,066,666 1,039.00 $0 $0 $0 Total
26 $23,800,000 $1,190,000 $60,815,917
$50,455,000 $0 $0
Note: The Census of Agriculture did not publish crop exposure in Wyandotte County to avoid disclosure of individual operations.

3.252
The following are the 1 – 10 ranges for the tornado vulnerability factor ratings. The Social Vulnerability Index is in a range of 1- 5. To give Social Vulnerability Index the same weight as the other factors, the numbers were multiplied by two.
Table 3.158. Ranges for Tornado Vulnerability Factor Ratings
Rat
ings
Soci
al
Vuln
erab
ility
Prio
r Eve
nts
Ann
ualiz
ed
Prop
erty
D
amag
e
Bui
ldin
g Ex
posu
re
Valu
atio
n
Popu
latio
n D
ensi
ty *
Cro
p Ex
posu
re
Ann
ualiz
ed
Cro
p Lo
ss
Insu
ranc
e Pa
id
1 3 - 7 $500 -
$500,000 $117,421 - $4,492,825
1.6 - 116.3 0 - $18,548,500 $0 - $1,000
2 1 8 - 12 $500,001 - $1,000,000
$4,492,826 - $8,868,229
116.4 - 231.1
$18,548,501 - $32,126,000 $1,001 - $2,000
3 13 - 17 $1,000,001 -
$1,300,000 $8,868,230 - $13,243,634
231.2 - 345.9
$32,126,001 - $45,703,500 $2,001 - $3,000
4 2 18 - 22 $1,300,001 -
$2,000,000 $13,243,635 -
$17,619,039 346 - 460.7
$45,703,501 - $59,281,000 $3,001 - $4,000
5 23 - 27 $2,000,001 -
$3,000,000 $17,619,040 -
$21,994,444 460.8 -
575.5 $59,281,001 -
$72,858,500 $4,0001- $5,000
6 3 28 - 32 $3,000,001 -
$4,000,000 $21,994,445 -
$26,369,848 575.6 -
690.3 $72,858,501 -
$86,436,000 $5,001 - $6,000
7 33 - 37 $4,000,001 -
$7,000,000 $26,369,849 -
$30,745,253 690.4 -
805.1 $86,436,001 - $100,013,500 $6,001 - $7,000
8 4 38 - 42 $8,000,001 - $11,000,000
$30,745,254 - $35,120,658
805.2 - 919.9
$100,031,501 - $113,591,000 $7,001 - $8,000
9 43 - 47 $11,000,001 -
$13,000,000 $35,120,659 -
$39,496,062 920-
1,034.7 $113,591,001 -
$127,168,500 $8,001 - $9,000
10 5 48 - 54 Above
$13,000,001 $39,496,063 -
$43,871,468 1,034.8 -
1,149.6 $127,168,501 -
$140,746,000 $9,001 and up Source: State Hazard Mitigation Plan
Table 3.159 provides the calculated ranges applied to determine the Medium, Medium-High and High vulnerable counties and Table 3.160 provides the seven rating values assigned that were considered in determining overall vulnerability to tornadoes. The entire Region is vulnerable to tornadoes so the overall ranges started with Medium and goes higher.
Table 3.159. Ranges for Overall tornado Vulnerability
Ranges Medium Medium-High High 9 - 19 20 – 29 30 - 40
Source: State Hazard Mitigation Plan

3.253
Table 3.160. Vulnerability of Region L Counties to Tornadoes
C o u n t y SoVI
Con
vert
ed
Rat
ing
Prio
r Eve
nt
Rat
ing
Ann
ualiz
ed
Prop
erty
Dam
age
Rat
ing
Bld
g Ex
posu
re
Valu
atio
n R
atin
g Po
pula
tion
Den
sity
Rat
ing
Cro
p Ex
posu
re
Rat
ing
Ann
ualiz
ed C
rop
Insu
ranc
e R
atin
g O
vera
ll Vu
lner
abili
ty
Rat
ing
Torn
ado
Vuln
erab
ility
M i t i g a t i o n P l a n n i n g R e g i o n L J o h n s o n 2 2 1 10 1 0 2 1 2 8 Medium-High Leavenworth 2 3 1 2 2 2 1 1 3 M e d i u m Wyandotte 6 1 2 3 1 0 1 1 2 4 Medium-High
Source: State Hazard Mitigation Plan
Table 3.161 lists the top 10 vulnerable counties in Kansas relative to each other concerning tornadoes. The one EF5 destructive tornado in Greensburg, Kiowa County was deemed a statistical outlier and was not included in this analysis. Otherwise, Kiowa County would be the highest rated county.
Table 3.161. Top 10 Vulnerable Counties in Kansas for Tornadoes (yellow highlight represents county in Region L).
Mitigation Planning Region County
Overall Vulnerability Rating
Tornado Vulnerability
G Sedgwick 34 High E Barton 32 High B Rush 30 Medium-High G Harper 29 Medium-High A Sherman 28 Medium-High E Stafford 28 Medium-High L Johnson 28 Medium-High A Sheridan 27 Medium-High B Rooks 27 Medium-High F Republic 27 Medium-High
Source: State Hazard Mitigation Plan
Mobile Home Vulnerability
Of the more than 560 people killed in the U.S between 2001 and 2010 by tornadoes, 51 percent were in mobile homes, according to the National Oceanic and Atmospheric Administration. According to the 2012 Kansas Severe Weather Awareness Week packet, people living in mobile homes are killed because of tornadoes at a rate 20 times higher than people living in permanent homes. Only 33 percent of those who died were in permanent structures, and 16 percent were outside a home.
Yet mobile homes make up only about 7 percent of the nation's housing. They represent about 5.2 percent of homes in Kansas, with 65,184 units according to the U.S. Census Bureau.

3.254
Table 3.162 provides the number of mobile home units per county according to the U.S. Census Bureau American Community Survey 2005 – 2009.
Table 3.162. Number of Mobile Home Units per County
County Number of Mobile Homes Johnson 1,392 Leavenworth 873 Wyandotte 1,676 Total 3,941 Source: State Hazard Mitigation Plan
Summary
Johnson, Leavenworth, and Wyandotte Counties are all vulnerable to tornado activity. Johnson County has had the most tornadoes in the Region, with a total of 38 reported, and 244 fatalities in the last 60 years. Wyandotte County has had the least with 10 reported tornado events. The vulnerability of this Region is enhanced due to its dense population, housing, and business industries. Due to the density of the population and building base in the region, if an EF1 tornado hits the area it can do severe damage.
Local Mitigation Concerns
• A big concern of a tornado in any region is the potential loss of life and destruction of property. Region L is a densely population area, with housing and buildings in close proximity to each other. Even an EF0 tornado has the ability to inflict damages when it is spawned in an urban area.
• Region L has a high industrial and business footprint, nationally and internationally. Many of these buildings are predominantly windows, which during a tornado event can inflict damaging personal injury to people inside the building and outside of the building. Should a tornado hit the business area of any of these counties the damage to humans could be catastrophic due to glass and flying debris.
• The Region recognizes that poor resiliency in existing buildings, particularly residential, are an issue. Training and Education in structural resiliency for Code Enforcers is an essential component for ensuring new construction is built to sustain damages.
Development in Hazard Prone Areas
New development anywhere in the planning area will be susceptible to tornado impacts. New manufactured housing development will be most susceptible to damage, particularly if not anchored properly. The extent of new manufactured housing development is not known. The inclusion of residential safe rooms into new construction is an area requiring further consideration in order to protect the populace, as well as community and school safe rooms. The Boy Scouts of America Camp Naish, and the DeSoto school district both benefited from

3.255
their prior mitigation plan participation by having safe rooms built with funding through the HMGP program.
Johnson County
Table 3.163. Johnson County CPRI: Tornado
Hazard Type Probability Magnitude Warning
Time Duration CPRI Planning
Significance
Johnson County Tornado 4 4 4 1 3.70 High
• The hazard of Tornado for Johnson County went from a 2.80 planning significance to a 3.70 planning significance during this plan. This is attributed to the fact that the last plan indicated that the probability was 49% that this event would happen in any given year, however the CPRI was calculated with a less than 33% chance, or Likely to occur. This plan corrects this to reflect the true probability based on historical data.
Leavenworth County
Table 3.164. Leavenworth County CPRI: Tornado
Hazard Type Probability Magnitude Warning
Time Duration CPRI Planning
Significance
Leavenworth County Tornado 4 3 4 1 3.40 High
Wyandotte County
Table 3.165. Wyandotte County CPRI: Tornado
Hazard Type Probability Magnitude Warning
Time Duration CPRI Planning
Significance
Wyandotte County Tornado 2 4 4 1 2.80 Moderate
Consequence (Impact) Analysis The information in Table 3.166 provides the Consequence Analysis of Potential for Detrimental Impacts of Hazards done for accreditation with the Emergency Management Accreditation Program (EMAP).
Table 3.166. EMAP Consequence Analysis: Tornado
Subject Ranking Impacts/Tornado Health and Safety of Persons in the Area of the Incident Severe
Impact of the immediate area could be severe depending on whether individuals were able to seek shelter and get

3.256
out of the trajectory of the tornado. Casualties are dependent on warning systems and warning times.
Responders Minimal Impact to responders is expected to be minimal unless responders live within the affected area.
Continuity of Operations Minimal to Severe
Temporary/Permanent relocation may be necessary if government facilities experience damage (minimal to severe).
Property, Facilities, and Infrastructure Minimal to Severe
Localized impact could be severe in the trajectory path. Roads, buildings, and communications could be adversely affected. Damage could be severe.
Delivery of Services Minimal to Severe
Delivery of services could be affected if there is any disruption to the roads and/or utilities due to damages sustained. Depending on the incident size the damage could be severe.
Environment Minimal to Severe
Impact will be severe for the immediate impacted area. Impact will lessen as distance increases from the immediate incident area.
Economic Conditions Minimal to Severe
Impacts to the economy will greatly depend on the trajectory of the tornado. If a jurisdiction takes a direct hit then the economic conditions will be severe. With an indirect hit the impact could still be anywhere from low to severe.
Public Confidence in Jurisdiction’s Governance Minimal to Severe
Response and recovery will be in question if not timely and effective. Warning systems and warning time will also be questioned (minimal to severe)

3.257
3.2.20 Utility/Infrastructure Failure
Calculated Priority Risk Index Planning Significance
3.00 High
Description Critical infrastructure involves several different types of facilities and systems including: electric power, transportation routes, natural gas and oil pipelines, water and sewer systems, storage networks, and internet/telecommunications systems. Failure of utilities or other components of the infrastructure in the planning area can seriously impact public health, functioning of communities and the economy. Disruption of any of these services could result from the majority of the natural, technological, and manmade hazards described in this plan. In addition to a secondary or cascading impact from another primary hazard, utilities and infrastructure can fail as a result of faulty equipment, lack of maintenance, degradation over time, or accidental damage such as damage to buried lines or pipes during excavation.
Electric Power Disruption of electric power supply can be a cascading impact of several other hazards. The most common hazards analyzed in this plan that disrupt power supply are: flood, tornado, windstorm, and winter weather as these hazards can cause major damage to power infrastructure. To a lesser extent, extreme temperatures, dam and levee failure, lightning, and terrorism can disrupt power. Extreme heat can disrupt power supply when air conditioning use spikes during heat waves which can cause brownouts. Dam and levee failure, are similar to flood in that infrastructure can be damaged or made inaccessible by water. Lightning strikes can damage substations and transformers, but is usually isolated to small areas of outage. Many forms of terrorism could impact power supply either by direct damage to infrastructure or through cyber-terrorism targeting power supply networks.
The largest electric utility providers in Region L are Kansas City Power & Light, Westar Energy, City of Gardner, and Leavenworth-Jefferson Elec. Coop., Inc.
Figure 3.77, Figure 3.78, and Figure 3.79 show the location of the electric lines for Johnson, Leavenworth, and Wyandotte Counties, respectively.

3.258
Figure 3.77. Map of Johnson County Electric Lines

3.259
Figure 3.78. Map of Leavenworth County Electric Line

3.260
Figure 3.79. Map of Wyandotte County Electric Lines

3.261
Transportation Routes Transportation routes can also be impacted by many of the hazards discussed in this plan. The primary hazards that impact transportation are: Flood, Hazardous Materials, and Winter Weather. Flood events, both riverine and flash flood can make roads and bridges impassible due to high water. Flood waters can also erode or scour road beds and bridge abutments. Highway and railroad accidents that involve hazardous materials can impact transportation routes as road and railroad closures, as well as evacuations may be necessary. Winter Weather frequently impacts transportation as roads become treacherous or impassible due to ice and snow. Secondary hazards that impact transportation routes include: dam and levee failure if routes are in inundation areas, extreme temperatures can cause damage to pavement (especially asphalt), land subsidence can damage roads/railroads if subsidence area is near the route, landslide can cause debris and rock falls onto roadways, terrorism can target routes, tornado can directly damage infrastructure or deposit debris in routes, wildfire can cause decreased visibility on transportation routes due to smoke, and windstorm can cause vehicle accidents or overturning (particularly cargo vans).
Natural Gas and Oil Pipelines Primary hazards that can impact natural gas and oil pipelines are earthquake, expansive soils, land subsidence, landslide, and terrorism.
Water and Sewer Systems The primary hazards that can impact water supply systems are: drought, flood, hazardous materials, and terrorism. The primary hazard that impacts sewer systems is flood.
Storage Networks If damaged, storage networks and infrastructure can disrupt government and business functions. All state government and most local governments and businesses utilize redundant systems to decrease vulnerability to outages. All hazards that can disrupt electric power can also impact storage networks as electricity is required to power the infrastructure. In addition, the networks themselves can be damaged if the hazard impacts the facility where the network is located. The primary hazards that can cause direct damage are: flood, lightning, terrorism, and tornado.
Internet/Telecommunications Internet and telecommunications infrastructure can be impacted by a number of hazards as well. The types of hazards and impacts to internet and telecommunications infrastructure are very similar to electric power supply. Land line phone lines often utilize the same poles as electric lines. So, when weather events such as windstorm or winter weather cause lines to break, both electricity and telephone services experience outages. With the increasing utilization of cellular phones, hazard events such as tornado that can damage cellular repeaters can cause outages. In addition, during any hazard event, internet and telecommunications systems can become overwhelmed due to the surge in call/usage volume.

3.262
Location
The entire planning area in Region L is vulnerable to Utility/Infrastructure Failure due to equipment or maintenance failure, or as a secondary hazard when the primary hazard is a Tornado, Winter Storm, Wind Storm, Lightning, Terrorism, expansive soil, drought, etc. All of these have the capacity to directly hit the utility and infrastructure of the planning area, or indirectly such as with earth movement during a drought or expansive soil, or flood event.
Previous Occurrences
• FEMA-4035-DR: Flooding—September 23, 2011: Four counties in northeast Kansas were declared for flooding that occurred from June 1 to August 1, 2011 along the Missouri River. The counties included are Atchison, Doniphan, Leavenworth, and Wyandotte. Damages as a result of this event were estimated to be nearly $7.4 Billion and primarily involved damages to roads and bridges.
• FEMA-1741-DR—February, 2008 (December 6-19, 2007): An ice storm caused numerous power outages and approximately 130,000 Kansas customers were without power. Specifically, Kansas Rural Electric Cooperatives reported 49,000 customers without power, Westar reported 76,000 customers, Kansas City Power & Light reported 4,300 customers, and Kansas City, Kansas Board of Public Utilities reported 800 customers without power. FEMA’s Public Assistance costs were $355,651,857 for this disaster.
Extent
While utility/infrastructure failure is common during winter storms, tornados, etc., it is a manageable failure. Normally the power lines are affected, however the utility companies are very aggressive in restoring their use. The planning committee has deemed this hazard as negligible to the planning area.
Probability of Future Events
Utitlity/Infrstructure failure are normally tied to other weather hazards such as tornadoes, winter storms, and high winds. Region L has a high propensity for weather that is conducive to these hazards, which in turn makes the possibility of a utility/infrastructure failure a high reality. The planning committee has determined that this event is Highly Likely during the calendar year.
Impact and Vulnerability
Since utility/infrastructure failure is generally a cascading impact of other hazards, it is not possible to quantify estimated potential losses specific to this hazard due to the variables associated with affected population, duration of outages, etc...
Although the limitless variables make it difficult to estimate future losses on a statewide basis, FEMA has developed standard loss of use estimates in conjunction with their Benefit-Cost Analysis methodologies to estimate the cost of lost utilities on a per-person, per-use basis (See Table 3.167).

3.263
Table 3.167. FEMA Standard Values for Loss of Service for Utilities and Roads/Bridges
Loss of Electric Power Cost of Complete Loss Total Economic Impact $126 per person per
Loss of Potable Water
Cost of Complete Loss Total Economic Impact $93 per person per
Loss of Wastewater
Cost of Complete Loss Total Economic Impact $41 per person per
Loss of Road/Bridge
Cost of Complete Loss Vehicle Delay Detour
$38.15 per vehicle per
Vehicle Delay Mileage $0.55 per mile (or
Source: State Hazard Mitigation Plan and FEMA.gov.
The impact of a major utility/infrastructure event would be dependent on time of year, location, and event length. If a major event happened in the middle or summer or winter during extreme temperatures than the elderly and very young population could be at risk as they try to stay cool or warm. If a major transportation node collapsed due to expansive soil, lives could be lost and services could be disrupted. The whole population could be effected if the event went on for a considerable length of time.
While every community in the State is at risk to utility/infrastructure failure, the vulnerability is somewhat elevated in the planning area due to the higher population density, development, and economic activities of the Kansas City Metropolitan Area that would be disrupted by a major infrastructure failure event.
In recent years, regional electric power grid system failures in the western and northeastern United States have demonstrated that similar failures could happen in Kansas. This vulnerability is most appropriately addressed on a multi-state regional or national basis.
Summary
Region L is vulnerable to this hazard, mainly as a secondary repercussion from other hazards that occur in the area. Tornadoes, Winter Storms, Floods, Expansive Soils, Extreme Temperatures, Drought, and many more play a role I the integrity of the utility/infrastructure arena. While most events of utility or infrastructure failure only last for 3 to 5 days, it can be detrimental to the safety of people, property and structural integrity. Because it is a highly urbanized region, a glitch or failure in utilities/infrastructure could upset everyday life, seamless travel, and the ability to survive, especially within our vulnerable populations.
Local Mitigation Concerns
• Utility/Infrastructure Failure is often times associated with another hazard which compounds the issue. Should a major blackout affect the Region, it could potentially affect up to a million people with responders trying to find shelter and food to sustain these lives, regardless of the extreme temperature caveat. Roads and Bridges could be damaged which hurt the supply routes, as well as any people traveling on them at the time.

3.264
• The vulnerable population is a particular concern during a utility/infrastructure failure event. They are not always able to get around on their own and rely on mobile food banks for sustenance. Any disruption in service could potentially put these lives in danger.
• Rolling blackouts could see an increase in theft and violence, particularly in the urban areas. The economy could suffer as a result, as well as the community’s confidence in their officials to keep them safe.
• Another potential issue is the occurrence of unmapped utility lines. Wyandotte County discovered unmapped fiber optic lines that went from their county into Leavenworth that belonged to the Department of Homeland Security. This discovery came about by accident due to the lack of communication. Regardless of whether a county owns the lines or not, it is imperative that they know what is buried within their jurisdiction.
Development in Hazard Prone Areas
Increases in development and population growth in the planning area, also increases the demand for utilities as well as the level of impacts when the utilities fail. One way to mitigate for this hazard is by burying utility lines in new construction and replacing existing lines when funding is available.
Johnson County
Table 3.168. Johnson County CPRI: Utility/Infrastructure Failure
Hazard Type Probability Magnitude Warning
Time Duration CPRI Planning
Significance
Johnson County Utility/Infrastructure Failure
3 2 4 3 2.85 Moderate
Leavenworth County
Table 3.169. Leavenworth County CPRI: Utility/Infrastructure Failure
Hazard Type Probability Magnitude Warning
Time Duration CPRI Planning
Significance
Leavenworth County Utility/Infrastructure Failure
4 1 4 2 2.90 Moderate

3.265
Wyandotte County
Table 3.170. Wyandotte County CPRI: Utility/Infrastructure Failure
Hazard Type Probability Magnitude Warning
Time Duration CPRI Planning
Significance
Wyandotte County Utility/Infrastructure Failure
4 1 4 3 3.00 High
Consequence (Impact) Analysis The information in Table 3.171 provides the Consequence Analysis of Potential for Detrimental Impacts of Hazards done for accreditation with the Emergency Management Accreditation Program (EMAP).
Table 3.171. EMAP Consequence Analysis: Utility/Infrastructure Failure
Subject Ranking Impacts/Utility/Infrastructure Failure
Health and Safety of Persons in the Area of the Incident
Moderate to Severe Localized impact will be moderate to severe for persons with functional and access needs, and the elderly, depending on length of failure and time of year.
Responders Minimal Impact to responders will be minimal if properly trained and equipped.
Continuity of Operations Minimal Due to the nature of the hazard, the COOP plan is not expected to be activated, however, if the recovery time is excessive than temporary relocation may become necessary (minimal).
Property, Facilities, and Infrastructure
Minimal Impact is dependent on the nature of the incident, e.g., electric, water, sewage, gas, communication disruptions). (Minimal)
Delivery of Services Minimal Delivery of services could be affected within and around the affected area (minimal).
Environment Minimal Impact, depending on the nature of the incident, should be minimal.
Economic Conditions Minimal Economic conditions could be adversely affected depending on damages suffered, extent of damages, etc. (minimal)
Public Confidence in Jurisdiction’s Governance
Minimal Impact will be dependent on whether or not the government or non-government entities response, recovery, and planning were not timely and effective (minimal).

3.266
3.2.21 Wildfire
Calculated Priority Risk Index Planning Significance
2.80 Moderate
Description
Wildfires in the planning area typically originate in pastures or accidents following the ignition of dry grasses (by natural or human sources). Ranchers and farmers intentionally ignite vegetation to restore soil nutrients or alter the existing vegetation growth. These fires have the potential to get out of control and erupt into wildfires. Wildfires are also associated with lightning and drought conditions, as dry conditions make vegetation more flammable. Wildfires may also originate, or spread to forested areas, or other areas with concentrations of woody fuel that can cause wildfires to increase in intensity and spread. The Eastern Red Cedar is of particular concern in the planning area. This invasive evergreen species can take over fence rows and un-planted fields, adding to wildfire fuel and risk. Additionally, this type of fuel, as well as other tree plantings near structures can cause structures to be consumed by wildfires, putting inhabitants at risk.
Wildfires tend to peak in March and April when people are conducting controlled burns in grassland and fields When conditions green up later in the summer and the humidity is higher, the risk of wildfires is generally lower. This trend, however, does not continue in years of extreme drought when hot and dry weather prevail.
The wild land/urban interface is the area where human improvements such as homes, ranches and farms come in contact with the wild lands. Urban expansion has driven the increased building of homes in wild land areas. Wherever people are living in or adjacent to wild land areas, the threat of wildfire exists. As the rural population increases, so does the risk to life and property from wildfire.
Location
The entire planning area is susceptible to wildfire events. The wildfire risk in Region L is of a higher concern than its western county counterparts. This is largely because of the population growth in the eastern part of the State resulting in increasing encroachment into the wildland/urban interface. Additionally, the effects of smoke emissions from wildfires are more of a concern in the more urban eastern counties due to higher populations in those areas.
According to the 2011 Kansas Forest Action Plan, with the exception of Eastern Red cedar/hardwood, most forest types in the region do not pose significant fire management issues. However, grasslands are a different story. These areas and the wild land-urban interface where development has occurred are the focus of wild land fire management issues in the area.

3.267
Previous Occurrences
• 8 August 2012 – More than 100 acres burned when a stolen car was set on fire in a field that led to the blaze. The fire was in the vicinity of 183rd Street and State Line Road, and 187th Street and Mission Road. A trailer and all-terrain vehicle were also set on fire. Firefighters stopped the fires from damaging any homes.
• 19 August 2012 – 5 grass fires were ultimately put out in Johnson County in the cities of Olathe (2), Lenexa, Mize and Shawnee. No buildings were damaged.
• 2012 – Wyandotte county saw a fire that began at 57th Street and I70 spreading toward Muncie Drive. Fire Crews stopped the fire about 100 feet from four or five homes in the rural, wooded area.
• 21 August 2012 – three grass fires in Leavenworth County, one begin near Tonganoxie were put out after burning 50 acres and 7 acres and the other of undetermined acreage. The seven acre fire near Tonganoxie destroyed one mobile home.
Extent
In the year 2012 alone the planning area saw four reported incidents for Wildfire. One mobile home was destroyed and four homes were threatened. With the incidence of drought that has affected the state, as well as the rise in average temperatures; the extent of wildfires could potentially be greater. The planning committee has determined that during this planning period the Magnitude is: Negligible.
Probability of Future Events
Historical records for this hazard are difficult to obtain. There is no consistency of when to report a wildfire, or what criteria should be followed. When a wildfire is located in a city often times the authorities do not report it as a wildfire, even though it may have been present in an open dry field. However, wildfires do occur on an annual basis in the planning area resulting in this hazard’s probability being “Highly Likely”.
Impact and Vulnerability
According to the USDA’s Risk Management Agency on Crop Insurance, no payments have been made for loss of crops due to wildfire in the planning area. However, as seen in previous occurrences, property loss, although rare in this region, does happen as seen with the mobile home that was burned.
Although some data is available from the National Fire Incident Reporting System (NFIRS) in terms of previous events, this data has limitations in providing useful statistical data for analysis. The most problematic issues are that not all fire departments report to NFIRS and of those that report, not all incidents are reported. This current lack of local level, (i.e. fire district or county), requirements and a past lack of enforcement of state statutes has led to a lack of fire occurrence data for both prescribed burns and wildfires being available. Changes in

3.268
enforcement of wildfire reporting requirements at the state level, as well as prescribed fire reporting requirements that are part of the EPA-mandated Kansas Flint Hills Smoke Management Plan (approved in 2011), will give the Kansas Forest Service a much greater opportunity to begin using real-time fire occurrence data to assist in making the best fire management decisions.
In light of the data limitations associated with available statistics, and with the publication of the 2011 Kansas Forest Action Plan, the planning committee determined that the best available data for the vulnerability analysis for the Wildfire Hazard is the ‘Weighted Sum’ analysis that was completed and utilized to develop a ‘Wildfire Risk’ composite layer as part of the Forest Action Plan.
The ‘Wildfire Risk’ composite layer was developed using a ‘Weighted Sum’ analysis to combine six data layers produced from a combination of eight separate datasets. In close consultation with the Kansas Forest Service’s Fire Management Coordinator and other Fire Management staff six data inputs were developed to represent Wildfire Risk in Kansas. These data inputs and their corresponding analysis weight are listed below:
1) Wildland Urban Interface—from 3 data sets (.85) 2) ISO Fire Station Coverage Gaps (.75); 3) Conservation Reserve Program Lands (.60); 4) Eastern Redcedar in Grasslands (.75); 5) ‘Moderate’ Fire Potential risk and (.53); 6) ‘High’ Fire Potential risk (.80).
For more detailed descriptions of these six data layers, see pages 27-28 of the Kansas Forest Action Plan, http://www.kansasforests.org/assessment.shtml. The six data layer inputs were combined using the ‘Weighted sum’ analysis. The resulting raster contains values ranging from 0 to 3.48. The higher the numbers (darker shading) indicate higher wildfire risk. Figure 3.80 is the resulting composite map. Figure 3.81 that follows provides a map indicating the mean score for each county. Then Table 3.168 provides a table of the mean score for each county.

3.269
Figure 3.80. Issues that Create Wildfire Risk—Composite Map
Source: Kansas Forest Service, Kansas Forest Action Plan, 2011

3.270
Figure 3.81. Wildfire Risk (by Mean County Score)
Source: Kansas Forest Service

3.271
Table 3.168. Mean Wildfire Risk Score for Kansas Counties by Mitigation Planning Region
County Mean Wildfire Risk Score
Mitigation Planning Region L Johnson 0.52408075333 Leavenworth 0.41779085994 Wyandotte 0.28411415219 Planning Region Average 0.40866192182
Source: State Mitigation Plan 2013
When the mean wildfire risk score is compared to all the counties in Kansas, Region L did not rate in the Top 10.
Community Wildfire Protection Plans One way for communities at risk to wildfire to reduce their overall vulnerability is development of Community Wildfire Protection Plans (CWPP) to identify specific areas at risk and actions that can be taken to reduce risk. The Healthy Forests Restoration Act (HFRA) provided communities with an opportunity to influence where and how federal agencies implement fuel reduction projects on federal lands. A CWPP is the most effective way to take advantage of this opportunity. Additionally, communities with Community Wildfire Protection Plans in place are given priority for funding of HFRA hazardous fuels reduction projects.
CWPPs can take a variety of forms, based on the needs of the people involved in their development. They may address issues such as wildfire response, hazard mitigation, community preparedness, or structure protection—or all of the above. The three main components of a CWPP are:
1) Collaboration between all affected or potentially affected jurisdictions, 2) Assessment of the wildfire hazards in an area that leads to recommendation for prioritized
fuel reduction, and 3) A section on recommendations towards reducing structural ignitability. In Kansas, the Kansas Forest Service coordinated with several Local Hazard Mitigation Planning efforts to integrate a Community Wildfire Hazard Assessment into Local Hazard Mitigation Plans. By doing so, the requirements of the main components of the CWPP have been met. The language in the HFRA provides maximum flexibility for communities to determine the substance and detail of their plans and the procedures they use to develop them. Table 3.169 shows the counties in the Region and their status into the Community wildfire Protection Plan, and as a Firewise Community.Wyandotte’s CWPP is pending, while Johnson County’s CWPP has been approved. Leavenworth has not begun the process at the writing of this plan.

3.272
Table 3.169. Participation in CWPP and Firewise
County Community Wildfire Protection Plan Firewise C it No Pending Approved
Johnson X No Leavenworth X No Wyandotte X No
Firewise Communities Taking steps to become a Firewise Community is another way communities with wildfire risk can reduce their wildfire vulnerability. The five steps of Firewise recognition http://www.firewise.org/communities/usa-recognition-program/program-criteria.aspx
• Obtain a wildfire risk assessment as a written document from your state forestry agency or fire department.
• Form a board or committee, and create an action plan based on the assessment. • Conduct a “Firewise Day” event. • Invest a minimum of $2 per capita in local Firewise actions for the year. • Submit an application to your state Firewise liaison
Currently no county in Region L is a Firewise Community. However, whether or not communities have a CWPP or have taken steps to become a Firewise Community, many have adopted burn ban ordinances or placed specific bans on burning during conditions favorable to wildfire, such as drought. Summary
Wildfires have been, currently are, and will be an issue for the planning area. Whether through natural means, or human caused, wildfires have the potential to put lives and property in danger. While there are many causes of wildfires, lightning and human caused top the list. Once an area has had a wildfire, and the land resides on a slope of any etiology, the chance of a landslide and soil erosion is increased. The planning area is known for its hill elevations and the construction that has been done for residences and businesses on these slopes. There is also marked presence of open land in the area that is also prone to wildfires. These types of fires can spread quickly, especially during drought conditions, endangering homes, businesses, crops, livestock, and property.
Local Mitigation Concerns
• The wind in Kansas normally blows in an eastwardly direction, so that when wildfires are present outside of the planning area, the smoke blows into their Region. This could be a health concern for all of the population, but specifically the vulnerable population that are elderly, young, and/or have health issues such as asthma, emphysema, etc.
• Wildfires in the Region can be a contributor to landslides and soil erosion. When a wildfire burns off all the grass it takes the ‘anchor’ for the soil. Subsequently, when it
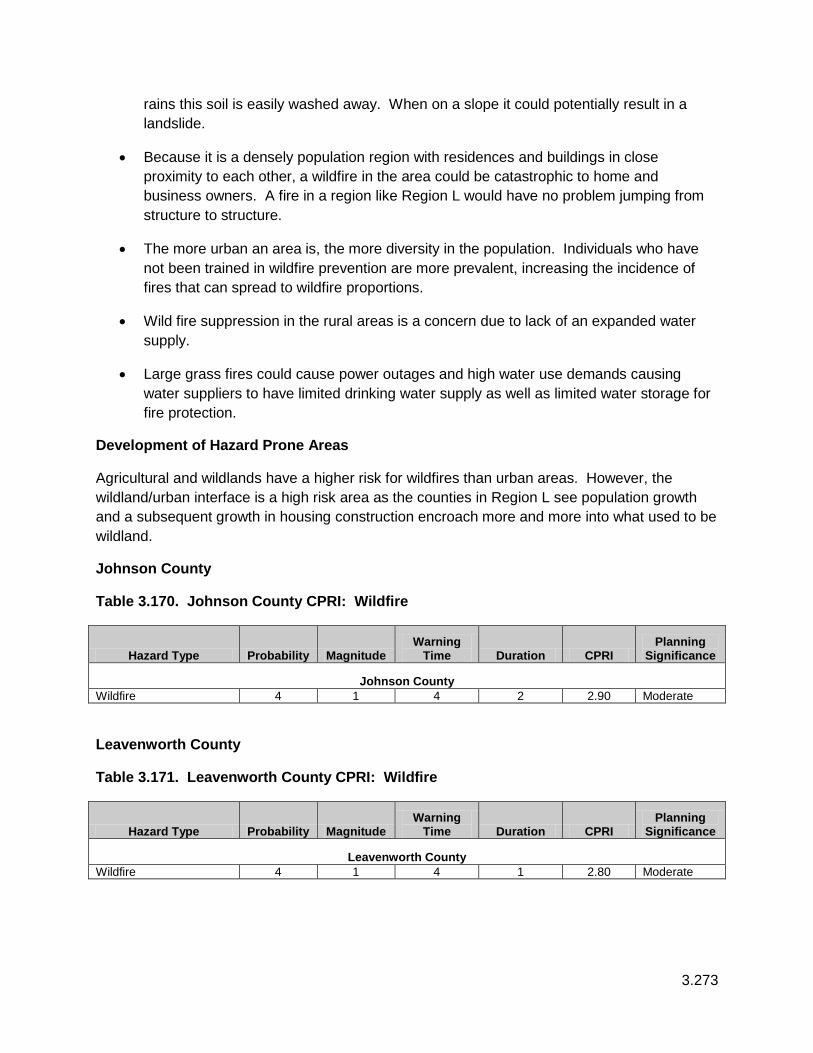
3.273
rains this soil is easily washed away. When on a slope it could potentially result in a landslide.
• Because it is a densely population region with residences and buildings in close proximity to each other, a wildfire in the area could be catastrophic to home and business owners. A fire in a region like Region L would have no problem jumping from structure to structure.
• The more urban an area is, the more diversity in the population. Individuals who have not been trained in wildfire prevention are more prevalent, increasing the incidence of fires that can spread to wildfire proportions.
• Wild fire suppression in the rural areas is a concern due to lack of an expanded water supply.
• Large grass fires could cause power outages and high water use demands causing water suppliers to have limited drinking water supply as well as limited water storage for fire protection.
Development of Hazard Prone Areas
Agricultural and wildlands have a higher risk for wildfires than urban areas. However, the wildland/urban interface is a high risk area as the counties in Region L see population growth and a subsequent growth in housing construction encroach more and more into what used to be wildland.
Johnson County
Table 3.170. Johnson County CPRI: Wildfire
Hazard Type Probability Magnitude Warning
Time Duration CPRI Planning
Significance
Johnson County Wildfire 4 1 4 2 2.90 Moderate
Leavenworth County
Table 3.171. Leavenworth County CPRI: Wildfire
Hazard Type Probability Magnitude Warning
Time Duration CPRI Planning
Significance
Leavenworth County Wildfire 4 1 4 1 2.80 Moderate

3.274
Wyandotte County
Table 3.172. Wyandotte County CPRI: Wildfire
Hazard Type Probability Magnitude Warning
Time Duration CPRI Planning
Significance
Wyandotte County Wildfire 4 1 4 1 2.80 Moderate
Consequence (Impact) Analysis The information in Table 3.173 provides the Consequence Analysis of Potential for Detrimental Impacts of Hazards done for accreditation with the Emergency Management Accreditation Program (EMAP).
Table 3.173. EMAP Consequence Analysis: Wildfire
Subject Ranking Impacts/Wildfire
Health and Safety of Persons in the Area of the Incident
Severe Impact of the immediate area could be severe for affected areas and moderate to light for other less affected areas.
Responders Minimal to Severe Impact to responders is could be severe depending on the size and scope of the fire, especially for fire fighters. Impact will be low to moderate for support responders with the main threat being smoke inhalation.
Continuity of Operations Minimal to Severe Temporary relocation may be necessary if government facilities experience damage (minimal to severe).
Property, Facilities, and Infrastructure
Severe Localized impact could be severe to facilities and infrastructure in the incident area. Property, Facilities, and infrastructure are all vulnerable to destruction by wildfire.
Delivery of Services Minimal to Severe Delivery of services could be affected if there is any disruption to the roads and/or utilities due to damages sustained (minimal to severe).
Environment Severe Impact will be severe for the immediate impacted area with regards to trees, bushes, animals, crops, etc. Impact will lessen as distance increases from the immediate incident area.
Economic Conditions Minimal to Moderate Impacts to the economy could be moderate in the immediate area.
Public Confidence in Jurisdiction’s Governance
Minimal to Severe Response and recovery will be in question if not timely and effective. Evacuation orders, shelters availability could be called in to question (minimal to severe).

3.275
3.2.22 Windstorm
Calculated Priority Risk Index Planning Significance
3.05 High
Description
Relatively frequent strong winds are a weather characteristic of the region. The planning area is located within wind zones III and IV, the highest inland categories. High winds, often accompanying severe thunderstorms, can cause significant property and crop damage, threaten public safety and have adverse economic impacts from business closures and power loss.
Straight-line winds are generally any thunderstorm wind that is not associated with rotation (i.e., is not a tornado). It is these winds, which can exceed 100 mph that represent the most common type of severe weather and are responsible for most wind damage related to thunderstorms. Since thunderstorms do not have narrow tracks like tornadoes, the associated wind damage can be extensive and affect entire (and multiple) counties. Objects like trees, barns, outbuildings, high-profile vehicles, and power lines/poles can be toppled or destroyed, and roofs, windows and homes can be damaged as wind speeds increase. One type of straight-line wind is the downburst, which can cause damage equivalent to a strong tornado and can be extremely dangerous to aviation.
Thunderstorms over the planning area typically happen between late April and early September, but, given the right conditions, they can develop as early as March. They are usually produced by super cell thunderstorms or a line of thunderstorms that typically develop on hot and humid days.
An unusual phenomenon that can happen in Region L is a derecho. This is a cluster of thunderstorms that merge into a line that begins moving east or southeast. As it progresses the winds increase and produce damage along that path much like a tornado would only it covers a much wider area. Whereas tornadoes are more isolated events that tend to hit a certain area, a derecho is a very large weather event that covers a much greater area, sometimes up to hundreds of miles at once. The damage can be significant to structures, nature, and people.
Location
The entire planning region is susceptible to high wind events. Whether due to Thunderstorms, Tornadoes, or solely wind events such as a Derecho, the Region can count on high wind events.
Previous Occurrences
28 February 2012 - A strong cold front, associated with a low pressure system over the Central Plains, moved east northeast across the region, with a broken line of thunderstorms. A few of the storms were severe with damaging winds, during the evening hours of February 28, 2012. Thunderstorm wind gusts were estimated up to 60 mph on Douglas Avenue.

3.276
3 August 2012 - Thunderstorm wind gusts were estimated up to 60 mph, at the corner of 199th and Blackbob Road.
6 June 2011 - Scattered severe thunderstorms were observed across extreme eastern Kansas, during the evening hours of June 1, 2011. There were several reports of hail and damaging winds. Large trees were snapped off at ground level. A barn was destroyed at 155th Street and Fairmont Road.
6 April 2010 – Leavenworth - Severe thunderstorms brought large hail and damaging winds to the area, during the afternoon hours of April 6, 2010. Thunderstorm winds were estimated up to 60 mph.
7 June 1982 - During the pre-dawn hours of Monday, June 7, 1982, a derecho formed over north central Kansas (KS) and roared eastward causing considerable damage and some injuries as it crossed northern Kansas, central Missouri (MO), and west central Illinois (IL) (Fig. 1). The most intense part of the storm occurred along a band from just west of Manhattan, KS (orange "M" in Fig. 1) through the central and northern parts of the Kansas City metropolitan area (orange "K" in Fig. 1). Measured peak wind gusts included 62 mph at Manhattan, 78 mph at Topeka (orange "T" in Fig. 1), 90 mph at Lake Perry, KS (orange "P" in Fig. 1), and 78 mph at Kansas City International Airport. Gusts were estimated to have reached 90 to 100 mph in several places, including the northern Kansas City suburb of Parkville, MO. Along the most intense part of the derecho path ("M" to "K"), mobile homes were overturned, buildings were damaged, planes were overturned at the airports in Topeka and Kansas City, and thousands of trees were damaged or blown down (Fig 1). Six people were injured in the overturned mobile homes. Much of the area lost electrical power, including the northern two-thirds of the Kansas City metropolitan area (noaa.gov).
Source: http://www.spc.noaa.gov/misc/AbtDerechos/casepages/kc1982mem2003pwrpage.htm
The following map depicts the area’s that have the highest incidence of Derecho’s. Region L falls in the 1 derecho every 1 to 2 year window.

3.277
Figure 3.82. Incidence of Derecho’s
Source: NOAA.gov
Extent
Between the years 2000 and 2012, the Counties in Region L saw a combined 516 wind events that were reported. Following is a breakdown by county of high winds associated with thunderstorms. This table represents only the reported data and is not an all-inclusive list. Wind events and property damage could be higher, however only what has been reported is shown in Table 3.174.
Table 3.174. High Wind Events Associated with and without Thunderstorms in Region L, 2000-2012
Johnson County High Wind
Event Wind Associated
With Thunderstorms
Deaths Injuries Property Damage with TSTM Winds
Crop Damage
9 126 0 0 693K 0.00K Leavenworth County
1 230 0 0 873.4K 0.00 Wyandotte County
8 160 0 0 906K 0.00

3.278
Totals 18 516 0 0 1512.4M 0.00K
Source: National Climatic Database
Magnitude: “Limited”. Injuries and/or illnesses do not result in permanent disability.
Probability of Future Occurrences
Based on the historical data presented of 516 wind events in Region L within the last 12 years, the probability that at least one wind event will occur in the Region in any given year is 100%. This hazard’s CPRI probability is “Highly Likely” within a calendar year.
Impact and Vulnerability
To determine potential financial loss estimates to wind in the planning area, the available historical loss data was annualized. In the case of frequently occurring weather-related hazards such as wind, annualized historical loss data is considered to be the best resource for determining future potential losses. The planning team obtained loss data from the National Climatic Data Center (NCDC) storm events (2006 – 2012) and the USDA Risk Management Agency insured crop loss payments (2002 – 2011) since agriculture plays such as important role in the Kansas economy. Following is the annualized property losses from wind, 2006 - 2012:
Table 3.175. Annualized Property Losses for Region L, 2006 - 2012
County Annualized Property Loss ($) Johnson $11,571 Leavenworth $73,307 Wyandotte $21,420 Source: State Hazard Mitigation Plan
All three counties in the planning area are vulnerable to windstorms. The statistical analysis method was used to refine and assess the relative vulnerability of each of Region L’s counties to wind. Ratings were assigned to pertinent factors that were examined at the county level. These factors are: social vulnerability index, prior events, prior annualized property damage, building exposure valuation, population density, crop exposure and annualized crop loss. Then a rating value of 1-10 was assigned to the data obtained for each factor and then weighted equally and factored together to obtain overall vulnerability scores for comparison and to determine the greatest vulnerable counties.
The following are the data sources of the factors: Social Vulnerability Index for Region L counties from the Hazards and Vulnerability Research Institute at the University of South Carolina, National Climatic Data Center (NCDC) storm events (2006 – 2012), U.S. Census Bureau (2010), USDA’s Census of Agriculture (2007) and USDA Risk Management Agency (2002 – 2011). It was determined that since wind is a common occurrence in the planning area, that using historical events and property damages from 2006 forward provides adequate events to describe the wind problem in Kansas.

3.279
Table 3.176 below provides the factor’s amount per county that are considered for wind vulnerability. It is important to remember that this is a snapshot in time and not all-inclusive.

3.280
Table 3.176. Vulnerability of Region L Counties Factor Amounts for Wind C
ount
y
SoV1
R
atin
g (1
-5)
Prio
r Ev
ents
20
06 –
20
12
Prop
erty
D
amag
es
Ann
ualiz
ed Pr
oper
ty
Dam
ages
Tota
l B
uild
ing
Expo
sure
($
1000
s)
Popu
latio
n D
ensi
ty
Cro
p Ex
posu
re
(200
7 C
ensu
s of
A
gric
ultu
re)
C
rop
Insu
ranc
e Pa
id fo
r W
ind
Ann
ualiz
ed
Cro
p In
sura
nce
Paid
Johnson 1 61 $81,000 $11,571 $43,871,468 1,149.60 $29,472,000 $109,685 $10,969
Leavenworth 1 60 $513,500 $73,357 $4,877,783 164.7 $20,983,000 $0 $0
Wyandotte 3 13 $150,000 $21,429 $12,066,666 1,039.00 $0 $0 $0
Total 134 $744,500 $106,357 $60,815,917 $50,455,000 $109,685 $10,969
Note: The Census of Agriculture did not publish crop exposure in Wyandotte County to avoid disclosure of individual operations

3.281
Table 3.177. Ranges for Wind Vulnerability Factor Ratings R
atin
gs
Soci
al
Vuln
erab
ility
NC
DC
Prio
r Ev
ents
Ann
ualiz
ed
Prop
erty
D
amag
e
Bui
ldin
g Ex
posu
re
Valu
atio
n
Popu
latio
n D
ensi
ty *
Cro
p Ex
posu
re
Ann
ualiz
ed
Cro
p Lo
ss
1 9 - 34 $0 -
$200,000 $117,421 - $4,492,825 1.6 - 116.3 0 - $18,548,500 19 - $40,800
2 1 35 - 56 $200,001 -
$400,000 $4,492,826 -
$8,868,229 116.4 -
231.1 $18,548,501 -
$32,126,000 $40,801 - $81,576
3 57 - 78 $400,001 -
$600,000 $8,868,230 - $13,243,634
231.2 - 345.9
$32,126,001 - $45,703,500 $81,577 - $122,352
4 2 79 - 100 $600,001 -
$800,000 $13,243,635 -
$17,619,039 346 - 460.7
$45,703,501 - $59,281,000
$122,353 - $163,128
5 101 - 122 $800,001 - $1,000,000
$17,619,040 - $21,994,444
460.8 - 575.5
$59,281,001 - $72,858,500
$163,129 - $203,904
6 3 123 - 144 $1,000,001 -
$3,000,000 $21,994,445 -
$26,369,848 575.6 -
690.3 $72,858,501 -
$86,436,000 $203,905 -
$244,680
7 145 - 165 $3,000,001 -
$5,000,000 $26,369,849 -
$30,745,253 690.4 -
805.1 $86,436,001 - $100,013,500
$244,681 - $285,456
8 4 166 - 187 $5,00,001 - $7,000,000
$30,745,254 - $35,120,658
805.2 - 919.9
$100,031,501 - $113,591,000
$285,457 - $326,232
9 188 - 209 $7,000,001 -
$9,000,000 $35,120,659 -
$39,496,062 920-
1,034.7 $113,591,001 -
$127,168,500 $326,233 -
$367,008
10 5 210 - 232 $9,000,001 - $25,460,428
$39,496,063 - $43,871,468
1,034.8 - 1,149.6
$127,168,501 - $140,746,000
$367,009 - $407,783
Source: State Hazard Mitigation Plan 2013
Table 3.178 provides the calculated ranges applied to determine the Low, Medium-Low, Medium, Medium-High and High vulnerable counties and Table 3.179 provides the seven rating values assigned that were considered in determining overall vulnerability to wind. Table 3.180 that follows provides the mapped results of this analysis by county.
Table 3.178. Ranges for Overall Wind Vulnerability
Ranges Low Medium-Low Medium Medium-High High 9 - 14 15 - 19 20 - 24 25 – 29 30 - 34
Source: State Hazard Mitigation Plan 2013

3.282
Table 3.179. Vulnerability of Region L Counties to Wind
Cou
nty
SoVi
Rat
ing
NC
DC
Prio
r Ev
ent R
atin
g
Ann
ualiz
ed
Prop
erty
Dam
age
Rat
ing
Bld
g Ex
posu
re
Valu
atio
n R
atin
g
Popu
latio
n D
ensi
ty R
atin
g
Cro
p Ex
posu
re
Rat
ing
Ann
ualiz
ed C
rop
Loss
Rat
ing
Ove
rall
Vuln
erab
ility
R
atin
g
Win
d Vu
lner
abili
ty
Johnson 2 3 1 10 10 2 1 29 Medium-High Leavenworth 2 3 1 2 2 2 0 12 Low Wyandotte 6 1 1 3 10 1 0 22 Medium
Source: State Hazard Mitigation Plan 2013
Table 3.180 below lists the top vulnerable counties in Kansas relative to each other concerning wind events.
Tab le 3.180. Top Kansas Counties: Vulnerable to Wind (Region L is highlighted in yellow).
Mitigation Planning Region County
Overall Vulnerability Rating Wind Vulnerability
A Sherman 34 High G Sedgwick 31 High C Stanton 29 Medium-High L Johnson 29 Medium-High A Cheyenne 27 Medium-High D Finney 26 Medium-High A Thomas 25 Medium-High C Morton 25 Medium-High D Haskell 25 Medium-High B Norton 24 Medium C Greeley 24 Medium C Stevens 24 Medium
Source: State Hazard Mitigation Plan 2013
Summary
Often it is the loss of electrical power that most impacts city dwellers following a strong wind event, whether due to thunderstorm winds or a derecho. This loss may be due to falling trees and tree limbs severing or shorting electrical lines, or to direct destruction of the overhead electrical distribution plant by high winds. Large portions of a metropolitan area may remain without electrical power for days or even weeks after a major wind event.
Local Mitigation Concerns
• Utility lines are at issue for Region L, specifically lines that provide the energy to power air conditioners or furnaces to the vulnerable populations. The population growth in this area is also seeing a growth in the elderly population as they move from rural areas to

3.283
urban areas in order to be closer to family and medical services. The elderly population growth is expected to continue as the baby boomers age, and with this growth is a growing dependence on electricity. Lives could be at risk during an extreme temperature event should the utilities be out due to high winds.
Development in Hazard Prone Areas
Future development projects should consider windstorm hazard at the planning, engineering and architectural design stage with the goal of reducing vulnerability. The entire planning area is subject to high wind events so all development (with the exception of sub-surface development) is and will be exposed to high winds. Wind resistant design and construction practices, strategic use of landscaping and stringent means for securing outside storage facilities, signs, etc., can all be incorporated into codes or promoted as means of minimizing vulnerability to windstorms.
Johnson County
Table 3.181. Johnson County CPRI: Windstorm
Hazard Type Probability Magnitude Warning
Time Duration CPRI Planning
Significance
Johnson County Windstorm 4 2 3 2 3.05 High
Leavenworth County
Table 3.182. Leavenworth County CPRI: Windstorm
Hazard Type Probability Magnitude Warning
Time Duration CPRI Planning
Significance
Leavenworth County Windstorm 4 2 3 2 3.05 High
Wyandotte County
Table 3.183. Wyandotte County CPRI: Windstorm
Hazard Type Probability Magnitude Warning
Time Duration CPRI Planning
Significance
Wyandotte County Windstorm 4 2 3 2 3.05 High

3.284
Consequence (Impact) Analysis)
The information in Table 3.184 provides the Consequence Analysis of Potential for Detrimental Impacts of Hazards done for accreditation with the Emergency Management Accreditation Program (EMAP).
Table 3.184. EMAP Consequence Analysis: Windstorm
Subject Ranking Impacts/Windstorm Health and Safety of Persons in the Area of the Incident Minimal to Moderate
Impact of the immediate area could be minimal to moderate for affected areas.
Responders Minimal Impact to responders is expected to be minimal unless responders live within the affected area.
Continuity of Operations Minimal Temporary relocation may be necessary if government facilities experience damage (minimal).
Property, Facilities, and Infrastructure Minimal to Severe
Localized impact could be minimal to moderate to facilities and infrastructure in the incident area. Utility lines most affected and could be severe.
Delivery of Services Minimal
Delivery of services could be affected if there is any disruption to the roads and/or utilities due to damages sustained (minimal).
Environment Minimal to Severe
Impact may be severe for the immediate impacted area with regards to trees, bushes, crops, etc. Impact will lessen as distance increases from the immediate incident area (minimal to severe).
Economic Conditions Minimal to Severe
Impacts to the economy will greatly depend on the trajectory of the windstorm. Revenue could be impacted if tourism, businesses are halted due to structural damages and infrastructure damage (minimal to severe).
Public Confidence in Jurisdiction’s Governance Minimal
Response and recovery will be in question if not timely and effective. Warning systems in place and the timeliness of those warnings could be questioned (minimal).

3.285
3.23 Winter Storm
Calculated Priority Risk Index Planning Significance
3.30 High
Description
Winter storms in Region L usually come in the form of heavy snow or freezing rain (ice storms). Regardless of the form they take, they can have significant impacts to the planning area and its residents for days, weeks, or even months. They can immobilize a region, blocking roads and railways and closing airports, which can disrupt emergency and medical services, hamper the flow of supplies, and isolate homes and farms, possibly for days. Heavy snow can collapse roofs and knock down trees and power lines. Unprotected livestock may be lost. Economic impacts include cost of snow removal, damage repair, business and crop losses, and power failures. It is these impacts that the region is most concerned about.
A major winter storm can last for several days and be accompanied by high winds, freezing rain or sleet, heavy snowfall, and cold temperatures (see Section 3.3.7, Extreme Temperatures). The National Weather Service describes different types of winter storm events as follows:
• Blizzard—Winds of 35 mph or more with snow and blowing snow reducing visibility to less than 1/4 mile for at least three hours.
• Blowing Snow—Wind-driven snow that reduces visibility. Blowing snow may be falling snow and/or snow on the ground picked up by the wind.
• Snow Squalls—Brief, intense snow showers accompanied by strong, gusty winds. Accumulation may be significant.
• Snow Showers—Snow falling at varying intensities for brief periods of time. Some accumulation is possible.
• Freezing Rain—Measurable rain that falls onto a surface with a temperature below freezing. This causes it to freeze to surfaces, such as trees, cars, and roads, forming a coating or glaze of ice. Most freezing-rain events are short lived and occur near sunrise between the months of December and March.
• Sleet—Rain drops that freeze into ice pellets before reaching the ground. Sleet usually bounces when hitting a surface and does not stick to objects.

3.286
Heavy accumulations of ice, often the result of freezing rain, can bring down trees, utility poles, and communications towers and disrupt communications and power for days. Even small accumulations of ice can be extremely dangerous to motorists and pedestrians.
Location
The entire planning area is susceptible to heavy snow and freezing rain. Figure 3.83 shows the average snowfalls for the planning area.
Figure 3.83. Average Annual Snowfall for Region L.
Source: Kansas State University, Research and Extension, Weather Data Library, www.oznet.ksu.edu/wdl/Maps/Climatic/AnnualFreezeMap.asp
The Region sees an average number of 8 – 9 hours per year with freezing rain.
Previous Occurrences
Region L has been in 4 out of eight Presidential Declarations that involved winter storms since 1955 (see Table 3.185).

3.287
Table 3.185. Region L’s Inclusion in Presidential Declarations Involving Winter Storms
Declaration Number
Declaration Date*
Disaster Description Counties Involved Disaster
Cost**
Major Disaster Declarations
1885 03/09/2010 (12/9/2009-1/8/2010)
Severe Winter Storms and Snowstorm
Allen, Anderson, Atchison, Bourbon, Brown, Butler, Cherokee, Cheyenne, Clay, Cowley, Crawford, Decatur, Doniphan, Elk, Franklin, Gove, Graham, Greenwood, Jackson, Jefferson, Jewell, Labette, Linn, Logan, Lyon, Marshall, Miami, Morris, Nemaha, Neosho, Norton, Osage, Phillips, Pottawatomie, Rawlins, Republic, Riley, Shawnee, Sheridan, Wabaunsee, Wallace, Washington, Wilson, Woodson and Wyandotte
$19,100,658
1741 02/01/2008 (12/6-12/19/2008)
Severe Winter Storms
Atchison, Barber, Barton, Brown, Butler, Chase, Cherokee, Clark, Clay, Cloud, Comanche, Crawford, Dickinson, Doniphan, Edwards, Ellis, Ellsworth, Ford, Geary, Graham, Gove, Harvey, Hodgeman, Jackson, Jefferson, Jewell, Kingman, Kiowa, Labette, Leavenworth, Lincoln, Logan, Lyon, Marion, Marshall, McPherson, Miami, Mitchell, Morris, Nemaha, Osage, Osborne, Ottawa, Pawnee, Phillips, Pottawatomie, Pratt, Reno, Republic, Rice, Riley, Rooks, Rush, Russell, Saline, Sedgwick, Shawnee, Sheridan, Smith, Stafford, Thomas, Wabaunsee, Wallace, Washington, and Woodson.
$359,557,345
1579 2/8/2005 (1/4-6/2005)
Severe Winter Storm, Heavy Rains, and Flooding
Anderson, Atchison, Barber, Brown, Butler, Chase, Chautauqua, Clark, Coffey, Comanche, Cowley, Crawford, Douglas, Elk, Franklin, Greenwood, Harper, Harvey, Jackson, Jefferson, Kingman, Kiowa, Leavenworth, Lyon, Marion, McPherson, Morris, Osage, Pratt, Reno, Rice, Sedgwick, Shawnee, Sumner, Wabaunsee, Woodson, Wyandotte
$106,873,672
1402 2/6/2002 (1/29-2/15/2002)
Ice Storm
Allen, Anderson, Barber, Bourbon, Butler, Chautauqua, Cherokee, Coffey, Comanche, Cowley, Crawford, Douglas, Elk, Franklin, Greenwood, Harper, Jefferson, Johnson, Kingman, Kiowa, Labette, Leavenworth, Linn, Lyon, Miami, Montgomery, Neosho, Osage, Pratt, Sedgwick, Shawnee, Sumner, Wilson, Woodson, Wyandotte
$60,185,754
Sources: http://www.fema.gov/disasters, and Kansas Division of Emergency Management * Incident dates are in parentheses. ** Disaster costs include Public Assistance and Individual Assistance
Table 3.18a shows reported property damage for Region L for Disaster 1402. No other data is available for the other Disasters. This could be due to a reporting issue, or because all damages were insured and were not reported to the NOAA data base.

3.288
TABLE 3.185a. Property Damage for Region L Due to Storms, 1996 - 2012
Disaster Year County Property Damage
1402 2002 Johnson 1.5M
1402 2002 Leavenworth 1.0M
1402 2002 Wyandotte 4.5M
Total 2002 All 7M
FEMA-1885-DR—March 9, 2010 (December 21, 2009—January 10, 2010): Beginning December 22nd a strong, slow moving storm moved into the western Kansas leaving heavy snow causing icy and snow packed roads in portions of northwestern Kansas. The storm system continued easterly and continued to significantly impact portions of north central, northeastern, and southeastern areas of the State. This storm system created blizzard conditions with dangerously high winds causing blowing/drifting snow, treacherous travel conditions, and impassable roads. Two fatalities and three injuries occurred in two of the more severe accidents.
FEMA-1741-DR—February, 2008 (December 6-19, 2007): Winter weather started across central and southeast Kansas with two different ice storms that moved across the area and produced significant accumulations. The ice caused numerous power outage and approximately 130,000 Kansas customers were without power. Specifically, Kansas Rural Electric Cooperatives reported 49,000 customers without power, Westar reported 76,000 customers, Kansas City Power & Light reported 4,300 customers, and Kansas City, Kansas Board of Public Utilities reported 800 customers without power. Then a major winter storm moved through Kansas during the evening hours of December 14th and the heaviest snow targeted areas still suffering from the ice storm that hit earlier in the week.
FEMA-1579-DR—February 8, 2005 (January 4-6): This was one of the worst ice storms on record to hit central, south central, and southeast Kansas. Although freezing rain was the primary culprit, sleet also played a vital role in coating nearly the entire region with one-two inches of ice, which caused incredible damage to trees, power lines, and power poles. Roads and highways were blocked by tree debris and downed power poles and lines. Many areas were without power for more than a week.
FEMA-1402-DR: Ice Storm—February 6, 2002 (January 29–February 15): Beginning on January 29, a three-day severe winter storm hit 35 Kansas counties in the southeast corner of the State with freezing rain, drizzle, sleet and snow. With one to two inches of ice accumulation, utility poles and power lines snapped, transportation was treacherous and fallen trees damaged many structures. The resulting power outages affected nearly the entire region and lasted nearly a week in some areas. Loss of power was particularly problematic for many nursing homes. There were seven fatalities. This was the worst ice storm in the metropolitan Kansas City area.

3.289
Extent
Winter Storms can severely affect people and property. Normally these storms are associated with extreme temperatures and wind, along with ice that can take down utility lines for days, weeks, even months. It is also very hard for people to be transit during these events and when they last a long time food can be in short supply. Another danger of a winter storm is if the electricity goes out, the heat normally follows, leaving people vulnerable to the cold.
• Johnson County had a reported 16 winter storm events between the years 2000 and 2012. While there were no deaths, injuries, the reported property damage during the 2002 storm was 1.5M. In addition, there were minor traffic accidents and school closings.
• Leavenworth County had 16 winter storms between the years 2000 and 2012, resulting in no deaths, injuries and property damage estimated at 1M. There were minor accidents and schools closings.
• Wyandotte County had 15 winter storms between the years 2000 and 2012, resulting in no deaths, injuries, and reported property damages at 4.5M. As with Johnson and Leavenworth Counties, there were minor accidents and school closings.
Because so many variables come into play during a winter storm the planning committee has determined that the magnitude is critical. Injuries and illnesses do not result in permanent disability (normally), a complete shutdown of facilities could last at least two weeks, and 25% – 50% of property could be severely damaged.
Probability
Johnson and Leavenworth County’s had 16 winter storms in 12 years, resulting in a 100% chance of a winter storm in any given year.
Wyandotte County had 15 winter storms in the past 12 years, resulting in a 100% chance of a winter storm in any given year.
Because Kansas is in a unique position as it relates to the United States, in that the jet stream tends to be directly above it or right over it. This brings the potential for strong storms, including winter storms. Based on historical data, the probability for this hazard is “Highly Likely” within the next three years.
Impact and Vulnerability
Winter Storms, which include snow and ice, have caused significant damage to the planning area in recent years. To assess the vulnerability to this hazard the planning committee assigned ratings to pertinent factors that were examined and the county level. These factors are: social vulnerability index, prior events, prior annualized property damage, building exposure valuation, population density, crop exposure and annualized crop loss. A rating value of 2 – 20 was assigned to the data obtained for each factor and then weighted equally and

3.290
factored together to obtain overall vulnerability scores for comparison and to determine the most vulnerable counties.
Following are the data sources for the rating factors. Social Vulnerability Index for Region L counties from the Hazards and Vulnerability Research Institute at the University of South Carolina, National Climatic Data Center (NCDC) storm events (2006 – 2012), U.S. Census Bureau (2010), USDA’s Census of Agriculture (2007), and USDA Risk Management Agency (2002-2011). In order to adequately describe the winter storm hazard, it was determined that winter storm historical events and property damages is needed back to 1993.
Table 3.186 below provides the factor’s amount per county in Region L that are considered for winter storm vulnerability.
Table 3.186. Vulnerability of Region L Counties Factor Amounts for Winter Storm
To determine potential financial loss estimates to winter storms in the region, the available historical loss data was annualized to determine future potential losses. As discussed above in the vulnerability overview for winter storm, the planning team obtained loss data for the National Climatic Data Center (NCDC) storm events (1993 – 2012). Most of the property damages that occur as a result of winter storms are a result of loss of power. For additional information regarding vulnerability to utility failure, see Section 3.3.19, Utility/Infrastructure Failure.
Table 3.186 provides the annualized property loss damages per county in the region from 1993 through 2012.

3.291
Table 3.186. Annualized Property Loss Damages, 1993 – 2012
County SoVI
Rat
ing
(1
-5)
Prio
r Eve
nts
1993
-201
2
Prop
erty
D
amag
es
Ann
ualiz
ed
Prop
erty
Dam
age
Tota
l Bui
ldin
g Ex
posu
re ($
000)
Popu
latio
n D
ensi
ty
Cro
p Ex
posu
re
Cro
p L
oss
Insu
ranc
e Pa
id
Ann
ualiz
ed C
rop
Lo
ss In
sura
nce
Paid
Mitigation Planning Region L Johnson 1 40 $10,010,000 $500,500 $43,871,468 1,149.60 $29,472,000 $197,938 $19,794 Leavenworth 1 35 $9,770,000 $488,500 $4,877,783 164.7 $20,983,000 $162,813 $16,281 Wyandotte 3 32 $9,760,000 $488,000 $12,066,666 1,039.00 $0 $0 $0 Total 107 $29,540,000 $1,477,000 $60,815,917
$50,455,000 $360,751 $36,075
Source: State Hazard Mitigation Plan 2013
Table 3.187 provides the 1 – 10 ranges for the winter storm vulnerability factor ratings. The Social Vulnerability Index is in a range of 1- 5. To give Social Vulnerability Index the same weight as the other factors, the numbers were multiplied by two.
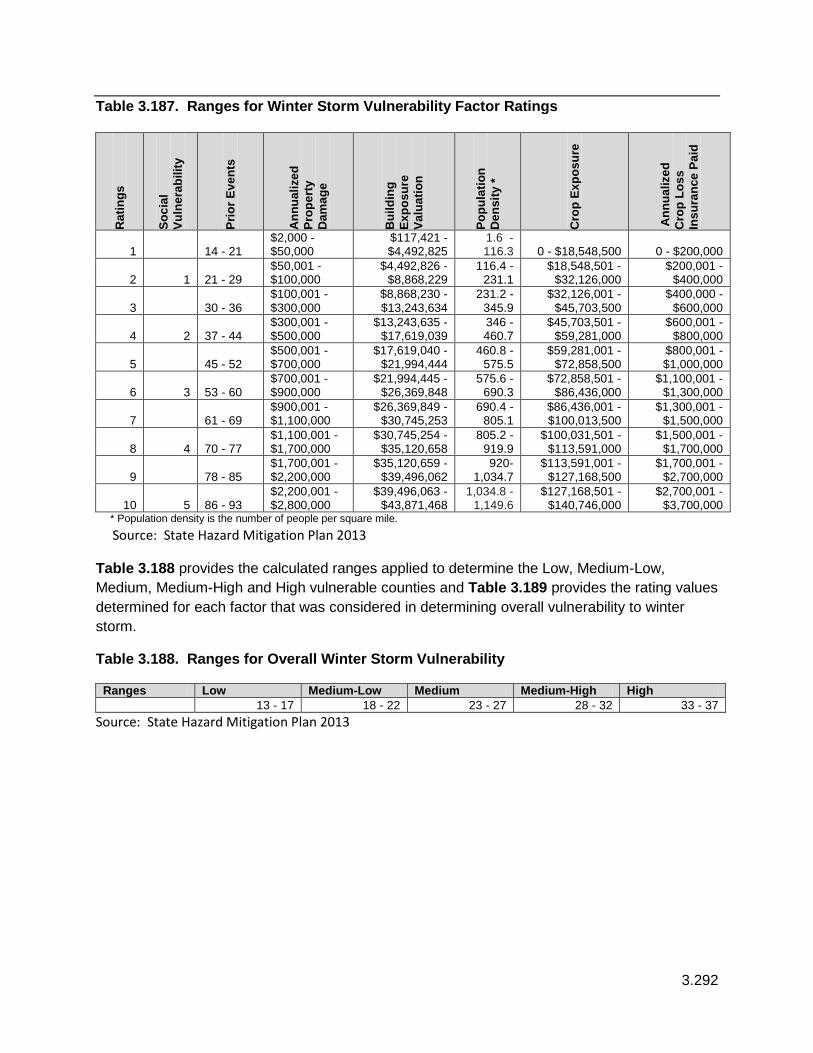
3.292
Table 3.187. Ranges for Winter Storm Vulnerability Factor Ratings R
atin
gs
Soci
al
Vuln
erab
ility
Prio
r Eve
nts
Ann
ualiz
ed
Prop
erty
D
amag
e
Bui
ldin
g Ex
posu
re
Valu
atio
n
Popu
latio
n D
ensi
ty *
Cro
p Ex
posu
re
Ann
ualiz
ed
Cro
p Lo
ss
Insu
ranc
e Pa
id
1 14 - 21 $2,000 - $50,000
$117,421 - $4,492,825
1.6 - 116.3 0 - $18,548,500 0 - $200,000
2 1 21 - 29 $50,001 - $100,000
$4,492,826 - $8,868,229
116.4 - 231.1
$18,548,501 - $32,126,000
$200,001 - $400,000
3 30 - 36 $100,001 - $300,000
$8,868,230 - $13,243,634
231.2 - 345.9
$32,126,001 - $45,703,500
$400,000 - $600,000
4 2 37 - 44 $300,001 - $500,000
$13,243,635 - $17,619,039
346 - 460.7
$45,703,501 - $59,281,000
$600,001 - $800,000
5 45 - 52 $500,001 - $700,000
$17,619,040 - $21,994,444
460.8 - 575.5
$59,281,001 - $72,858,500
$800,001 - $1,000,000
6 3 53 - 60 $700,001 - $900,000
$21,994,445 - $26,369,848
575.6 - 690.3
$72,858,501 - $86,436,000
$1,100,001 - $1,300,000
7 61 - 69 $900,001 - $1,100,000
$26,369,849 - $30,745,253
690.4 - 805.1
$86,436,001 - $100,013,500
$1,300,001 - $1,500,000
8 4 70 - 77 $1,100,001 - $1,700,000
$30,745,254 - $35,120,658
805.2 - 919.9
$100,031,501 - $113,591,000
$1,500,001 - $1,700,000
9 78 - 85 $1,700,001 - $2,200,000
$35,120,659 - $39,496,062
920- 1,034.7
$113,591,001 - $127,168,500
$1,700,001 - $2,700,000
10 5 86 - 93 $2,200,001 - $2,800,000
$39,496,063 - $43,871,468
1,034.8 - 1,149.6
$127,168,501 - $140,746,000
$2,700,001 - $3,700,000
* Population density is the number of people per square mile. Source: State Hazard Mitigation Plan 2013
Table 3.188 provides the calculated ranges applied to determine the Low, Medium-Low, Medium, Medium-High and High vulnerable counties and Table 3.189 provides the rating values determined for each factor that was considered in determining overall vulnerability to winter storm.
Table 3.188. Ranges for Overall Winter Storm Vulnerability
Ranges Low Medium-Low Medium Medium-High High 13 - 17 18 - 22 23 - 27 28 - 32 33 - 37
Source: State Hazard Mitigation Plan 2013

3.293
Table 3.189. Vulnerability of Region L Counties to Winter Storm
County SoVI
Con
vert
ed
Rat
ing
Prio
r Eve
nt
Rat
ing
Ann
ualiz
ed
Prop
erty
Dam
age
Rat
ing
Bld
g Ex
posu
re
Valu
atio
n R
atin
g
Popu
latio
n D
ensi
ty R
atin
g
Cro
p Ex
posu
re
Rat
ing
Ann
ualiz
ed C
rop
Insu
ranc
e R
atin
g
Ove
rall
Vuln
erab
ility
R
atin
g
Win
ter S
torm
Vu
lner
abili
ty
Mitigation Planning Region L Johnson 2 4 5 10 10 2 1 34 High Leavenworth 2 3 4 2 2 2 1 16 Low Wyandotte 6 3 4 3 10 0 1 27 Medium
Source: State Hazard Mitigation Plan 2013
Table 3.190 lists the top vulnerable counties in Kansas relative to each other concerning winter storm events.
Table 3.190. Top Counties Vulnerable to Winter Storm
Mitigation Planning Region County Overall Vulnerability Rating Winter Storm Vulnerability G Sedgwick 37 High G Reno 36 High F Republic 35 High K Marshall 34 High L Johnson 34 High A Thomas 32 Medium-High F Cloud 32 Medium-High F Dickinson 32 Medium-High A Sheridan 31 Medium-High A Sherman 31 Medium-High K Brown 31 Medium-High K Washington 31 Medium-High
Source: State Hazard Mitigation Plan 2013
To determine potential financial loss estimates to winter storms in Kansas, the historical loss data was annualized to determine future potential losses. Loss data was obtained from the NCDC storm events (1993 – 2012). Table 3.191 shows the annualized property loss for Region L by county..
Table 3.191. Annualized Property Loss for Region L
County Property loss ($) Johnson $500,500 Leavenworth $488,500 Wyandotte $488,000 Total 1,477,000 Source: State Hazard Mitigation Plan 2013

3.294
Mitigation Concerns:
• Region L has a huge diverse population of mature trees, which during a winter storm can see limbs breaking and downing power lines. This, in turn, takes out the electricity which puts the population in peril of extremely cold temperatures. If the roads are not accessible this population runs the risk of perishing.
• Heavy snowfall and ice conditions can cause roads to become impassable which results in the population being cut off from emergency services. Medical conditions can be exasperated without medicine or treatment or access to either. Should a fire ensue due to downed power lines, fire trucks could have a hard time reaching the source, again putting the population at risk.
• In the planning area, specifically Johnson County, record storms in the past five years have created traffic issues. Lack of early warning and communication to residents is an area that needs improvement. The lack of early warning and communication to the people of the planning area hampers emergency response for fire rescue, building failures, etc.
Development in Hazard Prone Areas
Structural development is not considered to be an issue for future development in the planning area. The biggest vulnerability comes from downed utility lines, transportation accidents, and exposure of aging infrastructure.
Johnson County
Table 3.192. Johnson County CPRI: Winter Storm
Hazard Type Probability Magnitude Warning
Time Duration CPRI Planning
Significance
Johnson County Winter Storm 4 3 1 3 3.15 High
Leavenworth County
Table 3.193. Leavenworth County CPRI: Winter Storm
Hazard Type Probability Magnitude Warning
Time Duration CPRI Planning
Significance
Leavenworth County Winter Storm 3 3 2 3 2.85 Moderate
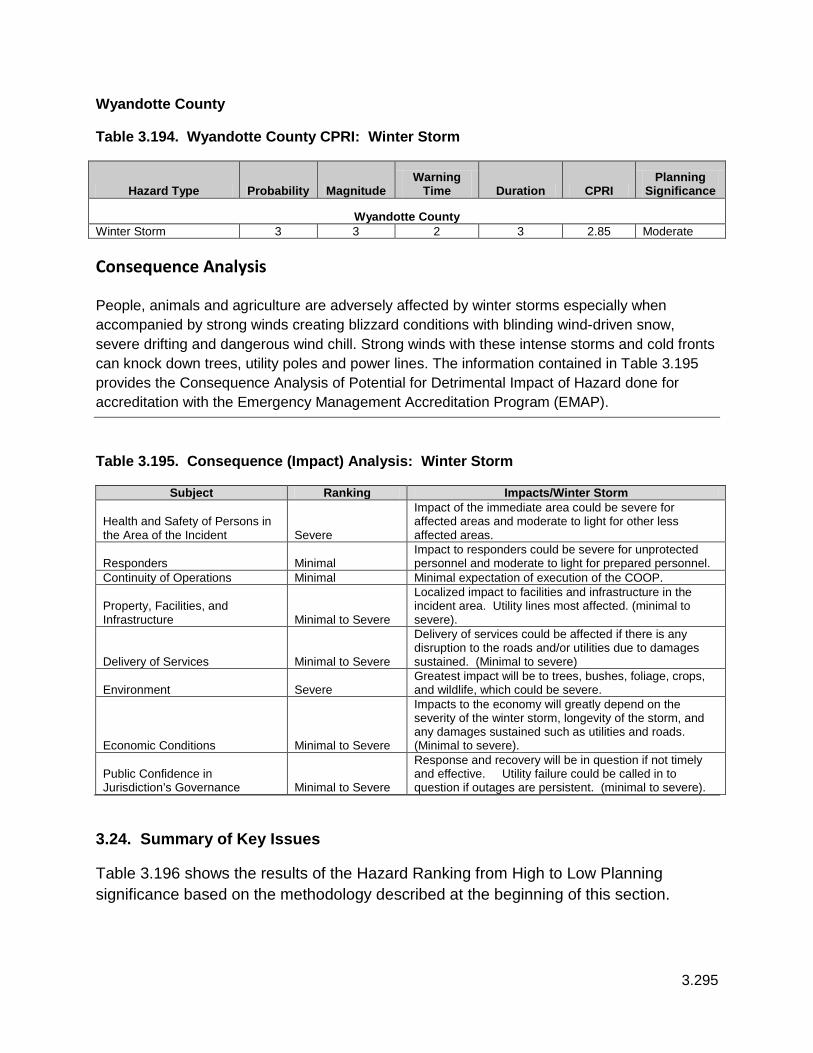
3.295
Wyandotte County
Table 3.194. Wyandotte County CPRI: Winter Storm
Hazard Type Probability Magnitude Warning
Time Duration CPRI Planning
Significance
Wyandotte County Winter Storm 3 3 2 3 2.85 Moderate
Consequence Analysis
People, animals and agriculture are adversely affected by winter storms especially when accompanied by strong winds creating blizzard conditions with blinding wind-driven snow, severe drifting and dangerous wind chill. Strong winds with these intense storms and cold fronts can knock down trees, utility poles and power lines. The information contained in Table 3.195 provides the Consequence Analysis of Potential for Detrimental Impact of Hazard done for accreditation with the Emergency Management Accreditation Program (EMAP).
Table 3.195. Consequence (Impact) Analysis: Winter Storm
Subject Ranking Impacts/Winter Storm
Health and Safety of Persons in the Area of the Incident Severe
Impact of the immediate area could be severe for affected areas and moderate to light for other less affected areas.
Responders Minimal Impact to responders could be severe for unprotected personnel and moderate to light for prepared personnel.
Continuity of Operations Minimal Minimal expectation of execution of the COOP.
Property, Facilities, and Infrastructure Minimal to Severe
Localized impact to facilities and infrastructure in the incident area. Utility lines most affected. (minimal to severe).
Delivery of Services Minimal to Severe
Delivery of services could be affected if there is any disruption to the roads and/or utilities due to damages sustained. (Minimal to severe)
Environment Severe Greatest impact will be to trees, bushes, foliage, crops, and wildlife, which could be severe.
Economic Conditions Minimal to Severe
Impacts to the economy will greatly depend on the severity of the winter storm, longevity of the storm, and any damages sustained such as utilities and roads. (Minimal to severe).
Public Confidence in Jurisdiction’s Governance Minimal to Severe
Response and recovery will be in question if not timely and effective. Utility failure could be called in to question if outages are persistent. (minimal to severe).
3.24. Summary of Key Issues
Table 3.196 shows the results of the Hazard Ranking from High to Low Planning significance based on the methodology described at the beginning of this section.

3.296
Table 3.196. Region L Hazard Ranking-High to Low Planning Significance
Hazard Type Probability Magnitude Warning Time Duration CPRI Planning
Significance
Regional CPRI
Tornado 4 4 4 1 3.70 High
Flood 4 3 3 4 3.55 High
Winter Storm 4 3 2 3 3.30 High
Windstorm 4 2 3 2 3.05 High
Utility/Infrastructure Failure 4 1 4 3 3.00 High
Drought 4 2 3 4 2.95 Moderate
Hazardous Materials 4 1 4 2 2.90 Moderate
Lightning 4 2 2 1 2.80 Moderate
Wildfire 4 1 4 1 2.80 Moderate
Civil Disorder 2 4 4 1 2.80 Moderate
Major Disease Outbreak 2 4 1 4 2.75 Moderate
Hailstorm 4 1 2 1 2.65 Moderate
Terrorism/Agro-terrorism 1 4 4 4 2.65 Moderate
Extreme Temperatures 3 2 1 4 2.50 Moderate
Agricultural Infestation 3 2 1 4 2.50 Moderate
Expansive Soils 3 1 1 4 2.20 Moderate
Dam and Levee Failure 1 3 3 3 2.10 Moderate
Radiological 1 3 3 3 2.10 Moderate
Landslide 1 2 4 1 1.75 Low
Soil Erosion and Dust 2 1 1 4 1.75 Low
Earthquake 1 2 4 1 1.75 Low
Land Subsidence 1 1 3 2 1.40 Low
The planning committee will focus efforts for the mitigation strategy on the hazards with a ranking of a moderate and high planning significance. Some of the key issues brought out via the risk assessment are as follows (this list is not all-inclusive, but highlights some of the planning committee’s concerns).
3.297
• Continued public education for all hazards needs to continue, expand, and improve.
• Utility/Infrastructure is ranked with a high planning significance and the planning committee will pursue mitigation efforts with the major utility companies to help reduce outages.
• Continue compliance with the NFIP to include floodplain management and mitigation of repetitive loss and severe repetitive loss properties.
• Encourage lake Quivira to address NFIP suspension.
• Continue finding funding outlets for safe rooms in schools and public facilities.
• With the large population base in Region L, all hazards need required vigilance so that mitigation efforts can be accomplished to preserve life, and prevent the destruction of property.
3.25 References
General Crop Insurance Payments, USDA Risk Management Agency, 2012
Kansas Disaster History. Federal Emergency Management Agency. www.fema.gov/disasters and Kansas Division of Emergency Management
USDA Declarations, U.S. Department of Agriculture
Mitigation Planning Workshop for Local Governments. Federal Emergency Management Agency. Student Manual. 2004.
National Weather Service Offices: Dodge City, KS— http://www.crh.noaa.gov/ddc/ Goodland, KS— http://www.crh.noaa.gov/gld/ Wichita, KS— http://www.crh.noaa.gov/ict/ Topeka, KS— http://www.crh.noaa.gov/top/ Springfield, MO— http://www.crh.noaa.gov/sgf/ Kansas City/Pleasant Hill, MO— http://www.crh.noaa.gov/eax/ Hastings, NE— http://www.crh.noaa.gov/gid/
Storm Events Database. National Climatic Data Center, www4.ncdc.noaa.gov/cgi-win/wwcgi.dll?wwEvent~Storms
2007 Census of Agriculture, U.S. Department of Agriculture, www.agcensus.usda.gov/index.asp
Analysis of State Development Trends 2007 Census of Agriculture, U.S. Department of Agriculture, www.agcensus.usda.gov/index.asp
Exposure of the Built Environment Values, HAZUS MH 2.1
Kansas Farm Facts, 2011 U.S. Department of Agriculture National Agricultural Statistics Service: http://www.nass.usda.gov/Statistics_by_State/Kansas/Publications/Annual_Statistical_Bulletin/ff2011.pdf
Kansas Fact Sheet. U.S. Department of Agriculture Economic Research Service. www.ers.usda.gov/StateFacts/KS.htm
Kansas Forest Action Plan, Kansas Forest Service/ Kansas State University, Manhattan, Revised October 2011, http://www.kansasforests.org/assessment.shtml
Kansas Population Projections through 2021. Kansas Division of the Budget. http://budget.ks.gov/ecodemo.htm
Social Vulnerability Index. University of South Carolina Department of Geography Hazards and Vulnerability Research Institute. http://webra.cas.sc.edu/hvri/products/sovi.aspx

3.298
U.S. Census Bureau, 2010 Census, www.census.gov
U.S. Census Bureau, Quick Facts, http://quickfacts.census.gov/qfd/states/2000.html Kansas Hazard Mitigation Plan DRAFT 3.583 2013

3.299
2011 Kansas Crop Insurance profile, Rep. USDA Risk Management Agency, n.d. Web. 5 Mar 2013. www.rma.usda.gov/pubs/2012/stateprofiles/kansas11.pdf Kansas Beef Confined Animal Feeding Operations, Kansas Department of Health & Environment, Bureau of Water, Livestock Waste Management
Kansas Cooperative Plant Disease Survey Report, http://www.ksda.gov/includes/document_center/plant_protection/Plant_Disease_Reports/2012KSWheatDiseaseLossEstimates.pdf, dated August 2012
Kansas Department of Agriculture, Plant Protection and Weed Control Division, 2012
Kansas Sensitive Crops Registry, Kansas Department of Agriculture, http://www.ksda.gov/pesticides_fertilizer/content/177
USDA, Animal and Plant Health Inspection Service http://www.aphis.usda.gov/plant_health/plant_pest_info/emerald_ash_b/index.shtml
USDA, National Agricultural Statistics Service, 2007 and 2010
Civil Disorder
Aggieville Riots, http://en.wikipedia.org/wiki/Aggieville_Riots - cite_note-Collegian-3
Electronic Mass Casualty Assessment and `Planning Scenarios (EMCAPS) http://www.hopkins-cepar.org/EMCAPS/EMCAPS.html, Johns Hopkins University, 2006
Inmate Populations, Kansas Department of Corrections Dam and Levee Failure Bureau of Reclamation, http://www.usbr.gov/gp/lakes_reservoirs/kansas_lakes.htm
Dam Failure Incidents, Stanford University‘s National Performance of Dams Program, http://ce-npdp-serv2.stanford.edu/DamDirectory/DamIncidentQuery/IncidentForm.jsp
DFIRM Status, FEMA RVII
FEMA RVII Mid-term Levee Inventory
Federal Dams, Kansas Water Office and Kansas Department of Agriculture, Division of Water Resources; *BOR=Bureau of Reclamation, USF&W = U.S. Fish & wildlife Service; USACE= U.S. Army Corps of Engineers
Information on Augusta levee 1998 damages: USACE Tulsa District Office, Project Update, http://www.swt.usace.army.mil/Portals/41/docs/library/proj-upd/2012-02.pdf
Missouri River Flood Task Force, http://www.nwd-mr.usace.army.mil/rcc/MRFTF/docs/20JunListofLeveeRehabsv1.pdf
State Regulated Dams, Kansas Department of Agriculture, Division of Water Resources, Water Structures Program, 2012
―So You Live Behind a Levee‖ (http://content.asce.org/ASCELeveeGuide.html)
Surface Water in Kansas and its Interactions with Groundwater, 2000, www.kgs.ku.edu/HighPlains/atlas/atswqn.htm
U.S. Army Corps of Engineers, Kansas City District, http://www.nwk.usace.army.mil, various damaged levees maps
U.S. Army Corps of Engineers, National Levee Database, http://nld.usace.army.mil/ Kansas Hazard Mitigation Plan DRAFT 3.584 2013

3.300
Drought Colorado Owes Kansas for Water, Court Rules. Cortez Journal Online. June 12, 2001. http://cortezjournal.com/archives/1news1405.htm.
Drought Impact Reporter. University of Nebraska–Lincoln National Drought Mitigation Center. http://droughtreporter.unl.edu.
Drought monitoring and technical assistance, National Drought Mitigation Center, University of Nebraska–Lincoln, http://www.drought.unl.edu/
Drought Vulnerable Public Water Suppliers Assessment 2007 and 2012, Kansas Water Office
Federal Reservoirs with Water Supply Storage, Kansas Water Office, www.kwo.org/ReservoirInformation/Map_Federal_Lakes_State_Storage.pdf
Historic Droughts of Kansas. U.S. Geological Survey. 2005. http://ks.water.usgs.gov/Kansas/ waterwatch/drought/historic.html.
Kansas Annual Precipitation Normals, Kansas State Research and Extension. Weather Data Library, http://www.ksre.ksu.edu/wdl/AnnualPrecipMaps.asp
Kansas Drought Operations Plan, Governors Drought Team, June 2012
Kansas Drought Resources, Governor‘s Office, http://governor.ks.gov/kansasdrought-resources
Kansas Drought Stage Declarations, Kansas Water Office, www.kwo.org/Reports%20&%20Publications/Drought/Tbl_drought_declarations_051107_twl.pdf
Kansas Water Plan, 2009 Kansas Water Office.
Major and Minor Aquifers in Kansas, Kansas State Geological Survey, http://www.kgs.ku.edu.
National Integrated Drought Information System, National Oceanic and Atmospheric Administration, http.
United States Supreme Court Rules for Colorado in Republican River Dispute With Kansas. Press Release. December 7, 2004. www.ago.state.co.us/press_detail.cfm?pressID=53.
U.S. Geological Survey Kansas Water Science Center. U.S. Geological Survey. http://ks.water.usgs.gov/index.shtml.
Earthquake Earthquakes in Kansas. Kansas Geological Survey. www.kgs.ku.edu/Publications/ GeoRecord/2001/vol7.3/Page1.html.
Earthquake Scenario, HAZUS MH 2.1
HAZUS 99 Estimated Annualized Earthquake Losses for the United States. Federal Emergency Management Agency. FEMA 366. 2001. www.fema.gov/library/index.jsp.
Recent Central US Earthquakes. Center for Earthquake Research and Information. September 7, 2007. http://folkworm.ceri.memphis.edu/recenteqs/.
U.S. Geological Survey, map generated by National Atlas of the United States, www.nationalatlas.gov/
U.S. Geological Survey Earthquake Hazards Program. http://earthquake.usgs.gov/regional/states/kansas/hazards.php. Kansas Hazard Mitigation Plan DRAFT 3.585 2013

3.301
Expansive Soils U.S. Geological Survey publication, http://arcvoid.com/surevoid_web/soil_maps/ks.html
U.S. News and World Report, Aug. 31, 2012 Extreme Temperatures Extreme Heat. Centers for Disease Control and Prevention. http://www.bt.cdc.gov/disasters/extremeheat/
Heat Index Chart and typical health impacts of extreme heat, National Weather Service www.weather.gov/os/heat/index.shtml
Kansas: Temperature Extremes, Information Please Database, Pearson Education, Inc. www.infoplease.com/ipa/A0930179.html
Kansas Environmental Public Health Tracking Program, Kansas Department of Health and Environment
Kansas State Plan on Aging Federal Fiscal Years 2010–2013, Kansas Department on Aging and Disability Services, http://www.kdads.ks.gov/Publications/Publication_Index.html.
Kansas State Research and Extension, Climatic Maps of Kansas, http://www.ksre.ksu.edu/wdl/ClimaticMaps.htm.
National Weather Service, Goodland, KS http://www.crh.noaa.gov/news/display_cmsarchive.php?wfo=gld
National Weather Service, Wichita, KS http://www.crh.noaa.gov/ict/scripts/archives.php?reqYear=2012
Wind Chill Chart, National Weather Service
Winter Weather, Centers for Disease Control and Prevention. http://www.bt.cdc.gov/disasters/winter/ Flood HAZUS MH 2.1
Kansas Commission on Emergency Planning and Response, 2011 Annual Report: Managing the Risk
Kansas River Basins, USGS Fact Sheet, Water Use in Kansas, 1990-2000 by Joan F. Kenny and Cristi V. Hansaen, http://pubs.usgs.gov/fs/2004/3133/pdf/fs04_3133.pdf.
K-State Research and Extension, http://www.ksre.ksu.edu/wdl/AnnualPrecipMaps.asp
FEMA‘s Policy and Claim Statistics for Flood Insurance, http://www.fema.gov/policy-claim-statistics-flood-insurance/policy-claim-statistics-flood-insurance/policy-claim-13
Kansas Floodplain Management Newsletter, May 2009
http://www.ksda.gov/includes/document_center/structures/Floodplain/may2009FP.pdf
Repetitive Loss/Severe Repetitive Loss, Flood Insurance Administration
Surface Water in Kansas and its Interactions with Groundwater, 2000, http://www.kgs.ku.edu/HighPlains/atlas/atswqn.htm
Various Flood Photos, Kansas Division of Emergency Management Kansas Hazard Mitigation Plan DRAFT 3.586 2013
3.302
Hail Hail Basics. National Oceanic and Atmospheric Administration National Severe Storm Laboratory. www.nssl.noaa.gov/primer/hail/hail_basics.html
Hailstorm Intensity Scale, Tornado and Storm Research Organization (TORRO), Department of Geography, Oxford Brookes University
Hazardous Materials Hazardous materials accidents statistics and top ranked worst case scenario facilities, Kansas Division of Emergency Management, Technological Hazards Section
Incident and Accident Data. U.S. Department of Transportation Office of Pipeline Safety. http://primis.phmsa.dot.gov/comm/reports/safety/KS_detail1.html?nocache=3112,
Kansas Department of Health and Environment, Division of Environment http://www.kdheks.gov/environment/index.html
Kansas gas transmission lines and petroleum pipelines, Kansas Corporation Commission
Kansas transportation routes, Kansas Department of Transportation
National Response Center. www.nrc.uscg.mil.
Pipeline mileage, U.S. Department of Transportation, Pipeline & Hazardous Materials Safety Administration http://primis.phmsa.dot.gov/comm/reports/safety/KS_detail1.html?nocache=3112#_OuterPanel_tab_6
Superfund National Priorities List Sites in Kansas. U.S. Environmental Protection Agency Superfund. www.epa.gov/superfund/sites/npl/ks.htm.
Land Subsidence Aber, S. The Many Uses of Salt from the Earth. Emporia State University. 2007. www.geospectra.net/salt.
Croxton, N. Subsidence on 1-70 in Russell County, Kansas Related to Salt Dissolution: A Short History. U.S. Department of Transportation Federal Highway Administration. 2005. www.fhwa.dot.gov/engineering/geotech/hazards/mine/workshops/kdot/kansas02.cfm
Kansas Department of Health and Environment Abandoned Mine Land (AML) Program, http://www.kdheks.gov/mining/emergency.html
Karst Features in Kansas, U.S. Geological Survey, mapped by the National Atlas of the United States, www.nationalatlas.gov
Macfarlane, P., M. Townsend, and G. Ohlmacher. Midcontinent Meeting for the National Karst Map Project-Field Trip Notes. Kansas Geological Survey. 2005. www.kgs.ku.edu/Hydro/Publications/2005/OFR05_50/OFR2005_50.pdf.
Subsurface Void Space and Sinkhole/Subsidence Area: Inventory for the State of Kansas. Kansas Department of Health and Environment. 2006, http://www.engg.ksu.edu/CHSR/outreach/tosnac/sites/docs/04.pdf
Using multiple logistic regression and GIS technology to predict landslide hazard in northeast Kansas, USA, Ohlmacher, G. C.; Davis, J. C., 2003
WIBW.com: http://www.wibw.com/home/headlines/1233947.html Kansas Hazard Mitigation Plan DRAFT 3.587 2013

3.303
Landslide Kansas Geological Survey, http://www.kgs.ku.edu/Publications/AnnRep02/hazards/hazards.html
Ohlmacher, G. Landslides in Kansas. Kansas Geological Survey. 1999. www.kgs.ku.edu/Publications/pic13/pic13_1.html.
Lightning U.S. Lightning Fatalities by State, NOAA, http://www.lightningsafety.noaa.gov/stats/59-11_fatalities_rates.pdf
Vaisala, http://www.vaisala.com/en/products/thunderstormandlightningdetectionsystems/Pages/NLDN.aspx Major Disease Outbreak Annual Infectious Disease Summaries, Kansas Department of Health & Environment, Bureau of Surveillance and Epidemiology, http://www.kdheks.gov/epi/index.html.
Influenza health care workers vaccinations, Kansas Healthcare Collaborative
Pandemic Influenza Plan, Kansas Department of Health & Environment
U.S. Centers for Disease Control and Prevention
Radiological Emergency Planning Zones, Kansas Department of Health and Environment Soil Erosion and Dust Federal Public Water Supply Reservoirs in Kansas, Kansas Water Office
Kansas State University‘s Wind Erosion Laboratory
Natural Resources Inventory: 2007 Annual NRI Report—Soil Erosion. Natural Resources Inventory, 2007, http://www.nrcs.usda.gov/technical/NRI/2007/2007_NRI_Summary.pdf.
Wind Erosion Research Unit, U.S. Department of Agriculture Agricultural Research Service, www.weru.ksu.edu.
USDA‘s Long Term Monitoring of Wind Erosion Induced Changes to Soil Properties in Western Kansas Study, http://topsoil.nserl.purdue.edu/~flanagan/isele2011/presentations/11113-Tatarko.pdf Terrorism/ Agri-Terrorism Electronic Mass Casualty Assessment and Planning Scenarios (EMCAPS), Johns Hopkins University, 2006 http://www.hopkins-cepar.org/EMCAPS/EMCAPS.htmlFederal Bureau of Investigation
Gunman Kills Man in Church. New York Times. March 7, 1988.
Holiday Inn Sniper Remembered 30 Years Later. KSNW-TV. September 5, 2006. Kansas Hazard Mitigation Plan DRAFT 3.588 2013

3.304
Tornado 2012 Kansas Severe Weather Awareness Week packet
Enhanced Fujita Scale for Tornado Damage, National Weather Service, www.spc.noaa.gov/faq/tornado/ef-scale.html
Federal Emergency Management Agency. 2004. Taking Shelter from the Storm: Building a Safe Room inside Your House. Publication 320.
National Oceanic and Atmospheric Administration. National Severe Storms Laboratory. Severe Weather Primer: Tornado. www.nssl.noaa.gov/primer/tornado/tor_basics.html.
National Oceanic and Atmospheric Administration. National Weather Service. Tornadoes. www.nws.noaa.gov/om/brochures/tornado.shtml.
Mobile home units per county, U.S. Census Bureau American Community Survey 2005 – 2009. Utility/Infrastructure Failure Coupler Clatter. Great Plains Dispatcher. September 2006. www.gptm.us/dispatcher/06_09.pdf.
General Information, Kansas Corporation Commission
General Information, Federal Energy Regulatory Commission
Highway Map, Kansas Department of Transportation
Loss of Service for Utilities and roads/Bridges, FEMA BCA Reference Guide, June 2009, Appendix C
Kansas 2009 Energy Report http://kec.kansas.gov/energy_plan/09Plan-Ch8-Section8_1.pdf
Telephone Exchange Areas, Kansas Corporation Commission, http://www.kcc.state.ks.us/maps/ks_telephone_certified_areas.pdf
Top Ten Lists—Oil and Gas Production. Kansas Geological Survey. May 31, 2007. www.kgs.ku.edu/PRS/Info/topTen.html.
Water Suppliers, Kansas Water Office, http://www.kwo.org/Kansas_Water_Plan/KWP_Docs/VolumeIII/Statewide/map_statewide_KWP_PWS_090508_tr.pdf Wildfire Firewise Communities, Kansas Firewise Community http://submissions.nfpa.org/firewise/fw_communities_list.php
Kansas Forest Action Plan, Kansas Forest Service/ Kansas State University, Manhattan, Revised October 2011, http://www.kansasforests.org/assessment.shtml
National Fire Incident Reporting Statistics, Kansas Forest Service
National Interagency Fire Center Predictive Services, http://www.predictiveservices.nifc.gov/outlooks/monthly_seasonal_outlook.pdf
National Weather Service. 2007 Kansas Severe Weather Awareness Week Information Packet. 2007. www.crh.noaa.gov/Image/top/2007KANSAS.pdf.
Topeka Capital-Journal, http://cjonline.com/news/2012-09-02/wildfire-activity-unique-extreme-dry-kansas-summer Kansas Hazard Mitigation Plan DRAFT 3.589 2013 Wa rd, K. 1st Wildfire Prevention Week March 25-31 across Kansas. Kansas State University Agricultural Experiment Station and Cooperative Extension Service. Press Release. March 15, 2007. www.oznet.ksu.edu/news/sty/2007/wildfire_prevention031507.htm. Windstorm Damaging Winds Basics. National Oceanic and Atmospheric Administration National Severe Storm Laboratory. www.nssl.noaa.gov/primer/wind/wind_basics.html. Winter Storm Average Annual Snowfall, Kansas State University, Research and Extension, Weather Data Library, www.oznet.ksu.edu/wdl/Maps/Climatic/AnnualFreezeMap.asp

3.305
―Freezing Rain Events in the United States‖. American Meteorological Society, http://ams.confex.com/ams/pdfpapers/71872.pdf.
Kansas snowfall and snow depths extremes, National Data Climatic Center Snow Climatology, http://www.ncdc.noaa.gov/ussc/USSCAppController?action=extremes&state=14
Winter Storms: The Deceptive Killers. National Oceanic and Atmospheric Administration. National Weather Service. 2001. www.nws.noaa.gov/om/winterstorm/winterstorms.pdf.
Winter storm descriptions, National Weather Service.

Region L Hazard Mitigation Plan, 2013 Final 4.1
4 Mitigation Strategy
44 CFR Requirement §201.6(c)(3): The plan shall include a mitigation strategy that provides the jurisdiction’s blueprint for reducing the potential losses identified in the risk assessment, based on existing authorities, policies, programs and resources, and its
ability to expand on and improve these existing tools.
This section describes the mitigation strategy developed by the planning committee based on the risk assessment. The mitigation strategy was developed through a group process by the counties of Johnson, Leavenworth, and Wyandotte and consists of general goal statements that are broad in nature. These statements will serve to guide the jurisdictions in their efforts to lessen, or avoid, the impacts brought about by natural disasters. The definitions below are based on those found in the 2013 FEMA Local Mitigation Handbook:
• Goals – general guidelines that are usually broad policy-type statements that are long term. They represent visions for reducing or avoiding losses from the identified hazards.
• Mitigation Actions – Specific projects and activities that help achieve the
goals.
IAW 44CFR, Requirement §201.6(c)(3)(ii) The mitigation strategy must address the jurisdictions participation in the NFIP and continued compliance with the NFIP requirement, as appropriate:
The NFIP provides the maps and regulatory basis for local floodplain management. It is also the nation’s leading source of insurance protection for flood prone properties. Involvement in NFIP is based on an agreement between local jurisdictions and FEMA. There are 3 basic areas:
• Mapping and floodplain identification. Communities are required to adopt the flood may in order to participate in NFIP. This allows for awareness of flood hazards, and the statistics needed to manage the floodplain program. In addition it is a tool used to rate new construction for flood insurance purposes.
• Floodplain Management. In order to participate in the NFIP, communities must adopt and enforce minimum floodplain management regulations in order to facilitate mitigation to reduce, lesson, or eliminate the effects of flooding on structures.
• Flood Insurance. The NFIP is a way for property owners to purchase insurance for protection against flood losses in exchange for State and community floodplain management regulations.
The NFIP is an agreement between the federal government and communities. The home owner is provided the opportunity to purchase flood insurance through the NFIP, which standard

Region L Hazard Mitigation Plan, 2013 Final 4.2
insurance providers do not carry. This NFIP insurance is made available to communities that regulate development in their mapped floodplain to reduce the risk of flooding. More information can be found in Chapter 3 – Risk Assessment: Flood. This chapter also includes the jurisdictions that actively participate in the NFIP program.
4.1 Goals
44 CFR Requirement 201.6©(3)(i): The hazard mitigation strategy shall include a description of mitigation goals to reduce or avoid long-term vulnerabilities to the identified hazards.
The planning committee for Region L developed the following goals to provide direction for the elimination, reduction, and/or avoidance of hazard-related losses.
During the second meeting, the planning committee looked at the goals for the three counties of Johnson, Wyandotte, and Leavenworth as written in their current plans. These goals were scrutinized and scrubbed to come up with the goals that best define the Region in their effort to reduce or avoid losses from identified hazards.
Goal 1: Reduce or eliminate risk to the people and property of Region L from the impacts of the identified hazards in this plan.
Goal 2: Strive to protect all vulnerable populations, structures, and critical facilities in Region L from the impacts of the identified hazards.
Goal 3: Improve public outreach initiatives to include education, awareness and partnerships with all entities in order to enhance understanding of the risk the Region faces due to the impacts of the identified hazards.
Goal 4: Enhance communication and coordination among all agencies and between agencies and the public.
4.2 Mitigation Actions
Requirement §201.6(c)(3)(ii): [The mitigation strategy shall include a] section that identifies and analyzes a comprehensive range of specific mitigation actions and projects being considered to reduce the effects of each hazard, with particular emphasis on new and existing buildings and infrastructure.
During the kickoff meetings, the committee was provided a worksheet to facilitate the development of action ideas. In addition, the committee was provided a worksheet on different types of mitigation actions.
Committee members were asked to review their current mitigation actions and formulate new key issues identified for each hazard. They were then asked to work with their jurisdictional partners to develop specific mitigation action ideas to eliminate, lessen, or avoid disaster

Region L Hazard Mitigation Plan, 2013 Final 4.3
impacts associated with each hazard. In addition, committee members were also tasked to update the status of each of their prior actions that were provided via handout. The status that could be assigned was on-going, deferred, completed, deleted, or merged. This status update was due at the second meeting.
Prior to the second meeting each jurisdiction represented in the plan submitted new action items which were consolidated, and where there was duplication the actions were merged into one. The new actions were discussed for their validity and sustainability to be incorporated into the existing action table.
During the final meeting, the identified actions, new and updated, were presented to the committee for their final review. These actions can be viewed in Table 4.1 at the end of this section.
4.3 Implementation of Mitigation Actions
44 CFR Requirement §201.6(c)(3)(ii): The mitigation strategy shall include an action strategy describing how the actions identified in paragraph (c)(2)(ii) will be prioritized, implemented, and administered by the local jurisdiction. Prioritization shall include a special emphasis on the extent to which benefits are maximized according to a cost benefits review of the proposed projects and their associated costs. Committee members were instructed to select mitigation actions they wanted to include in the strategy of the plan for their jurisdiction and/or develop additional actions that might surface. The members were provided a Mitigation Action Implementation Worksheet, a copy of all the actions in their current approved plan, and the STAPLEE form that was applicable to those actions. The STAPLEE worksheet is a tool to assist the jurisdictions with prioritization of submitted actions. STAPLEE is a tool used to assess the costs and benefits, and overall feasibility of mitigation actions. STAPLEE stands for the following: Social: Will the action be acceptable to the community? Technical: Is the action technically feasible? Are there secondary impacts? Does it offer a long-term solution? Administrative: Are there adequate staffing, funding, and maintenance capabilities to implement the project? Political: Will there be adequate political and public support for the project? Legal: Does your jurisdiction have the legal authority to implement the action? Economic: Is the action cost-beneficial? Environmental: Will there be negative environmental consequences from the action? Does it comply with environmental regulation? In order to prioritize the mitigation actions, the planning committee elected to review the STAPLEE forms for each forwarded action from the prior mitigation plan (these forms can be found in the prior mitigation plans for all the counties in Region L). During this review it was determined that no jurisdiction had any significant changes that would distort the finding from the last plan to the current plan. Therefore, other than items that were deleted or completed, the STAPLEE remained the same. However, during the discussion of the existing actions, new
Region L Hazard Mitigation Plan, 2013 Final 4.4
actions were brought up to be included in the plan. The new action items did not go through the STAPLEE process, but instead were prioritized based on the following: High – Immediate danger to critical infrastructure and potential death to parts of the population, with a major loss to economic recovery should a disaster strike. Medium – Damage to critical infrastructure and injury to the population, with medium impact to the economy. Low – Jurisdictions know that the project needs to be addressed. The Population and critical infrastructure could potentially be affected but it is not imminent. Not a high priority. This criteria was used due to the ineffectiveness of the STAPLEE process. The STAPLEE does not represent how the jurisdictions accurately prioritize the actions that they have ranked as high, medium or low. As such, each jurisdiction was instructed to write down what they use as their criteria for determining an actions high, medium, or low status. As this process unfolded the planning committee came to the realization that there is no standard on how each jurisdiction ranks their actions. What is a high ranking for a hospital may only be a medium ranking for a county. This in and of itself has created a new action item for the region: to come up with a standardized ranking system across the board. In order to begin the process, the planning committee came up with the following criteria that is representative of the majority of the action rankings, albeit not all inclusive. One element that did stand out with regards to prioritization of the actions was the cost benefit review. It was agreed that this element would be considered before and during the prioritization and the implementation of the agreed upon actions. FEMA requires a 1:1 ratio of cost to benefits, which the planning committee felt was necessary to adhere to. The actual implementation of the actions by the jurisdictions were dependent on funding availability, however the planning committee were in agreement that all policies, regulations, and legal procedures would be utilized once an action was scheduled for implementation. The actions, old and new, for the Regional Mitigation Plan were then distributed among the applicable jurisdictions for a final quality check, review, and discussion. These actions can be found in Table 4.1.
Another important aspect of the mitigation strategy is the ability for the Region and its communities to implement the actions that they have prioritized. The number one reason for actions not being completed were due to lack of funding. The following are available programs and funding capabilities that can be pursued in order to meet the goals of this plan:
The Hazard Mitigation Grant Program (HGMP) – The Hazard Mitigation Grant Program is authorized by Section 404 of the Robert T. Stafford Disaster Relief and Emergency Assistance Act, as amended (the Stafford Act), Title 42, United States Code (U.S.C.) 5170c. The key purpose of HMGP is to ensure that the opportunity to take critical mitigation measures to reduce the risk of loss of life and property from future disasters is not lost during the reconstruction process following a disaster. HMGP is available, when authorized under the Presidential Major Disaster Declaration, in the areas of the state requested by the governor. The amount of HMGP funding available to the applicant is based upon the total federal assistance provided by FEMA for disaster recovery under the major disaster declaration.

Region L Hazard Mitigation Plan, 2013 Final 4.5
The Pre‐Disaster Mitigation (PDM) Program - The Pre-Disaster Mitigation program is authorized by Section 203 of the Stafford Act, 42 U.S.C. 5133. The PDM program is designed to assist states, territories, Indian tribal governments, and local communities to implement a sustained pre‐disaster natural hazard mitigation program to reduce overall risk to the population and structures from future hazard events, while also reducing reliance on federal funding from future major disaster declarations.
National Flood Mitigation Fund - The Act (called the Biggert-Waters Flood Insurance Reform Act of 2012, found in H.R. 4348) consolidates the three of the NFIP funded mitigation programs described below into a single program. The combined National Flood Mitigation Fund is to be funded at $90 million per year. While the old Flood Mitigation Assistance (FMA) and Severe Repetitive Loss (SRL) program were funded annually at up to $40 million per year each and the Repetitive Flood Claims (RFC) program at up to $10 million annually, the SRL program was never fully utilized in part due to its complexity. More Information can be found at: http://www.fema.gov/flood-insurance-reform-act-2012. The new program simplifies and combines the three previous programs and includes the following elements:
• Encourages flood mitigation planning to be integrated into a community’s multi-hazard mitigation plan,
• Adds demolition/ rebuild (mitigation reconstruction) as an allowed mitigation activity under all programs,
• Caps the use of mitigation grant funds for mitigation planning activities at $50,000 (states) and $25,000 (communities),
• Provides for denial of grant funds if not fully obligated in 5 years, and
• Restructures federal share requirement:
Up to 100% for severe repetitive loss structures (4+ Claims of over $5000 or 2+ claims Up to 90% for repetitive loss structures (2 claims over 10 years averaging at least 25% of value of structure)
Up to 75% for other approved mitigation activities.
Fire Management Assistance Grant Program - This program, which provides a 75 percent federal share/25 percent state share, is available to states, as well as local and tribal governments. It provides for the mitigation, management, and control of fires on publicly or privately owned forests or grasslands, which threaten such destruction as would constitute a major disaster. The process is initiated when the state requests federal assistance for an event where the threat of major disaster exists for either single fires or numerous small fires.
Kansas Department of Agriculture – Division of Conservation

Region L Hazard Mitigation Plan, 2013 Final 4.6
Multipurpose Small Lakes Program - This program provides state cost-share assistance to a government entity for the construction or renovation of a dam for flood control and water supply and/or recreational purposes. It requires a general plan of works and a local nonpoint source pollution control plan.
Nonpoint Source Pollution Control - KDA-DOC distributes funding for implementation of local nonpoint source pollution management plans and supports the installation of best management practices involving sediment control, abandoned water well plugging, nutrient and pesticide management, household waste disposal, livestock waste systems, onsite waste systems, dump site reclamation and chemical containment. The agency provides cost shares to local landowners for practice implementation, supports local technical assistance and provides funding for local no till information and education programs
Riparian and Wetland Protection Program - This program is meant to financially assist and address the conservation and management of riparian areas and wetlands. Financial assistance is provided to implement practices such as tree planting, riparian fencing, wetland enhancement and other innovative bioengineering practices.
State Assistance to Watershed Dam Construction - The State provides cost-share assistance to organized watershed districts and other special purpose districts for the implementation of structural and nonstructural practices that reduce flood damage. Structural practices must be approved by the chief engineer of the Division of Water Resources.
Water Quality Buffer Initiative - This program provides additional incentive for participation in the Continuous Sign-Up provision of the U.S. Department of Agriculture Conservation Reserve Program. The program supplements the federal rental payments for the Conservation Reserve Program by 30 percent for grass filter strips or 50 percent for riparian forest buffers.
Water Resources Cost Share Program - This program provides state cost-share assistance to landowners for the establishment of enduring water conservation practices to protect and improve the quality and quantity of Kansas water resources. This includes targeting water quality funds to address total maximum daily load and other issues in priority areas, continuing base level funding to address water resource problems, technical assistance funding to landowners to implement best practices and maintaining the irrigation efficiency focus in western Kansas.
Water Conservation Program - This program provides financial incentives for voluntary retirements of private water rights in high priority areas. The Water Transition Assistance Program (WTAP) and the Conservation Reserve Enhancement Program (CREP) are two projects currently operating in approved target areas. Only those water rights, which can result in significant water conservation benefits to the State’s rivers, streams and aquifers are selected for these grants.

Region L Hazard Mitigation Plan, 2013 Final 4.7
Watershed Planning Assistance Program - The program provides financial assistance for engineering and environmental services, general plan development, and other flood control and rehabilitation projects in watershed districts.
Water Supply Restoration Program - This program provides financial assistance to renovate and protect lakes, which are used directly as a source of water for public water supply systems, where appropriate, and where watershed restoration and protection practices are planned or in place. Eligible sponsors include any entity with taxing authority and the right of eminent domain, rural water districts and public wholesale water supply districts.
Kansas Department of Agriculture—Division of Water Resources
Community Assistance Program - KDA-DWR participates in FEMA’s Community Assistance Program, which enhances the State’s capability to provide floodplain management information and technical assistance to help local officials in NFIP and CRS participating communities. It also encourages nonparticipating communities to join the NFIP and CRS.
Floodplain Management Program - KDA-DWR coordinates and provides technical assistance for local, state and federal floodplain management, including managing the NFIP and floodplain ordinances and regulations adopted by city and county governments.
Levees and Drainage District Program - This program regulates the construction of levees and dikes and the formation of drainage districts to address local issues regarding drainage problems and their amelioration.
Operations and Technical Services Program - This program provides administrative and technical support to the chief engineer of the KDA-DWR. The program addresses interstate compact administration, GIS, intensive groundwater use control areas, flow meter specifications and water assurance districts.
Special Management Programs - KDA-DWR is responsible for management of water resource-related issues, such as the Groundwater Management District Act and the Intensive Groundwater Use Control Area. It also monitors the observation well network, has designated responsibilities under the Water Assurance District Act, and reviews and approves of water conservation plans.
Stream Obstructions Program - This program regulates and monitors the changes in the course, current, or cross section of a stream; processes applications; reviews and approves plans; inspects ongoing projects before, during, and after construction; and performs ongoing safety inspections.
Watershed District Program and Multipurpose Small Lakes Program - These programs support the division’s responsibilities to perform regulatory and supervisory tasks during the formation of a watershed district and for projects to be built under the Small Lakes Program (see Kansas Department of Agriculture, Division of Conservation).
Region L Hazard Mitigation Plan, 2013 Final 4.8
Kansas Department of Commerce
Community Service Tax Credit - This incentive program offers Kansas tax credits for contributions to approved projects. Tax credits for nonprofit organizations allow them to improve their ability to undertake major capital fundraising drives. Projects eligible for tax credit awards include community service, crime prevention and health care
Kansas Partnership Fund - This fund provides low-interest state loans to cities and counties for infrastructure improvements that support Kansas basic enterprises. Loans are designed to help city and county governments attract new businesses and expand existing businesses.
Small Cities Community Development Block Grant Program - The department administers the CDBG program, awarding grants in four categories: community improvement, urgent need, Kansas Small Towns Environment Program and economic development. The CDBG program is a competitive grant process through which about half of the funding goes to support the development of community facilities and water and sewer projects.
Kansas Department of Corrections—Capital Improvements and Facilities Maintenance
Mitigation-related responsibilities of the Kansas Department of Corrections include public health and safety services, property repair and rehabilitation and property acquisition.
Kansas Department of Education
The Department oversees the education of students in Kansas in grades K-12.
Unified School Districts in Kansas are encouraged to participate in local multi-jurisdictional hazard mitigation plans and identify mitigation actions. Many mitigation actions include construction of tornado safe rooms in their buildings; education on hazards and ongoing required drills to protected lives during fires, tornadoes, and intruders.
Kansas Department of Health and Environment—Bureau of Environmental Remediation
Abandoned Mine Land Program - The Surface Mining Section is responsible for the reclamation of abandoned coalmines in Kansas and administers federal funds from the Office of Surface Mining Reclamation and Enforcement to address past mining problems that are hazardous to the health, safety, and general welfare of the public. Reclamation includes land clearing, backfilling and grading, erosion and site drainage control, guardrail and fence installation, demolition and disposal, and revegetation. The Abandoned Land Mine Emergency Program provides for the remediation of sites that are an immediate threat to the health and safety of the general public. These problems require prompt action and therefore cannot be reclaimed through ordinary program procedures. Kansas currently has over 350 abandoned coal mine sites identified with health and safety problems. Typical abatement activities include backfilling mine subsidence holes in residential areas and near roads and filling subsurface voids beneath structures and roads with cement grout.

Region L Hazard Mitigation Plan, 2013 Final 4.9
Kansas Brownfields Program - Brownfields are real property, the expansion, redevelopment, or reuse of which may be complicated by the presence or potential presence of a hazardous substance, pollutant, or contaminant. Often the potential liability associated with contamination complicates business development, property transactions, or expansion on these properties.
Cleaning up and redeveloping brownfields properties is necessary to preserve neighborhoods, reduce urban sprawl, and stop the continued development of new industrial and commercial facilities on farmland. By investigating and cleaning up a brownfields property and taking care of the site's potential health or environmental risks, communities can use local land again - producing jobs, increasing the tax base, or adding other benefits such as creating a park or residential area.
Almost every city and county, in both rural and urban areas, has brownfields properties. KDHE currently has programs to assist communities with the redevelopment of brownfields properties.
State Water Plan Contamination Remediation Program - Funding from the State Water Plan Fund is provided for the evaluation, monitoring, and remediation of contaminated groundwater or surface water sites, as well as contamination source areas in Kansas where the responsible party is not known or is unable or unwilling to undertake the necessary action. The program also provides funding to supply alternate water sources as an emergency response action to residences with contaminated drinking water sources.
Kansas Department of Insurance
The Department provides estimates of storm losses in Kansas since 2002 as a public service http://www.ksinsurance.org/storms/index.php . The data consists of windstorm, tornado and hail damage or other weather-related claim losses for insured real and personal property. It is reported for each calendar year and monthly during the calendar year. The Department also promotes flood and earthquake insurance as a pre-mitigation measure.
Kansas Department of Transportation
Corridor Management Program - The purpose of this program is to balance traffic and access management with land use management to protect public safety, public investment in the highway system, and private investment in property development on adjacent lands. The goal of corridor management is to create and preserve safe, efficient, and economically viable transportation corridors.
Transportation Enhancement Program - This is an annual competitive Federal Transportation Enhancement funded program that can be used for transportation enhancement activities that include environmental mitigation to address water pollution due to highway runoff or reduce vehicle-caused wildlife mortality while maintaining habitat connectivity.
Kansas Forest Service

Region L Hazard Mitigation Plan, 2013 Final 4.10
Community Forestry Program - This program provides assistance, education, and support to communities and municipalities in organizing urban and community forestry programs, identifying resource needs, setting priorities of work, and training city employees
Rural Forestry Program - Professional foresters provide “on-site” forest management and agro forestry analysis and recommendations through inventory of forests, woodlands and windbreaks.
Conservation Tree Planting Program - The tree-planting program provides tree and shrub seedlings for conservation plantings to establish forests, woodlands and shelterbelts ant to mitigate loss of forestland.
Environmental Education and Financial Assistance - The Kansas Forest Service provides a variety of publications, field days and workshops all available on the Web at www.kansasforests.org.The Kansas Forest Service administers the Volunteer Fire Assistance cost-share grant program that provides financial assistance to fire departments. Such programs as the USDA conservation programs provide for incentives to protect and implement forestry practices through the Environmental Quality Incentives Program (EQIP), the Cooperative Conservation Partnership Initiative, the Continuous Conservation Reserve Program and other programs are available to landowners.
Firewise Program - The Kansas Firewise program offers prevention materials for homeowners to reduce the threat of wildland fire in rural and high-risk areas. There is currently only one Firewise community in Kansas.
Forest Health Program - This program monitors the impacts of insects, diseases, drought, flooding and other health issues in forests, woodlands, windbreaks and conservation tree plantings by providing diagnosis and control recommendations and mitigation and planning for Emerald Ash Borer, Asian Bush Honeysuckles and other invasive species.
Forest Stewardship - Develops long-term comprehensive management plans and specific project plans for tree planting, forest stand improvement, timber harvest and windbreak establishment and renovation. The program maximizes and mitigates the forest and agro forestry benefits of water quality, clean air, aesthetics, wildlife, soil conservation, recreation, and timber products.
Streamside Forestry Program – Assesses protects and establishes trees adjacent to streams and rivers with the primary objective of improving water quality by stabilizing stream banks and providing vegetative filters between crop fields and waterways.
Landowner Education - The agency provides information and education to farmers regarding the benefits of good forest management. This includes information about federal cost share practices including the Environmental Quality Incentives Program, Conservation Reserve Program, and the Riparian and Wetland Protection Program.

Region L Hazard Mitigation Plan, 2013 Final 4.11
Rural Fire Protection - The agency provides fire support services to rural fire departments, including wildfire training, Smokey Bear fire prevention materials, and the acquisition and distribution of excess military vehicles for conversion to firefighting units.
Kansas Geological Survey
High Plains Aquifer Information Network (HIPLAIN) - This joint effort between the Kansas Geological Survey and Kansas State University is dedicated to providing information, data, and resources related to the High Plains aquifer.
Information Collection and Dissemination - The Kansas Geological Survey develops and hosts web-based information retrieval systems to allow access to water-related data accumulated since 1975.
Ogallala Aquifer Study - The Kansas Geological Survey conducts research on the extent and characteristics of the groundwater resources to better plan to meet future water needs.
Surface Water Groundwater Interactions - This program develops integrated computer models for surface water and groundwater hydrology, develops hydraulic characterizations of the stream-aquifer interface, and studies the physical and chemical processes of stream-aquifer interactions in the middle Arkansas River sub basin and the Walnut River basin.
Kansas Highway Patrol
Federal Preparedness Grant Program - Through this program, the Department of Homeland Security/FEMA provides funding to states to prevent, respond to, and recover from acts of terrorism by enhancing and sustaining capabilities. This program has been ongoing since federal fiscal year 1999 and the funding level varies each year.
Kansas State Fire Marshal’s Office
Fire Prevention Program - This program focuses on structural inspection to ensure compliance with the Kansas Fire Prevention Code. The Kansas State Fire Marshal’s Office works with local jurisdictional authorities. In addition, the Fire Prevention Division regulates the storage of highly flammable materials; oversees businesses involved in selling fire extinguishers, alarms, and sprinkler systems; and regulates fireworks manufacturers and displays. The division also tracks annual school fire and tornado drills.
Hazardous Materials Program - The Hazardous Materials Division is charged with developing, training, equipping, and supporting 12 regional hazardous materials/weapons of mass destruction (WMD) response teams across the State. These teams support local first responders in hazardous materials incidents, accidents, and acts of terrorism. They provide training, planning, and analysis related to hazardous materials accidents/incidents and WMD events to help local facilities and local, state, and federal agencies before an event occur. These teams are trained in the Incident Command System, facility pre-planning (which includes performing vulnerability analyses), and coordination among local, state, and federal agencies.

Region L Hazard Mitigation Plan, 2013 Final 4.12
Many of these trained personnel serve on local emergency planning committees, providing expertise and assistance to numerous communities. The division coordinates with other state agencies for training and actual hazardous materials/terrorism response.
Kansas Water Office
Assessment and Evaluation - The Kansas Water Office assesses water resource conditions and assists in identification of priority areas to target state financial and technical assistance and to provide a baseline, against which progress in meeting objectives can be measured.
Drought Monitoring - The Kansas Water Office, with the approval of the Kansas Water Authority, develops guidelines which indicate when drought conditions exist in the state. Conditions are routinely monitored and when drought conditions exist, the Kansas Water Office informs the Governor and recommends assembly of the Governor’s Drought Response Team. A periodic Kansas Drought Report is prepared and posted on the website of the Kansas Water Office.
Governor’s Drought Response Team - This team, chaired by the Kansas Water Office, is responsible for implementing an interagency state response to drought that is properly coordinated with local and federal response activities at all drought stages. The team is consulted on drought status declarations and responses.
Drought Operations Plan - An operations plan spelling out team membership, leadership, and procedures was updated and approved by the Governor in June 2012. It identifies individual agency responsibilities at three drought stages. This operations plan outlines a phased approach to drought response keyed to three county drought stages declared by the Governor: watch, warning and emergency. Specific agency actions to be taken at each stage are identified. The Kansas Water Office developed the operations plan with input from state and federal agency members of the response team.
Kansas State Water Plan - The Kansas Water Office develops and maintains a comprehensive state water plan, which is approved by the Kansas Water Authority. The Kansas Water Plan addresses the management, conservation, and development of the water resources of the state. It involves all water-related agencies and is organized into policy and basin sections. Twelve basin advisory committees provide advice to the director and the Kansas Water Authority in this regard. The State Water Plan Fund is dedicated to implementing recommendations made in the Kansas Water Plan.
Public Information and Education - This public education program provides information on water resource issues to the general public through publication of articles, pamphlets, news reports, etc. It also provides support for environmental education and local leadership development programs.
Stream Gauging Program - State financial assistance is provided for the operation of selected gauging stations operated by the U.S. Geological Survey. These gages provide real-time stream

Region L Hazard Mitigation Plan, 2013 Final 4.13
flow data to facilitate decision making regarding water rights, minimum desirable stream flows, flood monitoring, reservoir management, and water quality monitoring and analysis.
Technical Assistance to Water Users - This program provides technical assistance to municipalities, irrigators, and other groups to assist in the reduction of water use and improve water use efficiency.
Water Assurance Program - This program augments stream flow during periods of low flow through releases from water supply storage in federal reservoirs to satisfy downstream municipal and industrial water rights during drought conditions. The authorizing legislation allows municipal and industrial water right holders to form assurance districts and contract with the state for storage space in the federal reservoirs. Three water assurance districts have been formed by water users on the Kansas River, Marais des Cygnes River, and the Neosho-Cottonwood Rivers.
Water Conservation Program - The Kansas Water Office develops guidelines for irrigation and municipal water conservation plans and practices. Municipal guidelines, revised in 2007, address drought response in addition to long-term water conservation.
Water Marketing Program - Through this program, the state sells water to municipal and industrial water users from state-owned water storage facilities in 13 federal reservoirs. Revenues repay the costs of the water supply storage space, operations, and maintenance to the federal government. The Kansas Water Office contracts with municipal and industrial water users wishing to obtain water from this storage. Contracts are approved by the Kansas Water Authority. There are presently 32 contracts for water from this storage. Some users have more than one contract and some sell treated water at wholesale prices to other water systems.
Water Supply and Demand Estimates - These estimates provide a consistent set of long-range population and water demand projections for planning purposes. Since 2006, supply and demand projections have been made for all basins that have access to federal storage. Projections by county and public water supplier were made in 1998 by decade out to 2040; these are being updated on an as needed basis for specific projects.
Kansas Wildlife, Parks and Tourism
State Wildlife Grants Private Lands Program - This program provides cost-share to private landowners for the construction, establishment, and enhancement of grasslands, wetlands and riparian habitat. Request for proposals are announced annually and funds are awarded based on ecological priorities.
Project Review Program - This program provides technical assistance to project sponsors to mitigate impacts to grassland, wetland, and stream habitat as a result of development projects. Staff works with development sponsors to avoid and minimize impacts through native habitat restoration measures and natural stream design techniques.

Region L Hazard Mitigation Plan, 2013 Final 4.14
Stream Survey and Assessment Program - The purpose of this program is to document the current range and distribution of aquatic species, including aquatic nuisance species. Other objectives include establishing baseline data and monitoring fish kill and other natural resource damage assessments.
FEMA Risk Mapping, Assessment, and Planning (Risk Map)
In fiscal year 2009, FEMA began transitioning from Flood Map Modernization to Risk MAP. The Risk MAP strategy incorporates floodplain management with hazard mitigation by using tools such as DFIRMS, HAZUS reports, and risk assessment data to deliver quality data that increases public awareness and leads to action to reduce risk to life and property.
National Oceanic and Atmospheric Administration StormReady Program
StormReady is a voluntary program that was developed by the National Oceanic and Atmospheric Administration (NOAA) National Weather Service (NWS) to help communities better prepare for and mitigate effects of all types of severe weather—from tornadoes to flooding. The program encourages communities to take a new, proactive approach to improving local hazardous weather operations by providing emergency managers with clear-cut guidelines on how to improve their hazardous weather operations. StormReady is designed to help community leaders and emergency managers strengthen local safety programs. To be officially StormReady, a community must:
• Establish a 24-hour warning point and emergency operations center,
• Have more than one way to receive severe weather warnings and forecasts and to alert the public,
• Create a system that monitors weather conditions locally,
• Promote the importance of public readiness through community seminars, and
• Develop a formal hazardous weather plan, which includes training severe weather spotters and holding emergency exercises.
In Kansas, there are 27 counties, nine communities, two military sites, two universities and one commercial site that are recognized as StormReady.
U.S. Army Corps of Engineers
There are several relevant U.S. Army Corps of Engineers (USACE) Civil Works programs that are mitigation related in Kansas and overlap with the Kansas Hazard Mitigation Team. Those programs include: floodplain management services, planning assistance to the states, Continuing Authority Program (Section 14, Section 205, Section 208; or known as Emergency Streambank Protection Projects, Small Flood Control Projects, Snagging and Clearing for Flood Control Projects), general investigations (planning studies), construction flood projects, inspection of completed works, and rehabilitation and inspection program.
Region L Hazard Mitigation Plan, 2013 Final 4.15
Silver Jackets - This is the USACE Civil Works program enabling participation in the KHMT. Some of the states use the name Silver Jackets, however, many of the teams have existed longer than the inception of Silver Jackets around 2009. The Lead Silver Jackets Coordinator for Kansas directly participates on the KHMT, representing all the USACE districts within the State at the team’s regular meetings. The lead coordinator provides regular status updates, available on request. The status updates provide detail information on active USACE projects and programs, including specific project information that is useful during the FEMA Risk MAP Discovery Phases. The Silver Jackets Coordinator participates in the FEMA Risk MAP Resiliency Meeting.
Regional State Risk Management Team - This is the hazard mitigation teams in the four state regions of Kansas, Iowa, Missouri, and Nebraska, with a focus on the Missouri River. The team is primarily composed of the state agency officials directing those state teams and representatives from the local USACE Districts. The KHMT co-leads are one of the four states leading this broader team.
Levee Safety Program - The KHMT gets periodic updates on this USACE Civil Works program. Note the USACE is not responsible for all levees in the Nation, and the Kansas Department of Agriculture, Division of Water Resources already has an active levee program. The USACE Levee Safety Program activities have complemented KHMT work and have included establishing a National Levee Database, inspecting levees, communicating risks, taking steps to reduce risks, and establishing a levee safety portfolio internally at USACE for prioritizing levee work.
Dam Safety Program - This USACE program complements the Kansas Department of Agriculture, Division of Water Resources work with state dams. The USACE Dam Safety Program focuses on the large reservoirs, many of which are multipurpose. Reservoirs act together with levees and other infrastructure to reduce impacts of floods, and the reservoirs may also maintain flows for navigation downstream. The program is a little older than the program on levee safety and also has a risk portfolio for prioritizing dam work.
Emergency Management - This USACE Civil Works program addresses flood fighting and the rehabilitation of damaged infrastructure, such as levees or dams. In addition, major disasters and emergencies are also coordinated through this program.
Missouri River Basin Water Management - The flows of the Missouri River are managed by the USACE Northwestern Division. Eight authorized purposes must be addressed, including flood risk management. Flows from the Kansas River are part of the Missouri River Basin, and the Kansas City District Water Management handles this. In southern Kansas, the Tulsa District does water control for Arkansas River as part of the USACE Southwestern Division. The Water Control staff manages the following reservoirs: Big Hill, Council Grove, El Dorado, Elk City, Fall River, John Redmond, Marion, and Toronto lake projects.
Kansas Water, Wastewater, Gas and Electric Utility Mutual Aid Program (KSMAP)

Region L Hazard Mitigation Plan, 2013 Final 4.16
KSMAP has been developed to serve as the mutual aid program for Kansas utilities. The project is a joint effort of Kansas Municipal Utilities, Kansas Rural Water Association, the Kansas Section – American Water Works Association, the Kansas Water Environment Association, Kansas Corporation Commission, Kansas Department of Health & Environment and the Kansas Division of Emergency Management. The organizations participating in KSMAP stand ready to help with inter-utility assistance of equipment, materials and personnel to assist in the restoration and continuation of utility service for those utilities needing assistance (source: http://ksmap.org/general/KSMAPProgram.pdf).
Watershed Restoration and Protection Strategy
The Kansas Watershed Restoration and Protection Strategy (WRAPS), http://www.kswraps.org/ offers a framework that engages citizens and other stakeholders in a teamwork environment aimed at protecting and restoring Kansas watersheds. The WRAPS framework consists of identifying watershed restoration and protection needs, establishing watershed goals, creating cost-effective action plans to achieve established goals, and implementing the action plans. Each watershed served by a WRAPS team completing the program framework is eligible for WRAPS grant funding. The WRAPS funds are administered by the Kansas Water Office in collaboration with an interagency Work Group, which consists of representatives from a number of state and federal agencies.

Region L Hazard Mitigation Plan, 2013 Final 4.17
Mitigation Actions Region L
Red = deleted or merged with other actions to form a new combined action.
Blue = New Action since last plan
Green = Completed
Black = Action from last plan that has been carried forward to the new plan
Table 4.1 Region L Mitigation Actions (new, old, updated, and completed)
Region L Action ID Action/Description Priority Goal(s)
Addressed Hazard Addressed Status Responsible Entity Estimated cost, Funding Source,
and Completion Date Reg 1 Continue Training Responders to
Hazardous & Radiological material spills
M 3 Hazardous Materials & Radiological Materials
New: On-going/Open Ended
Emergency Managers for Region L
Cost: Dependent on size Funding: Grants, Local Completion Date: Open Ended
Reg 2 Continue Participation with the Kansas City Regional Terrorism Early Warning Group (TEW)
M 3 Terrorism New: On-going/Open Ended
Emergency Managers for Region L
Cost: Minimal Funding: Minimal Completion Date: Open Ended
Reg 3 Increase public & fire dept. training on wildland urban interface fires.
L 3 Wildfire New: On-going/Open Ended
Fire Chiefs within Region L Cost: Dependent on size Funding: Grants, Local Completion Date: Open Ended
Reg 4 Create a standardized ranking system for action items in the Mitigation Plan. Currently each jurisdiction ranks their actions without any standard criteria. By implementing High, Medium, and Low criteria for ranking actions, the whole region will be on the same page.
L 1,2,3,4 All Hazards New Emergency Managers for Johnson, Leavenworth, and Wyandotte Counties. Participation by Planning Committee.
Cost: Free Funding: NA Completion Date: August 2014

Region L Hazard Mitigation Plan, 2013 Final 4.18
Johnson County
Johnson County Action
ID Action/Description Priority Goal(s)
Addressed Hazard Addressed Status Responsible Entity Estimated cost, Funding Source, and
Completion Date Co. 1 Active Building code enforcement to
align with the national level. Johnson County believes in active code enforcement and follows national standards regarding all building codes. In the past we have adopted, within a reasonable time, all code enhancements as deemed applicable and useful in the unincorporated areas of the county.
H 1,2 All Hazards On-going/Open Ended
Johnson Co. Planning Building Official will review all enhancements to building codes on the national level and consider adopting those as appropriate based on the agreement of the Board of County Commissioners.
Cost: Unknown Funding: County funding, and federal as identified Completion Date: Open Ended
Co. 2 NFIP – Continued regulatory compliance and floodplain management. Current minimum federal requirements allow fill in the floodplain and rising of the water surface elevation. Restrict/eliminate development in the existing and future conditions floodplains and acquire land if necessary
H 1,2 Flood On-going/Open Ended
Johnson County Public Works, Flood Plain Manager
Cost: Minimal Funding: State and Federal Sources Completion Date: Open Ended
Co. 3 Acquisition/Demolition of flood prone properties. Many habitable buildings are located in the floodplain and/or are subject to flooding. Identify habitable buildings in the floodplain and/or are subject to flooding, prioritize locations, and purchase buildings as funding becomes available.
H 1 Flood On-going Johnson County Public Works, Acting Director
Cost: Cost varies and is dependent on the fair market value which is dependent on the economy. Funding: Stormwater Management Program, State and Federal agencies Completion Date
Co. 4 Educate public on impacts of major disease outbreak by working with health care providers, government agencies, and the public to monitor, educate, and promote the mitigation of a major disease outbreak.
H 3 Major Disease Outbreak Deleted – merged in County 5a
Johnson County Emergency Management
Cost: Unknown, Funding: State of Kansas and Federal Sources Completion Date:: Merged
Co. 5 Educate the impacts of winter storms including power outages via web based education, presentations, and participation with regional partners.
H 3 Winter Storms Deleted – merged in County 5a
Johnson County Emergency Management
Cost: Unknown, Funding: State of Kansas and Federal Sources Completion Date: Merged
Co. 5a NEW
Educate the public on the impacts of all hazards through all means
H 3 All Hazards New – On-going/Open
Johnson County Emergency Management, Assistant Director
Cost: Dependent on venue. Funding: State of Kansas and Federal

Region L Hazard Mitigation Plan, 2013 Final 4.19
necessary including with regional partners, state and federal partners in order to facilitate mitigation techniques to reduce the impacts of hazards.
Ended Community Preparedness Sources Completion Date: Open Ended
Co. 6 Safe Rooms in all future buildings built by the County. Kansas was the highest rated state for the number of tornadoes in 2008 at 168. In addition, the area is often battered by high wind events that cause extensive damage. The County has plans to review the concept of adding a tornado refuge built to FEMA standards in all new construction because of this issue. Johnson County government will review all future building plans and review the ability to add a safe room for citizens and employees in buildings such as libraries, public safety buildings, general use buildings and other buildings as appropriate. They will seek federal funding to assist with the building of the safe room.
H 1 Tornado On-going/Open Ended
Johnson County Facilities, Director
Cost: Unknown Funding: County funding, Federal as identified Completion Date: Open ended
Co. 7 All-Hazard education for mitigation, preparedness, response, & recovery Johnson County has many identified hazards that the public needs to be educated how to mitigate, prepare for, respond to and recover from to ensure that all citizens and businesses are as prepared as possible. Johnson County will give public presentations, use of web 2.0 resources, multimedia, and print publications. The County will work with all citizens and businesses to help them understand the hazards and how to prepare themselves as well as how to mitigate hazards if possible
H 3 All Hazards On-going/Open Ended
Johnson County Emergency management, Asst. Director Community Preparedness
Cost: $10,000 per year, Funding: county funding, federal as identified Completion Date: On-going/Open Ended
Co. 8 Improve flood hazard areas through the use of conveyance system structural improvement. Conveyance system structural improvements can be an effective means for flood damage reduction.
H 1 Flood On-going/Open Ended
Johnson County Public Works, Acting Director
Cost: Unknown Funding: Stormwater Management Program, state and federal agencies Completion Date: Open Ended

Region L Hazard Mitigation Plan, 2013 Final 4.20
Prioritize locations where flood damages have/may occur and design/construct improvements as funding becomes available.
Co. 9 Educate the impacts of lightning M 3 Lightning Deleted – merged in County 5a
Johnson County Emergency Management
Cost: Unknown Funding: State of Kansas, federal sources Completion Date: NA
Co. 10 Low-water crossing elimination based on risk and traffic count. Numerous low-water crossings exist in the county that are a threat to the traveling public. Prioritize low-water crossings based on risk and traffic count. Eliminate crossings as funding becomes available.
M 1 Flood On-going/Open Ended
Johnson County Public Works, Acting Director
Cost: Unknown Funding: Stormwater Management Program, State and federal agencies Completion Date: Open Ended
Co. 11 Flood warning system implementation. Provide the ability to warn residents and the traveling public about potential/actual flooding that threatens people, property and travel.
M 4 Flood On-going/Open Ended
Johnson County Public Works and Johnson County Emergency Management, Asst. Director of Operations
Cost: Unknown Funding: Stormwater Management Program, state and federal agencies Completion Date: Open Ended
Co. 12 Additional outdoor warning sirens with a computer based digital monitoring system so that defects or maintenance issues will be reported immediately as they occur. As new development is created in the County, additional outdoor warning sirens will be needed. Purchase and install additional emergency warning sirens along with a computer based digital monitoring system so that defects or maintenance issues will be reported immediately as they occur.
M 4 Tornado, Windstorm On-going/Open Ended
Johnson County Emergency Management, Asst Director of Operations
Cost: Unknown Funding: Annual Budget and HMGP grants. Completion Date: Open Ended
Co. 13 Promote Private Insurance. Johnson County will promote private insurance for Hail & Fog, Lightening, Expansive soils, land subsidence, landslides, earthquake that causes of personal injury, damage to foundations and roofs, loss in inventory (car lots), & auto damage from wrecks. Johnson County experienced a hail storm in 1996 that caused an estimated $10 million dollars in insured and uninsured losses. The County experiences many hail events as
M 3 All Hazards On-going/Open Ended
Johnson County Emergency Management, Asst. Director of Community Preparedness
Cost: Minimal Funding: State of Kansas, federal sources Completion Date: Open Ended

Region L Hazard Mitigation Plan, 2013 Final 4.21
well as auto damage during the course of a year. In addition, house settling causes impacts to building / house foundations.
Co. 14 Promote Crops Insurance. County will work with KSU Extension to promote crop insurance in the County – to insure against natural hazards such as agricultural infestation, soil erosion, extreme temperatures, wildfire, windstorm, winter storm, tornado, flooding & drought.
L 3 Agricultural Infestation, Dam and Levee Failure, Drought, Extreme Heat, Flood, Soil Erosion and Dust, Wildfire, Windstorm, Tornado, Winter Storm
On-going/Open Ended
Johnson County Emergency Management & KSU Extension Office
Cost: Minimal Funding: State of Kansas, federal sources Completion Date: Open Ended
Co.15 Flood proof Buildings. Many buildings are located in the floodplain and/or are subject to flooding. If buyout is not an option, installing/completing flood proofing techniques can minimize the potential for loss of life and property damage. Identify habitable buildings in the floodplain and/or are subject to flooding, prioritize locations, install/complete flood proofing techniques for buildings as funding becomes available if buyout is not an option.
L 1,2 Flood On-going/Open Ended
Johnson County Public Works, Acting Director
Cost: Unknown Funding: State and federal agencies Completion Date: Open Ended
Co.16 Safe Rooms in Private Non-Profit Schools. Kansas was the highest rated state for the number of tornadoes in 2008 at 168. In addition, the area is often battered by high wind events that cause extensive damage. Private non-profit schools in Johnson County will review the concept of adding a tornado refuge built to FEMA standards in all new construction. Build safe rooms/”hardened” room in private non-profit school attendance centers in accordance with FEMA publication #361, “Design and Construction Guidance for Community Shelters”.
H 1 Tornado On-going/Open Ended
Private Non-Profit Schools, Asst. Director Planning
Cost: Unknown Funding: Private Funds Completion Date: Open Ended
MultiJ 2 Continue Training Responders to Hazardous & Radiological material spills
M 3 Hazardous Materials & Radiological Materials
Deleted – moved to Reg 1
Fire Departments Cost: Unknown Funding: Completion Date: Moved to Reg1
MultiJ 3 Continue Participation with the Kansas City Regional Terrorism Early Warning Group (TEW)
M 3 Terrorism Deleted – moved to Reg 2
Johnson County and City law enforcement agencies
Cost: Unknown Funding: Mid-America Regional Council

Region L Hazard Mitigation Plan, 2013 Final 4.22
Completion Date :Moved to Reg2 MultiJ 4 Increase public & fire dept. training
on wildland urban interface fires. L 3 Wildfire Deleted –
moved to Reg 3
Kansas Forest Service Cost: $30.00 per student per training opportunity. Funding: Kansas Forest Service, State and federal partners Completion Date: Moved to Reg 3
MultiJ 5 Provide Homeowner Education on wildfire mitigation in wildland-urban interface. Before times and conditions of wildfire danger occur homeowners living in the wildland/urban interface need to have the knowledge to prepare their homes and property to be as safe and defendable as possible. Educational workshops to be put on for homeowners associations and/or in rural communities to provide homeowners with property in the wildland/urban interface information on steps that they can take on their own to defend their property from wildfire. Existing programs such as the FIREWISE Communities USA program could be used to supplement local knowledge and expertise provided by the local fire departments and the Kansas Forest Service in providing the needed information at these workshop
L 1,2 Wildfire On-going/Open Ended
Kansas Forest Service and Local Fire Departments Chiefs
Cost: $500 per workshop. Funding: Kansas Forest service and federal grants Completion Date: Open Ended
MultiJ 6 Reduce hazards fuels in prioritized wildfire risk areas. Past experience has shown that there is a threat of having wildland/urban interface fire problems in this area. The Wildland Urban Interface (WUI) is any location where a fire can spread from vegetation (wildland fuels) to man-made (urban fuels). As part of the planning process a wildfire hazard assessment has been conducted to begin to identify those locations that might be in need of some hazard fuel reduction work. In those areas that have been prioritized as posing a threat for wildland/urban interface fires, fuel reduction will be used to create fuel breaks between the wildland fuels
L 1,2 Wildfire On-going/Open Ended
Kansas Forest Service and Local Fire Departments Chiefs
Cost: $85 a course for hazardous fuel reduction projects. Funding: Kansas Forest Service, federal WUI grant Completion Date: Open Ended

Region L Hazard Mitigation Plan, 2013 Final 4.23
and the urban environment. Methods used will be mechanical removal of fuel, mechanical thinning of fuel, and/or prescribed fire.
Johnson County – City of De Soto Action
ID Action/Description Priority Goal(s)
Addressed Hazard Addressed Status Responsible Entity Estimated cost and Funding Source
DeSoto-1a
NFIP – continued participation and compliance with the NFIP program to include public education and continued enforcement of floodplain management that includes avoiding construction in floodplain.
H 1,2 Flood On-going, Continuous
Floodplain Manager Cost: NA Funding: NA Completion Date: On-going
DeSoto 1
Flood Control Projects H 1,2 Flood, Soil Erosion & Dust On-going De Soto Engineering Division
Cost: Unknown Funding: City and County General Funds, HMGP Grants and Special Benefit Districts Completion Date:
DeSoto 2
Back-up generators for Fire Station and the EOC
H 2 Lightning, Tornado, Utility/Infrastructure Failure, Winter Storm
On-going City of De Soto Cost: $55,000, Funding: city funds, Grants, Bonds, and CIP Completion Date:
DeSoto 3
Fire Station Windstorm Damage Mitigation
H 2 Wind Storm On-going City of De Soto Cost: $65,000. Funding: Budget, Bonds or Mitigation Grant funds Completion Date:
Johnson County – City of Edgerton Action ID Action/Description Priority Goal(s)
Addressed Hazard Addressed Status Responsible Entity Estimated Cost and funding Source
Edgerton 1 NFIP – continued participation and compliance with the NFIP program to include public education. Current minimum federal requirements allow fill in the floodplain and rising of the water surface elevation. Restrict /eliminate development in the existing and future conditions floodplains and acquire land if
H 1,2 Flood On-going City of Edgerton Cost: Unknown Funding: City funds Completion Date:

Region L Hazard Mitigation Plan, 2013 Final 4.24
necessary Edgerton 2 Edgerton Storm Shelter , currently
this is no shelter M 1 Tornado On-going City of Edgerton Cost: Unknown
Funding: HMGP Completion Date:
Edgerton 3 Portable Electric Generators M 1,2 Lightning, Tornado, Utility/Infrastructure
Failure, Winter Storm, Wind Storm
On-going City of Edgerton Cost: $14,400 - $157,000 Funding: Potential grant Completion Date:
Edgerton 4 Edgerton Strom Siren System Expansion
M 4 Windstorm, Tornado On-going City of Edgerton Cost: $21,000 Funding: City’s capital reserve funds with matching grant Completion Date:
Edgerton 5 207th Street Grade Separation H 1,2 All Hazards On-going City of Edgerton, Johnson county
Cost: $10 - $15 million Funding: Federal and State Highway Programs, Federal and State Rail Crossing Programs, and other unidentified sources Completion Date:
Edgerton 6 Edgerton Marias des Cygnes Watershed Storm water Infrastructure. In the Johnson County Marais des Cygnes Watershed Study conducted in February 2007, issues were identified that could potentially create hazards during a flood event. The study identified areas where improvements are recommended to decrease the probability of flood loss.. The study identified three major floodway projects that would reduce damage and loss due to a flood event. The three projects are: 1) replace culverts on both 1st and 2nd Street, 2) raise 2nd Street by 1.2 feet for 200 feet, and 3) improve 1,700 feet of the flood channel.
L 1,2 Flood On-going City of Edgerton Cost: $679,200. Funding: Johnson County SMAC, FEMA programs, and the City’s capital reserve fund Completion Date:
Edgerton 7 Dam Infrastructure Repair and Upgrade at Edgerton and South Lakes. In the Johnson County Marais des Cygnes Watershed
L 1,2 Dam and Levee Failure, Flood
On-going City of Edgerton Cost: Unknown Funding: City’s Capital reserve funds with match Completion Date:

Region L Hazard Mitigation Plan, 2013 Final 4.25
Study conducted in February 2007, issues were identified that could potentially create hazards during a flood event. One such issue the City has identified is a lack of ability to regulate stormwater that flows from the built community to the City’s two lakes. The City has also identified a lack of water storage capacity in the lakes due to erosion and silting. As such, the lakes would not be able to hold as much water as believed, thus resulting in more damaging flood potential. The City has identified the need for a floodgate to regulate the amount of water that is allowed to flow further downstream in the Big Bull Creek. The floodgates would allow the City to regulate the amount of water that flows into the creek, and thus provide the City with the ability to better control the flood waters during and after a flood event. The City also has identified the need for both lakes to be dredged to allow more storage capacity during a flood event.
Johnson County – City of Fairway Action ID Action/Description Priority Goal(s)
Addressed Hazard Addressed Status Responsible Entity Estimated Cost and funding Source
Fairway 1 Public Education of City businesses, home owners, and residents to be pro-active vs reactive in surviving and recovering from disasters.
H 3 All Hazards On-going Police Department Chief Cost: $20,000 Funding: FEMA/State Mitigation grants. City Fairway would provide matching cost share Completion Date:
Fairway 2 NFIP continued regulatory compliance. In 1971 the City of
H 1,2 Flood On-going Codes Department, City of Fairway Bldg
Cost: Unknown Funding: City funds

Region L Hazard Mitigation Plan, 2013 Final 4.26
Fairway entered the National Flood Insurance Program (NFIP) and began regulating development and other activities within the FEMA regulated floodplain, in accordance with federal requirements. By participating in this program, properties within Fairway can obtain flood insurance; in fact properties within the floodplain must obtain flood insurance to qualify for federally insured loans. In addition, the City has worked with Johnson County to obtain more detailed and accurate flood studies throughout the City. In 2002 we adopted an updated flood study and the corresponding mapping for Rock Creek. This program has been implemented and requires regulation of all construction within the FEMA regulated floodplain.
Inspector/Codes Officer Completion Date: Continuous
Fairway 3 Flood control Projects and Storm Sewer Upgrades. 42 buildings are within the FEMA 1% floodplain. Other structures flood due to drainage issues. Projects are designed by a consulting engineer and contracted through competitive bid. Whenever possible, we pursue cost-sharing opportunities with Johnson County SMAC. Projects are designed to protect buildings up to the 100-year storm, either through open channels and flood plain modifications (on large creeks) or through a combination of below-ground storm sewers and above ground swales (smaller watersheds). The Citybudgets for these projects as funds become available.
H 1,2 Flood On-going Fairway 3 Public Works Director
Cost: Vary Funding: FEMA mitigation and repetitive loss grants. JOCO Storm Water Management Program. CARS, Federal, State, City funding from Stormwater Utility Fund. Private contributions Completion Date: On-going
Fairway 4 Trailer-mounted, portable M 2 Lightning, tornado, On-going Police Department Chief Cost: $40,000

Region L Hazard Mitigation Plan, 2013 Final 4.27
generator for Police Station. utility/infrastructure failure, winter storm, windstorm
Funding: Disaster Contingency Funds with a matching cost share Completion Date: 2019
Johnson County – City of Gardner Action ID Action/Description Priority Goal(s)
Addressed Hazard Addressed Status Responsible Entity Estimated Cost and funding Source
Gardner 1 Storm Watershed Master Plan Study which identifies stream buffer policies, detention requirements, grading plan requirements, and minimum development standards for stormwater. The CIP list identifies areas of potential flooding and concerns, recommended improvements, and a dedicated funding stream for stormwater is available.
H 1,3,4 Flood On-going Public Works, Engineering Division
Cost: $400,000+ Funding: SMAC, General Fund, Stormwater Utility fund and property owner contributions Completion Date: 2019
Gardner 2 Flood control Projects – Doublegate Culvert Replacement Project where 11 houses are within the 1% floodplain. Also, 20 houses that could be affected by the same 1% event flooding.
H 2 Flood On-going Public Works, Engineering Division
Cost: $1.2Million Funding: FEMA mitigation repetitive loss grants, SMAC and City funds from the Stormwater Utility fund Completion Date: Unknown
Gardner 3 Generator project due to growth has resulted in several critical facilities within the community.
M 2 Lightning, tornado, Utility/Infrastructure
Failure, Winter Storm, windstorm
On-going Gardner Public Safety Cost: $50,000 per generator w/installation Funding: State and Federal agencies Completion Date: 2019
Gardner 4 National Flood Insurance Program – continued regulatory compliance The City of Gardner participates in the National Flood Insurance Program and regulates development and other activities within the FEMA regulated floodplain in accordance with Federal requirements. By
M 1,2 Flood On-going Public Works, Engineering Division
Cost: NA Funding: NA Completion Date:: Continuous

Region L Hazard Mitigation Plan, 2013 Final 4.28
participating in this program, properties within Gardner can obtain flood insurance. Gardner has worked with Johnson County to obtain more detailed mapping and accurate flood studies within the City. Detailed flood studies have been completed for the Kill Creek, Cedar Creek, and Bull Creek watersheds within Gardner.
Gardner 5 Tornado Sirens to service a growth in the Garner population. Also, upgrades are needed to replace aged sirens
M 4 All Hazards On-going Gardner Public Safety Cost: $22,000 per siren Funding: State and Federal agencies Completion Date: 2019
Johnson County – City of Lake Quivira
Action ID Action/Description Priority Goal(s) Addressed
Hazard Addressed Status Responsible Entity Estimated Cost and funding Source
LQuivira 1 Emergency Evacuation Exit for gated residential community that houses over 400 homes. Located adjacent to the BNSF Mainline Railway, the easement currently exists for an exit on the West side of the community but was abandoned in the early 1980s. Should there be a hazardous spill on the BNSF near the community it could potentially block the only evacuation route.
H 1 Hazardous Materials On-going Emergency Preparedness, Fire Chief
Cost: $60,000 for initial construction, $100,000 with road base update Funding: City of Lake Quivira Quivira Inc., FEMA Completion Date: 2019
LQuivira 2 Emergency Power Back-up Generator for City Hall Facility that houses the Fire, Police, and administration departments. Westar Energy’s western substation increases the incidences of power outages in the are.
H 2 Lightning, tornado, utility/infrastructure failure,
winter storm, windstorm
On-going City of Lake Quivira Police Department
Cost: $25,000 Funding: City of Lake Quivira and FEMA Completion Date: 2019

Region L Hazard Mitigation Plan, 2013 Final 4.29
Johnson County – City of Leawood Action ID Action/Description Priority Goal(s)
Addressed Hazard Addressed Status Responsible Entity Estimated Cost, funding Source, and
completion date Leawood 1 NFIP – continued regulatory
compliance and pursue CRS membership. Current minimum federal requirements allow fill in the floodplain and rising of the water surface elevation. Restrict /eliminate development in the existing and future conditions floodplains and acquire land if necessary
H 1,2 Flood On-going/open
ended
Director of Public Works Cost: NA Funding: City of Leawood funding, Completion Date: open ended.
Leawood 2 Natural Resource protection for flooding along Indian Creek west of state line road. The drainage waterway that runs into the business park, spills into Indian Creek from the North. This causes repetitive flooding at a commercial building park. Conduct a feasibility study to determine an appropriate course of action which might include a stormwater project to address improvements to the creek, erosion control, and floodproofing of businesses, etc.
H 1,2 Flood, soil Erosion and Dust On-going Director of Public Works Cost: Unknown Funding: Annual Budget Completion Date: Feasibility study completion would be 1 – 12 months after funding, and construction would be 12 – 36 months after that.
Leawood 3 Natural Resource Protection of Tomahawk & Indian Creeks resulting from flooding over the years that has severely eroded this area. Areas adjacent to the creeks, including parks, trails, and natural habitats continue to be impacted. Provide protection to creek banks and adjacent areas to prevent further damage. Natural Resource Protection – Stream Corridor Restoration, Erosion & Sediment Control, and Forest & Vegetation Management
H 1,2 Flood, Soil Erosion and Dust On-going Director of Public Works Cost: $1,000,000 Funding: Annual budget Completion Date: Up to 12 months for feasibility study and 12 – 36 months for construction after funding received.
Leawood 4 Emergency Services – Protection of Utilities at a Critical Facility
H 4 Lightning, tornado, utility/infrastructure
Completed Leawood Fire Department #1
Cost: $50,000 Funding: Annual budget

Region L Hazard Mitigation Plan, 2013 Final 4.30
with a new Generator. Fire Station #1 frequently loses electricity during sever weather due to an aged generator. This generator does not provide electricity to the entire building and all essential components either.
failure, winter storm, winter storm
Completion Date: Completed
Leawood 5 Installation of additional warning system sirens and computer monitoring system for two areas that lack adequate coverage from existing warning sirens.
H 4 Tornado, windstorm Completed Leawood Fire Department Cost: $134,000 Funding: Annual Budget Completion Date: Completed
Leawood 6 Emergency Services – warning systems: weather radios to enhance the warning of the public and businesses.
H 2 Tornado, Windstorm, Winter storm, Lightning
On-going Leawood Fire Chief Cost: $315,000 Funding: Annual Budget Completion Date: 2010
Johnson County – City of Lenexa Action ID Action/Description Priority Goal(s)
Addressed Hazard Addressed Status Responsible Entity Estimated Cost and funding Source
Lenexa 1 Continue NFIP Participation. In 1977 the City of Lenexa entered the National Flood Insurance Program (NFIP) and began regulating development and other activities within the FEMA regulated floodplain, in accordance with federal requirements. By participating in this program, properties within Overland Park can obtain flood insurance; in fact properties within the floodplain must obtain flood insurance to qualify for federally insured loans. This program has been implemented and requires regulation of all construction within the FEMA regulated floodplain.
H 1,2 Flood On-going/open
ended
City of Lenexa Public Works Cost: N/A Funding: N/A Completion Date: Open ended
Lenexa 2 Construction of Public Safe Rooms. H 1 Tornado On-going City of Lenexa Public Works Cost: Unknown

Region L Hazard Mitigation Plan, 2013 Final 4.31
Currently there are none. The large outdoor festivals have no shelter areas.
Funding: City funding, Federal as identified Completion Date: 2019
Lenexa 3 Back-up generators for critical facilities, Fire Station #2 has no emergency power generator
H 2 Lightning, tornado, utility/infrastructure failure,
winter storm, windstorm
On-going City of Lenexa Fire Department
Cost: $60,000 Funding: City of Lenexa, State and Federal Funds Completion Date: 2016
Johnson County – City of Merriam Action ID Action/Description Priority Goal(s)
Addressed Hazard Addressed Status Responsible Entity Estimated Cost and funding Source
Merriam 1 As the City of Merriam has areas of the City that flood, we have been and continue to be compliant with the NFIP. We also have structures that have suffered repetitive losses. We would like to investigate/complete: Working on acquiring repetitive loss structures (when appropriate/or when the opportunity arises), continue to educate residents about the floodplain and NFIP, and serve as a resource for residents with questions about the floodplain and NFIP. Current minimum federal requirements allow fill in the floodplain and rising of the water surface elevation. Restrict /eliminate development in the existing and future conditions floodplains.
H 1,2 Flood On-going/Open
Ended
City Engineer/Floodplain Manager
Cost: NA Funding: City Funds Completions Date: is open ended
Johnson County – City of Mission Action ID Action/Description Priority Goal(s)
Addressed Hazard Addressed Status Responsible Entity Estimated Cost and funding Source
Mission 1 NFIP: continued regulatory H 1,2 Flood On- City of Mission Cost: NA

Region L Hazard Mitigation Plan, 2013 Final 4.32
compliance. This program has been implemented and requires regulation of all construction within the FEMA regulated floodplain.
going/Open Ended
Funding: City funds Completion Date: is open ended
Mission 1a Floodplain management compliance continuation to include regulating new construction in the Special Flood Hazard area.
H 1,2 Flood New Floodplain Manager Cost: None Funding: none Completion Date: open ended
Mission 2 Sylvester Powell Jr. Community Center Disaster Preparedness
Project
M 1 All Hazards On –going Emergency Preparedness Cost: Unknown Funding: City, county and FEMA funding Completion Date: unknown
Mission 3 Additional Generator for Public Works Facility
L 2 Lightning, tornado, utility/infrastructure failure,
winter storm, windstorm
On-going Emergency Preparedness Cost: Unknown Funding: Mission General Fund/Federal Funds Completion Date: Open
Johnson County – City of Mission Hills Action ID Action/Description Priority Goal(s)
Addressed Hazard Addressed Status Responsible Entity Estimated Cost and funding Source
MHills 1 NFIP – continued participation and regulatory compliance. As the City of Mission Hills has several areas of the City that flood, we have been and continue to be compliant with the NFIP and our floodplain management. We also have several structures that have suffered repetitive losses. We would like to investigate/complete: 1. Working on acquiring repetitive loss structures (when appropriate/or when the opportunity arises) 2. Continuing to educate residents about the floodplain and NFIP 3. Serving as a resource for residents with questions about the floodplain and NFIP.
H 1,2 Flood On-going/Open
Ended
City Administrator Cost: $1 - $3 Million Funding: City Funds Completion Date: education is continuous, Acquiring Structures – as opportunities arise
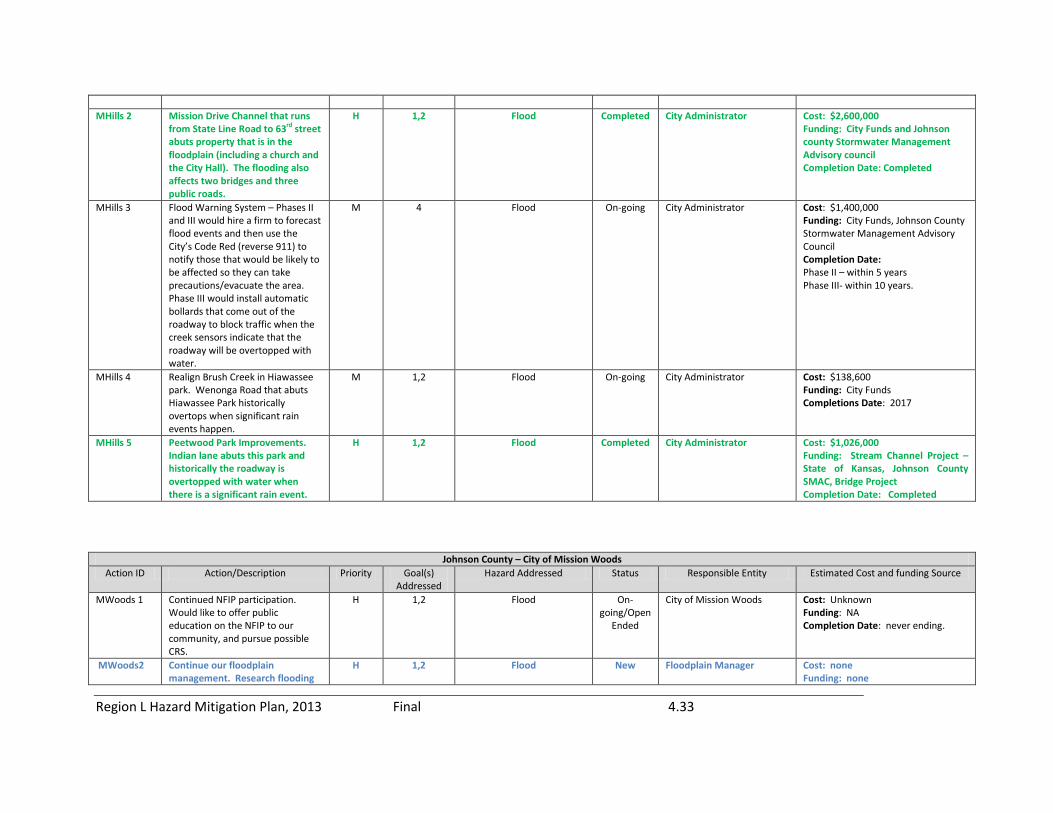
Region L Hazard Mitigation Plan, 2013 Final 4.33
MHills 2 Mission Drive Channel that runs
from State Line Road to 63rd street abuts property that is in the floodplain (including a church and the City Hall). The flooding also affects two bridges and three public roads.
H 1,2 Flood Completed City Administrator Cost: $2,600,000 Funding: City Funds and Johnson county Stormwater Management Advisory council Completion Date: Completed
MHills 3 Flood Warning System – Phases II and III would hire a firm to forecast flood events and then use the City’s Code Red (reverse 911) to notify those that would be likely to be affected so they can take precautions/evacuate the area. Phase III would install automatic bollards that come out of the roadway to block traffic when the creek sensors indicate that the roadway will be overtopped with water.
M 4 Flood On-going City Administrator Cost: $1,400,000 Funding: City Funds, Johnson County Stormwater Management Advisory Council Completion Date: Phase II – within 5 years Phase III- within 10 years.
MHills 4 Realign Brush Creek in Hiawassee park. Wenonga Road that abuts Hiawassee Park historically overtops when significant rain events happen.
M 1,2 Flood On-going City Administrator Cost: $138,600 Funding: City Funds Completions Date: 2017
MHills 5 Peetwood Park Improvements. Indian lane abuts this park and historically the roadway is overtopped with water when there is a significant rain event.
H 1,2 Flood Completed City Administrator Cost: $1,026,000 Funding: Stream Channel Project – State of Kansas, Johnson County SMAC, Bridge Project Completion Date: Completed
Johnson County – City of Mission Woods Action ID Action/Description Priority Goal(s)
Addressed Hazard Addressed Status Responsible Entity Estimated Cost and funding Source
MWoods 1 Continued NFIP participation. Would like to offer public education on the NFIP to our community, and pursue possible CRS.
H 1,2 Flood On-going/Open
Ended
City of Mission Woods Cost: Unknown Funding: NA Completion Date: never ending.
MWoods2 Continue our floodplain management. Research flooding
H 1,2 Flood New Floodplain Manager Cost: none Funding: none
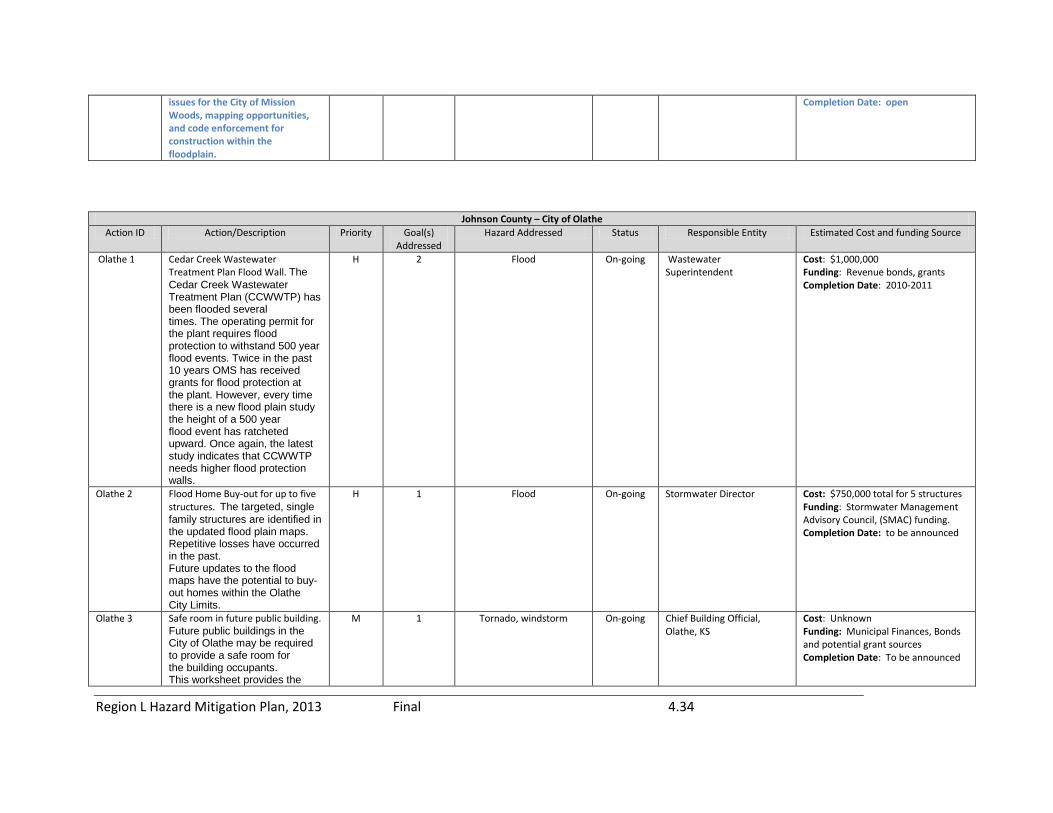
Region L Hazard Mitigation Plan, 2013 Final 4.34
issues for the City of Mission Woods, mapping opportunities, and code enforcement for construction within the floodplain.
Completion Date: open
Johnson County – City of Olathe
Action ID Action/Description Priority Goal(s) Addressed
Hazard Addressed Status Responsible Entity Estimated Cost and funding Source
Olathe 1 Cedar Creek Wastewater Treatment Plan Flood Wall. The Cedar Creek Wastewater Treatment Plan (CCWWTP) has been flooded several times. The operating permit for the plant requires flood protection to withstand 500 year flood events. Twice in the past 10 years OMS has received grants for flood protection at the plant. However, every time there is a new flood plain study the height of a 500 year flood event has ratcheted upward. Once again, the latest study indicates that CCWWTP needs higher flood protection walls.
H 2 Flood On-going Wastewater Superintendent
Cost: $1,000,000 Funding: Revenue bonds, grants Completion Date: 2010-2011
Olathe 2 Flood Home Buy-out for up to five structures. The targeted, single family structures are identified in the updated flood plain maps. Repetitive losses have occurred in the past. Future updates to the flood maps have the potential to buy-out homes within the Olathe City Limits.
H 1 Flood On-going Stormwater Director Cost: $750,000 total for 5 structures Funding: Stormwater Management Advisory Council, (SMAC) funding. Completion Date: to be announced
Olathe 3 Safe room in future public building. Future public buildings in the City of Olathe may be required to provide a safe room for the building occupants. This worksheet provides the
M 1 Tornado, windstorm On-going Chief Building Official, Olathe, KS
Cost: Unknown Funding: Municipal Finances, Bonds and potential grant sources Completion Date: To be announced

Region L Hazard Mitigation Plan, 2013 Final 4.35
need for potential requests of this nature.
Olathe 4 Trailer-mounted, portable generator. An electrical power outage to a fire station, the DOC or EOC would reduce our ability to Provide public safety and Emergency Management services to the public. This plan and equipment will provide a redundant back-up to our electrical service.
M 2 Lightning, tornado, utility/infrastructure failure,
winter storm, windstorm
On-going Olathe Fire Department, Assistant Chief, Special Operations
Cost: Unknown Funding: Cost-share line item from disaster contingency funds Completion Date: To be announced
Olathe 5 CERT training program. The goal of the Olathe, KS CERT program is to train 10% of the city population. As of 2008, 1,100 participants have been certified as CERT responders.
H 3,4 All Hazards On-going Assistant Chief, Special Operations
Cost: $22,000 Funding: Budget, Citizen Corps, and UASI grant Completion Date: Jan and November of each year.
Olathe 6 Storm drainage culvert expansion at 147/Brougham Dr. The existing culvert has been determined to be under-sized according to the undated flood maps of 2008. Previous improvements to the down-stream areas are now capable of the flow of the stream. Increase the reinforced concrete culvert under Brougham Dr. at 147 Street by 100% to reduce the current flow restriction.
H 1,2 Flood On-going Olathe Storm Water Planning Division Chief
Cost: $200,000 Funding: Johnson county Storm Water Management Advisory Council Completion Date: To be announced.
Olathe 7 All-Hazard Citizen Education Preparing citizens for their role in all-hazard preparedness is paramount to the City’s capability to respond to and recover from the hazards we face. Educating Olathe citizens about firework safety, regulations, and alternative activities/events is another safety issue we face each year. Workbook. These are used in Community Emergency Response Team (CERT)
H 3 All Hazards On-going Olathe Fire Department, Assistant Chief of Special Ops
Cost: $21,140 for 10,000 workbooks Funding: Emergency Management Divisions printing line item, Administration division’s budget. Completion Date: Olathe FY 2009 –Jan – Dec.

Region L Hazard Mitigation Plan, 2013 Final 4.36
training as well as distributed to groups, neighbourhood associations, and the public in general. Help continue to produce mailers for the July 4th safety campaign as well as do firework safety demonstrations.
Olathe 8 Expansion of Olathe Outdoor Warning System. The City of Olathe continues to grow not only in land mass, but in population. The City currently has 34 sirens for our Outdoor Warning System. We have at least six annexation areas that still need to be covered. We, however, have no budget at least in 2008 and at least 2009 to put up any more sirens.
H 4 Tornado, wind storm On-going Olathe fire Department/Emergency Management Division – Chief Dock
Cost: $138,000 for six sirens Funding: Grant, budget, developer contribution Completion Date: Action will be addressed if need be, 1 siren at a time until all six are complete.
Olathe 9 Upgrade computers for the Olathe EOC & DOC. The City of Olathe houses a free standing facility for the traffic operations center, (TOC). The City Emergency Operations Plan designates the Fire Department Operations Center as the alternate site for the TOC.The program is also utilized in the City Emergency Operations Center as an observation tool for all events. The computer programs that support and operate the video capability in the traffic system exceed the current capability of the main computers in the DOC and the EOC.
H 4 All Hazards On-going City of Olathe I.T. Department director
Cost: $7,000 Funding: Kansas State Mitigation Grant, City of Olathe Line Item Budget Completion Date: As soon as possible
Olathe 10 Water Plant 2 chlorine gas retrofit. Water Plant 2 uses chlorine gas to treat our potable water supply. The gas is stored in cylinders (with a capacity of a ton) and is a potential danger to the surrounding area should it rupture. OMS would need to evacuate approximately 600 people in the event of a cylinder rupture. Another means to treat the water exists in sodium hypochlorite, but Plant 2 feed equipment would
H 2 Hazardous Materials On-going Environmental Services Manager
Cost: $250,000 Funding: Bonds, Grants Completion Date: 2010-2011

Region L Hazard Mitigation Plan, 2013 Final 4.37
need to be retrofitted to enable use of this chemical
Olathe 11 New construction of free standing safe rooms at Santa Barbara Mobile Home Estates. The Home Town Santa Barbara sub-division is a mobile home park with a total land area of 82.57 acres. The total number of housing units on the site is 487 with 100% of the units built at grade. The average census/populating in the complex is 1600 people. The original construction date is 1972 and offers no protection from high-wind and tornado events. This mobile home complex has no existing structures on the property for residents to seek shelter and safety from tornado or high wind events.
H 1 Tornado, Windstorm On-going Assistant Chief, OFD Cost: $800,000. Funding: KS State Mitigation Grand Funds Only Completion Date: 2010
Olathe 12 Continue NFIP participation. This program has been implemented and requires regulation of all construction within the FEMA regulated floodplain.
H 1,2 Flood On-going/Open
Ended
City of Olathe, Rob Beilfus Cost: Unknown Funding: City funds if needed Completion Date: open ended
Johnson County – City of Overland Park Action ID Action/Description Priority Goal(s)
Addressed Hazard Addressed Status Responsible Entity Estimated Cost and funding Source
OVP 1 City Hall Emergency Generator Project. The KC Metro area is vulnerable to several potentially catastrophic weather events such as tornadoes, winter storms, damaging winds, etc. During many of these types of weather events, power can be disrupted at a center to facilitate specific operations associated with emergency response and mitigation activities. Currently OP does not have the
H 2 Tornadoes, Wind Storms, Winter Storms
New Manager; Facilities Management and Code Administrator; Building Safety Division
Cost: $250,000 Funding: Grants, Local Completion Date: 6 months after funding received.

Region L Hazard Mitigation Plan, 2013 Final 4.38
capability of supporting critical functions/operations if power were lost to the building. Currently, the only emergency back-up systems available is to accommodate building evacuation in case of fire such as emergency lighting and alarm systems. Building systems to support occupancy during emergency operations such as environmental (HVAC), communications, security systems, currently have no emergency back-up power systems. City Hall would be provided with an emergency generator system, designed and installed with the appropriate capacity, in order to support essential building systems to accommodate occupancy of the building functions. The system would be provided with a fuel reservoir capable of 48 – 72 hours of operating time.
OVP 2 Tomahawk Ridge Community Center Emergency Generator Project. The KC Metro area is vulnerable to several potentially catastrophic weather events such as tornadoes, winter storms, damaging winds, etc. During many of these types of weather events, power can be disrupted at a center to facilitate specific operations associated with emergency response and mitigation activities. Currently OP does not have the capability of supporting critical functions/operations if power were lost to the building. Currently, the only emergency back-up systems available is to accommodate building evacuation in case of fire such as emergency lighting and alarm systems.
H 2 Tornadoes, Wind Storms, Winter Storms
New Director Recreation Services Department and Manager, Facilities Management
Cost: $350,000 Funding: Grants, local Completion Date: 6 months after authorization of funds.

Region L Hazard Mitigation Plan, 2013 Final 4.39
Building systems to support occupancy during emergency operations such as environmental (HVAC), communications, security, systems, currently have no emergency back-up power systems. Tomahawk Community Center would be provided with an emergency generator system, designed and installed with the appropriate capacity, in order to support essential building systems to accommodate occupancy of the building. The system would be provided with a fuel reservoir capable of 48 – 72 hours of operating time.
OVP 3 Fire Station Safe Room. The KC Metro area is vulnerable to tornadoes and severe storms that produce damaging wind conditions. It is critical that we protect our public safety personnel and equipment in order for them to respond to emergencies, particularly during disaster events. Fire station number three does not have a basement or safe refuge area for personnel during a fast moving severe storm. FS #3 would be retrofitted with a safe room capable of protecting up to 50 people. The room would be capable of protecting the on-duty crew as well as up to 45 additional people.
H 2 Tornado, Wind Storm New – replaces OP
6
Fire Chief, Fire Department Cost: $150,000 Funding: Grants, local Completion Date: 2019
OVP 4 Fire Department Generator Project. During hazard events power is disrupted at critical facilities. Fire station number five does not currently have a generator capable of providing back up power for critical functions. FS #5 would have a generator installed that would be capable of providing power to all
H 2 Lightning, tornado, utility/infrastructure failure,
winter storm, windstorm
New, replaces OP
7
Fire Chief, fire Department Cost: $75,000 Funding: Grants, Local Completion Date: 2019

Region L Hazard Mitigation Plan, 2013 Final 4.40
critical functions within the building. The generator would have a fuel reservoir capable of 48-72 hours of operating time.
OVP 5 NFIP – Program has been implemented and requires regulation of all construction within the FEMA regulated floodplain. By participating in this program, properties within Overland Park can obtain flood insurance; in fact properties within the floodplain must obtain flood insurance to qualify for federally insured loans. Chapter 18.360 of the Overland Park Municipal Code establishes the legal authority for this program. We are actively engaged in our Floodplain management and enforce its requirements to include building in SFHA.
M 1,2 Flood New, replaces OP
1
Code Administrator, and Flood plain Administrator
Cost: NA Funding: NA Completion Date: Open ended
OVP 6 Fire Station Windstorm Damage Mitigation. Retrofit four of the five fire stations in Overland Park with wind resistant/energy efficient doors. All large surface area windows would be fitted with storm panels or shutters. Fire station number five is scheduled for replacement in the near future, and would include iwnd resistant doors as part of the design specifications. The weakest points of the structures are apparatus bay doors and large surface area windows.
M 2 Tornado, Windstorm New, replaces OP
9
Fire Chief, Overland park Fire Department
Cost: $400,000 Funding: Grants, local Completion Date: 2019
OVP 7 Evaluation of critical city facilities for compliance with FEMA 361 (Design, and Construction Guidance for Community Shelters) along with nationally recognized design and construction standards for storm shelters, safe rooms and their ability for use as a post-
M 2 Tornado, Windstorm New, replaces OP
5
Public Works Department City Engineer, and Manager, Facilities Management, and Code Administrator, Building Safety Division
Cost: $5,000,000 Funding: Local Completions Date: 5 years

Region L Hazard Mitigation Plan, 2013 Final 4.41
disaster shelter. OP has listed several critical facilities on our emergency operations plans which need to be evaluated per contemporary standards for use and compliance as community shelters, storm shelters and safe rooms. Once evaluation is completed, upgrade facilities as needed.
OVP 8 Electronic Plan Review and Recording. Building code enforcement is recognized as one of the most effective tools to provide for mitigation of damage to our vertical built environment. Technology related to building code enforcement is rapidly changing particularly as the design professionals continue to move toward the use of business information modeling (BIM). OP has initiated research activities related to electronic plan review hardware and software. Going forward a task force consisting of City Staff, designers, contractors, and other interested parties would be assembled to develop a program, research specific needs, and interview software companies.
M 4 All Hazards New, replaces OP
8
Code Administrator, Building Safety Division
Cost: $400,000 Funding: Local Completion Date: One year after funding authorized.
OVP 9 Public education of city businesses, home owners and residents and all city staff in OP for disaster preparedness, mitigation and recovery. Train citizens and businesses in moving away from reactionary to pro-active preparedness in surviving and recovering from disasters. Educating the public on measures to secure/reinforce homes and businesses before a disaster occurs to minimize damages, loss of life and enable a quick economic stability rebound.
M 4 All Hazards New, replaces OP
3
City Emergency Management Coordinator
Cost: $100,000 Funding: Local Completion Date: Approximately one year after funding is authorized.
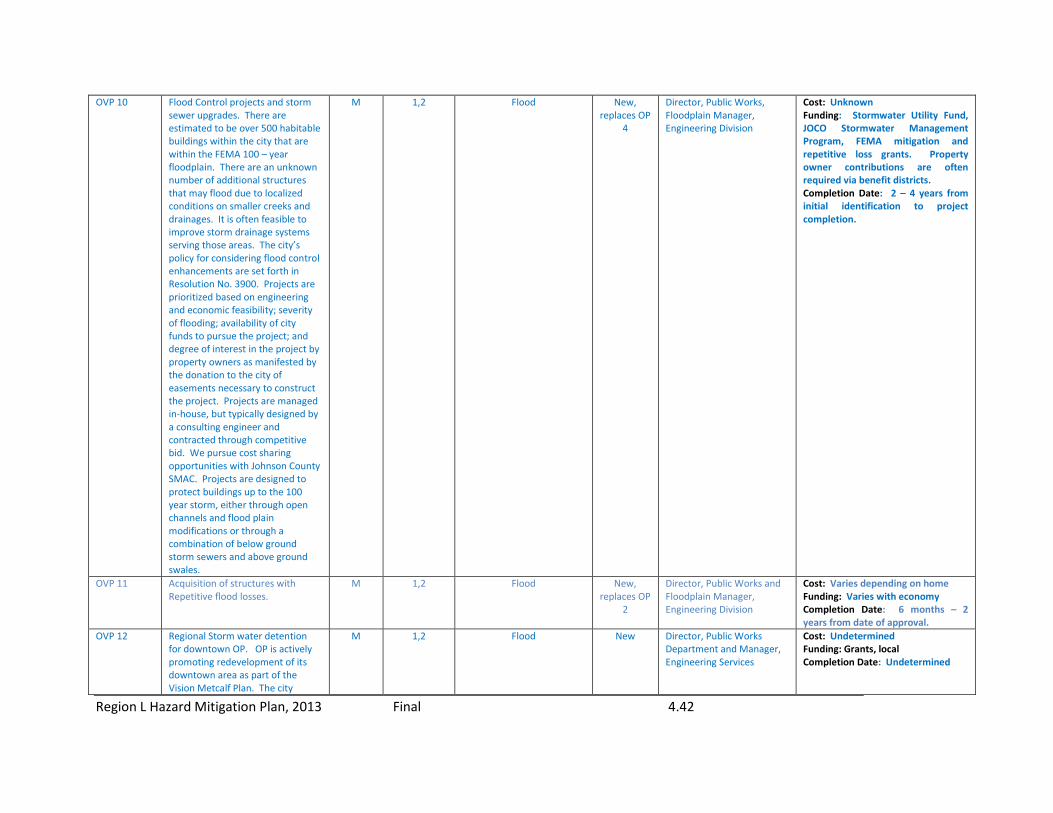
Region L Hazard Mitigation Plan, 2013 Final 4.42
OVP 10 Flood Control projects and storm sewer upgrades. There are estimated to be over 500 habitable buildings within the city that are within the FEMA 100 – year floodplain. There are an unknown number of additional structures that may flood due to localized conditions on smaller creeks and drainages. It is often feasible to improve storm drainage systems serving those areas. The city’s policy for considering flood control enhancements are set forth in Resolution No. 3900. Projects are prioritized based on engineering and economic feasibility; severity of flooding; availability of city funds to pursue the project; and degree of interest in the project by property owners as manifested by the donation to the city of easements necessary to construct the project. Projects are managed in-house, but typically designed by a consulting engineer and contracted through competitive bid. We pursue cost sharing opportunities with Johnson County SMAC. Projects are designed to protect buildings up to the 100 year storm, either through open channels and flood plain modifications or through a combination of below ground storm sewers and above ground swales.
M 1,2 Flood New, replaces OP
4
Director, Public Works, Floodplain Manager, Engineering Division
Cost: Unknown Funding: Stormwater Utility Fund, JOCO Stormwater Management Program, FEMA mitigation and repetitive loss grants. Property owner contributions are often required via benefit districts. Completion Date: 2 – 4 years from initial identification to project completion.
OVP 11 Acquisition of structures with Repetitive flood losses.
M 1,2 Flood New, replaces OP
2
Director, Public Works and Floodplain Manager, Engineering Division
Cost: Varies depending on home Funding: Varies with economy Completion Date: 6 months – 2 years from date of approval.
OVP 12 Regional Storm water detention for downtown OP. OP is actively promoting redevelopment of its downtown area as part of the Vision Metcalf Plan. The city
M 1,2 Flood New Director, Public Works Department and Manager, Engineering Services
Cost: Undetermined Funding: Grants, local Completion Date: Undetermined

Region L Hazard Mitigation Plan, 2013 Final 4.43
adopted a form based code that may result in more intense urban uses within the downtown area. Downtown OP falls on a ridge line and drains into three watersheds to include Brush Creek to the east, Turkey Creek to the west, and Indian Creek to the south. Flood studies of these three watersheds had identified a substantial number of homes and businesses in flood prone areas in each of these watersheds and in downtown OP. Currently, storm water detention facilities are required to be constructed with development and redevelopment projects that significantly increase impervious land cover when there are identified downstream flooding problems. Construction of regional storm water detention facilities to control and/or reduce runoff generated by redevelopment of the downstream area.
OP 1 Continue NFIP Participation H 1,2 Flood Deleted. Replaced by OVP 5
OP 2 Acquisition of structures with repetitive flood losses
H 2 Flood Deleted, replaced by
OVP 11
OP 3 Public Education for City Businesses, Home owners, Residents, & all City Staff in OP for disaster preparedness, mitigation, & recovery
H 3 All Hazards Deleted, replaced by
OVP 9
OP-4 Flood control Projects and Storm Sewer Upgrades
H 1,2 Flood Deleted, replaced by
OVP 10
OP 5 Evaluation of Critical City Facilities for compliance with FEMA 361
H 2 Tornado/Wind Storm Deleted, replaced by
OVP 7
OP 6 Fire Station Safe room. H 2 Tornado, Wind Storm Deleted, replaced by
OVP3
Fire Department

Region L Hazard Mitigation Plan, 2013 Final 4.44
OP 7 Generator Project H 2 Lightning, tornado, utility/infrastructure failure,
winter storm, windstorm
Deleted, replaced by
OVP 4
OP 8 Electronic Plan Review and Recording
H 4 All Hazards Deleted, replaced by
OVP 8
OP 9 Fire Station Windstorm Damage Mitigation
H 2 Windstorm Deleted, Replaced by QVP 6
Johnson County – City of Prairie Village
Action ID Action/Description Priority Goal(s) Addressed
Hazard Addressed Status Responsible Entity Estimated Cost and funding Source
PV 1 Bury underground utility cables M 1,2 Lightning, Tornado, Utilitiy/Infrastructure Failure, Winter Storm,
Windstorm
On-going Director of Public Works Cost: Unknown Funding: NA Completion Date: never ending.
PV 2 National Flood Insurance Program. This program has been implemented and requires regulation of all construction within the FEMA regulated floodplain.
H 1,2 Flood On-going/Open
ended
Assistant City Administrator Cost: NA Funding: NA Completion Date: Continuous
Johnson County – City of Roeland Park Action ID Action/Description Priority Goal(s)
Addressed Hazard Addressed Status Responsible Entity Estimated Cost and funding Source
Roeland Pk 1 Back-up generators for City Hall/Police Department and City community Center. The critical facilities, city Hall/police Department & City Community Center do not have back-up power during emergencies. Both facilities are used for emergency response.
H 2 Lightning, tornado, utility/8infrastructure failure, winter storm,
windstorm
On-going Roeland Park Police Department
Cost: $80,000 Funding: New construction Bonds Completion Date: Within 4 years
Roeland Pk 2 National Flood Insurance program. The City would like to continue to be compliant with the NFIP.ram. This program has been implemented and requires regulation of all construction within the FEMA regulated
H 1,2 Flood On-going/Open
Ended
City of Roeland Park Cost: NA Funding: City funds Completion Date: Open ended

Region L Hazard Mitigation Plan, 2013 Final 4.45
floodplain.
Roeland Pk 3 Habitable building buyout. Habitable buildings are located in the floodplain and/or are subject to flooding. Identify habitable buildings in the floodplain and/or are subject to flooding, prioritize locations, and purchase buildings as funding becomes available.
M 1 Flood On-going Roeland park Public Works Cost: Unknown Funding: JOCO Stormwater Management Completion Date: Ongoing
Johnson County – City of Shawnee Action ID Action/Description Priority Goal(s)
Addressed Hazard Addressed Status Responsible Entity Estimated Cost and funding Source
SH4 Establish a full time Emergency Management Office. Shawnee has never had a dedicated EM or EM office. Plans, such as EOP, COOP, etc., have suffered. Same with outreach to community. An acting EM position has been established to update plans, form a CERT, attend county and regional planning meetings and work on projects.
H 1,2 All Hazards New City Manager Cost: $100,000 per year Funds: General Fund Completion Date: Awaiting approval of City Council, Summer 2013
SH3 Form CERT Training Program. Train citizens in disaster preparedness and response. Have a Force Multiplier of trained volunteers for disaster.
M 3 All Hazards New Acting Emergency Manager Cost: $1000 start-up Funds: State & Federal Grants, Donations Completion Date: Fall 2014
Shawnee 3 Inclusion of tornado safe rooms in all future buildings built by the City. Kansas was the highest rated state for tornadoes in 2008 at 168. In addition, the area is
H 1 Tornado, Windstorm On-going, Open Ended
Public Works Director Cost: Unknown Funds: County, Federal Completion Date: Continuous
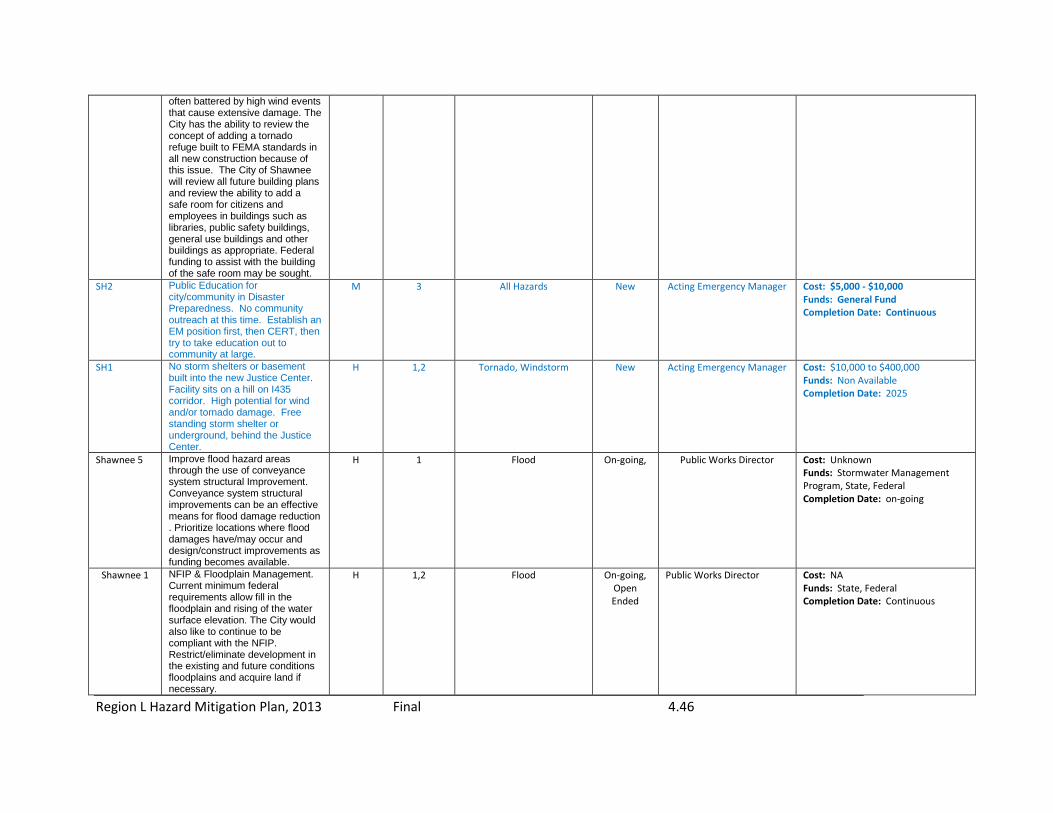
Region L Hazard Mitigation Plan, 2013 Final 4.46
often battered by high wind events that cause extensive damage. The City has the ability to review the concept of adding a tornado refuge built to FEMA standards in all new construction because of this issue. The City of Shawnee will review all future building plans and review the ability to add a safe room for citizens and employees in buildings such as libraries, public safety buildings, general use buildings and other buildings as appropriate. Federal funding to assist with the building of the safe room may be sought.
SH2 Public Education for city/community in Disaster Preparedness. No community outreach at this time. Establish an EM position first, then CERT, then try to take education out to community at large.
M 3 All Hazards New Acting Emergency Manager Cost: $5,000 - $10,000 Funds: General Fund Completion Date: Continuous
SH1 No storm shelters or basement built into the new Justice Center. Facility sits on a hill on I435 corridor. High potential for wind and/or tornado damage. Free standing storm shelter or underground, behind the Justice Center.
H 1,2 Tornado, Windstorm New Acting Emergency Manager Cost: $10,000 to $400,000 Funds: Non Available Completion Date: 2025
Shawnee 5 Improve flood hazard areas through the use of conveyance system structural Improvement. Conveyance system structural improvements can be an effective means for flood damage reduction . Prioritize locations where flood damages have/may occur and design/construct improvements as funding becomes available.
H 1 Flood On-going, Public Works Director Cost: Unknown Funds: Stormwater Management Program, State, Federal Completion Date: on-going
Shawnee 1 NFIP & Floodplain Management. Current minimum federal requirements allow fill in the floodplain and rising of the water surface elevation. The City would also like to continue to be compliant with the NFIP. Restrict/eliminate development in the existing and future conditions floodplains and acquire land if necessary.
H 1,2 Flood On-going, Open Ended
Public Works Director Cost: NA Funds: State, Federal Completion Date: Continuous

Region L Hazard Mitigation Plan, 2013 Final 4.47
Shawnee 2 Shawnee believes in active code enforcement and follows national standards regarding all building codes. In the past we have adopted, within a reasonable time, all code enhancements as deemed applicable and useful in the City. Shawnee will review all enhancements to building codes on the national level and consider adopting those as appropriate.
H 1,2 All Hazards On-going, Open Ended
Public Works Director Cost: NA Funds: County, Federal Completion Date: Continuous
Shawnee 4 Habitable building buyout. Some habitable buildings may be located in the floodplain and/or are subject to flooding. Identify habitable buildings in the floodplain and/or are subject to flooding, prioritize locations, and purchase buildings as funding becomes available.
H 1 Flood On-going, Open Ended
Public Works Director Cost: Vaires Funds: Stormwater Management Program, State, Federal Completion Date: Continuous
Shawnee 7 Flood warning System Implementation. Provide the ability to warn residents and the traveling public about potential/actual flooding that threatens people, property and travel. Work with other jurisdictions to build infrastructure for flood warning system components
M 4 Flood On-going Public Works Director Cost: Unknown Funds: State, Federal Completion Date: On-going
SH5 Trailer Mounted Generator, portable. Backup generators at Justice Center and Fire headquarters are not adequate to power entire building, only certain positions, in an emergency. Have at least one portable generator that can be transported to whatever city building needs it most, to boost power for that facility.
H 1,2 All Hazards New Acting Emergency Manager Cost: $30,000 to $50,000 Funds: No funds Available Completion Date: On-going
Shawnee 6 Shawnee will work mitigate the impacts of a winter storms. Johnson County experiences many winter storm events each year. These can lead to power outages which impact all levels of our citizenry. The City of Shawnee will work with Johnson County, citizens and businesses to prepare for winter storm impacts including power outages. This will be accomplished via web
H 3 Winter Storms, Utility/Infrastructure Failure
Deleted, replaced with SH2
Fire Department Cost: Unknown Funds: State, Federal Completion Date: Deleted

Region L Hazard Mitigation Plan, 2013 Final 4.48
based education campaigns, presentations to citizens, civic groups, businesses, etc., and participation with regional partners on education campaigns. via web based education campaigns, presentations to citizens, civic groups, businesses, etc., and participation with regional partners on education campaigns.
Shawnee 8 Flood proof buildings. Many buildings are located in the floodplain and/or are subject to flooding. If buyout is not an option, installing/completing flood proofing techniques can minimize the potential for loss of life and property damage. Identify habitable buildings in the floodplain and/or are subject to flooding, prioritize locations, install/complete flood proofing techniques for buildings as funding becomes available if buyout is not an option.
L 1,2 Flood On-going, Open Ended
Public Works Director Cost: Unknown Funds: State, Federal Completion Date: Continuous
Johnson County – City of Spring Hill Action ID Action/Description Priority Goal(s)
Addressed Hazard Addressed Status Responsible Entity Estimated Cost and funding Source
SpringH 1 Tornado safe rooms in all future city buildings. Kansas was the highest rated state for tornadoes in 2008 at 168. In addition, the area is often battered by high wind events that cause extensive damage. The city has plans to review the concept of adding a tornado refuge built to FEMA standards in all new construction because of this issue. The City of Spring Hill will review all future building plans and review the ability to add a safe room for citizens and employees in buildings such as libraries, public safety buildings, general use buildings and other buildings as appropriate. They will seek federal funding to assist with the
H 1 Tornado On-going Spring Hill Planning & Development
Cost: Unknown Funding: City funding, Federal as identified Completion Date: Continuous

Region L Hazard Mitigation Plan, 2013 Final 4.49
building of the safe room. SpringH 2 Continue compliance with NFIP.
This program has been implemented and requires regulation of all construction within the FEMA regulated floodplain.
H 1,2 Flood On-going/Open
Ended
City of Spring Hill Cost: NA Funding: NA Completion Date: Open Ended
SpringH 3 Public information distribution after a disaster. Experience has taught city officials that accurate information to the public is vital during and after a disaster event. Understanding that telephone, television and internet services are not always available in many events, establishing a central location for information such as shelters, food banks, waste removal locations, etc. will aid the public and ensure accurate information is distributed. A secondary location would be established in the event the primary location is unavailable. The City of Spring Hill will establish a primary and secondary location to serve as a distribution point for public information. City staff will work to provide as much information as possible on topics specific to the event and have this information readily available in a paper format.
M 4 All Hazards On-going/Open
Ended
Spring Hill Planning Department
Cost: Unknown Funding: Local Completion Date: Implemented as needed
SpringH 4 Portable generator for City Hall. An electrical power outage to City Hall would reduce our ability to provide public safety and Emergency Management services to the public. Currently City Hall has no source of emergency power and this would provide a back-up to conventional electrical service to the building. As an alternative solution, the installation of a permanent generator would be more desirable, however we currently are in the early planning stages of planning a new facility for City Hall. Should a new building be approved, the need for
M 2 Lightning, tornado, utility/infrastructure failure,
winter storm, windstorm
On-going Public Works Cost: Undetermined Funding: FEMA, State of Kansas, local capitol improvement budgeting Completion Date: TBA

Region L Hazard Mitigation Plan, 2013 Final 4.50
a permanent generator will be shifted to the new facility. The generator/trailer will be stored at the Public Works Building. Scheduled maintenance and operation will be supervised by the Public Works Director and performed by the city staff. Upon electrical power failure and the building stand-by generator failure, the trailer would be dispatched to the point of need. Connection to the building would be made via a weather-proof service box to support essential functions inside the City Hall building. If a decision is made for a permanent generator then appropriate switch boxes and conversion equipment will be installed
Johnson County – City of Westwood
Action ID Action/Description Priority Goal(s) Addressed
Hazard Addressed Status Responsible Entity Estimated Cost and funding Source
Westwood 1 Back-up generators for critical facilities. City Hall/Police Dept has no back-up power nor does public works building. Install generators in currently owned buildings – community center located in City Hall Building.
M 2 Lightning, tornado, utility/infrastructure failure,
winter storm, windstorm
On-going Police Department/Public Works
Cost: $75,000 - $100,000 Funding: State and federal agencies Completion Date: 1 – 2 years
Westwood 2 Continued Participation in the NFIP. Westwood is a NFSHA community, however continued participation in the NFIP could help our citizens in the event of a 100 or 500 year flood.
H 1,2 Flood On-going/Open
Ended
City of Westwood Cost: NA Funding: NA Completion Date: Open Ended
Westwood3 Continue to regulate construction in the floodplain and ensure regulatory guidelines are met.
H 1,2 Flood New Floodplain Manager Cost: none Funding: none Completion Date: on-going
Johnson County – City of Westwood Hills Action ID Action/Description Priority Goal(s) Hazard Addressed Status Responsible Entity Estimated Cost and funding Source

Region L Hazard Mitigation Plan, 2013 Final 4.51
Addressed Westwood Hills 1
Continued Participation in the NFIP. While Westwood Hill is NFSHA, participation is important in the event of a 100 or 500 year flood.
H 1,2 Flood On-going/Open
Ended
City of Westwood Hills Cost: NA Funding: NA Completion Date: Open Ended
Westwood Hills2
Continue to regulate construction in the floodplain and ensure regulatory guidelines are met.
H 1,2 Flood New Floodplain Manager Cost: none Funding: none Completion Date: on-going
Johnson County – USD 229 Blue Valley Action ID Action/Description Priority Goal(s)
Addressed Hazard Addressed Status Responsible Entity Estimated Cost and funding Source
USD229 1 Blue Valley Schools Safe Room Shelter for staff and students during wind storms. Build safe rooms/”hardened” room in school facilities in accordance with FEMA publication #361, “Design and Construction Guidance for Community Shelters”.
M 1,2 Tornado, Windstorm On-going Director of Blue Valley Safety & Security
Cost: Unknown Funding: HMGP Completion Date: Ongoing as funding becomes available
Johnson County – USD 230 Spring Hill Action ID Action/Description Priority Goal(s)
Addressed Hazard Addressed Status Responsible Entity Estimated Cost and funding Source
USD230 1 Tornado safe rooms at all attendance centers. Build safe rooms/”hardened” room in school facilities in accordance with FEMA publication #361, “Design and Construction Guidance for Community Shelters”.
M 1,2 Tornado, Windstorm On-going Superintendent/Asst. Superintendent
Cost: $100,000 to $150,000 per bldg $500,000 to 750,000 total. Funding: bond issues and HMGP Completion Date: 2014
Johnson County – USD 231 Gardner/Edgerton Action ID Action/Description Priority Goal(s)
Addressed Hazard Addressed Status Responsible Entity Estimated Cost and funding Source
USD231 1 Severe Weather Reguge Area Improvements Study. There are differing levels of space available for refuge areas in each of the nine attendance centers. 1. Staff survey of each building’s refuge
H 1,2 Tornado, Windstorm On-going USD231 Director of Operations
Cost: $36,000 for thorough study Funding: FEMA grants, existing capital revenue, and future school bond revenue Completion Date: 2010

Region L Hazard Mitigation Plan, 2013 Final 4.52
areas 2. Employ design consultants to assist with each site survey 3. Implement list of desired improvements ranked by level of need.
USD231 2 Tornado safe rooms in schools. Johnson County averages at least 1 tornado every 2 years. Not all the schools have a “hardened area” for severe weather sheltering. Work with district architects for the safe room to be constructed in accordance with FEMA publication #361, “Design and Construction Guidance for Community Shelters”
H 1,2 Tornado, Windstorm On-going School district administration
Cost: Unknown Funding: HMGP Completion Date: 2025
Johnson County – USD 232 De Soto Action ID Action/Description Priority Goal(s)
Addressed Hazard Addressed Status Responsible Entity Estimated Cost and funding Source
USD232 1 Safe Room tornado Shelters in Schools. USD 232 is among the cooperating school districts now undertaking a study of tornado safety shelters for KSDE. This action plan shows intent to follow up on this study to provide safe rooms where current shelter areas are lacking. Work with district architects to plan for wind-resistant doors and reinforced shelters in new construction.
H 1,2 Tornado, Windstorm On-going Crisis Plan Coordinator, Facility Department
Cost: Unknown Funding: HMGP Completion Date: 2025
USD232 2 Educate Students and/or stakeholders. USD 232 seeks to provide lifelong learning opportunities for all of its patrons and works to make the school a central depository of information. USD 232 has an involved crisis/safety plan that includes educating its students, staff and patrons of possible hazards and steps they can take to protect themselves. Use community school resources to disseminate news and information to students, staff and patrons.
M 3 All Hazards On-going/Open
Ended
Schools Cost: Minimal Funding: USD232 Completion Date: Open Ended

Region L Hazard Mitigation Plan, 2013 Final 4.53
Johnson County – USD 233 Olathe Action ID Action/Description Priority Goal(s)
Addressed Hazard Addressed Status Responsible Entity Estimated Cost and funding Source
USD233 1 Safe Room Tornado Shelters in Schools. Johnson County averages at least 1 tornado every 2 years. None of the Olathe schools have a “hardened area” for severe weather sheltering. Work with district architects for the safe room to be constructed in accordance with FEMA publication #361, “Design and Construction Guidance for Community Shelters” for new schools, additions to schools, and school renovation projects.
H 1,2 Tornado, Windstorm On-going School District Administration
Cost: Unknown Funding: HMGP Completion Date: 1 – 5 years
USD233 2 Back up generators for food production center, central office, and designated Jr High for community shelter. These three designated facilities are critical to communities’ disaster response plans. As new additions and remodeling occurs, new back-up generators should be purchased for these three facilities.
M 2 Lightning, tornado, utility/infrastructure failure,
winter storm, windstorm
On-going School District Administration
Cost: Unknown Funding: Grant, local Completion Date: 1 – 5 years
Johnson County – USD 512 Shawnee Mission Action ID Action/Description Priority Goal(s)
Addressed Hazard Addressed Status Responsible Entity Estimated Cost and funding Source
USD512 1 Shawnee Mission Schools Safe Rooms. USD 512 is among the cooperating school districts now undertaking a study of tornado safety shelters for KSDE. This
H 1,2 Tornado, Windstorm On-going Shawnee Mission Operations & Maintenance Department
Cost: Unknown Funds: Bond and/or capital funds, HMGP Completion Date: 2025

Region L Hazard Mitigation Plan, 2013 Final 4.54
action plan shows intent to follow up on this study to provide safe rooms where current shelter areas are lacking. Work with district architects for the safe room to be constructed in accordance with FEMA publication #361, “Design and Construction Guidance for Community Shelters”.
Johnson County – Kansas School of the Deaf Action ID Action/Description Priority Goal(s)
Addressed Hazard Addressed Status Responsible Entity Estimated Cost and funding Source
KSD 1 ADA Community Safe Room. The student population is multiply disabled including blindness. Moving them around as a group is slow and cumbersome. The school buildings, where students spend most of their day, were built in the prior to 1950's and are not equipped with reinforced construction required to provide truly safe protection from tornadoes or other severe weather related incidents. Currently hallways are designated as tornado shelter areas. We do this because the many buildings have no basement . An ADA Safe Room on the main level would allow us to move the students to this area in a short period of time where they were safe and where they can be found easily by emergency personnel.
H 1,2 Windstorm, Tornado New Unified Government, KSSDB Superintendent
Cost: Unknown Funds: FEMA Grant Completion Date: 12 – 18 months
KSD 2 Backup Generator. We have medically fragile students with multiple handicaps many of whom live on site. Loss of power would expose them to danger from health risks from lowered temperatures and safety risks from exposure to alternative heating sources like
H 1,2 Utility Failure, Windstorm, Winter Storm
New Unified Government, KSSB Superintendent
Cost: $230,000 total Funds: FEMA Completion Date: 8 – 10 months

Region L Hazard Mitigation Plan, 2013 Final 4.55
kerosene heaters or other exposed flames. Over the years during loss or power incidents the students have been at risk. The campus was originally built in mid 1800’s; the wiring is antiquated. We have multiple separate power feeds into the campus. The generator would allow us to better protect the students in the event of a major crisis like an Ice Storm – the generator would prevent students being exposed to dangerous environments such as loss of heat, open heaters, kerosene heaters, inadequate food preparation and safe food storage. Also because of the location and layout of the campus we could be an emergency housing site for neighborhood groups living in the vicinity. The campus could also provide housing for workers such as utility workers or medical personnel or even a quarantine location in the event of a medical emergency. For this level of response all the buildings would be need access to the Backup Generator.
KSD 3 Closed Site Clinic. We are a facility with medically fragile students some of whom have multiple disabilities; therefore, we have an onsite Infirmary with 24/5 staffing. Because many of the students come from out of state Kansas it is sometimes difficult to impossible for them to get immunizations for things like flu in their home communities because they live on the campus during the week. Having vaccine available on campus would facilitate them getting the proper immunization as well as providing the service to the staff. In addition we could provide the same service, in cooperation with the Health Dept. To the
H 1,2 Major Disease Outbreak New Unified Government, KSSB Superintendent
Cost: Unknown Funds: FEMA Grant Completion Date On-going

Region L Hazard Mitigation Plan, 2013 Final 4.56
community neighbors. We propose having a regular scheduled time for immunizations on the campus using the qualified medical staff. This could be coordinated with the Unified Government Health Department
KSD 4 Mass Notification for intruders, hazards, natural disasters, bomb and civil disorder events. This type of notification systems proves to be effective for deaf (visual notice) & for blind (audio) individuals.
H 1,2,4 All Hazards New School for the Blind Operations Director
Cost: $800,000 Funds: State, FEMA Completion Date: 5 year phased implementation
KSD5 All Hazard Staff & Student Evacuation Plan/Education.
1. Preparing staff and students for their role in all-hazard preparedness is paramount to the schools capability to respond to and recover from potential hazards.
2. Educating staff & students about safety, regulations, and alternative work site is another safety issue we could potentially face.
3. Continue to produce, update annually and distribute the Crisis Management Handbook. This is used in relation to local emergency response teams training as well as distributed to ?? groups and school associations.
4. Help continue to produce update inserts for the August 1st start of school all staff in-service.
H 1,3,4 All Hazards On-going Crisis Management Team and Emergency Management Department
Cost: $185 for 20-40 handbooks Funds: Instructional Operational Funding Completion Date: FY 2013 On-going
Johnson County – Johnson County Community College
Action ID Action/Description Priority Goal(s) Hazard Addressed Status Responsible Entity Estimated Cost and funding Source

Region L Hazard Mitigation Plan, 2013 Final 4.57
Addressed JCCC 1 Upgrade new Library & other new
buildings with safe rooms. Johnson County Community College Campus does not currently have any safe rooms. During the planning, programming, and design of the new Library addition, the architects and engineers will make cost estimates for providing community safe rooms to protect the peak building population. This will be completed in accordance with FEMA publication #361, “Design and Construction Guidance for Community Shelters”.
H 1,2 Tornado, Windstorm On-going JCCC Police Department and Emergency Preparedness Manager
Cost: $30,000 million For library and safe room. Funds: Bonds, Grants, College Budget, Donations Completion Date: 2015
Johnson County – University of Kansas Edwards Campus Action ID Action/Description Priority Goal(s)
Addressed Hazard Addressed Status Responsible Entity Estimated Cost and funding Source
KUEdwards 1 Update Emergency Management Plan
M 1,3,4 All Hazards On-going Mary E. Ryan, Associate Dean, Academic and Student Affairs, KU Edwards Campus
Cost: Minimal Funds: No funds Completion Date: 2015
KUEdwards 2 Public Education To provide educational preparedness material to students, staff, and faculty.
M 3 All Hazards On-going, Open Ended
Mary E. Ryan, Associate Dean, Academic and Student Affairs, KU Edwards Campus
Cost: Minimal Funds: No funds Completion Date: 2015
KUEdwards 3 Future Design of Buildings – include safe room design. The University of Kansas Edwards Campus does not currently have any safe rooms. All future buildings constructed, will be designed to include safe rooms constructed in accordance with FEMA publication #361, “Design and Construction Guidance for
M 1,2 Tornado, Windstorm On-going Mary E. Ryan, Associate Dean, Academic and Student Affairs, KU Edwards Campus
Cost: Minimal Funds: KDEM, FEMA Completion Date: 2015
KUEdwards 4 Mutual Aid Agreement. The University of Kansas Edwards Campus does not currently have any mutual aid agreement with
M 4 All Hazards On-going Mary E. Ryan, Associate Dean, Academic and Student Affairs, KU Edwards Campus
Cost: Minimal Funds: No funds Completion Date: 2015

Region L Hazard Mitigation Plan, 2013 Final 4.58
outside response agencies. Develop mutual aid agreements with nearby response agencies
Johnson County – Consolidated Fire District #2 Action ID Action/Description Priority Goal(s)
Addressed Hazard Addressed Status Responsible Entity Estimated Cost and funding Source
ConsFD2 1 Replacement of doors at emergency fire protection facility. The existing apparatus bay doors at Consolidated Fire District #2 are slow opening and hazardous to operate particularly during inclement weather. The plan is to retrofit or replace the existing apparatus bay doors with wind storm resistant, quick opening bi-fold doors.
H 2 Windstorm On-going Consolidated FD #2 Cost: $60,000 Funds: Grant, Local Completion Date: 18 months
Johnson County – Fire District #1 Action ID Action/Description Priority Goal(s)
Addressed Hazard Addressed Status Responsible Entity Estimated Cost and funding Source
FD1 1 Fire Station Windstorm Damage Mitigation. The South West portion of Johnson County is vulnerable to severe weather conditions which produce damaging winds. Fire stations are susceptible to damage from these storms. The weakest points of the structures are apparatus bay doors and large surface area windows. Retrofit the three fire stations within the Fire District with wind resistant / energy efficient doors. All large surface area windows would be fitted with storm panels.
H 2 Windstorm On-going Fire District #1 Johnson County, Fire chief
Cost: $250,000 Funds: Budget, Bonds, Mitigation Grant funds if available Completion Date: 2019

Region L Hazard Mitigation Plan, 2013 Final 4.59
Johnson County – Fire District #2
Action ID Action/Description Priority Goal(s) Addressed
Hazard Addressed Status Responsible Entity Estimated Cost and funding Source
FD2 1 Fire Station Windstorm Damage Mitigation. Johnson County is vulnerable to severe weather conditions which produce damaging winds. Fire stations are susceptible to damage from these storms. The weakest points of the structures are apparatus bay doors and large surface area windows. Retrofit the fire stations within the Fire District with wind resistant / energy efficient doors. All large surface area windows would be fitted with storm panels.
H 2 Windstorm On-going Fire District #2, Fire Chief Cost: $250,000 Funds: Budget, Bonds, Mitigation Grant funds if available. Completion Date: 2019
FD2 2 Purchase Backup generators. During many severe thunderstorms and ice storms electrical power is lost. This causes a delay of response that may be needed. The plan is to obtain cost share funding from FEMA to purchase two generators for fire station #2 and #3
H 2 Lightning, Tornado, Utility/Infrastructure
Failure, Winter Storm, Windstorm
On-going Fire District #2, Fire chief Cost: Unknown Funds: Grants, capital improvement, and bonds Completion Date: 2019
Johnson County – Fire District 3 Action ID Action/Description Priority Goal(s)
Addressed Hazard Addressed Status Responsible Entity Estimated Cost and funding Source
FD3 1 Back-up generators for fire stations. During many severe thunderstorms and ice storms electrical power is lost. This causes a delay of response that may be needed. The plan is to obtain cost share funding from FEMA to purchase two or three generators for the fire stations.
M 2 Lightning, Tornado, Utility/Infrastructure
Failure, Winter Storm, Windstorm
On-going Fire District #3, Johnson County
Cost: Unknown Funds: Grants, capital improvement, and bonds Completion Date: 2019
Leavenworth County

Region L Hazard Mitigation Plan, 2013 Final 4.60
Leavenworth County Multijurisdictional Actions
Action ID
Action/Description Priority Goal(s) Addressed
Hazard Addressed Status Responsible Entity Estimated cost, Funding Source, and Completion Date
1 Leavenworth County and the cities of Basehor, Lansing, Leavenworth, Linwood, and Tonganoxie are committed to continued participation and compliance with the National Flood Insurance Program (NFIP). The decision on whether to join the NFIP is very important for a jurisdiction (community). There is no Federal law that requires a jurisdiction to join the program, and participation is voluntary. A benefit of participation is that the citizens are provided the opportunity to purchase flood insurance to protect themselves against flood losses. Another consideration is that a jurisdiction that has been identified by FEMA as being flood-prone and has not joined the NFIP within one year of being notified of being mapped as flood-prone will be sanctioned. Jurisdictions that regulate development in floodplains are able to participate in the NFIP. To participate in the NFIP the jurisdiction must adopt and enforce floodplain management regulations that meet or exceed the minimum requirements of the program.
H 1,2 Flood On-going, Open Ended
County Planners, City Officials Cost: NA Funds: State/FEMA/Program Grants Completion Date: continuous
2 Contact owners identified in high-risk flood areas and inform them of potential availability of assistance through the Federal Flood Mitigation Assistance (FEMA) program, in addition to other flood protection measures. Property owners should be contacted every year to promote the availability of the FEMA funding and to determine their level of interest in applying for the program.
H 3 Flood On-going, Open Ended
County Planners, City Officials Cost: NA Funds: Local Completion Date: Continuous
3 Advertise and promote the availability of flood insurance to property owners by direct mail once a year. Leavenworth
H 3 Flood On-going, Open Ended
County Planners, City Officials Cost: NA Funding: Local Completion Date: Continuous

Region L Hazard Mitigation Plan, 2013 Final 4.61
County, including the cities of Leavenworth, Lansing, Basehor, Easton, Tonganoxie, and Linwood, participates in the National Flood Insurance Program (NFIP). There are currently 214 policies in effect, with a total coverage amount of $41,122,700. Since the jurisdiction joined the program, there have been 197 claims paid for a total loss paid amount of $2,260,341. (Source: FEMA, 2008). NFIP flood insurance policies protect property owners by offering affordable rates for protecting both structures and contents.
4 Collect educational materials on individual and family preparedness / mitigation measures for property owners, and display at both the library and routinely visited government offices.
H 3 All Hazards On-going, Open Ended
Chamber of Commerce, Emergency Management, City Officials
Cost: NA Funds: Local Completion Date: Continuous
5 Annually host a public “hazards workshop” in combination with local festivals, fairs, or other appropriate events. A hazard workshop for county residents should be added to an established event drawing large crowds. The workshop should be geared toward educating them on the hazards that threaten Leavenworth County, and the mitigation and preparedness measures available to protect them. Guest speakers from the National Weather Service, the Kansas Division of Emergency Management, and other relevant agencies should be invited to attend, and educational displays/handouts should be provided such as Flood Insurance Rate Maps, FEMA publications, safety tips, etc.
H 3,4 All Hazards On-going, Open Ended
City and County Planners, Emergency Management
Cost: NA Funds: Local Completion Date: Continuous
6 Promote and educate the jurisdiction’s public and private sectors on potential agricultural terrorism and bio-terrorism issues that can severely impact the county and regional economies, and develop and
H 1,2,3,4 Terrorism, Agriterrorism, Civil disorder
On-going, Open Ended
County Health Department, County Emergency Management, county Extension, Local Producers
Cost: NA Funds: Local/State Completion Date: continuous

Region L Hazard Mitigation Plan, 2013 Final 4.62
implement plans to address these issues. Leavenworth County is basically an agricultural community. A natural or intentional introduction of a foreign animal disease would be devastating to the local, regional state, economies. This annex will be added to the Local Emergency Operations Plan, a separate part of the plan addressing FAD, with additional annexes developed in the future to address other types of terrorism.
7 The County and local governments will work with the Kansas Dept. of Ag - Division of Water Resources to educate and promote local jurisdictional participation in the National Flood Insurance Program’s Community Rating System (CRS). The Kansas Division of Water Resources provides local training and education on the benefits of participation in the NFIP. The program provides availability of flood insurance to individuals whose local governments participate in the program. Flood insurance claims are paid even if a disaster is not declared by the President, and there is no payback requirement. Flood insurance policies are continuous, and are not non-renewed or cancelled for repeat losses.
H 3,4 Flood On-going, Open Ended
Emergency Management, City Officials
Cost: NA Funds: Local/State Completion Date: continuous
8 Establish, promote, and fund continuity of water systems between rural water districts to larger water departments to manage future growth in the county. The rural water districts are in need to have some connectivity to larger municipal water departments to continue growth, and also to assure continuous water supply to all districts if one district is jeopardized with lost of water or contamination of the supply. Seek funding through Federal and State grants to accomplish this task.
M 4 All Hazards On-going Water Departments, Water Districts
Cost: Unknown Funds: Local, State, Federal Completion Date: 31 Dec 2015
9 Encourage the construction of safe rooms and storm shelters in public
H 1,2 Tornado On-going, Open
School Districts, City Officials, State of Kansas, FEMA
Cost: Unknown Funds: FEMA, State, Local
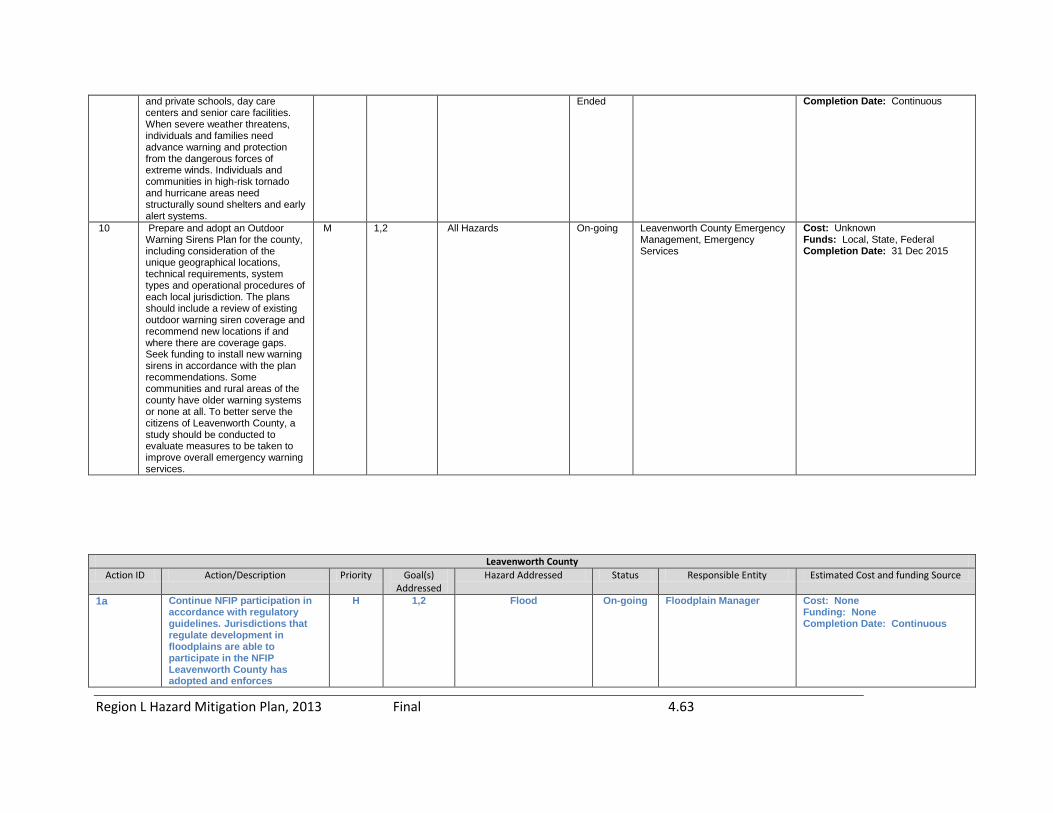
Region L Hazard Mitigation Plan, 2013 Final 4.63
and private schools, day care centers and senior care facilities. When severe weather threatens, individuals and families need advance warning and protection from the dangerous forces of extreme winds. Individuals and communities in high-risk tornado and hurricane areas need structurally sound shelters and early alert systems.
Ended Completion Date: Continuous
10 Prepare and adopt an Outdoor Warning Sirens Plan for the county, including consideration of the unique geographical locations, technical requirements, system types and operational procedures of each local jurisdiction. The plans should include a review of existing outdoor warning siren coverage and recommend new locations if and where there are coverage gaps. Seek funding to install new warning sirens in accordance with the plan recommendations. Some communities and rural areas of the county have older warning systems or none at all. To better serve the citizens of Leavenworth County, a study should be conducted to evaluate measures to be taken to improve overall emergency warning services.
M 1,2 All Hazards On-going Leavenworth County Emergency Management, Emergency Services
Cost: Unknown Funds: Local, State, Federal Completion Date: 31 Dec 2015
Leavenworth County Action ID Action/Description Priority Goal(s)
Addressed Hazard Addressed Status Responsible Entity Estimated Cost and funding Source
1a Continue NFIP participation in accordance with regulatory guidelines. Jurisdictions that regulate development in floodplains are able to participate in the NFIP Leavenworth County has adopted and enforces
H 1,2 Flood On-going Floodplain Manager Cost: None Funding: None Completion Date: Continuous
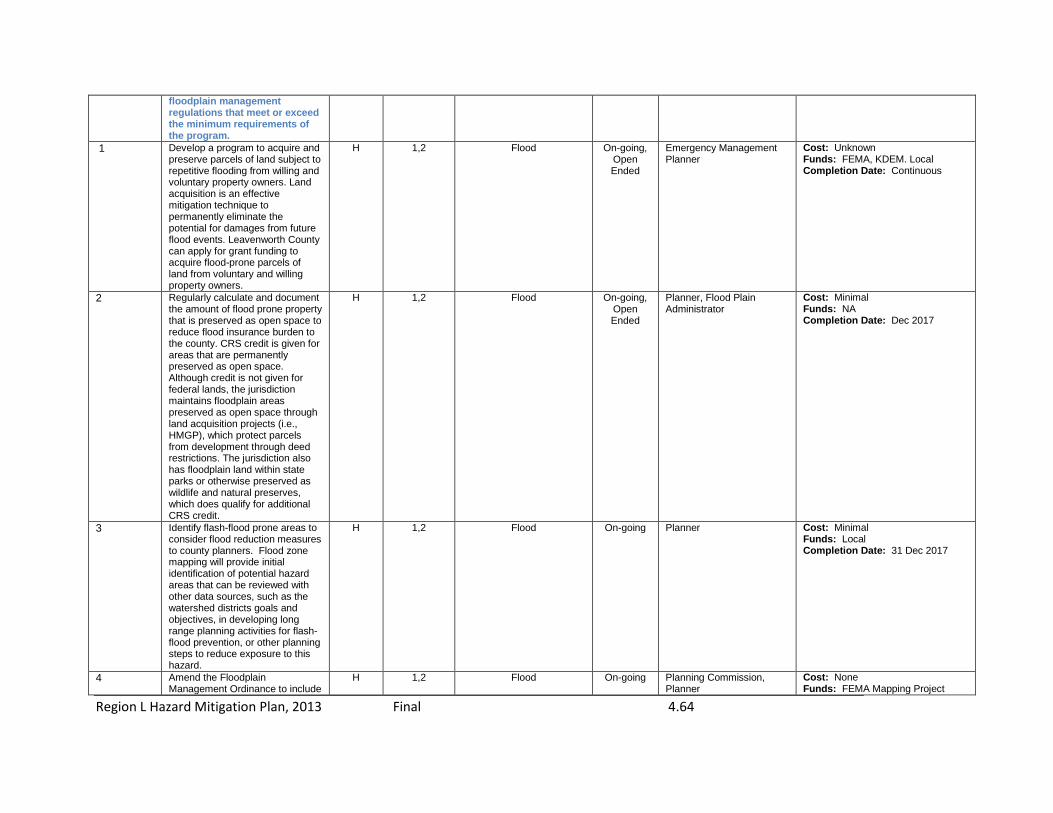
Region L Hazard Mitigation Plan, 2013 Final 4.64
floodplain management regulations that meet or exceed the minimum requirements of the program.
1 Develop a program to acquire and preserve parcels of land subject to repetitive flooding from willing and voluntary property owners. Land acquisition is an effective mitigation technique to permanently eliminate the potential for damages from future flood events. Leavenworth County can apply for grant funding to acquire flood-prone parcels of land from voluntary and willing property owners.
H 1,2 Flood On-going, Open Ended
Emergency Management Planner
Cost: Unknown Funds: FEMA, KDEM. Local Completion Date: Continuous
2 Regularly calculate and document the amount of flood prone property that is preserved as open space to reduce flood insurance burden to the county. CRS credit is given for areas that are permanently preserved as open space. Although credit is not given for federal lands, the jurisdiction maintains floodplain areas preserved as open space through land acquisition projects (i.e., HMGP), which protect parcels from development through deed restrictions. The jurisdiction also has floodplain land within state parks or otherwise preserved as wildlife and natural preserves, which does qualify for additional CRS credit.
H 1,2 Flood On-going, Open Ended
Planner, Flood Plain Administrator
Cost: Minimal Funds: NA Completion Date: Dec 2017
3 Identify flash-flood prone areas to consider flood reduction measures to county planners. Flood zone mapping will provide initial identification of potential hazard areas that can be reviewed with other data sources, such as the watershed districts goals and objectives, in developing long range planning activities for flash-flood prevention, or other planning steps to reduce exposure to this hazard.
H 1,2 Flood On-going Planner Cost: Minimal Funds: Local Completion Date: 31 Dec 2017
4 Amend the Floodplain Management Ordinance to include
H 1,2 Flood On-going Planning Commission, Planner
Cost: None Funds: FEMA Mapping Project

Region L Hazard Mitigation Plan, 2013 Final 4.65
a “no-rise (in base flood elevation)” clause for Leavenworth County. Many floodplain permitting systems, including those that meet National Flood Insurance Program standards, allow projects outside the floodway to increase base flood elevations by up to one foot. While this may not represent a significant increase for just one project, the cumulative impact of a number of projects in the same floodplain can be significant. By prohibiting any rise throughout the 100-year floodplain, a “no rise” clause ensures that the cumulative impact of multiple permitted projects will not cause flood elevations to rise to unacceptable levels.
Completion Date: 31 Dec 2015
5 Research and design an appropriate stream buffer ordinance to further protect the jurisdiction’s water resources and to limit future flood damages adjacent to major waterways. Riparian buffers serve as natural boundaries between local waterways and existing development and help protect resources by filtering pollutants, providing flood control, alleviating streambank erosion, mitigating stream warming, and providing room for lateral movement of the stream channel. Buffer widths can vary greatly depending upon stream channel size and the intended purpose of the buffer, but 50-100 feet is generally considered to be sufficient for purposes of bank stabilization and sediment control. Many communities require 200 feet for flood control purposes. Special consideration should be given to Stranger Creek, while exempting Leavenworth County’s agricultural operations from buffer regulations.
H 1,2 Flood On-going Planning Commission, Planner
Cost: Minimal Funds: FEMA/State/Local.Levee Districts Completion Date: 31 Dec 2017
6 Identify levee owners in the jurisdiction. Early in the
H 1,2 Flood On-going Planner, emergency Management, Levee
Cost: Minimal Funds: Local

Region L Hazard Mitigation Plan, 2013 Final 4.66
implementation of Flood Map Modernization (Map Mod), the Department of Homeland Security's Federal Emergency Management Agency (FEMA) recognized that the role of levees in flood risk reduction would be an important part of the efforts of Map Mod. Further, it was acknowledged that the condition of levees had not been assessed since they were originally mapped as providing base (1-percent-annual-chance) flood protection. Because of this, FEMA initiated a revised process to gain a better understanding of the actual flood risks for those citizens living and working behind levees nationwide. Often, documentation regarding levee design, accreditation, and the impacts on flood hazard mapping is outdated or missing altogether. Identifying levee owners and developing initiatives for certifying levees may help reduce overall risk to life and property in the community.
Districts Completion Date: 31 Dec 2015
7 Implement a study to determine the residual flood risk in levee-protected areas. Levee owners or communities have the responsibility to provide documentation that a levee meets the requirements of Title 44 of the Code of Federal Regulations, Section 65.10 of the national Flood Insurance Program regulations (44CFR Section 65.10), as part of a study/mapping project. Without the required documentation necessary to comply with 44 CFR Section 65.10, the area behind the levee will be re-delineated and mapped as Special Flood Hazard Area (SFHA) on the Digital Flood Insurance Rate Map (DFIRM). Procedure Memorandum No. 34 allows for the issuance of a deadline to the community for submitting the required
M 1,2 Flood On-going Planner, Levee Districts Cost: Staff Time Funds: Local Completion Date: 31 Dec 2015

Region L Hazard Mitigation Plan, 2013 Final 4.67
documents. 8 Identify the county’s most at-risk
critical facilities, and evaluate potential mitigation techniques for protecting each facility to the maximum extent possible. A thorough evaluation of potential mitigation opportunities for Leavenworth County’s critical facilities must still be completed. Currently, there is very little available data on these facilities. An inventory/database on critical facilities should be created and maintained by the county and shared with the Kansas Division of Emergency Management. This inventory should include information on the location and risk to each facility, and should also document any cost-effective mitigation techniques to consider when funding becomes available.
M 1,2 All Hazards On-going Emergency Management Cost: None Funds: Local Completion Date: 31 Dec 2017
9 Conduct an inventory/survey for the county’s emergency response services to identify any existing needs or shortfalls in terms of personnel, equipment or required resources. A survey should be completed in order to verify the county’s current emergency services are adequate to protect public health and safety from most probable hazard events. Any identified needs or shortfalls should become documented and result in specific recommendations to the County Commission for emergency service enhancements.
M 1 All Hazards On-going Emergency Management, GIS
Cost: None Funds: Local/State Completion Date: 31 Dec 2015
10 Research, develop, and recommend an ordinance/resolution to require installation of tornado shelters for major manufactured and/or mobile home parks with more than 10 mobile home spaces. Mobile homes are particularly vulnerable to damage from high winds. Residents, even those who live in mobile homes with tie-downs, should seek safe shelter when a
H 1,2 Tornado, Windstorm On-going Planning and Zoning Department
Cost: None Funds: NA Completion Date: 31 Dec 2015

Region L Hazard Mitigation Plan, 2013 Final 4.68
tornado threatens. Tornado shelters should be constructed in major mobile home parks to ensure a safe place for residents to go during a tornado event. The shelter structure, which should be designed to withstand a minimum of 120mph winds, could easily serve an alternate purpose such as a community center, laundry facility, etc. Tornado shelters should be for last minute protection for high wind events.
11 Evaluate the firefighting water supply resources within the County. This should include both fixed and mobile supply issues. Lack of sufficient water supply makes it difficult for firefighters to suppress fires. Whenever possible, increasing access to water along water service delivery lines (wet and dry hydrants) would provide additional resources for emergency responders.
M 1,2 Wildfire On-going Fire Officials, Emergency Management
Cost: Unknown Funds: Local Completion Date: 31 Dec 2017
12 Distribute assessment report examples provided by the Kansas Forest Service to applicable parties to develop an understanding of the Community Wildfire Protection Plan (CWPP). Recommend joining the program and completing an assessment report for approval. The probability of grass/cropland fire in Leavenworth County is relatively high. With over 58-years of history, the likelihood of future events is estimated to remain the same as currently calculated. Leavenworth County can expect an average of 11.03 significant wildfires per year that damage or destroy a total of 292.83 acres annually. The Kansas Forest Service staff would provide assistance to interested communities in the form of a Community Wildfire Hazard Assessment Report and some mitigation action items.
H 3,4 Wildfire On-going Rural Fire, Emergency Management
Cost: Minimal Funds: Local, State, Federal Grant programs. Completion Date: 31 Dec 2017
13 Develop and implement a wildfire M 3,4 Wildfire On-going, Fire Officials, Emergency Cost: Dependent on size

Region L Hazard Mitigation Plan, 2013 Final 4.69
prevention/education program. In addition to providing education to the general public, the program should also target children, fire and equipment users, builders and developers, and homeowners. Leavenworth County has burn-ban resolutions which require special permission to conduct open burning operations. In periods of drought or extreme weather conditions a burn ban may be declared. When a ban is declared all radio stations, TV stations, and regional newspapers in the area are notified as well as mayors, fire chiefs, etc. To better educate the public at large, Leavenworth County should expand their existing fire protection program to include wildfire workshops to all age groups and commercial operations.
Open Ended
Management Funds: Local Completion Date: continuous
14 Examine the current agreements within the county and assess the need to expand or update cooperative agreements for firefighting resources. Include agreements with local, state and federal agencies. Cooperative agreements provide the support needed in times of emergency, and are an important element of planning, with the long-range goal of reducing damage to structures and systems within the jurisdiction.
H 4 Wildfire On-going, Open Ended
Fire Officials, Emergency Management
Cost: None Funds: Local Completion Date: Continuous
15 Appoint a rural fire committee to schedule meetings with the Kansas Forest Service to map suspected hazardous wildfire areas in the county for potential participation in the Community Wildfire Protection Program (CWPP). In order for a community to take advantage of the Community based Healthy forests Restoration Act (HFRA), 2003, a community must develop a Community Wildfire Protection Plan (CWPP). To develop qualifications the community must
M 3,4 Wildfire On-going Rural Fire, Emergency Management
Cost: None Funds: Local/State/Federal Completion Date: 31 Dec 2017

Region L Hazard Mitigation Plan, 2013 Final 4.70
identify and map potential hazard areas as an initial step towards participation in the program.
16 Incorporate wildfire maps, develop actions and projects for wildfire prevention, and complete an assessment report to meet CWPP requirements for submittal to the Kansas Forest Service. The minimum requirements participation in the CWPP as described in the HFRA are: (1) Collaboration: A CWPP must be collaboratively developed by local and state government representatives, in consultation with federal agencies and other interested parties. (2) Prioritized Fuel Reduction: A CWPP must identify and prioritize areas for hazardous fuel reduction treatments and recommend the types and methods of treatment that will protect one or more at-risk communities and essential infrastructure. (3) Treatment of Structural Ignitability: A CWPP must recommend measures that homeowners and communities can take to reduce the ignitability of structures throughout the area addressed by the plan.
M 1,4 Wildfire On-going Rural Fire, Emergency Management
Cost: Minimal Funds: Local, Federal, State Completion Date: 31 Dec 2017
17 Develop cross-departmental information collection capabilities, and incorporate cadastral (building/parcel) data utilizing a GIS for purposes of conducting more detailed hazard risk assessments and for tracking permitting / land use patterns, buildings and infrastructure replacement costs, and overall structural accounting for the county. A comprehensive catalog of data can greatly enhance the county’s technical capability to manage, analyze and display spatially referenced data. Leavenworth County has GIS capabilities available through the Leavenworth GIS Department. Further development of this
M 4 All Hazards On-going, Open Ended
Emergency Management, GIS
Cost: None Funds: KDEM, Local, grants Completion Date: Continuous

Region L Hazard Mitigation Plan, 2013 Final 4.71
capability for functional use across all departments will enhance the county’s overall capabilities to document building/structure cost data, and further hazard mitigation goals in developing cadastral data for the county.
18 Develop an annex to the Local Emergency Operations Plan (LEOP) for dam/levee failure response and evacuation plans for high hazard dams/levees in Leavenworth County. Leavenworth County has 221 dams in the county that are regulated by the Kansas Department of Agriculture, Water Resources Department. Seven of these structures are classified as “High Hazard Class C” structures, and are owned by various private, State, and Federal agencies. The State evaluation of the dams is based on location in areas where failure may cause extensive loss of life, serious damage to homes, industrial and commercial facilities, important public utilities, main highways or railroads. It is important to note that a high hazard dam is not necessarily unsafe, as defined by the State of Kansas. An individual dam’s hazard classification is based upon the potential consequences of dam failure and does not reflect the physical condition of the dam. Preparing for a potential emergency is an essential planning step to secure the people and property downstream from a potential breach or dam failure. There are also an estimated 48 levees reported in the county, of which four (4) are owned by the county. Ownership for the remaining levees is listed as unknown.
H 1,2 Dam/Levee On-going Emergency Management Department
Cost: None Funds: Local Completion Date: 31 Dec 2017
19 Seek funding to complete a stormwater drainage study for Leavenworth County that will lead to a stormwater management
M 1,2 Flood On-going Planner, Public Works Cost: Unknown Funds: State of Kansas, FEMA Completion Date: 31 Dec 2015

Region L Hazard Mitigation Plan, 2013 Final 4.72
ordinance that maintains pre-development runoff rates. The study should include an evaluation of existing dams/levee systems, vulnerable streams, and other major waterways in the county that may impact growth patterns established for the county. Stormwater management best practices for Leavenworth are addressed in the Leavenworth County Land Use Plan. According to the Plan, guidance is to protect environmentally sensitive land and maintain open space, and adopting a stream setback policy for all new developments. A stormwater drainage study/plan will identify drainage problems and address solutions through detention, retention, and drainage system maintenance among other specific mitigation measures.
20 Research and contact all owners of high hazard dams in the county, and inform them of their responsibility to provide Emergency Action Plans to the Leavenworth County Emergency Management as prescribed by the Kansas Department of Agriculture – Water Resources Division, Chief Engineer. Additionally, Levee owners should be contacted regarding potential PM 43 requirements for continued validation of protected areas behind the levees. Leavenworth County has 221 dams in the county that are regulated by the Kansas Department of Agriculture, Water Resources Department. Seven of these structures are classified as “High Hazard” structures. These seven dams should have Emergency Action Plans on file with emergency management for the protection of life and property downstream of these structures. The State evaluation of the dams is based on location in areas where failure
H 3,4 Dam/Levee Failure On-going Emergency Management Department
Cost: Minimal Funds: Local Completion Date: 31 Dec 2017

Region L Hazard Mitigation Plan, 2013 Final 4.73
may cause extensive loss of life, serious damage to homes, industrial and commercial facilities, important public utilities, main highways or railroads. It is important to note that a classification as “High Hazard” is not necessarily unsafe, as defined by the State of Kansas. An individual dam or levee hazard classification is based upon the potential consequences of dam failure and does not reflect the physical condition of the dam. Preparing for a potential emergency is an essential planning step to secure the people and property downstream from a potential breach or dam failure. Approximately 48 levees were identified in Leavenworth County. Certifications are unknown at the time of this Plan.
21 Research and recommend appropriate building codes for the Jurisdiction that includes Wind resistant design techniques for new construction. Currently, Leavenworth County does not have any building code requirements. Incorporated and unincorporated areas of the county should adopt and enforce codes that require certain minimum building practices and contractor licensing for wind loss reduction. Experts agree that structures built to exceed high wind provisions have a much greater chance of surviving violent windstorms. Additional techniques include adding protection for windows (i.e., shutters), anchoring door frames with multiple hinges, stiffening garage doors with additional bracing, reinforcing masonry chimneys with vertical steel, and strengthening connections between walls and the roof with hurricane straps and ties. These techniques should be promoted to building contractors
H 1,4 All Hazards On-going Planning Commission, Planner, BOCC
Cost: None Funds: Local Completion Date: 31 Dec 2017

Region L Hazard Mitigation Plan, 2013 Final 4.74
and homebuyers by the county for all new residential construction, to the maximum extent possible during the building permit process.
22 Establish a local reserve fund to augment the Leavenworth County GIS Department’s ability to monitor building trends and erosion patterns across the county through frequent aerial photography. Utilization of GIS capabilities should be expanded to include monitoring of county topography and water erosion changes a minimum of four times a year. This frequency will allow development of additional GIS layers for future planning, and also assist in identifying mitigation of potential problem areas before they become a major issue for the county.
M 3 Flood Completed County GIS Cost: Undetermined Funds: Local, State, Federal Completion Date: 31 Dec 2015
23 Establish a local reserve fund to develop and support an interactive GIS webpage for the general public. Development and implementation of a county interactive webpage would provides real-time GIS data that will provide an effective training tool, as well as education references for home school, and research activities.
M 3 All Hazards Complete 2013
Leavenworth County GIS Cost: Unknown Funds: Local, State, Federal Completion Date: Complete
24 The Big Stranger Drainage District will continue the care and maintenance, including debris removal, of the portion of the Big Stranger Creek that is located within the Drainage District. The Big Stranger Drainage District contains 16,730 acres within Leavenworth County. The general mission of the drainage district is to see that the Big Stranger Creek is free of of debris on the portion of the creek that is located within the Drainage District. The organization will evaluate the need for further maintenance projects, and additional effort will be made to seek alternative funding as they become available.
M 1,2 Dam/Levee, Flood On-going, Open Ended
Big Strange Drainage District
Cost: Unknown Funds: Local, State, Federal Completion Date: Continuous

Region L Hazard Mitigation Plan, 2013 Final 4.75
25 The Leavenworth County Consolidated Rural Water District (RWD) No. 1 will continue to assess the impact of natural hazards on water distribution lines, systems, and equipment. The Water District will also seek funding sources to mitigate damage to critical infrastructure, and seek funding for various water main improvement projects. The Leavenworth County Consolidated RWD No. 1 provides potable water to their customers in Leavenworth County. Maintaining an adequate, quality water supply to their customers is the district's top priority.
M 1,2 Utility/Infrastructure Failure On-going, Open Ended
Leavenworth county Consolidated RWD #1
Cost: Undetermined Funds: Local, State, Federal Completion Date: Continuous
26 Maintain, repair, and collect GPS locations of fire hydrants within the Leavenworth County area served by Leavenworth County Rural Water District (RWD) 7. The maintenance and repair, as well as the GPS mapping of the fire hydrant locations, could benefit response time of the applicable fire departments serving the areas.
M 1,2 Wildfire Completed 2012
Leavenworth County RWD 7
Cost: Unknown Funds: Local, State, Federal Completion Date: Completed
27 The Leavenworth County Rural Water District (RWD) No. 7 will continue to assess the impact of natural hazards on water distribution lines, systems, and equipment. The Water District will also seek funding sources to mitigate damage to critical infrastructure, and seek funding for various water main improvement projects. The Leavenworth County RWD No. 7 provides potable water to their customers in Leavenworth County. Maintaining an adequate, quality water supply to their customers is the district's top priority.
M 1,2 All Hazards On-going, Open Ended
Leavenworth County RWD 7
Cost: Unknown Funds: Local, State, Federal Completion Date: Continuous
28 Obtain funding for the purchase of mobile backup power generators for the groundwater well facilities of Leavenworth County Rural
M 1,2 All hazards On-going Leavenworth County RWD 7
Cost: Unknown Funds: Local, State, Federal Completion Date: 31 Dec 2020

Region L Hazard Mitigation Plan, 2013 Final 4.76
Water District (RWD) 7. Leavenworth County RWD 7 has identified a need to quickly restore power in its groundwater well facilities in the event of a weather event and the subsequent loss of power.
29 Suburban Water, Inc. will seek funding to prepare a written Emergency Operations Plan to be used as a resource during the initial response to an emergency event and provide guidance until all operations affected are back to normal operation.
M 1,2,4 All Hazards Deleted due to not a plan participant.
Suburban Water, Inc. Cost: Unknown Funds: Local, State, Federal Completion Date: Delete
30 Suburban Water, Inc. will continue to assess the impact of natural hazards on its water supplies, distribution and transmission systems, storage facilities, structures and equipment. Suburban Water, Inc. will also seek funding sources to mitigate damage to critical infrastructure, and seek funding for various water main improvement projects to enhance reliability of service. Suburban Water, Inc. provides potable water to its customers which are located in southern Leavenworth County. Providing a safe, reliable, and high quality water supply to all present and future customers is Suburban Water’s top priority.
M 1,2 All Hazards Deleted due to not
a plan participant
.
Suburban Water, Inc. Cost: Unknown Funds: Local, State, Federal Completion Date: Delete
31 Suburban Water, Inc. will continue to enhance the reliability of its supervisory control and data acquisition (SCADA) system used to monitor the supply of water throughout its distribution system. Suburban Water, Inc. will also seek funding sources to further expand the capabilities of its SCADA system. Suburban Water, Inc. has identified a need to expand the capabilities of its current SCADA system.
M 1,2 All Hazards Deleted due to not
a plan participant
.
Suburban Water, Inc. Cost: Unknown Funds: Local, State, Federal Completion Date: Delete
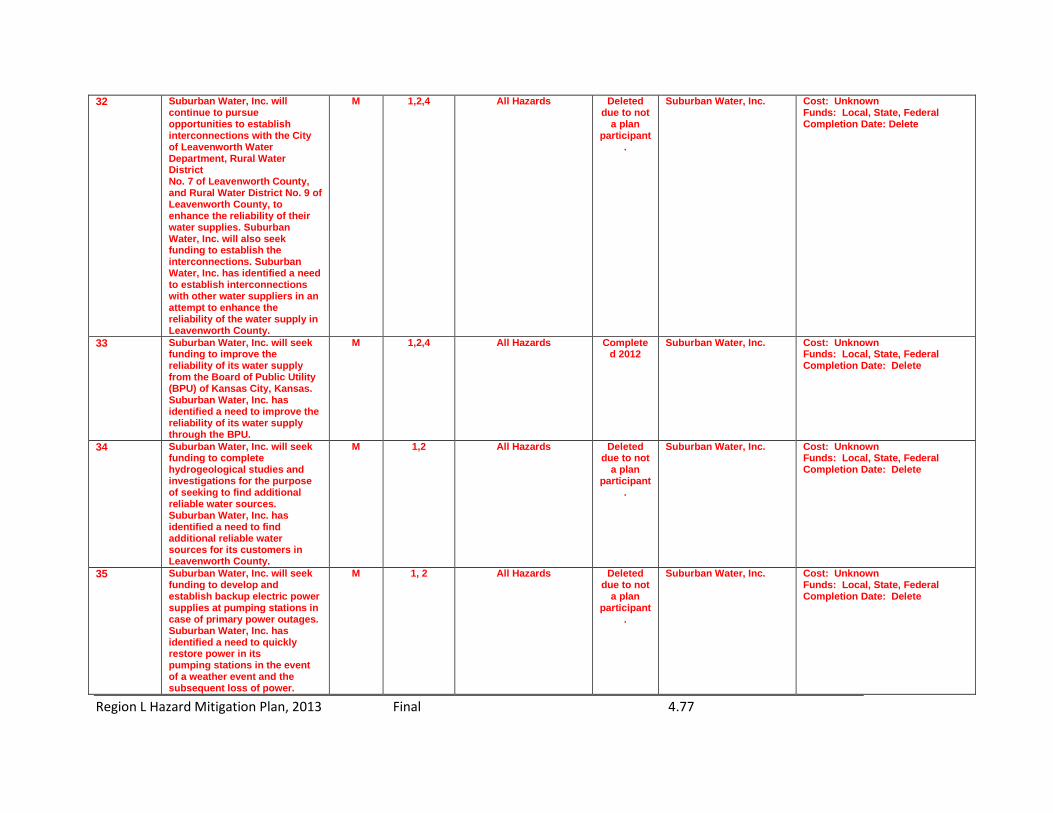
Region L Hazard Mitigation Plan, 2013 Final 4.77
32 Suburban Water, Inc. will continue to pursue opportunities to establish interconnections with the City of Leavenworth Water Department, Rural Water District No. 7 of Leavenworth County, and Rural Water District No. 9 of Leavenworth County, to enhance the reliability of their water supplies. Suburban Water, Inc. will also seek funding to establish the interconnections. Suburban Water, Inc. has identified a need to establish interconnections with other water suppliers in an attempt to enhance the reliability of the water supply in Leavenworth County.
M 1,2,4 All Hazards Deleted due to not
a plan participant
.
Suburban Water, Inc. Cost: Unknown Funds: Local, State, Federal Completion Date: Delete
33 Suburban Water, Inc. will seek funding to improve the reliability of its water supply from the Board of Public Utility (BPU) of Kansas City, Kansas. Suburban Water, Inc. has identified a need to improve the reliability of its water supply through the BPU.
M 1,2,4 All Hazards Completed 2012
Suburban Water, Inc. Cost: Unknown Funds: Local, State, Federal Completion Date: Delete
34 Suburban Water, Inc. will seek funding to complete hydrogeological studies and investigations for the purpose of seeking to find additional reliable water sources. Suburban Water, Inc. has identified a need to find additional reliable water sources for its customers in Leavenworth County.
M 1,2 All Hazards Deleted due to not
a plan participant
.
Suburban Water, Inc. Cost: Unknown Funds: Local, State, Federal Completion Date: Delete
35 Suburban Water, Inc. will seek funding to develop and establish backup electric power supplies at pumping stations in case of primary power outages. Suburban Water, Inc. has identified a need to quickly restore power in its pumping stations in the event of a weather event and the subsequent loss of power.
M 1, 2 All Hazards Deleted due to not
a plan participant
.
Suburban Water, Inc. Cost: Unknown Funds: Local, State, Federal Completion Date: Delete

Region L Hazard Mitigation Plan, 2013 Final 4.78
36 Suburban Water, Inc. will seek funding to develop a secure and protected structure at its headquarters to allow continuous operations during natural disasters. Suburban Water, Inc. identified a need to develop a secure and protected structure at its headquarters to allow continuous operations during natural disasters.
M 1,2 All Hazards Deleted due to not
a plan participant
.
Suburban Water, Inc. Cost: Unknown Funds: Local, State, Federal Completion Date: Delete
37 Suburban Water, Inc. will seek funding to enhance the protection to existing water mains at creek crossings (flood plains). Suburban Water, Inc. identified a need to enhance the protection to existing water mains at creek crossings that are located within flood plains.
M 1,2 Flood Deleted due to not
a plan participant
.
Suburban Water, Inc Cost: Unknown Funds: Local, State, Federal Completion Date: Delete
38 The Leavenworth Water Department will continue to assess the impact of natural hazards on water distribution lines, systems, and equipment. The Department will also seek additional funding sources to mitigate damage to critical infrastructure. The Leavenworth Water Department provides potable water to their customers throughout Leavenworth County, encompassing approximately 55,000 residents. The Department's facilities also includes approximately 180 miles of water transmission and distribution lines, pumping stations, well field, and five million gallons of potable water storage.
M 1,2 All Hazards On-going, Open Ended
Leavenworth Water Department, Leavenworth County
Cost: Unknown Funds: Local, State, Federal Completion Date: Continuous
39 Coordinate county and local government mitigation efforts with Rural Electric Cooperatives (REC’s), encourage identification of hazards potentially affecting their infrastructure, assessment of the vulnerabilities of the infrastructure to these hazards, and identification of mitigation strategies. Long-term planning
M 1,2,4 Utility/Infrastructure Failure On-going City, county Planners, RECs
Cost: Undetermined Funds: NA Completion Date: 31 Dec 2017

Region L Hazard Mitigation Plan, 2013 Final 4.79
goals that will reduce exposure to loss of electrical power are beneficial to all organizations and citizens within the jurisdiction. Power loss during extreme periods of cold or heat increase damage potential to people and property.
Leavenworth County – City of Basehor Action ID Action/Description Priority Goal(s)
Addressed Hazard Addressed Status Responsible Entity Estimated Cost and funding Source
1a Continue NFIP participation in accordance with regulatory guidelines . We have Adopted and enforce floodplain management regulations that meet or exceed the minimum requirements of the program to include new construction in the floodplain..
H 1,2 Flood On-going Floodplain Manager Cost: None Funding: None Completion Date: Continuous
1 Identify flash-flood prone areas to consider flood reduction measures to city/county planners. Flood zone mapping has provided initial identification of potential hazard areas that can be reviewed with other data sources, such as the watershed districts goals and objectives, in developing long range planning activities for flood prevention, or other planning steps to reduce exposure to this hazard.
L 1,2 Flood On-going, 2 major
flash flood prone areas
identified (1 has been
corrected)
Floodplain Manager, City Planner, City Superintendent Public Works
Cost: NA Funds: Local Completion Date: 31 Dec 2018
2 Incorporate the inspection and management of trees into the city maintenance program that may pose a threat to the electrical lines that could result in power outages during ice storms. Significant amounts of property damage occur during ice storms that result from tree failure. Trees that fall into utility lines have additional serious consequences such as
M 1,2 Winter Storm, Wind Storms On-going, Open Ended
City Superintendent, Codes Enforcement Officer
Cost: NA Funds: Local, State, Federal Completion Date: continuous

Region L Hazard Mitigation Plan, 2013 Final 4.80
causing power outages, surges, fires and other damage. The jurisdiction’s ability to recognize and prevent hazardous tree conditions (through inspection, pruning or removal) is the best defense against problems and costly damages resulting from tree failure. Specifically, trees located on jurisdictional property, which pose immediate threats to property, utility lines and other critical facilities should be addressed.
3 Determine the efficacy of the existing generators located within Critical Facility structures, including the City Hall / Police Department, and consider funding options for any Critical Facilities that may require generators and/or transfer switches to maintain power in the event of severe weather events. Ensure that Critical Facilities located within the City of Basehor maintain power during severe weather events.
H 2 All Hazards On-going City Superintendent, Cost: None Funds: Local, State, Federal Completion Date: 31 Dec 2018
4 Seek funding to retain an engineer to design a safe room within the City of Basehor City Hall / Police Department and apply for grant funding for construction of the safe room within the new facility when constructed. A lack of safe rooms poses a serious risk to the community. The City of Basehor has identified a need for a safe room within the Basehor City (new) City Hall / Police Department when constructed.
L 1,2 Tornado, Windstorm On-going, New
concrete encased
vault – no fema rating
or fema rated door
City Engineer, Planner Cost: Unknown Funds: Local, State, Federal Completion Date: 31 Dec 2018
5 Develop a radio communications plan between the City of Basehor Public Works Department / Street Department and City Hall to ensure interoperability between entities. The communications plan should address equipment compatibility and upgrade requirements to implement the plan. The City of
M 4 All Hazards On-going/Conti
nuous
City Administrator, Chief of Police, City Superintendent
Cost: None Funds: Local, State, Federal Completion Date: Continuous

Region L Hazard Mitigation Plan, 2013 Final 4.81
Basehor has identified a need to implement interoperable radio communications between the Public Works Department / Street Department and City Hall.
6 Seek funding options for the purchase of a brine applicator and mixer to apply chemicals to roads within the City of Basehor prior to major winter storm events, including ice storms. The City of Basehor has identified a need for a brine applicator and mixer to assist in maintain safe roads within the city during major winter storm events.
L 1,2 All Hazards On-going, currently
have 3 salt/sand spreaders in use – no brine app.
City Superintendent Cost: Unknown Funds: Local, State, Federal Completion Date: 31 Dec 2018
7 Seek funding options for the purchase of equipment to assist in the removal of debris and assist with cleanups after major storms. The City of Basehor has identified the need for equipment to be utilized in the removal of debris and cleanup after major storms within the city limits. Equipment needed includes a Case 580 Super M Series 3 4x4 extended backhoe with grapple bucket; a Polaris Ranger 800 HD utility vehicle; and a 2010 F-450 Ford 4x4 diesel truck with dump bed. 2014 F-550 Ford 4.4 diesel truck with dump bed.
M 1,2 All Hazards On-going City Superentendent Cost: Unknown Funds: Local, State, Federal Completion Date: 31 Dec 2018
Leavenworth County – City of Easton Action ID Action/Description Priority Goal(s)
Addressed Hazard Addressed Status Responsible Entity Estimated Cost and funding Source
1a Continue NFIP participation in accordance with regulatory guidelines. We regulate development in floodplains and have adopted and enforce floodplain management regulations that meet or exceed the minimum requirements of the program.
H 1,2 Flood On-going Floodplain Manager Cost: None Funding: None Completion Date: Continuous
1 Identify flash-flood prone areas to consider flood reduction measures
H 1,2 Flood On-going Floodplain Manager Cost: Minimal Funds: Local
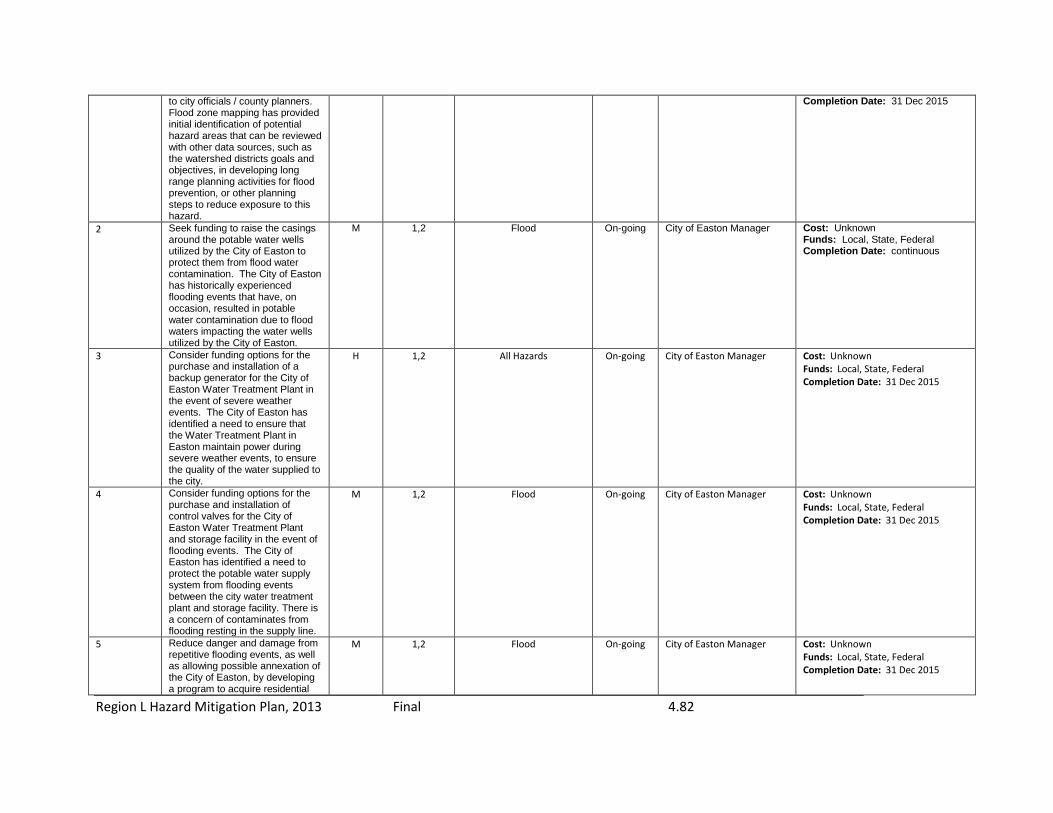
Region L Hazard Mitigation Plan, 2013 Final 4.82
to city officials / county planners. Flood zone mapping has provided initial identification of potential hazard areas that can be reviewed with other data sources, such as the watershed districts goals and objectives, in developing long range planning activities for flood prevention, or other planning steps to reduce exposure to this hazard.
Completion Date: 31 Dec 2015
2 Seek funding to raise the casings around the potable water wells utilized by the City of Easton to protect them from flood water contamination. The City of Easton has historically experienced flooding events that have, on occasion, resulted in potable water contamination due to flood waters impacting the water wells utilized by the City of Easton.
M 1,2 Flood On-going City of Easton Manager Cost: Unknown Funds: Local, State, Federal Completion Date: continuous
3 Consider funding options for the purchase and installation of a backup generator for the City of Easton Water Treatment Plant in the event of severe weather events. The City of Easton has identified a need to ensure that the Water Treatment Plant in Easton maintain power during severe weather events, to ensure the quality of the water supplied to the city.
H 1,2 All Hazards On-going City of Easton Manager Cost: Unknown Funds: Local, State, Federal Completion Date: 31 Dec 2015
4 Consider funding options for the purchase and installation of control valves for the City of Easton Water Treatment Plant and storage facility in the event of flooding events. The City of Easton has identified a need to protect the potable water supply system from flooding events between the city water treatment plant and storage facility. There is a concern of contaminates from flooding resting in the supply line.
M 1,2 Flood On-going City of Easton Manager Cost: Unknown Funds: Local, State, Federal Completion Date: 31 Dec 2015
5 Reduce danger and damage from repetitive flooding events, as well as allowing possible annexation of the City of Easton, by developing a program to acquire residential
M 1,2 Flood On-going City of Easton Manager Cost: Unknown Funds: Local, State, Federal Completion Date: 31 Dec 2015
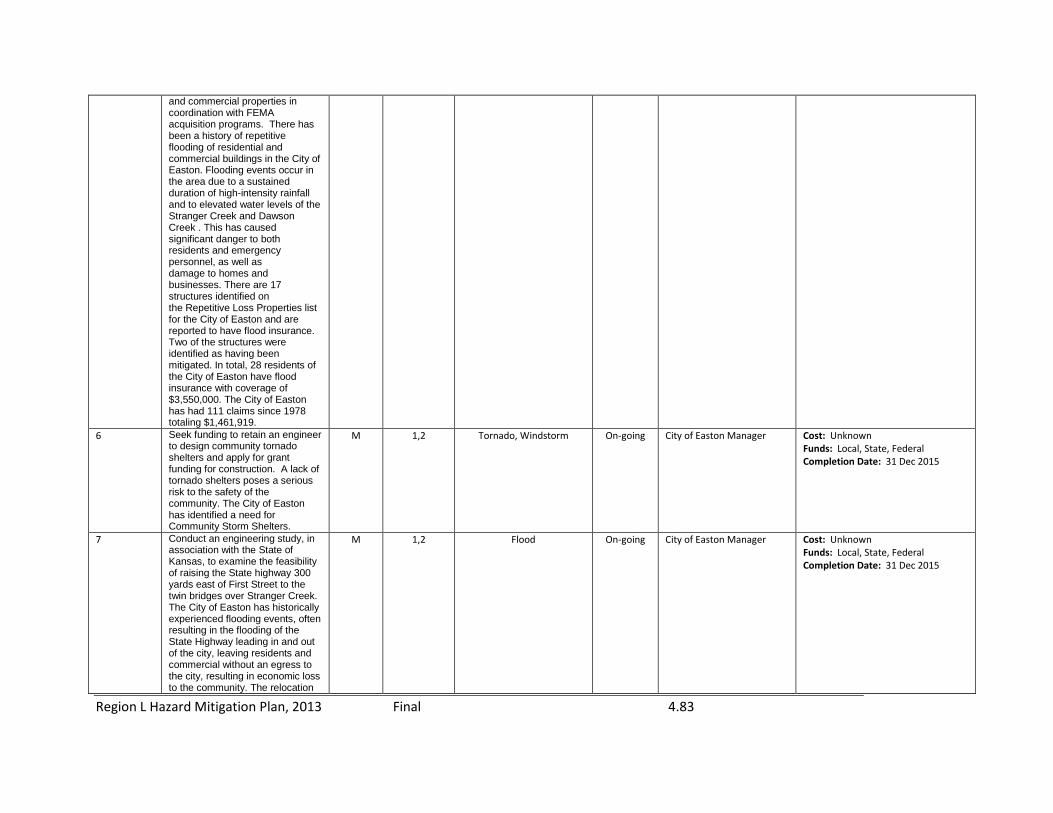
Region L Hazard Mitigation Plan, 2013 Final 4.83
and commercial properties in coordination with FEMA acquisition programs. There has been a history of repetitive flooding of residential and commercial buildings in the City of Easton. Flooding events occur in the area due to a sustained duration of high-intensity rainfall and to elevated water levels of the Stranger Creek and Dawson Creek . This has caused significant danger to both residents and emergency personnel, as well as damage to homes and businesses. There are 17 structures identified on the Repetitive Loss Properties list for the City of Easton and are reported to have flood insurance. Two of the structures were identified as having been mitigated. In total, 28 residents of the City of Easton have flood insurance with coverage of $3,550,000. The City of Easton has had 111 claims since 1978 totaling $1,461,919.
6 Seek funding to retain an engineer to design community tornado shelters and apply for grant funding for construction. A lack of tornado shelters poses a serious risk to the safety of the community. The City of Easton has identified a need for Community Storm Shelters.
M 1,2 Tornado, Windstorm On-going City of Easton Manager Cost: Unknown Funds: Local, State, Federal Completion Date: 31 Dec 2015
7 Conduct an engineering study, in association with the State of Kansas, to examine the feasibility of raising the State highway 300 yards east of First Street to the twin bridges over Stranger Creek. The City of Easton has historically experienced flooding events, often resulting in the flooding of the State Highway leading in and out of the city, leaving residents and commercial without an egress to the city, resulting in economic loss to the community. The relocation
M 1,2 Flood On-going City of Easton Manager Cost: Unknown Funds: Local, State, Federal Completion Date: 31 Dec 2015

Region L Hazard Mitigation Plan, 2013 Final 4.84
of the State Highway to the twin bridges over Stranger Creek would allow residents and commercial commodities to travel through the community during flooding events.
Leavenworth County – City of Lansing Action ID Action/Description Priority Goal(s)
Addressed Hazard Addressed Status Responsible Entity Estimated Cost and funding Source
1a Continue NFIP participation in accordance with regulatory guidelines. Continue NFIP participation in accordance with regulatory guidelines. We regulate development in floodplains and have adopted and enforce floodplain management regulations that meet or exceed the minimum requirements of the program.
H 1,2 Flood On-going Floodplain Manager Cost: None Funding: None Completion Date: Continuous
1 Identify flash-flood prone areas to consider flood reduction measures to city planners. Flood zone mapping has provided initial identification of potential hazard areas that can be reviewed with other data sources, such as the watershed districts goals and objectives, in developing long range planning activities for flood prevention, or other planning steps to reduce exposure to this hazard.
H 1,2 Flood Delayed due to staff reductions
Public Works Director Cost: $20,000 Funds: Local/Grant Completion Date: 3 years
2 Research funding options to construct storm shelters for existing mobile home parks in the City of Lansing that currently do not have storm shelters or have inadequate storm shelters. Mobile homes are particularly vulnerable to damage from high winds. Residents, even those who live in mobile homes with tie-downs, should seek safe shelter when a tornado threatens. Tornado shelters should be constructed in major mobile home parks to ensure a safe place for residents to go during
H 1,2 Tornado, Windstorms Delayed due to staff reductions.
Community Development Superintendent
Cost: $783,153 Funds: Local, State, Federal Completion Date: 6 years

Region L Hazard Mitigation Plan, 2013 Final 4.85
a tornado event. The shelter structure, which should be designed to withstand a minimum of 120mph winds, could easily serve an alternate purpose such as a community center, laundry facility, etc. Tornado shelters should be for last minute protection for high wind events. Mobile Home Courts that currently do not have storm shelters or have inadequate storm shelters were identified as Wiley Mobile Home Court, Clear Creek Court, Black’s Mobile Home Court, and Parkwood Court Manufactured Home Court.
3 Develop and fund professional services to augment the City of Lansing's GIS capability to provide condition investigation, analysis of streamways, develop stream buffer mapping, provide updated 2 ft. interval hypsography for the entire Lansing growth area to allow for improved storm water modeling and management, draft a stream buffer zoning ordinance for the city, produce digital 2 ft. contour mapping for use in storm water analysis and planning, and develop interactive floodplain and property parcel GIS application and database for use by city staff. Utilization of GIS capabilities should be expanded to include the use of ArcInfo and AutoCad format for various flood-related projects throughout the City of Lansing and the Lansing Growth Area.
M 1,2 Flood Delayed due to lack of funding and staff
reductions.
Public Works Director Cost: $40,000 Funds: Local, State, Federal Completion Date: 2 years.
4 Conduct engineering studies for design and construction of levees to protect several areas within the Lansing city limits from flooding events. The City of Lansing has identified a need for the construction of levees to protect the Rock Creek West/Rock Creek West #5 neighborhood and the Fawn Valley Replat neighborhood from flooding events.
M 1,2 Flood On-going, Delayed
due to lack of local funding and staff
reductions
Public Works Director Cost: $275,000 Funds: Local, State, Federal Completion Date: 6 months
5 Conduct engineering studies for the design and reconstruction of an
H 1,2 Flood On-going, Public Works Director Cost: $250,000

Region L Hazard Mitigation Plan, 2013 Final 4.86
engineered storm water channel within the city limits of Lansing. The City of Lansing has identified the need for design and reconstruction of the engineered storm water channel located in the Holiday Hills neighborhood.
Delayed due to lack
of local funding and staff
reductions
Funds: Local, Grant Completion Date: 3
6 Research and fund engineering services for a city-wide storm water infrastructure-needs assessment. The City of Lansing has identified the need for professional services to perform a storm water infrastructure needs assessment throughout the City of Lansing.
H 1,2 Flood On-going Public Works Director Cost: $150,000 Funds: Local, Grant Completion Date: 31 Dec 2015
7 Research funding options for professional services and construction of stream bank stablization on Nine Mile Creek and Seven Mile Creek within the city limits of Lansing. The City of Lansing has identified a need for professional services and construction for stream bank stabilization at various location on Nine Mile Creek and Seven Mile Creek where bank erosion threatens public utilities or private improvements.
M 1,2 Flood On-going, Delayed
due to lack of local funding and staff
reductions.
Public Works Director Cost: $200,000 Funds: Local, Grant Completion Date: 6
8 Seek contractors proposal to perform maintenance activities along Nine Mile Creek and Seven Mile Creek within the city limits of Lansing. The City of Lansing has identified a need for contractor removal or deadfall and/or log jams from Nine Mile Creek and Seven Mile Creek within the city limits of Lansing.
M 1,2 Flood On-going Public Works Director Cost: Unknown Funds: Local, State, Federal Completion Date: 31 Dec 2015
9 Seek contractors proposal to perform storm water quality monitoring in the City of Lansing. The City of Lansing has identified a need to have a contractor perform storm water quality monitoring on a routine basis within the City of Lansing.
M 1,2 Flood On-going, delayed
due to lack of funding and staff
reductions
Public Works Director Cost: Unknown Funds: Local, State, Federal Completion Date: 31 Dec 2014
Leavenworth County – City of Leavenworth Action ID Action/Description Priority Goal(s) Hazard Addressed Status Responsible Entity Estimated Cost and funding Source
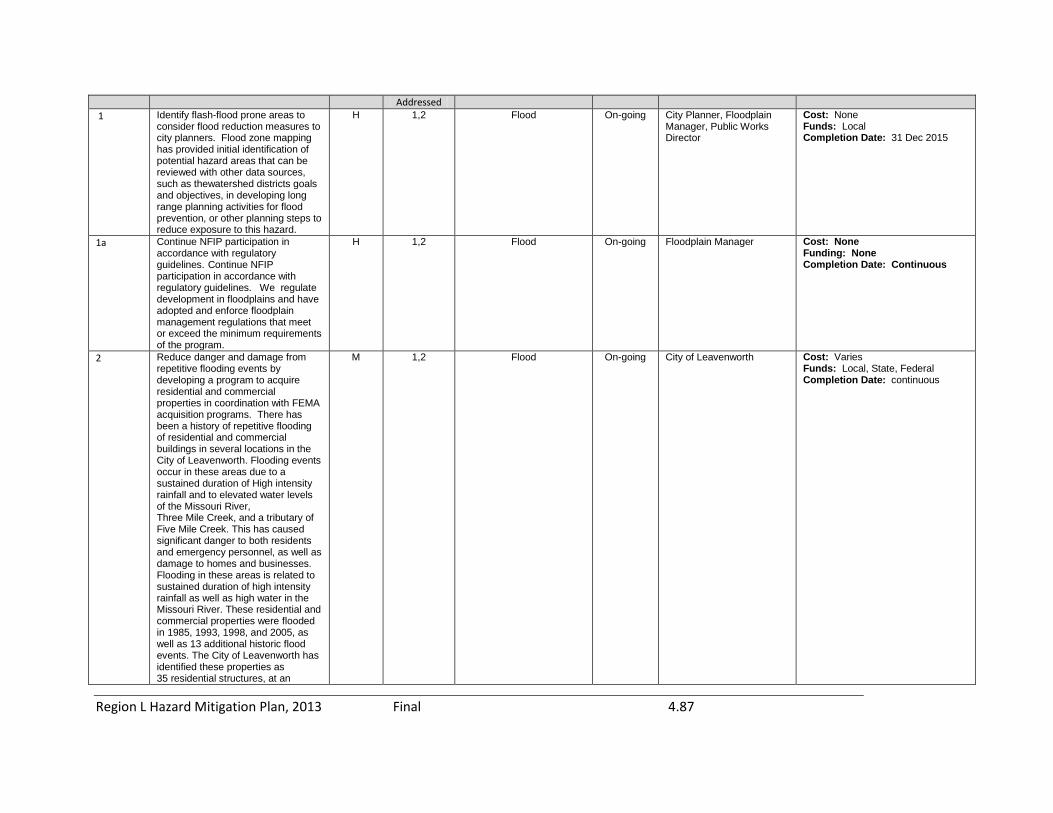
Region L Hazard Mitigation Plan, 2013 Final 4.87
Addressed 1 Identify flash-flood prone areas to
consider flood reduction measures to city planners. Flood zone mapping has provided initial identification of potential hazard areas that can be reviewed with other data sources, such as thewatershed districts goals and objectives, in developing long range planning activities for flood prevention, or other planning steps to reduce exposure to this hazard.
H 1,2 Flood On-going City Planner, Floodplain Manager, Public Works Director
Cost: None Funds: Local Completion Date: 31 Dec 2015
1a Continue NFIP participation in accordance with regulatory guidelines. Continue NFIP participation in accordance with regulatory guidelines. We regulate development in floodplains and have adopted and enforce floodplain management regulations that meet or exceed the minimum requirements of the program.
H 1,2 Flood On-going Floodplain Manager Cost: None Funding: None Completion Date: Continuous
2 Reduce danger and damage from repetitive flooding events by developing a program to acquire residential and commercial properties in coordination with FEMA acquisition programs. There has been a history of repetitive flooding of residential and commercial buildings in several locations in the City of Leavenworth. Flooding events occur in these areas due to a sustained duration of High intensity rainfall and to elevated water levels of the Missouri River, Three Mile Creek, and a tributary of Five Mile Creek. This has caused significant danger to both residents and emergency personnel, as well as damage to homes and businesses. Flooding in these areas is related to sustained duration of high intensity rainfall as well as high water in the Missouri River. These residential and commercial properties were flooded in 1985, 1993, 1998, and 2005, as well as 13 additional historic flood events. The City of Leavenworth has identified these properties as 35 residential structures, at an
M 1,2 Flood On-going City of Leavenworth Cost: Varies Funds: Local, State, Federal Completion Date: continuous

Region L Hazard Mitigation Plan, 2013 Final 4.88
estimated acquisition cost of $2,450,220, and 22 commercial structures, at an estimated acquisition cost of $2,007,570. One residential structure and one commercial structure appear on the Repetitive Loss Properties list for the City of Leavenworth and are reported to have flood insurance; the remaining structures targeted for acquisition activities by the City of Leavenworth do not appear to have flood insurance and do not appear on the Repetitive Loss Properties list for the City of Leavenworth.
3 Seek funding to purchase a portable dam system to reduce exposure from flooding to the Leavenworth Community Center. The Leavenworth Community Center, located at 123 South Esplanade, is listed on the National Register of Historic Places, and is a focal point of social and community activity in the City. Flooding events are attributed to elevated water levels of the Missouri River. The building was flooded in 1951; was protected from flooding in 1993 by a large sandbag wall; and protected by a rented portable dam system in 2007. Given its location and flood history, it is expected to be threatened by flooding in the future. Flooding of this building will damage a historic structure and repair costs are expected to be significant.
M 1,2 Flood On-going, appealing
project denial by
FEMA
City of Leavenworth Cost: Unknown Funds: Local, State, Federal Completion Date: 31 Dec 2015
4 Seek funding to purchase a portable dam system to reduce exposure from flooding to the City of Leavenworth Wastewater Treatment Plant. The City of Leavenworth Wastewater Treatment Plant, located on South 2nd Street, suffers flooding events primarily related to the elevation of the Missouri River. It is also subject to flooding if a high-intensity event occurs in the Five Mile Creek drainage basin while the Missouri River elevations are up. The facility suffered extensive flood damage in
M 1,2 Flood On-going City of Leavenworth Cost: Unknown Funds: Local, State, Federal Completion Date: 31 Dec 2015

Region L Hazard Mitigation Plan, 2013 Final 4.89
1993. The facility was expected to be flooded in 2007 and was protected by a sandbag wall. Flood damage to the facility causes untreated wastewater to be discharged to the Missouri River; repair costs are estimated to be significant.
5 Seek funding to construct a new City of Leavenworth Animal Control Shelter Building to replace the existing structure which is susceptible to repeated flooding events. The City of Leavenworth Animal Control Shelter Building, located on South 2nd Street, suffers flooding events primarily related to the elevation of the Missouri River. It is also subject to flooding if a High intensity event occurs in the Five Mile Creek drainage basin while the Missouri River elevations are up. The facility suffered extensive flood damage in 1993. The facility was predicted to be flooded in 2007 and was protected by a sandbag wall. Damage to the Animal Control building causes significant disruption of service for animal control activities in Leavenworth and Leavenworth County. This facility serves as an animal shelter and alternative housing for the animals, who must be relocated each time it is threatened with flooding.
L 1,2 Flood On-going City of Leavenworth Cost: Unknown Funds: Local, State, Federal Completion Date: 31 Dec 2014
Leavenworth County – City of Linwood Action ID Action/Description Priority Goal(s)
Addressed Hazard Addressed Status Responsible Entity Estimated Cost and funding Source
1 Identify flash-flood prone areas to consider flood reduction measures to city planners. Flood zone mapping has provided initial identification of potential hazard areas that can be reviewed with other data sources, such as the watershed districts goals
H 1,2 Flood On-going Planning Board Commissioner
Cost: Unknown Funds: Local Completion Date: 31 Dec 2015

Region L Hazard Mitigation Plan, 2013 Final 4.90
and objectives, in developing long range planning activities for flood prevention, or other planning steps to reduce exposure to this hazard.
1a Continue NFIP participation in accordance with regulatory guidelines. Continue NFIP participation in accordance with regulatory guidelines. We regulate development in floodplains and have adopted and enforce floodplain management regulations that meet or exceed the minimum requirements of the program.
H 1,2 Flood On-going Floodplain Manager Cost: None Funding: None Completion Date: Continuous
2 Conduct a study to determine the efficacy of the existing warning siren system within the Jurisdiction, and repair and install new sirens as needed to ensure area coverage. Reduce the possibility of damages and loss of life to the citizens by maintaining and upgrading the early warning system for the City of Linwood.
M 1,2 Tornado On-going Directors of Emergency Management in Leavenworth County
Cost: Unknown Funds: Local, State, Federal Completion Date: 31 Dec 2015
Leavenworth County – City of Tonganoxie Action ID Action/Description Priority Goal(s)
Addressed Hazard Addressed Status Responsible Entity Estimated Cost and funding Source
1 Identify flash-flood prone areas to consider flood reduction measures to city planners. Flood zone mapping has provided initial identification of potential hazard areas that can be reviewed with other data sources, such as the watershed districts goals and objectives, in developing long range planning activities for flood prevention, or other planning steps to reduce exposure to this hazard.
H 1,2 Flood On-going City Planning Committee, Floodplain Manager, City Engineer
Cost: $100,000 Funds: Local Completion Date: 31 Dec 2015
1a Continue NFIP participation in accordance with regulatory guidelines. Continue NFIP participation in accordance with regulatory guidelines. We regulate development in floodplains and have adopted and enforce floodplain management regulations that meet or exceed the minimum requirements of the program.
H 1,2 Flood On-going Floodplain Manager Cost: None Funding: None Completion Date: Continuous

Region L Hazard Mitigation Plan, 2013 Final 4.91
2 Develop and fund professional services to augment the City of Tonganoxie's GIS capability to provide condition investigation, analysis of streamways, develop stream buffer mapping, provide updated 2 ft. interval hypsography for the entire Tonganoxie growth area to allow for improved storm water modeling and management, draft a stream buffer zoning ordinance for the city, produce digital 2 ft. contour mapping for use in storm water analysis and planning, and develop interactive floodplain and property parcel GIS application and database for use by city staff. Utilization of GIS capabilities should be expanded to include the use of ArcInfo and AutoCad format for various flood-related projects throughout the City of Tonganoxie and the Tonganoxie Growth Area.
M 1,2 Flood On-going City of Tonganoxie Planner, City Engineer
Cost: 65,000 Funds: Local, State, Federal Completion Date: 31 Dec 2015
3 Research funding options for professional services and construction of stream bank stablization on Tonganoxie Creek within the city limits of Tonganoxie. The City of Tonganoxie has identified a need for professional services and construction for stream bank stabilization at various locations on Tonganoxie Creek where bank erosion threatens public utilities or private improvements.
M 1,2 Flood On-going City of Tonganoxie, City Engineer
Cost: $25,000 Funds: Local, State, Federal Completion Date: 31 Dec 2015
4 Research and fund engineering services for a city-wide storm water infrastructure-needs assessment. The City of Tonganoxie has identified the need for professional services to perform a storm water infrastructure needs assessment throughout the City of Tonganoxie.
M 1,2 Flood On-going City of Tonganoxie Engineer
Cost: $25,000 Funds: Local, State, Federal Completion Date: 31 Dec 2015
5 Seek contractors proposal to perform maintenance activities along Tonganoxie Creek within the city limits of Tonganoxie. The City of Tonganoxie has identified a need for contractor removal or deadfall and/or log jams from Tonganoxie Creek within the city limits of Tonganoxie.
M 1,2 Flood On-going City of Tonganoxie, City Engineer
Cost: $15,000 Funds: Local, State, Federal Completion Date: 31 Dec 2015

Region L Hazard Mitigation Plan, 2013 Final 4.92
6 Seek contractors proposal to perform storm water quality monitoring in the City of Tonganoxie. The City of Tonganoxie has identified a need to have a contractor perform storm water quality monitoring on a routine basis within the City of Tonganoxie.
M 1,2 Flood On-going, City of Tonganoxie Engineer
Cost: Unknown Funds: Local, State, Federal Completion Date: 31 Dec 2015
7 Incorporate the inspection and management of trees into the city maintenance program that may pose a threat to the electrical lines that could result in power outages during ice storms. Significant amounts of property damage occur during ice storms that result from tree failure. Trees that fall into utility lines have additional serious consequences such as causing power outages, surges, fires and other damage. The jurisdiction’s ability to recognize and prevent hazardous tree conditions (through inspection, pruning or removal) is the best defense against problems and costly damages resulting from tree failure. Specifically, trees located on jurisdictional property, which pose immediate threats to property, utility lines and other critical facilities should be addressed.
M 1,2 Ice Storm On-going, Open Ended
City of Tonganoxie and Local Utility Companies
Cost: $10,000 Funds: Local, State, Federal Completion Date: Continuous
8 Conduct a study to determine the efficacy of the existing warning siren system within the Jurisdiction, and repair and install new sirens as needed to ensure area coverage. Reduce the possibility of damages and loss of life to the citizens by maintaining and upgrading the early warning system for the City of Tonganoxie.
M 1,2 Tornado On-going Leavenworth County Cost: Unknown Funds: Local Completion Date: 15 Dec 2015
9 Create a working group to assess the county’s firefighting / EMS resources to identify any existing needs or shortfalls in terms of personnel, equipment or additional required resources. A survey should be completed in order to verify the county’s current firefighting / EMS resources are adequate for public safety. Any identified needs or shortfalls should become documented and result in specific
M 4 All Hazards On-going City of Tonganoxie Fire Chief, EMS
Cost: $30,000 Funds: Local, State, Federal Completion Date: 31 Dec 2015
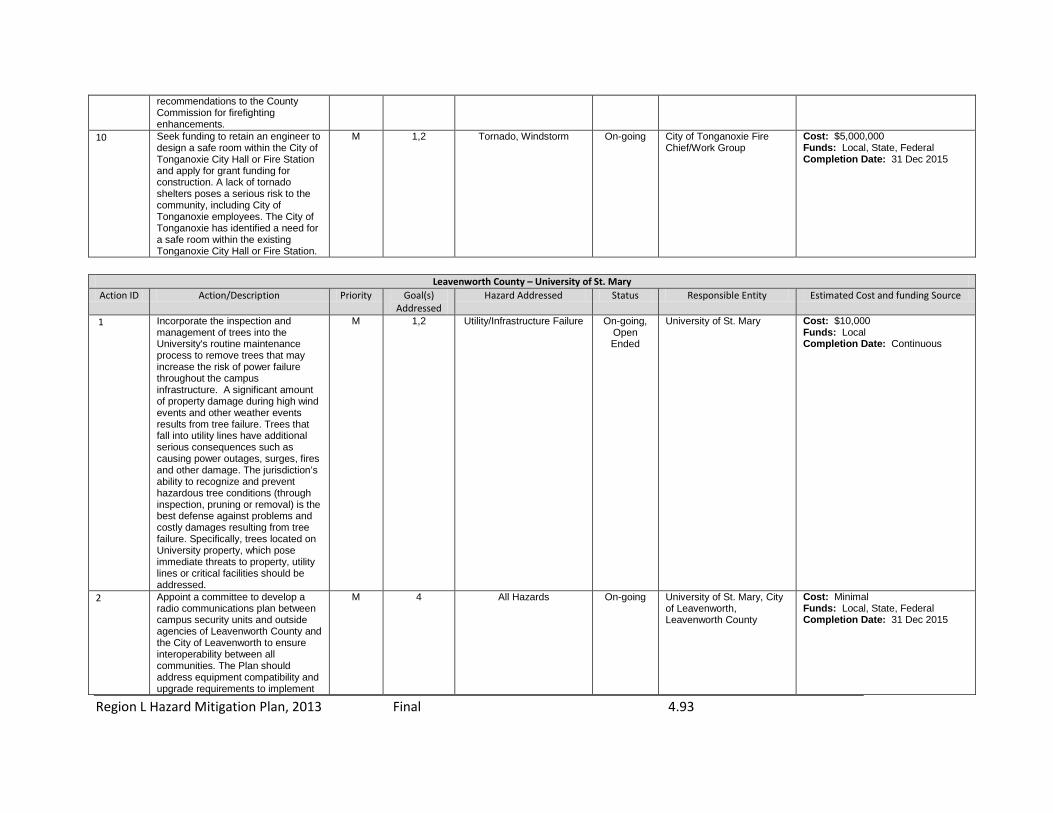
Region L Hazard Mitigation Plan, 2013 Final 4.93
recommendations to the County Commission for firefighting enhancements.
10 Seek funding to retain an engineer to design a safe room within the City of Tonganoxie City Hall or Fire Station and apply for grant funding for construction. A lack of tornado shelters poses a serious risk to the community, including City of Tonganoxie employees. The City of Tonganoxie has identified a need for a safe room within the existing Tonganoxie City Hall or Fire Station.
M 1,2 Tornado, Windstorm On-going City of Tonganoxie Fire Chief/Work Group
Cost: $5,000,000 Funds: Local, State, Federal Completion Date: 31 Dec 2015
Leavenworth County – University of St. Mary
Action ID Action/Description Priority Goal(s) Addressed
Hazard Addressed Status Responsible Entity Estimated Cost and funding Source
1 Incorporate the inspection and management of trees into the University's routine maintenance process to remove trees that may increase the risk of power failure throughout the campus infrastructure. A significant amount of property damage during high wind events and other weather events results from tree failure. Trees that fall into utility lines have additional serious consequences such as causing power outages, surges, fires and other damage. The jurisdiction’s ability to recognize and prevent hazardous tree conditions (through inspection, pruning or removal) is the best defense against problems and costly damages resulting from tree failure. Specifically, trees located on University property, which pose immediate threats to property, utility lines or critical facilities should be addressed.
M 1,2 Utility/Infrastructure Failure On-going, Open Ended
University of St. Mary Cost: $10,000 Funds: Local Completion Date: Continuous
2 Appoint a committee to develop a radio communications plan between campus security units and outside agencies of Leavenworth County and the City of Leavenworth to ensure interoperability between all communities. The Plan should address equipment compatibility and upgrade requirements to implement
M 4 All Hazards On-going University of St. Mary, City of Leavenworth, Leavenworth County
Cost: Minimal Funds: Local, State, Federal Completion Date: 31 Dec 2015

Region L Hazard Mitigation Plan, 2013 Final 4.94
the Plan. The University of St. Mary has identified a need to implement interoperable radio communications between its security staff and county and city services in case of campus emergency.
3 Appoint a committee to research and implement enhancement to the University's early warning systems for students and staff for weather alerts and campus emergencies. Enhancements may include a campus website identifying emergencies on campus. The University of St. Mary has identified a need to enhance the University's ability to issue early warnings for students and staff for weather events or campus emergencies in an effective, dependable, and rapid manner.
M 1,2,4 All Hazards On-going University of St. Mary Cost: Unknown Funds: Local, State, Federal Completion Date: 31 Dec 2015
Leavenworth County – USD 449
Action ID Action/Description Priority Goal(s) Addressed
Hazard Addressed Status Responsible Entity Estimated Cost and funding Source
1 Develop and fund mitigation projects for the construction of tornado safe rooms for Unified School District 449 schools. Schools are particularly vulnerable to potential damage from tornadoes and high winds. Students, faculty, and staff should seek safe shelter when a tornado threatens. Tornado safe rooms should be constructed in schools to ensure a safe place for students to go during a tornado event. Safe rooms may be funded by FEMA during new school construction, as part of school additions, or as retrofits.
M 1,2 Tornado, Windstorm On-going, Open Ended
School District, State, FEMA
Cost: Unknown Funds: FEMA Completion Date: Continuous
Leavenworth County – USD 453 Action ID Action/Description Priority Goal(s)
Addressed Hazard Addressed Status Responsible Entity Estimated Cost and funding Source
1 Develop and fund mitigation projects M 1,2 Tornado, Windstorm On-going School District, FEMA Cost: Unknown
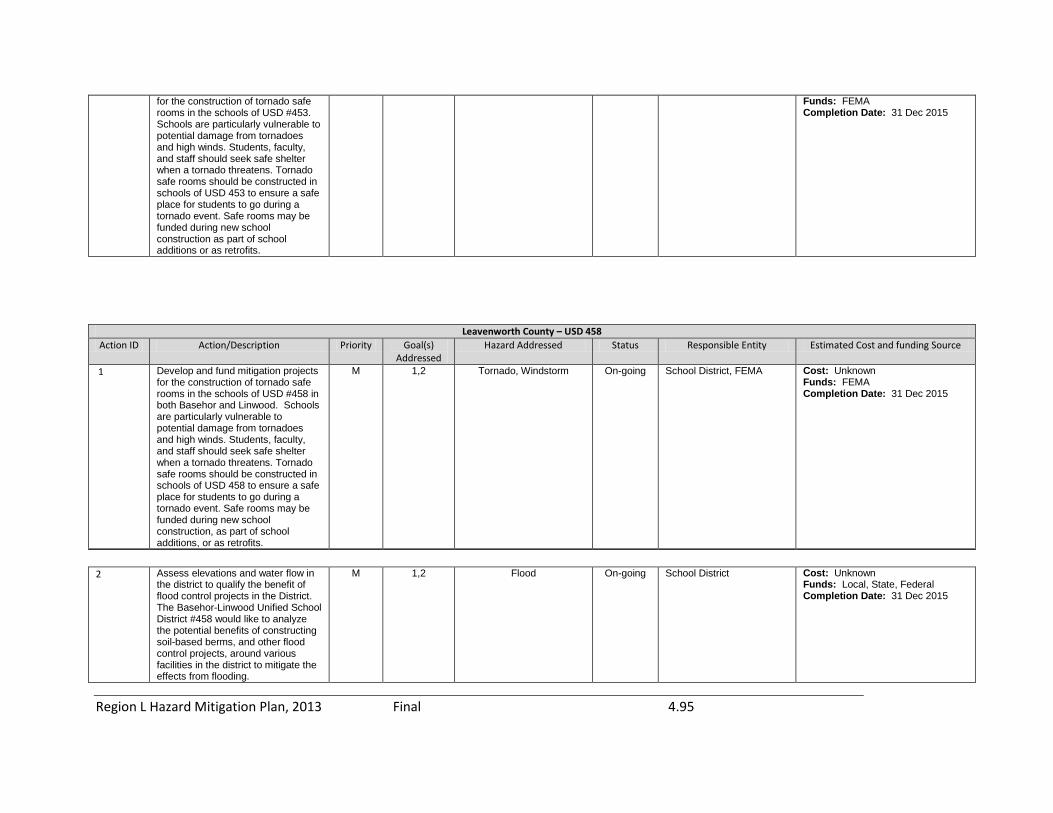
Region L Hazard Mitigation Plan, 2013 Final 4.95
for the construction of tornado safe rooms in the schools of USD #453. Schools are particularly vulnerable to potential damage from tornadoes and high winds. Students, faculty, and staff should seek safe shelter when a tornado threatens. Tornado safe rooms should be constructed in schools of USD 453 to ensure a safe place for students to go during a tornado event. Safe rooms may be funded during new school construction as part of school additions or as retrofits.
Funds: FEMA Completion Date: 31 Dec 2015
Leavenworth County – USD 458 Action ID Action/Description Priority Goal(s)
Addressed Hazard Addressed Status Responsible Entity Estimated Cost and funding Source
1 Develop and fund mitigation projects for the construction of tornado safe rooms in the schools of USD #458 in both Basehor and Linwood. Schools are particularly vulnerable to potential damage from tornadoes and high winds. Students, faculty, and staff should seek safe shelter when a tornado threatens. Tornado safe rooms should be constructed in schools of USD 458 to ensure a safe place for students to go during a tornado event. Safe rooms may be funded during new school construction, as part of school additions, or as retrofits.
M 1,2 Tornado, Windstorm On-going School District, FEMA Cost: Unknown Funds: FEMA Completion Date: 31 Dec 2015
2 Assess elevations and water flow in
the district to qualify the benefit of flood control projects in the District. The Basehor-Linwood Unified School District #458 would like to analyze the potential benefits of constructing soil-based berms, and other flood control projects, around various facilities in the district to mitigate the effects from flooding.
M 1,2 Flood On-going School District Cost: Unknown Funds: Local, State, Federal Completion Date: 31 Dec 2015

Region L Hazard Mitigation Plan, 2013 Final 4.96
Leavenworth County – USD 464 Action ID Action/Description Priority Goal(s)
Addressed Hazard Addressed Status Responsible Entity Estimated Cost and funding Source
1 Develop and fund mitigation projects for the construction of tornado safe rooms in the schools of USD #464 in Tonganoxie. Schools are particularly vulnerable to potential damage from tornadoes and high winds. Students, faculty, and staff should seek safe shelter when a tornado threatens. Tornado safe rooms should be constructed in schools of USD 464 to ensure a safe place for students to go during a tornado event. Safe rooms may be funded during new school construction, as part of school additions, or as retrofits.
M 1,2 Tornado, Windstorm On-going, Open Ended
Superintendent of Schools Cost: Unknown Funds: Local Completion Date: Continuous
2 Obtain funding for the purchase and installation of backup power generators for theschools of USD 464. USD 464 has identified a need to quickly restore power in all of its schools in the event of a weather event and the subsequent loss of po
M 1,2 All Hazards On-going Superintendent of Schools Cost: Unknown Funds: Local, State, Federal Completion Date: 31 Dec 2015
3 Seek funding to retain a professional school safety and security firm to review and update the school’s Security Plan for domestic acts of terrorism, building security, and contagious disease response. As domestic acts of terrorism are becoming more of reality, many officials believe that the next wave of terrorists acts may be aimed at public school systems. Although these events are impossible to predict with great accuracy, updating building security, school security plans, and USD emergency plans can prepare school districts such as USD 464 for these events.
M 1,2,3 Terrorism, Agri-Terrorism, Civil Disorder
On-going Superintendent of Schools Cost: Unknown Funds: Local, State, Federal Completion Date: 31 Dec 2015

Region L Hazard Mitigation Plan, 2013 Final 4.97
Companies such as the National School Safety and Security Services provide the expertise in this field to help review and upgrade plans for the district.
Leavenworth County – USD 469 Action ID Action/Description Priority Goal(s)
Addressed Hazard Addressed Status Responsible Entity Estimated Cost and funding Source
1 Develop and fund mitigation projects for the construction of tornado / thunderstormwind safe rooms in the schools of USD #469 in Lansing. Schools are particularly vulnerable to potential damage from tornadoes and high winds. Students, faculty, and staff should seek safe shelter when a tornado or thunderstorm winds threatens. Safe rooms should be constructed in schools of USD 469 to ensure a safe place for students to go during a tornado or thunderstorm wind event. Safe rooms may be funded during new school construction, as part of school additions, or as retrofits.
M 1,2 Tornado, Windstorm On-going, Open Ended
School District, State, FEMA
Cost: Unknown Funds: Local Completion Date: Continuous
2 Seek funding to retain a professional school safety and security firm to review and update the school’s Security Plan for domestic acts of terrorism, building security, and contagious disease response. As domestic acts of terrorism are becoming more of reality, many officials believe that the next wave of terrorists acts may be aimed at public school systems. Although these events are impossible to predict with great accuracy, updating building security, school security plans, and USD emergency plans can prepare school districts such as USD 469 for these events. Companies such as the National School Safety and Security Services provide the expertise in this field to help review and upgrade plans for the district.
M 1,2,3 Terrorism, Agri-Terrorism, Civil Disorder
On-going Board of Education, School superintendent
Cost: Unknown Funds: Local, State, Federal Completion Date: 31 Dec 2015

Region L Hazard Mitigation Plan, 2013 Final 4.98
Leavenworth County – USD 207 Action ID Action/Description Priority Goal(s)
Addressed Hazard Addressed Status Responsible Entity Estimated Cost and funding Source
1 The safe room for the new school will be located on the lower level; however, it will have an on-grade entrance/exit due to the terrain of the site. Three walls are below grade. The elevator will allow the 2nd and 3rd floor staff and students with disabilities (and wheelchair bound students) to access the safe room.
H 1,2 Tornadoes, Windstorm On-going (In-
progress)
USD 207 Board of Education; CFO (business manager) will tract progress of project .
Cost: $28.6 million Funds: FEMA Grant and USD 207 Completion Date: 31 Dec 2019
2 The district is vulnerable to the threat of tornadoes and TSTM Winds. The current MacArthur Elementary School has a designated tornado area but the construction design of the old school (built in 1956) is very vulnerable to tornadoes and TSTM winds. The new school has a planned capacity to host over 1000 students and staff. The safe room is designed to be located on the lower level. The safe room will have an on grade entrance and exit due to the site terrain. Three walls are below grade with one on grade. The safe room will also be accessible from an elevator to accommodate children and adults with disabilities as well as stairs. It will be part of the initial construction of the new elementary school at Fort Leavenworth.
H 1,2 Tornadoes, Windstorm New USD 207 Board of Education; CFO (business manager) will tract progress of project along with architectural firm (BCDM) and Titan Construction Company
Cost: $1.2 million Funds: Local Completion Date: August 2015
Wyandotte County – Leavenworth Rural Water District #7 Action ID Action/Description Priority Goal(s)
Addressed Hazard Addressed Status Responsible Entity Estimated Cost and funding Source
LVRWD7 1 Maintain, Repair, and collect GPS locations of fire hydrants within the area served by Leavenworth RWD7
M 4 Wildfire On-going Operations, Leavenworth RDW7
Cost: Staff Time Funds: District Funds Completion Date: 6 months

Region L Hazard Mitigation Plan, 2013 Final 4.99
with Wyandotte County, KS. There is no GIS mapping of the fire hydrants located in Leavenworth RWD7 boundaries. District personnel could repair and map fire hydrants using GPS mapping equipments and provide that information to the Fire Department.
Wyandotte County
Wyandotte County Action ID Action/Description Priority Goal(s)
Addressed Hazard Addressed Status Responsible Entity Estimated Cost and funding Source
WyCo 1 Develop alternative ways to better monitor, in real-time, water levels of the Kansas & Missouri Rivers, Turkey Creek and other smaller streams / tributaries throughout the county for the purposes of advance planning, response & warning. For real-time monitoring to allow / enhance advance planning, provide adequate response and give timely warning to the citizens. Currently, the local river / stream monitoring is very inadequate. Survey various locations and Install several remotely accessible gages and cameras at strategic points along the Kansas & Missouri Rivers, Turkey Creek and other smaller streams / tributaries throughout the county.
H 1,2, 4 Floods On-going Emergency Management Director
Cost: $10,000 Funds: FEMA Completion Date: 2 – 5 years
WYCo 2 Provide adequate communications system(s) for Scouts, Scouters and campers at Boy Scout Camp Theodore Naish, BSA. No completely adequate communications system(s) are currently available for campers, leaders and staff at Camp Naish. • Camp Naish conducts year-round camping with the heaviest number of campers on-site during the summer months, mainly late May thru early
High 4 All Hazards Deleted from
Wyandotte Co. Moved
to BSA1
Wyandotte County Emergency Management
Cost: Unknown Funds: Grant funding with in-kind match, contributions of local material, manpower & monetary resources. Completion Date: Deleted/Moved

Region L Hazard Mitigation Plan, 2013 Final 4.100
August. Camping also occurs throughout the year. Provide better communications equipment to ensure the camp has contact with local government public safety entities and with each other throughout the camp.
WyCo 3 Provide adequate & timely warning system(s) for Scouts, Scouters and campers at Boy Scout Camp Theodore Naish, BSA No completely adequate & timely warning system(s) are currently available for campers at Camp Naish. • Camp Naish conducts year-round camping with the heaviest number of campers on-site during the summer months, mainly late May thru early August. Camping also occurs throughout the year. Provide adequate & timely warning system(s) that can be activated both on-site and remotely to warn camp personnel to impending dangers.
H 1,2,4 All Hazards On-going Wyandotte County Emergency Management Department Director
Cost: Unknown Funds: Grant funding with in-kind match.contributions of local material, manpower & monetary resources. Completion Date: 1 year of project approval.
WyCo 4 Adopt building codes to require safe rooms in residential structures and public buildings—including schools. To protect the citizens, visitors, school children, faculty & staff • The majority of private residences (to include high-rises & congregate care centers), public buildings and schools in Wyandotte County have completely inadequate, if any at all, shelters from storms. Work with all three cities to adopt building codes to require safe rooms in residential structures (to include high-rises & congregate care centers) and public buildings--including schools
H 1,2 Windstorm, Tornadoes On-going UG Planning Department working with UG Commissioners and Bonner Springs, KS and Edwardsville, KS Planning and Zoning
Cost: Unknown Funds: Grants, local funding, individual funding. Completion Date: 3 – 10 years
WyCo 5 Large Outdoor Venues—Response PlansShelteringDevelop/Provide/Update Shelter Areas/Safe Rooms and Response Plans for Large Outdoor Venues (ie: KS Speedway, Community America Ballpark [TBones], Capital Federal Park @ Sandstone, KC Renaissance Festival, Schlitterbahn Vacation Village, Lakeside Speedway, Sporting KC, Wyandotte County Fairgrounds, local football stadiums,
H 1,2 All Hazards On-going Emergency Management Director
Cost: Unknown Funds: Local, large venue funds, grant funding Completion Date: 3 – 10 years

Region L Hazard Mitigation Plan, 2013 Final 4.101
and other locations as identified in the future.) Weather in Kansas is completely unpredictable and the need for folks attending large outdoor venue events to seek shelter at any time is to be expected. • Currently, no large outdoor venues have appropriate sheltering for individuals and most have no sheltering available at all. • Many of the large venues find themselves at a complete loss as to WHAT to tell their visitors/fans and WHEN to tell them! All need better plans. Work with each of the large venues to enhance their current emergency response plans to ensure proper emergency procedures are in-place & to insure they have adequate means to warn their visitors/fans while instructing them what actions to take,• Work with each of the large venues to ascertain the best available locations to direct their visitors/fans to in case of the need for sheltering. • Emphasize the need for each large venue (and those to be constructed) to provide adequate sheltering from storms (tornadoes, hail, lightning, etc.,) as a minimum within their design or added as a retrofit.
WyCo 6 Continue Participation in the National Flood Insurance Program (NFIP). Numerous areas within Wyandotte County lie within the designated flood plain. Wyandotte County participates in the NFIP and will continue to do so. Wyandotte County will continue to regulate development in the flood plain according to the flood plain management ordinance and the DFIRMs. Continue participation in the NFIP and enforce current flood plain management ordinance. Adopt revised ordinance as a result of the development of new DFIRM maps.
H 1,2 Flood On-going, Open Ended
Flood Plain Manager (Planning Department), County Emergency Management
Cost: Unknown Funds: Local Completion Date: Continuous
WyCo 7 Purchase flood prone properties. Especially repetitive loss properties. Historically properties located in flood prone areas have had many
H 1,2 Flood On-going, Open Ended
Wyandotte county Emergency Management Director
Cost: Unknown Funds: Federal HMGP, Local, Combination of both Completion Date: Continuous

Region L Hazard Mitigation Plan, 2013 Final 4.102
costly repetitive losses. There is a need to reduce the probability for property loss due to repetitive flooding.
WyCo 8 Provide Back-up power for critical facilities (i.e. BPU water system pumps, Armourdale and Fairfax Drainage Districts, hospitals, nursing homes, schools, etc.) Facilities are designated as “Critical Facilities” due to their required operation in relation to the health, safety, welfare and/or needs of the local communities they serve. Disruption of critical facility operations could easily affect the health, safety or welfare of citizens—even to the point of life endangerment. Plan for and Install back-up generators or UPS systems in each facility. Or, as a minimum, determine and plan for alternate power sources—ie; pre-wire building for use of on-call, rented/loaned generators.
H 1,2 All Hazards On-going, Open Ended
Emergency Management Director
Cost: $300,000 Funds: Grant, Local Completion Date: Continuous
WyCo 9 Encourage development of low water plans for utilities, businesses and organizations dependent on the water supply from the rivers. River water supply is very unpredictable with rivers often dropping to dangerous levels affecting those agencies dependent on supply of water. Partner with utilities, businesses and organizations dependent on river water and assist them, as needed and appropriate, with low water plans.
H 1,2,4 Drought On-going Emergency Management Department director
Cost: Unknown Funds: Local Completion Date: Unknown
WyCo10 Protect or relocate flood prone critical facilities. Critical facilities are identified as such due to the critical need of others for their continued operation. Unprotected critical facilities in the flood prone areas could become nonoperational for long periods of time due to flooding. Develop and implement methods for protecting flood prone critical facilities on a case-by-case basis. or Relocate the critical facility,
H 1,2 Flood On-going, Open Ended
Emergency Management Department Director
Cost: Unknown Funds: Local, Grant Completion Date: One to several years – depending on the prevention method(s) chosen to be used, and/or the need to relocate the critical facility.
WyCo 11 Upgrade Local Government 800 Radio System to include placement of radios in all Unified School District
H 4 All Hazards On-going, Open Ended
Emergency Management director
Cost: $21M Funds: Local, Grant, Donations Completion Date: Continuous
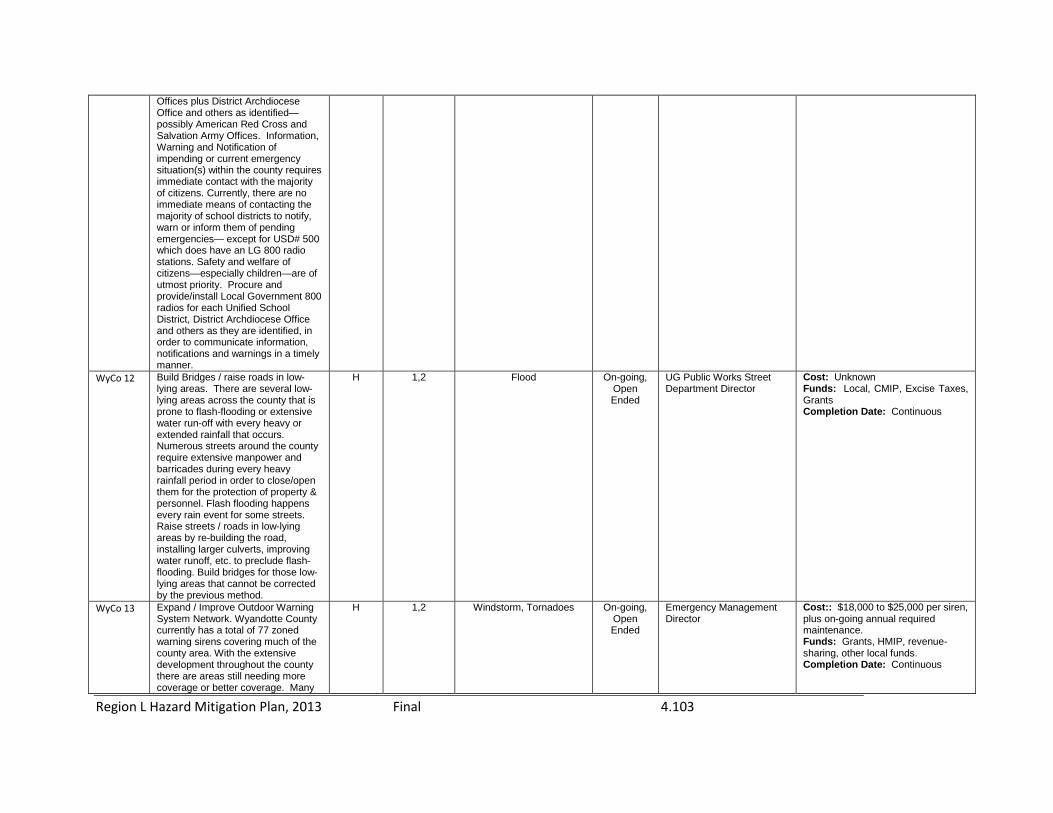
Region L Hazard Mitigation Plan, 2013 Final 4.103
Offices plus District Archdiocese Office and others as identified—possibly American Red Cross and Salvation Army Offices. Information, Warning and Notification of impending or current emergency situation(s) within the county requires immediate contact with the majority of citizens. Currently, there are no immediate means of contacting the majority of school districts to notify, warn or inform them of pending emergencies— except for USD# 500 which does have an LG 800 radio stations. Safety and welfare of citizens—especially children—are of utmost priority. Procure and provide/install Local Government 800 radios for each Unified School District, District Archdiocese Office and others as they are identified, in order to communicate information, notifications and warnings in a timely manner.
WyCo 12 Build Bridges / raise roads in low-lying areas. There are several low-lying areas across the county that is prone to flash-flooding or extensive water run-off with every heavy or extended rainfall that occurs. Numerous streets around the county require extensive manpower and barricades during every heavy rainfall period in order to close/open them for the protection of property & personnel. Flash flooding happens every rain event for some streets. Raise streets / roads in low-lying areas by re-building the road, installing larger culverts, improving water runoff, etc. to preclude flash-flooding. Build bridges for those low-lying areas that cannot be corrected by the previous method.
H 1,2 Flood On-going, Open Ended
UG Public Works Street Department Director
Cost: Unknown Funds: Local, CMIP, Excise Taxes, Grants Completion Date: Continuous
WyCo 13 Expand / Improve Outdoor Warning System Network. Wyandotte County currently has a total of 77 zoned warning sirens covering much of the county area. With the extensive development throughout the county there are areas still needing more coverage or better coverage. Many
H 1,2 Windstorm, Tornadoes On-going, Open Ended
Emergency Management Director
Cost:: $18,000 to $25,000 per siren, plus on-going annual required maintenance. Funds: Grants, HMIP, revenue-sharing, other local funds. Completion Date: Continuous

Region L Hazard Mitigation Plan, 2013 Final 4.104
citizens rely on the warning sirens as their primary warning source. Severe weather in Kansas is a fact of life. Add additional warning sirens to cover those areas, countywide, currently having only minimal coverage or none at all. Include some voice transmit warning sirens for various areas around the county;( i.e.: numerous large outdoor venue areas including the Kansas Speedway, Schlitterbahn Vacation Village, The Legends and many others.)
WyCo 14 Continue Participation in the “StormReady” Community Certification Program thru the National Weather Service, Pleasant Hill, MO. Primary emphasis in Emergency Management is to do all we can to educate citizens on personal Emergency Preparedness issues and to protect their lives and property. Meeting or exceeding the requirements for maintaining the “StormReady” Community Certification / Designation alone ensures that we will be much better prepared to accomplish the mission throughout all phases of Emergency Management. Continue meeting / exceeding all of the requirements for the “StormReady” Community Program.
H 3,4 All Hazards On-going, Open Ended
Emergency Management Director
Cost: Staff Time Funds: NA Completion Date: Continuous
WyCo 15 Public Education: Safety during extreme temperature (heat / cold) conditions. Citizens need to know how to protect themselves from, prepare for, respond to and recover from extreme temperature conditions. Proper knowledge, individual preparation and care can prevent injury, illness and potential deaths. Provide public education talks, seminars, meetings with various groups, planning sessions, training, exercises, etc. Provide information thru websites; cell phones; newspapers, theatres, billboards, fliers, PSAs, television ads and other multimedia sources, Provide educational materials to
H 1,2,3,4 Extreme Temperatures On-going, Open Ended
Emergency Management & Public Health Departments Directors
Cost: Depends on magnitude of the public education program being conducted. Funds: Grants, Local, Combination Completion Date: Continuous

Region L Hazard Mitigation Plan, 2013 Final 4.105
schools, hospitals, senior citizen centers, long-term care facilities, business & industry and individuals.
WyCo 16 Public Education: Promote NOAA “All-Hazards” Weather Radios and Support the KC Metro Region’s “Project Community Alert” All-Hazards Weather Radio Program. Citizens need to receive timely information / warnings in order to protect themselves from, prepare for, respond to and recover from various emergency type situations / incidents. The All-Hazards Weather Radio provides one of the necessary means for receipt of the notification and warning messages. Proper knowledge, individual preparation and care can prevent personal injury, illness and potential deaths. Continue to promote and support MARC’s “Project Community Alert” and also make NOAA radios available at cost to neighborhood groups, etc. Provide public education talks, seminars, meetings with various groups, planning sessions, training, exercises, etc. Provide information thru websites; cell phones; newspapers, theatres, billboards, fliers, PSAs, television ads and other multimedia sources, • Provide educational materials to schools, hospitals, senior citizen centers, long-term care facilities, business & industry and individuals.
H 1,2,3,4 All Hazards On-going, Open Ended
Emergency Management Department Director
Cost: Depends on magnitude of the public education program being conducted. Cost for the purchase of a radio is an individual responsibility. Funds: Department of Homeland Security Grants, Local, Combination Completion Date: Continuous
WyCo 17 Public Education: Tornado Safety. Citizens need to know how to protect themselves from, prepare for, respond to and recover from tornadoes & severe weather. Proper knowledge, individual preparation and care can prevent injury and potential deaths. Provide public education talks, seminars, meetings with various groups, planning sessions, training, exercises, etc. Provide information thru websites; cell phones; newspapers, theatres, billboards, fliers, PSAs, television ads and other multimedia sources, Provide educational materials to
H 1,2,3 Tornadoes On-going, Open Ended
Emergency Management Department Director
Cost: Depends on magnitude of public education program being conducted Funds: Grants, local, combination Completion Date: Continuous
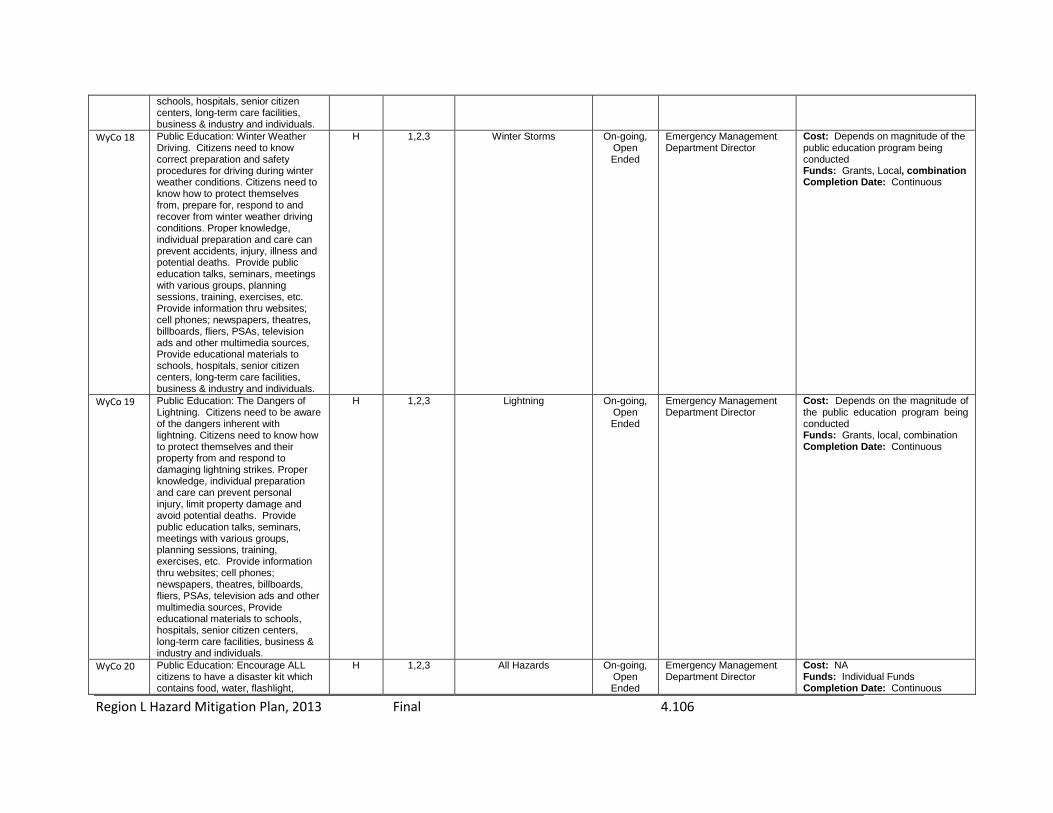
Region L Hazard Mitigation Plan, 2013 Final 4.106
schools, hospitals, senior citizen centers, long-term care facilities, business & industry and individuals.
WyCo 18 Public Education: Winter Weather Driving. Citizens need to know correct preparation and safety procedures for driving during winter weather conditions. Citizens need to know how to protect themselves from, prepare for, respond to and recover from winter weather driving conditions. Proper knowledge, individual preparation and care can prevent accidents, injury, illness and potential deaths. Provide public education talks, seminars, meetings with various groups, planning sessions, training, exercises, etc. Provide information thru websites; cell phones; newspapers, theatres, billboards, fliers, PSAs, television ads and other multimedia sources, Provide educational materials to schools, hospitals, senior citizen centers, long-term care facilities, business & industry and individuals.
H 1,2,3 Winter Storms On-going, Open Ended
Emergency Management Department Director
Cost: Depends on magnitude of the public education program being conducted Funds: Grants, Local, combination Completion Date: Continuous
WyCo 19 Public Education: The Dangers of Lightning. Citizens need to be aware of the dangers inherent with lightning. Citizens need to know how to protect themselves and their property from and respond to damaging lightning strikes. Proper knowledge, individual preparation and care can prevent personal injury, limit property damage and avoid potential deaths. Provide public education talks, seminars, meetings with various groups, planning sessions, training, exercises, etc. Provide information thru websites; cell phones; newspapers, theatres, billboards, fliers, PSAs, television ads and other multimedia sources, Provide educational materials to schools, hospitals, senior citizen centers, long-term care facilities, business & industry and individuals.
H 1,2,3 Lightning On-going, Open Ended
Emergency Management Department Director
Cost: Depends on the magnitude of the public education program being conducted Funds: Grants, local, combination Completion Date: Continuous
WyCo 20 Public Education: Encourage ALL citizens to have a disaster kit which contains food, water, flashlight,
H 1,2,3 All Hazards On-going, Open Ended
Emergency Management Department Director
Cost: NA Funds: Individual Funds Completion Date: Continuous

Region L Hazard Mitigation Plan, 2013 Final 4.107
batteries, battery operated radio, medications, etc. Citizens in Wyandotte County face many potential hazards, some that will require them to survive on their own for possibly one to three days or more until additional help can arrive. Citizens need to take responsibility for their own health, safety and welfare by planning ahead and being ready to care for themselves, their families and their neighbors during all emergencies/disasters. Continue to provide information about the true need for and contents of personal / family disaster kits through Emergency Preparedness talks & training, various media sources, literature, websites and by other means.
WyCo 21 Continue Review / Revision of the Wyandotte County Emergency Operations Plan (EOP). Local government planning, preparedness, response, recovery and mitigation operations to provide services to the public must continue regardless of initial, temporary disruptions by an incident or disaster. The health, safety and welfare of the public depend on continued operation of these local government services. Continue Review / Revision of the Wyandotte County Emergency Operations Plan (EOP). Review plan annually and following all incidents and exercises to determine if changes need to be made. Conduct formal reviews of each ESF every five years as scheduled in the plan. Train on and exercise the plan.
H 4 All Hazards On-going, Open Ended
Emergency Management Department Director
Cost: NA Funds: Local Completion Date: Continuous
WyCo 22 Continue Review / Revision of the Wyandotte County Metropolitan Medical Response System (MMRS) Plan. Local government health-related services to the public must continue regardless of initial, temporary disruption by an incident or disaster. The health, safety and welfare of the public depend on continuation of these local government services. Wyandotte
H 4 All Hazards On-going, Open Ended
Emergency Management Director
Cost: Unknown Funds: DHS Grant, UASI Grant, Local, Combination Completion Date: Continuous

Region L Hazard Mitigation Plan, 2013 Final 4.108
County partners with all other metro area (Greater KC Region) counties and MARC for provision of seamless health-related services to the public. Continue Review / Revision of the Wyandotte County Metropolitan Medical Response System (MMRS) Plan. Review plan annually and following all incidents and exercises to determine if changes need to be made. Conduct formal reviews every five years. Continue working with MARC and the Greater KC Counties on MMRS
WyCo 23 Develop and maintain a Continuity of Operations Plan (COOP) for the Unified Government. Local government services to the public must continue regardless of initial, temporary disruption by an incident or disaster. The health, safety and welfare of the public depend on continuation of local government services. Develop and maintain a Continuity of Operations Plan (COOP) for the Unified Government. Include all departments and divisions in the plan; however, begin planning with the ones providing the most critical (life saving, etc.) services and work thru all departments.
H 1,2,3,4 All Hazards On-going Wyandotte County emergency management Director
Cost: Unknown Funds: Grant DHS, Federal & State Grants, Local, combination Completion Date: 1 to 1 ½ years after start.
WyCo 24 Develop and maintain a Multi-Hazards Evacuation Plan. There are many hazards located in, and traveling through, Wyandotte County that could create immediate, temporary or permanent disruptions that would threaten the lives and well-being of the public, requiring them to evacuate to a safer area. The health, safety and welfare of the public depend on an orderly, planned evacuation to a safer area during a life-threatening incident. Develop and maintain a Multi-Hazards Evacuation Plan Include all departments and divisions in the planning process to include other jurisdictions and agencies.
H 1,2,3,4 All Hazards On-going Wyandotte County Emergency Management Director
Cost: Unknown Funds: DHS Grant, Federal and State Grants, Local, combination Completion Date: 1 to 1 1 /2 years after start.
WyCo 25 Removal of Debris from Floodways to Mitigate Floodwater Back-up.
H 1,2 Flood On-going, Open
UG Public Works Department Director
Cost: Unknown Funds: Local, Grant

Region L Hazard Mitigation Plan, 2013 Final 4.109
Debris reduces or sometimes even stops water flow thru floodways causing floodwater to back-up. This back-up results in flooded roads, homes, businesses and land areas not normally designed to contain water. Remove debris from floodways to mitigate floodwater back-up and prevent further damages.
Ended Completion Date: Continuous
WyCo 26 Removal of Debris from Storm water Systems to Mitigate Floodwater Back-up. Debris reduces or sometimes even stops water flow thru storm water systems causing floodwater to back-up. This back-up results in flooded roads, homes, businesses and land areas not normally designed to contain water. Remove debris from storm water systems to mitigate floodwater back-up and prevent further damages.
H 1,2 Flood On-going, Open Ended
Water Pollution Control Director, Public Works of Bonner Springs, and Edwardsville
Cost: Unknown Funds: Local, Grant Completion Date: Continuous
WyCo 27 Coordinate with NASCAR to develop a formal emergency response plan for the Kansas Speedway…including tornado sheltering. Spring event at the Kansas Speedway resulted in tornado warning requiring sheltering in place. No written plan for tornado response exists. Establish a working group to discuss and develop a written tornado response and sheltering in place plan.
H 1,2 All Hazards On-going Emergency Management Director
Cost: $30,000 Funds: Nascar Completion Date: 3 months
WyCo 28 Continue Participation in the Community Emergency Response Team (CERT) program by recruiting, training, equipping and fielding CERT Teams. Emergency services personnel may not be available to help for up to 72+ hours following a disaster due to the size of the area affected lost communications and impassable roads. Since help may not be immediately available following a disaster; it is imperative that individuals be trained and equipped to help themselves, their families and their neighbors. • Most citizens know very little about the basic skills needed to help themselves and others in a disaster when emergency services are not
H 1,2,3 Flood On-going, Open Ended
Emergency Management Director
Cost: $4,000 per class of 25 Funds: Grant, Local, Individual, combination Completion Date: Continuous
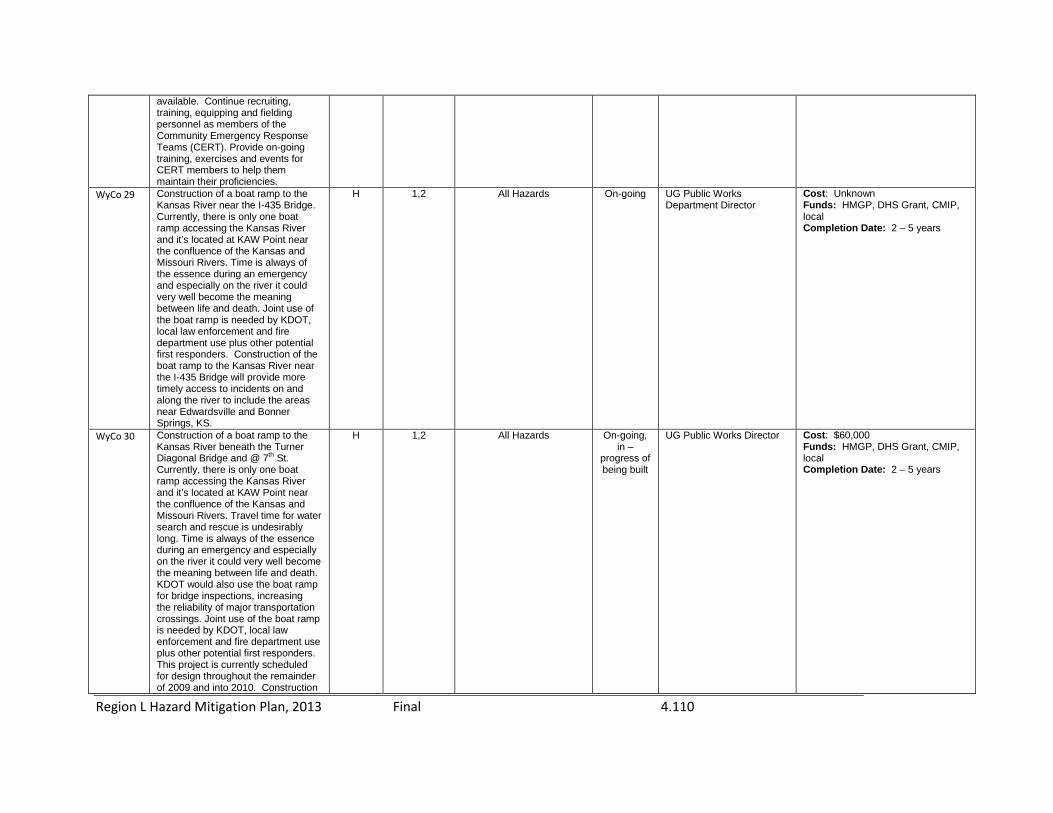
Region L Hazard Mitigation Plan, 2013 Final 4.110
available. Continue recruiting, training, equipping and fielding personnel as members of the Community Emergency Response Teams (CERT). Provide on-going training, exercises and events for CERT members to help them maintain their proficiencies.
WyCo 29 Construction of a boat ramp to the Kansas River near the I-435 Bridge. Currently, there is only one boat ramp accessing the Kansas River and it’s located at KAW Point near the confluence of the Kansas and Missouri Rivers. Time is always of the essence during an emergency and especially on the river it could very well become the meaning between life and death. Joint use of the boat ramp is needed by KDOT, local law enforcement and fire department use plus other potential first responders. Construction of the boat ramp to the Kansas River near the I-435 Bridge will provide more timely access to incidents on and along the river to include the areas near Edwardsville and Bonner Springs, KS.
H 1,2 All Hazards On-going UG Public Works Department Director
Cost: Unknown Funds: HMGP, DHS Grant, CMIP, local Completion Date: 2 – 5 years
WyCo 30 Construction of a boat ramp to the Kansas River beneath the Turner Diagonal Bridge and @ 7th St. Currently, there is only one boat ramp accessing the Kansas River and it’s located at KAW Point near the confluence of the Kansas and Missouri Rivers. Travel time for water search and rescue is undesirably long. Time is always of the essence during an emergency and especially on the river it could very well become the meaning between life and death. KDOT would also use the boat ramp for bridge inspections, increasing the reliability of major transportation crossings. Joint use of the boat ramp is needed by KDOT, local law enforcement and fire department use plus other potential first responders. This project is currently scheduled for design throughout the remainder of 2009 and into 2010. Construction
H 1,2 All Hazards On-going, in –
progress of being built
UG Public Works Director Cost: $60,000 Funds: HMGP, DHS Grant, CMIP, local Completion Date: 2 – 5 years

Region L Hazard Mitigation Plan, 2013 Final 4.111
of the boat ramp to the Kansas River beneath the Turner Diagonal Bridge will provide more timely access to incidents on and along the river.
WyCo 31 Strengthen / Upgrade utility power lines / distribution systems. To reduce power failures and reliance on generators To reduce suffering and economic loss. Strengthen / Upgrade power distribution systems and power lines Bury utility lines
H 1,2 Utility/Infrastructure Failure On-going, Open Ended
Board of Public Utilities, KCP&L, other utilities as needed
Cost: Unknown Funds: HMGP Funding/Local Match, Local Completion Date: Continuous
WyCo 32 Establish Priority reconnects with local utility companies after outages created by severe storms or other type incidents. Numerous agencies depend on continual utility support for the health, safety and welfare of their personnel / clientele to include life support issues. Critical facilities also depend on continual utility support for their operations. In some cases, failed utility support can mean the advent of even more life-threatening incidents, i.e.: loss of life support equipment; chemical releases, food spoilage, etc. Partner with all local utility companies in identifying critical facilities for priority reconnects following outages and together establish a detailed plan to accomplish all reconnects in an orderly manner by that priority
H 1,2 Utility/Infrastructure Failure On-going County Emergency Management Director/all utilities in Wyandotte County
Cost: Unknown Funding: NA Completion Date: 6 month – 2 years
WyCo 33 Public Education—Promote Wyandotte County Multi-Jurisdictional All-Hazards Mitigation Plan to the Public. Wyandotte County is subject to a wide range of natural, man-made and technological hazards ranging from flooding to hazardous materials incidents, to tornadoes and severe weather. All citizens need to be aware of and plan for these potential hazards. Citizen awareness and input is important during the planning process in order to develop a comprehensive countywide plan. Promote the Wyandotte County Multi-Jurisdictional All-Hazards Mitigation Plan to the Public and seek their comments. Promotion of the plan will be made thru news
H 3 All Hazards On-going Wyandotte county Emergency Management Director
Cost: included in the currently funded HMGP grant Funds: Local, HMGP Completion Date: 2009

Region L Hazard Mitigation Plan, 2013 Final 4.112
releases; various websites including a special page on the UG website; emails; neighborhood group announcements / newsletters; information to volunteer groups; public comment access areas at local libraries & city offices; and by other means—all to be addressed in the final Mitigation Plan.
WyCo 34 Continue Periodic Reviews / Updates of Wyandotte County Multi-Jurisdictional All-Hazards Mitigation Plan conducting a major review every five years. A Complete Review & Update of the plan is required by FEMA at least once every Five years in order for Jurisdictions to continue their mitigation compliance and remain eligible for mitigation funding thru the Hazard Mitigation Grant Program (HMGP). Conduct an annual review of the Mitigation Plan ensuring all jurisdictions are involved. Maintain a running account on the status of mitigation actions. Conduct a complete review & update of the entire plan at least once every five years for IAW FEMA mitigation compliance requirements. Forward the updated plan (or changes) to FEMA thru KDEM’s Mitigation Planning Section—same procedure as before. (At the present time, no formal jurisdiction adoptions are required for changes to the plan.)
H 1,2 All Hazards On-going Wyandotte County Emergency Management Director
Cost: NA Funds: NA Completion Date: On-going
WyCo 35 Identify the locations of special needs populations and develop a disaster early warning system for them. Currently there are no completely adequate notification systems available for the special needs population. Many special needs individuals need more advance warning to respond adequately and in a timely manner than do other individuals. A significant portion of Wyandotte County’s population falls into the special needs category. Identify the locations of special needs populations and develop a disaster
1,2 High All Hazards On-going, open ended
Wyandotte County Emergency Management Director
Cost: Unknown Funds: State & Federal Grants, Local, combination, KSERV Completion Date: 6 – 24 months, then continuous

Region L Hazard Mitigation Plan, 2013 Final 4.113
early warning system for them. WyCo 36 Develop a plan for evacuating
special needs populations during disasters. Currently there are no special needs population evacuation plans for Wyandotte County special needs population presents different and additional resource needs in order to be moved / evacuated than others normally do. The health, safety and welfare of special needs population depends on a well planned evacuation during disasters. Federal requirements (DOJ) stipulate the need for written evacuation plans for special needs population. Meet with all stakeholders and develop a detailed plan for evacuating special needs populations during disasters.
H 1,2 All Hazards On-going, Open Ended
Wyandotte County Emergency Management Director, MARC Regional Plan
Cost: Unknown Funds: State and Federal Grants, Local, Combination Completion Date: 6 – 24 months and then continuous
WyCo 37 Adopt / Implement / Enforce Building Code standards for the installation of lightning protection systems. Lightning is the # 1 under-rated killer and a major cause of injuries and damages during thunderstorms. The Magellan Tank Fire, numerous house & structure fires and grass fires have been caused by lightning strike incidents. Adopt / Implement / Enforce Building Code standards for the installation of lightning protection systems Include a spot on the Fire Inspector’s Checklist for Lightning Protection Systems
H 1,2 Lightning On-going UG, Bonner Springs, Edwardsville Planning Departments, Director of Neighborhood Resource Center
Cost: Unknown Funds: Unknown Completion Date: 2 – 5 years
WyCo 38 Create a public notification system to alert the public about an epidemic and how To prevent or treat the disease. Currently there is no adequate public notification system to alert individuals about an epidemic or how to prevent or treat the disease. Research available options, choose the best option that can be funded and further develop it for use.
H 1,2,4 Major Disease Outbreak On-going Wyandotte county Emergency Management Director, Wyandotte county Public Health Department Director
Cost: Unknown Funds: Federal, State Grant funding through DHS/MMRS Local, combination Completion Date: 6 months – 1 ½ years
WyCo 39 Offer / provide Damage Assessment Team Training annually for designated Damage Assessment personnel. Personnel properly trained in current Damage Assessment methods / procedures are required following all disasters to
H 4 All Hazards On-going, Open Ended
Wyandotte County Emergency management Director
Cost: NA Funds: KDEM, IAW FEMA guidelines Completion Date: Continuous

Region L Hazard Mitigation Plan, 2013 Final 4.114
assist Emergency Management in assessing countywide damages to help determine initial damage cost estimates. KDEM requires an Initial Situation Report (Sit-Rep) with this information following a disaster. Damage Assessment procedures often change, requiring individuals to take annual and/or refresher training. Offer / provide Damage Assessment Team Training annually for designated Damage Assessment personnel.
WyCo 40 Identify large venues, ball fields, parks and other areas countywide for installation of lightning detectors and develop a program for their installation. Lightning is the # 1 under-rated killer that results in hundreds of needless deaths and property destruction annually. • Lightning can, and does, strike unaware in areas miles from, and outside, the actual storm area. Research areas countywide, acquire and install lightning detectors in areas as needed and identified.
H 1,2 Lightning On-going Wyandotte County emergency Management Director
Cost: Unknown Funds: HMGP, DHS Grant, Local, Combination Completion Date: 1 – 3 years
WyCo 41 Conduct periodic site visits to hazardous materials (Haz-Mat) critical facilities for familiarization with the facility and to determine site capabilities and limitations for response. Wyandotte County has numerous Hazardous Materials storage / usage facilities that could require emergency response at any time. As with most incidents—Time is of the essence; however, Time is even more important when dealing with the dangers inherent in Haz-Mat issues. Local responders conduct periodic site visits to hazardous materials critical facilities to familiarize themselves with the facility and its capabilities and limitations.
H 1,2 Hazardous Material On-going, Open Ended
Kansas City, Kansas Fire Department Hazmat Team
Cost: None Funds: None Completion Date: Continuous
WyCo 42 Partner with local school districts to ensure they have coordinated, well-prepared plans for school evacuations and sheltering-in-place. Wyandotte County is subject to many potential hazards. Some of these
H 1,2,3,4 All Hazards On-going, Open Ended
Wyandotte County Emergency Management Director
Cost: NA Funds: NA Completion Date: Continuous, on-going. Wyandotte Co has gotten with the districts, however, as plan are revised the cycle begins over.

Region L Hazard Mitigation Plan, 2013 Final 4.115
would require evacuation of personnel to a safer place or sheltering them in place. Providing for the health, safety and welfare of children, teachers and staff are a key concern. Partner with local school districts to ensure they have well-prepared plans for school evacuations and sheltering in place. Assist them in their planning process by reviewing their current plans and providing suggestions for potential revisions.
WyCo 43 Develop adequate communications systems among and between disaster response agencies and the EOC. Wyandotte County is subject to many hazards requiring responses from multiple disaster response agencies. For an effective response, these agencies need to be able to talk with each other and to the operational EOC. Develop adequate communications systems for use between disaster response agencies and the EOC.
H 4 All Hazards On-going Wyandotte county Emergency Management Director
Cost: Unknown Funds: DHS Grant, Local, combination Completion Date: 1 – 3 years
WyCo 44 Support the continuation of Tabletop, Functional and Full Scale Exercises and other training events for responders and support personnel. Training and Exercises allow and prepare responders and support personnel to be better trained and better prepared for actual response situations. Continue supporting training and exercises for all responders and support personnel.
H 1,2,4 All Hazards On-going, Open Ended
Wyandotte County Emergency management Director
Cost: None Funds: None Completion Date: Continuous
WyCo 45 Create a method for parents to reach their children during disaster emergencies. Communications means are almost always overpowered during disaster emergencies. The first thing that parents or guardians want to do following a disaster or incident involving their child(ren) is to immediately self-dispatch to their child’s school or location where they ultimately tend to add to the problem already occurring. Creation of a means / method for parents to reach their children during disaster
H 4 All Hazards On-going, Open Ended
Wyandotte County Emergency Management DIrector
Cost: NA Funds: NA Completion Date: Continuous
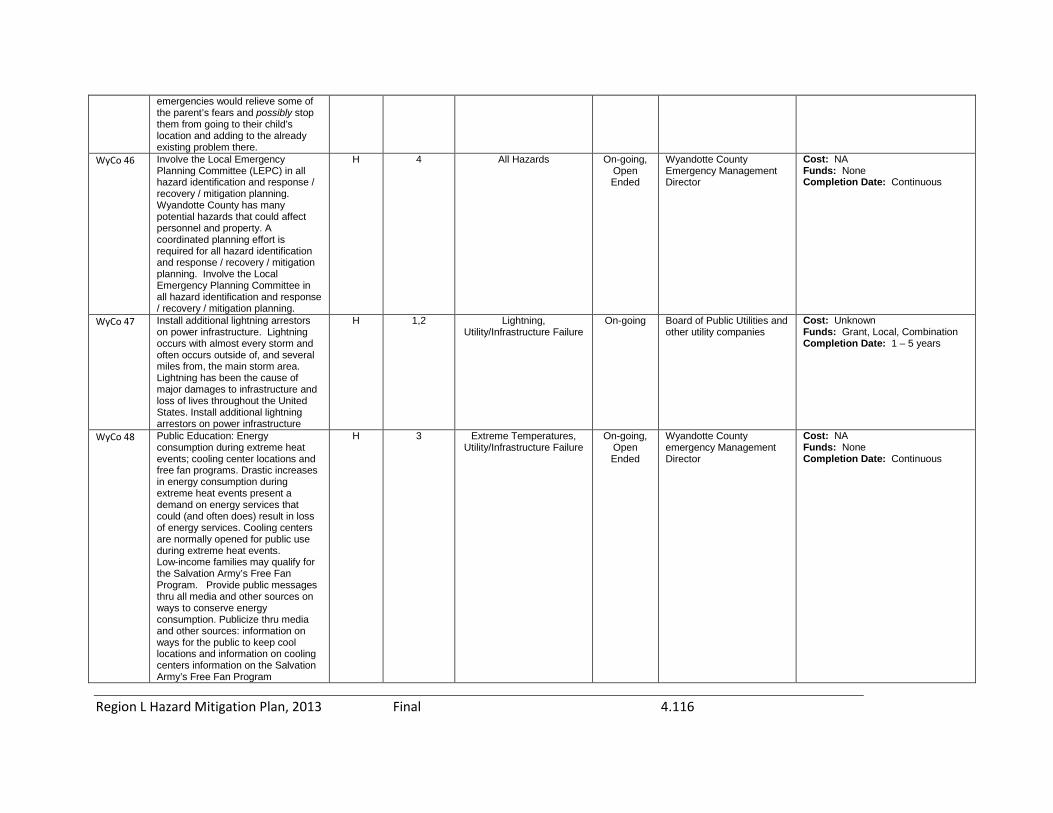
Region L Hazard Mitigation Plan, 2013 Final 4.116
emergencies would relieve some of the parent’s fears and possibly stop them from going to their child’s location and adding to the already existing problem there.
WyCo 46 Involve the Local Emergency Planning Committee (LEPC) in all hazard identification and response / recovery / mitigation planning. Wyandotte County has many potential hazards that could affect personnel and property. A coordinated planning effort is required for all hazard identification and response / recovery / mitigation planning. Involve the Local Emergency Planning Committee in all hazard identification and response / recovery / mitigation planning.
H 4 All Hazards On-going, Open Ended
Wyandotte County Emergency Management Director
Cost: NA Funds: None Completion Date: Continuous
WyCo 47 Install additional lightning arrestors on power infrastructure. Lightning occurs with almost every storm and often occurs outside of, and several miles from, the main storm area. Lightning has been the cause of major damages to infrastructure and loss of lives throughout the United States. Install additional lightning arrestors on power infrastructure
H 1,2 Lightning, Utility/Infrastructure Failure
On-going Board of Public Utilities and other utility companies
Cost: Unknown Funds: Grant, Local, Combination Completion Date: 1 – 5 years
WyCo 48 Public Education: Energy consumption during extreme heat events; cooling center locations and free fan programs. Drastic increases in energy consumption during extreme heat events present a demand on energy services that could (and often does) result in loss of energy services. Cooling centers are normally opened for public use during extreme heat events. Low-income families may qualify for the Salvation Army’s Free Fan Program. Provide public messages thru all media and other sources on ways to conserve energy consumption. Publicize thru media and other sources: information on ways for the public to keep cool locations and information on cooling centers information on the Salvation Army’s Free Fan Program
H 3 Extreme Temperatures, Utility/Infrastructure Failure
On-going, Open Ended
Wyandotte County emergency Management Director
Cost: NA Funds: None Completion Date: Continuous

Region L Hazard Mitigation Plan, 2013 Final 4.117
WyCo 49 Public Education: Home Improvement programs to conserve water and electricity usage to help eliminate hardship on the infrastructure and lower consumption during peak demand periods. A dramatically increased usage of water and electric services during peak demand periods often causes an overall degradation of services that could lead to a complete loss of services and system failure. Advertise / publicize home improvement programs that will help conserve water and electricity usage such as the installation of high efficiency HVAC systems, installation of high energy savings windows and insulation programs.
H 3 Utility/Infrastructure Failure On-going, Open Ended
Wyandotte County Emergency Management Director
Cost: NA Funds: NA Completion Date: Continuous
WyCo 50 Public Education: More aggressive smoke detector installation. Home and building fires occur daily throughout the Metro Area. Smoke (loss of oxygen) is the # 1 Killer during a fire. Smoke alarms lead to saved lives. Research avenues for funding additional smoke detectors to provide to citizens. Local Fire Departments partner with other agencies (Neighborhood Groups, Volunteer Groups, etc.) to distribute and install smoke detectors in more homes. Media campaign on the need for smoke detectors.
H 3 Wildfire On-going, Open Ended
Kansas City, Kansas fire Department, Bonner Springs, Edwardsville, and Lake Quivira FD, Fire Inspector
Cost: Unknown Funds: Unknown Completion Date: Continuous
WyCo 51 Upgrade / Expand / Improve Storm water Management Systems. Development and re-development of communities creates a continual need to assess current storm water management systems and to upgrade / expand / improve them as needed. Continue to assess current storm water management systems and upgrade / expand / improve them as needed with available funding.
H 1,2 Flood On-going, Open Ended
UG Water Pollution Control, Public Works Departments of Bonner springs, Edwardsville, and Lake Quivira
Cost: Unknown Funding: Grant, Local, combination Completion Date: Continuous
WyCo 52 Develop / Improve Early Warning System—work with Media Partners / Outlets. Personnel in Wyandotte County receive their severe weather and other warnings by several different methods. Not all warning
H 3,4 All Hazards On-going Wyandotte county Emergency Management Director
Cost: NA Funds: None Completion Date: Continuous

Region L Hazard Mitigation Plan, 2013 Final 4.118
methods are consistent with each other During emergencies it’s very important for all warning agencies to speak consistently, with one voice, so that individuals don’t receive conflicting messages and not know how or when to respond to the given emergency. Partner with all media outlets, the National Weather Service and other KC Metro counties to ensure that the same, clear, consistent message is being sent out by everyone
WyCo 53 Special Events Planning. There is a need for seminars / training on planning for special event venues to include all hazard events, emergency response plans and continuity of business plans. Coordinate meetings with all large venues: Kansas Speedway, Capitol Federal Park at Sandstone, Community America Ballpark, Schlitterbahn’s Vacation Village, Sunflower Golf Course, Wyandotte County Park, The Legends, George Meyen, Renaissance Festival, Lakeside Speedway, Camp Naish, Parks, Museums, Sporting KC and others to discuss the need for all hazard preparedness, event emergency response plans and continuity of business planning for all special events. 2. Design program and delivery methods based on needs identified at coordination meeting. 3. Identify subject matter presenters 4. Schedule date, time and location of the training 5. Promote training through the Media, Chamber of Commerce, City officials, and direct mail 6. Conduct training. 7. Evaluate effectiveness of the training through the use of surveys and one-on-one interviews.
H 1,2,4 All Hazards On-going Wyandotte County emergency Management Director
Cost: $5,000 Funds: Grants, Donations, Local Completion Date: TBD
WyCo 54 Invite critical organizations to be part of the KC TEW for advance notification of terrorist activity in the area. Coordinated intelligence information systems providing law enforcement organizations in Wyandotte County a common
H 1,2,3,4 Terrorism/Agri-Terrorism On-going Wyandotte County Sheriff’s Chief & KCK Police Department
Cost: NA Funds: None Completion Date: Continuous

Region L Hazard Mitigation Plan, 2013 Final 4.119
operating picture of local threats is a necessity in preserving the safety, security and well-being of all individuals. Invite critical organizations to be part of the KC TEW for advance notification of terrorist activity in the area.
WyCo 55 Develop / maintain an Early Warning System to notify the Public on potential Hazardous Materials (Haz-Mat) dangers integrating it with existing early warning capabilities. Wyandotte County has a large number of hazardous materials facilities along with numerous haz-mat shipments via both road and rail traveling in and through the county on a regular daily basis. A serious haz-mat incident could occur from any one of these sources, resulting in an immediate need to notify/warn the public. Research potential hazardous materials early warning systems for notification of the public in partnership with local first responders and private hazardous materials companies. Acquire and maintain an appropriate early warning system for haz-mat Integrate new warning system with existing warning system.
H 1,2,4 Hazardous Materials On-going Wyandotte County emergency Management Director
Cost: Unknown Funds: DHS Grant, Local, Combination Completion Date: 1 – 3 years
WyCo 56 Develop / maintain an Early Warning System to notify Hospitals and other critical facilities of impending hazard threats integrating it with existing early warning capabilities. Wyandotte County currently has no existing Early Warning System to notify both Hospitals and other critical facilities of impending hazard threats. Research / develop and maintain an Early Warning System to notify Hospitals and other critical facilities of impending hazard threats. • Integrate new warning system with existing warning system.
H 1,2,4 All Hazards On-going Wyandotte County Emergency Management Director
Cost: Unknown Funds: DHS Grant, Local, combination Completion Date: 1 – 3 years
WyCo 57 Implement usage of electronic signs on highways to notify motorists of weather warnings and other hazards. Currently, electronic highway signage is used primarily to warn motorists of working highway
H 1,2, 4 All Hazards On-going Wyandotte County Emergency Management Director
Cost: Unknown Funds: DHS Grant, Local, Combination Completion Date: 6 month – 1 ½ years

Region L Hazard Mitigation Plan, 2013 Final 4.120
accidents; expected delays due to these accidents or large events, detours for road construction, etc. • Use of electronic highway signage for notification of motorists on weather warnings and other hazards could prevent their potential injury or death. Partner, plan and coordinate with KDOT and MODOT for use of their electronic highway signs to notify motorists of weather warnings and other potential hazards that could involve them.
WyCo 58 Update All Flood Insurance Maps. Updated flood insurance maps are required in order for insurance companies to write and provide flood insurance for homeowners and businesses in flood-prone areas.
H 1,2 Flood On-going UG Planning Department Director
Cost: Unknown Funds: Unknown Completion Date: 6 months – 1 ½ years.
WyCo 59 Notify all homeowners and businesses in flood prone areas of their possible risk. Currently there are several businesses and many homeowners located in the flood prone areas of Wyandotte County who are unaware of their flood risks and completely uninsured for any flood losses. Establish an on-going program to notify all property owners (homes and businesses) in the flood prone areas of Wyandotte County of their possible risks due to flooding and encourage them to obtain adequate flood insurance. “On-going program” means an on-going notification plan to notify future potential new property owners of flood prone properties of their risks prior to, or upon transfer of property ownership to them.
H 1,2 Flood On-going UG Planning and Zoning Department; Bonner springs and Edwardsville Planning Departments
Cost: Unknown Funds: Unknown Completion Date: 1 – 2 years
WyCo 60 Ensure that the Wyandotte County Emergency Management Department has a complete, well-planned and coordinated Disaster Response Plan that is continually reviewed and annually updated. Wyandotte County Emergency Management is responsible for timely warning and notification to the public about impending disasters and the coordination of resource support activities to ensure a well-organized,
H 1,2 All Hazards On-going, Open Ended
Wyandotte County Emergency Management Director
Cost: NA Funds: None Completion Date: Continuous

Region L Hazard Mitigation Plan, 2013 Final 4.121
efficient response prior to / during / following disasters. Continually review and annually update the Emergency Management Department’s Disaster Response Plan to ensure a timely, efficient and coordinated response prior to / during / following disasters.
WyCo 61 Create Redundancy in Utility Distribution Lines (Loops) and Key Equipment at Production Facilities. Redundancy in utility distribution lines and key equipment at production facilities is required for and ensures continual service to customers.
H 1,2 Utility/Infrastructure Failure On-going, Open Ended
Board of Public Utilities (BPU), KCP&L, Operations
Cost: Unknown Funds: Grant, Local, combination Completion Date: 3 – 5 years, continuous thereafter.
WyCo 62 Require fixed haz-mat facilities to have their emergency response procedures coordinated with the city and county first responder plans. Facilities generally have internal procedures and plans ready to implement in the event of an emergency with a hazardous chemical. While the emergency responders (fire, police, ambulance) are aware of the chemicals through the Tier II reporting and facility tours, specific procedures are not shared between the agencies. Therefore during an emergency, expectations could likely differ between the responding agencies and the facility personnel.
H 1,4 Utility/Infrastructure Failure On-going, Wyandotte County Emergency Management Director
Cost: Unknown Funds: Unknown Completion Date: 1+ years
WyCo 63 Develop/Update Debris Management Plan to include Memorandums Of Understanding (MOU’s) for debris removal between Wyandotte County and outside / local agencies with equipment available for this, establish collection areas and free mulch program. During most weather events some type of debris resulting from the event is usually produced. During many large events, a tremendous amount of debris is often generated blocking roads and causing extensive damages. Management, removal and disposition of this debris requires careful preplanning, effective responses and, quite often, written
M 4 All Hazards On-going UG Public Works Department with Wyandotte County Emergency Management Director
Cost: Unknown Funds: Local, Grant Completion Date: Continuous

Region L Hazard Mitigation Plan, 2013 Final 4.122
MOUs with other agencies. Develop / Update an effective Debris Management Plan for Wyandotte County to include: MOU’s with other agencies, jurisdictions and pre-identified contractors --Identification of several pre-selected debris collection sites across the --county for use during these events (with MOU’s if required) --Establishment of a countywide “Free Mulch Program” * Review / Update the countywide Debris Management Plan and all MOUs on a regularly scheduled basis.
WyCo 64 Create and train volunteer search & rescue teams to support Professional First Responders. In large searches or other large emergencies, professional First Responders resources may need to be supported by additional personnel. The support of a trained, certified, team of volunteers may be necessary. Wyandotte County, under the direction of Emergency Management, currently has two trained volunteer groups, the Community Emergency Response Team (CERT) and the Radio Amateur Civil Emergency Service (RACES). The purpose of this Mitigation Action is to discuss with the Professional First Responder organizations on how these volunteer teams can support their operations.
M 1,2 All Hazards On-going Emergency Management Director
Cost: $5,000 Funds: CCP Grant Completion Date: Continuous
WyCo 65 Public Education: Hailstorm Damage Prevention. Citizens need to be aware of the dangers inherent in hailstorms. Citizens need to know how to protect themselves and their property from, prepare for, respond to and recover from damaging hailstorms. Proper knowledge, individual preparation and care can prevent personal injury, limit property damage and avoid potential deaths. Provide public education talks, seminars, meetings with various groups, planning sessions, training, exercises, etc. Provide information
M 3 Hailstorm On-going, Open Ended
Emergency Management Director
Cost: Depends on magnitude of public education program being conducted. Funds: Grants, Local, combination Completion Date: Continuous

Region L Hazard Mitigation Plan, 2013 Final 4.123
thru websites; cell phones; newspapers, theatres, billboards, fliers, PSAs, television ads and other multimedia sources, Provide educational materials to schools, hospitals, senior citizen centers, long-term care facilities, business & industry and individuals.
WyCo 66 Identify and develop a list of those areas susceptible to explosive fires, such as grain elevators, etc., and map them. Explosive fires from areas such as grain elevators, etc., present a special and dangerous challenge to first responders and others. Identification and knowledge of these locations along with some prior planning before an incident occurs could very well provide for a much safer overall response. Identify and develop a list of those areas susceptible to explosive fires, such as grain elevators, etc., map them and do some pre-response planning.
M 1,2 Wildfire On-going, Open Ended
Wyandotte County emergency Management Director
Cost: Unknown Funds: DHS Grant, Local, combination Completion Date: 1 – 3 years then continuous.
WyCo 67 Develop a Memorandum of Understanding (MOU) with/between area Building Departments for Post-Disaster Damage Assessment. Well-trained and qualified individuals are needed following every disaster for post-disaster damage assessment. An MOU with their departments would provide more assurance of these individuals being made available by their agencies for post-disaster damage assessments.
M 4 All Hazards On-going, Open Ended
Wyandotte County Emergency Management Director
Cost: NA Funds: None Completion Date: 6 month – 1 years then continuous
WyCo 68 Map all geological hazards countywide and make this information available. There are several geological hazards in Wyandotte County that need to be further identified and mapped such as landslide, land subsidence, and earthquake. Knowing and having this information available will assist us all in countywide planning effort.
M 1,2 All Hazards On-going, Open Ended
Wyandotte County Emergency Management Director/GIS Director
Cost: Unknown Funds: DHS Grant, Local, Combination Completion Date: Continuous
WyCo 69 Identify and map specific underground void space areas prone to collapse failure and limit future development in these areas. Numerous underground void space
M 1,2 Land Subsidence On-going, Open Ended
Wyandotte County Emergency Management Director/GIS Director
Cost: Unknown Funds: DHS Grant, Local, Combination Completion Date: Continuous

Region L Hazard Mitigation Plan, 2013 Final 4.124
areas prone to collapse failure exist Throughout Wyandotte County. • Identifying, mapping and limiting future development in these areas would be cost-effective, potentially prevent injuries and limit future damages due to void spaces collapsing / cave-ins.
WyCo 70 Preparedness Planning for Small Business Owners. Information / training is needed for small business owners on planning for all hazards, preparation of small business emergency response plans and continuity of business plans. Coordinate meetings with Bonner Springs, Edwardsville, Lake Quivira and KCK, Chambers of Commerce, SBA, and others as later identified to discuss the need for business preparedness planning Design a program and delivery methods based on needs identified at coordination meeting. Identify corporate sponsors Identify subject matter presenters Schedule date, time, and location for the training Promote training through the Chamber of Commerce, City officials, business organizations, and direct mail. Conduct training Evaluate effectiveness of the training through the use of surveys and one-on-one interviews
M 3 All Hazards On-going Wyandotte County Emergency Management Director
Cost: $5,000 Funds: Grants, Corporate Sponsors Completion Date: TBD
WyCo 71 Develop and Enforce Building Restrictions in Dam Inundation Areas. When dams are compromised and break, the areas below them are subject to being inundated, resulting in buildings and structures being either damaged or destroyed. Personnel living below these dams are also at great risk of injury or death.
M 1,2 Dam and Levees On-going Wyandotte County Emergency Management Director
Cost: Unknown Funds: None Completion Date: 1 – 5 years
WyCo 72 Upgrade power distribution systems through replacement of porcelain insulators and switches with polymer components. Porcelain insulators and switches are not a durable as those made with polymer components.
M 1,2 Utility/Infrastructure Failure On-going Board of Public Utilities and KCPL
Cost: Unknown Funds: Local Utility Funded, Grant Completion Date: Unknown

Region L Hazard Mitigation Plan, 2013 Final 4.125
WyCo 73 Install and maintain fog warning flashing lights and flash flood warnings (lights and signs) in low-lying and flood prone areas. Wyandotte County often experiences fog and flash flooding events. • Motorists do not drive carefully enough during either type of event and often are involved in accidents or driving their vehicles into high water.
M 1,2 Flood On-going Wyandotte County Emergency Management Director
Cost: Unknown Funds: Grant, Local, Combination Completion Date: Unknown
WyCo 74 Create a website to allow citizens to communicate with each other. Following a large disaster with numerous families relocated from the disaster area, many of the families will find the need to communicate with their former neighbors and friends from that area.
M 4 All Hazards On-going, Open Ended
Wyandotte County Emergency Management Director
Cost: Na Funds: None Completion Date: Continuous
WyCo 75 Encourage the use of flashing fire alarms for the hearing impaired. Wyandotte County has many home and business fires. Normal fire alarms cannot always be heard by the hearing impaired individual. Encourage businesses to use flashing fire alarms for the hearing impaired. Encourage homeowners to use flashing fire alarms for the hearing impaired.
M 1,2 Wildfire On-going, Open Ended
KCK Fire Department, Bonner springs and Edwardsville FD’s
Cost: Unknown Funds: Individual Business or homeowner Completion Date: Continuous
WyCo 76 Require Back-up Generators / Back-up Power for all Critical Facilities. Critical Facilities around the county have been designated as such and, due to their critical role, need to operate continually regardless of the situation. Identify those critical facilities without back-up generators or back-up power. Partner with these critical sites to ensure they do obtain back-up power.
M 1,2 All Hazards On-going Wyandotte County Emergency Management Director
Cost: Unknown Funds: Unknown Completion Date: 1 – 2 years
WyCo 77 Prepare procedures and sites for decontamination. Decontamination of personnel and property is required during certain hazardous materials incidents. Identify potential decontamination sites around the county. Prepare procedures and sites for decontamination.
M 1,2 Hazardous Materials On-going Wyandotte County Emergency Management Director
Cost: Unknown Funds: Unknown Completion Date: 1 – 2 years
WyCo 78 Use Traffic simulations to predict evacuation problems and plan for
M 1 All Hazards On-going Wyandotte County Emergency Management
Cost: Unknown Funds: Unknown

Region L Hazard Mitigation Plan, 2013 Final 4.126
these problems. Routes chosen for evacuation need to be de-conflicted to the greatest extent possible.
Director Completion Date: 1 – 2 years
WyCo 79 Develop a plan for using school buses and public transportation to move people to shelters following an incident / disaster. During an incident or disaster people normally need to be moved out of the affected area to a safer location. Movement of personnel to safer locations and sheltering during an incident is necessary for their personal health, safety and well-being. Partner and plan with local school districts and public transportation agencies to develop a viable plan for transporting people to shelters.
M 1,2 All Hazards On-going Wyandotte County Emergency Management Director
Cost: Unknown Funds: Unknown Completion Date: 6 months – 1 ½ years.
WyCo 80 Identify potential landslide areas and install reinforcement barriers to nullify potential disasters and protect infrastructure. Wyandotte County has several potential landslide areas throughout the county due to its natural geography and previous land developments / improvements. There are some roads and structures located in/near these potential landslide areas. Do not allow building in these areas. Redirect water with specific planting of deep root vegetation to mitigate landslides. Install reinforcement barriers as needed.
M 1,2 Landslides On-Going Wyandotte County Emergency Management Director, Public Works Departments of the UG, Bonner springs and Edwardsville
Cost: Unknown Funds: State, Federal, Local, Combination Completion Date: Unknown.
WyCo 81 Provide an early warning system on streams with the most potential for flood damage to structures. Wyandotte County historically has had flooding issues along streams and rivers—mainly resulting in flooded structures. There is no early warning system for these streams. Identify streams that historically have had flooding issues. Research potential solutions for early warning systems for these streams. Install early warning systems on streams identified as having a potential for flooding.
M 1,2 Flood On-going Wyandotte County Emergency Management Director
Cost: Unknown Funds: HMGP, DHS Grants, Local Completion Date: 3 – 5 years
WyCo 82 Identify Critical Businesses & Public Service Agencies and work to ensure their Continuity of Operations during
M 4 All Hazards On-going Wyandotte County Emergency Management Director
Cost: Unknown Funds: HMGP, DHS Grants, Local, Individual business/agency funding

Region L Hazard Mitigation Plan, 2013 Final 4.127
/ following a disaster. Critical business and public service agencies, including volunteer agencies, providing services to the public must continue regardless of initial, temporary disruption by an incident or disaster. The health, safety and welfare of the public depend on continuation of these services. Identify and work with critical businesses and public service agencies to assist them in developing and maintaining a Continuity of Operations Plan (COOP) for their business/agency to ensure their continued operations and support of the public.
or donations, combination Completion Date: 2 – 5 years
WyCo 83 Create / Develop and Maintain a Plan for pet and livestock rescue, care and sheltering during / following disasters. Pets and livestock are an integral part of many families and most families do not want to leave them in order to seek shelter for themselves. The health, safety and welfare of the public and their pets / livestock depend on planned support services for both by local government and other agencies.
M 2 All Hazards On-going Wyandotte County Emergency Management Director
Cost: Unknown Funds: DHS Grants, Local, State, Federal Completion Date: 2 – 5 years
WyCo 84 Develop Emergency Action Plan for the dam on the Kansas City Kansas Community College’s (KCKCC) campus. If the dam is breached, city drains would probably not hold all the water and State Avenue could flood disrupting traffic and businesses’ in the area. A potential vehicle accident (or other type of accident) caused by the dam breaching could even result in personal injury or death.
M 1,2 Dam and Levees On-going KCK Community college Cost: Unknown Funds: Grants, Local, combination Completion Date: 1 – 1 ½ years
WyCo 85 Develop / Review / Update
Emergency Action Plans (EAPs) for High & Significant Hazard Dams in Wyandotte County. Should one of these dams be breached or overtopped during extremely heavy rainfall, the area below and downstream of the dam would flood, potentially causing loss of life and/or extensive property damage, along
M 1,2 Dams and Levees On-going Owner of Dam – KCK Community College
Cost: Minimal Funds: Individual owner Completion Date: 6 months after start of plan

Region L Hazard Mitigation Plan, 2013 Final 4.128
with the disruption of traffic and businesses in the area. An EOP with well-developed emergency notification procedures and regularly updated contact numbers for persons living or owning property below these dams is paramount to the safety of all.
WyCo 86 Public Education—Encourage the use of grounded outlets and surge protectors in homes and businesses. Improperly grounded electrical outlets and equipment may result in fires, equipment damage, personal injuries and potential loss of life. Equipment unprotected from power surges may be damaged, destroyed or can result in fires which could also result in the loss of life. Provide public education talks, seminars, meetings with various groups, planning sessions, training, exercises, etc. Provide information thru websites; cell phones; newspapers, theatres, billboards, fliers, PSAs, television ads and other multimedia sources, Provide educational materials to schools, hospitals, senior citizen centers, long-term care facilities, business & industry and individuals
M 3 Wildfire On-going, Open Ended
Local Fire Departments Cost: Depends on magnitude of public education program being conducted Funds: Grants, Local, combination Completion Date: Continuous
WyCo 87 Adopt / Enforce Codes to bury utility lines in future developments. Conventional power pole power lines are subject to damages / outages from storms, vehicular accidents, falling tree limbs and other means that place them out of service for varying lengths of time. The lives, health and well-being of many citizens across the county require continual use of utility services to stay healthy / remain alive. Existing utility lines require continual maintenance to keep in operation. Adopt and enforce codes in all three cities (Bonner Springs, Edwardsville, Kansas City, Kansas) requiring builders / developers to bury all utility lines in future developments.
M 1,2 Utility/Infrastructure Failure On-going, Open Ended
Planning and Zoning Departments for each city
Cost: Unknown Funds: Grants, Local, Private developer funding Completion Date: Continuous

Region L Hazard Mitigation Plan, 2013 Final 4.129
WyCo 88 Enforce Strict Compliance on Dam and Levee Deficiencies found during periodic inspections. There are 15 HIGH Hazard Dams and 3 Significant Hazard Dams in Wyandotte County. The High Hazard Dams have residences / businesses below them. Many of the High Hazard Dams DO NOT have the required Emergency Action Plans (EAP) or their EAP is completely outdated. (Alert / Notification rosters are an integral part of the plan and much-needed during a dam failure or potential failure.) There are 4 Levees providing 100-year or greater protection with over $2 billion in protected structures and $8 billion in contents/other protected assets behind them. There is also one agricultural levy (Wolcott). Organize a program to monitor all dam and levee inspections, their results (deficiencies found) and corrective actions taken. Work with dam and levy owners throughout the process to ensure all corrective actions are planned / taken. Assist levy owners in pursuing potential funding to correct deficiencies thru various sources—local, state and federal. • Determine method to induce strict and full compliance on deficiencies by the owners of all High / Significant Hazard dams and potential results for non-compliance—monetary or otherwise.
M 1,2 Dam and Levee On-going, Open Ended
Wyandotte County Emergency Management Director
Cost: Unknown Funds: HMGP, Local, owner of dam Completion Date: 6 months – 1 year, than Continuous
WyCo 89 Establish locations for emergency morgues. A mass fatality disaster in Wyandotte County could far exceed one local morgue’s capability. • Pre-identified emergency morgue locations would assist in a mass fatality response effort. Meet with all stakeholders to research and identify potential emergency morgue locations Develop a detailed, coordinated plan for the use of these facilities / locations with proper MOUs / MOAs as required.
M 3 All Hazards On-going Wyandotte County Emergency Management Director, County Coroner
Cost: Unknown Funds: DHS Grants, Local, State Completion Date: 1 – 3 years,

Region L Hazard Mitigation Plan, 2013 Final 4.130
Wyandotte County – Wyandotte Health Department Action ID Action/Description Priority Goal(s)
Addressed Hazard Addressed Status Responsible Entity Estimated Cost and funding Source
WyHealth 1 Public Education and information: Public Health. Prior to a public health emergency and throughout, the public needs to know what actions to take to prepare for the event, prevent illness, and care for the ill. There are a myriad of ways to disseminate information. A multimedia approach is required to reach all venues including special populations. Newspapers, theatres, billboards, fliers, PSAs, television ads, educational materials for schools, meetings with various groups, presentations, and more are all necessary to get the right message out to citizens.
H 3 All Hazards On-going, Continuous
Health Department Cost: $100,000 Funds: CDC Completion Date: Continuous as needed
WyHealth 2 Develop Protocols for delivering vaccine / providing vaccinations. Adequately administering timely vaccinations to individuals prior to or during a pandemic or other major health incident is paramount to the overall health, safety and livelihood of the community. Meet with primary stakeholders and develop a detailed plan for administering and/or tracking vaccine / vaccinations throughout the county. Continued Public Health surveillance to further detect the potential need for distribution of vaccine and vaccinations. Public Education to citizens on required protective measures / vaccinations
H 1,2,3 Major Disease Outbreak On-going Wyandotte county Emergency Management Department, Local Hospitals & Health Providers, UG and volunteer personnel
Cost: Unknown Funds: CDC, KDHE, Local Completion Date: On-going
Wyandotte County – Wyandotte County Sheriff Action ID Action/Description Priority Goal(s) Hazard Addressed Status Responsible Entity Estimated Cost and funding Source
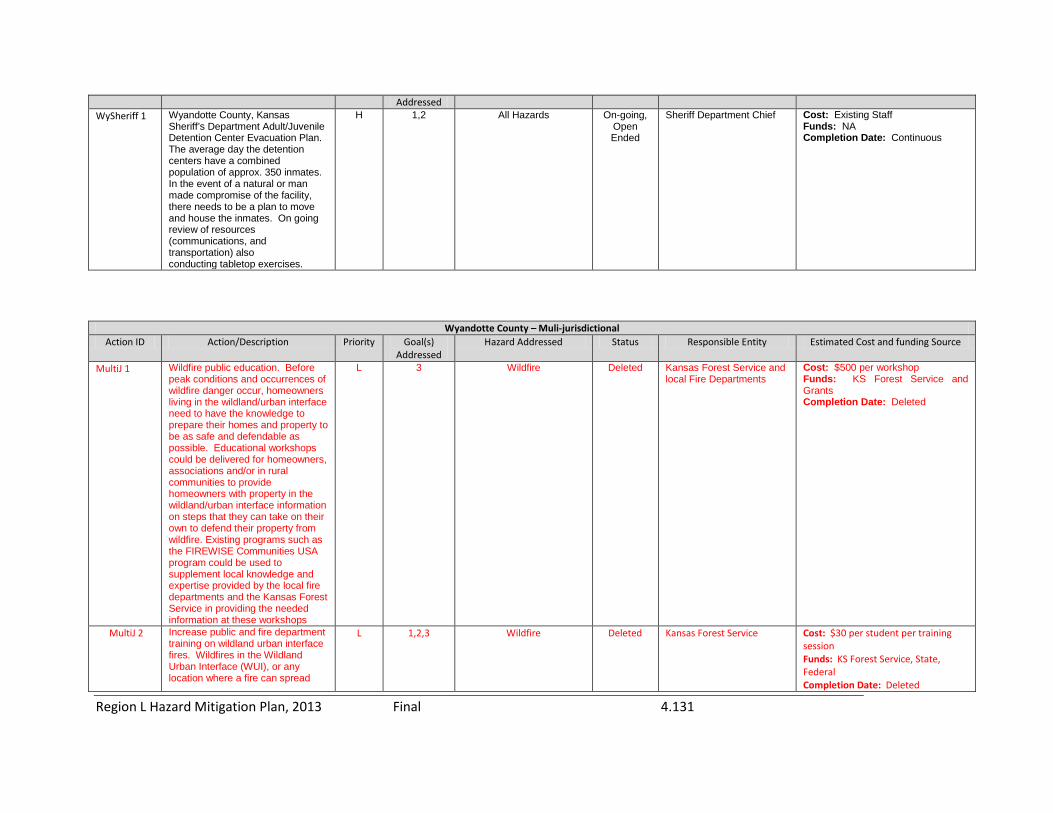
Region L Hazard Mitigation Plan, 2013 Final 4.131
Addressed WySheriff 1 Wyandotte County, Kansas
Sheriff’s Department Adult/Juvenile Detention Center Evacuation Plan. The average day the detention centers have a combined population of approx. 350 inmates. In the event of a natural or man made compromise of the facility, there needs to be a plan to move and house the inmates. On going review of resources (communications, and transportation) also conducting tabletop exercises.
H 1,2 All Hazards On-going, Open Ended
Sheriff Department Chief Cost: Existing Staff Funds: NA Completion Date: Continuous
Wyandotte County – Muli-jurisdictional Action ID Action/Description Priority Goal(s)
Addressed Hazard Addressed Status Responsible Entity Estimated Cost and funding Source
MultiJ 1 Wildfire public education. Before peak conditions and occurrences of wildfire danger occur, homeowners living in the wildland/urban interface need to have the knowledge to prepare their homes and property to be as safe and defendable as possible. Educational workshops could be delivered for homeowners, associations and/or in rural communities to provide homeowners with property in the wildland/urban interface information on steps that they can take on their own to defend their property from wildfire. Existing programs such as the FIREWISE Communities USA program could be used to supplement local knowledge and expertise provided by the local fire departments and the Kansas Forest Service in providing the needed information at these workshops
L 3 Wildfire Deleted Kansas Forest Service and local Fire Departments
Cost: $500 per workshop Funds: KS Forest Service and Grants Completion Date: Deleted
MultiJ 2 Increase public and fire department training on wildland urban interface fires. Wildfires in the Wildland Urban Interface (WUI), or any location where a fire can spread
L 1,2,3 Wildfire Deleted Kansas Forest Service Cost: $30 per student per training session Funds: KS Forest Service, State, Federal Completion Date: Deleted

Region L Hazard Mitigation Plan, 2013 Final 4.132
from vegetation (wildland fuels) to man-made (urban fuels) presents a unique and potentially very dangerous set of hazards to the firefighters that respond to them as well as the public that live in areas where such fires occur. Several trainings could be implemented to increase the general, tactical, and safety knowledge of anyone living in or responding to fires in the WUI. Topics from tactical decision making to assistance with pre-incident assessments of properties that may be impacted should be covered in these training sessions
MultiJ 3 Reduce hazardous fuels in prioritized wildfire risk areas. Past experience has shown that there is a threat of having wildland/urban interface (WUI) fires in the planning area. The WUI is any location where a fire can spread from vegetation (wildland fuels) to man-made (urban fuels). As part of the planning process, a wildfire hazard assessment has been conducted to begin to identify those locations that might be in need of some hazard fuel reduction work. In those areas that have been prioritized as posing a threat for wildland/urban interface fires, fuel reduction should be used to create fuel breaks between the wildland fuels and the urban environment. Methods used would consist of mechanical removal of fuel, mechanical thinning of fuel, and/or prescribed fire.
L 1,2 Wildfire Deleted Kansas Forest Service and Local Fire Departments
Cost: $85 per acre Funds: KS Forest Service, Local FDs Completion Date: Deleted
Wyandotte County – Board of Public Utilities Action ID Action/Description Priority Goal(s)
Addressed Hazard Addressed Status Responsible Entity Estimated Cost and funding Source
BPU 1 Upgrade UG and BPU’s Radio System. The current radio system
H 4 All Hazards On-going Director – Electric Transmission and
Cost: $20 to $25 million Funds: Grants, Local

Region L Hazard Mitigation Plan, 2013 Final 4.133
is obsolete and is an unsupported system for Public Safety between BPU and the Unified Government. The radio system is scheduled for replacement in 2014, which includes Wyandotte County’s critical support services.
Distribution Kansas City Board of Public Utilities
Completion Date: 2nd Qtr, 2014
Wyandotte County – City of Bonner Springs Action ID Action/Description Priority Goal(s)
Addressed Hazard Addressed Status Responsible Entity Estimated Cost and funding Source
BSprings 1 Provide detention along Mission Creek north of Kaw Dr. (K-32) near Shawnee Rock. When Mission Creek floods, the floodwaters crest Kaw Dr. (K-32) near 121st Street. The floodwaters cause damage to the businesses in the area. The floodwaters also cause other issues downstream in Edwardsville, Kansas. Upon completion of an engineering study, it may be possible to detain Mission Creek, near the entrance to Shawnee Rock, in times of flood. Currently, the creek flows into three large tubes. By controlling the output of these tubes, floodwater would be detained in the natural basin outlined roughly by 118th Street and Steventon Dr /Metropolitan Ave. These roads would flood, but the areas they serve could be accessed from the north. The detention of the floodwater would result in keeping Kaw Dr. (K-32) from flooding and prevent flooding issues downstream.
H 1,2 Flood On-going City of Bonner Springs, City Planner/Floodplain Administrator, Public Works Director
Cost: Unknown Funds: FEMA, Local, combination Completion Date: 1 – 3 years
BSprings 2 Continue Compliance with NFIP. To reduce flood losses and maintain city’s standing with FEMA. Continuous monitoring of floodplain development Participate in the NFIP Community Rating System Promote Flood Insurance at severe weather seminars, preparedness seminars, safety fairs, and severe
H 1,2,4 Flood On-going, Open Ended
Bonner springs Planning Department, City Planning Director
Cost: NA Funds: NA Completion Date: Continuous

Region L Hazard Mitigation Plan, 2013 Final 4.134
weather week activities. BSprings 3 Provide NOAA weather radios to all
physical businesses in Bonner Springs and Edwardsville. Severe weather strikes quickly and without warning. We should enhance the early warning capability for all hazards. By providing NOAA weather radios to all businesses throughout the community, we can provide early warning of severe weather and other hazards to members of the business community and their employees.
H 1,2, 4 Hailsotrm, Lightning, Tornado, Windstorm,
Winter Storm
Delete – no longer an
active project
Bonner Springs Project Manager
Cost: $10,530 Funds: FEMA, Civic Org., NOAA (quantity discount) Completion Date: Delete
BSprings 4 Mounting camera at Fire Department for storm Monitoring. Severe weather strikes quickly and without warning. Weather spotters from the fire department are limited by terrain and other factors. By mounting a camera capable of tilt, zoom, and pan, (TZP) to the antenna at the Bonner Springs Fire Department, it would enhance the early warning capabilities of the county and city.
H 1,2 Hailsotrm, Lightning, Tornado, Windstorm,
Winter Storm
On-going Bonner springs Fire Department, Fire Chief, and WYCO Emergency Management Director
Cost: Unknown Funds: Unknown Completion Date: 1 year
BSprings 5 Continuity of Operations. Continuity of Operations plans are needed for the City of Bonner Springs Government Identify cost for plan development. 2. Identify funding source. 3. Emergency Management will coordinate with the City of Bonner Springs on implementation of this project upon receipt of funding. 4. Select contractor. 5. Schedule and conduct kick-off meeting 6. Conduct departmental interviews. 7. Develop draft plan. 8. Present the draft plan and solicit input from departments and elected officials. 9. Make revisions and finalize plan. 10. Develop exercise. 11. Exercise the plan 12. Conduct After Action and make any necessary changes to the plan.
H 1,4 All Hazards On-going City of Bonner springs City Manager
Cost: $15,000 Funds: TBD Completion Date: TBD
BSprings 6 Family Preparedness Planning. Citizens need all hazard preparedness planning information to know how to respond in the
H 1,2,3 All Hazards On-going City of Bonner Springs, City Manager
Cost: $50,000 Funds: DHS Grant, UASI Homeland Security Funds Completion Date: TBD

Region L Hazard Mitigation Plan, 2013 Final 4.135
event of a hazard event. Metropolitan Emergency Mgmt Committee (MEMC) Citizens Preparedness Committee will develop preparedness website to include family preparedness procedures and family planning templates. Make copies available of the planning templates. Develop family preparedness handbook Promote family preparedness planning with brochures, website and community outreach. Develop all hazards planning template in multiple languages Evaluate program outcomes with surveys and website
BSprings 7 Turn Around Don’t Drown. The public needs information/reminders not to drive through floodwaters on roadways. 1. Adopt Turn Around Don’t Drown program 2. Develop promotional brochures, media releases, and street signs. 3. Promote program to driver education in schools. 4. Place signs along roadways that are prone to flash flooding
H 1,2,3 Flood On-going City of Bonner Springs Fire Department Fire Chief
Cost: $2,000 Funds: Corporate Sponsors Completion Date: TBD
BSprings 8 Spring Creek Storm Drainage Improvements. Improvements are needed to address flooding that occurs as a result of inadequate drainage. Replace and construct additional culverts to reduce flooding. 1. Culvert under railroad Spur Road: replace with double 14’X14’ RCB- $386,600 2. Culvert under railroad tracks: construct an additional 14’X12’ RCB- $414,850 3. Culvert under Front Street: construct an additional 14’X12’ RCB $284,150 4. Culvert under Second Street: construct an additional 14’X12’ RCB $108,700 Total Cost: $1,194,300
M 1,2 Flood On-going City of Bonner Springs Public Works Director
Cost: $1,194,300 Funds: TBD Completion Date: TBD
BSprings 9 Spring Creek Storm Drainage /Springdale Avenue to Morse Avenue. Stream bank improvements are needed in Spring Creek located along Pratt Street and Morse Avenue and in the park. New triple 14’ X 6’ RCB under
M 1,2 Flood On-going City of Bonner Springs Public Works Director
Cost: $782,700 Funds: FEMA HMGP, other Grants Completion Date: TBD

Region L Hazard Mitigation Plan, 2013 Final 4.136
Morse Avenue Grading the channel and constructing gabion basket walls at several locations along the creek within the park to stabilize the creek banks and help prevent further erosion Gabion basket walls will be constructed adjacent to the house at 300 block of Pratt Street to prevent further bank erosion Turf reinforcement matrix will also be constructed to stabilize the channel slopes in other locations Identify funding Place project out for bid Select contractor Execute contract Work completed City of Bonner Springs or designee would oversee project
BSprings 10 Chemical Warning System Procedures. The public needs warning information during some chemical events that could impact them. Develop procedures to activate the Emergency Alert System (EAS) and National Weather Service (NWS) All Hazard Radios for chemical events. Coordinate meeting with Bonner Springs Police, Fire, EMS, Wyandotte County Emergency Management, NWS, and Union Pacific Railroad to discuss implementation of the NWS HazCollect notification system. Develop implementation policies and procedures and distribute to necessary departments Exercise the program Review After Action and make any necessary changes
M 1,2,4 Hazardous Materials On-going City of Bonner Springs Police Chief and Fire Chief
Cost: None Funds: None Completion Date: TBD
BSprings 11 Stream Bank Set Back ordinance. Controlling uses and developments along stream banks can aid in lessening impacts as a result of flooding. An ordinance controlling development along streambank would allow vegetation within setback areas minimizing streambank erosion as well as providing natural filters to improve groundwater quality. Research stream bank set back ordinances and determine if this tool should be implemented in the City of
M 1,2,4 Flood On-going City of Bonner Springs City Planning Director
Cost: None Funds: None Completion Date: TBD

Region L Hazard Mitigation Plan, 2013 Final 4.137
Bonner Springs. 1. Coordinate meeting with Bonner Springs, Natural Resources Conservation Service and Emergency Management 2. Review existing cities and sample ordinances 3. Determine if there is a need in Bonner Springs for a stream bank set back ordinance.
BSprings 12 Storm Drainage Study. Storm drainage improvements are needed along Wolf Creek watershed. Provide Hydrologic and hydraulic analysis and storm drainage improvement design along Wolf Creek watershed. 1. finalize area to be studied 2. select contractor 3. execute contract 4. review preliminary findings 5. present study to elected officials
L 2 Flood On-going City of Bonner Springs City Planning Director
Cost: $100,000 Funds: FEMA HMGP, County Completion Date: TBD
BSprings 13 Clark Area Drainage. Improvements are needed to address the undersized drainage features in the Clark Area Drainage Watershed. Phase A: Add RCB under K-7 ramp $174,000 Phase B: Main line system-Emerson to Warner $851,000 Phase C: Ditch re-alignment west of Emerson $6,600 Phase D: Main line system-Morse to upstream of Emerson $388,000 Phase E: Cornell Avenue system $35,000 Phase F: Emerson Avenue to Morse Avenue $92,000 Phase G: Northwest of Morse Avenue $206,000 Total $1,753,000
L 2 Flood On-going City of Bonner Springs Public Works Director
Cost: $1,1753,000 Funds: TBD Completion Date: TBD
BSprings 14 Shelter-in-Place. A program is needed to educate individuals on how to receive notification regarding a chemical incident and necessary actions to take. Develop Shelter-in-Place program. Develop brochures and kits for sheltering-in-place. Educate and train residents on how to shelter-in-place
L 3 Hazardous Materials On-going City of Bonner Springs Police Chief and Fire Chief
Cost: $7,500 Funds: TBD Completion Date: TBD
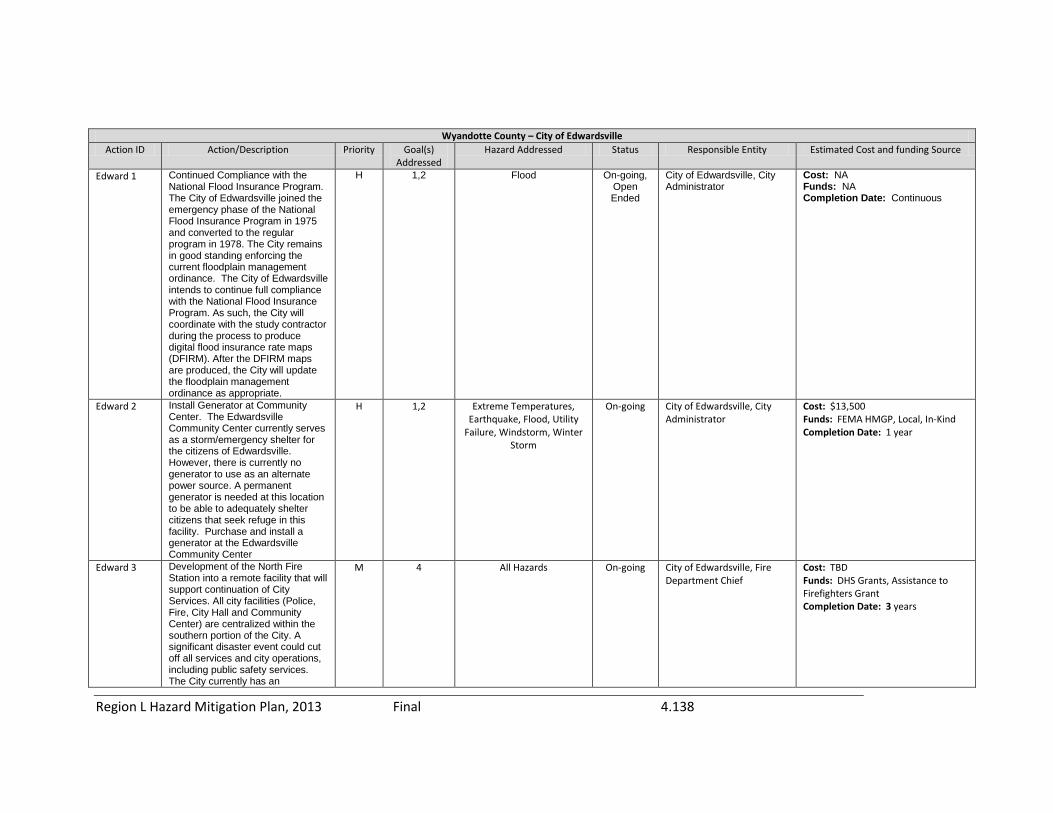
Region L Hazard Mitigation Plan, 2013 Final 4.138
Wyandotte County – City of Edwardsville Action ID Action/Description Priority Goal(s)
Addressed Hazard Addressed Status Responsible Entity Estimated Cost and funding Source
Edward 1 Continued Compliance with the National Flood Insurance Program. The City of Edwardsville joined the emergency phase of the National Flood Insurance Program in 1975 and converted to the regular program in 1978. The City remains in good standing enforcing the current floodplain management ordinance. The City of Edwardsville intends to continue full compliance with the National Flood Insurance Program. As such, the City will coordinate with the study contractor during the process to produce digital flood insurance rate maps (DFIRM). After the DFIRM maps are produced, the City will update the floodplain management ordinance as appropriate.
H 1,2 Flood On-going, Open Ended
City of Edwardsville, City Administrator
Cost: NA Funds: NA Completion Date: Continuous
Edward 2 Install Generator at Community Center. The Edwardsville Community Center currently serves as a storm/emergency shelter for the citizens of Edwardsville. However, there is currently no generator to use as an alternate power source. A permanent generator is needed at this location to be able to adequately shelter citizens that seek refuge in this facility. Purchase and install a generator at the Edwardsville Community Center
H 1,2 Extreme Temperatures, Earthquake, Flood, Utility
Failure, Windstorm, Winter Storm
On-going City of Edwardsville, City Administrator
Cost: $13,500 Funds: FEMA HMGP, Local, In-Kind Completion Date: 1 year
Edward 3 Development of the North Fire Station into a remote facility that will support continuation of City Services. All city facilities (Police, Fire, City Hall and Community Center) are centralized within the southern portion of the City. A significant disaster event could cut off all services and city operations, including public safety services. The City currently has an
M 4 All Hazards On-going City of Edwardsville, Fire Department Chief
Cost: TBD Funds: DHS Grants, Assistance to Firefighters Grant Completion Date: 3 years

Region L Hazard Mitigation Plan, 2013 Final 4.139
unmanned fire station located in the northern portion of the City that can serve as an emergency operations center for the city should such an event occur. Renovation of the facility, purchase and installation of necessary equipment to make the North Fire Station operable for all services of the city.
Edward 4 Floodprone property acquisition. Properties along 98th Street flood have flooded several times in the past. Implement a voluntary purchase project to purchase up to 5 properties along 98th street. After purchase, the properties would be demolished and the land maintained as open space.
L 1,2 Flood Deleted City of Edwardsville, City Administrator’s Office
Cost: Unknown Funds: FEMA, Local Completion Date: Deleted
Wyandotte County – City of Lake Quivira Action ID Action/Description Priority Goal(s)
Addressed Hazard Addressed Status Responsible Entity Estimated Cost and funding Source
LQuivira 1 Emergency Power Back-up Generator for City Hall Facility. There is currently no power back-up system for City Hall that houses the Fire, Police and administration departments. Thus emergency lighting, communications equipments are door openers are all vulnerable during power outages. There are frequent power outages in the area because of Westar Energy’s western substation. Installation of a single property sized generator behind City Hall as a single unit could support all existing circuits.
H 1,2 Lightning, Tornado, Utility/Infrastructure Failure, Winter Storm, Windstorm
Deleted, merged
with Johnson County
LQuivira 2
City of Lake Quivira Police Department
Cost: $25,000 Funds: Local, FEMA Completion Date: 1 – 2 years
LQuivira 2 Emergency Evacuation Exit for gated residential community
H 1,2 Hazardous Materials Deleted, merged
with Johnson County,
LQuivira 1
City of Edwardsville, City Administrator’s Office
Cost: $13,500 Funds: FEMA HMGP, Local, In-Kind Completion Date: 1 year

Region L Hazard Mitigation Plan, 2013 Final 4.140
Wyandotte County – Wyandotte Nation Action ID Action/Description Priority Goal(s)
Addressed Hazard Addressed Status Responsible Entity Estimated Cost and funding Source
WyNation 1 Reconstruction of the existing deteriorated walkways, steps, and handicapped accessible ramps at the cemetery of the Huron Nation. The Cemetery of The Huron Nation which not only served as a final resting place for the Native Americans indigenous to the area, but also countless and in many cases unnamed Civil War Dead both Union and Confederate at rest in the heart of the community. The Huron Park and Cemetery are Landmarks on the National Register of Historic Sites. There is an issue with drainage from this elevated plot of land and the resulting erosion must be curtailed to halt erosion and land sinking on adjacent sidewalks, clogging the existing drainage system with silt and debris from the water runoff. Reconstruction of the existing deteriorated walkways, steps, and handicapped accessible ramps incorporating retaining walls and drainage to channel runoff as outlined below will halt the infiltration of silt and debris entering the cities drainage system. #1. Cemetery, South East Corner: Replace existing wooden stairways and landings with reinforced concrete and an incorporated retaining wall and drainage channel. #2 Cemetery North East Corner: Replace the existing deteriorated wooden handicapped accessible ramp and promontory overlook from
H 1,2 Flood, Landslide Deleted due to non-
participation in plan.
Wyandotte Nation Cost: Unknown Funds: Bureau of Indian Affairs, HMGP Completion Date: Deleted

Region L Hazard Mitigation Plan, 2013 Final 4.141
the East Drive up to an existing outlook and cemetery level. Replace with a reinforced concrete ramp, and existing promontory overlook. #3 Replace the sinking sections of sidewalk along the driveway on the east side of the cemetery and dividing the cemetery from the Huron Park. #4 Re-construct the drain located at the base of the South East Stairway of the Cemetery alongside the driveway.
Wyandotte County – USD 202 Turner Schools Action ID Action/Description Priority Goal(s)
Addressed Hazard Addressed Status Responsible Entity Estimated Cost and funding Source
USD202 1 Provide Adequate & accessible storm shelter area(s) (safe-rooms) for students, faculty and staff of Turner Schools. No completely adequate storm shelter area(s) (safe-rooms) are currently available for students, faculty and staff of Turner Schools. Construct new safe-rooms to provide adequate sheltering in accordance with FEMA standards (per FEMA 361 guidance) for each Turner USD# 202 school with easy access when sheltering is required. Retrofit, as deemed appropriate, those schools already in existence with safe-rooms that may also be used as school multi-purpose meeting rooms.
H 1,2 Windstorm, Winter Storm, Tornado
Deleted due to non-
participation in plan.
USD 202 Cost: Unknown Funds: Grant (HMGP), in-kind Completion Date: Deleted
Wyandotte County – USD 204 Bonner/Edwardsville Schools Action ID Action/Description Priority Goal(s)
Addressed Hazard Addressed Status Responsible Entity Estimated Cost and funding Source
USD204 1 Camera System Updates and H 1,2,4 Terrorism On-going USD204, IT Department, Cost: $70,000

Region L Hazard Mitigation Plan, 2013 Final 4.142
installation. Currently, we have internet access to camera systems at all of the buildings. The tech department has worked with the Bonner Springs Police Department on retrofitting Bonner police cars so that they could web into the cameras any time. Provide communication between USD #204 tech department and the local police departments on implementation. Pan, tilt, zoom camera systems for all exterior portions of the buildings including the athletic facilities equipped so that emergency personnel will be able to remote into the systems to view what is currently happening at the site. Key areas within the building would also have pan, tilt, and zoom systems so that these areas can be viewed. All of the camera systems will be able to be controlled remotely by personnel. Some of the key areas will be the entrances, stairways, major hallways, and cafeterias. they need. We are interested in working with the Edwardsville police department and KCK police departments (Delaware Ridge is in KCK) on access to their vehicles as well. We need upgrades and new cameras to help ensure a safe environment in all of the buildings.
Administration, Local Police Departments
Funds: Unknown Completion Date: 4 months after funding is secured
USD204 2 Safe Rooms for Schools. No completely adequate storm shelter area(s) (safe-rooms) are currently available for students, faculty and staff of Bonner / Edwardsville USD# 204 schools. Construct new safe-rooms to provide adequate sheltering in accordance with FEMA standards (per FEMA 361 guidance) for each Bonner / Edwardsville USD# 204 school with easy access when sheltering is required. Retrofit, as deemed appropriate, those schools already in existence with safe-rooms that may also be used as school multi-purpose meeting rooms.
H 1,2 Windstorm & Tornado On-going USD 204 Cost: Unknown Funds: HMGP, In-kind Completion Date: Within 1 year of project approval

Region L Hazard Mitigation Plan, 2013 Final 4.143
Wyandotte County – USD500 Kansas City Schools Action ID Action/Description Priority Goal(s)
Addressed Hazard Addressed Status Responsible Entity Estimated Cost and funding Source
USD500 1 Provide adequate & accessible storm shelter area(s) (safe-rooms) for students, faculty and staff of Kansas City, Kansas USD# 500. schools. No completely adequate storm shelter area(s) (safe-rooms) are currently available for students, faculty and staff of Kansas City, Kansas USD# 500 schools. Construct new safe-rooms to provide adequate sheltering in accordance with FEMA standards (per FEMA 361 guidance) for each Kansas City, Kansas USD# 500 school with easy access when sheltering is required. Retrofit, as deemed appropriate, those schools already in existence with safe-rooms that may also be used as school multi-purpose meeting rooms.
H 1,2 Windstorm & Tornado Deleted due to non-
participation in plan
USD500 Cost: Unknown Funds: HMGP, In-kind match Completion Date: Deleted
Wyandotte County – Kansas State School for the Blind Action ID Action/Description Priority Goal(s)
Addressed Hazard Addressed Status Responsible Entity Estimated Cost and funding Source
KSSB 1 ADA Community Safe Room. The student population is multiply disabled including blindness. Moving them around as a group is slow and cumbersome. The school buildings, where students spend most of their day, were built prior to the 1950's and are not equipped with reinforced construction required to provide truly safe protection from
H 1,2 Windstorm, Tornado On-going, Assessme
nt has been
complete.
Unified Government, KSSB Superintendent
Cost: Unknown Funds: FEMA Grant Completion Date: 12 – 18 months

Region L Hazard Mitigation Plan, 2013 Final 4.144
tornadoes or other severe weather related incidents. Currently hallways are designated as tornado shelter areas. We do this because many buildings have no basement . An ADA Safe Room on the main level would allow us to move the students to this area in a short period of time where they were safe and where they can be found easily by emergency personnel.
KSSB 2 Back up Generator. We have medically fragile students with multiple handicaps many of whom live on site. Loss of power would expose them to danger from health risks from lowered temperatures and safety risks from exposure to alternative heating sources like kerosene heaters or other exposed flames. Over the years during loss or power incidents the students have been at risk. The campus was originally built in mid l800’s the wiring is antiquated. We have multiple separate power feeds into the campus. The generator would allow us to better protect the students in the event of a major crisis like an Ice Storm – the generator would prevent students being exposed to dangerous environments such as loss of heat, open heaters, kerosene heaters, inadequate food preparation and safe food storage. Also because of the location and layout of the campus we could be an emergency housing site for neighbourhood groups living in the vicinity. The campus could also provide housing for workers such as utility workers or medical personnel or even a quarantine location in the event of a medical emergency. For this level of response all 10 or the buildings would be need access to the Back up Generator.
H 1,2 Utility Failure, Windstorm, Winter Storm
On-going Unified Government, KSSB Superintendent
Cost: $230,000 total Funds: FEMA HMGP Completion Date: 8 – 10 months

Region L Hazard Mitigation Plan, 2013 Final 4.145
KSSB 3 Closed Site Clinic. We are a facility with medically fragile students some of whom have multiple disabilities; therefore, we have an onsite Infirmary with 24/5 staffing. Because many of the students come from out of state Kansas it is sometimes difficult to impossible for them to get immunizations for things like flu in their home communities because they live on the campus during the week. Having vaccine available on campus would facilitate them getting the proper immunization as well as providing the service to the staff. In addition we could provide the same service, in cooperation with the Health Dept. To the community neighbors. We propose having a regular scheduled time for immunizations on the campus using the qualified medical staff. This could be coordinated with the Government Health Department
H 1,2 Major Disease Outbreak On-going Unified Government, KSSB Superintendent
Cost: Unknown Funds: FEMA Grant Completion Date: On-going
KSSB 4 Mass Notification for intruders, hazards, natural disasters, bomb and civil disorder events. This type of notification systems proves to be effective for deaf (visual notice) & for blind (audio) individuals.
H 1,2,4 All Hazards New School for the Blind Operations Director
Cost: $800,000 Funds: State, FEMA Completion Date: 5 year phased implementation
KSSB 5 All Hazard Staff & Student Evacuation Plan/Education.
1. Preparing staff and students for their role in all-hazard preparedness is paramount to the schools capability to respond to and recover from potential hazards.
2. Educating staff & students about safety, regulations, and alternative work site is another safety issue we could potentially face.
3. Continue to produce, update annually and
H 1,3,4 All Hazards New Crisis Management Team and Emergency Management Department
Cost: $185 for 20-40 handbooks Funds: In structural Operational Funding Completion Date: FY 2013 On-going

Region L Hazard Mitigation Plan, 2013 Final 4.146
distribute the Crisis Management Handbook. This is used in relation to local emergency response teams training as well as distributed to ?? groups and school associations.
4. Help continue to produce update inserts for the August 1st start of school all staff in-service.
Wyandotte County – Kansas City Kansas Community College Action ID Action/Description Priority Goal(s)
Addressed Hazard Addressed Status Responsible Entity Estimated Cost and funding Source
KCKCC 1 Control of groundwater runoff from KCKCC Campus. The campus of KCKCC acts as the “drain” for College Blvd from Parallel to the College’s east entrance. Also draining into this area is the Painted Hills Golf Course runoff and campus runoff from the north side of campus. All runoff water exits the campus on the south boundary, just north of State Avenue. Excessive runoff could impact traffic on State Avenue. The College has an extensive system of flood control, including 3 retention ponds. Areas of concern are the sediment build-up in drainage ditches, old concrete drains, and erosion at sharp corners of the drainage ditches. The College is dredging the ditch to the final retention pond to remove sediment. The sediment in other ditches is being removed, especially around riprap. Additional riprap is being installed at sharp angles in the ditches to reduce erosion. Drains along Campus Blvd are to be redone.
M 1,2 Flood On-going KCKCC Buildings and Grounds Department
Cost: $10,000 Funds: College Funds Completion Date: 8 months.
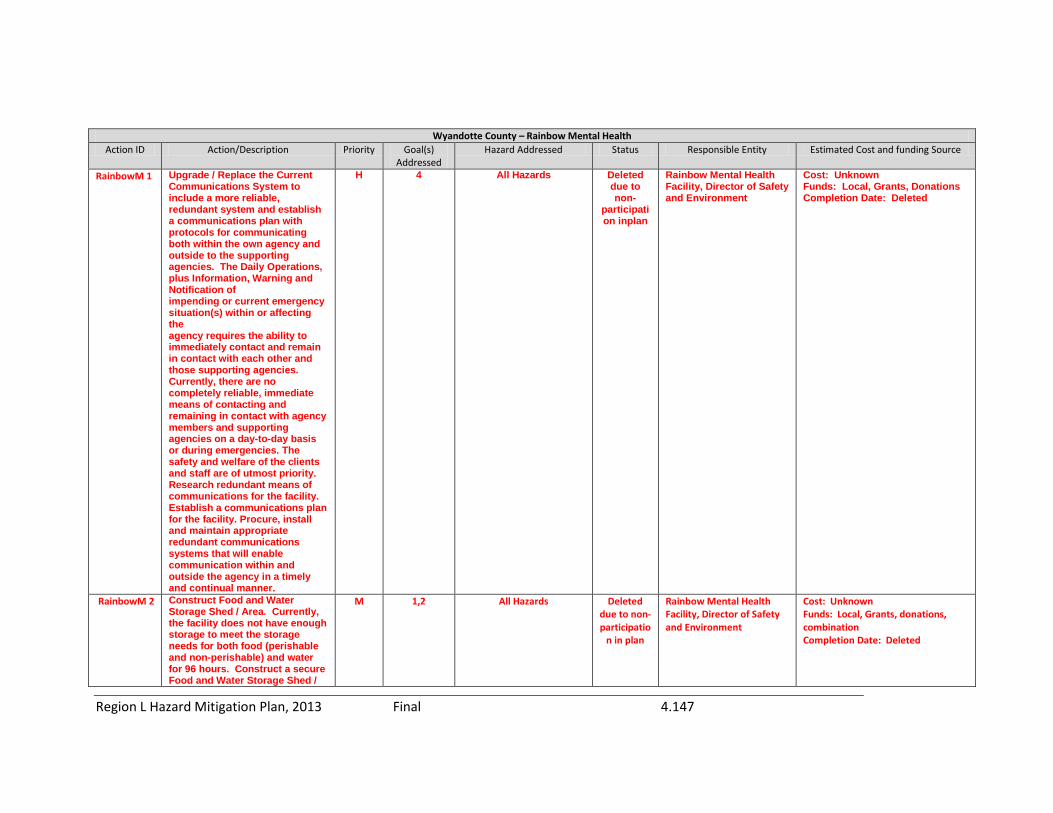
Region L Hazard Mitigation Plan, 2013 Final 4.147
Wyandotte County – Rainbow Mental Health Action ID Action/Description Priority Goal(s)
Addressed Hazard Addressed Status Responsible Entity Estimated Cost and funding Source
RainbowM 1 Upgrade / Replace the Current Communications System to include a more reliable, redundant system and establish a communications plan with protocols for communicating both within the own agency and outside to the supporting agencies. The Daily Operations, plus Information, Warning and Notification of impending or current emergency situation(s) within or affecting the agency requires the ability to immediately contact and remain in contact with each other and those supporting agencies. Currently, there are no completely reliable, immediate means of contacting and remaining in contact with agency members and supporting agencies on a day-to-day basis or during emergencies. The safety and welfare of the clients and staff are of utmost priority. Research redundant means of communications for the facility. Establish a communications plan for the facility. Procure, install and maintain appropriate redundant communications systems that will enable communication within and outside the agency in a timely and continual manner.
H 4 All Hazards Deleted due to non-
participation inplan
Rainbow Mental Health Facility, Director of Safety and Environment
Cost: Unknown Funds: Local, Grants, Donations Completion Date: Deleted
RainbowM 2 Construct Food and Water Storage Shed / Area. Currently, the facility does not have enough storage to meet the storage needs for both food (perishable and non-perishable) and water for 96 hours. Construct a secure Food and Water Storage Shed /
M 1,2 All Hazards Deleted due to non-participatio
n in plan
Rainbow Mental Health Facility, Director of Safety and Environment
Cost: Unknown Funds: Local, Grants, donations, combination Completion Date: Deleted

Region L Hazard Mitigation Plan, 2013 Final 4.148
Area with electricity to include heating, cooling and plumbing systems, an intrusion alarm system and adequate security lighting.
Wyandotte County – University of Kansas Hospital Action ID Action/Description Priority Goal(s)
Addressed Hazard Addressed Status Responsible Entity Estimated Cost and funding Source
KUHosp 1 Construct Saferoom as part of new office complex construction. KU Hospital has plans to construct a new office complex within the next 5 years. As part of that construction effort, the hospital will consider incorporating a tornado saferoom to accommodate patients and staff in that facility. As part of the construction planning, the hospital will determine the feasibility of incorporating the construction of a tornado saferoom in the design of the planned office complex. If determined feasible, the hospital will seek funding for the saferoom through FEMA’s Hazard Mitigation Grant Program
H 1,2 Windstorm, Tornado On-going University of Kansas Hospital
Cost: $120 sq ft @ 5 ft per person Funds: FEMA Completion Date: Unknown
Wyandotte County – University of Kansas Medical Center Action ID Action/Description Priority Goal(s)
Addressed Hazard Addressed Status Responsible Entity Estimated Cost and funding Source
KUMC 1 Public Education – Shelter Locations. This action is needed to educate faculty, staff and visitors of the shelter locations on campus. The University of Kansas Medical Center is a complex institution with many buildings built in close quarters to each other which can create confusion to visitors and
M 3 Windstorm, Winter Storm, Tornado
Completed University Office of Compliance and the Environment, Health & Safety Office
Cost: $50,000 Funds: Department Funds Completion Date: Completed
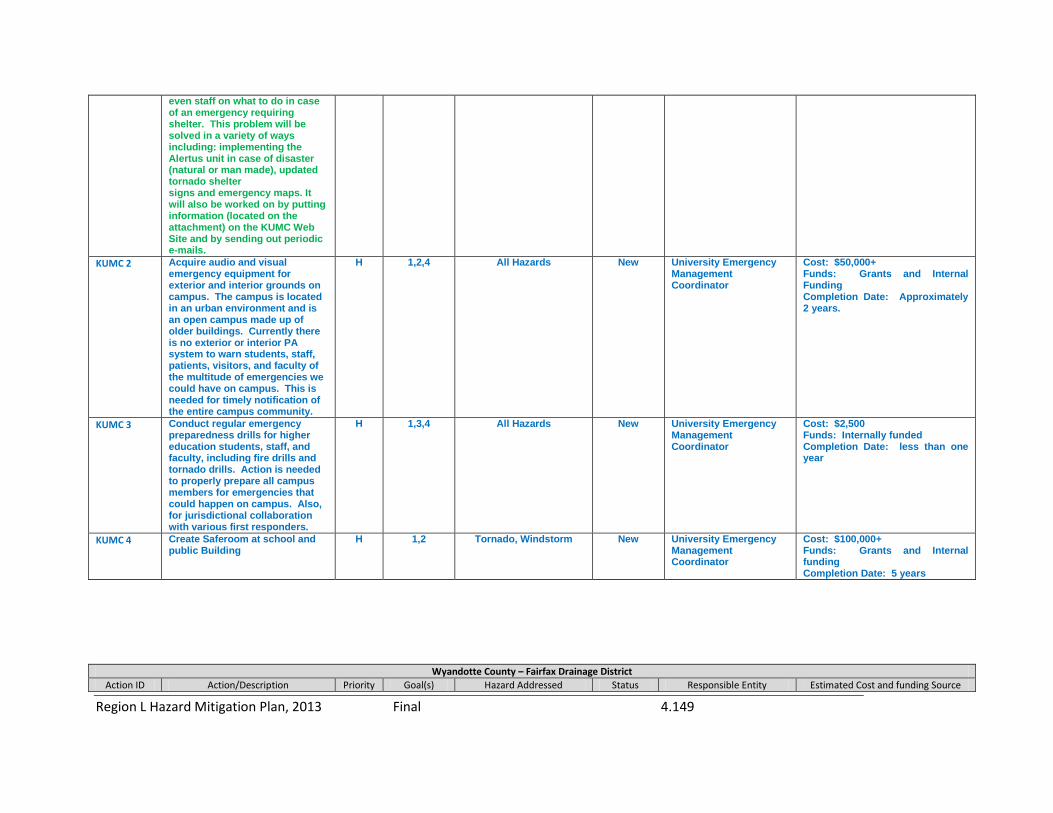
Region L Hazard Mitigation Plan, 2013 Final 4.149
even staff on what to do in case of an emergency requiring shelter. This problem will be solved in a variety of ways including: implementing the Alertus unit in case of disaster (natural or man made), updated tornado shelter signs and emergency maps. It will also be worked on by putting information (located on the attachment) on the KUMC Web Site and by sending out periodic e-mails.
KUMC 2 Acquire audio and visual emergency equipment for exterior and interior grounds on campus. The campus is located in an urban environment and is an open campus made up of older buildings. Currently there is no exterior or interior PA system to warn students, staff, patients, visitors, and faculty of the multitude of emergencies we could have on campus. This is needed for timely notification of the entire campus community.
H 1,2,4 All Hazards New University Emergency Management Coordinator
Cost: $50,000+ Funds: Grants and Internal Funding Completion Date: Approximately 2 years.
KUMC 3 Conduct regular emergency preparedness drills for higher education students, staff, and faculty, including fire drills and tornado drills. Action is needed to properly prepare all campus members for emergencies that could happen on campus. Also, for jurisdictional collaboration with various first responders.
H 1,3,4 All Hazards New University Emergency Management Coordinator
Cost: $2,500 Funds: Internally funded Completion Date: less than one year
KUMC 4 Create Saferoom at school and public Building
H 1,2 Tornado, Windstorm New University Emergency Management Coordinator
Cost: $100,000+ Funds: Grants and Internal funding Completion Date: 5 years
Wyandotte County – Fairfax Drainage District Action ID Action/Description Priority Goal(s) Hazard Addressed Status Responsible Entity Estimated Cost and funding Source

Region L Hazard Mitigation Plan, 2013 Final 4.150
Addressed FairfaxDD 1 Floodwall Improvements at the
Quindaro Power Plant owned by BPU. The US Corps of Engineers Feasibility Study completed in 2006 determined that the concrete floodwall protecting the BPU/ Quindaro Power Plant has a significant risk of failure when the Missouri River approaches the top of the floodwall. The problem can be solved by strengthening or replacing sections of the floodwall.
H 1,2 Flood, Dam & Levee On-going Fairfax Drainage District General Manager
Cost: $9million Funds: USACE, 65%, Local 35% Completion Date: 5 - 10 years
FairfaxDD 2 Financial Assistance in meeting FEMA requirements relating to levee 100-year certification. FEMA requires certification to be completed within two years of November 2010 Action is needed to insure continued participation in the National / Federal Flood Insurance Program. Partner with the Corps of Engineers to perform the study and data collection.
H 1,2 Flood, Dam & Levee Completed Fairfax Drainage District Cost: $500,000 Funds: Local, Federal Completion Date: Completed
Wyandotte County – Kaw Valley Drainage District Action ID Action/Description Priority Goal(s)
Addressed Hazard Addressed Status Responsible Entity Estimated Cost and funding Source
KVDD 1 Provide adequate communications & warning system(s) for Kaw Valley Drainage District (KVDD). No completely adequate communications and warning system(s) are currently available for KVDD. Effective, timely communications between KVDD personnel, first responders, emergency support personnel and the public are vital in the event of any type of emergency including flooding. Levees hold back and prevent the water from the Kansas and Missouri Rivers from damaging the homes and businesses behind them, causing millions of dollars worth of damage from potential flooding and possible preventing the loss of lives. Provide a radio
H 1,2,4 Flood, Dam and Levee On-going KVDD and County Emergency Management Department
Cost: Unknown Funds: FEMA, Local, combination Completion Date: unknown

Region L Hazard Mitigation Plan, 2013 Final 4.151
communications system for KVDD that will enable them to maintain constant communications with their own personnel, first responders, emergency management and other emergency support personnel as needed both during emergencies and on a regular day-to-day basis. Provide an adequate warning system(s) for KFCC that will enable them to quickly and properly warn personnel during impending dangers or emergencies.
KVDD 2 Place/Re-Place Riprap along the slopes of the levees. Levees are subject to potential erosive forces if left unprotected or only partially protected. A portion of the KVDD levees need an additional build-up with Rock Riprap to help prevent erosion. These levees hold back and prevent the water from the Kansas/Missouri Rivers from damaging the homes and businesses behind them causing millions of dollars worth of damage from potential flooding and possible preventing the loss of lives. Place/Re-Place Rock Riprap along the slopes of the Kaw Valley Drainage District’s levees to protect them from erosive forces.
H 1,2 Flood, Dam and Levee On-going Kaw Valley Drainage District Cost: $18 million Funds: FEMA, Local, combination Completion Date 2 years
KVDD 3 Raise the top of the levees 4 – 5’ in order to meet the requirements for the 500-year flood event. An overtopping of the Levees by river waters during a 500-year flood event could result in catastrophic losses in personnel, property and economically. These levees hold back and prevent the water from the Kansas/Missouri Rivers from damaging the homes and businesses behind them causing millions of dollars worth of damage from potential flooding and possible preventing the loss of lives. Raise the top of the Levees 4-5’ feet in order to meet the requirements for the 500-year flood event.
H 1,2 Flood, Dam and Levee On-going Kaw Valley Drainage District Cost: $250 million Funds: FEMA, Local, Combination Completion Date: 10 years
KVDD 4 Financial Assistance in meeting FEMA requirements relating to
H 1,2 Flood, Dam and Levee On-going Kaw Valley Drainage District Cost: $1.3 million total

Region L Hazard Mitigation Plan, 2013 Final 4.152
levee 100-year certification. FEMA required certification to be completed within two years of November 2010. Action is needed to insure Federal Flood Insurance Program. Partner with Corps of Engineers to perform the study and data collection.
Funds: Federal, Local Completion Date: 2 years
Wyandotte County – WaterOne Action ID Action/Description Priority Goal(s)
Addressed Hazard Addressed Status Responsible Entity Estimated Cost and funding Source
WaterOne 1 Remote Monitoring of Fire/Smoke Alarms at WaterOne Unmanned Facilities. WaterOne has 13 unmanned facilities. Within each facility is electrical and pumping equipment necessary to deliver water to WaterOne customers. Each facility contains a fire and smoke detection system with local alarms. In the event of a fire, no notice would come through the SCADA system to the manned control room. The first notice would be from equipment failures alarming on SCADA or from observation by personnel that are occasionally on-site. Incorporate instrumentation into the smoke/fire alarm systems at each unmanned facility to send signals back to SCADA.
M 1,2,4 Wildfire Deleted due to non-
participation
WaterOne Cost: Unknown Funds: Unknown Completion Date: Deleted
Wyandotte County – Private Non-Profits Action ID Action/Description Priority Goal(s)
Addressed Hazard Addressed Status Responsible Entity Estimated Cost and funding Source
BSA 1 Shelter during Weather Events Provide adequate & accessible sheltering areas for Scouts, Scouters and campers at Boy Scout Camp Theodore Naish, BSA. No completely adequate
H 1,2 Hailstorm, Lightning, Tornado, Windstorm,
Winter Storm
completed Wyandotte county Emergency Management Department
Cost: $700,000 Funds: Grant, In-kind, Contributions Completion Date: Completed

Region L Hazard Mitigation Plan, 2013 Final 4.153
sheltering areas are currently available for campers and staff at Camp Theodore Naish, BSA. Camp Naish conducts year-round camping with the heaviest number of campers on-site during the summer months, mainly late May thru early August. Camping also occurs throughout the year. Provide adequate FEMA approved sheltering (per FEMA 361 guidance) for each populated area (campsites & main areas) of camp to ensure all Scouts / Scouters / campers are within easy access of a shelter when sheltering is required.
BSA 2 Provide adequate communications system(s) for Scouts, Scouters and campers at Boy Scout Camp Theodore Naish, BSA. No completely adequate communications system(s) are currently available for campers, leaders and staff at Camp Naish. • Camp Naish conducts year-round camping with the heaviest number of campers on-site during the summer months, mainly late May thru early August. Camping also occurs throughout the year. Provide better communications equipment to ensure the camp has contact with local government public safety entities and with each other throughout the camp.
High 4 All Hazards Deleted from
Wyandotte Co.
Moved to BSA1 –
NEW
Wyandotte County Emergency Management Director
Cost: Unknown Funds: Grant funding with in-kind match, contributions of local material, manpower & monetary resources. Completion Date: Unknown
LakeForest 1 Develop a plan to cover all aspects of a flood making the entrance road to Lake of the forest unusable. With only one road leading both into and out of Lake of the Forest emergency vehicles would be prevented from helping residents in case of fire or medical situations. Permission for emergency use could be obtained from a neighbour whose property adjoins Lake of the
H 1,2 Flood On-going President, Lake Forest Community
Cost: Negligible Funds: None Completion Date: 6 months

Region L Hazard Mitigation Plan, 2013 Final 4.154
Forest on the East side of the maintenance yard. A clear path through the Lake’s maintenance area should always be available. Lake Forest should have a boat and motor available to evacuate people if the need should arise. A list of residents with phone numbers who are trained in CPR and other medical areas could be maintained.
LakeForest 2 Develop a plan to assist residents after a tornado. It is unlikely only one home would be damaged so many people could need temporary accommodations. It is probable everyone at Lake Forest including the public buildings would be without utilities. Roads would need to be cleared. A list of residents with phone numbers who are trained in CPR and other medical areas could be maintained. Lake Forest could purchase a portable generator that would be capable of providing electricity to the Clubhouse.
M 1,2 Tornado, Windstorm On-going President, Lake Forest Cost: Cost of a portable generator Funds: Lake Forest General Operating Budget Completion Date: 6 months
Providence 1 Develop Vaccination Strategy. Healthcare workers are necessary to the care and recovery of those affected. A hospital mass prophylaxis plan is in place and is currently being reviewed
H 1,2 Major Disease Outbreak On-going, Open Ended
County, Manager Infection Control Director, Health Department, Administrator
Cost: TBD Funds: MMRS, and the SNS Completion Date: Continuous
WyHC 1 Ability to continue to provide outpatient Mental Health services to current consumers, as well as provide services to those affected
M 1, 2, All Hazards New Community Mental Health Center Director
TBD
Goal 1: Reduce or eliminate risk to the people and property of Region L from the impacts of the identified hazards in this plan. Goal 2: Strive to protect all of the vulnerable populations, structures, and critical facilities in Region L from the impacts of the identified hazards. Goal 3: Improve public outreach initiatives to include education, awareness and partnerships with all entities in order to enhance understanding of the risk the Region faces due to the impacts of the identified hazards.

Region L Hazard Mitigation Plan, 2013 Final 4.155
Goal 4: Enhance communication and cooperation among all agencies and between agencies and the public.
Region L Hazard Mitigation Plan, 2013 Final 5.1
5 Plan Maintenance Process
Requirement §201.6(c)(4)(i): [The plan maintenance process shall include a] section describing the method and schedule of monitoring, evaluating, and updating the mitigation plan within a five-year cycle.
5.1 Plan Monitoring and Evaluation
The Region L Mitigation Plan, consisting of Johnson, Leavenworth, and Wyandotte Counties, will be monitored and evaluated on a quarterly basis, beginning in the quarter following approval and adoption. These meetings will consist of information gathering on any changes that are critical to the plan, along with the updating of existing action items. Staying current and monitoring any changes that affect the plan is paramount to the success of the plan. By initiating quarterly reviews and evaluations, the planning committee will stimulate conversation on each jurisdictions wants, needs, and status.
The monitoring and evaluation of the Regional Plan will be facilitated through the Kansas Division of Emergency Management Planning Section and will consist of a variety of methods to engage the members of the community – public and private. Some of these methods consist of:
1. Surveys to all participating jurisdictions for information regarding any significant changes that have been noted since the last plan update.
2. Meeting(s) of the Regional Hazard Mitigation Planning Committee will be convened to discuss the survey feedback, any changes in the regions risks, and action updates.
3. The Kansas Division of Emergency Management will write and submit an annual report to be included as an addendum to the current plan, and the quarterly reports will be filed by the Emergency Management committee that holds the quarterly meeting. These meetings will be held in conjunction with the applicable KEMA meetings, the LEPC, and/or any public forums that consists of members of the planning committee.
5.2 Plan Updating
FEMA requires that a multi-jurisdictional hazard mitigation plan be updated and approved every five years. This five year period begins with the date by FEMA of the first adoption resolution submitted for a plan.
With the approval and adoption of the current plan in 2014, the Region L Hazard Mitigation Plan will be scheduled for updating and approval by FEMA in the year 2019.
The quarterly maintenance and evaluation of the plan will set the stage for the five year update. This will also enable any changes in personnel involved in the planning committee

Region L Hazard Mitigation Plan, 2013 Final 5.2
to be kept apprised of the process and to be aware of any changes or updates that will enable them to be a viable and informed partner.
The system that will store the plan, the Super System, will enable the plan updates to be seamless and kept current. This is particularly important to the updating of the mitigation actions.
Data gaps in the current plan will be addressed during the yearly maintenance scheduled meetings. A few of these gaps are:
Rankings – a plausible ranking system that takes the place of the STAPLEE criteria as it pertains to the actions each jurisdiction has put forward. Each jurisdiction ranks them as a high, medium, or low depending on what their mission is. It can only benefit the whole community to ensure everyone is on the same page.
Maps – Maps are a critical component of the mitigation plan as it enables the reader to visualize the story the plan writer is telling. While each county within the Region has a GIS department, as does KDEM, maps were a struggle to obtain during this plan update. By addressing this issue well ahead of time the planning committee should have a seamless process for the acquisition of maps.
5.3 Incorporation of Mitigation Plan Into Other Planning Mechanisms
Requirement §201.6(c)(4)(ii): A process by which local governments incorporate the requirements of the mitigation plan into other planning mechanisms such as comprehensive or capital improvement plans, when appropriate.
All participating jurisdictions will strive to implement actions that minimize loss of life and property damage from hazards as to their current capabilities. Whenever possible, participating jurisdictions will use existing plans, policies, procedures and programs to aid in the implementation of identified hazard mitigation actions. Potential avenues for implementation may include:
• Operation plans
• General or master plans
• Ordinances
• Capital improvement plans
• Budget revisions or adoptions
• Hiring of staff
• Stormwater planning

Region L Hazard Mitigation Plan, 2013 Final 5.3
• Land use planning
The governing bodies of the jurisdictions adopting this plan will encourage all other relevant planning mechanisms under their authority to consult this plan to ensure minimization of risk to natural hazards as well as coordination of activities.
5.4 Incorporating Available Plans, Studies, Reports, and Maps
Mitigation planning draws upon existing information about a jurisdiction, in the form of studies, reports, maps, plans, and ordinances. The following is a brief description of the types of usable studies, reports, maps, plans, and ordinances that were incorporated into this plan for Region L.
Comprehensive Plan
A comprehensive plan establishes the overall vision for a jurisdiction and serves as a guide to governmental decision making. A comprehensive plan generally contains information on demographics, land use, transportation, and facilities. As a comprehensive plan is broad in scope the integration of hazard mitigation measures can enhance the likelihood of achieving risk reduction goals.
Capital Improvement Plan
A capital improvement plan guides scheduling of, and spending on, public improvements. A capital improvement plan can guide future development away from identified hazard areas, an effective mitigation strategy.
Emergency Operations Plan
An emergency operations plan outlines responsibilities, means and methods by which resources are deployed during and following an emergency or disaster.
Recovery Plan
A disaster recovery plan guides the recovery and reconstruction process following a disaster. Hazard mitigation principles should be incorporated into disaster recovery plans to assist in breaking the cycle of disaster loss.
Debris Management Plan
A debris management plan covers the response and recovery from debris-causing incidents such as tornados or floods. Planning considerations include debris removal and disposal, disposal locations, equipment availability, and personnel training.
Economic Development Plan

Region L Hazard Mitigation Plan, 2013 Final 5.4
An economic development plan assists in advancing a strong and sustainable economy over the long term. This plan provides strategies, programs, and policies that will foster the jurisdictions business climate.
Transportation Plan
A transportation plan aids with the evaluation, review, design and locating of transportationinfrastructure, including streets, highways, public transport lines, and transportation centers.
Land Use Plan
Land-use planning is used to regulate land use in an efficient and equitable manner, and to assist jurisdictions in managing the development of land within their boundaries.
Flood Mitigation Assistance Plan
The purpose of the flood mitigation assistance plan is to reduce or eliminate the long-term risk of flood damage to buildings and other structures insured under the National Flood Insurance Program.
Watershed Management Plan
A watershed management plan is used to provide assessment and management information for a geographically defined watershed.
Fire Mitigation Plan
A fire mitigation plan is used to mitigate a jurisdictions wildfire risk and vulnerability In The plan documents areas with an elevated risk of wildfires, and identifies the actions taken to decrease the risk.
Critical Facilities Plan
A critical facilities plan is used to identify a jurisdictions critical facilities, including fire stations, police stations, hospitals, schools, day care centers, senior care facilities, major roads and bridges, critical utility sites, and hazardous material storage areas. Additionally, this plan is used to determine methods to mitigate damage to these facilities.
Zoning
Zoning is the traditional and most common tool available to local jurisdictions to control the use of land. State of Kansas statutes grant municipalities and counties authority to engage in zoning for land use. Counties may also regulate inside municipal jurisdiction at the request of a municipality. Zoning is used to promote health, safety, and the general welfare of the community. Zoning is used to dictate the type of land use and to set minimum specifications for use such as lot size, building height and setbacks, and density of

Region L Hazard Mitigation Plan, 2013 Final 5.5
population. Local governments are authorized to divide their jurisdiction into districts, and to regulate and restrict the erection, construction, reconstruction, alteration, repair or use of buildings, structures, or land within those districts. Districts may include general use districts, overlay districts, special use districts or conditional use districts. Zoning ordinances consist of maps and written text.
Building Code
Many structural mitigation measures involve constructing and retrofitting homes, businesses and other structures according to standards designed to make the buildings more resilient to the impacts of natural hazards. Many of these standards are imposed through the building code. Kansas does not have state mandatory building codes. However, municipalities and counties may adopt codes for their respective areas if approved by the state as providing "adequate minimum standards." Local governments in Kansas are also empowered to carry out building inspections, and may empower cities and counties to create an inspection department to enforce construction codes and ordinances.
Floodplain Ordinance
In 1992 the Kansas General Assembly approved legislation for floodplain management (Kansas Statutes Annotated 12-766, “Floodplain Management”) authorizing the Department of Agriculture, Division of Water Resources as the primary department to oversee and approve local zoning regulation. The regulation requires planning and approval to prevent inappropriate development in the one hundred-year floodplain and to reduce flood hazards. The purpose of the law is to:
Minimize the extent of floods by preventing obstructions that inhibit water flow and increase flood height and damage
Prevent and minimize loss of life, injuries, and property damage in flood hazard areas
Promote the public health, safety and welfare of citizens of Kansas in flood hazard areas. The statute affects local governments by directing, them to:
Manage planned growth
Adopt local ordinances to regulate uses in flood hazard areas
Enforce those ordinances
Grant permits for use in flood hazard areas that are consistent with the ordinance
The act also makes certain that local ordinances meet the minimum requirements of participation in the NFIP. The incentive for local governments adopting such ordinances is that they will afford their residents the ability to purchase flood insurance through the NFIP. In addition, communities with such ordinances in place will be given priority in the
Region L Hazard Mitigation Plan, 2013 Final 5.6
consideration of applications for loans and grants from the Clean Water Revolving Loan and Grant Fund.
Subdivision Ordinance
Subdivision regulations control the division of land into parcels for the purpose of building development or sale. Flood-related subdivision controls typically require that sub-dividers install adequate drainage facilities and design water and sewer systems to minimize flood damage and contamination. They prohibit the subdivision of land subject to flooding unless flood hazards are overcome through filling or other measures, and they prohibit filling of floodway areas. Subdivision regulations require that subdivision plans be approved prior to the division and/or sale of land. Subdivision regulations are a more limited tool than zoning and only indirectly affect the type of use made of land and the specifications for structures on that land.
Broad subdivision control authority resides with the county for areas outside of municipalities and municipal extra-territorial planning jurisdictions. Subdivision is defined as all divisions of a tract or parcel of land divided into two or more lots and all divisions involving new streets.
Tree Trimming Ordinance
These ordinances may place requirements for the removal, pruning, planting, and other tree work depending upon whether the tree is in the public right-of-way or on a private lot as well as tree size or species, and property zoning.
Stormwater Ordinance
The purpose of a stormwater ordinance is to protect the quality and quantity of local, regional and state waters from the potential harm of unmanaged stormwater. Stormwater ordinances include protection from activities that result in the degradation of properties, water quality, stream channels, and other natural resources.
Drainage Ordinance
The purpose of a drainage ordinance is to improve storm sewer systems for the management and control of storm water runoff to prevent polluted waters from entering the water supply and other receiving waters.
Site Plan Review Ordinance
The purpose of a site plan review ordinance is to ensure orderly growth, and to minimize the adverse effects growth that could be caused by the development of commercial, industrial, retail or institutional structures.
Landscape Ordinance

Region L Hazard Mitigation Plan, 2013 Final 5.7
A landscape ordinance generally provides rules and procedures for the protection and maintenance of vegetation and landscaping.
Wetlands/Riparian Areas Conservation Plan
The purpose of a Wetlands/Riparian Areas Conservation Plan is to preserve and protect wetlands, water resources, and adjacent upland areas.
Hazard Awareness Program
A program designed to inform citizens as to the nature and extent of local and regional natural and manmade hazards.
National Flood Insurance Program
In 1968, Congress created the NFIP to help provide a means for property owners to financially protect themselves. The NFIP offers flood insurance to homeowners, renters, and business owners if their community participates in the NFIP. Participating communities agree to adopt and enforce ordinances that meet or exceed FEMA requirements to reduce the risk of flooding.
Community Rating System program under the National Flood Insurance Program
The NFIP's Community Rating System (CRS) is a voluntary incentive program that recognizes and encourages community floodplain management activities that exceed the minimum NFIP requirements. Participants are offered flood insurance premium rates at a discount to reflect the reduced flood risk resulting from the community actions meeting the three goals of the CRS. These goals are the reduction of flood damage to insurable property, the strengthening and support of insurance aspects of the NFIP, and the encouragement of a comprehensive approach to floodplain management.
Firewise Community Certification
The Firewise Communities Program encourages local solutions for safety by involving homeowners in taking individual responsibility for preparing their homes from the risk of wildfire. Firewise is a key component of Fire Adapted Communities, a collaborative approach that connects all those who play a role in wildfire education, planning and action with comprehensive resources to help reduce risk. The program is co-sponsored by the USDA Forest Service, the US Department of the Interior, and the National Association of State Foresters.
Building Code Effectiveness Grading
The Building Code Effectiveness Grading Schedule assesses the building codes in effect and how the community enforces its building codes, with special emphasis on mitigation of losses from natural hazards.

Region L Hazard Mitigation Plan, 2013 Final 5.8
ISO Fire Rating
ISO’s Fire Rating gauges the fire protection capability of the local fire department to respond to fires.
Land Use Program
A Land Use Program is designed with the goal of balancing environmental protection with economic development. This program, coupled with various other planning efforts, provides resources to local leaders to establish policies to guide the development of the community, including annexation, expansion, and building.
Public Education/Awareness
Education programs for the public that provide education and awareness about hazards, hazard planning and mitigation efforts.
Stream Maintenance Program
Programs designed to keep streams free from debris and blockages to prevent or minimize flooding.
Engineering Studies for Streams (Local/County/Regional)
Studies that detail information concerning flow data, potential trouble spots, and improvement recommendations for streams.
Mutual Aid Agreements
Mutual Aid Agreements are understanding among localities to lend assistance across jurisdictional boundaries. This may occur due to an emergency response that exceeds local resources, such as a disaster. Mutual aid may be requested only when such an emergency occurs. Or may be a formal standing agreement on a continuing basis.
Hazard Analysis/Risk Assessment
A hazard analysis is the identification of different type of hazards that may affect a jurisdiction. A risk assessment is the determination of quantitative or qualitative value of risk related to a situation and a recognized hazard.
Evacuation Route Map
A map detailing the evacuation routes for a jurisdiction, often incorporating road, services, and travel time information.
Critical Facilities Inventory

Region L Hazard Mitigation Plan, 2013 Final 5.9
A list of all critical facilities within a jurisdictions, which may include fire stations, police stations, hospitals, schools, day care centers, senior care facilities, major roads and bridges, critical utility sites, and hazardous material storage areas.
Vulnerable Population Inventory
A vulnerable population inventory may include members of the jurisdictions population who are elderly, limited in functional capacity, homeless, or have limited financial means. These populations may be poorly equipped with the resources and capabilities necessary to prepare for, and respond to, disasters without additional assistance.
Land Use Map
A jurisdictional map detailing current land uses.
5.5 Public Participation in Plan Maintenance
Requirement §201.6(c)(4)(iii): [The plan maintenance process shall include a] discussion on how the community will continue public participation in the plan maintenance process.
The Regional Hazard Mitigation Plan for Region L will be made available to the public via each county website, in order to ensure the public has a review and comment forum. Should any interested groups within the county desire a presentation of the plan than the Kansas Division of Emergency Management will facilitate the meeting either with the cooperation of the county the interested party resides in, or as a lone entity. Some of these interested parties could include: School Districts, Local Emergency Planning Committees, City Officials, or any other public venue that desires knowledge of the plan.

Region L Hazard Mitigation Plan, 2013 Final
Appendix A: Signed Resolutions
Model Resolution Resolution # ______ Adopting the Region L Multi-Hazard Mitigation Plan Whereas, the (Name of Government/District/Organization seeking FEMA approval of hazard mitigation plan) recognizes the threat that natural hazards pose to people and property within our community; and Whereas, undertaking hazard mitigation actions will reduce the potential for harm to people and property from future hazard occurrences; and Whereas, the U.S. Congress passed the Disaster Mitigation Act of 2000 (“Disaster Mitigation Act”) emphasizing the need for pre-disaster mitigation of potential hazards; Whereas, the Disaster Mitigation Act made available hazard mitigation grants to state and local governments; and Whereas, an adopted Multi-Hazard Mitigation Plan is required as a condition of future funding for mitigation projects under multiple FEMA pre- and post-disaster mitigation grant programs; and Whereas, the (Name of Government/District/Organization) fully participated in the FEMAprescribed mitigation planning process to prepare this Multi-Hazard Mitigation Plan; and Whereas, the Kansas Division of Emergency Management and the Federal Emergency Management Agency Region VII officials have reviewed the “Region L Multi-Hazard Mitigation Plan,” and approved it contingent upon this official adoption of the participating governing body; and Whereas, the (Name of Government/District/Organization) desires to comply with the requirements of the Disaster Mitigation Act and to augment its emergency planning efforts by formally adopting the Region L Multi-Hazard Mitigation Plan; and Whereas, adoption by the governing body for the (Name of Government/District/Organization) demonstrates the jurisdictions’ commitment to fulfilling the mitigation goals and objectives outlined in this Multi-Hazard Mitigation Plan. Whereas, adoption of this legitimizes the plan and authorizes responsible agencies to carry out their responsibilities under the plan; Now, therefore, be it resolved, that the (Name of Government/District/Organization) adopts the “Region L-Hazard Mitigation Plan” as an official plan; and

Region L Hazard Mitigation Plan, 2013 Final
Be it further resolved, the (Name of Government/District/Organization) will submit this Adoption Resolution to the Kansas Division of Emergency Management and Federal Emergency Management Agency Region VII officials to enable the plan’s final approval. Passed: ___________ __________ _______
Certifying Official


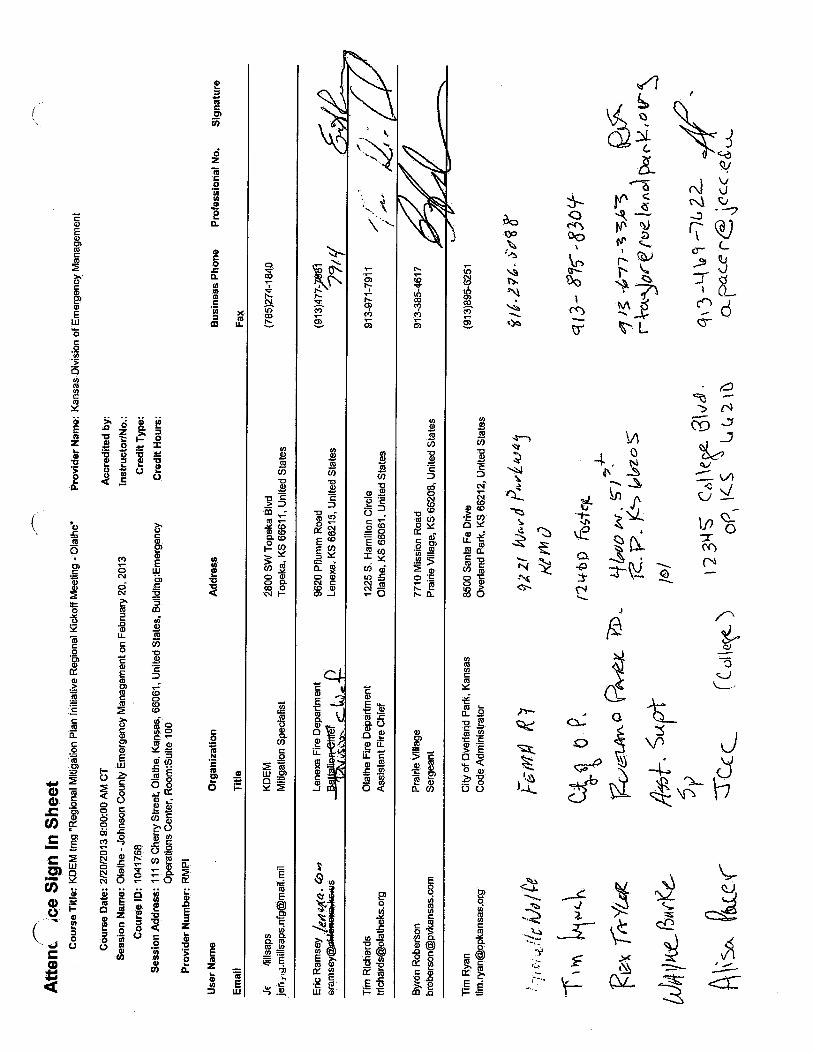


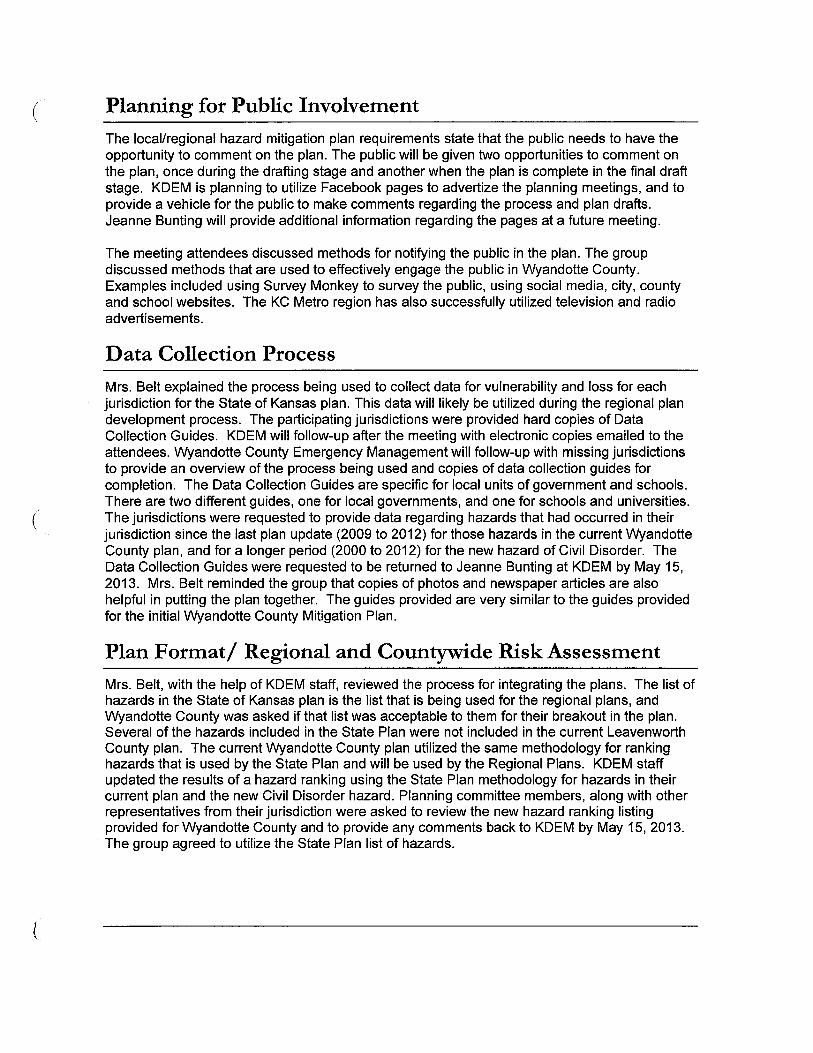


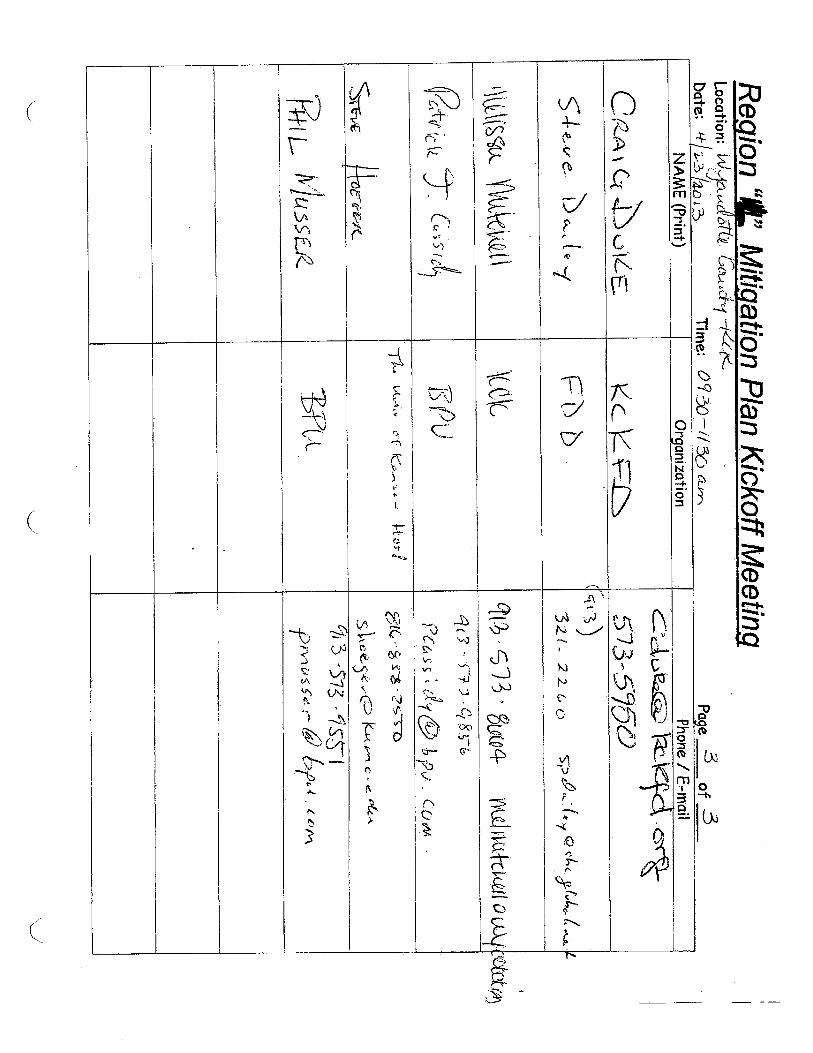

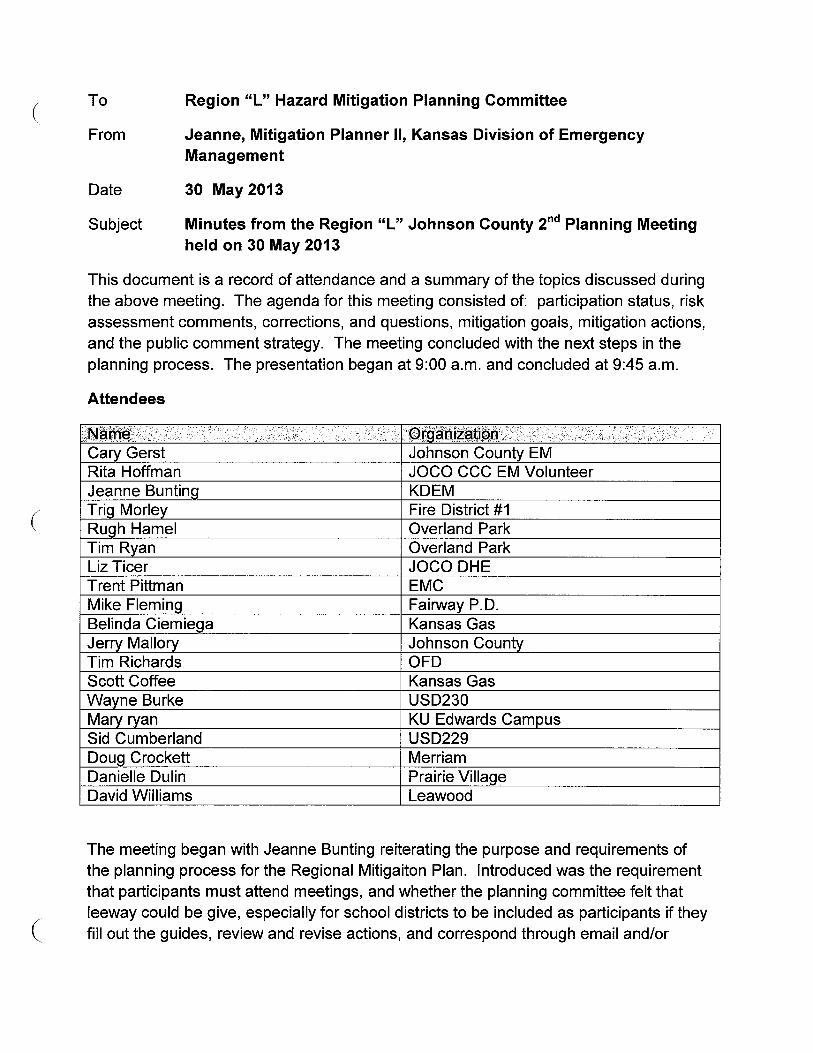


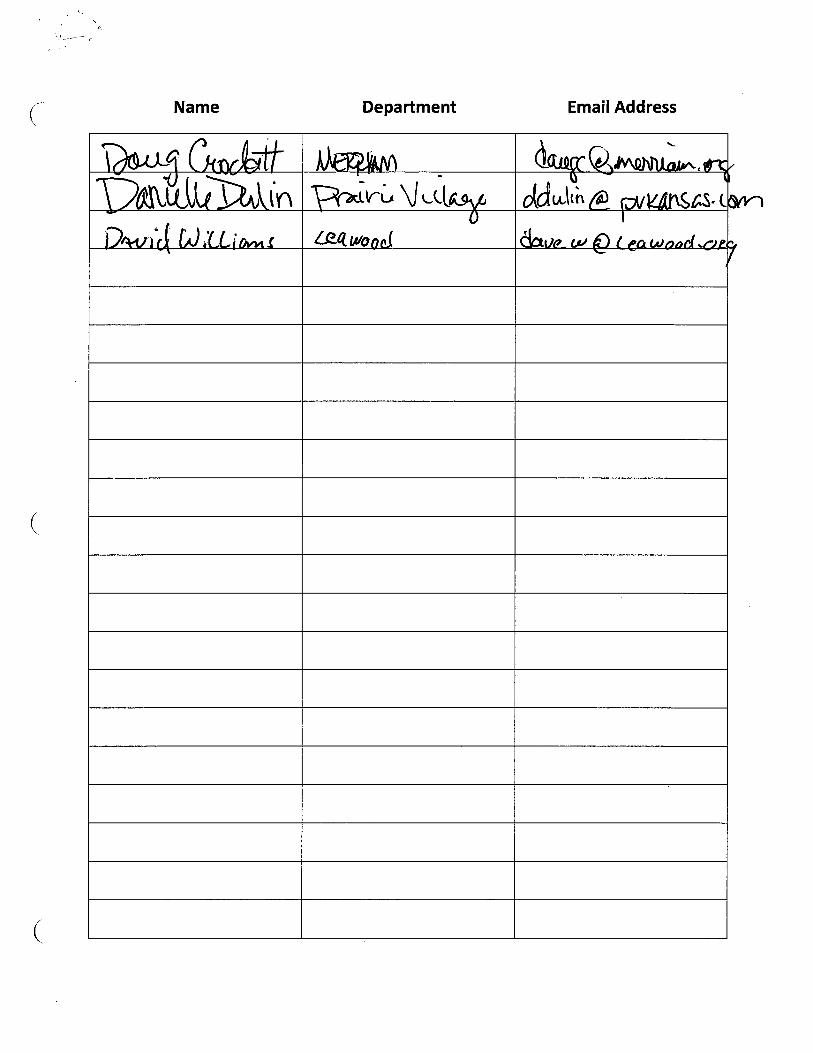
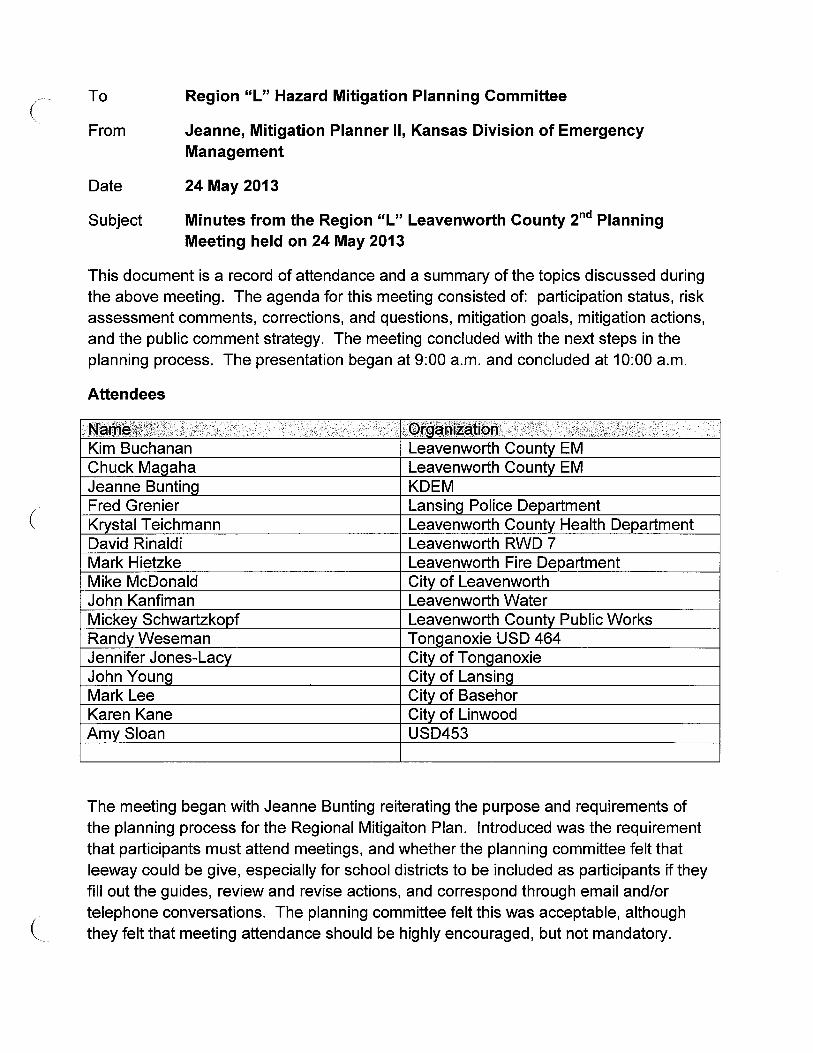

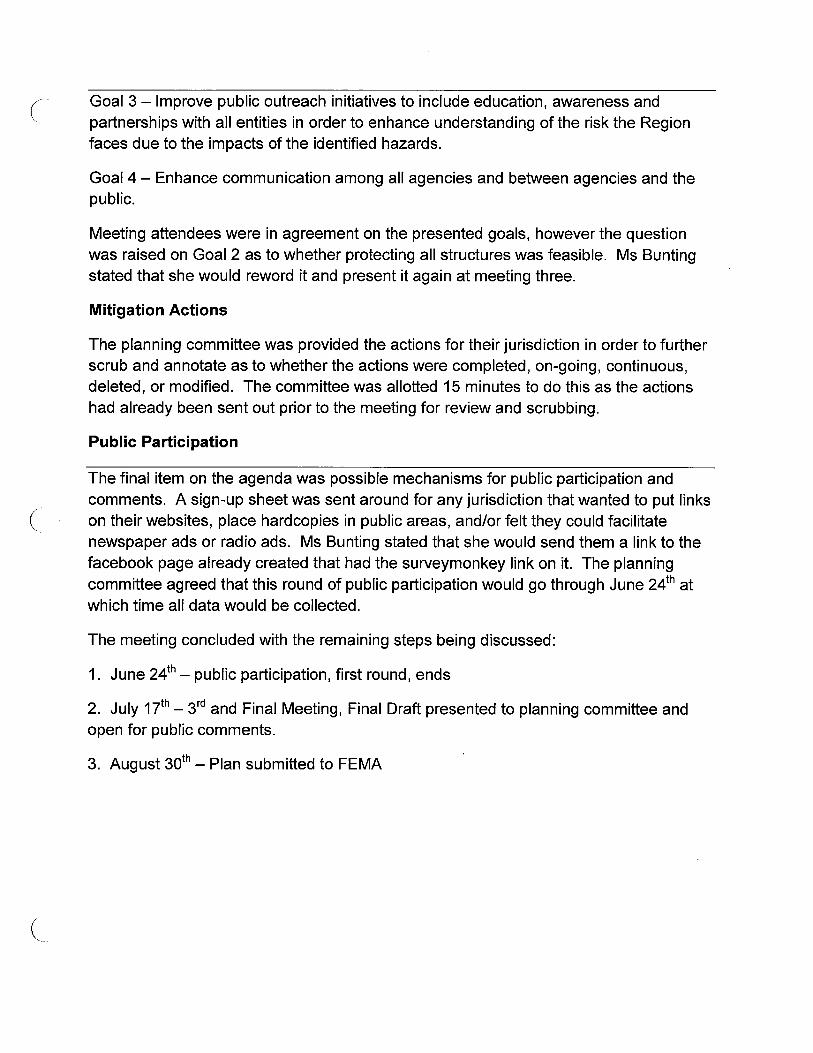


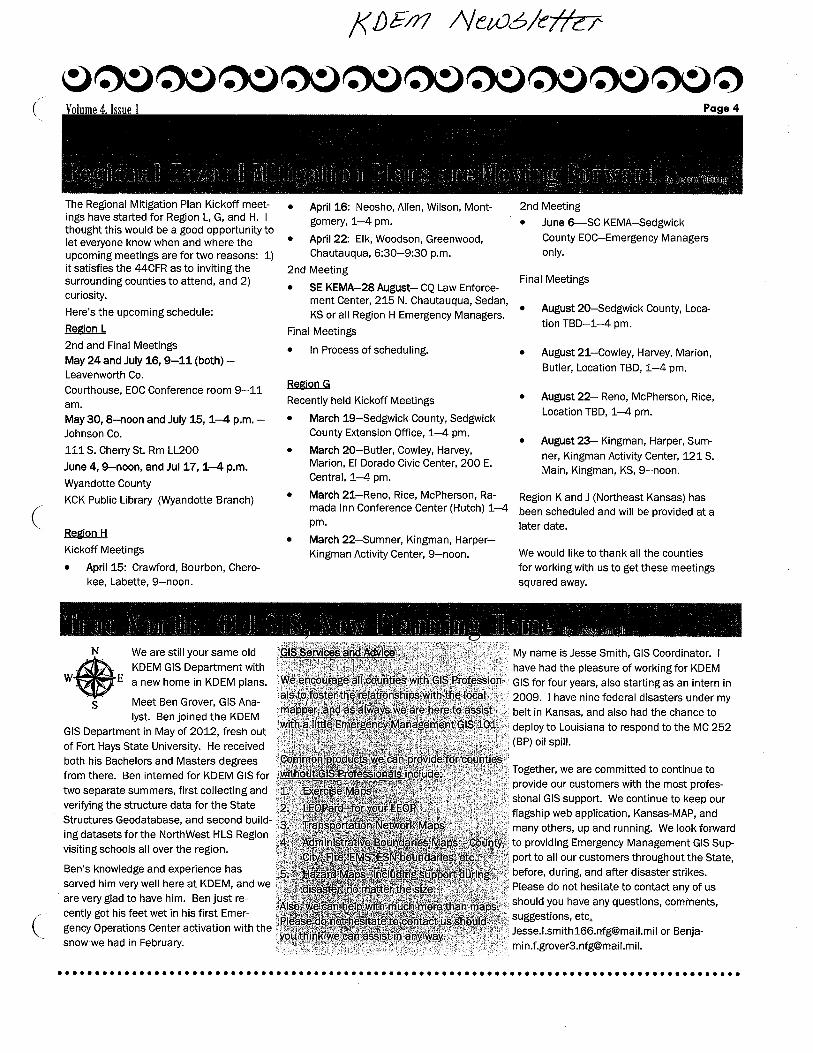


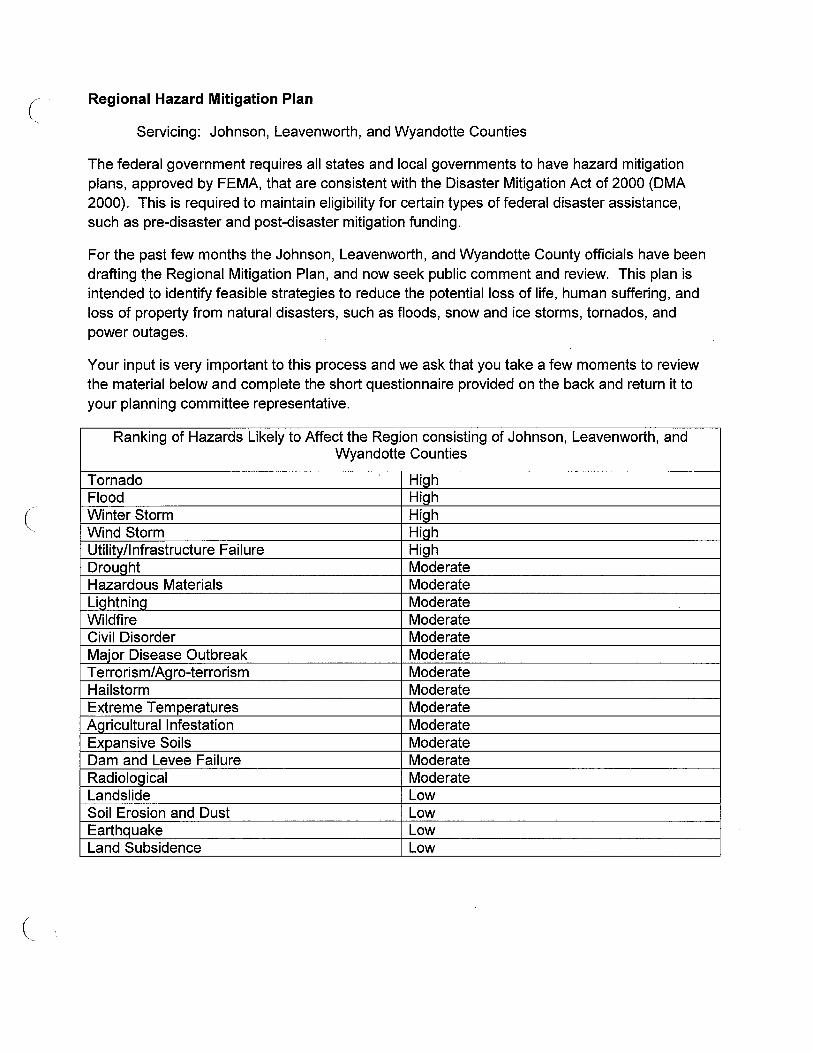


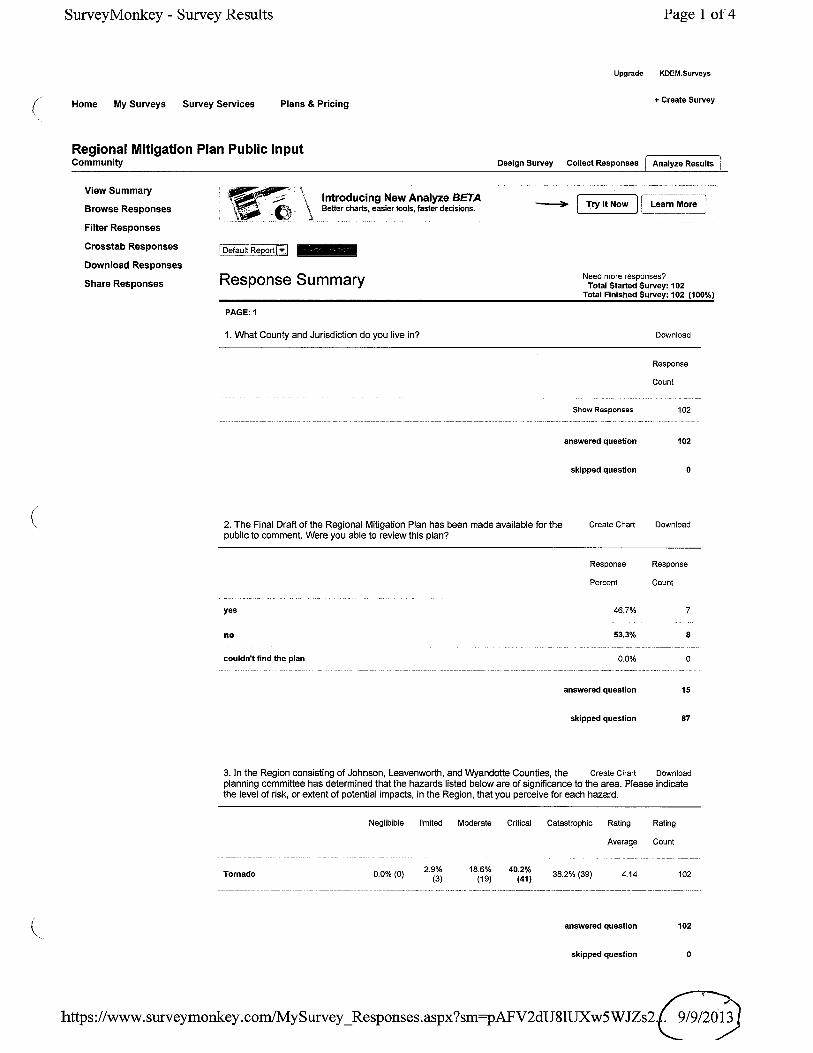
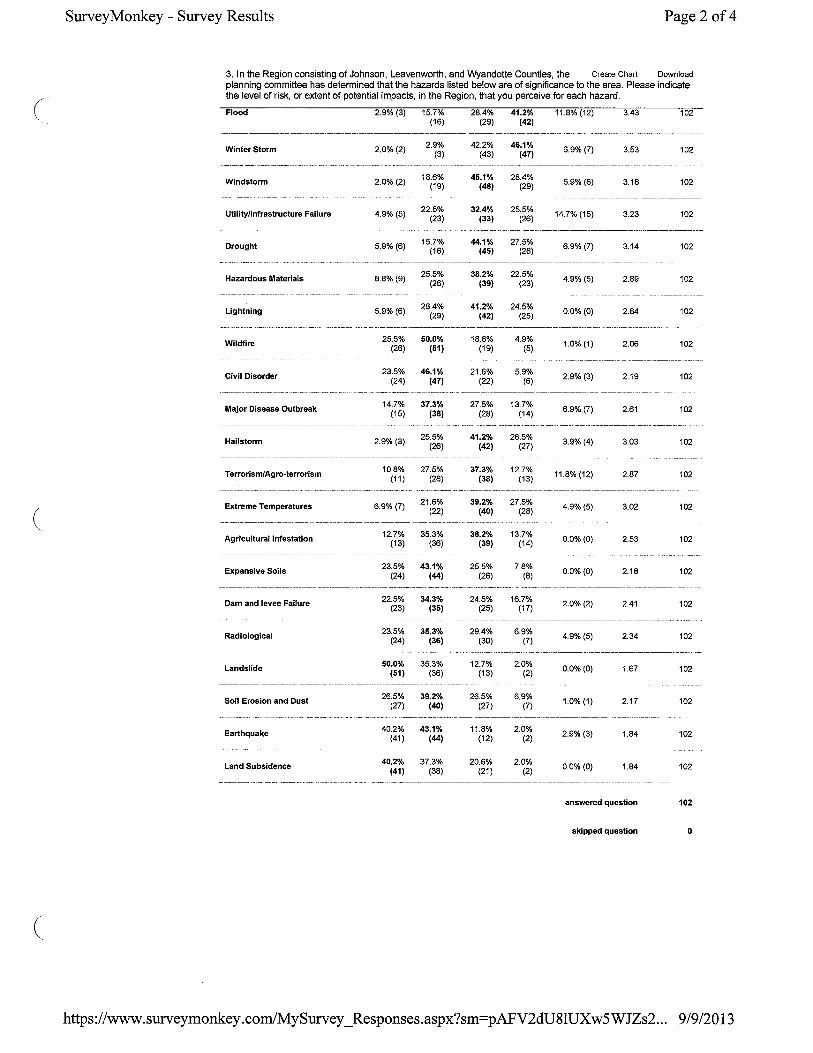
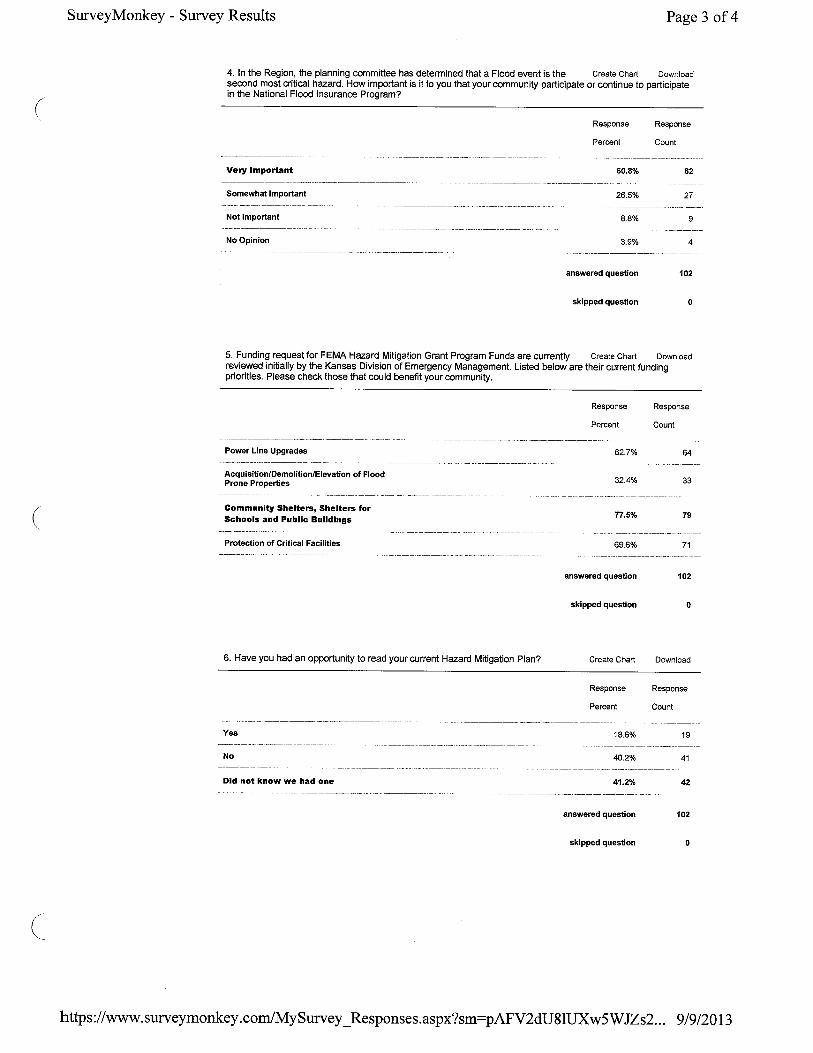


Region L Hazard Mitigation Plan, 2013 Final
Appendix C
Critical Facilities (SECURE APPENDIX – NOT RELEASABLE TO THE PUBLIC) Critical facilities are essential in providing utility or direction during the response to an emergency or during the recovery operation. The information below is the inventory of critical facilities in Johnson, Leavenworth, and Wyandotte Counties. Wherever possible the information has been indicated in a GIS format. All information was gathered via GIS, Kansas Division of Emergency Management, Johnson, Leavenworth, and Wyandotte Counties, participants of the plan, and prior plans.

Region L Hazard Mitigation Plan, 2013 Final
Region L: Transportation Routes:

Region L Hazard Mitigation Plan, 2013 Final
Region L: Pipelines

Region L Hazard Mitigation Plan, 2013 Final
Johnson County Critical Facilities FACILITY NAME ADDRESS CITY SUBSTANCE Fire Station De Soto, Stn 1 33150 W 83RD ST De Soto
Fire Station Dist 3, Stn 1 9745 KILL CREEK RD De Soto Nursing Home Hillside Village of De Soto 33600 W 85th St De Soto School De Soto High 35000 W 91st St De Soto School Starside Elementary 35400 W 91st St De Soto School Lexington Trails Middle 8800 Penner Ave De Soto School Education Admin. Office 35200 W 91st St De Soto School Countryside Learning Center 10120 Lexington Ave De Soto County Facility Rural Fire District #3, Antenna Site 9745 Kill Creek Road De Soto, KS County Facility HSA MultiService Center - De Soto 32905 W 84th Street De Soto, KS County Facility De Soto 33145 W 83rd Street De Soto, KS Government Office De Soto City Hall 32905 W 84th St De Soto, KS 66018 HazMat Huhtamaki Consumer Packaging Inc 9201 PACKAGING DR DeSoto 6XXX series alloys
HazMat Huhtamaki Consumer Packaging Inc 9201 PACKAGING DR DeSoto Absolytye/Champion Sealed Lead Batter HazMat Huhtamaki Consumer Packaging Inc 9201 PACKAGING DR DeSoto SULFURIC ACID HazMat Huhtamaki Consumer Packaging Inc 9201 PACKAGING DR DeSoto CADMIUM OXIDE HazMat Huhtamaki Consumer Packaging Inc 9201 PACKAGING DR DeSoto Lead Acid Batteries HazMat Huhtamaki Consumer Packaging Inc 9201 PACKAGING DR DeSoto KC-3468 Poly Lo Thriller Red HazMat Hunt - Sunflower Quarry 34135 W 95TH ST DeSoto ANFO HazMat Hunt - Sunflower Quarry 34135 W 95TH ST DeSoto Diesel Fuel HazMat Hunt - Sunflower Quarry 34135 W 95TH ST DeSoto Lubricating Oil HazMat Hunt - Sunflower Quarry 34135 W 95TH ST DeSoto Water Gel Primer HazMat Intervet Inc 35500 W 91st St DeSoto Formaldehyde HazMat A T & T - Eudora 37260 W 103RD ST DeSoto SULFURIC ACID HazMat Laidlaw Transit Inc. - (7013 DeSoto) 8800 PENNER AVE DeSoto Diesel Fuel County Facility Med-Act 1159 (DeSoto FD) 33150 W. 83rd DeSoto, KS 66018
Fire Station Dist 1, Stn 2 400 E 3RD ST Edgerton HazMat Roberts Oil Leases - Richard L Roberts 17915 Sunflower Rd Edgerton Crude Oil
HazMat Edgerton Coop 1002 E 2ND ST Edgerton Ammonia (ANHYDROUS) HazMat Edgerton Coop 1002 E 2ND ST Edgerton Diesel Fuel HazMat Edgerton Coop 1002 E 2ND ST Edgerton Gasoline HazMat Edgerton Coop 1002 E 2ND ST Edgerton Guardsman Max HazMat Edgerton Coop 1002 E 2ND ST Edgerton Keystone

Region L Hazard Mitigation Plan, 2013 Final
HazMat Edgerton Coop 1002 E 2ND ST Edgerton Propane HazMat Edgerton Coop 1002 E 2ND ST Edgerton Prowl HazMat Edgerton Coop 1002 E 2ND ST Edgerton Roundup Ultra Max HazMat Edgerton Coop 1002 E 2ND ST Edgerton Glystar Plus HazMat Edgerton Coop 1002 E 2ND ST Edgerton roundup Orinigal Max School Edgerton Elementary 400 W Nelson St Edgerton
County Facility Storage 309 E. Nelson Edgerton, KS County Facility Edgerton Library 319-321 E. Nelson Street Edgerton, KS County Facility Lanesfield Interpretive Center 18745 Dillie Rd. Edgerton, KS County Facility Edgerton Radio Tower Site 710 E. Nelson Edgerton, KS County Facility Edgerton Substation 309 E. Nelson Edgerton, KS County Facility Lanesfield School Historic Site 18745 S. Dillie Road Edgerton, KS 66021
Government Office Edgerton City Hall 404 E Nelson Edgerton, KS 66021 Police Fairway Police 5252 Belinder Rd Fairview
HazMat Colt Energy - Effertz Leases 4350 SHAWNEE MISSION PKWY Fairway Crude Oil County Facility Belinder Holding Station 5700 Belinder Fairway, KS
County Facility Rock Creek Pumping Station 5801 Roe Blvd Fairway, KS 66205
Government Office Fairway City Hall 5252 Belinder Rd Fairway, KS 66205
Fire Station Dist 1, Stn 1 234 E PARK ST Gardner
Fire Station Gardner, Stn 1 440 E MAIN ST Gardner
Fire Station Gardner Pub Safety 2 Future
Gardner
HazMat Sprint Communications Company L.P. - Gardner Cen 107 S ELM ST Gardner SULFURIC ACID HazMat Sprint Communications Company L.P. - Gardner Cen 107 S ELM ST Gardner Lead Compounds HazMat Cramer Products Inc 153 W WARREN ST Gardner Isopropyl Alcohol HazMat Cramer Products Inc 153 W WARREN ST Gardner Petrolatum HazMat Cramer Products Inc 153 W WARREN ST Gardner Sodium Chloride HazMat Cramer Products Inc 153 W WARREN ST Gardner Wood Resin FF Nursing Home Medicalodge of Gardner 223 Bedford St Gardner
Nursing Home Meadowbrook Rehab. Hospital 427 W Main St Gardner
Nursing Home Vintage Park of Gardner 869 Juniper Ter Gardner
Police Gardner Police 440 E Main St Gardner
School Gardner-Edgerton High 425 N Waverly Rd Gardner
School Sunflower Elementary 775 N Center St Gardner
School Wheatridge Middle 318 E Washington St Gardner
School Gardner Elementary 218 E Shawnee St Gardner

Region L Hazard Mitigation Plan, 2013 Final
School Education Admin. Office 314 E. Washington St Gardner
County Facility Med-Act 1150, (Gardner Public Safety) 440 E. Main Gardner, KS
County Facility HSA MultiService Center - Gardner 112 S. Elm Gardner, KS
County Facility Gardner Library 137 E Shawnee Gardner, KS
County Facility JCDS - Agnes St 17371 S Agnes St Gardner, KS 66030
County Facility HSA Nutrition Site - Gardner 128 E Park St Gardner, KS 66030
County Facility JCDS - Ingrid 17390 S. Ingrid Gardner, KS 66030
Government Office Gardner City Hall 120 E Main St Gardner, KS 66030
County Facility
County Facility Kill Creek #1
Johnson County
County Facility Hangar D 200 Springhill Dr. Johnson County
County Facility Hangar E 200 Springhill Dr. Johnson County
County Facility Hangar C 200 Springhill Dr. Johnson County
County Fuel Tank New Century 228 Gardner Dr Johnson County
County Fuel Tank New Century 228 Gardner Dr Johnson County
County Fuel Tank New Century 50 Leawood Dr Johnson County
County Fuel Tank Heritage Park Maintenance 14025 W. 159th Street Johnson County
County Fuel Tank Heritage Park Maintenance 14025 W. 159th Street Johnson County
County Fuel Tank Heritage Park Golf Course 16445 S. Lackman Road Johnson County
County Fuel Tank Heritage Park Golf Course 16445 S. Lackman Road Johnson County
County Fuel Tank Kill Creek Park Maintenance 11770 Homestead Lane Johnson County
County Fuel Tank Kill Creek Park Maintenance 11770 Homestead Lane Johnson County
County Fuel Tank Heritage Park Maintenance 14025 W. 159th Street Johnson County
Fire Station Dist 1, Stn 3 490 NEW CENTURY PKWY Johnson County
Fire Station Overland Park, Stn 5 15935 METCALF RD Johnson County
Fire Station Dist 2, Stn 1 19495 METCALF RD Johnson County
Fire Station Dist 2, Stn 2 18475 MISSION RD Johnson County
Fire Station Dist 2, Stn 3 19065 LACKMAN RD Johnson County
Fire Station Gardner Pub Safety 3 Future
Johnson County
Fire Station Dist 3, Stn 2 29520 W 127TH ST Johnson County
HazMat Petroleum Technologies Inc
Johnson County Crude Oil HazMat Petroleum Technologies Inc
Johnson County Crude Oil
HazMat Petroleum Technologies Inc
Johnson County BRINE HazMat Petroleum Technologies Inc
Johnson County BRINE
HazMat Petroleum Technologies Inc
Johnson County BRINE

Region L Hazard Mitigation Plan, 2013 Final
HazMat Petroleum Technologies Inc
Johnson County
HazMat Petroleum Technologies Inc
Johnson County
HazMat Petroleum Technologies Inc
Johnson County BRINE HazMat Petroleum Technologies Inc
Johnson County Crude Oil
HazMat Petroleum Technologies Inc
Johnson County Crude Oil HazMat Petroleum Technologies Inc
Johnson County BRINE
HazMat Petroleum Technologies Inc
Johnson County Crude Oil HazMat Petroleum Technologies Inc
Johnson County BRINE
HazMat Petroleum Technologies Inc
Johnson County Crude Oil HazMat Petroleum Technologies Inc
Johnson County Crude Oil
HazMat Petroleum Technologies Inc
Johnson County BRINE Jail Johnson County Sheriff 27745 W 159th St Johnson County
School Pleasant Ridge Middle 9000 W 165th St Johnson County
School Blue Valley High 6001 W 159th St Johnson County
School Stilwell Elementary 6410 W 199th St Johnson County
School Hilltop Elementary 16740 W 175th Johnson County
School Moonlight Elementary 17960 S Moonlight Rd Johnson County
School Blue Valley West High 16200 Antioch Road Johnson County
School Cedar Hills Elementary 9100 W 165th St Johnson County
School Prairie Creek Elementary 17077 W 165th St Johnson County
School Future High 19701 S Ridgeview Johnson County
School Madison Elementary 800 W Madison St Johnson County
School Pinoeer Ridge Middle 16200 Kill Creek Rd Johnson County
School Nike Elementary 19500 S Gardner Rd. Johnson County
Sheriff Johnson County Sheriff 27747 W 159th St Johnson County
HazMat Petroleum Technologies Inc - Knabe C Lease
Kansas City BRINE
HazMat Petroleum Technologies Inc - Knabe C Lease
Kansas City Crude Oil County Facility Lake Quivira Antenna Site 100 Crescent Boulevard Lake Quivira, KS 66217 Fire Station Lake Quivira, Stn 1 10 CRESCENT DR Lake Quivira, KS 66217 Government Office Lake Quivira City Hall 10 Crescent Blvd Lake Quivira, KS 66217 Police Lake Quivira Police 10 Crescent Blvd Lake Quivira, KS 66217 Fire Station Leawood, Stn 1 9607 LEE BLVD Leawood
Fire Station Leawood, Stn 2 12701 MISSION RD Leawood
Fire Station Leawood, Stn 3 14801 MISSION RD Leawood
HazMat Johnson County Wastewater Tomahawk Facility 10701 LEE BLVD Leawood chlorine
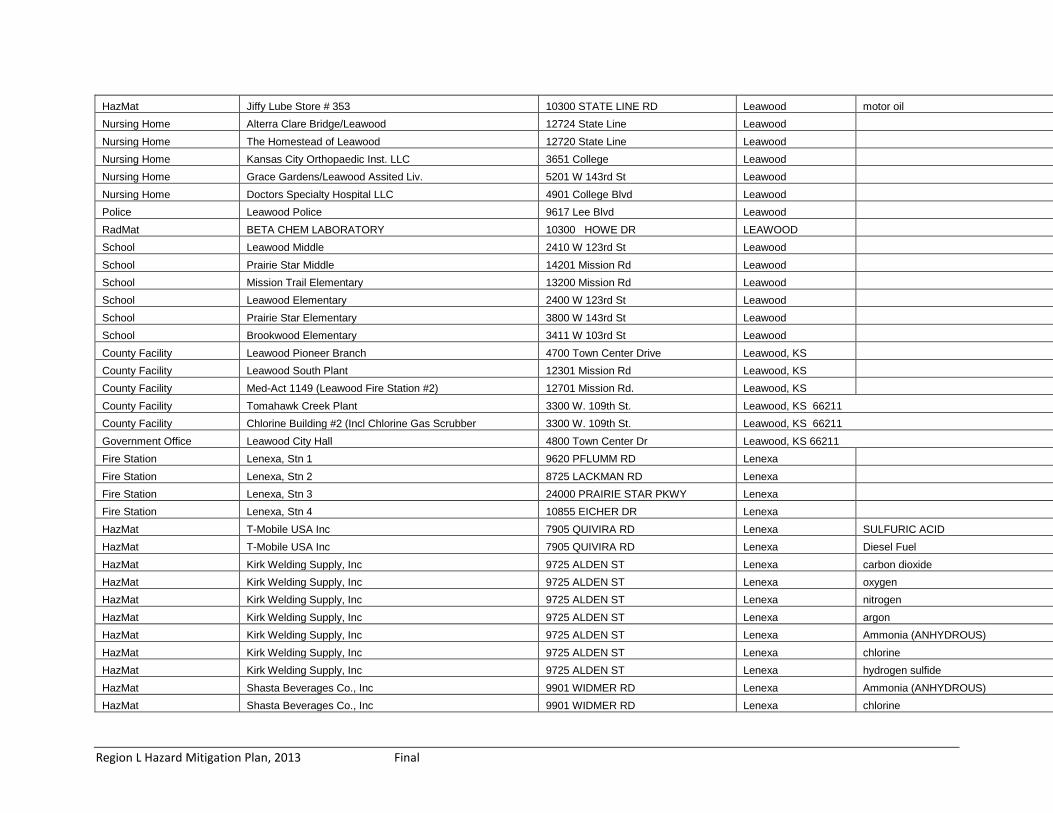
Region L Hazard Mitigation Plan, 2013 Final
HazMat Jiffy Lube Store # 353 10300 STATE LINE RD Leawood motor oil Nursing Home Alterra Clare Bridge/Leawood 12724 State Line Leawood
Nursing Home The Homestead of Leawood 12720 State Line Leawood
Nursing Home Kansas City Orthopaedic Inst. LLC 3651 College Leawood
Nursing Home Grace Gardens/Leawood Assited Liv. 5201 W 143rd St Leawood
Nursing Home Doctors Specialty Hospital LLC 4901 College Blvd Leawood
Police Leawood Police 9617 Lee Blvd Leawood
RadMat BETA CHEM LABORATORY 10300 HOWE DR LEAWOOD
School Leawood Middle 2410 W 123rd St Leawood
School Prairie Star Middle 14201 Mission Rd Leawood
School Mission Trail Elementary 13200 Mission Rd Leawood
School Leawood Elementary 2400 W 123rd St Leawood
School Prairie Star Elementary 3800 W 143rd St Leawood
School Brookwood Elementary 3411 W 103rd St Leawood
County Facility Leawood Pioneer Branch 4700 Town Center Drive Leawood, KS
County Facility Leawood South Plant 12301 Mission Rd Leawood, KS
County Facility Med-Act 1149 (Leawood Fire Station #2) 12701 Mission Rd. Leawood, KS
County Facility Tomahawk Creek Plant 3300 W. 109th St. Leawood, KS 66211 County Facility Chlorine Building #2 (Incl Chlorine Gas Scrubber 3300 W. 109th St. Leawood, KS 66211 Government Office Leawood City Hall 4800 Town Center Dr Leawood, KS 66211 Fire Station Lenexa, Stn 1 9620 PFLUMM RD Lenexa
Fire Station Lenexa, Stn 2 8725 LACKMAN RD Lenexa
Fire Station Lenexa, Stn 3 24000 PRAIRIE STAR PKWY Lenexa
Fire Station Lenexa, Stn 4 10855 EICHER DR Lenexa
HazMat T-Mobile USA Inc 7905 QUIVIRA RD Lenexa SULFURIC ACID HazMat T-Mobile USA Inc 7905 QUIVIRA RD Lenexa Diesel Fuel HazMat Kirk Welding Supply, Inc 9725 ALDEN ST Lenexa carbon dioxide HazMat Kirk Welding Supply, Inc 9725 ALDEN ST Lenexa oxygen HazMat Kirk Welding Supply, Inc 9725 ALDEN ST Lenexa nitrogen HazMat Kirk Welding Supply, Inc 9725 ALDEN ST Lenexa argon HazMat Kirk Welding Supply, Inc 9725 ALDEN ST Lenexa Ammonia (ANHYDROUS) HazMat Kirk Welding Supply, Inc 9725 ALDEN ST Lenexa chlorine HazMat Kirk Welding Supply, Inc 9725 ALDEN ST Lenexa hydrogen sulfide HazMat Shasta Beverages Co., Inc 9901 WIDMER RD Lenexa Ammonia (ANHYDROUS) HazMat Shasta Beverages Co., Inc 9901 WIDMER RD Lenexa chlorine

Region L Hazard Mitigation Plan, 2013 Final
HazMat Sprint Communications Company L.P. - Lenexa OSSC 15201 W 99TH ST Lenexa SULFURIC ACID HazMat Sprint Communications Company L.P. - Lenexa OSSC 15201 W 99TH ST Lenexa Diesel Fuel HazMat Sprint Communications Company L.P. - Lenexa OSSC 15201 W 99TH ST Lenexa halon 1301 HazMat Sprint Communications Company L.P. - Lenexa OSSC 15201 W 99TH ST Lenexa Lead Compounds HazMat Sprint Communications Company L.P. - Kansas RegÆ 14625 W 100TH ST Lenexa SULFURIC ACID HazMat Sprint Communications Company L.P. - Kansas RegÆ 14625 W 100TH ST Lenexa Lead Compounds HazMat Sprint Communications Company L.P. - Lenexa Legl 9601 LEGLER RD Lenexa SULFURIC ACID HazMat Sprint Communications Company L.P. - Lenexa Legl 9601 LEGLER RD Lenexa Lead Compounds HazMat Sprint Communications Company L.P. - Lenexa Legl 9601 LEGLER RD Lenexa Diesel Fuel HazMat Sprint Communications Company L.P. - Lenexa Lake 10951 LAKEVIEW AVE Lenexa SULFURIC ACID HazMat Sprint Communications Company L.P. - Lenexa Lake 10951 LAKEVIEW AVE Lenexa Lead Compounds HazMat Sprint Communications Company L.P. - Lenexa Lake 10951 LAKEVIEW AVE Lenexa Diesel Fuel HazMat Sprint Communications Company L.P. - Lenexa PCS- 11211 LAKEVIEW AVE Lenexa SULFURIC ACID HazMat Sprint Communications Company L.P. - Lenexa PCS- 11211 LAKEVIEW AVE Lenexa Lead Compounds HazMat Sprint Communications Company L.P. - Lenexa PCS 15481 W 110TH ST Lenexa SULFURIC ACID HazMat Sprint Communications Company L.P. - Lenexa PCS 15481 W 110TH ST Lenexa Lead Compounds HazMat Sprint Communications Company L.P. - Lenexa PCS 15481 W 110TH ST Lenexa Diesel Fuel HazMat Sprint Communications Company L.P. - Lenexa PCS 15620 W 113TH ST Lenexa SULFURIC ACID HazMat Sprint Communications Company L.P. - Lenexa PCS 15620 W 113TH ST Lenexa Lead Compounds HazMat Sprint Communications Company L.P. - Lenexa PCS 16020 W 113TH ST Lenexa SULFURIC ACID HazMat Sprint Communications Company L.P. - Lenexa PCS 16020 W 113TH ST Lenexa Lead Compounds HazMat Sprint Communications Company L.P. - Lenexa PCS 16020 W 113TH ST Lenexa Diesel Fuel HazMat Sprint Communications Company L.P. - Lenexa PCS 11300 CORPORATE AVE Lenexa SULFURIC ACID HazMat Sprint Communications Company L.P. - Lenexa PCS 11300 CORPORATE AVE Lenexa Lead Compounds HazMat Sprint Communications Company L.P. - Lenexa PCS 11300 CORPORATE AVE Lenexa Diesel Fuel HazMat Ringside Inc. 9650 DICE LN Lenexa carbon & alloy steels HazMat Cable and Wireless USA 8005 BOND ST Lenexa Diesel Fuel HazMat Cable and Wireless USA 8005 BOND ST Lenexa lead HazMat Cable and Wireless USA 8005 BOND ST Lenexa SULFURIC ACID HazMat AMCOR P.E.T. Packaging North America 9939 WIDMER RD Lenexa "Eastpak" Polymer 9921 W HazMat AMCOR P.E.T. Packaging North America 9939 WIDMER RD Lenexa Diala Oil AX 68745 HazMat AMCOR P.E.T. Packaging North America 9939 WIDMER RD Lenexa Cleartuf 8006 HazMat AMCOR P.E.T. Packaging North America 9939 WIDMER RD Lenexa VFR 10538 HazMat AMCOR P.E.T. Packaging North America 9939 WIDMER RD Lenexa Polyester Bottle Resin HazMat AMCOR P.E.T. Packaging North America 9939 WIDMER RD Lenexa "Eastpak" Polymer CM01

Region L Hazard Mitigation Plan, 2013 Final
HazMat Southwestern Bell Mobile Systems 9532 9532 PFLUMM RD Lenexa Diesel Fuel HazMat Southwestern Bell Mobile Systems 9532 9532 PFLUMM RD Lenexa SULFURIC ACID HazMat Southwestern Bell Mobile System 11749 11749 W 112TH ST Lenexa SULFURIC ACID HazMat Magnum Products - Lenexa 15740 W 108TH ST Lenexa Polyethylene HazMat Magnum Products - Lenexa 15740 W 108TH ST Lenexa Plasters HazMat Magnum Products - Lenexa 15740 W 108TH ST Lenexa Attapulgite products HazMat Magnum Products - Lenexa 15740 W 108TH ST Lenexa Hubercarb HazMat Magnum Products - Lenexa 15740 W 108TH ST Lenexa LV-9 HazMat Magnum Products - Lenexa 15740 W 108TH ST Lenexa Mica Powder (Muscovite) HazMat Magnum Products - Lenexa 15740 W 108TH ST Lenexa Pyrax B HazMat Magnum Products - Lenexa 15740 W 108TH ST Lenexa Staramic 747 Starch HazMat Magnum Products - Lenexa 15740 W 108TH ST Lenexa TALC HazMat Magnum Products - Lenexa 15740 W 108TH ST Lenexa Cal bond R-21 HazMat Magnum Products - Lenexa 15740 W 108TH ST Lenexa Magnum Joint Compound HazMat Magnum Products - Lenexa 15740 W 108TH ST Lenexa Joint Compounds Powder HazMat Magnum Products - Lenexa 15740 W 108TH ST Lenexa Methocel*250 Hydroxypropyl Methylcellu HazMat Magnum Products - Lenexa 15740 W 108TH ST Lenexa Hydroxyethylcellulose Natrosol HazMat Magnum Products - Lenexa 15740 W 108TH ST Lenexa 1 1/4 Cornerbead, "L" metal, and Open A HazMat Magnum Products - Lenexa 15740 W 108TH ST Lenexa Sheetrock Joint Tape HazMat Magnum Products - Lenexa 15740 W 108TH ST Lenexa Magnum Drywall Textures S-1000, V -10 HazMat Magnum Products - Lenexa 15740 W 108TH ST Lenexa Magnum Drywall Blend HazMat Magnum Products - Lenexa 15740 W 108TH ST Lenexa Methylhydroxypropylcellulose HazMat Magnum Products - Lenexa 15740 W 108TH ST Lenexa Nexton 3082R Water Soluble Polymer HazMat Magnum Products - Lenexa 15740 W 108TH ST Lenexa Hydrostone HazMat Magnum Products - Lenexa 15740 W 108TH ST Lenexa Airflex 531 BP Emulsion HazMat Penske Truck Leasing Co L.P. 17225 W 116TH ST Lenexa Diesel Fuel HazMat Kelly Co LLC 15547 W 109TH ST Lenexa Crude Oil HazMat Kelly Co LLC 15547 W 109TH ST Lenexa Emulsion Breaker HazMat Kelly Co LLC 15547 W 109TH ST Lenexa Corrosion Inhibitor HazMat Kelly Co LLC 15547 W 109TH ST Lenexa Salt Water HazMat Universal Engracing # 2 11801 W 86TH TER Lenexa Copper HazMat Sam's Club # 8208 12200 W 95TH ST Lenexa SULFURIC ACID HazMat Verizon Wireless - Lenexa MTSO 9725 PFLUMM RD Lenexa SULFURIC ACID HazMat Verizon Wireless - Lenexa MTSO 9725 PFLUMM RD Lenexa Diesel Fuel HazMat Verizon Wireless - Lenexa MTSO 9725 PFLUMM RD Lenexa Lead

Region L Hazard Mitigation Plan, 2013 Final
HazMat Comfort Products Distributing 14001 MARSHALL DR Lenexa Chlorodifluoromethane HazMat Wheeling Corrugating Company 9801 ALDEN ST Lenexa Diesel Fuel HazMat Coca Cola Bottling of Mid America 10001 INDUSTRIAL BLVD Lenexa Ammonia (ANHYDROUS) HazMat Coca Cola Bottling of Mid America 10001 INDUSTRIAL BLVD Lenexa Anthrafilt HazMat Coca Cola Bottling of Mid America 10001 INDUSTRIAL BLVD Lenexa Calcium Hydroxide HazMat Coca Cola Bottling of Mid America 10001 INDUSTRIAL BLVD Lenexa Ferric Sulfate HazMat Coca Cola Bottling of Mid America 10001 INDUSTRIAL BLVD Lenexa carbon dioxide HazMat Coca Cola Bottling of Mid America 10001 INDUSTRIAL BLVD Lenexa SULFURIC ACID HazMat Coca Cola Bottling of Mid America 10001 INDUSTRIAL BLVD Lenexa Nitrogen, (Cryogenic Liquid) HazMat Coca Cola Bottling of Mid America 10001 INDUSTRIAL BLVD Lenexa SULFURIC ACID HazMat Coca Cola Bottling of Mid America 10001 INDUSTRIAL BLVD Lenexa Antracite coal HazMat Coca Cola Bottling of Mid America 10001 INDUSTRIAL BLVD Lenexa Glycol Ehter HazMat Coca Cola Bottling of Mid America 10001 INDUSTRIAL BLVD Lenexa Nitric Acid HazMat United Parcel Service 14650 SANTA FE TRAIL DR Lenexa Gasoline HazMat United Parcel Service 14650 SANTA FE TRAIL DR Lenexa Diesel Fuel HazMat J C Penney Catalog Center 10500 LACKMAN RD Lenexa Diesel Fuel HazMat J C Penney Catalog Center 10500 LACKMAN RD Lenexa Propane HazMat J C Penney Catalog Center 10500 LACKMAN RD Lenexa SULFURIC ACID HazMat J C Penney Catalog Center 10500 LACKMAN RD Lenexa halon 1301 HazMat Vertis Retail Newspaper Services 14720 W 99TH ST Lenexa petroleum distillates in heatset web offse HazMat Vertis Retail Newspaper Services 14720 W 99TH ST Lenexa Cleaning Compounds in acid solution PS HazMat Vertis Retail Newspaper Services 14720 W 99TH ST Lenexa Cleaning Liquid Compounds-Z-cling 7140 HazMat Midland Research Laboratories Inc 10850 MID AMERICA AVE Lenexa CYCLOHEXYLAMINE HazMat Midland Research Laboratories Inc 10850 MID AMERICA AVE Lenexa HYDRAZINE HazMat Midland Research Laboratories Inc 10850 MID AMERICA AVE Lenexa Midland PC 6010 Chlorine Dioxide precu HazMat Midland Research Laboratories Inc 10850 MID AMERICA AVE Lenexa sodium Bromide HazMat Midland Research Laboratories Inc 10850 MID AMERICA AVE Lenexa Sodium sulfite HazMat Midland Research Laboratories Inc 10850 MID AMERICA AVE Lenexa SULFURIC ACID HazMat Spec Plating Corporation 8291 MELROSE DR Lenexa Nitric Acid HazMat Spec Plating Corporation 8291 MELROSE DR Lenexa Potassium Cyanide HazMat Fedex Express -IXDA 14635 W 99TH ST Lenexa Gasoline HazMat Fedex Express -IXDA 14635 W 99TH ST Lenexa Diesel Fuel HazMat Southern Star Central Pipeline (Craig) 19600 W 87TH LN Lenexa Gas Engine Oil HazMat Southern Star Central Pipeline (Craig) 19600 W 87TH LN Lenexa Natural Gas Condensates, Gas HazMat SCP Distributors LLC 9802 WIDMER RD Lenexa Calcium Hypochlorite

Region L Hazard Mitigation Plan, 2013 Final
HazMat SCP Distributors LLC 9802 WIDMER RD Lenexa Trichloro-S-Triazinetrione HazMat SCP Distributors LLC 9802 WIDMER RD Lenexa Silicon Dioxide HazMat SCP Distributors LLC 9802 WIDMER RD Lenexa Vermiculite HazMat SCP Distributors LLC 9802 WIDMER RD Lenexa Sodium Hypochlorite Solution HazMat SCP Distributors LLC 9802 WIDMER RD Lenexa Diatomaceous Earth, Flux-calcined HazMat SCP Distributors LLC 9802 WIDMER RD Lenexa Hydrogen Chloride HazMat SCP Distributors LLC 9802 WIDMER RD Lenexa Cyanuric Acid HazMat SCP Distributors LLC 9802 WIDMER RD Lenexa Propylene Glycol HazMat SCP Distributors LLC 9802 WIDMER RD Lenexa Sodium Hydrogen Carbonate HazMat SCP Distributors LLC 9802 WIDMER RD Lenexa 1-bromo-3-chloro-5, 5-dimethyl-hydantio HazMat SCP Distributors LLC 9802 WIDMER RD Lenexa Lithium Hypochlorite HazMat SCP Distributors LLC 9802 WIDMER RD Lenexa 1-Hydroxyethylidene-1,-diphosphonic HazMat SCP Distributors LLC 9802 WIDMER RD Lenexa Calcium Chloride HazMat SCP Distributors LLC 9802 WIDMER RD Lenexa sodium Dichloro-s-triazinetrione HazMat Superior Pool Products LLC 9874 PFLUMM RD Lenexa sodium Dichloro-s-triazinetrione HazMat Superior Pool Products LLC 9874 PFLUMM RD Lenexa Propylene Glycol HazMat Superior Pool Products LLC 9874 PFLUMM RD Lenexa Calcium Hypochlorite HazMat Superior Pool Products LLC 9874 PFLUMM RD Lenexa Trichloro-S-Triazinetrione HazMat Superior Pool Products LLC 9874 PFLUMM RD Lenexa Silicon Dioxide HazMat Superior Pool Products LLC 9874 PFLUMM RD Lenexa Sodium Hydrogen Carbonate HazMat Superior Pool Products LLC 9874 PFLUMM RD Lenexa Vermiculite HazMat Superior Pool Products LLC 9874 PFLUMM RD Lenexa Cyanuric Acid HazMat Superior Pool Products LLC 9874 PFLUMM RD Lenexa Sodium Bisulfate HazMat Superior Pool Products LLC 9874 PFLUMM RD Lenexa Potassium Peroxymonosulfate HazMat Superior Pool Products LLC 9874 PFLUMM RD Lenexa Hydrochloric Acid HazMat Superior Pool Products LLC 9874 PFLUMM RD Lenexa 1-Hydroxyethylidene-1,-diphosphonic HazMat Superior Pool Products LLC 9874 PFLUMM RD Lenexa Diatomaceous Earth HazMat Superior Pool Products LLC 9874 PFLUMM RD Lenexa PROPYLENE GLYCOL, Butoxydipropan HazMat Superior Pool Products LLC 9874 PFLUMM RD Lenexa Copper- Triethanolamine complex HazMat Superior Pool Products LLC 9874 PFLUMM RD Lenexa Copper- Triethanolamine complex HazMat Superior Pool Products LLC 9874 PFLUMM RD Lenexa 1-bromo-3chloro-5,5-dimethyl-hydantion HazMat Wichita Southeast Kansas Transit 14401 W 97TH TER Lenexa DIESEL FUEL HazMat Moore Wallace North America 8460 FLINT ST Lenexa SULFURIC ACID HazMat Ryder Transportation Services #0381A 10003 LACKMAN RD Lenexa Diesel Fuel HazMat BWI Companies Inc., BWI - Kansas City 9831 LACKMAN RD Lenexa 13-13-13 Boron Homogenous Fertilizer

Region L Hazard Mitigation Plan, 2013 Final
HazMat BWI Companies Inc., BWI - Kansas City 9831 LACKMAN RD Lenexa 13-3-7, 20-3-4 NPK Fert + Weed Control HazMat BWI Companies Inc., BWI - Kansas City 9831 LACKMAN RD Lenexa 20-3-4 Fert W/ Propendi Herb HazMat BWI Companies Inc., BWI - Kansas City 9831 LACKMAN RD Lenexa 20-4-10 40% HazMat BWI Companies Inc., BWI - Kansas City 9831 LACKMAN RD Lenexa 46-0-0 Urea HazMat BWI Companies Inc., BWI - Kansas City 9831 LACKMAN RD Lenexa Barricade HazMat BWI Companies Inc., BWI - Kansas City 9831 LACKMAN RD Lenexa Dimension Fertilizer HazMat BWI Companies Inc., BWI - Kansas City 9831 LACKMAN RD Lenexa Howard Johnson's Turf Fertilizer HazMat BWI Companies Inc., BWI - Kansas City 9831 LACKMAN RD Lenexa LEB CC 21-3-18 5.0 WIN HazMat BWI Companies Inc., BWI - Kansas City 9831 LACKMAN RD Lenexa Lebanon Pro 32-4-8 12 SCU HazMat BWI Companies Inc., BWI - Kansas City 9831 LACKMAN RD Lenexa Merit 0.5 G Insecticide HazMat BWI Companies Inc., BWI - Kansas City 9831 LACKMAN RD Lenexa Merit 025 HazMat BWI Companies Inc., BWI - Kansas City 9831 LACKMAN RD Lenexa Snapshot 2.5 TG Herbicide HazMat BWI Companies Inc., BWI - Kansas City 9831 LACKMAN RD Lenexa 18-3-18 Country Club HazMat BWI Companies Inc., BWI - Kansas City 9831 LACKMAN RD Lenexa Calcium Nitrate Fertilizer 15.5%N HazMat BWI Companies Inc., BWI - Kansas City 9831 LACKMAN RD Lenexa Dormant Oil HazMat BWI Companies Inc., BWI - Kansas City 9831 LACKMAN RD Lenexa Ferromec AC Liquid Iron 15-0-0 HazMat BWI Companies Inc., BWI - Kansas City 9831 LACKMAN RD Lenexa Goal 2X Herbicide HazMat BWI Companies Inc., BWI - Kansas City 9831 LACKMAN RD Lenexa Honcho Plus Herbicide HazMat BWI Companies Inc., BWI - Kansas City 9831 LACKMAN RD Lenexa Howard Johnsons Mach 2 Plus Fertilizer HazMat BWI Companies Inc., BWI - Kansas City 9831 LACKMAN RD Lenexa Nitro 30 30-0-0 HazMat BWI Companies Inc., BWI - Kansas City 9831 LACKMAN RD Lenexa Roundup Pro Herbicide HazMat BWI Companies Inc., BWI - Kansas City 9831 LACKMAN RD Lenexa Speed Zone Broadleaf Herbicide HazMat BWI Companies Inc., BWI - Kansas City 9831 LACKMAN RD Lenexa Surflan A S Herbicide HazMat BWI Companies Inc., BWI - Kansas City 9831 LACKMAN RD Lenexa Trimec 992 HazMat Simplex Grinnell 13555 W 107TH ST Lenexa carbon dioxide HazMat Pitman Company 9900 PFLUMM RD Lenexa Hydroquinone HazMat Pack America Corporation 9635 WIDMER RD Lenexa SULFURIC ACID HazMat Pack America Corporation 9635 WIDMER RD Lenexa Inseal 30-5166 Ethylene Vinyl Acetate HazMat Pack America Corporation 9635 WIDMER RD Lenexa Vinyl Acetate Adhesive KY 729 HazMat B/E Aerospace. Inc. 10800 PFLUMM RD Lenexa Oxygen, (Cryogenic Liquid) HazMat B/E Aerospace. Inc. 10800 PFLUMM RD Lenexa Sodium Chloride HazMat Costco #349 9350 MARSHALL DR Lenexa SULFURIC ACID HazMat Costco #349 9350 MARSHALL DR Lenexa Lead HazMat Emerson Ventilation Products 10048 INDUSTRIAL BLVD Lenexa Argon HazMat Emerson Ventilation Products 10048 INDUSTRIAL BLVD Lenexa SULFURIC ACID

Region L Hazard Mitigation Plan, 2013 Final
HazMat Emerson Ventilation Products 10048 INDUSTRIAL BLVD Lenexa SULFURIC ACID HazMat Harbison - Walker Refractories Co. 14515 W 96TH TER Lenexa Alumiona Silicate HazMat Harbison - Walker Refractories Co. 14515 W 96TH TER Lenexa Aluminum Oxide HazMat Harbison - Walker Refractories Co. 14515 W 96TH TER Lenexa Cristobalite HazMat Harbison - Walker Refractories Co. 14515 W 96TH TER Lenexa Portland Cenent HazMat Harbison - Walker Refractories Co. 14515 W 96TH TER Lenexa Vitreous Silica HazMat Harbison - Walker Refractories Co. 14515 W 96TH TER Lenexa Hydrous Aluminum Silicate HazMat Harbison - Walker Refractories Co. 14515 W 96TH TER Lenexa Hydrous Aluminum Silicate HazMat Harbison - Walker Refractories Co. 14515 W 96TH TER Lenexa Quartz HazMat Harbison - Walker Refractories Co. 14515 W 96TH TER Lenexa Silicon Dioxide HazMat Harbison - Walker Refractories Co. 14515 W 96TH TER Lenexa Calcium Aluminate HazMat Harbison - Walker Refractories Co. 14515 W 96TH TER Lenexa Refractory Ceramic Fibers HazMat Jiffy Lube Store # 1628 13520 W 87TH ST PKWY Lenexa Motor Oil HazMat Machine Laboratory, Inc. 8040 BOND ST Lenexa Steel RS5214 HazMat Machine Laboratory, Inc. 8040 BOND ST Lenexa Stell 1018 HazMat Machine Laboratory, Inc. 8040 BOND ST Lenexa Steel 440FSE HazMat Machine Laboratory, Inc. 8040 BOND ST Lenexa Steel 430 FR HazMat Machine Laboratory, Inc. 8040 BOND ST Lenexa 12L14 HazMat Machine Laboratory, Inc. 8040 BOND ST Lenexa 1215 Steel HazMat Machine Laboratory, Inc. 8040 BOND ST Lenexa Steel 416SS HazMat Machine Laboratory, Inc. 8040 BOND ST Lenexa Steel 303SS HazMat Sprint Communications Company Lenexa PCS Watersi 15405 COLLEGE BLVD Lenexa SULFURIC ACID HazMat Holland Corporation, Inc 9131 NOLAND RD Lenexa Diesel Oil, Medium HazMat Holland Corporation, Inc 9131 NOLAND RD Lenexa Diesel Fuel HazMat Holland Corporation, Inc 9131 NOLAND RD Lenexa Gasoline HazMat Kansas City Power & Light - Johnson County Servi 16215 W 108TH ST Lenexa Diesel Fuel HazMat Kansas City Power & Light - Johnson County Servi 16215 W 108TH ST Lenexa Gasoline HazMat Mid America Wastewater Treatment 14021 W 101ST ST Lenexa Ammonia (ANHYDROUS) HazMat Mid America Wastewater Treatment 14021 W 101ST ST Lenexa Sodium Hydroxide HazMat Shaw Industries, Inc. Plant 3K 16955 W 116TH ST Lenexa SULFURIC ACID HazMat Verizon Wireless - Lenexa Ks-MO RHQ 9725 PFLUMM RD Lenexa SULFURIC ACID HazMat Emerson Ventilation Products 13915 W 107TH ST Lenexa SULFURIC ACID HazMat IBM 11200 LAKEVIEW AVE Lenexa SULFURIC ACID Nursing Home Delmar Gardens of Lenexa 9701 Monrovia St Lenexa
Nursing Home Lakeview Village 9100 Park St Lenexa

Region L Hazard Mitigation Plan, 2013 Final
Nursing Home Vintage Park at Lenexa 8710 Caenen Lake Lenexa
Nursing Home The Homestead of Lenexa 8740 Caenen Lake Lenexa
Nursing Home Sunrise Assisted Living of Lenexa 15055 W 87th Pkwy Lenexa
Police Lenexa Police 12500 W 87th St Lenexa
Police Lenexa Police 23930 Prairie Star Pkwy Lenexa
RadMat CITY OF LENEXA 12350 W 87TH STREET PKWY LENEXA
RadMat CLINICAL REFERENCE LABORATORY 8433 QUIVIRA RD LENEXA
RadMat COMO TECH INC 27640 W 83RD ST LENEXA
RadMat EAGLE-PICHER INDUSTRIES 13605 W 96TH TERR LENEXA
RadMat GEORGE BUTLER ASSOCIATES 9801 RENNER BLV LENEXA
RadMat GEOSYSTEMS ENGINEERING INC 7802 BARTON AVE LENEXA
RadMat KRUGER TECHNOLOGIES INC 14705 W 114TH TERR LENEXA
RadMat PACE ANALYTICAL SERVICES I 9608 LOIRET BLV LENEXA
RadMat PHARMACEUTICAL RESEARCH A 16300 COLLEGE BLV LENEXA
RadMat QUINTILES INC 11250 CORPORATE AVE LENEXA
RadMat S O R 14685 W 105TH ST LENEXA
RadMat TERRACON INC 16000 COLLEGE BLV LENEXA
RadMat TRANSYSTEMS CORPORATION 8218 NIEMAN RD LENEXA
School Christa McAuliffe Elementary 15600 W 83rd St Lenexa
School Mill Creek Elementary 13951 W 79th St Lenexa
School Rising Star Elementary 8600 Candlelight Ln Lenexa
School Rosehill Elementary 9801 RoseHill Rd Lenexa
School Sunflower Elementary 8955 Loiret Blvd Lenexa
School Trailridge Middle 7500 Quivira Rd Lenexa
School Don Bonjour Elementary 9400 Pflumm Rd Lenexa
School Mill Creek Middle 8001 Mize Rd Lenexa
School Manchester Park Elementary 9810 Prairie Creek Rd Lenexa
County Facility Med-Act 1135, (Lenexa FD) 9224 Haskins Lenexa, KS
County Facility Lackman 15345 W. 87th Pkwy Lenexa, KS
County Facility Wastewater Storage 16101 W. 95th St. Lenexa, KS
County Facility JCDS - Satellite Site 15024 W. 106th Lenexa, KS 66219
County Facility HSA Nutrition Site - Lenexa 13425 Walnut Lenexa, KS 66210
County Facility HSA MultiService Center - North Central 12425 W. 87th Street Pkwy Lenexa, KS 66215
County Facility JCDS - Satellite Site 15012 W. 106th Lenexa, KS 66219
County Facility Offices & Workshop 10501 Lackman Road Lenexa, KS 66219

Region L Hazard Mitigation Plan, 2013 Final
County Facility JCDS - Satellite Site 15016 W. 106th Lenexa, KS 66219
County Facility JCDS Annex - Satellite Site 15046 W. 106th Lenexa, KS 66219
County Facility Health Department Storage 16101 W. 95th Street Lenexa, KS 66219
Government Office Lenexa City Hall 12350 W 87th Street Pkwy, Lenexa, KS 66285-4888 County Fuel Tank Antioch Park Maintenance 6501 Antioch Road Merriam
County Fuel Tank Antioch Park Maintenance 6501 Antioch Road Merriam
County Fuel Tank Antioch Park Maintenance 6501 Antioch Road Merriam
Fire Station Merriam, Stn 1 9000 W 62ND TER Merriam
HazMat Concrete Materials Inc 9900 W 75TH ST Merriam Calcium Chloride HazMat Concrete Materials Inc 9900 W 75TH ST Merriam Flyash HazMat Concrete Materials Inc 9900 W 75TH ST Merriam Ground Granulated Blast Furnace Slag HazMat Concrete Materials Inc 9900 W 75TH ST Merriam MB AE 90 Air Entrained Agent HazMat Concrete Materials Inc 9900 W 75TH ST Merriam Polyheed 997 HazMat Concrete Materials Inc 9900 W 75TH ST Merriam Portland Cenent HazMat Concrete Materials Inc 9900 W 75TH ST Merriam Pazzolith 220N HazMat Concrete Materials Inc 9900 W 75TH ST Merriam Pozzolith 534 NC HazMat Concrete Materials Inc 9900 W 75TH ST Merriam Polyheed 900 HazMat Shawnee Mission Medical Center W 74TH ST & GRANDVIEW ST Merriam Oxygen, (Cryogenic Liquid) HazMat Car Max #7173 6801 E FRONTAGE RD Merriam Gasoline HazMat Lucent Technologies 9510 W 67TH ST Merriam SULFURIC ACID HazMat Lucent Technologies 9510 W 67TH ST Merriam Copper Hospital Shawnee Mission Medical Center 9100 West 74th Street Merriam
Nursing Home Trinity Nursing and Rehab Center 9700 W 62nd St Merriam
Nursing Home South Park House 9322 W 50th Ter Merriam
Police Merriam Police 9010 E 62ND ST Merriam
School Crestview Elementary 6101 Craig Rd Merriam
School Merriam Park Elementary 6100 Mastin St Merriam
County Facility Med-Act 1131, (Merriam Fire Station) 9000 W. 62nd Terr Merriam, KS
County Facility Crisis Residential Facility/Breakthrough House 8901 W. 50th Terr. Merriam, KS
County Facility Crisis Residential Facility/Breakthrough Garage 8903 W. 50th Terr. Merriam, KS
County Facility Supplemental Support Bldg 6235 Slater Merriam, KS
County Facility Antioch 8700 Shawnee Mission Park Merriam, KS
County Facility JCDS - Mackey House 5738 Mackey St Merriam, KS 66202
County Facility 57th St. 8536 W. 57th St. Merriam, KS 66202
Government Office Merriam City Hall 9000 W 62nd Ter Merriam, KS 66202-2815

Region L Hazard Mitigation Plan, 2013 Final
County Facility HSA Nutrition Site - Merriam/Shawnee Ctr 5701 Merriam Dr. Merriam, KS 66203
County Fuel Tank Myron K. Nelson 4800 Nall Mission
County Fuel Tank Myron K. Nelson 4800 Nall Mission
Fire Station Cons Dist 2, Stn 1 6400 MARTWAY ST Mission
HazMat Neff Printing Inc 7080 MARTWAY ST Mission
HazMat Neff Printing Inc 7080 MARTWAY ST Mission
HazMat Neff Printing Inc 7080 MARTWAY ST Mission
HazMat Neff Printing Inc 7080 MARTWAY ST Mission
HazMat Neff Printing Inc 7080 MARTWAY ST Mission
HazMat Neff Printing Inc 7080 MARTWAY ST Mission
HazMat Neff Printing Inc 7080 MARTWAY ST Mission
HazMat Jiffy Lube Store # 1460 5850 BROADMOOR ST Mission
Nursing Home Mission Springs Assisted Living I 5300 W 61st Pl Mission
Nursing Home Mission Springs Assisted Living II 5350 W 61st Pl Mission
Police Mission Police 6090 Woodson Rd Mission
RadMat DIAGNOSTIC TECHNOLOGY CONSULTANTS 5930 ROE AVE MISSION
RadMat MISSION MEDVET 5501 JOHNSON DR MISSION
School Horizons High 5900 Lamar Ave Mission
School Highlands Elementary 6200 Roe Ave Mission
School Rushton Elementary 6001 W 52nd St Mission
HazMat Indian Hills Country Club 6847 TOMAHAWK RD Mission Hills
Government Office Mission Hills City Hall 6300 State Line Rd Mission Hills, KS 66208 County Facility Martway Holding Station 5395 Martway Mission, KS
County Facility Myron K Nelson Treatment Plant Cmplx, Mission Ma 48th & Nall Mission, KS
County Facility Turkey Creek Plant 47th & Nall Mission, KS
County Facility Process Water Building 48th and Nall Mission, KS
County Facility Final Settling Tank - 2 Tanks 47th & Nall Mission, KS
County Facility Hazardous Materials Collection Facility 5801 Foxridge Dr. Mission, KS
County Facility Hazardous Materials Collection Facility 5801 Foxridge Dr. Mission, KS
County Facility Hazardous Materials Collection Facility 5801 Foxridge Dr. Mission, KS
County Facility Hazardous Materials Collection Facility 5801 Foxridge Dr. Mission, KS
County Facility Storage of Command Post (Fire District #2) 6400 Martway Mission, KS
County Facility Foxridge Towers, Antenna Site 5700 Broadmoor Mission, KS
County Facility Northeast Offices 6000 Lamar Ave Mission, KS 66202
County Facility Radio Tower 6000 Lamar Ave Mission, KS 66202

Region L Hazard Mitigation Plan, 2013 Final
Government Office Mission City Hall 6090 Woodson Rd Mission, KS 66202
Government Office Northeast Office County Office 6000 Lamar Mission, KS 66202
Government Office Motor Vehicle Registration 6000 Lamar Mission, KS 66202
Government Office Driver License Bureau 6507 Johnson Dr Mission, KS 66202
County Facility JCDS - Ash 5117 Ash Mission, KS 66205
HazMat Danisco Cultor USA, Inc 201 New Century Pkwy New Century
HazMat Danisco Cultor USA, Inc 201 New Century Pkwy New Century
HazMat Danisco Cultor USA, Inc 201 New Century Pkwy New Century
HazMat Danisco Cultor USA, Inc 201 New Century Pkwy New Century
HazMat Kerry Sweet Ingredients 400 PRAIRIE VILLAGE DR New Century
HazMat Kerry Sweet Ingredients 400 PRAIRIE VILLAGE DR New Century
HazMat Kerry Sweet Ingredients 400 PRAIRIE VILLAGE DR New Century
HazMat CFS West Holdings, Inc. 101 PRAIRIE VILLAGE DR New Century
HazMat CFS West Holdings, Inc. 101 PRAIRIE VILLAGE DR New Century
HazMat Sprint Communications Company L.P. - KRDC/North 600 NEW CENTURY PKWY New Century
HazMat Sprint Communications Company L.P. - KRDC/North 600 NEW CENTURY PKWY New Century
HazMat Sprint Communications Company L.P. - KRDC/North 600 NEW CENTURY PKWY New Century
HazMat Executive Beechcraft Inc 280 GARDNER DR New Century
HazMat Executive Beechcraft Inc 280 GARDNER DR New Century
HazMat Unilever Bestfoods 27080 W 159TH ST New Century
HazMat De Elliotte Co., Inc. 201 PRAIRIE VILLAGE DR New Century
HazMat De Elliotte Co., Inc. 201 PRAIRIE VILLAGE DR New Century
HazMat Graphic Technology, Inc. 301 GARDNER DR New Century
HazMat Heartland Precision Fasteners. Inc. 301 PRAIRIE VILLAGE DR New Century
HazMat Heartland Precision Fasteners. Inc. 301 PRAIRIE VILLAGE DR New Century
HazMat Heartland Precision Fasteners. Inc. 301 PRAIRIE VILLAGE DR New Century
HazMat Heartland Precision Fasteners. Inc. 301 PRAIRIE VILLAGE DR New Century
HazMat Heartland Precision Fasteners. Inc. 301 PRAIRIE VILLAGE DR New Century
HazMat Heartland Precision Fasteners. Inc. 301 PRAIRIE VILLAGE DR New Century
HazMat Heartland Precision Fasteners. Inc. 301 PRAIRIE VILLAGE DR New Century
HazMat Heartland Precision Fasteners. Inc. 301 PRAIRIE VILLAGE DR New Century
HazMat Heartland Precision Fasteners. Inc. 301 PRAIRIE VILLAGE DR New Century
HazMat Heartland Precision Fasteners. Inc. 301 PRAIRIE VILLAGE DR New Century
HazMat Heartland Precision Fasteners. Inc. 301 PRAIRIE VILLAGE DR New Century
HazMat Heartland Precision Fasteners. Inc. 301 PRAIRIE VILLAGE DR New Century

Region L Hazard Mitigation Plan, 2013 Final
HazMat Heartland Precision Fasteners. Inc. 301 PRAIRIE VILLAGE DR New Century
HazMat Heartland Precision Fasteners. Inc. 301 PRAIRIE VILLAGE DR New Century
HazMat Heartland Precision Fasteners. Inc. 301 PRAIRIE VILLAGE DR New Century
HazMat Heartland Precision Fasteners. Inc. 301 PRAIRIE VILLAGE DR New Century
HazMat Heartland Precision Fasteners. Inc. 301 PRAIRIE VILLAGE DR New Century
HazMat Heartland Precision Fasteners. Inc. 301 PRAIRIE VILLAGE DR New Century
HazMat Heartland Precision Fasteners. Inc. 301 PRAIRIE VILLAGE DR New Century
HazMat Heartland Precision Fasteners. Inc. 301 PRAIRIE VILLAGE DR New Century
HazMat Heartland Precision Fasteners. Inc. 301 PRAIRIE VILLAGE DR New Century
HazMat Heartland Precision Fasteners. Inc. 301 PRAIRIE VILLAGE DR New Century
HazMat Heartland Precision Fasteners. Inc. 301 PRAIRIE VILLAGE DR New Century
HazMat Heartland Precision Fasteners. Inc. 301 PRAIRIE VILLAGE DR New Century
HazMat Heartland Precision Fasteners. Inc. 301 PRAIRIE VILLAGE DR New Century
County Facility 14' x 70' Office Trailer 404 Mission Drive, New Ce New Century, Kansas County Facility Fred Allenbrand Criminal Justice 27745 W. 159th Street New Century, KS
County Facility Operations Center 27747 W. 159th Street New Century, KS
County Facility NORAD Building 400 400 Mission Parkway New Century, KS
County Facility NORAD Building 401 401 Mission Parkway New Century, KS
County Facility NORAD Building 402 402 Mission Parkway New Century, KS
County Facility Community Corrections Ctr, Building 1 101 Roeland Park New Century, KS
County Facility Community Corrections Ctr, Building 3 101 Roeland Park New Century, KS
County Facility New Century AirCenter, Admin Office, Building 9 1 New Century Pkwy New Century, KS
County Facility Howell Mfg., Building 114 201 Overland Park Place New Century, KS
County Facility Executive, Beechcraft #1 Aero Plaza New Century, KS
County Facility T-Hanger, Hangar A #3 Aero Plaza New Century, KS
County Facility T-Hanger, Hangar B #4 Aero Plaza New Century, KS
County Facility Dodson International #2 Aero Plaza New Century, KS
County Facility Royal Tractor Building 100 Mission Woods Drive New Century, KS
County Facility Kings Avionics 280 Gardner Drive (Buildi New Century, KS
County Facility Kings Avionics 290 Gardner Drive (Buildi New Century, KS
County Facility Kings Avionics 294 Gardner Drive (Buildi New Century, KS
County Facility Fire Station #3 490 New Century Pkwy New Century, KS
County Facility Little Bull Creek SSD #2 50 Leawood Dr. New Century, KS
County Facility Above Ground Water Tank
New Century, KS
County Facility Grinsted Sewer Pumping Station
New Century, KS

Region L Hazard Mitigation Plan, 2013 Final
County Facility Main Water Treatment Plant Pumping Station
New Century, KS
County Facility South Sewer Pumping Station
New Century, KS
County Facility South Water Pumping Station
New Century, KS
County Facility Countywide Communications Center 399 Mission Parkway New Century, KS
County Facility North Water Pumping Station Building 39B New Century New Century, KS
County Facility Water Treatment Plant
New Century, KS
County Facility Community Corrections Ctr, Building 2 101 Roeland Park New Century, KS
County Facility Kings Avionics 294 Gardner Drive (Buildi New Century, KS
County Facility Headworks Screen Rm. & Grit Removal 50 Leawood Dr. New Century, KS
County Facility Archives - Bldg #16 One Industrial Parkway New Century, KS
County Facility Programs Building 141 Mission Parkway New Century, KS
County Facility Housing Building, Building 4 173 Mission Parkway New Century, KS
County Facility Construction Trailer 401 Mission Parkway New Century, KS
County Facility Construction Trailer 401 Mission Parkway New Century, KS
County Facility Construction Trailer 402 Mission Parkway New Century, KS
County Facility Mobile Restroom Trailer 402 Mission Parkway New Century, KS
County Facility Maintenance Garage, Building 28 228 Gardner Drive New Century, KS 66031 County Fuel Tank Public Works Headquarters 1800 West 56 Highway Olathe
County Fuel Tank Public Works Headquarters 1800 West 56 Highway Olathe
County Fuel Tank Executive 15335 Pflumm Rd Olathe
County Fuel Tank Executive 15335 Pflumm Rd Olathe
County Fuel Tank Public Works Transit Building 1701 West 56 Highway Olathe
County Fuel Tank Public Works Transit Building 1701 West 56 Highway Olathe
County Fuel Tank Public Works Transit Building 1701 West 56 Highway Olathe
Fire Station Olathe, Stn 2 1705 N RENNER RD Olathe
Fire Station Olathe, Stn 3 14940 W 143RD ST Olathe
Fire Station Olathe, Stn 4 13301 MUR-LEN RD Olathe
Fire Station Olathe, Stn 5 1128 W SPRUCE RD Olathe
Fire Station Olathe, Stn 6 24200 COLLEGE BLVD Olathe
Fire Station Olathe, Stn 1 501 E US56 HWY Olathe
Fire Station Olathe, Stn 7 16040 S MUR-LEN RD Olathe
HazMat City of Olathe Water Treatment Plant # 1 600 S CURTIS ST Olathe
HazMat City of Olathe Water Treatment Plant # 1 600 S CURTIS ST Olathe
HazMat City of Olathe Water Treatment Plant # 2 27065 W 83RD ST Olathe
HazMat Century Concrete - Olathe 1340 W 149TH ST Olathe

Region L Hazard Mitigation Plan, 2013 Final
HazMat Century Concrete - Olathe 1340 W 149TH ST Olathe
HazMat Century Concrete - Olathe 1340 W 149TH ST Olathe
HazMat Century Concrete - Olathe 1340 W 149TH ST Olathe
HazMat Century Concrete - Olathe 1340 W 149TH ST Olathe
HazMat Century Concrete - Olathe 1340 W 149TH ST Olathe
HazMat Sysco Food Services of Kansas City 1915 E KANSAS CITY RD Olathe
HazMat Sysco Food Services of Kansas City 1915 E KANSAS CITY RD Olathe
HazMat Sysco Food Services of Kansas City 1915 E KANSAS CITY RD Olathe
HazMat Sysco Food Services of Kansas City 1915 E KANSAS CITY RD Olathe
HazMat Sysco Food Services of Kansas City 1915 E KANSAS CITY RD Olathe
HazMat Sysco Food Services of Kansas City 1915 E KANSAS CITY RD Olathe
HazMat Sysco Food Services of Kansas City 1915 E KANSAS CITY RD Olathe
HazMat Sysco Food Services of Kansas City 1915 E KANSAS CITY RD Olathe
HazMat ExxonMobil 1400 S HARRISON ST Olathe
HazMat ExxonMobil 1400 S HARRISON ST Olathe
HazMat ExxonMobil 1400 S HARRISON ST Olathe
HazMat ExxonMobil 1400 S HARRISON ST Olathe
HazMat ExxonMobil 1400 S HARRISON ST Olathe
HazMat ExxonMobil 1400 S HARRISON ST Olathe
HazMat ExxonMobil 1400 S HARRISON ST Olathe
HazMat ExxonMobil 1400 S HARRISON ST Olathe
HazMat ExxonMobil 1400 S HARRISON ST Olathe
HazMat ExxonMobil 1400 S HARRISON ST Olathe
HazMat ExxonMobil 1400 S HARRISON ST Olathe
HazMat ExxonMobil 1400 S HARRISON ST Olathe
HazMat ExxonMobil 1400 S HARRISON ST Olathe
HazMat ExxonMobil 1400 S HARRISON ST Olathe
HazMat ExxonMobil 1400 S HARRISON ST Olathe
HazMat ExxonMobil 1400 S HARRISON ST Olathe
HazMat ExxonMobil 1400 S HARRISON ST Olathe
HazMat ExxonMobil 1400 S HARRISON ST Olathe
HazMat ExxonMobil 1400 S HARRISON ST Olathe
HazMat ExxonMobil 1400 S HARRISON ST Olathe
HazMat ExxonMobil 1400 S HARRISON ST Olathe
HazMat ExxonMobil 1400 S HARRISON ST Olathe

Region L Hazard Mitigation Plan, 2013 Final
HazMat ExxonMobil 1400 S HARRISON ST Olathe
HazMat ExxonMobil 1400 S HARRISON ST Olathe
HazMat ExxonMobil 1400 S HARRISON ST Olathe
HazMat ExxonMobil 1400 S HARRISON ST Olathe
HazMat ExxonMobil 1400 S HARRISON ST Olathe
HazMat McAnany Oil Co Inc 1125 W 149TH ST Olathe
HazMat Southwestern Bell Mobile Systems 114 114 N WATER ST Olathe
HazMat Southwestern Bell Mobile Systems 114 114 N WATER ST Olathe
HazMat Kansas City Aviation Center 15325 S PFLUMM RD Olathe
HazMat Kansas City Aviation Center 15325 S PFLUMM RD Olathe
HazMat ITW Dymon 805 E OLD 56 HWY Olathe
HazMat ITW Dymon 805 E OLD 56 HWY Olathe
HazMat ITW Dymon 805 E OLD 56 HWY Olathe
HazMat ITW Dymon 805 E OLD 56 HWY Olathe
HazMat ITW Dymon 805 E OLD 56 HWY Olathe
HazMat ITW Dymon 805 E OLD 56 HWY Olathe
HazMat ITW Dymon 805 E OLD 56 HWY Olathe
HazMat ITW Dymon 805 E OLD 56 HWY Olathe
HazMat ITW Dymon 805 E OLD 56 HWY Olathe
HazMat ITW Dymon 805 E OLD 56 HWY Olathe
HazMat ITW Dymon 805 E OLD 56 HWY Olathe
HazMat ITW Dymon 805 E OLD 56 HWY Olathe
HazMat Pepsi Cola General Bottlers 1775 E KANSAS CITY RD Olathe
HazMat Pepsi Cola General Bottlers 1775 E KANSAS CITY RD Olathe
HazMat Pepsi Cola General Bottlers 1775 E KANSAS CITY RD Olathe
HazMat NuCo2 Inc 15350 S KEELER ST Olathe
HazMat Nitrogen Air Pressue Co Inc 15080 W 116TH ST Olathe
HazMat Nitrogen Air Pressue Co Inc 15080 W 116TH ST Olathe
HazMat KM Interstate Gas Transmission - Kenneth Rd Faci 3401 W 159TH ST Olathe
HazMat Federal Aviation Administration 250 S ROGERS RD Olathe
HazMat Vectron International Olathe Inc 620 N LINDENWOOD DR Olathe
HazMat Vectron International Olathe Inc 620 N LINDENWOOD DR Olathe
HazMat Honeywell - Olathe 23500 W 105TH ST Olathe
HazMat Honeywell - Olathe 23500 W 105TH ST Olathe
HazMat Honeywell - Olathe 23500 W 105TH ST Olathe

Region L Hazard Mitigation Plan, 2013 Final
HazMat Marble Creations Inc 1401 W OTT ST Olathe
HazMat Marley Cooling Technologies 1200 W MARLEY RD Olathe
HazMat LaFarge N A Inc - Olathe RM Plant 901 E OLD 56 HWY Olathe
HazMat LaFarge N A Inc - Olathe RM Plant 901 E OLD 56 HWY Olathe
HazMat LaFarge N A Inc - Olathe RM Plant 901 E OLD 56 HWY Olathe
HazMat LaFarge N A Inc - Olathe RM Plant 901 E OLD 56 HWY Olathe
HazMat LaFarge N A Inc - Olathe RM Plant 901 E OLD 56 HWY Olathe
HazMat Performance Plating Inc 435 S KANSAS AVE Olathe
HazMat Performance Plating Inc 435 S KANSAS AVE Olathe
HazMat Geiger Ready Mix Co Inc 875 E OLD 56 HWY Olathe
HazMat Geiger Ready Mix Co Inc 875 E OLD 56 HWY Olathe
HazMat Geiger Ready Mix Co Inc 875 E OLD 56 HWY Olathe
HazMat Geiger Ready Mix Co Inc 875 E OLD 56 HWY Olathe
HazMat Electrolux Construction Products 17400 W 119TH ST Olathe
HazMat Magellan Olathe Terminal 13745 W 135TH ST Olathe
HazMat Magellan Olathe Terminal 13745 W 135TH ST Olathe
HazMat W R Grace & Co - Conn GCP 701 S KANSAS AVE Olathe
HazMat W R Grace & Co - Conn GCP 701 S KANSAS AVE Olathe
HazMat W R Grace & Co - Conn GCP 701 S KANSAS AVE Olathe
HazMat W R Grace & Co - Conn GCP 701 S KANSAS AVE Olathe
HazMat W R Grace & Co - Conn GCP 701 S KANSAS AVE Olathe
HazMat W R Grace & Co - Conn GCP 701 S KANSAS AVE Olathe
HazMat W R Grace & Co - Conn GCP 701 S KANSAS AVE Olathe
HazMat W R Grace & Co - Conn GCP 701 S KANSAS AVE Olathe
HazMat W R Grace & Co - Conn GCP 701 S KANSAS AVE Olathe
HazMat W R Grace & Co - Conn GCP 701 S KANSAS AVE Olathe
HazMat W R Grace & Co - Conn GCP 701 S KANSAS AVE Olathe
HazMat W R Grace & Co - Conn GCP 701 S KANSAS AVE Olathe
HazMat W R Grace & Co - Conn GCP 701 S KANSAS AVE Olathe
HazMat W R Grace & Co - Conn GCP 701 S KANSAS AVE Olathe
HazMat W R Grace & Co - Conn GCP 701 S KANSAS AVE Olathe
HazMat W R Grace & Co - Conn GCP 701 S KANSAS AVE Olathe
HazMat W R Grace & Co - Conn GCP 701 S KANSAS AVE Olathe
HazMat W R Grace & Co - Conn GCP 701 S KANSAS AVE Olathe
HazMat W R Grace & Co - Conn GCP 701 S KANSAS AVE Olathe

Region L Hazard Mitigation Plan, 2013 Final
HazMat W R Grace & Co - Conn GCP 701 S KANSAS AVE Olathe
HazMat W R Grace & Co - Conn GCP 701 S KANSAS AVE Olathe
HazMat A T & T - Olathe 15085 W 116TH ST Olathe
HazMat Tyson Foods Inc - Olathe Distribution Center 20701 W 159TH ST Olathe
HazMat Tyson Foods Inc - Olathe Distribution Center 20701 W 159TH ST Olathe
HazMat The Industrial Fumigant Company 19745 W 159TH ST Olathe
HazMat The Industrial Fumigant Company 19745 W 159TH ST Olathe
HazMat Superior Bowen Asphalt Company 23555 W 151ST ST Olathe
HazMat Superior Bowen Asphalt Company 23555 W 151ST ST Olathe
HazMat Superior Bowen Asphalt Company 23555 W 151ST ST Olathe
HazMat Superior Bowen Asphalt Company 23555 W 151ST ST Olathe
HazMat Superior Bowen Asphalt Company 23555 W 151ST ST Olathe
HazMat ADM Arkady 100 S PANIPLUS RDWY Olathe
HazMat Asphalt Sales Company, Inc 23200 W 159TH ST Olathe
HazMat Jiffy Lube Store # 244 1114 E SANTA FE ST Olathe
HazMat Jiffy Lube Store # 2908 15305 W 135TH ST Olathe
HazMat Rental Service Corporation #298 11615 S ROGERS RD Olathe
HazMat Shawnee Rock Co, Plant # 1 - Lone Elm 1600 W 151ST ST Olathe
HazMat Shawnee Rock Co, Plant # 1 - Lone Elm 1600 W 151ST ST Olathe
HazMat Webco Manufacturing, Inc. 15750 S KEELER TER Olathe
HazMat Webco Manufacturing, Inc. 15750 S KEELER TER Olathe
HazMat Webco Manufacturing, Inc. 15750 S KEELER TER Olathe
HazMat Cintas Corp 2050 E KANSAS CITY RD Olathe
HazMat Cintas Corp 2050 E KANSAS CITY RD Olathe
HazMat Cintas Corp 2050 E KANSAS CITY RD Olathe
HazMat Cintas Corp 2050 E KANSAS CITY RD Olathe
HazMat Desco Coatings, Inc 616 N ROGERS RD Olathe
HazMat Jiffy Lube Store # 3041 20015 W 153RD ST Olathe
Hospital Olathe Medical Center 20333 West 151st Street Olathe
Jail Johnson County Adult Detention 101 N Kansas Ave Olathe
Jail Johnson County Juvenile Detention Center 915 W Spruce St Olathe
Nursing Home Royal Terrace Nursing/Rehab Center 201 E Flaming Rd Olathe
Nursing Home Johnson County Nursing Center 11875 S Sunset Olathe
Nursing Home Olathe Good Samaritan Center 20705 W 151st St Olathe
Nursing Home Pinnacle Ridge Nursing/Rehab Ctr. 400 S Rogers Rd Olathe

Region L Hazard Mitigation Plan, 2013 Final
Nursing Home Villa St Francis 16600 W 126th St Olathe
Nursing Home Aberdeen Village 17500 W 119th St Olathe
Nursing Home The Homestead of Olathe North 791 Somerset Ter Olathe
Nursing Home The Homestead of Olathe South 751 Somerset Ter Olathe
Nursing Home Assisted Lifestyles 625 Lincoln Olathe
Nursing Home Cedar Lake Village 15325 Lone Elm Rd Olathe
Nursing Home Bethesda Lutheran Homes/Faith 1 14155 W 113th St Olathe
Nursing Home Bethesda Lutheran Homes/Faith 2 14175 W 113th St Olathe
Nursing Home Bethesda Lutheran Homes/Faith 3 14235 W 113th St Olathe
Nursing Home Hoeger House 20911 W 153rd St Olathe
Police Olathe Police 501 E Old 56 Hwy Olathe
RadMat CITY OF OLATHE 100 E SANTA FE ST OLATHE
RadMat HONEYWELL INTERNATIONAL 23500 W 105TH ST OLATHE
RadMat OLATHE MEDICAL CENTER 20333 W 151ST ST OLATHE
School Liberty View Elementary 14800 S Greenwood St Olathe
School Havencroft Elementary 1700 E Sheridan St Olathe
School Briarwood Elementary 14101 S Brougham Dr Olathe
School Tomahawk Elementary 13820 S Brougham Dr Olathe
School Prairie Center Elementary 629 N Persimmon Dr Olathe
School Washington Elementary 1202 N Ridgeview Rd Olathe
School Olathe North High 600 E Prairie St Olathe
School Countryside Elementary 15800 W 124th Ter Olathe
School Heatherstone Elementary 13745 W 123rd St Olathe
School Walnut Grove Elementary 11800 Pflumm Rd Olathe
School Scarborough Elementary 2000 S Lindenwood Dr Olathe
School Olathe Northwest High School 21300 W College Blvd Olathe
School Regency Place Elementary 13250 S Greenwood St Olathe
School Lone Elm Service Building 21800 W 107th St Olathe
School Ravenwood Elementary 12211 S Clinton St Olathe
School Education Admin. Office 14160 Black Bob Rd Olathe
School Brougham Elementary 15500 S Brougham Dr Olathe
School Ridgeview Elementary 1201 E Elm St Olathe
School Meadow Lane Elementary 21880 College Blvd Olathe
School Black Bob Elementary 14701 S Brougham Dr Olathe
School Chisholm Trail Middle 16700 W 159th St Olathe

Region L Hazard Mitigation Plan, 2013 Final
School Olathe South High 1640 E 151st St Olathe
School Santa Fe Trail Middle 1100 N Ridgeview Rd Olathe
School W Dennis Support Center B 1021 S Pitt St Olathe
School Heartland Learning Center 1700 W Sheridan St Olathe
School Prairie Learning Center 1400 W Santa Fe St Olathe
School Jo Co Detention Center 915 W Spruce St Olathe
School Instructional Materials Center 14090 Black Bob Rd Olathe
School Sunny Side Elementary 16025 S Lindenwood Dr Olathe
School Indian Trail Middle 1440 E 151st St Olathe
School Fairview Elementary 600 N Marion St Olathe
School Westview Elementary 601 S Lee St Olathe
School Clearwater Creek Elementary 930 S Clearwater Creek Dr Olathe
School Oregon Trail Middle 1800 W Dennis Ave Olathe
School Rolling Ridge Elementary 1500 W Elm Ter Olathe
School Pioneer Trail Middle 15100 W 127th St Olathe
School College Blvd Activity Center 11031 S. Valley Rd Olathe
School Food Production Center 14140 Black Bob Rd Olathe
School W Dennis Support Center A and C 1005 S Pitt St Olathe
School USD 233 Transportation Center 18950 W 157th Ter Olathe
School Harmony Early Childhood Center 14030 S Black Bob Rd Olathe
School Clare Alternative Learning Center 540 S Rogers Rd Olathe
School Junior High #9 N Persimmion Dr Olathe
School Mahaffie Elementary 1300 N Nelson Rd Olathe
School Olathe East High 14545 W 127th St Olathe
School Cedar Creek Elementary 11150 S Clare Rd Olathe
School Prairie Trail Middle 21600 W 107th St Olathe
School Northview Elementary 905 N Walker St Olathe
School Heritage Elementary 1700 E Pawnee Dr Olathe
School Central Elementary 324 S Water St Olathe
School Green Springs Elementary 14675 S Alden St Olathe
School California Trail Middle 13775 W 133rd St Olathe
School Frontier Trail Middle 15300 W 143rd St Olathe
School Arbor Creek Elementary 16150 S Brougham Dr Olathe
School N. Lindenwood Support Center 315 N Lindenwood St Olathe
School Millcreek Center 311 E Park St Olathe

Region L Hazard Mitigation Plan, 2013 Final
School Activity Center 21201 W 159th St Olathe
School Operational Service Center 1500 W 56 Hwy Olathe
School Indian Creek Elementary 15800 W Indian Creek Pkwy Olathe
School ACCESS Program 650 SLindenwood Dr Olathe
School Madison Place Elementary 16651 S Warwick St Olathe
School Woodland Elementary 11601 S Woodland Rd Olathe
School Forest View Elementary 12567 S Canyon Dr Olathe
Sheriff Johnson County Sheriff 125 N Cherry St Olathe
County Facility Med-Act 1156, (Olathe FD) 24200 W. 111th Street Olathe, KS
County Facility Med-Act Support Services 205 E. Flaming Drive Olathe, KS
County Facility Juvenile Field Services & Corrections Admin 131-139 S. Kansas Avenue Olathe, KS
County Facility Administration Building 111 S. Cherry Olathe, KS
County Facility Election Commission 2101 E Kansas City Road Olathe, KS
County Facility Juvenile Detention 915 W. Spruce Olathe, KS
County Facility Central Warehouse 135 S. Fir Olathe, KS
County Facility Mental Health Center 1125 W. Spruce Olathe, KS
County Facility Hanger K 15100 Pflumm Olathe, KS
County Facility Executive Airport, Maintenance Garage 15335 Pflumm Road Olathe, KS
County Facility Public Works Office 1800 W. Old 56 Hwy Olathe, KS
County Facility Central Transmitting, Antenna Site 19100 W. 119th St. Olathe, KS
County Facility Hanger L 15100 Pflumm Olathe, KS
County Facility Hanger M 15100 Pflumm Olathe, KS
County Facility Hanger N 15100 Pflumm Olathe, KS
County Facility Hanger R 15100 Pflumm Olathe, KS
County Facility Hanger S 15100 Pflumm Olathe, KS
County Facility Hanger T 15100 Pflumm Olathe, KS
County Facility Hanger P 15100 Pflumm Olathe, KS
County Facility Hanger O 15100 Pflumm Olathe, KS
County Facility Air Traffic Control Tower 15100 Pflumm Olathe, KS
County Facility Kansas City Aviation Center 15100 Pflumm Olathe, KS
County Facility Kansas City Aviation Center 15100 Pflumm Olathe, KS
County Facility Kansas City Aviation Center 15100 Pflumm Olathe, KS
County Facility Air Associates 15100 Pflumm Olathe, KS
County Facility Kansas City Aviation Center 15100 Pflumm Olathe, KS
County Facility Air Associates 15100 Pflumm Olathe, KS

Region L Hazard Mitigation Plan, 2013 Final
County Facility Kansas City Aviation Center 15100 Pflumm Olathe, KS
County Facility Public Works Maintenance Area 1800 W. 56 Hwy Olathe, KS
County Facility Public Works Equipment Shed 1800 W. 56 Hwy Olathe, KS
County Facility Public Works Bridge Building 1800 W. 56 Hwy Olathe, KS
County Facility Public Works Salt Dome 1800 W. 56 Hwy Olathe, KS
County Facility Gazebo, Courthouse Lawn 100 S. Kansas Olathe, KS
County Facility Courthouse 100 S. Kansas Olathe, KS
County Facility Motor Vehicle-Olathe 1327 East Santa Fe, Ste A Olathe, KS
County Facility Med-Act 1151 205 E. Flaming Drive Olathe, KS
County Facility Colonial Building 110 W. Loula Olathe, KS
County Facility Storage Building 127 South Cherry Olathe, KS
County Facility Supported Living 616 N. Monroe Olathe, KS
County Facility Independent Living 200 E. Cedar Olathe, KS
County Facility Supervised Living 13850 S. Constance Court Olathe, KS
County Facility Wastewater Storage 1525 E. Spruce Olathe, KS
County Facility Dist. Court Service, Juvenile Intake 905 W. Spruce Olathe, KS 66061
County Facility Adult Detention Center 101 N. Kansas Ave Olathe, KS 66061
County Facility Court Services 18505 W. 119th Street Olathe, KS 66061
County Facility Adolescent Center For Treatment 301 N. Monroe Olathe, KS 66061
County Facility Transit Bldg#1 - Administration 1701 W 56 Highway Olathe, KS 66061
County Facility Sunset Office Building 11811 South Sunset Drive Olathe, KS 66061
County Facility Health & Human Services Center Complex 11875 S. Sunset Olathe, KS 66061
County Facility Transit Bldg#2 - Fueling Station 1701 W 56 Highway Olathe, KS 66061
County Facility Transit Bldg#3 - Bus Wash 1701 W 56 Highway Olathe, KS 66061
County Facility Transit Bldg#4 - Bus Parking Structure 1701 W 56 Highway Olathe, KS 66061
County Facility Facilities - Records 920 W Spruce Olathe, KS 66061
County Facility HSA Nutrition Site - Olathe 311 E. Park Olathe, KS 66061
County Facility Operations Center 19310 W. 159th Street Olathe, KS 66061
Government Office Johnson County Election Office 2101 E Kansas City Rd Olathe, KS 66061
Government Office Motor Vehicle Registration 1327 "A" E Santa Fe Olathe, KS 66061
Government Office Olathe City Hall 100 E Santa Fe Olathe, KS 66061
Government Office Sunset Office County Office 11811 South Sunset Dr Olathe, KS 66061
Government Office Kansas Highway Patrol Inspection Station 395 E Dennis Av Olathe, KS 66061
Government Office Johnson County Courthouse 100 N Kansas Olathe, KS 66061
County Facility JCDS - 154th St 2145 E 154th St Olathe, KS 66062
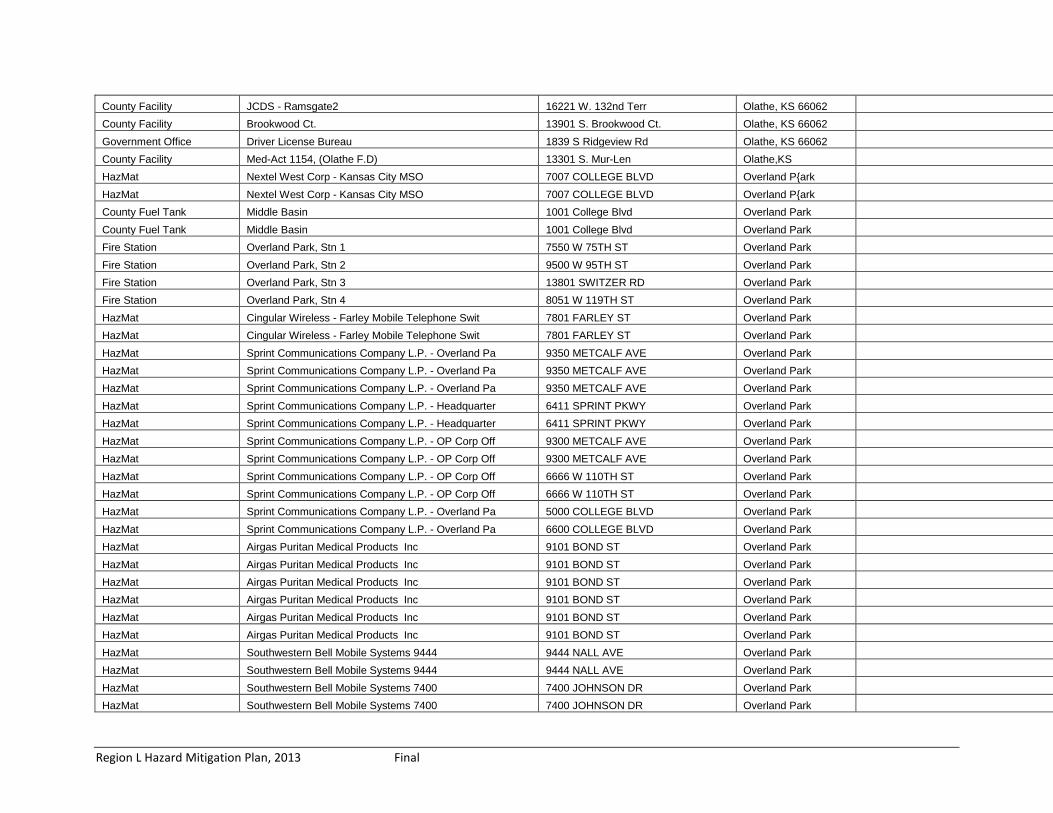
Region L Hazard Mitigation Plan, 2013 Final
County Facility JCDS - Ramsgate2 16221 W. 132nd Terr Olathe, KS 66062
County Facility Brookwood Ct. 13901 S. Brookwood Ct. Olathe, KS 66062
Government Office Driver License Bureau 1839 S Ridgeview Rd Olathe, KS 66062
County Facility Med-Act 1154, (Olathe F.D) 13301 S. Mur-Len Olathe,KS
HazMat Nextel West Corp - Kansas City MSO 7007 COLLEGE BLVD Overland P{ark
HazMat Nextel West Corp - Kansas City MSO 7007 COLLEGE BLVD Overland P{ark
County Fuel Tank Middle Basin 1001 College Blvd Overland Park
County Fuel Tank Middle Basin 1001 College Blvd Overland Park
Fire Station Overland Park, Stn 1 7550 W 75TH ST Overland Park
Fire Station Overland Park, Stn 2 9500 W 95TH ST Overland Park
Fire Station Overland Park, Stn 3 13801 SWITZER RD Overland Park
Fire Station Overland Park, Stn 4 8051 W 119TH ST Overland Park
HazMat Cingular Wireless - Farley Mobile Telephone Swit 7801 FARLEY ST Overland Park
HazMat Cingular Wireless - Farley Mobile Telephone Swit 7801 FARLEY ST Overland Park
HazMat Sprint Communications Company L.P. - Overland Pa 9350 METCALF AVE Overland Park
HazMat Sprint Communications Company L.P. - Overland Pa 9350 METCALF AVE Overland Park
HazMat Sprint Communications Company L.P. - Overland Pa 9350 METCALF AVE Overland Park
HazMat Sprint Communications Company L.P. - Headquarter 6411 SPRINT PKWY Overland Park
HazMat Sprint Communications Company L.P. - Headquarter 6411 SPRINT PKWY Overland Park
HazMat Sprint Communications Company L.P. - OP Corp Off 9300 METCALF AVE Overland Park
HazMat Sprint Communications Company L.P. - OP Corp Off 9300 METCALF AVE Overland Park
HazMat Sprint Communications Company L.P. - OP Corp Off 6666 W 110TH ST Overland Park
HazMat Sprint Communications Company L.P. - OP Corp Off 6666 W 110TH ST Overland Park
HazMat Sprint Communications Company L.P. - Overland Pa 5000 COLLEGE BLVD Overland Park
HazMat Sprint Communications Company L.P. - Overland Pa 6600 COLLEGE BLVD Overland Park
HazMat Airgas Puritan Medical Products Inc 9101 BOND ST Overland Park
HazMat Airgas Puritan Medical Products Inc 9101 BOND ST Overland Park
HazMat Airgas Puritan Medical Products Inc 9101 BOND ST Overland Park
HazMat Airgas Puritan Medical Products Inc 9101 BOND ST Overland Park
HazMat Airgas Puritan Medical Products Inc 9101 BOND ST Overland Park
HazMat Airgas Puritan Medical Products Inc 9101 BOND ST Overland Park
HazMat Southwestern Bell Mobile Systems 9444 9444 NALL AVE Overland Park
HazMat Southwestern Bell Mobile Systems 9444 9444 NALL AVE Overland Park
HazMat Southwestern Bell Mobile Systems 7400 7400 JOHNSON DR Overland Park
HazMat Southwestern Bell Mobile Systems 7400 7400 JOHNSON DR Overland Park

Region L Hazard Mitigation Plan, 2013 Final
HazMat Southwestern Bell Mobile Systems 8686 8680 COLLEGE BLVD Overland Park
HazMat Southwestern Bell Mobile Systems 8686 8680 COLLEGE BLVD Overland Park
HazMat Southwestern Bell Mobile System 14969 14969 METCALF AVE Overland Park
HazMat Southwestern Bell Mobile System 14969 14969 METCALF AVE Overland Park
HazMat Sam's Club # 4707 8300 W 135TH ST Overland Park
HazMat Universal Engraving Inc 9090 NIEMAN RD Overland Park
HazMat Universal Engraving Inc 9090 NIEMAN RD Overland Park
HazMat Universal Engraving Inc 9090 NIEMAN RD Overland Park
HazMat Universal Engraving Inc 9090 NIEMAN RD Overland Park
HazMat Universal Engraving Inc 9090 NIEMAN RD Overland Park
HazMat Universal Engraving Inc 9090 NIEMAN RD Overland Park
HazMat Jiffy Lube Store # 1180 9757 QUIVIRA RD Overland Park
HazMat Kansas Gas Service/Div of Oneonk-Mission Service 11401 W 89TH ST Overland Park
HazMat Kansas Gas Service/Div of Oneonk-Mission Service 11401 W 89TH ST Overland Park
HazMat Kansas Gas Service/Div of Oneonk-Overland Park - W 115TH ST & QUIVIRA RD Overland Park
HazMat Kansas City Power & Light - Johnson County Servi 8730 NIEMAN RD Overland Park
HazMat Kansas City Power & Light - Johnson County Servi 8730 NIEMAN RD Overland Park
HazMat Federal Express-IXDRC 8215 W 108TH TER Overland Park
HazMat Federal Express-IXDRC 8215 W 108TH TER Overland Park
HazMat Southern Star Central Pipeline (South Glavin) 11486 QUIVIRA RD Overland Park
HazMat Cardinal Health 11300 GLENWOOD ST Overland Park
HazMat Cardinal Health 11300 GLENWOOD ST Overland Park
HazMat Sprint Communications Company L.P. - Headquarter 6480 SPRINT PKWY Overland Park
HazMat Sprint Communications Company L.P. - Headquarter 6480 SPRINT PKWY Overland Park
HazMat Sprint Communications Company L.P. - Headquarter 6480 SPRINT PKWY Overland Park
HazMat Costco #369 12221 BLUE VALLEY PKWY Overland Park
HazMat Costco #369 12221 BLUE VALLEY PKWY Overland Park
HazMat GE Employers Reinsurance Corporation (GE ERC) 5200 METCALF AVE Overland Park
HazMat GE Employers Reinsurance Corporation (GE ERC) 5200 METCALF AVE Overland Park
HazMat GE Employers Reinsurance Corporation (GE ERC) 5200 METCALF AVE Overland Park
HazMat Jiffy Lube Store # 578 7000 W 95TH ST Overland Park
HazMat Jiffy Lube Store # 1180 9757 QUIVIRA RD Overland Park
HazMat Jiffy Lube Store # 1355 11940 RILEY ST Overland Park
HazMat Jiffy Lube Store # 1930 8625 W 151ST ST Overland Park
HazMat Jiffy Lube Store # 2217 10201 W 75TH ST Overland Park

Region L Hazard Mitigation Plan, 2013 Final
HazMat World Com - IVKPKS 7251 W 105TH ST Overland Park
HazMat World Com - IVKPKS 7251 W 105TH ST Overland Park
HazMat Sprint Communications Company 5454 W 110TH ST Overland Park
HazMat Sprint Communications Company 5454 W 110TH ST Overland Park
HazMat Sprint Communications Company 5454 W 110TH ST Overland Park
HazMat Nextel-Kansas City MSO 7007 COLLEGE BLVD Overland Park
HazMat Nextel-Kansas City MSO 7007 COLLEGE BLVD Overland Park
Hospital Overland Park Regional Medical Center 10500 Quivira Road Overland Park
Hospital Menorah Medical Park 5721 W 119th Street Overland Park
Hospital St. Lukes South Hospital 12300 Metcalf Avenue Overland Park
Hospital Children's Mercy South Hospital 5808 W 110th St Overland Park
Nursing Home Indian Creek Healthcare Center 6515 W 103rd St Overland Park
Nursing Home Manorcare Health Services 5211 W 103rd St Overland Park
Nursing Home Garden Terrace of Overland Park 7541 Switzer Rd Overland Park
Nursing Home Delmar Gardens of Overland Park 12100 W 109th St Overland Park
Nursing Home The Forum at Overland Park 3501 W 95th St Overland Park
Nursing Home Villa Saint Joseph 11901 Rosewood St Overland Park
Nursing Home Overland Park Nursing and Rehab 6501 W 75th St Overland Park
Nursing Home Village Shalom, Inc 5500 W 123rd St Overland Park
Nursing Home Cypress Court of Overland Park 11000 Oakmont Overland Park
Nursing Home Ashford Place 10665 Barkley Overland Park
Nursing Home Stratford Commons 12340 Quivira Rd Overland Park
Nursing Home Lamar Court 11909 Lamar Overland Park
Nursing Home Freedom Pointe of OP 9201 Foster Overland Park
Nursing Home Benson House 8518 Benson Overland Park
Nursing Home Conser House 7829 Conser Overland Park
Nursing Home Grandview Lane 8501 Grandview Overland Park
Nursing Home Specialty Hospital/Mid-America SNF 6509 W 103rd St Overland Park
Nursing Home Mid America Rehab. Hospital 5701 W 110th St Overland Park
Nursing Home Select Specialty Hospital/KC 10500 Quivira Rd Overland Park
Nursing Home Gables Assisted Living 11701 Nieman Rd Overland Park
Nursing Home The Rose Estates 12700 Antioch Rd Overland Park
Nursing Home Vintage Park at Stanley 14430 Metcalf Ave Overland Park
Nursing Home The Atriums 7300 W 107th St Overland Park
Nursing Home Heartland Surgical Spec. Hosp. LLC 10720 Nall Ave Overland Park

Region L Hazard Mitigation Plan, 2013 Final
Nursing Home Silvercrest at Deer Creek 13060 Metcalf Ave Overland Park
Police Overland Park Police 8500 Antioch Rd Overland Park
Police Overland Park Police 12400 Foster Rd Overland Park
Police Overland Park Police Department 11900 Westgate St Overland Park
RadMat APEX ENVIRONMENTAL CONSULTANTS 4800 COLLEGE BLV OVERLAND PARK
RadMat AQUATERRA ENVIRONMENTAL SYSTEMS 6980 W 153RD ST OVERLAND PARK
RadMat ASH GROVE CEMENT COMPANY 8900 INDIAN CREEK PKWY OVERLAND PARK
RadMat DBI INC 11660 W 90TH ST OVERLAND PARK
RadMat DIAGNOSTIC IMAGING CENTER 5520 COLLEGE BLV OVERLAND PARK
RadMat DRESSLER CONSULTING ENGINEERING 4425 INDIAN CREEK PKWY OVERLAND PARK
RadMat HNTB CORPORATION 7450 W 130TH ST OVERLAND PARK
RadMat JOHNSON COUNTY IMAGING CENTER 12000 W 110TH ST OVERLAND PARK
RadMat KANSAS CITY CANCER CENTER 12200 W 110TH ST OVERLAND PARK
RadMat MENORAH MEDICAL CENTER 5721 W 119TH ST OVERLAND PARK
RadMat MIDWEST CARDIOLOGY ASSOCIATES 10550 QUIVIRA RD OVERLAND PARK
RadMat OVERLAND PARK REGIONAL MEDICAL CENTER 10500 QUIVIRA RD OVERLAND PARK
RadMat PHYSICIANS REFERENCE LABORATORY 7800 W 110TH ST OVERLAND PARK
RadMat RENO CONSTRUCTION COMPANY 7355 W 162ND TER OVERLAND PARK
RadMat RICHARD A MORRISON MD 10500 MASTIN ST OVERLAND PARK
RadMat SAINT LUKE'S SOUTH HOSPITAL 12300 METCALF AVE OVERLAND PARK
RadMat SVERDRUP ENVIRONMENTAL 4400 COLLEGE BLV OVERLAND PARK
RadMat URS CORPORATION 10975 EL MONTE ST OVERLAND PARK
RadMat VETERINARY SPECIALTY CENTER 11950 W 110TH ST OVERLAND PARK
School Morse Elementary 15201 Monrovia St Overland Park
School Oak Hill Elementary 10200 W 124th St Overland Park
School Stanley Elementary 6121 W 158th St Overland Park
School Blue Valley Northwest High 13260 Switzer Rd Overland Park
School Oxford Middle 12500 Switzer Rd Overland Park
School Valley Park Elementary 12301 Lamar Ave Overland Park
School Overland Trail Elementary 6225 W 133rd St Overland Park
School Cottonwood Point Elementary 10521 W 129th St Overland Park
School Heartland Elementary 12775 Goodman St Overland Park
School Blue River Elementary 4701 W 163rd Ter Overland Park
School Overland Trail Middle 6201 W 133rd St Overland Park
School Harmony Middle 10101 W 141st St Overland Park

Region L Hazard Mitigation Plan, 2013 Final
School Blue Valley North High 12200 Lamar Ave Overland Park
School Indian Valley Elementary 11600 Knox St Overland Park
School Sunset Ridge Elementary 14901 England Ave Overland Park
School Blue Valley Middle 4601 W 163rd Ter Overland Park
School District OfficeCampus 15020 Metcalf Ave Overland Park
School Arrowhead Administrative Center 6601 Santa Fe Dr Overland Park
School Lakewood Elementary 14600 Lamar Ave Overland Park
School Lakewood Middle 6601 Edgewater Dr Overland Park
School Harmony Elementary 14140 Grant St Overland Park
School John Diemer Elementary 9600 Lamar Ave Overland Park
School Apache Elementary 8910 Goddard St Overland Park
School Brookridge Elementary 9920 Lowell St Overland Park
School East Antioch Elementary 7342 Lowell St Overland Park
School Oak Park-Carpenter Elementary 10000 Nieman Rd Overland Park
School Overland Park Elementary 8150 Santa Fe Dr Overland Park
School Pawnee Elementary 9501 W 91st St Overland Park
School Santa Fe Trail Elementary 7100 Lamar Ave Overland Park
School Tomahawk Elementary 6301 W 78th St Overland Park
School Trailwood Elementary 5101 W 95th St Overland Park
School Antioch Middle 8200 W 71st St Overland Park
School Indian Woods Middle 9700 Woodson St Overland Park
School Westridge Middle 9300 Nieman Rd Overland Park
School SM North High 7401 Johnson Dr Overland Park
School SM South High 5800 W 107th St Overland Park
School SM West High 8800 W 85th St Overland Park
School Dorothy Moody Elementary 10101 England Overland Park
School Comanche Elementary 8200 Grant St Overland Park
School Indian Creek Technology Center 4401 W 103rd St Overland Park
School Broadmoor Technical Center 6701 W 83rd St Overland Park
School McEachen Admin. Center 7235 Antioch Rd Overland Park
School SM Instructional Support Center 9700 W 96th St Overland Park
School Center for International Studies 5800 W. 107th St Overland Park
School Blue Valley Academy 7500 W 149th Ter Overland Park
School Shawnee Mission Operations and Maintenance 11475 W 93rd St Overland Park
School Sunrise Point 15800 Roe Ave Overland Park

Region L Hazard Mitigation Plan, 2013 Final
School Bentwood Elementary 13000 Bond St Overland Park
School Pleasant Ridge Elementary 12235 Rosehill Rd Overland Park
County Facility Med-Act 1103, North Battalion Chief 8500 Grandview Overland Park, KS
County Facility Med-Act 1144, (O.P. Fire Dept) 8051 W 119th St. Overland Park, KS
County Facility MedAct, 1143 & 1104, O.P. Battalion Chief (OPFD) 13801 Switzer Overland Park, KS
County Facility Blue Valley Library 9000 W. 151st Street Overland Park, KS
County Facility Operations Building 2523 W. 151st St. Overland Park, KS
County Facility Oak Park 9500 Bluejacket Overland Park, KS
County Facility Med-Act 1142 (OPFD 2) 9500 W. 95th St Overland Park, KS
County Facility Aeration Blower Building 2523 W. 151st St. Overland Park, KS
County Facility Med-Act 1141 (OPFD 1) 7550 W. 75th St Overland Park, KS
County Facility Med-Act 1145 (OPFD 5) 15935 Metcalf Overland Park, KS
County Facility M.A.S.T. Bldg, Antenna Site 7500 W. 110th St. Overland Park, KS
County Facility Overland Park PD Tower, Antenna Site 8500 Antioch Overland Park, KS
County Facility Mental Health Center - Blue Valley 15118 Glenwood Overland Park, KS
County Facility JCDS-Goddard 9443 Goddard Overland Park, KS
County Facility JCDS-98th Circle 8403 W. 98th Circle Overland Park, KS
County Facility JCDS - 54th Terr 8202 W. 54th Terr Overland Park, KS 66202 County Facility JCDS - Antioch 7985 Antioch Overland Park, KS 66204 County Facility JCDS-Nall Hills 5608 W. 99th Terr. Overland Park, KS 66207 County Facility JCDS - Lamar Ave 7916 Lamar Ave Overland Park, KS 66208 County Facility HSA Nutrition Site - Blue Valley 6100 W 127th St Overland Park, KS 66209 County Facility Middle Basin 10001 College Blvd. Overland Park, KS 66210 County Facility HSA Nutrition Site - Overland Park 6300 W 87th St Overland Park, KS 66210 County Facility Aeration Basin #1 10001 College Blvd. Overland Park, KS 66210 County Facility Overland Park Convention Center, Sheraton Hotel 6100 College Blvd Overland Park, KS 66211 County Facility Central Resource Library 9875 W. 87th St. Overland Park, KS 66212 County Facility JCDS - Robinson 1 9301 Robinson Overland Park, KS 66212 County Facility JCDS - Hayes 9141 Hayes Overland Park, KS 66212 County Facility JCDS - Robinson 2 9300 Robinson Overland Park, KS 66212 County Facility 101st Terr. 9032 W. 101st Terr. Overland Park, KS 66212 Government Office Overland Park City Hall 8500 Santa Fe Dr Overland Park, KS 66212 County Facility Med-Act Community Education 11902 Lowell Overland Park, KS 66213 County Facility Switzer House 8525 Switzer Overland Park, KS 66214 County Facility Warehouse - Library Storage 11313-17 West 87th Terrac Overland Park, KS 66214

Region L Hazard Mitigation Plan, 2013 Final
County Facility JCDS - Farley 8050 Farley #305 Overland Park, KS 66214 County Facility SWB Cellular Tower Site 8004 W. 159th Overland Park, KS 66223 Nursing Home Brighton Gardens/Prairie Village 7105 Mission Rd Prairie Vill
Nursing Home Somerset-Claridge Court 8101 Mission Rd Prairie Vill
Fire Station Cons Dist 2, Stn 2 3921 W 63RD ST Prairie Village
Fire Station Cons Dist 2, Stn 3 9011 ROE AVE Prairie Village
Police Prairie Village Police 7710 Mission Rd Prairie Village
School Belinder Elementary 7230 Belinder Ave Prairie Village
School Briarwood Elementary 5300 W 86th St Prairie Village
School Corinth Elementary 8301 Mission Rd Prairie Village
School Prairie Elementary 6642 Mission Rd Prairie Village
School Indian Hills Middle 6400 Mission Rd Prairie Village
School Mission Valley Middle 8500 Mission Rd Prairie Village
School SM East High 7500 Mission Rd Prairie Village
County Facility Corinth 8100 Mission Road Prairie Village, KS
County Facility Nall Avenue Holding Station 5500 Nall Avenue Prairie Village, KS
County Facility Dykes Branch Pumping Station 3535 Somerset Prairie Village, KS
County Facility Med-Act 1133, (Fire Dist. #2) 3921 W. 63rd Prairie Village, KS
County Facility Brush Creek Pumping Station 7401 Roe Blvd Prairie Village, KS 66208 County Facility HSA Nutrition Site - Prairie Village Ctr 7720 Mission Rd Prairie Village, KS 66208 County Facility JCDS - Nall 8032 Nall Prairie Village, KS 66208 County Facility JCDS - 76th 6200 W. 76th Prairie Village, KS 66208 Government Office Prairie Village City Hall 7700 Mission Rd Prairie Village, KS 66208 County Facility Med-Act 1134, (Fire Dist. #2) 9011 Roe Prairie Village,KS
Police Roeland Park Police 4600 W 51st St Roeland Park
School Roesland Elementary 4900 Parish Dr Roeland Park
County Facility HSA MultiService Center - Roeland Park 4850 Rosewood Drive Roeland Park, KS
County Facility Cedar-Roe 5120 Cedar Roeland Park, KS
Government Office Roeland Park City Hall 4600 W 51st St Roeland Park, KS 66205 County Fuel Tank Shawnee Mission Park Maintenance 7700 Renner Road Shawnee
County Fuel Tank Shawnee Mission Park Maintenance 7700 Renner Road Shawnee
County Fuel Tank Tomahawk Hills Golf Course Maintenance 17501 Midland Drive Shawnee
County Fuel Tank Tomahawk Hills Golf Course Maintenance 17501 Midland Drive Shawnee
County Fuel Tank Tomahawk Hills Golf Course Maintenance 17501 Midland Drive Shawnee
County Fuel Tank Streamway Parks System/Nursery 19902 Shawnee Mission Par Shawnee

Region L Hazard Mitigation Plan, 2013 Final
Fire Station Shawnee, Stn 1 6535 QUIVIRA RD Shawnee
Fire Station Shawnee, Stn 2 19210 MIDLAND DR Shawnee
Fire Station Shawnee, Stn 3 6805 HEDGE LANE TER Shawnee
HazMat Ted Manufacturing Corporation 11415 JOHNSON DR Shawnee
HazMat Ted Manufacturing Corporation 11415 JOHNSON DR Shawnee
HazMat Ted Manufacturing Corporation 11415 JOHNSON DR Shawnee
HazMat Ted Manufacturing Corporation 11415 JOHNSON DR Shawnee
HazMat Southwestern Bell Mobile Systems 6134 6134 PFLUMM RD Shawnee
HazMat Southwestern Bell Mobile Systems 6134 6134 PFLUMM RD Shawnee
HazMat Hogden Powder Co, Shawnee 6335 LIND RD Shawnee
HazMat Hogden Powder Co, Shawnee 6335 LIND RD Shawnee
HazMat Hogden Powder Co, Shawnee 6335 LIND RD Shawnee
HazMat Hogden Powder Co, Shawnee 6335 LIND RD Shawnee
HazMat Nazdar - Shawnee 8501 HEDGE LANE TER Shawnee
HazMat Nazdar - Shawnee 8501 HEDGE LANE TER Shawnee
HazMat Nazdar - Shawnee 8501 HEDGE LANE TER Shawnee
HazMat Nazdar - Shawnee 8501 HEDGE LANE TER Shawnee
HazMat Nazdar - Shawnee 8501 HEDGE LANE TER Shawnee
HazMat Nazdar - Shawnee 8501 HEDGE LANE TER Shawnee
HazMat Nazdar - Shawnee 8501 HEDGE LANE TER Shawnee
HazMat Nazdar - Shawnee 8501 HEDGE LANE TER Shawnee
HazMat Nazdar - Shawnee 8501 HEDGE LANE TER Shawnee
HazMat Nazdar - Shawnee 8501 HEDGE LANE TER Shawnee
HazMat Nazdar - Shawnee 8501 HEDGE LANE TER Shawnee
HazMat Nazdar - Shawnee 8501 HEDGE LANE TER Shawnee
HazMat Nazdar - Shawnee 8501 HEDGE LANE TER Shawnee
HazMat Nazdar - Shawnee 8501 HEDGE LANE TER Shawnee
HazMat Nazdar - Shawnee 8501 HEDGE LANE TER Shawnee
HazMat Nazdar - Shawnee 8501 HEDGE LANE TER Shawnee
HazMat Nazdar - Shawnee 8501 HEDGE LANE TER Shawnee
HazMat Nazdar - Shawnee 8501 HEDGE LANE TER Shawnee
HazMat Nazdar - Shawnee 8501 HEDGE LANE TER Shawnee
HazMat Nazdar - Shawnee 8501 HEDGE LANE TER Shawnee
HazMat Nazdar - Shawnee 8501 HEDGE LANE TER Shawnee
HazMat Nazdar - Shawnee 8501 HEDGE LANE TER Shawnee

Region L Hazard Mitigation Plan, 2013 Final
HazMat Intervet Inc 12707 W 63RD ST Shawnee
HazMat Kansas Gas Service/Div of Onenok -Shawnee North W 75TH ST & NIEMAN RD Shawnee
HazMat Truegreen Chemlawn 8420 COLE PKWY Shawnee
HazMat Truegreen Chemlawn 8420 COLE PKWY Shawnee
HazMat Truegreen Chemlawn 8420 COLE PKWY Shawnee
HazMat Truegreen Chemlawn 8420 COLE PKWY Shawnee
HazMat Truegreen Chemlawn 8420 COLE PKWY Shawnee
HazMat Truegreen Chemlawn 8420 COLE PKWY Shawnee
HazMat Truegreen Chemlawn 8420 COLE PKWY Shawnee
HazMat Truegreen Chemlawn 8420 COLE PKWY Shawnee
HazMat Truegreen Chemlawn 8420 COLE PKWY Shawnee
HazMat Truegreen Chemlawn 8420 COLE PKWY Shawnee
HazMat Truegreen Chemlawn 8420 COLE PKWY Shawnee
HazMat Truegreen Chemlawn 8420 COLE PKWY Shawnee
HazMat Carquest 7751 NIEMAN RD Shawnee
HazMat Deffenbaugh Industries Inc 18181 W 53RD ST Shawnee
HazMat Deffenbaugh Industries Inc 18181 W 53RD ST Shawnee
HazMat Deffenbaugh Industries Inc 18181 W 53RD ST Shawnee
HazMat Deffenbaugh Industries Inc 18181 W 53RD ST Shawnee
HazMat Deffenbaugh Industries Inc 18181 W 53RD ST Shawnee
HazMat Deffenbaugh Industries Inc 18181 W 53RD ST Shawnee
HazMat Deffenbaugh Industries Inc 18181 W 53RD ST Shawnee
HazMat Southern Star Central Pipeline (Glavin) 11103 W 75TH ST Shawnee
HazMat Xsis Electronics Inc 12620 SHAWNEE MISSION PKW Shawnee
HazMat FedEx Ground 8000 COLE PKWY Shawnee
HazMat Bayer Healthcare LLC AH Div 12707 SHAWNEE MISSION PKW Shawnee
HazMat Bayer Healthcare LLC AH Div 12707 SHAWNEE MISSION PKW Shawnee
HazMat Bayer Healthcare LLC AH Div 12707 SHAWNEE MISSION PKW Shawnee
HazMat Bayer Healthcare LLC AH Div 12707 SHAWNEE MISSION PKW Shawnee
HazMat Bayer Healthcare LLC AH Div 12707 SHAWNEE MISSION PKW Shawnee
HazMat Bayer Healthcare LLC AH Div 12707 SHAWNEE MISSION PKW Shawnee
HazMat Bayer Healthcare LLC AH Div 12707 SHAWNEE MISSION PKW Shawnee
HazMat Bayer Healthcare LLC AH Div 12707 SHAWNEE MISSION PKW Shawnee
HazMat Bayer Healthcare LLC AH Div 12707 SHAWNEE MISSION PKW Shawnee
HazMat Bayer Healthcare LLC AH Div 12707 SHAWNEE MISSION PKW Shawnee

Region L Hazard Mitigation Plan, 2013 Final
HazMat Bayer Healthcare LLC AH Div 12707 SHAWNEE MISSION PKW Shawnee
HazMat Bayer Healthcare LLC AH Div 12707 SHAWNEE MISSION PKW Shawnee
HazMat Bayer Healthcare LLC AH Div 12707 SHAWNEE MISSION PKW Shawnee
HazMat Bayer Healthcare LLC AH Div 12707 SHAWNEE MISSION PKW Shawnee
HazMat Bayer Healthcare LLC AH Div 12707 SHAWNEE MISSION PKW Shawnee
HazMat Bayer Healthcare LLC AH Div 12707 SHAWNEE MISSION PKW Shawnee
HazMat Bayer Healthcare LLC AH Div 12707 SHAWNEE MISSION PKW Shawnee
HazMat Bayer Healthcare LLC AH Div 12707 SHAWNEE MISSION PKW Shawnee
HazMat Bayer Healthcare LLC AH Div 12707 SHAWNEE MISSION PKW Shawnee
HazMat Bayer Healthcare LLC AH Div 12707 SHAWNEE MISSION PKW Shawnee
HazMat Bayer Healthcare LLC AH Div 12707 SHAWNEE MISSION PKW Shawnee
HazMat Bayer Healthcare LLC AH Div 12707 SHAWNEE MISSION PKW Shawnee
HazMat Bayer Healthcare LLC AH Div 12707 SHAWNEE MISSION PKW Shawnee
HazMat Vita Craft Corporation 11100 W 58TH ST Shawnee
HazMat Vita Craft Corporation 11100 W 58TH ST Shawnee
HazMat Vita Craft Corporation 11100 W 58TH ST Shawnee
HazMat Vita Craft Corporation 11100 W 58TH ST Shawnee
HazMat McLane Foodservice 8200 MONTICELLO RD Shawnee
HazMat McLane Foodservice 8200 MONTICELLO RD Shawnee
HazMat Shawnee Rock Co, Plant # 2 & 4 - Johnson Co Land 17955 HOLLIDAY DR Shawnee
HazMat Shawnee Rock Co, Plant # 2 & 4 - Johnson Co Land 17955 HOLLIDAY DR Shawnee
HazMat Shawnee Rock Co, Plant # 2 & 4 - Johnson Co Land 17955 HOLLIDAY DR Shawnee
HazMat VISTAR/ USA of KC 10600 W 79TH ST Shawnee
HazMat VISTAR/ USA of KC 10600 W 79TH ST Shawnee
HazMat Wall Ties & Forms 4000 BONNER INDUSTRIAL DR Shawnee
HazMat Wall Ties & Forms 4000 BONNER INDUSTRIAL DR Shawnee
HazMat Wall Ties & Forms 4000 BONNER INDUSTRIAL DR Shawnee
HazMat Wall Ties & Forms 4000 BONNER INDUSTRIAL DR Shawnee
HazMat Wall Ties & Forms 4000 BONNER INDUSTRIAL DR Shawnee
HazMat Wall Ties & Forms 4000 BONNER INDUSTRIAL DR Shawnee
HazMat Wall Ties & Forms 4000 BONNER INDUSTRIAL DR Shawnee
HazMat Wall Ties & Forms 4000 BONNER INDUSTRIAL DR Shawnee
Nursing Home Sharon Lane Nursing Home 10315 Johnson Dr Shawnee
Nursing Home Shawnee Gardens Healthcare/Rehab 6416 Long St Shawnee
Nursing Home The Sweet Life at Shawnee 11400 W 65th St Shawnee

Region L Hazard Mitigation Plan, 2013 Final
Nursing Home The Sweet Life at Rosehill 12802 Johnson Dr Shawnee
Nursing Home Shawnee Heartland 16125 Midland Dr Shawnee
Nursing Home Jo Co Church of Christ Adult Day C 7300 Neiman Rd Shawnee
Police Shawnee Police 6535 Quivira Rd Shawnee
RadMat A A I INTERNATIONAL INC 12400 SHAWNEE MISSION P SHAWNEE
RadMat DEFFENBAUGH INDUSTRIES 18181 W 53RD ST SHAWNEE
RadMat MID-AMERICA CARDIOLOGY ASSOCIATES 7405 RENNER RD SHAWNEE
School Mize Elementary 7301 Mize Rd Shawnee
School Mill Valley High 5900 Monticello Rd Shawnee
School Clear Creek Elementary 5815 Monticello Rd Shawnee
School Monticello Trails Middle 6100 Monticello Rd Shawnee
School Riverview Elementary 21550 W 47th St Shawnee
School Rhein Benninghoven Elementary 6720 Caenen St Shawnee
School Bluejacket-Flint Elementary 11615 W 49th Ter Shawnee
School Broken Arrow Elementary 5901 Alden Rd Shawnee
School Nieman Elementary 10917 W 67th St Shawnee
School Shawanoe Elementary 11230 W 75th St Shawnee
School Hocker Grove Middle 10400 Johnson Dr Shawnee
School SM Northwest High 12701 W 67th St Shawnee
School Raymond Marsh Elementary 5642 Rosehill Rd Shawnee
School Horizon Elementary 7210 Chouteau St Shawnee
School Prairie Ridge Elementary 22405 Clear Creek Pkwy Shawnee
RadMat CARDIOLOGY SERVICES 7301 FRONTAGE RD SHAWNEE MISSION RadMat CENTRAL STATES MEDICAL 5500 BUENA VISTA ST SHAWNEE MISSION RadMat KRAMER & CROUSE CARDIOLOGY 7301 E FRONTAGE RD SHAWNEE MISSION RadMat MID-AMERICA CALIBRATIONS 5500 BUENA VISTA ST SHAWNEE MISSION RadMat SHAWNEE MISSION MEDICAL CENTER 9100 W 74TH ST SHAWNEE MISSION County Facility Storage of Ambulance (Shanwee Mission Ford) 11501 Shawnee Mission Pkw Shawnee Mission, KS 66203 HazMat Jiffy Lube Store # 496 11800 W 63RD ST Shawnee
County Facility Med-Act 1132, (Shawnee Fire Station) 6501 Quivira Shawnee, KS
County Facility Med-Act 1130 (Shawnee F.D.) 6805 Hedge Lane Shawnee, KS
County Facility Shawnee Mission Park, Antenna Site 7700 Renner Road Shawnee, KS
County Facility Community Support Services (CSS) 6440 Nieman Road Shawnee, KS
County Facility Shawnee 13811 Johnson Dr. Shawnee, KS
County Facility Mill Creek SSD #3 Pump Station 7325 Renner Road Shawnee, KS
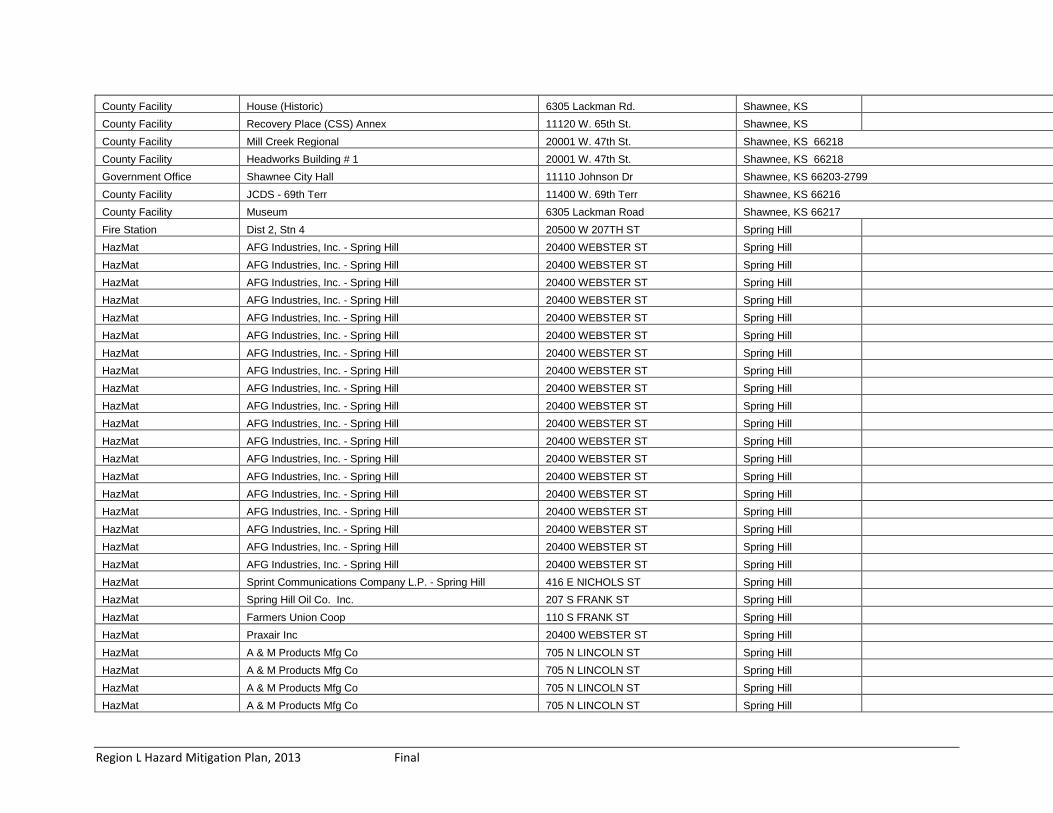
Region L Hazard Mitigation Plan, 2013 Final
County Facility House (Historic) 6305 Lackman Rd. Shawnee, KS
County Facility Recovery Place (CSS) Annex 11120 W. 65th St. Shawnee, KS
County Facility Mill Creek Regional 20001 W. 47th St. Shawnee, KS 66218 County Facility Headworks Building # 1 20001 W. 47th St. Shawnee, KS 66218 Government Office Shawnee City Hall 11110 Johnson Dr Shawnee, KS 66203-2799 County Facility JCDS - 69th Terr 11400 W. 69th Terr Shawnee, KS 66216 County Facility Museum 6305 Lackman Road Shawnee, KS 66217 Fire Station Dist 2, Stn 4 20500 W 207TH ST Spring Hill
HazMat AFG Industries, Inc. - Spring Hill 20400 WEBSTER ST Spring Hill
HazMat AFG Industries, Inc. - Spring Hill 20400 WEBSTER ST Spring Hill
HazMat AFG Industries, Inc. - Spring Hill 20400 WEBSTER ST Spring Hill
HazMat AFG Industries, Inc. - Spring Hill 20400 WEBSTER ST Spring Hill
HazMat AFG Industries, Inc. - Spring Hill 20400 WEBSTER ST Spring Hill
HazMat AFG Industries, Inc. - Spring Hill 20400 WEBSTER ST Spring Hill
HazMat AFG Industries, Inc. - Spring Hill 20400 WEBSTER ST Spring Hill
HazMat AFG Industries, Inc. - Spring Hill 20400 WEBSTER ST Spring Hill
HazMat AFG Industries, Inc. - Spring Hill 20400 WEBSTER ST Spring Hill
HazMat AFG Industries, Inc. - Spring Hill 20400 WEBSTER ST Spring Hill
HazMat AFG Industries, Inc. - Spring Hill 20400 WEBSTER ST Spring Hill
HazMat AFG Industries, Inc. - Spring Hill 20400 WEBSTER ST Spring Hill
HazMat AFG Industries, Inc. - Spring Hill 20400 WEBSTER ST Spring Hill
HazMat AFG Industries, Inc. - Spring Hill 20400 WEBSTER ST Spring Hill
HazMat AFG Industries, Inc. - Spring Hill 20400 WEBSTER ST Spring Hill
HazMat AFG Industries, Inc. - Spring Hill 20400 WEBSTER ST Spring Hill
HazMat AFG Industries, Inc. - Spring Hill 20400 WEBSTER ST Spring Hill
HazMat AFG Industries, Inc. - Spring Hill 20400 WEBSTER ST Spring Hill
HazMat AFG Industries, Inc. - Spring Hill 20400 WEBSTER ST Spring Hill
HazMat Sprint Communications Company L.P. - Spring Hill 416 E NICHOLS ST Spring Hill
HazMat Spring Hill Oil Co. Inc. 207 S FRANK ST Spring Hill
HazMat Farmers Union Coop 110 S FRANK ST Spring Hill
HazMat Praxair Inc 20400 WEBSTER ST Spring Hill
HazMat A & M Products Mfg Co 705 N LINCOLN ST Spring Hill
HazMat A & M Products Mfg Co 705 N LINCOLN ST Spring Hill
HazMat A & M Products Mfg Co 705 N LINCOLN ST Spring Hill
HazMat A & M Products Mfg Co 705 N LINCOLN ST Spring Hill

Region L Hazard Mitigation Plan, 2013 Final
HazMat A & M Products Mfg Co 705 N LINCOLN ST Spring Hill
HazMat A & M Products Mfg Co 705 N LINCOLN ST Spring Hill
HazMat A & M Products Mfg Co 705 N LINCOLN ST Spring Hill
HazMat A & M Products Mfg Co 705 N LINCOLN ST Spring Hill
HazMat A & M Products Mfg Co 705 N LINCOLN ST Spring Hill
HazMat A & M Products Mfg Co 705 N LINCOLN ST Spring Hill
HazMat A & M Products Mfg Co 705 N LINCOLN ST Spring Hill
Nursing Home Beverly Health Care & Rehab 251 E Wilson St Spring Hill
Police Westwood Police 4700 Rainbow Rd Spring Hill
Police Spring Hill Police 302 N Jefferson Spring Hill
School Westwood View Elementary 2511 W 50th St Spring Hill
School Spring Hill High 301 E South St Spring Hill
School Spring Hill Board of Education Office 101 E South St Spring Hill
School Spring Hill Middle 300 E South St Spring Hill
School Spring Hill Elementary 300 S Webster St Spring Hill
County Facility Spring Hill 109 S. Webster Spring Hill, KS
County Facility HSA MultiService Center - Spring Hill 401 N. Madison Spring Hill, KS
County Facility Spring Hill Antenna 302 North Jefferson Spring Hill, KS
County Facility Med-Act 1157 (Spring Hill FD) 20500 W. 207th St. Spring Hill, KS 66083 Government Office Spring Hill City Hall 401 N Madison St, P.O. Bo Spring Hill, KS 66083 County Facility Storage 520 E. Nichols Springhill, KS
County Facility HSA MultiService Center - Blue Valley School 7500 W. 149th Terr. Stanley, KS
County Facility Aubrey Antenna Site 21100 Metcalf Ave Stillwell, KS
County Facility Aubrey Substation 19495 S. Metcalf Stillwell, KS
HazMat Bayer Research Park 17745 METCALF AVE Stilwell
HazMat Kansas City Power & Light - Southland Service Ce 19955 NEWTON ST Stilwell
HazMat Kansas City Power & Light - Southland Service Ce 19955 NEWTON ST Stilwell
HazMat APAC Kansas Inc - Stanley West 10203 W 167TH ST Stilwell
HazMat APAC Kansas Inc - Stanley West 10203 W 167TH ST Stilwell
HazMat APAC Kansas Inc - Stanley West 10203 W 167TH ST Stilwell
HazMat APAC Kansas Inc - Stanley East 7000 W 167TH ST Stilwell
HazMat APAC Kansas Inc - Stanley East 7000 W 167TH ST Stilwell
HazMat APAC Kansas Inc - Stanley East 7000 W 167TH ST Stilwell
HazMat APAC Kansas Inc - Stanley East 7000 W 167TH ST Stilwell
HazMat APAC Kansas Inc - Stanley East 7000 W 167TH ST Stilwell

Region L Hazard Mitigation Plan, 2013 Final
HazMat APAC Kansas Inc - Stanley East 7000 W 167TH ST Stilwell
RadMat BAYER CORPORATION 17745 S METCALF AVE STILWELL
HazMat Sprint Communications Company L.P. - Westwood Co 2330 SHAWNEE MISSION PKWY Westwood
HazMat Sprint Communications Company L.P. - Westwood Co 2330 SHAWNEE MISSION PKWY Westwood
HazMat Sprint Communications Company L.P. - Westwood Co 2330 SHAWNEE MISSION PKWY Westwood
Government Office Westwood Hills City Hall 5008 State Line Rd Westwood Hills, KS 66205 Government Office Mission Woods City Hall 4700 Rainbow Blvd Westwood, KS 66205 Government Office Westwood City Hall 4700 Rainbow Blvd Westwood, KS 66205-1831
De Soto
Facility Name Address City
Insured Value Occupancy Substance
County Facility Rural Fire District #3,
Antenna Site 9745 Kill Creek
Road De
Soto
County Facility HSA MultiService Center - De Soto
32905 W 84th Street
De Soto
County Facility De Soto 33145 W 83rd
Street De
Soto
County Facility Med-Act 1159
(DeSoto FD) 33150 W. 83rd De
Soto
Fire Station De Soto, Stn 1 33150 W 83RD
ST De
Soto $1,500,000 35
Fire Station De Soto, Stn 2 De
Soto $250,000 2
Fire Station Dist 3, Stn 1 9745 KILL
CREEK RD De
Soto Government Office De Soto City Hall 32905 W 84th St
De Soto $4,500,000 500
HazMat Huhtamaki Consumer
Packaging Inc 9201
PACKAGING DR De
Soto 6XXX series alloys, Absolytype/Champion Sealed Lead Battery, Sulfuric
Acid, Cadmium Oxide, Lead Acid Batteries, KC-3468 Poly Lo Thriller Red
HazMat Hunt - Sunflower
Quarry 34135 W 95TH
ST De
Soto ANFO, Disiel Fuel, Lubricating Oil, water gel primer
HazMat Intervet Inc 35500 W 91st St De
Soto FORMALDEHYDE
HazMat A T & T - Eudora 37260 W 103RD
ST De
Soto SULFURIC ACID
HazMat Laidlaw Transit Inc. -
(7013 DeSoto) 8800 PENNER
AVE De
Soto DIESEL FUEL

Region L Hazard Mitigation Plan, 2013 Final
Historical Site Abbott Hall 8310 Peoria St De
Soto
Nursing Home Hillside Village of De
Soto 33600 W 85th St De
Soto
Nursing Home Valley Springs Homes 31765 W. 83rd St De
Soto
Wastewater Facility
Wastewater Treatment Facility 31860 S. 83rd
De Soto
Water Plant De Soto water system
facility 33000 W. 82nd
St De
Soto
Edgerton
Facility Name Address City Insured Value Occupancy Substance County Facility Storage 309 E. Nelson Edgerton
County Facility Edgerton Library 319-321 E. Nelson Street Edgerton County Facility Lanesfield Interpretive Center 18745 Dillie Rd. Edgerton County Facility Edgerton Radio Tower Site 710 E. Nelson Edgerton County Facility Edgerton Substation 309 E. Nelson Edgerton
County Facility Lanesfield School Historic Site 18745 S. Dillie Road Edgerton County Facility Spoon Creek Pump Station Edgerton $350,000 0 Government Office Edgerton City Hall 404 E Nelson Edgerton
Fairway
Facility Name Address City Insured Value Occupancy Substance County Facility Belinder Holding Station 5700 Belinder Fairway
County Facility Rock Creek Pumping Station 5801 Roe Blvd Fairway County Facility Fairway Pool 6136 Mission Rd Fairway County Facility Public Works Department 5505 Buena Vista Fairway County Facility Sewer Lift Station 5700 Belinder Fairway
Critical Community Supplier Hen House Grocery Store 2724 W 53rd Street Fairway Government Office Fairway City Hall 5252 Belinder Rd Fairway

Region L Hazard Mitigation Plan, 2013 Final
HazMat Colt Energy - Effertz Leases 4350 SHAWNEE MISSION PKWY Fairway CRUDE OIL
Highway Shawnee Mission Parkway Shawnee Mission Parkway Fairway
Police Fairway Police 5252 Belinder Rd Fairway
Religious Facility Old Mission United Methodist Church 5519 State Park Fairway
Gardner
Facility Name Address City Insured Value Occupancy Substance
County Facility Med-Act 1150, (Gardner Public Safety) 440 E. Main Gardner
County Facility HSA MultiService Center - Gardner 112 S. Elm Gardner
County Facility Gardner Library 137 E Shawnee Gardner County Facility JCDS - Agnes St 17371 S Agnes St Gardner County Facility HSA Nutrition Site - Gardner 128 E Park St Gardner County Facility JCDS - Ingrid 17390 S Ingrid Gardner Day Care Center Open Arms Daycare 306 E MadisonSt Gardner 220 Day Care Center Kiddie Corner Daycare 936 E Santa Fe St Gardner 75
Day Care Center Little Building Block's Daycare 813 E Lincoln Ln Gardner 50 Day Care Center Little People Place Daycare 125 N. Moonlight Rd Gardner 195 Fire Station Dist 1, Stn 1 234 E PARK ST Gardner Fire Station Gardner, Stn 1 440 E MAIN ST Gardner Fire Station Gardner Pub Safety 2 Future Gardner Government Office Gardner City Hall 120 E Main St Gardner $ 3,077,470 Government Office Energy Center Bldg 1150 E Santa Fe Gardner $ 485,010
HazMat Sprint Communications Company L.P. - Gardner Cen 107 S ELM ST Gardner
SULFURIC ACID, LEAD COMPOUNDS
HazMat Cramer Products Inc 153 W WARREN ST Gardner
ISOPROPYL ALCOHOL, PETROLATUM, SODIUM CHLORIDE, wood resin FF

Region L Hazard Mitigation Plan, 2013 Final
Nursing Home Medicalodge of Gardner 223 Bedford St Gardner 182
Nursing Home Meadowbrook Rehab. Hospital 427 W Main St Gardner 235 Nursing Home Vintage Park of Gardner 869 Juniper Ter Gardner Police Gardner Police 440 E Main St Gardner Utility Water Treatment Plant 30100 W. 151st St Gardner $ 153,630 Utility Water Treatment Plant 29501 W. 151st St Gardner $ 87,630
Utility Killcreek Wastewater Treatment 159th & Waverly Gardner $ 13,000,000
Johnson County
Facility Name Address City
Insured Value Occupancy Substance
County Facility Kill Creek #1 Johnson County
County Facility Hangar D 200 Springhill Dr.
Johnson County
County Facility Hangar E 200 Springhill Dr.
Johnson County
County Facility Hangar C 200 Springhill Dr.
Johnson County
County Facility 14' x 70' Office Trailer
404 Mission Drive, New Ce
New Century
County Facility Fred Allenbrand Criminal Justice
27745 W. 159th Street
New Century
County Facility Operations Center 27747 W. 159th Street
New Century
County Facility NORAD Building 400 400 Mission Parkway
New Century
County Facility NORAD Building 401 401 Mission Parkway
New Century
County Facility NORAD Building 402 402 Mission Parkway
New Century
County Facility
Community Corrections Ctr, Building 1
101 Roeland Park
New Century

Region L Hazard Mitigation Plan, 2013 Final
County Facility
Community Corrections Ctr, Building 3
101 Roeland Park
New Century
County Facility
New Century AirCenter, Admin Office, Building 9
1 New Century Pkwy
New Century
$ 1,679,213.00 50
County Facility Howell Mfg., Building 114
201 Overland Park Place
New Century
County Facility Executive, Beechcraft
#1 Aero Plaza
New Century
County Facility T-Hanger, Hangar A #3 Aero Plaza
New Century
County Facility T-Hanger, Hangar B #4 Aero Plaza
New Century
County Facility Dodson International #2 Aero Plaza
New Century
County Facility Royal Tractor Building
100 Mission Woods Drive
New Century
County Facility Kings Avionics 280 Gardner Drive (Buildi
New Century
County Facility Kings Avionics 290 Gardner Drive (Buildi
New Century
County Facility Kings Avionics 294 Gardner Drive (Buildi
New Century
County Facility Fire Station #3
490 New Century Pkwy
New Century
County Facility Little Bull Creek SSD #2
50 Leawood Dr.
New Century
County Facility Above Ground Water Tank
New Century
County Facility Grinsted Sewer Pumping Station
New Century
County Facility
Main Water Treatment Plant Pumping Station
New Century
County Facility South Sewer Pumping Station
New Century

Region L Hazard Mitigation Plan, 2013 Final
County Facility South Water Pumping Station
New Century
County Facility
Countywide Communications Center
399 Mission Parkway
New Century
County Facility North Water Pumping Station
Building 39B New Century
New Century
County Facility Water Treatment Plant
New Century
County Facility
Community Corrections Ctr, Building 2
101 Roeland Park
New Century
County Facility Kings Avionics 294 Gardner Drive (Buildi
New Century
County Facility Headworks Screen Rm. & Grit Removal
50 Leawood Dr.
New Century
County Facility Archives - Bldg #16
One Industrial Parkway
New Century
County Facility Programs Building 141 Mission Parkway
New Century
County Facility Housing Building, Building 4
173 Mission Parkway
New Century
County Facility Construction Trailer 401 Mission Parkway
New Century
County Facility Construction Trailer 401 Mission Parkway
New Century
County Facility Construction Trailer 402 Mission Parkway
New Century
County Facility Mobile Restroom Trailer
402 Mission Parkway
New Century
County Facility Maintenance Garage, Building 28
228 Gardner Drive
New Century
County Facility Aubrey Antenna Site 21100 Metcalf Ave Stillwell
County Facility Aubrey Substation 19495 S. Metcalf Stillwell
County Facility Aubrey Antenna Site 21100 Metcalf Ave Stillwell
County Facility Aubrey Substation 19495 S. Stillwell

Region L Hazard Mitigation Plan, 2013 Final
Metcalf
County Fuel Tank New Century 228 Gardner Dr
Johnson County
County Fuel Tank New Century 228 Gardner Dr
Johnson County
County Fuel Tank New Century 50 Leawood Dr
Johnson County
County Fuel Tank Heritage Park Maintenance
14025 W. 159th Street
Johnson County
County Fuel Tank Heritage Park Maintenance
14025 W. 159th Street
Johnson County
County Fuel Tank Heritage Park Golf Course
16445 S. Lackman Road
Johnson County
County Fuel Tank Heritage Park Golf Course
16445 S. Lackman Road
Johnson County
County Fuel Tank Kill Creek Park Maintenance
11770 Homestead Lane
Johnson County
County Fuel Tank Kill Creek Park Maintenance
11770 Homestead Lane
Johnson County
County Fuel Tank Heritage Park Maintenance
14025 W. 159th Street
Johnson County
Fire Station Dist 1, Stn 3
490 NEW CENTURY PKWY
Johnson County
Fire Station Overland Park, Stn 5
15935 METCALF RD
Johnson County
Fire Station Dist 2, Stn 1
19495 METCALF RD
Johnson County
Fire Station Dist 2, Stn 2 18475 MISSION RD
Johnson County
Fire Station Dist 2, Stn 3
19065 LACKMAN RD
Johnson County
Fire Station Gardner Pub Safety 3 Future
Johnson County

Region L Hazard Mitigation Plan, 2013 Final
Fire Station Dist 3, Stn 2 29520 W 127TH ST
Johnson County
HazMat Petroleum Technologies Inc
Johnson County Crude Oil, BRINE
HazMat Danisco Cultor USA, Inc
201 New Century Pkwy
New Century
ACETIC ACID, ACETIC ANHYDRIDE, ANHYDROUS AMMONIA, NITROGEN
HazMat Kerry Sweet Ingredients
400 PRAIRIE VILLAGE DR
New Century SULFURIC ACID, ALUMINUM SULFATE, SOLUTION
HazMat CFS West Holdings, Inc.
101 PRAIRIE VILLAGE DR
New Century AMMONIA (ANHYDROUS)
HazMat CFS West Holdings, Inc.
101 PRAIRIE VILLAGE DR
New Century NITROGEN
HazMat
Sprint Communications Company L.P. - KRDC/North
600 NEW CENTURY PKWY
New Century SULFURIC ACID, LEAD COMPOUNDS, DIESEL FUEL
HazMat Executive Beechcraft Inc
280 GARDNER DR
New Century GASOLINES: AVIATION (< 4.86G LEAD/GAL), JET FUEL: JP-1
HazMat Unilever Bestfoods 27080 W 159TH ST
New Century AMMONIA (ANHYDROUS)
HazMat De Elliotte Co., Inc. 201 PRAIRIE VILLAGE DR
New Century L 8174 Polyethylene Octene Copolymer, 1031 Polyethylene Homopolymer
HazMat Graphic Technology, Inc.
301 GARDNER DR
New Century SULPHURIC ACID

Region L Hazard Mitigation Plan, 2013 Final
HazMat Heartland Precision Fasteners. Inc.
301 PRAIRIE VILLAGE DR
New Century
SULFURIC ACID, NITRIC ACID, SODIUM CYANIDE, ISO-PROPYL ALCOHOL, METHANOL, Mineral Spirits, NICKEL METAL, NICKEL CHLORIDE, NICKEL SULFATE, OXYGEN, NITROGEN, PICRIC ACID, PROPYLENE GLYCOL, SODIUM DICHROMATE, SODIUM HYDROXIDE, CHROMIC ACID, Zinc Phosphate, AMMONIUM NITRATE, ACETYLENE, SODIUM BISULFITE, CADMIUM, Cetyl Alcohol, ETHYL ALCOHOL, PHOSPHORIC ACID, HYDROCHLORIC ACID
HazMat Bayer Research Park
17745 METCALF AVE Stilwell FUEL OIL
HazMat
Kansas City Power & Light - Southland Service Ce
19955 NEWTON ST Stilwell DIESEL FUEL, gasoline
HazMat APAC Kansas Inc - Stanley West
10203 W 167TH ST Stilwell ANFO, Blastex, cast boosters
HazMat APAC Kansas Inc - Stanley East
7000 W 167TH ST Stilwell
ASPHALT CEMENTS, DIESEL FUEL, FUEL OIL, GASOLINE, motor oils, SSL-Tack
HazMat BAYER CORPORATION
17745 S METCALF AVE Stilwell
HazMat Bayer Research Park
17745 METCALF AVE Stilwell FUEL OIL
HazMat
Kansas City Power & Light - Southland Service Ce
19955 NEWTON ST Stilwell DIESEL FUEL, gasoline

Region L Hazard Mitigation Plan, 2013 Final
HazMat APAC Kansas Inc - Stanley West
10203 W 167TH ST Stilwell ANFO, Blastex, cast boosters
HazMat APAC Kansas Inc - Stanley East
7000 W 167TH ST Stilwell
ASPHALT CEMENTS, DIESEL FUEL, FUEL OIL, GASOLINE, motor oils, SSL-Tack
HazMat Bayer Research Park
17745 METCALF AVE Stilwell FUEL OIL
HazMat
Kansas City Power & Light - Southland Service Ce
19955 NEWTON ST Stilwell DIESEL FUEL, gasoline
HazMat APAC Kansas Inc - Stanley West
10203 W 167TH ST Stilwell
ANFO, Blastex, cast boosters, ASPHALT CEMENTS, DIESEL FUEL, FUEL OIL, GASOLINE, motor oils, SSL-Tack
Jail Johnson County Sheriff
27745 W 159th St
Johnson County
RadMat BAYER CORPORATION
17745 S METCALF AVE Stilwell
RadMat BAYER CORPORATION
17745 S METCALF AVE Stilwell
Sheriff Johnson County Sheriff
27747 W 159th St
Johnson County
Lake Quivira
Facility Name Address City Insured Value Occupancy Substance
Government Office Lake Quivira City Hall, Fire Station, & Police 10 Crescent Blvd
Lake Quivira $ 2,000,000 105
Private/Commercial Quivira Inc. Clubhouse Facility 100 Crescent Blvd Lake Quivira $ 6,000,000 600
Leawood

Region L Hazard Mitigation Plan, 2013 Final
Facility Name Address City Insured Value Occupancy Substance
County Facility Leawood Pioneer Branch 4700 Town Center Drive Leawood County Facility Leawood South Plant 12301 Mission Rd Leawood
County Facility Med-Act 1149 (Leawood Fire Station #2) 12701 Mission Rd. Leawood $ 958,000.00 10
County Facility Tomahawk Creek Plant 3300 W. 109th St. Leawood
County Facility Chlorine Building #2 (Incl Chlorine Gas Scrubber 3300 W. 109th St. Leawood
County Facility Public Works Facility 40 County Facility Parks & Recreation Facility 20 Fire Station Leawood, Stn 1 9607 LEE BLVD Leawood $ 329,700.00 4 Fire Station Leawood, Stn 2 12701 MISSION RD Leawood $ 958,000.00 10 Fire Station Leawood, Stn 3 14801 MISSION RD Leawood $ 2,930,056.00 10 Government Office Leawood City Hall 4800 Town Center Dr Leawood $ 7,791,369.00 85
HazMat Johnson County Wastewater Tomahawk Facility 10701 LEE BLVD Leawood CHLORINE
HazMat Jiffy Lube Store # 353 10300 STATE LINE RD Leawood MOTOR OIL
Nursing Home Alterra Clare Bridge/Leawood 12724 State Line Leawood Nursing Home The Homestead of Leawood 12720 State Line Leawood
Nursing Home Kansas City Orthopaedic Inst. LLC 3651 College Leawood
Nursing Home Grace Gardens/Leawood Assited Liv. 5201 W 143rd St Leawood
Nursing Home Doctors Specialty Hospital LLC 4901 College Blvd Leawood Police Leawood Police 9617 Lee Blvd Leawood $ 2,579,605.00 40 Police Annex Leawood $ 207,000.00 8
RadMat BETA CHEM LABORATORY 10300 HOWE DR Leawood
Lenexa

Region L Hazard Mitigation Plan, 2013 Final
Facility Name Address City Insured Value Occupancy Substance
Communications Facility Sprint Communications 9601 Legler Lenexa
Communications Facility Sprint Communications 11300 Corporate Lenexa
Communications Facility Sprint Communications 15201 W 99th Street Lenexa
Communications Facility Sprint Communications 14625 W 100TH ST Lenexa
Communications Facility Sprint Communications
15405 COLLEGE BLVD Lenexa $ 6,827,000.00
County Facility Health Department Storage 16101 W. 95th Street Lenexa
County Facility HSA MultiService Center - North Central
12425 W. 87th Street Pkwy Lenexa
County Facility HSA Nutrition Site - Lenexa 13425 Walnut Lenexa County Facility JCDS - Satellite Site 15024 W. 106th Lenexa County Facility JCDS - Satellite Site 15012 W. 106th Lenexa County Facility JCDS - Satellite Site 15016 W. 106th Lenexa County Facility JCDS Annex - Satellite Site 15046 W. 106th Lenexa County Facility Lackman 15345 W. 87th Pkwy Lenexa County Facility Med-Act 1135, (Lenexa FD) 9224 Haskins Lenexa County Facility Offices & Workshop 10501 Lackman Road Lenexa County Facility Wastewater Storage 16101 W. 95th St. Lenexa Dam Hidden Woods Park Dam 8300 Quivira Lenexa Dam Mize Lake Dam 9600 Mize Blvd Lenexa Dam Monticello Lake Dam 9100 Monticello Lenexa
Dam Sar Ko Park Dam 15300 W. 87th Street Pkwy Lenexa
Dam Shawnee Mission Park Dam 7900 Renner Lenexa
Day Care Center Alice's Little Amgels Daycare 9550 Halsey Lenexa Day Care Center Building Blocks Daycare 15215 College Blvd Lenexa $ 826,220.00
Day Care Center Camp Special Beginnings Daycare 9550 Pflumm Lenexa
Day Care Center Christa McAuliffe Daycare 15600 W. 83rd Street Lenexa $ 4,717,150.00

Region L Hazard Mitigation Plan, 2013 Final
Day Care Center Community Evangelical Church Daycare
15700 W 87th Street pkwy Lenexa $ 8,694,970.00
Day Care Center Country Kids Daycare 8745 Bourgade Lenexa $ 1,064,370.00 Day Care Center Creative Kids Daycare 12001 W. 79th Street Lenexa Day Care Center Holy Trinity Daycare 13517 W. 92nd Street Lenexa $ 4,522,550.00
Day Care Center Johnson County Parks & Rec Daycare 8600 Candlelight Lenexa $ 8,107,340.00
Day Care Center Kansas City Church of Christ Daycare 10248 Quivira Lenexa
Day Care Center Kinder Care Daycare 8555 M+C103onrovia Lenexa $ 920,890.00 Day Care Center La Petite Daycare 15039 W 86th Street Lenexa $ 303,020.00 Day Care Center Lakeview Billage Daycre 9100 Park Lenexa $ 22,964,360.00 Day Care Center Lions Share Daycare 7830 Barton Lenexa $ 675,500.00 Day Care Center Shining Stars Daycare 10248 Quivira Lenexa Day Care Center Special Beginnings 10216 Pflumm Lenexa Day Care Center St. Paul's Daycare 7740 Lackman Road Lenexa $ 1,837,240.00 Day Care Center Tender Hearts Daycare 11740 W. 77th Street Lenexa $ 318,430.00 Fire Station Lenexa, Stn 1 9620 PFLUMM RD Lenexa $ 2,866,120.00 Fire Station Lenexa, Stn 2 8725 LACKMAN RD Lenexa
Fire Station Lenexa, Stn 3 24000 PRAIRIE STAR PKWY Lenexa $ 5,931,250.00
Fire Station Lenexa, Stn 4 10855 EICHER DR Lenexa $ 1,791,100.00 Government Office Johnson County Library 15345 W 87th Street Lenexa $ 2,836,480.00
Government Office Johnson County Multi Service Center
12425 W. 87th Street Pkay Lenexa $ 3,703,000.00
Government Office Lenexa City Hall 12350 W 87th Street Pkwy, Lenexa
Government Office National Archives & Records Administration 17501 W. 98th Street Lenexa $ 2,273,760.00
Government Office U.S. Food & Drug Administration 11510 W 80th Street Lenexa $ 8,680,050.00 Government Office United States Post Office 8820 Monrovia Lenexa $ 1,059,480.00

Region L Hazard Mitigation Plan, 2013 Final
HazMat AMCOR P.E.T. Packaging North America 9939 WIDMER RD Lenexa
"Eastpak" Polymer 9921 W, Diala Oil AX 68745, Cleartuf 8006, VFR 10538, Polyester Bottle Resin, "Eastpak" Polymer CM01
HazMat B/E Aerospace. Inc. 10800 PFLUMM RD Lenexa OXYGEN,(CRYOGENIC LIQUID), SODIUM CHLORATE
HazMat BWI Companies Inc., BWI - Kansas City 9831 LACKMAN RD Lenexa
13-13-13 Boron Homogenous Fertilizer, 13-3-7, 20-3-4 NPK Fert + Weed Control, 20-3-4 Fert W/ Propendi Herb, 20-4-10 40%, 46-0-0 Urea, Barricade, Dimension Fertilizer, Howard Johnson's Turf Fertilizer, LEB CC 21-3-18 5.0 WIN, Lebanon Pro 32-4-8 12 SCU, Merit 0.5 G Insecticide, Merit 025, Snapshot 2.5 TG Herbicide, 18-3-18 Country Club, Calcium Nitrate Fertilizer 15.5%N, Dormant Oil, Ferromec AC Liquid Iron 15-0-0, Goal 2X Herbicide, Honcho Plus Herbicide, Howard Johnsons Mach 2 Plus Fertilizer, Nitro 30 30-0-0, Roundup Pro Herbicide, Speed Zone Broadleaf Herbicide, Surflan A S Herbicide, Trimec 992
HazMat Cable and Wireless USA 8005 BOND ST Lenexa SULFURIC ACID, DIESEL FUEL, LEAD COMPOUNDS

Region L Hazard Mitigation Plan, 2013 Final
HazMat Coca Cola Bottling of Mid America
10001 INDUSTRIAL BLVD Lenexa
AMMONIA (ANHYDROUS), Anthrafilt, CALCIUM HYDROXIDE, FERRIC SULFATE, CARBON DIOXIDE, SULFURIC ACID, NITROGEN,(CRYOGENIC LIQUID), SULPHURIC ACID, Anthracite Coal, GLYCOL ETHER, NITRIC ACID
HazMat Comfort Products Distributing 14001 MARSHALL DR Lenexa CHLORODIFLUOROMETHANE HazMat Costco #349 9350 MARSHALL DR Lenexa SULFURIC ACID, LEAD
HazMat Emerson Ventilation Products 10048 INDUSTRIAL BLVD Lenexa
ARGON, SULFURIC ACID, SULPHURIC ACID
HazMat Emerson Ventilation Products 13915 W 107TH ST Lenexa SULPHURIC ACID HazMat Fedex Express -IXDA 14635 W 99TH ST Lenexa GASOLINE, DIESEL FUEL
HazMat Harbison - Walker Refractories Co. 14515 W 96TH TER Lenexa
Alumiona Silicate, ALUMINUM OXIDE, Cristobalite, Portland Cement, Vitreous Silica, HYDROUS ALUMINUM SILICATE, Hydrous Alumina Silicate, Quartz, SILICON DIOXIDE, Calcium Aluminate, Refractory Ceramic Fibers
HazMat Hazardous Materials See Johnson County Tier II Reports
HazMat Holland Corporation, Inc 9131 NOLAND RD Lenexa DIESEL OIL, MEDIUM, DIESEL FUEL, GASOLINE
HazMat IBM 11200 LAKEVIEW AVE Lenexa SULFURIC ACID

Region L Hazard Mitigation Plan, 2013 Final
HazMat J C Penney Catalog Center 10500 LACKMAN RD Lenexa DIESEL FUEL, PROPANE, SULFURIC ACID, HALON 1301
HazMat Jiffy Lube Store # 1628 13520 W 87TH ST PKWY Lenexa MOTOR OIL
HazMat Kansas City Power & Light - Johnson County Servi 16215 W 108TH ST Lenexa DIESEL FUEL, GASOLINE
HazMat Kelly Co LLC 15547 W 109TH ST Lenexa CRUDE OIL, Emulsion Breaker, Corrosion Inhibitor, Salt Water
HazMat Kirk Welding Supply, Inc 9725 ALDEN ST Lenexa
CARBON DIOXIDE, OXYGEN, NITROGEN, ARGON, AMMONIA (ANHYDROUS), CHLORINE, HYDROGEN SULFIDE
HazMat Machine Laboratory, Inc. 8040 BOND ST Lenexa
Steel RS5214, Steel 1018, Steel 440FSE, Steel 430 FR, 12L14, 1215 Steel, Steel 416SS, Steel 303SS

Region L Hazard Mitigation Plan, 2013 Final
HazMat Magnum Products - Lenexa 15740 W 108TH ST Lenexa
POLYETHYLENE, Plasters, Attapulgite Products, Hubercarb, LV-9, Mica Powder (Muscovite), Pyrax B, Staramic 747 Starch, TALC, Cal Bond R-21, Magnum Joint Compound, Joint Compounds Powder, Methocel*250 S Hydroxypropyl Methylcellulose, Hydroxyethylcellulose Natrosol, 1 1/4 Cornerbead, "L" metal, and Open Angle Cornerbead, Sheetrock Joint Tape, Magnum Drywall Textures S-1000, V -1000, R-1002 and R-1011, Magnum Drywall Blend, Nexton 3082R Water Soluble Polymer, Hydrostone, Airflex 531 BP Emulsion
HazMat Mid America Wastewater Treatment 14021 W 101ST ST Lenexa
AMMONIA (ANHYDROUS), SODIUM HYDROXIDE
HazMat Midland Research Laboratories Inc
10850 MID AMERICA AVE Lenexa
CYCLOHEXYLAMINE, HYDRAZINE, Midland PC 6010 Chlorine Dioxide precursor, sodium bromide, SODIUM SULFITE, SULFURIC ACID
HazMat Moore Wallace North America 8460 FLINT ST Lenexa SULFURIC ACID
HazMat Pack America Corporation 9635 WIDMER RD Lenexa
SULFURIC ACID, Inseal 30-5166 Ethylene Vinyl Acetate (Hot Melt Glue), Vinyl Acetate Adhesive KY 729

Region L Hazard Mitigation Plan, 2013 Final
HazMat Penske Truck Leasing Co L.P. 17225 W 116TH ST Lenexa DIESEL FUEL HazMat Pitman Company 9900 PFLUMM RD Lenexa HYDROQUINONE HazMat Ringside Inc. 9650 DICE LN Lenexa Carbon & Alloy steels
HazMat Ryder Transportation Services #0381A 10003 LACKMAN RD Lenexa DIESEL FUEL
HazMat Sam's Club # 8208 12200 W 95TH ST Lenexa SULFURIC ACID
HazMat SCP Distributors LLC 9802 WIDMER RD Lenexa
CALCIUM HYPOCHLORITE, TRICHLORO-S-TRIAZINETRIONE, Silicon Dioxide, Vermiculite, SODIUM HYPOCHLORITE SOLUTION, diatomaceous Earth, flux-calcined, HYDROGEN CHLORIDE, CYANURIC ACID, PROPYLENE GLYCOL, SODIUM HYDROGEN CARBONATE, 1-bromo-3-chloro-5, 5-dimethyl-hydantion, LITHIUM HYPOCHLORITE, 1-Hydroxyethylidene-1,1-diphosphonic, CALCIUM CHLORIDE, SODIUM DICHLORO-S-TRIAZINETRIONE
HazMat Shasta Beverages Co., Inc 9901 WIDMER RD Lenexa AMMONIA (ANHYDROUS), CHLORINE
HazMat Shaw Industries, Inc. Plant 3K 16955 W 116TH ST Lenexa SULFURIC ACID HazMat Simplex Grinnell 13555 W 107TH ST Lenexa CARBON DIOXIDE
HazMat Southern Star Central Pipeline (Craig) 19600 W 87TH LN Lenexa
Gas engine oil, NATURAL GAS CONDENSATES, GASOLINE

Region L Hazard Mitigation Plan, 2013 Final
HazMat Southwestern Bell Mobile Systems 9532 9532 PFLUMM RD Lenexa DIESEL FUEL, SULFURIC ACID
HazMat Spec Plating Corporation 8291 MELROSE DR Lenexa NITRIC ACID, POTASSIUM CYANIDE
HazMat Sprint Communications Company L.P. - Kansas RegÆ 14625 W 100TH ST Lenexa
SULFURIC ACID, LEAD COMPOUNDS
HazMat Sprint Communications Company L.P. - Lenexa Lake 10951 LAKEVIEW AVE Lenexa $ 6,747,000.00
SULFURIC ACID, DIESEL FUEL, LEAD COMPOUNDS
HazMat Sprint Communications Company L.P. - Lenexa Legl 9601 LEGLER RD Lenexa
SULFURIC ACID, DIESEL FUEL, LEAD COMPOUNDS
HazMat Sprint Communications Company L.P. - Lenexa OSSC 15201 W 99TH ST Lenexa
SULFURIC ACID, DIESEL FUEL, HALON 1301, LEAD COMPOUNDS
HazMat Sprint Communications Company L.P. - Lenexa PCS 15481 W 110TH ST Lenexa $ 722,300.00
SULFURIC ACID, DIESEL FUEL, LEAD COMPOUNDS
HazMat Sprint Communications Company L.P. - Lenexa PCS 15620 W 113TH ST Lenexa $ 3,540,000.00
SULFURIC ACID, LEAD COMPOUNDS
HazMat Sprint Communications Company L.P. - Lenexa PCS 16020 W 113TH ST Lenexa $ 18,726,200.00
SULFURIC ACID, DIESEL FUEL, LEAD COMPOUNDS
HazMat Sprint Communications Company L.P. - Lenexa PCS
11300 CORPORATE AVE Lenexa
SULFURIC ACID, DIESEL FUEL, LEAD COMPOUNDS
HazMat Sprint Communications Company L.P. - Lenexa PCS- 11211 LAKEVIEW AVE Lenexa $ 2,954,000.00
SULFURIC ACID, LEAD COMPOUNDS
HazMat Sprint Communications Company Lenexa PCS Watersi
15405 COLLEGE BLVD Lenexa SULFURIC ACID

Region L Hazard Mitigation Plan, 2013 Final
HazMat Superior Pool Products LLC 9874 PFLUMM RD Lenexa
SODIUM DICHLORO-S-TRIAZINETRIONE, PROPYLENE GLYCOL, CALCIUM HYPOCHLORITE, TRICHLORO-S-TRIAZINETRIONE, silicon dioxide, SODIUM HYDROGEN CARBONATE, Vermiculite, CYANURIC ACID, SODIUM BISULFATE, Potassium peroxymonosulfate, HYDROCHLORIC ACID, 1-hydroxyethylidene-1,1-diphosphonic, DIATOMACEOUS EARTH, PROPYLENE GLYCOL, Butoxydipropanol, CALCIUM CHLORIDE, Copper- Triethanolamine complex, 1-bromo-3chloro-5,5-dimethyl-hydantion
HazMat T-Mobile USA Inc 7905 QUIVIRA RD Lenexa SULFURIC ACID, DIESEL FUEL HazMat T-Mobile USA Inc 7905 QUIVIRA RD Lenexa
HazMat United Parcel Service 14650 SANTA FE TRAIL DR Lenexa GASOLINE, DIESEL FUEL
HazMat Universal Engracing # 2 11801 W 86TH TER Lenexa COPPER
HazMat Verizon Wireless - Lenexa Ks-MO RHQ 9725 PFLUMM RD Lenexa SULFURIC ACID
HazMat Verizon Wireless - Lenexa MTSO 9725 PFLUMM RD Lenexa SULFURIC ACID, DIESEL FUEL, LEAD

Region L Hazard Mitigation Plan, 2013 Final
HazMat Vertis Retail Newspaper Services 14720 W 99TH ST Lenexa
petroleum distillates in heatset web offset printing inks, Cleaning Compounds in acid solution PSI 1966KC, Cleaning Liquid Compounds-Z-cling 7140SA
HazMat Wheeling Corrugating Company 9801 ALDEN ST Lenexa DIESEL FUEL
HazMat Wichita Southeast Kansas Transit 14401 W 97TH TER Lenexa DIESEL FUEL Highway Interstate I-35 Lenexa Highway Interstate435 Lenexa Highway Kansas Highway 10 Lenexa Highway Kansas highway 7 Lenexa
Medical Facility College Park Family Care 12208 W. 87th Street Pkwy Lenexa $ 1,816,900.00
Medical Facility Encompass Medical Group 8550 Marshall Lenexa $ 3,866,000.00
Medical Facility Family Practice Physican Urgent Care Physiciam 11140 Thompson Ave Lenexa $ 3,912,700.00
Medical Facility Lenexa Family Practice 8700 Bourgade Lenexa $ 1,244,000.00
Medical Facility Occupational Medicine Specialist 11170 Thompson Lenexa $ 3,912,700.00
Military Installations National Guard Armory 18200 87th St pkwy Lenexa $ 2,911,890.00 Nursing Home Delmar Gardens of Lenexa 9701 Monrovia St Lenexa $ 6,357,300.00 Nursing Home Garden Villas Nursing Home 9705 Monrovia Lenexa $ 26,260,620.00 Nursing Home Lakeview Village 9100 Park St Lenexa $ 22,964,360.00
Nursing Home Lakeview Village South Nursing Home 13850 W 91st Terrace Lenexa
Nursing Home Northpoint at Lakeview Nursing Home 14100 W 92nd Street Lenexa
Nursing Home Rosewood Senior Nursing Home 8500 Pflumm Lenexa $ 9,168,000.00
Nursing Home Southridge at Lakeview Nursing Home 14001 W. 92nd Street Lenexa $ 21,170,120.00

Region L Hazard Mitigation Plan, 2013 Final
Nursing Home Sunrise Assisted Living of Lenexa 15055 W 87th Pkwy Lenexa $ 6,560,000.00 Nursing Home The Homestead of Lenexa 8740 Caenen Lake Lenexa $ 2,145,110.00 Nursing Home Vintage Park at Lenexa 8710 Caenen Lake Lenexa $ 2,314,500.00
Pipeline Southern Star Central Gas Pipeline 13430 W. 98th Street Lenexa
Pipeline Williams Pipeline 19600 W. 87th Lane Lenexa Police Lenexa Police 12500 W 87th St Lenexa
Police Lenexa Police 23930 Prairie Star Pkwy Lenexa
RadMat CITY OF LENEXA 12350 W 87TH STREET PKWY Lenexa
RadMat CLINICAL REFERENCE LABORATORY 8433 QUIVIRA RD Lenexa
RadMat COMO TECH INC 27640 W 83RD ST Lenexa
RadMat EAGLE-PICHER INDUSTRIES 13605 W 96TH TERR Lenexa
RadMat GEORGE BUTLER ASSOCIATES 9801 RENNER BLV Lenexa
RadMat GEOSYSTEMS ENGINEERING INC 7802 BARTON AVE Lenexa
RadMat KRUGER TECHNOLOGIES INC 14705 W 114TH TERR Lenexa
RadMat PACE ANALYTICAL SERVICES I 9608 LOIRET BLV Lenexa
RadMat PHARMACEUTICAL RESEARCH A 16300 COLLEGE BLV Lenexa
RadMat QUINTILES INC 11250 CORPORATE AVE Lenexa
RadMat S O R 14685 W 105TH ST Lenexa
RadMat TERRACON INC 16000 COLLEGE BLV Lenexa
RadMat TRANSYSTEMS CORPORATION 8218 NIEMAN RD Lenexa

Region L Hazard Mitigation Plan, 2013 Final
Railroad Burlington Northern Santa Fe Railroad Lenexa
Railroad Union Pacific Railroad Lenexa
Shelter Central Church of the Nazarene Shelter
12600 W. 87th Street Pkwy Lenexa $ 7,787,730.00
Shelter Holy Trinity School Shelter 13615 W. 92nd Street Lenexa $ 3,808,200.00
Shelter Lenexa United Methodist Church Shelter
9138 Caenen Lake Road Lenexa $ 1,493,690.00
Shelter St. James Academy High School Shelter
24505 Prairies Star Pkwy Lenexa $ 18,725,680.00
Shelter Westside Family Church Shelter 8500 Woodsonia Lenexa $ 11,262,630.00 Utility Electrical Sub Station 24260 W 102 Terrace Lenexa Utility Electrical Sub Station 15800 W. 95th Street Lenexa Utility Electrical Sub Station 16300 W 110th Street Lenexa Utility Electrical Sub Station 9950 Pflumm Lenexa Utility Gas Distribution Station 8732 Candlelight Lenexa Utility Gas Distribution Station 8700 Renner Lenexa Utility Gas Distribution Station 19600 87th Lane Lenexa
Merriam
Facility Name Address City Insured Value Occupancy Substance
County Facility Med-Act 1131, (Merriam Fire Station) 9000 W. 62nd Terr Merriam
County Facility Crisis Residential Facility/Breakthrough House 8901 W. 50th Terr. Merriam
County Facility Crisis Residential Facility/Breakthrough Garage 8903 W. 50th Terr. Merriam
County Facility Supplemental Support Bldg 6235 Slater Merriam
County Facility Antioch 8700 Shawnee Mission Park Merriam
County Facility JCDS - Mackey House 5738 Mackey St Merriam County Facility 57th St. 8536 W. 57th St. Merriam

Region L Hazard Mitigation Plan, 2013 Final
County Facility HSA Nutrition Site - Merriam/Shawnee Ctr 5701 Merriam Dr. Merriam
County Facility Merriam Community Center 5701 Merriam Dr. Merriam County Fuel Tank Antioch Park Maintenance 6501 Antioch Road Merriam County Fuel Tank Antioch Park Maintenance 6501 Antioch Road Merriam County Fuel Tank Antioch Park Maintenance 6501 Antioch Road Merriam Fire Station Merriam, Stn 1 9000 W 62ND TER Merriam $ 5,250,000 12 Government Office Merriam City Hall 9000 W 62nd Ter Merriam $ 5,250,000 20
HazMat Concrete Materials Inc 9900 W 75TH ST Merriam
CALCIUM CHLORIDE, Flyash, ground granulated blast furnace slag, MB AE 90 Air entrained agent, Polyheed 997, portland cement, Pozzolith 220N, Pozzolith 534 NC, Polyheed 900
HazMat Shawnee Mission Medical Center 9100 West 74th Street Merriam OXYGEN,(CRYOGENIC LIQUID)
HazMat Car Max #7173 6801 E FRONTAGE RD Merriam GASOLINE HazMat Lucent Technologies 9510 W 67TH ST Merriam SULFURIC ACID, COPPER
Hospital Shawnee Mission Medical Center 9100 West 74th Street Merriam 2800
Nursing Home Trinity Nursing and Rehab Center 9700 W 62nd St Merriam Nursing Home South Park House 9322 W 50th Ter Merriam Police Merriam Police 9010 E 62ND ST Merriam $ 2,520,000 17
Private/Commercial H.D. Lee World Headquarters 9701 W 67th St. Merriam
Private/Commercial Johnson county Library, Antioch Branch 8700 W 63 St. Merriam
Private/Commercial Seabord Building 9000 W. 67 St. Merriam
Transportation Burlington northern Santa Fe Railroad Merriam

Region L Hazard Mitigation Plan, 2013 Final
Transportation City of Merriam Public Works 6901 Knox St. Merriam Utility KCPL Sub-station 6412 Carter Ave Merriam
Utility Water One Storage/pumping station 67 East Frontage Road Merriam
Utility Williams Pipeline Merriam
Mission
Facility Name Address City Insured Value Occupancy Substance County Facility Final Settling Tank - 2 Tanks 47th & Nall Mission
County Facility Foxridge Towers, Antenna Site 5700 Broadmoor Mission
County Facility Hazardous Materials Collection Facility 5801 Foxridge Dr. Mission
County Facility Hazardous Materials Collection Facility 5801 Foxridge Dr. Mission
County Facility Hazardous Materials Collection Facility 5801 Foxridge Dr. Mission
County Facility Hazardous Materials Collection Facility 5801 Foxridge Dr. Mission
County Facility JCDS - Ash 5117 Ash Mission County Facility Martway Holding Station 5395 Martway Mission
County Facility Myron K Nelson Treatment Plant Cmplx, Mission Ma 48th & Nall Mission $ 30,000,000.00 50
County Facility Northeast Offices 6000 Lamar Ave Mission $ 12,000,000.00 300 County Facility Process Water Building 48th and Nall Mission County Facility Radio Tower 6000 Lamar Ave Mission
County Facility Storage of Command Post (Fire District #2) 6400 Martway Mission
County Facility Turkey Creek Plant 47th & Nall Mission
County Facility Sylvester Powell Community Ctr. Mission $ 18,000,000.00 300 County Facility Comm. Radio Stations (4) Mission $ 30,000,000.00 750 County Fuel Tank Myron K. Nelson 4800 Nall Mission
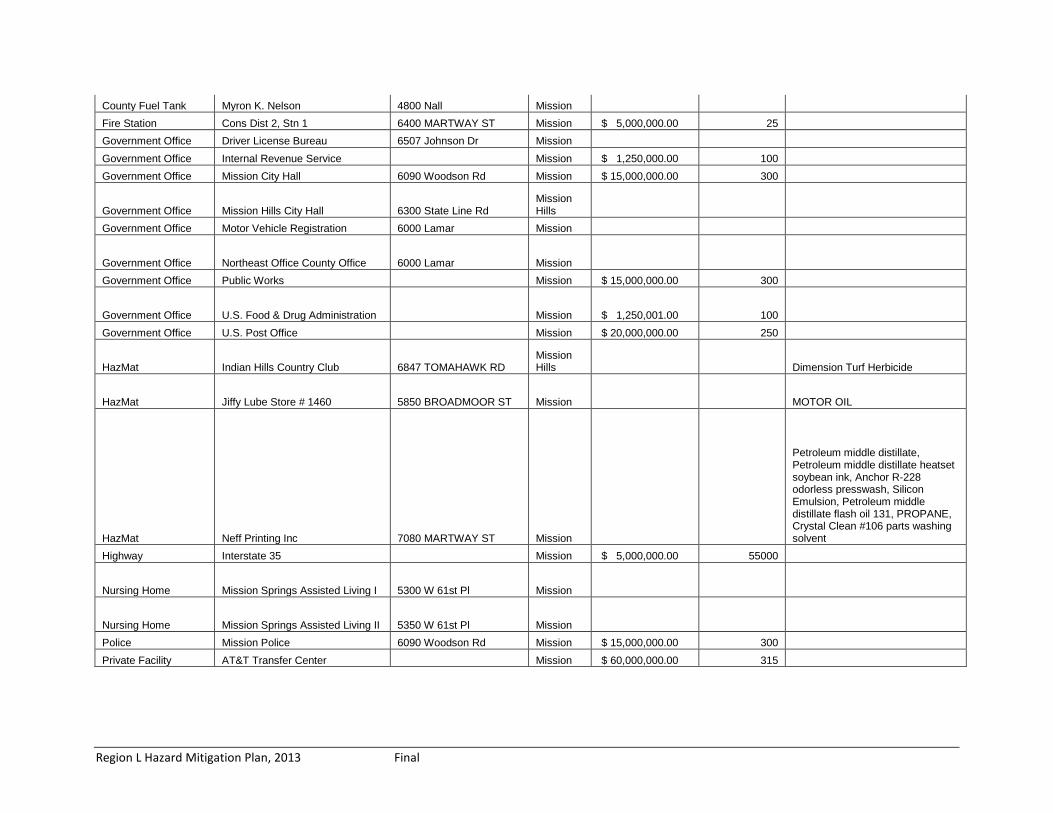
Region L Hazard Mitigation Plan, 2013 Final
County Fuel Tank Myron K. Nelson 4800 Nall Mission Fire Station Cons Dist 2, Stn 1 6400 MARTWAY ST Mission $ 5,000,000.00 25 Government Office Driver License Bureau 6507 Johnson Dr Mission Government Office Internal Revenue Service Mission $ 1,250,000.00 100 Government Office Mission City Hall 6090 Woodson Rd Mission $ 15,000,000.00 300
Government Office Mission Hills City Hall 6300 State Line Rd Mission Hills
Government Office Motor Vehicle Registration 6000 Lamar Mission
Government Office Northeast Office County Office 6000 Lamar Mission Government Office Public Works Mission $ 15,000,000.00 300
Government Office U.S. Food & Drug Administration Mission $ 1,250,001.00 100 Government Office U.S. Post Office Mission $ 20,000,000.00 250
HazMat Indian Hills Country Club 6847 TOMAHAWK RD Mission Hills Dimension Turf Herbicide
HazMat Jiffy Lube Store # 1460 5850 BROADMOOR ST Mission MOTOR OIL
HazMat Neff Printing Inc 7080 MARTWAY ST Mission
Petroleum middle distillate, Petroleum middle distillate heatset soybean ink, Anchor R-228 odorless presswash, Silicon Emulsion, Petroleum middle distillate flash oil 131, PROPANE, Crystal Clean #106 parts washing solvent
Highway Interstate 35 Mission $ 5,000,000.00 55000
Nursing Home Mission Springs Assisted Living I 5300 W 61st Pl Mission
Nursing Home Mission Springs Assisted Living II 5350 W 61st Pl Mission Police Mission Police 6090 Woodson Rd Mission $ 15,000,000.00 300 Private Facility AT&T Transfer Center Mission $ 60,000,000.00 315

Region L Hazard Mitigation Plan, 2013 Final
RadMat DIAGNOSTIC TECHNOLOGY CONSULTANTS 5930 ROE AVE Mission
RadMat MISSION MEDVET 5501 JOHNSON DR Mission School Friends University Mission $1,000,000 50
Mission Hills
Facility Name Address City Insured Value Occupancy Substance
Government Office Mission Hills City Hall 6300 State Line Rd Mission Hills
HazMat Indian Hills Country Club 6847 TOMAHAWK RD Mission Hills Dimension Turf Herbicide
Olathe
Facility Name Address City Insured Value Occupancy Substance
County Facility Med-Act 1156, (Olathe FD) 24200 W. 111th Street Olathe County Facility Med-Act Support Services 205 E. Flaming Drive Olathe
County Facility Juvenile Field Services & Corrections Admin
131-139 S. Kansas Avenue Olathe
County Facility Administration Building 111 S. Cherry Olathe
County Facility Election Commission 2101 E Kansas City Road Olathe County Facility Juvenile Detention 915 W. Spruce Olathe County Facility Central Warehouse 135 S. Fir Olathe County Facility Mental Health Center 1125 W. Spruce Olathe
County Facility Hanger K, L, M, N, O, P, R, S T 15100 Pflumm Olathe
County Facility Executive Airport, Maintenance Garage 15335 Pflumm Road Olathe
County Facility Public Works Office 1800 W. Old 56 Hwy Olathe
County Facility Central Transmitting, Antenna Site Olathe

Region L Hazard Mitigation Plan, 2013 Final
County Facility Air Traffic Control Tower 15100 Pflumm Olathe County Facility Kansas City Aviation Center 15100 Pflumm Olathe County Facility Air Associates 15100 Pflumm Olathe County Facility Kansas City Aviation Center 15100 Pflumm Olathe County Facility Air Associates 15100 Pflumm Olathe County Facility Kansas City Aviation Center 15100 Pflumm Olathe
County Facility Public Works Maintenance Area 1800 W. 56 Hwy Olathe
County Facility Public Works Bridge Building 1800 W. 56 Hwy Olathe County Facility Public Works Salt Dome 1800 W. 56 Hwy Olathe County Facility Courthouse 100 S. Kansas Olathe
County Facility Motor Vehicle-Olathe 1327 East Santa Fe, Ste A Olathe
County Facility Med-Act 1151 205 E. Flaming Drive Olathe County Facility Colonial Building 110 W. Loula Olathe County Facility Storage Building 127 South Cherry Olathe County Facility Supported Living 616 N. Monroe Olathe County Facility Independent Living 200 E. Cedar Olathe
County Facility Supervised Living 13850 S. Constance Court Olathe
County Facility Wastewater Storage 1525 E. Spruce Olathe
County Facility Dist. Court Service, Juvenile Intake 905 W. Spruce Olathe
County Facility Adult Detention Center 101 N. Kansas Ave Olathe
County Facility Court Services 18505 W. 119th Street Olathe
County Facility Adolescent Center For Treatment 301 N. Monroe Olathe
County Facility Transit Bldg#1 - Administration 1701 W 56 Highway Olathe
County Facility Sunset Office Building 11811 South Sunset Drive Olathe
County Facility Health & Human Services Center Complex 11875 S. Sunset Olathe

Region L Hazard Mitigation Plan, 2013 Final
County Facility Transit Bldg#2 - Fueling Station 1701 W 56 Highway Olathe County Facility Transit Bldg#3 - Bus Wash 1701 W 56 Highway Olathe
County Facility Transit Bldg#4 - Bus Parking Structure 1701 W 56 Highway Olathe
County Facility Facilities - Records 920 W Spruce Olathe County Facility HSA Nutrition Site - Olathe 311 E. Park Olathe
County Facility Operations Center 19310 W. 159th Street Olathe County Facility JCDS - 154th St 2145 E 154th St Olathe County Facility JCDS - Ramsgate2 16221 W. 132nd Terr Olathe
County Facility Brookwood Ct. 13901 S. Brookwood Ct. Olathe County Facility Med-Act 1154, (Olathe F.D) 13301 S. Mur-Len Olathe
County Fuel Tank Public Works Headquarters 1800 West 56 Highway Olathe
County Fuel Tank Public Works Headquarters 1800 West 56 Highway Olathe County Fuel Tank Executive 15335 Pflumm Rd Olathe County Fuel Tank Executive 15335 Pflumm Rd Olathe
County Fuel Tank Public Works Transit Building 1701 West 56 Highway Olathe
County Fuel Tank Public Works Transit Building 1701 West 56 Highway Olathe
County Fuel Tank Public Works Transit Building 1701 West 56 Highway Olathe Fire Station Olathe, Stn 2 1705 N RENNER RD Olathe Fire Station Olathe, Stn 3 14940 W 143RD ST Olathe Fire Station Olathe, Stn 4 13301 MUR-LEN RD Olathe Fire Station Olathe, Stn 5 1128 W SPRUCE RD Olathe
Fire Station Olathe, Stn 6 24200 COLLEGE BLVD Olathe Fire Station Olathe, Stn 1 501 E US56 HWY Olathe
Fire Station Olathe, Stn 7 16040 S MUR-LEN RD Olathe

Region L Hazard Mitigation Plan, 2013 Final
Government Office Johnson County Election Office 2101 E Kansas City Rd Olathe Government Office Motor Vehicle Registration 1327 "A" E Santa Fe Olathe Government Office Olathe City Hall 100 E Santa Fe Olathe
Government Office Sunset Office County Office 11811 South Sunset Dr Olathe
Government Office Kansas Highway Patrol Inspection Station 395 E Dennis Av Olathe
Government Office Johnson County Courthouse 100 N Kansas Olathe Government Office Driver License Bureau 1839 S Ridgeview Rd Olathe
HazMat City of Olathe Water Treatment Plant # 1 600 S CURTIS ST Olathe
AMMONIA (ANHYDROUS), CHLORINE
HazMat City of Olathe Water Treatment Plant # 2 27065 W 83RD ST Olathe CHLORINE
HazMat Century Concrete - Olathe 1340 W 149TH ST Olathe
DIESEL FUEL, Fly Ash, Calcium Carbonate (Limestone Aggregate), CALCIUM CHLORIDE, ANHYDROUS, Portland Cement Type I, II, III, Silica Sand
HazMat Sysco Food Services of Kansas City
1915 E KANSAS CITY RD Olathe
CHLORINE, SULFURIC ACID, AMMONIA (ANHYDROUS), Solid Power Plus, Ice Melt, DIESEL FUEL, Reliance Disinfectant Bleach

Region L Hazard Mitigation Plan, 2013 Final
HazMat ExxonMobil 1400 S HARRISON ST Olathe
amine Tallow primary/adogen 170, calcium carbonate, CALCIUM HYDROXIDE, GRAPHITE (NATURAL), LITHIUM HYDROXIDE, molybdenum disulphide, mondur m flake, Para Toluidine (Benzen Amine, 4-Methyl, TOLUENE-2,6-DIISOCYANATE, Cenwax ME, CALCIUM CARBONATE Vicron 45-3, 15 micron Artificial Graphite, Amine Cyclohexyl, ANILINE, Baragel 3000, CN 1416, Dicalcium Phosphate, Grease Mixture, Hydrocal 3147, infinium C9425, isocyanate 227, Lubrizol 2002D, Molyvan A, Mondor M Fused, Nalco 356, NITROGEN, DIESEL FUEL
HazMat McAnany Oil Co Inc 1125 W 149TH ST Olathe Lube Oil
HazMat Southwestern Bell Mobile Systems 114 114 N WATER ST Olathe DIESEL FUEL, SULFURIC ACID
HazMat Kansas City Aviation Center 15325 S PFLUMM RD Olathe GASOLINES: AVIATION (< 4.86G LEAD/GAL), JET FUEL: JP-1

Region L Hazard Mitigation Plan, 2013 Final
HazMat ITW Dymon 805 E OLD 56 HWY Olathe
Odorless Mineral Spirits, D'Limonene, ISOBUTANE, Propane A-110 Aerosol Grade, Isoparaffinic Hydrocarbon, 2-BUTOXYETHANOL, TOLUENE, ACETONE, ETHANOL SDA 3A, BUTYL ACETATE, ETHANOL blend, Ethanol SDA 40B
HazMat Pepsi Cola General Bottlers 1775 E KANSAS CITY RD Olathe GASOLINE, DIESEL FUEL
HazMat NuCo2 Inc 15350 S KEELER ST Olathe CARBON DIOXIDE, REFRIGERATED LIQUID
HazMat Nitrogen Air Pressue Co Inc 15080 W 116TH ST Olathe NITROGEN, CARBON DIOXIDE
HazMat KM Interstate Gas Transmission - Kenneth Rd Faci 3401 W 159TH ST Olathe MERCAPTAN MIXTURE, [LIQUID]
HazMat Federal Aviation Administration 250 S ROGERS RD Olathe DIESEL FUEL
HazMat Vectron International Olathe Inc 620 N LINDENWOOD DR Olathe Carbon Dioxide, NITROGEN
HazMat Honeywell - Olathe 23500 W 105TH ST Olathe NITROGEN, SULFURIC ACID, LEAD
HazMat Marble Creations Inc 1401 W OTT ST Olathe Marble Dust HazMat Marley Cooling Technologies 1200 W MARLEY RD Olathe TETRAHYDROFURAN
HazMat LaFarge N A Inc - Olathe RM Plant 901 E OLD 56 HWY Olathe
CALCIUM CHLORIDE, DIESEL FUEL, Portland Cement, sand, limestone
HazMat Performance Plating Inc 435 S KANSAS AVE Olathe SULFURIC ACID, SODIUM CYANIDE
HazMat Geiger Ready Mix Co Inc 875 E OLD 56 HWY Olathe CALCIUM CHLORIDE, Darachem 65, diesel, Polarset

Region L Hazard Mitigation Plan, 2013 Final
HazMat Electrolux Construction Products 17400 W 119TH ST Olathe
POLYMERIC DIPHENYLMETHANE DIISOCYANATE
HazMat Magellan Olathe Terminal 13745 W 135TH ST Olathe WPL IVD gasoline additive, FS II Anti-Icer
HazMat W R Grace & Co - Conn GCP 701 S KANSAS AVE Olathe
Adva Cast 530, Daracel, Daracem ML – 500, Daracem 100, Daracem – 50, Daraset 200, Daratard – 17, daravair – 1000, Daravair – 1400, Darex II AEA, DCI Corrosion inhibitor, DCI-S corrosion inhibitor, Force 10,000 D, Gilco Accelerator, Polarset, WRDA – 82, WRDA/Hycol, ADVA CAST 530, DARACEM 65, Daravair AT60, Eclipse Plus
HazMat A T & T - Olathe 15085 W 116TH ST Olathe SULFURIC ACID
HazMat Tyson Foods Inc - Olathe Distribution Center 20701 W 159TH ST Olathe
AMMONIA (ANHYDROUS), SULFURIC ACID
HazMat The Industrial Fumigant Company 19745 W 159TH ST Olathe ALUMINUM PHOSPHIDE, METHYL BROMIDE
HazMat Superior Bowen Asphalt Company 23555 W 151ST ST Olathe
DIESEL FUEL, ASPHALT, Industrial cleaner, gasoline, PROPANE
HazMat ADM Arkady 100 S PANIPLUS RDWY Olathe SULFURIC ACID HazMat Asphalt Sales Company, Inc 23200 W 159TH ST Olathe PROPANE HazMat Jiffy Lube Store # 244 1114 E SANTA FE ST Olathe MOTOR OIL HazMat Jiffy Lube Store # 2908 15305 W 135TH ST Olathe MOTOR OIL
HazMat Rental Service Corporation #298 11615 S ROGERS RD Olathe Lead Acid Battery (Sulfuric Acid)
HazMat Shawnee Rock Co, Plant # 1 - Lone Elm 1600 W 151ST ST Olathe
DIESEL FUEL, Super Heavy Duty Engine Oil

Region L Hazard Mitigation Plan, 2013 Final
HazMat Webco Manufacturing, Inc. 15750 S KEELER TER Olathe NITROGEN, LIQUID OXYGEN, ARGON
HazMat Cintas Corp 2050 E KANSAS CITY RD Olathe
SULFURIC ACID, Express, Horizon, Alpha Liquid Detergent
HazMat Desco Coatings, Inc 616 N ROGERS RD Olathe Epoxy Resin HazMat Jiffy Lube Store # 3041 20015 W 153RD ST Olathe MOTOR OIL
Hospital Olathe Medical Center 20333 West 151st Street Olathe
Jail Johnson County Adult Detention 101 N Kansas Ave Olathe
Jail Johnson County Juvenile Detention Center 915 W Spruce St Olathe
Nursing Home Royal Terrace Nursing/Rehab Center 201 E Flaming Rd Olathe
Nursing Home Johnson County Nursing Center 11875 S Sunset Olathe
Nursing Home Olathe Good Samaritan Center 20705 W 151st St Olathe
Nursing Home Pinnacle Ridge Nursing/Rehab Ctr. 400 S Rogers Rd Olathe
Nursing Home Villa St Francis 16600 W 126th St Olathe Nursing Home Aberdeen Village 17500 W 119th St Olathe
Nursing Home The Homestead of Olathe North 791 Somerset Ter Olathe
Nursing Home The Homestead of Olathe South 751 Somerset Ter Olathe Nursing Home Assisted Lifestyles 625 Lincoln Olathe Nursing Home Cedar Lake Village 15325 Lone Elm Rd Olathe
Nursing Home Bethesda Lutheran Homes/Faith 1 14155 W 113th St Olathe
Nursing Home Bethesda Lutheran Homes/Faith 2 14175 W 113th St Olathe
Nursing Home Bethesda Lutheran Homes/Faith 3 14235 W 113th St Olathe

Region L Hazard Mitigation Plan, 2013 Final
Nursing Home Hoeger House 20911 W 153rd St Olathe Police Olathe Police 501 E Old 56 Hwy Olathe RadMat CITY OF OLATHE 100 E SANTA FE ST Olathe
RadMat HONEYWELL INTERNATIONAL 23500 W 105TH ST Olathe
RadMat OLATHE MEDICAL CENTER 20333 W 151ST ST Olathe School Kansas School for Deaf Roth Bldg, 450 E Park Olathe $ 12,000,000 300
School Kansas School for Deaf Roberts Bldg, 458 E Park Olathe $ 8,000,000 225
School Kansas School for Deaf Parks-Bilger, 455 E. Santa Fe Olathe $ 8,500,000 120
School Kansas School for Deaf Emery Bldg, 440 E. Park Olathe $ 15,000,000 240
School Kansas School for Deaf Taylor Bldg, 419 E. Santa Fe Olathe $4,100,000 35
School Kansas School for Deaf Old Voc Bldg, 423 E. Santa Fe Olathe $ 3,200,000 45
School Kansas School for Deaf Infirmary, 450 E. Park Olathe $ 2,100,000 16
School Kansas School for Deaf Power House, 425 E. Santa Fe Olathe $ 3,900,000 18
School Kansas School for Deaf White House, 400 E. Park Olathe $ 75,000 8 Sheriff Johnson County Sheriff 125 N Cherry St Olathe
Overland Park
Facility Name Address City Insured Value Occupancy Substance
County Facility 101st Terr. 9032 W. 101st Terr. Overland Park
County Facility Aeration Basin #1 10001 College Blvd. Overland Park
County Facility Aeration Blower Building 2523 W. 151st St. Overland Park

Region L Hazard Mitigation Plan, 2013 Final
County Facility Blue Valley Library 9000 W. 151st Street Overland Park
County Facility Central Resource Library 9875 W. 87th St. Overland Park
County Facility HSA Nutrition Site - Blue Valley 6100 W 127th St
Overland Park
County Facility HSA Nutrition Site - Overland Park 6300 W 87th St
Overland Park
County Facility JCDS - 54th Terr 8202 W. 54th Terr Overland Park
County Facility JCDS - Antioch 7985 Antioch Overland Park
County Facility JCDS - Farley 8050 Farley #305 Overland Park
County Facility JCDS - Hayes 9141 Hayes Overland Park
County Facility JCDS - Lamar Ave 7916 Lamar Ave Overland Park
County Facility JCDS - Robinson 1 9301 Robinson Overland Park
County Facility JCDS - Robinson 2 9300 Robinson Overland Park
County Facility JCDS-98th Circle 8403 W. 98th Circle Overland Park
County Facility JCDS-Goddard 9443 Goddard Overland Park
County Facility JCDS-Nall Hills 5608 W. 99th Terr. Overland Park
County Facility M.A.S.T. Bldg, Antenna Site 7500 W. 110th St. Overland Park
County Facility Med-Act 1103, North Battalion Chief 8500 Grandview
Overland Park
County Facility Med-Act 1141 (OPFD 1) 7550 W. 75th St Overland Park
County Facility Med-Act 1142 (OPFD 2) 9500 W. 95th St Overland Park

Region L Hazard Mitigation Plan, 2013 Final
County Facility Med-Act 1144, (O.P. Fire Dept) 8051 W 119th St.
Overland Park
County Facility Med-Act 1145 (OPFD 5) 15935 Metcalf Overland Park
County Facility Med-Act Community Education 11902 Lowell
Overland Park
County Facility MedAct, 1143 & 1104, O.P. Battalion Chief (OPFD) 13801 Switzer
Overland Park
County Facility Mental Health Center - Blue Valley 15118 Glenwood
Overland Park
County Facility Middle Basin 10001 College Blvd. Overland Park
County Facility Oak Park 9500 Bluejacket Overland Park
County Facility Operations Building 2523 W. 151st St. Overland Park
County Facility Overland Park Convention Center, Sheraton Hotel 6100 College Blvd
Overland Park
County Facility Overland Park PD Tower, Antenna Site 8500 Antioch
Overland Park
County Facility SWB Cellular Tower Site Overland Park
County Facility Switzer House 8525 Switzer Overland Park
County Facility Warehouse - Library Storage 11313-17 West 87th Terrac
Overland Park
County Fuel Tank Middle Basin 1001 College Blvd Overland Park
County Fuel Tank Middle Basin 1001 College Blvd Overland Park
Fire Station Overland Park, Stn 1 7550 W 75TH ST Overland Park $ 770,760,000
Fire Station Overland Park, Stn 2 9500 W 95TH ST Overland Park $ 1,198,240
Fire Station Overland Park, Stn 3 13801 SWITZER RD Overland Park $ 2,557,200

Region L Hazard Mitigation Plan, 2013 Final
Fire Station Overland Park, Stn 4 8051 W 119TH ST Overland Park $ 12,564,910
Government Office Overland Park City Hall 8500 Santa Fe Dr Overland Park $ 5,498,440 400
HazMat Airgas Puritan Medical Products Inc 9101 BOND ST
Overland Park
NITROUS OXIDE, CARBON DIOXIDE, OXYGEN, SODA LIME, ethylene oxide sterilant gas, NITROGEN
HazMat Cardinal Health 11300 GLENWOOD ST
Overland Park LEAD, sulfuric acid
HazMat Cingular Wireless - Farley Mobile Telephone Swit 7801 FARLEY ST
Overland Park
SULFURIC ACID, DIESEL FUEL
HazMat Costco #369 12221 BLUE VALLEY PKWY
Overland Park SULFURIC ACID, LEAD
HazMat Federal Express-IXDRC 8215 W 108TH TER Overland Park
DIESEL FUEL, SULFURIC ACID
HazMat GE Employers Reinsurance Corporation (GE ERC) 5200 METCALF AVE
Overland Park
SULFURIC ACID, LEAD, DIESEL FUEL
HazMat Jiffy Lube Store # 1180 9757 QUIVIRA RD Overland Park MOTOR OIL
HazMat Jiffy Lube Store # 1180 9757 QUIVIRA RD Overland Park MOTOR OIL
HazMat Jiffy Lube Store # 1355 11940 RILEY ST Overland Park MOTOR OIL
HazMat Jiffy Lube Store # 1930 8625 W 151ST ST Overland Park MOTOR OIL
HazMat Jiffy Lube Store # 2217 10201 W 75TH ST Overland Park MOTOR OIL
HazMat Jiffy Lube Store # 578 7000 W 95TH ST Overland Park MOTOR OIL

Region L Hazard Mitigation Plan, 2013 Final
HazMat Kansas City Power & Light - Johnson County Servi 8730 NIEMAN RD
Overland Park $ 1,553,030 DIESEL FUEL, GASOLINE
HazMat Kansas Gas Service/Div of Oneonk-Mission Service 11401 W 89TH ST
Overland Park DIESEL FUEL, GASOLINE
HazMat Kansas Gas Service/Div of Oneonk-Overland Park -
W 115TH ST & QUIVIRA RD
Overland Park RP Captan
HazMat Nextel West Corp - Kansas City MSO
7007 COLLEGE BLVD
Overland P{ark
SULFURIC ACID, DIESEL FUEL
HazMat Nextel-Kansas City MSO 7007 COLLEGE BLVD
Overland Park
DIESEL FUEL, SULFURIC ACID
HazMat Sam's Club # 4707 8300 W 135TH ST Overland Park SULFURIC ACID
HazMat Southern Star Central Pipeline (South Glavin) 11486 QUIVIRA RD
Overland Park Tert-butyl mercaptan
HazMat Southwestern Bell Mobile System 14969
14969 METCALF AVE
Overland Park
DIESEL FUEL, SULFURIC ACID
HazMat Southwestern Bell Mobile Systems 7400 7400 JOHNSON DR
Overland Park
DIESEL FUEL, SULFURIC ACID
HazMat Southwestern Bell Mobile Systems 8686
8680 COLLEGE BLVD
Overland Park
DIESEL FUEL, SULFURIC ACID
HazMat Southwestern Bell Mobile Systems 9444 9444 NALL AVE
Overland Park
DIESEL FUEL, SULFURIC ACID
HazMat Sprint Communications Company 5454 W 110TH ST
Overland Park
DIESEL FUEL, SULFURIC ACID, LEAD COMPOUNDS
HazMat Sprint Communications Company L.P. - Headquarter 6411 SPRINT PKWY
Overland Park DIESEL FUEL, GASOLINE
HazMat Sprint Communications Company L.P. - Headquarter 6480 SPRINT PKWY
Overland Park
HFC-227EA, LEAD COMPOUNDS, SULFURIC ACID
HazMat Sprint Communications Company L.P. - OP Corp Off 9300 METCALF AVE
Overland Park
SULFURIC ACID, LEAD COMPOUNDS
HazMat Sprint Communications Company L.P. - OP Corp Off 6666 W 110TH ST
Overland Park
LEAD COMPOUNDS, SULFURIC ACID
HazMat Sprint Communications Company L.P. - Overland Pa 9350 METCALF AVE
Overland Park
SULFURIC ACID, LEAD COMPOUNDS, DIESEL FUEL

Region L Hazard Mitigation Plan, 2013 Final
HazMat Sprint Communications Company L.P. - Overland Pa
5000 COLLEGE BLVD
Overland Park SULFURIC ACID
HazMat Sprint Communications Company L.P. - Overland Pa
6600 COLLEGE BLVD
Overland Park SULFURIC ACID
HazMat Universal Engraving Inc 9090 NIEMAN RD Overland Park
COPPER, FERRIC CHLORIDE, HYDROGEN CHLORIDE, HYDROQUINONE, SULFURIC ACID, ZINC
HazMat World Com - IVKPKS 7251 W 105TH ST Overland Park
DIESEL FUEL, SULFURIC ACID
Hospital Children's Mercy South Hospital 5808 W 110th St
Overland Park $ 35,700,660 34 beds
Hospital Menorah Medical Park 5721 W 119th Street Overland Park $ 14,011,000 158 beds
Hospital Overland Park Regional Medical Center 10500 Quivira Road
Overland Park $ 39,562,380 343 beds
Hospital St. Lukes South Hospital 12300 Metcalf Avenue
Overland Park $ 49,535,970 75 beds
Nursing Home Ashford Place 10665 Barkley Overland Park $ 7,069,510 100
Nursing Home Benson House 8518 Benson Overland Park
Nursing Home Conser House 7829 Conser Overland Park
Nursing Home Cypress Court of Overland Park 11000 Oakmont
Overland Park $ 2,804,400 60
Nursing Home Delmar Gardens of Overland Park 12100 W 109th St
Overland Park $ 5,997,230 120
Nursing Home Freedom Pointe of OP 9201 Foster Overland Park $ 8,763,450 124
Nursing Home Gables Assisted Living 11701 Nieman Rd Overland Park $ 29,500,000 41
Nursing Home Garden Terrace of Overland Park 7541 Switzer Rd
Overland Park $ 5,574,200 165

Region L Hazard Mitigation Plan, 2013 Final
Nursing Home Grandview Lane 8501 Grandview Overland Park
Nursing Home Heartland Surgical Spec. Hosp. LLC 10720 Nall Ave
Overland Park
Nursing Home Indian Creek Healthcare Center 6515 W 103rd St
Overland Park $ 1,877,410 120
Nursing Home Lamar Court 11909 Lamar Overland Park $ 923,380 85
Nursing Home Manorcare Health Services 5211 W 103rd St Overland Park $ 480,020 248
Nursing Home Mid America Rehab. Hospital 5701 W 110th St Overland Park $ 8,947,380 Outpatient
Nursing Home Overland Park Nursing and Rehab 6501 W 75th St
Overland Park $ 492,010 102
Nursing Home Select Specialty Hospital/KC 10500 Quivira Rd Overland Park
Nursing Home Silvercrest at Deer Creek 13060 Metcalf Ave Overland Park $ 2,496,000 116
Nursing Home Specialty Hospital/Mid-America SNF 6509 W 103rd St
Overland Park
Nursing Home Stratford Commons 12340 Quivira Rd Overland Park $ 860,300 57
Nursing Home The Atriums 7300 W 107th St Overland Park $ 17,357,400 205
Nursing Home The Forum at Overland Park 3501 W 95th St Overland Park $ 18,441,380 207
Nursing Home The Rose Estates 12700 Antioch Rd Overland Park $ 557,640 100
Nursing Home Villa Saint Joseph 11901 Rosewood St Overland Park $ 736,880 120
Nursing Home Village Shalom, Inc 5500 W 123rd St Overland Park $ 8,135,970 206
Nursing Home Vintage Park at Stanley 14430 Metcalf Ave Overland Park $ 985,500 41
Police Overland Park Police 8500 Antioch Rd Overland Park

Region L Hazard Mitigation Plan, 2013 Final
Police Overland Park Police 12400 Foster Rd Overland Park
Police Overland Park Police Department 11900 Westgate St
Overland Park
RadMat APEX ENVIRONMENTAL CONSULTANTS
4800 COLLEGE BLV
Overland Park
RadMat
AQUATERRA ENVIRONMENTAL SYSTEMS 6980 W 153RD ST
Overland Park
RadMat ASH GROVE CEMENT COMPANY
8900 INDIAN CREEK PKWY
Overland Park
RadMat DBI INC 11660 W 90TH ST Overland Park
RadMat DIAGNOSTIC IMAGING CENTER
5520 COLLEGE BLV
Overland Park
RadMat DRESSLER CONSULTING ENGINEERING
4425 INDIAN CREEK PKWY
Overland Park
RadMat HNTB CORPORATION 7450 W 130TH ST Overland Park
RadMat JOHNSON COUNTY IMAGING CENTER 12000 W 110TH ST
Overland Park $ 2,493,300
RadMat KANSAS CITY CANCER CENTER 12200 W 110TH ST
Overland Park
RadMat MENORAH MEDICAL CENTER 5721 W 119TH ST
Overland Park
RadMat MIDWEST CARDIOLOGY ASSOCIATES 10550 QUIVIRA RD
Overland Park
RadMat
OVERLAND PARK REGIONAL MEDICAL CENTER 10500 QUIVIRA RD
Overland Park
RadMat PHYSICIANS REFERENCE LABORATORY 7800 W 110TH ST
Overland Park
RadMat RENO CONSTRUCTION COMPANY 7355 W 162ND TER
Overland Park
RadMat RICHARD A MORRISON MD 10500 MASTIN ST Overland Park

Region L Hazard Mitigation Plan, 2013 Final
RadMat SAINT LUKE'S SOUTH HOSPITAL
12300 METCALF AVE
Overland Park
RadMat SVERDRUP ENVIRONMENTAL
4400 COLLEGE BLV
Overland Park
RadMat URS CORPORATION 10975 EL MONTE ST
Overland Park
RadMat VETERINARY SPECIALTY CENTER 11950 W 110TH ST
Overland Park
Medical Facility Diagnostic Imaging Centers Overland Park $ 1,022,230
Medical Facility St. Joseph Medical Center/Villas at St. Joseph
Overland Park $ 10,733,000 120 beds
Schools Jewish Community Campus Overland Park $ 37,075,340
Schools Johnson County Community College
Overland Park $ 132,326,080
Schools KU Edwards Campus Regents Bldg, 12600 Quivira Rd
Overland Park $ 11,057,000
Schools KU Edwards Campus Regnier Bldg, 12610 Quivira Rd
Overland Park $ 18,027,000
Schools KU Edwards Campus Jayhawk Bldg, 12520 Quivira Rd
Overland Park $ 4,019,000
Schools St. Thomas Aquinas Overland Park $ 22,266
City Facilities Blue Valley District Maintenance Facility
Overland Park $ 2,189,220 100
City Facilities Matt Ross community Center Overland Park $ 15,403,710 530
City Facilities Myron Scafe Bldg (formerly AJC)
Overland Park $ 4,695,000 250
City Facilities OP Fire headquarters Administrative Offices
Overland Park $ 584,710
City Facilities Overland park Fire Station #5 Overland Park $ 566,730 35
City Facilities Overland Park Fire Training Center
Overland Park $ 6,255,000 500

Region L Hazard Mitigation Plan, 2013 Final
City Facilities Overland Park Parks and Rec Building
Overland Park $ 12,564,910 80
City Facilities
Overland Park shawnee Mission Maintenance Facility/Dennis Garrett PW Station
Overland Park $ 1,947,720 65
City Facilities W. jack Sanders Justice Center
Overland Park $ 17,047,590 500
City Facilities Westgate Police Station Overland Park $ 682,530 150
Facilities/ Government Buildings/Water Treatment/ Communications
Johnson County Waste Water Plant
Overland Park
Facilities/ Government Buildings/Water Treatment/ Communications
Johnson County Water Distribution Station #1
Overland Park $ 10,272,710
Facilities/ Government Buildings/Water Treatment/ Communications
Johnson County Water Distribution Station #2
Overland Park $ 233,480
Facilities/ Government Buildings/Water Treatment/ Communications
Johnson County Water Distribution Station #3
Overland Park
Facilities/ Government Buildings/Water Treatment/ Communications
Johnson County Water Distribution Station #4
Overland Park

Region L Hazard Mitigation Plan, 2013 Final
Facilities/ Government Buildings/Water Treatment/ Communications
Johnson County Water Distribution Station #5
Overland Park
Facilities/ Government Buildings/Water Treatment/ Communications
Kansas Gas Service/Div of Oneonk-Overland Park - south Bordor
Overland Park RP Captan
Facilities/ Government Buildings/Water Treatment/ Communications
KCPL Power Sub-Station - Antioch
Overland Park
Facilities/ Government Buildings/Water Treatment/ Communications
KCPL Power Sub-Station - Brookridge
Overland Park
Facilities/ Government Buildings/Water Treatment/ Communications
KCPL Power Sub-Station - College
Overland Park
Facilities/ Government Buildings/Water Treatment/ Communications
KCPL Power Sub-Station -Kenilworth
Overland Park
Facilities/ Government Buildings/Water Treatment/ Communications
KCPL Power Sub-Station - Overland Park
Overland Park

Region L Hazard Mitigation Plan, 2013 Final
Facilities/ Government Buildings/Water Treatment/ Communications
KCPL Power Sub-Station - Oxford
Overland Park
Facilities/ Government Buildings/Water Treatment/ Communications
KCPL Power Sub-Station - Reeder
Overland Park
Facilities/ Government Buildings/Water Treatment/ Communications
KCPL Power Sub-Station - Riley
Overland Park
Facilities/ Government Buildings/Water Treatment/ Communications
KCPL Power Sub-Station - Sprint
Overland Park
Facilities/ Government Buildings/Water Treatment/ Communications
KCPL Power Sub-Station - Switzer
Overland Park
Facilities/ Government Buildings/Water Treatment/ Communications
State of Kansas Office Building
Overland Park $ 2,350,000
Facilities/ Government Buildings/Water Treatment/ Communications
United States Postal Service #1
Overland Park $ 3,598,770

Region L Hazard Mitigation Plan, 2013 Final
Facilities/ Government Buildings/Water Treatment/ Communications
United States Postal Service #2
Overland Park $ 1,431,800
Facilities/ Government Buildings/Water Treatment/ Communications
United States Postal Service #3
Overland Park $ 1,620,590
Facilities/ Government Buildings/Water Treatment/ Communications
United States Postal Service #4
Overland Park $ 803,390
Facilities/ Government Buildings/Water Treatment/ Communications Bair Company & Associates
Overland Park $ 241,370 4,322 sq. Ft.
Facilities/ Government Buildings/Water Treatment/ Communications
Brookridge golf & Country Club
Overland Park $ 3,088,970 56,091 sq. ft.
Facilities/ Government Buildings/Water Treatment/ Communications Doubletree Hotel
Overland Park $ 22,074,200 266,490 sq. ft.
Facilities/ Government Buildings/Water Treatment/ Communications
KM Interstate Gas Transmission-Kenneth Rd Facility
Overland Park
Flood plain tank facility - Hazardous materials facility

Region L Hazard Mitigation Plan, 2013 Final
Facilities/ Government Buildings/Water Treatment/ Communications Minute Shop #2
Overland Park $ 407,630 2520 sq. ft.
flood plain tank facility-two 10,000 gal feberglass tanks
Facilities/ Government Buildings/Water Treatment/ Communications
O'Donnell & Sons Construction Company
Overland Park $ 566,560 9168 sq. ft.
Flood plain tank facility-one 3000 gal & one 4000 gal underground stell tanks
Facilities/ Government Buildings/Water Treatment/ Communications Phillips Kicks 66
Overland Park $ 974,430 4478 sq. ft.
Flood plain tank facitity-three 12,000 gal underground fiberglass tanks
Facilities/ Government Buildings/Water Treatment/ Communications Puritan Medical Products, Inc.
Overland Park $ 1,015,000 Hazardous materials facility
Facilities/ Government Buildings/Water Treatment/ Communications Universal Engraving, Inc
Overland Park $ 1,185,000 Hazardous materials facility
Top Employeers/Hotels/Convention Center Black and Veatch Corporation
Overland Park $ 44,112,000 3800
Top Employeers/Hotels/Convention Center Doubletree Hotel
Overland Park $ 22,074,200
356 guess rooms with 24,000 sq.
Ft. of meeting space
Top Employeers/ Hotels/ Convention Center Embarq
Overland Park $ 30,874,000 3800

Region L Hazard Mitigation Plan, 2013 Final
Top Employeers/ Hotels/ Convention Center Marriott
Overland Park $ 32,087,000
398 guest rooms with
14,000 sq. ft. of meeting
spaace
Top Employeers/ Hotels/ Convention Center Oak Park Mall
Overland Park $ 117,000,000
1542000 sq. ft. of area
Top Employeers/ Hotels/ Convention Center
Overland Park Canvention Center
Overland Park $ 45,482,530 290,746 sq. ft.
Top Employeers/ Hotels/ Convention Center Sheraton Hotel
Overland Park $ 53,523,800
412 guest rooms with
20000 sq. ft. of meeting
space
Top Employeers/ Hotels/ Convention Center Sprint Building
Overland Park $ 9,795,000 119680 sq. ft.
Top Employeers/ Hotels/ Convention Center Sprint World Headquarters
Overland Park 12,000
Chemical Inventory/Sulfuric Acid-Lead/Lead Compounds-HFC-227EA-Gasoline-Diesel Fuel #2
Top Employeers/ Hotels/ Convention Center Waddell and Reed financial
Overland Park $ 9,570,700 1,045
Top Employeers/ Hotels/ Convention Center Yellow Freight Company
Overland Park $ 26,997,000 2,600
Historic Landmarks Blackfeather Farm Historic Landmarks E.C. Chase House $ 191,890 Historic Landmarks Gleason House $ 209,020 Historic Landmarks Graham Rodgers House $ 158,100 Historic Landmarks Historic overland Theater Historic Landmarks Morse Church $ 191,890 Historic Landmarks Strange Car Barn $ 458,000
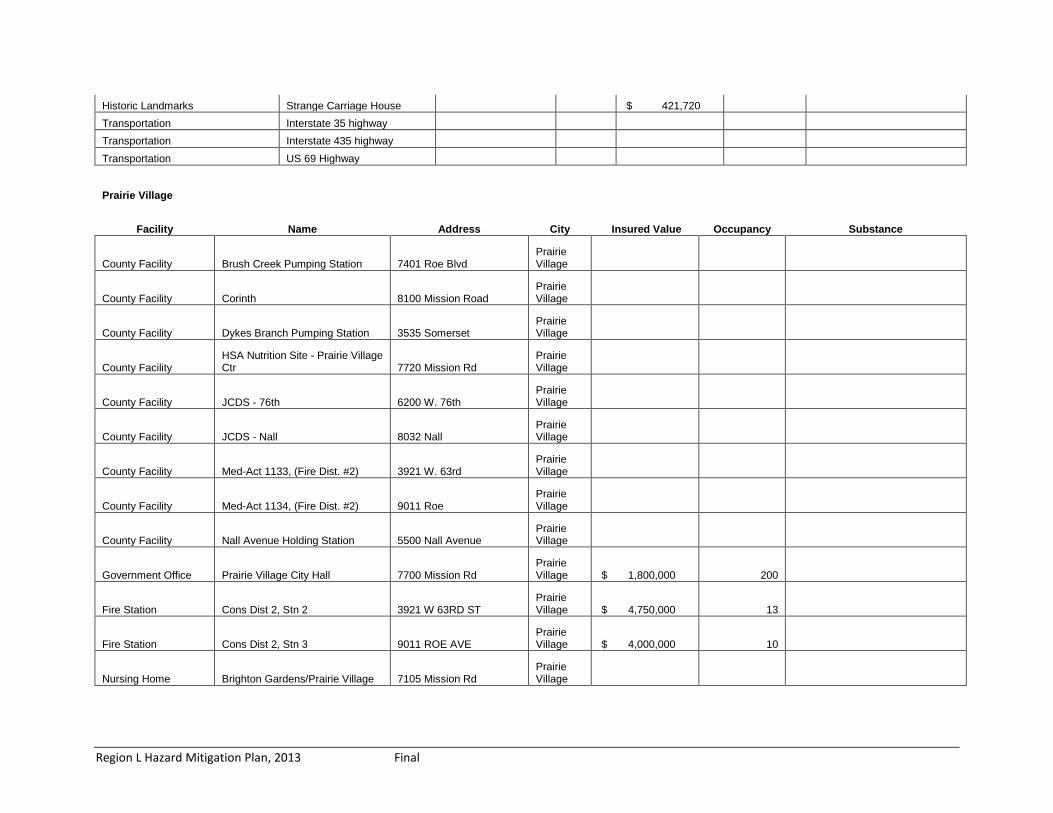
Region L Hazard Mitigation Plan, 2013 Final
Historic Landmarks Strange Carriage House $ 421,720 Transportation Interstate 35 highway Transportation Interstate 435 highway Transportation US 69 Highway
Prairie Village
Facility Name Address City Insured Value Occupancy Substance
County Facility Brush Creek Pumping Station 7401 Roe Blvd Prairie Village
County Facility Corinth 8100 Mission Road Prairie Village
County Facility Dykes Branch Pumping Station 3535 Somerset Prairie Village
County Facility HSA Nutrition Site - Prairie Village Ctr 7720 Mission Rd
Prairie Village
County Facility JCDS - 76th 6200 W. 76th Prairie Village
County Facility JCDS - Nall 8032 Nall Prairie Village
County Facility Med-Act 1133, (Fire Dist. #2) 3921 W. 63rd Prairie Village
County Facility Med-Act 1134, (Fire Dist. #2) 9011 Roe Prairie Village
County Facility Nall Avenue Holding Station 5500 Nall Avenue Prairie Village
Government Office Prairie Village City Hall 7700 Mission Rd Prairie Village $ 1,800,000 200
Fire Station Cons Dist 2, Stn 2 3921 W 63RD ST Prairie Village $ 4,750,000 13
Fire Station Cons Dist 2, Stn 3 9011 ROE AVE Prairie Village $ 4,000,000 10
Nursing Home Brighton Gardens/Prairie Village 7105 Mission Rd Prairie Village

Region L Hazard Mitigation Plan, 2013 Final
Nursing Home Somerset-Claridge Court 8101 Mission Rd Prairie Village
Police Prairie Village Police 7710 Mission Rd Prairie Village
Shelter Community Center $ 2,200,000 500
Emergency Equipment Public Works $ 1,500,000 100
Roeland Park
Facility Name Address City Insured Value Occupancy Substance
County Facility HSA MultiService Center - Roeland Park 4850 Rosewood Drive
Roeland Park
County Facility Cedar-Roe 5120 Cedar Roeland Park
Government Office Roeland Park City Hall 4600 W 51st St Roeland Park
Police Roeland Park Police 4600 W 51st St Roeland Park
Shawnee
Facility Name Address City Insured Value Occupancy Substance
County Facility Community Support Services (CSS) 6440 Nieman Road Shawnee
County Facility Headworks Building # 1 20001 W. 47th St. Shawnee County Facility House (Historic) 6305 Lackman Rd. Shawnee County Facility JCDS - 69th Terr 11400 W. 69th Terr Shawnee
County Facility Med-Act 1130 (Shawnee F.D.) 6805 Hedge Lane Shawnee
County Facility Med-Act 1132, (Shawnee Fire Station) 6501 Quivira Shawnee
County Facility Mill Creek Regional 20001 W. 47th St. Shawnee
County Facility Mill Creek SSD #3 Pump Station 7325 Renner Road Shawnee

Region L Hazard Mitigation Plan, 2013 Final
County Facility Museum 6305 Lackman Road Shawnee
County Facility Recovery Place (CSS) Annex 11120 W. 65th St. Shawnee County Facility Shawnee 13811 Johnson Dr. Shawnee
County Facility Shawnee Mission Park, Antenna Site 7700 Renner Road Shawnee
County Facility Storage of Ambulance (Shanwee Mission Ford)
11501 Shawnee Mission Pkw Shawnee
County Fuel Tank Shawnee Mission Park Maintenance 7700 Renner Road Shawnee
County Fuel Tank Shawnee Mission Park Maintenance 7700 Renner Road Shawnee
County Fuel Tank Streamway Parks System/Nursery
19902 Shawnee Mission Par Shawnee
County Fuel Tank Tomahawk Hills Golf Course Maintenance 17501 Midland Drive Shawnee
County Fuel Tank Tomahawk Hills Golf Course Maintenance 17501 Midland Drive Shawnee
County Fuel Tank Tomahawk Hills Golf Course Maintenance 17501 Midland Drive Shawnee
Fire Station Shawnee, Stn 1 6535 QUIVIRA RD Shawnee Fire Station Shawnee, Stn 2 19210 MIDLAND DR Shawnee
Fire Station Shawnee, Stn 3 6805 HEDGE LANE TER Shawnee Government Office Shawnee City Hall 11110 Johnson Dr Shawnee

Region L Hazard Mitigation Plan, 2013 Final
HazMat Bayer Healthcare LLC AH Div 12707 SHAWNEE MISSION PKW Shawnee
FUEL OIL, [NO. 2], PROPYLENE GLYCOL, wastewater, Tricalcium Phosphate, Toltrazuril Sulfone, SUCROSE, PIPERONYL BUTOXIDE, PERMETHRIN, Panasol AN-3N, N-METHYLPYRROLIDINONE, L-Arginine base, LACTIC ACID 20% solution, Imidacloprid, Gypsum Terra Alba, ETHYL ALCOHOL, Enrofloxacin, DIPROPYLENE GLYCOL MONOMETHYL ETHER, DIAZINON, CYFLUTHRIN, CUMAPHOS, Clout All WEather Bait, BENZYL ALCOHOL, POLY(VINYL CHLORIDE)
HazMat Carquest 7751 NIEMAN RD Shawnee SULFURIC ACID
HazMat Deffenbaugh Industries Inc 18181 W 53RD ST Shawnee
Antifreeze, hydraulic fluid, gear lubricant, MOTOR OIL, PROPANE, GASOLINE, DIESEL FUEL
HazMat FedEx Ground 8000 COLE PKWY Shawnee DIESEL FUEL
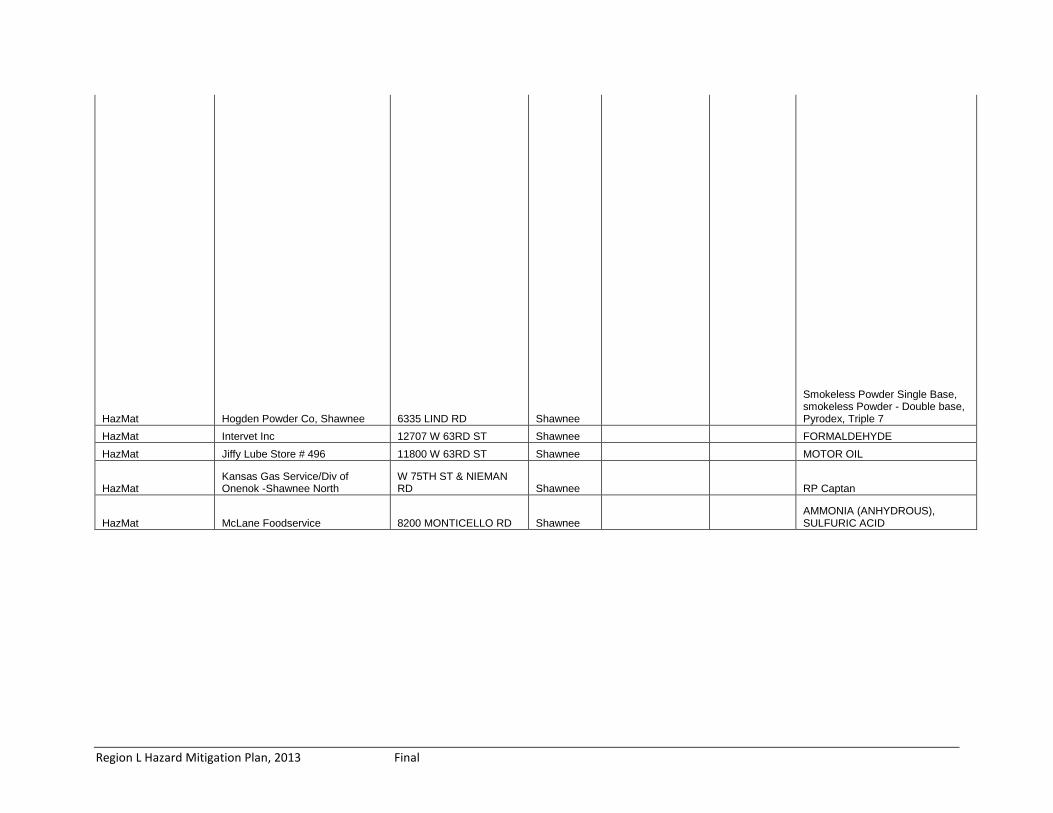
Region L Hazard Mitigation Plan, 2013 Final
HazMat Hogden Powder Co, Shawnee 6335 LIND RD Shawnee
Smokeless Powder Single Base, smokeless Powder - Double base, Pyrodex, Triple 7
HazMat Intervet Inc 12707 W 63RD ST Shawnee FORMALDEHYDE HazMat Jiffy Lube Store # 496 11800 W 63RD ST Shawnee MOTOR OIL
HazMat Kansas Gas Service/Div of Onenok -Shawnee North
W 75TH ST & NIEMAN RD Shawnee RP Captan
HazMat McLane Foodservice 8200 MONTICELLO RD Shawnee AMMONIA (ANHYDROUS), SULFURIC ACID

Region L Hazard Mitigation Plan, 2013 Final
HazMat Nazdar - Shawnee 8501 HEDGE LANE TER Shawnee
1200 Series Coroplus Screen Ink, 1600 Series UV Retail Display, 3200 Series UV Decal Screen Ink, 3500 Series Vinex Screen Ink, 3800 Series UV Poly Banner Screen Ink, 3900 Series Flexible Banner Screen Ink, 9600 Series Polyster Screen Ink, Adcote 49T13, GV Series Screen Ink, N3100 Series UV Poly Screen Ink, VF Series Screen Ink, 1700 series UV Versaprint Screen Ink, Coke 9600 Series Polyester Screen Ink, 9700 Series All purpose screen ink, Metro Media 4 Color Process inks, 1,6 hexanediol Diacrylate, tabcure 55P, S2 Series Gloss Vinyl Screen ink, FORMALDEHYDE, ADE Series Epoxy Screen Ink, SR339 MF219
HazMat Shawnee Rock Co, Plant # 2 & 4 - Johnson Co Land 17955 HOLLIDAY DR Shawnee
DIESEL FUEL, Super Heavy Duty Engine Oil, extended life coolant
HazMat Southern Star Central Pipeline (Glavin) 11103 W 75TH ST Shawnee Tert-butytl mercaptan
HazMat Southwestern Bell Mobile Systems 6134 6134 PFLUMM RD Shawnee DIESEL FUEL, SULFURIC ACID
HazMat Ted Manufacturing Corporation 11415 JOHNSON DR Shawnee
Brass Alloys, POTASSIUM CYANIDE, SODIUM CYANIDE, SULFURIC ACID

Region L Hazard Mitigation Plan, 2013 Final
HazMat Truegreen Chemlawn 8420 COLE PKWY Shawnee
Lime Pellitized, Turf Type Tall Fescue, ice melter, fertilizer 25-3-8, fertilizer 22-3-8 w/.23merit 50% scu, fertilizer 25-0-8 crabgrass preventer, fertilizer 27-0-8, fertilizer 27-0-8 Weed & Feed Tripower, merit .2 0-0-7, 19-3-5 w/.20 Barricade, 25-3-8 50% SCU, 17-2-5
HazMat VISTAR/ USA of KC 10600 W 79TH ST Shawnee LEAD COMPOUNDS, SULPHURIC ACID
HazMat Vita Craft Corporation 11100 W 58TH ST Shawnee
Liquid compound SS-5767, Liquid Compound SS-5876, PERCHLOROETHYLENE, Liquid Compound CS-4129
HazMat Wall Ties & Forms 4000 BONNER INDUSTRIAL DR Shawnee
Wire Rods, Hot Rolled Bars, Cold Finished Bars, HYDROCHLORIC ACID, Chrome Plated XCarbon Steel, Carbon & Alloy Steels, Aluminum, Aluminum Extrusions, Wrought Aluminum Alloy, Aluminum Alloy 6000 Series Extrusion
HazMat Xsis Electronics Inc 12620 SHAWNEE MISSION PKW Shawnee
NITROGEN, [REFRIGERATED LIQUID]
Nursing Home Jo Co Church of Christ Adult Day C 7300 Neiman Rd Shawnee
Nursing Home Sharon Lane Nursing Home 10315 Johnson Dr Shawnee
Nursing Home Shawnee Gardens Healthcare/Rehab 6416 Long St Shawnee
Nursing Home Shawnee Heartland 16125 Midland Dr Shawnee Nursing Home The Sweet Life at Rosehill 12802 Johnson Dr Shawnee Nursing Home The Sweet Life at Shawnee 11400 W 65th St Shawnee Police Shawnee Police 6535 Quivira Rd Shawnee
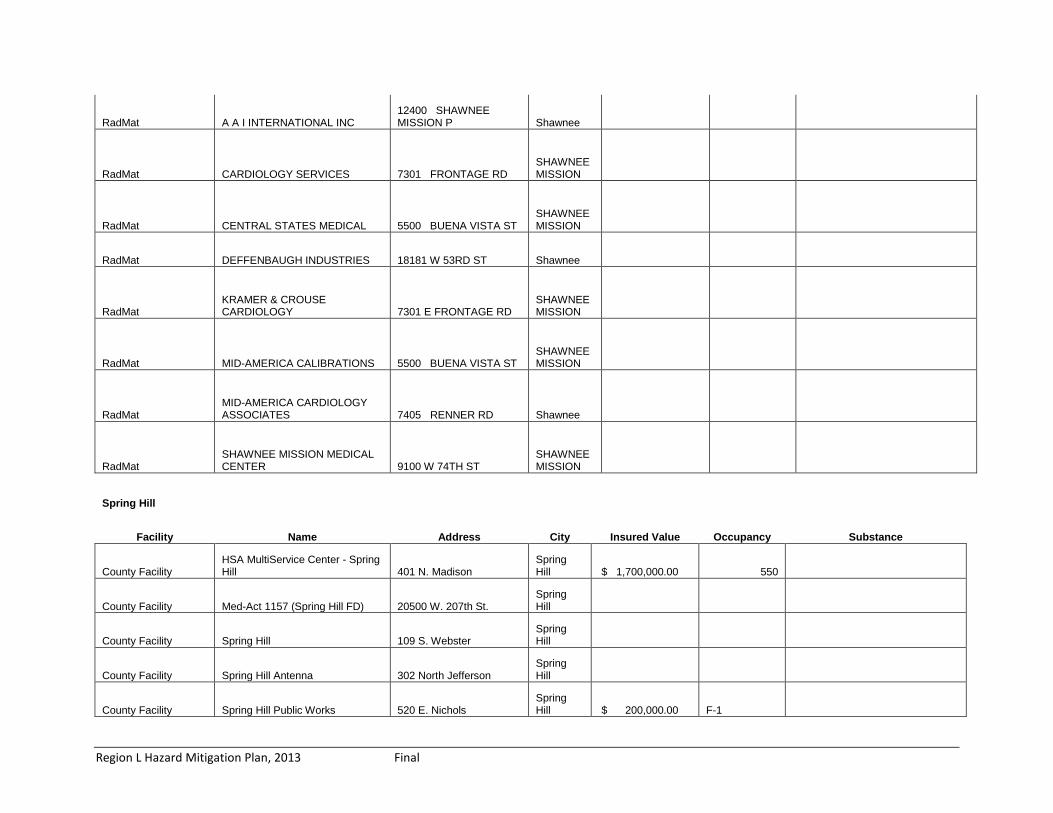
Region L Hazard Mitigation Plan, 2013 Final
RadMat A A I INTERNATIONAL INC 12400 SHAWNEE MISSION P Shawnee
RadMat CARDIOLOGY SERVICES 7301 FRONTAGE RD SHAWNEE MISSION
RadMat CENTRAL STATES MEDICAL 5500 BUENA VISTA ST SHAWNEE MISSION
RadMat DEFFENBAUGH INDUSTRIES 18181 W 53RD ST Shawnee
RadMat KRAMER & CROUSE CARDIOLOGY 7301 E FRONTAGE RD
SHAWNEE MISSION
RadMat MID-AMERICA CALIBRATIONS 5500 BUENA VISTA ST SHAWNEE MISSION
RadMat MID-AMERICA CARDIOLOGY ASSOCIATES 7405 RENNER RD Shawnee
RadMat SHAWNEE MISSION MEDICAL CENTER 9100 W 74TH ST
SHAWNEE MISSION
Spring Hill
Facility Name Address City Insured Value Occupancy Substance
County Facility HSA MultiService Center - Spring Hill 401 N. Madison
Spring Hill $ 1,700,000.00 550
County Facility Med-Act 1157 (Spring Hill FD) 20500 W. 207th St. Spring Hill
County Facility Spring Hill 109 S. Webster Spring Hill
County Facility Spring Hill Antenna 302 North Jefferson Spring Hill
County Facility Spring Hill Public Works 520 E. Nichols Spring Hill $ 200,000.00 F-1

Region L Hazard Mitigation Plan, 2013 Final
County Facility Spring Hill Wastewater Plant 22711 Woodland Spring Hill $ 3,500,000.00 F-2
County Facility Spring Hill Community Center 613 S. Race St. Spring Hill $ 232,000.00 A-2 OL=125
County Facility Spring Hill Storage 520 E. Nichols Spring Hill
Daycare Day Brook Learning Center 22498 Harrison St. Spring Hill $ 550,000.00 I-4
Daycare Kidz, Inc. 110 E. Wilson St. Spring Hill $ 510,000.00 I-4
Fire Station Dist 2, Stn 4 20500 W 207TH ST Spring Hill $ 1,200,000.00
Government Office Spring Hill City Hall 401 N Madison St, Spring Hill $ 50,000.00 10
Government Office Post Office 418 E. Nichols Spring Hill $ 77,320.00 B
HazMat A & M Products Mfg Co 705 N LINCOLN ST Spring Hill
ACTIVATED CHARCOAL, SULFURIC ACID, Borax Pentahydrate, Cedar Wood Chips, Granular Bentonite, Instatn-Loc Hot Melt Adhesive, Silica Gel, Versa Melt 32-2240 Hot Melt Adhesive, LEAD, Dry Fragrance, Zeolite

Region L Hazard Mitigation Plan, 2013 Final
HazMat AFG Industries, Inc. - Spring Hill 20400 WEBSTER ST Spring Hill
CAUSTIC SODA, DIESEL FUEL, ETHYLENE, HYDROGEN, Limestone, NITROGEN, (CRYOGENIC LIQUID), Silica Sand, Soda Ash, SODIUM SULFITE, SULFURIC ACID, Tin, Carb-O-Site, dolomite, ICD-1022, ICD-1119, OXYGEN,(CRYOGENIC LIQUID), ROUGE (IRON OXIDE), SILANE, SULFUR DIOXIDE
HazMat Farmers Union Coop 110 S FRANK ST Spring Hill AMMONIA (ANHYDROUS)
HazMat Praxair Inc 20400 WEBSTER ST Spring Hill NITROGEN
HazMat Spring Hill Oil Co. Inc. 207 S FRANK ST Spring Hill PROPANE
HazMat Sprint Communications Company L.P. - Spring Hill 416 E NICHOLS ST
Spring Hill SULFURIC ACID
Nursing Home Beverly Health Care & Rehab 251 E Wilson St Spring Hill $ 1,400,000.00 47 beds
Nursing Home Spring Hill Senior Government Assisted Housing 116 E. Lawrence
Spring Hill $ 407,000.00 R-2 24 units
Nursing Home Low-income Government Assisted Housing 158 E. Lawrence
Spring Hill $ 602,900.00 R-2 36 units
Nursing Home Golden Living Center 251 E. Wilson St. Spring Hill $ 1,400,000.00 I-2 47 beds
Nursing Home Cozy Haven Senior Housing 210 S. Washington St. Spring Hill $ 400,000.00 I-1 12 units
Nursing Home Assisted Life Styles-Nursing/Convalescent 22550 S. Franklin St.
Spring Hill $ 1,600,000.00 I-1 12 units
Police Spring Hill Police 302 N Jefferson Spring Hill leased 54

Region L Hazard Mitigation Plan, 2013 Final
Police Westwood Police 4700 Rainbow Rd Spring Hill
Spring Hill Civic Center 401 N. Madison 302 N. Jefferson
Spring Hill $ 1,700,000.00
B/A-3 OL=gym 480
Westwood
Facility Name Address City Insured Value Occupancy Substance Government Office Mission Woods City Hall 4700 Rainbow Blvd Westwood Government Office Westwood City Hall 4700 Rainbow Blvd Westwood
HazMat Sprint Communications Company L.P. - Westwood Co
2330 SHAWNEE MISSION PKWY Westwood
SULFURIC ACID, DIESEL FUEL, LEAD COMPOUNDS
Name Address City Insured Value Occupancy Substance
Westwood Hills City Hall 5008 State Line Rd Westwood Hills
The following figure shows the Johnson County Land Use Map:

Region L Hazard Mitigation Plan, 2013 Final
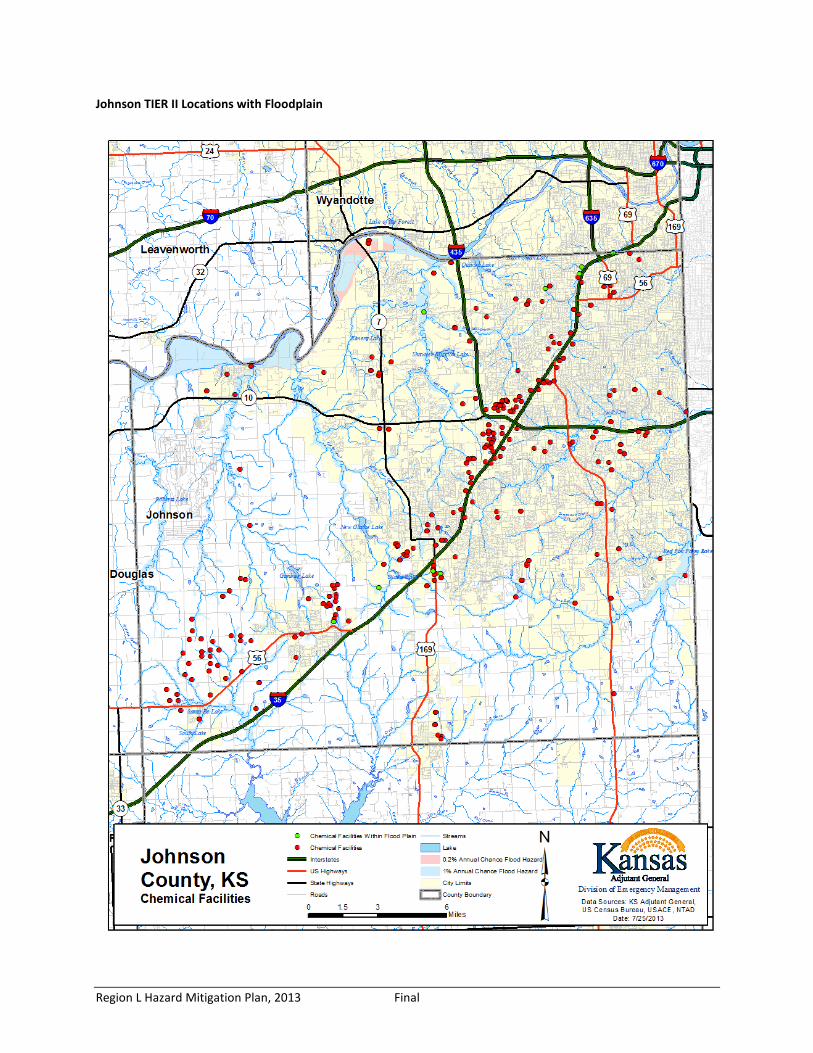
Region L Hazard Mitigation Plan, 2013 Final
Johnson TIER II Locations with Floodplain
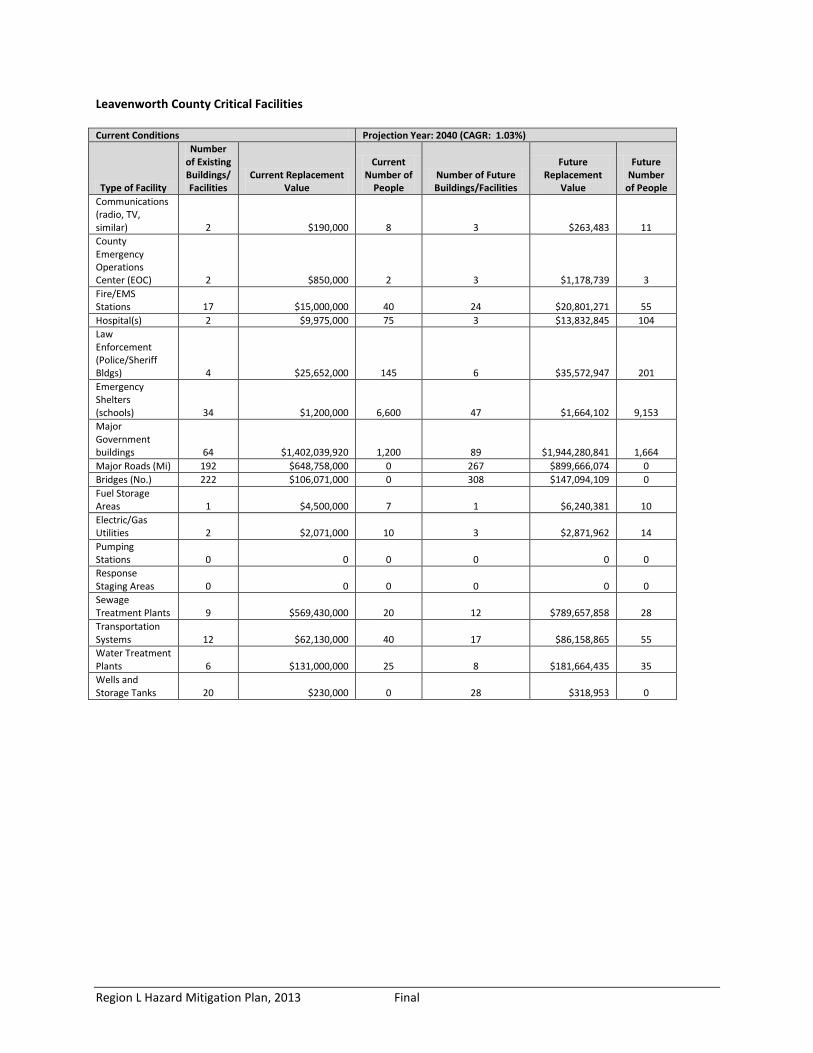
Region L Hazard Mitigation Plan, 2013 Final
Leavenworth County Critical Facilities Current Conditions Projection Year: 2040 (CAGR: 1.03%)
Type of Facility
Number of Existing Buildings/Facilities
Current Replacement Value
Current Number of
People Number of Future Buildings/Facilities
Future Replacement
Value
Future Number
of People Communications (radio, TV, similar) 2 $190,000 8 3 $263,483 11 County Emergency Operations Center (EOC) 2 $850,000 2 3 $1,178,739 3 Fire/EMS Stations 17 $15,000,000 40 24 $20,801,271 55 Hospital(s) 2 $9,975,000 75 3 $13,832,845 104 Law Enforcement (Police/Sheriff Bldgs) 4 $25,652,000 145 6 $35,572,947 201 Emergency Shelters (schools) 34 $1,200,000 6,600 47 $1,664,102 9,153 Major Government buildings 64 $1,402,039,920 1,200 89 $1,944,280,841 1,664 Major Roads (Mi) 192 $648,758,000 0 267 $899,666,074 0 Bridges (No.) 222 $106,071,000 0 308 $147,094,109 0 Fuel Storage Areas 1 $4,500,000 7 1 $6,240,381 10 Electric/Gas Utilities 2 $2,071,000 10 3 $2,871,962 14 Pumping Stations 0 0 0 0 0 0 Response Staging Areas 0 0 0 0 0 0 Sewage Treatment Plants 9 $569,430,000 20 12 $789,657,858 28 Transportation Systems 12 $62,130,000 40 17 $86,158,865 55 Water Treatment Plants 6 $131,000,000 25 8 $181,664,435 35 Wells and Storage Tanks 20 $230,000 0 28 $318,953 0

Region L Hazard Mitigation Plan, 2013 Final
Leavenworth County Tier II Locations

Region L Hazard Mitigation Plan, 2013 Final
Leavenworth County TIerII in relation to Floodplain
Leavenworth Utilities and Transportation

Region L Hazard Mitigation Plan, 2013 Final
Leavenworth-Jefferson Electric COOP and Westar Energy Corp. provide electricity to the county. Figure 2.17 shows the electric map for Leavenworth County.
Leavenworth County: Kansas Gas Service, Southern Star, and Atmos provide natural gas

Region L Hazard Mitigation Plan, 2013 Final
Leavenworth County Transportation Map

Region L Hazard Mitigation Plan, 2013 Final
Leavenworth County Critical Facilities

Region L Hazard Mitigation Plan, 2013 Final

Region L Hazard Mitigation Plan, 2013 Final
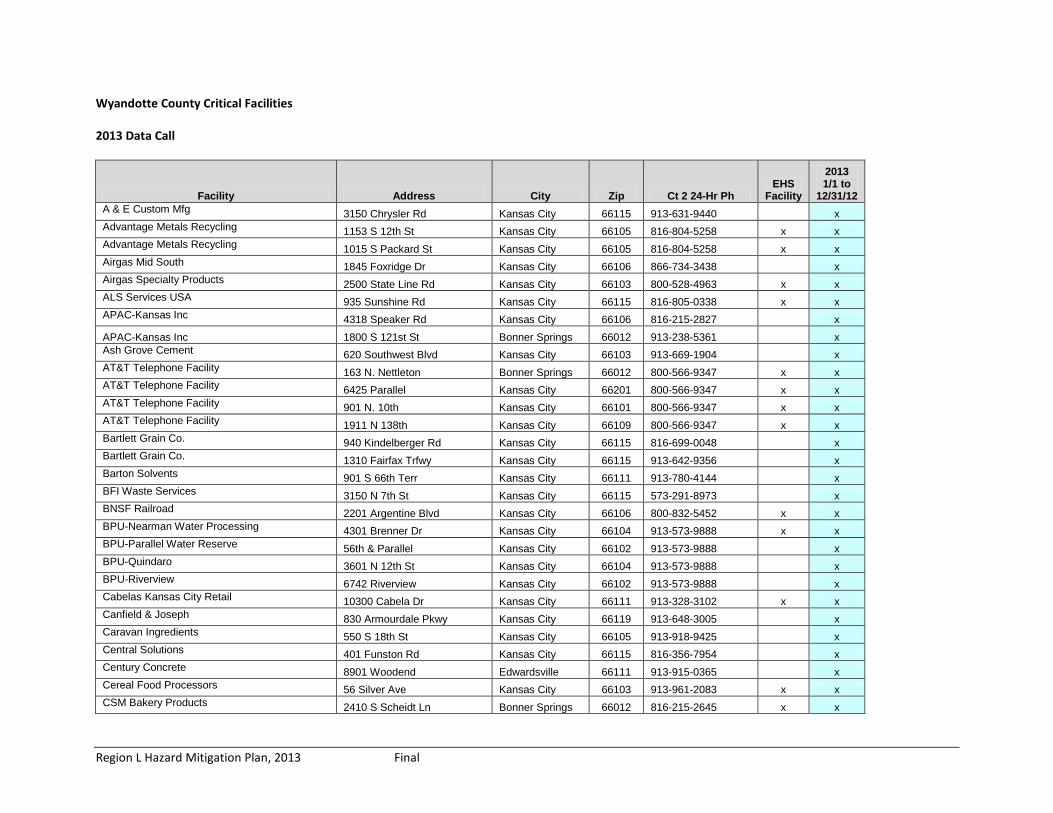
Region L Hazard Mitigation Plan, 2013 Final
Wyandotte County Critical Facilities 2013 Data Call
Facility Address City Zip Ct 2 24-Hr Ph EHS
Facility
2013 1/1 to
12/31/12 A & E Custom Mfg 3150 Chrysler Rd Kansas City 66115 913-631-9440 x Advantage Metals Recycling 1153 S 12th St Kansas City 66105 816-804-5258 x x Advantage Metals Recycling 1015 S Packard St Kansas City 66105 816-804-5258 x x Airgas Mid South 1845 Foxridge Dr Kansas City 66106 866-734-3438 x Airgas Specialty Products 2500 State Line Rd Kansas City 66103 800-528-4963 x x ALS Services USA 935 Sunshine Rd Kansas City 66115 816-805-0338 x x APAC-Kansas Inc 4318 Speaker Rd Kansas City 66106 816-215-2827 x APAC-Kansas Inc 1800 S 121st St Bonner Springs 66012 913-238-5361 x Ash Grove Cement 620 Southwest Blvd Kansas City 66103 913-669-1904 x AT&T Telephone Facility 163 N. Nettleton Bonner Springs 66012 800-566-9347 x x AT&T Telephone Facility 6425 Parallel Kansas City 66201 800-566-9347 x x AT&T Telephone Facility 901 N. 10th Kansas City 66101 800-566-9347 x x AT&T Telephone Facility 1911 N 138th Kansas City 66109 800-566-9347 x x Bartlett Grain Co. 940 Kindelberger Rd Kansas City 66115 816-699-0048 x Bartlett Grain Co. 1310 Fairfax Trfwy Kansas City 66115 913-642-9356 x Barton Solvents 901 S 66th Terr Kansas City 66111 913-780-4144 x BFI Waste Services 3150 N 7th St Kansas City 66115 573-291-8973 x BNSF Railroad 2201 Argentine Blvd Kansas City 66106 800-832-5452 x x BPU-Nearman Water Processing 4301 Brenner Dr Kansas City 66104 913-573-9888 x x BPU-Parallel Water Reserve 56th & Parallel Kansas City 66102 913-573-9888 x BPU-Quindaro 3601 N 12th St Kansas City 66104 913-573-9888 x BPU-Riverview 6742 Riverview Kansas City 66102 913-573-9888 x Cabelas Kansas City Retail 10300 Cabela Dr Kansas City 66111 913-328-3102 x x Canfield & Joseph 830 Armourdale Pkwy Kansas City 66119 913-648-3005 x Caravan Ingredients 550 S 18th St Kansas City 66105 913-918-9425 x Central Solutions 401 Funston Rd Kansas City 66115 816-356-7954 x Century Concrete 8901 Woodend Edwardsville 66111 913-915-0365 x Cereal Food Processors 56 Silver Ave Kansas City 66103 913-961-2083 x x CSM Bakery Products 2410 S Scheidt Ln Bonner Springs 66012 816-215-2645 x x

Region L Hazard Mitigation Plan, 2013 Final
Darling International 685 Adams St Kansas City 66105 913-321-9328 x Dayton Superior Specialty 636 S 66th Terr Kansas City 66111 913-403-6866 x x Deffenbaugh HQ & Fleet Maint 2601 Mid-West Dr Kansas City 66111 913-223-8716 x Deffenbaugh Materials Recycling Facility 8905 Kaw Dr Kansas City 66111 913-208-9464 x Estes Express Lines 4601 Speaker Rd Kansas City 66106 800-395-9143 x Exide Technologies 3001 Fairfax Trfwy Kansas City 66115 913-206-5101 x Exide Technologies 501 Kindelberger Rd Kansas City 66115 913-206-5101 x x Exxon Mobil Oil Corp 966 Sunshine Rd Kansas City 66115 913-207-0819 x Fahey, J.M. Construction 7014 Holliday Dr Kansas City 66106 913-422-5011 x Fairfax Town Border 3370 Harvester Rd Kansas City 66115 913-599-8998 x FedEx Freight 9140 Woodend Rd Edwardsville 66111 x Forbo Adhesives 3150 Fiberglass Rd Kansas City 66115 913-321-1576 x x Fordyce Concrete 211 Central Ave Kansas City 66101 913-207-3803 x Frito-Lay Kansas City Mega DC 2040 S 45th St Kansas City 66106 913-206-7801 x x Fuchs Lubricants - Century Lubricants 2140 S 88th St Kansas City 66111 913-220-4716 x Garsite LLC 539 S 10th St Kansas City 66105 913-549-2610 x Gatx Corporation 6600 Thorn Dr Kansas City 66106 979-324-8070 x General Motors 3201 Fairfax Trfwy Kansas City 66115 913-573-7234 x x General Motors Yard 200 East Marley Rd Kansas City 66115 816-728-2731 x Glen-Gery Corp 336 S 42nd St Kansas City 66106 816-529-2992 x Graham Packaging Company 2077 Bayard Ave Kansas City 66105 x x Harcross Chemicals 5200 Speaker Rd Kansas City 66106 913-208-5133 x x Heathwood Oil Inc. 2011 N 10th St Kansas City 66104 913-294-2925 x Herff Jones, Inc. 2525 Midpoint Dr Edwardsville 66113 913-461-5960 x x Hillshire Brands Co. 4612 Speaker Rd Kansas City 66106 816-284-9960 x x Holland, Inc. 9711 State Ave Kansas City 66111 913-406-7355 x International Food Products 6721 Griffin Rd Kansas City 66111 913-441-3835 x International Paper 2101 Kansas Ave Kansas City 66105 913-544-3796 x x INX International 2647 S 96th St Edwardsville 66111 913-645-0540 x Jiffy Lube #2218 4214 Rainbow Blvd Kansas City 66103 816-721-1351 x Jiffy Lube #491 1010 N 78th St Kansas City 66112 816-695-2013 x Johnson County Water Dist #1 4340 N 60th St Kansas City 66104 913-895-5801 x x Johnson County Water Dist #1 7601 Holliday Dr Kansas City 66106 913-895-5801 x x Johnson County Water Dist #1 8715 Holliday Drive Kansas City 66106 913-895-5801 x x Johnson County Water Dist #1 10900 Sam Clark Ln Kansas City 66109 913-895-5801 x

Region L Hazard Mitigation Plan, 2013 Final
Kansas City Abrasives 3140 Dodge Rd Kansas City 66115 913-839-3166 x Kansas City Steak Co 100 Osage Ave Kansas City 66105 913-269-8795 x x Keebler Company 801 Sunshine Rd Kansas City 66115 816-208-3161 x x Keller Fire & Safety 1138 Kansas Ave Kansas City 66105 913-371-8494 x Talon Concrete 317 S 3rd Kansas City 66117 816-214-2993 x Liquid Environmental Solutions 3349 Harvester Rd Kansas City 66115 913-233-0045 x x Lowes of Kansas City 6920 State Ave Kansas City 66102 888-429-6281 x Magellan - Argentine Station 3401 Fairbanks Kansas City 66106 800-720-2417 x Magellan Kansas City Terminal 401 E Donovan Rd Kansas City 66115 800-720-2417 x Magellan Reclamation Facility 1090 C Sunshine Rd Kansas City 66115 800-720-2417 x McCulley Oil 1925 N 9th St Kansas City 66101 816-590-0347 x MCI 313 E Donovan Rd Kansas City 66115 800-386-9639 x x Mid-West Terminal #2 Woodswether Rd Kansas City 66118 816-471-2335 x Millard Refrigerated Services 2350 S 98th St Edwardsville 66111 913-416-2086 x x NAPA Distribution 250 Osage Ave Kansas City 66105 913-397-6990 x x Nexeo Solutions - Speaker Rd 5420 Speaker Rd Kansas City 66106 855-639-3648 x x Nexeo Solutions - Swartz Rd 5022 Swartz Rd Kansas City 66106 855-639-3648 x x Orion Fittings 2850 Fairfax Trfwy Kansas City 66115 816-206-3707 x Owens Corning 300 Sunshine Rd Kansas City 66115 864-216-1921 x x Parker Oil Company, Inc. 6601 Kansas Ave Kansas City 66111 913-671-9320 x PBI Gordon 300 S 3rd St Kansas City 66118 816-421-4070 x Phillips 66 209 Fairfax Trafficway Kansas City 66115 800-231-2566 x Plastic Packaging Technologies 750 S 65th St 66111 913-205-5280 x PQ Corporation 1700 Kansas Ave Kansas City 66105 610-235-9096 x x Procter & Gamble 1900 Kansas Ave Kansas City 66105 913-671-0841 x x Providence Medical Center 8929 Parllel Pkwy Kansas City 66112 913-596-4000 x x Quickrete Company 2430 S 88th St Kansas City 66111 816-415-2071 x RockTenn CP LLC 510 Division St Kansas City 66103 913-915-2306 x Sams Club 4870 10510 Parallel Pkwy Kansas City 66109 479-204-3911 x x Sinclair Oil - KC Pipeline 3401 Fairbanks Kansas City 66106 x Stericycle, Inc. 3140 N. 7th St Trfwy Kansas City 66115 913-375-4123 x x Swift Transportation 9000 Woodend Rd Edwardsville 66111 x x Kincaid Ready Mix 5620 Wolcott Dr Kansas City 66109 913-908-2889 x Union Pacific Railroad 18th & I-70 Kansas City 66105 888-877-7267 x Universal Lubricants 601 S 66th Terr Kansas City 66111 913-226-6249 x

Region L Hazard Mitigation Plan, 2013 Final
US Postal Service 4900 Speaker Rd Kansas City 66106 913-219-6705 x x Verizon Wireless 605 North 110th St Kansas City 66111 908-559-7260 x x
Chemical Manufacturing Facilities Name Address Chemical City State Zip Tier Latitude Longitude Comments PQ Corporation Kansas City Site (Zeolyst)
1700 Kansas Ave, Piperidine
Kansas City KS 66105 3 Harcros Chemicals Inc - Kansas City
5200 Speaker Rd Ethylene oxide
Kansas City KS 66106 3 The Procter & Gamble Manufacturing Company
1900 Kansas Ave Bromine
Kansas City KS 66105 4 LaRoche Industries Inc. 2500 State Line Rd Ammonia (anhydrous) Kansas City KS 66103 4 Quindaro Water Treatment Plant- BPU
3601 N 12th Street Chlorine
Kansas City KS 66104 4 Reichhold, Inc. Vinyl acetate monomer
[Acetic acid ethenyl ester]
Kansas City KS 66115 4 Millard Refrigerated Services 2350 S 98th Street Ammonia (anhydrous) Edwardsville KS 66111 4 Kansas City Product Supply Center
Ammonia (anhydrous)
Kansas City KS 66106 4 Ashland Distribution Company 5420 Speaker Road Aroset ps 6204
Kansas City KS 66106 39.095866 -94.704698 EHS AWG INC 5000 Kansas Ave Ammonia Kansas City KS 66106 39.091221 -94.689720 EHS Barton Solvents 901 S 66th Terrace Dichloromethane Kansas City KS 66111 39.081476 -94.731470 EHS BNSF Railway Company 2201 Argentine Blvd. Polypropylene
Kansas City KS 66106 39.078567 -94.654458 EHS Nearman Water Treatment Plant-BPU
4301 Brenner Drive Chlorine
Kansas City KS 66104 39.170924 -94.693310 EHS Conagra Foods 4612 Speaker Road Anhydrus Ammonia
Kansas City KS 66106 39.097014 -94683554 EHS Dayton Superior Corporation 1100 Blake Formaldehyde Edwardsville KS 66113 39.055685 -94.812689 EHS Exide Technologies 3001 Fairfax
Trafficway Sulphuric Acid, Sodium Hydroxide
Kansas City KS 66115 39.140247 -94.610435 EHS

Region L Hazard Mitigation Plan, 2013 Final
Forbo Adhesives 3150 Fiberglass Road
Vinal Acetate
Kansas City KS 66115 39.617434 -94.617434 EHS GM Fairfax Plant 3201 Fairfax
Trafficway Hydrochloric Acid
Kansas City KS 66115 39.603630 -94.603630 EHS Griffin Wheel Company 7111 Griffin Road Phenol Kansas City KS 66111 39.080864 -94.742250 EHS Johnson County Water District #1 Hansen Water Treatment Plant
7601 Holliday Drive Chlorine
Kansas City KS 66106 39.054029 -94.757112 EHS Johnson County Water District #1 -Kansas River Supply Facility
4340 N 60th Street Chlorine
Kansas City KS 66104 39.165407 -94.718852 EHS Legacy Technologies Inc. 1851 Merriam Lane Ammonia Kansas City KS 66106 39.049057 -94.651012 EHS Midwest Cold Storage 1101 S 6th Street Anhydrus Ammonia Kansas City KS 66105 39.080055 -94.619249 EHS Nordic Food Co. Inc. 4747 Speaker Road Ammonia
Kansas City KS 66106 39.094369 -94.696433 EHS Owens Corning 300 Sunshine Blvd Phenol Kansas City KS 66115 39.148614 -94.614303 EHS PBI/GORDON 300 S 3rd Street Dimethyl-2.2 -
Dichlorovinalphosphate Kansas City KS 66118 39.099463 -94.615642 EHS
GS Robbins and Company 2955 Chrysler Road Chlorine
Kansas City KS 66115 39.138834 -94.610600 EHS City Road Bridges Facility Carried
Intersecting Feature Location
Avg Daily Traffic
Service On Structure
Service Under Structure Latitude Longitude
Comments
I35 HWY MISSION BLVD I35 and Mission Blvd 1000000 Highway Roadway, Waterway
39.063058
-94.625512
I35 HWY 7th Street I35 and 7th Street 1000000 Highway Roadway 39.07117
2 -
94.619529 Colleges & Universities Name Address City State Zip Sector Latitude Longitude Comments Cutting Edge Hairstyling Academy 4327 State Ave Kansas City KS 66102 Private for-profit, less-than-2-year 39.116785 -94.608532 Central Baptist Theological Seminary 741 N 31st St Kansas City KS 66102-3964 Private nonprofit, 4-year or above 39.113399 -94.664021 Donnelly College 608 N 18th St Kansas City KS 66102 Private nonprofit, 2-year 39.111961 -94.649235 Kansas City Area Technical School 2220 N. 59th St. Kansas City KS 66104 39.130493 -94.715206 Kansas City Kansas Community College 7250 State Ave Kansas City KS 66112 Public, 2-year 39.116603 -94.746726

Region L Hazard Mitigation Plan, 2013 Final
University of Kansas Medical Center 3901 Rainbow Blvd Kansas City KS 66160 Public, 4-year or above 39.059104 -94.613034 Commercial Overnight Shipping Name Address City State Zip Location Type Latitude Longitude Comments Fedex Freight East 9140 Woodend Road Edwardsville KS 66111 Freight 39.051091 -94.792996 800-872-7028 UPS Customer Center 223 N. James Street Kansas City KS 66118 UPS Store/Customer Center 39.107763 -94.612504 800-742-5877 Enclosed Shopping Malls Name Address City State Zip Total Stores Latitude Longitude Comments Indian Springs Marketplace 4601 State Ave Kansas City KS 66102 101 39.116628 -94.685356
Hospitals Name Address City State Zip Latitude Longitude Comments Providence Medical Center 8929 Parallel Pkwy Kansas City KS 66112 39.128584 -94.786715
Rainbow Mental Health Facility 2205 W. 36 Ave Kansas City KS 66103 39.061409 -94.610807 University of Kansas Hospital 3901 Rainbow Blvd Kansas City KS 66103 39.057380 -94.611755 Wyandotte Mental Health Ctr 1223 Meadowlark Ln Kansas City KS 66102 39.118563 -94.709787
Levees Name Address City State Zip Latitude Longitude Comments Fairfax Drainage 1620 Fairfax Trfwy Kansas City KS 66115
Fairfax--Upper Jersey Creek
Kaw Valley Drainage 719 Osage Kansas City KS 66105
Argentine Unit - 5.48 mi Kaw Valley Drainage 719 Osage Kansas City KS 66105
Armourdale Unit - 6.45 mi
Kaw Valley Drainage 719 Osage Kansas City KS 66105
Central Industrial Dist. 3.30 mi Kaw Valley Drainage 719 Osage Kansas City KS 66105
Fairfax-Jersey Creek Unit .92 mi
Maritime Port Facilities
Name Port Waterway City State County Location
Latitude
Longitude
Comments
Farmland Industries; Grain Elevator 'X' Dock.
Missouri/Arkansas R.
Missouri River
Kansas City KS
Wyandotte
Right bank, Missouri River, mile 373.3 above Fairfax (U.S. Highways 69-169) Bridge.

Region L Hazard Mitigation Plan, 2013 Final
Williams Energy Services Co., Kansas City Dock.
Missouri/Arkansas R.
Missouri River
Kansas City KS
Wyandotte
Right bank, Missouri River, mile 368.3 approximately 0.8 above mouth of Kansas River.
Kansas City-Wyandotte County Joint Port Authority Wharf.
Missouri/Arkansas R.
Missouri River
Kansas City KS
Wyandotte
Right bank, Missouri River, mile 367.6 above mouth of Kansas River.
Petroleum Storage Tank Farms Address City State County Storage Capacity (Barrels) Latitude Longitude Comments 2029 Fairfax Trfwy Kansas City KS Wyandotte 1310000 39.123824 -94.610888
313 E Donovan Rd Kansas City KS Wyandotte 1290000 39.135685 -94.607886 Magellan Kansas City Terminal 3401 Fairbanks Ave Kansas City KS Wyandotte 397469 39.087881 -94.668101
Portable Water Treatment Address City State County Population Served Latitude Longitude Comments 4301 Brenner Road Kansas City KS Wyandotte 215500 39.164345 -94.707759 66104 12301 Kaw Drive Bonner Springs KS Wyandotte 10,000 39.062034 -94.86863 Approx. 3,000 metered customer
plus contract sales
7601 Holliday Drive Kansas City KS Wyandotte 350000 39.054029 -94.757112
Primary & Secondary Schools Name Address City State Zip Latitude Longitude Comments All Saints Elementary School 809 Vermont Kansas City KS 66101 39.097704 -94.630434
Argentine Middle School 2123 Ruby Ave. Kansas City KS 66106 39.07072 -94.65331 Arrowhead Middle School 1715 N. 82nd St. Kansas City KS 66112 39.124385 -94.769638 Banneker Elementary School 2026 N. 4th St. Kansas City KS 66101 39.128690 -94.619234 Bethel Elementary School 7850 Yecker Kansas City KS 66109 39.137876 -94.758329 Bishop Ward High School 701 N. 18th St. Kansas City KS 66102 39.112604 -94.649235 Bonner Springs Elementary School 212 South Neconi Bonner Springs KS 66012 39.056295 -94.886542 Bonner Springs High School 100 North McDanield Bonner Springs KS 66012 39.058531 -94.893330 Caruthers Elementary School 1100 Waverly Kansas City KS 66104 39.132003 -94.638535 Cathedral of St. Peter Elementary
School 422 N. 14th St. Kansas City KS 66102 39.063555 -94.384153 Central Baptist Seminary 741 N. 31st St. Kansas City KS 66102 39.133456 -94.664109

Region L Hazard Mitigation Plan, 2013 Final
Central Elementary School 813 Barnett Kansas City KS 66102 39.11243 -94.63045 Central Middle School 925 Ivandale Kansas City KS 66101 39.096104 -94.633514 Christ the King Elementary School 3027 N. 54th St. Kansas City KS 66104 39.141862 -94.703736 Clark Middle School 420 North Bluegrass Bonner Springs KS 66012 39.061732 -94.894755 Claude Huyck Elementary School 1530 N. 83rd. St. Kansas City KS 66112 39.121347 -94.771927 Coronado Middle School 1735 N. 64th Terr. Kansas City KS 66102 39.124803 -94.728337 Donnelly College 608 N. 18th St. Kansas City KS 66102 39.119610 -94.649235 Douglass Elementary School 1310 N. 9th St. Kansas City KS 66101 39.118686 -94.632734 Edwardsville Elementary School 1700 South 104th Street Edwardsville KS 66111 39.067462 -94.820979 Eisenhower Middle School 2901 N. 72nd. St. Kansas City KS 66109 39.139103 -94.745238 Emerson Elementary School 1429 S. 29th St. Kansas City KS 66106 39.07449 -94.66254 Endeavor Alternative 2540 Junction Rd. Kansas City KS 66106 39.05626 -94.66881 Eugene Ware Elementary School 4820 Oakland Kansas City KS 66102 39.12141 -94.68897 Evening High School 2214 N. 59th St. Kansas City KS 66104 39.130384 -94.715208 Fairfax Campus 3016 N 9th Kansas City KS 66101 39.139413 -94.632849 Fairfax Learning Center 4601 State Kansas City KS 66101 39.11300 -94.68362 Frances Willard Elementary School 3400 Orville Kansas City KS 66102 39.10969 -94.66817 Frank Rushton Elementary School 2605 W. 43rd Ave. Kansas City KS 66103 39.05014 -94.61611 Grant Elementary School 1510 N. 4th St. Kansas City KS 66101 39.120057 -94.618940 Harmon High School 2400 Steele Rd. Kansas City KS 66106 39.06305 -94.65663 Hazel Grove Elementary School 2401 N. 67th St. Kansas City KS 66104 39.132783 -94.733793 Holy Name Elementary School 1007 Southwest Blvd. Kansas City KS 66103 39.061354 -94.620721 John F. Kennedy Elementary School 2600 N. 72nd St. Kansas City KS 66109 39.134760 -94.745556 John Fiske Elementary School 625 S. Valley Kansas City KS 66105 39.08644 -94.64184 Junction Elementary School 2570 S. 42nd St. Kansas City KS 66106 39.05529 -94.67715 Kansas City Kansas Community
College 7250 State Ave. Kansas City KS 66112 39.116662 -94.746970 Kansas School for the Visually
Impaired 1100 State Ave. Kansas City KS 66102 39.065998 -94.381786 Lindbergh Elementary School 641 N. 57th St. Kansas City KS 66102 39.11109 -94.70970 Lowell Preschool 1030 Orville Kansas City KS 66102 39.11024 -94.63643 M.E. Pearson Elementary School 310 N. 11th St. Kansas City KS 66102 39.10768 -94.63842 Mark Twain Elementary School 2300 Minnesota Ave. Kansas City KS 66102 39.11578 -94.65519 McDanield Resource Center 110 South Nettleton Bonner Springs KS 66012 39.057644 -94.884919 McDanield South 402 North Neconi Bonner Springs KS 66012 39.061690 -94.886693 McKinley Elementary School 611 N. 14th St. Kansas City KS 66102 39.11235 -94.64421

Region L Hazard Mitigation Plan, 2013 Final
Midland Trail 3101 South 51st St. Kansas City KS 66106 39.04555 -94.69509 Morris Elementary School 7120 Gibbs Rd. Kansas City KS 66106 39.05899 -94.74533 Morse Early Childhood Center 912 S Baltimore Kansas City KS 66105 39.08200 -94.63651 Muncie Christian School 3650 N. 67th St. Kansas City KS 66109 39.153122 -94.733871 New Chelsea Elementary School 1835 N. 25th Kansas City KS 66104 39.12430 -94.65698 New Stanley Elementary School 3604 Metropolitan Kansas City KS 66106 39.07312 -94.67076 Noble Prentis Elementary School 2337 S. 14th St. Kansas City KS 66103 39.05872 -94.64404 Northwest Middle School 2400 N. 18th St. Kansas City KS 66104 39.132639 -94.650205 Oak Grove Elementary School 5340 Oak Grove Kansas City KS 66106 39.05582 -94.70208 Open Door Christian School 545 S. 94th St. Kansas City KS 66111 39.088456 -94.797652 Our Lady of Unity Elementary School 2646 S. 34th St. Kansas City KS 66106 39.053460 -94.667689 Our Savior Lutheran School 4153 Rainbow Blvd. Kansas City KS 66103 39.030889 -94.364216
Piper Elementary School East 4410 N. 107th St. Kansas City KS 66109-4132 39.165246 -94.826746
Piper Elementary School West 3130 N 122nd St. Kansas City KS
66109-4835 39.144073 -94.861768
Piper High School 4400 N. 107th St. Kansas City KS
66109-4132 39.164986 -94.826772
Piper Middle School 4420 N. 107th St. Kansas City KS
66109-4102 39.16702 -94.83136
Pleasant Green Community School 340 Oakland Kansas City KS 66101 39.071418 -94.370589 Quindaro Elementary School 2800 Farrow Kansas City KS 66104 39.14477 -94.66008 Rosedale Middle School 3600 Springfield Kansas City KS 66103 39.06222 -94.61535 Schlagle High School 2214 N. 59th.St. Kansas City KS 66104 39.131229 -94.715296 Silver City Elementary School 2515 Lawrence Ave. Kansas City KS 66106 39.06755 -94.65823 St. John/Holy Family Elementary
School 420 Barnett Kansas City KS 66101 39.112775 -94.619934 St. Mary's College 608 N. 18th St. Kansas City KS 66102 39.119610 -94.649235 St. Patrick Elementary School 1066 N. 94th St. Kansas City KS 66112 39.114803 -94.797733 Stony Point North Elementary
School 8200 Elizabeth Kansas City KS 66112 39.107756 -94.768722 Stony Point South Elementary
School 150 S. 78th St. Kansas City KS 66111 39.095051 -94.760478 Sumner Academy 1610 N. 8th St. Kansas City KS 66101 39.121050 -94.629411 T.A. Edison Elementary School 1000 Locust Ave. Kansas City KS 66103 39.04803 -94.63526 Turner Elementary School 1800 S. 55th St. Kansas City KS 66106 39.06756 -94.70705 Turner High School 2211 S. 55th St. Kansas City KS 66106 39.060936 -94.705193 Turner Middle School 1800 South 55th St. Kansas City KS 66106 39.067950 -94.705272 V Lindsay Seventh Day Adventist 3301 Garfield Ave. Kansas City KS 66104 39.073410 -94.400141

Region L Hazard Mitigation Plan, 2013 Final
School
W.A. White Elementary School 2600 N. 43rd Terr. Kansas City KS 66104 39.132711 -94.680798 Washington High School 7340 Leavenworth Rd. Kansas City KS 66109 39.143134 -94.749261 Welborn Elementary School 5200 Leavenworth Rd. Kansas City KS 66104 39.142942 -94.700059 West Middle School 2600 44th St. Kansas City KS 66104 39.13376 -94.68212 White Church Elementary School 2226 N. 85th St. Kansas City KS 66109 39.130832 -94.775715 Whittier Elementary School 295 S. 10th St. Kansas City KS 66102 39.09600 -94.63497 Wyandotte High School 2501 Minnesota Av. Kansas City KS 66102 39.115444 -94.656946
Railroad Bridges Facility Carried Intersecting Feature Location
Avg Daily Traffic
Service On Structure Service Under Structure
Latitude
Longitude
Comments
RAILROAD 4TH. & 5TH. STREET 4-5TH. ST. AT JERSEY CK. 10 Railroad
Highway, with or without pedestrian
39.121295
-94.615687
RAILROAD JAMES ST AND I635 Between James St and I635
Railroad Kansas River
39.108811
-94.617759
RAILROAD I 625 I625
Railroad Kansas River 39.101853
-94.615237
RAILROAD OSAGE AND RAILROAD ST OSAGE AND RAILROAD ST
Railroad Kansas River
39.083675
-94.611410
RAILROAD MISSION BLVD AND SOUTHWEST BLVD SOUTHWEST BLVD AND TURKEY CK Railroad Turkey Creek
39.061170
-94.625413
Stadiums Name Address City State Zip Seating Capacity Latitude Longitude Comments Kansas Speedway 400 Speedway Blvd Kansas City KS 66111 125000 39.063313 -94.501012
Telecomm Telephone Hotels CLLI Code City State Zip Exchange Count Latitude Longitude Comments KSCYKS10 KANSAS CITY KS 66101 13
KSCYKSPA KANSAS CITY KS 66102 8

Region L Hazard Mitigation Plan, 2013 Final
Dams – High
City State Zip Location Type Latitude Longitude Comments KANSAS CITY KS
39.146793 -94.794229
GROVES CENTER
39.090304 -94.82687 KANSAS CITY KS
39.068555 -94.713437
GROVES CENTER
39.097554 -94.831591 KANSAS CITY KS
39.110034 -94.780409
BONNER SPRINGS KS
39.075294 -94.892302 EDWARDSVILLE KS
39.066384 -94.840831
BONNER SPRINGS KS
39.095724 -94.843271 KANSAS CITY KS
39.057525 -94.736738
KANSAS CITY KS
39.178503 -94.865191 KANSAS CITY KS
39.108414 -94.81756
KANSAS CITY KS
39.110224 -94.81526 BONNER SPRINGS KS
39.065264 -94.881732

Region L Hazard Mitigation Plan, 2013 Final
Wyandotte Daycare’s

Region L Hazard Mitigation Plan, 2013 Final
Wyandotte Fire Departments
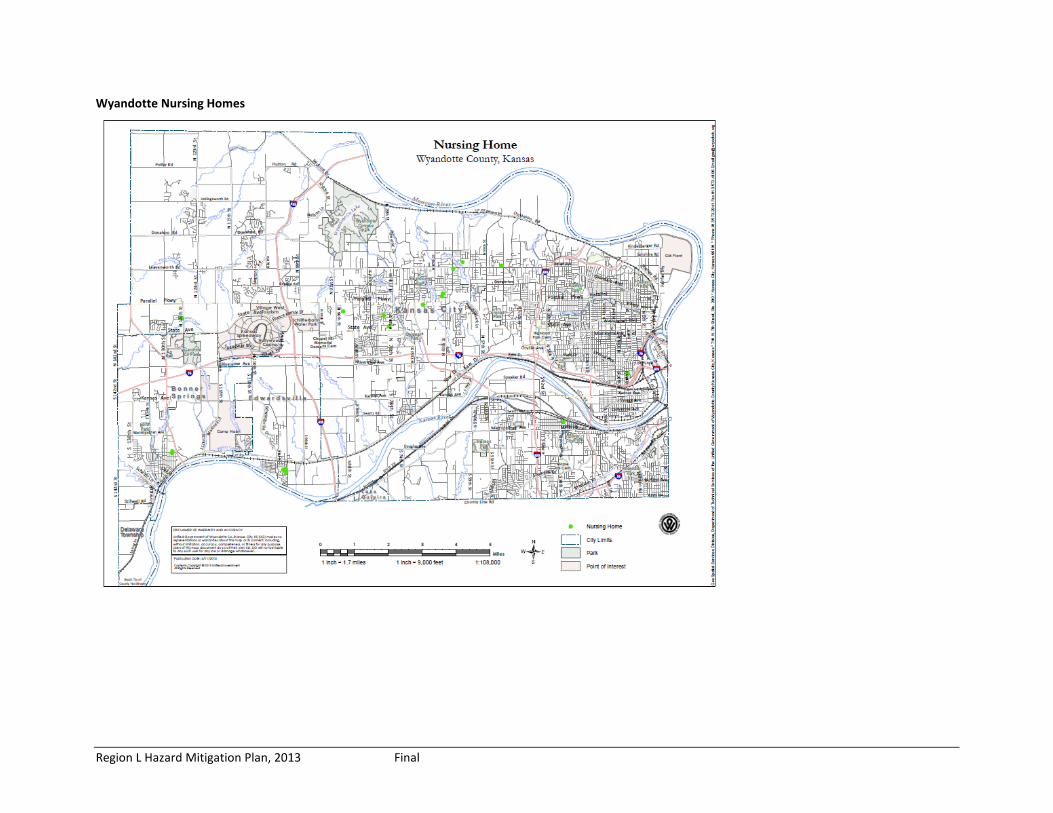
Region L Hazard Mitigation Plan, 2013 Final
Wyandotte Nursing Homes

Region L Hazard Mitigation Plan, 2013 Final
Wyandotte Hospital’s

Region L Hazard Mitigation Plan, 2013 Final
Wyandotte Tier II

Region L Hazard Mitigation Plan, 2013 Final
Wyandotte Tier II with Floodplain Layer

Region L Hazard Mitigation Plan, 2013 Final
Land Use Map, Unified Government, Wyandotte County

Region L Hazard Mitigation Plan, 2013 Final
Appendix D: References and Contacts
• The following individuals were contacted in reference to the Region L Hazard Mitigation Plan. Phone numbers are provided should verification be needed:
• Steve Samuelson – Kansas Department of Agriculture – Contacted on CRS program, NFIP stats and program. 785-296-4622. 25 March 2013 – 16 July 2013.
• Erika Stanley – Kansas Department of Agriculture Division of Water Resources. Contacted on maps, levees and ams. 785-296-2513. 22 April 2013 – 29 April 2013.
• Michael McNulty – Director of Homeland Security Operations bureau of community Health systems Kansas Department of Health and Environment. 785-291-3065. Contacted on Major Disease Outbreak and statistics related to extreme temperature. 20 March 2013 – 12 July 2013.
• Jack Baines – Wyandotte County Deputy Appraiser. 913-573-8400. Contacted for the Wyandotte County Abstract of Values. 10 June 2013 – 13 June 2013.
• Jamie Schwartz – Environmental Scientist, KS Division of Emergency Management. 785-274-1423. Contacted about RMP by county.
• Jennifer Clark – Technological Hazards and Critical Infrastructure Section Chief, KS Division of Emergency Management. 785-274-1394. Contacted for hazardous material spills and incidents. 4 April 2013 – 18 July 2013.
• Kimberly A. Hunninghake, Dam Safety Team Leader, Kansas Department of Agriculture, Division of Water Resources. 785-296-4625. Contacted for Dam and Levee information. 13 March 2013.
• Kent Schierkolk – Response/Restoration Unit Manager, Bureau of Environmental Remediation, KDHE. 785-368-7301. Contacted for information of hazardous material spills and incidents. 8 April 2013 – 9 April 2013.
• Kim Steves – KS Department of Health and Environment Radiation Control Program. 785-296-4359. Contacted for stats on radiological spills, accidents, etc. for the planning area. 25 March 2013 – 5 April 2013.
• Brian T. Rast – Senior Planner and Senior Project Manager silver Jackets Coordinator, Kansas & Missouri, USACE. 816-389-3337. April 2013 – 24 July 2013. Levee’s and Dams information.
• Chad Omitt – National Weather Service, Warning Coordination Meteorologist. 785-232-1493. Contacted in regards to various natural hazard climatology questions. 11 Dec 2012 – on-going.

Region L Hazard Mitigation Plan, 2013 Final
• Kari Valentine, Laurie Bestgren, Susan Belt - AMEC, Mitigation Planner’s. 785-272-6878. Contacted in regards to various data and stats in the State Mitigation Plan that directly affected Region L’s HMP. Time period – on going.
• Rob Ladner, Captain – KDWPT – Region 2 Office. 785-273-6740. Environmental, endangered species, wildfire. 29 January 2013.
• John W. Maddox – Freight and Rail Program Manager, Bureau of Transportation Planning, Kansas Department of Transportation. 785-296-3228. Number of Kansas Regulated Pipeline Mileage. 5 Dec 2012.
• Kim Gant – KS Historical Society. 29 Jan 2013 – 12 June 2013.
• Jeremy Jackson – Director – Kansas Intelligence Fusion Center, 785-274-1805. Contacted in regards to cybersecurity, terrorism. 29 April 2013 – on-going.
• Margaret Fast – Kansas Water Office. 785-296-0865. 1 February 2013. Requested info on drought.
• 2011 Kansas Crop Insurance Profile. Rep. USDA Risk Management Agency, n.d. Web. 5 Mar. 2013. www.rma.usda.gov/pubs/2012/stateprofiles/kansas11.pdf.
• Bureau of Reclamation. Managing Water in the West. Dam Safety Public Protection Guidelines. www.usbr.gov/ssle/damsafety/documents/PPG201108.pdf
• Centers for Disease Control and Prevention (CDC). “Preparing for and Responding to Extreme Heat and Cold Events.” www.cdc.gov/nceh/hsb/disaster/heatandcold.htm.
• Department of Homeland Security. Various. www.FEMA.gov
• EMCAPS. Electronic Mass Casualty Assessment and Planning Scenario’s. www.hopkins-cepar.org/EMCAPS/EMCAPS.html
• Federal Bureau of Investigation (FBI). www.fbi.gov/stats-services/publications/terrorism-2002-2005
• FEMA’s Policy and Claim Statistics for Flood Insurance. www.fema.gov/policy-claim-statistics-flood-insurance/policy-claim-statistics-flood-insurance/policy-claim-13
• Johnson County Multi-Hazard Mitigation Plan, 2009.
• Kansas Adjutant General’s Department
• Kansas Department of Health and Environment Bureau of Surveillance and Epidemiology. www.kdheks.gov/epi/index.html.
• Kansas Department of Agriculture, Division of Water Resources (KDS-DWR). www.ksda.gov/dwr.

Region L Hazard Mitigation Plan, 2013 Final
• Kansas Department of Agriculture. Emerald Ash Borer Information. N.p., n.d. Web. 5 Mar. 2013. www.ksda.gov/plant_protection/content/379.>.
• Kansas Department of Agriculture. High and Significant Hazard Dams.
• Kansas Department of Agriculture, Plant Protection and Weed Control Division, 2011, www.ksda.gov/includes/document_center/plant_protection/Insect_Survey_Reports/InsectReportN1V59.pdf.
• Kansas Department of Corrections. Inmate Populations. www.doc.ks.gov/publications/fiscal-year-2012-offender-population-report/view
• Kansas Department of Health and Environment. www.kdheks.gov/environment/index.html
• United States Department of Transportation, Pipeline & Hazardous Materials Safety Administration. primis.phmsa.dot.gov/comm/reports/safety/KS_detail1.html?nocache=3112#_OuterPanel_tab_6
• Kansas Department of Health and Environment. “Subsurface Void Space
and Sinkhole/Subsidence Area Inventory for the State of Kansas.” 2006.
• Kansas Division of Emergency Management (KDEM). Technological Hazards. Primary Locations of Hazardous Materials Incidents.
• Kansas Geological Survey, Earthquakes in Kansas. www.kgs.ku.edu/Publications/GeoRecord/2001/vol7.3/Page1.html
• Kansas State Hazard Mitigation Plan 2013.
• Kansas Historical Society. National and State Registers. www.kshs.org.
• Kansas State Research and Extension, Climatic Maps of Kansas. http://www.ksre.ksu.edu/wdl/ClimaticMaps.htm
• Kansas State University. “Forrest Action Plan.Revised Web. 2011. www.kansasforests.org/documents/stateagency/Kansas_FRAS.pdf and www.kansasforests.org/assessment.shtml.
• Kansas Water Office. Drought/Climate Report. www.kwo.org/Reports%20&%20Publications/Drought/Tbl_drought_declarations_051107_twl.pd and http://governor.ks.gov/kansasdrought-resources.
• Leavenworth County Multi-jurisdictional Mitigation Plan, Jul 2010.
• Local Mitigation Planning Handbook. Federal Emergency Management Agency. FEMA. Mar. 2013. Print.

Region L Hazard Mitigation Plan, 2013 Final
• National Climatic Data Center. Various. http://www.ncdc.noaa.gov/stormevents/choosedates.jsp?statefips=20%2CKANSAS
• National Oceanic and Atmospheric Administration. Drought. www.drought.gov/drought/.
• National Weather Service (NWS). Heat Index Chart. www.crh.noaa.gov/images/unr/preparedness/heatindex.pdf
• NCAR, Climate and Global Dynamics Division. Palmer Drought Index. www.cgd.ucar.edu/cas/catalog/climind/pdsi.html.
• Pepitone, John. "Community Activist Calls for Stop to HS "Fight Club"" Fox4kccom. N.p., 12 Nov. 2012. Web. 22 Jan. 2013. http://fox4kc.com/2012/11/12/community-activist-calls-for-stop-to-hs-fight-club/.
• Southern Poverty Law Center. 2012. www.splcenter.org/what-we-do/hate-and-extremism
• "'So, You Live Behind a Levee!' New ASCE Guide Helps Communities Tackle Flood Protection, Risk Issues." American Society of Civil Engineers. N.p., n.d. Web. Jan.-Feb. 2013. <http://content.asce.org/ASCELeveeGuide.html>.
• Stanford University’s National Performance of Dams Program. http://ce-npdp-serv2.stanford.edu/DamDirectory/DamIncidentQuery/IncidentForm.jsp
• State of Kansas, K.S.A. 82a-301 et seq. Definitin of a jurisdictional dam. http://damsafety.org/media/Documents/STATE_INFO/LAWS_&_REGS/Kansas_L&R.pdf
• The Annual impact of seasonal influenza in the US: Measuring disease burden and costs, by Molinari et al.
• Tornado Project. www.tornadoproject.com.
• United States Army Corps of Engineer, KC District. http://www.nwk.usace.army.mil/Portals/29/docs/emergencymanagement/leveerehab/2009-LeveeRepairs-Status-MO.pdf
• United States Army Corps of Engineers. National Levee Database.
http://nld.usace.army.mil/egis/f?p=471:1:0::NO
• United States Census Bureau. Various. 2010. www.census.gov.
• USDA. Animal and Plant Health Inspection Service. Map. USDA, n.d. Web. 5 Mar. 2013. www.aphis.usda.gov/plant_health/plant_pest_info/emerald_ash_b/downloads/eab_quarantine_map.pdf .
• USDA, 2007 Census of Agriculture. www.agcensus.usda.gov.
Region L Hazard Mitigation Plan, 2013 Final
• United States Environmental Protection Agency (EPA), RMPs, www.rtknet.org/rmp/ks.php.
• United States Geological Survey, National Atlas of the United States. www.nationalatlas.gov. and Swelling Soils. http://arcvoid.com/surevoid_web/soil_maps/ks.html
• United States Geological Survey. PSHA Model. http://earthquake.usgs.gov/hazards/apps/
• Unites States of Homeland Security/FEMA, GIS Department.
• Vaisala’s National Lightning Detection Network (NLDN). Cloud to Ground Lightning Incidence in the Continental U.S. (1997-2010). http://www.vaisala.com/en/products/thunderstormandlightningdetectionsystems/Pages/NLDN.aspx
• Wyandotte County Multi-jurisdictional Hazard Mitigation Plan. Jul 2010.
Copyright © 2022 FDOKUMEN