SWIBANGLA: Managing salt water intrusion impacts in coastal ...
153
SWIBANGLA: Managing salt water intrusion impacts in coastal groundwater systems of Bangladesh Project consortium Deltares, The Netherlands UNESCO-IHE, The Netherlands Jahangirnagar University, Bangladesh Project sponsors IRC International Water and Sanitation Centre, The Netherlands BRAC, Bangladesh Department of Public Health Engineering (DPHE), Bangladesh Final Report Deltares report number: 1207671-000-BGS-0016 January 2015
-
Upload
khangminh22 -
Category
Documents
-
view
3 -
download
0
Transcript of SWIBANGLA: Managing salt water intrusion impacts in coastal ...
SWIBANGLA: Managing salt water intrusion impacts in coastal groundwater systems of Bangladesh
Project consortium
Deltares, The Netherlands UNESCO-IHE, The Netherlands
Jahangirnagar University, Bangladesh
Project sponsors
IRC International Water and Sanitation Centre, The Netherlands BRAC, Bangladesh
Department of Public Health Engineering (DPHE), Bangladesh
Final Report Deltares report number: 1207671-000-BGS-0016
January 2015

PrefaceThis document is the final report of the project SWIBANGLA - Managing salt waterintrusion impacts in Bangladesh carried out by Deltares, UNESCD-IHE, and theJahangirnagar University under the IRG/BRAG-WASHprogram. The document describesthe project and its objectives, and it contains the performed activities and outputs. Thereport is built as the collection of the deliverables of the project.
The authors of this report are: Marta Faneca Sanchez (Deltares), Khairul Bashar(Jahangirnagar University), Gijs Janssen (Deltares), Gualbert Dude Essink (Deltares),Marjolein Vogels (intern Deltares), Jan Snel (intern Deltares), Yangxiao Zhou (UNESCDIHE) and Roelof Stuurman (Deltares).
G.H.P. Oude Essink.s. van Baaren
Version Date AuthorJan.2015 M. Faneca Sanchez
Citation: Faneca Sanchez, M., Bashar, K., Janssen, G.M.C.M., Vogels, M., Snel, J.,Zhou, Y., Stuurman, R. and Dude Essink, G.H.P., 2015. SWIBANGLA: Managing saltwater intrusion impacts in coastal groundwater systems of Bangladesh, p.153.

Executive Summary Bangladesh is densely populated and it is expected that the population increases significantly in the coming decades (up to 26.6% more by 2050 according to IIASA (2013)1). Demand for drinking water will increase accordingly. These developments may cause significant changes in the hydrological system, e.g. leading to a drop of groundwater tables (Ferguson and Gleeson, 2012; Konikow and Kendy, 2005). Moreover, climate change and sea level rise are predicted by the scenarios drawn by the International Panel of Climate Change (IPCC, 2013), which leads to, among others, an increase of salt water intrusion, in surface water as well as in groundwater (Green et al., 2011; Taylor and Green, 2013; Werner and Simmons, 2009).
This project, SWIBANGLA – Managing salt water intrusion impacts in Bangladesh, is one of the six innovative researches of the BRAC program WASH II. This program contributes to the attainment of the Millennium Development Goals by providing integrated water services, sanitation and hygiene promotion expanding to hard-to-reach areas and to under-served populations, in collaboration with government and other stakeholders.
In this project, the focus is on salt water intrusion in coastal groundwater systems in the south-western coastal area of Bangladesh (see figure below), as groundwater is the main resource of drinking water in this area. The project area is in the north and east bounded by the Ganges and Meghna rivers, in the west by India, and in the south by the Bay of Bengal. It includes twenty one districts, and among others the most important cities in this area Khulna and Barisal.
1 https://secure.iiasa.ac.at/web-apps/ene/SspDb/dsd?Action=htmlpage&page=countries

Figure: Study area.
The project SWIBANLGA has two main general objectives which contribute to achieve the Millennium Development Goals:
1. increasing Water, Sanitation and Hygiene (WASH) sector stakeholders’ awareness of the salinization of drinking water resources and the threats posed by this process, and
2. improving WASH sector stakeholders’ knowledge and skills necessary to anticipate on the salinization of drinking water resources.
The specific objectives leading to the main ones are:
1. Create a better understanding of the process of salinization of drinking water resources in Bangladesh.
2. Provide recommendations for monitoring.
3. Provide recommendations for adaptation to salinization and mitigation of salt water impacts.
Delta (Tidal)
Ganges (Active)
Ganges (Inactive)
91°0'0"E
91°0'0"E
90°30'0"E
90°30'0"E
90°0'0"E
90°0'0"E
89°30'0"E
89°30'0"E
89°0'0"E
89°0'0"E
24°0
'0"N
24°0
'0"N
23°3
0'0"
N
23°3
0'0"
N
23°0
'0"N
23°0
'0"N
22°3
0'0"
N
22°3
0'0"
N
22°0
'0"N
22°0
'0"NÜ
0 10 20 30 405Kilometers
Study Area
Upper Delta Plain
Lower Delta Plain
LegendDelta (Tidal)
Ganges (Active)
Ganges (Inactive)
4. Achieve an effective knowledge transfer between the Netherlands and Bangladesh on how to cope with salinization issues.
5. Advise on the integration of the salinization issue in Water Safety Planning (WSP).
In order to achieve the objectives, the activities of SWIBANGLA were grouped in four main themes:
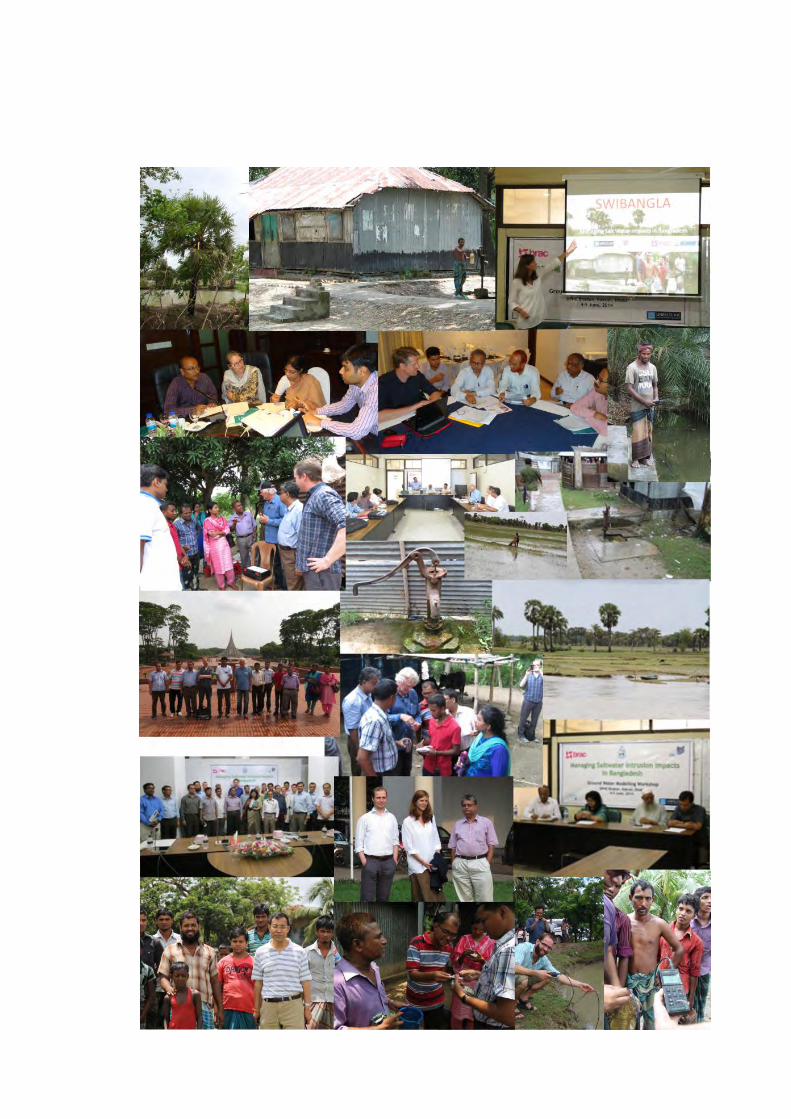
A1 – Fact Finding: during the first months of the project, and through several meetings and literature research, data and information of the groundwater system of Bangladesh, the key stakeholders, the institutional management, and the Water Safety Plans was collected.
A2 – Data Processing - knowledge and insights acquired during the first activity were combined with the expertise of the project partners. A critical review of all existing data regarding monitoring, mitigation techniques and the lessons learned from piloting was carried out. Among other products, we developed a 3D variable-density groundwater flow and salt transport model of the south-western part of Bangladesh (the SWIBANGLA model), we assessed adaptation and mitigation strategies, and we identified the key components that need to be included in the Water Safety Plans.
A3 – Training – Around 15 engineers from different organizations were trained in groundwater numerical modelling and specifically on the SWIBANGLA model, and on monitoring strategies and techniques. We gave two workshops where professionals from different organizations such as Bangladesh Water Development Board (BWDB), Department of Public Health and Engineering (DPHE), BRAC, and Bangladesh Agricultural Development Corporation (BADC) were invited.
A4 – Dissemination - The results and experiences of the project were shared with stakeholders during the project through courses, a close communication with stakeholders, and through a final dissemination workshop in Dhaka.
The main findings of the project are:
The coastal area of Bangladesh is geologically and hydrogeologically complex. The sea regressions and transgressions and the river dynamics of the past thousands of years created an intricate system of sedimentary deposits containing fresh and saline water. The anthropogenic actions through groundwater abstractions are impacting the system, making it even more complex. In addition, the lack of enough reliable geological and hydrogeological data makes a clear and straight forward analysis even more difficult. However, the analysed information gave enough insights to conclude that the upper delta seems to be fresh and stays fresh during the steady dynamic

evolution of the salinity distribution. In the southern part, groundwater is brackish to saline from 10m up to 150m below ground surface. Moreover, defining one clear salinity groundwater front inland is complicated due to the scattered pattern of fresh and saline groundwater in the coastal zone. Pockets of fresh and saline groundwater are found distributed near by the coast.
Different types of salinization processes are currently taking place in Bangladesh. The most important ones being: lateral surface salt water intrusion, lateral saline groundwater intrusion, vertical up-coning under groundwater abstractions and low-lying areas/polders, infiltration of salt due to inundations caused by storm surges.
The awareness of population regarding the existence, relevance and dynamics of these processes is poor. Awareness material such as the leaflets created in SWIBANGLA helps spreading the knowledge on how to monitor this salinization processes and how to mitigate their impacts.
Systematic monitoring of groundwater is of key importance to understand the functioning of the hydrogeological system and the velocity of the salinization processes. This systematic monitoring is currently not taking place in Bangladesh.
Deep groundwater is the most reliable source for drinking water supply, but is likely not renewable and must be used only for drinking water supply. The abstraction must be managed and monitored systematically.
In Lower Delta Plain, strategies for aquifer storage and recovery of fresh water and deep well injection should be implemented to achieve long-term sustainability of safe drinking water supply. The saline environment urges to storage techniques to consider fresh-salt groundwater aspects.
In Upper Delta Plain, conjunctive use of surface and groundwater should be investigated. Feasible technologies include river bank infiltration, gallery, and infiltration basin.
Several mitigation strategies that could be applied in Bangladesh to counteract the salinization impacts were identified. Specifically the conjunctive use of surface water and groundwater, the systematic monitoring and the artificial recharge have been identified as potential measures. The spatial feasibility of the proposed mitigation strategies should be investigated further.
Important input for the WSPs are the salinization hazards related to each water supply technology, the needed changes in the design to prevent salinization, the
control and monitoring measures for technologies susceptible to be affected by salinization, and the specific management procedures to prevent and counteract salinization. For each technology the mentioned aspects have been identified and they should be included in the next generation of WSPs.
There appear to be no unified national groundwater monitoring network and national groundwater database in Bangladesh. It is strongly recommended to integrate groundwater monitoring networks from different agencies into one national groundwater monitoring network.

9
Contents Preface ................................................................................................................................. 2
Executive Summary .............................................................................................................. 3
1 Project description ....................................................................................................... 12
1.1 Project scope and objectives .......................................................................... 12
1.2 Project activities and outputs .......................................................................... 14
2 Definitions of saline, brackish and fresh water ............................................................. 16
2.2. Consequences of saline water for health .................................................................. 17
2.3 Consequences of saline water for agriculture ............................................................ 17
3 Description of the project area ..................................................................................... 19
3.2 Fact Finding outcomes .............................................................................................. 22
4 Monitoring of groundwater salinity ................................................................................ 30
4.1 Present monitoring activities in Bangladesh .................................................... 30
4.2 Outcome of the monitoring workshop ............................................................. 33
4.3 Monitoring techniques .................................................................................... 33
4.4 Recommendations for a national monitoring network ..................................... 40
5 Modelling of salt water intrusion ................................................................................... 42
5.1 Model structure and inputs ............................................................................. 43
5.2 Model results .................................................................................................. 53
5.3 Outcome of the modelling workshop ............................................................... 57
5.4 Conclusions of the model and recommendations for further improvement ...... 57
6 Mitigating strategies for salt water impacts ................................................................... 59
6.1 Assumptions and framework .......................................................................... 59
6.2 Strategy for sustainability ................................................................................ 61
6.3 Strategy for systematic monitoring .................................................................. 63
6.4 Strategy for deep well injection ....................................................................... 64
6.5 Strategy for GO-FRESH ................................................................................. 66
6.6 Strategy for conjunctive use ........................................................................... 68
7 Inputs to the Water Safety Plans .................................................................................. 74
7.1 Salinization of groundwater ............................................................................ 74
7.2 The Water Safety Plans .................................................................................. 75
7.3 Linking salinity aspects to Water Safety Plans ................................................ 76
7.4 Water Supply Technologies ............................................................................ 78
8 Conclusions and Recommendations ............................................................................ 87
10
8.1 Outcome of the dissemination workshop ........................................................ 87
8.2 Conclusions .................................................................................................... 87
8.3 Recommendations .......................................................................................... 88
Acknowledgements ............................................................................................................. 91
References ......................................................................................................................... 92
Annex 1: Report of the Fact Finding Mission to Bangladesh ............................................. 100
Annex 2: Leaflet salinization processes and mitigation strategies ..................................... 124
Annex 3: Groundwater modelling workshop (June, 4th-5th, 2014) .................................... 125
Annex 4: Monitoring workshop (June, 8th-10th, 2014) ...................................................... 131
Annex 5: Description of various water institutes in Bangladesh ......................................... 142
Annex 6: Report on the dissemination workshop ............................................................... 146

11
List of Tables Table 1: Classification of water as a function of salinity (in milliSiemens/cm and mg TDS/l).17
Table 2: Summary of salt tolerance of crops ....................................................................... 18
Table 3: Guidelines for irrigation water in Bangladesh. ........................................................ 18
Table 4: Source of drinking water in different districts of the project area ............................ 20
Table 5: Involvement of govt. institutions in different aspects of water management .......... 31
Table 6: Vertical discretization of the model. ....................................................................... 44
Table 7: Classification of technologies per selected region ................................................. 80
Table 8: Use of the water depending on its salinity ............................................................. 83
Table 9: Example of records for salinity measurements ...................................................... 86

12
1 Project description
1.1 Project scope and objectives Bangladesh is densely populated and it is expected that the population increases significantly in the coming decades (up to 26.6% more by 2050 according to IIASA (2013)2). Demand for drinking water will increase accordingly. These developments may cause significant changes in the hydrological system, e.g. leading to a drop of the groundwater tables (Ferguson and Gleeson, 2012; Konikow and Kendy, 2005). Moreover, climate change and a sea level rise are predicted by the scenarios drawn by the International Panel of Climate Change (IPCC, 2013). This leads to, among others, an increase of salt water intrusion, in surface water as well as in groundwater (Green et al., 2011; Taylor and Green, 2013; Werner and Simmons, 2009).
The goal of the BRAC WASH II programme is to contribute to the attainment of the Millennium Development Goals by providing integrated water services, sanitation and hygiene promotion expanding to hard-to-reach areas and to under-served populations, in collaboration with government and other stakeholders. As part of the programme, innovative research is addressed in six relevant themes, one of which is the theme salt water intrusion. This project, SWIBANGLA – Managing salt water intrusion impacts in Bangladesh, contributes to the theme salt water intrusion.
In this project, the focus is on salt water intrusion in coastal groundwater systems, as groundwater is the main resource of drinking water and irrigation water for agriculture. So, intrusion of sea water into the coastal surface water courses that are under the influence of tidal effect and storm surges are not studied here. In Mahmuduzzaman et al. (2014) some insights of causes of surface water salinization are given.
When the salt water intrusion processes and dynamics in groundwater systems are understood, water managers or others can use this knowledge to decide on the adequate measures to secure fresh groundwater. Otherwise, a shortage of sufficient, clean fresh water at the right moment for domestic water supply as well as for agricultural use will occur. In Bangladesh, an estimated 80% of the irrigation water is groundwater, which seems to be growing (CSIRO, 2014). Currently, a blue print for accurate policy measures on the issue of salt water intrusion does not exist. In current water safety planning practices in Bangladesh, the issue of salt water intrusion in groundwater systems is underexposed.
The Department of Public Health and Engineering (DPHE) is the main authority in developing and improving Water Safety Plans for water supply technologies in Bangladesh. The outputs of SWIBANGLA are mainly meant for DPHE, which has been the main stakeholder during the project, but they are also meant for all governmental agencies, NGOs, universities and others that study, manage or have to deal with salt water intrusion impacts in Bangladesh.
SWIBANLGA has two main general objectives which contribute to the achievement of the Millennium Development Goals:
1. increasing WASH sector stakeholders’ awareness of the salinization of drinking water resources and the threats posed by this process;
2 https://secure.iiasa.ac.at/web-apps/ene/SspDb/dsd?Action=htmlpage&page=countries

13
2. increasing WASH sector stakeholders’ knowledge and skills necessary to anticipate on the salinization of drinking water resources.
The specific additional objectives leading to the main ones are:
1. Create a better understanding of the process of salinization of drinking water resources in Bangladesh
Management of and anticipation on salinization of drinking water resources salinization requires an understanding of the actual physical salinization processes in the subsoil behind it. Moreover, awareness of the salinization issue will benefit from an increased understanding of the actual physical process. The project includes the mapping, monitoring and understanding of the coastal groundwater system in Bangladesh by means of data analysis and variable-density groundwater modelling.
2. Provide recommendations for monitoring
It is only through a clear understanding of the cause-effect relationships in the salinization issue that effective strategies for mitigation and adaptation can be defined. Thus, to make Water Safety Plans “salinization robust”, insights are necessary in the current salinity levels of the drinking groundwater resources, as well as throughout the (geo)hydrological setting in which these drinking water sources are located. In the case of Bangladesh, this asks for effective monitoring approaches that produce the necessary information at low cost. The cheaper and more simple the monitoring approach, the more successful and widespread its implementation will be.
3. Provide recommendations for adaptation and mitigation
Effective water planning is only realizable if possible courses of action are presented to water managers, should salinization indeed hamper the supply of drinking water of a good enough quality. The success of mitigation and adaptation strategies depends on many factors. Guidance is needed as of which mitigation and adaptation measures are applicable in what situation.
4. Achieve an effective, tailored knowledge transfer between the Netherlands and Bangladesh
It is a challenge to effectively communicate all knowledge to the stakeholders in the WASH sector of Bangladesh. Through a close communication with the project stakeholders and the organization of workshops, the project aimed to set up a continuous exchange of knowledge with Bangladeshi experts.
5. Advise on the integration of the salinization issue in Water Safety Planning
At grass-root level the Water Safety Plans are applied. These plans are however developed at governmental level (DPHE, BRAC and WHO are the main developers). Water Safety Plans are simple documents easy to access and to be used by communities. They are key tools for sustainable water supply technologies management. These plans need to be completed with knowledge on salinization processes, as salinization is one of the important threats of water supply technologies in the coastal zone of Bangladesh.

14
1.2 Project activities and outputs The project is divided into four main activities: A1 – Fact Finding, A2 – Data Processing, A3 – Training and A4 – Dissemination.
A1 – Fact Finding
The Fact Finding activity complemented the project partners’ understanding of:
the key stakeholders that should be targeted within the project (BRAC, WASH services managers, representatives of local communities, etc.);
the organisation of WASH services in Bangladesh (responsible parties, representatives, coverage, etc.);
the Water Safety Plans currently in place or being prepared in Bangladesh;
previous studies;
available data on meteorology, hydrology, hydrogeology, geology, land use, and salinity monitoring etc.;
the state of the knowledge already existing in Bangladesh on the salinization issues;
different approaches to mitigating and adapting WASH services to increased salinity in ground- and surface water that have been used or piloted in Bangladesh;
different salinity monitoring systems that are in use and the systems that are used to quality, control, analyse, model and disseminate salinity information; and
the lessons that have been learned from piloting and upscaling the use of water planning in Bangladesh.
This activity consisted of two parts: 1) a Fact Finding Mission to Bangladesh at the beginning of the project (viz. July, 7th-10th, 2013), and 2) desktop studies to collect and analyse existing literature.
The report of the Fact Finding Mission to Bangladesh can be found in Annex 1; the desktop studies were used as input for Activity 2 Data Processing.
A2 – Data Processing
During this activity, knowledge and insights acquired during the first activity were combined with the expertise of the project partners. A critical review of all existing data regarding monitoring, mitigation techniques and the lessons learned from piloting was carried out.
As a result of the activity, the following products were developed:
an App for smartphones to measure salinity content in water and a monitoring kit to evaluate water quality (see Chapter 2),
a 3D variable-density groundwater flow and salt transport model of the south-western coastal zone of Bangladesh (see Chapter 3),

15
an assessment of adaptation and mitigation strategies (see Chapter 4),
an assessment of the key components that need to be included in the Water Safety Plans in order to integrate the salinization issues that water supply technologies might be threatened with (see Chapter 5), and
a leaflet about salinization processes, monitoring and mitigation strategies (see Annex 2).
A3 – Training
During the project two workshops were organized; one in groundwater modelling (June, 4th-5th, 2014) and one in monitoring (June, 8th-10th, 2014). The workshops were meant for engineers and technicians of DPHE, BRAC, BWDB, BADC, Water aid, and other organizations dealing with water supply and water management.
In the first training, the first version of the 3D variable-density groundwater model was presented, the data used for the model was discussed, and the participants were trained in the use and run of the used modelling package iMOD-SEAWAT, part of Deltares Open Source software (2015)3.
In the second training, the monitoring network of Bangladesh was discussed, new techniques were presented, and a discussion on how to improve the monitoring of groundwater in Bangladesh took place.
The reports of the two workshops can be found in Annex 3 and Annex 4.
A4 - Dissemination
The results and experiences of the project were shared with stakeholders during the project through a final dissemination workshop in Dhaka, September, 2nd-3rd, 2014. Besides the final workshop, the other two workshops organized during the project (modelling and monitoring) and the close communication with the stakeholders, were also key activities to disseminate and discuss on the findings and progress of the project.
3 http://oss.deltares.nl/web/imod/home.

16
2 Definitions of saline, brackish and fresh water
2.1. How to define saline water?
When water contains significant quantities of dissolved salts, especially sodium chloride (NaCl), we call this saline water. The amount of salt in water is often expressed as concentration in milligrams of chloride per liter of water (mg Cl-/l) or in its equivalent; parts per million (ppm). Another standard way of measuring salinity is milligrams TDS per liter, where TDS is Total Dissolved Solids. It can also be expressed using the Electrical Conductivity (in reference to 25⁰ Celcius) often expressed either in milliSiemens per centimeter (mS/cm) or microSiemens per centimeter (μS/cm). To get an idea: 106 μS/cm = 103 mS/cm = 1 S/cm and 1 μS/cm = 100 μS/m. For a reference, ocean water is 19,000 mg Cl-/l, or 35,000 mg TDS/L (making the ratio Cl- over TDS equal to 0.55, under stable normal seawater environments), or 5S/m or 50mS/cm. Note that the relation between Electrical Conductivity and chloride concentration is pretty straightforward, see
Figure 1, unless the salinity is low. The EC is converted to salinity using the relationship: Cl (g/L) = EC(mS/cm)*0.36-0.45 (de Louw et al., 2011).
Figure 1: relation between Chloride concentration and Electrical Conductivity for two examples in The Netherlands: chloride concentration is retrieved from samples in the laboratory, e.g. de Louw et al. (2011) and Goes et al. (2009).
Depending on the amount of salt in water, the FAO has divided the water in the following types of water. In the next table a modification of that division including the Bangladesh Standard for Drinking water is shown:

17
Table 1: Classification of water as a function of salinity (in milliSiemens/cm and mg TDS/l)4.
2.2. Consequences of saline water for health The World Health Organization Guidelines for Drinking-water Quality – Chloride in Drinking-water5, summarize the behaviour of Chloride in water, the taste of the water that contain Chloride, and the issues related to human health.
They conclude that a concentration higher than 250 mg Cl-/L can be detected by tasting the water, but it depends on the cations with which the chloride is associated (sodium, calcium and potassium). These guidelines do not give any health-based threshold value for chloride alone, but they give indications of the Lethal Doses (LD50) of chloride components in mg per kg of body weight. The LD50 values for calcium (Ca) chloride, sodium (Na) chloride and potassium (K) chloride are 1000, 3000, 2430 mg/kg of body weight respectively.
They state that healthy individuals can tolerate the intake of large quantities of chloride provided that there is an equivalent intake of fresh water, being fresh water that one that contains less than 500 mg/L of Total Dissolved Solids. However, in most countries, drinking water is water that contains less than 150 mg Cl-/L. Health problems related to water with a high content of salt are for example hypertension3.
Another consequence of chloride in water is that it increases the corrosivity of water, meaning that the water reacts with the metals of metallic pipes and increases the concentration of metals in the water. The high content of metals in water can also lead to health problems.
2.3 Consequences of saline water for agriculture Often, river, ditch or groundwater is used as a water resource for irrigation of cropland. The composition of this water, and specially the content of salt, is determinant for the growth of the crops. Besides irrigation water, the salt content of the soil water is also conditioning the capability of a certain crop to grow in an area. Depending of the concentration of the soil water and the irrigation water, the crop can suffer stress and therefore not grow properly, or 4 The use of saline waters for crop production - FAO irrigation and drainage paper 48: http://www.fao.org/docrep/T0667E/t0667e00.htm. 5 Guidelines for drinking-water quality, 2nd ed. Vol. 2. Health criteria and other supporting information, World Health Organization, Geneva, 1996.
18
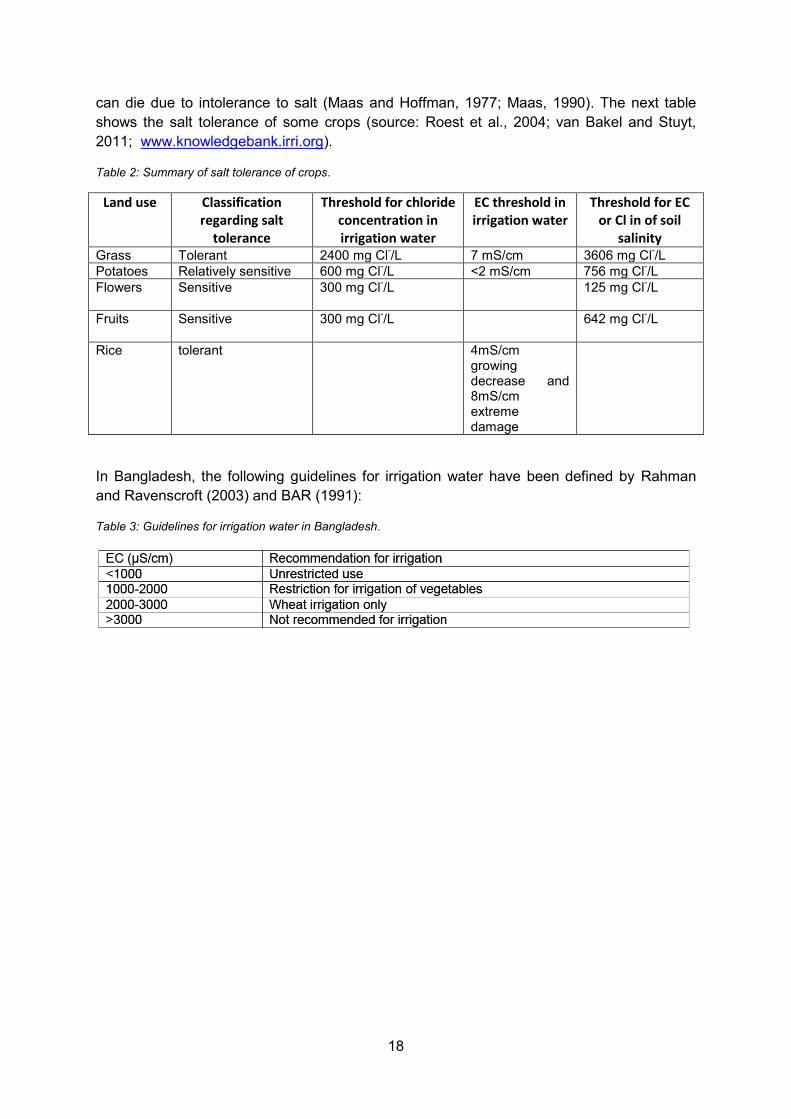
can die due to intolerance to salt (Maas and Hoffman, 1977; Maas, 1990). The next table shows the salt tolerance of some crops (source: Roest et al., 2004; van Bakel and Stuyt, 2011; www.knowledgebank.irri.org).
Table 2: Summary of salt tolerance of crops.
Land use Classification regarding salt
tolerance
Threshold for chloride concentration in irrigation water
EC threshold in irrigation water
Threshold for EC or Cl in of soil
salinity Grass Tolerant 2400 mg Cl-/L 7 mS/cm 3606 mg Cl-/L Potatoes Relatively sensitive 600 mg Cl-/L <2 mS/cm 756 mg Cl-/L Flowers Sensitive 300 mg Cl-/L 125 mg Cl-/L
Fruits Sensitive 300 mg Cl-/L 642 mg Cl-/L
Rice tolerant 4mS/cm growing decrease and 8mS/cm extreme damage
In Bangladesh, the following guidelines for irrigation water have been defined by Rahman and Ravenscroft (2003) and BAR (1991):
Table 3: Guidelines for irrigation water in Bangladesh.

19
3 Description of the project area
3.1. Introduction to project area
The project area constitutes the south-western part of Bangladesh which is the part of the Ganges Brahmaputra Delta. In this area, saline groundwater is occurring in the top groundwater systems, and salinity issues are widespread in all districts. In the north and east the area is bounded by the river Ganges and Meghna, in the west by Indian border and in the south by the Bay of Bengal Figure 2.
Figure 2: Location map of the project area Figure 3: Location of districts and cities in the project area
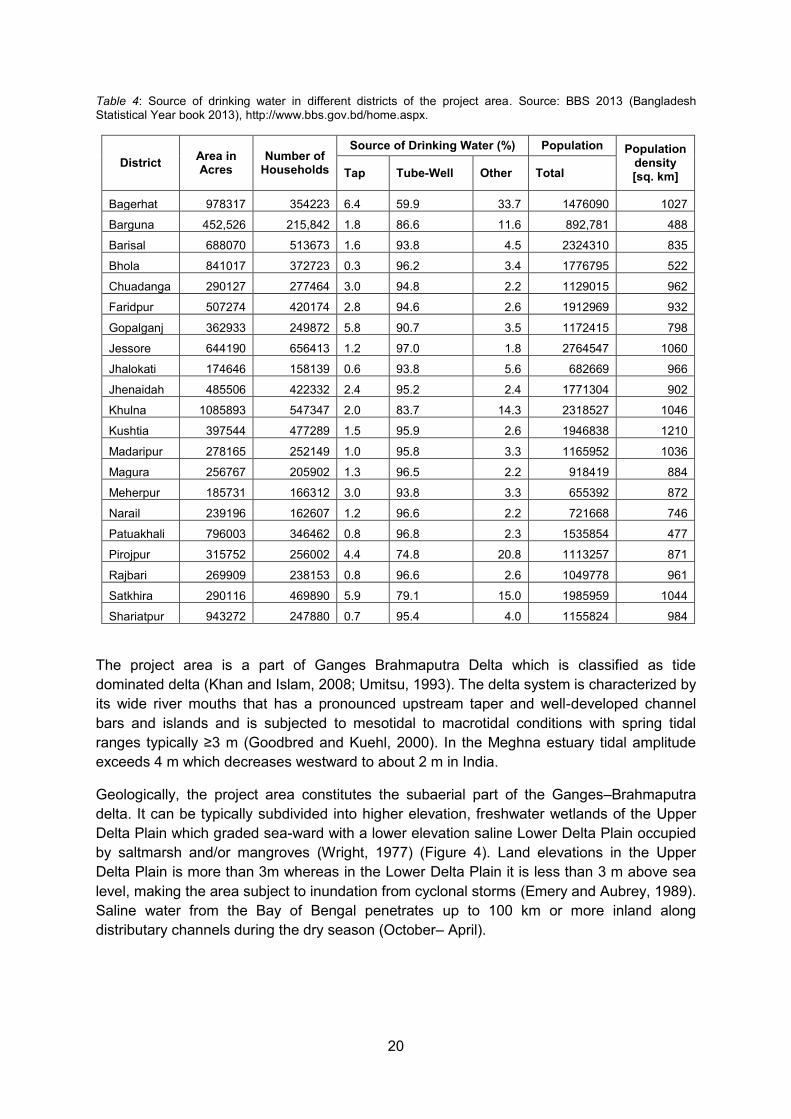
There are twenty one districts in the project area (Figure 3). Khulna and Barisal are two big cities in the coastal area. The entire south-west area of Bangladesh to the right bank of Ganges-Padma is known as the Gangetic delta and has been formed primarily by the alluvium carried by the Ganges. The existing north-south trending river system includes the remnants of major distributaries of the Ganges. Important of these distributaries are: Ichamati, Shibsha, Passur, Madhumati-Haringhata, Biskhali, Lohalia andTentulia. These north-south rivers are interconnected by smaller tidal creeks virtually forming a network of rivers. Table 4 gives the sources of drinking water in different districts of the project area. Total population in the project area is about 30.5 million (source: Bangladesh Statistical Year book 2013).
20
Table 4: Source of drinking water in different districts of the project area. Source: BBS 2013 (Bangladesh Statistical Year book 2013), http://www.bbs.gov.bd/home.aspx.
District Area in Acres
Number of Households
Source of Drinking Water (%) Population Population density [sq. km] Tap Tube-Well Other Total
Bagerhat 978317 354223 6.4 59.9 33.7 1476090 1027
Barguna 452,526 215,842 1.8 86.6 11.6 892,781 488
Barisal 688070 513673 1.6 93.8 4.5 2324310 835
Bhola 841017 372723 0.3 96.2 3.4 1776795 522
Chuadanga 290127 277464 3.0 94.8 2.2 1129015 962
Faridpur 507274 420174 2.8 94.6 2.6 1912969 932
Gopalganj 362933 249872 5.8 90.7 3.5 1172415 798
Jessore 644190 656413 1.2 97.0 1.8 2764547 1060
Jhalokati 174646 158139 0.6 93.8 5.6 682669 966
Jhenaidah 485506 422332 2.4 95.2 2.4 1771304 902
Khulna 1085893 547347 2.0 83.7 14.3 2318527 1046
Kushtia 397544 477289 1.5 95.9 2.6 1946838 1210
Madaripur 278165 252149 1.0 95.8 3.3 1165952 1036
Magura 256767 205902 1.3 96.5 2.2 918419 884
Meherpur 185731 166312 3.0 93.8 3.3 655392 872
Narail 239196 162607 1.2 96.6 2.2 721668 746
Patuakhali 796003 346462 0.8 96.8 2.3 1535854 477
Pirojpur 315752 256002 4.4 74.8 20.8 1113257 871
Rajbari 269909 238153 0.8 96.6 2.6 1049778 961
Satkhira 290116 469890 5.9 79.1 15.0 1985959 1044
Shariatpur 943272 247880 0.7 95.4 4.0 1155824 984
The project area is a part of Ganges Brahmaputra Delta which is classified as tide dominated delta (Khan and Islam, 2008; Umitsu, 1993). The delta system is characterized by its wide river mouths that has a pronounced upstream taper and well-developed channel bars and islands and is subjected to mesotidal to macrotidal conditions with spring tidal ranges typically ≥3 m (Goodbred and Kuehl, 2000). In the Meghna estuary tidal amplitude exceeds 4 m which decreases westward to about 2 m in India.
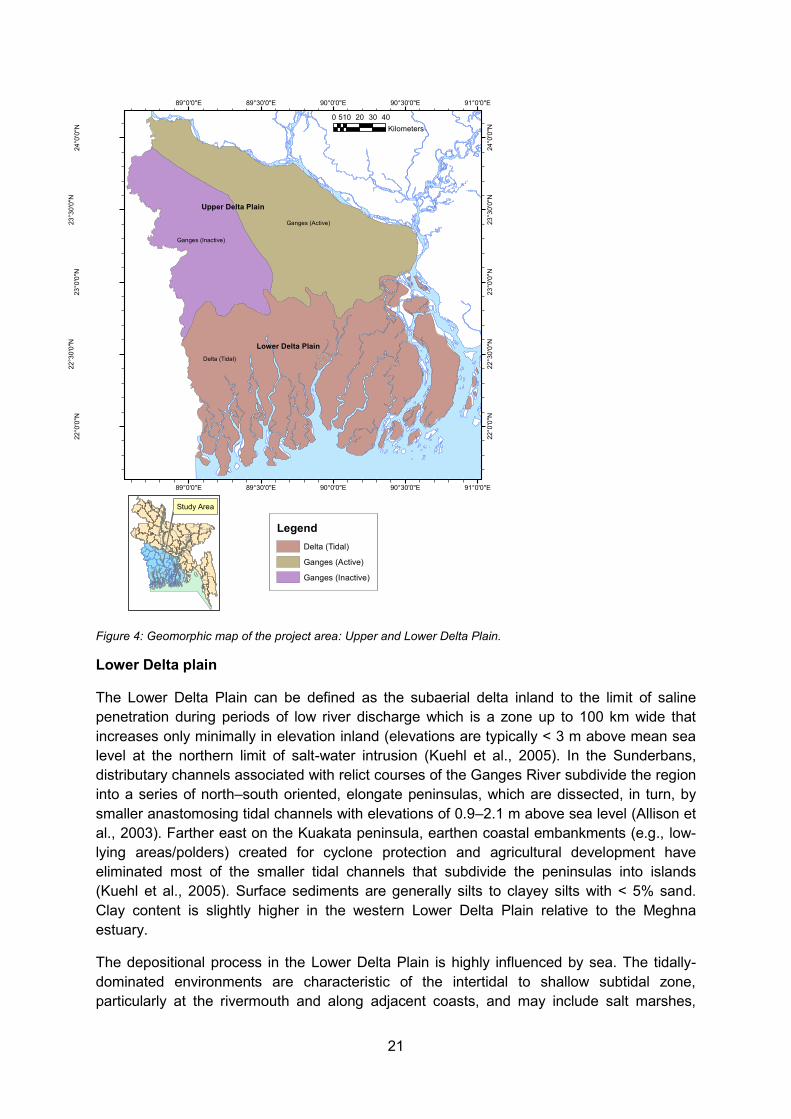
Geologically, the project area constitutes the subaerial part of the Ganges–Brahmaputra delta. It can be typically subdivided into higher elevation, freshwater wetlands of the Upper Delta Plain which graded sea-ward with a lower elevation saline Lower Delta Plain occupied by saltmarsh and/or mangroves (Wright, 1977) (Figure 4). Land elevations in the Upper Delta Plain is more than 3m whereas in the Lower Delta Plain it is less than 3 m above sea level, making the area subject to inundation from cyclonal storms (Emery and Aubrey, 1989). Saline water from the Bay of Bengal penetrates up to 100 km or more inland along distributary channels during the dry season (October– April).
21
Figure 4: Geomorphic map of the project area: Upper and Lower Delta Plain.
Lower Delta plain
The Lower Delta Plain can be defined as the subaerial delta inland to the limit of saline penetration during periods of low river discharge which is a zone up to 100 km wide that increases only minimally in elevation inland (elevations are typically < 3 m above mean sea level at the northern limit of salt-water intrusion (Kuehl et al., 2005). In the Sunderbans, distributary channels associated with relict courses of the Ganges River subdivide the region into a series of north–south oriented, elongate peninsulas, which are dissected, in turn, by smaller anastomosing tidal channels with elevations of 0.9–2.1 m above sea level (Allison et al., 2003). Farther east on the Kuakata peninsula, earthen coastal embankments (e.g., low-lying areas/polders) created for cyclone protection and agricultural development have eliminated most of the smaller tidal channels that subdivide the peninsulas into islands (Kuehl et al., 2005). Surface sediments are generally silts to clayey silts with < 5% sand. Clay content is slightly higher in the western Lower Delta Plain relative to the Meghna estuary.
The depositional process in the Lower Delta Plain is highly influenced by sea. The tidally-dominated environments are characteristic of the intertidal to shallow subtidal zone, particularly at the rivermouth and along adjacent coasts, and may include salt marshes,
Delta (Tidal)
Ganges (Active)
Ganges (Inactive)
91°0'0"E
91°0'0"E
90°30'0"E
90°30'0"E
90°0'0"E
90°0'0"E
89°30'0"E
89°30'0"E
89°0'0"E
89°0'0"E
24°0
'0"N
24°0
'0"N
23°3
0'0"
N
23°3
0'0"
N
23°0
'0"N
23°0
'0"N
22°3
0'0"
N
22°3
0'0"
N
22°0
'0"N
22°0
'0"NÜ
0 10 20 30 405Kilometers
Study Area
Upper Delta Plain
Lower Delta Plain
LegendDelta (Tidal)
Ganges (Active)
Ganges (Inactive)
22
mangroves, muddy tidal flats, tidal channels, and channel-mouth bars. The transition between subtidal and supratidal environments is the principal zone of subaerial delta progradation and is largely defined by the development of channel-mouth bars within and just seaward of the active river mouth. These bars are generally large (102–104 m) elongate features that extend from shallow subtidal to supratidal elevations, forming within or along the active distributaries of the river mouth estuary and comprising muddy, sandy, to heterolithic sediments (Allison et al., 2003).
Alternating sand-mud layers also commonly occur within subtidal sandbar that form on the delta-front platform and likely represent the incipient phase of channel-mouth bar formation. These deposits are interbedded or interlaminated sand and mud that are formed under the strong influence of tides, especially the neap–spring cycle(Michels et al., 1998). The sand layers within the delta-front platform develop through erosion and bedload transport during spring tides, whereas muddy layers are produced under relatively low-energy conditions during neap tides.
Upper Delta Plain and flood basin
The large area of the Upper Delta Plain is dominated by fluvial processes that are overprinted by downstream coastal evolution and sea-level change. The landward boundary of the Upper Delta Plain is defined by the initiation of distributary development along the Ganges and the downstream edge of the Upper Delta Plain is defined by the inland dry-season extent of saline water, typically encompassing land >3 m above sea level. The Upper Delta Plain extends 200 km landward of the salinity influenced Lower Delta Plain and comprises almost half of the delta plain (Kuehl et al., 2005). Frequent sea level fluctuation in the Quaternary changed the river gradient and river pattern and consequently sediments of different fluvial facies deposited in the Upper Delta Plain. The gravel bed occurring at different depths in the study area indicates the deposition in the river beds and presence of pre-existing rivers. Immense fluvial sediment discharge supported development of a thick Transgressive Systems Tract during rapid early Holocene sea-level rise. In the early Holocene, major fluvial and flood-basin sequences accreted across the Upper Delta Plain.
In general, shallow sub-surface stratigraphy of the Upper Delta Plain consists of a fining upward succession starting with coarse channel sand deposits (3–20m thick) capped by thin floodplain muds (0.5–3 m). Thin floodplain facies on the surface of the Upper Delta Plain are bioturbated and moderately pedogenized, in contrast to the deeper floodplain facies which are thicker (> 5 m) and well-preserved (Kuehl et al., 2005). Kuehl et al. (2005) also described the organic-rich facies formed in local depressions as discrete layers (5–20 cm thick), although their origin is not well understood.
3.2 Fact Finding outcomes A thorough study of the geological and salinity data was carried out by the University of Jahangirnagar within this project. The study reveals the geological characteristics of the project area. It also points out the findings and research questions still remaining regarding the salinity distribution in the groundwater and the salinization processes. A description of the used data can be found in Chapter 0.
23
Analysis of the geological data
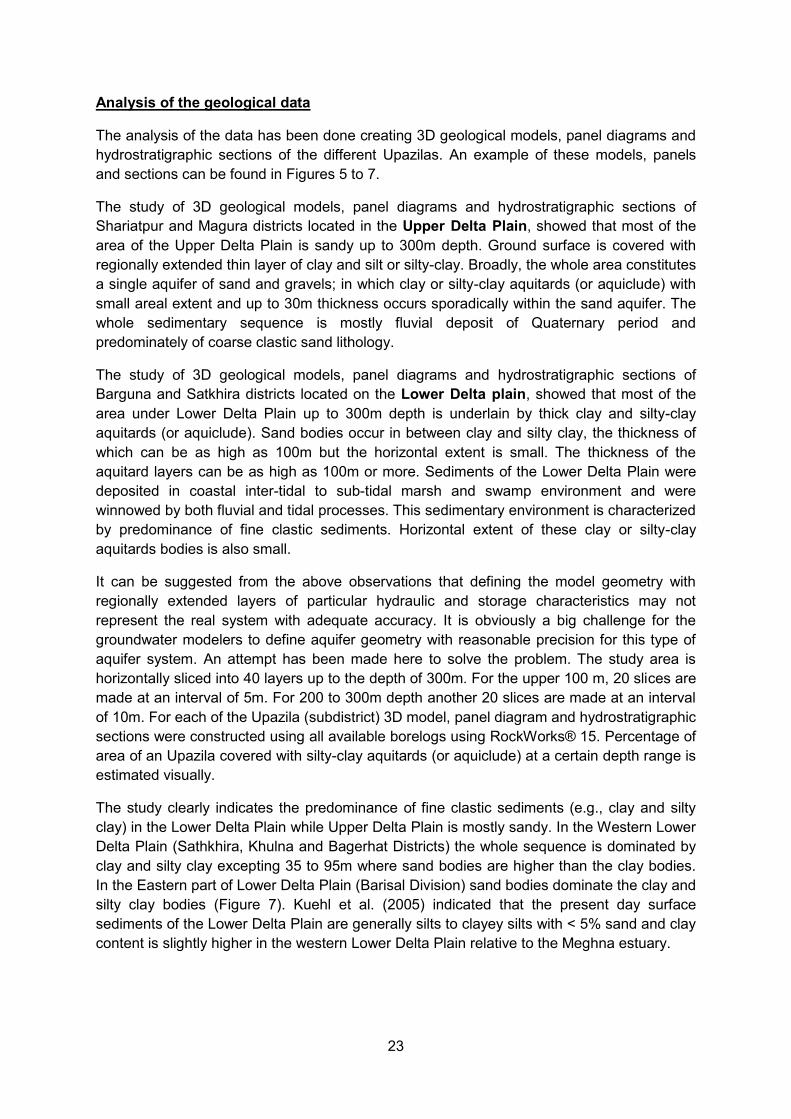
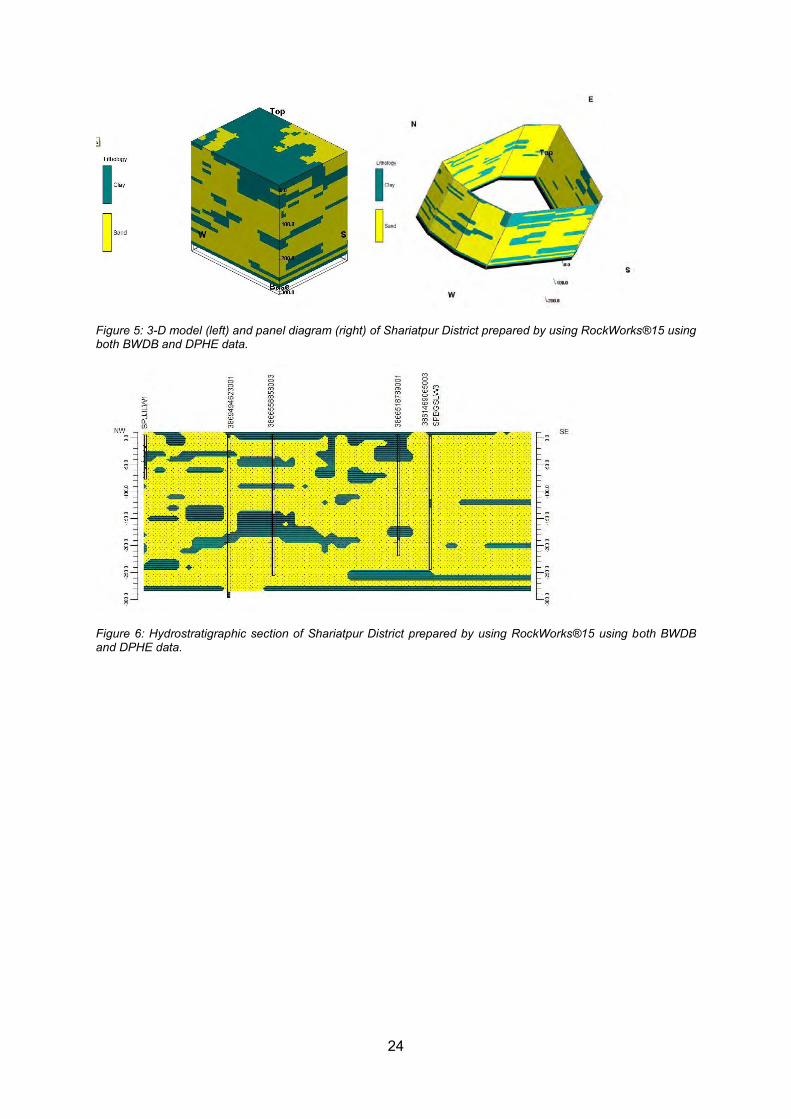
The analysis of the data has been done creating 3D geological models, panel diagrams and hydrostratigraphic sections of the different Upazilas. An example of these models, panels and sections can be found in Figures 5 to 7.
The study of 3D geological models, panel diagrams and hydrostratigraphic sections of Shariatpur and Magura districts located in the Upper Delta Plain, showed that most of the area of the Upper Delta Plain is sandy up to 300m depth. Ground surface is covered with regionally extended thin layer of clay and silt or silty-clay. Broadly, the whole area constitutes a single aquifer of sand and gravels; in which clay or silty-clay aquitards (or aquiclude) with small areal extent and up to 30m thickness occurs sporadically within the sand aquifer. The whole sedimentary sequence is mostly fluvial deposit of Quaternary period and predominately of coarse clastic sand lithology.
The study of 3D geological models, panel diagrams and hydrostratigraphic sections of Barguna and Satkhira districts located on the Lower Delta plain, showed that most of the area under Lower Delta Plain up to 300m depth is underlain by thick clay and silty-clay aquitards (or aquiclude). Sand bodies occur in between clay and silty clay, the thickness of which can be as high as 100m but the horizontal extent is small. The thickness of the aquitard layers can be as high as 100m or more. Sediments of the Lower Delta Plain were deposited in coastal inter-tidal to sub-tidal marsh and swamp environment and were winnowed by both fluvial and tidal processes. This sedimentary environment is characterized by predominance of fine clastic sediments. Horizontal extent of these clay or silty-clay aquitards bodies is also small.
It can be suggested from the above observations that defining the model geometry with regionally extended layers of particular hydraulic and storage characteristics may not represent the real system with adequate accuracy. It is obviously a big challenge for the groundwater modelers to define aquifer geometry with reasonable precision for this type of aquifer system. An attempt has been made here to solve the problem. The study area is horizontally sliced into 40 layers up to the depth of 300m. For the upper 100 m, 20 slices are made at an interval of 5m. For 200 to 300m depth another 20 slices are made at an interval of 10m. For each of the Upazila (subdistrict) 3D model, panel diagram and hydrostratigraphic sections were constructed using all available borelogs using RockWorks® 15. Percentage of area of an Upazila covered with silty-clay aquitards (or aquiclude) at a certain depth range is estimated visually.
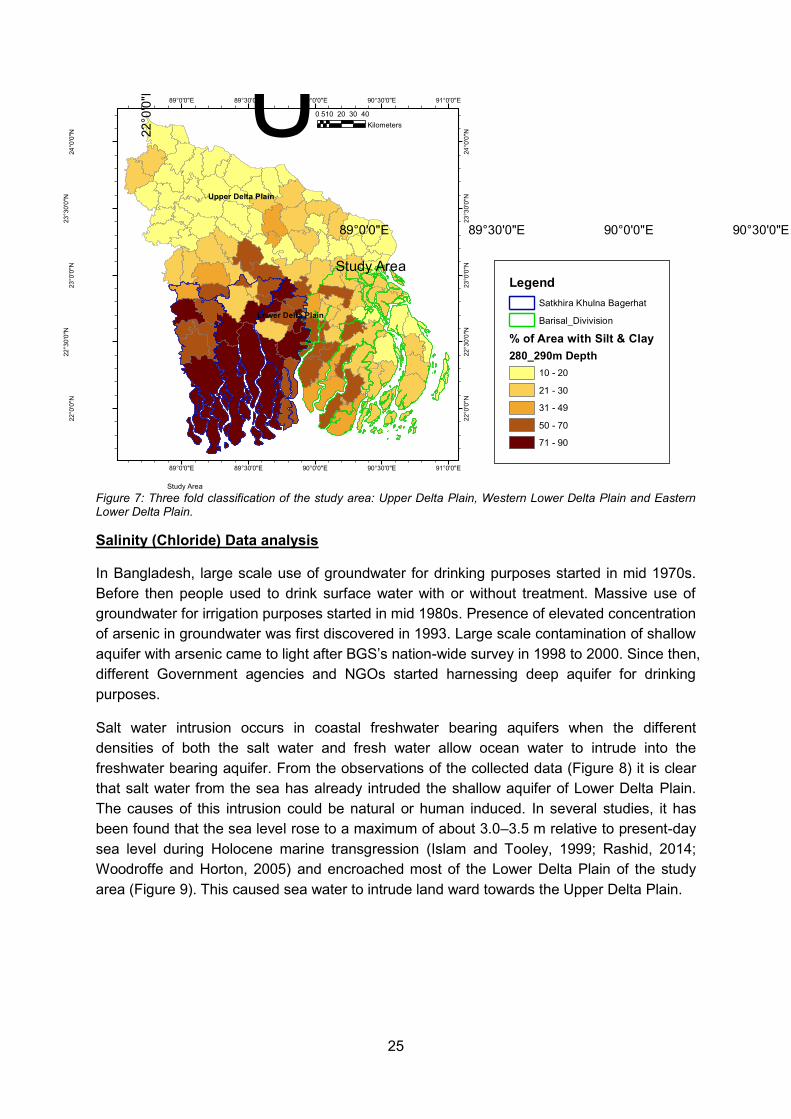
The study clearly indicates the predominance of fine clastic sediments (e.g., clay and silty clay) in the Lower Delta Plain while Upper Delta Plain is mostly sandy. In the Western Lower Delta Plain (Sathkhira, Khulna and Bagerhat Districts) the whole sequence is dominated by clay and silty clay excepting 35 to 95m where sand bodies are higher than the clay bodies. In the Eastern part of Lower Delta Plain (Barisal Division) sand bodies dominate the clay and silty clay bodies (Figure 7). Kuehl et al. (2005) indicated that the present day surface sediments of the Lower Delta Plain are generally silts to clayey silts with < 5% sand and clay content is slightly higher in the western Lower Delta Plain relative to the Meghna estuary.
24
Figure 5: 3-D model (left) and panel diagram (right) of Shariatpur District prepared by using RockWorks®15 using both BWDB and DPHE data.
Figure 6: Hydrostratigraphic section of Shariatpur District prepared by using RockWorks®15 using both BWDB and DPHE data.
25
Figure 7: Three fold classification of the study area: Upper Delta Plain, Western Lower Delta Plain and Eastern Lower Delta Plain.
Salinity (Chloride) Data analysis
In Bangladesh, large scale use of groundwater for drinking purposes started in mid 1970s. Before then people used to drink surface water with or without treatment. Massive use of groundwater for irrigation purposes started in mid 1980s. Presence of elevated concentration of arsenic in groundwater was first discovered in 1993. Large scale contamination of shallow aquifer with arsenic came to light after BGS’s nation-wide survey in 1998 to 2000. Since then, different Government agencies and NGOs started harnessing deep aquifer for drinking purposes.
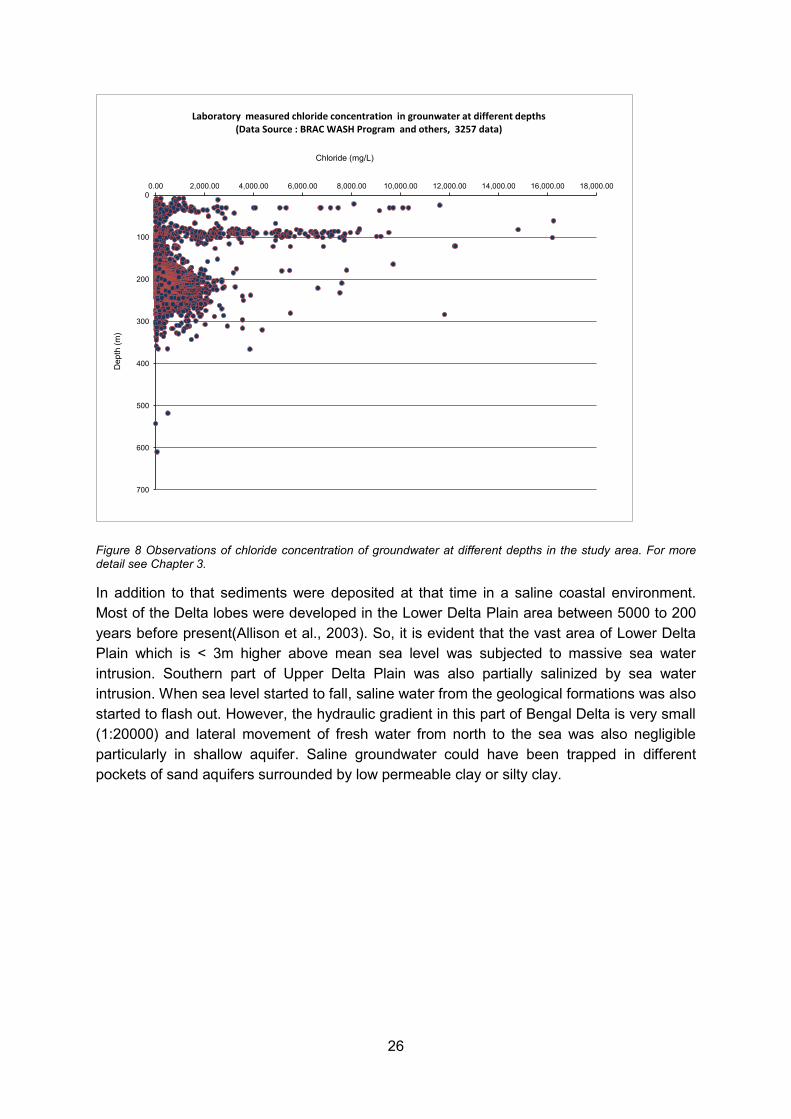
Salt water intrusion occurs in coastal freshwater bearing aquifers when the different densities of both the salt water and fresh water allow ocean water to intrude into the freshwater bearing aquifer. From the observations of the collected data (Figure 8) it is clear that salt water from the sea has already intruded the shallow aquifer of Lower Delta Plain. The causes of this intrusion could be natural or human induced. In several studies, it has been found that the sea level rose to a maximum of about 3.0–3.5 m relative to present-day sea level during Holocene marine transgression (Islam and Tooley, 1999; Rashid, 2014; Woodroffe and Horton, 2005) and encroached most of the Lower Delta Plain of the study area (Figure 9). This caused sea water to intrude land ward towards the Upper Delta Plain.
91°0'0"E
91°0'0"E
90°30'0"E
90°30'0"E
90°0'0"E
90°0'0"E
89°30'0"E
89°30'0"E
89°0'0"E
89°0'0"E
24°0
'0"N
24°0
'0"N
23°3
0'0"
N
23°3
0'0"
N
23°0
'0"N
23°0
'0"N
22°3
0'0"
N
22°3
0'0"
N
22°0
'0"N
22°0
'0"NÜ
0 10 20 30 405Kilometers
Study Area
Upper Delta Plain
Lower Delta Plain
LegendSatkhira Khulna Bagerhat
Barisal_Divivision
% of Area with Silt & Clay280_290m Depth
10 - 20
21 - 30
31 - 49
50 - 70
71 - 90
91°0'0"E
91°0'0"E
90°30'0"E
90°30'0"E
90°0'0"E
90°0'0"E
89°30'0"E
89°30'0"E
89°0'0"E
89°0'0"E
24°0
'0"N
24°0
'0"N
23°3
0'0"
N
23°3
0'0"
N
23°0
'0"N
23°0
'0"N
22°3
0'0"
N
22°3
0'0"
N
22°0
'0"N
22°0
'0"NÜ
0 10 20 30 405Kilometers
Study Area
Upper Delta Plain
Lower Delta Plain
LegendSatkhira Khulna Bagerhat
Barisal_Divivision
% of Area with Silt & Clay280_290m Depth
10 - 20
21 - 30
31 - 49
50 - 70
71 - 90
26
Figure 8 Observations of chloride concentration of groundwater at different depths in the study area. For more detail see Chapter 3.
In addition to that sediments were deposited at that time in a saline coastal environment. Most of the Delta lobes were developed in the Lower Delta Plain area between 5000 to 200 years before present(Allison et al., 2003). So, it is evident that the vast area of Lower Delta Plain which is < 3m higher above mean sea level was subjected to massive sea water intrusion. Southern part of Upper Delta Plain was also partially salinized by sea water intrusion. When sea level started to fall, saline water from the geological formations was also started to flash out. However, the hydraulic gradient in this part of Bengal Delta is very small (1:20000) and lateral movement of fresh water from north to the sea was also negligible particularly in shallow aquifer. Saline groundwater could have been trapped in different pockets of sand aquifers surrounded by low permeable clay or silty clay.
0
100
200
300
400
500
600
700
0.00 2,000.00 4,000.00 6,000.00 8,000.00 10,000.00 12,000.00 14,000.00 16,000.00 18,000.00
Chloride (mg/L)
Laboratory measured chloride concentration in grounwater at different depths (Data Source : BRAC WASH Program and others, 3257 data)
Dep
th (m
)

27
Figure 9: Paleoshore lines, Quaternary delta lobes, and groundwater arsenic distributions in the Bengal Basin. Wells having arsenic concentrations greater than 50 µg L-1 are only mapped. The paleoshore lines are adopted from previous studies, e.g., Goodbred and Kuehl (2000). A 3-m elevation line is estimated from a digital elevation model of Bangladesh that indicates the possible coastline during the highest sea level during 7000 years BP. GBM delta phases are taken from Allison et al. (2003). The long arrows indicate the growth and migration paths of the GBM delta with time. Map shows significant influences of Quaternary paleoshore lines and delta lobes on the regional distributions of groundwater arsenic in the Bengal Basin. B. Brahmaputra; BM, Brahmaputra–Meghna; G, Ganges; GB, Ganges–Brahmaputra. Source: Shamsudduha and Uddin (2007).
28
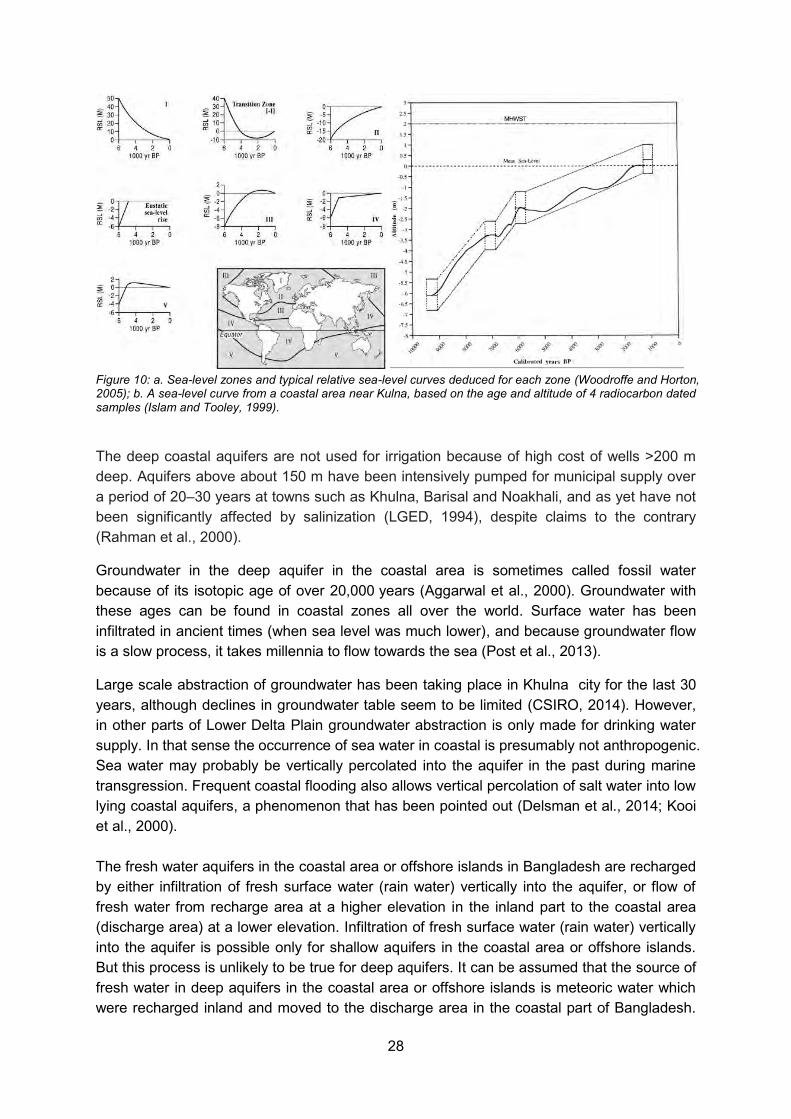
Figure 10: a. Sea-level zones and typical relative sea-level curves deduced for each zone (Woodroffe and Horton, 2005); b. A sea-level curve from a coastal area near Kulna, based on the age and altitude of 4 radiocarbon dated samples (Islam and Tooley, 1999).
The deep coastal aquifers are not used for irrigation because of high cost of wells >200 m deep. Aquifers above about 150 m have been intensively pumped for municipal supply over a period of 20–30 years at towns such as Khulna, Barisal and Noakhali, and as yet have not been significantly affected by salinization (LGED, 1994), despite claims to the contrary (Rahman et al., 2000).
Groundwater in the deep aquifer in the coastal area is sometimes called fossil water because of its isotopic age of over 20,000 years (Aggarwal et al., 2000). Groundwater with these ages can be found in coastal zones all over the world. Surface water has been infiltrated in ancient times (when sea level was much lower), and because groundwater flow is a slow process, it takes millennia to flow towards the sea (Post et al., 2013).
Large scale abstraction of groundwater has been taking place in Khulna city for the last 30 years, although declines in groundwater table seem to be limited (CSIRO, 2014). However, in other parts of Lower Delta Plain groundwater abstraction is only made for drinking water supply. In that sense the occurrence of sea water in coastal is presumably not anthropogenic. Sea water may probably be vertically percolated into the aquifer in the past during marine transgression. Frequent coastal flooding also allows vertical percolation of salt water into low lying coastal aquifers, a phenomenon that has been pointed out (Delsman et al., 2014; Kooi et al., 2000). The fresh water aquifers in the coastal area or offshore islands in Bangladesh are recharged by either infiltration of fresh surface water (rain water) vertically into the aquifer, or flow of fresh water from recharge area at a higher elevation in the inland part to the coastal area (discharge area) at a lower elevation. Infiltration of fresh surface water (rain water) vertically into the aquifer is possible only for shallow aquifers in the coastal area or offshore islands. But this process is unlikely to be true for deep aquifers. It can be assumed that the source of fresh water in deep aquifers in the coastal area or offshore islands is meteoric water which were recharged inland and moved to the discharge area in the coastal part of Bangladesh.

29
Isotope hydrology can uncover the history of the water, how it flows and from where it comes. Several studies involving isotopes have already supported this hypothesis. Isotopic study of water samples from shallow and deep tube wells of some coastal districts including Barisal, Pirojpur, Lakshmipur and Noakhali was made by Aggarwal et al., 2000. Groundwater (so-called Type 4 Groundwater) was found at depths of approximately 300 m in the Barisal area. This water is dated to about 20,000 years old, and it is free of arsenic and potential for groundwater abstraction.
Figure 11: Hydrogeological model of Bangladesh, based in isotope data (Aggarwal et al., 2000).
Basu et al. (2001) reported that 2×10¹¹ m3/year of groundwater flows directly into the Bay of Bengal, an outflow equivalent to 19% of the discharge from the Ganges-Brahmaputra river system. They showed that this estimate of flow could have important consequences for the interpretation of marine strontium isotope records, because strontium concentrations are higher in Ganges delta groundwater than in Ganges-Brahmaputra river water. Majumder et al. (2011) used environmental isotope data to reveal a complex flow of fresh water generally from north to south following the basement structure and topographic gradient. They showed the presence of regional groundwater flow commencing from the unconfined aquifers, which discharges along the coastal regions. Environmental isotopes and 14C dating were applied to estimate ages and recharge sources of deep groundwater (>150 m bgl) in south-east Bangladesh (Comilla and Noakhali area) by Hoque and Burgess (2012). With one exception, deep groundwater is shown to have been recharged more recently than 10 Ka (range 3–9 Ka, mean 7.6 Ka).
30
4 Monitoring of groundwater salinity
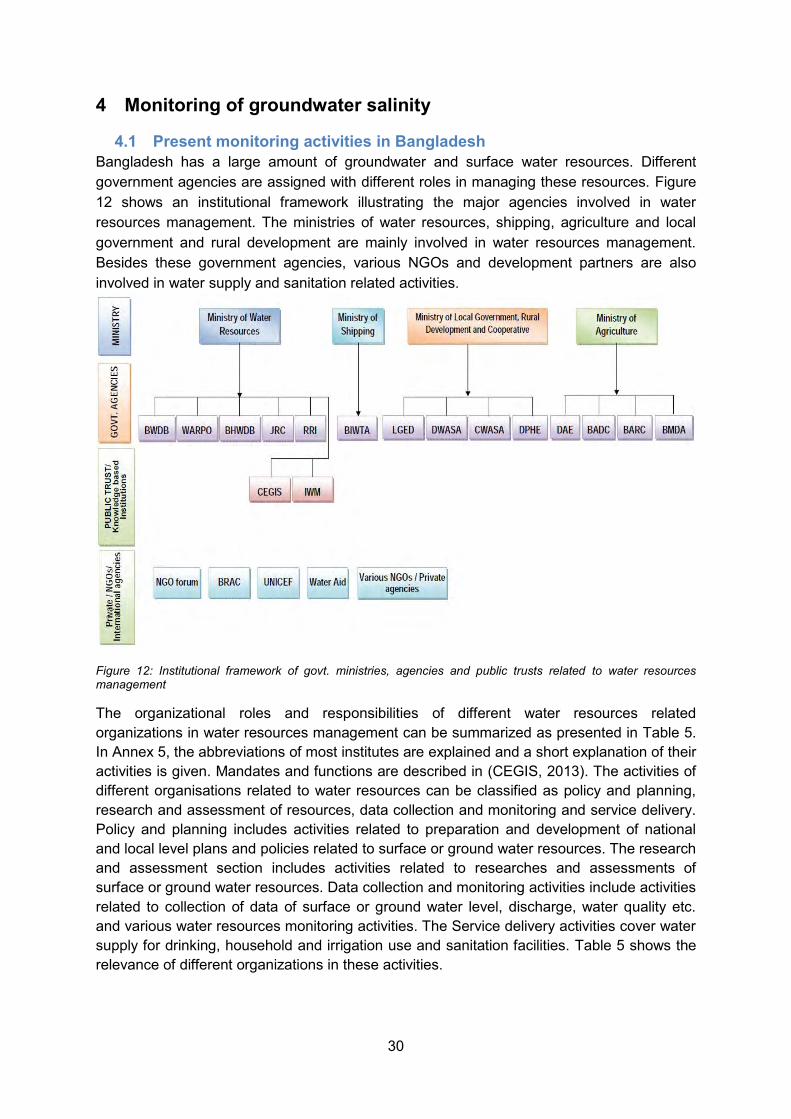
4.1 Present monitoring activities in Bangladesh Bangladesh has a large amount of groundwater and surface water resources. Different government agencies are assigned with different roles in managing these resources. Figure 12 shows an institutional framework illustrating the major agencies involved in water resources management. The ministries of water resources, shipping, agriculture and local government and rural development are mainly involved in water resources management. Besides these government agencies, various NGOs and development partners are also involved in water supply and sanitation related activities.
Figure 12: Institutional framework of govt. ministries, agencies and public trusts related to water resources management
The organizational roles and responsibilities of different water resources related organizations in water resources management can be summarized as presented in Table 5. In Annex 5, the abbreviations of most institutes are explained and a short explanation of their activities is given. Mandates and functions are described in (CEGIS, 2013). The activities of different organisations related to water resources can be classified as policy and planning, research and assessment of resources, data collection and monitoring and service delivery. Policy and planning includes activities related to preparation and development of national and local level plans and policies related to surface or ground water resources. The research and assessment section includes activities related to researches and assessments of surface or ground water resources. Data collection and monitoring activities include activities related to collection of data of surface or ground water level, discharge, water quality etc. and various water resources monitoring activities. The Service delivery activities cover water supply for drinking, household and irrigation use and sanitation facilities. Table 5 shows the relevance of different organizations in these activities.

31
Table 5: Involvement of govt. institutions in different aspects of water management (- = involvement)
Organisation Surface water Ground water
Pol
icy
and
P
lann
ing
Res
earc
h/
Ass
essm
ent
Dat
a co
llect
ion
and
Mon
itorin
g
Ser
vice
del
iver
y
Pol
icy
and
P
lann
ing
Res
earc
h/
Ass
essm
ent
Dat
a co
llect
ion
and
Mon
itorin
g
Ser
vice
del
iver
y
WARPO BWDB JRC BHWDB RRI DPHE LGED DWASA and CWASA BIWTA BADC BARC BARI DAE BMDA CEGIS IWM Private sector/ NGOs
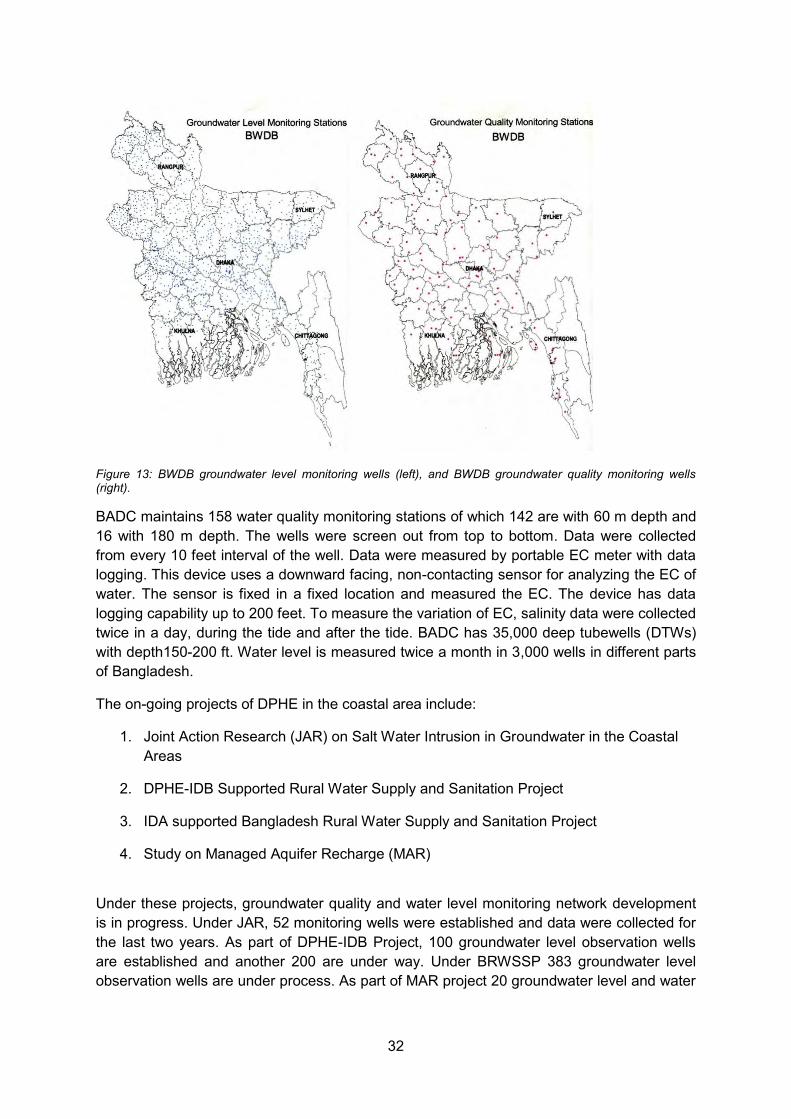
For groundwater data collection and monitoring BWDB, DPHE, BADC and BMDA are the main government agencies. BWDB maintains 1250 water level monitoring stations around Bangladesh. It also maintains borelog data and aquifer properties data of different parts of Bangladesh. BWDB also monitors groundwater quality in selected wells (Figure 13).
32
Figure 13: BWDB groundwater level monitoring wells (left), and BWDB groundwater quality monitoring wells (right).
BADC maintains 158 water quality monitoring stations of which 142 are with 60 m depth and 16 with 180 m depth. The wells were screen out from top to bottom. Data were collected from every 10 feet interval of the well. Data were measured by portable EC meter with data logging. This device uses a downward facing, non-contacting sensor for analyzing the EC of water. The sensor is fixed in a fixed location and measured the EC. The device has data logging capability up to 200 feet. To measure the variation of EC, salinity data were collected twice in a day, during the tide and after the tide. BADC has 35,000 deep tubewells (DTWs) with depth150-200 ft. Water level is measured twice a month in 3,000 wells in different parts of Bangladesh.
The on-going projects of DPHE in the coastal area include:
1. Joint Action Research (JAR) on Salt Water Intrusion in Groundwater in the Coastal Areas
2. DPHE-IDB Supported Rural Water Supply and Sanitation Project
3. IDA supported Bangladesh Rural Water Supply and Sanitation Project
4. Study on Managed Aquifer Recharge (MAR)
Under these projects, groundwater quality and water level monitoring network development is in progress. Under JAR, 52 monitoring wells were established and data were collected for the last two years. As part of DPHE-IDB Project, 100 groundwater level observation wells are established and another 200 are under way. Under BRWSSP 383 groundwater level observation wells are under process. As part of MAR project 20 groundwater level and water

33
chemistry monitoring wells were established and 80 are underway. DPHE have no particular fixed monitoring wells. From union level they collect lowest water level once in a year.
BMDA (Barind Multipurpose Development Authority) in Rajshahi area has 14,000 deep tube wells (DTWs) for irrigation. Some are monitored for water levels.
All this data should be centralized in the National Water Database under the coordination of the Water Resource Planning Organisation (WARPO), which is a government organisation with the mandate to collect, coordinate and disseminate all water related data.
4.2 Outcome of the monitoring workshop As one of the activities of this project, a groundwater quality monitoring workshop was organised in Bangladesh in June, 8-10, 2014. The objectives of the groundwater quality monitoring workshop were to suggest: a. the parameters that need to be monitored, b. the frequency of monitoring of those parameters; and c. the possible location of monitoring wells in the coastal area. After the workshop, a fieldwork was conducted to demonstrate how easily some health related water quality parameters can be monitored instantly in the field by non-technical people with a field kit.
A total of 17 participants joined in the groundwater quality monitoring workshop which was held at Department of Public Health Engineering (DPHE) head office in Dhaka. Five participants were from DPHE, two from BRAC University, two from BRAC WASH program, two from BWDB, two from BADC, and one each from NGO Forum, Asia Arsenic Network (AAN), Water Aid, Geological Survey of Bangladesh and Jahangirnagar University.
The groundwater quality monitoring workshop and fieldwork was successful in drawing attention from the participants. Most of the participants actively took part in the discussion. They were highly enthusiastic about developing a systematic network for monitoring salinity and other parameters in the coastal area of Bangladesh. The conclusion of the workshop was that the data obtained from monitoring should be available to all users and there should be co-ordination among monitoring agencies. The workshop decided to make a proposal to Director General of WARPO and Dutch Embassy in Dhaka to support WARPO with their initiative to collect and disseminate all water related data. Later on, these recommendations were presented in the meeting of LCG WSS Sub-group for Water Supply and Sanitation sector in Dhaka held on the 3rd of September of 2014.
4.3 Monitoring techniques A number of technologies are available to monitor groundwater salinity, each of them useful depending on the objective of the monitoring exercise (de Louw et al., 2011; Goes et al., 2009; Pauw, 2011; Reynolds, 1997). In SWIBANGLA, two special practical methods were promoted: a. A Water Quality Field Kit (see technique number 9) and b. The SWAPP; a smart phone application to measure salinity (see technique number 10).
In the following paragraphs the most relevant monitoring tecniques are described:
1 Vertical Electrical Sounding (VES) In many cases the subsurface is heterogeneous. Therefore, the measured resistivity of the subsurface is an apparent resistivity (ρ a ), composed of multiple units having a specific resistivity (ρ s ). A vertical electrical sounding (VES) measurement can be performed to

34
obtain a layer model, where each layer has its own specific resistivity. First, the resistivity is measured with a small current electrode distance. Upon an increase of the current electrodes, the bulk of the current will be distributed over a larger (vertical) extend. Different electrode configurations exist, but the most appropriate and most generally applied one is the Schlumberger configuration. For more information on other configurations see for example Reynolds (1997). In the Schlumberger configuration, the distance of the potential electrodes (MN) is no more than one fifth of the half the distance of the current electrodes (AB). A so called sounding curve, where the apparent resistivity values are plotted as a function of half the current electrode separation (AB) on a double log scale, can then be constructed from the different electrode distance measurements. From this sounding curve, a layer model can be derived. This is generally done by computer models, which can construct an n-layered model where each model layer has a thickness and an specific resistivity. This however, introduces equivalence problems as the signal can be the result different combinations of layer depth and specific resistance.
Figure 14: Set up of a VES measurement at the beach. Four reels of wire are used to connect the measurement unit (the orange device) to the current and potential electrodes.
2 TEC-probe A TEC-probe (Temperature - Electrical Conductivity) is suitable for manual 1-D measurements of temperature and the electrical conductivity (ECsoil) of soft soils like peat and clayey soils. The electrodes and temperature sensor are located at the far end of the probe. The probe has a diameter of 22mm and the electrode distance is 50mm.
35
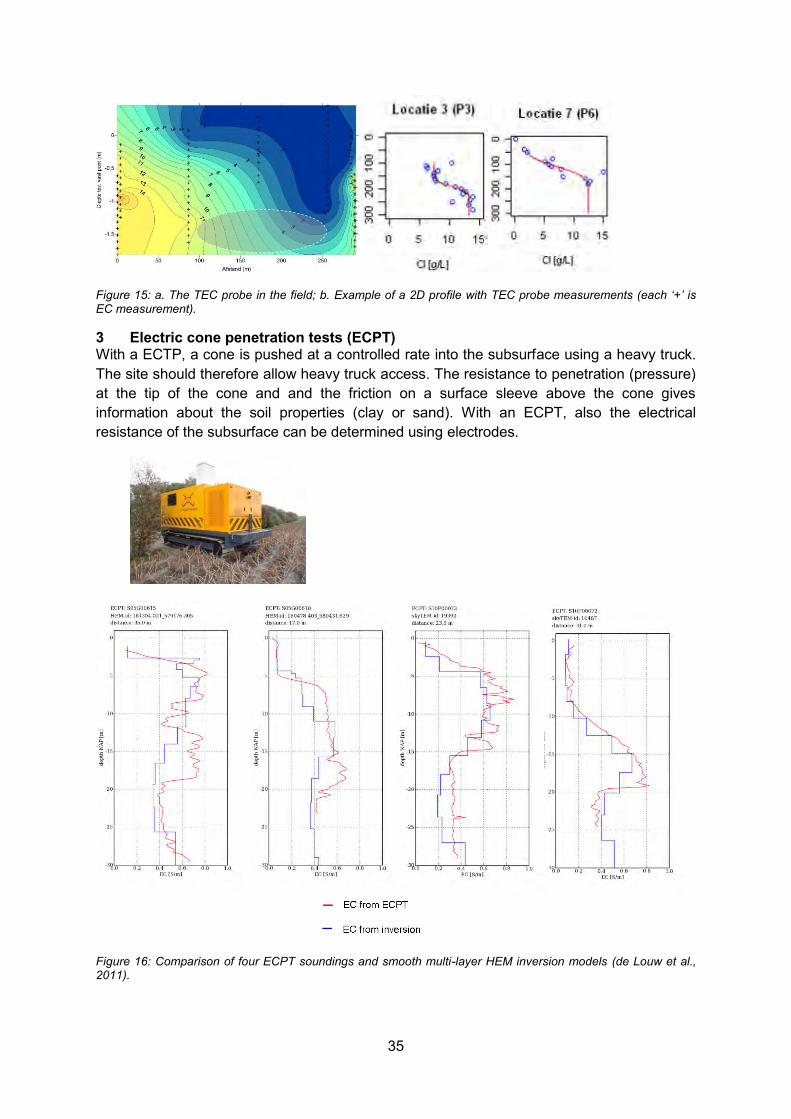
Figure 15: a. The TEC probe in the field; b. Example of a 2D profile with TEC probe measurements (each ‘+’ is EC measurement).
3 Electric cone penetration tests (ECPT) With a ECTP, a cone is pushed at a controlled rate into the subsurface using a heavy truck. The site should therefore allow heavy truck access. The resistance to penetration (pressure) at the tip of the cone and and the friction on a surface sleeve above the cone gives information about the soil properties (clay or sand). With an ECPT, also the electrical resistance of the subsurface can be determined using electrodes.
Figure 16: Comparison of four ECPT soundings and smooth multi-layer HEM inversion models (de Louw et al., 2011).
36
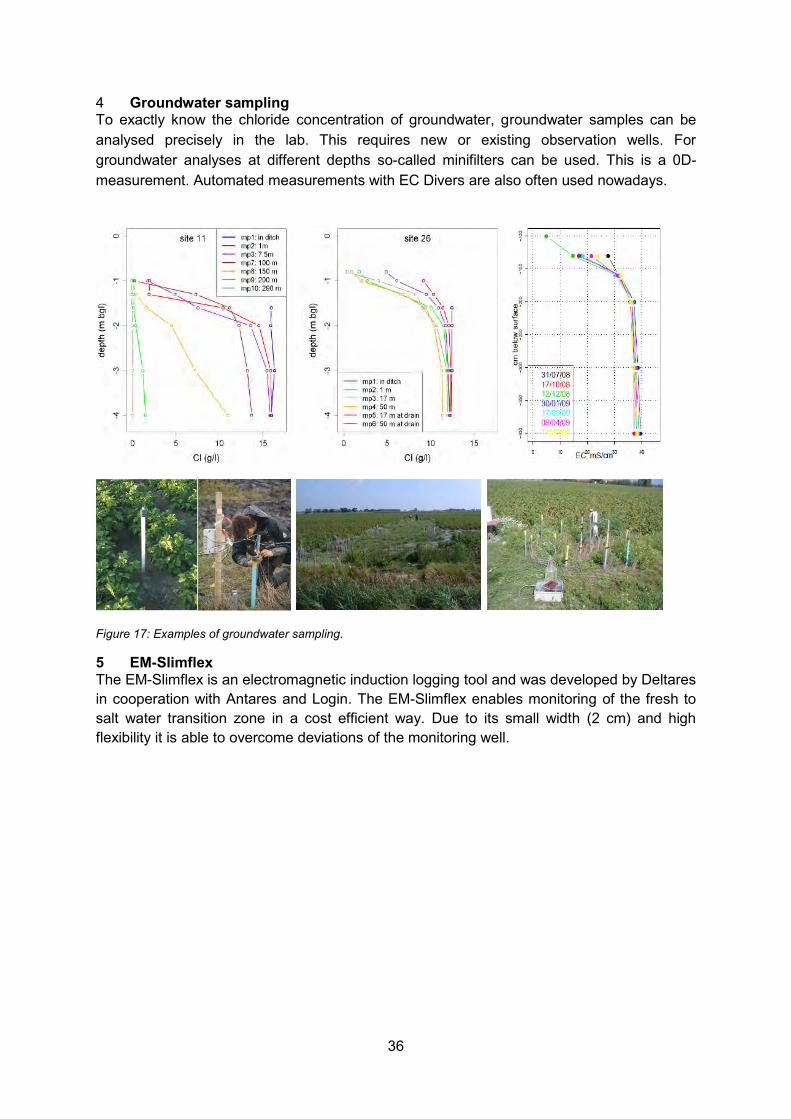
4 Groundwater sampling To exactly know the chloride concentration of groundwater, groundwater samples can be analysed precisely in the lab. This requires new or existing observation wells. For groundwater analyses at different depths so-called minifilters can be used. This is a 0D-measurement. Automated measurements with EC Divers are also often used nowadays.
Figure 17: Examples of groundwater sampling.
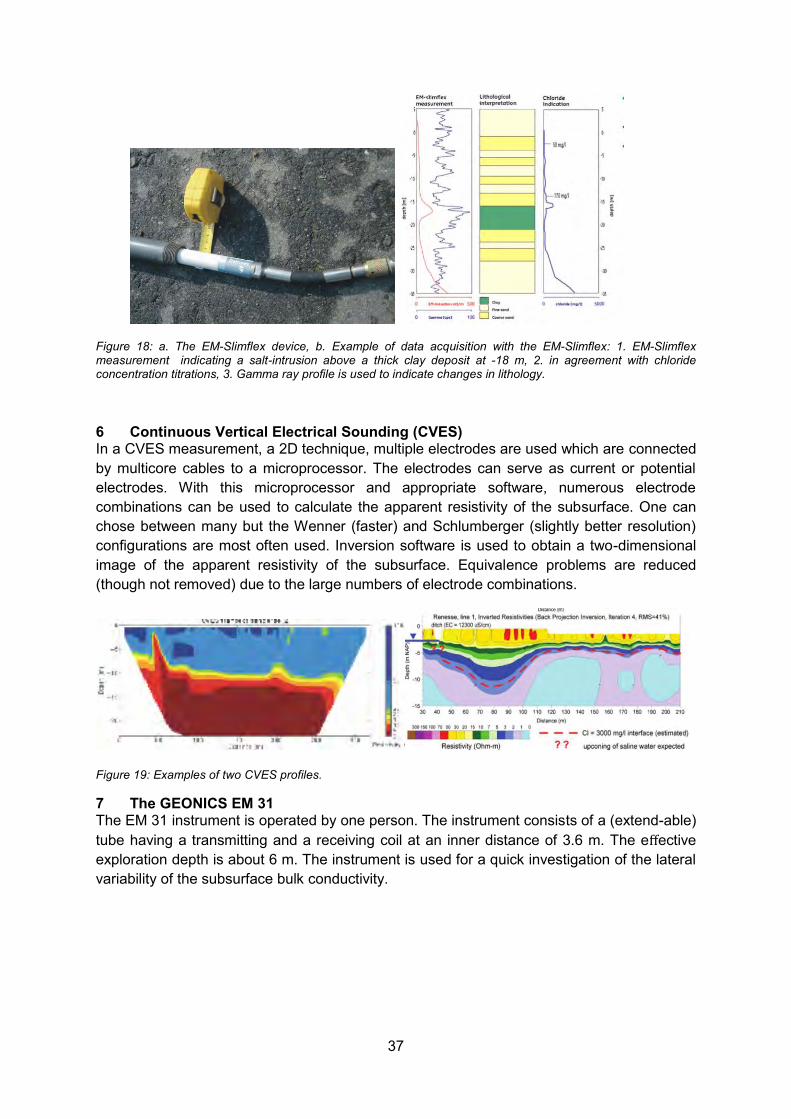
5 EM-Slimflex The EM-Slimflex is an electromagnetic induction logging tool and was developed by Deltares in cooperation with Antares and Login. The EM-Slimflex enables monitoring of the fresh to salt water transition zone in a cost efficient way. Due to its small width (2 cm) and high flexibility it is able to overcome deviations of the monitoring well.
37
Figure 18: a. The EM-Slimflex device, b. Example of data acquisition with the EM-Slimflex: 1. EM-Slimflex measurement indicating a salt-intrusion above a thick clay deposit at -18 m, 2. in agreement with chloride concentration titrations, 3. Gamma ray profile is used to indicate changes in lithology.
6 Continuous Vertical Electrical Sounding (CVES) In a CVES measurement, a 2D technique, multiple electrodes are used which are connected by multicore cables to a microprocessor. The electrodes can serve as current or potential electrodes. With this microprocessor and appropriate software, numerous electrode combinations can be used to calculate the apparent resistivity of the subsurface. One can chose between many but the Wenner (faster) and Schlumberger (slightly better resolution) configurations are most often used. Inversion software is used to obtain a two-dimensional image of the apparent resistivity of the subsurface. Equivalence problems are reduced (though not removed) due to the large numbers of electrode combinations.
Figure 19: Examples of two CVES profiles.
7 The GEONICS EM 31 The EM 31 instrument is operated by one person. The instrument consists of a (extend-able) tube having a transmitting and a receiving coil at an inner distance of 3.6 m. The effective exploration depth is about 6 m. The instrument is used for a quick investigation of the lateral variability of the subsurface bulk conductivity.

38
Figure 20: a. EM 31 instrument in an agricultural field, b. Some results (de Louw et al., 2011).
8 Airborne geophysics Airborne Electromagnetic (AEM) geophysical techniques can be used to determine the resistance of the substrate in the ground, viz. a combination of geology and groundwater salinity together. In a short time, an image can be formed for entire region. Advantages of this technique are the fast collection of data and a 3D result of the resistance of the substrate, and (with the aid of a accurate 3D geologic model) a freshwater-saltwater distribution of the groundwater. After several years, this measurement could be repeated to see trends in freshening and salinization of the groundwater system. Two types of techniques are described: HEM and TDEM (Sengpiel and Siemon, 2000; Siemon et al., 2009):
Helicopter-borne frequency-domain electromagnetic (HEM) systems use a towed installation with small transmitter and receiver coils (about 50 cm). The system RESOLVE (Fugro Airborne surveys) operated by BGR (Federal Institute for Geosciences and Natural Resources, Germany) serves as an example here. This system makes use of five pairs of transmitting and receiving coil and frequency combinations. In this way, the electrical conductivity of the subsurface in three dimensions can be measured by application of inversion techniques. The exploration depth depends on the resistivity of the subsurface. In relatively resistive terrain, up to 150 m can be detected, while this is much lower in conductive terrain. Large areas can be covered through times; a sampling distance of 4 m can be performed at a flight velocity of 140 km/h.
In time domain methods, a DC is transmitted through a large loop of wire. The flow of current will create a primary magnetic field. When the current is sharply (though controlled) switched off, the change in magnetic field will create currents within the subsurface. These currents dissipate due to the resistance of the subsurface, and create a secondary magnetic field which thus changes over time. In a receiving coil, this change (decay) in magnetic field in measured over time. The change depends of the resistivity distribution of the subsurface. An advantage of the method is that the transmitting loop can be used as a receiving loop.

39
Figure 21: Impressions of Airborne Electromagnetic (AEM) geophysical techniques: a. the two techniques HEM and TDEM, b. HEM airborne, c. a map of freshwater lens thickness (de Louw et al., 2011), d. the ‘bird’ of HEM grounded.
9 Water Quality Field Kit The Water Quality Field Kit is a kit containing. various cost-effective monitoring techniques to measure different parameters such as electrical conductivity of water (EC), pH, nitrate, coliform bacteria, nitrate and bicarbonate.
Figure 22: Water Quality Monitoring Kit.
40
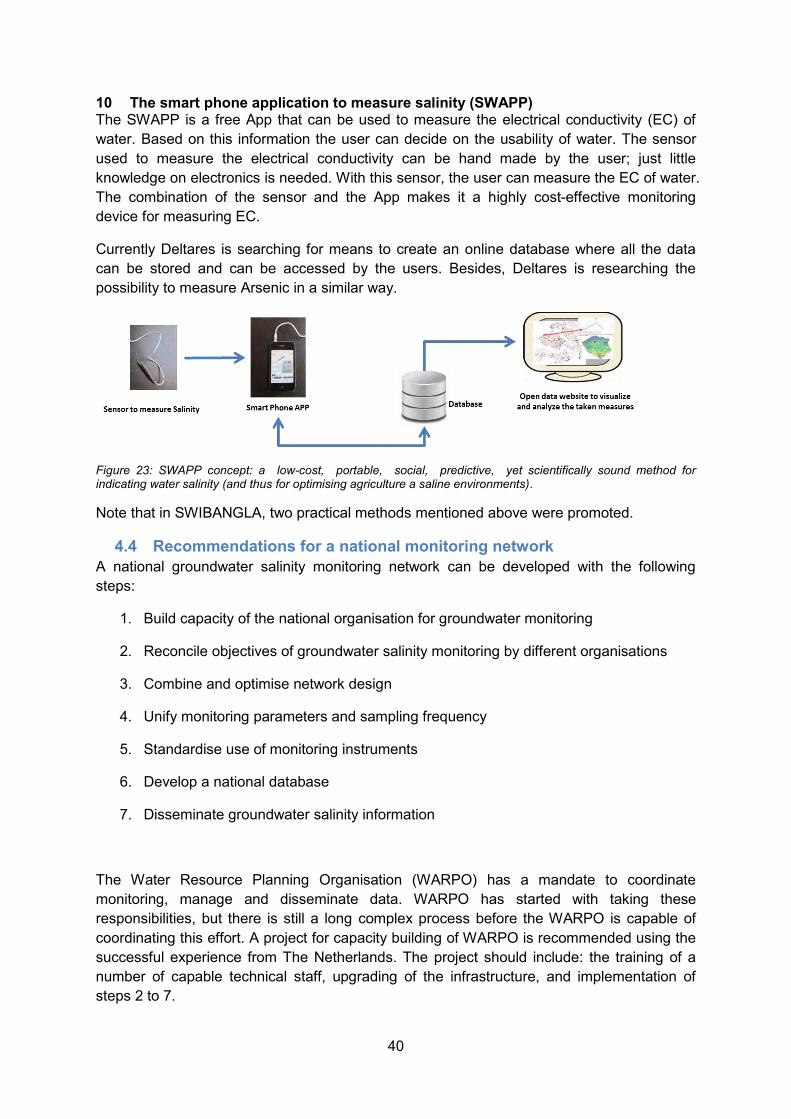
10 The smart phone application to measure salinity (SWAPP) The SWAPP is a free App that can be used to measure the electrical conductivity (EC) of water. Based on this information the user can decide on the usability of water. The sensor used to measure the electrical conductivity can be hand made by the user; just little knowledge on electronics is needed. With this sensor, the user can measure the EC of water. The combination of the sensor and the App makes it a highly cost-effective monitoring device for measuring EC.
Currently Deltares is searching for means to create an online database where all the data can be stored and can be accessed by the users. Besides, Deltares is researching the possibility to measure Arsenic in a similar way.
Figure 23: SWAPP concept: a low-cost, portable, social, predictive, yet scientifically sound method for indicating water salinity (and thus for optimising agriculture a saline environments).
Note that in SWIBANGLA, two practical methods mentioned above were promoted.
4.4 Recommendations for a national monitoring network A national groundwater salinity monitoring network can be developed with the following steps:
1. Build capacity of the national organisation for groundwater monitoring
2. Reconcile objectives of groundwater salinity monitoring by different organisations
3. Combine and optimise network design
4. Unify monitoring parameters and sampling frequency
5. Standardise use of monitoring instruments
6. Develop a national database
7. Disseminate groundwater salinity information
The Water Resource Planning Organisation (WARPO) has a mandate to coordinate monitoring, manage and disseminate data. WARPO has started with taking these responsibilities, but there is still a long complex process before the WARPO is capable of coordinating this effort. A project for capacity building of WARPO is recommended using the successful experience from The Netherlands. The project should include: the training of a number of capable technical staff, upgrading of the infrastructure, and implementation of steps 2 to 7.

41
Organisations for groundwater salinity monitoring may have different objectives. For example, BWDB is interested in groundwater salinity distributions and changes over time. BADC focuses on soil salinity in relation to groundwater and irrigation water salinity. DPHE wants to know suitability of groundwater as a drinking water source. BRAC WASH needs to monitor if groundwater salinity in production wells satisfies drinking water standard. These organisations should together prepare a list of objectives for a united national groundwater salinity monitoring network.
Locations and depth of existing monitoring wells from all organisations must be collected and analysed to determine if a simple combination of all existing observation wells can meet the objectives defined in step 2. Geostatistical method (such as Kriging interpolation method) and groundwater salinity model may be used to optimise monitoring network design. A priority list of installing new observation wells should be prepared and installed in phases.
Time series of historical measurements of groundwater salinity should be analysed. The analysis may find correlations between different water quality parameters and patterns of salinity changes. These are basis to select a set of minimum parameters and sampling frequency for monitoring.
All monitoring organisations should use the same or comparable instruments. A number of potential instruments have been described in section 4.3.
A national groundwater database should be also developed for groundwater data management and information dissemination. Successful experiences in database management in The Netherlands can be adapted in establishing a national groundwater database and information system in Bangladesh.
Finally, data from the database should be made freely available for universities and research organisations. Information gained from data analysis should be provided to water management organisations timely for informed decision-making.
42
5 Modelling of salt water intrusion
Regional models for variable-density groundwater flow and coupled salt are used tools to understand the dynamics of the groundwater system and the salinization processes taking place (Cobaner et al., 2012; Faneca Sànchez et al., 2012; Nocchi and Salleolini, 2013; Oude Essink, 2001a; Oude Essink et al., 2010; Pauw et al., 2014, 2012; Sulzbacher et al., 2012; Vandenbohede et al., 2008). These models are also used to assess the impacts of climate change, or the efficiency and effectiveness of measures to counteract salinization. Their regional character does not make them suitable to zoom in local processes such as assessing local effects of Aquifer Storage and Recovery measures; they are rather appropriate to simulate regional processes, understand general trends in fresh groundwater reserves, groundwater aging, water balance budgets and regional salinization assessment under the pressure of global and climate change. The models can also be used to point out areas that need specific attention or further investigation.
It is important to notice that in coastal areas where a large part of the groundwater is saline, groundwater models must include the density term as well as the salt transport in order to simulate correctly the proper functioning of the groundwater system. If the models in salt-fresh environments do not account for density differences and salt transport, the simulated heads and fluxes might enclose significant errors (De Lange et al., 2014), and the behavior of the coastal groundwater system will be understood wrongly.
As confirmed during the fact finding mission, at the start of the SWIBANGLA project there was no regional 3D variable-density groundwater flow and coupled salt transport model of this coastal area of Bangladesh. The objective of this project wasto better understand the groundwater system, and this model can be used as a decision support tool to secure drink water supply, now and in the future. Within the project the first version of a regional 3D variable-density groundwater flow model of the coastal zone of Bangladesh was built with the purpose:
1. to better understand and visualize the regional groundwater dynamics and relevant salinity processes in Bangladesh, focusing on lateral surface salt water intrusion, lateral saline groundwater intrusion, vertical upconing under abstraction and low-lying areas and infiltration of salt water due to inundations caused by storm surges,
2. to provide DPHE (and other Bangladeshi water managers and universities) with an instrument for their mandates on secure water supply, now and in the future, within the context of the on-going evolution of groundwater salinization,
3. to assess the impact of global and climate change scenarios (including the effect of sea level rise), and
4. to give future local models correct boundary conditions.
For the understanding of the reader, it is stressed that this model is a first set up and it is not meant to answer all questions related to salinization processes in Bangladesh, but to do a preliminary assessment of the groundwater system. However, this model can be used as a basis for future regional modelling efforts, such as improvements on water systems concepts, data amount, computer speed, etc.

43
Note that a model is only a simplification of the reality; basically it is only a tool, not a purpose on itself. Field data is essential, otherwise the data-result connection of a model is just “Garbage in=Garbage out”. A model can be used as a database to store your different types of data and makes analysis of very complex systems possible. It is also often a tool of communication between scientist and stakeholder. Results of piezometric heads, velocities, salt transport can be discussed and perceptions of the groundwater system are confirmed or excluded. It is good to understand many types to errors can arise during the modelling process: wrong model concepts (e.g., important resistance layers are not included in the model); incomplete equations (e.g., geochemical processes are not considered in the fresh-brackish-salt groundwater evolution); inaccurate parameters and variables (e.g. wrong solute mixing parameters (dispersivities), inappropriate assessment of hydraulic conductivities, wrong interaction with surface water); errors in the computer code; as well as numerical inaccuracies (improper spatial x and temporal t choices, leading to numerical dispersion, oscillations and truncation errors).
5.1 Model structure and inputs The area of interest is the one described in section 0, however, in order to avoid the effects of the boundaries in the area of interest, the model is horizontally extended and occupies a larger area than the area of direct interest. Figure 24 shows the model extent and the study area. The total model domain covers an area of 274x317 = 86858 km2.
Model discretization
The horizontal resolution of all model cells is 1000m by 1000m. This cell resolution was chosen to find a compromise between the goal of the model and computing requirements of the model. The model extent is 274x317 km2, which amounts to 274 columns and 317 rows in the model domain (Figure 24).
Figure 24: a. Location of the area within Bangladesh, including (in blue) the flooding area in case of a sea level rise of 2m (http://flood.firetree.net), b. Illustration of total model domain and the area of interest (within black border): the central coastal plane of Bangladesh. The legend shows the digital elevation in meters above mean sea level.
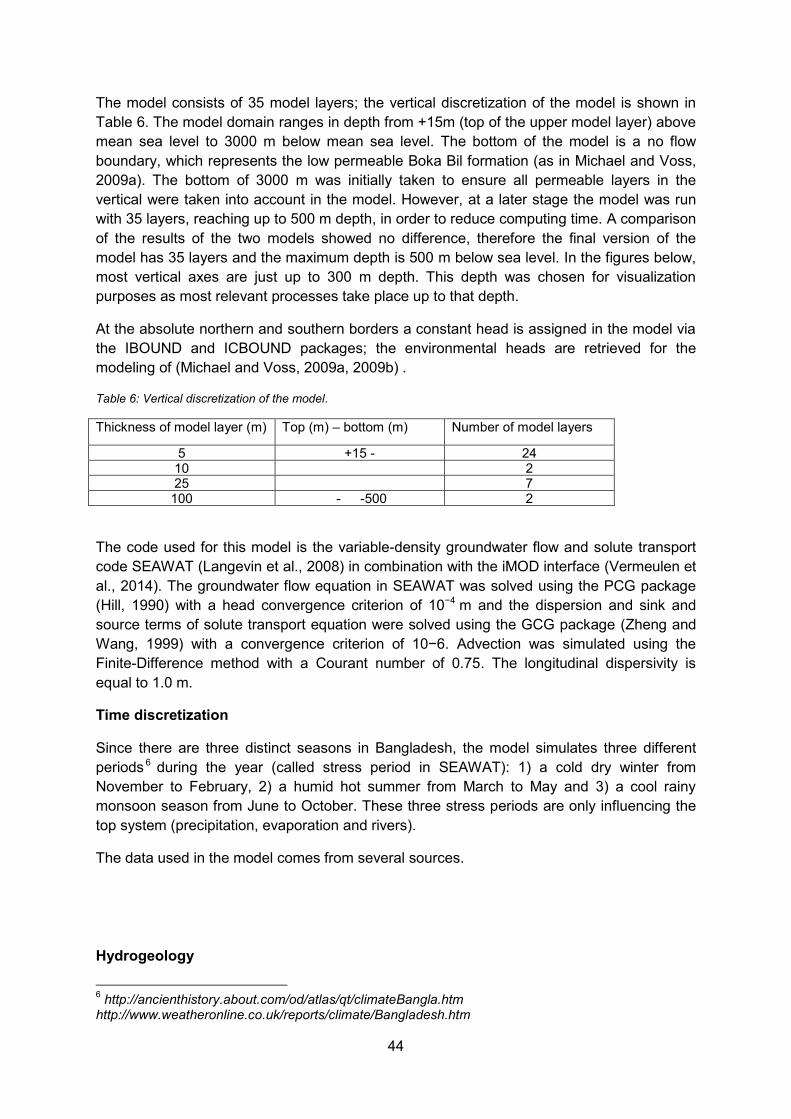
44
The model consists of 35 model layers; the vertical discretization of the model is shown in Table 6. The model domain ranges in depth from +15m (top of the upper model layer) above mean sea level to 3000 m below mean sea level. The bottom of the model is a no flow boundary, which represents the low permeable Boka Bil formation (as in Michael and Voss, 2009a). The bottom of 3000 m was initially taken to ensure all permeable layers in the vertical were taken into account in the model. However, at a later stage the model was run with 35 layers, reaching up to 500 m depth, in order to reduce computing time. A comparison of the results of the two models showed no difference, therefore the final version of the model has 35 layers and the maximum depth is 500 m below sea level. In the figures below, most vertical axes are just up to 300 m depth. This depth was chosen for visualization purposes as most relevant processes take place up to that depth.
At the absolute northern and southern borders a constant head is assigned in the model via the IBOUND and ICBOUND packages; the environmental heads are retrieved for the modeling of (Michael and Voss, 2009a, 2009b) .
Table 6: Vertical discretization of the model.
Thickness of model layer (m) Top (m) – bottom (m) Number of model layers
5 +15 - 24 10 2 25 7 100 - -500 2
The code used for this model is the variable-density groundwater flow and solute transport code SEAWAT (Langevin et al., 2008) in combination with the iMOD interface (Vermeulen et al., 2014). The groundwater flow equation in SEAWAT was solved using the PCG package (Hill, 1990) with a head convergence criterion of 10−4 m and the dispersion and sink and source terms of solute transport equation were solved using the GCG package (Zheng and Wang, 1999) with a convergence criterion of 10−6. Advection was simulated using the Finite-Difference method with a Courant number of 0.75. The longitudinal dispersivity is equal to 1.0 m.
Time discretization
Since there are three distinct seasons in Bangladesh, the model simulates three different periods 6 during the year (called stress period in SEAWAT): 1) a cold dry winter from November to February, 2) a humid hot summer from March to May and 3) a cool rainy monsoon season from June to October. These three stress periods are only influencing the top system (precipitation, evaporation and rivers).
The data used in the model comes from several sources.
Hydrogeology
6 http://ancienthistory.about.com/od/atlas/qt/climateBangla.htm http://www.weatheronline.co.uk/reports/climate/Bangladesh.htm
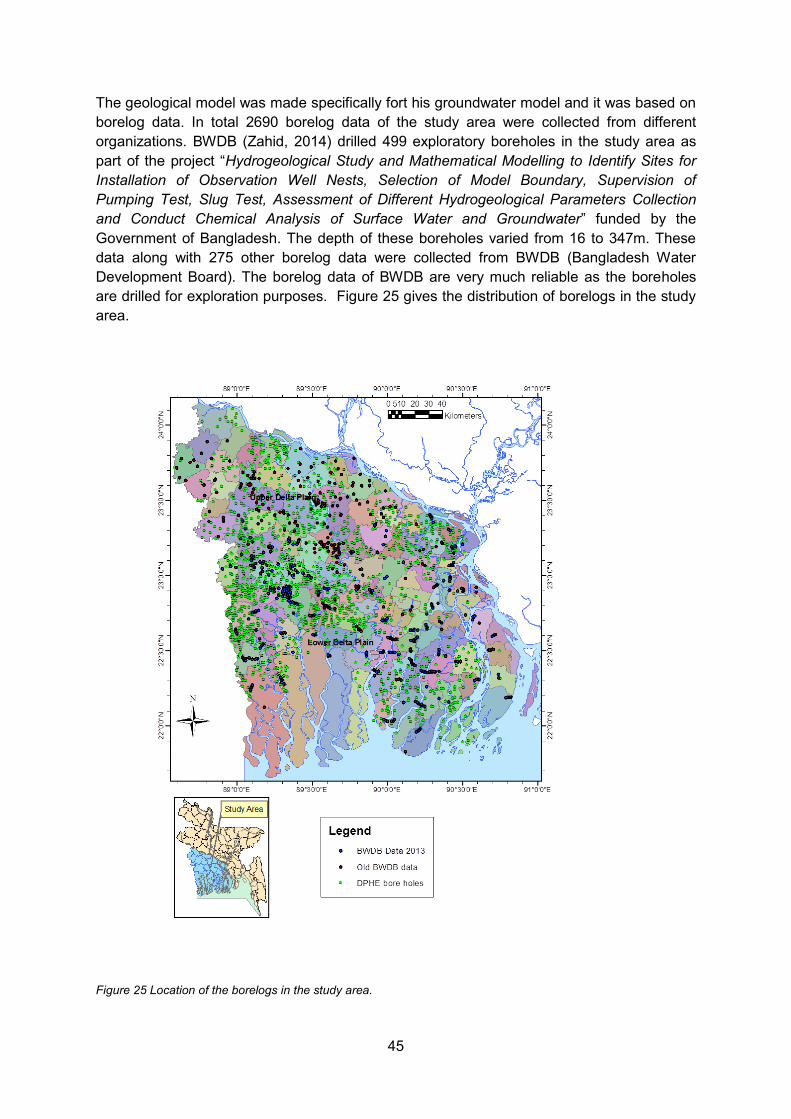
45
The geological model was made specifically fort his groundwater model and it was based on borelog data. In total 2690 borelog data of the study area were collected from different organizations. BWDB (Zahid, 2014) drilled 499 exploratory boreholes in the study area as part of the project “Hydrogeological Study and Mathematical Modelling to Identify Sites for Installation of Observation Well Nests, Selection of Model Boundary, Supervision of Pumping Test, Slug Test, Assessment of Different Hydrogeological Parameters Collection and Conduct Chemical Analysis of Surface Water and Groundwater” funded by the Government of Bangladesh. The depth of these boreholes varied from 16 to 347m. These data along with 275 other borelog data were collected from BWDB (Bangladesh Water Development Board). The borelog data of BWDB are very much reliable as the boreholes are drilled for exploration purposes. Figure 25 gives the distribution of borelogs in the study area.
Figure 25 Location of the borelogs in the study area.

46
From the website (http://www.dphe.gov.bd/aquifer/index.php/borelog) of the Department of Public Health Engineering (DPHE) 1916 borelogs were downloaded. RockWorks 15® software was used for analyzing borehole data. Borelog for each borehole was carefully divided into aquifers and aquitards depending on the lithology. It is mentioned here that the whole area up to the depth of 300 m is composed mainly of clay, silt, sand and occasional gravel. Some peat layers were encountered in a small number of boreholes. Layers with high content of clay and silt were considered as aquitard (non-screen able part) whereas layers dominantly composed of very fine sand, fine sand, medium sand, coarse sand and gravel are considered as aquifer (screen-able part).
There are 16 districts in the study area which constitute 124 subdistricts or ‘Upazilas’. For each Upazila two sets of 3D geological models, panel diagram and hydro-stratigraphic sections were constructed using RockWorks® 15. One set was constructed using BWDB borelogs and the other set with DPHE borelogs. However, for some Upazilas only one set of 3D model, panel diagram and hydro-stratigraphic sections were constructed because of the absence of data.
For each Upazila 40 layers were considered up to the depth of 300m. From 0 to 100m depth, 20 layers have been developed at the interval of 5m; and from 100 to 300m depth another 20 layers were developed, at the interval of 10m. By analyzing the 3D model, panel diagram and hydro-stratigraphic sections for each Upazila percentage of the area of the Upazila covered by aquitard or aquiclude (clay, silt or silty-clay) for each of the 40 layers is determined.
The layers containing information about the hydraulic conductivity of the lithology have been constructed using the layers mentioned above. An average horizontal and vertical hydraulic conductivity has been assigned to each Upazila and to each model layer. The value of the hydraulic conductivity assigned to each layer is a function of the percentage of clay and sand in the cell. The values are in accordance with studies such as Michael and Voss (2009b) and Sahu et al. (2013). Figure 26 demonstrates the spatial distribution of the horizontal hydraulic conductivities of the model. Deeper than 300m MSL, the hydraulic conductivity is set to 17m/d (BGS and DPHE, 2001; Michael and Voss, 2009a; Rahman and Ravenscroft, 2003). The anisotropy (horizontal versus vertical hydraulic conductivity) is equal to 1000 for the top 300m, which is in accordance with other work (e.g. Michael and Voss, 2009a, 2009b); for the deeper groundwater an anisotropy of 10 is implemented.
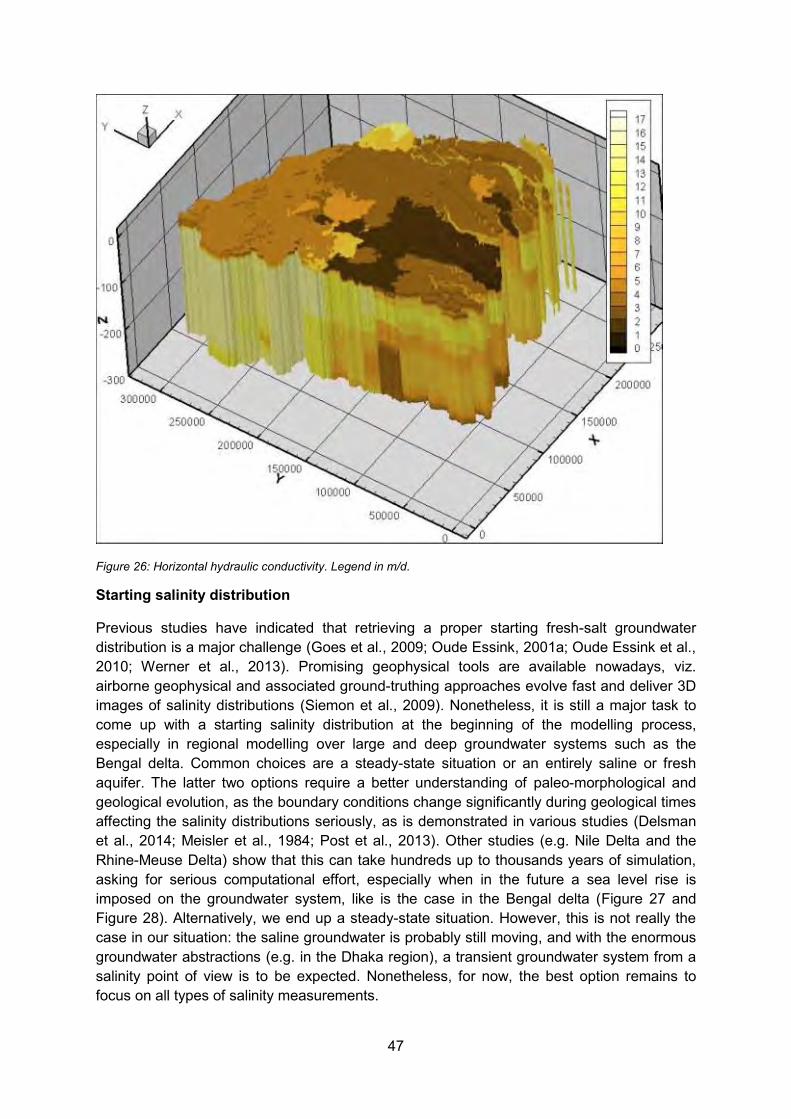
47
Figure 26: Horizontal hydraulic conductivity. Legend in m/d.
Starting salinity distribution
Previous studies have indicated that retrieving a proper starting fresh-salt groundwater distribution is a major challenge (Goes et al., 2009; Oude Essink, 2001a; Oude Essink et al., 2010; Werner et al., 2013). Promising geophysical tools are available nowadays, viz. airborne geophysical and associated ground-truthing approaches evolve fast and deliver 3D images of salinity distributions (Siemon et al., 2009). Nonetheless, it is still a major task to come up with a starting salinity distribution at the beginning of the modelling process, especially in regional modelling over large and deep groundwater systems such as the Bengal delta. Common choices are a steady-state situation or an entirely saline or fresh aquifer. The latter two options require a better understanding of paleo-morphological and geological evolution, as the boundary conditions change significantly during geological times affecting the salinity distributions seriously, as is demonstrated in various studies (Delsman et al., 2014; Meisler et al., 1984; Post et al., 2013). Other studies (e.g. Nile Delta and the Rhine-Meuse Delta) show that this can take hundreds up to thousands years of simulation, asking for serious computational effort, especially when in the future a sea level rise is imposed on the groundwater system, like is the case in the Bengal delta (Figure 27 and Figure 28). Alternatively, we end up a steady-state situation. However, this is not really the case in our situation: the saline groundwater is probably still moving, and with the enormous groundwater abstractions (e.g. in the Dhaka region), a transient groundwater system from a salinity point of view is to be expected. Nonetheless, for now, the best option remains to focus on all types of salinity measurements.

48
Figure 27: Sea-level changes during the last interglacial transition (BGS and DPHE, 2001; Pirazzoli, 1996),
Figure 28: Paleo-geographic maps illustrating Late Quaternary development of the Ganges–Brahmaputra delta (Goodbred and Kuehl, 2000), in combination with paleo sea level graph during the last 16k yr BP.
Chloride concentration or Electrical Conductivity data of groundwater with specific depth and geo-references are not readily available for the whole study area. For an explanation of the definition and units of salinity, see paragraph 0, on page 16. In the past, some Chloride concentration data was collected during the study of BGS and DPHE (2001), see Figure 29. However, BWDB (Zahid, 2014) has recently analysed chloride concentration in water of the

49
newly constructed wells of different depths in the study area as part of the project “Hydrogeological Study and Mathematical Modelling to Identify Sites for Installation of Observation Well Nests, Selection of Model Boundary, Supervision of Pumping Test, Slug Test, Assessment of Different Hydrogeological Parameters Collection and Conduct Chemical Analysis of Surface Water and Groundwater”, funded by the Government of Bangladesh. These data are highly reliable as they are generated in designated chemical laboratories.
Figure 29: a. Chloride distribution (in mg Cl-/l) groundwater from the BWDB Water-Quality Monitoring Network survey (BGS and DPHE, 2001), b. Electrical Conductivity map (in microSiemens per centimetre, µS/cm) at 35 meters depth established by the Bangladesh Agricultural Development Corporation (BADC, 2011) based on 100 observation wells with salinity measurements at a 10ft interval.
Different organizations (Dhaka University, Jahangirnagar University, Rajshahi University, Bangladesh Atomic Energy Commission, etc.) created geo-referenced chloride concentration data as part of regular research activities. The sampling dates of most of these data are within last 10 years.
DPHE also possesses a huge bulk of chloride data but in most cases they are not geo-referenced and the data are measured using a field test kit instead of the laboratory. Only for some chloride data, sampling depths were available.
BRAC under WASH program also generated 2525 chloride concentrations data, measured in the laboratory for 38 Upazilas in the study area. These data are not geo-referenced but the depth of the wells is recorded.
All the available georeference data were compiled and used to generate the 3D salinity distribution for the model. The data was divided in 4 depths: from 0 to 50 m, from 50 to 100 m, from 100 to 200 m and more than 200 m. There is no information of depths greater than 350 m. For the model, groundwater deeper than 300 m is assumed to be fresh, however, this assumption cannot be proved. A saline deeper layer could have significant consequences for the salinization of the fresh groundwater residing at 200 m depth. Therefore, it is of high importance that new monitoring wells at more depth are placed. The measurements available and the interpolated distributions can be seen in Figure 30:
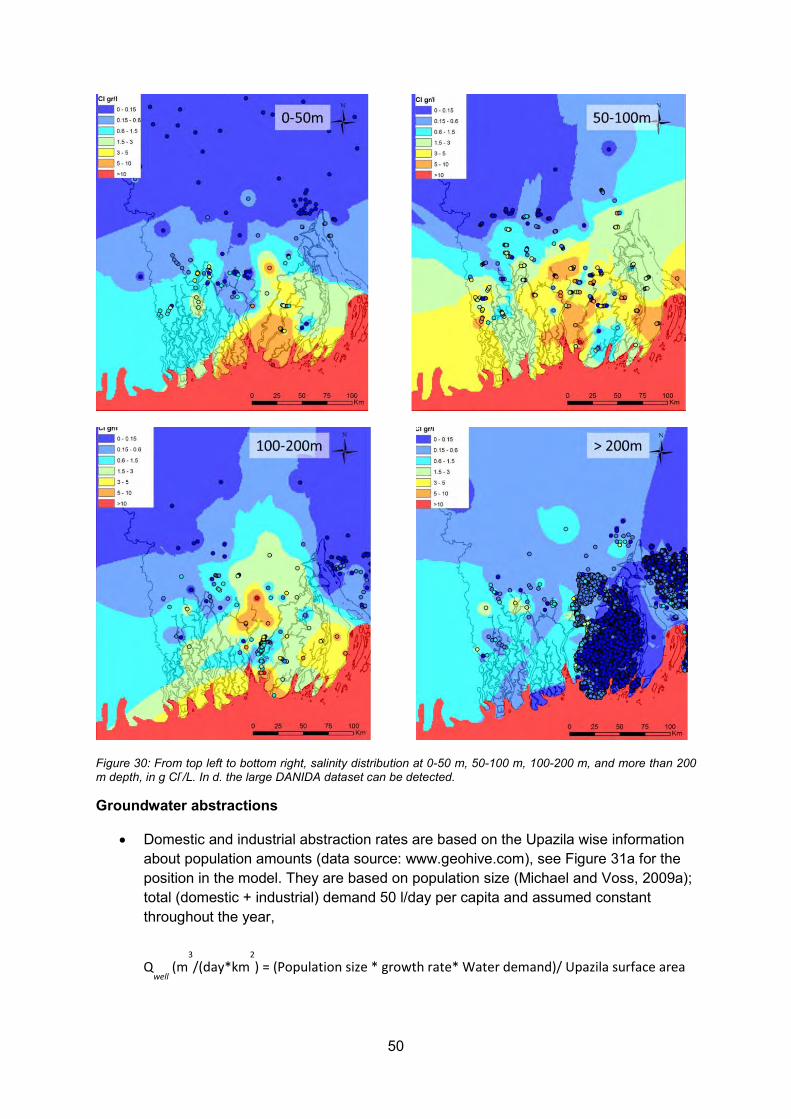
50
Figure 30: From top left to bottom right, salinity distribution at 0-50 m, 50-100 m, 100-200 m, and more than 200 m depth, in g Cl-/L. In d. the large DANIDA dataset can be detected.
Groundwater abstractions
Domestic and industrial abstraction rates are based on the Upazila wise information about population amounts (data source: www.geohive.com), see Figure 31a for the position in the model. They are based on population size (Michael and Voss, 2009a); total (domestic + industrial) demand 50 l/day per capita and assumed constant throughout the year,
Qwell
(m3
/(day*km2
) = (Population size * growth rate* Water demand)/ Upazila surface area

51
Irrigation abstraction rates are based on the district wise information about surface area irrigated by several techniques (data source: CEGIS), see Figure 31b for the position in the model. There is a distinction between wet season and dry season,
Irrigation rates are divided over the wet and dry season with a ratio of 5% to 95%,
Deep tube well depths range between 60-100 m (CEGIS; BGS; Mondal and Saleh, 2003) and shallow tube well depths range between 10-60 m (CEGIS; BGS; Mondal and Saleh, 2003),
Abstraction rates are interpolated in the model over these depths for model cells with a hydraulic conductivity higher than 0.005 m/day (note that in the model, groundwater abstraction from low permeable aquitards causes serious numerical problems by computing unrealistic low piezometric heads),
Deep tube well depths for domestic use are complemented with deep tube well data of DPHE.
Figure 31: Domestic and industrial abstractions (left) and abstractions for irrigation purposes during the dry season (right), all in (m3/(day*km2) as used in the model.
Recharge
Rainfall data of 1990-2008 at 82 locations is interpolated over the entire model area over the three stress periods, see Figure 32 for the spatial distribution in the model over the stress periods,
Evapotranspiration data of 1990-1998 at 4 locations is interpolated over the entire model area over the three stress periods using their average in each stress period,
The difference of rainfall and evapotranspiration will be added up to the model as recharge.
Qwell
(m3
/(day*km2
) = (Irrigated area * withdrawal rate) / district surface area

52
Figure 32: Groundwater recharge in the three stress periods of the model (note the legends are not equal).
Surface water
River water level data of 1990-2008 at 113 river station locations are separated over the three stress periods and have been interpolated over the rivers length,
River cross-section data of 1990-2008 at about 700 locations has been averaged per location and interpolated over the rivers length,
Salinity of surface water (in g TDS/L): source data from CEGIS and completed from DIVA-GIS (84 monitoring stations on salinity values), see Figure 33 for the locations and Figure 34 for the spatial salinity distribution throughout the model area. These values correspond with other studies (CSIRO, 2014; Winterwerp and Giardino, 2012).
Figure 33: Location of the surface salinity measurement points in the river system in the area.

53
Figure 34: The salinity distribution of the surface water system (in g TDS/L) during the three stress periods.
5.2 Model results In order to analyse the natural changes in the salinity distribution, the model was run for 2000 years in steady state with average yearly input and without anthropogenic stresses (viz. groundwater abstractions). During this run of 2000 years inconsistencies in the initial salinity distribution were removed and the model more or less reached a steady dynamic evolution in equilibrium with the boundary conditions. This salinity distribution was used as a starting distribution for the consequent model runs.
Based on the velocities retrieved from the modelling results, the lateral salt water intrusion from the sea as a natural phenomenon was found to be slow (of in the order of only one meter per year. Although traditional salt water intrusion is occurring in the coastal zone due to density effects (see the analytical expression in Oude Essink (2001b)) a salt water wedge is created in the groundwater system, but this wedge has a limited extent. This is mainly caused as a consequence of the serious groundwater flow from the north towards the sea, pushing back the intruded saline groundwater from the sea.
Figure 35: Examples of salt water wedges. The extent of the wedge is limited.
The upper delta seems to be fresh and stays fresh during the steady dynamic evolution of the salinity distribution, which is in equilibrium with the boundary condition. In the southern part, groundwater is brackish to saline from 10 up to 150 m, more in the western than in the eastern area (Figure 36 and Figure 37). This situation might be a consequence of the data entered in the model. There is a large amount of data available at more than 200 m depth
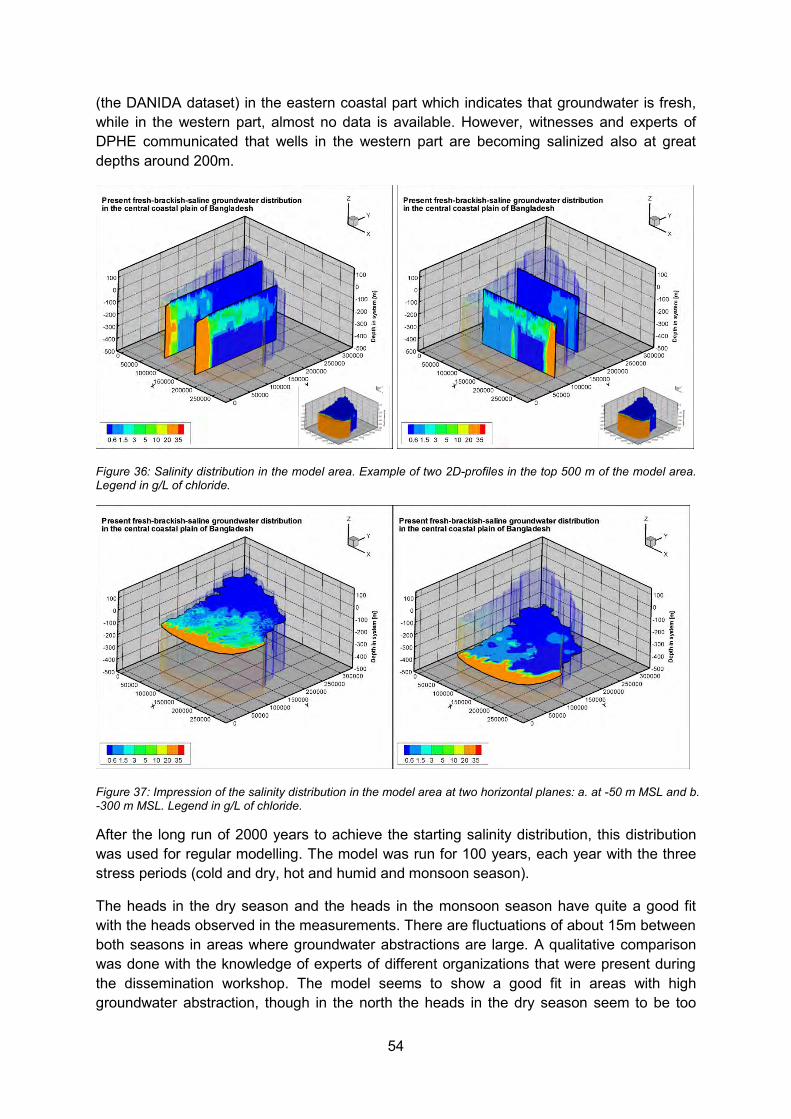
54
(the DANIDA dataset) in the eastern coastal part which indicates that groundwater is fresh, while in the western part, almost no data is available. However, witnesses and experts of DPHE communicated that wells in the western part are becoming salinized also at great depths around 200m.
Figure 36: Salinity distribution in the model area. Example of two 2D-profiles in the top 500 m of the model area. Legend in g/L of chloride.
Figure 37: Impression of the salinity distribution in the model area at two horizontal planes: a. at -50 m MSL and b. -300 m MSL. Legend in g/L of chloride.
After the long run of 2000 years to achieve the starting salinity distribution, this distribution was used for regular modelling. The model was run for 100 years, each year with the three stress periods (cold and dry, hot and humid and monsoon season).
The heads in the dry season and the heads in the monsoon season have quite a good fit with the heads observed in the measurements. There are fluctuations of about 15m between both seasons in areas where groundwater abstractions are large. A qualitative comparison was done with the knowledge of experts of different organizations that were present during the dissemination workshop. The model seems to show a good fit in areas with high groundwater abstraction, though in the north the heads in the dry season seem to be too
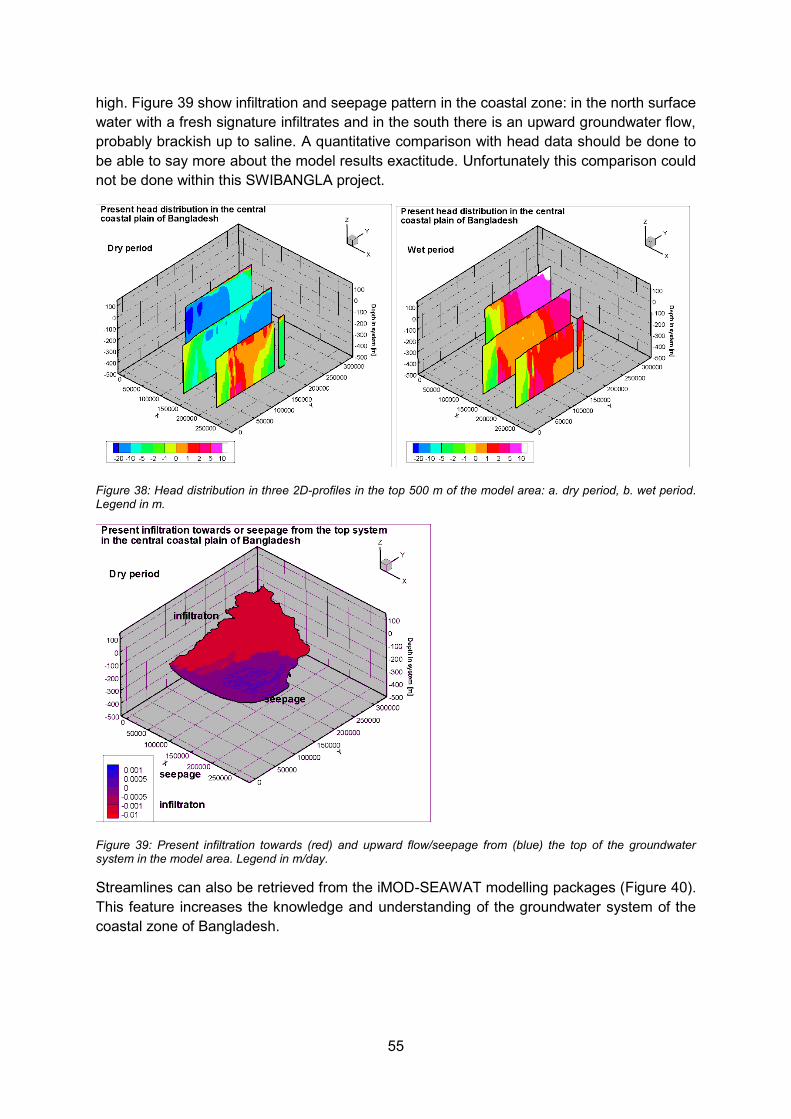
55
high. Figure 39 show infiltration and seepage pattern in the coastal zone: in the north surface water with a fresh signature infiltrates and in the south there is an upward groundwater flow, probably brackish up to saline. A quantitative comparison with head data should be done to be able to say more about the model results exactitude. Unfortunately this comparison could not be done within this SWIBANGLA project.
Figure 38: Head distribution in three 2D-profiles in the top 500 m of the model area: a. dry period, b. wet period. Legend in m.
Figure 39: Present infiltration towards (red) and upward flow/seepage from (blue) the top of the groundwater system in the model area. Legend in m/day.
Streamlines can also be retrieved from the iMOD-SEAWAT modelling packages (Figure 40). This feature increases the knowledge and understanding of the groundwater system of the coastal zone of Bangladesh.
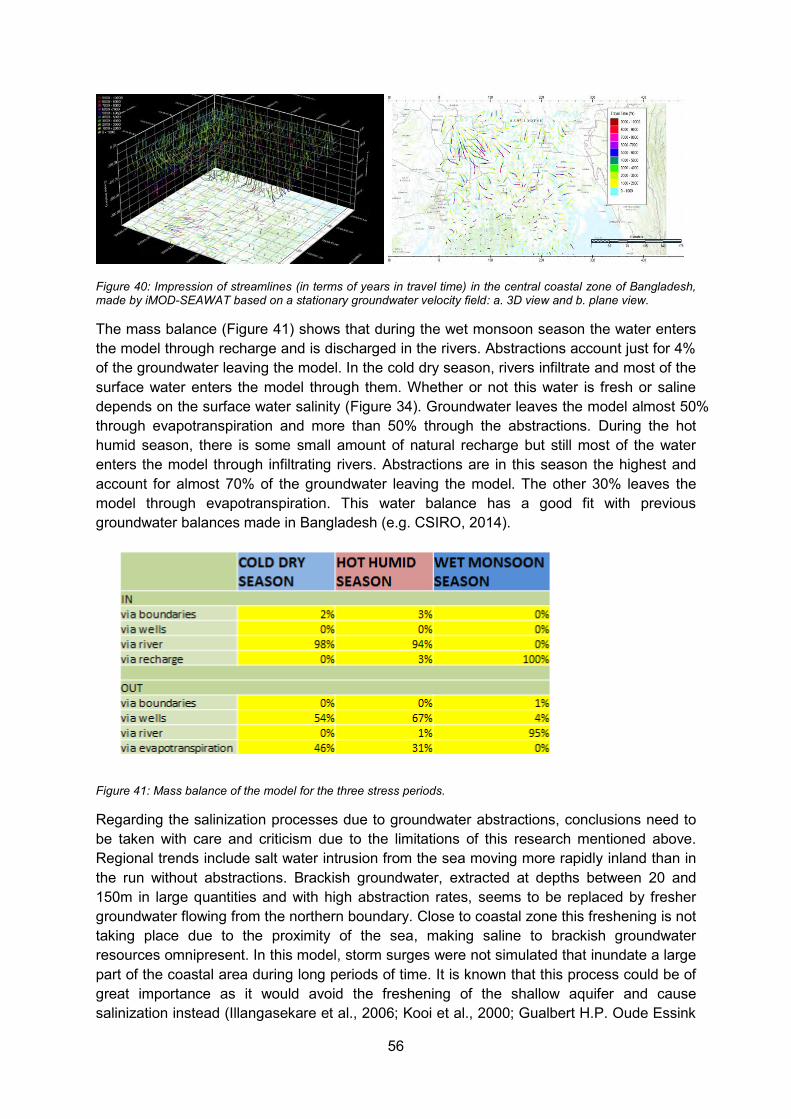
56
Figure 40: Impression of streamlines (in terms of years in travel time) in the central coastal zone of Bangladesh, made by iMOD-SEAWAT based on a stationary groundwater velocity field: a. 3D view and b. plane view.
The mass balance (Figure 41) shows that during the wet monsoon season the water enters the model through recharge and is discharged in the rivers. Abstractions account just for 4% of the groundwater leaving the model. In the cold dry season, rivers infiltrate and most of the surface water enters the model through them. Whether or not this water is fresh or saline depends on the surface water salinity (Figure 34). Groundwater leaves the model almost 50% through evapotranspiration and more than 50% through the abstractions. During the hot humid season, there is some small amount of natural recharge but still most of the water enters the model through infiltrating rivers. Abstractions are in this season the highest and account for almost 70% of the groundwater leaving the model. The other 30% leaves the model through evapotranspiration. This water balance has a good fit with previous groundwater balances made in Bangladesh (e.g. CSIRO, 2014).
Figure 41: Mass balance of the model for the three stress periods.
Regarding the salinization processes due to groundwater abstractions, conclusions need to be taken with care and criticism due to the limitations of this research mentioned above. Regional trends include salt water intrusion from the sea moving more rapidly inland than in the run without abstractions. Brackish groundwater, extracted at depths between 20 and 150m in large quantities and with high abstraction rates, seems to be replaced by fresher groundwater flowing from the northern boundary. Close to coastal zone this freshening is not taking place due to the proximity of the sea, making saline to brackish groundwater resources omnipresent. In this model, storm surges were not simulated that inundate a large part of the coastal area during long periods of time. It is known that this process could be of great importance as it would avoid the freshening of the shallow aquifer and cause salinization instead (Illangasekare et al., 2006; Kooi et al., 2000; Gualbert H.P. Oude Essink
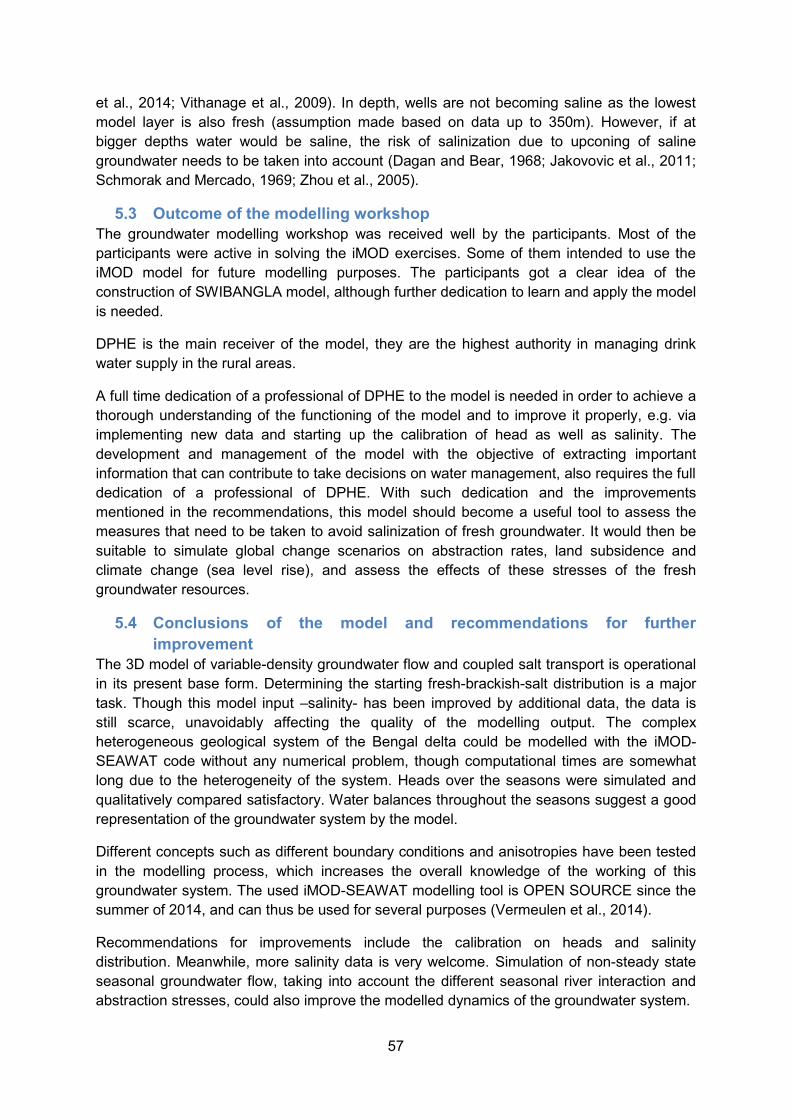
57
et al., 2014; Vithanage et al., 2009). In depth, wells are not becoming saline as the lowest model layer is also fresh (assumption made based on data up to 350m). However, if at bigger depths water would be saline, the risk of salinization due to upconing of saline groundwater needs to be taken into account (Dagan and Bear, 1968; Jakovovic et al., 2011; Schmorak and Mercado, 1969; Zhou et al., 2005).
5.3 Outcome of the modelling workshop The groundwater modelling workshop was received well by the participants. Most of the participants were active in solving the iMOD exercises. Some of them intended to use the iMOD model for future modelling purposes. The participants got a clear idea of the construction of SWIBANGLA model, although further dedication to learn and apply the model is needed.
DPHE is the main receiver of the model, they are the highest authority in managing drink water supply in the rural areas.
A full time dedication of a professional of DPHE to the model is needed in order to achieve a thorough understanding of the functioning of the model and to improve it properly, e.g. via implementing new data and starting up the calibration of head as well as salinity. The development and management of the model with the objective of extracting important information that can contribute to take decisions on water management, also requires the full dedication of a professional of DPHE. With such dedication and the improvements mentioned in the recommendations, this model should become a useful tool to assess the measures that need to be taken to avoid salinization of fresh groundwater. It would then be suitable to simulate global change scenarios on abstraction rates, land subsidence and climate change (sea level rise), and assess the effects of these stresses of the fresh groundwater resources.
5.4 Conclusions of the model and recommendations for further improvement
The 3D model of variable-density groundwater flow and coupled salt transport is operational in its present base form. Determining the starting fresh-brackish-salt distribution is a major task. Though this model input –salinity- has been improved by additional data, the data is still scarce, unavoidably affecting the quality of the modelling output. The complex heterogeneous geological system of the Bengal delta could be modelled with the iMOD-SEAWAT code without any numerical problem, though computational times are somewhat long due to the heterogeneity of the system. Heads over the seasons were simulated and qualitatively compared satisfactory. Water balances throughout the seasons suggest a good representation of the groundwater system by the model.
Different concepts such as different boundary conditions and anisotropies have been tested in the modelling process, which increases the overall knowledge of the working of this groundwater system. The used iMOD-SEAWAT modelling tool is OPEN SOURCE since the summer of 2014, and can thus be used for several purposes (Vermeulen et al., 2014).
Recommendations for improvements include the calibration on heads and salinity distribution. Meanwhile, more salinity data is very welcome. Simulation of non-steady state seasonal groundwater flow, taking into account the different seasonal river interaction and abstraction stresses, could also improve the modelled dynamics of the groundwater system.

58
After implementation of these suggestions, the model is suitable assess to the impact of stresses such as global change scenarios on extraction rates, land subsidence and climate change (sea level rise) on the fresh groundwater resources in the central coastal zone of Bangladesh.

59
6 Mitigating strategies for salt water impacts
6.1 Assumptions and framework The coastal region of Bangladesh covers about 20% of total land area and over 30% of the cultivable lands of the country. A total of about 40 million people are living in the coastal area. About 53 % of the coastal areas were affected by salinity. Since the 1960’s, groundwater has been used extensively as the main source of drinking and irrigation water supply. About 75% of cultivated land is irrigated by groundwater and the remaining 25% by surface water (Zahid and Ahmed, 2006). Of the abstracted groundwater about 70-90% is used for agricultural purposes and the rest for drinking and other water supplies. Groundwater is the main source of potable water for nearly 98% of the population in Bangladesh. The discovery of high Arsenic concentrations in shallow groundwater in 1990's has turned to exploitation of deep groundwater (>150m below land surface) for water supply. Although deep groundwater is Arsenic-free, it is vulnerable to depletion and salt water intrusion, especially under the projected climate change impacts.
In this chapter, strategies to secure safe drinking water supply in the coastal areas of Bangladesh are proposed. These strategies are formulated by reviewing published reports and literatures conducted in Bangladesh and similar areas in the world. The strategies were formulated based on the following assumptions:
Availability of Arsenic-free fresh groundwater resources: A number of investigations (Asian Development Bank, 2013; BGS and DPHE, 2001) has found wide availability of fresh groundwater in the deep aquifer in the coastal areas (<300-400 below land surface) and in inland areas (<150m below land surface). Limited model simulations (UCL, 2013; Yu et al., 2010) indicate that groundwater in the deep aquifer can provide safe drinking water for the projected population growth in 100 years if it is only used for domestic water supply.
Salinity distribution and saline water intrusion pathways: There are no proper maps delineating salinity distribution and fresh/salt groundwater interfaces in major aquifers. Investigations (Asian Development Bank, 2013; BADC, 2011) found that groundwater in the shallow and middle aquifers in the coastal areas are brackish or saline. Pockets of saline groundwater exist in the inland areas. The main pathways of salt water intrusion (Yu et al., 2010) include lateral sea water intrusion, vertical leakage of inundated seawater, and mixing of saline groundwater induced by pumping.
Impacts of climate change and human activities on salt water intrusion: The impact of sea level rising on salt water intrusion is only limited in fresh/sea water interface (UCL, 2013). The flooding seawater during periodic storm surges may have large impacts on increasing surface water and shallow groundwater salinity (Yu et al., 2010); similar concept have been detected during tsunami events (Illangasekare et al., 2006; Gualbert H.P. Oude Essink et al., 2014; Vithanage et al., 2012a, 2012b). Groundwater abstraction is a very important driver causing mixing and upcoming of pre-existence saline groundwater in the middle and deep aquifers.
In Dillon (2005), different types of management of aquifer recharge were schematised; local circumstances highly determines which technique can be implemented.
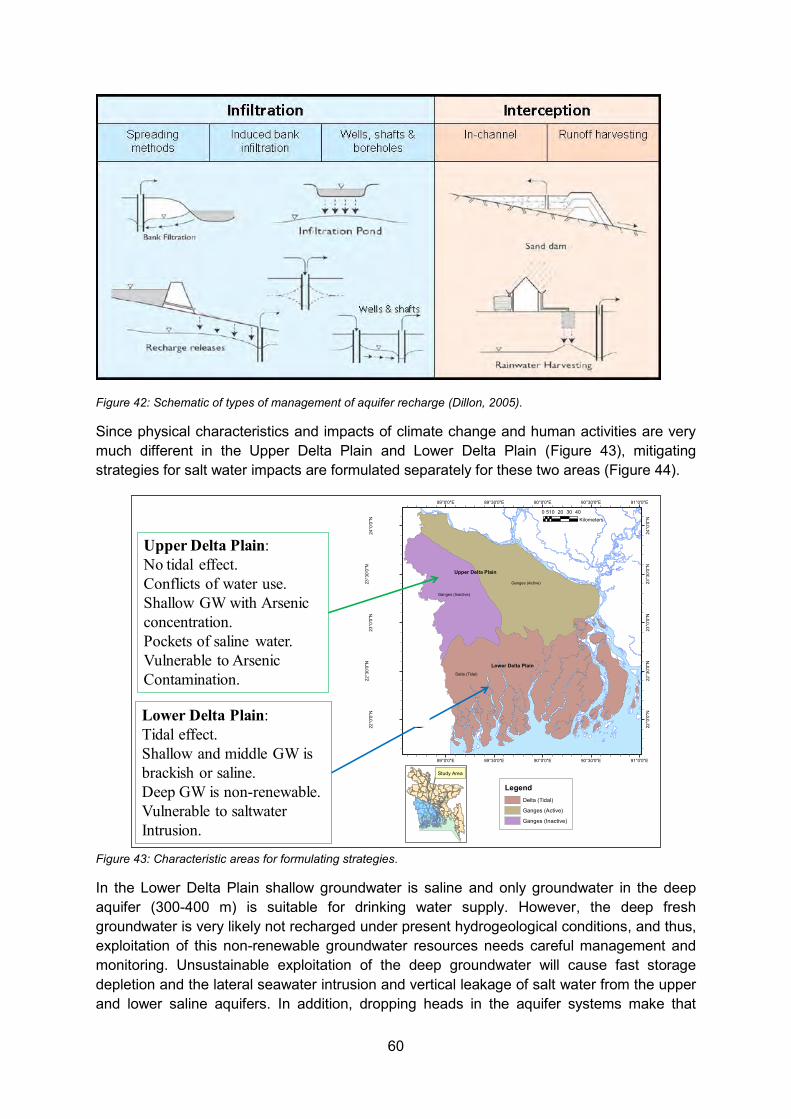
60
Figure 42: Schematic of types of management of aquifer recharge (Dillon, 2005).
Since physical characteristics and impacts of climate change and human activities are very much different in the Upper Delta Plain and Lower Delta Plain (Figure 43), mitigating strategies for salt water impacts are formulated separately for these two areas (Figure 44).
Figure 43: Characteristic areas for formulating strategies.
In the Lower Delta Plain shallow groundwater is saline and only groundwater in the deep aquifer (300-400 m) is suitable for drinking water supply. However, the deep fresh groundwater is very likely not recharged under present hydrogeological conditions, and thus, exploitation of this non-renewable groundwater resources needs careful management and monitoring. Unsustainable exploitation of the deep groundwater will cause fast storage depletion and the lateral seawater intrusion and vertical leakage of salt water from the upper and lower saline aquifers. In addition, dropping heads in the aquifer systems make that
Delta (Tidal)
Ganges (Active)
Ganges (Inactive)
91°0'0"E
91°0'0"E
90°30'0"E
90°30'0"E
90°0'0"E
90°0'0"E
89°30'0"E
89°30'0"E
89°0'0"E
89°0'0"E
24°0
'0"N
24°0
'0"N
23°3
0'0"
N
23°3
0'0"
N
23°0
'0"N
23°0
'0"N
22°3
0'0"
N
22°3
0'0"
N
22°0
'0"N
22°0
'0"NÜ
0 10 20 30 405Kilometers
Study Area
Upper Delta Plain
Lower Delta Plain
LegendDelta (Tidal)
Ganges (Active)
Ganges (Inactive)
Lower Delta Plain: Tidal effect.Shallow and middle GW is brackish or saline.Deep GW is non-renewable.Vulnerable to saltwater Intrusion.
Upper Delta Plain: No tidal effect.Conflicts of water use.Shallow GW with Arsenic concentration.Pockets of saline water.Vulnerable to ArsenicContamination.
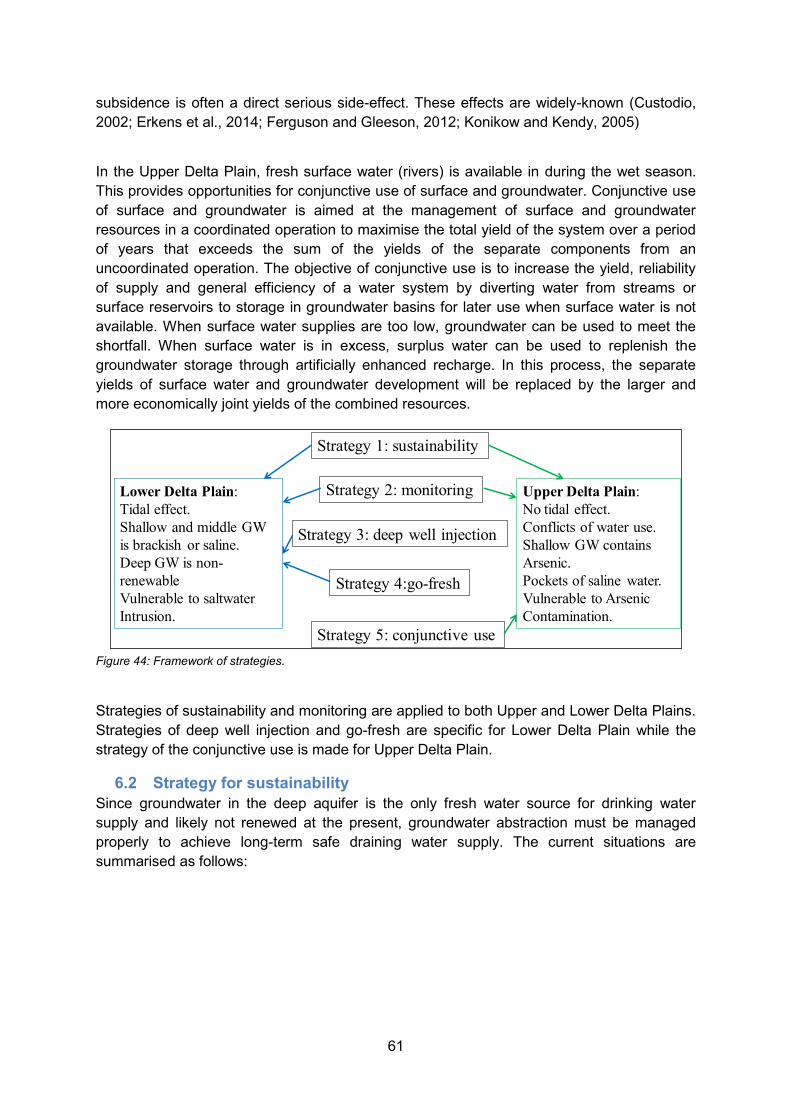
61
subsidence is often a direct serious side-effect. These effects are widely-known (Custodio, 2002; Erkens et al., 2014; Ferguson and Gleeson, 2012; Konikow and Kendy, 2005)
In the Upper Delta Plain, fresh surface water (rivers) is available in during the wet season. This provides opportunities for conjunctive use of surface and groundwater. Conjunctive use of surface and groundwater is aimed at the management of surface and groundwater resources in a coordinated operation to maximise the total yield of the system over a period of years that exceeds the sum of the yields of the separate components from an uncoordinated operation. The objective of conjunctive use is to increase the yield, reliability of supply and general efficiency of a water system by diverting water from streams or surface reservoirs to storage in groundwater basins for later use when surface water is not available. When surface water supplies are too low, groundwater can be used to meet the shortfall. When surface water is in excess, surplus water can be used to replenish the groundwater storage through artificially enhanced recharge. In this process, the separate yields of surface water and groundwater development will be replaced by the larger and more economically joint yields of the combined resources.
Figure 44: Framework of strategies.
Strategies of sustainability and monitoring are applied to both Upper and Lower Delta Plains. Strategies of deep well injection and go-fresh are specific for Lower Delta Plain while the strategy of the conjunctive use is made for Upper Delta Plain.
6.2 Strategy for sustainability Since groundwater in the deep aquifer is the only fresh water source for drinking water supply and likely not renewed at the present, groundwater abstraction must be managed properly to achieve long-term safe draining water supply. The current situations are summarised as follows:
Upper Delta Plain: No tidal effect.Conflicts of water use.Shallow GW contains Arsenic.Pockets of saline water.Vulnerable to ArsenicContamination.
Lower Delta Plain: Tidal effect.Shallow and middle GW is brackish or saline.Deep GW is non-renewableVulnerable to saltwater Intrusion.
Strategy 1: sustainability
Strategy 2: monitoring
Strategy 3: deep well injection
Strategy 4:go-fresh
Strategy 5: conjunctive use
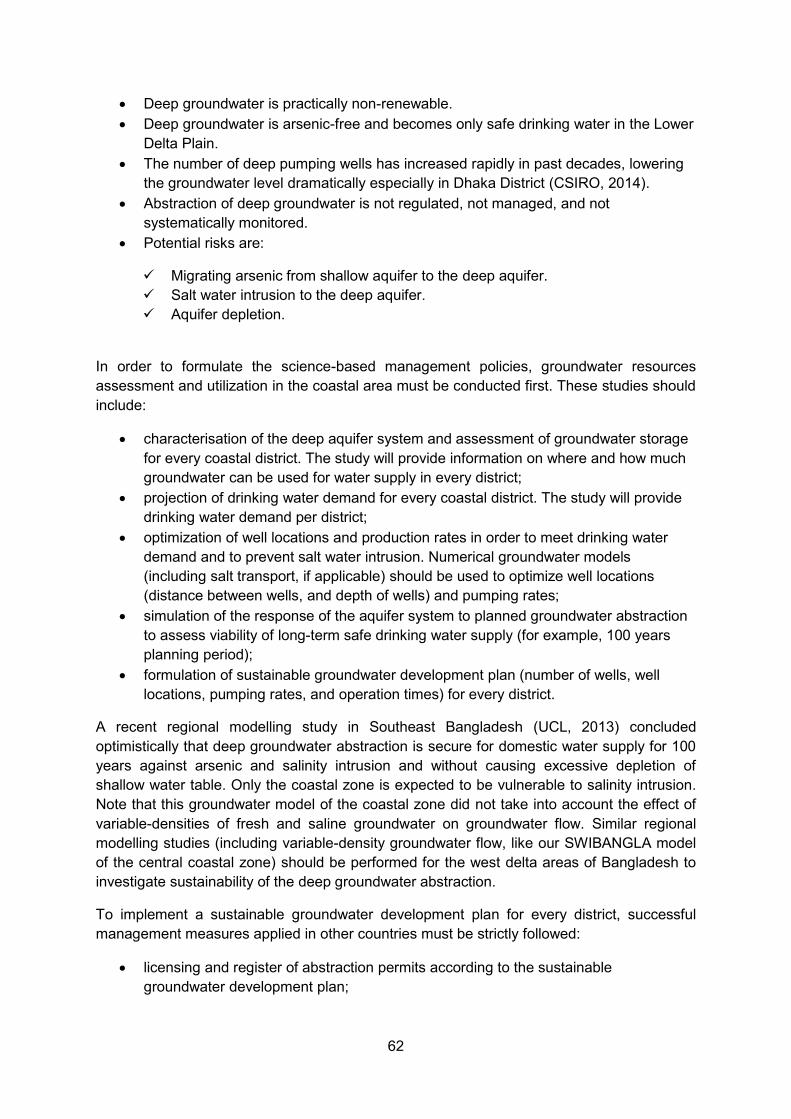
62
Deep groundwater is practically non-renewable. Deep groundwater is arsenic-free and becomes only safe drinking water in the Lower
Delta Plain. The number of deep pumping wells has increased rapidly in past decades, lowering
the groundwater level dramatically especially in Dhaka District (CSIRO, 2014). Abstraction of deep groundwater is not regulated, not managed, and not
systematically monitored. Potential risks are:
Migrating arsenic from shallow aquifer to the deep aquifer. Salt water intrusion to the deep aquifer. Aquifer depletion.
In order to formulate the science-based management policies, groundwater resources assessment and utilization in the coastal area must be conducted first. These studies should include:
characterisation of the deep aquifer system and assessment of groundwater storage for every coastal district. The study will provide information on where and how much groundwater can be used for water supply in every district;
projection of drinking water demand for every coastal district. The study will provide drinking water demand per district;
optimization of well locations and production rates in order to meet drinking water demand and to prevent salt water intrusion. Numerical groundwater models (including salt transport, if applicable) should be used to optimize well locations (distance between wells, and depth of wells) and pumping rates;
simulation of the response of the aquifer system to planned groundwater abstraction to assess viability of long-term safe drinking water supply (for example, 100 years planning period);
formulation of sustainable groundwater development plan (number of wells, well locations, pumping rates, and operation times) for every district.
A recent regional modelling study in Southeast Bangladesh (UCL, 2013) concluded optimistically that deep groundwater abstraction is secure for domestic water supply for 100 years against arsenic and salinity intrusion and without causing excessive depletion of shallow water table. Only the coastal zone is expected to be vulnerable to salinity intrusion. Note that this groundwater model of the coastal zone did not take into account the effect of variable-densities of fresh and saline groundwater on groundwater flow. Similar regional modelling studies (including variable-density groundwater flow, like our SWIBANGLA model of the central coastal zone) should be performed for the west delta areas of Bangladesh to investigate sustainability of the deep groundwater abstraction.
To implement a sustainable groundwater development plan for every district, successful management measures applied in other countries must be strictly followed:
licensing and register of abstraction permits according to the sustainable groundwater development plan;
63
monitoring and control of pumping rate using the so-called IC Card system7; building institution capacity for implementation and monitoring.
A regulated IC Card system has been used in China for groundwater use management. Under this system, farmers are allocated water quota and pay a price for the use of water. The pumping is activated with the IC Card and data on water use are recorded centrally. Unused quota can also be traded. This system has helped to bring down water consumption, as it encouraged farmers to apply water saving techniques and phase out crops with high water productivity.
A workshop attended by BWDB, PSU, DPHE, BADC, GSB, WARPO issued a Ruposhi Bangla Deep Groundwater Statement (UCL, 2013) and identified that the institutional weakness jeopardise the proper management of deep groundwater resources and recommended for a Groundwater Regulatory Agent. This new agent should be made responsible for managing and monitoring deep groundwater abstractions.
6.3 Strategy for systematic monitoring Several organisations in Bangladesh, such as the Bangladesh Water Development Board (BWDB), Department of Public Health Engineering (DPHE) and Bangladesh Agricultural Development Corporation (BADC), have water quality and water level monitoring networks throughout the whole country. BWDB (Zahid, 2014) has established a regional groundwater monitoring network in the central and western Delta area. The network consists of 42 groundwater monitoring well nests and 102 line wells. Each well nest consist of 3 to 5 piezometers down to the maximum depth of 350 m for measuring groundwater levels, collection of water samples and performing hydraulic tests in the deep aquifers. Each line well consists of 5 wells down to the maximum depth of about 100 m to assess surface water – groundwater interaction in the upper aquifers. Groundwater levels in all observation wells are measured once per week, water samples in all wells are taken at the wet and dry season for water quality analysis (25 parameters). DPHE has installed several hundred groundwater monitoring wells on the project bases. However, DPHE does not operate a long-term regular groundwater monitoring network. BADC owns 158 water quality monitoring stations for salinity monitoring in coastal areas. Electric conductivity (EC) values are measured with portable EC meter with data logger. The measurements are collected twice in a day, during the tide and after the tide. BADC also measures groundwater levels twice a month in about 3000 wells in different parts of Bangladesh. BRAC WASH program has installed 6000 wells in Bangladesh for drinking water supply to rural people. Five water quality parameters are measured in these wells (pH, Cl, Fe, Mn and As). Data collected from these networks provide important information for groundwater resources development and management in Bangladesh.
However, a unified national groundwater monitoring network does not exist, nor a national groundwater database in Bangladesh. Data are scattered in different organisations and not analysed to produce useful maps of salinity distributions in major aquifers. Water Resource Planning Organisation (WARPO) is a government organisation which has a mandate to coordinate monitoring, manage and disseminate data. WARPO is currently organizing its tasks around these responsibilities.
7 IC Card Systems uses intelligent card (IC) technology in order to more closely regulate the volume of groundwater extracted from wells and boreholes.
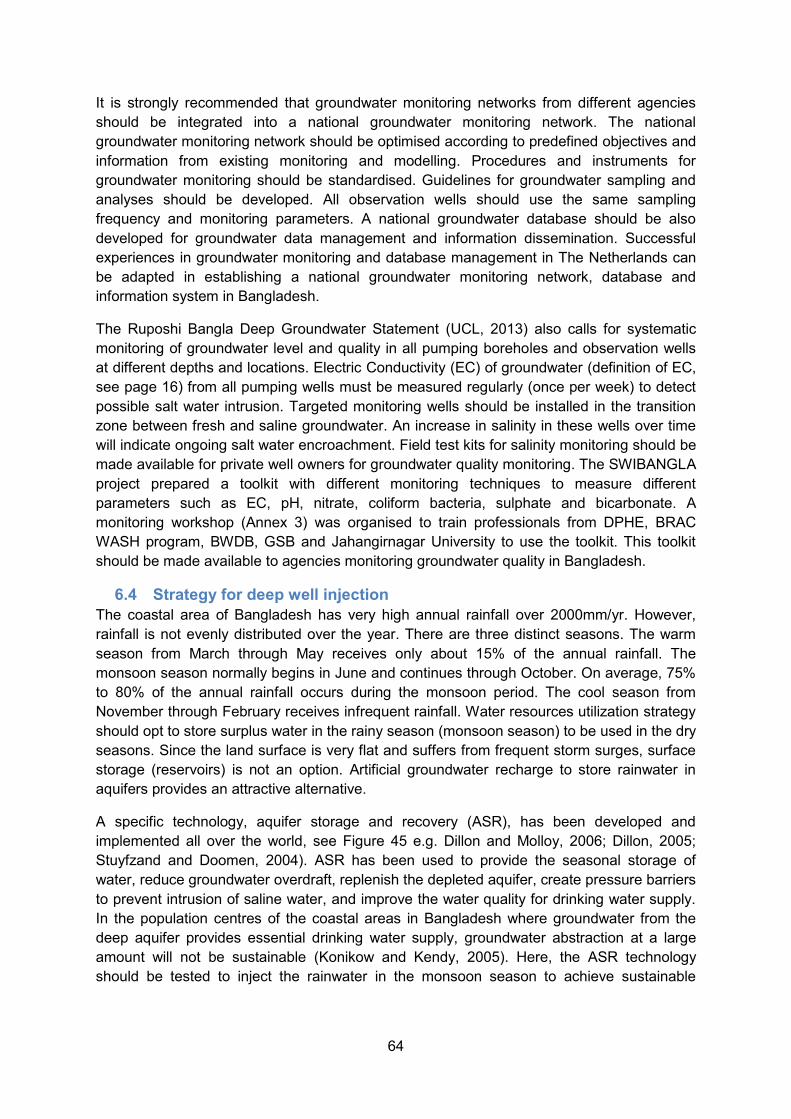
64
It is strongly recommended that groundwater monitoring networks from different agencies should be integrated into a national groundwater monitoring network. The national groundwater monitoring network should be optimised according to predefined objectives and information from existing monitoring and modelling. Procedures and instruments for groundwater monitoring should be standardised. Guidelines for groundwater sampling and analyses should be developed. All observation wells should use the same sampling frequency and monitoring parameters. A national groundwater database should be also developed for groundwater data management and information dissemination. Successful experiences in groundwater monitoring and database management in The Netherlands can be adapted in establishing a national groundwater monitoring network, database and information system in Bangladesh.
The Ruposhi Bangla Deep Groundwater Statement (UCL, 2013) also calls for systematic monitoring of groundwater level and quality in all pumping boreholes and observation wells at different depths and locations. Electric Conductivity (EC) of groundwater (definition of EC, see page 16) from all pumping wells must be measured regularly (once per week) to detect possible salt water intrusion. Targeted monitoring wells should be installed in the transition zone between fresh and saline groundwater. An increase in salinity in these wells over time will indicate ongoing salt water encroachment. Field test kits for salinity monitoring should be made available for private well owners for groundwater quality monitoring. The SWIBANGLA project prepared a toolkit with different monitoring techniques to measure different parameters such as EC, pH, nitrate, coliform bacteria, sulphate and bicarbonate. A monitoring workshop (Annex 3) was organised to train professionals from DPHE, BRAC WASH program, BWDB, GSB and Jahangirnagar University to use the toolkit. This toolkit should be made available to agencies monitoring groundwater quality in Bangladesh.
6.4 Strategy for deep well injection The coastal area of Bangladesh has very high annual rainfall over 2000mm/yr. However, rainfall is not evenly distributed over the year. There are three distinct seasons. The warm season from March through May receives only about 15% of the annual rainfall. The monsoon season normally begins in June and continues through October. On average, 75% to 80% of the annual rainfall occurs during the monsoon period. The cool season from November through February receives infrequent rainfall. Water resources utilization strategy should opt to store surplus water in the rainy season (monsoon season) to be used in the dry seasons. Since the land surface is very flat and suffers from frequent storm surges, surface storage (reservoirs) is not an option. Artificial groundwater recharge to store rainwater in aquifers provides an attractive alternative.
A specific technology, aquifer storage and recovery (ASR), has been developed and implemented all over the world, see Figure 45 e.g. Dillon and Molloy, 2006; Dillon, 2005; Stuyfzand and Doomen, 2004). ASR has been used to provide the seasonal storage of water, reduce groundwater overdraft, replenish the depleted aquifer, create pressure barriers to prevent intrusion of saline water, and improve the water quality for drinking water supply. In the population centres of the coastal areas in Bangladesh where groundwater from the deep aquifer provides essential drinking water supply, groundwater abstraction at a large amount will not be sustainable (Konikow and Kendy, 2005). Here, the ASR technology should be tested to inject the rainwater in the monsoon season to achieve sustainable
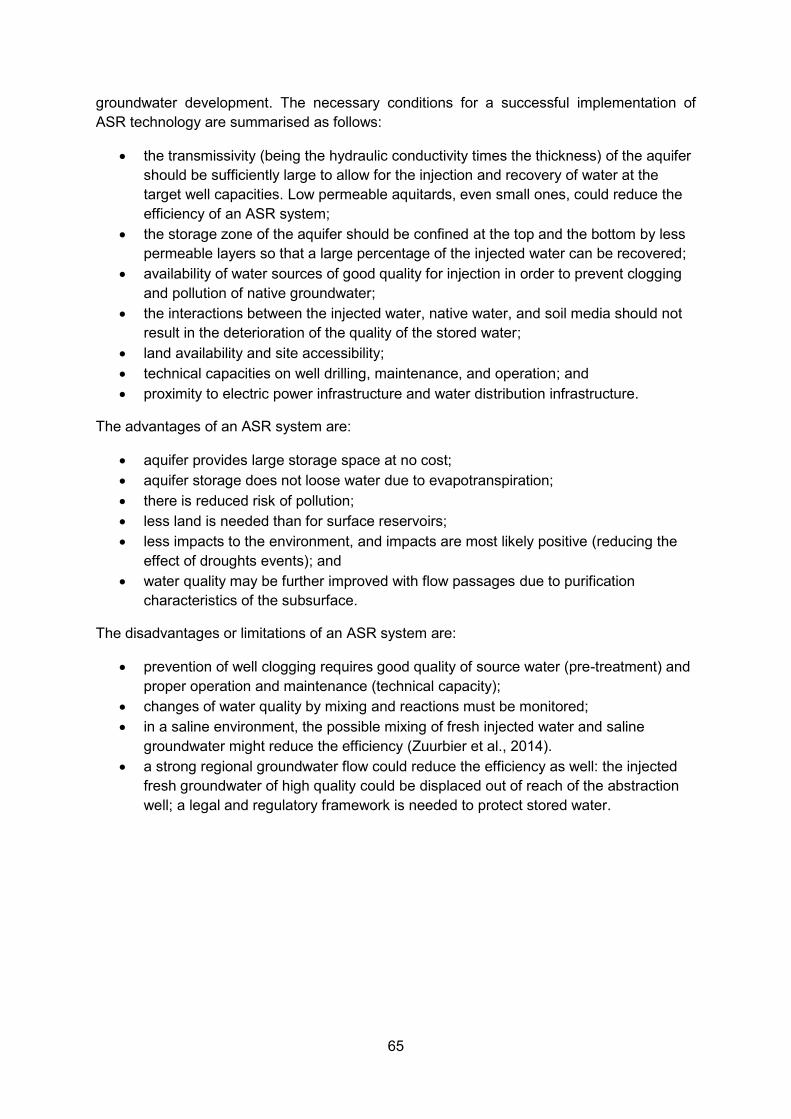
65
groundwater development. The necessary conditions for a successful implementation of ASR technology are summarised as follows:
the transmissivity (being the hydraulic conductivity times the thickness) of the aquifer should be sufficiently large to allow for the injection and recovery of water at the target well capacities. Low permeable aquitards, even small ones, could reduce the efficiency of an ASR system;
the storage zone of the aquifer should be confined at the top and the bottom by less permeable layers so that a large percentage of the injected water can be recovered;
availability of water sources of good quality for injection in order to prevent clogging and pollution of native groundwater;
the interactions between the injected water, native water, and soil media should not result in the deterioration of the quality of the stored water;
land availability and site accessibility; technical capacities on well drilling, maintenance, and operation; and proximity to electric power infrastructure and water distribution infrastructure.
The advantages of an ASR system are:
aquifer provides large storage space at no cost; aquifer storage does not loose water due to evapotranspiration; there is reduced risk of pollution; less land is needed than for surface reservoirs; less impacts to the environment, and impacts are most likely positive (reducing the
effect of droughts events); and water quality may be further improved with flow passages due to purification
characteristics of the subsurface.
The disadvantages or limitations of an ASR system are:
prevention of well clogging requires good quality of source water (pre-treatment) and proper operation and maintenance (technical capacity);
changes of water quality by mixing and reactions must be monitored; in a saline environment, the possible mixing of fresh injected water and saline
groundwater might reduce the efficiency (Zuurbier et al., 2014). a strong regional groundwater flow could reduce the efficiency as well: the injected
fresh groundwater of high quality could be displaced out of reach of the abstraction well; a legal and regulatory framework is needed to protect stored water.

66
Figure 45: System of Aquifer Storage and Recovery well (Maliva and Missimer, 2010).
6.5 Strategy for GO-FRESH In the Lower Delta Plain, the superficial aquifer is often fresh during the rainy season and becomes brackish during the dry season. In order to create a continuous fresh water supply from these aquifers, artificial groundwater recharge methods can be applied.
A consortium led by Deltares conducted a test project called GO-FRESH in western Delta area of The Netherlands (www.go-fresh.info). The project tested a number of methods to store fresh water in periods of surplus for the use during dry periods (G.H.P. Oude Essink et al., 2014). Two methods were tested successfully:
Creek Ridge Infiltration Test: increase of fresh groundwater reservoir by infiltration drains in between two ditches by infiltration of surface water (Pauw et al., 2015).
Freshmaker: increase of freshwater in between two ditches by injecting freshwater with the horizontal well on the top part of the aquifer and abstracting saline groundwater in the lower part of the aquifer. During the dry period, shallow horizontal wells are used to pump rejected water for irrigation.
In villages where access to safe drinking water is a problem since deep groundwater is not present or too expensive to abstract, an alternative artificial groundwater recharge technology can be applied by storing rainwater in the shallow brackish aquifer. Dhaka University of Bangladesh and Acacia Water of the Netherlands conducted four test sites in Khulna and Satkhira from 2009 to 2012 for this technology (Acacia Water, 2011). The system is designed to infiltrate pond water and rainwater in the aquifer though infiltration wells and to create a freshwater lens in the aquifer for use during the dry season (Figure 46).
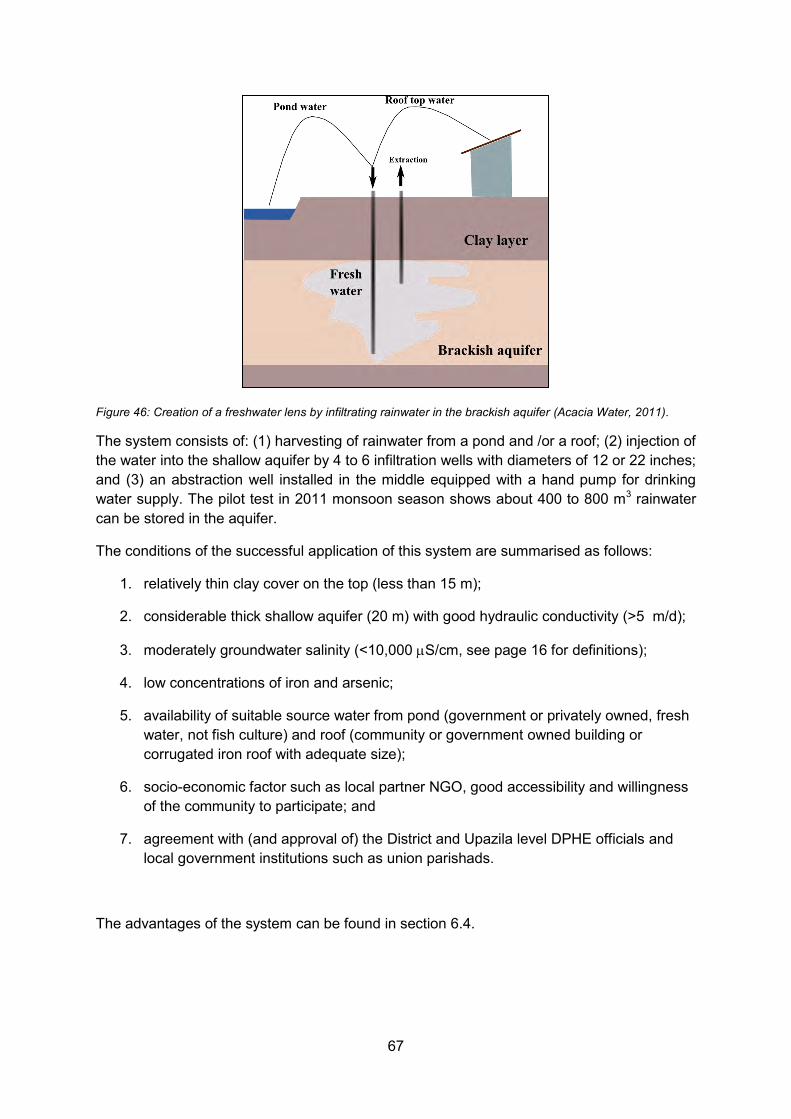
67
Figure 46: Creation of a freshwater lens by infiltrating rainwater in the brackish aquifer (Acacia Water, 2011).
The system consists of: (1) harvesting of rainwater from a pond and /or a roof; (2) injection of the water into the shallow aquifer by 4 to 6 infiltration wells with diameters of 12 or 22 inches; and (3) an abstraction well installed in the middle equipped with a hand pump for drinking water supply. The pilot test in 2011 monsoon season shows about 400 to 800 m3 rainwater can be stored in the aquifer.
The conditions of the successful application of this system are summarised as follows:
1. relatively thin clay cover on the top (less than 15 m);
2. considerable thick shallow aquifer (20 m) with good hydraulic conductivity (>5 m/d);
3. moderately groundwater salinity (<10,000 S/cm, see page 16 for definitions);
4. low concentrations of iron and arsenic;
5. availability of suitable source water from pond (government or privately owned, fresh water, not fish culture) and roof (community or government owned building or corrugated iron roof with adequate size);
6. socio-economic factor such as local partner NGO, good accessibility and willingness of the community to participate; and
7. agreement with (and approval of) the District and Upazila level DPHE officials and local government institutions such as union parishads.
The advantages of the system can be found in section 6.4.
68
Figure 47: Test sites and installations in Khulna and Satkhira (Acacia Water, 2011).
6.6 Strategy for conjunctive use In the Upper Delta Plain, fresh groundwater is present at both shallow and deep aquifers. Groundwater in the shallow aquifers has high Arsenic concentration and is not used for drinking water supply, but used for irrigation. Groundwater in the deep aquifer is free of Arsenic pollution and is used for drinking water supply. However, pockets of relic saline groundwater are found in some places and may intrude fresh groundwater when large amount of groundwater is abstracted resulting in a decrease of fresh water pressure. The conjunctive use of surface and groundwater will achieve sustainable water supply in this area.
Advantages of a conjunctive use system are as follows:
increase in yield. This results from a reduction in loss from the freshwater system in the form of reduced flow to the ocean or reduced evaporation from surface reservoirs. For example, excess water in a river normally flowing to the ocean is now diverted and stored underground for subsequent use;
offset uneven distribution of runoff (too much water in monsoon season, shortages in dry seasons);
it stores water in aquifers closer to the users. This ensures a water supply in proximity to consumers in case of interruption of the regular surface water supply;
can operate with a smaller surface distribution system because of a wider distribution of wells;
can function with smaller surface water reservoirs or diversion structures; can prevent or reduce drainage problems in some areas because storage and water
levels are controlled, with wells acting as vertical drains; and canal lining is not necessary. Unlined canals can be an important source of
groundwater recharge.
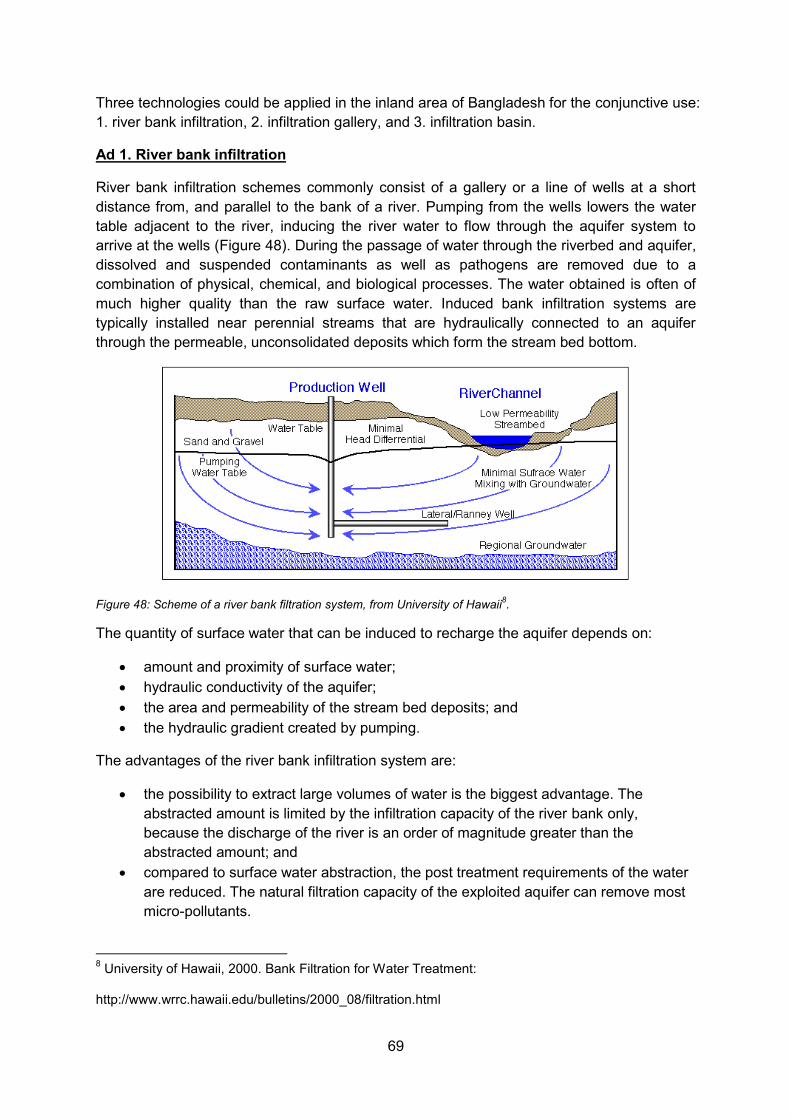
69
Three technologies could be applied in the inland area of Bangladesh for the conjunctive use: 1. river bank infiltration, 2. infiltration gallery, and 3. infiltration basin.
Ad 1. River bank infiltration
River bank infiltration schemes commonly consist of a gallery or a line of wells at a short distance from, and parallel to the bank of a river. Pumping from the wells lowers the water table adjacent to the river, inducing the river water to flow through the aquifer system to arrive at the wells (Figure 48). During the passage of water through the riverbed and aquifer, dissolved and suspended contaminants as well as pathogens are removed due to a combination of physical, chemical, and biological processes. The water obtained is often of much higher quality than the raw surface water. Induced bank infiltration systems are typically installed near perennial streams that are hydraulically connected to an aquifer through the permeable, unconsolidated deposits which form the stream bed bottom.
Figure 48: Scheme of a river bank filtration system, from University of Hawaii8.
The quantity of surface water that can be induced to recharge the aquifer depends on:
amount and proximity of surface water; hydraulic conductivity of the aquifer; the area and permeability of the stream bed deposits; and the hydraulic gradient created by pumping.
The advantages of the river bank infiltration system are:
the possibility to extract large volumes of water is the biggest advantage. The abstracted amount is limited by the infiltration capacity of the river bank only, because the discharge of the river is an order of magnitude greater than the abstracted amount; and
compared to surface water abstraction, the post treatment requirements of the water are reduced. The natural filtration capacity of the exploited aquifer can remove most micro-pollutants.
8 University of Hawaii, 2000. Bank Filtration for Water Treatment:
http://www.wrrc.hawaii.edu/bulletins/2000_08/filtration.html
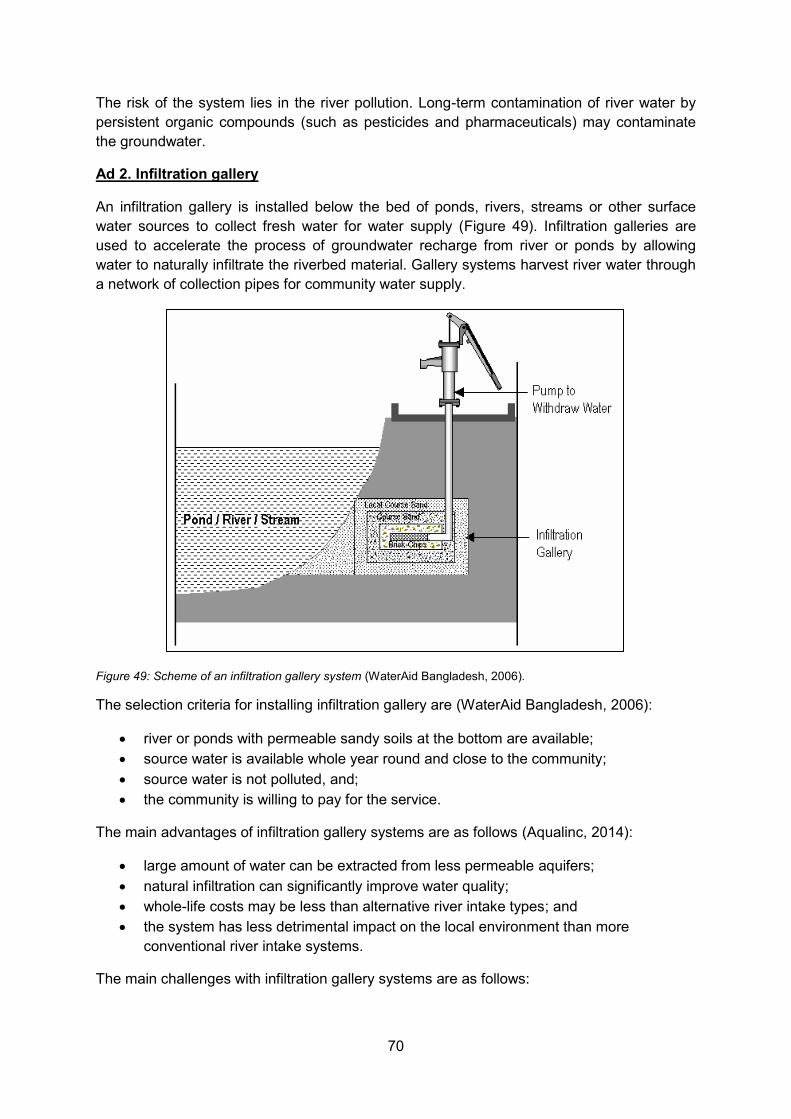
70
The risk of the system lies in the river pollution. Long-term contamination of river water by persistent organic compounds (such as pesticides and pharmaceuticals) may contaminate the groundwater.
Ad 2. Infiltration gallery
An infiltration gallery is installed below the bed of ponds, rivers, streams or other surface water sources to collect fresh water for water supply (Figure 49). Infiltration galleries are used to accelerate the process of groundwater recharge from river or ponds by allowing water to naturally infiltrate the riverbed material. Gallery systems harvest river water through a network of collection pipes for community water supply.
Figure 49: Scheme of an infiltration gallery system (WaterAid Bangladesh, 2006).
The selection criteria for installing infiltration gallery are (WaterAid Bangladesh, 2006):
river or ponds with permeable sandy soils at the bottom are available; source water is available whole year round and close to the community; source water is not polluted, and; the community is willing to pay for the service.
The main advantages of infiltration gallery systems are as follows (Aqualinc, 2014):
large amount of water can be extracted from less permeable aquifers; natural infiltration can significantly improve water quality; whole-life costs may be less than alternative river intake types; and the system has less detrimental impact on the local environment than more
conventional river intake systems.
The main challenges with infiltration gallery systems are as follows:

71
gallery performance is dependent on the properties of the soil in which they are constructed;
site investigations are required to determine the design parameters; whilst the hydraulic conductivity of the riverbed may be good, transmissivity may be
poor if the aquifers saturated depth is low; poorly designed systems can experience a significant reduction in yield if the filter
pack becomes blinded through ingress of silt; gallery systems require regular maintenance to sustain design performance; and the presence of clay can present many technical difficulties and hinder gallery
performance.
Figure 50 shows an example of using infiltration gallery to abstract river water in Pingtung County of Taiwan. The system was constructed in 1923 and is still in use for water supply of local residents and irrigation.
Figure 50: An infiltration gallery system in Pingtung, Taiwan.
Ad 3. Infiltration basin
Infiltration basins are either excavated, or are enclosed by dikes or levees which retain the recharge water until it has infiltrated through the bottom of the basin (Figure 51). This “leaky lake” must be constructed in geologically suitable areas where surface water can infiltrate into the subsurface and recharge to the aquifers. The soil beneath the infiltration basin to the water table must be highly permeable sand or gravel so that the infiltrating surface water can move downward with large quantity. The thickness of the unsaturated zone should be sufficiently large in order to store a large quantity of water during the wet season.
Infiltration gallery in Taiwan Pingtung County Linbian river since 1923. the daily abstraction rate is around 70,000-250,000m3/day.
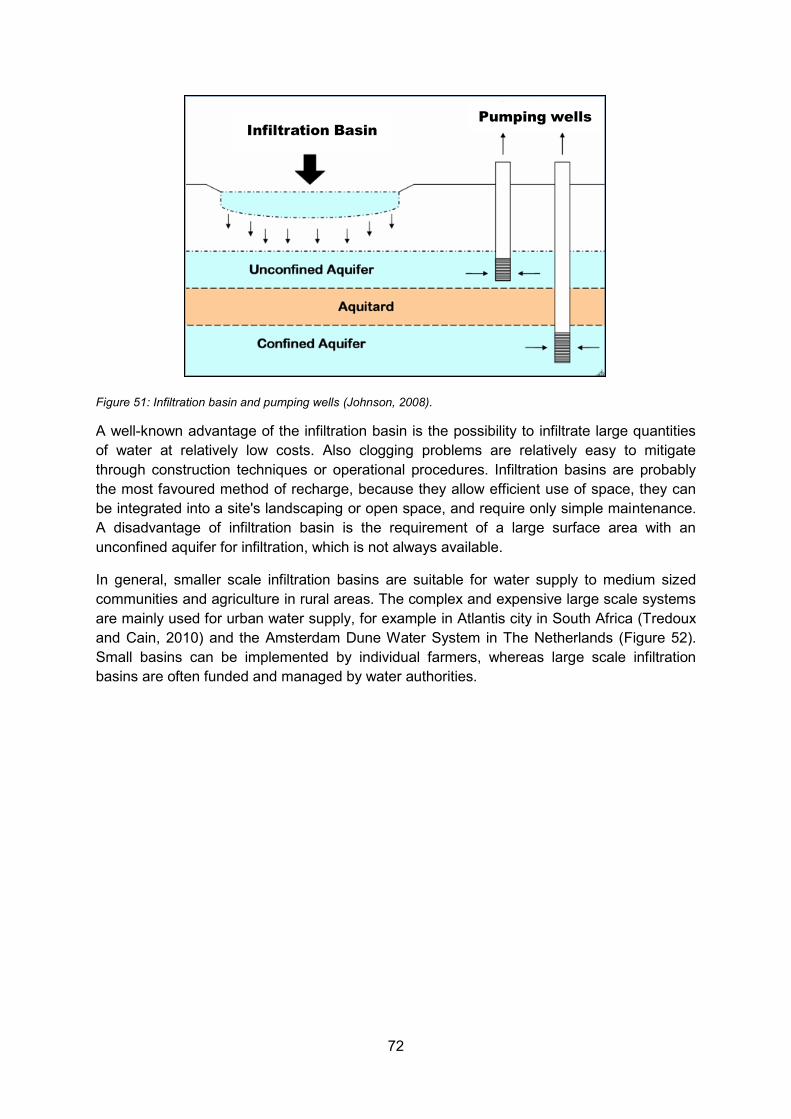
72
Figure 51: Infiltration basin and pumping wells (Johnson, 2008).
A well-known advantage of the infiltration basin is the possibility to infiltrate large quantities of water at relatively low costs. Also clogging problems are relatively easy to mitigate through construction techniques or operational procedures. Infiltration basins are probably the most favoured method of recharge, because they allow efficient use of space, they can be integrated into a site's landscaping or open space, and require only simple maintenance. A disadvantage of infiltration basin is the requirement of a large surface area with an unconfined aquifer for infiltration, which is not always available.
In general, smaller scale infiltration basins are suitable for water supply to medium sized communities and agriculture in rural areas. The complex and expensive large scale systems are mainly used for urban water supply, for example in Atlantis city in South Africa (Tredoux and Cain, 2010) and the Amsterdam Dune Water System in The Netherlands (Figure 52). Small basins can be implemented by individual farmers, whereas large scale infiltration basins are often funded and managed by water authorities.
Infiltration Basin
Pumping wells
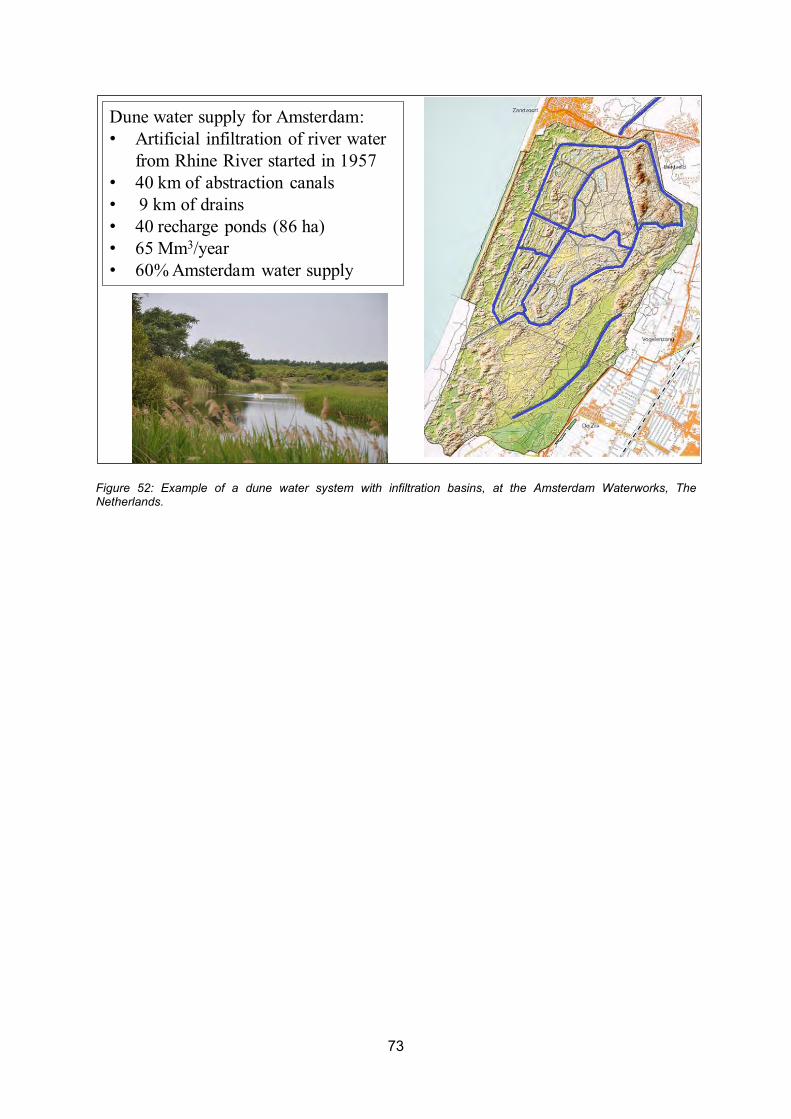
73
Figure 52: Example of a dune water system with infiltration basins, at the Amsterdam Waterworks, The Netherlands.
Dune water supply for Amsterdam:• Artificial infiltration of river water
from Rhine River started in 1957• 40 km of abstraction canals• 9 km of drains• 40 recharge ponds (86 ha)• 65 Mm3/year• 60% Amsterdam water supply
74
7 Inputs to the Water Safety Plans
7.1 Salinization of groundwater In coastal aquifers, threats of salt water intrusion into the fresh groundwater system are a troubling issue. Early studies (Barlow, 2003; Custodio and Bruggeman, 1987; Custodio, 2002; Dagan and Bear, 1968; Jakovovic et al., 2011; Oude Essink, 1996; Oude Essink et al., 2010; Schmorak and Mercado, 1969; Stuyfzand, 1993; Werner et al., 2009; Zhou et al., 2005) have addressed concerns on over-exploitation of fresh groundwater resulting in salt water intrusion.
As the coastal zones of Bangladesh are very low-lying areas, sea water may intrude into the groundwater system much further inland under the predicted future sea level rise. In addition, the outstretched surface water system in Bangladesh makes it possible for salt water wedges to get further inland (up to 100km in the dry season) and to salinize the surface water system, affecting the groundwater. The sea level rise might also cause more frequent flooding to more coastal areas. leading to salt water intrusion (Kooi et al., 2000; Smith and Turner, 2001; Yu et al., 2010). This coupled with reduced river flows in prolonged dry periods under climate change can result in coastal groundwater becoming more saline and in increasing soil salinity. Elevated salt contents in soil and water will affect agricultural productivities and drinking water safety, as well as will increase the salinity levels of drinking water supplies (Khan et al., 2008).
Based on the characteristics of the stresses and the hydrogeological circumstances, various types of salinization are possible (Figure 53): up-coning under abstraction well, salt water intrusion in groundwater system, up-coning under low-lying areas, seepage, salt water intrusion in the surface water (Savenije et al., 2008), etc.

75
Figure 53: Examples of different types of salinization in groundwater and surface water.
7.2 The Water Safety Plans The Water Safety Plans (WSPs) describe all steps in water supply from catchment to consumer. They are meant to organize and systematise the water management practices applied to drinking water. The WHO states that WSPs should be developed for individual drinking water systems, however, many elements of the WSPs are common in most systems. According to the WHO, a WSP has three key components9:
1. system assessment to determine whether the drinking water supply chain (up to the point of consumption) as a whole can deliver water of a quality that meets health-based targets. This also includes the assessment of design criteria of new systems;
2. identifying control measures in a drinking water system that will collectively control identified risks and ensure that the health-based targets are met. For each control
9 http://www.who.int/wsportal/wsp/en/
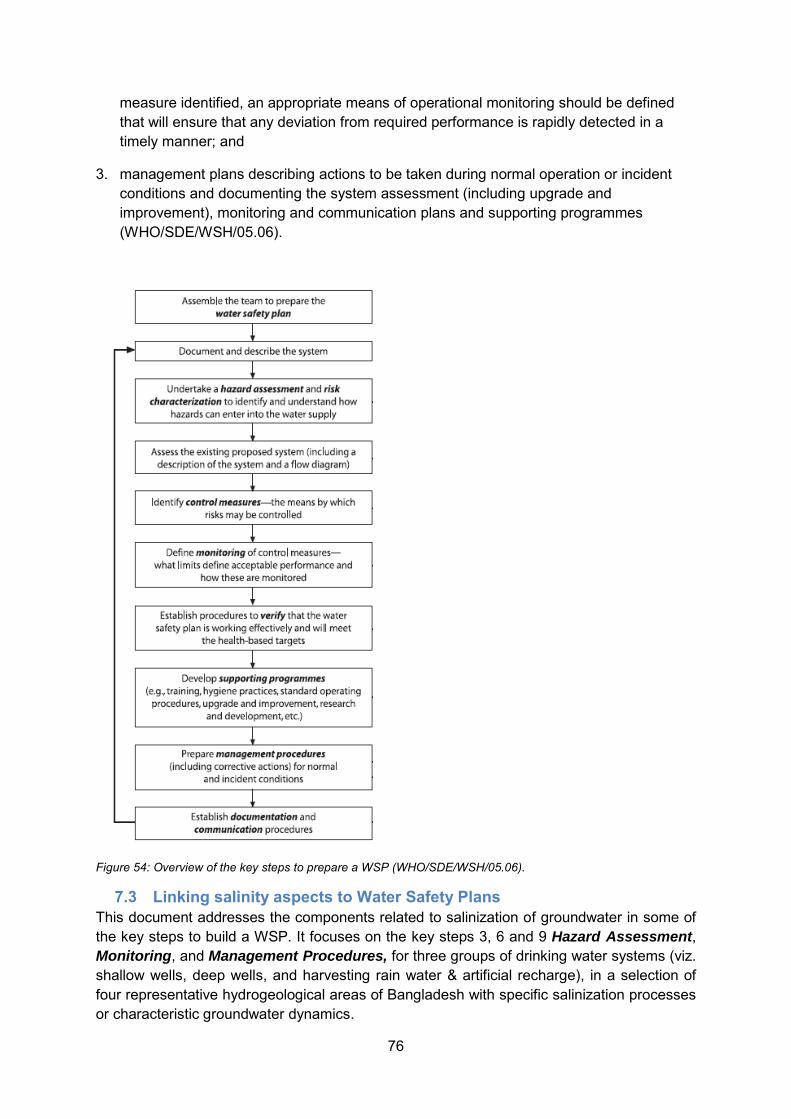
76
measure identified, an appropriate means of operational monitoring should be defined that will ensure that any deviation from required performance is rapidly detected in a timely manner; and
3. management plans describing actions to be taken during normal operation or incident conditions and documenting the system assessment (including upgrade and improvement), monitoring and communication plans and supporting programmes (WHO/SDE/WSH/05.06).
Figure 54: Overview of the key steps to prepare a WSP (WHO/SDE/WSH/05.06).
7.3 Linking salinity aspects to Water Safety Plans This document addresses the components related to salinization of groundwater in some of the key steps to build a WSP. It focuses on the key steps 3, 6 and 9 Hazard Assessment, Monitoring, and Management Procedures, for three groups of drinking water systems (viz. shallow wells, deep wells, and harvesting rain water & artificial recharge), in a selection of four representative hydrogeological areas of Bangladesh with specific salinization processes or characteristic groundwater dynamics.
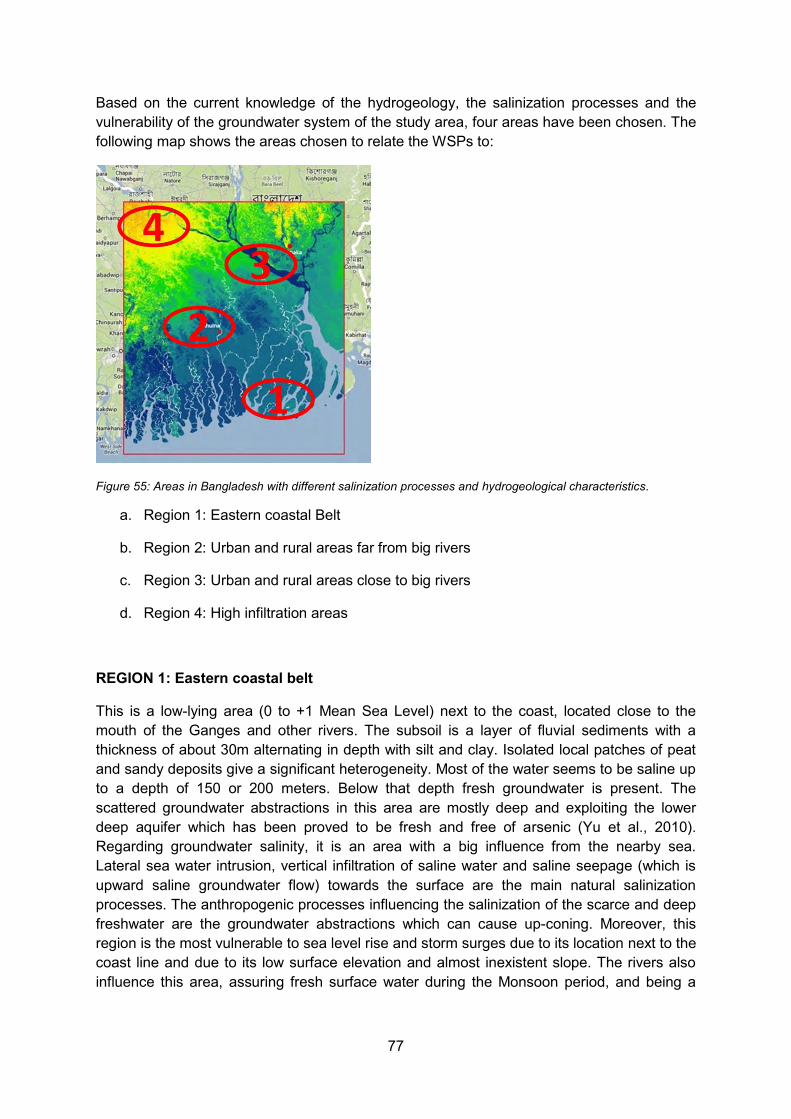
77
Based on the current knowledge of the hydrogeology, the salinization processes and the vulnerability of the groundwater system of the study area, four areas have been chosen. The following map shows the areas chosen to relate the WSPs to:
Figure 55: Areas in Bangladesh with different salinization processes and hydrogeological characteristics.
a. Region 1: Eastern coastal Belt
b. Region 2: Urban and rural areas far from big rivers
c. Region 3: Urban and rural areas close to big rivers
d. Region 4: High infiltration areas
REGION 1: Eastern coastal belt
This is a low-lying area (0 to +1 Mean Sea Level) next to the coast, located close to the mouth of the Ganges and other rivers. The subsoil is a layer of fluvial sediments with a thickness of about 30m alternating in depth with silt and clay. Isolated local patches of peat and sandy deposits give a significant heterogeneity. Most of the water seems to be saline up to a depth of 150 or 200 meters. Below that depth fresh groundwater is present. The scattered groundwater abstractions in this area are mostly deep and exploiting the lower deep aquifer which has been proved to be fresh and free of arsenic (Yu et al., 2010). Regarding groundwater salinity, it is an area with a big influence from the nearby sea. Lateral sea water intrusion, vertical infiltration of saline water and saline seepage (which is upward saline groundwater flow) towards the surface are the main natural salinization processes. The anthropogenic processes influencing the salinization of the scarce and deep freshwater are the groundwater abstractions which can cause up-coning. Moreover, this region is the most vulnerable to sea level rise and storm surges due to its location next to the coast line and due to its low surface elevation and almost inexistent slope. The rivers also influence this area, assuring fresh surface water during the Monsoon period, and being a

78
main conduit of saline surface water during the dry season. The area is dominated by small farmers that mostly irrigate their crops with surface water.
REGION 2: Urban and rural areas far from big rivers
This is a low-lying area (around 0 to +1 mean sea level) located at tens of kilometers from the sea. It is far from the big rivers but close to the mangrove forest. The groundwater of this area is mostly influenced by the sea and the mangrove area. The outstretched surface water system consisting of a dense network of small rivers also influences the area by bringing in surface salt water wedges in the dry season (Savenije et al., 2008). The area also gets saline seepage through the entire year, almost not noticing the seasonal effects of the surface water. According to the available salinity data, most shallow groundwater is brackish or saline, and just at depths of >100m, the groundwater is fresh. This area uses less surface water for irrigation and uses more groundwater than the coastal belt. The abstractions are mostly deep wells due to the salinity and arsenic concentrations, while the shallow wells are scarce and aiming at the freshwater lenses created by the infiltration of rainwater. The vulnerability of this area is mostly subjected to the sea level rise and possible increase of saline seepage. An overexploitation of the fresh deep groundwater can also lead to both up-coning of deeper saline groundwater as well as percolation of shallower saline groundwater.
REGION 3: Urban and rural areas close to big rivers
This region is located at 5 to 6m above mean sea level and about 200km from the coast line. It is close to Dhaka and to the Ganges River. These two elements are the determinants of the groundwater dynamics in the area. Moreover, this region is located at the transition zone between the relatively sandy homogeneous aquifer, and the heterogeneous southern areas with thick clay layers. It is significantly influenced by the seasons and the concentration of the water in the Ganges. During the Monsoon season, the fresh water of the big rivers infiltrates and appears as seepage at shallow depths. During the dry periods, although the saline sea water that intrudes in the Ganges does not reach Dhaka, the decrease on outflow influences the groundwater levels at shallow depths. The high dependency of the dynamics of this area on the dynamics of the surface water, makes it very vulnerable in terms of salinization to sea level rise as well as to the change in rain patterns.
REGION 4: High infiltration areas
This area is located at about 15m above sea level and far from the coast and the big rivers. It is a relatively high infiltration area that receives groundwater flowing from the northern mountain chains into the aquifers. This area does not sense current salinization issues. However, bad water management practices in the past and the future (large groundwater abstractions leading to serious head drops) and the not stationary salinity distribution in the groundwater (Yu et al., 2010), could lead to these issues. In this area irrigation and drinking water is mostly groundwater extracted in shallow wells and surface water.
7.4 Water Supply Technologies The different water supply technologies have been divided in three groups (shallow wells, deep wells and harvesting rain water & artificial recharge). The suggestion for this division relies on the fact that the origin of the salinization risks associated to each technology is different. As such, the risks associated to deep wells have a hazard from a different origin than the risks associated to shallow wells (for example up-coning of saline groundwater
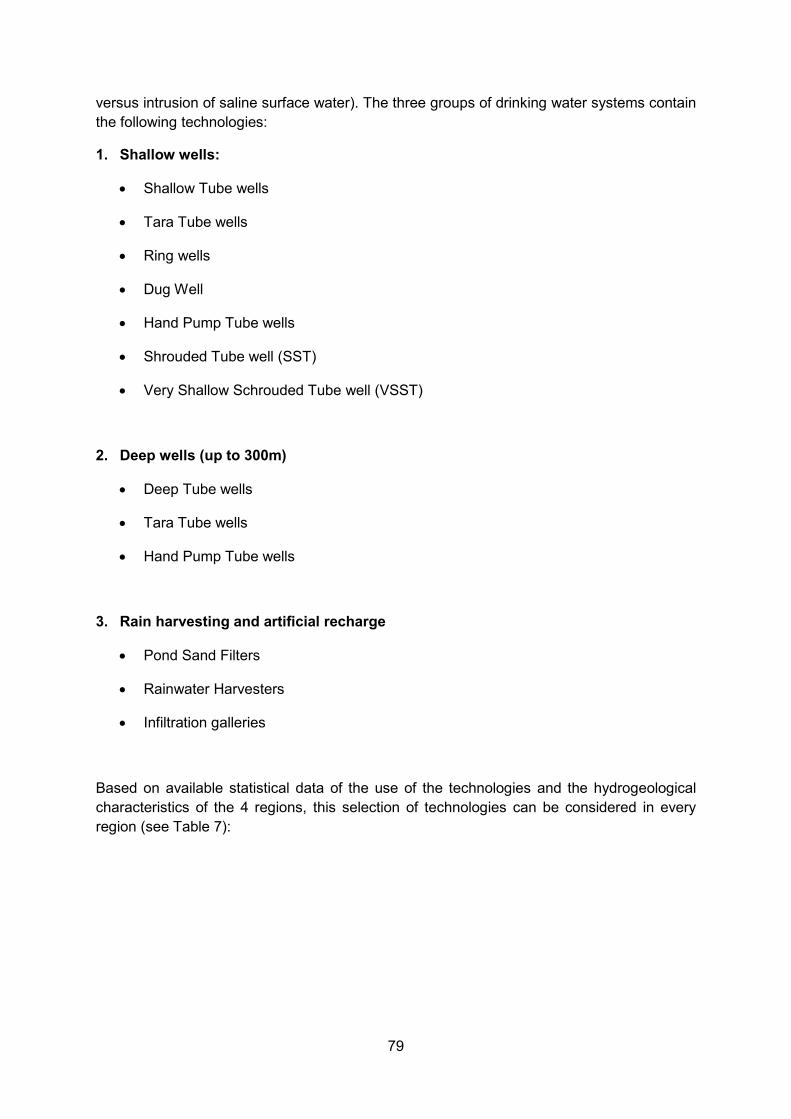
79
versus intrusion of saline surface water). The three groups of drinking water systems contain the following technologies:
1. Shallow wells:
Shallow Tube wells
Tara Tube wells
Ring wells
Dug Well
Hand Pump Tube wells
Shrouded Tube well (SST)
Very Shallow Schrouded Tube well (VSST)
2. Deep wells (up to 300m)
Deep Tube wells
Tara Tube wells
Hand Pump Tube wells
3. Rain harvesting and artificial recharge
Pond Sand Filters
Rainwater Harvesters
Infiltration galleries
Based on available statistical data of the use of the technologies and the hydrogeological characteristics of the 4 regions, this selection of technologies can be considered in every region (see Table 7):

80
Table 7: Classification of technologies per selected region
Region Group of technologies Region 1: Coastal Belt Deep wells, rain harvesting and artificial
recharge Region 2: Urban and rural areas far from big rivers
Deep wells (and shallow wells), rain harvesting and artificial recharge
Region 3: Urban and rural areas close to big rivers
Shallow wells (and deep wells), rain harvesting and artificial recharge
Region 4: High infiltration areas Shallow wells (and deep wells), rain harvesting and artificial recharge
Currently so-called technology maps are being developed. These maps show the suitability of each technology per Upazila. The availability of those maps would help refining the classification made in Table 7.
The input for the WSPs has been divided per component and has been linked to a group of technologies. The following components are discussed below:
1. Hazard Assessment
2. Design of the system
3. Control Measures and Monitoring
4. Management Procedures
Hazard Assessment
Previous studies (Yu et al., 2010; Zahid and Ahmed, 2006; Zahid, 2014) mentioned that the primary salinization processes impacting fresh water in Bangladesh are: upconing due to pumping, lateral seawater intrusion and salt water intrusion due to inundation caused by periodic storm surges. In this section, these hazards and others likely to happen in Bangladesh such as seepage, lateral salt water intrusion near rivers, and vertical percolation in depth, will be described so that they can be taken into account when drafting the WSPs.
Up-coning: When fresh groundwater lies on salt water and there is no impermeable layer between them, pumping fresh groundwater may cause the vertical movement of saline groundwater towards the well intake. This process is called up-coning, see Figure 53a. The ultimate consequence of up-coning is the salinization of the well. The recovery of a salinized well can just be achieved by 1) cessation of water abstraction during a period at least three to ten times longer than the period that caused the salinization of the well (Ward et al., 2007), or 2) by injection of fresh water (artificial aquifer recharge) (Zuurbier et al., 2014).
Later sea water intrusion: this is a natural process that can also be accelerated by pumping (see Figure 53a). In a confined aquifer of fresh water, the abstraction of groundwater causes a drawdown of the water table. The tendency of the system to equilibrate pressures can cause the displacement of nearby water towards the well. This can accelerate the lateral salt water intrusion and cause the salinization of the well.
Salt water intrusion caused by inundation: the periodic inundation of an area due to storm surges can cause vertical percolation of saline water in the aquifer, see Figure 53e. A
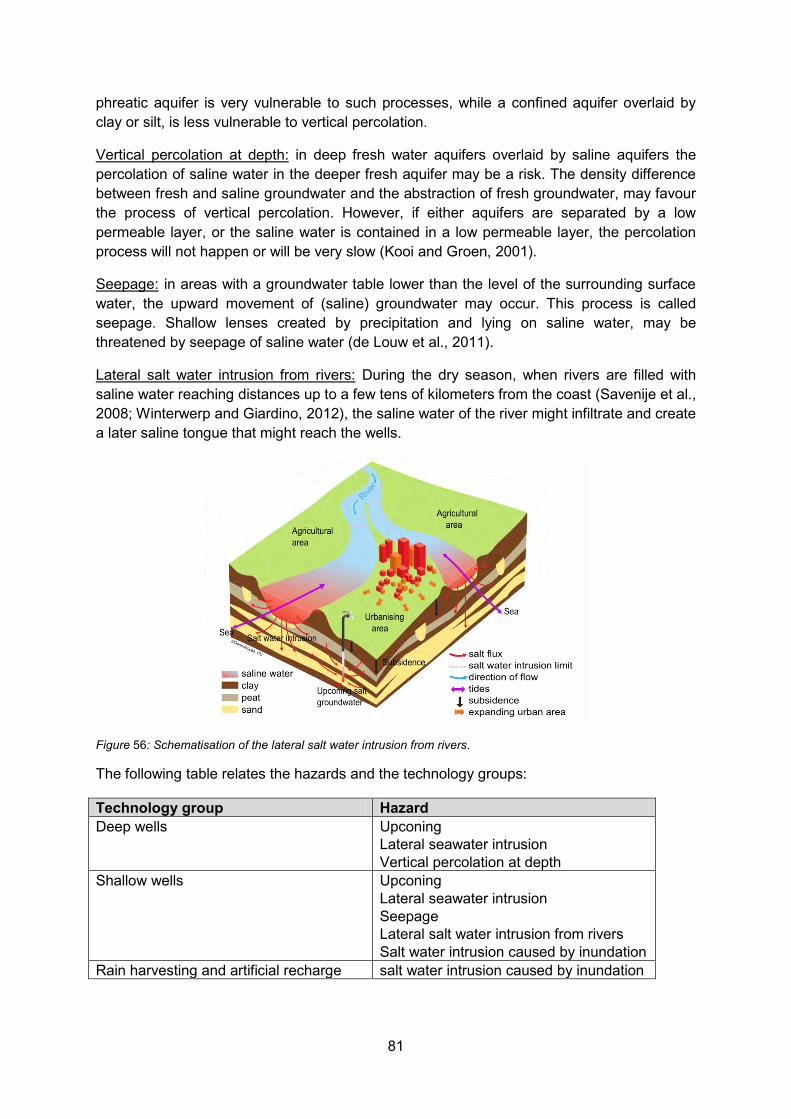
81
phreatic aquifer is very vulnerable to such processes, while a confined aquifer overlaid by clay or silt, is less vulnerable to vertical percolation.
Vertical percolation at depth: in deep fresh water aquifers overlaid by saline aquifers the percolation of saline water in the deeper fresh aquifer may be a risk. The density difference between fresh and saline groundwater and the abstraction of fresh groundwater, may favour the process of vertical percolation. However, if either aquifers are separated by a low permeable layer, or the saline water is contained in a low permeable layer, the percolation process will not happen or will be very slow (Kooi and Groen, 2001).
Seepage: in areas with a groundwater table lower than the level of the surrounding surface water, the upward movement of (saline) groundwater may occur. This process is called seepage. Shallow lenses created by precipitation and lying on saline water, may be threatened by seepage of saline water (de Louw et al., 2011).
Lateral salt water intrusion from rivers: During the dry season, when rivers are filled with saline water reaching distances up to a few tens of kilometers from the coast (Savenije et al., 2008; Winterwerp and Giardino, 2012), the saline water of the river might infiltrate and create a later saline tongue that might reach the wells.
Figure 56: Schematisation of the lateral salt water intrusion from rivers.
The following table relates the hazards and the technology groups:
Technology group Hazard Deep wells Upconing
Lateral seawater intrusion Vertical percolation at depth
Shallow wells Upconing Lateral seawater intrusion Seepage Lateral salt water intrusion from rivers Salt water intrusion caused by inundation
Rain harvesting and artificial recharge salt water intrusion caused by inundation

82
Design of the system
In order to avoid some of the above mentioned hazards, the following factors need to be taken into account during the design of the water system:
Exploration phase: Before implementing a vertical well, besides the general exploration phase, an exploration phase of the aquifer properties and the groundwater dynamics from a groundwater salinization perspective is also needed. Key information to decide on well location and well design is:
stratigraphy in the area: identify aquifers, semi confining and confining layers;
location of other wells;
aquifer properties: horizontal and vertical hydraulic conductivity;
regional and local groundwater flow and dynamics;
salt distribution in the vertical from the surface until the brackish interface, salt distribution horizontally. A good way to determine this is to do a resistivity logging along the well, see section 4.3, page 33.
Location of the screen: the location of the depth of the well screen has to be a function of:
depth of the freshwater lens;
stationary drawdown (hydraulic properties of the aquifer);
depth of the interface of brackish or saline water – see exploration phase above;
the expected pumping rate. The pumping rate needs to be determined as a function of the drawdown of the piezometric head, the risk of up-coning of the fresh-brackish interface (e.g., is the aquifer confined or unconfined? Is it overlaid by a saline aquifer?), the water demand, and the hydraulic properties of the aquifer.
The groundwater extracted should not over exceed the recharge of the aquifer. Otherwise there is mining of the aquifer.
The screen should be set as high as possible within the fresh water body, always taking into account the stationary drawdown caused by the abstraction.
Protection from inundation: salt water intrusion of surface water caused by inundation is frequent close to the coast or to rivers. Shallow wells and rain harvesting systems are very vulnerable to it. A dike or another impermeable system should be built around the drink water source in order to protect it from the inundations.
Control Measures and Monitoring
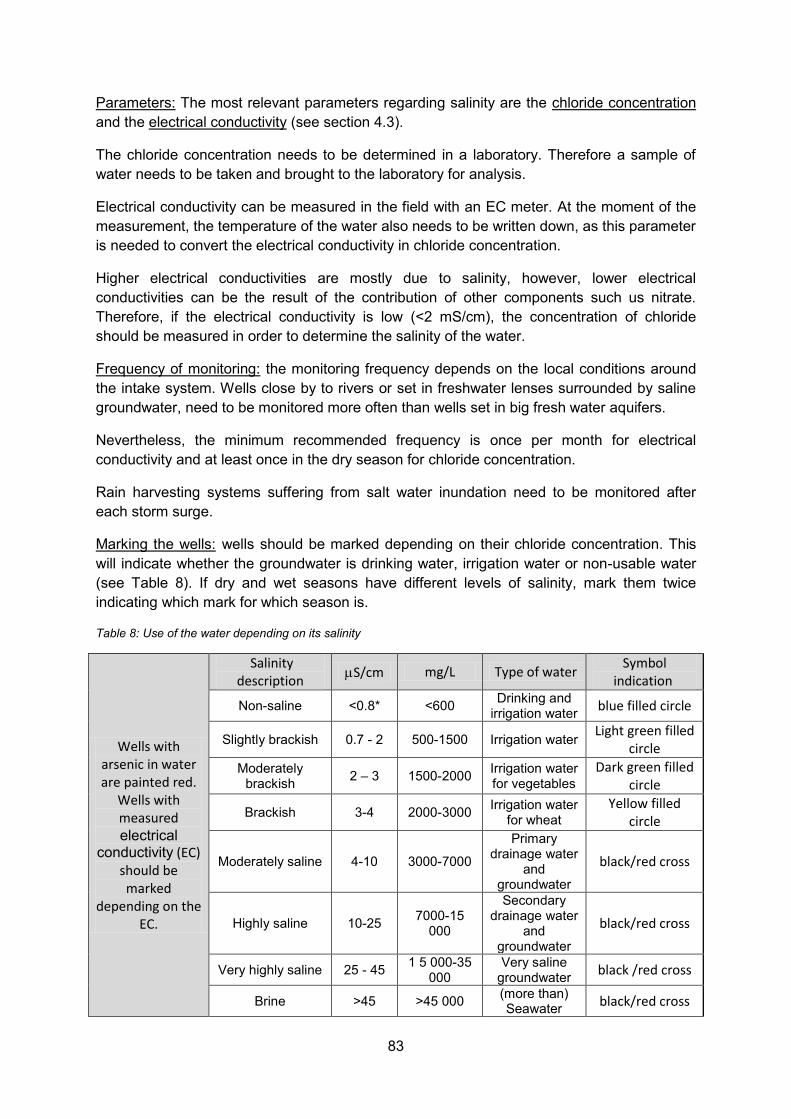
83
Parameters: The most relevant parameters regarding salinity are the chloride concentration and the electrical conductivity (see section 4.3).
The chloride concentration needs to be determined in a laboratory. Therefore a sample of water needs to be taken and brought to the laboratory for analysis.
Electrical conductivity can be measured in the field with an EC meter. At the moment of the measurement, the temperature of the water also needs to be written down, as this parameter is needed to convert the electrical conductivity in chloride concentration.
Higher electrical conductivities are mostly due to salinity, however, lower electrical conductivities can be the result of the contribution of other components such us nitrate. Therefore, if the electrical conductivity is low (<2 mS/cm), the concentration of chloride should be measured in order to determine the salinity of the water.
Frequency of monitoring: the monitoring frequency depends on the local conditions around the intake system. Wells close by to rivers or set in freshwater lenses surrounded by saline groundwater, need to be monitored more often than wells set in big fresh water aquifers.
Nevertheless, the minimum recommended frequency is once per month for electrical conductivity and at least once in the dry season for chloride concentration.
Rain harvesting systems suffering from salt water inundation need to be monitored after each storm surge.
Marking the wells: wells should be marked depending on their chloride concentration. This will indicate whether the groundwater is drinking water, irrigation water or non-usable water (see Table 8). If dry and wet seasons have different levels of salinity, mark them twice indicating which mark for which season is.
Table 8: Use of the water depending on its salinity
Wells with arsenic in water are painted red.
Wells with measured electrical
conductivity (EC) should be marked
depending on the EC.
Salinity description
S/cm mg/L Type of water Symbol
indication
Non-saline <0.8* <600 Drinking and irrigation water blue filled circle
Slightly brackish 0.7 - 2 500-1500 Irrigation water Light green filled circle
Moderately brackish 2 – 3 1500-2000 Irrigation water
for vegetables Dark green filled
circle
Brackish 3-4 2000-3000 Irrigation water for wheat
Yellow filled circle
Moderately saline 4-10 3000-7000
Primary drainage water
and groundwater
black/red cross
Highly saline 10-25 7000-15 000
Secondary drainage water
and groundwater
black/red cross
Very highly saline 25 - 45 1 5 000-35 000
Very saline groundwater black /red cross
Brine >45 >45 000 (more than) Seawater black/red cross

84
*Higher electrical conductivities are mostly due to salinity, however, lower electrical conductivities can be the result of the contribution of other components.
Screen of a monitoring well: For monitoring purposes, wells should not be screened along the entire depth, but at a certain depth. Otherwise the water is mixed along the well and no conclusions can be drawn on the salinity distribution in depth (Prinos et al., 2014).
Determine the interaction between surface water and groundwater: for shallow wells located close to rivers, understanding the dynamics of the interaction of surface water and groundwater is of key importance. The infiltrating or draining character of the river will give an indication of the risk for groundwater salinization. If a river is draining the aquifer, there is no risk for salinization (except for salt water intrusion due to inundation). If the river is infiltrating, there is risk for salinization due to lateral salt water intrusion and seepage. In Bangladesh, the draining of infiltrating character of a river is likely to change per season.
In order to monitor the interaction of aquifer and river:
set a row of piezometers from the surface water until the well to monitor. Make sure that there is at least: 1) one piezometer in the river with a screen below the river bed, 2) a river gauge (or a stilling well) to measure the stage of the river, and 3) a piezometer close to the well;
measure the groundwater table at all the piezometers. In this way a profile of the groundwater table from the well to the river can be drawn;
measure the groundwater table for a period of at least one week every season. Make sure that you measure during rainy periods and dry periods with a high frequency;
if possible collect information of the precipitation;
if possible collect information of the geology;
try to draw a profile of the groundwater table from the well to the river for each measurement (see example in Figure 57).
Figure 57: Example profile to understand dynamics groundwater-surface water.
85
Management Procedures
There are several management procedures necessary to ensure a sustainable use of the freshwater resource. Some of the strategies are further explained in this section.
Decrease the pumping rate: as mentioned above, all wells should be monitored in terms of chloride concentration and electrical conductivity. If an increase of the salinity of the extracted water is observed and the pumping rate is not modified, probably the salinity will keep on increasing and after a certain point the, well will have to be abandoned.
If an increase of the chloride concentration above 400 mg/L is observed, the pumping rate should be decreased.
If the salinity continues to increase and it reaches the 600 mg/L, the well should not be used for drinking water anymore.
For deep wells in Bangladesh the recovery time is unknown but it is expected to be in the order of tenths of times longer than the abstraction period. Monitoring during the recovery period is recommended.
Shallow wells influenced by the surface water system can recover faster. The cessation of the abstraction should last at least until the end of the next wet season. Monitoring during the recovery period is recommended.
Regulate the surface water level: If a shallow well is significantly influenced by the surrounding surface water system, the water level of the surface water system could be controlled in order to avoid seepage and lateral salt water intrusion. A water level closer to the groundwater table will decrease the lateral salt water intrusion as well as the seepage. Quick exercises with analytical solutions can be executed to get an idea of the extent of the surface water groundwater-interactions (Huisman and Olsthoorn, 1987).
Testing: All wells must be tested for chloride before they are handed in to the community:
if the chloride is higher than 600 mg/L, they should not be handed in to the community as drinking water wells;
if chloride is higher than 3000 mg/L they should not be handed in to the community, at all.
Dilution of the salt concentration: in harvesting rainwater systems after a storm surge, the salt concentration can be diluted by letting more fresh water come into the catchment before utilizing the water from the collection point. Otherwise, fresh water collected in calm weather periods, can be used to dilute the salt concentration of the water with higher salt content.
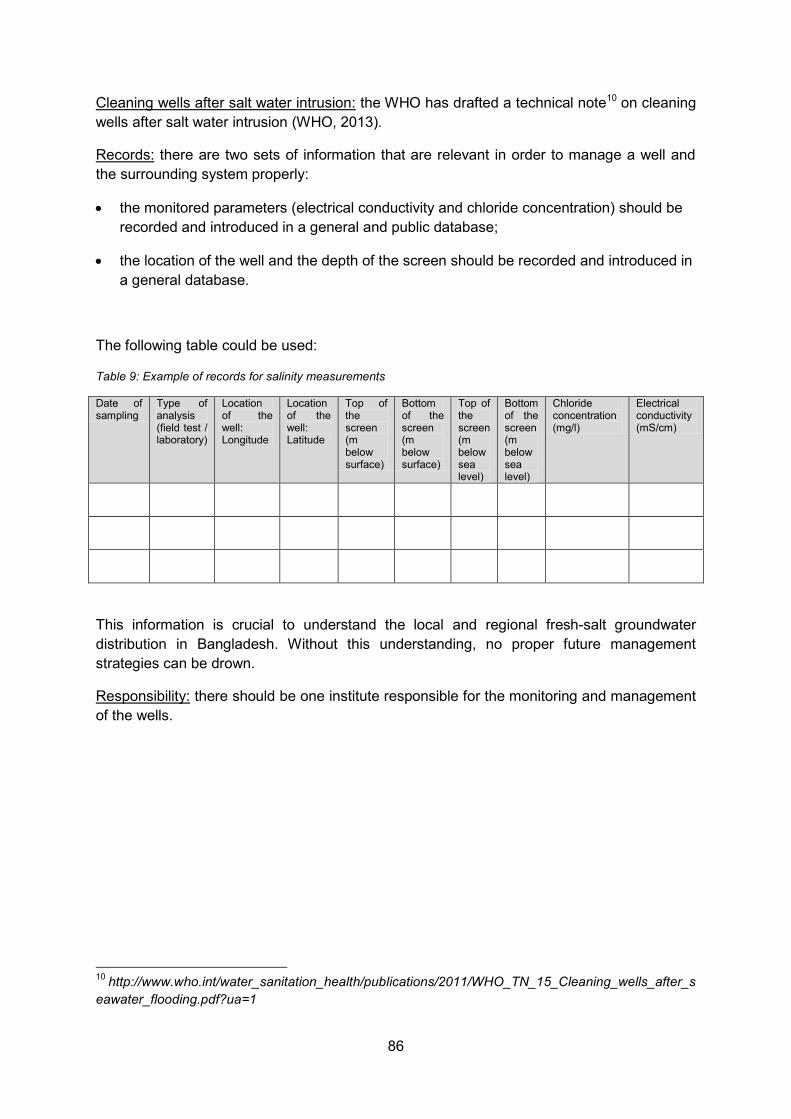
86
Cleaning wells after salt water intrusion: the WHO has drafted a technical note10 on cleaning wells after salt water intrusion (WHO, 2013).
Records: there are two sets of information that are relevant in order to manage a well and the surrounding system properly:
the monitored parameters (electrical conductivity and chloride concentration) should be recorded and introduced in a general and public database;
the location of the well and the depth of the screen should be recorded and introduced in a general database.
The following table could be used:
Table 9: Example of records for salinity measurements
Date of sampling
Type of analysis (field test / laboratory)
Location of the well: Longitude
Location of the well: Latitude
Top of the screen (m below surface)
Bottom of the screen (m below surface)
Top of the screen (m below sea level)
Bottom of the screen (m below sea level)
Chloride concentration (mg/l)
Electrical conductivity (mS/cm)
This information is crucial to understand the local and regional fresh-salt groundwater distribution in Bangladesh. Without this understanding, no proper future management strategies can be drown.
Responsibility: there should be one institute responsible for the monitoring and management of the wells.
10 http://www.who.int/water_sanitation_health/publications/2011/WHO_TN_15_Cleaning_wells_after_seawater_flooding.pdf?ua=1

87
8 Conclusions and Recommendations
8.1 Outcome of the dissemination workshop The dissemination workshop took place on the 2nd and 3rd of September in Dhaka. A summarized report on the workshop can be found in Annex 6. Here only the main outcomes are presented.
The dissemination workshop covered various topics related to safe drinking water supply in the coastal areas of Bangladesh. It included the origin of salinity, geographic distribution of salinity, hydro-stratigraphy of the project area, monitoring of groundwater level and quality data for future management of the groundwater system, modelling the sea water intrusion in the project area, different strategies of fresh water supply for different hydrogeological set up, modification of Water Safety Plans and also the use of smartphone to collect huge field level EC data in a cheap way.
Groundwater salinity data of BRAC WASH program were very much useful in understanding salinity distribution at a certain depth of the aquifer. It was observed that even the deeper aquifer in some parts of the project area is saline and do not satisfy the drinking water standard of Bangladesh. The variation of water chemistry at a small depth range reflects the heterogeneity of the aquifer.
The objectives of the dissemination workshop were to communicate and share the project findings with different stakeholders and to receive feedback from them. Participants of various organisations, exchanged their views and discussed the findings.
It has been accepted by the participants that for managing the salinity problem in the coastal area of Bangladesh systematic monitoring of different aspects of groundwater resource, modelling of sea water intrusion in the coastal area and cautious application of suggested strategies and Water Safety Plans are highly important.
The proposed strategies and Water Safety Plans are the key to ensure long lasting fresh water supply for domestic and irrigation purposes in the coastal area of Bangladesh.
8.2 Conclusions The coastal area of Bangladesh is geologically and hydrogeologically complex. The sea regressions and transgressions and the river dynamics of the past thousands of years created an intricate system of sedimentary deposits containing fresh and saline water. The anthropogenic actions through groundwater abstractions are impacting the system, making it even more complex. In addition, the lack of enough reliable geological and hydrogeological data makes a clear and straight forward analysis even more difficult. However, the analysed information gave enough insights to conclude that the upper delta seems to be fresh and stays fresh during the steady dynamic evolution of the salinity distribution. In the southern part, groundwater is brackish to saline from 10 up to 150mt. Moreover, defining one clear salinity groundwater front inland is complicated due to the scattered pattern of fresh and saline groundwater in the coastal zone. Pockets of fresh and saline groundwater are found distributed near by the coast.
88
Other relevant conclusions are the following:
Different types of salinization processes are currently taking place in Bangladesh. The most important ones being: lateral surface salt water intrusion, lateral saline groundwater intrusion, vertical up-coning under groundwater abstractions and low-lying areas, infiltration of salt due to inundations caused by storm surges.
The awareness of population regarding the existence, relevance and dynamics of these processes is poor. Awareness material such as the leaflets created in SWIBANGLA can help spreading the knowledge on how to monitor this processes and how to mitigate their impacts.
Systematic monitoring of groundwater is of key importance to understand the functioning of the hydrogeological system and the velocity of the salinization processes. This systematic monitoring is currently not taking place in Bangladesh, but rather an uncoordinated effort.
Deep groundwater is the most reliable source for drinking water supply, but is likely not renewable and must be used only for drinking water supply. The abstraction must be managed and monitored systematically.
In Lower Delta Plain, strategies for go-fresh and deep well injection should be implemented to achieve long-term sustainability of safe drinking water supply. In Upper Delta Plain, conjunctive use of surface and groundwater should be investigated. Feasible technologies include river bank infiltration, gallery, and infiltration basin.
Several mitigation strategies that could be applied in Bangladesh to counteract the salinization impacts were identified. Specifically the conjunctive use of surface water and groundwater, the systematic monitoring and the artificial recharge have been identified as potential measures.
Important input for the WSPs are the salinization hazards related to each water supply technology, the needed changes in the design to prevent salinization, the control and monitoring measures for technologies susceptible to be affected by salinization, and the specific management procedures to prevent and counteract salinization. For each technology the mentioned aspects have been identified and they should be included in the next generation of WSPs.
8.3 Recommendations Salinization of surface and groundwater is such a major issue in the coastal zone of Bangladesh, that it requires special attention. Currently different projects tackling the salinization problematic are carried out; however, these projects do not make part of a specific program to understand, prevent and counteract salinization, but are rather independent. More effective than independent projects would be to define a stepwise plan to approach the salinization issue in an integrated manner. This requires a coordinated effort between the responsible authorities. The plan or program should include a data collection phase during which efforts of several projects such as the ones of BWDB are integrated to collect valuable data on salinization processes. The next step should be the analysis of this
89
data and the integration of this data in modelling instruments. Models developed by IWM and the model SWIBANGLA could be used as they are readily available. Once these models have been validated, they could be used to understand and predict salinization processes at different scales. This information would help defining prevention and counteract measures. Thereafter other modelling efforts should be identified and carried out in the most vulnerable areas to salinization. The availability of data and model results would form a solid basis for the study of the feasibility of potential mitigation strategies.
Besides this coordinated effort for an integrated program for salinization, we encourage to follow the next relevant recommendations regarding the monitoring of salinization process:
Determine clear monitoring objectives. Every objective has its own design criteria, in space and in time. Often different objective monitoring networks can be combined.
Define monitoring networks to monitor groundwater salinization. These networks have particular characteristics and it is strongly recommended to design and drill monitoring networks to monitor salinization processes at several points in the coastal zone.
Collect and store all monitoring data in 1 central database. A centrally organized and publicly available database with data regarding: geology, hydraulic properties of the ground, groundwater levels, groundwater quality and well location is needed.
One organization should be responsible for the monitoring and management of the wells. Bring all monitoring stakeholders together in one network (at least one meeting/year).
Produce clear graphs, maps etc. to show the monitoring results on a public website.
Determine in advance what you decide to do with results, passing thresholds (“the red dot method is no solution”).
Explore the potential of participative monitoring. Some instruments such as SWAPP can be of great help at community level in terms of data gathering and health improvement.
In terms of management strategies to prevent and counteract salinization of existing wells, the following recommendations are made:
Pumping rate of a well should be controlled and the water extracted should not exceed the recharge of the aquifer. Otherwise there may be mining of the aquifer and acceleration of the salinization.
The screen should be set as high as possible within the fresh water body, always taking into account the stationary drawdown caused by the abstraction.
If an increase of the chloride concentration above 400 mg/L is observed, the pumping rate should be decreased. If the salinity continues to increase and it reaches the 600mg/l, the well should not be used for drinking water anymore.
Regarding modelling and mitigation strategies:
Train DPHE, BWDB and IWM on the use of the SWIBANLGA model. A training workshop was carried out, however, a longer course is needed to train the professionals

90
on modifying input, running the model and creating scenarios. The continuation in the learning process is necessary.
Choose a specific modeller and train him/her on salt transport modelling in groundwater, so that he can generate and evaluate models.
Keep de model up to date with new data.
Get a better understanding of paleo-morphological and geological evolution, as the boundary conditions change significantly during geological times affecting the salinity distributions seriously.
Validate the model with chloride concentration measures and groundwater table measures.
Use the validated model to identify areas which need monitoring networks.
91
Acknowledgements
Completing the work presented in this report and preparing this report would not have been possible without the help of many people. The project has gone through some difficulties but with the support and help of the people we mention in this paragraph, we managed to complete it to the satisfaction of the authors and the receivers. Therefore the authors would like to explicitly thank Mr. Mohammad Mofazzal Hoque for his support and sharp advice in all phases of the project. His experience and knowledge about the hydrological system in Bangladesh have been of key relevance for the project. Also our thanks to Mr. Charles Batchelor for his supervision, help, and critical expert comments which helped us sharpen our research. We also want to thank Mr. Jan Willem Dogger, and Ms. Ingeborg Krukkert for their support and guidance from IRC and their mediation when problems arose. Many thanks to Mr. Ibrahim and Mr. Saifur from DPHE for making the continuation of the project possible, and for facilitating the workshops and courses. We are also very grateful by the work done by the students that participated in this project, especially the students of Jahangirnagar University. We would also like to thank CEGIS for their initial participation in the project and the data delivered. Especial thanks to the participants of the Fact Finding workshop and the Dissemination workshop; their input was very valuable to shape the project and also to assess the outcomes.
92
References
Acacia Water, 2011. Creating fresh water bubbles in brackish aquifer.
Aggarwal, P.K., Basu, A.R., Poreda, R.J., Kulkarni, K.M., Froehlich, K., Tarafder, S.A., Ali, M., Ahmed, N., Hossain, A., Rahman, M., Ahmed, S.R., 2000. A report on isotope hydrology of groundwater in Bangladesh: implications for characterization and mitigation of arsenic in groundwater.
Allison, M.A., Khan, S.R., Goodbred, S.L., Kuehl, S.A., 2003. Stratigraphic evolution of the late Holocene Ganges – Brahmaputra lower delta plain. Sedimentary Geology 155, 317–342.
Aqualinc, 2014. Infiltration Gallery Guidelines Design, Construction, Operation & Maintenance; Prepared for Marlborough District Council, Report No 14003/2.
Asian Development Bank, 2013. People’s Republic of Bangladesh: Strengthening the Resilience of the Urban Water Supply, Drainage, and Sanitation to Climate Change in Coastal Towns (Financed by the Japan Fund for Poverty Reduction).
BADC, 2011. Identification of Underground Salinity Front of Bangladesh, Bangladesh Agricultural Development Corporation.
Barlow, P.M., 2003. Ground Water in Freshwater-Saltwater Environments of the Atlantic Coast U.S. Department of the Interior.
Basu, A.R., Jacobsen, S.B., Poreda, R.J., Dowling, C.B., Aggarwal, P.K., 2001. Large groundwater strontium flux to the oceans from the bengal basin and the marine strontium isotope record. Science 293, 1470–1473.
BGS and DPHE, 2001. Arsenic contamination of groundwater in Bangladesh. British Geological Survey Technical Report WC/00/19.
CEGIS, 2013. Institutional Aspects of Water Resources Management in.
Cobaner, M., Yurtal, R., Dogan, A., Motz, L.H., 2012. Three dimensional simulation of seawater intrusion in coastal aquifers: A case study in the Goksu Deltaic Plain. Journal of Hydrology 464-465, 262–280.
CSIRO, 2014. Bangladesh Integrated Water Resources Assessment: final report. CSIRO, BIDS, BWDB, CEGIS, IWM, WARPO.
Custodio, E., 2002. Aquifer overexploitation: what does it mean? Hydrogeology Journal 10, 254–277.
Custodio, E., Bruggeman, G.A., 1987. Groundwater Problems in Coastal Areas, Studies and Reports in Hydrology. UNESCO, International Hydrological Programme, Paris.
Dagan, G., Bear, J., 1968. Solving The Problem Of Local Interface Upconing In A Coastal Aquifer By The Method Of Small Perturbations, Journal of Hydraulic Research.
De Lange, W.J., Prinsen, G.F., Hoogewoud, J.C., Veldhuizen, A. a., Verkaik, J., Oude Essink, G.H.P., van Walsum, P.E.V., Delsman, J.R., Hunink, J.C., Massop, H.T.L.,

93
Kroon, T., 2014. An operational, multi-scale, multi-model system for consensus-based, integrated water management and policy analysis: The Netherlands Hydrological Instrument. Environmental Modelling & Software 59, 98–108.
De Louw, P.G.B., Eeman, S., Siemon, B., Voortman, B.R., Gunnink, J.L., van Baaren, E.S., Oude Essink, G.H.P., 2011. Shallow rainwater lenses in deltaic areas with saline seepage. Hydrology and Earth System Sciences 15, 3659–3678.
Delsman, J.R., Hu-a-ng, K.R.M., Vos, P.C., de Louw, P.G.B., Oude Essink, G.H.P., Stuyfzand, P.J., Bierkens, M.F.P., 2014. Paleo-modeling of coastal saltwater intrusion during the Holocene: an application to the Netherlands. Hydrology and Earth System Sciences 18, 3891–3905.
Dillon, P., Molloy, R., 2006. Developing Aquifer Storage and Recovery (ASR) Opportunities in Melbourne.
Dillon, P.J., 2005. Future management of aquifer recharge. Hydrogeology Journal 13, 313–316.
Emery, K.O., Aubrey, D.G., 1989. Tide Gauges of India. Journal of Coastal Research 5, 489–501.
Erkens, G., Bucx, T., Dam, R., De Lange, G., Lambert, J., 2014. Sinking coastal cities: a research agenda towards solutions for subsiding delta cities. Delft.
Faneca Sànchez, M., Gunnink, J.L., van Baaren, E.S., Oude Essink, G.H.P., Auken, E., Elderhorst, W., de Louw, P.G.B., 2012. Modelling climate change effects on a Dutch coastal groundwater system using airborne electromagnetic measurements. Hydrology and Earth System Sciences 16, 4499–4516.
Ferguson, G., Gleeson, T., 2012. Vulnerability of coastal aquifers to groundwater use and climate change. Nature Climate Change 2, 342–345.
Gleeson, T., Alley, W.M., Allen, D.M., Sophocleous, M.A., Zhou, Y., Taniguchi, M., VanderSteen, J., 2012. Towards sustainable groundwater use: setting long-term goals, backcasting, and managing adaptively. Ground water 50, 19–26.
Goes, B.J.M., Oude Essink, G.H.P., Vernes, R.W., Sergi, F., 2009. Estimating the depth of fresh and brackish groundwater in a predominantly saline region using geophysical and hydrological methods , Zeeland , the Netherlands. Near Surface Geophysics 7, 401–412.
Goodbred, S.L., Kuehl, S.A., 2000. The significance of large sediment supply , active tectonism , and eustasy on margin sequence development : Late Quaternary stratigraphy and evolution of the Ganges – Brahmaputra delta. Sedimentary Geology 133, 227–248.
Green, T.R., Taniguchi, M., Kooi, H., Gurdak, J.J., Allen, D.M., Hiscock, K.M., Treidel, H., Aureli, A., 2011. Beneath the surface of global change: Impacts of climate change on groundwater. Journal of Hydrology 405, 532–560.
Hill, M.C., 1990. Preconditioned conjugate-gradient 2 (PCG2), a computer program for solving ground-water flow equations.
94
Hoque, M.A., Burgess, W.G., 2012. 14C dating of deep groundwater in the Bengal Aquifer System, Bangladesh: Implications for aquifer anisotropy, recharge sources and sustainability. Journal of Hydrology 444-445, 209–220.
Huisman, L., Olsthoorn, T.N., 1987. Artificial groundwater recharge.
Illangasekare, T., Tyler, S.W., Clement, T.P., Villholth, K.G., Perera, a. P.G.R.L., Obeysekera, J., Gunatilaka, A., Panabokke, C.R., Hyndman, D.W., Cunningham, K.J., Kaluarachchi, J.J., Yeh, W.W.-G., van Genuchten, M.T., Jensen, K., 2006. Impacts of the 2004 tsunami on groundwater resources in Sri Lanka. Water Resources Research 42, n/a–n/a.
Islam, M.S., Tooley, M.J., 1999. Coastal and sea-level changes during the Holocene in Bangladesh. Quaternary International 55, 61–75.
Jakovovic, D., Werner, A.D., Simmons, C.T., 2011. Numerical modelling of saltwater up-coning: Comparison with experimental laboratory observations. Journal of Hydrology 402, 261–273.
Johnson, T., 2008. Groundwater replenishment at the Montebello Forebay Spreading Grounds, Technical Bulletin 14.
Khan, S.R., Islam, B., 2008. Holocene stratigraphy of the lower Ganges-Brahmaputra river delta in Bangladesh. Frontiers of Earth Science in China 2, 393–399.
Konikow, L.F., Kendy, E., 2005. Groundwater depletion: A global problem. Hydrogeology Journal 13, 317–320.
Kooi, H., Groen, J., 2001. Offshore continuation of coastal groundwater systems; predictions using sharp-interface approximations and variable-density flow modelling 246, 19–35.
Kooi, H., Groen, J., Leijnse, a., 2000. Modes of seawater intrusion during transgressions. Water Resources Research 36, 3581–3589.
Kuehl, S.A., Allison, M.A., Goodbred, S.L., Kudrass, H., 2005. The Ganges – Brahmaputra delta. SEPM (Society for Sedimentary Geology) 413–434.
Langevin, C.D., Thorne, D.T.J., Dausman, A.M., Sukop, M.C., Guo, W., 2008. SEAWAT Version 4: A Computer Program for Simulation of Multi-Species Solute and Heat Transport.
LGED, 1994. Municipal Services Project. Interim Report, vol. 5: Khulna Water Supply.
Maas, E. V., 1990. Crop salt tolerance, American Society of Civil Engineers, Manuals and Reports on Engineering Practice. Publ by ASCE.
Maas, E. V., Hoffman, G.J., 1977. Crop salt tolerance - current assessment. ASCE J Irrig Drain Div 103, 115–134.
Mahmuduzzaman, M., Ahmed, Z.U., Nuruzzaman, A.K.M., Ahmed, F.R.S., 2014. Causes of Salinity Intrusion in Coastal Belt of Bangladesh. International Journal of Plant Research 4, 8–13.
95
Majumder, R.K., Halim, M.A., Saha, B.B., Ikawa, R., Nakamura, T., Kagabu, M., Shimada, J., 2011. Groundwater flow system in Bengal Delta, Bangladesh revealed by environmental isotopes. Environmental Earth Sciences 64, 1343–1352.
Maliva, R.B., Missimer, T.M., 2010. Aquifer storage and recovery and managed aquifer recharge using wells: planning, hydrogeology, design, and operation. . Methods in Water Resources Evaluation. Series No. 2, Schlumberger Water Services.
Meisler, H., Leahy, P.P., Knobel, L.L., 1984. Effect of Eustatic Sea-Level Changes on Saltwater-Freshwater in the Northern Atlantic Coastal Plain, in: USGS Water Supply Paper: 2255. U.S. Geological Survey, p. 28.
Michael, H.A., Voss, C.I., 2009a. Controls on groundwater flow in the Bengal Basin of India and Bangladesh: regional modeling analysis. Hydrogeology Journal 17, 1561–1577.
Michael, H.A., Voss, C.I., 2009b. Estimation of regional-scale groundwater flow properties in the Bengal Basin of India and Bangladesh. Hydrogeology Journal 17, 1329–1346.
Michels, K.H., Kudrass, H.R., Hu, C., 1998. The submarine delta of the Ganges – Brahmaputra : cyclone-dominated sedimentation patterns 149, 133–154.
Mondal, M.S., Saleh, A.F.M., 2003. Evaluation of some deep and shallow tubewell irrigated schemes in Bangladesh using performance indicators. Agricultural Water Management 58, 193–207.
Nocchi, M., Salleolini, M., 2013. A 3D density-dependent model for assessment and optimization of water management policy in a coastal carbonate aquifer exploited for water supply and fish farming. Journal of Hydrology 492, 200–218.
Oude Essink, G.H.P., 1996. Impact of sea level rise on groundwater flow regimes. A sensitivity analysis for the Netherlands. Delft University of Technology, Delft, The Netherlands.
Oude Essink, G.H.P., 2001a. Salt Water Intrusion in a Three-dimensional Groundwater System in The Netherlands : A Numerical Study. Transport in Porous Media 43, 137–158.
Oude Essink, G.H.P., 2001b. Improving fresh groundwater supply problems and solutions. Ocean & Coastal Management 44, 429–449.
Oude Essink, G.H.P., Faneca Sànchez, M., Zamrsky, D., 2014. Global Quick Scan of the Vulnerability of Groundwater systems to Tsunamis, in: Geophys. Res. Abstr., 16, 14480.
Oude Essink, G.H.P., van Baaren, E.S., de Louw, P.G.B., 2010. Effects of climate change on coastal groundwater systems: A modeling study in the Netherlands. Water Resources Research 46, 1–16.
Oude Essink, G.H.P., van Baaren, E.S., Zuurbier, K.G., Velstra, J., Veraart, J., Brouwer, W., Faneca Sànchez, M., Pauw, P.S., de Louw, P.G.B., Vreke, J., Schoevers, M., 2014. GO-FRESH: Valorisatie kansrijke oplossingen voor een robuuste zoetwatervoorziening (in Dutch), KvK 151/2014, ISBN EAN 978-94-92100-12-2.

96
Pauw, P.S., 2011. Overview of common field measurements applicable in the research on freshwater lenses in coastal areas.
Pauw, P.S., Baaren, E.S. van, Visser, M., Louw, P.G.B. de, Oude Essink, G.H.P., 2015. Testing the feasibility of increasing a fresh water lens below a creek ridge by artificial recharge using a controlled drainage system, submitted. Hydrogeology Journal.
Pauw, P.S., De Louw, P.G.B., Oude Essink, G.H.P., 2012. Groundwater salinisation in the Wadden Sea area of the Netherlands: quantifying the effects of climate change , sea-level rise and anthropogenic interferences. Netherlands Journal of Geosciences - Geologie en Mijnbouw 91-3, 373–383.
Pauw, P.S., Oude Essink, G.H.P., Leijnse, A., Vandenbohede, A., Groen, J., van der Zee, S.E.A.T.M., 2014. Regional scale impact of tidal forcing on groundwater flow in unconfined coastal aquifers. Journal of Hydrology 517, 269–283.
Pirazzoli, P.A., 1996. Sea-level changes: the last 20 000 years, Sea-level changes: the last 20 000 years. Wiley; Coastal Morphology and Research Series.
Post, V.E.A., Groen, J., Kooi, H., Person, M., Ge, S., Edmunds, W.M., 2013. Offshore fresh groundwater reserves as a global phenomenon. Nature 504, 71–8.
Prinos, S.T., Wacker, M.A., Cunningham, K.J., Fitterman, D. V., 2014. Origins and Delineation of Saltwater Intrusion in the Biscayne Aquifer and Changes in the Distribution of Saltwater in Miami-Dade County , Florida.
Rahman, A.A., Ravenscroft, P., 2003. Groundwater resources and development in Bangladesh: background to the arsenic crisis, agricultural potential and the environment. The University Press.
Rahman, M.M., Hassan, M.Q., Islam, M.S., Shamsad, S.Z.K.M., 2000. Environmental impact assessment on water quality deterioration caused by the decreased Ganges outflow and saline water intrusion in south-western Bangladesh. Environmental Geology 40, 31–40.
Rashid, T., 2014. Holocene Sea-level Scenarios in Bangladesh, SpringerBriefs in Oceanography. Springer Singapore, Singapore.
Reynolds, J.M., 1997. An Introduction to Applied and Environmental Geophysics, Geophysics. John Wiley & Sons.
Roest, C.W.J., van Bakel, P.J.T., Smit, A.A.M.F.R., 2004. Update of the salinity tolerance of field and greenhouse crops for the calculation of crop damage in the Netherlands with the RIZA instruments (in Dutch).
Sahu, P., Michael, H. a., Voss, C.I., Sikdar, P.K., 2013. Impacts on groundwater recharge areas of megacity pumping: analysis of potential contamination of Kolkata, India, water supply. Hydrological Sciences Journal 58, 1340–1360.
Savenije, H.H.G., Toffolon, M., Haas, J., Veling, E.J.M., 2008. Analytical description of tidal dynamics in convergent estuaries. Journal of Geophysical Research 113, C10025.
97
Schmorak, S., Mercado, A., 1969. Upconing of fresh-water sea-water interface below pumping wells, field study. Water Resources Research 5, 1290–1311.
Sengpiel, K., Siemon, B., 2000. Advanced inversion methods for airborne electromagnetic exploration. Geophysics 65, 1983–1992.
Shamsudduha, M., Uddin, A., 2007. Quaternary shoreline shifting and hydrogeologic influence on the distribution of groundwater arsenic in aquifers of the Bengal Basin. Journal of Asian Earth Sciences 31, 177–194.
Siemon, B., Christiansen, A.V., Auken, E., 2009. A review of helicopter-borne electromagnetic methods for groundwater exploration. Near Surface Geophysics.
Smith, A.J., Turner, J. V., 2001. Density-dependent surface water-groundwater interaction and nutrient discharge in the Swan-Canning Estuary. Hydrological Processes 15, 2595–2616.
Stuyfzand, P.J., 1993. Hydrochemistry and hydrology of the coastal dune area of the Western Netherlands. Vrije Universiteit, Amsterdam.
Stuyfzand, P.J., Doomen, A., 2004. The Dutch experience with MARS (Managed Aquifer Recharge and Storage); A review of facilities, techniques and tools.
Sulzbacher, H., Wiederhold, H., Siemon, B., Grinat, M., Igel, J., Burschil, T., Günther, T., Hinsby, K., 2012. Numerical modelling of climate change impacts on freshwater lenses on the North Sea Island of Borkum using hydrological and geophysical methods. Hydrology and Earth System Sciences 16, 3621–3643.
Taylor, R.G., Green, T.R., 2013. Ground water and climate change. Nature Climate Change 1–8.
Tredoux, G., Cain, J., 2010. The Atlantis Water Resource Management Scheme: 30 years of Artificial Groundwater Recharge.
UCL, 2013. The Security of Deep Groundwater in Southeast Bangladesh: Recommendations for Policy to Safeguard against Arsenic and Salinity invasion, Final Report, EPSRC/UCL-BEAMS Knowledge Transfer Project, London.
Umitsu, M., 1993. Late quaternary sedimentary environments and landforms in the Ganges Delta. Sedimentary Geology 83, 177–186.
Van Bakel, P.J.T., Stuyt, L.C.P.M., 2011. Updating the knowledge of the salt tolerance of crops, based on literature review, expert knowledge and practical experiences (in Dutch), Alterra-rapport 2201 Alterra. Wageningen, The Netherlands.
Vandenbohede, A., Luyten, K., Lebbe, L.C., 2008. Effects of Global Change on Heterogeneous Coastal Aquifers: A Case Study in Belgium. Journal of Coastal Research 24, 160–170.
Vermeulen, P.T.M., van der Linden, W., Minnema, B., 2014. iMOD User Manual.
Vithanage, M., Engesgaard, P., Jensen, K.H., Illangasekare, T.H., Obeysekera, J., 2012a. Laboratory investigations of the effects of geologic heterogeneity on groundwater
98
salinization and flush-out times from a tsunami-like event. Journal of contaminant hydrology 136-137, 10–24.
Vithanage, M., Engesgaard, P., Villholth, K.G., Jensen, K.H., 2012b. The effects of the 2004 tsunami on a coastal aquifer in Sri Lanka. Ground water 50, 704–14.
Vithanage, M., Villholth, K.G., Mahatantila, K., Engesgaard, P., Jensen, K.H., 2009. Effect of well cleaning and pumping on groundwater quality of a tsunami-affected coastal aquifer in eastern Sri Lanka. Water Resources Research 45, W07501.
Ward, J.D., Simmons, C.T., Dillon, P.J., 2007. A theoretical analysis of mixed convection in aquifer storage and recovery: How important are density effects? Journal of Hydrology 343, 169–186.
WaterAid Bangladesh, 2006. Implementation guidelines for Infiltration Gallery (IFG).
Werner, A.D., Bakker, M., Post, V.E.A.V.E. a., Vandenbohede, A., Lu, C., Ataie-Ashtiani, B., Simmons, C.T., Barry, D. a., 2013. Seawater intrusion processes, investigation and management: Recent advances and future challenges. Advances in Water Resources 51, 3–26.
Werner, A.D., Jakovovic, D., Simmons, C.T., 2009. Experimental observations of saltwater up-coning. Journal of Hydrology 373, 230–241.
Werner, A.D., Simmons, C.T., 2009. Impact of sea-level rise on sea water intrusion in coastal aquifers. Ground water 47, 197–204.
WHO, 2013. Cleaning wells after seawater flooding.
Winterwerp, J.C., Giardino, A., 2012. Assessment of increasing freshwater input on salinity and sedimentation in the Gorai river system.
Woodroffe, S.A., Horton, B.P., 2005. Holocene sea-level changes in the Indo-Pacific. Journal of Asian Earth Sciences 25, 29–43.
Wright, L.D., 1977. Sediment transport and deposition at river mouths: A synthesis. Geological Society of America Bulletin 857–868.
Yu, W., Voss, C.I., Michael, H.A., Ahmed, K.M., Feinson, L., Khan, M.R., Tuinhof, A., 2010. Implications of Climate Change for Fresh Groundwater Resources in Coastal Aquifers in Bangladesh.
Zahid, A., 2014. Establishment of Monitoring Network and Mathematical Model to Assess Saline Water Intrusion in Groundwater in the Coastal Area of Bangladesh.
Zahid, A., Ahmed, S.R.U., 2006. Groundwater Resources Development in Bangladesh: Contribution to Irrigation for Food Security and Constraints to Sustainability, in: Sharma, B.R., Vilkoth, K., Sharma, K.D. (Eds.), Groundwater Research and Management: Integrating Science into Management Decisions. Proceedings of IWMI-ITP-NIH International Workshop on “Creating Synergy Between Groundwater Research and Management in South and Southeast Asia.” International Water Management Institute (IWMI), pp. 27–46.
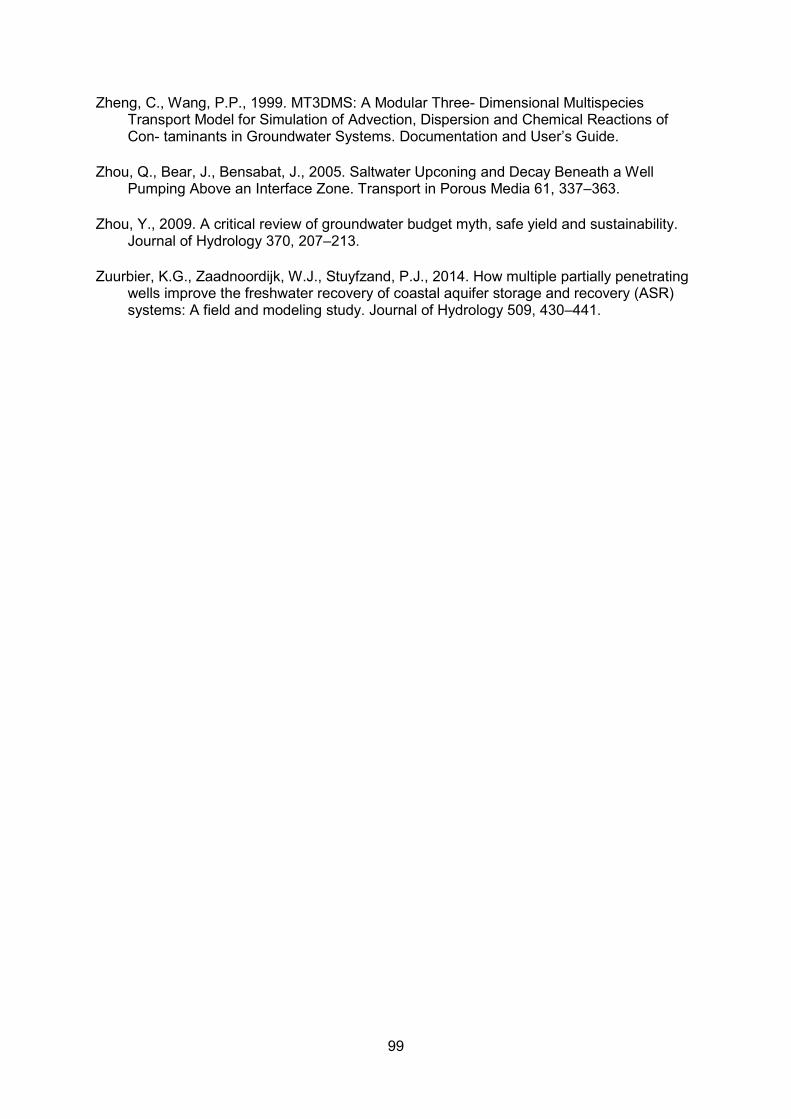
99
Zheng, C., Wang, P.P., 1999. MT3DMS: A Modular Three- Dimensional Multispecies Transport Model for Simulation of Advection, Dispersion and Chemical Reactions of Con- taminants in Groundwater Systems. Documentation and User’s Guide.
Zhou, Q., Bear, J., Bensabat, J., 2005. Saltwater Upconing and Decay Beneath a Well Pumping Above an Interface Zone. Transport in Porous Media 61, 337–363.
Zhou, Y., 2009. A critical review of groundwater budget myth, safe yield and sustainability. Journal of Hydrology 370, 207–213.
Zuurbier, K.G., Zaadnoordijk, W.J., Stuyfzand, P.J., 2014. How multiple partially penetrating wells improve the freshwater recovery of coastal aquifer storage and recovery (ASR) systems: A field and modeling study. Journal of Hydrology 509, 430–441.
100
Annex 1: Report of the Fact Finding Mission to Bangladesh Introduction
Earlier studies have addressed concerns on over-exploitation of fresh groundwater resulting in salt water intrusion and upconing under extraction wells. As the coastal zone of Bangladesh is low-lying, sea water may intrude much further inland under the predicted future sea level rise. This coupled with reduced river flows in prolonged dry periods under climate change conditions may cause the coastal groundwater system becoming more saline. Subsequently, elevated salt contents in soil and water will affect drinking water safety and agricultural crop production. Several types of salinization of the groundwater system are possible (Figure 1). As such, Bangladesh is facing environmental and health threats that will be the result of rising salinity levels in drinking water wells. BRAC’s Vision ‘WASH services that last’ will only be sustainable in Bangladesh when water salinity and other water quality challanges are tackled effectively through Water Safety Planning.
A consortium consisting of Deltares, UNESCO-IHE and CEGIS has been installed to increase public awareness on salt water intrusion impacts on drinking water in Bangladesh. Apart from organising workshops and meetings with relevant stakeholders, field trips to salinity vulnerable coastal areas will be executed, In addition, advice on monitoring salinity will be given (e.g. via the creation of brochures) and a 3D numerical model on salt water intrusion in groundwater will be constructed to assess the impact of climate and global change on drinking water from a groundwater perspective.
Figure 1: Examples of different salinization situations in groundwater systems.
Goal of the project
To make mitigation and adaptation to salinization of drinking water an integral part of Water Safety Planning in Bangladesh.
Objectives
The salinization issue will only become an integral part of Water Safety Planning in Bangladesh when a sufficient level of awareness, knowledge and skills is reached. Our SWIBANGLA project under the coordination of IRC (International Water and Sanitation Centre) is focused at fulfilling the following five objectives: Create a better understanding of the process of salinization of drinking water resources in
Bangladesh. Achieve an effective, tailored knowledge transfer between the Netherlands and Bangladesh. Advise on the integration of the salinization issue in Water Safety Planning. Provide recommendations for monitoring. Provide recommendations for adaptation and mitigation.
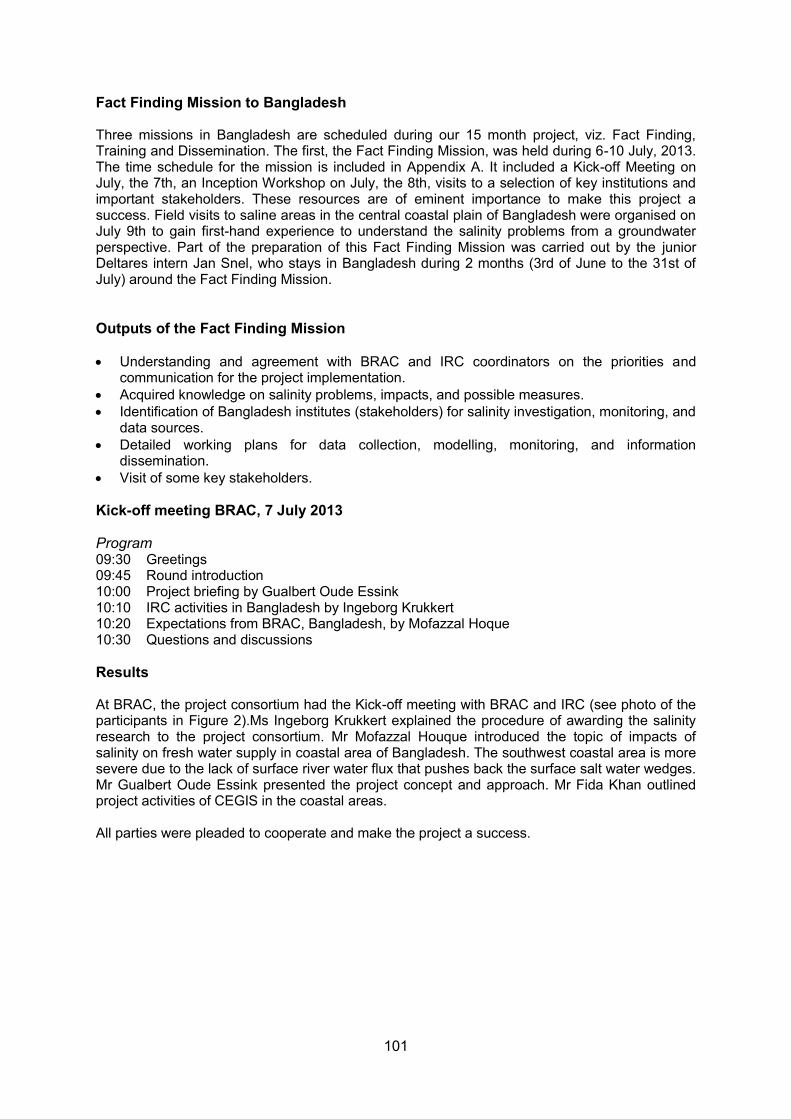
101
Fact Finding Mission to Bangladesh
Three missions in Bangladesh are scheduled during our 15 month project, viz. Fact Finding, Training and Dissemination. The first, the Fact Finding Mission, was held during 6-10 July, 2013. The time schedule for the mission is included in Appendix A. It included a Kick-off Meeting on July, the 7th, an Inception Workshop on July, the 8th, visits to a selection of key institutions and important stakeholders. These resources are of eminent importance to make this project a success. Field visits to saline areas in the central coastal plain of Bangladesh were organised on July 9th to gain first-hand experience to understand the salinity problems from a groundwater perspective. Part of the preparation of this Fact Finding Mission was carried out by the junior Deltares intern Jan Snel, who stays in Bangladesh during 2 months (3rd of June to the 31st of July) around the Fact Finding Mission.
Outputs of the Fact Finding Mission
Understanding and agreement with BRAC and IRC coordinators on the priorities and communication for the project implementation.
Acquired knowledge on salinity problems, impacts, and possible measures. Identification of Bangladesh institutes (stakeholders) for salinity investigation, monitoring, and
data sources. Detailed working plans for data collection, modelling, monitoring, and information
dissemination. Visit of some key stakeholders.
Kick-off meeting BRAC, 7 July 2013
Program 09:30 Greetings 09:45 Round introduction 10:00 Project briefing by Gualbert Oude Essink 10:10 IRC activities in Bangladesh by Ingeborg Krukkert 10:20 Expectations from BRAC, Bangladesh, by Mofazzal Hoque 10:30 Questions and discussions
Results
At BRAC, the project consortium had the Kick-off meeting with BRAC and IRC (see photo of the participants in Figure 2).Ms Ingeborg Krukkert explained the procedure of awarding the salinity research to the project consortium. Mr Mofazzal Houque introduced the topic of impacts of salinity on fresh water supply in coastal area of Bangladesh. The southwest coastal area is more severe due to the lack of surface river water flux that pushes back the surface salt water wedges. Mr Gualbert Oude Essink presented the project concept and approach. Mr Fida Khan outlined project activities of CEGIS in the coastal areas. All parties were pleaded to cooperate and make the project a success.
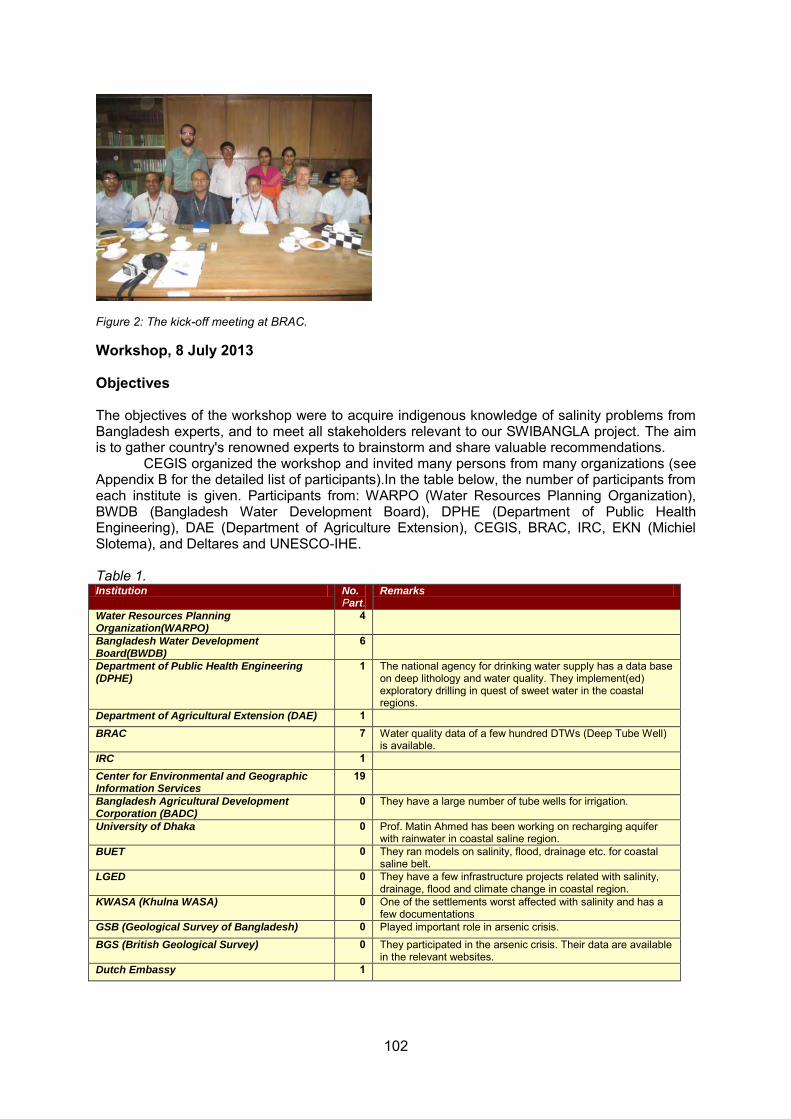
102
Figure 2: The kick-off meeting at BRAC.
Workshop, 8 July 2013
Objectives
The objectives of the workshop were to acquire indigenous knowledge of salinity problems from Bangladesh experts, and to meet all stakeholders relevant to our SWIBANGLA project. The aim is to gather country's renowned experts to brainstorm and share valuable recommendations. CEGIS organized the workshop and invited many persons from many organizations (see Appendix B for the detailed list of participants).In the table below, the number of participants from each institute is given. Participants from: WARPO (Water Resources Planning Organization), BWDB (Bangladesh Water Development Board), DPHE (Department of Public Health Engineering), DAE (Department of Agriculture Extension), CEGIS, BRAC, IRC, EKN (Michiel Slotema), and Deltares and UNESCO-IHE. Table 1. Institution No.
Part. Remarks
Water Resources Planning Organization(WARPO)
4
Bangladesh Water Development Board(BWDB)
6
Department of Public Health Engineering (DPHE)
1 The national agency for drinking water supply has a data base on deep lithology and water quality. They implement(ed) exploratory drilling in quest of sweet water in the coastal regions.
Department of Agricultural Extension (DAE) 1 BRAC 7 Water quality data of a few hundred DTWs (Deep Tube Well)
is available. IRC 1 Center for Environmental and Geographic Information Services
19
Bangladesh Agricultural Development Corporation (BADC)
0 They have a large number of tube wells for irrigation.
University of Dhaka 0 Prof. Matin Ahmed has been working on recharging aquifer with rainwater in coastal saline region.
BUET 0 They ran models on salinity, flood, drainage etc. for coastal saline belt.
LGED 0 They have a few infrastructure projects related with salinity, drainage, flood and climate change in coastal region.
KWASA (Khulna WASA) 0 One of the settlements worst affected with salinity and has a few documentations
GSB (Geological Survey of Bangladesh) 0 Played important role in arsenic crisis. BGS (British Geological Survey) 0 They participated in the arsenic crisis. Their data are available
in the relevant websites. Dutch Embassy 1

103
Program
The workshop program is as follows.
Workshop program 8th of July 3013 Joint strategy planning for managing saltwater
intrusion impacts in Bangladesh
Starting time
a. Introductions
Goal: meet and greet; context project, knowing each other
Presenter
09:30 Start of workshop
Tilwat from the Holy Qur'ân
09:40 Welcome address by Engr. Md Waji Ullah, Executive Director, CEGIS, Bangladesh
Engr.Md Waji Ullah
09:50 Welcome address and Introduction by IRC Ingeborg Krukkert
IRC
10:05 Introduction BRAC:
o WASH Bangladesh o Introduction Water Safety Plan
Mofazzal Hoque
BRAC
10:25 Introduction SWIBANGLA
o activities, time planning, concepts
Gualbert Oude
Essink, consortium
10:45 Introduction on interactive session Yangxiao Zhou
10:55 Tea Break
Starting time
b. Identification actual problem
Goal: detect knowledge level, understand actual problem
Presenter
11:15 Group interactive session All participants
12:30 Feedback of every group plus open discussions Zhou/Oude Essink/Fida Khan
13:30 Rap-up speech Fida Khan
13.50 Lunch
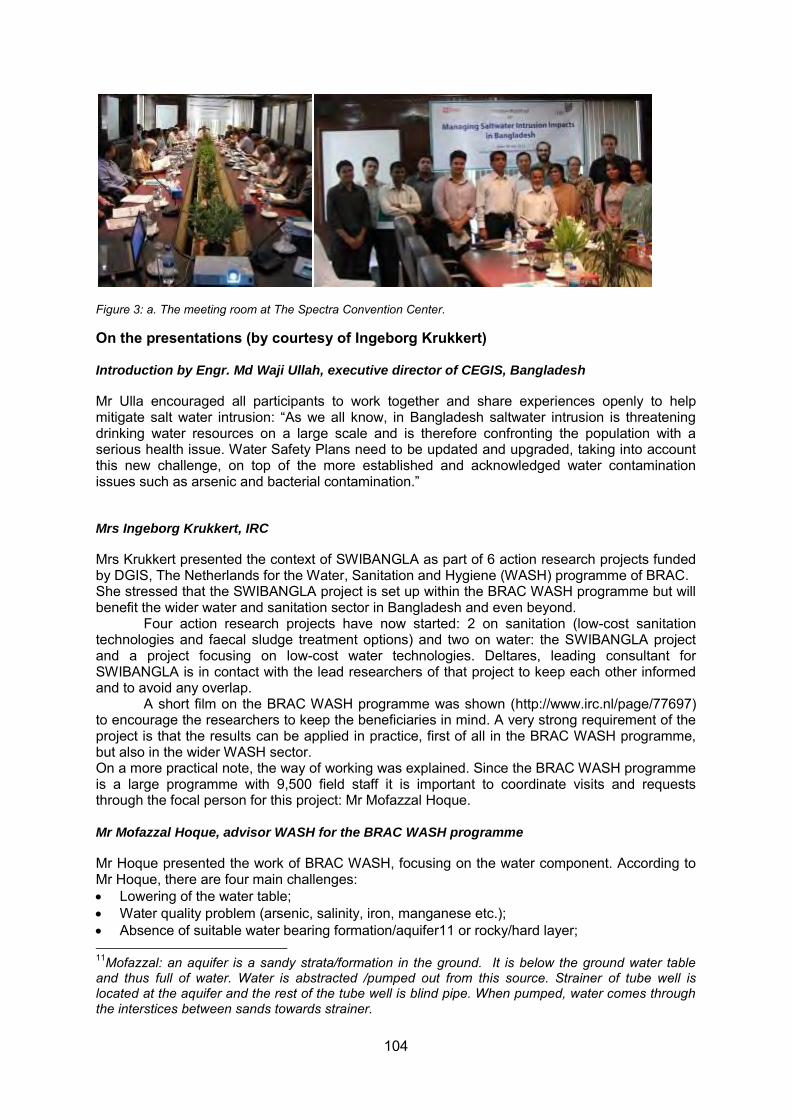
104
Figure 3: a. The meeting room at The Spectra Convention Center.
On the presentations (by courtesy of Ingeborg Krukkert)
Introduction by Engr. Md Waji Ullah, executive director of CEGIS, Bangladesh
Mr Ulla encouraged all participants to work together and share experiences openly to help mitigate salt water intrusion: “As we all know, in Bangladesh saltwater intrusion is threatening drinking water resources on a large scale and is therefore confronting the population with a serious health issue. Water Safety Plans need to be updated and upgraded, taking into account this new challenge, on top of the more established and acknowledged water contamination issues such as arsenic and bacterial contamination.”
Mrs Ingeborg Krukkert, IRC
Mrs Krukkert presented the context of SWIBANGLA as part of 6 action research projects funded by DGIS, The Netherlands for the Water, Sanitation and Hygiene (WASH) programme of BRAC. She stressed that the SWIBANGLA project is set up within the BRAC WASH programme but will benefit the wider water and sanitation sector in Bangladesh and even beyond. Four action research projects have now started: 2 on sanitation (low-cost sanitation technologies and faecal sludge treatment options) and two on water: the SWIBANGLA project and a project focusing on low-cost water technologies. Deltares, leading consultant for SWIBANGLA is in contact with the lead researchers of that project to keep each other informed and to avoid any overlap. A short film on the BRAC WASH programme was shown (http://www.irc.nl/page/77697) to encourage the researchers to keep the beneficiaries in mind. A very strong requirement of the project is that the results can be applied in practice, first of all in the BRAC WASH programme, but also in the wider WASH sector. On a more practical note, the way of working was explained. Since the BRAC WASH programme is a large programme with 9,500 field staff it is important to coordinate visits and requests through the focal person for this project: Mr Mofazzal Hoque. Mr Mofazzal Hoque, advisor WASH for the BRAC WASH programme
Mr Hoque presented the work of BRAC WASH, focusing on the water component. According to Mr Hoque, there are four main challenges: Lowering of the water table; Water quality problem (arsenic, salinity, iron, manganese etc.); Absence of suitable water bearing formation/aquifer11 or rocky/hard layer; 11Mofazzal: an aquifer is a sandy strata/formation in the ground. It is below the ground water table and thus full of water. Water is abstracted /pumped out from this source. Strainer of tube well is located at the aquifer and the rest of the tube well is blind pipe. When pumped, water comes through the interstices between sands towards strainer.

105
Non-availability of protected and perennial surface water source round the year. He explained that the service levels for tube wells are often much lower than the standard:
sometimes more than 250 persons have to use one tube well, while the standard is 1 for 50 users.
He showed three technological innovations for water: Sustainable piped water supply; Multi-headed tube well; User friendly deepest hand pump for areas where groundwater is very low, that is beyond
suction limit which is practically 8 metre. Discussion arose around the definition of ‘deep’ in deep tube well. Different organizations define shallow/deep tube wells differently. DPHE used to call a tube well deep when its depth was more than 60m. Presently, tube wells deeper than 150m are called deep tube well. BADC has a different definition. So, what’s deep? This needs to be unified.
Presentation by Mr Gualbert Oude Essink, Deltares
Salt water is a problem. It is a problem for drinking water as it not only affects the taste, it also has a long term health effect. It is also a problem for the industry as their pipes get corroded and it is difficult to prepare food with salt water. Agriculture faces challenges too as yield of crops is lower: many crops will not grow or much less due to salt water. Finally, salt damage is a challenge for irrigation. How can we solve certain parts of this problem? How can the SWIBANGLA project contribute to solving this problem? Gualbert presented the work packages of the project and what will be done the coming year. He also showed examples of modelling and monitoring – also low-cost options. In addition, a hand-out was provided on the SWIBANGLA project. On some questions the following was answered: a. the central coastal part will be covered; b. as the recharge values are not clear, different scenario’s will be considered; c. SEAWAT, a computer program for simulation of density-dependent groundwater flow and coupled salt transport, will be used as being the best model to consider this phenomena.
Results of group discussions
Participants were divided into 3 groups to fill in the predesigned 5 information tables. The completed tables were presented by the group moderators. Afterwards, 3 sets of 5 tables were combined. The details of out comings can be found in Appendix C. With this approach, information on the following 5 issues was effectively collected: 1. Current status of salinity problems: severe groundwater salinities in Southwest coastal area
because there is less surface water, salinity problem occurs only in dry period in the central coastal area.
2. Monitoring of salinities: DPHE, BWDB, BADC, and GSB are involved in monitoring groundwater salinity. A unified national monitoring network for salinity doesn't exist.
3. Database and information systems: salinity data are scattered in these organizations. A national database for groundwater salinity doesn't exist. Data has to be purchased.
4. Modelling activities: groundwater salinity models don't exist. There is a lack of groundwater modelling capacity in these organizations.
5. Impacts, measures, and beneficiaries: Many people move out the severe salinity impact areas in the Southwest coastal area. With support of international donors, deep tube wells (more than 300 m) were installed for community drinking water supply. Some villages use shallow freshwater lenses for drinking water.
This knowledge is important to develop the project working plan.

106
In the discussion on salinity impact, problem owners and beneficiaries, the three groups focus on different things:
Group 1 mentions the stakeholders and problem owners. For soil salinity and surface water quality DPHE and NGOs are mentioned as problem owners, while shallow groundwater salinity and middle groundwater salinity have private sector, government, and NGOs as problem owners.
Group 2 mentions as beneficiaries: farmers, coastal people, specifically the poor Group 3 mentions the areas that benefit: livelihoods, surface water, drinking water
Fieldtrip, 10 July 2013
Location and area description
Field visit: Date: 09-07-2013, from Patuakhali to Amtali polder
Field work: Part of the inception workshop is a field visit of 1 day to in an area with salinity problems. For this the southeast of the central coastal area is selected, and measurements are done on different location and from sources. In the map below the measurements are marked. The most southern location was the Amtali polder in the district of Patuakhali. Sources are ponds, tube wells, and rivers.
Figure 4: Location of measure points collected during the fieldtrip.
Area description
The southeastern part of the central coastal area is a low lying flat land that ranges approximately 1-2 meters above sea level. Everywhere in the region there are water bodies in the form of ponds, ditches and rivers. Together with agricultural practices, mainly rice paddies, and trees in-between agricultural land, they determine the landscape.

107
0
1
10
100
1000
10 100 1000 10000 100000
EC [m
S/cm
]
Chloride concentratie [mg Cl-/l]
van Wirdum (2004)
NITG (1992): 100mg HCO3
NITG (1992): 800mg HCO3
Flevoland analyses (2008)
Figure 5: Impression of the area during the Location of measure points collected during the fieldtrip.
Figure 6: Detailed information of the sample locations.
Measurements
Salinity values
Different methods can be used to determine salinity of water, using an electrical conductivity meter.
Due to chemical processes, pressure and temperature, the relation between electrical conductivity can be different using different methods (Figure 7).
For a quick first assessment of (ground)water salinity, the equation in Figure 7 is used. The equation is derived from the water salinity and electrical conductivity from samples in Zeeland, in The Netherlands. Electrical conductivity changes with water quality/TDS, salinity remaining the same. Therefore, change in water quality may warrant calibration of the EC meter.
Figure 7 Relationship between EC and Cl concentrations.
Table 2 Measured EC and estimated Cl values.
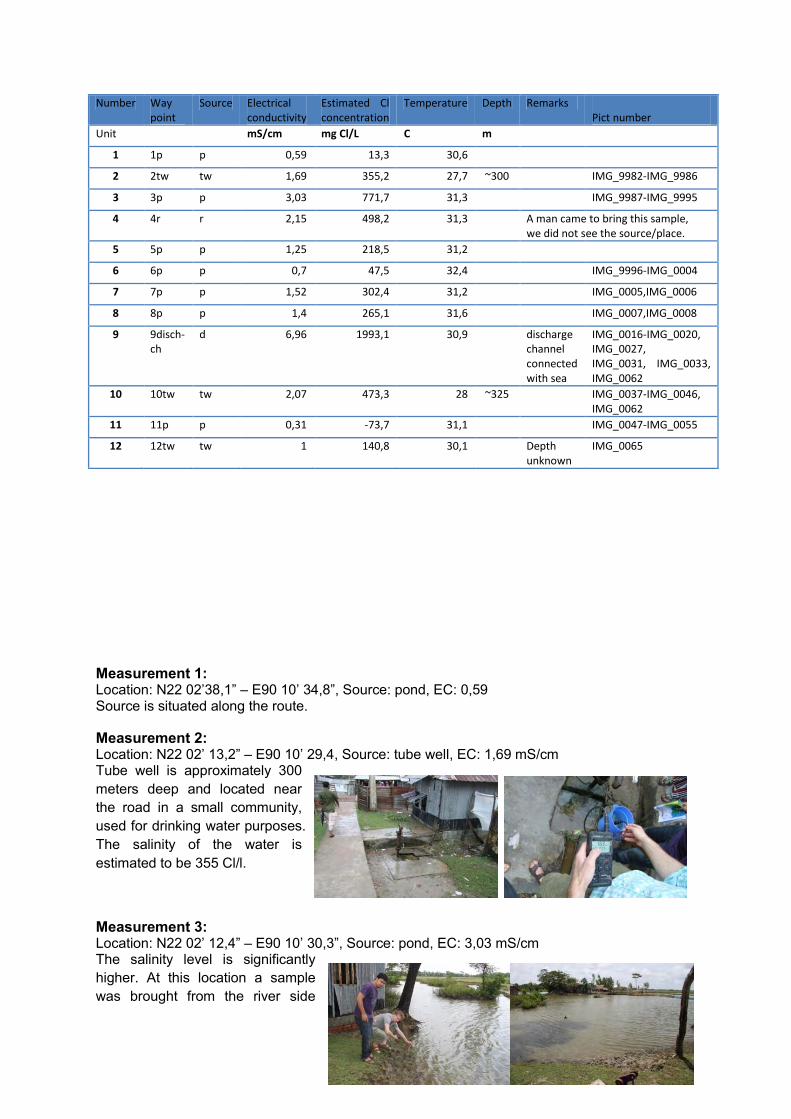
108
Number Way point
Source Electrical conductivity
Estimated Cl concentration
Temperature Depth Remarks Pict number
Unit mS/cm mg Cl/L C m
1 1p p 0,59 13,3 30,6
2 2tw tw 1,69 355,2 27,7 ~300 IMG_9982-IMG_9986
3 3p p 3,03 771,7 31,3 IMG_9987-IMG_9995
4 4r r 2,15 498,2 31,3 A man came to bring this sample, we did not see the source/place.
5 5p p 1,25 218,5 31,2
6 6p p 0,7 47,5 32,4 IMG_9996-IMG_0004
7 7p p 1,52 302,4 31,2 IMG_0005,IMG_0006
8 8p p 1,4 265,1 31,6 IMG_0007,IMG_0008
9 9disch-ch
d 6,96 1993,1 30,9 discharge channel connected with sea
IMG_0016-IMG_0020, IMG_0027, IMG_0031, IMG_0033, IMG_0062
10 10tw tw 2,07 473,3 28 ~325 IMG_0037-IMG_0046, IMG_0062
11 11p p 0,31 -73,7 31,1 IMG_0047-IMG_0055
12 12tw tw 1 140,8 30,1 Depth unknown
IMG_0065
Measurement 1: Location: N22 02’38,1” – E90 10’ 34,8”, Source: pond, EC: 0,59 Source is situated along the route.
Measurement 2: Location: N22 02’ 13,2” – E90 10’ 29,4, Source: tube well, EC: 1,69 mS/cm Tube well is approximately 300 meters deep and located near the road in a small community, used for drinking water purposes. The salinity of the water is estimated to be 355 Cl/l.
Measurement 3: Location: N22 02’ 12,4” – E90 10’ 30,3”, Source: pond, EC: 3,03 mS/cm The salinity level is significantly higher. At this location a sample was brought from the river side
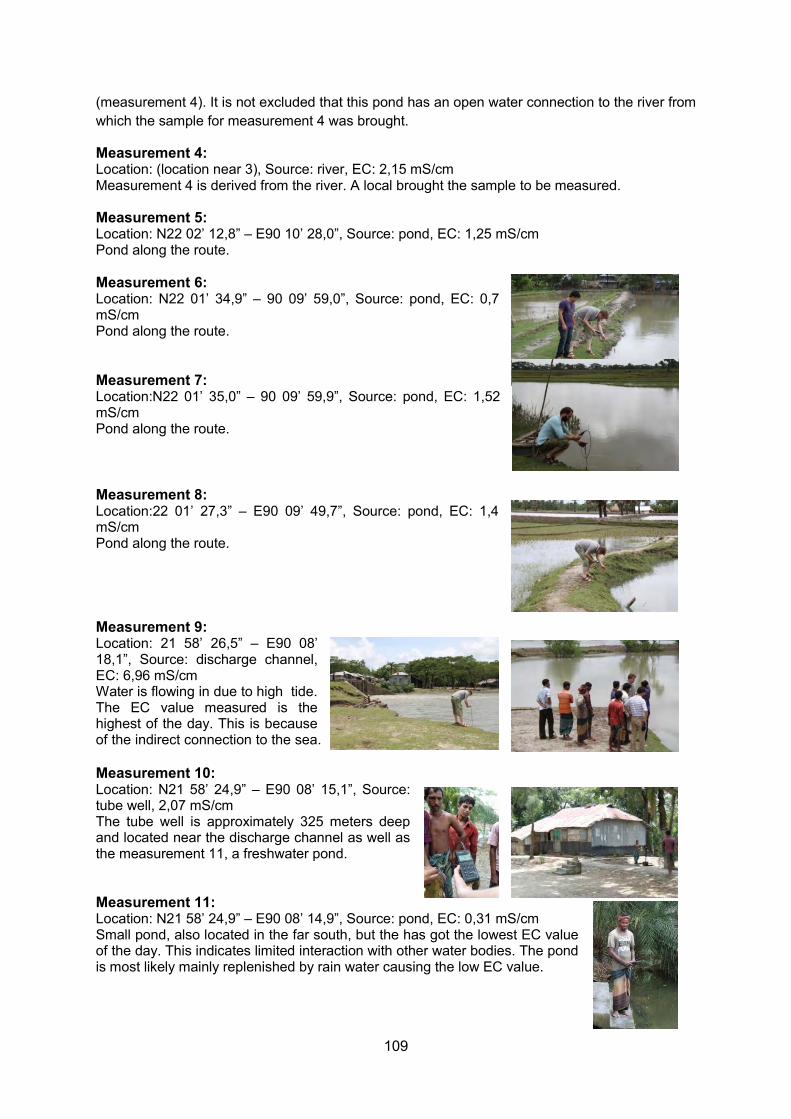
109
(measurement 4). It is not excluded that this pond has an open water connection to the river from which the sample for measurement 4 was brought.
Measurement 4: Location: (location near 3), Source: river, EC: 2,15 mS/cm Measurement 4 is derived from the river. A local brought the sample to be measured.
Measurement 5: Location: N22 02’ 12,8” – E90 10’ 28,0”, Source: pond, EC: 1,25 mS/cm Pond along the route. Measurement 6: Location: N22 01’ 34,9” – 90 09’ 59,0”, Source: pond, EC: 0,7 mS/cm Pond along the route.
Measurement 7: Location:N22 01’ 35,0” – 90 09’ 59,9”, Source: pond, EC: 1,52 mS/cm Pond along the route.
Measurement 8: Location:22 01’ 27,3” – E90 09’ 49,7”, Source: pond, EC: 1,4 mS/cm Pond along the route. Measurement 9: Location: 21 58’ 26,5” – E90 08’ 18,1”, Source: discharge channel, EC: 6,96 mS/cm Water is flowing in due to high tide. The EC value measured is the highest of the day. This is because of the indirect connection to the sea. Measurement 10: Location: N21 58’ 24,9” – E90 08’ 15,1”, Source: tube well, 2,07 mS/cm The tube well is approximately 325 meters deep and located near the discharge channel as well as the measurement 11, a freshwater pond. Measurement 11: Location: N21 58’ 24,9” – E90 08’ 14,9”, Source: pond, EC: 0,31 mS/cm Small pond, also located in the far south, but the has got the lowest EC value of the day. This indicates limited interaction with other water bodies. The pond is most likely mainly replenished by rain water causing the low EC value.
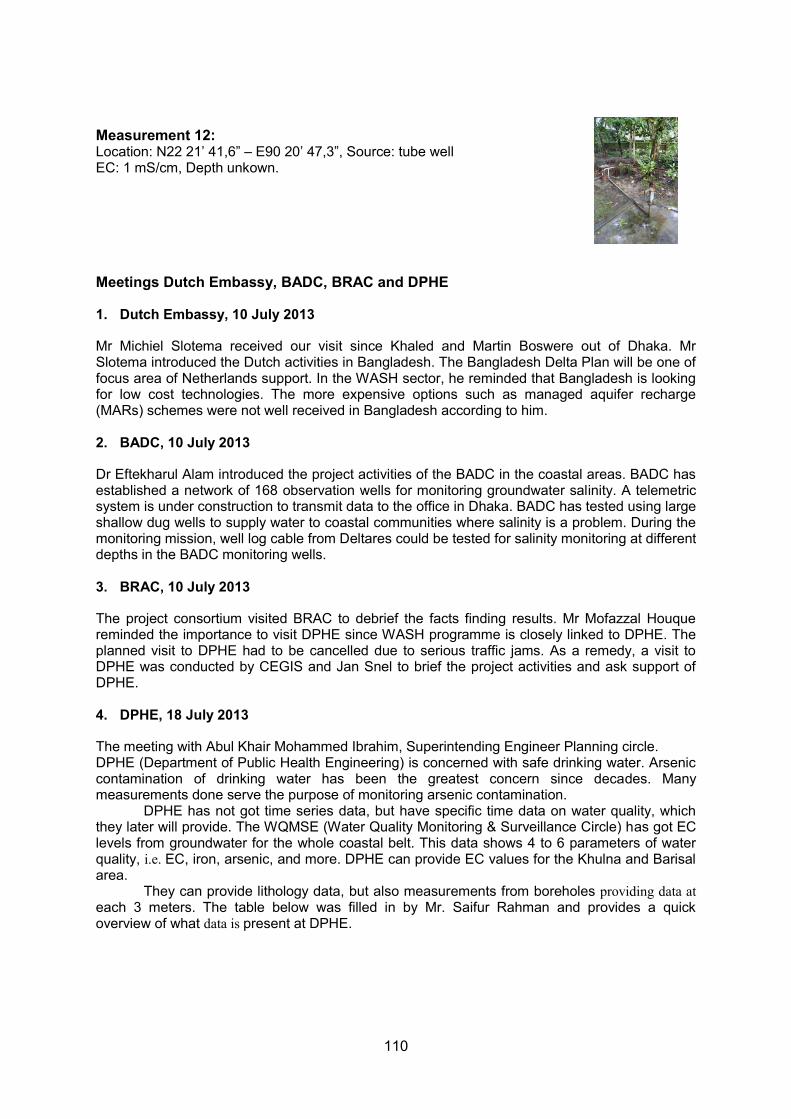
110
Measurement 12: Location: N22 21’ 41,6” – E90 20’ 47,3”, Source: tube well EC: 1 mS/cm, Depth unkown.
Meetings Dutch Embassy, BADC, BRAC and DPHE
1. Dutch Embassy, 10 July 2013
Mr Michiel Slotema received our visit since Khaled and Martin Boswere out of Dhaka. Mr Slotema introduced the Dutch activities in Bangladesh. The Bangladesh Delta Plan will be one of focus area of Netherlands support. In the WASH sector, he reminded that Bangladesh is looking for low cost technologies. The more expensive options such as managed aquifer recharge (MARs) schemes were not well received in Bangladesh according to him. 2. BADC, 10 July 2013
Dr Eftekharul Alam introduced the project activities of the BADC in the coastal areas. BADC has established a network of 168 observation wells for monitoring groundwater salinity. A telemetric system is under construction to transmit data to the office in Dhaka. BADC has tested using large shallow dug wells to supply water to coastal communities where salinity is a problem. During the monitoring mission, well log cable from Deltares could be tested for salinity monitoring at different depths in the BADC monitoring wells. 3. BRAC, 10 July 2013
The project consortium visited BRAC to debrief the facts finding results. Mr Mofazzal Houque reminded the importance to visit DPHE since WASH programme is closely linked to DPHE. The planned visit to DPHE had to be cancelled due to serious traffic jams. As a remedy, a visit to DPHE was conducted by CEGIS and Jan Snel to brief the project activities and ask support of DPHE. 4. DPHE, 18 July 2013
The meeting with Abul Khair Mohammed Ibrahim, Superintending Engineer Planning circle. DPHE (Department of Public Health Engineering) is concerned with safe drinking water. Arsenic contamination of drinking water has been the greatest concern since decades. Many measurements done serve the purpose of monitoring arsenic contamination.
DPHE has not got time series data, but have specific time data on water quality, which they later will provide. The WQMSE (Water Quality Monitoring & Surveillance Circle) has got EC levels from groundwater for the whole coastal belt. This data shows 4 to 6 parameters of water quality, i.e. EC, iron, arsenic, and more. DPHE can provide EC values for the Khulna and Barisal area.
They can provide lithology data, but also measurements from boreholes providing data at each 3 meters. The table below was filled in by Mr. Saifur Rahman and provides a quick overview of what data is present at DPHE.

111
For the next field trip of Jan Snel in the week of 21-25 July, Jan will contact a local DPHE engineer in Khulna, viz. Executive Engineer Abdul Mannam (017119664614). He will accompany Jan Snel during the fieldtrip to some wells and will assist in the monitoring.
In addition, Mr Ihtishamul Haque retired Superintending Engineer of DPHE, advisor of JICA and highly knowledgeable on groundwater can be contacted for more information.
And finally, Engr Sudhir Kumar Gosh should be contacted. He is well-known in the area and is connected to the Khulna WASA and knowledgeable on groundwater (01199487159).
Conclusions of the Fact Finding Mission
The salinity issue is quite recognized by the Workshop audience and the participants were very active during the Workshop. Though the way to explore sources of information works, some necessary information should come from organizations that were not present in the Workshop. These organizations should be contacted in a later phase.
Though the impact of salt water intrusion on agriculture is an important issue, within this project the focus will be on the drinking water sector. The (un)importance of other issues like future sea level rise, climate change, land subsidence, cyclones and storms should be considered qualitatively.
The central (Patuakhali) as well as the southwest coastal area (Khulna) are under consideration within this project. Both areas differs from each other from a surface river water flux point of view, affecting the degree of salinization.
Monitoring Electrical Conductivities in (ground)water in these two areas will be executed in good correspondence with BRAC and DPHE (being closely linked to the WASH program).
On data collection (mentioned by the 3 groups during the Workshop): organizations involved in monitoring are: BADC, BWDB and DPHE organizations involved in borelog data are: BRAC, DPHE, BWDB there are many (!) organizations involved in groundwater database and information
systems: BADC, BRAC, BGS, BAC, BWDB (strong database for hydrogeology), CEGIS, DoA (Department of Agriculture), DPHE, GSB, IWM, Municipalities, Universities, various industries, WARPO, and KWASA (Khulna WASA). Data are scattered in these organizations, and have to be purchased for the use.
Although modelling information is actually present, there seems to be no specific groundwater model in combination with salinity modelling information available in Bangladesh. There is also a lack of groundwater modelling capacity in these organizations. A

112
vision needs to be developed how to build the capacity of groundwater modelling at CEGIS during the project and after the project completion.
It appears that the salinity problems within the groundwater system of Bangladesh are not topic within the Bangladesh Delta Plan. This should be checked and awareness actions should be executed and research questions should be stated, if applicable.
BRAC has developed some water safety plans, it is not clear how the information from monitoring is used in developing these plans. The project needs to look at how the information from the monitoring and modelling from the project can be fed into improve the water safety plans.
Upcoming Activities
The working plans for 5 main project activities have been developed by the 3 project partners on July 10, 2013. The detailed working plans can be found in Appendix D. The sequences of actions are:
1) CEGIS will nominate project staff (to be discussed, based on skills of the employees) who are skillful in using ArcGIS, Excel, and a programming language for data processing with some knowledge on hydrogeology and modelling. They will collect data according to the data lists (Table 1 in Appendix D) in July and August, 2013.
2) The nominated staff will come to Netherlands, Deltares, in the autumn of 2013 for participating in constructing 3D regional groundwater models or (depending on skills) for assisting in model output visualization (e.g. GIS-maps and reporting).
3) A MSc student from Utrecht University will assist Deltares in constructing the 3D model according to Table in Appendix D starting September 2013.
4) A MSc student, Mr Ruknul Ferdous, from UNESCO-IHE who is from CEGIS will contribute to the analysis of metrological, hydrological and groundwater time series and assessment of salinity impacts and potential measures. The research starts in September 2013 and will finish in April 2014.
5) A training on salinity monitoring will be conducted in December 2013/January 2014 according to the plan in Table 3 of Appendix D.
6) The final project information dissemination seminar will be organized in the summer of 2014. The preliminary plan is in Table 5 of Appendix D.
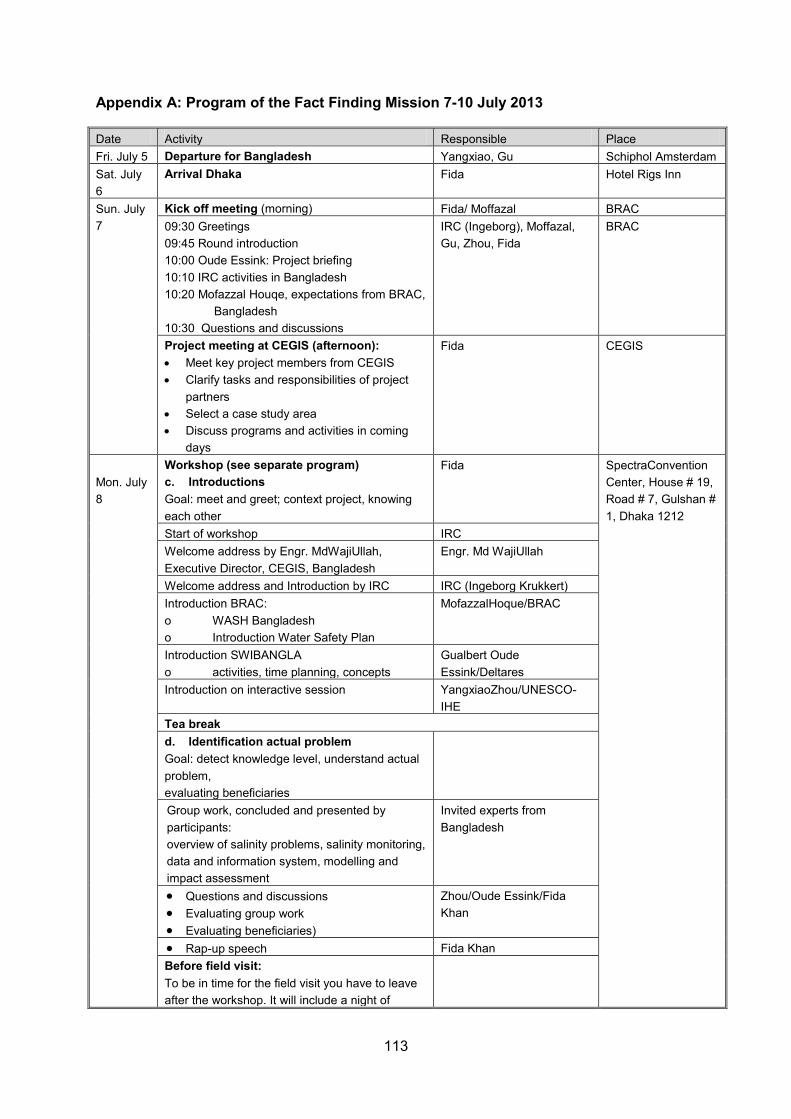
113
Appendix A: Program of the Fact Finding Mission 7-10 July 2013
Date Activity Responsible Place Fri. July 5 Departure for Bangladesh Yangxiao, Gu Schiphol Amsterdam Sat. July 6
Arrival Dhaka Fida Hotel Rigs Inn
Sun. July 7
Kick off meeting (morning) Fida/ Moffazal BRAC 09:30 Greetings 09:45 Round introduction 10:00 Oude Essink: Project briefing 10:10 IRC activities in Bangladesh 10:20 Mofazzal Houqe, expectations from BRAC,
Bangladesh 10:30 Questions and discussions
IRC (Ingeborg), Moffazal, Gu, Zhou, Fida
BRAC
Project meeting at CEGIS (afternoon): Meet key project members from CEGIS Clarify tasks and responsibilities of project
partners Select a case study area Discuss programs and activities in coming
days
Fida CEGIS
Mon. July 8
Workshop (see separate program) c. Introductions Goal: meet and greet; context project, knowing each other
Fida SpectraConvention Center, House # 19, Road # 7, Gulshan # 1, Dhaka 1212
Start of workshop IRC Welcome address by Engr. MdWajiUllah, Executive Director, CEGIS, Bangladesh
Engr. Md WajiUllah
Welcome address and Introduction by IRC IRC (Ingeborg Krukkert) Introduction BRAC: o WASH Bangladesh o Introduction Water Safety Plan
MofazzalHoque/BRAC
Introduction SWIBANGLA o activities, time planning, concepts
Gualbert Oude Essink/Deltares
Introduction on interactive session YangxiaoZhou/UNESCO-IHE
Tea break d. Identification actual problem Goal: detect knowledge level, understand actual problem, evaluating beneficiaries
Group work, concluded and presented by participants: overview of salinity problems, salinity monitoring, data and information system, modelling and impact assessment
Invited experts from Bangladesh
Questions and discussions Evaluating group work Evaluating beneficiaries)
Zhou/Oude Essink/Fida Khan
Rap-up speech Fida Khan Before field visit: To be in time for the field visit you have to leave after the workshop. It will include a night of

114
traveling. The location in mind by Fida: ‘Barguna’ district in the far South, te be determined on Monday worshop
Tue. July 9
Field visit Goals: see actual problems, scale of problem, contact with local communities
Yangxiao, Gu
Coastal areas with salinity problems: evidences of salinity problems, causes of salinity, impacts on local communities, measures implemented, monitoring of salinity, governance structure
Fida/Gu
BRACWASH service projects (sources of water supply, monitoring of water quality, drinking water treatment, impacts of salinity)
After field visit. Traveling start in the afternoon again and will again go over night.
Fida
Wed. July 10
Visits to key stakeholders (morning) Fida Goals: start embedding this project (results) in water sector Bangladesh
Fida
Dutch Embassy (briefing project activities and plans)
Gu
Ministry of Water Resources (link project activities to national IWRM priorities)
BRAC (link project activities to WASH services and water safety plans in pilot areas)
Bangladesh Water Development Board (support for data collection)
Development of working plans (afternoon) Goals: team building, data (availability, format, source), detailed activity plans, distribution of tasks
Gu, Yangxiao Gulshan II Dhaka Bangladesh Data collection and analysis: lists of data
requirement, sources of data, schedule of data collection, methods of data collection, expected results
Fida
Salinity monitoring (current and new): identification of data gaps, definition of target areas for pilot studies, plan of collection of new data, instruments, schedules
Zhou
Salt water intrusion modelling (concept, scale, 2D3D): model area, objectives, conceptual model structure, numerical model details, model calibration, use of model for analysis of salinity impacts, formulation of management scenarios
Gu
Training: target groups, training need assessment, program of training courses, delivery schedules
Zhou
Thu. July 11
Departure Dhaka Gu, Yangxiao
Gu: +31-6-30550408, Fida: +8801819261274, Zhou: +31-6-57816828
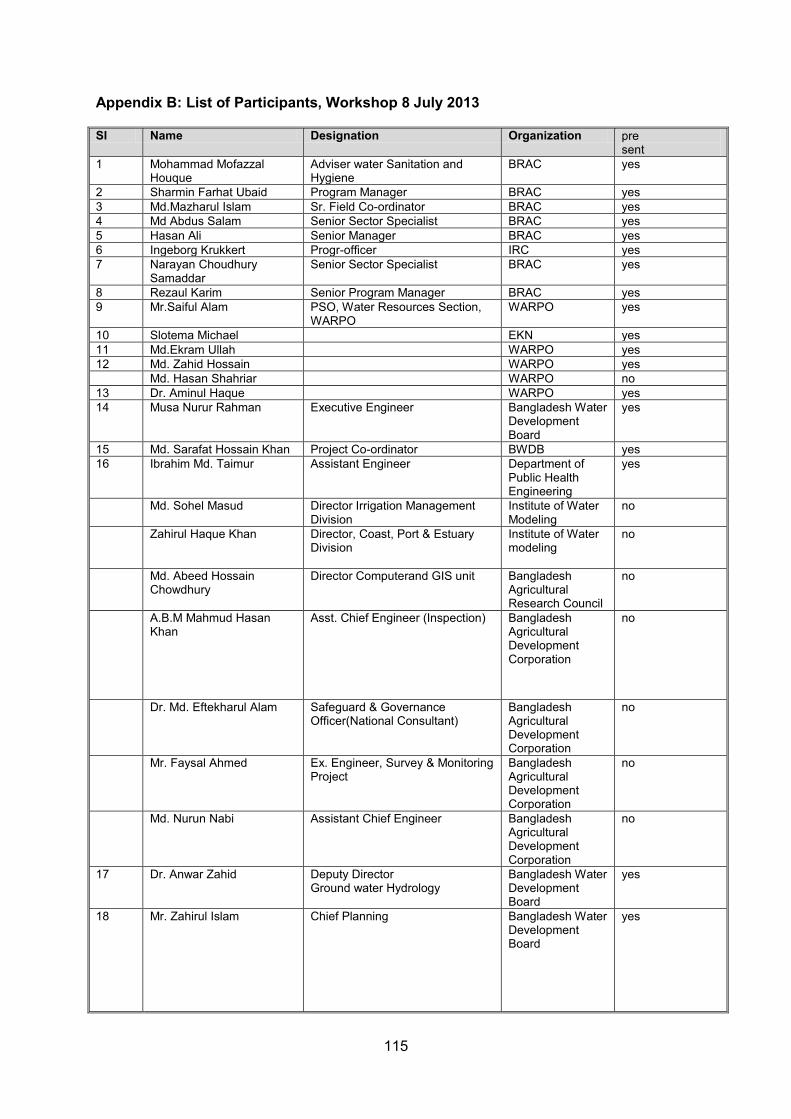
115
Appendix B: List of Participants, Workshop 8 July 2013
SI Name Designation Organization pre sent
1 Mohammad Mofazzal Houque
Adviser water Sanitation and Hygiene
BRAC yes
2 Sharmin Farhat Ubaid Program Manager BRAC yes 3 Md.Mazharul Islam Sr. Field Co-ordinator BRAC yes 4 Md Abdus Salam Senior Sector Specialist BRAC yes 5 Hasan Ali Senior Manager BRAC yes 6 Ingeborg Krukkert Progr-officer IRC yes 7 Narayan Choudhury
Samaddar Senior Sector Specialist BRAC yes
8 Rezaul Karim Senior Program Manager BRAC yes 9 Mr.Saiful Alam PSO, Water Resources Section,
WARPO WARPO yes
10 Slotema Michael EKN yes 11 Md.Ekram Ullah WARPO yes 12 Md. Zahid Hossain WARPO yes Md. Hasan Shahriar WARPO no 13 Dr. Aminul Haque WARPO yes 14 Musa Nurur Rahman Executive Engineer Bangladesh Water
Development Board
yes
15 Md. Sarafat Hossain Khan Project Co-ordinator BWDB yes 16 Ibrahim Md. Taimur Assistant Engineer Department of
Public Health Engineering
yes
Md. Sohel Masud Director Irrigation Management Division
Institute of Water Modeling
no
Zahirul Haque Khan
Director, Coast, Port & Estuary Division
Institute of Water modeling
no
Md. Abeed Hossain Chowdhury
Director Computerand GIS unit Bangladesh Agricultural Research Council
no
A.B.M Mahmud Hasan Khan
Asst. Chief Engineer (Inspection) Bangladesh Agricultural Development Corporation
no
Dr. Md. Eftekharul Alam Safeguard & Governance Officer(National Consultant)
Bangladesh Agricultural Development Corporation
no
Mr. Faysal Ahmed Ex. Engineer, Survey & Monitoring Project
Bangladesh Agricultural Development Corporation
no
Md. Nurun Nabi Assistant Chief Engineer Bangladesh Agricultural Development Corporation
no
17 Dr. Anwar Zahid Deputy Director Ground water Hydrology
Bangladesh Water Development Board
yes
18 Mr. Zahirul Islam Chief Planning Bangladesh Water Development Board
yes

116
Mr Abdur Rahman Akanda Director Planning-I
Bangladesh Water Development Board
no
Mr Gopal Chandra Sutradhar
Director,Planning II no
19 Mr Masud Ahmed Director,Planning III yes
20 Mr.Sayedul Islam Chief Engineer, Hydrology BWDB yes
Mr Provati Mukherjee Director River Morphology &Research Circle
no
Dr. Mashfiques Salehin Professor Institute of Water and Flood Management
no
Mr. Saifur Rahman Executive Engineer, R&D Section, Groundwater Monitoring Circle
Department of Public Health Engineering
no
Mr.A.K.M. Ibrahim Superintending Engineer (Ground Water Circle)
Department of Public Health Engineering
no
Dr. Sultan Ahmad Joint Secretary, Director (NRM) Department of Environment
no
Md. Taslimul Islam Deputy Secretary (DEV1) Ministry of Water Resources, Bangladesh
no
Hasin Jahan Director, Programmes in Water Aid Bangladesh
Water Aid no
Md. Moqbul Hossain Principal Scientific Officer Training section
Soil Resources Development Institute
no
21 Dr.Abu Wali Raghib Hasan Project Director, Department of Agricultural Extension
yes
Md. Khairul Islam Director (Geology) & Branch Chief (Geological Mapping & Quaternary Geology)
Geological Survey of Bangladesh
no
Prof Dr. M. Mirzahan Mia Professor Bangladesh University of Engineering& Technology
no
Babul Bala Assistant Programme Coordinate-Engineer
WaterAid no
Mr Giasuddin Ahmed Choudhury
Adviser, Water Resources Management
CEGIS no
22 Dr Maminul Haque Sarker Deputy Executive Director (Development)
CEGIS yes
23 Mr Md Waji Ullah Executive Director CEGIS yes 24 Dr Ahmadul Hassan Director, R&D and Training CEGIS yes 25 Dr Abdul Hamid Director, Business Development,
Admn& HRD CEGIS
yes
26 Mr Mollah Md Awlad Hossain
Director, GIS CEGIS
yes
27 Mr Malik Fida A Khan Director, Climate Change Study CEGIS
yes
28 Mr Md Sarfaraz Wahed Director, Water Resources CEGIS
yes
Dr Dilruba Ahmed Director, Social and Economic CEGIS
no
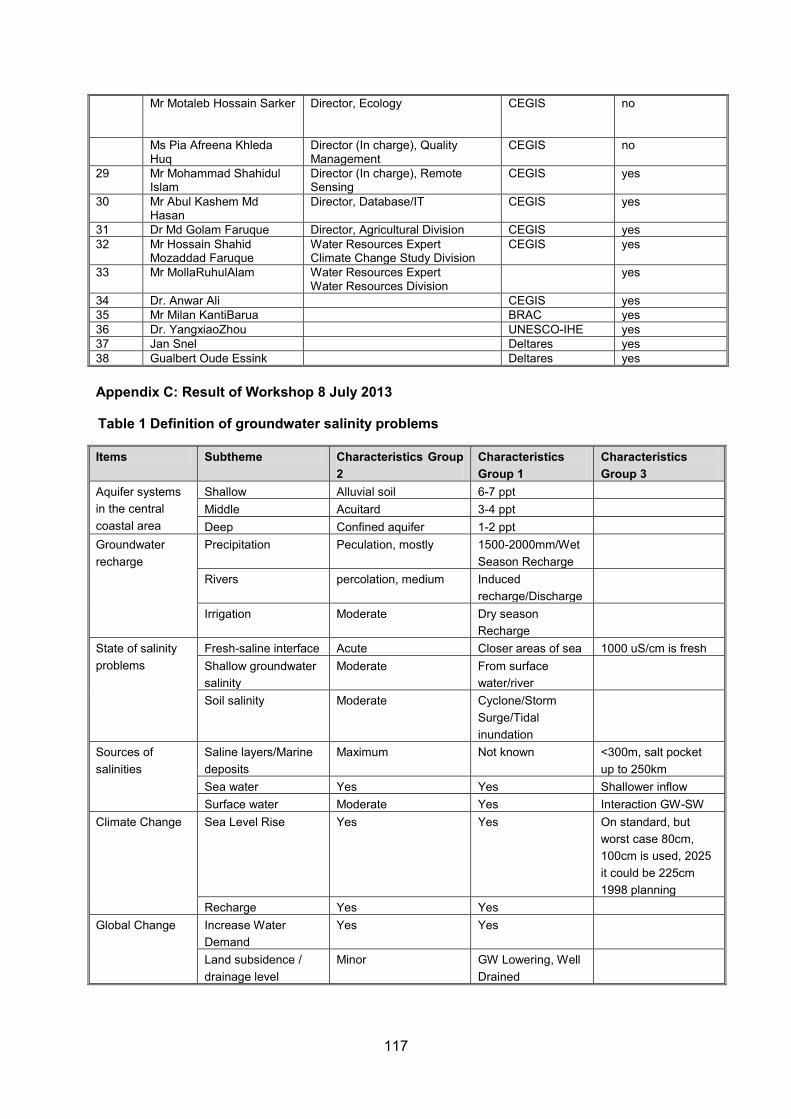
117
Mr Motaleb Hossain Sarker Director, Ecology
CEGIS no
Ms Pia Afreena Khleda Huq
Director (In charge), Quality Management
CEGIS no
29 Mr Mohammad Shahidul Islam
Director (In charge), Remote Sensing
CEGIS
yes
30 Mr Abul Kashem Md Hasan
Director, Database/IT CEGIS yes
31 Dr Md Golam Faruque Director, Agricultural Division CEGIS yes 32 Mr Hossain Shahid
Mozaddad Faruque Water Resources Expert Climate Change Study Division
CEGIS yes
33 Mr MollaRuhulAlam
Water Resources Expert Water Resources Division
yes
34 Dr. Anwar Ali CEGIS yes 35 Mr Milan KantiBarua BRAC yes 36 Dr. YangxiaoZhou UNESCO-IHE yes 37 Jan Snel Deltares yes 38 Gualbert Oude Essink Deltares yes Appendix C: Result of Workshop 8 July 2013
Table 1 Definition of groundwater salinity problems
Items Subtheme Characteristics Group 2
Characteristics Group 1
Characteristics Group 3
Aquifer systems in the central coastal area
Shallow Alluvial soil 6-7 ppt Middle Acuitard 3-4 ppt Deep Confined aquifer 1-2 ppt
Groundwater recharge
Precipitation Peculation, mostly 1500-2000mm/Wet Season Recharge
Rivers percolation, medium Induced recharge/Discharge
Irrigation Moderate Dry season Recharge
State of salinity problems
Fresh-saline interface Acute Closer areas of sea 1000 uS/cm is fresh Shallow groundwater salinity
Moderate From surface water/river
Soil salinity Moderate Cyclone/Storm Surge/Tidal inundation
Sources of salinities
Saline layers/Marine deposits
Maximum Not known <300m, salt pocket up to 250km
Sea water Yes Yes Shallower inflow Surface water Moderate Yes Interaction GW-SW
Climate Change Sea Level Rise Yes Yes On standard, but worst case 80cm, 100cm is used, 2025 it could be 225cm 1998 planning
Recharge Yes Yes Global Change Increase Water
Demand Yes Yes
Land subsidence / drainage level
Minor GW Lowering, Well Drained
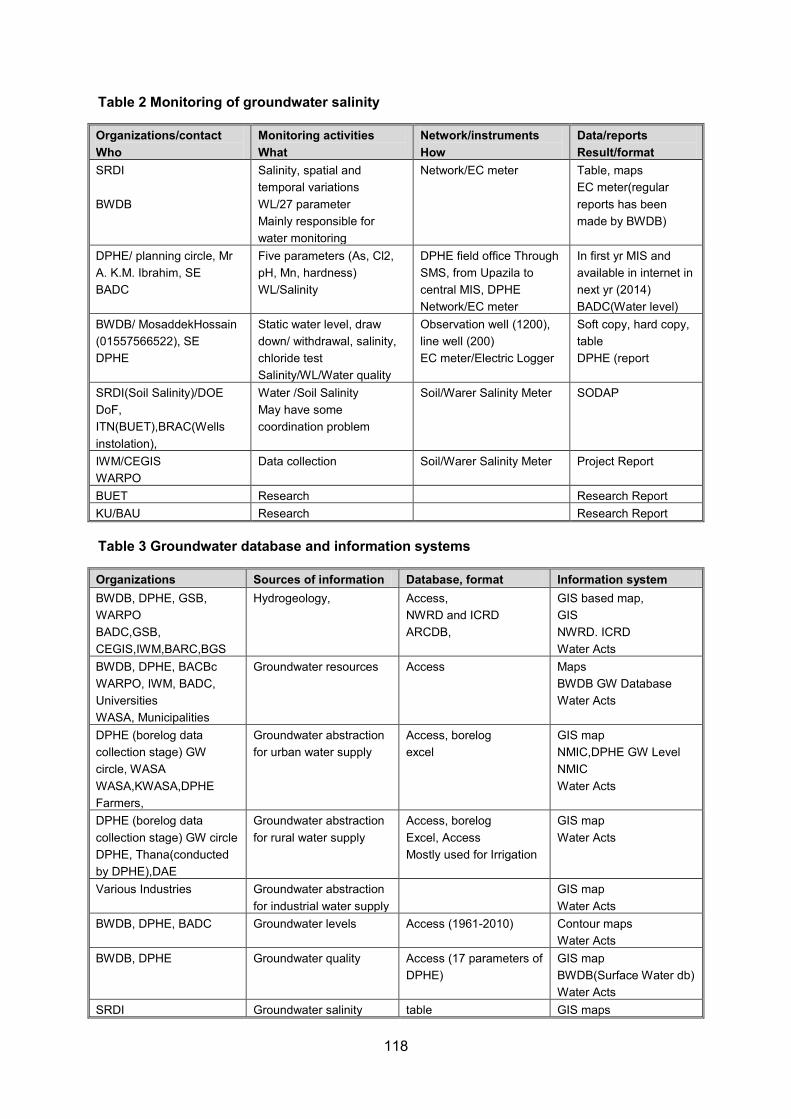
118
Table 2 Monitoring of groundwater salinity
Organizations/contact Who
Monitoring activities What
Network/instruments How
Data/reports Result/format
SRDI BWDB
Salinity, spatial and temporal variations WL/27 parameter Mainly responsible for water monitoring
Network/EC meter Table, maps EC meter(regular reports has been made by BWDB)
DPHE/ planning circle, Mr A. K.M. Ibrahim, SE BADC
Five parameters (As, Cl2, pH, Mn, hardness) WL/Salinity
DPHE field office Through SMS, from Upazila to central MIS, DPHE Network/EC meter
In first yr MIS and available in internet in next yr (2014) BADC(Water level)
BWDB/ MosaddekHossain (01557566522), SE DPHE
Static water level, draw down/ withdrawal, salinity, chloride test Salinity/WL/Water quality
Observation well (1200), line well (200) EC meter/Electric Logger
Soft copy, hard copy, table DPHE (report
SRDI(Soil Salinity)/DOE DoF, ITN(BUET),BRAC(Wells instolation),
Water /Soil Salinity May have some coordination problem
Soil/Warer Salinity Meter SODAP
IWM/CEGIS WARPO
Data collection Soil/Warer Salinity Meter Project Report
BUET Research Research Report KU/BAU Research Research Report Table 3 Groundwater database and information systems
Organizations Sources of information Database, format Information system BWDB, DPHE, GSB, WARPO BADC,GSB, CEGIS,IWM,BARC,BGS
Hydrogeology,
Access, NWRD and ICRD ARCDB,
GIS based map, GIS NWRD. ICRD Water Acts
BWDB, DPHE, BACBc WARPO, IWM, BADC, Universities WASA, Municipalities
Groundwater resources Access Maps BWDB GW Database Water Acts
DPHE (borelog data collection stage) GW circle, WASA WASA,KWASA,DPHE Farmers,
Groundwater abstraction for urban water supply
Access, borelog excel
GIS map NMIC,DPHE GW Level NMIC Water Acts
DPHE (borelog data collection stage) GW circle DPHE, Thana(conducted by DPHE),DAE
Groundwater abstraction for rural water supply
Access, borelog Excel, Access Mostly used for Irrigation
GIS map Water Acts
Various Industries Groundwater abstraction for industrial water supply
GIS map Water Acts
BWDB, DPHE, BADC Groundwater levels Access (1961-2010) Contour maps Water Acts
BWDB, DPHE Groundwater quality Access (17 parameters of DPHE)
GIS map BWDB(Surface Water db) Water Acts
SRDI Groundwater salinity table GIS maps
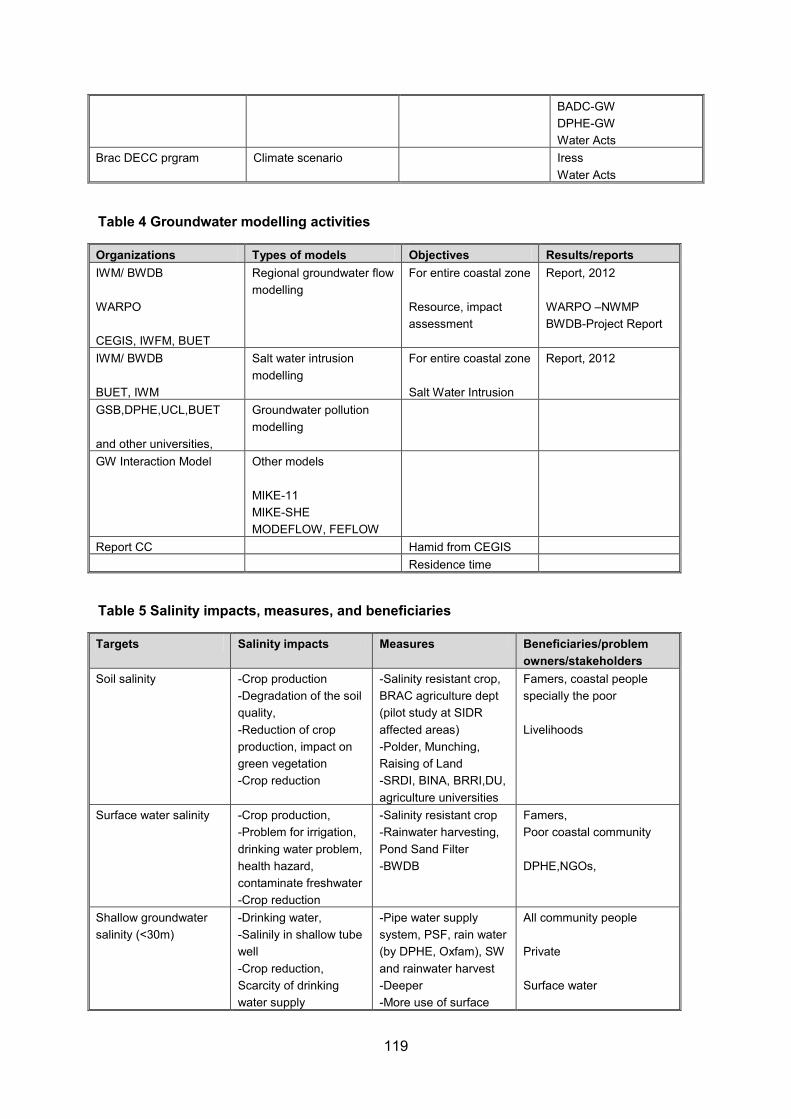
119
BADC-GW DPHE-GW Water Acts
Brac DECC prgram Climate scenario Iress Water Acts
Table 4 Groundwater modelling activities
Organizations Types of models Objectives Results/reports IWM/ BWDB WARPO CEGIS, IWFM, BUET
Regional groundwater flow modelling
For entire coastal zone Resource, impact assessment
Report, 2012 WARPO –NWMP BWDB-Project Report
IWM/ BWDB BUET, IWM
Salt water intrusion modelling
For entire coastal zone Salt Water Intrusion
Report, 2012
GSB,DPHE,UCL,BUET and other universities,
Groundwater pollution modelling
GW Interaction Model Other models MIKE-11 MIKE-SHE MODEFLOW, FEFLOW
Report CC Hamid from CEGIS Residence time
Table 5 Salinity impacts, measures, and beneficiaries
Targets Salinity impacts Measures Beneficiaries/problem owners/stakeholders
Soil salinity -Crop production -Degradation of the soil quality, -Reduction of crop production, impact on green vegetation -Crop reduction
-Salinity resistant crop, BRAC agriculture dept (pilot study at SIDR affected areas) -Polder, Munching, Raising of Land -SRDI, BINA, BRRI,DU, agriculture universities
Famers, coastal people specially the poor Livelihoods
Surface water salinity
-Crop production, -Problem for irrigation, drinking water problem, health hazard, contaminate freshwater -Crop reduction
-Salinity resistant crop -Rainwater harvesting, Pond Sand Filter -BWDB
Famers, Poor coastal community DPHE,NGOs,
Shallow groundwater salinity (<30m)
-Drinking water, -Salinily in shallow tube well -Crop reduction, Scarcity of drinking water supply
-Pipe water supply system, PSF, rain water (by DPHE, Oxfam), SW and rainwater harvest -Deeper -More use of surface
All community people Private Surface water

120
water and rainwater, -Crop diversification
Middle groundwater salinity
-Agricultural production loss -Scarcity of drinking water supply
-SW and rainwater harvest -Deep Tube well -Alternate fresh water option, mapping of fresh water aquifer (if any)
Farmers Private, NGOs
Deep groundwater salinity (>200m)
-Agricultural production loss -Scarcity of drinking water supply
-Desalination reverse osmosis (at sonailtola and union, Mongla by DPHE), SW and rainwater harvest -Deep Tubewell -Alternate fresh water option, mapping of fresh water aquifer (if any)
Farmers Drinking
Appendix D Working plan
Table 1 Data collection July-Aug 2013
Type Data Source Person Time Topo DEM CEGIS: July-Aug
Topo map (shape files GIS) Morphology maps ()
Meteo Monthly rainfall Monthly Evapotranspiration Monthly Temp.
Surface water River map, gauging station River stages/levels River discharges River salinity ? River cross-section
Groundwater
Groundwater resources assessment report ?
Groundwater modelling study report ?
Groundwater investigation report, survey
Hydrogeology map/cross-sections Boreholes/pumping tests Monthly groundwater level Groundwater salinity measures (all levels)
Saline layers/Marine deposits? Groundwater recharge Groundwater abstraction (location and rate) 50%
Land use Land use map Land use types Crop yield Irrigation 50%
Table 2 Modelling: Sept 2013-April 2014
STEPS Activities Time Person

121
Conceptual model Model layers WUR-student, Ferdous
Boundary conditions
Parameters
Inputs
Outputs
Numerical model Model grid
Time
Thickness/elevation of model layers
Layer parameters
Model calibration Flow model
Observed head
Saline model
Observed salinities
Fresh/saline interface, 3D distribution
Model application Climate scenarios
Global change scenarios
Groundwater use scenarios
Modelling report
Table 3 Monitoring
Activities Time Person Test measurements of EC of rivers/drinking water wells (groundwater)
2 months summer July 2013 Jan Snel CEGIS
Training of using salinity monitoring instruments
Training Mission, Nov/Dec 2013
Stuurman BRAC, CEGIS, Local
EC measurements in a dry periods Nov/Dec 2013, Feb 2014, May 2014
CEGIS, BRAC, locals
Recommendations for systematic monitoring
May 2004 All
Table 4: Training
Activities Time Person Training groundwater modelling Sept-Oct 2013 One expert CEGIS Training of monitoring Dec 2013

122
Table 5 Dissemination
Activities Time Person Solutions May 2014 BRAC, locals, all Brochures May 2014 Meeting stakeholders July 2014, ask IRC Seminar: CEGIS: big seminar, secretary, IWM
July 2014, ask IRC
123
Appendix E: Welcome address Md. Waji Ullah Workshop
Distinguished invitees, Ladies and Gentlemen; AssalamuAlaikum and very good morning. This is Md. Waji Ullah, Executive Director of CEGIS would like to humbly welcome you all
to participate in today’s inception workshop titled as “Managing Saltwater Intrusion Impacts in Bangladesh”.
This workshop is subjected as a part of the project with consortium of Deltares, UNESCO-IHE and CEGIS. Under this project a 3D density dependent ground water model will be established for the coastal area of Bangladesh. In addition, different salinity monitoring strategies will be recommendation for different areas. Piloting of monitoring will be performed in some areas to test effectiveness. Monitoring technologies will be transferred to stakeholders in this project. Last, but not the least, a safe water plan will be prepared addressing adaptation and mitigation of salinity intrusion.
As we all know, in Bangladesh saltwater intrusion is threatening drinking water resources on a large scale and is therefore confronting the population with a serious health issue. Water Safety Plans need to be updated and upgraded, taking into account this new challenge, on top of the more established and acknowledged water contamination issues such as arsenic and bacterial contamination. Currently, however, awareness of the salinization issue is relatively low in the WASH sector of Bangladesh. Moreover, WASH services managers are lacking the knowledge and skills to effectively anticipate on salinization of drinking water resources.
Concurrently, this project aims to increase the level of awareness and knowledge and at the same time skills that would be required for integrated water management in the face of salinization of resources.
The main objectives of the project can be stated as- To create a better understanding of the physical process of salinization in Bangladesh, To provide recommendations for monitoring, To provide recommendations for mitigation and adaptation, To create an effective knowledge transfer and To provide guidance on the integration of the salinization issue in Water Safety Planning in
Bangladesh. The main aim of this workshop is to gather country's renowned experts to brainstorm their
thoughts in different sessions and contribute to the formulation of the research approach. We would be delighted if you all spontaneously join us and shear your knowledge and understanding in the context of the issue that we are trying to address in the area concerned.
I am sure that at the end of the day, this workshop will successfully come up with some defined and a workable approach to make a safe water plan which is intended in this project. Please share your knowledgeable recommendations and guide us towards the way of success.
And again, I would like to thank you all to present here and welcome all to participate dynamically for the success of this workshop.
Thank you all for your kind cooperation. Thank you.

124
Annex 2: Leaflet salinization processes and mitigation strategies

125
Annex 3: Groundwater modelling workshop (June, 4th-5th, 2014)
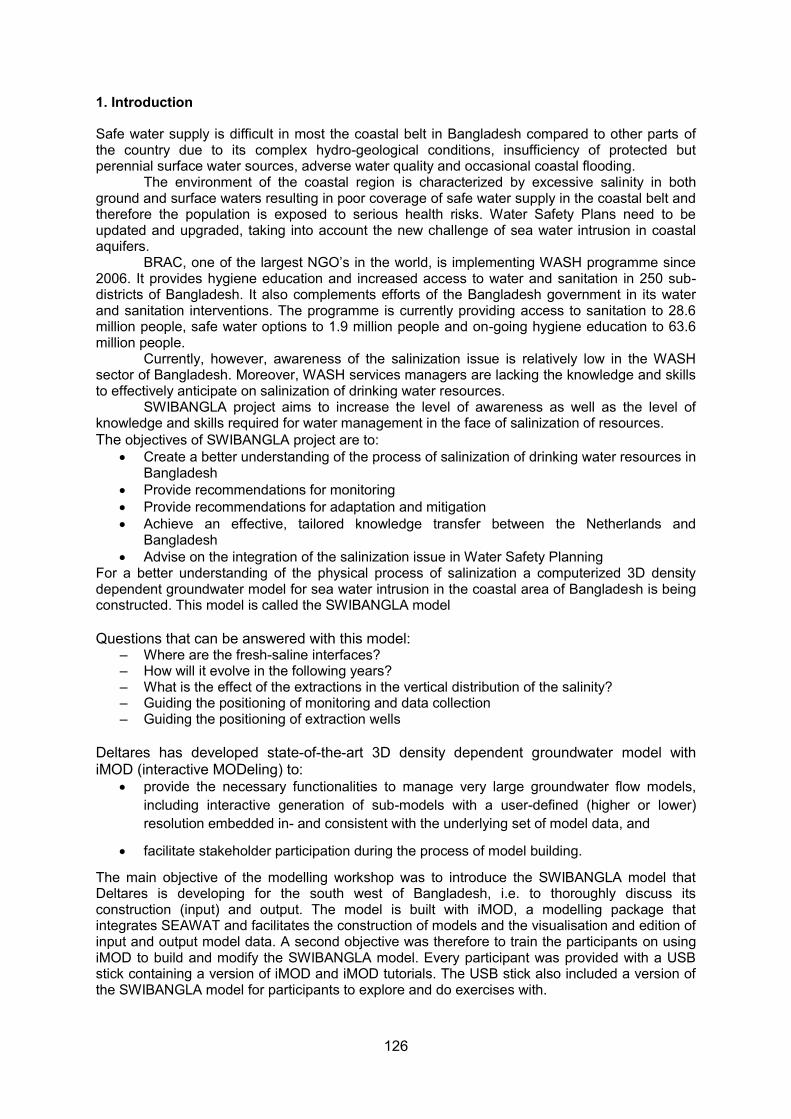
126
1. Introduction
Safe water supply is difficult in most the coastal belt in Bangladesh compared to other parts of the country due to its complex hydro-geological conditions, insufficiency of protected but perennial surface water sources, adverse water quality and occasional coastal flooding.
The environment of the coastal region is characterized by excessive salinity in both ground and surface waters resulting in poor coverage of safe water supply in the coastal belt and therefore the population is exposed to serious health risks. Water Safety Plans need to be updated and upgraded, taking into account the new challenge of sea water intrusion in coastal aquifers.
BRAC, one of the largest NGO’s in the world, is implementing WASH programme since 2006. It provides hygiene education and increased access to water and sanitation in 250 sub-districts of Bangladesh. It also complements efforts of the Bangladesh government in its water and sanitation interventions. The programme is currently providing access to sanitation to 28.6 million people, safe water options to 1.9 million people and on-going hygiene education to 63.6 million people.
Currently, however, awareness of the salinization issue is relatively low in the WASH sector of Bangladesh. Moreover, WASH services managers are lacking the knowledge and skills to effectively anticipate on salinization of drinking water resources.
SWIBANGLA project aims to increase the level of awareness as well as the level of knowledge and skills required for water management in the face of salinization of resources. The objectives of SWIBANGLA project are to:
Create a better understanding of the process of salinization of drinking water resources in Bangladesh
Provide recommendations for monitoring Provide recommendations for adaptation and mitigation Achieve an effective, tailored knowledge transfer between the Netherlands and
Bangladesh Advise on the integration of the salinization issue in Water Safety Planning
For a better understanding of the physical process of salinization a computerized 3D density dependent groundwater model for sea water intrusion in the coastal area of Bangladesh is being constructed. This model is called the SWIBANGLA model Questions that can be answered with this model:
– Where are the fresh-saline interfaces? – How will it evolve in the following years? – What is the effect of the extractions in the vertical distribution of the salinity? – Guiding the positioning of monitoring and data collection – Guiding the positioning of extraction wells
Deltares has developed state-of-the-art 3D density dependent groundwater model with iMOD (interactive MODeling) to:
provide the necessary functionalities to manage very large groundwater flow models, including interactive generation of sub-models with a user-defined (higher or lower) resolution embedded in- and consistent with the underlying set of model data, and
facilitate stakeholder participation during the process of model building.
The main objective of the modelling workshop was to introduce the SWIBANGLA model that Deltares is developing for the south west of Bangladesh, i.e. to thoroughly discuss its construction (input) and output. The model is built with iMOD, a modelling package that integrates SEAWAT and facilitates the construction of models and the visualisation and edition of input and output model data. A second objective was therefore to train the participants on using iMOD to build and modify the SWIBANGLA model. Every participant was provided with a USB stick containing a version of iMOD and iMOD tutorials. The USB stick also included a version of the SWIBANGLA model for participants to explore and do exercises with.
127
A major difference of iMOD, compared to other conventional modeling packages, is the generic georeferenced data structure that for spatial data may contain files with unequal resolutions and can be used to generate sub-models at different scales and resolutions applying up and down-scaling concepts. This is done internally without creating sub-sets of the original model data. For modelers and stakeholders, this offers high performance, flexibility and transparency. Figure 1 gives the 3D model generated by using iMOD for the south western part of Bangladesh.
Figure 1. 3D density dependent groundwater model for south west Bangladesh (SWIBANGLA model).
2. Participants
Total 10 participants were trained in the Ground Water Modeling Workshop which was held at Department of Public Health Engineering (DPHE) head office in Dhaka. Five participants were from DPHE, three from BRAC University and two from Jahangirnagar University. Table 1 gives the list of participants in the Ground Water Modeling Workshop. Table 1 List of participants. Organization Participants Name and address of the participants
DPHE 5 Md. Didarul Alam Tushar, Asst. Engineer, DPHE, Groundwater Circle, Dhaka Fahim Hassan Siraji, Asst. Engineer, DPHE, Groundwater Management Project, Dhaka Shafiqul Alam, Asst. Engineer, DPHE, Arsenic Management Division, Dhaka Ms. Ismat Nur-e-Jahan, Asst. Engineer, DPHE, NMIS, Dhaka, Ms. Shahana Alam, Asst. Engineer, DPHE, NMIS, Dhaka,
BRAC University
3 Abu S Moniruzzaman Khan, Assistant Professor Ali Md. Rezaie, Lecturer Nandan Mukherjee, Director
Jahangirnagar University
2 Dr. Khairul Bashar, Professor Maroof Mehedi, MS Hydrogeology Student
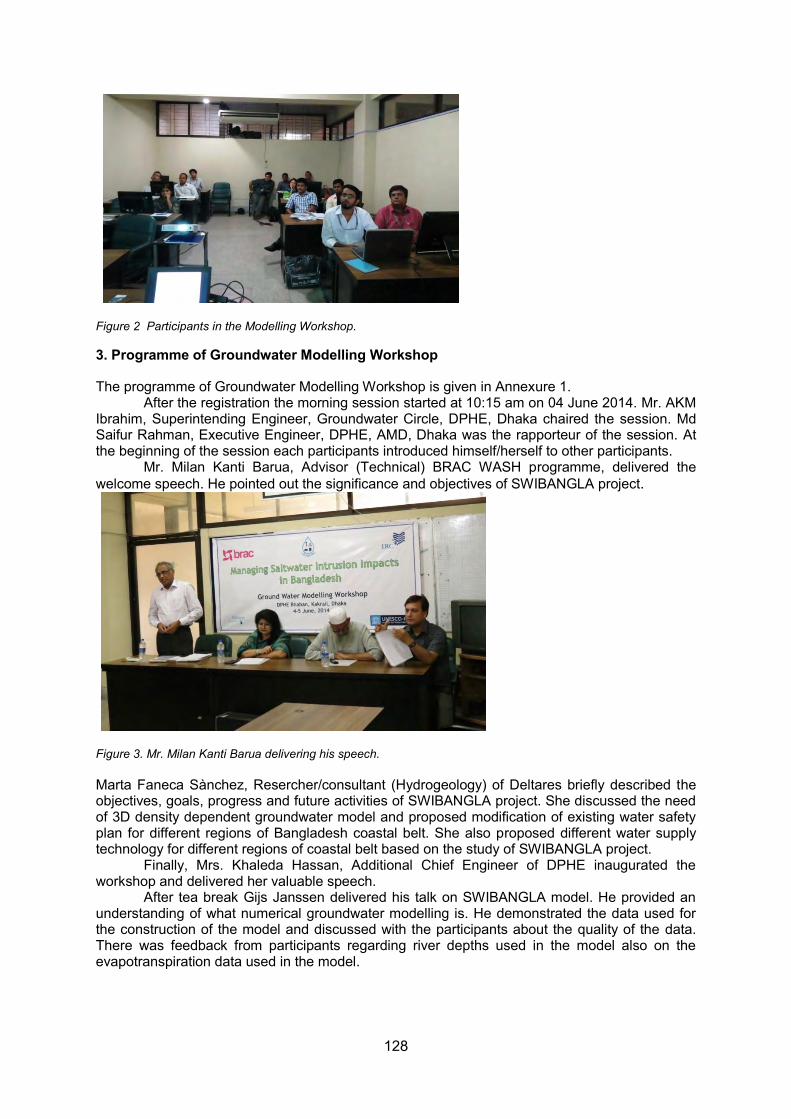
128
Figure 2 Participants in the Modelling Workshop. 3. Programme of Groundwater Modelling Workshop
The programme of Groundwater Modelling Workshop is given in Annexure 1. After the registration the morning session started at 10:15 am on 04 June 2014. Mr. AKM
Ibrahim, Superintending Engineer, Groundwater Circle, DPHE, Dhaka chaired the session. Md Saifur Rahman, Executive Engineer, DPHE, AMD, Dhaka was the rapporteur of the session. At the beginning of the session each participants introduced himself/herself to other participants.
Mr. Milan Kanti Barua, Advisor (Technical) BRAC WASH programme, delivered the welcome speech. He pointed out the significance and objectives of SWIBANGLA project.
Figure 3. Mr. Milan Kanti Barua delivering his speech. Marta Faneca Sànchez, Resercher/consultant (Hydrogeology) of Deltares briefly described the objectives, goals, progress and future activities of SWIBANGLA project. She discussed the need of 3D density dependent groundwater model and proposed modification of existing water safety plan for different regions of Bangladesh coastal belt. She also proposed different water supply technology for different regions of coastal belt based on the study of SWIBANGLA project.
Finally, Mrs. Khaleda Hassan, Additional Chief Engineer of DPHE inaugurated the workshop and delivered her valuable speech.
After tea break Gijs Janssen delivered his talk on SWIBANGLA model. He provided an understanding of what numerical groundwater modelling is. He demonstrated the data used for the construction of the model and discussed with the participants about the quality of the data. There was feedback from participants regarding river depths used in the model also on the evapotranspiration data used in the model.
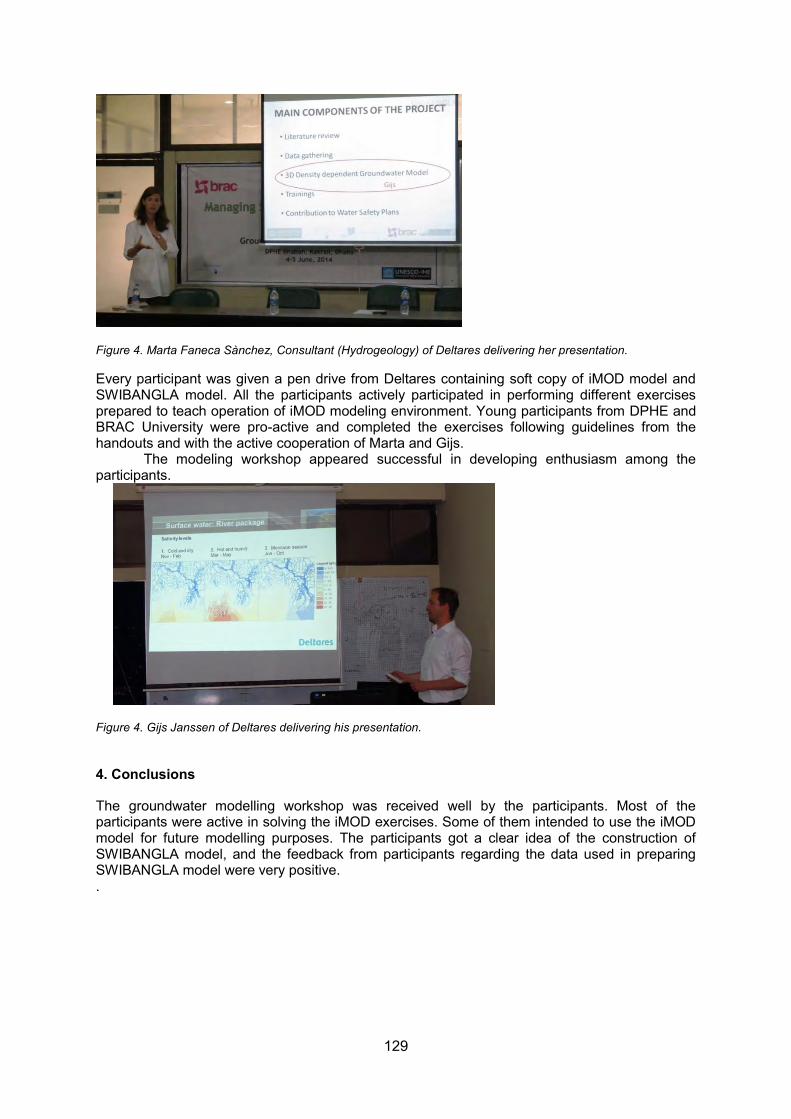
129
Figure 4. Marta Faneca Sànchez, Consultant (Hydrogeology) of Deltares delivering her presentation. Every participant was given a pen drive from Deltares containing soft copy of iMOD model and SWIBANGLA model. All the participants actively participated in performing different exercises prepared to teach operation of iMOD modeling environment. Young participants from DPHE and BRAC University were pro-active and completed the exercises following guidelines from the handouts and with the active cooperation of Marta and Gijs.
The modeling workshop appeared successful in developing enthusiasm among the participants.
Figure 4. Gijs Janssen of Deltares delivering his presentation.
4. Conclusions
The groundwater modelling workshop was received well by the participants. Most of the participants were active in solving the iMOD exercises. Some of them intended to use the iMOD model for future modelling purposes. The participants got a clear idea of the construction of SWIBANGLA model, and the feedback from participants regarding the data used in preparing SWIBANGLA model were very positive. .

130
Annexure 1
GROUNDWATER MODELLING WORKSHOP 4 - 5 June 2014
DPHE Head Office, 4th floor, Kakrail, Dhaka, Bangladesh
Day 1, Wednesday June 4
Chair: Mr. AKM Ibrahim, Superintending Engineer, Groundwater Circle, DPHE, Dhaka Rapporteur: Md Saifur Rahman, EE DPHE, AMD, Dhaka 10.00 – 10.15 Walk-in and registration 10.15 – 10.20 Self-Introduction by participants 10.20 – 10.30 Welcome speech Dr. Babar Kabir, Senior Director, BRAC 10.30 – 11.00 Introduction to the SWIBANGLA project and the workshop 11.00 – 11.10 Inauguration by Chief Engineer, DPHE Tea Break 11.30 – 12.30 Introduction to (density-dependent) groundwater flow and solute transport modeling and introduction to the SWIBANGLA model Lunch 14.00 – 14.30 Introduction to iMOD(-SEAWAT) 14.30 – 15.15 Installation of iMOD software and play with iMOD Tea Break 15.30 – 16.00 Running the SWIBANGLA model: explanation of the runfile and I/O structure 16.00 – 17.00 Exercise 1: run the model and visualize and export output in iMOD. 17.00 End of workshop day 1
Day 2, Thursday June 5
Chair: Mr. AKM Ibrahim, Superintending Engineer, Groundwater Circle, DPHE, Dhaka Rapporteur: Md Saifur Rahman, EE DPHE, AMD, Dhaka 10.00 – 10.15 Walk-in 10.15 – 11.15 Exercise 2: create two versions of the model and evaluate the differences in model output (heads, velocities) in iMOD Tea Break 11.30 – 12.30 Exercise 3: Adjustment of raster input data (IDF adjustments) Lunch 14.00 – 15.00 Exercise 4: adjustment of point input data (IPF adjustments) Tea Break 15.15 – 16.30 Exercise 5: Streamline calculations 16.30 End of workshop
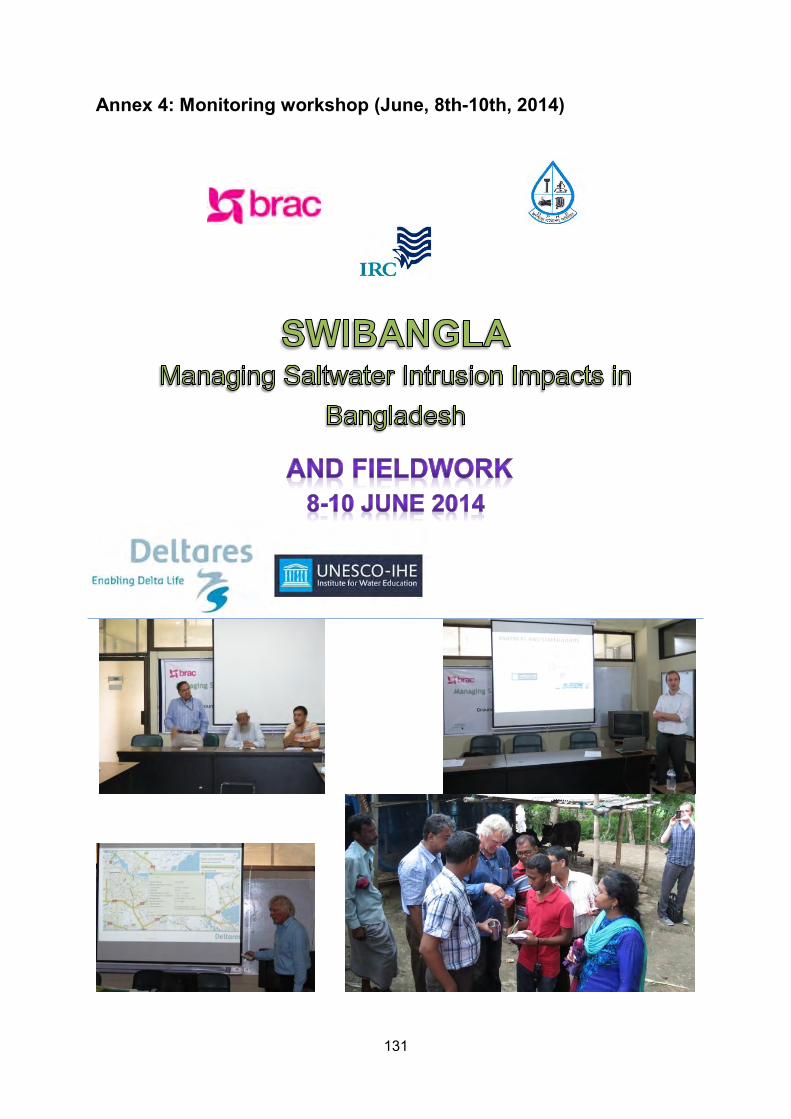
131
Annex 4: Monitoring workshop (June, 8th-10th, 2014)

132
1. Introduction
Safe water supply is difficult in most the coastal belt in Bangladesh compared to other parts of the country due to its complex hydro-geological conditions, insufficiency of protected but perennial surface water sources, adverse water quality and occasional coastal flooding.
The environment of the coastal region is characterized by excessive salinity in both ground and surface waters resulting in poor coverage of safe water supply in the coastal belt and therefore the population is exposed to serious health risks. Water Safety Plans need to be updated and upgraded, taking into account the new challenge of sea water intrusion in coastal aquifers.
BRAC, one of the largest NGO’s in the world, is implementing WASH programme since 2006. It provides hygiene education and increased access to water and sanitation in 250 sub-districts of Bangladesh. It also complements efforts of the Bangladesh government in its water and sanitation interventions. The programme is currently providing access to sanitation to 28.6 million people, safe water options to 1.9 million people and on-going hygiene education to 63.6 million people.
Currently, however, awareness of the salinization issue is relatively low in the WASH sector of Bangladesh. Moreover, WASH services managers are lacking the knowledge and skills to effectively anticipate on salinization of drinking water resources.
SWIBANGLA project aims to increase the level of awareness as well as the level of knowledge and skills required for water management in the face of salinization of resources. The objectives of SWIBANGLA project are to:
Create a better understanding of the process of salinization of drinking water resources in Bangladesh
Provide recommendations for monitoring Provide recommendations for adaptation and mitigation Achieve an effective, tailored knowledge transfer between the Netherlands and
Bangladesh Advise on the integration of the salinization issue in Water Safety Planning
Monitoring is important prerequisite of water resource management. For increasing the understanding of salt water occurrence in the coastal area monitoring of hydraulic head and water quality parameters at different depths are very important. Different organisations of Bangladesh such as Bangladesh Water Development Board (BWDB), Department of Public Health Engineering (DPHE), Bangladesh Agricultural Development Corporation (BADC), have water quality and water level monitoring networks throughout the whole country. The objectives of the water quality monitoring workshop were to suggest the parameters that need to be monitored, frequency of monitoring of those parameters and the possible location of monitoring wells in the coastal area. The objective of the fieldwork was to demonstrate how easily some health related water quality parameters can be monitored instantly in the field by non-technical people. 2. Participants of Ground Water Quality Monitoring Workshop
Total 17 participants were joined in the Ground Water Quality Monitoring Workshop which was held at Department of Public Health Engineering (DPHE) head office in Dhaka. Five participants were from DPHE, two from BRAC University, two from BRAC WASH program, two from BWDB, two from BADC, and one from NGO Forum, Asia Arsenic Network (AAN), Water Aid, Geological Survey of Bangladesh and Jahangirnagar University. Table 1 gives the list of participants in the Ground Water Quality Monitoring Workshop. Table 1: List of participants in the Water Quality Monitoring Workshop. Organization Participants Name and address of the participants
DPHE 5
Mr. Biprakash Dhali, Sub-Asst. Engineer, DPHE, Batiaghata, Khulna Md. Amjad Hossain, Sub-Asst. Engineer, DPHE, Kachua, Bagerhat Mr. Akber Ali, Sub-Asst. Engineer, DPHE, Assasuni, Satkhira Mr. Rustam Ali, Sub-Asst. Engineer, DPHE, Pirojpur Sadar, Mr. Sohel Rana, Sub-Asst. Engineer, DPHE, Kalapara, Patuakhali

133
BWDB 2 Dr. Anwar Zahid, Deputy Director, Directorate of Groundwater Hydrology
Mrs. Farhana Tazneen, Geologist, Groundwater Hydrology Division
BADC 2 Afroza Shirmeen, AE, MIISU, BADC 9551749
Mr. Lutfor Rahman EE MIISU, BADC 9552429
GSB 1 Mr. Ahad Ali, Deputy Director, GSB
BRAC 4
Mr. Md. Abdus Salam, Senior Sector Specialist (Technical), BRAC WASH Programme
Mr. Narayan Chandra Somoddar, Senior Sector Specialist (Technical), BRAC WASH Programme.
Minhaz Farid Ahmed, Lecturer, BRAC University,
Hasnaeen Zakir, Research Assistant, BRAC University
NGO-F 1 Mr. S. M. Shahidullah, Sr. Chemist, Arsenic Lab. Dhaka.
AAN 1 Mr. Md. Wali Ullah, Assistant Chemist, AAN Environmental Laboratory
Water Aid 1 Mr Towhidul Islam/Programme Officer/M&E Towhidul Islam
Figure 1: Participants in the Groundwater Quality Monitoring Workshop. 3. Participants of Ground Water Quality Monitoring Fieldwork
Total 10 participants were present in the Ground Water Quality Monitoring Fieldwork which was held at Mirer Tek village near Banshi river, adjacent to Jahangirnagar University, Savar, Dhaka. Three participants were from DPHE, two from BRAC WASH program, two from BWDB, two from Department of Geological Sciences of Jahangirnagar University and one from Geological Survey of Bangladesh. Table 2 gives the list of participants in the Ground Water Quality Monitoring Fieldwork. Table 2: List of participants in the Water Quality Monitoring Fieldwork.
Organization Participants Name and address of the participants
DPHE 3
Mr. Saifur Rahman, Executive Engineer, AMD, DPHE, Dhaka Md. Didarul Alam Tushar, Asst. Engineer, DPHE, Groundwater Circle, Dhaka, Mrs. Rifat Shirmeen, Hydrogeologist, DPHE, Dhaka
BWDB 2
Dr. Anwar Zahid, Deputy Director, Directorate of Groundwater Hydrology
Mrs. Farhana Tazneen, Geologist, Groundwater Hydrology Division
GSB 1 Mr. Ahad Ali, Deputy Director, GSB
BRAC 2
Mr. Md. Abdus Salam, Senior Sector Specialist (Technical), BRAC WASH Programme
Mr. Narayan Chandra Somoddar, Senior Sector Specialist (Technical), BRAC WASH Programme.
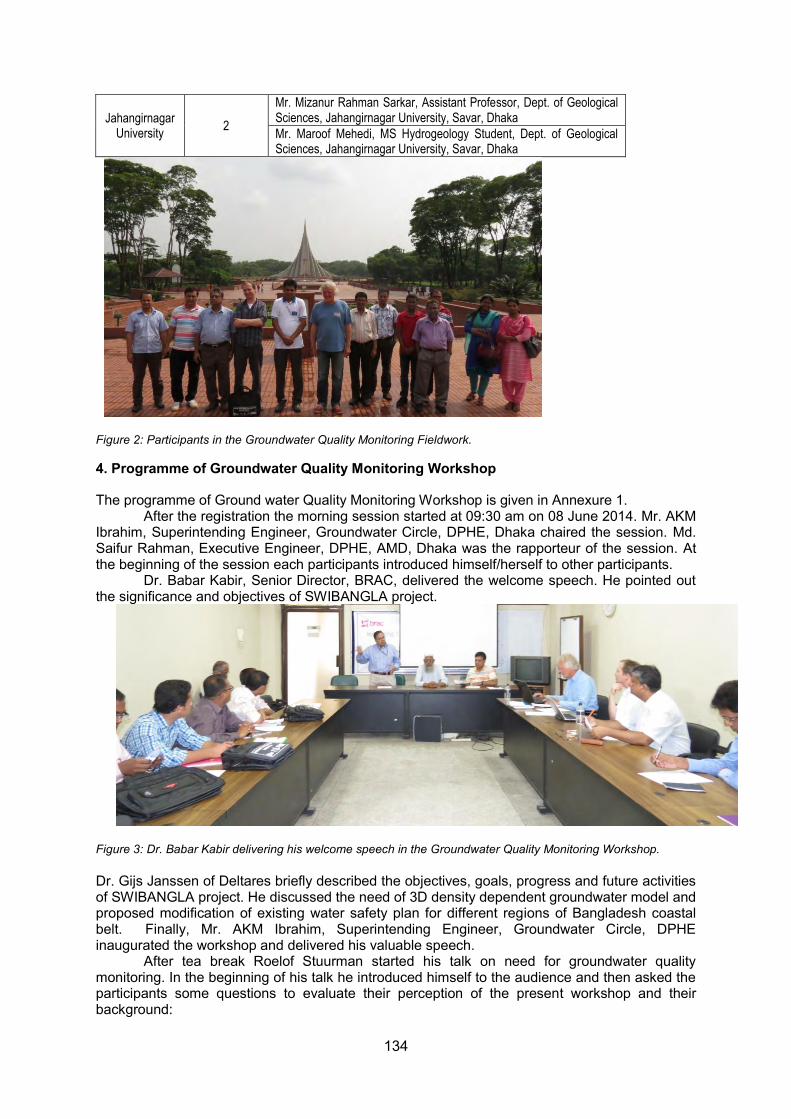
134
Jahangirnagar University
2
Mr. Mizanur Rahman Sarkar, Assistant Professor, Dept. of Geological Sciences, Jahangirnagar University, Savar, Dhaka
Mr. Maroof Mehedi, MS Hydrogeology Student, Dept. of Geological Sciences, Jahangirnagar University, Savar, Dhaka
Figure 2: Participants in the Groundwater Quality Monitoring Fieldwork. 4. Programme of Groundwater Quality Monitoring Workshop
The programme of Ground water Quality Monitoring Workshop is given in Annexure 1. After the registration the morning session started at 09:30 am on 08 June 2014. Mr. AKM
Ibrahim, Superintending Engineer, Groundwater Circle, DPHE, Dhaka chaired the session. Md. Saifur Rahman, Executive Engineer, DPHE, AMD, Dhaka was the rapporteur of the session. At the beginning of the session each participants introduced himself/herself to other participants.
Dr. Babar Kabir, Senior Director, BRAC, delivered the welcome speech. He pointed out the significance and objectives of SWIBANGLA project.
Figure 3: Dr. Babar Kabir delivering his welcome speech in the Groundwater Quality Monitoring Workshop. Dr. Gijs Janssen of Deltares briefly described the objectives, goals, progress and future activities of SWIBANGLA project. He discussed the need of 3D density dependent groundwater model and proposed modification of existing water safety plan for different regions of Bangladesh coastal belt. Finally, Mr. AKM Ibrahim, Superintending Engineer, Groundwater Circle, DPHE inaugurated the workshop and delivered his valuable speech.
After tea break Roelof Stuurman started his talk on need for groundwater quality monitoring. In the beginning of his talk he introduced himself to the audience and then asked the participants some questions to evaluate their perception of the present workshop and their background:
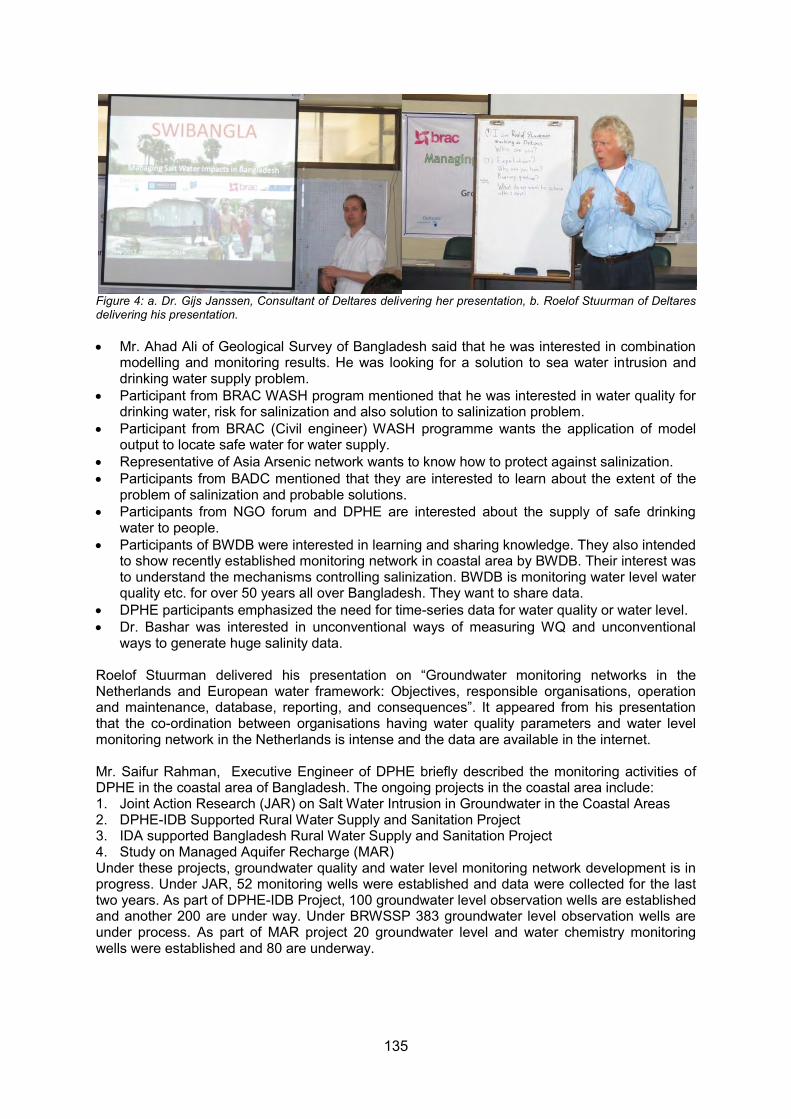
135
Figure 4: a. Dr. Gijs Janssen, Consultant of Deltares delivering her presentation, b. Roelof Stuurman of Deltares delivering his presentation. Mr. Ahad Ali of Geological Survey of Bangladesh said that he was interested in combination
modelling and monitoring results. He was looking for a solution to sea water intrusion and drinking water supply problem.
Participant from BRAC WASH program mentioned that he was interested in water quality for drinking water, risk for salinization and also solution to salinization problem.
Participant from BRAC (Civil engineer) WASH programme wants the application of model output to locate safe water for water supply.
Representative of Asia Arsenic network wants to know how to protect against salinization. Participants from BADC mentioned that they are interested to learn about the extent of the
problem of salinization and probable solutions. Participants from NGO forum and DPHE are interested about the supply of safe drinking
water to people. Participants of BWDB were interested in learning and sharing knowledge. They also intended
to show recently established monitoring network in coastal area by BWDB. Their interest was to understand the mechanisms controlling salinization. BWDB is monitoring water level water quality etc. for over 50 years all over Bangladesh. They want to share data.
DPHE participants emphasized the need for time-series data for water quality or water level. Dr. Bashar was interested in unconventional ways of measuring WQ and unconventional
ways to generate huge salinity data. Roelof Stuurman delivered his presentation on “Groundwater monitoring networks in the Netherlands and European water framework: Objectives, responsible organisations, operation and maintenance, database, reporting, and consequences”. It appeared from his presentation that the co-ordination between organisations having water quality parameters and water level monitoring network in the Netherlands is intense and the data are available in the internet. Mr. Saifur Rahman, Executive Engineer of DPHE briefly described the monitoring activities of DPHE in the coastal area of Bangladesh. The ongoing projects in the coastal area include: 1. Joint Action Research (JAR) on Salt Water Intrusion in Groundwater in the Coastal Areas 2. DPHE-IDB Supported Rural Water Supply and Sanitation Project 3. IDA supported Bangladesh Rural Water Supply and Sanitation Project 4. Study on Managed Aquifer Recharge (MAR) Under these projects, groundwater quality and water level monitoring network development is in progress. Under JAR, 52 monitoring wells were established and data were collected for the last two years. As part of DPHE-IDB Project, 100 groundwater level observation wells are established and another 200 are under way. Under BRWSSP 383 groundwater level observation wells are under process. As part of MAR project 20 groundwater level and water chemistry monitoring wells were established and 80 are underway.
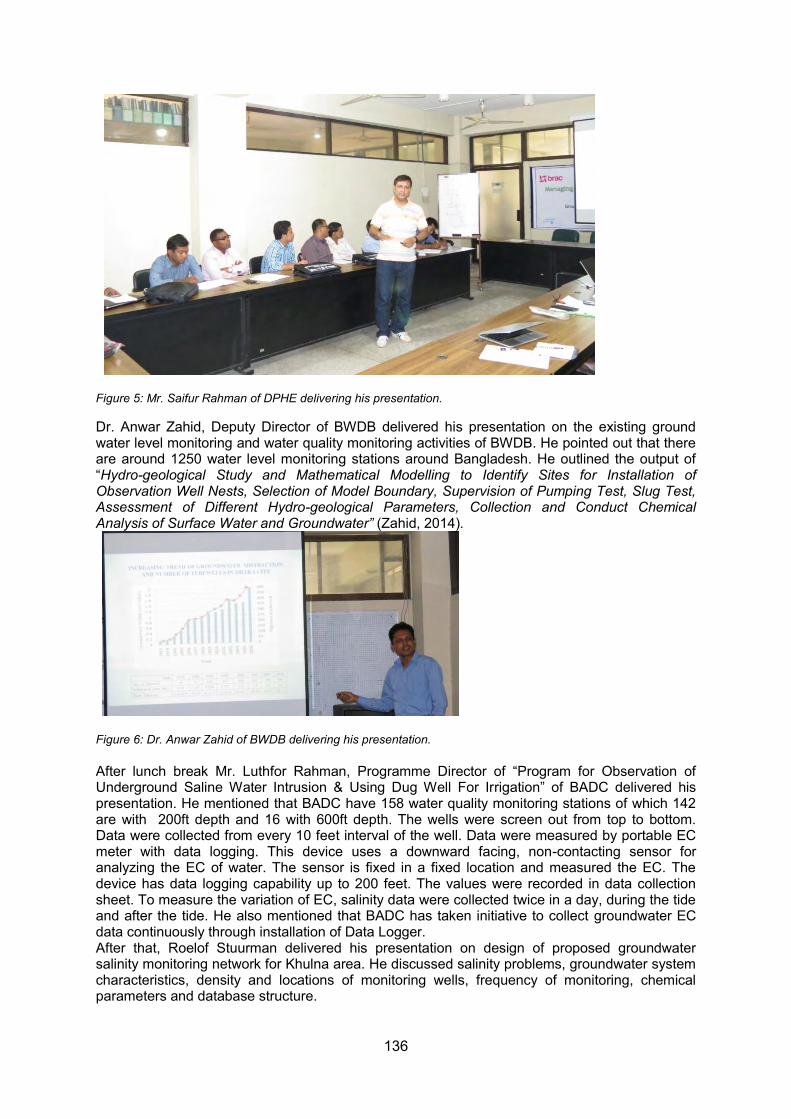
136
Figure 5: Mr. Saifur Rahman of DPHE delivering his presentation. Dr. Anwar Zahid, Deputy Director of BWDB delivered his presentation on the existing ground water level monitoring and water quality monitoring activities of BWDB. He pointed out that there are around 1250 water level monitoring stations around Bangladesh. He outlined the output of “Hydro-geological Study and Mathematical Modelling to Identify Sites for Installation of Observation Well Nests, Selection of Model Boundary, Supervision of Pumping Test, Slug Test, Assessment of Different Hydro-geological Parameters, Collection and Conduct Chemical Analysis of Surface Water and Groundwater” (Zahid, 2014).
Figure 6: Dr. Anwar Zahid of BWDB delivering his presentation. After lunch break Mr. Luthfor Rahman, Programme Director of “Program for Observation of Underground Saline Water Intrusion & Using Dug Well For Irrigation” of BADC delivered his presentation. He mentioned that BADC have 158 water quality monitoring stations of which 142 are with 200ft depth and 16 with 600ft depth. The wells were screen out from top to bottom. Data were collected from every 10 feet interval of the well. Data were measured by portable EC meter with data logging. This device uses a downward facing, non-contacting sensor for analyzing the EC of water. The sensor is fixed in a fixed location and measured the EC. The device has data logging capability up to 200 feet. The values were recorded in data collection sheet. To measure the variation of EC, salinity data were collected twice in a day, during the tide and after the tide. He also mentioned that BADC has taken initiative to collect groundwater EC data continuously through installation of Data Logger. After that, Roelof Stuurman delivered his presentation on design of proposed groundwater salinity monitoring network for Khulna area. He discussed salinity problems, groundwater system characteristics, density and locations of monitoring wells, frequency of monitoring, chemical parameters and database structure.
137
Figure 7: Mr. Luthfor Rahman of BADC delivering his presentation.
On the 9 June 2014 Roelof Stuurman discussed the administrative aspects of groundwater monitoring. Design criteria of a groundwater monitoring network in New Orleans, Mississippi delta was presented by Roelof Stuurman. He also presented a paper on “Monitoring of rural drinking water wells with simple tools by barefoot water specialists. An Orissa example”. Then the discussion session was started with the active participation of representative of different organisations. Representative of BRAC WASH program mentioned that they have installed 6000 wells all around Bangladesh for supplying drinking water to rural people. They also kept the borelogs of the tube wells. They measured five water chemistry parameters of each well and kept a good computerized record with depth. The five parameters were pH, Cl, Fe, Mn and As. They are measured once after construction. However, BRAC is not collecting water levels data.
Participants of BADC mentioned that they have 35000 DTWs with depth150-200ft. They also mentioned that they measure water level twice a month in about 3000 wells in different parts of Bangladesh. Participants of BWBD informed that it has the mandate from the government to collect groundwater level data, exploratory borelogs, pumping test data, river level data etc. BWDB has 1250 ground water level monitoring wells with piezometer. These are shallow wells or dug wells and water level measured per week. They also measure water quality twice a year for some of the wells. Participants from DPHE said that there are 7 to11 million drinking water wells in Bangladesh. About 80% of them is <150 meters depth and 20% with >150 meters depth. Water quality is measured once after installation. DPHE have no particular fixed monitoring wells. From union level they collect lowest water level once in a year. BMDA (Barind Multipurpose Development Authority) in Rajshahi area has 14000 DTWs for irrigation. Some are monitored for water levels.
For drinking water supply in Dhaka, Chittagong and Khulna, DWASA (Dhaka Water Supply and Sewerage Authority), CWASA (Chittagong Water Supply and Sewerage Authority) and KWASA (Khulna Water Supply and Sewerage Authority) are responsible. They also have monitoring network. DWASA has 670 pumping wells in Dhaka.
Water Resource Planning Organisation (WARPO) is a government orginsation which is supposed to coordinate and store all the data, but unfortunately it’s not happening. WARPO is responsible to collect, coordinate and disseminate all water related data.
It has been suggested from the workshop that WARPO can work as a store house of all water related data in Bangladesh. It has government mandate to do so although it is not performing properly. It has also been suggested that the Government of the Netherlands may take an initiative in this regard.
The workshop decided to make proposal to Director General of WARPO and Dutch Embassy in Dhaka so that WARPO takes initiative to collect and disseminate all water related data.
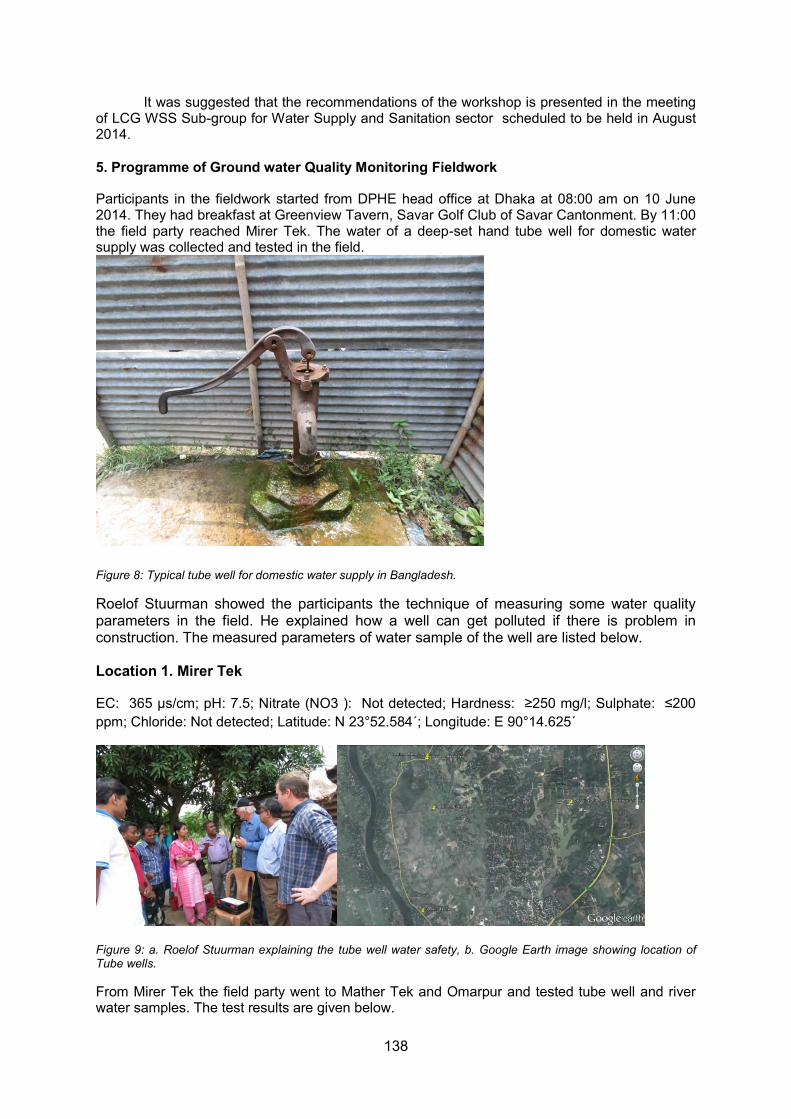
138
It was suggested that the recommendations of the workshop is presented in the meeting of LCG WSS Sub-group for Water Supply and Sanitation sector scheduled to be held in August 2014. 5. Programme of Ground water Quality Monitoring Fieldwork
Participants in the fieldwork started from DPHE head office at Dhaka at 08:00 am on 10 June 2014. They had breakfast at Greenview Tavern, Savar Golf Club of Savar Cantonment. By 11:00 the field party reached Mirer Tek. The water of a deep-set hand tube well for domestic water supply was collected and tested in the field.
Figure 8: Typical tube well for domestic water supply in Bangladesh.
Roelof Stuurman showed the participants the technique of measuring some water quality parameters in the field. He explained how a well can get polluted if there is problem in construction. The measured parameters of water sample of the well are listed below. Location 1. Mirer Tek
EC: 365 µs/cm; pH: 7.5; Nitrate (NO3 ): Not detected; Hardness: ≥250 mg/l; Sulphate: ≤200 ppm; Chloride: Not detected; Latitude: N 23°52.584´; Longitude: E 90°14.625´
Figure 9: a. Roelof Stuurman explaining the tube well water safety, b. Google Earth image showing location of Tube wells.
From Mirer Tek the field party went to Mather Tek and Omarpur and tested tube well and river water samples. The test results are given below.
139
Location 2. Mather Tek
EC: 300 µs/cm; pH: 7; Nitrate (NO3 ): Not detected; Hardness: ≥125 mg/l; Sulphate: Not detected; Chloride: Not detected; Latitude: N 23°53.063´; Longitude: E 90°14.362´
Location 3. Mather Tek
EC: 307 µs/cm; pH: 7; Nitrate (NO3 ): Not detected; Hardness: ≥125 mg/l; Sulphate: Not detected; Chloride: Not detected; Latitude: N 23°52.893´; Longitude: E 90°11.338´
Location 4. Omarpur
EC: 369 µs/cm; pH: 7; Nitrate (NO3 ): Not detected; Hardness: ≥125 mg/l; Sulphate: Not detected; Chloride: Not detected; Latitude: N 23°51.692´; Longitude: E 90°11.115´
Location 4. Omarpur (Water of the Banshi river)
EC: 790 µs/cm; pH: 8; Nitrate (NO3 ): Not detected; Hardness: 65 mg/l; Sulphate: Not detected; Chloride: Not detected; Latitude: N 23°51.692´; Longitude: E 90°11.115´
Roelof Stuurman explained the needs of monitoring water quality parameters. At 2:00 pm. The field party had lunch at Savar Golf Club Restaurant. The field party visited Department of Geological Sciences of Jahangirnagar University and tested the water quality of the supply wells. At 04:30 pm the training session ended and the participants started for Dhaka. 6. Results and Conclusions
The ground water quality monitoring workshop and fieldwork was successful in drawing attention from the participants. Most of the participants actively took part in the discussion. They were highly enthusiastic about developing a systematic network for monitoring salinity and other parameters in the coastal area of Bangladesh. The workshop recommended that the data obtained from monitoring should be available to all users and there should have co-ordination among monitoring agencies. The workshop decided to make proposal to Director General of WARPO and Dutch Embassy in Dhaka so that WARPO takes initiative to collect and disseminate all water related data without cost. It was suggested that the recommendations of the workshop be presented in the meeting of LCG WSS Sub-group for Water Supply and Sanitation sector scheduled to be held in August 2014.
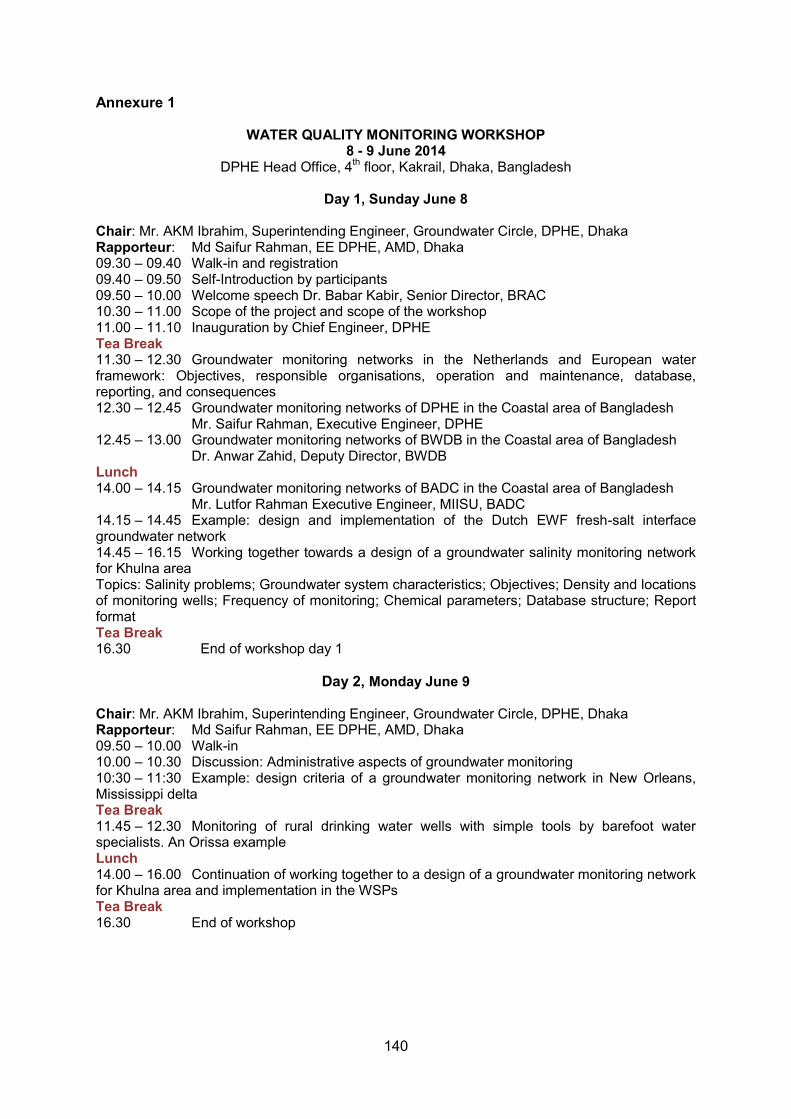
140
Annexure 1
WATER QUALITY MONITORING WORKSHOP 8 - 9 June 2014
DPHE Head Office, 4th floor, Kakrail, Dhaka, Bangladesh
Day 1, Sunday June 8 Chair: Mr. AKM Ibrahim, Superintending Engineer, Groundwater Circle, DPHE, Dhaka Rapporteur: Md Saifur Rahman, EE DPHE, AMD, Dhaka 09.30 – 09.40 Walk-in and registration 09.40 – 09.50 Self-Introduction by participants 09.50 – 10.00 Welcome speech Dr. Babar Kabir, Senior Director, BRAC 10.30 – 11.00 Scope of the project and scope of the workshop 11.00 – 11.10 Inauguration by Chief Engineer, DPHE Tea Break 11.30 – 12.30 Groundwater monitoring networks in the Netherlands and European water framework: Objectives, responsible organisations, operation and maintenance, database, reporting, and consequences 12.30 – 12.45 Groundwater monitoring networks of DPHE in the Coastal area of Bangladesh
Mr. Saifur Rahman, Executive Engineer, DPHE 12.45 – 13.00 Groundwater monitoring networks of BWDB in the Coastal area of Bangladesh
Dr. Anwar Zahid, Deputy Director, BWDB Lunch 14.00 – 14.15 Groundwater monitoring networks of BADC in the Coastal area of Bangladesh
Mr. Lutfor Rahman Executive Engineer, MIISU, BADC 14.15 – 14.45 Example: design and implementation of the Dutch EWF fresh-salt interface groundwater network 14.45 – 16.15 Working together towards a design of a groundwater salinity monitoring network for Khulna area Topics: Salinity problems; Groundwater system characteristics; Objectives; Density and locations of monitoring wells; Frequency of monitoring; Chemical parameters; Database structure; Report format Tea Break 16.30 End of workshop day 1
Day 2, Monday June 9 Chair: Mr. AKM Ibrahim, Superintending Engineer, Groundwater Circle, DPHE, Dhaka Rapporteur: Md Saifur Rahman, EE DPHE, AMD, Dhaka 09.50 – 10.00 Walk-in 10.00 – 10.30 Discussion: Administrative aspects of groundwater monitoring 10:30 – 11:30 Example: design criteria of a groundwater monitoring network in New Orleans, Mississippi delta Tea Break 11.45 – 12.30 Monitoring of rural drinking water wells with simple tools by barefoot water specialists. An Orissa example Lunch 14.00 – 16.00 Continuation of working together to a design of a groundwater monitoring network for Khulna area and implementation in the WSPs Tea Break 16.30 End of workshop
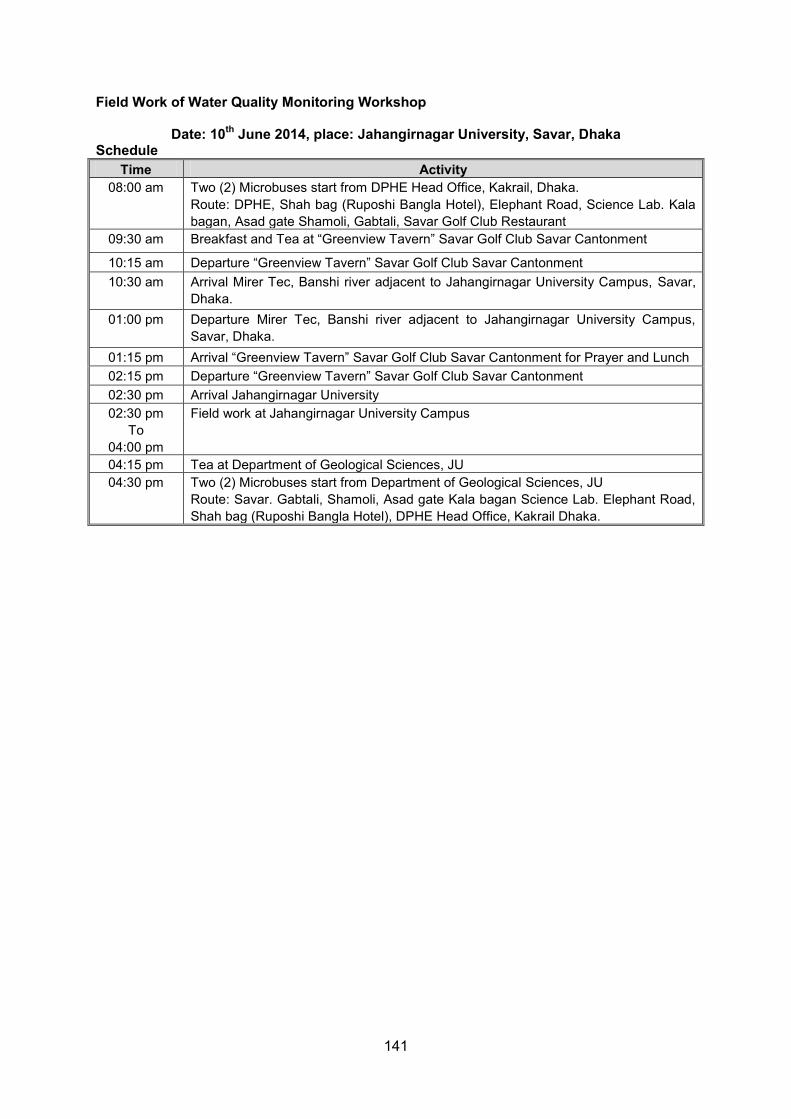
141
Field Work of Water Quality Monitoring Workshop
Date: 10th June 2014, place: Jahangirnagar University, Savar, Dhaka Schedule
Time Activity 08:00 am Two (2) Microbuses start from DPHE Head Office, Kakrail, Dhaka.
Route: DPHE, Shah bag (Ruposhi Bangla Hotel), Elephant Road, Science Lab. Kala bagan, Asad gate Shamoli, Gabtali, Savar Golf Club Restaurant
09:30 am Breakfast and Tea at “Greenview Tavern” Savar Golf Club Savar Cantonment
10:15 am Departure “Greenview Tavern” Savar Golf Club Savar Cantonment 10:30 am Arrival Mirer Tec, Banshi river adjacent to Jahangirnagar University Campus, Savar,
Dhaka. 01:00 pm Departure Mirer Tec, Banshi river adjacent to Jahangirnagar University Campus,
Savar, Dhaka. 01:15 pm Arrival “Greenview Tavern” Savar Golf Club Savar Cantonment for Prayer and Lunch 02:15 pm Departure “Greenview Tavern” Savar Golf Club Savar Cantonment 02:30 pm Arrival Jahangirnagar University 02:30 pm
To 04:00 pm
Field work at Jahangirnagar University Campus
04:15 pm Tea at Department of Geological Sciences, JU 04:30 pm Two (2) Microbuses start from Department of Geological Sciences, JU
Route: Savar. Gabtali, Shamoli, Asad gate Kala bagan Science Lab. Elephant Road, Shah bag (Ruposhi Bangla Hotel), DPHE Head Office, Kakrail Dhaka.

142
Annex 5: Description of various water institutes in Bangladesh 1. Ministry of Water Resources (MoWR) The Ministry of Water Resources is the apex body of the Government of the People's Republic of Bangladesh for development and management of the whole water resources of the country. It formulates policies, plans, strategies, guidelines, instructions and acts, rules, regulations, etc. relating to the development and management of water resources, and regulation and control of the institutions reporting to it. This is a development ministry. It prepares and implements development projects relating to flood control, drainage and irrigation; riverbank erosion control; delta development and land reclamation; etc. and provides irrigation, drainage, flood protection, bank erosion protection, land reclamation facilities by constructing barrages, regulators, sluices, canals, cross-dams, embankments and sea-dykes along the banks of the rivers and the coast, etc. 2. Ministry of Shipping (MoS) The Ministry of Shipping is mandated for modern port management, ensuring safe and continuous inland water transport and efficient and cost effective water transport service to help the overall economic growth of the country. The ministry is concerned to water resources with respect to navigability in the rivers and channels. The main involvement of the ministry in water resources related activities include data collection and monitoring of water level and depth along navigation routes. 3. Ministry of Local Government, Rural Development and Cooperative (MLGRD&C) The Ministry of Local Government, Rural Development and Cooperative (MLGRD&C) has been mandated to improve the quality of life of the people through planned development efforts at local and rural levels. It is responsible for policy formulation, planning, monitoring and administration of local government and rural development initiatives of the country. Through its agencies like LGED, DPHE and WASAs this ministry is engaged in providing safe drinking water and sanitation facilities to people and also irrigation and drainage facilities through small scale water management projects. 4. Ministry of Agriculture (MoA) The Ministry of Agriculture (MoA) is one of the key ministries of the Government of Bangladesh. It comprises seven wings with responsibilities of policy formulation, planning, monitoring and administration. Eighteen agencies operate under the ministry, which are responsible for implementation of different projects and plans of MoA. Several agencies of the ministry are involved in irrigation related research, data collection and monitoring and service delivery. These agencies are BADC, BARC, BARI, DAE etc. which use water resources from surface and ground water sources for irrigation purposes. 5. Water Resources Planning Organization (WARPO) The Water Resources Planning Organization (WARPO) is an apex organization under the Ministry of Water Resources, dealing with nationwide water resources planning. In 1983 Government created Master Plan Organization (MPO) with a mandate to prepare National Water Plans. MPO became WARPO under act no. xii of 1992. Flood Plan Coordination Organization (FPCO) was created in 1989 to coordinate Flood Action Plan (FAP) activities and has been merged with WARPO in January 1996. WARPO is a multi-disciplinary organization with a team of professionals from a wide range of disciplines. 6. Bangladesh Water Development Board (BWDB) The Bangladesh Water Development Board (BWDB) has been established as the water wing of “East Pakistan Water and Power Development Authority” in 1959. This was done as per the Crug mission’s recommendations which were formed in 1957 under United Nations (UN) to boost up food productivity by minimizing flood damage and water resources development and management in this region. As the principal agency of the government for managing water resources of the country it was given the responsibility of accomplishing the tasks of executing flood control, drainage and irrigation projects to increase productivity in agriculture and fisheries.
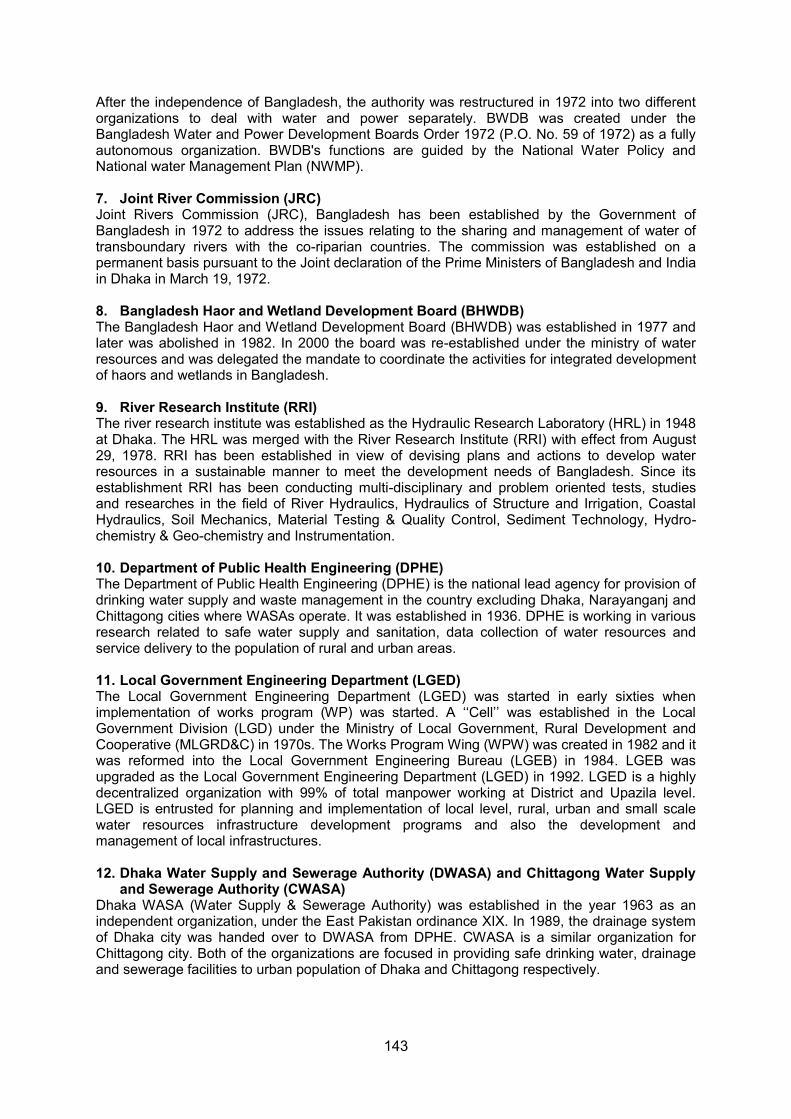
143
After the independence of Bangladesh, the authority was restructured in 1972 into two different organizations to deal with water and power separately. BWDB was created under the Bangladesh Water and Power Development Boards Order 1972 (P.O. No. 59 of 1972) as a fully autonomous organization. BWDB's functions are guided by the National Water Policy and National water Management Plan (NWMP). 7. Joint River Commission (JRC) Joint Rivers Commission (JRC), Bangladesh has been established by the Government of Bangladesh in 1972 to address the issues relating to the sharing and management of water of transboundary rivers with the co-riparian countries. The commission was established on a permanent basis pursuant to the Joint declaration of the Prime Ministers of Bangladesh and India in Dhaka in March 19, 1972. 8. Bangladesh Haor and Wetland Development Board (BHWDB) The Bangladesh Haor and Wetland Development Board (BHWDB) was established in 1977 and later was abolished in 1982. In 2000 the board was re-established under the ministry of water resources and was delegated the mandate to coordinate the activities for integrated development of haors and wetlands in Bangladesh. 9. River Research Institute (RRI) The river research institute was established as the Hydraulic Research Laboratory (HRL) in 1948 at Dhaka. The HRL was merged with the River Research Institute (RRI) with effect from August 29, 1978. RRI has been established in view of devising plans and actions to develop water resources in a sustainable manner to meet the development needs of Bangladesh. Since its establishment RRI has been conducting multi-disciplinary and problem oriented tests, studies and researches in the field of River Hydraulics, Hydraulics of Structure and Irrigation, Coastal Hydraulics, Soil Mechanics, Material Testing & Quality Control, Sediment Technology, Hydro-chemistry & Geo-chemistry and Instrumentation. 10. Department of Public Health Engineering (DPHE) The Department of Public Health Engineering (DPHE) is the national lead agency for provision of drinking water supply and waste management in the country excluding Dhaka, Narayanganj and Chittagong cities where WASAs operate. It was established in 1936. DPHE is working in various research related to safe water supply and sanitation, data collection of water resources and service delivery to the population of rural and urban areas. 11. Local Government Engineering Department (LGED) The Local Government Engineering Department (LGED) was started in early sixties when implementation of works program (WP) was started. A ‘‘Cell’’ was established in the Local Government Division (LGD) under the Ministry of Local Government, Rural Development and Cooperative (MLGRD&C) in 1970s. The Works Program Wing (WPW) was created in 1982 and it was reformed into the Local Government Engineering Bureau (LGEB) in 1984. LGEB was upgraded as the Local Government Engineering Department (LGED) in 1992. LGED is a highly decentralized organization with 99% of total manpower working at District and Upazila level. LGED is entrusted for planning and implementation of local level, rural, urban and small scale water resources infrastructure development programs and also the development and management of local infrastructures. 12. Dhaka Water Supply and Sewerage Authority (DWASA) and Chittagong Water Supply
and Sewerage Authority (CWASA) Dhaka WASA (Water Supply & Sewerage Authority) was established in the year 1963 as an independent organization, under the East Pakistan ordinance XIX. In 1989, the drainage system of Dhaka city was handed over to DWASA from DPHE. CWASA is a similar organization for Chittagong city. Both of the organizations are focused in providing safe drinking water, drainage and sewerage facilities to urban population of Dhaka and Chittagong respectively.

144
13. Bangladesh Inland Water Transport Authority (BIWTA) The Bangladesh Inland Water Transport Authority (BIWTA) has been established to set up an Authority for development, maintenance and control of inland water transport and of certain inland navigable waterways. It was established by the then East Pakistan Government on 31st October 1958 under the East Pakistan Inland water Transport Authority Ordinance 1958. The BIWTA came in to existence as the successor of the former EPIWTA. An advisory committee have subsequently been constituted to advise the authority in respect of all matters related to development, maintenance and operation of inland water transport and of inland waterways in Bangladesh. 14. Bangladesh Agricultural Development Corporation (BADC) The Bangladesh Agricultural Development Corporation (BADC) is the successor of the East Pakistan Agricultural Development Corporation, established under the Agricultural Development Corporation Ordinance, 1961. It is an autonomous corporate body under the Ministry of Agriculture. The goal of the organization is the development of agriculture through supply of agricultural inputs and dissemination of technologies among the farmers to ensure national food security. The mission of BADC includes, production and supply of high yielding varieties of quality seeds of different crops, transfer seed production technologies and provide services to the private sector for development of seed industry and provide irrigation facilities to the farmer through minor irrigation activities including innovation of appropriate technologies for increasing irrigation efficiency and built buffer stock of quality fertilizer and ensure supply of fertilizer. 15. Bangladesh Agricultural Research Council (BARC) Bangladesh Agricultural Research Council (BARC) was established in 1973 by the Presidential Order No. 32 to provide systematic approach to plan, evaluate, coordinate and conduct national agricultural research program in order to accelerate food production including fish and livestock and labour productivity. The parliamentary act in 1996 empower BARC with a wider responsibility of planning, priority setting, coordination, monitoring, reviewing and evaluation of research programs and human resource development of the National Agricultural Research System (NARS) institutes. The BARC Act, 2012 was approved by the parliament in March 2012 to empower BARC to allocate research resource for coordinating agricultural research program. The vision of BARC is to develop an efficient, effective and sustainable system of agricultural research promoting to increase standard of living, which would be adequate for well-being of the people of Bangladesh. 16. Department of Agricultural Extension (DAE) The Department of Agricultural Extension is the extension wing of the Ministry of Agriculture with a mission to provide efficient and effective needs based extension services to all categories of farmer, to enable them to optimize their use of resources, in order to promote sustainable agricultural and socio-economic development. 17. Barind Multipurpose Development Authority (BMDA) Augmentation of Surface water and its' use Development for effective water distribution system, control and maintenance of irrigation
equipment and the Area Development Programme Electrification of irrigation equipment and that of small and cottage industries Re excavation of ponds for fish culture Afforestation Programme for maintaining environmental balance Diversified crop production through production of potato, wheat, maize, pulses and oilseeds
using deep tubewells (DTWs), shallow tubewells (STWs) and power pumps. 18. Center for Environmental and Geographic Information Services (CEGIS) The Center for Environmental and Geographic Information Services (CEGIS) has been established as a national non-profit public trust in 2002. It is the successor of EGIS which was established in 1995 by merger of Environmental Studies (FAP 16) and the Geographic Information System Studies (FAP 19) under the Flood Action Plan (FAP) studies. The mission of CEGIS is to as a scientifically independent center of excellence, support the planning and
145
management of natural resources for sustainable socio-economic development using integrated environmental and social analysis, geographic information systems, remote sensing, database and information technology. 19. Institute of Water Modelling (IWM) The Institute of Water Modelling (IWM) was started as the Surface Water Simulation Modelling Programme (SWSMP) launched in 1986 under the Master Planning Organization to develop a high level of analytical capabilities by use of state-of-the-art mathematical water modelling. With the technical guidance of DHI SWSMP is transformed into Surface Water Modelling Centre (SWMC). By the end of 1996, SWMC was transformed into a national non-profit public trust. From 2002 SWMC has been renamed as Institute of Water Modelling (IWM) in matching with its research and learning status. IWM functions as a centre of excellence and research in the field of Water Modelling, Computational Hydraulics and allied Sciences, and provides services in this field on a cost recovery basis in enhancing the quality of planning and implementation. 20. Private sector/ NGOs A large number of NGOs are involved in water resources sector in Bangladesh. The NWMP encourages private investors and NGOs as an important stakeholder in advocacy and service delivery in water supply and sanitation in rural and local levels. Some of the important NGOs working in water sector are CARE, WaterAid, BRAC, PROSHIKA, NGO Forum, OXFAM-GB, VERC etc. Besides these NGOs UNICEF and other international organizations are also involved in water supply and sanitation sector. The NGOs function mostly in service delivery. Besides, they are also involved in some research and assessment activities regarding groundwater.
146
Annex 6: Report on the dissemination workshop
147
1. Introduction
The scarcity of safe drinking water is an increasing problem in the coastal zone of Bangladesh as it is turning brackish and saline gradually. Climate change is exacerbating the situation due to sea level rise, poor rainfall in winter, high rate of evaporation and various disastrous events like cyclone and storm surge. Further, higher saline concentration in the surface water compels coastal people to depend more on ground water. Therefore, the ground water extraction for drinking and irrigation purpose has been accelerated. However, the water of shallow aquifer is also being contaminated by salinity intrusion.
The coastal zone groundwater aquifer is contaminated with salt above permissible levels at various places. In Bangladesh, the official permissible threshold level of salt in groundwater is 600 mg/l chloride. But for the coastal districts, due to the lack of good water, the permissible level is set at 1,000 mg/l.
The project area constitutes the south-western part of Bangladesh which is the part of the Ganges Brahmaputra Delta. In the north and east the area is bounded by the river Ganges and Meghna, in the west by Indian border and in the south by the Bay of Bengal. Geologically the project area constitutes the subaerial part of the Ganges–Brahmaputra delta. It can be typically subdivided into higher elevation, freshwater wetlands of the upper delta plain which graded sea-ward with a lower elevation saline lower delta plain occupied by saltmarsh and/or mangroves. Land elevations in the upper delta plain is more than 3m whereas in the lower delta plain it is less than 3 m above sea level, making the area subject to inundation from cyclonal storms. Saline water from the Bay of Bengal penetrates 100 km or more inland along distributary channels during the dry season (October– April).
Hydrology of the coastal plains of lower delta presents a complicated interaction of fresh water flow from the upstream, the tides and tidal flows from the Bay of Bengal, tropical cyclones, storm surge and other meteorological effect from the sea and the physiography of the coastal plains. The river water, in most of the time in the year, is highly turbid and saline. The coastal plains of Bangladesh are subject to tidal inundation twice in a day by the semi-diurnal tide originating from the Bay of Bengal. During low flow season the tide penetrates far inland.
BRAC, an international development organization based in Bangladesh, is the largest non-governmental development organization in the world, measured by the number of employees and the number of people it has helped, as of November 2012. BRAC is implementing WASH programme since 2006. The programme provides sustainable and integrated services in rural and isolated areas, breaking the cycle of contamination caused by unsanitary latrines, contaminated water and unsafe hygiene practices. BRAC WASH ensures sustainability of these interventions by encouraging community ownership, developing linkages with local governments, and encouraging local entrepreneurs to supply low-cost hardware. It provides hygiene education and increased access to water and sanitation in 250 sub-districts of Bangladesh. It also complements efforts of the Bangladesh government in its water and sanitation interventions. The programme is currently providing access to sanitation to 28.6 million people, safe water options to 1.9 million people and on-going hygiene education to 63.6 million people. Currently, however, awareness of the salinization issue is relatively low in the WASH sector of Bangladesh. Moreover, WASH services managers are lacking the knowledge and skills to effectively anticipate on salinization of drinking water resources.
SWIBANGLA project aims to increase the level of awareness as well as the level of knowledge and skills required for water management in the face of salinization of resources. The objectives of SWIBANGLA project are to: Create a better understanding of the process of salinization of drinking water resources in
Bangladesh Provide recommendations for monitoring Provide recommendations for adaptation and mitigation Achieve an effective, tailored knowledge transfer between the Netherlands and Bangladesh Advise on the integration of the salinization issue in Water Safety Planning
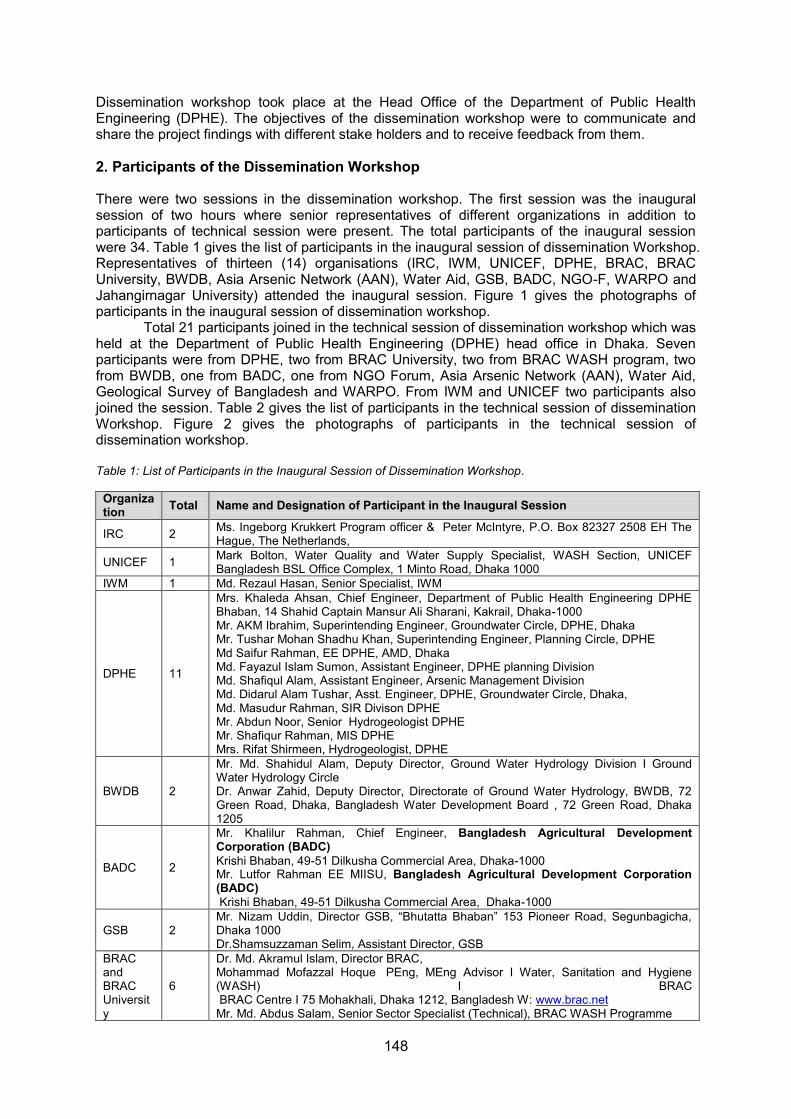
148
Dissemination workshop took place at the Head Office of the Department of Public Health Engineering (DPHE). The objectives of the dissemination workshop were to communicate and share the project findings with different stake holders and to receive feedback from them. 2. Participants of the Dissemination Workshop
There were two sessions in the dissemination workshop. The first session was the inaugural session of two hours where senior representatives of different organizations in addition to participants of technical session were present. The total participants of the inaugural session were 34. Table 1 gives the list of participants in the inaugural session of dissemination Workshop. Representatives of thirteen (14) organisations (IRC, IWM, UNICEF, DPHE, BRAC, BRAC University, BWDB, Asia Arsenic Network (AAN), Water Aid, GSB, BADC, NGO-F, WARPO and Jahangirnagar University) attended the inaugural session. Figure 1 gives the photographs of participants in the inaugural session of dissemination workshop.
Total 21 participants joined in the technical session of dissemination workshop which was held at the Department of Public Health Engineering (DPHE) head office in Dhaka. Seven participants were from DPHE, two from BRAC University, two from BRAC WASH program, two from BWDB, one from BADC, one from NGO Forum, Asia Arsenic Network (AAN), Water Aid, Geological Survey of Bangladesh and WARPO. From IWM and UNICEF two participants also joined the session. Table 2 gives the list of participants in the technical session of dissemination Workshop. Figure 2 gives the photographs of participants in the technical session of dissemination workshop.
Table 1: List of Participants in the Inaugural Session of Dissemination Workshop.
Organization Total Name and Designation of Participant in the Inaugural Session
IRC 2 Ms. Ingeborg Krukkert Program officer & Peter McIntyre, P.O. Box 82327 2508 EH The Hague, The Netherlands,
UNICEF 1 Mark Bolton, Water Quality and Water Supply Specialist, WASH Section, UNICEF Bangladesh BSL Office Complex, 1 Minto Road, Dhaka 1000
IWM 1 Md. Rezaul Hasan, Senior Specialist, IWM
DPHE 11
Mrs. Khaleda Ahsan, Chief Engineer, Department of Public Health Engineering DPHE Bhaban, 14 Shahid Captain Mansur Ali Sharani, Kakrail, Dhaka-1000 Mr. AKM Ibrahim, Superintending Engineer, Groundwater Circle, DPHE, Dhaka Mr. Tushar Mohan Shadhu Khan, Superintending Engineer, Planning Circle, DPHE Md Saifur Rahman, EE DPHE, AMD, Dhaka Md. Fayazul Islam Sumon, Assistant Engineer, DPHE planning Division Md. Shafiqul Alam, Assistant Engineer, Arsenic Management Division Md. Didarul Alam Tushar, Asst. Engineer, DPHE, Groundwater Circle, Dhaka, Md. Masudur Rahman, SIR Divison DPHE Mr. Abdun Noor, Senior Hydrogeologist DPHE Mr. Shafiqur Rahman, MIS DPHE Mrs. Rifat Shirmeen, Hydrogeologist, DPHE
BWDB 2
Mr. Md. Shahidul Alam, Deputy Director, Ground Water Hydrology Division I Ground Water Hydrology Circle Dr. Anwar Zahid, Deputy Director, Directorate of Ground Water Hydrology, BWDB, 72 Green Road, Dhaka, Bangladesh Water Development Board , 72 Green Road, Dhaka 1205
BADC 2
Mr. Khalilur Rahman, Chief Engineer, Bangladesh Agricultural Development Corporation (BADC) Krishi Bhaban, 49-51 Dilkusha Commercial Area, Dhaka-1000 Mr. Lutfor Rahman EE MIISU, Bangladesh Agricultural Development Corporation (BADC) Krishi Bhaban, 49-51 Dilkusha Commercial Area, Dhaka-1000
GSB 2 Mr. Nizam Uddin, Director GSB, “Bhutatta Bhaban” 153 Pioneer Road, Segunbagicha, Dhaka 1000 Dr.Shamsuzzaman Selim, Assistant Director, GSB
BRAC and BRAC University
6
Dr. Md. Akramul Islam, Director BRAC, Mohammad Mofazzal Hoque PEng, MEng Advisor I Water, Sanitation and Hygiene (WASH) I BRAC BRAC Centre I 75 Mohakhali, Dhaka 1212, Bangladesh W: www.brac.net Mr. Md. Abdus Salam, Senior Sector Specialist (Technical), BRAC WASH Programme

149
Mr. Narayan Chandra Somoddar, Senior Sector Specialist (Technical), BRAC WASH Programme. Abu S Moniruzzaman Khan, Assistant Professor, Director, C & ER, BRAC University Hasnaeen Zakir, Research Assistant, BRAC University
NGO-F 1 Md. Ahsan Habib Env. Water Quality Officer, NGO-F
AAN 1 Dr. Md. Shamim Uddin, Senior Chemist,, Asia Arsenic Network, House: 46, Road: 13/C, Block: E, Banani, Dhaka 1213
Water Aid 1 Yasin Kabir, Programme Officer Engineer, Water aid
WARPO 2
Md. Salim Bhuiyan, Director General, Water Resources Planning Organisation, Road-1, House-103, Dhaka-1213, Mr. Md. Saiful Hossain, PSO (Eng.), Water Resources Planning Organisation, Road-1, House-103, Dhaka-1213
Jahangirnagar University
2
Mrs. Shahapara Skeik Dola, MS, Hydrogeology Student, Department of Geological Sciences, Jahangirnagar University Mr. Maruf Mehedi, MS, Hydrogeology Student, Department of Geological Sciences, Jahangirnagar University
Total 34

150
Figure 1: Participants in the Inaugural Session of Dissemination Workshop.
Table 2: List of Participants in the Technical Session of Dissemination Workshop.
Organizati
on
Total Name and Designation of Participant in the Technical Session
UNICEF 1 Mark Bolton, Water Quality and Water Supply Specialist, WASH Section, UNICEF
Bangladesh BSL Office Complex, 1 Minto Road, Dhaka 1000
IWM 1 Md. Rezaul Hasan, Senior Specialist, IWM
DPHE 7 Md. Fayazul Islam Sumon, Assistant Engineer, DPHE planning Division
Md. Shafiqul Alam, Assistant Engineer, Arsenic Management Division
Md. Didarul Alam Tushar, Asst. Engineer, DPHE, Groundwater Circle, Dhaka,
Md. Masudur Rahman, SIR Divison DPHE
Mr. Abdun Noor, Senior Hydrogeologist DPHE
Mr. Shafiqur Rahman, MIS DPHE
Mrs. Rifat Shirmeen, Hydrogeologist, DPHE
BWDB 2 Mr. Md. Shahidul Alam, Deputy Director, Ground Water Hydrology Division I Ground
Water Hydrology Circle
Dr. Anwar Zahid, Deputy Director, Directorate of Ground Water Hydrology, BWDB, 72
Green Road, Dhaka 1205, Bangladesh Water Development Board , 72 Green Road,
Dhaka 1205
BADC 1 Mr. Lutfor Rahman EE MIISU, Bangladesh Agricultural Development Corporation (BADC)
Krishi Bhaban, 49-51 Dilkusha Commercial Area, Dhaka-1000
GSB 1 Dr.Shamsuzzaman Selim, Assistant Director, GSB“Bhutatta Bhaban” 153 Pioneer Road,
Segunbagicha, Dhaka 1000
BRAC and
BRAC
University
4 Mr. Md. Abdus Salam, Senior Sector Specialist (Technical), BRAC WASH Programme
Mr. Narayan Chandra Somoddar, Senior Sector Specialist (Technical), BRAC WASH
Programme.
Abu S Moniruzzaman Khan, Assistant Professor, Director, C & ER, BRAC University
Hasnaeen Zakir, Research Assistant, BRAC University
NGO-F 1 Md. Ahsan Habib Env. Water Quality Officer, NGO-F
AAN 1 Dr. Md. Shamim Uddin, Senior Chemist,, Asia Arsenic Network, House: 46, Road: 13/C, Block: E, Banani, Dhaka 1213
Water Aid 1 Yasin Kabir, Programme Officer Engineer, Water aid
WARPO 1 Mr. Md. Saiful Hossain, PSO (Eng.), Water Resources Planning Organisation, Road-1,
House-103, Dhaka-1213
Total 21
3 Programme of Dissemination Workshop
The programme of Dissemination Workshop is given in Annexure 1. After the registration the inaugural session started at 09:30 am on 02 September 2014 at
the Conference Room of DPHE Head Office Dhaka. Mr. AKM Ibrahim, Superintending Engineer,

151
Groundwater Circle, DPHE, Dhaka chaired the session. Md. Saifur Rahman, Executive Engineer, DPHE, AMD, Dhaka was the rapporteur of the session. At the beginning of the session each participants introduced himself/herself to other participants.
Mr. Akramul Islam, Director, BRAC, delivered the welcome speech. He described the significance and objectives of SWIBANGLA project. He pointed out the problem of water scarcity, arsenic in groundwater and drought particularly in coastal area, and mentioned that BRAC intends to work in the water sectors. He expects support from government departments, such as DPHE. He also mentioned the significance of scaling up of intervention in water supply problem of the coastal area of Bangladesh.
Ms. Ingeborg Krukkert, Program officer of IRC, mentioned in her welcome speech that the IRC is looking for long lasting and sustainable research projects. She mentioned that SWIBANGLA is one of the eight research project of IRC. She emphasized that the mitigation of salinity is one of the big issues that came out of the assessment by SWIBANGLA project. She expected that the results of the research should be useful for the entire Bangladesh.
Mr. Salim Bhuiyan, Director General of WARPO, mentioned the significance of taking special care for quality of water for drinking purposes. He stresses the need of collaboration of BWDB, BADC, DPHE and other relevant organizations to collect data and pointed out that no research is effective until we have enough good data.
After the welcome speech Dr. Ir. Gualbert Oude Essink, project leader, Deltares, delivered his presentation on the scope of the project and final recommendations of the workshop. He discussed the goal of the project, salt water intrusion, modeling sea water intrusion and finally drew conclusions and proposed some recommendations. Mrs. Khaleda Ahsan, Chief Engineer, DPHE, in her speech expected that the workshops will increase the knowledge of the participants and commented that SWIBANGLA is a way to explore new actions/studies on the salt water intrusion in Bangladesh.
Mr. AKM Ibrahim, Superintending Engineer, Groundwater Circle, DPHE commented that DPHE has to support all kind of research on water and emphasized the need for joint collaboration of the different agencies to formulate a common strategy and coordinate studies and researches. The inaugural session ended at 11:30 am and participants joined to the tea break.
After tea break, Professor Khairul Bashar, Jahangirnagar University and Marta Faneca Sànchez of Deltares delivered their presentation on on ‘Salt water intrusion in the Coastal area of Bangladesh’. It included the present status of salinity in coastal aquifers; number of affected people exposed to high salinity; present drinking water supply scenario in the study area; technology in use for water supply in Bagerhat district; distribution of salinity in different Upazilas BRAC WASH program salinity data and probable source of salinity in groundwater in the project area.
After lunch break, Marta Faneca Sànchez of Deltares delivered her presentation on the groundwater monitoring. She discussed the need for monitoring, monitoring networks, monitoring techniques, information management and monitoring in the Netherlands and monitoring of groundwater in Bangladesh. Her presentation was followed by discussion on the present groundwater monitoring in Bangladesh. Dr. Anwar Zahid of BWDB, Mr. Saifur Rahman of DPHE, Mr. Lutfor Rahman of BADC, Dr. Bashar of Jahangirnagar University and Mr. Mofazzal Haq of BRAC participated in the discussion. After the discussion session the workshop ended for day one. On the second day, Dr. Ir. Gualbert Oude Essink and Marta Faneca Sànchez of Deltares delivered their presentation on the State of the Art of Salt Water Intrusion Modelling using iMOD-SEAWAT modelling tool which is open source. They showed the method of construction of 3D variable-density groundwater models and the preliminary results. Participants of Water Aid, BWDB, WARPO, DPHE and IWM took part in the discussion on various issues of model construction and model use for predictive purposes.
Mr. Sohel Masud, Director, Flood Management of IWM, delivered his presentation on the Groundwater Modeling in Bangladesh. He mentioned that IWM uses MIKE 11 and MIKESHE for modeling and for salt water intrusion modeling IWM recently used FEFLOW and MODFLOW.
Dr. Yangxiao Zhou of UNESCO-IHE, Delft, The Netherlands, delivered his presentation on mitigating salinity impacts on drinking water in Bangladesh. He demonstrated various strategies applicable for mitigating salinity impacts of both Upper Delta Plain and Lower Delta
152
Plain. He proposed different strategies such as: sustainability, monitoring, deep well injection, go fresh and conjunctive use of groundwater and surface water. Participants from UNICEF, DPHE, BADC, BWDB and Water Aid discussed the applicability of different strategies for Bangladesh.
Then, Marta Faneca Sànchez of Deltares delivered her presentation on “Water Safety Plans: Importance and improvement”. She discussed the present status of water safety plan for various technologies in Bangladesh and suggested different technologies for different hydrogeological conditions in the project area. The discussion on water safety plan was started by Abdun Noor of DPHE. Dr. Anwar Zahid of BWDB, Mr. Yasin of Water Aid, Mr. Saifur of DPHE also took part in the discussion.
Mr. Saifur of DPHE briefly discussed how mobile phone SMS is being used by DPHE to collect field data on water quality. Marta Faneca Sànchez of Deltares also demonstrated how a smartphone (Apple Macintosh iphone) can be used to measure electrical conductivity of water. She showed that an iphone with the aid of a particular apps and a cheap device can be used to measure EC of water. After the discussion on the use of smartphone for measuring EC the workshop ended. 4. Results and Conclusions
The workshop covered various topics related to safe drinking water supply in the coastal areas of Bangladesh. It included the origin of salinity, geographic distribution of salinity, hydrostratigraphy of the project area, monitoring of groundwater level and quality data for future management of the groundwater system, modeling the sea water intrusion in the project area, different stratigies of fresh water supply for different hydrogeological set up, modification of water safety plan and also the use of smartphone to collect huge field level EC data in a cheap way.
Groundwater salinity data of BRAC WASH program were very much useful in understanding salinity distribution at a certain depth of the aquifer. It was observed that even the deeper aquifer in some parts of the project area is saline and do not satisfy the drinking water standard of Bangladesh. The variation of water chemistry at a small depth range reflects the heterogeneity of the aquifer.
Participants of various organisations, exchanged their views and discussed the findings. To manage the salinity problem in the coastal area of Bangladesh, systematic monitoring of different aspects of groundwater resource, modeling of sea water intrusion in the coastal area and cautious application of suggested strategies and water safety plan are highly important in order to ensure long lasting fresh water supply for domestic and irrigation purposes.
Annexure 1
Dissemination Workshop Managing Saltwater Intrusion Impact in Bangladesh
2-3 September, 2014 Conference Room 1st Floor, DPHE Bhaban, Kakrail, Dhaka
Day 1, Tuesday September 2 Chair: Mr. AKM Ibrahim, Superintending Engineer, Groundwater Circle, DPHE, Dhaka Rapporteur: Md. Saifur Rahman, EE DPHE, AMD, Dhaka 09.30 – 09.45 Walk-in and registration 09.45 – 10.00 Welcome speech by Dr. Md. Akramul Islam, Director, BRAC 10:00 – 10.10 Mr. Mike Slotema, Advisor Water Resource Management 10:10 – 10.25 Representative of IRC, 10.25 – 11.20 Scope of the Project and Final Recommendations of the Workshop
On goal of the project, introduction salt water intrusion, sense-of-urgency, work packages, deliverables, conclusions, recommendations Dr. Ir. Gualbert Oude Essink, project leader Deltares
11.20 – 11.30 Inauguration by Chief Engineer, DPHE 11.30 – 11.40 Remarks from the Chair

153
Tea Break 12.10 – 13.00 Salt water intrusion in the Coastal area of Bangladesh
On present status; number of affected people; Present Drinking Water Supply Scenario in the Study area (BBS data); Technology in use for water supply; Case study Bagerhat District; Distribution of salinity in different Upazilas BRAC WASH Program Salinity data Professor Khairul Bashar, Jahangirnagar University and Marta Faneca, MSc, Deltares
Lunch 14.15 – 14.45 Need for Monitoring
On existing monitoring campaigns; what should be measured; best practices of monitoring; parameters and instruments can be used for monitoring and the development of a Systematic Monitoring Network Dr. Ir. Gualbert Oude Essink, Deltares and Dr. Yangxiao Zhou, UNESCO-IHE
14.45 – 15.45 Discussion on monitoring Md Saifur Rahman
Tea Break 16.30 End of workshop day 1
Day 2, Wednesday September 3 Chair: Mr. AKM Ibrahim, Superintending Engineer, Groundwater Circle, DPHE, Dhaka Rapporteur: Md Saifur Rahman, EE DPHE, AMD, Dhaka 09.50 – 10.00 Walk-in 10.00 – 10.30 State of the Art of Salt Water Intrusion Modelling
On 3D variable-density groundwater models; used data; SWIBANGLA model; preliminary results Dr. Ir. Gualbert Oude Essink and Marta Faneca, MSc, Deltares
10.30 – 10.50 Groundwater modeling in Bangladesh On existing groundwater modeling projects in Bangladesh, used tools and some results Md. Zahirul Haque Khan, IWM
10.50 – 11.00 Discussion on Modelling Md. Zahirul Haque Khan, IWM and Dr. Ir. Gualbert Oude Essink, Deltares
Tea Break 11.30 – 12.15 Strategies for mitigating salinity impacts on drinking water
On Guidelines for Bangladesh on the best management practices for drinking-water supply from a salinity perspective Dr. Yangxiao Zhou, UNESCO-IHE
12.15 – 12.45 Water Safety Plans: Importance and improvement Professor Khairul Bashar, Jahangirnagar University and Marta Faneca, MSc, Deltares
12.45 – 13.15 Working together to implement the WSPs Professor Khairul Bashar, Jahangirnagar University and Marta Faneca, MSc, Deltares
Lunch 14.15 – 14.30 Applications of mobile phone in water quality monitoring: Experience of DPHE
Computer programmer DPHE 14.30 – 15.00 Short demonstration on the Smart Phone Water App on measuring EC
Marta Faneca, MSc, Deltares and Dr. Ir. Gualbert Oude Essink, Deltares 15.00 – 16.15 Discussion and Conclusion by the Chair Tea Break 16.30 End of workshop