INTRUSION PREVENTION/INTRUSION DETECTION SYSTEM (IPS/IDS) FOR WIFI NETWORKS

UNIVERSITA DEGLI STUDI DI MILANO
Facolta di Science Matematiche, Fisiche e Naturali
DOTTORATO DI RICERCA IN INFORMATICA
XXI CICLO
SETTORE SCIENTIFICO DISCIPLINARE INF/01 INFORMATICA
Composite Intrusion Detection in Process ControlNetworks
Tesi di: Julian L. Rrushi
Relatore: Prof. Carlo Bellettini
Coordinatore del Dottorato: Prof. Ernesto Damiani
Anno Accademico 2007-2008
Composite Intrusion Detection in Process ControlNetworks
A dissertation presented
by
Julian L. Rrushi
to
Department of Computer Science
in partial fulfillment of the requirements
for the degree of
Doctor of Philosophy
in the subject of
Computer Science
Universita degli Studi di Milano
Milano, Italy
January 2009

c©2009 - Julian L. Rrushi
All Rights Reserved.

Abstract
An intrusion detection ensemble, i.e. a set of diverse intrusion detection algo-
rithms employed as a group, has been shown to outperform each one those diverse
algorithms employed individually. Moving along this line, we have devised an in-
trusion detection ensemble that inspects network packets that flow across the pro-
cess control network of a digitally controlled physical system such as a power plant.
Such process control specific intrusion detection ensemble is comprised of a statistical
anomaly intrusion detection algorithm called the Estimation-Inspection (EI) algo-
rithm, a physical process aware specification-based approach, a theory of deception
for intrusion detection that we call mirage theory, and an alert fusion technique in
the form of a Bayesian theory of confirmation. In this research we leverage evolutions
of the content of specific locations in the random access memory (RAM) of control
systems into means of characterizing the normalcy or abnormality of network traffic.
The EI algorithm uses estimation methods from applied statistics and probability
theory to estimate normal evolutions of RAM content. The physical process aware
specification-based approach defines normal evolutions of RAM content via specifi-
cations developed manually through expert knowledge. Mirage theory consistently
introduces deceptive evolutions of RAM content, and hence employs communicating
finite state machines to detect any deviations caused by malicious network packets.
The alert fusion technique also leverages evolutions of RAM content to estimate the
degrees to which network traffic normalcy and abnormality hypotheses are confirmed
on evidence. In this dissertation we provide a detailed discussion of these intrusion
detection algorithms along with a detailed discussion of the alert fusion technique.
We also discuss an empirical testing of the proposed intrusion detection ensemble in a
small testbed comprised of Linux PC-based control systems that resemble the process
iii

Abstract iv
control environment of a power plant; and in the case of the EI algorithm, a prob-
abilistic validation via stochastic activity networks with activity-marking oriented
reward structures.

Contents
Title Page . . . . . . . . . . . . . . . . . . . . . . . . . . . . . . . . . . . . iAbstract . . . . . . . . . . . . . . . . . . . . . . . . . . . . . . . . . . . . . iiiTable of Contents . . . . . . . . . . . . . . . . . . . . . . . . . . . . . . . . vList of Tables . . . . . . . . . . . . . . . . . . . . . . . . . . . . . . . . . . viiiList of Figures . . . . . . . . . . . . . . . . . . . . . . . . . . . . . . . . . . ixCitations to Published Material . . . . . . . . . . . . . . . . . . . . . . . . xiAcknowledgments . . . . . . . . . . . . . . . . . . . . . . . . . . . . . . . . xiiDedication . . . . . . . . . . . . . . . . . . . . . . . . . . . . . . . . . . . . xiv
1 INTRODUCTION 1
2 BACKGROUND 72.1 Digital Control of Physical Processes . . . . . . . . . . . . . . . . . . 7
2.1.1 Distributed Control Systems . . . . . . . . . . . . . . . . . . . 72.1.2 Sensors and Actuators . . . . . . . . . . . . . . . . . . . . . . 92.1.3 Programmable Logic Controllers . . . . . . . . . . . . . . . . . 92.1.4 ModBus Communication Protocol . . . . . . . . . . . . . . . . 12
2.2 Computer Network Attacks on Process Control Systems . . . . . . . . 142.2.1 Array Overflows . . . . . . . . . . . . . . . . . . . . . . . . . . 152.2.2 Buffer Overflows . . . . . . . . . . . . . . . . . . . . . . . . . 152.2.3 Format String Vulnerabilities . . . . . . . . . . . . . . . . . . 172.2.4 Integer Overflows . . . . . . . . . . . . . . . . . . . . . . . . . 182.2.5 Dangling Pointers . . . . . . . . . . . . . . . . . . . . . . . . . 192.2.6 Control-Application Specific Memory Corruptions . . . . . . . 20
2.3 Computer Network Attacks on Physical Systems . . . . . . . . . . . . 222.3.1 Attacks on Physical Equipment . . . . . . . . . . . . . . . . . 222.3.2 Attacks on Physical Processes . . . . . . . . . . . . . . . . . . 24
2.4 Intrusion Detection . . . . . . . . . . . . . . . . . . . . . . . . . . . . 24
3 RELATED RESEARCH 263.1 Applied Statistics for Intrusion Detection . . . . . . . . . . . . . . . . 26
v

Contents vi
3.2 Developing Specifications of Normal Behavior for Intrusion Detection 333.3 Related Research on Applied Deception . . . . . . . . . . . . . . . . . 363.4 Other Related Research on Intrusion Detection in Process Control Net-
works . . . . . . . . . . . . . . . . . . . . . . . . . . . . . . . . . . . . 403.5 Intrusion Alert Fusion . . . . . . . . . . . . . . . . . . . . . . . . . . 43
4 PROBABILISTIC ESTIMATION OF DATA TRANSITION FLOWSFOR ANOMALY DETECTION 464.1 Introduction . . . . . . . . . . . . . . . . . . . . . . . . . . . . . . . . 464.2 A Statistical Approach to Anomaly Intrusion Detection . . . . . . . . 48
4.2.1 Mathematical Modeling and Underlying Thesis . . . . . . . . 484.2.2 Estimating the Statistical Parameters of Ordinal and Dichoto-
mous Logistic Models . . . . . . . . . . . . . . . . . . . . . . . 534.2.3 The Estimation-Inspection Algorithm . . . . . . . . . . . . . . 604.2.4 Payload Coverage . . . . . . . . . . . . . . . . . . . . . . . . . 62
4.3 Discussion on Inductive Machine Learning in a DCS . . . . . . . . . . 654.3.1 Generating the Learning Data Set . . . . . . . . . . . . . . . . 654.3.2 Handling Black Swan Events . . . . . . . . . . . . . . . . . . . 70
4.4 Probabilistic Validation . . . . . . . . . . . . . . . . . . . . . . . . . . 724.4.1 Stochastic Activity Networks with Activity-Marking Oriented
Reward Structures . . . . . . . . . . . . . . . . . . . . . . . . 754.4.2 Construction and Solution of Validation Models based on Stochas-
tic Activity Networks . . . . . . . . . . . . . . . . . . . . . . . 77
5 PROCESS AWARE SPECIFICATION-BASED DETECTION 845.1 Introduction . . . . . . . . . . . . . . . . . . . . . . . . . . . . . . . . 845.2 Semantic Analysis of Network Traffic . . . . . . . . . . . . . . . . . . 865.3 Specifications of Control Network Traffic . . . . . . . . . . . . . . . . 905.4 Activity Network Modeling of Detection Specifications . . . . . . . . 925.5 Concrete Activity Network Models . . . . . . . . . . . . . . . . . . . 95
5.5.1 Supervisory Control Specifications . . . . . . . . . . . . . . . . 955.5.2 Automatic Control Specifications . . . . . . . . . . . . . . . . 104
5.6 Discussion . . . . . . . . . . . . . . . . . . . . . . . . . . . . . . . . . 107
6 MIRAGE THEORY FOR DECEPTION-BASED DETECTION 1106.1 Introduction . . . . . . . . . . . . . . . . . . . . . . . . . . . . . . . . 1106.2 Conducting Defensive Deception for Intrusion Detection . . . . . . . . 1136.3 Real-Time Deceptive Event Generation . . . . . . . . . . . . . . . . . 118
6.3.1 Continuous Simulation of Physical Processes and Equipment . 1186.3.2 Deceptive Emulation via Network Traffic Mirroring . . . . . . 124
6.4 Analysis of Deception Capabilities in Mirage Theory . . . . . . . . . 130

Contents vii
6.4.1 Reconnaissance for a Computer Network Attack on an ElectricMotor . . . . . . . . . . . . . . . . . . . . . . . . . . . . . . . 131
6.4.2 Empirical Quantification of Deception Effects . . . . . . . . . 139
7 A BAYESIAN THEORY OF CONFIRMATION FOR INTRUSIONREPORT FUSION 1457.1 Introduction . . . . . . . . . . . . . . . . . . . . . . . . . . . . . . . . 1457.2 Problem Statement . . . . . . . . . . . . . . . . . . . . . . . . . . . . 1467.3 Estimating the Hypothesis-based Probabilities of Evidence . . . . . . 151
7.3.1 Developing Incomplete-data Spaces and the Associated Sym-bolic Analyzers . . . . . . . . . . . . . . . . . . . . . . . . . . 153
7.3.2 Algorithmic Approach . . . . . . . . . . . . . . . . . . . . . . 1567.4 Estimating Prior Probabilities of Normalcy and Abnormality . . . . . 1627.5 Bayesian Comparison of the Normalcy and Abnormality Hypotheses . 165
8 EXPERIMENTAL EVALUATION 1698.1 Testbed . . . . . . . . . . . . . . . . . . . . . . . . . . . . . . . . . . 1698.2 Test Vulnerabilities and Exploitations . . . . . . . . . . . . . . . . . . 1708.3 Empirical Results . . . . . . . . . . . . . . . . . . . . . . . . . . . . . 171
9 CONCLUSIONS 177
Bibliography 181

List of Tables
6.1 A sample of values of physical parameters that characterize the oper-ation of an AC induction motor studied in laboratory settings. . . . . 133
6.2 Excerpt from the data set acquired through ModScan from a targetPLC. . . . . . . . . . . . . . . . . . . . . . . . . . . . . . . . . . . . . 138
6.3 Measurements of the degree of linear association between holding reg-ister variables and input register variables that were scanned from thememory of a target PLC. . . . . . . . . . . . . . . . . . . . . . . . . . 138
8.1 The gain in probability of detection in the case the EI algorithm ismade subject to detection failure injection. . . . . . . . . . . . . . . . 173
8.2 The gain in probability of detection in the case the physical processaware specification-based approach is made subject to detection failureinjection. . . . . . . . . . . . . . . . . . . . . . . . . . . . . . . . . . . 174
8.3 The gain in probability of detection in the case mirage theory is madesubject to detection failure injection. . . . . . . . . . . . . . . . . . . 174
8.4 The gain in false alarms rate in the case the EI algorithm is madesubject to detection failure injection. . . . . . . . . . . . . . . . . . . 175
8.5 The gain in false alarms rate in the case the physical process awarespecification-based approach is made subject to detection failure injec-tion. . . . . . . . . . . . . . . . . . . . . . . . . . . . . . . . . . . . . 175
8.6 The gain in false alarms rate in the case mirage theory is made subjectto detection failure injection. . . . . . . . . . . . . . . . . . . . . . . . 176
viii
List of Figures
2.1 Typical architecture of a Distributed Control System. . . . . . . . . . 82.2 Organization of a typical Programable Logic Controller. . . . . . . . . 102.3 Organization of an attack packet payload that exploits faulty mappings
in ModBus applications. . . . . . . . . . . . . . . . . . . . . . . . . . 22
4.1 Typical architecture of a SAN model developed for testing a set ofstochastic vectors produced by a probability mass function. . . . . . . 82
5.1 Schematic representation of the application of process-aware intrusiondetection specifications. . . . . . . . . . . . . . . . . . . . . . . . . . . 87
5.2 Schematic diagram of supervised thermal power increase via networkpackets that withdraw control rods. . . . . . . . . . . . . . . . . . . . 98
5.3 Excerpt from an activity network model that checks whether definednetwork traffic induces high stresses in the walls of the reactor pressurevessel. . . . . . . . . . . . . . . . . . . . . . . . . . . . . . . . . . . . 100
5.4 Schematic diagram of an automatic corrective withdrawal of a controlrod that is conducted via a network packet in response to the loss of awater pump. . . . . . . . . . . . . . . . . . . . . . . . . . . . . . . . . 105
5.5 Excerpt from an activity network model that checks whether a networkpacket under inspection is the corrective response to the loss of a waterpump. . . . . . . . . . . . . . . . . . . . . . . . . . . . . . . . . . . . 107
6.1 Boundary between continuous and discrete spaces exploited in miragetheory to camouflage computer simulation or emulation of sensors, ac-tuators, and physical processes. . . . . . . . . . . . . . . . . . . . . . 115
6.2 A network packet payload that is indicative of the presence of physicalequipment and a physical process. . . . . . . . . . . . . . . . . . . . . 117
6.3 Excerpt from two communicating finite state machines that model twoindividual control systems in a process control network. . . . . . . . . 121
6.4 Schematic diagram of an emulation of a continuous space via trafficmirroring. . . . . . . . . . . . . . . . . . . . . . . . . . . . . . . . . . 129
ix

List of Figures x
6.5 Normal density curves for applied voltage frequency γ and actual motorrotational speed ω, left and right respectively, in which the standarddeviation of γ is 8.46751 and the standard deviation of ω is 25.40254 135
6.6 Scatter plot and linear regression line for the statistical relation be-tween γ and ω. . . . . . . . . . . . . . . . . . . . . . . . . . . . . . . 137
6.7 POC curves for a PLC that controls a motor-driven water pump, asestimated during a simulated loss of cooling attack. . . . . . . . . . . 141
6.8 POC curves that characterize the uncertainty under which adversariesidentify the target of a loss of cooling attack in the attack-defensemodel given in this section. . . . . . . . . . . . . . . . . . . . . . . . 143
6.9 ROC curve that corresponds to the POC curves of Figure 6.8. . . . . 144
7.1 Example of an ACH matrix in the proposed theory of confirmation. . 1517.2 Example of the derivation of an incomplete-data space for a word vari-
able x1. . . . . . . . . . . . . . . . . . . . . . . . . . . . . . . . . . . 1557.3 Probability tree estimation of prior normalcy and abnormality proba-
bilities. . . . . . . . . . . . . . . . . . . . . . . . . . . . . . . . . . . . 164
Citations to Published Material
The dissertation research has led to the following publications:
J.L. Rrushi, and K. Kang. An Estimation-Inspection Algorithm for Ano-maly Detection in Process Control Networks. Proceedings of the 3rd In-ternational Conference on Critical Infrastructure Protection, DartmouthCollege, Hanover, New Hampshire, USA, March 2009, to appear.
J.L.Rrushi. Exploiting Physical Process Internals for Network IntrusionDetection in Process Control Networks. 6th American Nuclear Society In-ternational Topical Meeting on Nuclear Plant Instrumentation, Control,and Human-Machine Interface Technologies, Knoxville, Tennessee, USA,April 2009, to appear.
J.L. Rrushi, and K. Kang. CyberRadar: A Regression Analysis Approachto the Identification of Cyber-Physical Mappings in Process Control Sys-tems. Proceedings of the 3rd ACM/IEEE Workshop on Embedded Sys-tems Security, Atlanta, Georgia, USA, October 2008.
J.L. Rrushi, and K. Kang. Mirage Theory: A Deception Approach to In-trusion Detection in Process Control Networks. NATO Symposium onInformation Assurance for Emerging and Future Military Systems, Ljubl-jana, Slovenia, October 2008.
J.L. Rrushi, and R.H. Campbell. Detecting Cyber Attacks on NuclearPower Plants. Proceedings of the 2nd International Conference on Crit-ical Infrastructure Protection, George Mason University, Arlington, Vir-ginia, USA, March 2008.
J.L. Rrushi, and R.H. Campbell. Using Deception to Facilitate IntrusionDetection in Nuclear Power Plants. Proceedings of the 3rd InternationalConference on Information Warfare and Security, Peter Kiewit Institute,University of Nebraska Omaha, USA, April 2008.
C. Bellettini, and J.L. Rrushi. Low-level Coding Vulnerabilities: Researchon Attack, Defense and Evasion. Handbook of Research on InformationSecurity and Assurance, Jatinder Gupta and Sushil Sharma editors, pub-lisher Idea Group, Inc., Spring 2008.
J.L. Rrushi, and R.H. Campbell. An Intrusion Detection System for Op-eration in Nuclear Power Plants. 4th ITI Workshop on Dependability andSecurity, Coordinated Science Laboratory, University of Illinois, Urbana,USA, November 2007.
xi

Acknowledgments
The love for my family and homeland, and for God Jesus Christ, has been an
immense moral support for me throughout my difficult way towards a Ph.D. I wish
to first acknowledge in this dissertation Professor Emilia Rosti and Professor William
H. Sanders. Professor Rosti introduced me to science, and taught me how to conduct
scientific research. It was the education that I received from her that led me to enroll
in Ph.D. studies. Professor Sanders’ confidence in my potential for scientific research
has been a strong encouragement to overcome a myriad of difficulties that were deter-
ring my academic progress. I’m grateful for his unconditional moral support, which
is one of the factors that led me to completion of my Ph.D. studies.
I would like to thank my tutor and adviser Professor Carlo Bellettini for his supervi-
sion of my Ph.D. studies and research, and for his financial support. I would like to
also thank my coadviser Professor Kyoung-Don Kang for his efforts to validate and
improve my research ideas. Heartfelt thanks go to Professor Roy H. Campbell for ad-
vising me throughout my research at the University of Illinois at Urbana-Champaign.
Heartfelt thanks also go to Professor Carl A. Gunter of the University of Illinois at
Urbana-Champaign for helping me identify and understand the research challenges
in the area of cyber security of networked process control.
I would like to thank the external referees of my dissertation, namely Professor Rajni
Goel, Dr. Alfonso Valdes, and Dr. Alvaro Cardenas, for their technical and editorial
advice. Special thanks go to Professor Goffredo Haus for his valuable moral support
and understanding. In this dissertation I take the chance to thank the country of
Italy for giving me what I consider the most precious gift in my life, namely higher
education. This is something I will never forget. My doctoral research was financially
xii

Acknowledgments xiii
supported by a doctoral scholarship, conference scholarships, and a research fellow-
ship from the Universita degli Studi di Milano, Istituto per il Diritto allo Studio
Universitario, International Information Systems Security Certification Consortium,
U.S. Oak Ridge National Laboratory, U.S. Naval Research Laboratory, and U.S. In-
stitute for Information Infrastructure Protection.
Lastly, but by no means lesser in importance, I would like to thank my wife Ronilda
and my family for their immense love and care without which this doctoral work
would not have been possible.

Dedicated to my mother Liliana.
xiv

Chapter 1
INTRODUCTION
In this dissertation we discuss a novel process control specific network intrusion
detection ensemble for operation in the distributed control system (DCS) of a dig-
itally controlled physical system such as a power plant. A DCS is comprised of
application-specific computer devices and networks that are used to monitor and
control in real-time a physical system within a defined geographic location [110]. Ex-
amples of DCS-controlled physical systems include electric power generation plants,
chemical plants, oil refineries, etc.
A DCS is said distributed as the computer devices that form it are distributed
throughout a physical system, and thus are connected by communication networks
for control and monitoring. Concrete examples of DCS are the Mark VIe and OC
4000, which are provided by General Electric for power plant control. The operation
of the proposed intrusion detection ensemble is organized into three loops, namely
collection, analysis, and reporting.
In a collection loop the intrusion detection ensemble intercepts network packets as
1
Chapter 1: INTRODUCTION 2
they flow across a process control network. In an analysis loop the intercepted traf-
fic is analyzed independently by various intrusion detection algorithms, which are a
major contribution of this dissertation. In a reporting loop an intrusion report fusion
technique analyzes the hypotheses generated in the analysis loop, and hence fuses
them into a single composite estimation of legitimacy or intrusiveness.
The intrusion detection ensemble is formed by a statistical intrusion detection algo-
rithm called the Estimation-Inspection (EI) algorithm, a specification-based intrusion
detection approach that we call a physical process aware approach, a deception-based
intrusion detection approach, and a Bayesian theory of confirmation for intrusion
report fusion. We devised this intrusion detection ensemble for detecting unknown
computer network attacks on a DCS-controlled physical system. Thus, the intrusion
detection algorithms along with the intrusion report fusion technique that we have
devised in this research do not assume any knowledge of any internals of the computer
network attacks that we aim at detecting.
The intrusion detection ensemble bases the concept of normalcy or abnormality of
network traffic on continually changing content of specific memory locations in the
random access memory (RAM) of control systems, with the objective of capturing
the behavior of an entire cyber-physical system. In this research with cyber-physical
system we mean a process control environment such as a DCS integrated with a
physical system such as a power plant. Let us argue why in our research we leverage
evolutions of the content of specific locations in the RAM of control systems into
means of characterizing the normalcy or abnormality of network traffic.
We model as a matrix, say W , the portions of the RAM of control systems that hold
Chapter 1: INTRODUCTION 3
process measurement data or actuator control data along with set points. We view
matrix W as a conceptual dynamic system whose behavior consists of evolutions of
the values of the elements of the matrix W . Let us define the behavior of a physical
process as evolutions of values of physical parameters that characterize that physical
process. For example, the parameters that characterize the fission process within a
nuclear reactor include neutron population, reactivity, moderator temperature, ther-
mal power, etc.
Measurements of the physical parameters that characterize a physical process are com-
monly mapped to ordinary program variables stored in the RAM of control systems.
Taking into account that these program variables are modeled by specific elements
of the matrix W , the behavior of the physical process becomes part of the behavior
of the conceptual dynamic system. Let us define the behavior of a process control
network in a DCS as evolutions of specific RAM content caused by network packets
that flow over that process control network.
Recall that the payloads of such network packets read from or write into specific loca-
tions in the RAM of control systems. These payloads convey set points and actuator
control values that are commonly stored in ordinary program variables, which are
modeled by specific elements of the matrix W as well. Therefore the behavior of a
process control network also becomes part of the behavior of the conceptual dynamic
system. Thus, the matrix W is where the behavior of physical processes in a physi-
cal system and the behavior of a process control network in the associated DCS are
conceptually merged.
We conclude that the behavior of the conceptual dynamic system, and hence evo-

Chapter 1: INTRODUCTION 4
lutions of the content of specific locations in the RAM of control systems, capture
or represent the behavior of the entire cyber-physical system. We validated the said
result empirically through an observational study on an experimental cyber-physical
system. This experimental cyber-physical system was formed by some system and
network components of a DCS and a limited number of simulated physical compo-
nents of an advanced boiling water reactor (ABWR) [56, 37].
The observation result is the following: throughout a normal network operation of
the aforementioned simulated physical system, the continually changing content of
specific memory locations in the RAM of control systems follow specific flows that
persist over time. Thus, in our problem domain the challenge of determining the
normalcy or abnormality of network traffic takes the form of determining normal and
abnormal evolutions of the content of specific locations in the RAM of control sys-
tems, respectively.
For a network packet to be classified as normal, its payload should cause a normal
evolution of RAM content. The EI algorithm, which is comprised of an estimation
part and an inspection part, computes normal evolutions of RAM content via applied
statistics and probability theory. The estimation part of the EI algorithm uses logistic
regression integrated with maximum likelihood estimation in an inductive machine
learning process to estimate a series of statistical parameters, which in conjunction
with logistic regression formulae form a probability mass function for each program
variable stored in the RAM of a control system.
The inspection part of the EI algorithm uses the afore computed probability mass
functions to estimate the normalcy probability of a specific value that a network
Chapter 1: INTRODUCTION 5
packet under inspection is about to write to a program variable. The physical process
aware approach is developed manually through expert knowledge, and is comprised
of direct specifications of normal evolutions of RAM content. These specifications are
derived from rules that regulate the supervisory or automatic network operation of a
DCS-controlled physical system.
The deception-based intrusion detection approach introduces deceptive but consistent
evolutions of RAM content, and thus uses sequence detectors to check for deviations
caused by malicious network packets. The intrusion report fusion technique also lever-
ages evolutions of RAM content. It is a mathematical development of the Heuer’s
analysis of competing hypotheses (ACH) methodology [47] in the form of a Bayesian
theory of confirmation.
In technical terms, the intrusion detection ensemble runs in a dedicated computer
cluster. We use network sniffing devices to tap into all of the network segments
within a DCS. These devices sniff network traffic, which they send to the intrusion
detection ensemble for real-time inspection. The transmission of sniffed traffic from
network sniffing devices to the intrusion detection ensemble could be conducted ei-
ther in-band or out-of-band. Issues related to network traffic collection in real-time
lie outside the scope of this research.
In this dissertation we first discuss each one of the intrusion detection approaches indi-
vidually, and then proceed with a discussion of the intrusion report fusion technique.
We then describe an evaluation of the effectiveness of the EI algorithm, the physical
process aware approach, and the intrusion report fusion technique. The evaluation of
the effectiveness of the deception-based intrusion detection approach is given within
Chapter 1: INTRODUCTION 6
the discussion of this approach itself.
The process control environment, the field devices, and the industrial communication
protocol that are used as references in this research are a DCS [110], programmable
logic controllers (PLCs) [32, 95], and the ModBus protocol [83], respectively. The
physical system that is used as a reference throughout this research is an ABWR. In
this dissertation with logical variable we mean a program variable whose values are
either measurement data received from logical sensors or control data used to drive
logical actuators. Thus, the possible values of logical variables are 0 and 1.
In this dissertation with word variable we mean a program variable whose values are
either measurement data received from continuous sensors or control data that are
used to drive continuous actuators. The values of word variables are discrete and
are normally taken from specific intervals of values, including negative values. In
this dissertation the term network traffic is used to refer to network packets that are
transmitted over a process control network in a DCS.

Chapter 2
BACKGROUND
2.1 Digital Control of Physical Processes
2.1.1 Distributed Control Systems
A DCS is used to monitor and control in real-time physical systems within a de-
fined geographic location. A typical DCS architecture as derived from [110] is depicted
in Figure 2.1. It is comprised of devices and network segments distributed through
various layers, namely a supervisory level, one or more intermediate supervisory levels,
and a field level. At a supervisory level system operators use human-machine interface
(HMI) applications to send requests over a control network to control servers. Those
requests require that the receiving device supplies process data, or that it propagates
process set points down to lower levels.
A control server in turn requests process data from, or sends process set points to,
subordinate control servers at intermediate supervisory levels. Control servers at the
7

Chapter 2: BACKGROUND 8
Figure 2.1: Typical architecture of a Distributed Control System.
lowest intermediate level poll for data or send process set points to edge control sys-
tems, i.e. field level devices such as PLCs, which receive input from sensors and send
output by generating electrical signals in order to drive actuators. An edge control
system may communicate with digital sensors or actuators over a network that is
referred to as fieldbus.
Communications over control networks are conducted via protocols such as Mod-
Bus [83], Fieldbus [10], Distributed Network Protocol v3 (DNP3) [29], etc., while
fieldbus communications are conducted via protocols such as DeviceNet [98] or Mod-
Bus. In this dissertation we refer to control networks at various supervisory levels
along with fieldbus networks as a process control network.
Chapter 2: BACKGROUND 9
2.1.2 Sensors and Actuators
A sensor is a device that measures physical phenomena and converts the measured
value into an electrical signal. Sensors are categorized into logical and continuous.
Logical sensors can only detect a process state that is either true or false. They report
the detected state by turning a voltage or current on or off. Continuous sensors can
measure a process parameter that takes continuous values. They report via genera-
tion of voltages or currents that are proportional to the measured value.
An actuator is a mechanical device that converts electrical energy into mechanical
motion. Actuators are categorized into logical and continuous as well. Logical ac-
tuators allow a physical equipment to position or adjust outputs over two values,
i.e. usually open and closed, while continuous actuators do so over specific ranges of
values.
2.1.3 Programmable Logic Controllers
The internal design of a typical PLC follows a von Neumann architecture, and is
depicted in Figure 2.2 along with I/O modules that enable a PLC to receive input
from, and send output to physical processes usually through electrical signals. In the
actual context with input we mean measurements of physical process variables, such
as for example the temperature in a closed container, while with output we mean
generation of motion via equipment that changes process variables, such as for exam-
ple opening a valve to increase the water level in a tank.
Input is received from sensors, i.e. devices embedded in physical infrastructures that
translate physical phenomena into electrical signals. Output is sent by generating
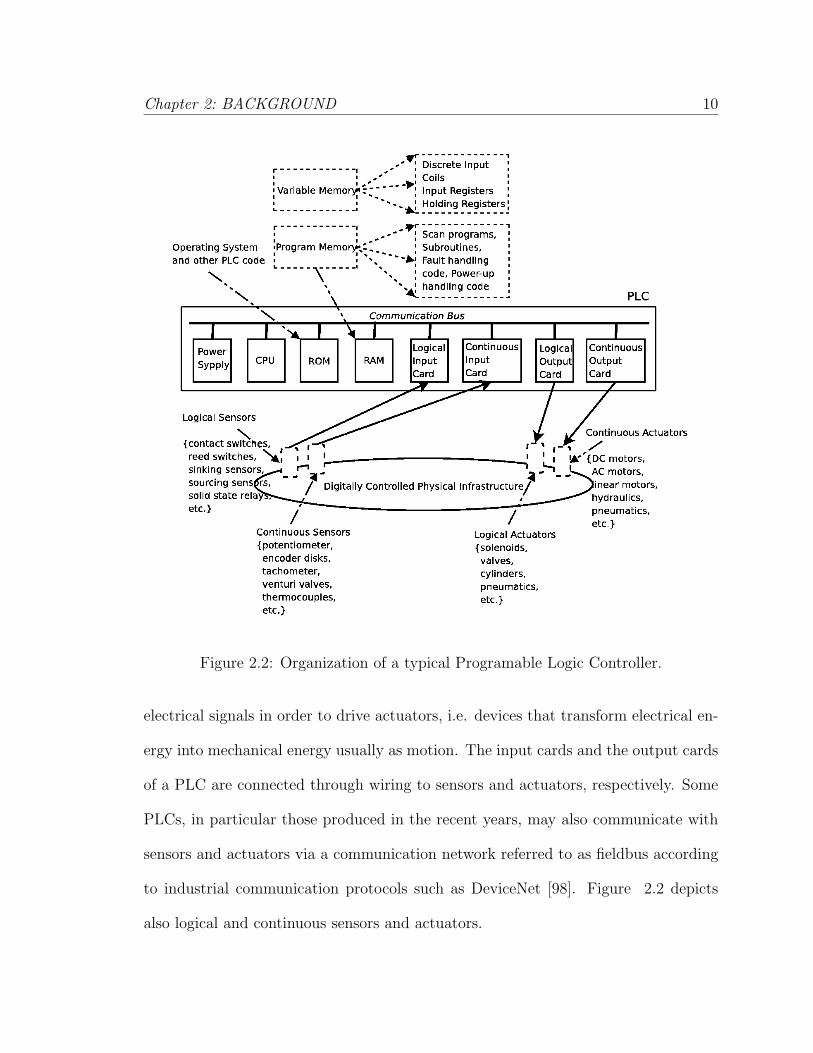
Chapter 2: BACKGROUND 10
Figure 2.2: Organization of a typical Programable Logic Controller.
electrical signals in order to drive actuators, i.e. devices that transform electrical en-
ergy into mechanical energy usually as motion. The input cards and the output cards
of a PLC are connected through wiring to sensors and actuators, respectively. Some
PLCs, in particular those produced in the recent years, may also communicate with
sensors and actuators via a communication network referred to as fieldbus according
to industrial communication protocols such as DeviceNet [98]. Figure 2.2 depicts
also logical and continuous sensors and actuators.
Chapter 2: BACKGROUND 11
Voltage values that are generated by continuous sensors are referred to as analog
data, and are to be converted into a digital form before being processed by a PLC.
Voltage values are periodically sampled, and once acquired are processed via defined
equations that convert them into numerical values [26]. Similarly, numerical values
that a PLC sends to continuous actuators are to be converted into an analog form,
i.e. voltage values, via specific digital-to-analog conversion equations before having
these continuous actuators be subject to them.
The logic of how a PLC should monitor and control a physical process is encoded into
computer code referred to as logic solving scan programs, possibly following princi-
ples of control theory. Control theory is a discipline based on engineering and applied
mathematics that deals with optimal control of the behavior of dynamic systems
[14, 91].
At run time logic solving scan programs, input scan programs, i.e. programs that
read input values, output scan programs, i.e. programs that write output values, and
other PLC programs such as fault handling programs, power-up handling programs,
etc., are stored in a part of RAM referred to as program memory, as opposed to that
part of RAM identified as variable memory that is dedicated to storage of computa-
tion, input, and output data Figure 2.2.
Logic solving scan programs are usually written in one or more programming lan-
guages of the IEC-61131-3 industrial standard [57], namely ladder diagram language,
function block diagram language, structured text language, instruction list language,
and sequential function chart language. The C and C++ languages are also com-
monly used to program PLCs. A PLC operates by periodically executing a defined
Chapter 2: BACKGROUND 12
sequence of scan programs known as a control loop. In common PLCs control loops
are comprised of four stages, and are executed a large number of times each second.
In the first stage a PLC executes code that checks the hardware and software of the
PLC itself for faults. If no faults are detected, the PLC proceeds with the second
stage in which it executes input scan programs. These programs read input data
from the logical and continuous input cards, respectively, and copy these data in
RAM variable memory. The memory locations in which logical and continuous input
and output values are stored are preliminarily designated.
In the third stage the PLC executes logic solving scan programs that process input
data previously received from sensors and stored in RAM variable memory, and pro-
duce output data that they store also in RAM variable memory in their corresponding
designated locations. In the last stage the PLC propagates logical and continuous
output values from RAM variable memory into logical and continuous actuators,
respectively.
2.1.4 ModBus Communication Protocol
ModBus is an application layer messaging protocol that enables control systems to
communicate with each other in a client-server configuration within possibly different
types of buses and networks [83]. The ModBus data model defines four categories of
variables that hold I/O values. Discrete input variables are read only single-bit data
provided by logical sensors. Coil variables are read and write single-bit data provided
by, or destined for, logical sensors and logical actuators, respectively.
Input register variables are read only 16-bit data provided by continuous sensors.
Chapter 2: BACKGROUND 13
Holding register variables are read and write 16-bit data provided by, or destined for,
continuous sensors and continuous actuators, respectively. ModBus defines its own
addressing model in which each one of the variables of those four categories is as-
signed an address from 0 to 65535. Modus applications maintain a mapping between
addresses of variables as defined by the ModBus addressing model and addresses of
locations in RAM variable memory where these variables are stored.
The said mapping is vendor specific. A ModBus protocol data unit (PDU), i.e. a
network packet payload that conveys information that a sending device wants a re-
ceiving device to process, is comprised of two fields, namely a function code and data.
Function codes indicate an operation on ModBus variables, such as write single reg-
ister, read coils, etc. Function codes are encoded in one byte and their valid values
lie in the 1 to 255 range in decimal representation.
The data field in a PDU that is sent from a client to a server contains additional
information such as ModBus addresses, the number of variables that are to be han-
dled, or the number of bytes in the network packet payload. Server devices need this
information to carry out a task specified by the associated function code. Neverthe-
less, in some specific requests a function code alone is sufficient for a server device to
perform the required task, therefore in these requests the data field is of zero length.
The data field in a response PDU sent from a server to a client contains the data that
the client had preliminarily requested via a request PDU.
For example, if a master computer, say A, controlled by human operators needs to
acquire the values of four discrete input variables generated by logical sensors and
stored contiguously in the RAM variable memory of a PLC, say B, then A sends to

Chapter 2: BACKGROUND 14
B a request PDU in which it specifies a function code of 0x02, which according to the
protocol specification stands for read discrete input, a starting address in the 0x0000
to 0xFFFF range, which in this example will be the address of the first discrete input
variable that is being asked to be read, and the number of discrete input variables
that A is asking to read, namely four in this example.
In a regular transaction device B will derive from the function code the action to
perform, namely read discrete input, will use the starting address and the number of
discrete input variables that A is asking to read for the purpose of determining the
address of each one of these discrete input variables, will read their values from RAM
variable memory and will place them in the data field of a response PDU, which it
then sends to device A. In the ModBus addressing model coil variables are addressed
starting from zero. Thus, the address of the first coil is 0, the address of the second
coil is 1, and so on. In ModBus the output value 0x0000 requests the coil to be 0
(off), while the output value 0xFF00 requests the coil to be 1 (on).
2.2 Computer Network Attacks on Process Con-
trol Systems
We now discuss attack techniques that exploit low-level coding vulnerabilities, as
these attack techniques are applicable to a large number of process control systems in
production. Low-level coding vulnerabilities may be defined as programming errors
that open the way to an adversary to corrupt the memory of a program. Exploitation
of such vulnerabilities generally takes the form of control-data or pure-data attacks.
Chapter 2: BACKGROUND 15
Control-data attacks corrupt memory management data for the purpose of transfer-
ring control to binary code inserted into the address space of a target process, or to
existing arbitrary instructions that usually are forced to take adversary supplied data
as arguments.
Pure-data attacks [20, 96] are built upon corruption of noncontrol data, i.e., compu-
tational data usually held by global or local variables in a computer program. Real-
world examples of low-level coding vulnerabilities in process control systems include a
buffer overflow in the ABB’s PCU400 process communication unit [16], another bufer
overflow in the DATAC’s RealWin/FlexView HMI [6], and a heap overflow in the GE
Fanuc’s CIMPLICITY HMI [17].
2.2.1 Array Overflows
An array overflow is a programming error that occurs when no range checks are
performed on a value that is used to index an array. The danger rises when the said
value may be directly or indirectly affected by an adversary, and the array is filled
with user-supplied data.
2.2.2 Buffer Overflows
A buffer overflow vulnerability is a programming error that allows data to be stored
beyond the boundaries of a destination buffer, therefore overwriting adjacent memory
locations and possibly further away. Buffer overflows may be caused by instructions
that do not perform any bounds checking on a destination buffer when storing data
into it. Some functions such as strncpy() allow a programmer to explicitly specify

Chapter 2: BACKGROUND 16
the number of bytes to copy to a destination buffer, but do not null-terminate the
destination buffer.
These apparently safe functions may lead to the creation of adjacent not null termi-
nated buffers. Such a situation in conjunction with a vulnerable function may cause
an excessive amount of data to be copied to a destination buffer, thus overflowing it.
In fact, the intention to copy one of these buffers to a destination buffer may copy
the intended buffer along with one or more adjacent buffers causing an overflow of
the destination buffer. A stack-based buffer overflow attack in one of its very first
forms consists in injecting binary code and overwriting the saved instruction pointer
stored on stack with the address of the injected code [3].
If executable memory areas where an adversary could inject binary code is not avail-
able or the available buffers are too small to hold the entire injected binary code,
the adversary may overwrite the saved instruction pointer on stack with the address
of existing instructions. The adversary may specify possible arguments by injecting
them on stack along with the corrupting address. A common approach is to overwrite
the saved instruction pointer with the address of the system() function of the libc dy-
namic library along with injecting on stack the address of the string that represents
a command that an adversary aims at executing on a target system.
This attack technique is referred to as return-into-library [88, 108]. As a result of
errors in handling the index of arrays in looping and iteration, a destination buffer
may be overflowed by just a few bytes, more commonly by one byte or by five bytes.
Although such a buffer overflow is limited, it may be sufficient for an adversary to
reach and corrupt the least significant byte of the saved frame pointer in a Little En-

Chapter 2: BACKGROUND 17
dian architecture, and consequently dictate the address where the operating system
pops a saved instruction pointer [73].
Heap overflow attacks [5, 22, 71] are built upon the fact that most of the memory al-
locator algorithms such as System V in Solaris, Doug Lea’s Malloc used by the GNU
C Library, RtlHeap in Windows, and so on, store heap management data in band
on the heap itself. By overflowing a buffer on heap, an adversary may corrupt such
data and consequently force the execution of macros such as unlink or frontlink and
make them use corrupted values in both sides of various assignments. This enables an
adversary to write arbitrary values to memory locations of his choice. In an indirect
pointer overwrite [15], an adversary overflows a buffer to overwrite a data pointer in
which adversary supplied data is to be written.
The adversary makes such a pointer point to a memory address where control data
or sensitive pure data are stored. When the corrupted data pointer is dereferenced,
adversary supplied data overwrite the aforementioned control data or sensitive pure
data. Similarly, through a buffer overflow an adversary may overwrite function point-
ers with the address of injected binary code.
2.2.3 Format String Vulnerabilities
A format string vulnerability is a programming error that allows an adversary to
specify the format string to a format function. An adversary may have the possi-
bility to specify a format string directly, such as, for example, when a programmer
writes printf(buff) instead of printf( ”%s,” buff), where buff is user supplied data, or
indirectly when before being used by a vulnerable format function user supplied data

Chapter 2: BACKGROUND 18
is stored in other variables, possibly in a formatted form by other format functions.
Format functions parse a format string one byte at a time.
If a read byte is not equal to %, the format function copies this byte directly to out-
put, otherwise, it means that a format directive is encountered and the corresponding
value is retrieved from a memory address stored on stack. By providing format di-
rectives in a format string an adversary has the possibility to force a format function
to operate on values, part of which are user supplied, stored on stack. For instance,
by providing %x or %s an adversary could view memory content and by providing
%n an adversary may write the number of bytes printed that far into the memory
location pointed by an address retrieved from stack.
An adversary could specify this address where to write at or read from by including
it in the format string and popping values from the stack till reaching it. At that
point the inserted format directive will be processed by the vulnerable format func-
tion, which will use it in these read/write operations. In the case of the %n format
directive, in the format string the adversary may also define each byte of the value
to be written in a specific memory address. The adversary specifies the said memory
address in the format string as well [105, 90, 38].
2.2.4 Integer Overflows
Integer errors are of two kinds, namely integer overflows and integer sign errors.
An integer overflow occurs when an integer variable is assigned a value that is larger
than the maximum value it can hold. When an integer variable is overflowed no
buffers are smashed, thus an integer overflow vulnerability is not directly exploitable.
Chapter 2: BACKGROUND 19
Nevertheless, according to [64], an overflown, unsigned integer variable is subject to
a modulo of MAXINT +1, and the result of this operation becomes the new value of
such a variable.
The actual value of an overflown integer variable may become too small; therefore, it
may be quite problematic when used as a size value in memory allocation operations
in programs that are not prepared for such a failure. As a consequence of an integer
overflow, too little memory may be allocated possibly leading to an overflow of a
buffer on heap if such memory holds the destination buffer of an unprepared memory
copy operation.
An integer sign error occurs when a function that expects an unsigned integer variable
as an argument is passed a signed integer variable instead. Such a function then
implicitly casts the signed integer into an unsigned one. The danger stands in the
fact that a large negative value may pass several maximum size tests in a program,
but when implicitly cast into an unsigned integer and used in memory copy operations
it may cause a buffer overflow.
2.2.5 Dangling Pointers
A dangling pointer vulnerability occurs when a pointer referenced by a program
refers to already deallocated memory. Such a vulnerability may cause a program
to assume abnormal behavior, and in the case of a double free vulnerability, it may
lead to a complete program exploitation [30]. A double free occurs when deallocated
memory is deallocated a second time. After a chunk on heap is freed twice, its for-
ward and backward pointers will point to that chunk itself. If the program requests

Chapter 2: BACKGROUND 20
the allocation of a chunk of the same size as the double freed chunk, and the later
chunk is first unlinked from the list of free chunks, after the unlink the forward and
backward pointers of the doubled free chunk will still point to that chunk itself.
Thus, the doubled free chunk will not really be unlinked from the list of free chunks.
The memory allocator algorithm though assumes that this chunk is effectively un-
linked, and the vulnerable program will use the user data part of the double freed
chunk. The attack at this point proceeds as in a heap overflow exploitation.
2.2.6 Control-Application Specific Memory Corruptions
Process control applications may be subject to memory corruptions conducted
in ways that are specific to them. Examples of these applications include ModBus.
ModBus employs an addressing model in which unsigned integer indices in the range
[0, 65535] are used to logically refer to ModBus application variables. The ModBus
data model maintains a mapping between logical references, i.e. the said indices,
which are also known as ModBuss addresses, and memory addresses of application
objects in a process control system. In general the mapping in question is vendor
device specific.
Faulty mappings may be a possible cause of memory corruptions on a ModBus ap-
plication, as discussed in [9]. An instance of a faulty mapping is one in which the
address of a memory location is calculated by using a logical reference as an offset
with respect to a predetermined base address. In this case a memory corruption at-
tack on a target ModBus application is conducted through a write request network
packet in which the logical reference is such that, when added to the base address, it
Chapter 2: BACKGROUND 21
produces the memory address of control data or the memory address of non-control
data other than normally accessible ModBus variables.
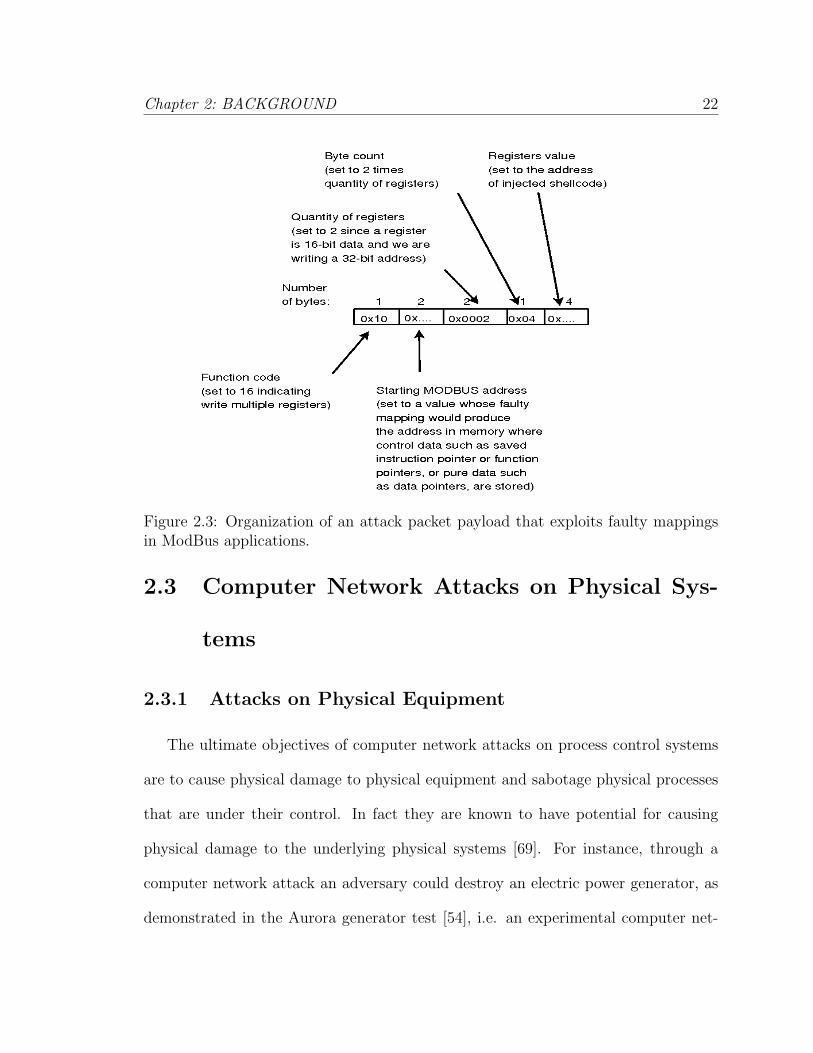
An example of an attack network packet, which more precisely in ModBus is referred
to as protocol data unit (PDU), is shown in Figure 2.3. The idea behind the orga-
nization of the said attack network packet is to request a target MODBUS device
to write two holding register variables, i.e. two 16-bit variables stored in the main
memory of a ModBus device, by specifying a logical reference, which as a result of
a possible faulty mapping would produce the address of the memory location where
control data are stored.
The overwriting value is specified in the attack network packet as well in the form
of two 16-bit data that are to be written to the said register variables. When joined
together, these data form the address of shellcode preliminarily injected. Thus, under
the assumption that a shellcode injection point exists in a vulnerable ModBus appli-
cation, the attack packet in question would corrupt control data with the address of
injected shellcode. This ModBus specific memory corruption is conceptually similar
to the attacks on OLE for Process Control (OPC) [63], which are discussed by Mora
in [85].
Chapter 2: BACKGROUND 22
Figure 2.3: Organization of an attack packet payload that exploits faulty mappingsin ModBus applications.
2.3 Computer Network Attacks on Physical Sys-
tems
2.3.1 Attacks on Physical Equipment
The ultimate objectives of computer network attacks on process control systems
are to cause physical damage to physical equipment and sabotage physical processes
that are under their control. In fact they are known to have potential for causing
physical damage to the underlying physical systems [69]. For instance, through a
computer network attack an adversary could destroy an electric power generator, as
demonstrated in the Aurora generator test [54], i.e. an experimental computer net-

Chapter 2: BACKGROUND 23
work attack conducted by researchers of the Idaho National Laboratory.
Depending on equipment specifications and the physics behind physical processes,
there is a variety of ways in which an adversary could manipulate process control
systems to cause physical damage. Note that these attacks represent techniques for
maximizing physical damage on physical equipment once an adversary has acquired
network access to a process control network or process control system. A taxonomy
of these attacks is provided by Larsen in [70].
An inertial attack consists of speeding up or slowing down heavy equipment. An
inertial attack has the potential of forcing heavy equipment to fail as in general such
equipment is not tolerant to abrupt speed changes. An exclusion attack takes place
when a process control system violates physical dependencies between various equip-
ment, while a wear attack manipulates a process control system so as to consume
certain equipment components and hence reduce the life span of the equipment itself.
Small variations of continuous process variables such as electric current or fluid flow
are recorded in a wave kept in other parts of a system.
A resonance attack is conducted by repeatedly causing small variations of word vari-
ables in order to increase the size of this wave beyond acceptable limits. A surge
attack is mounted by exceeding defined process variable limits beyond maximal val-
ues that continuous control systems are capable of handling. A latent abilities attack
exploits latent features in off-the-shelf physical equipment. An example of a latent
abilities attack provided by Larsen is to force a servomotor to run in the reverse di-
rection, although such an action may not be part of its operation in a defined physical
system.
Chapter 2: BACKGROUND 24
2.3.2 Attacks on Physical Processes
Physical processes that take place within a physical system are kept under safe
conditions by system operators, who use sensor data to monitor their status at any
point in time and also generate set points to cause them to evolve in a controlled way.
As sensing and control of physical processes is conducted through process control
systems over process control networks, by compromising these process control systems
an adversary achieves direct control over physical processes, and hence can directly
attack them.
With attacking a physical process we mean taking its parameters to abnormal values,
a fact thay may result even in explosions if the physical process degradation is not
corrected on time. In a nuclear power plant, for example, control rods are used as the
primary mechanism for controlling the rate at which nuclear fissions take place within
the reactor core. If an adversary manages to disable reactor protection systems and
thereafter uses compromised control systems to withdraw a large number of control
rods, then the power level in the reactor will increase to abnormal values.
If the power level along with related parameters are not brought to normal values on
time, the power level will keep increasing beyond the limits of physical safety, with
consequences being comparable to those of accidents in nuclear power plants.
2.4 Intrusion Detection
Intrusion detection approaches can be categorized into misuse detection [97, 75],
anomaly detection [36, 4], and specification-based detection [74, 107]. Misuse detec-

Chapter 2: BACKGROUND 25
tion is based on signatures of known attacks, therefore it does not detect unknown
attacks. Anomaly detection is based on learning profiles of the normal behavior of
systems and networks. A typical anomaly detection approach monitors systems and
networks. If their behavior deviates from the behavior that was preliminarily learned,
the anomaly detection approach deems that an attack is taking place.
Anomaly detection has the potential of detecting unknown attacks, but is subject to
a high rate of false positives. This is due to the fact that systems and networks often
exhibit behavior profiles other than those exhibited during the time frame in which
an anomaly detection approach observes their operation in order to learn profiles of
their behavior. Specification-based detection is based on manually developed specifi-
cations of legitimate behavior of systems and networks.
Specification-based detection is characterized by a lower false alarms rate than anomaly
detection. Nevertheless, the capability of specification-based detection to detect novel
attacks is lower than anomaly detection.

Chapter 3
RELATED RESEARCH
3.1 Applied Statistics for Intrusion Detection
As of this writing, the majority of research on applied statistics and probability
theory for intrusion detection has been conducted on general purpose computer sys-
tems and networks. In [77], Li et al. develop n-gram models upon training data to
probabilistically characterize normal sequences of system calls that are issued by priv-
ileged processes. Li et al. use receiver operating characteristic (ROC) curve analysis
to assess the effectiveness of their n-gram models, and thus show that their approach
is promising to a degree that they also propose to apply it for network intrusion de-
tection.
The approach of Li et al. is limited when it comes to scrutinize the payload of net-
work packets that flow across a process control network. The said limitation stems
from the very definition of an n-gram model. An n-gram model is a probabilistic
model that is used to predict the next item, i.e. phonemes, syllables, letters, words
26

Chapter 3: RELATED RESEARCH 27
or base pairs, etc., in a defined sequence. Given a history of size n, an n-gram model
is used to estimate the probability that a defined item will be the next item. For
example, given a history of system calls of size 2, a 2-gram model is used to calculate
the probability distribution for the third system call that will be issued by a given
process.
Taking into account that the payload of a network packet transmitted over a process
control network conveys data that are to be written to, or are read from, logical or
word variables stored in the RAM variable memory of a given control system, the
task that may be conducted by an n-gram model is the following: given a history
of n values that were taken by a logical or word variable, what is the probability
distribution for the next value that will be taken by the variable in question ?
A history of past values of a defined variable though provides limited visibility on
the next value of the said variable, as a logical or word variable may also depend on
other logical or word variables. In a nuclear power plant, for example, the next value
of the word variable that is mapped to the linear position of a control rod depends to
a large degree on the current values of variables that are mapped to parameters like
temperature, pressure, poisons, fuel concentration, etc.
Similarly, the next value of the logical variable that is mapped to the position of a
safety relief valve depends exclusively on the current value of the word variable that
is mapped to the reactor vessel pressure. Thus, n-gram models have limited visibility
on the evolutions of values of a logical or word variable as in their estimations they
completely ignore the dependency of a given variable on other logical or word vari-
ables. Our statistical intrusion detection algorithm captures the said dependencies

Chapter 3: RELATED RESEARCH 28
in full, and thus maintains visibility over all factors that influence the probability
distribution for the next value of a logical or word variable.
In [4, 59], Valdes et al. describe a statistical intrusion detection algorithm called Next-
Generation Intrusion-Detection Expert System (NIDES), which adaptively learns
what is normal for individual subjects, i.e. system users, user groups, remote hosts,
and the overall system. The NIDES statistical algorithm estimates various statistical
measures of abnormalcy, say Si, where i ≤ n with n being the total number of the
said measures. More than one of the S measures may be used to examine the same
aspect of behavior via different approaches. The NIDES statistical algorithm defines
S measures of activity intensity, audit record distributions, transaction-specific cate-
gories, and counts of various events.
The S measures are then aggregated into a single statistic that is referred to as the
NIDES score value. The estimation of normalcy or abnormalcy of a defined behavior
is conducted upon an estimated value of the NIDES score value. We do not see any
technical reason that could prevent the invention of a version of the NIDES algorithm
applicable to a process control network. In this regard our statistical intrusion detec-
tion algorithm would be fully compliant with the NIDES statistical algorithm since
it could form a NIDES component that estimates one of the S measures, which the
NIDES statistical algorithm then could aggregate with other S measures and hence
derive the score value.
Nevertheless, as of this writing no written material on a version of the NIDES sta-
tistical algorithm for process control networks is publicly available. In [2], Kumar et
al. analyze network traffic via classification trees in order to identify parameters that
Chapter 3: RELATED RESEARCH 29
may be leveraged to characterize normal network traffic, and thus apply the six-sigma
technique integrated with rigorous statistics to estimate upperbound and lowerbound
thresholds for the said parameters.
During inspection of network traffic each packet is deemed as normal if the values of
the parameters in question are found to lie within the corresponding thresholds. We
tried the approach by Kumar et al. on a process control network in order to assess its
applicability to such special-purpose network. What we received from the application
of the six-sigma technique is an estimation of the maximum and minimum values for
each word variable in the RAM variable memory of a control system.
The employment of six-sigma in a process control network is redundant as the maxi-
mum and minimum values for each word variable can be derived from specifications
of the deployed equipment, the physical process being controlled digitally, and the
cyber-physical mapping that is in place. Furthermore, conducting intrusion detection
in a process control network by checking whether the value of a defined word variable
falls within its maximum and minimum values provides limited defense.
We deem that the said limitation is due to the fact that six-sigma completely ignores
the context of physical equipment and physical processes being controlled via a com-
puter network. Consider for example an inertial attack on a four-pole electric motor
that runs on 60 Hz with a maximum speed of 1800 rotations per minute (RPM). Re-
call from [70] that an inertial attack is conducted by causing abrupt speed changes,
with the result being physical damage or operation failure.
Although a network packet that changes the speed of the said motor from, say 25
RPM, to, say 1800 RPM, is a manifestation of an inertial attack, the approach by
Chapter 3: RELATED RESEARCH 30
Kumar et al. would classify the network packet in question as normal since a word
variable is being set to a value that falls within its corresponding maximum and min-
imum values allowed. Our statistical intrusion detection algorithm is not subject to
the said limitation as it is fully aware of the dynamics of physical processes and op-
eration of physical equipment, and as such classifies as abnormal any network packet
that has potential for perturbing any physical parameters in a DCS-controlled phys-
ical system.
In [41], Gowadia et al. apply Bayesian belief networks (BBNs) to model probabilistic
relations between defined fields of network packets, and hence estimate their prob-
ability distributions. Our statistical intrusion detection algorithm is similar to the
approach of Gowadia et al. to some degree, as the probabilistic relations between log-
ical or word variables that we leverage in our work can be expressed as a BBN. Our
work though differs from that of Gowadia et al. in the way conditional probability
distributions are estimated.
Gowadia et al. estimate conditional probability distributions for a defined variable
manually being based on expert knowledge, while our statistical intrusion detection al-
gorithm is built upon inductive learning and uses probability mass functions based on
applied logistic regression and maximum likelihood estimation. In [31], DuMouchel
applies the Bayesian Dirichlet-Multinomial Model to estimate command transition
probabilities. In this case we are referring to operating system commands. Given a
user u and the most recent command c issued by that user. DuMouchel estimates
P (Next Command = k | {c, u})
Chapter 3: RELATED RESEARCH 31
for each k, where k is a command. We deem that DuMouchel’s research provided
in [31] is directly applicable to a process control network. The Modbus counterpart
of an operating system command is a function code, i.e. a 1-byte field of a network
packet that specifies to a receiving node what kind of action to perform. If s and r
are a sending node and a receiving node in a process control network, respectively,
and c is the function code of the most recent network packet sent by s to r, then we
could apply the Bayesian Dirichlet-Multinomial Model to estimate
P (Function Code of Next Network Packet = k | {c, s, r})
for each k, where k is a function code. The said Bayesian Dirichlet-Multinomial
Model applied to a process control network would be complementary to our statisti-
cal intrusion detection algorithm as the former would scrutinize function code fields
of network packets, while the latter scrutinizes data fields of network packets.
In [61], Ju and Vardi address the same challenge as DuMouchel, namely probabilistic
estimation of the sequence of operating system commands that is likely to be issued
by a computer user. Ju and Vardi deem that solely the most recently issued command
is insufficient for computing the probability of transitioning to a defined command.
Consequently they apply a high-order Markov chain to estimate the probability dis-
tribution for the next command being based on a recent history of commands.
Furthermore, Ju and Vardi develop independence models to cope with cases in which
user profiles with respect to sequences of commands change drastically over time.
We believe that the approach of Ju and Vardi is also applicable to a process control
network to estimate the probability distribution for the function code of the next
network packet that will be sent by a sending node to a destination node. The said
Chapter 3: RELATED RESEARCH 32
estimation would be conducted being based on a history of function codes derived
from network packets that were recently sent by a sender to a receiver. In [118], Wang
and Stolfo develop statistical models of network packet payloads, and hence inspect
network traffic in real-time to look for deviations from the said models.
Wang and Stolfo compute a statistical model for each defined range of payload length,
for each service, and for each direction of payload flow. They consider as a variable the
frequency of each byte of a payload. A statistical model then is formed by computing
the mean and standard deviation of such variables over a set of training payloads,
which are gathered during a learning phase in which a normal network interaction
with a network service or application is conducted.
In a monitoring phase Wang and Stolfo capture incoming payloads, and thus compute
the Mahalanobis distance between the byte value distributions of a payload under in-
spection against the statistical model that corresponds to the said payload. If the
Mahalanobis distance is found to be high, then the payload under inspection is likely
to be abnormal. Although clearly the approach of Wang and Stolfo is applicable
to a process control network, the statistical models of network packets that may be
constructed via this approach do not take into account the possible states of a DCS-
controlled physical system.
In other words, the statistical profiles in question are derived solely from network
packets that are observed during a learning phase instead of those network packets
in conjunction with the possible states of a DCS-controlled physical system. This is
a limitation since a network packet may be normal in a defined state and abnormal
in another state of a DCS-controlled physical system. Consider for a moment the
Chapter 3: RELATED RESEARCH 33
network packets that perform a SCRAM of a nuclear power plant, i.e. emergency
shutdown.
The said network packets are normal if the values of certain physical parameters are
outside predefined limits. These same network packets may be abnormal if the val-
ues of the physical parameters in question are within predefined limits. In the latter
case we may have a clear denial of service attempt since restarting a nuclear power
plant takes considerable time, during which the power plant won’t produce any elec-
tric power. Similarly, a network packet that opens the generator output breaker is
normal if the value of a defined physical parameter is indicative of a mechanical or
electrical fault in the generator, and abnormal otherwise.
3.2 Developing Specifications of Normal Behavior
for Intrusion Detection
The practical development of a specification-based intrusion detection approach,
which is capable of detecting known as well as unknown attacks and maintaining a
very low rate of false positives, was studied by Uppuluri and Sekar in [114]. The au-
thors of [114] report that an effective specification-based approach can be built with
moderate efforts. Our experience with a physical process aware specification-based
approach complies with the experience of Uppuluri and Sekar.
Nevertheless, throughout our research we met another factor that is directly related
to the practical development of a physical process aware specification-based approach,
namely a high level of complexity of the detection specifications that we use to scru-

Chapter 3: RELATED RESEARCH 34
tinize the payloads of network packets that flow across a process control network. In
other words, the development of our specification-based approach is practical, but the
expert knowledge that is required to write and maintain the detection specifications
is much higher than the expert knowledge required to develop a specification-based
approach for operation in general-purpose computer systems and networks.
This is mainly due to the necessity of including in the detection specifications the
normal behavior of phenomena that take place at the physical system. For example,
if the physical system is, say a nuclear power plant, we would need to draw from areas
such as nuclear physics and reactor theory to specify the expected normal behavior
of the nuclear power plant in terms of possible normal contents of network packet
payloads. To our knowledge, as of this writing there is only one research work on
specification-based intrusion detection for process control networks, namely model-
based intrusion detection [21].
In [21], Cheung et al. explore protocol-level models for intrusion detection in pro-
cess control networks. These models express a definition of legitimacy for packet
payloads of byte-oriented protocols such as Modbus, and are derived from protocol
specifications and implementation guides. Protocol-level models search for violations
of specifications regarding function codes, exception codes, protocol identifiers, or
other functionally similar fields. Protocol-level models also examine cross-field rela-
tionships, since the legitimate value of a payload field may depend on the value of
another payload field.
Our research on physical process aware specification-based detection is built on top
of model-based detection, and thus is complementary to it. The rest of the work on
Chapter 3: RELATED RESEARCH 35
specification-based detection was conducted for general-purpose computer systems
and networks. Sekar and Uppuluri in [107], and Ko et al. in [74], propose approaches
based on specifications of normal behavior of computer programs.
Sekar and Uppuluri capture the normal execution of a computer program via spec-
ifications of sequences of system calls and specifications of conditions on values of
system call arguments. Ko et al. deem that specifying in full the behavior of a com-
puter program is not practical, and thus develop specifications of only those aspects
of program execution that are relevant to security. More precisely, Ko et al. develop
specifications of the sets of files that the computer program is expected to access,
specific sequences of operations such as I/O or starting external programs such as a
shell program, and synchronization with other concurrent computer programs.
What our physical process aware specification-based intrusion detection approach has
in common with the approaches of Sekar and Uppuluri and Ko et al. is the derivation
of detection specifications from high-level behavior specifications. Their difference
lies in the fact that Sekar and Uppuluri and Ko et al. capture the normal behavior of
computer programs, while in our research we attempt to capture the normal behavior
of network traffic. In [94], Petroni et al. propose a specification-based technique for
detection of rootkits that corrupt dynamic kernel data, given that hash functions can
provide protection from corruption of static kernel data only.
Petroni et al. develop specifications for low-level kernel data structures and the rela-
tionships between them. As the other specification-based approaches, the approach
of Petroni et al. relies on expert knowledge, in this case expert knowledge of oper-
ating system kernels. Both our research and the research of Petroni et al. exploit
Chapter 3: RELATED RESEARCH 36
the concept of data semantics. We work on the semantics of network packets that
flow across a process control network, while Petroni et al. leverage the semantics of
dynamic kernel data.
In [7], Balepin et al. logically couple specification-based intrusion detection with au-
tomated response. Although intrusion response lies outside the scope of the work
that we discuss in this dissertation, the specification models that we develop convey
a sense of response, in the sense that no normal transition of any of the models in
question takes place if a network packet is classified as abnormal.
3.3 Related Research on Applied Deception
The application of deception techniques from conventional warfare, as detailed
under the light of specific case studies of military conflicts drawn from history, for
improving the security of computer systems and networks has been explored by Rowe
and Rothstein in [100, 101]. Rowe and Rothstein analyze historical military opera-
tions like Operation Mincemeat [84], which took place during the second world war,
to illustrate a set of principles and mechanisms that are used for an effective tactical
deception in conventional warfare.
The authors then evaluate the applicability of the said principles and mechanisms to
the invention of defensive deceptive capabilities for computer systems and networks.
Mirage theory moves along the line of Rowe and Rothstein’s research as it is a di-
rect application of MILDEC to the defense of process control systems and networks.
Furthermore, as written in the previous section, while researching on mirage theory
we carefully analyzed a historical conventional warfare operation, namely Operation
Chapter 3: RELATED RESEARCH 37
Fortitude South. Honeypots, i.e. closely monitored information system resources that
serve as network decoys [109, 109], and mirage theory have a few features in common
to some extent, including distraction of adversaries from valuable attack targets, and
leverage of deception for intrusion detection [49, 68].
Nevertheless, mirage theory is fundamentally different. Honeypots are passive and
just stand by to receiving network connections. Thus, they have no normal activity.
Mirage theory is exactly the opposite, in the sense that its main strength lies in nor-
mal system and network activity. Honeypots usually simulate services that are more
vulnerable than their production counterpart in order to lure adversaries. Mirage
theory fights for making deceptive process control networks, systems, and simulated
or emulated physical processes or equipment as much undistinguishable from their
production counterparts as possible.
The deception capabilities of honeypots are placed within the boundaries of a com-
puter system or network, and hence fall within network access visibility. Mirage
theory develops deceptive capabilities at a layer which is not reachable through a
network access to a target process control network. Rowe and Rothstein in [22, 23]
indicate that honeypots are not in line with an important principle of conventional
warfare, namely that deception should be integrated with operations.
Their thesis is that deceptive tactics are more effective on real systems. In fact Holz
and Raynal show in [50] several techniques to detect honeypots by capturing technical
details that are characteristic for virtual execution environments, and hence different
than in real ones. In mirage theory the process control systems and networks are all
genuine. Furthermore, they are deployed and configured in such a way that they can

Chapter 3: RELATED RESEARCH 38
be used to smoothly monitor and control an existing physical system.
The research of Yuill et al. provided in [127] and mirage theory leverage concepts
that are similar to some degree, namely honeyfiles and deceptive program variables in
cyber-physical mappings, respectively. Honeyfiles are bait files intended for hackers
to access. Honeyfiles reside in servers, which generate intrusion alerts if a honefile is
accessed. Honeyfiles are intended to be no different than other normal files. Thus,
for an adversary to detect a honeyfile, he/she has to open it, an action that results
in the detection of the adversary’s presence.
A cyber-physical mapping is a one-to-one correspondence between program variables,
which hold I/O values in the RAM of control systems, and physical process param-
eters or parameters that characterize the operation of physical equipment. While a
file is mapped to regions of secondary storage by the operating system, a deceptive
variable is mapped to a parameter related to a physical process or equipment, which
in fact are all simulated or emulated.
Mirage theory employs deceptive network packets to make deceptive variables appear
no different than their genuine counterpart. For an adversary to detect a deceptive
variable, he/she has to access it either locally or over a process control network, an
action that is used to detect the intrusion. In [99], Rowe attacks the problem of logi-
cal consistency in deception. He explores automated methods which track assertions
that are made up to a certain point in time along with their effects, and thereafter
identify the possible consistent deceptions that may be conducted next in order.
In mirage theory we attack the same problem, but do so in a way that differs from
the approach followed by Rowe in [21] due to our different levels of intervention. Row

Chapter 3: RELATED RESEARCH 39
works mainly at the operating system level, while from the logical consistency per-
spective in mirage theory we focus mainly on physical system phenomena. We employ
large systems of differential equations to feed an adversary with a consistent view of
the internal dynamics of physical processes and equipment at any point in time.
The end objective is what mirage theory has in common with cognitive hacking [39],
reflexive control theory [112], and perception management process [60]. Cognitive
hacking is basically manipulation of the perception of technology users. Reflexive
control is a warfare theory that has been studied in the former Soviet Union and later
on in Russia for a very long time. Reflexive control theory is comprised of methods
for conveying to a subject especially prepared information in order to incline him/her
to voluntarily make a predetermined decision.
The US approximate counterpart of reflexive control theory is the perception man-
agement process. Perception management is comprised of actions that convey and/or
deny selected information and indicators to foreign audiences in order to influence
them. Mirage theory seeks to exploit the adversary’s mind, namely his/her percep-
tion of a defined cyber-physical system. Mirage theory actively conveys information
and indicators to an adversary for the purpose of piloting his/her target selection
process towards simulated or emulated physical processes and equipment.
Chapter 3: RELATED RESEARCH 40
3.4 Other Related Research on Intrusion Detec-
tion in Process Control Networks
The research challenge of detecting attacks to control systems is addressed by
Cardenas et al. in [18], and Naess et al. in [87]. Cardenas et al. describe an approach
that is based on an understanding of the interactions between control systems and a
physical system. Cardenas et al. model the behavior of a physical system as a lin-
ear dynamic system, and thus use the said model to determine the effects of control
commands on physical parameters of the physical system in question.
Their thesis is that attacks to control systems will exhibit an abnormal behavior of the
physical system, i.e. will have negative effects on physical parameters of the physical
system, and thus propose to use sequential detection theory to detect them. In our
research we model the interactions between control systems and a physical system as
evolutions of values of logical or word variables stored in the RAM variable memory
of control systems themselves.
Our thesis is that the normal behavior of a physical system in conjunction with nor-
mal network control traffic by which the former is directly affected can be captured by
specific evolutions. In the EI algorithm we estimate these evolutions via probabilistic
models that we construct upon inductive machine learning. In the physical process
aware approach we use expert knowledge to specify these evolutions. For a control
command to be deemed as normal, the network packet that conveys it should cause
an evolution of values of a logical or word variable that is deemed as normal by our
intrusion detection approaches.

Chapter 3: RELATED RESEARCH 41
Naess et al. discuss an intrusion detection approach that is comprised of high level
application-based policies whose implementation is placed at the middleware level.
Naess et al. develop misuse policies that are based on attack signatures, procedural-
based policies that use execution patterns of a component that is being monitored,
and interval-based policies that look for anomalies in parameter values or method in-
vocation frequencies, and thus are based on estimation and enforcement of parameter
thresholds.
Procedural-based policies use an approach that is typical to host-based intrusion de-
tection, and as such they are not comparable to our statistical intrusion detection
algorithm. So are misuse policies and those interval-based policies that deal with
method invocation frequencies. Our research suggests that interval-based policies
take into account the state of the physical system when setting parameter thresholds.
Naess et al. discuss maximum and minimum value policies that look for values of
parameters that lie outside the range of allowed values of those parameters.
For instance, if the allowed set point for the linear position of a control rod, i.e. a
rod made of neutron absorbing materials that is used to adjust the reactivity of the
reactor core [116], should be an even value between, say 6 and 24, a maximum and
minimum value policy would classify a set point of 24 as normal. If the current value
of reactivity in the reactor is high, moving the control rod in question from a low
position to position 24 may be quite abnormal and thus dangerous.
The approach of Naess et al. includes delta value and maximum average policies,
which are devised to detect unexpected variations in parameter values over a short
amount of time and excesses of maximum distance from a moving average for each
Chapter 3: RELATED RESEARCH 42
measurement, respectively. A consideration of the state of a physical system would
enable delta value and maximum average policies to allow for corrective responses
that are initiated by control systems upon occurrences of faults or breakages in plant
equipment.
To our knowledge many of such corrective responses often consist of set points that
cause large and abrupt changes in values of specific parameters. Naess et al. also
discuss interval-based policies that employ cumulative distribution functions to de-
tect rare values given a history of normally distributed values. Thus, these policies
compare the next value of a parameter with a trace of a given length of previous
values of the said parameter. To our experience though the next normal value of a
parameter depends also on current values of other parameters that characterize the
state of a physical system.
In a nuclear power plant, for example, the next value of the position of a turbine
bypass valve depends also on the current value of the pressure in the reactor vessel.
The EI algorithm and the physical process aware approach consider the full state
of a physical system when estimating a probability distribution for the next value
of a logical or word variable. In [86], Naedele and Biderbost describe an approach
for reducing security related events that occur in a process control environment into
quantitative metrics, which are understandable by system operators who normally
have no computer system and network security expertise.
The said quantitative metrics are then visualized to system operators, who assess
whether a computer network attack is taking place. What the approach of Naedele
and Biderbost has in common with the EI algorithm and the physical process aware
Chapter 3: RELATED RESEARCH 43
approach is that both of them do consider the dynamics of a digitally controlled
physical system when estimating the normalcy of network packets. They differ in the
means they use for estimating the normalcy of network packets.
The approach of Naedele and Biderbost use the human mind as pattern matcher and
relevance evaluator, while the EI algorithm and the physical process aware approach
leverage the estimation power of statistics and physical process aware specifications,
respectively. We deem that the EI algorithm and the physical process aware approach
are better as they provide for real-time detection, while human analysis of events takes
at least a few seconds. Consider for example a malicious network packet that opens
or closes a circuit breaker to desynchronize a power generator with respect to a power
transmission grid.
We think that the approach of Naedele and Biderbost has potential for detecting the
said malicious network packet, but still would detect it too late due to the delay that
is induced by the seconds that the system operators would need to analyze one or
more quantitative metrics. The EI algorithm and the physical process aware approach
are capable of detecting the network packet in question before it is processed by the
target control system that controls the circuit breaker.
3.5 Intrusion Alert Fusion
The ACH [47] is a methodology devised for use by intelligence analysts when
working on choosing several alternative hypotheses. ACH is comprised of eight se-
quential steps that focus on a matrix with hypotheses across the top and evidence
down the side, with the objective being an estimation of the relative likelihood of

Chapter 3: RELATED RESEARCH 44
each hypothesis. ACH forms the foundation of our intrusion report fusion technique,
which may be thought of as a mathematical development of ACH for intrusion report
fusion in process control networks.
A theory of confirmation is a proposal for a logic by which to confirm or deny hy-
potheses [35, 40, 79, 80, 58, 34, 119]. A theory of confirmation normally involves
two measures, namely a measure of hypothesis-based probability of evidence, i.e. the
likelihood of evidence were the hypothesis true, and a measure of the degree to which
a hypothesis is confirmed or disconfirmed on the evidence. A confirmation theory
that uses the Bayes theorem to represent the relation between these two measures is
referred to as a Bayesian confirmation theory.
The intrusion report fusion technique that we discuss in this dissertation is exactly a
Bayesian confirmation theory. In [43], Gu et al. employ the likelihood ratio test [24]
to fuse alerts from an ensemble of intrusion detection approaches in order to improve
the overall intrusion detection effectiveness. The application of the likelihood ratio
test to our problem domain would consist of a comparison between the hypothesis-
based probabilities of evidence. Later on in this dissertation we will see that in our
problem domain the hypothesis-based probabilities of evidence are not directly mea-
surable.
Consequently, a part of our work is conducted on the computation of a probability
density function that allows for estimating the hypothesis-based probabilities of evi-
dence. Furthermore, we attempt to refine the effectiveness of the likelihood ratio test
via the Bayes theorem in its ratio form, which in addition to prior probabilities of
hypotheses uses also the likelihood ratio test to derive and compare the degrees to

Chapter 3: RELATED RESEARCH 45
which each one of the hypotheses is confirmed on evidence.
Majority voting or weighted voting is used as an intrusion alert fusion technique by
Breiman in [12], Perdisci et al. in [92], and by Freund and Schapire in [33]. In
[122], Wolpert discusses stacking, which is a method for training a machine learning
algorithm such as a neural network or a support vector machine for the purpose of
combining predictions made by various intrusion detection classifiers. In [43], Gu et
al. indicate that voting and stacking are less effective than the likelihood ratio test
technique.
In [8], Bass points out that the application of multisensor data fusion for intrusion
detection is based on applied mathematical theories such as statistics, artificial in-
telligence, digital signal processing, information theory, decision theory, etc. In fact
in this research we apply elements of statistics and probability theory to devise an
intrusion report fusion technique especially for process control networks.

Chapter 4
PROBABILISTIC ESTIMATION
OF DATA TRANSITION FLOWS
FOR ANOMALY DETECTION
4.1 Introduction
After decades of engineering research, the majority of the physics behind processes
in a physical system such as a nuclear power plant are known. If a physical system is
operated digitally, as is the case of some generation III, most of generation III+, and
generation IV reactors, arguably we can say that with the said knowledge in hand we
have a good definition of normalcy in the physical side of such cyber-physical system.
Taking into account that several behavior profiles of control systems and networks are
induced by physical processes taking place at the physical side, an intuitive research
direction is to leverage knowledge of normalcy in the physical side into an estimation
46
Chapter 4: PROBABILISTIC ESTIMATION OF DATA TRANSITION FLOWSFOR ANOMALY DETECTION 47
of normal behavior of the cyber side, and hence estimate the concept of normalcy for
the whole cyber-physical system in consideration.
In this chapter we discuss an anomaly intrusion detection algorithm that we call
the Estimation-Inspection (EI) algorithm. The EI algorithm leverages the concept
of RAM data flow to derive, in a statistical way, the normal behavior of a process
control network from the behavior of the physical system that is being controlled
digitally. Thus, the EI algorithm estimates the normal evolutions of the content of
specific locations in the RAM of control systems via applied statistics and probability
theory.
The EI algorithm thereafter determines whether a network packet is normal or abnor-
mal by considering the specific RAM data flow that the network packet in question
has potential to cause. The effectiveness of the EI algorithm lies in the fact that the
concept of normal RAM data flow is a direct characterization of the dynamics of a
DCS-controlled physical system, namely its states and transitions between states. By
ensuring that the evolutions of the values of logical or word variables follow only nor-
mal RAM data flows, the EI algorithm protects the DCS-controlled physical system
from being taken to unsafe conditions by malicious network packets.
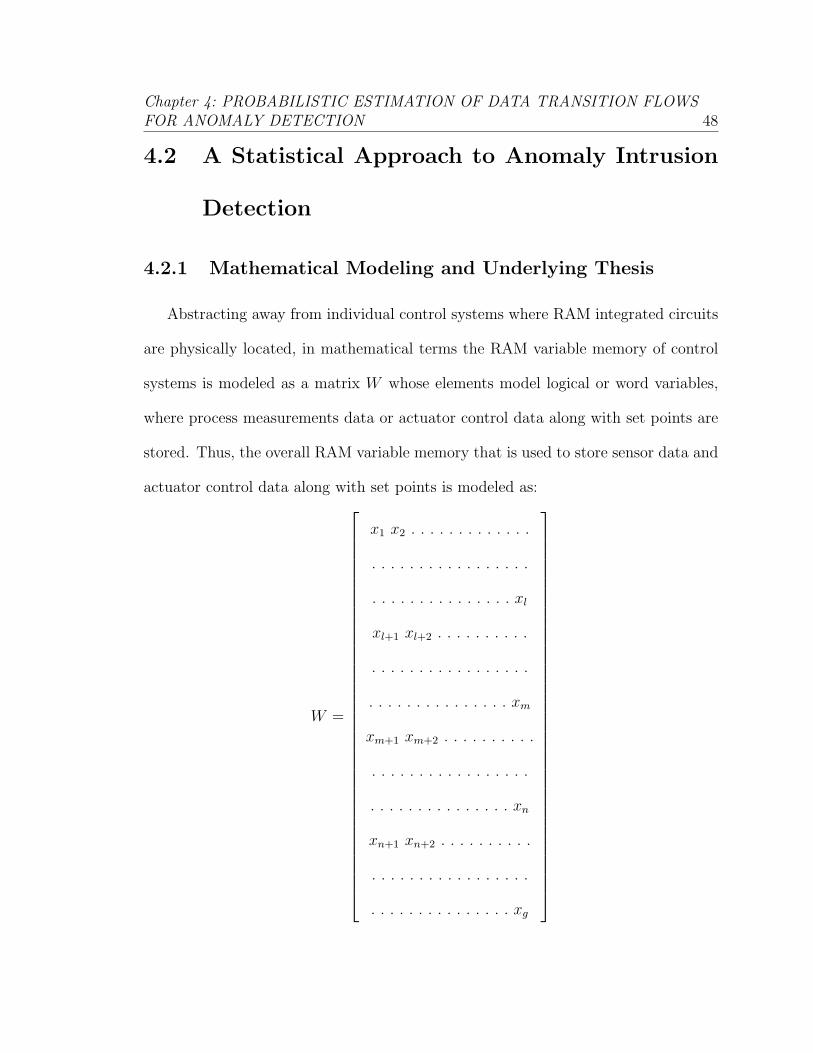
Chapter 4: PROBABILISTIC ESTIMATION OF DATA TRANSITION FLOWSFOR ANOMALY DETECTION 48
4.2 A Statistical Approach to Anomaly Intrusion
Detection
4.2.1 Mathematical Modeling and Underlying Thesis
Abstracting away from individual control systems where RAM integrated circuits
are physically located, in mathematical terms the RAM variable memory of control
systems is modeled as a matrix W whose elements model logical or word variables,
where process measurements data or actuator control data along with set points are
stored. Thus, the overall RAM variable memory that is used to store sensor data and
actuator control data along with set points is modeled as:
W =
x1 x2 . . . . . . . . . . . . .
. . . . . . . . . . . . . . . . .
. . . . . . . . . . . . . . . xl
xl+1 xl+2 . . . . . . . . . .
. . . . . . . . . . . . . . . . .
. . . . . . . . . . . . . . . xm
xm+1 xm+2 . . . . . . . . . .
. . . . . . . . . . . . . . . . .
. . . . . . . . . . . . . . . xn
xn+1 xn+2 . . . . . . . . . .
. . . . . . . . . . . . . . . . .
. . . . . . . . . . . . . . . xg

Chapter 4: PROBABILISTIC ESTIMATION OF DATA TRANSITION FLOWSFOR ANOMALY DETECTION 49
The elements x1, x2, ..., xl model input register variables, the elements xl+1, xl+2, ...,
xm model holding register variables, the elements xm+1, xm+2, ..., xn model discrete
input variables, and the elements xn+1, xn+2, ..., xg model coil variables. A control
system can hold as many as 65536 variables of each type. If q is the number of control
systems in a process control network, then l = 65536q, m = 2l, n = 3l, and g = 4l.
Nevertheless, in a real world DCS it may happen that not all of the input register
variables, holding register variables, discrete input variables, and coil variables, are
needed, and thus not all of them are defined by control system engineers. Logical
variables and word variables in RAM variable memory, and hence the elements of
the matrix W , are mapped to process parameters, i.e. variables that characterize
the operation of physical equipment and/or physical processes, according to specific
schemes, i.e. cyber-physical mappings, that depend on the communication protocol
being used.
In some byte oriented protocols such as ModBus, cyber-physical mappings are defined
ad hoc by control system engineers and are applied during device configuration, while
other protocols such as IEC 61850 [55] come with inherent cyber-physical mappings
that are defined in their respective specifications. Process parameters are related to
each-other by formulae that lie in sciences such as chemistry or physics, depending on
the kind of processes taking place at the physical side of a DCS-controlled physical
system under consideration.
A cyber-physical mapping is seen as the mechanism that reflects physical or chemical
relations between process parameters into functional relations among logical variables
and word variables in RAM variable memory, and hence into functional relations
Chapter 4: PROBABILISTIC ESTIMATION OF DATA TRANSITION FLOWSFOR ANOMALY DETECTION 50
among the elements of the matrix W . Such functional relations in turn form the
stem of what logical data and continuous data are assigned to sensor associated vari-
ables and actuator control variables during a controlled operation of a DCS-controlled
physical system.
Thus, given a kind of process on the physical side of a DCS-controlled physical system
along with a cyber-physical mapping, a value assigned to a defined element of the
matrix W may be explained by consulting a set of other elements of the matrix W,
under the assumption that the analysis is being performed on a safe operation of the
DCS-controlled physical system. The thesis that forms the foundation of the research
discussed in this paper is that for each possible combination of possible values of the
elements of the matrix W , including the current value of W [i][j], W [i][j] may take
each one of its possible values with a probability that varies from 0.0 to 1.0.
We refer to the probability in question as a normalcy probability. A normal transition
flow step occurs when W [i][j] takes a value whose associated normalcy probability is
not 0.0. Thus, a network packet that is about to write W [i][j] is classified as normal
if it causes a normal transition of the current value of W [i][j], i.e. it writes a value to
W [i][j] whose associated normalcy probability is not 0.0. Reasoning in a statistical
context, let us refer to the elements of the matrix W as W [i][j] and x1, x2, ..., xg when
we treat them as dependent variables and as exposure variables, respectively.
The proposed statistical algorithm, which is called the Estimation-Inspection (EI)
algorithm and is provided later on in this section, estimates the probability distribu-
tion of the values of W [i][j] given x1, x2, ..., xg, and checks that a network packet that
writes W [i][j] conveys a value for W [i][j] whose associated normalcy probability is
Chapter 4: PROBABILISTIC ESTIMATION OF DATA TRANSITION FLOWSFOR ANOMALY DETECTION 51
not 0.0. In this research we say that the possible values of each variable W [i][j] lie
in {min(W [i][j]), min(W [i][j]) + 1, ..., min(W [i][j]) + h}, where min(W [i][j]) + h =
max(W [i][j]).
We use the term possible value since each logical variable by definition may assume
either the value 0 or the value 1, while each one of the word variables usually takes
values from a defined interval that depends on the process parameter that the variable
in question is mapped to. In a nuclear power plant, for example, the word variable
that is mapped to the pressure in a reactor vessel, i.e. a large cylindrical steel tank
that contains nuclear fuel, may take values that vary from 0 pound per square inch
(psi) at plant start up to a maximum value, say a little bit more than around 1005
psi, when the plant is operating at 100% thermal power.
Similarly, if the maximum synchronous speed of a 2-pole AC induction motor is, say,
1500 revolutions per minute (rpm), the applied voltage frequency, which is used by
an edge control system to directly control the actual rotational speed of such motor,
may assume values that vary from 0 Hz to 25 Hz. Furthermore, we want to accomo-
date also negative values of each variable W [i][j], since in a physical system like a
nuclear power plant several process measurement data or actuator control data can
be negative.
In this research we use stochastic vectors as practical means of storing the probability
distribution of the values of each element W [i][j] of the matrix W . The aforemen-

Chapter 4: PROBABILISTIC ESTIMATION OF DATA TRANSITION FLOWSFOR ANOMALY DETECTION 52
tioned stochastic vectors are defined as:
VW [i][j] = {
p0
p1
.
.
.
ph
| p0 + p1 + ...+ ph = 1} (4.1)
Let pk = VW [i][j][k] be the normalcy probability that W [i][j] takes the value
min(W [i][j]) + k, where k ∈ {0, 1, ..., h}. Thus, p0 = VW [i][j][0] is the normalcy
probability that W [i][j] takes the value min(W [i][j]), p1 = VW [i][j][1] is the normalcy
probability that W [i][j] takes the value min(W [i][j]) + 1, and so on. We model as
a probability mass function, say ΓW [i][j], the normal data transition flows that may
potentially be followed by each element W [i][j]. The probability mass function ΓW [i][j]
is defined as:
ΓW [i][j] : x1 X ... X xl+1 X... X xm+1 X... X xn+1 X... X xg → VW [i][j] (4.2)
The estimation part of the EI algorithm uses logistic regression integrated with max-
imum likelihood estimation in an inductive machine learning process to estimate a
series of statistical parameters, which in conjunction with logistic regression formulae
form a practical definition of the probability mass function ΓW [i][j] for each W [i][j].
The inspection part of the EI algorithm uses the probability mass function ΓW [i][j] to
estimate the normalcy probability of a specific value min(W [i][j]) + k that a network
packet is about to write to W [i][j].
Chapter 4: PROBABILISTIC ESTIMATION OF DATA TRANSITION FLOWSFOR ANOMALY DETECTION 53
4.2.2 Estimating the Statistical Parameters of Ordinal and
Dichotomous Logistic Models
As we will see later on in this subsection, an element W [i][j] may take each one
of its possible values with a probability that depends on x1, x2, ..., xg and a set of
constants denoted as, say α(s) and β(s), that in statistics are commonly referred to
as parameters. In this research the α(s) are intercept terms, while the β(s) are coef-
ficient terms. We refer to these constants as statistical parameters in order to avoid
conceptual confusion with physical process parameters. We estimate statistical pa-
rameters via applied logistic regression analysis integrated with maximum likelihood
estimation [52, 72].
The first step is to run the replica of a DCS-controlled physical system normally and
under no attacks, and thus record in a database the values of logical or word variables
in the RAM of control systems as they evolve over time. We have several individuals
run the said replica multiple times. Although in nuclear power industry reactor oper-
ator candidates are required to pass identical or similar certification exams, different
reactor operators may have different habits of changing process parameters to reach
desired operational states.
Furthermore, various process related events may be handled in different ways, all con-
sidered part of normal operation as long as they perform the desired task correctly.
What is important here is that the replica is made to generate a sample of network
packets that characterizes the population of network packets that form the normal
network operation of a DCS-controlled physical system. Refer to Section 5.6 for a
detailed discussion on how we generate the learning data set.
Chapter 4: PROBABILISTIC ESTIMATION OF DATA TRANSITION FLOWSFOR ANOMALY DETECTION 54
For each program variable modeled by an element W [i][j], we create a database view
composed of rows in the form {ϕ(W [i][j]), x1, x2, ..., xg}, where ϕ(W [i][j]) denotes the
next value of W [i][j]. ϕ(W [i][j]) is extracted from a network packet transmitted over
a process control network that is about to write W [i][j], while the record of values of
x1, x2, ..., xg is a snapshot of the current values of the elements of the matrix W right
before the said network packet changes the value of W [i][j] into a specific ϕ(W [i][j]).
Let d be the number of rows in the database view in question.
We now consider the case in which W [i][j] models a word variable. If in statistical
terms each possible value of W [i][j] is considered as an outcome category, then the
type of logistic regression applicable to the research problem under investigation is the
ordinal logistic regression since in DCS-controlled physical systems in general these
categories are ordered. In a nuclear power plant, for example, the possible values of
word variables that are mapped to process parameters such as pressure in a reactor
vessel, reactor water level, neutron population in a reactor core, steam flow rate, etc.,
are all ordered.
In ordinal logistic regression comparisons between contiguous values of a dependent
variable play a key role in the estimation of their respective probabilities of occur-
rence. Since the possible values of W [i][j] lie in [min(W [i][j]), min(W [i][j]) + h],
there are h possible comparisons between contiguous values of W [i][j]. Consequently,
always according to ordinal logistic regression, there are h intercept terms α in this
ordinal logistic model, namely α1, α2, ..., αh. There is an intercept term αk defined
for each value min(W [i][j]) + k of W [i][j] such that k 6= 0.
Later on in this subsection we will see that αk is directly used in the estimation of

Chapter 4: PROBABILISTIC ESTIMATION OF DATA TRANSITION FLOWSFOR ANOMALY DETECTION 55
the probability that W [i][j] takes the value min(W [i][j])+k. Due to a reason that we
explain later on in this subsection, there is no α0 defined for min(W [i][j]). Since the
logistic model under consideration is ordinal rather than polytomous, there is only one
coefficient term βa associated with each exposure variable xa, where a ∈ {1, 2, ..., g}.
Furthermore, there is a unique set of coefficient terms β1, β2, ..., βg defined for all val-
ues min(W [i][j]) + k of W [i][j].
As intercept term αk, the set of coefficient terms β1, β2, ..., βg is also directly used
in the estimation of the probability that W [i][j] takes the value min(W [i][j]) + k.
Given x1, x2, ..., xg, the probability that W [i][j] takes a value equal to or greater than
min(W [i][j]) + k is:
P (ϕ(W [i][j]) ≥ min (W [i][j]) + k | W ) =1
1 + e−(αk+Pga=1 βaxa)
(4.3)
In the equation given above e denotes the Euler’s constant, i.e. the base of natural
algorithm. As a matter of fact we are interested in min (W [i][j]) + k ≥ 1, since
obviously P (ϕ(W [i][j]) ≥ 0 | W ) = 1. Similarly, the probability that W [i][j] takes a
value equal to or greater than min (W [i][j]) + k + 1 given x1, x2, ..., xg is:
P (ϕ(W [i][j]) ≥ min(W [i][j]) + k + 1 | W ) =1
1 + e−(αk+1+Pga=1 βaxa)
(4.4)
Equations (4.3) and (4.4) are used to derive the probability that W [i][j] takes a value
min(W [i][j]) + k given x1, x2, ..., xg. The said probability is:
P (ϕ(W [i][j]) = min(W [i][j]) + k | W ) = P (ϕ(W [i][j]) ≥ min(W [i][j])+
k | W ) − P (ϕ(W [i][j]) ≥ min(W [i][j]) + k + 1 | W ) (4.5)

Chapter 4: PROBABILISTIC ESTIMATION OF DATA TRANSITION FLOWSFOR ANOMALY DETECTION 56
By plugging equations (4.3) and (4.4) into equation (4.5) we get:
P (ϕ(W [i][j]) = min (W [i][j]) + k | W ) =
1
1 + e−(αk+Pga=1 βaxa)
− 1
1 + e−(αk+1+Pga=1 βaxa)
(4.6)
In the specific case in which k = 0, and thus the value of W [i][j] whose probability
of occurrence is being estimated is min(W [i][j]), the minuend in equation (4.6) will
be 1 since P (ϕ(W [i][j]) ≥ min(W [i][j]) | W ) = 1. This explains why there is no α0
defined for min(W [i][j]), i.e. when k = 0. We now discuss the development of the
likelihood function LW [i][j] for an element W [i][j]. The function LW [i][j] represents
the joint probability for the likelihood of observing the data of the d rows in the
aforementioned database view. Assuming that the rows of the database view are
numbered from 1 to d, let ybk be an indicator variable defined on the b-th row as
follows:
ybk =
1 if in the b-th row ϕ(W [i][j]) = min (W [i][j]) + k
0 if in the b-th row ϕ(W [i][j]) 6= min (W [i][j]) + k
(4.7)
The joint probability for the likelihood of observing the data in the database view is:
d∏b=1
h∏k=0
P (ϕ(W [i][j]) = min (W [i][j]) + k | W )ybk (4.8)
Equation (4.8) basically estimates the individual contribution made by each row to
the probability that ϕ(W [i][j]) will be min(W [i][j])+k, and then joins the individual
likelihood contributions made by each row. Clearly each row contributes with the
probability of only one value min(W [i][j]) + k being taken by W [i][j], since only one
of the indicator variables will be equal to 1. By plugging equation (4.6) into equation
Chapter 4: PROBABILISTIC ESTIMATION OF DATA TRANSITION FLOWSFOR ANOMALY DETECTION 57
(4.8) we get:
d∏b=1
h∏k=0
(1
1 + e−(αk+Pga=1 βaxa)
− 1
1 + e−(αk+1+Pga=1 βaxa)
)ybk(4.9)
The values of exposure variables x1, x2, ..., xg in equation (4.9) are available from the
database view as each individual row is processed by this equation, therefore after
performing the multiplications of the probabilities contributed by each individual row,
the likelihood function LW [i][j] appears as a function of the statistical parameters,
namely:
LW [i][j] (α1, α2, ..., αh, β1, β2, ..., βg) (4.10)
We are interested to estimate those specific values of the statistical parameters
α1, α2, ..., αh, β1, β2, ..., βg that maximize LW [i][j]. For this purpose we now apply the
maximum likelihood technique [76]. Let us organize the parameters of the likelihood
function LW [i][j] into a vector θ = (θ1, θ2, ..., θh+g). Maximizing LW [i][j] (θ) is equivalent
to maximizing ln[LW [i][j] (θ)
]. If r ∈ {1, 2, ..., h+g}, and hence θr is the r-th element
of vector θ, the values of the statistical parameters that maximize LW [i][j] (θ) are the
solutions of a system of equations of the form:
∂ln[LW [i][j] (θ)
]∂θr
= 0 (4.11)
where the fraction is a partial derivative of the natural logarithm of the likelihood
function LW [i][j] with respect to θr. The solutions of the said system of equations
represent our estimates of the statistical parameters α1, α2, ..., αh, β1, β2, ..., βg. Armed
with the estimated values of the statistical parameters , we can return to equation
(4.6) and estimate the probability that W [i][j] takes the value min(W [i][j])+k, given
the current values of the elements of the matrix W . This is an integral component of
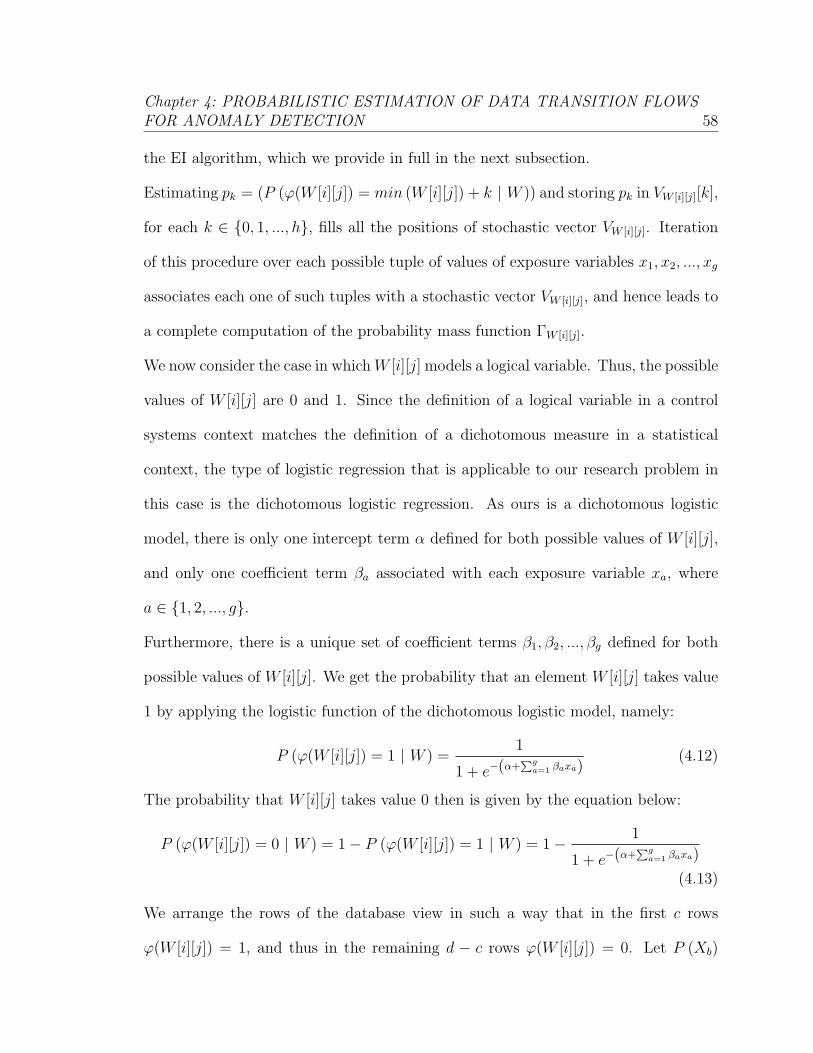
Chapter 4: PROBABILISTIC ESTIMATION OF DATA TRANSITION FLOWSFOR ANOMALY DETECTION 58
the EI algorithm, which we provide in full in the next subsection.
Estimating pk = (P (ϕ(W [i][j]) = min (W [i][j]) + k | W )) and storing pk in VW [i][j][k],
for each k ∈ {0, 1, ..., h}, fills all the positions of stochastic vector VW [i][j]. Iteration
of this procedure over each possible tuple of values of exposure variables x1, x2, ..., xg
associates each one of such tuples with a stochastic vector VW [i][j], and hence leads to
a complete computation of the probability mass function ΓW [i][j].
We now consider the case in whichW [i][j] models a logical variable. Thus, the possible
values of W [i][j] are 0 and 1. Since the definition of a logical variable in a control
systems context matches the definition of a dichotomous measure in a statistical
context, the type of logistic regression that is applicable to our research problem in
this case is the dichotomous logistic regression. As ours is a dichotomous logistic
model, there is only one intercept term α defined for both possible values of W [i][j],
and only one coefficient term βa associated with each exposure variable xa, where
a ∈ {1, 2, ..., g}.
Furthermore, there is a unique set of coefficient terms β1, β2, ..., βg defined for both
possible values of W [i][j]. We get the probability that an element W [i][j] takes value
1 by applying the logistic function of the dichotomous logistic model, namely:
P (ϕ(W [i][j]) = 1 | W ) =1
1 + e−(α+Pga=1 βaxa)
(4.12)
The probability that W [i][j] takes value 0 then is given by the equation below:
P (ϕ(W [i][j]) = 0 | W ) = 1− P (ϕ(W [i][j]) = 1 | W ) = 1− 1
1 + e−(α+Pga=1 βaxa)
(4.13)
We arrange the rows of the database view in such a way that in the first c rows
ϕ(W [i][j]) = 1, and thus in the remaining d − c rows ϕ(W [i][j]) = 0. Let P (Xb)

Chapter 4: PROBABILISTIC ESTIMATION OF DATA TRANSITION FLOWSFOR ANOMALY DETECTION 59
denote P (ϕ(W [i][j]) = 1 | W ) for the b-th row. Also in a dichotomous logistic model
the joint probability for the likelihood of observing the data in the database view is
given by a likelihood function LW [i][j], which in this case is defined as:
c∏b=1
P (Xb)d∏
b=c+1
1− P (Xb) (4.14)
Equation (4.14) estimates the individual likelihood contribution made by each row
numbered from 1 to c to the probability that W [i][j] takes value 1, along the individual
likelihood contribution made by each row numbered from c+1 to d to the probability
that W [i][j] takes value 0, and joins the individual likelihood contributions made by
each row. The values of exposure variables x1, x2, ..., xg in equation (4.14) are available
from individual rows of the database view. By performing the multiplications of the
probabilities contributed by each row we get a likelihood function LW [i][j] that is
defined as:
LW [i][j] (α, β1, β2, ..., βg) (4.15)
We are interested to estimate those specific values of the statistical parameters
α, β1, β2, ..., βg that maximize LW [i][j], and do so via maximum likelihood estimation.
We apply the unconditional likelihood technique rather than the conditional one
since the number of statistical parameters in the model is usually small relative to
the number of rows in the database view. Furthermore, the conditional likelihood
technique does not allow for estimating the intercept term α, which, as may be seen
from equation (4.12) and equation (4.13), is quite indispensable to the estimation of
the probability that W [i][j] takes value 1 and 0, respectively.
If we denote the parameters of the likelihood function LW [i][j] as θ = (θ1, θ2, ..., θg+1),
then the values of the statistical parameters that maximize LW [i][j] (θ) are the solu-
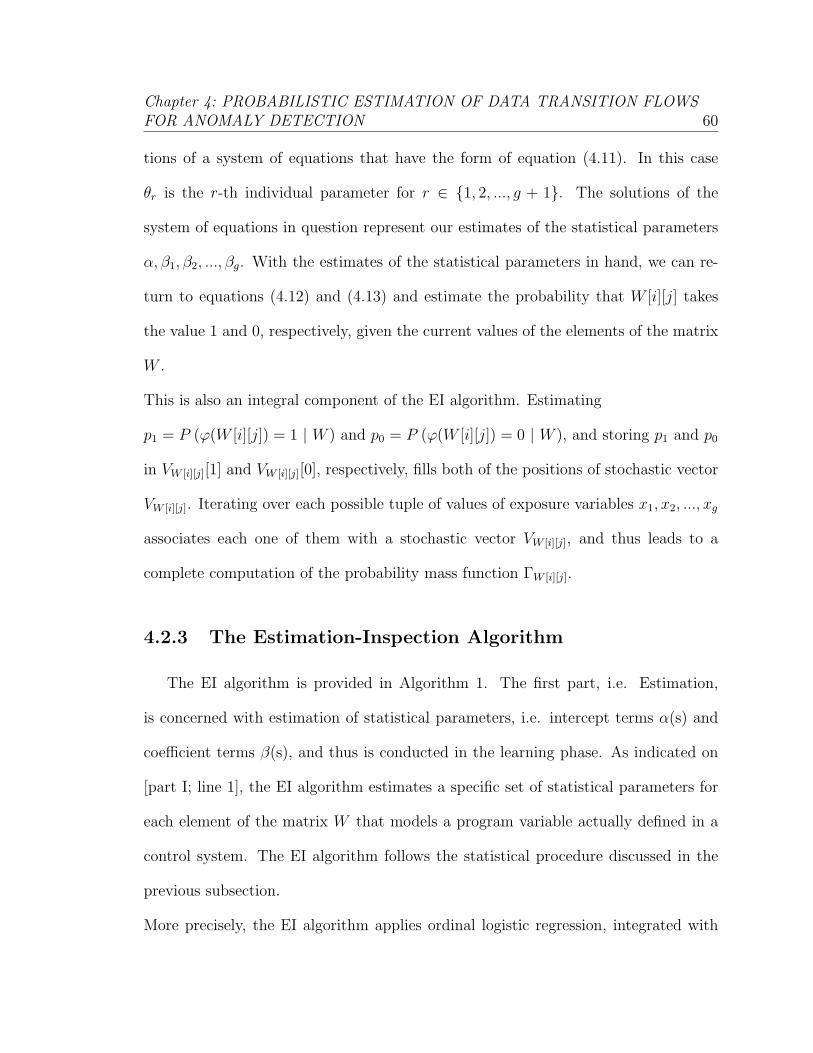
Chapter 4: PROBABILISTIC ESTIMATION OF DATA TRANSITION FLOWSFOR ANOMALY DETECTION 60
tions of a system of equations that have the form of equation (4.11). In this case
θr is the r-th individual parameter for r ∈ {1, 2, ..., g + 1}. The solutions of the
system of equations in question represent our estimates of the statistical parameters
α, β1, β2, ..., βg. With the estimates of the statistical parameters in hand, we can re-
turn to equations (4.12) and (4.13) and estimate the probability that W [i][j] takes
the value 1 and 0, respectively, given the current values of the elements of the matrix
W .
This is also an integral component of the EI algorithm. Estimating
p1 = P (ϕ(W [i][j]) = 1 | W ) and p0 = P (ϕ(W [i][j]) = 0 | W ), and storing p1 and p0
in VW [i][j][1] and VW [i][j][0], respectively, fills both of the positions of stochastic vector
VW [i][j]. Iterating over each possible tuple of values of exposure variables x1, x2, ..., xg
associates each one of them with a stochastic vector VW [i][j], and thus leads to a
complete computation of the probability mass function ΓW [i][j].
4.2.3 The Estimation-Inspection Algorithm
The EI algorithm is provided in Algorithm 1. The first part, i.e. Estimation,
is concerned with estimation of statistical parameters, i.e. intercept terms α(s) and
coefficient terms β(s), and thus is conducted in the learning phase. As indicated on
[part I; line 1], the EI algorithm estimates a specific set of statistical parameters for
each element of the matrix W that models a program variable actually defined in a
control system. The EI algorithm follows the statistical procedure discussed in the
previous subsection.
More precisely, the EI algorithm applies ordinal logistic regression, integrated with

Chapter 4: PROBABILISTIC ESTIMATION OF DATA TRANSITION FLOWSFOR ANOMALY DETECTION 61
maximum likelihood estimation, on a learning data set to estimate the intercept terms
and the coefficient terms of the ordinal logistic model developed for an element of the
matrix W that models a word variable [part I; lines 2-4]. The EI algorithm applies
dichotomous logistic regression, integrated with maximum likelihood estimation, on
a learning data set to estimate the intercept term and the coefficient terms of the
dichotomous logistic model developed for an element of the matrix W that models a
logical variable [part I; lines 5-7].
The second part of the EI algorithm, i.e. Inspection, is concerned with scrutiniz-
ing network packets that flow across a process control network. When assessing the
normalcy of a network packet, the EI algorithm conducts its statistical analysis in
relation to each variable that is being written by the network packet currently under
inspection [part II; line 3]. The EI algorithm checks whether the program variable
that is being written by the network packet under inspection is a word variable [part
II; line 4] or a logical variable [part II; line 8, 10].
This information in conjunction with the value of index k derived in [part II; line 4]
is used to identify (1) the type of logistic model, and hence the corresponding logistic
regression formula, that is applicable to the network packet under inspection, (2) the
intercept terms α(s) and coefficient terms β(s) of the applicable logistic model defined
for the variable being written.
If the program variable that is being written is a word variable, the EI algorithm plugs
the intercept terms α(s) and coefficient terms β(s) along with the current values of
exposure variables x1, x2, ..., xg into the formula of the ordinal logistic model, with
the result being an estimate of the normalcy probability of the specific value that
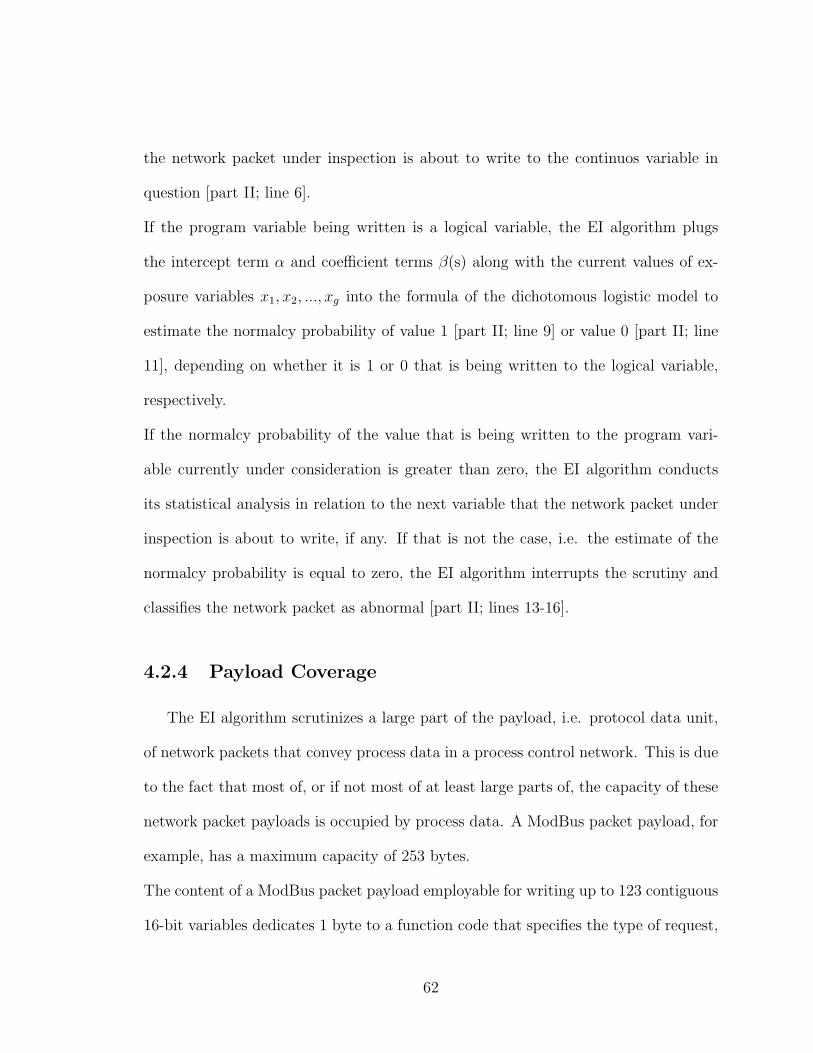
the network packet under inspection is about to write to the continuos variable in
question [part II; line 6].
If the program variable being written is a logical variable, the EI algorithm plugs
the intercept term α and coefficient terms β(s) along with the current values of ex-
posure variables x1, x2, ..., xg into the formula of the dichotomous logistic model to
estimate the normalcy probability of value 1 [part II; line 9] or value 0 [part II; line
11], depending on whether it is 1 or 0 that is being written to the logical variable,
respectively.
If the normalcy probability of the value that is being written to the program vari-
able currently under consideration is greater than zero, the EI algorithm conducts
its statistical analysis in relation to the next variable that the network packet under
inspection is about to write, if any. If that is not the case, i.e. the estimate of the
normalcy probability is equal to zero, the EI algorithm interrupts the scrutiny and
classifies the network packet as abnormal [part II; lines 13-16].
4.2.4 Payload Coverage
The EI algorithm scrutinizes a large part of the payload, i.e. protocol data unit,
of network packets that convey process data in a process control network. This is due
to the fact that most of, or if not most of at least large parts of, the capacity of these
network packet payloads is occupied by process data. A ModBus packet payload, for
example, has a maximum capacity of 253 bytes.
The content of a ModBus packet payload employable for writing up to 123 contiguous
16-bit variables dedicates 1 byte to a function code that specifies the type of request,
62

Chapter 4: PROBABILISTIC ESTIMATION OF DATA TRANSITION FLOWSFOR ANOMALY DETECTION 63
Algorithm 1 Assess the normalcy of a network packet payload
1: for all W [i][j] that models a program variable that is defined do
2: if W [i][j] models a word variable then
3: estimate the associated statistical parameters α1, α2, ..., αh, β1, β2, ..., βg via
ordinal logistic regression and maximum likelihood estimation
4: end if
5: if W [i][j] models a logical variable then
6: estimate the associated statistical parameters α, β1, β2, ..., βg via dichoto-
mous logistic regression and maximum likelihood estimation
7: end if
8: end for

Chapter 4: PROBABILISTIC ESTIMATION OF DATA TRANSITION FLOWSFOR ANOMALY DETECTION 64
1: U ⇐ payload
2: Norm⇐ true
3: for all W [i][j] such that ϕ(W [i][j]) ∈ U do
4: k ⇐ ϕ(W [i][j])−min(W [i][j])
5: if W [i][j] models a word variable then
6: pk ⇐ 1
1+e−(αk+
Pga=1 βaxa)
− 1
1+e−(αk+1+
Pga=1 βaxa)
7: end if
8: if W [i][j] models a logical variable and k = 1 then
9: pk ⇐ 1
1+e−(α+
Pga=1 βaxa)
10: else if W [i][j] models a logical variable and k = 0 then
11: pk ⇐ 1− 1
1+e−(α+
Pga=1 βaxa)
12: end if
13: if pk = 0.0 then
14: Norm⇐ false
15: break for loop
16: end if
17: end for
18: return Norm
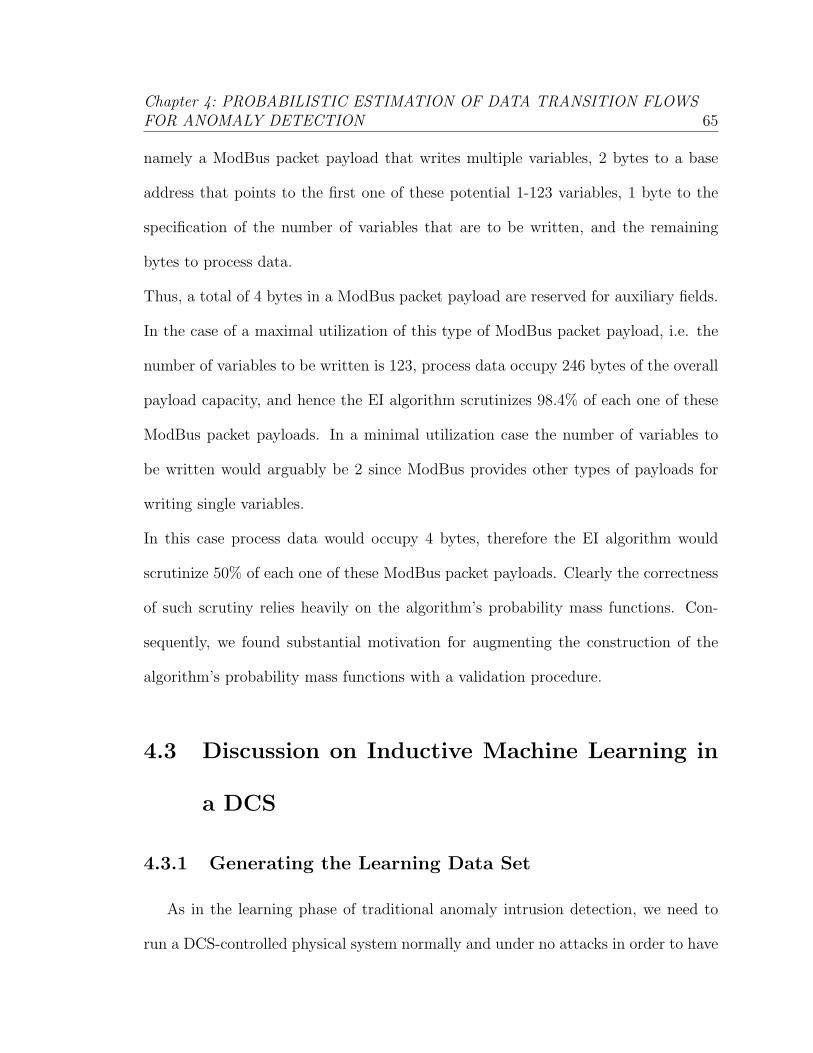
Chapter 4: PROBABILISTIC ESTIMATION OF DATA TRANSITION FLOWSFOR ANOMALY DETECTION 65
namely a ModBus packet payload that writes multiple variables, 2 bytes to a base
address that points to the first one of these potential 1-123 variables, 1 byte to the
specification of the number of variables that are to be written, and the remaining
bytes to process data.
Thus, a total of 4 bytes in a ModBus packet payload are reserved for auxiliary fields.
In the case of a maximal utilization of this type of ModBus packet payload, i.e. the
number of variables to be written is 123, process data occupy 246 bytes of the overall
payload capacity, and hence the EI algorithm scrutinizes 98.4% of each one of these
ModBus packet payloads. In a minimal utilization case the number of variables to
be written would arguably be 2 since ModBus provides other types of payloads for
writing single variables.
In this case process data would occupy 4 bytes, therefore the EI algorithm would
scrutinize 50% of each one of these ModBus packet payloads. Clearly the correctness
of such scrutiny relies heavily on the algorithm’s probability mass functions. Con-
sequently, we found substantial motivation for augmenting the construction of the
algorithm’s probability mass functions with a validation procedure.
4.3 Discussion on Inductive Machine Learning in
a DCS
4.3.1 Generating the Learning Data Set
As in the learning phase of traditional anomaly intrusion detection, we need to
run a DCS-controlled physical system normally and under no attacks in order to have
Chapter 4: PROBABILISTIC ESTIMATION OF DATA TRANSITION FLOWSFOR ANOMALY DETECTION 66
it exhibit its normal behavior in terms of network packets that are transmitted over
the associated process control network. Our experience with this research indicates
that an appropriate way of implementing the learning phase is to use a hybrid replica
of the real DCS-controlled physical system. The hybrid replica is to be formed by
both real and simulated elements, and is required to strictly resemble the real DCS-
controlled physical system.
The cyber side of the hybrid replica is to be formed by genuine control systems and
networks that possibly are to be identical to the control systems and networks in the
real DCS-controlled physical system, respectively. Furthermore, system and network
configurations in the hybrid replica are a copy of the system and network configu-
rations deployed on the cyber side of the real DCS-controlled physical system. Real
world DCS like General Electric’s Mark VIe or OC 4000 would be ideal as the cyber
side of the hybrid replica.
Nevertheless, as of the time this research was conducted we didn’t have access to a
DCS that is deployed in real world power plants, and thus constructed a DCS com-
prised of ModBus speaking MatPLC systems. The majority of that part of the hybrid
replica that corresponds to the physical side of the real DCS-controlled physical sys-
tem is to be simulated. Given the individual nature of this research, we conducted a
continuous simulation of only a limited part of an ABWR, namely a simplified version
of the rod motion and water injection control mechanisms along with a small portion
of reactor physics.
The rationality behind using a hybrid replica for learning the normal behavior of a
DCS-controlled physical system rather than the DCS-controlled physical system itself
Chapter 4: PROBABILISTIC ESTIMATION OF DATA TRANSITION FLOWSFOR ANOMALY DETECTION 67
is formed of a variety of reasons. Gathering training data that are to be used during
the learning phase involves either installing additional code in each control system in
order to copy values of variables from RAM memory as they evolve, or tapping into
control networks and fieldbus networks in order to sniff process control traffic, which
is then used to reconstruct values of variables in the RAM memory of each control
system.
In a DCS-controlled physical system such as a nuclear power plant in production the
aforementioned system or network interventions may be quite constrained by safety
procedures. Training data that characterize temporary perturbations of critical pro-
cess parameters certainly are not immediately available in a DCS-controlled physical
system in production. Learning about transients in a nuclear power plant in produc-
tion, for example, requires gathering or reconstructing values of variables in RAM
memory as transients occur.
Further, variations in transient severity also need to be taken into account in the
learning phase. Generally it may take some time before a DCS-controlled physical
system transitions between various operational states. For example, it may take some
time before a nuclear power plant transitions from 20% thermal power to 40% ther-
mal power and then to 100% thermal power, depending on the demands of the overall
electric power distribution network. If we’re interested in initialization conditions, it
may also take time before a nuclear power plant is shut down and then is restarted
again. Learning the effects of depletion of consumable physical elements on data
transition flows in a real DCS-controlled physical system is also an issue.
In a nuclear power plant, for example, the concentration of nuclear fuel decreases
Chapter 4: PROBABILISTIC ESTIMATION OF DATA TRANSITION FLOWSFOR ANOMALY DETECTION 68
with time due to the fission process. This has a direct affect on a series of process
parameters, and hence on logical or word variables in control systems due to a cyber-
physical mapping in place. Consumption of nuclear fuel continues throughout the
operation of a nuclear power plant until it is time for refueling the reactor. If we’re
interested in developing classifiers that are fully aware of the slow effects of gradual
nuclear fuel consumption on data transition flows, then we have to gather data for a
period that extends to the lifetime of a nuclear fuel load in the reactor, i.e. usually
many months.
For instance, in a General Electric reactor designed according to what is known as
a BWR-4 model, the lifetime of a nuclear fuel load is about 18 months under the
assumption that the reactor operates at full thermal power with few interruptions [1].
In a hybrid replica of a DCS-controlled physical system to be protected, RAM mem-
ory monitoring code can be safely installed in each control system, and sniffing tools
can also be safely tapped into control networks and fieldbus networks. In a hybrid
replica temporary perturbations of critical process parameters, such as transients in
nuclear power plants, can be easily emulated at all possible severities.
These emulations enable the anomaly detection system to be able to estimate data
transition flows that have the potential to be followed by logical or word variables in
the RAM memory of control systems when a DCS-controlled physical system to be
protected is subject to these operationally abnormal events. A hybrid replica can be
quickly brought to various states, and hence be transitioned between them. A hybrid
replica can also be shut down and restarted quickly. The aforementioned maneuvers
generate statistical data that allow for reproducing the behavior in terms of data
Chapter 4: PROBABILISTIC ESTIMATION OF DATA TRANSITION FLOWSFOR ANOMALY DETECTION 69
transition flows that a DCS-controlled physical system exhibits when it is in initial-
ization conditions, or as it transitions between various possible operational states.
The simulator part of a hybrid replica can be used to simulate in an accelerated way
the depletion of consumable physical elements such as nuclear fuel, and thus allow for
the anomaly detection system to learn the effects that this physical phenomenon has
on data transition flows in a real DCS-controlled physical system. Please notice that,
as the statistical intrusion detection provided in this dissertation is based on logistic
regression, its learning procedure does not require the whole population of network
packets that characterize a normal network operation of a DCS-controlled physical
system. In other words, our algorithm does not need to be presented with all possible
normal flows of values of a logical or word variable.
We only need to generate through the hybrid replica a sample of the said population.
This sample does suffice for our algorithm to produce maximum-entropy classifiers
that can process all possible network packets, and hence determine the normalcy or
abnormalcy of any flows of values of any logical or word variables. This is, again, due
to the kind of statistical foundation of our algorithm, namely logistic regression, which
can estimate statistical parameters that hold for a whole population even though the
regression is applied only on a sample of the said population.
In [81], Mahoney and Chan report some limitations of the simulated normal network
traffic gathered in the IDEVAL datasets [44] and used as a benchmark for evaluating
anomaly intrusion detection systems. Mahoney and Chan have found that IDEVAL
data are excessively predictable and clean, and that several successful intrusion detec-
tions in IDEVAL are due to certain details of the network simulation process. Based

Chapter 4: PROBABILISTIC ESTIMATION OF DATA TRANSITION FLOWSFOR ANOMALY DETECTION 70
on their research in [81], Mahoney and Chan believe that Internet traffic is too com-
plex to be accurately simulated, while computer network attacks can be simulated
correctly. Consequently they propose to use real rather than simulated network traffic
as training data, while continuing to use data gathered from simulated attacks for
testing anomaly intrusion detection systems.
The findings of Mahoney and Chan do not directly affect our approach of generating
a learning data set since we use genuine control systems and networks, and hence real
network traffic, for inductive machine learning. In our mind though their research
raises some concerns whether the continuous simulation of a physical system resem-
bles the said physical system to a degree that is sufficient not to negatively affect
the learning process. We believe that a further study similar to that of Mahoney
and Chan is needed to validate the usability of network traffic generated via a hybrid
replica to learn profiles of normal behavior of the corresponding real cyber-physical
system. We leave this study as a future work since as of this writing we do not have
access to a data set gathered from the process control network of a real nuclear power
plant, which is the physical system of reference in our research.
4.3.2 Handling Black Swan Events
The maximum-entropy classifiers produced by the statistical intrusion detection
algorithm are trained to be capable of dealing with data transition flows that are
exclusively due to black swan events. Black swan events are large-impact, hard-to-
predict, and rare events that lie beyond the realm of normal expectations [111]. In
nuclear power plants we identify as black swan events any events such as electric, me-

Chapter 4: PROBABILISTIC ESTIMATION OF DATA TRANSITION FLOWSFOR ANOMALY DETECTION 71
chanical, or electronic faults in plant equipment, breakages, etc., that have potential
for causing transients and accidents of any level of gravity.
Transients are abnormal events that can cause temporary perturbations of critical
process parameters of a DCS-controlled nuclear power plant. Transients in general
trigger a corrective response by control systems. An example of a transient is an event
in which at a high power level a feed water pump experiences dysfunction due to some
fault, with the consequence being a rapid drop in reactor water level. The correc-
tive response taken by control systems consists in reducing reactor thermal power
by inserting control rods, i.e. rods that contain the element boron and as such add
negative reactivity by absorbing neutrons.
Accidents in a nuclear power plant are events that have potential for breaking the
protective measures designed to prevent release of radioactive material. We have
simulated a series of computer network attacks on the MatPLCs of the previously
described DCS, and thus noticed the following: the data transition flows that are
followed by logical or word variables in the RAM variable memory of compromised
control systems as a successful attack tends to reach its ultimate objective, namely
cause physical damage, are identical to the data transition flows followed by these
variables when transients or accidents occur.
This is obvious since causations of physical damage by attacks over the network may
be considered as intentional transients or accidents, respectively. What we meant
with dealing with data transition flows that are exclusively due to black swan events
is to generate maximum-entropy classifiers which do not classify transients and ac-
cidents as computer network attacks, and which do not classify as transients and
Chapter 4: PROBABILISTIC ESTIMATION OF DATA TRANSITION FLOWSFOR ANOMALY DETECTION 72
accidents those computer network attacks that are stealth enough to masquerade as
transients and accidents, respectively.
In order to generate maximum-entropy classifiers with the said capability, we do in-
clude in the learning data set values of logical or word variables that characterize
transients and accidents, relying on the distinction between causation and reporting.
In the learning phase we absolutely do not allow the transmission of any network
packets that are not part of a normal network operation of a DCS-controlled power
plant, while still allowing for a power plant to be in abnormal conditions in conjunc-
tion with network packets that cause evolutions of values of logical or word variables
that characterize a recovery.
In other words, the statistical intrusion detection algorithm is not presented with net-
work packets that will force the power plant to precipitate into abnormal conditions,
but still the maximum-entropy classifiers are taught how to recognize evolutions of
logical or word variables that characterize corrective responses taken by control sys-
tems to normalize the plant conditions. The statistical intrusion detection algorithm
is capable of recognizing black swan events, and hence does not report them as anoma-
lies. Furthermore, the statistical intrusion detection algorithm classifies as abnormal
all those network packets that have potential for causing black swan events.
4.4 Probabilistic Validation
The EI algorithm’s effectiveness to estimate probability mass functions that per-
mit only normal evolutions of values of logical or word variables in the RAM variable
memory of control systems is validated via modeling and simulation. For the said

Chapter 4: PROBABILISTIC ESTIMATION OF DATA TRANSITION FLOWSFOR ANOMALY DETECTION 73
purpose we develop validation models based on the stochastic activity network for-
malism (SAN) [102, 104], which thereafter are solved via the Mobius tool [25]. We
opted for a simulation-based validation because of a variety of reasons.
Clearly a data set that is comprised of network packets sniffed from the process con-
trol network of a real world DCS-controlled physical system like a nuclear power
plant in operation would have been an excellent evaluation benchmark for assessing
whether the EI algorithm classifies as normal each single network packet of the said
data set. Nevertheless, access for experimentation purposes to a real world DCS con-
trolled physical system in operation normally is not available.
At least we as academic researchers, as of the time this research was conducted,
haven’t had feasible means of acquiring real world process control network traffic on
which to base the validation of the EI algorithm, nor are we aware of the existence
of such a data set. Furthermore, clearly the data set that fed the inductive machine
learning phase is not appropriate for validating the maximum-entropy classifiers.
A real world DCS-controlled physical system like a power plant in operation may
exhibit only a subset of the data transition flows that form its normal behavior.
Demonstrating the EI algorithm’s effectiveness on a limited number of data transi-
tion flows is only a partial validation of the algorithm in question. Clearly a power
plant cannot be operated in such a way as to generate a thorough data set usable for
validation purposes.
In other words, it may not be feasible to dedicate the operation of a real world power
plant in operation to an algorithm validation procedure. Even more unreachable ap-
pears to be the access to a data set which includes network packets that are part of a
Chapter 4: PROBABILISTIC ESTIMATION OF DATA TRANSITION FLOWSFOR ANOMALY DETECTION 74
computer network attack on a real world DCS-controlled nuclear power plant, which
is our reference physical system in this research.
Although such data set would have been a valuable instrument to validate the detec-
tion capability of the EI algorithm, we believe that several concerns may apply to its
being publicly available due to its relevance to national security. The employment
of modeling and simulation for validation purposes is common in environments in
which experimentation with real world equipment and/or physical phenomena is not
available or feasible.
An argument for advocating the rationality behind using simulation to validate our
statistical intrusion detection algorithm is a parallelism between the said algorithm
and conflict detection algorithms that are used in airborne collision avoidance sys-
tems. While a conflict detection algorithm aims at detecting collision conditions that
threaten the safety of flying aircraft, the EI algorithm aims at detecting abnormal
network communication conditions that threaten the safety of a DCS-controlled phys-
ical system like a power plant.
Most importantly, creating real collision conditions to validate the effectiveness of a
conflict detection algorithm is dangerous in the same way as it is to conduct real com-
puter network attacks on a real world power plant to validate the effectiveness of an
intrusion detection algorithm devised for operation in process control networks. As
can be derived from the review of conflict detection algorithms conducted by Thomas
et al. in [113], simulation is a major instrument for validating the effectiveness of
such algorithms.
Chapter 4: PROBABILISTIC ESTIMATION OF DATA TRANSITION FLOWSFOR ANOMALY DETECTION 75
4.4.1 Stochastic Activity Networks with Activity-Marking
Oriented Reward Structures
An activity network [102, 104] is a generalized Petri net [93]. It can be defined
as an eight-tuple: AN = (T,E, I, O, ζ, η, i, o). In this definition T is a finite set of
places, which in a graphical representation are denoted by circles. As in a Petri net,
places hold tokens, which indicate the value or state of a place. The distribution of
tokens among all the places in an activity network is called a marking. Thus, the
marking of an activity network is a function µT : T → N. If S is a set such that
S ⊂ T and S 6= ∅, then a specific marking of S is called a partial marking and is
formed by the function µS : S → N.
The set of possible markings of S is comprised of the set of functions MS = {µS |
µS : S → N}. In the activity network definition, E is a finite set of activities, i.e.
transitions that model activities of a system being modeled. Each activity has one
or more cases, which are used to indicate a possible action that may be taken upon
the completion of the activity. Cases are denoted by small circles on the right side
of activities. Activities are of two kinds, namely timed activities and instantaneous
activities.
Timed activities are transitions that have non-negligible durations, while instanta-
neous activities complete in a negligible amount of time. In a graphical representation
timed activities and instantaneous activities are denoted by thick bars and thin bars,
respectively. I is a finite set of input gates, which connect places to activities. An
input gate is a triple ig = (G, e, f), in which G ⊆ T is a set of input places that are
associated with the input gate ig, e : MG → {0, 1} is the enabling predicate of the
Chapter 4: PROBABILISTIC ESTIMATION OF DATA TRANSITION FLOWSFOR ANOMALY DETECTION 76
said input gate, and f : MG →MG is the input function of the gate.
An input gate ig = (G, e, f) is said to hold in the marking µT if e (µG) = 1. In a
graphical representation input gates are denoted by triangles that point to the left.
An activity is said to be enabled when all of the input gates that are connected to
the said activity hold. O is a finite set of output gates, which connect activities to
places. An output gate is a pair og = (G, f), in which G ⊆ T is a set of output places
that are associated with the output gate og, and f is the output function of the said
gate and is defined as f : MG →MG.
In a graphical representation output gates are denoted by triangles that point to the
right. In the activity network definition, ζ is a function that specifies the number
of cases for each activity, and thus is defined as ζ : E → N+. η is a function that
indicates for each activity whether it is timed or instantaneous, and is defined as
η : E → {Timed, Instantaneous}. i is a function that specifies which input gates are
connected to which activity. It is defined as i : I → E.
o is a function that connects output gates to cases of activities. It is defined as
o : O → {(a, c)}, where a is an activity and c is a case of the activity a. Stochastic
activity networks (SANs) are a stochastic extension to activity networks. The said
extension lies in activity time distribution functions and activity case distribution
functions. An activity time distribution function probabilistically specifies the dura-
tion of a timed activity to which it is assigned. An activity case distribution function
assigned to an activity with more than one case specifies the probability distribution
of those cases, i.e. for each case the function in question specifies the probability that
the said case will be selected.
Chapter 4: PROBABILISTIC ESTIMATION OF DATA TRANSITION FLOWSFOR ANOMALY DETECTION 77
The overall behavior of a SAN is formed by enabling of activities, completion of ac-
tivities, selection of activity cases, and changes in markings. Reward variables in a
SAN are organized according to their reward structure type, category within a re-
ward structure type, and variable type [103, 104]. The reward structure type that is
applied to validate the algorithm is the activity-marking oriented reward structure
[103, 104]. An activity-marking oriented reward structure is a set of functions that
quantify impulse rewards, i.e. benefits associated with completion of defined activi-
ties, and functions that quantify rates of reward, i.e. benefits associated with defined
numbers of tokens in defined places.
The former functions are of the form C : E → R, in which if a ∈ E, C (a) is the
impulse reward gained by the completion of a. The latter functions are of the form
R : Υ → R, where Υ is the set of partial markings. If µ ∈ Υ, then R (µ) is the rate
of reward gained when the partial marking µ is reached. The category within the
activity-marking oriented reward structure that is of our interest is the interval-of-
time category. The variable type in the said category that we apply in this research is
the one that represents the total reward accumulated during a defined time interval
∆t.
4.4.2 Construction and Solution of Validation Models based
on Stochastic Activity Networks
As we have in hand a probabilistic characterization of the evolutions of values
of elements of the matrix W, namely probability mass functions, clearly from the
EI algorithm’s perspective our dynamic system exhibits a stochastic behavior. We
Chapter 4: PROBABILISTIC ESTIMATION OF DATA TRANSITION FLOWSFOR ANOMALY DETECTION 78
model the said dynamic system as a SAN, and thus have the behavior of the SAN
model correspond with the normal behavior of the dynamic system, and hence with
the normal behavior of the whole cyber-physical system. By doing so we gain the
opportunity to check whether the said dynamic system evolves into specific states
that are indicative of conditions that are not created throughout a normal operation
of a DCS-controlled physical system.
Conversely, if the dynamic system in question evolves only between states that charac-
terize a normal operation of a DCS-controlled physical system, we can gain confidence
that the EI algorithm indeed estimates probability mass functions that do not allow
a DCS-controlled physical system to be taken to abnormal conditions. The elements
of the matrix W are in turn modeled as elements of T , i.e. places, and thus the values
of the elements of the matrix W are modeled as tokens in places. Let S be the set of
places that model discrete input variables, input register variables, and those holding
register variables and coil variables that are used to store measurement data or data
produced by computations on measurement data.
An example of the latter data in a nuclear power plant is thermal power, which is
computed upon neutron population measurements that are received over a fieldbus
network from a large number of sensors distributed within the reactor core. MS, i.e.
the set of possible markings of S, may be defined as MS = MSn ∪MSa , where MSn
is the set of possible markings of S that represent normal conditions of the physical
process, while MSa is the set of possible markings of S that represent abnormal con-
ditions of the physical process.
Thus, the normal behavior of the physical process is comprised of evolutions between
Chapter 4: PROBABILISTIC ESTIMATION OF DATA TRANSITION FLOWSFOR ANOMALY DETECTION 79
{µS | µS ∈ MSn}, while the abnormal behavior of the physical process involves an
evolution into any {µS | µS ∈ MSa}. Let Q = T − S be the set of places that
model coil variables and holding register variables that are used to store set points
and actuator control values. Let MQ denote the possible markings of Q. ∀µS ∈MSn ,
MQ = MQn ∪ MQa relative to µS, where MQn and MQa are comprised of all those
partial markings in MQ that cause an evolution of µS into a marking of S that lies
in MSn and MSa , respectively.
The evolutions of values of each W [i][j] which models a program variable that is used
to store set points or actuator control values are themselves modeled as an activity,
say aW [i][j]. In other words, the evolutions of numbers of tokens in each one of the
places in Q are modeled as an activity. Many of the evolutions of values of program
variables that are used to store set points and actuator control values, which we model
as activities, have non-negligible durations.
The said durations though depend on factors whose prediction lies outside our prob-
lem domain. In a nuclear power plant, for example, the duration of a specific evolution
of values of program variables that is caused by a transition of the plant from 40%
thermal power to, say, 42% thermal power depends on the demands of the overall
electric power distribution network. If thermal power in a plant is currently 40% and
due to some reasons the demand for electric power increases, then an operator will
quickly transition the plant from 40% thermal power to 42% thermal power, and so
on.
If the demand for electric power remains constant for an undetermined amount of
time, then an operator may keep the plant at 40% thermal power for a while until
Chapter 4: PROBABILISTIC ESTIMATION OF DATA TRANSITION FLOWSFOR ANOMALY DETECTION 80
the demand for electric power increases. Clearly the duration of the said evolution
is quite variable from case to case, and thus a precise estimation of the duration in
question is not available. As another example, consider the automatic response initi-
ated by control systems in a nuclear power plant upon sensing of a fault condition in
an electrical generator.
The said response is comprised of opening the generator output breaker, closing the
turbine steam admission valves, and opening the turbine bypass valve. Estimating
the duration, or rate, of any of the evolutions of values of program variables that are
caused by the response in question is equivalent to estimating the failure rate of the
electrical power generator. The activities in the validation models are defined to be
instantaneous. We deem that this modeling choice does not affect the correctness of
the validation procedure.
SANs with activity-marking oriented reward structures traditionally are used to de-
termine measures of time-dependent concepts, like performance along with queueing
time, steady-state and interval availability, reliability over a defined amount of time,
etc. In the validation procedure we are only interested in assessing whether the evo-
lutions modeled by activities have potential for taking the aforementioned dynamic
system into particular states that are indicative of unsafe and abnormal conditions,
regardless of the time. Furthermore, in SAN modeling the duration of each activity
is normally considered relative to a variable being measured [102].
The case distribution function of an activity aW [i][j] is exactly the probability mass
function ΓW [i][j]. Let ΓW [i][j] as applied in a validation model based on a SAN be
referred to as SAN-ΓW [i][j]. The domain of SAN-ΓW [i][j] is comprised of all possible

Chapter 4: PROBABILISTIC ESTIMATION OF DATA TRANSITION FLOWSFOR ANOMALY DETECTION 81
markings of T . Being identical to ΓW [i][j], SAN-ΓW [i][j] produces in output a stochastic
vector for each individual marking of T , with the extension that each probability in
the stochastic vector is assigned to a case of the activity in question.
Thus, for each activity aW [i][j] in a validation model we have ζ(aW [i][j]
)= h + 1.
These cases are sequentially numbered from min(W [i][j]) to min(W [i][j]) + h, i.e.
max(W [i][j]). The probability pk, i.e. the value stored at index k of the stochastic
vector produced by SAN-ΓW [i][j], is assigned to the (min(W [i][j]) + k)-th case of the
activity aW [i][j]. Let εW [i][j] denote a place that models W [i][j] in the validation mod-
els. Selection of the (min(W [i][j]) + k)-th case of an activity aW [i][j] denotes the fact
that the number of tokens in εW [i][j] is transitioning to min(W [i][j]) + k.
In a validation model, the set of places T is connected to an activity aW [i][j] via an
input gate igW [i][j] = (G, e, f). Thus, for each W [i][j] that is modeled by one of the
places in Q, we have i : igW [i][j] → aW [i][j]. The set of input places G is defined as
G = T . The enabling predicate e applies SAN-ΓW [i][j] on the current marking of T in
order to compute a stochastic vector, and thereafter sequentially searches in the said
vector for any pk > 0.0.
If the said enabling predicate finds at least one pk > 0.0, then it returns 1, otherwise it
returns 0. In other words, an input gate igW [i][j] holds, and hence enables an activity
aW [i][j], only if the current marking of T is deemed to allow for a normal transition of
the number of tokens in εW [i][j]. In the input gate definition, the input function f is
an identity function. Each case min(W [i][j]) + k of an activity aW [i][j] is connected to
an output gate, say ogMin+kW [i][j] = (G, f). Thus, for each W [i][j] that is modeled by one
of the places in Q, we have o : ogMin+kW [i][j] →
(aW [i][j],min (W [i][j]) + k
).

Chapter 4: PROBABILISTIC ESTIMATION OF DATA TRANSITION FLOWSFOR ANOMALY DETECTION 82
Let SW [i][j] ⊂ S be the set of places which model program variables that are af-
fected by values of W [i][j] according to some physics or chemistry equations. In each
ogMin+kW [i][j] , G = SW [i][j] ∪ εW [i][j]. While function f sets the number of tokens in εW [i][j]
to min(W [i][j]) + k, and the number of tokens in each place in SW [i][j] to set a value
that is calculated via the said equations, where W [i][j] is taken as min(W [i][j]) + k.
Figure 4.1: Typical architecture of a SAN model developed for testing a set of stochas-tic vectors produced by a probability mass function.
Overall, the behavior of these SANs represents the behavior of a cyber-physical sys-
tem considered in its entirety, such as for example a digitally controlled nuclear power
plant along with its associated process control networks, as enforced by the EI algo-
Chapter 4: PROBABILISTIC ESTIMATION OF DATA TRANSITION FLOWSFOR ANOMALY DETECTION 83
rithm. The question that we are interested to ask is the following: is there an activity
that causes a change in the marking of the SANs in question such that the new partial
marking of S results to be an element of MSa ?
For being able to respond to the said question, in the Mobius tool we define a se-
ries of rates of reward variables of the interval-of-time category that intercept all
{µS | µS ∈ MSa}. The SANs are then solved for very large ∆t. In the estimates
computed via solutions of the SANs in question the reward accumulated by the said
rates of reward variables is 0.0, which means that the partial marking of S never
evolved into any {µS | µS ∈ MSa}. The typical architecture of a validation model
based on a SAN is depicted in Figure 4.1.
Chapter 5
PROCESS AWARE
SPECIFICATION-BASED
DETECTION
5.1 Introduction
Experimental evaluations of specification-based intrusion detection indicate that
this approach is efficient in detecting known and unknown attacks [114]. Furthermore,
it is capable of maintaining a very low rate of false positives [114]. More precisely,
in [114] Uppuluri and Sekar report experiments with specification-based detection
whose outcome is 0 false alarms in both online and offline testing. Nevertheless,
specification-based intrusion detection is not as effective as anomaly intrusion detec-
tion in detecting unknown attacks [106].
Ever since specification-based intrusion detection was first introduced in [74, 107],
84
Chapter 5: PROCESS AWARE SPECIFICATION-BASED DETECTION 85
little progress has been made in enhancing its detection capabilities, and hence make
these capabilities comparable to those of anomaly intrusion detection with regard to
detection of unknown attacks. The problem lies in attacks whose manifestations are
compliant with manually developed specifications of normal behavior. In a process
control network this problem takes the form of malicious network packets that are
capable of passing all tests of model-based intrusion detection [4].
Sekar et al. in [106] address this problem in its original form by combining specification-
based detection with anomaly detection. For each host or router in a network, Sekar
et al. developed specifications of normal network traffic that is received or transmit-
ted by the modeled host or router, respectively. Sekar et al. derive specifications of
normal network traffic from requests for comments (RFCs) or other descriptions of
communication protocols, and thus represent these specifications as extended finite
state automata.
Sekar et al. then apply anomaly detection on top of the extended finite state au-
tomata. Sekar et al. employ machine learning to capture statistical properties of
network traffic, such as frequencies of transitions between control states in an ex-
tended finite state automaton, the most encountered value of a state variable at a
control state of an extended finite state automaton, and the distribution of values of
a state variable in an extended finite state automaton.
In this chapter we discuss our research on advancing the detection capabilities of
specification-based intrusion detection itself when employed in a process control net-
work. We leave open the possibility of applying statistical machine learning or other
anomaly intrusion detection approaches on top of the improved specification-based
Chapter 5: PROCESS AWARE SPECIFICATION-BASED DETECTION 86
approach.
Thus, the approach discussed in this chapter, which we refer to as physical pro-
cess aware specification-based intrusion detection, is specific to process control net-
works. As such it aims at leveraging model-based intrusion detection into an extended
specification-based intrusion detection approach whose effectiveness with regard to
detection of unknown attacks is comparable to the effectiveness of anomaly intrusion
detection.
5.2 Semantic Analysis of Network Traffic
Given a network packet, i.e. a byte stream, we are interested in deriving the
semantic meaning of this byte stream. We need to derive the operation or function
that the byte stream in question is about to perform. We refer to this process as byte
stream semantic analysis, and employ it as a fundamental mechanism to increase the
scrutiny of network packets that flow across a process control network. For example,
referring to Figure 5.1, the semantic meaning of a network packet comprised of the
five bytes 0x05 0x03 0x40 0xff 0x00, in a specific nuclear power plant, is: Closing
a main steam line isolation valve.
As depicted in Figure 5.1, we apply byte stream semantic analysis on top of model-
based intrusion detection. We do so for two main reasons. First, if a network packet
is found to be malformed, then it is the model-based intrusion detection approach to
generate an intrusion alert. If that was the case, there would be no need for further
scrutiny, and thus our approach would have been redundant. For this reason a net-
work packet is first scrutinized by the model-based intrusion detection.
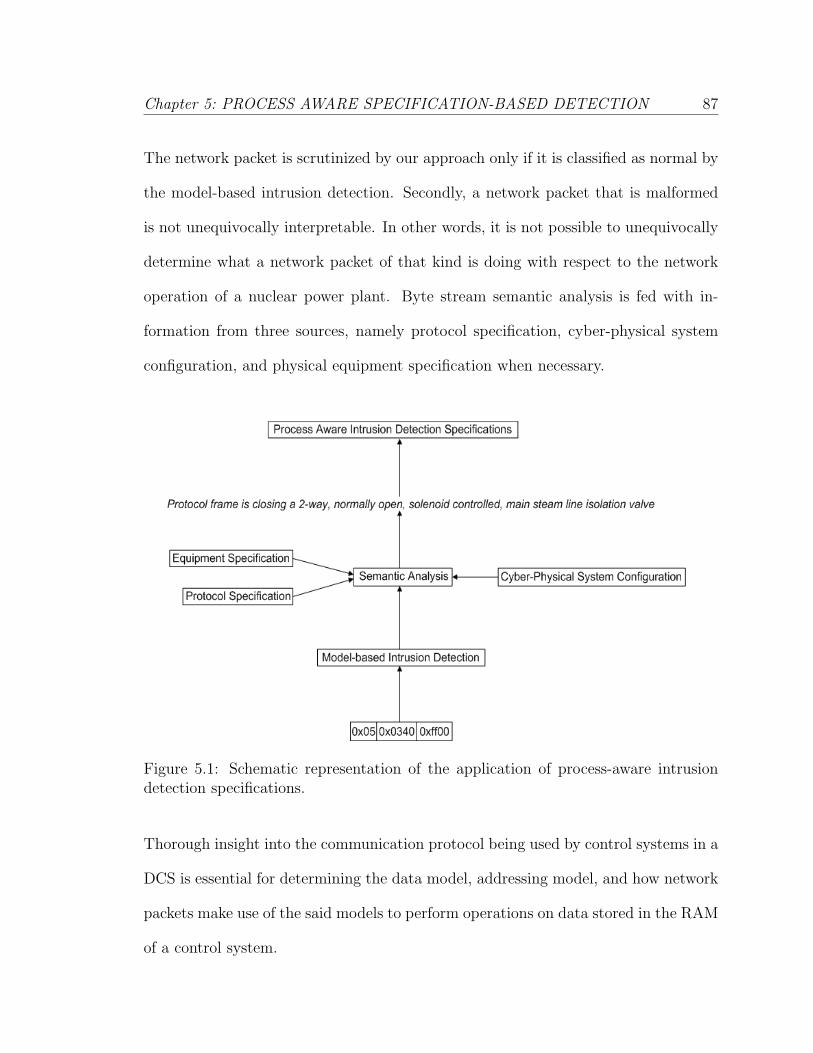
Chapter 5: PROCESS AWARE SPECIFICATION-BASED DETECTION 87
The network packet is scrutinized by our approach only if it is classified as normal by
the model-based intrusion detection. Secondly, a network packet that is malformed
is not unequivocally interpretable. In other words, it is not possible to unequivocally
determine what a network packet of that kind is doing with respect to the network
operation of a nuclear power plant. Byte stream semantic analysis is fed with in-
formation from three sources, namely protocol specification, cyber-physical system
configuration, and physical equipment specification when necessary.
Figure 5.1: Schematic representation of the application of process-aware intrusiondetection specifications.
Thorough insight into the communication protocol being used by control systems in a
DCS is essential for determining the data model, addressing model, and how network
packets make use of the said models to perform operations on data stored in the RAM
of a control system.

Chapter 5: PROCESS AWARE SPECIFICATION-BASED DETECTION 88
For example, if process control communications in a DCS are conducted via the
ModBus protocol, the information that is required in a byte stream semantic analysis
includes the fact that measurement data generated by continuous sensors are stored
in input register variables, each one of which stores a 16-bit word, and so on for the
other types of program variables in the ModBus data model; that at protocol level
there is an address in the range [0, 65535] that corresponds to each one of the program
variables of a defined type, and that a specific mapping table associates protocol level
addresses with addresses of locations in the physical memory of a control system; that
program variables are accessed via specific function codes; etc.
In the example of Figure 5.1, the intermediate outcome that we reach via byte stream
semantic analysis upon consultation of information provided by the ModBus protocol
specification, is that the network packet under inspection is writing a value of 1 into
the coil variable whose protocol level address is 832. In other words, this network
packet is requesting to energize the logical output that is represented by the said
program variable.
The cyber-physical system configuration provides byte stream semantic analysis with
information like what program variable with what address is mapped to what pa-
rameter of a physical process or equipment, and hence implicitly what control system
monitors and/or operates what physical equipment, what control program running on
a control system handles what aspect of a physical process or equipment operation,
etc.
Referring to Figure 5.1 again, the relevant information that byte stream semantic
analysis receives from cyber-physical system configuration is that the coil variable
Chapter 5: PROCESS AWARE SPECIFICATION-BASED DETECTION 89
with protocol level address 832 in the RAM of the destination control system is
mapped to the output contact that controls the state of a main steam line isolation
valve, i.e. open or closed. In light of this new information, byte stream semantic
analysis refines the intermediate outcome into another intermediate outcome, namely
that the network packet under inspection is requesting to operate on a main steam
line isolation valve via application of electric power.
Equipment specification provides information about the architecture and configura-
tion of specific equipment. This information is useful from the perspective of scruti-
nizing network packets, since normal network control of equipment of the same type,
but with different architectures or configurations, may be characterized by different
network packets. Consider for example a water pump whose maximum rate is 8.4
million of pounds per hour (MLB/hr), and another water pump whose maximum
rate is 12 MLB/hr.
Let us assume that these rate values are scaled via a multiplication by 10. While a
network packet that conveys a rate value of 100 may be potentially normal if des-
tined for the latter water pump, that same network packet is certainly not normal if
destined for the former water pump. Referring to the specific example of Figure 5.1,
the information that is provided by equipment specification on the main steam line
isolation valve includes the number of positions and the valve position when power is
off, namely 2 and open, respectively.
At this point byte stream semantic analysis refines the current intermediate outcome
into the final outcome, which is that the network packet under inspection is closing
a 2-way, normally open, main steam line isolation valve. In order to highlight the
Chapter 5: PROCESS AWARE SPECIFICATION-BASED DETECTION 90
effect that equipment specification has on the final outcome of byte stream semantic
analysis, let us consider the case in which according to equipment specification the
main steam line isolation valve is a normally closed valve. Taking into account that
the network packet under inspection is requesting to apply power on the main steam
line isolation valve, the semantic of this network packet would have been that it is
opening the main steam line isolation valve rather than closing it.
If due to any reason a byte stream semantic analysis fails to derive a semantic mean-
ing from a network packet, then the proposed intrusion detection approach deems
that the said network packet is abnormal, and hence raises an intrusion alert. The
rationality behind this conclusion is that, due to the special purpose nature of process
control networks, every normal network packet that flows over such networks carries
a semantic meaning.
As we show in a practical example later on in this chapter, the detection specifi-
cations that we develop in this work do take into account temporary perturbations
of critical process parameters caused by mechanical or electrical faults of physical
equipment, pipe breaks, etc. Thus, the detection specifications that we develop in
this work do not classify the aforementioned transient events as attacks, but rather
express network packets that would stabilize those critical process parameters.
5.3 Specifications of Control Network Traffic
A DCS-controlled nuclear power plant is operated in two simultaneously active
ways, namely supervisory and automatic. In a supervisory operation, plant operators
consult real-time sensor data and accordingly send process set points over a process
Chapter 5: PROCESS AWARE SPECIFICATION-BASED DETECTION 91
control network to control systems. In an automatic operation, logic solving scan
programs running in control systems elaborate sensor data along with set points and
generate automatic responses according to a specific control logic.
Both supervisory operation and automatic operation are conducted over a process
control network according to a series of well defined rules, which ensure a safe oper-
ation of a DCS-controlled nuclear power plant. Conversely, any violations of these
operation rules have potential for causing perturbations to process parameters, and
thus can cause possible accidents. We leverage these operation rules to develop de-
tection specifications that further extend the scrutiny of network packets that flow
across a process control network.
In our research we deem a network packet as abnormal if the associated semantic
meaning, as derived via byte stream semantic analysis, violates any of the detection
specifications. We now provide a practical explanation of the concepts discussed so
far by referring to the example of Figure 5.1. Recall that in this example a network
packet that is being scrutinized requests closure of a 2-way, normally open, main
steam line isolation valve.
A main steam line in a nuclear power plant is a large pipe that is used to convey
steam from the reactor, where it is created, into the generators’ room, where it is
used to drive a turbine generator for the purpose of producing electric power. A main
steam line isolation valve is positioned in a main steamline, where the latter enters
the reactor vessel. This valve is used to close off the flow of steam from the reactor
vessel in the case downstream piping gets broken at any point due to any reason.
According to the operation rules, a main steam line isolation valve normally remains

Chapter 5: PROCESS AWARE SPECIFICATION-BASED DETECTION 92
open in order to allow steam to flow through the pipe. The valve is closed only when
control systems sense a low water level or excessive flow in the reactor pressure vessel,
and/or a low pressure in the main steam line. A typical nuclear power plant contains
four main steam lines with two main steam line isolation valves per steam line.
Closing them in normal plant conditions would cause a pressurization of the reactor
vessel, which would then be followed by an addition of positive reactivity. For the
network packet that is depicted in Figure 5.1 to be classified as normal, it has to
be received when either one or both of the aforementioned perturbations are sensed.
Otherwise the network packet in question is classified as abnormal since it is violat-
ing the operation rules, i.e. it is closing a main steam line isolation valve in a plant
condition in which the valve in question should remain open.
5.4 Activity Network Modeling of Detection Spec-
ifications
In summary, for a network packet to be classified as normal by the intrusion
detection approach described in this chapter, it is required to satisfy two properties,
namely (1) have a valid semantic meaning, and (2) have a semantic meaning that fully
complies with supervisory or automatic operation rules. In order to make a concrete
and consistent use of scrutiny, we need a deterministic state-transition formalism to
model a joint representation of byte stream semantic analysis and operation rules.
As can be derived from the next two sections of this chapter, byte stream semantic
analysis and operation rules are state dependent and transition related concepts. In

Chapter 5: PROCESS AWARE SPECIFICATION-BASED DETECTION 93
this research our formalism of choice is the activity network [102]. We develop activity
network models that reason in terms of network packets, since the physical process
aware intrusion detection approach is to be deployed as a software component of a
network traffic inspection tool.
The specification-based anomaly detection counterpart of our activity network for-
malism is the extended finite state machine. In [106], Sekar et al. use extended finite
state machines to model protocol level specifications. We apply the network formal-
ism in a functionally similar way. This is consistent, since the contribution of the
proposed approach lies in an increase of the scrutiny of network traffic rather than in
a modification of the foundations of specification-based intrusion detection itself.
Before we proceed, let us define physical process aware specifications as compositions
of byte stream semantic analysis and supervisory or automatic operation rules. A
key factor in the process of developing activity network models for intrusion detec-
tion consists of how to map elements of process aware specifications into activity
network primitives. We model as activity network places the various fields of a net-
work packet payload along with the program variables that are stored in the RAM of
control systems.
We also model as activity network places various additional arguments that through-
out the development of activity network models result necessary to fully characterize
network packet transmissions between control systems via network packets. For ex-
ample, in Figure 5.3 and Figure 5.5 we can tell places like pending function code,
pending address, and pending value, which represent a write request that has been
issued but that still has to be confirmed by the receiving control system.
Chapter 5: PROCESS AWARE SPECIFICATION-BASED DETECTION 94
We model as activity network activities all possible semantic meanings of network
packets that comply with operation rules. We place the burden of byte stream se-
mantic analysis and checks for compliance with operation rules on activity network
input gates. Each input gate is equipped with a predicate that tests whether a de-
fined semantic meaning corresponds to a network packet under inspection. If that is
the case, the predicate consults the number of tokens at various places in order to
determine whether the operation denoted by the semantic meaning in question is not
violating any operation rules.
Only if these two conditions are satisfied does the activity that is associated with this
input gate get enabled. The enabling of a specific activity is indicative of the fact
that a network packet under inspection has successfully passed the intrusion detec-
tion scrutiny. We model as output gates the effects induced by network packets that
have been deemed as normal. As a network packet is sniffed from a process control
network, the value of each field of that packet is extracted and is used as the number
of tokens at the place that represents the field in question.
For a network packet to be classified as normal, there has to be an input gate whose
predicate holds, in which case an associated activity is enabled and completes, with
the result being that an activity network model transitions from a specific marking
into another marking.

Chapter 5: PROCESS AWARE SPECIFICATION-BASED DETECTION 95
5.5 Concrete Activity Network Models
5.5.1 Supervisory Control Specifications
We now provide concrete examples of detection specifications derived from rules
that regulate the supervisory network operation of a DCS-controlled nuclear power
plant. We also show how one of these specifications and the associated part of byte
stream semantic analysis are encoded into an activity network model. A nuclear
power plant is operated over process control networks via HMI controls according
to precise instructions. For candidate operators to be licensed to operate a nuclear
power plant, they are required to learn the aforementioned instructions in specific
training courses, and also demonstrate their knowledge in especially prepared certifi-
cation exams.
Thus, a normal network operation of a nuclear power plant strictly follows the in-
structions in question. It is exactly these instructions or supervisory operation rules
from which we derive process aware specifications that reason in terms of network
packets. As in other specification-based detection approaches, the specifications that
we develop in this dissertation, including those that are derived from supervisory
operation rules, are deterministic. This is due to the fact that operation rules along
with operation guides, if any, are deterministic.
A power-to-flow operating map, for instance, is a clean example of the latter. A
power-to-flow is a graph that indicates the expected relation between thermal power
and water level in the reactor pressure vessel. One of the available mechanisms for
changing thermal power is to set the rate of specific water pumps, which in turn

Chapter 5: PROCESS AWARE SPECIFICATION-BASED DETECTION 96
change the water level. An operator specifies a water level set point. Thereafter it
is a logic solving scan program, i.e. control applications, running in a control system
that calculates the exact changes of the rate of water pumps that bring the water
level to the said set point.
An operator has to keep the thermal power within defined thresholds, which depend
on the current values of various plant parameters. In order to be able to do so, an
operator consults the power-to-flow operating map to estimate a change in the water
level, and hence the water level set point, which produces a change in the thermal
power such that the new value of the thermal power lies within the desired thresholds.
These thresholds themselves are defined in supervisory operation rules.
Taking into account that the power-to-flow operating map and the thresholds in
question are deterministic, we can develop process aware specifications that, given a
current value of thermal power, determine the possible network packets that would
cause a change in the water level such that the associated change in thermal power
would produce a new value of thermal power that lies within preliminarily defined
thresholds. We now provide an example of an activity network that represents pro-
cess aware specifications that are derived from a supervisory operation rule and byte
stream semantic analysis.
The said rule protects one of the most important limits on reactor operation, namely
the rate at which the temperature of the water in the reactor pressure vessel is
changed. Since water is in direct contact with the reactor pressure vessel steel, the
temperature of the former is diffused into the latter. Changes of water temperature
cause a difference in temperature between the inside and outside surfaces of the re-

Chapter 5: PROCESS AWARE SPECIFICATION-BASED DETECTION 97
actor pressure vessel. This factor induces stresses in the walls of the reactor pressure
vessel. Thus, a plant operator is required to operate a nuclear power plant in such a
way as to minimize these stresses.
The plant operator does so by limiting the water temperature change rate to a de-
fined threshold, and thus allow for the temperature of the lower temperature vessel
surface to reach the temperature of the higher temperature vessel surface. In a typ-
ical General Electric boiling water reactor, the allowed water temperature change
rate is about 100 degrees Fahrenheit per hour. The water temperature change rate
is proportional to thermal power, therefore an operator can maintain a specific water
temperature change rate by limiting the average thermal power that is maintained
over each interval in which temperature is increased or decreased.
Earlier in this subsection we mentioned that an operator could change thermal power
by changing the water level in the reactor pressure vessel. In this example we consider
the case in which an operator employs the other available mechanism for controlling
thermal power, namely insertion or withdrawal of control rods. We develop an ac-
tivity network model, which inspects the network packets that insert or withdraw
control rods, and thus checks whether they induce stresses in the walls of the reactor
pressure vessel to a degree that lies beyond predefined minimal values.
The elements that are involved in supervisory withdrawals of control rods are de-
picted in Figure 5.2. Neutron detectors, which are located adjacent to nuclear fuel
rods inside the reactor core, measure neutron population. Their measurement values
are received over a fieldbus network by PLC3. PLC3 uses a logic solving scan program
to process neutron population measurements, and hence produce an estimation of the
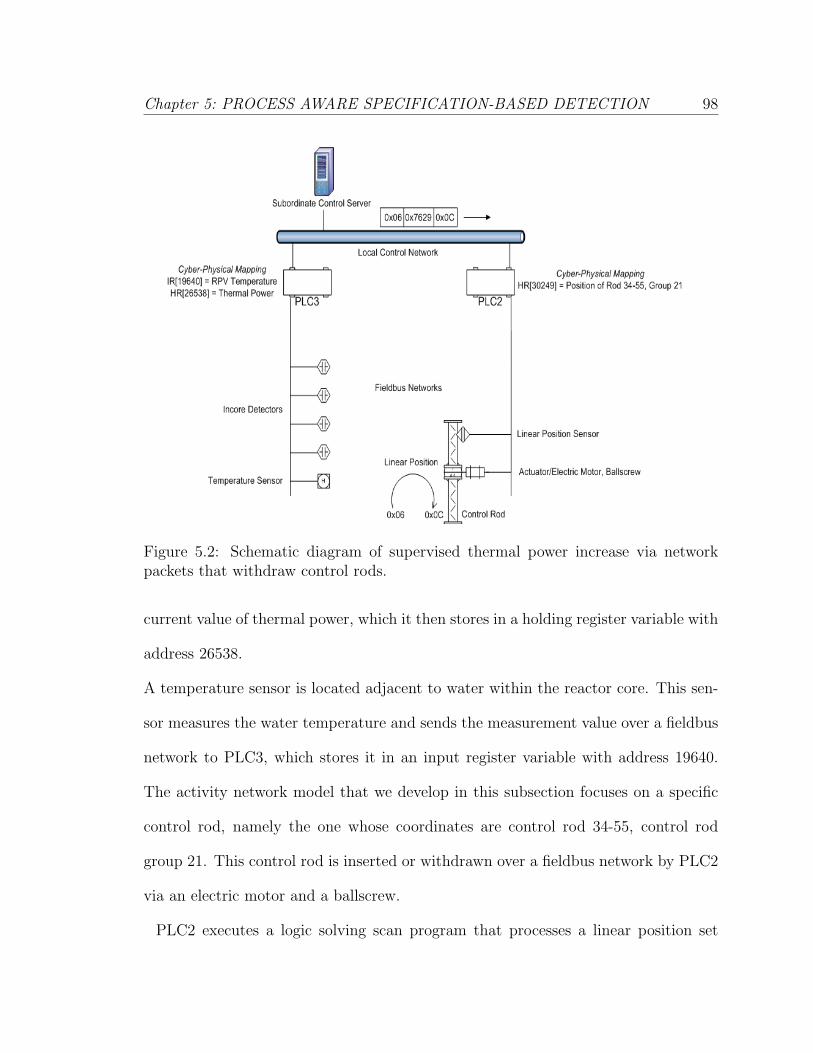
Chapter 5: PROCESS AWARE SPECIFICATION-BASED DETECTION 98
Figure 5.2: Schematic diagram of supervised thermal power increase via networkpackets that withdraw control rods.
current value of thermal power, which it then stores in a holding register variable with
address 26538.
A temperature sensor is located adjacent to water within the reactor core. This sen-
sor measures the water temperature and sends the measurement value over a fieldbus
network to PLC3, which stores it in an input register variable with address 19640.
The activity network model that we develop in this subsection focuses on a specific
control rod, namely the one whose coordinates are control rod 34-55, control rod
group 21. This control rod is inserted or withdrawn over a fieldbus network by PLC2
via an electric motor and a ballscrew.
PLC2 executes a logic solving scan program that processes a linear position set

Chapter 5: PROCESS AWARE SPECIFICATION-BASED DETECTION 99
point, and thereafter generates network packets to directly control the actual rota-
tional speed of the electric motor along with its rotor’s rotation direction. The rota-
tional motion that is produced by the electric motor is converted into linear motion
by the ballscrew. This linear motion then is used to insert or withdraw the control
rod depending on the rotor’s rotation direction. A linear position sensor measures
the actual linear position of the control rod.
Let the Internet protocol (IP) addresses of the subordinate control server and PLC2
be represented by the identifiers 169 and 205, respectively. Some key elements of the
activity network model that scrutinizes protocol packets for potential for inducing
high stresses in the walls of the reactor pressure vessel are depicted in Figure 5.3.
Let us see how this activity network model scrutinizes the network packet payload in
Figure 5.2.
This network packet, which is sent by the subordinate control server to PLC2, requests
to withdraw the control rod in question, more precisely change its linear position from
6 to 12. Notice that a control rod always moves between even positions. The possible
exact semantic meanings of a network packet that requests to cause a change to the
linear position of the control rod in consideration are: (1) withdrawing control rod
34-55, control rod group 21; and (2) inserting control rod 34-55, control rod group
21.
As this network packet is sniffed from a process control network, the values of each one
of its fields, namely function code, register address, and register value, are assigned as
amounts of tokens to the corresponding places in the activity network model. Both
protocol fields and activity network places take discrete values; therefore there are no
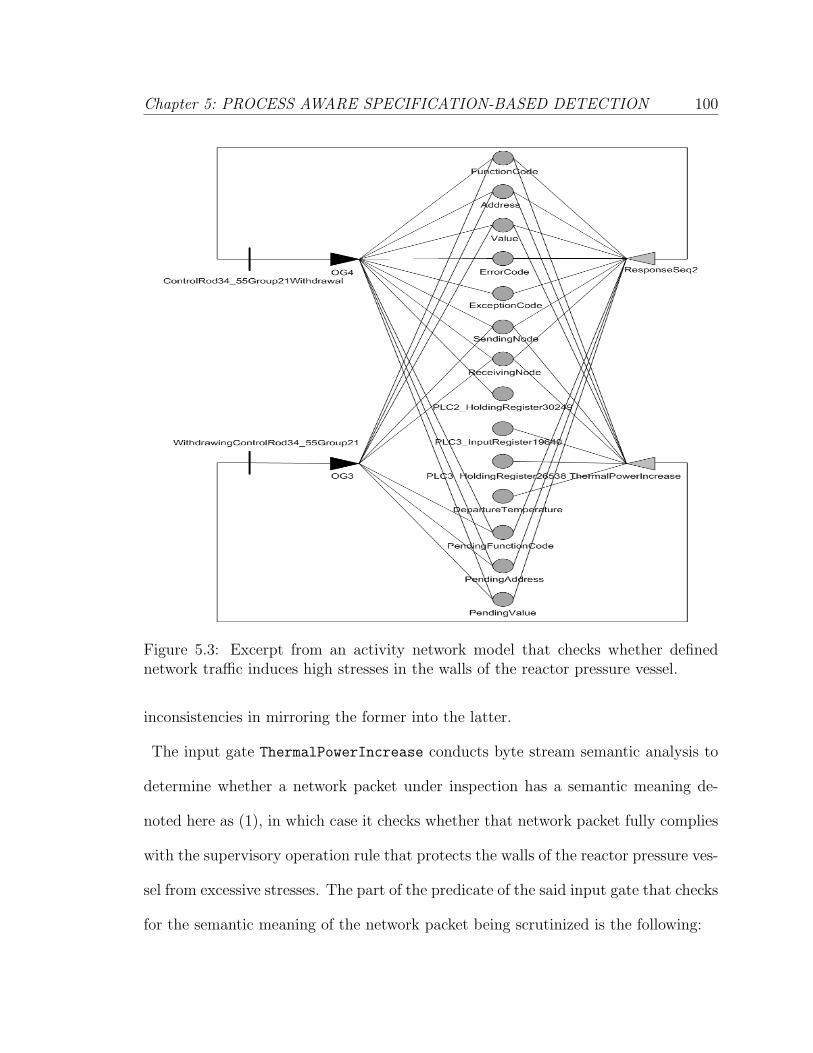
Chapter 5: PROCESS AWARE SPECIFICATION-BASED DETECTION 100
Figure 5.3: Excerpt from an activity network model that checks whether definednetwork traffic induces high stresses in the walls of the reactor pressure vessel.
inconsistencies in mirroring the former into the latter.
The input gate ThermalPowerIncrease conducts byte stream semantic analysis to
determine whether a network packet under inspection has a semantic meaning de-
noted here as (1), in which case it checks whether that network packet fully complies
with the supervisory operation rule that protects the walls of the reactor pressure ves-
sel from excessive stresses. The part of the predicate of the said input gate that checks
for the semantic meaning of the network packet being scrutinized is the following:
Chapter 5: PROCESS AWARE SPECIFICATION-BASED DETECTION 101
(SendingNode->Mark() == 169) && (ReceivingNode->Mark() == 205) &&
(FunctionCode->Mark() == 6) && (Address->Mark() == 30249)
This code snippet basically checks that the network packet is originating from the
subordinate control server, which is the device that according to the cyber-physical
system configuration is configured to transmit network packets that convey control
rod linear position set points. This code snippet also checks that the network packet
is destined for PLC2, which according to the cyber-physical system configuration is
the edge control system that is configured to directly control the electric motor that
in turn inserts or withdraws the control rod.
In addition, this code snippet checks whether the network packet is writing the holding
register variable with address 30249, which, again, according to the cyber-physical
system configuration is the program variable that is mapped to the linear position of
the control rod. The rest of the predicate verifies that the network packet will not
induce high stresses in the walls of the reactor pressure vessel.
&& ((PLC3_InputRegister19640->Mark() + tempaddition(Value->Mark(),
PLC3_HoldingRegister26538->Mark(), PLC3_InputRegister19640->Mark()))
<= (DepartureTemperature->Mark() + 100)) &&
(Value->Mark() < PLC2_HoldingRegister30249->Mark()) &&
(PendingFunctionCode->Mark() == 0) && (PendingAddress->Mark() == 0) &&
(PendingValue->Mark() == 0)
Control rod worth is defined as the amount of reactivity that is added per increment
of control rod motion, and is a function of thermal power and linear position. Control
rod worth is proportional to the thermal power change rate, and hence to the water
temperature change rate. The function tempaddition() in the snippet of code given
Chapter 5: PROCESS AWARE SPECIFICATION-BASED DETECTION 102
above calculates the additional temperature ∆T expected to be induced by the new
linear position of the control rod that is being requested by the network packet being
analyzed.
Let the departure temperature denote the original value of the temperature when
it first began to change. The said code snippet adds ∆T to the current value of
the temperature, and then checks that the resulting value is less than or equal to
the maximum value of the temperature allowed in one hour. This code snippet is
basically verifying that the control rod motion requested by the network packet will
not cause a change in the water temperature that has potential for inducing high
stresses in the walls of the reactor pressure vessel.
The remaining lines of code in the snippet above are verifying that the network
packet is a request rather than a response. In ModBus a request network packet and
a response network packet may be identical, since a receiving device may respond to
a sending device with a copy of the request network packet in order to notify positive
processing of the said request. If the said input gate enables the associated activity,
the network packet has successfully passed the intrusion detection scrutiny.
The output function of the output gate OG3 is used to denote the fact that the normal
network packet is being processed by PLC3. That function is given below:
PendingFunctionCode->Mark() = FunctionCode->Mark();
FunctionCode->Mark() = 0; PendingAddress->Mark() = Address->Mark();
Address->Mark() = 0; PendingValue->Mark() = Value->Mark();
Value->Mark() = 0; SendingNode->Mark() = 0; ReceivingNode->Mark() = 0;
Chapter 5: PROCESS AWARE SPECIFICATION-BASED DETECTION 103
According to the ModBus protocol specification a successful reception of a request
network packet does not imply its successful processing. A receiving device may not
be able to handle a request network packet due to factors like detection of parity errors
in its RAM, detection of communication errors, etc. The input gate ResponseSeq2 in
the activity network model of Figure 5.3 conducts byte stream semantic analysis to
determine whether a network packet under inspection has a semantic meaning that
corresponds to the status of handling the request network packet that was analyzed
previously, in which case the associated activity gets enabled. The predicate of input
gate ResponseSeq2 is given below:
((SendingNode->Mark() == 205) && (ReceivingNode->Mark() == 169))
&& (((FunctionCode->Mark() == PendingFunctionCode->Mark()) &&
(Address->Mark() == PendingAddress->Mark()) &&
(Value->Mark() == PendingValue->Mark())) ||
((ErrorCode->Mark() == 134) && (ExceptionCode->Mark() > 0) &&
(ExceptionCode->Mark() < 5)))
The output function of output gate OG4 assesses whether PLC2 is sending a normal
response indicating to have handled the query correctly, in which case it commits
the change of the control rod linear position from its original value to the set point
indicated in the request network packet, namely from 6 to 12. If that is not the case,
the said output function voids the temporary effects of the request network packet.
This is because the holding register variable with address 30249 in the RAM of PLC2
was not written, and thus the control rod linear position remained unchanged.
The output function of output gate OG4 is given below:
if (ErrorCode->Mark() == 0) {

Chapter 5: PROCESS AWARE SPECIFICATION-BASED DETECTION 104
PLC2_HoldingRegister30249->Mark() = PendingValue->Mark();
flush(ErrorCode->Mark());
} else {
flush(ErrorCode->Mark());
}
5.5.2 Automatic Control Specifications
The logic of automatic operation functions is encoded into logic solving scan pro-
grams. These computer programs are executed many times per second in order to
check for the creation of specific conditions that urge a fast intervention, and hence
provide a timely corrective response. An example of an automatic operation rule
is the rod sequence enforcement in a nuclear power plant. In order to limit control
rod worth, a mandatory sequence of control rod movements is required as rods are
withdrawn or inserted. Violations of this specific sequence have potential for creating
unsafe conditions.
Consequently, the sequence in question is enforced via one or more logic solving scan
programs. In this research we derive process aware specifications also from logic solv-
ing scan programs, or if possible, from the high level program specifications upon
which they were developed. We now provide an example of an activity network that
represents process aware specifications that are derived from an automatic operation
rule. The rule in question protects a reactor from unsafe conditions that may be
created as a consequence of a fault in any of the water pumps.
A rapid drop in the reactor water level characterizes the loss of a water pump, with
the result being an excessive increase of thermal power. The said rule requires control
systems to detect the loss of any water pumps, and upon detection of that event to

Chapter 5: PROCESS AWARE SPECIFICATION-BASED DETECTION 105
Figure 5.4: Schematic diagram of an automatic corrective withdrawal of a control rodthat is conducted via a network packet in response to the loss of a water pump.
rapidly insert specific control rods. These control rod withdrawals decrease thermal
power to values that are normal for the reduced water level. The elements that are
involved in automatic withdrawals of control rods, as a water pump is lost due to a
fault, are depicted in Figure 5.4.
PLC1 is an edge control system that controls and monitors two motor-driven water
pumps. The rate of each one of these water pumps is measured by flowmeters, which
send their measurement values over a fieldbus network to PLC1. Let the input register
variable with address 19685 in the RAM of PLC1 be mapped to the rate of the first
water pump from top. PLC2 along with the control rod, electric motor, ballscrew,
and linear position sensor are those that were discussed in the previous subsection.

Chapter 5: PROCESS AWARE SPECIFICATION-BASED DETECTION 106
Some key elements of the activity network model that scrutinizes network packets to
see whether they are the corrective response to the loss of a water pump are depicted
in Figure 5.5.
The input gate LossOfFeedwaterPump conducts byte stream semantic analysis to
determine whether a network packet being scrutinized has the following semantic
meaning: inserting control rod 34-55, control rod group 21. If that is the case, the
said input gate checks whether one of the water pumps results to have been lost. For
modeling purposes, let the IP address of PLC1 be represented by the identifier 168.
The part of the predicate of input gate LossOfFeedwaterPump that checks for the
semantic meaning of the network packet being scrutinized is given below:
(SendingNode->Mark() == 168) && (ReceivingNode->Mark() == 205) &&
(FunctionCode->Mark() == 6) && (Address->Mark() == 30249) &&
(Value->Mark() < PLC2_HoldingRegister30249->Mark()) &&
The remaining of the said predicate verifies that the network packet is being sent in
response to the loss of a water pump, and that it will not insert the control rod in
question beyond its insertion limit.
(PLC1_InputRegister19685->Mark() == 0) && (Value->Mark() > 5) &&
(PendingFunctionCode->Mark() == 0) && (PendingAddress->Mark() == 0) &&
(PendingValue->Mark() == 0)
The other lines in the code snippet given above verify that the network packet being
analyzed is a request rather than a response. The remaining elements of the activity

Chapter 5: PROCESS AWARE SPECIFICATION-BASED DETECTION 107
Figure 5.5: Excerpt from an activity network model that checks whether a networkpacket under inspection is the corrective response to the loss of a water pump.
network model are defined similarly to their counterpart elements discussed in the
previous subsection.
5.6 Discussion
We now discuss the complexity of detection specifications, which is the main factor
that directly affects the practicality of the physical process aware specification-based
intrusion detection approach. As in any other specification-based approaches, the

Chapter 5: PROCESS AWARE SPECIFICATION-BASED DETECTION 108
level of abstraction is quite relevant to keeping the proposed approach practical. In
other words, specifying in full the normal behavior of a system in general is not prac-
tical. For example, as discussed in the related work section, a thorough specification
of the behavior of a computer program is not practical [74].
Consequently, specification-based approaches that focus on the behavior of a com-
puter program capture only specific details, and thus refrain from attempting to
capture the full behavior of a computer program [74, 107]. Moving along this line, we
deem that capturing the full dynamics of a physical system such as a nuclear power
plant is not practical. Consequently, we do not attempt to include the full behavior
of physical processes into the specifications of normal control network traffic.
As written earlier in this chapter, we aim at capturing the normal behavior of a
physical system, as exhibited in contents of network packet payloads, by deriving
specifications from supervisory operation rules and control applications. To our ex-
perience, the complexity of supervisory operation rules is manageable, and therefore
the derivation of detection specifications from these rules is feasible.
A consideration of a control application in its entirety to derive specifications of net-
work packets, which are expected to be received or transmitted by that control ap-
plication, leads us to construct a replica of the control application in question within
the activity network models. In other words, we would have ended up with activity
network models that perform redundant program execution [67]. While redundant
program execution has been already used for computer security [23], we deem that in
our problem domain the creation of entire replicas of control applications is unneces-
sary.

Chapter 5: PROCESS AWARE SPECIFICATION-BASED DETECTION 109
For the purpose of developing specifications of control network traffic, in this research
we consider only those functions of a control application that read from or write to
network sockets, in conjunction with program variables that are stored in the RAM
of a control system. To our experience, the complexity of deriving these detection
specifications from a control application is relatively high, but yet manageable. As
a future work, we deem that drawing from areas such as nuclear physics and reactor
theory to specify the expected normal behavior of a nuclear power plant in terms of
network packets has potential for further improving the effectiveness of the proposed
approach.

Chapter 6
MIRAGE THEORY FOR
DECEPTION-BASED
DETECTION
6.1 Introduction
In this chapter we provide a discussion of mirage theory, i.e. a novel deception
approach that we have derived from military deception (MILDEC) [117] and its appli-
cations [126]. In [117], MILDEC is defined as those actions executed to deliberately
mislead adversary decision makers as to friendly military capabilities, intentions, and
operations, thereby causing the adversary to take specific actions or inactions that
will contribute to the accomplishment of the friendly mission.
Mirage theory is comprised of actions that are devised to deliberately mislead an ad-
versary as to DCS-controlled physical processes and equipment such as nuclear power
110

Chapter 6: MIRAGE THEORY FOR DECEPTION-BASED DETECTION 111
plants, thereby causing the adversary to take specific actions that will contribute to
the detection of his/her intrusion in process control networks. Deception means in
MILDEC are grouped into three categories, namely physical means, technical means,
and administrative means. Examples of physical means include dummy and decoy
equipment and devices, tactical actions, movement of military forces, etc.
Examples of technical means include emission of chemical or biological odors, emission
of radiation, reflection of energy, computers, etc., while examples of administrative
means include techniques to convey or deny physical evidence. Mirage theory employs
mainly technical deception means, namely emission of deceptive network traffic along
with computers and computer networks. Mirage theory relies to a large degree on a
MILDEC concept that is referred to as a display. Displays are simulation, disguising,
and/or portrayal of friendly objects, units, or capabilities that may not exist, but are
made to appear so.
In this regard mirage theory employs computers or computer clusters to simulate
or emulate the presence of physical processes and equipment. The ultimate goal of
mirage theory is to cause an adversary to target computer systems that monitor and
control simulated or emulated physical processes via simulated or emulated sensors
and actuators. Actions taken by a deceived adversary are thereafter leveraged to
detect and characterize his/her malicious activity.
Our research on mirage theory was inspired by a lesson that we drew from history,
namely the Operation Fortitude South, which is a MILDEC application that was
conducted in the second world war [126]. The allied invasion of German occupied
territory of France was preceded by a strategic plan whose codename was Operation
Chapter 6: MIRAGE THEORY FOR DECEPTION-BASED DETECTION 112
Fortitude South, which was made by the allies to deceive the command of German
military into believing that the allies would attack from Pas de Calais rather than
from Normandy. In addition to large intelligence operations such as espionage and
controlled leaks of information through diplomatic channels, this plan included also
the creation and deployment of a special electronic unit that was called the 5th wire-
less group.
This group used some newly developed transmitters to generate radio communica-
tions based on preprogrammed and especially written scripts. These radio commu-
nications contained conversations that are typical to military assault operations. As
the German military in France had few aerial reconnaissance capabilities left, eaves-
dropping on radio communications was the principal mechanism that they could use
to determine movements of allied troops. The Operation Fortitude South was highly
successful to a degree that Adolf Hitler concentrated a large number of military units,
including Panzer tank units, in Pas de Calais.
Mirage theory exploits similar concepts, namely the adversary’s reliance on analysis
of intercepted network data to derive the presence and characteristics of physical tar-
gets, and the lack of means to verify that intercepted traffic is indeed generated by
existing physical targets. In this chapter the terms physical system and continuous
space are used interchangeably. The terms cyber-physical system and DCS-controlled
physical system are also used interchangeably. The terms communicating finite state
machine and automaton are used interchangeably as well.

Chapter 6: MIRAGE THEORY FOR DECEPTION-BASED DETECTION 113
6.2 Conducting Defensive Deception for Intrusion
Detection
As illustrated in the top part of Figure 6.1, the interactions between sensing or
actuating devices and edge control systems take place via application of electrical sig-
nals with certain characteristics. In a typical sensing activity sensors, i.e. transducers,
measure physical phenomena and report continuous values by generating analog val-
ues, i.e. voltages or currents. For instance, incore detectors in a nuclear reactor
measure neutron flux. Incore detectors apply electrical signals that are proportional
to neutron population in the reactor core.
Neutron flux measurements that are conveyed by these electrical signals are pro-
cessed by computer systems, which together form a neutron monitoring system. For
measurement values to be processed by computer systems, the corresponding elec-
trical signals are periodically sampled and converted into discrete numerical values
via analog-to-digital conversion integrated circuits [48]. Edge control systems actuate
physical equipment also by applying electrical signals. Discrete numerical values in
a computer system are converted into analog values via digital-to-analog conversion
integrated circuits.
For instance, an edge control system may set the rotational speed of an AC induction
motor by controlling the applied voltage frequency. In the actual context we see two
spaces, namely one in which values are in a continuous form and another in which
values are in a discrete form. In this work we refer to these spaces as the continuous
space and the discrete space, respectively. As also depicted in Figure 6.1, analog-

Chapter 6: MIRAGE THEORY FOR DECEPTION-BASED DETECTION 114
to-digital and digital-to-analog conversion integrated circuits may be thought of as a
boundary between the continuous and discrete spaces.
In fact it is in these integrated circuits that information changes form from continuous
to discrete and vice versa. The basis of mirage theory is formed by leverage of the
boundary between continuous and discrete spaces, leverage of how the presence of
a continuous space is reflected on a corresponding discrete space, and simulation or
emulation of physical processes and physical equipment. A computer network attack
provides an adversary with access that may extend to a whole discrete space. Nev-
ertheless, due to physical limits there are no feasible ways for an adversary to gain
visibility over a continuous space through a computer network attack.
In other words, a computer network attack won’t enable an adversary to virtually
move beyond the analog-to-digital and digital-to-analog conversion integrated cir-
cuits. Consequently an adversary cannot verify whether input electrical signals are
indeed applied by existing sensing devices, nor can he/she verify whether output elec-
trical signals indeed reach an existing actuating device. Referring to the bottom part
of Figure 6.1, in mirage theory we generate measurement values in a digital form via
computer simulation or emulation, and hence employ digital-to-analog converters to
generate the electrical signals that correspond to these digital values.
What edge control systems receive in input comprises a series of analog values as if
such values were generated by existing sensing devices. Edge control systems then
convert these logical values into digital values via analog-to-digital converters, and
thereafter process them. Since it is after the conversion to a digital form that the
values in question become accessible to an adversary, the previously described ma-
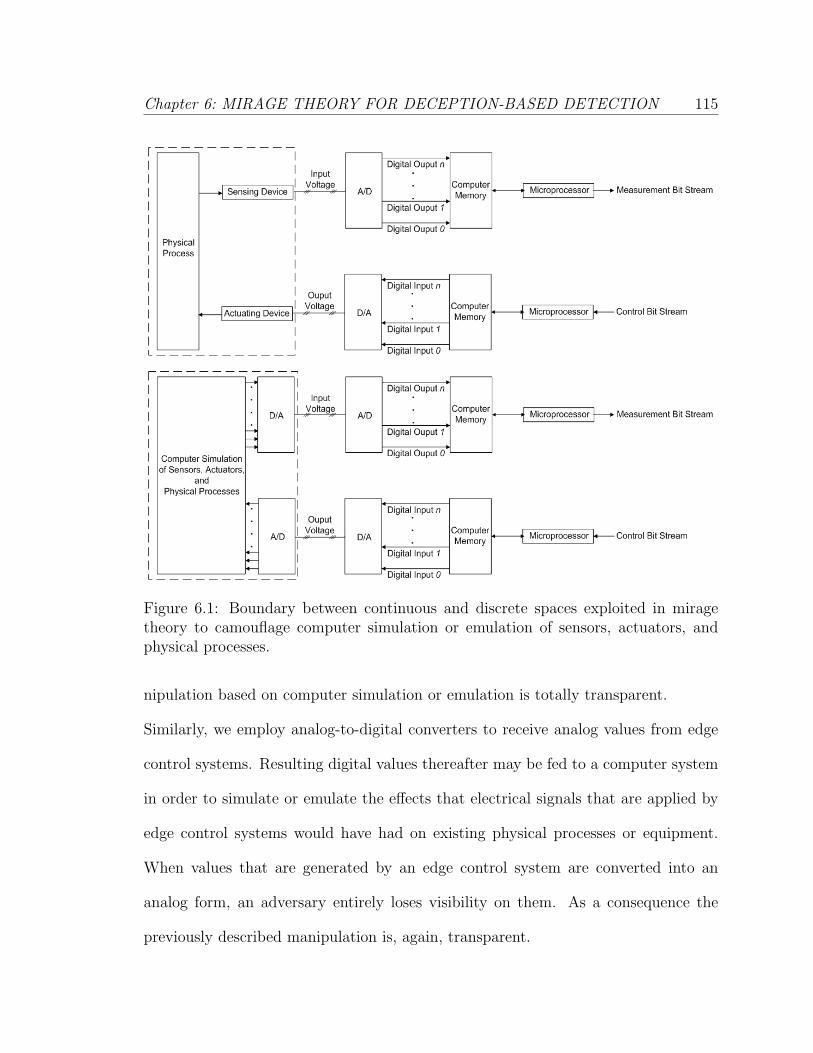
Chapter 6: MIRAGE THEORY FOR DECEPTION-BASED DETECTION 115
Figure 6.1: Boundary between continuous and discrete spaces exploited in miragetheory to camouflage computer simulation or emulation of sensors, actuators, andphysical processes.
nipulation based on computer simulation or emulation is totally transparent.
Similarly, we employ analog-to-digital converters to receive analog values from edge
control systems. Resulting digital values thereafter may be fed to a computer system
in order to simulate or emulate the effects that electrical signals that are applied by
edge control systems would have had on existing physical processes or equipment.
When values that are generated by an edge control system are converted into an
analog form, an adversary entirely loses visibility on them. As a consequence the
previously described manipulation is, again, transparent.
Chapter 6: MIRAGE THEORY FOR DECEPTION-BASED DETECTION 116
From a network access perspective the presence of physical processes and physical
equipment is derived from network packets that flow over a process control network.
For instance, in a nuclear power plant control network a network packet such as the
one depicted in Figure 6.2 denotes the presence of an electric motor that generates
rotational motion, a ball screw that translates this rotational motion into a linear
motion, and a control rod that is inserted or withdrawn via the linear motion in
question.
The reconnaissance that normally precedes initiation of physical damage through a
computer network attack over a target process control network includes analyses of
network packets that flow over this network. By employing techniques such as applied
regression analysis an adversary analyzes data that are conveyed by network packets,
with the result being an identification of the configuration of a target cyber-physical
system along with equipment and physical process specifications indicated in Fig-
ure 6.2.
Not only is the information derived through these reconnaissance analyses indicative
of the presence of physical processes and equipment, but it also details them. The
interaction between a simulated or emulated continuous space and a genuine discrete
space, as depicted in the bottom part of Figure 6.1, is characterized by network traffic
that guides the reconnaissance analyses conducted by an adversary into identification
of physical processes and equipment, which in reality are all simulated or emulated,
along with the computer systems that control and monitor them. As written pre-
viously, in mirage theory only continuous space is simulated or emulated. Discrete
space is intentionally chosen to be genuine in its entirety. In mirage theory process

Chapter 6: MIRAGE THEORY FOR DECEPTION-BASED DETECTION 117
Figure 6.2: A network packet payload that is indicative of the presence of physicalequipment and a physical process.
control systems and networks are deployed and configured as if they were to monitor
and control a real physical process through real sensors and actuators. The com-
puter code that is to be run in these control systems also needs to have been written
for control systems that are intended to monitor and control a real physical process
through real sensors and actuators.
A clean way of constructing the discrete space of an application of mirage theory is
to deploy a replica of the discrete space of a real cyber-physical system in produc-
tion. The ultimate goal of mirage theory is to deceive an adversary into targeting
a simulated or emulated physical process and/or equipment by actively attacking a
control system over a process control network in the discrete space of an application
of mirage theory itself.

Chapter 6: MIRAGE THEORY FOR DECEPTION-BASED DETECTION 118
6.3 Real-Time Deceptive Event Generation
Taking into account that an adversary cannot cross the boundary between con-
tinuous and discrete spaces, a possible option that he/she may explore for detecting
deception consists of analyses of network packets having as an objective to identify
inconsistencies that may be caused by errors in the simulation or emulation of physi-
cal processes and equipment. Even tiny imperfections in the simulation or emulation
of physical processes and equipment are reflected on network data in the discrete
space, and hence have potential for enabling an adversary to catch inconsistencies by
employing advanced analysis techniques such as those based on applied mathematics.
In this section we discuss our research on faithfull simulation or emulation of physical
processes and equipment, namely continuous simulation and traffic mirroring.
6.3.1 Continuous Simulation of Physical Processes and Equip-
ment
In mirage theory we need to simulate a continuous space in real-time in order to
faithfully mimic the appearance of existing DCS-controlled physical systems such as
nuclear power plants or radar units. We deem that a viable simulation technique for
such purpose is continuous simulation [19] as, in addition to having the necessity to
simulate continuous systems, we are also interested in modeling the internal dynamics
within each one of these continuous systems in order to generate a faithful simulation.
As a matter of fact physical processes and physical equipment such as, for instance,
nuclear fission and AC induction motors, respectively, are continuous systems.

Chapter 6: MIRAGE THEORY FOR DECEPTION-BASED DETECTION 119
Their state variables, which are modeled as functions, change continuously over time.
Furthermore, the rates of change of these variables, which are modeled as derivatives,
change continuously over time as well. Continuous simulation models of a continuous
space are comprised of ordinary or partial differential equations that characterize the
behaviour, i.e. internal dynamics, of physical processes and equipment at any point in
time. The continuous simulation itself is conducted by solving these differential equa-
tions via analytical methods, i.e. explicit formulas, or numerical analysis in computer
clusters behind the boundary between continuous and discrete spaces, as indicated in
the bottom part of Figure 6.1.
With regard to detection of network packets that are part of a computer network at-
tack, we organize this process as in anomaly intrusion detection, namely in a learning
phase and a monitoring phase. We model each process control system that is involved
in deceptive communications, i.e. network packets that are generated as a result of
simulation of a continuous space, as a communicating finite state machine [115].
Both input that causes these automata to transition from one state to another and
output that is generated when state transitions take place are network packets. An
example of the said communicating finite state machines is given in Figure 6.3. The
purpose of a learning phase is to thoroughly contruct these automata, while in a suc-
cessive monitoring phase these automata are used to distinguish between deceptive
network packets and possible malicious network packets.
In a learning phase we define a sequence of process set points, which when entered in
a HMI [110] will emulate the DCS-controlled operation of a physical system. Recall
that all or part of the continuous space is simulated. Examples of set points in a
Chapter 6: MIRAGE THEORY FOR DECEPTION-BASED DETECTION 120
nuclear power plant include discrete values of the level of water whithin a reactor
pressure vessel, logical values, i.e. on or off, for starting or stopping a defined water
pump, logical values for opening or closing a main steam isolation valve, logical values
for opening or closing the circuit breaker of an electric generator, discrete values of
the terminal speed of a turbine, etc.
The said set points are then issued from a computer system that would normally be
used by a system operator, i.e. the computer system that is associated with a HMI
and that is depicted in the upper left corner of Figure 6.4, with the result being a
realistic operation of a DCS-controlled physical system as if the continuous space was
real rather than simulated. As the simulated continuous space is operated, we sniff
all network packets that flow over the process control network.
The network packets that a control system receives and transmits are modeled as
input and output, respectively, in the associated communicating finite state machine.
Each one of the network packets in input causes a state transition. Nevertheless, the
automaton may transition from one state to another state even though it has received
no network packets in input. Similarly, it may transition from one state to another
state while producing no network packets in output.
Overall, a communicating finite state machine acts as a sequence detector with re-
spect to the network traffic that is received from or transmitted by the control system
that it models. Although we coded a few communicating finite state machines in the
concurrent hierarchical state machine language system [78], and those mainly in the
form of a proof of concept prototype, to our knowledge the activity of constructing
these automaton-based sequence detectors can be automated.
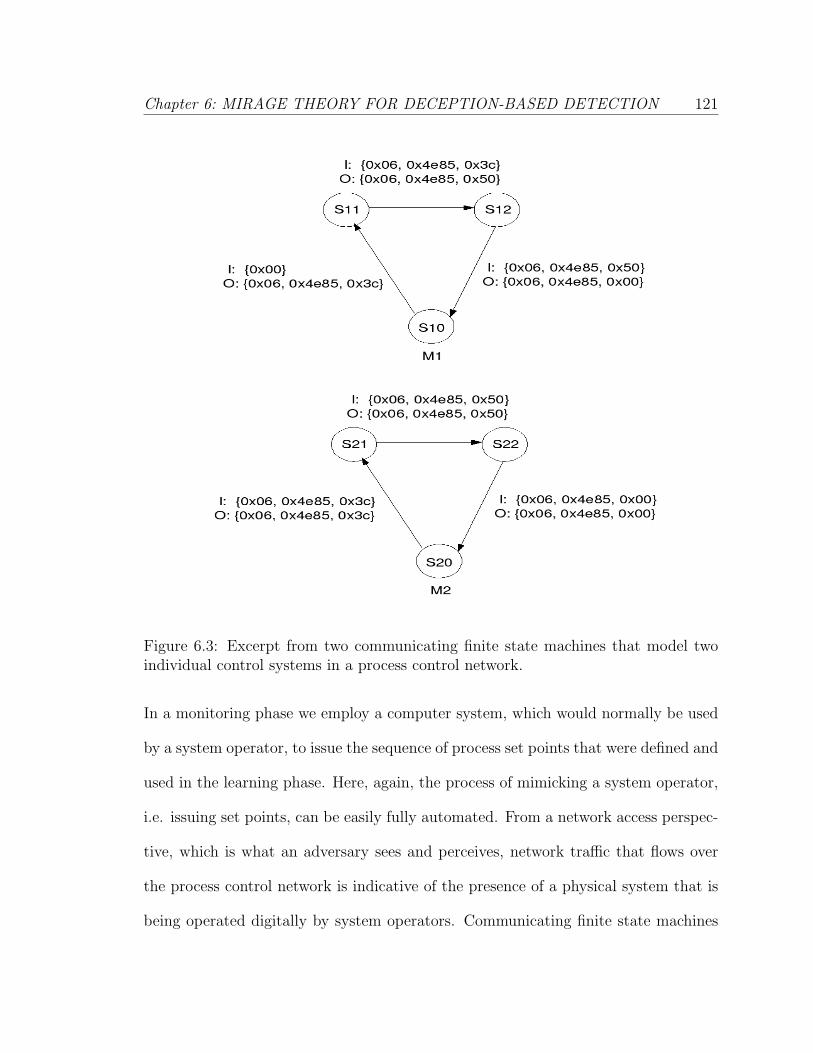
Chapter 6: MIRAGE THEORY FOR DECEPTION-BASED DETECTION 121
Figure 6.3: Excerpt from two communicating finite state machines that model twoindividual control systems in a process control network.
In a monitoring phase we employ a computer system, which would normally be used
by a system operator, to issue the sequence of process set points that were defined and
used in the learning phase. Here, again, the process of mimicking a system operator,
i.e. issuing set points, can be easily fully automated. From a network access perspec-
tive, which is what an adversary sees and perceives, network traffic that flows over
the process control network is indicative of the presence of a physical system that is
being operated digitally by system operators. Communicating finite state machines

Chapter 6: MIRAGE THEORY FOR DECEPTION-BASED DETECTION 122
are embedded in a network packet inspection tool. As network packets flow accross a
process control network, the detection tool inspects them to determine the network
identifiers of the source and destination nodes, i.e. for example IP addresses in the
case the process control protocol runs over TCP/IP, and thereafter submits them
individually to the corresponding automata. If these sequence detectors recognize
the network packets submitted to them, then they simply transition to another state,
and from there the inspection loop keeps running.
We do allow for small variations of values in the data field of network packets in
order to deal with various sources of small errors, such as for example jitter effects
on analog to digital and digital to analog converters. If sequence detectors do not
recognize a given network packet, then it means that they are processing a network
packet that was not generated in the learning phase, therefore the inspection tool
raises an intrusion alert.
We deem that if learning is conducted correctly in the learning phase, then a com-
puter network attack is manifested as one or more extra network packets, i.e. network
packets that do not result to have been generated in the learning phase. Later on
in this chapter we discuss an attack-defense model in which an adversary conducts a
loss of cooling attack on a power plant. The attack is materialized by transmitting a
network packet that writes a malicious value to a program variable, which is mapped
to applied voltage frequency, in a target control system.
According to our thesis the said malicious network packet is not generated in the
learning phase, therefore sequence detectors in the inspection tool won’t recognize it.
We see a series of pros and cons in employing continuous simulation to simulate a

Chapter 6: MIRAGE THEORY FOR DECEPTION-BASED DETECTION 123
continuous space. Continuous simulation allows for interactivity with an adversary,
in the sense that an adversary can generate malicious network packets and verify
their negative impact on his/her targets. This is useful in the case security officers
are interested in letting an adversary do some progress, in order to extract a better
characterization of his/her attack.
Furthermore, there are cases in which it may be necessary to allow for more than a
single unseen network packet in order to have sufficient confidence that a computer
network attack is actually taking place. With continuous simulation we have no re-
liance on existing DCS-controlled physical systems. We can independently deploy an
entire process control network and associate it with a simulated continuous space.
We can, for example, deploy a large number of dummy power plants that are based
on continuous simulation, while not needing the presence of an existing power plant.
On the other hand, it is challenging to conduct a continuous simulation of a nuclear
power plant in real-time.
The issue is that differential equations that model complex systems such as nuclear
power plants are too complex to be solved analytically. Their solutions are to be
obtained via numerical analysis, which requires considerable computing resources for
making the internal dynamics within a simulated continous space appear as taking
place in real-time. Furthermore, numerical analysis generally produces numerically
approximated solutions of differential equations, a fact which in theory may open a
window for an adversary to look for imperfections that indicate the simulation nature
of a target continuous space. In practice though we do not see approximate solutions
of differential equations as an issue as long as they stay within an acceptable degree

Chapter 6: MIRAGE THEORY FOR DECEPTION-BASED DETECTION 124
of accuracy range.
The rationality behind our assumption lies in the fact that, to the best of our knowl-
edge, analyses of network traffic that is induced by an existing continuous space do
not reflect any absolute perfections. Thus, the challenge that an adversary has to face
does not consist in how to differentiate between a perfect view and an imperfect view
of a target continuous space. An example of a source of imperfection in our context
is the conversion of information. There are no ideal analog to digital converters.
Analog to digital conversion of information is characterized by unavoidable errors
such as quantization errors, aperture errors, non-linearity errors when applicable, etc.
Similarly, digital to analog conversion of information is not ideal either. Further-
more, the said errors are mostly random. Thus, the challenge that an adversary has
to face consists in how to differentiate between randomly imperfect views of a target
continuous space.
6.3.2 Deceptive Emulation via Network Traffic Mirroring
Traffic mirroring is a technique for emulating a continuous space. Thus, it is an
alternative to continuous simulation. The main idea behind this emulation technique
is to sniff network traffic in a process control network in production, i.e. a process
control network that is used to operate an existing physical system, and thereafter
replay the said traffic in a deceptive process control network, i.e. a process control
network that is deployed as part of a mirage theory application. A schematic diagram
of how traffic mirroring may be applied is depicted in Figure 6.4.
As of the time that the research reported in this chapter was conducted, we had no

Chapter 6: MIRAGE THEORY FOR DECEPTION-BASED DETECTION 125
access for experimentation purposes to a real world power plant. Due do this lim-
itation we couldn’t implement network traffic mirroring and analyze it in practice,
consequently we describe it in this chapter as a theoretical approach to emulation of a
continuous space. In addition, the concepts that accompany our proposal of the said
emulation technique, including network sniffing systems, traffic mirroring network,
and inspection tool, are purely hypothetical.
The deceptive process control network, which is depicted in the left part of Figure 6.4,
is the replica of a process control network in production, which is depicted in the right
part of Figure 6.4. Network sniffing systems are deployed in all network segments of
the process control network in production. These systems are equipped with two net-
work interfaces, namely one attached to a segment of the process control network in
production, and another one attached to a network that is used to propagate network
packets to the deceptive process control network. We refer to the latter as a traffic
mirroring network.
The network sniffing systems operate at the data link layer, therefore they are not
assigned a network layer address on the network interface that is attached to a seg-
ment of the process control network in production. Furthermore, for obvious reasons
we need the network sniffing systems not to reveal their existence. For this purpose
the network stack of a network sniffing system may be modified such that it doesn’t
respond to any queries, and hence evade network discovery tools. The network sniff-
ing systems are assigned a network layer address on the network interface that is
attached to the traffic mirroring network.
As network packets flow across the process control network in production, they are

Chapter 6: MIRAGE THEORY FOR DECEPTION-BASED DETECTION 126
intercepted by the network sniffing systems, which in turn associate a timestamp with
them and send them to the general purpose computers depicted in the right part of
Figure 6.4. More precisely, network packets that convey set points and that are trans-
mitted by the HMI system in the process control network in production are sent to
the replica of a HMI system in the deceptive process control network. At emulation
time the replica of a HMI system replays these network packets into the deceptive
process control network according to their associated timestamps.
Network packets that convey sensor data are sent to those computer systems that are
equipped with digital to analog converters. In Figure 6.4, for example, to each one
of the flowmeters corresponds a computer system, which at emulation time converts
sensor data from digital to analog according to their timestamps. Thus, in general
the said systems emulate transducers that are in the process control network in pro-
duction. Sniffing and replaying network packets that convey set points and sensor
data is sufficient for emulating a continuous space.
As set points are transmitted from the replica of a HMI system into the deceptive
process control network, they trigger exchanges of network packets between control
systems, with the result being a transmission of network packets that convey actua-
tor control data. Upon reception of the said data, actuators in the deceptive process
control network generate electrical signals, which are received from computer systems
in the traffic mirroring network that are equipped with digital to analog converters.
Once these computer systems derive the digital form of an analog value, they ignore
it as their only objective is to mimic the reception of physical parameter changes by
physical equipment.
Chapter 6: MIRAGE THEORY FOR DECEPTION-BASED DETECTION 127
As computer systems that emulate transducers generate electrical signals, which cor-
respond to the analog form of sensor data that are received from network sniffing
systems, these signals are converted into digital sensor data and then are transmitted
over the deceptive process control network.
The resulting network packets, which convey the said sensor data, trigger exchanges
of network packets between control systems in the deceptive process control network.
Some of these sensor data are also sent to the replica of a HMI system in the form of
process status updates. Thus, overall, what we expect to achieve with synchronized
replays of set points and sensor data is a logical mirror. The said mirror is intended to
reflect network packets that flow across the process control network into the deceptive
process control network, with a shift ∆t with respect to time.
With regard to detection of malicious network packets, we propose an adaptation of
the approach used in the case continuous simulation is used to simulate a continuous
space. More precisely, we propose to model each control system in the process control
network in production as a communicating finite state machine like those depicted
in Figure 6.3. The emulation and intrusion detection activities are organized into
intervals of time ∆t. During each one of these intervals the network sniffing systems
intercept network packets as they flow across the process control network in produc-
tion.
If we assume that the activity of constructing automata can be automated, then
the said network packets are used in an automated construction of communicating
finite state machines, which model control systems in the process control network
in production. The interval of time ∆t is chosen sufficiently long for the automated
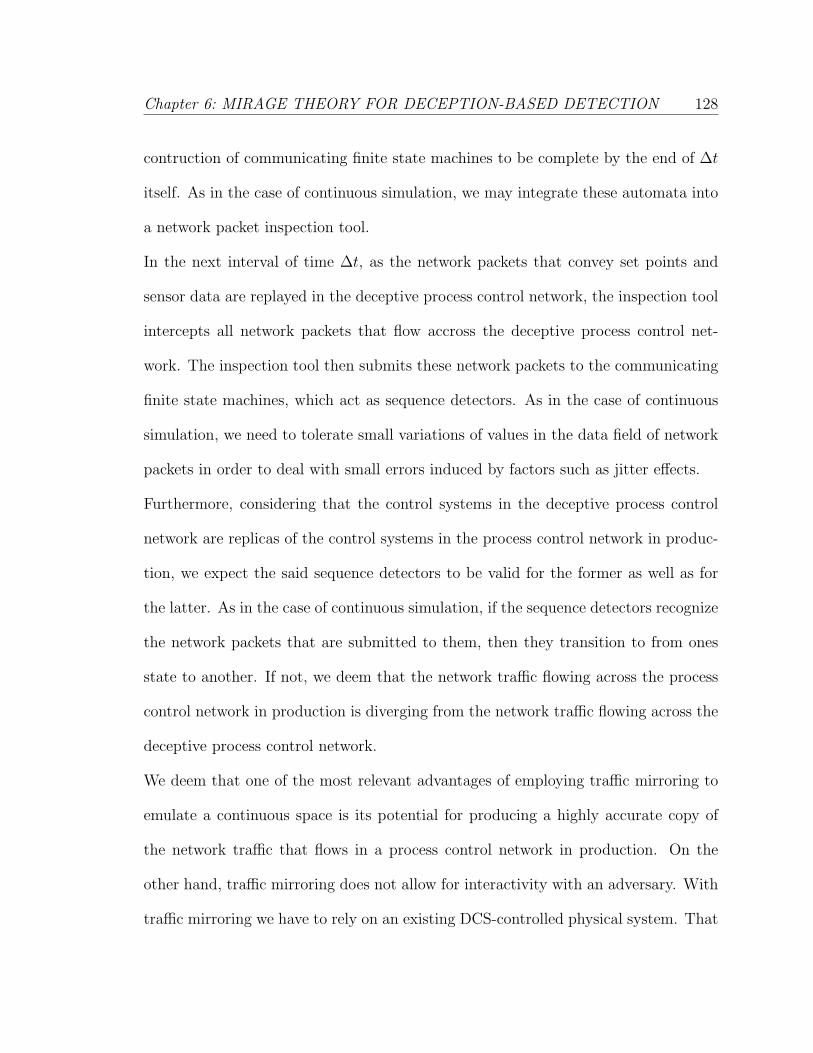
Chapter 6: MIRAGE THEORY FOR DECEPTION-BASED DETECTION 128
contruction of communicating finite state machines to be complete by the end of ∆t
itself. As in the case of continuous simulation, we may integrate these automata into
a network packet inspection tool.
In the next interval of time ∆t, as the network packets that convey set points and
sensor data are replayed in the deceptive process control network, the inspection tool
intercepts all network packets that flow accross the deceptive process control net-
work. The inspection tool then submits these network packets to the communicating
finite state machines, which act as sequence detectors. As in the case of continuous
simulation, we need to tolerate small variations of values in the data field of network
packets in order to deal with small errors induced by factors such as jitter effects.
Furthermore, considering that the control systems in the deceptive process control
network are replicas of the control systems in the process control network in produc-
tion, we expect the said sequence detectors to be valid for the former as well as for
the latter. As in the case of continuous simulation, if the sequence detectors recognize
the network packets that are submitted to them, then they transition to from ones
state to another. If not, we deem that the network traffic flowing across the process
control network in production is diverging from the network traffic flowing across the
deceptive process control network.
We deem that one of the most relevant advantages of employing traffic mirroring to
emulate a continuous space is its potential for producing a highly accurate copy of
the network traffic that flows in a process control network in production. On the
other hand, traffic mirroring does not allow for interactivity with an adversary. With
traffic mirroring we have to rely on an existing DCS-controlled physical system. That
Chapter 6: MIRAGE THEORY FOR DECEPTION-BASED DETECTION 129
Figure 6.4: Schematic diagram of an emulation of a continuous space via trafficmirroring.
said, a logical connection with a process control network in production may be a
disadvantage as much as an advantage.
While we cannot independently deploy an entire process control network and associate
it with an emulated continuous space, divergences captured by the sequence detectors
may be an indication of intrusion in the process control network in production.

Chapter 6: MIRAGE THEORY FOR DECEPTION-BASED DETECTION 130
6.4 Analysis of Deception Capabilities in Mirage
Theory
We now provide a practical attack-defense model in order to analyze the deception
capabilities of mirage theory. In this model an adversary attempts a loss of cooling
attack on a DCS-controlled power plant that is based on a boiling water reactor de-
sign. In the said power plant a number of water pumps feed water into the reactor
core. The injected water picks up the heat produced by nuclear fission, and thereafter
is transformed into steam. Steam is then directed through pipes to spin the shaft of
a turbine that is connected to an electric generator. In addition to being transformed
into steam, the injected water serves to also cool nuclear fuel in the reactor.
Let water be fed into a reactor core by motor-driven water pumps that are controlled
by PLCs. In this example attack-defense model the adversary conducts a computer
network attack on these PLCs in order to cause physical damage to the motors that
they control, and hence prevent the motor-driven water pumps from functioning. Let
the PLCs that control motor-driven water pumps in this model be part of a DCS
whose communications are based on ModBus TCP protocol.
For an adversary to affect the operation of an electric motor, he/she should prelimi-
narily identify that part of a cyber-physical mapping which relates program variables
in a target PLC with physical parameters that characterize the operation of the as-
sociated electric motor. This is due to the fact that an adversary can affect these
physical parameters only by modifying the corresponding program variables. We pro-
vide a statistical technique that may be used for such purpose. We thereafter show
Chapter 6: MIRAGE THEORY FOR DECEPTION-BASED DETECTION 131
how mirage theory deceives an adversary by generating data that guide his/her data
analysis, and hence quantify empirically the deception capabilities exhibited in this
attack-defense model by analyzing under the light of signal detection theory [66, 82]
the reaction of mirage theory.
6.4.1 Reconnaissance for a Computer Network Attack on an
Electric Motor
We have found persistent statistical relations between certain program variables
in RAM of PLCs, depending on what physical parameters they are mapped to. More
precisely, we have developed a statistical technique which, under the condition that
a linear relation between program variables of interest is in place, employs the degree
of linear association as measured by a linear correlation coefficient to identify such
variables of interest and hence reveal their ModBus addresses [24]. In our attack-
defense model an adversary applies the said technique to conduct a network inertial
attack on an alternating current (AC) induction motor [53], which in turn drives a
water pump.
An inertial attack is conducted by speeding up or slowing down heavy equipment
at high rates. It is reported to have potential for forcing heavy equipment to fail
as in general heavy equipment is not tolerant to abrupt speed changes [70]. For an
adversary to be able to launch an inertial attack, he/she needs to find out what pro-
gram variable in the RAM of a target PLC is mapped to applied voltage frequency,
which is a physical parameter that is used to set the actual rotational speed of an AC
induction motor controlled by the PLC in question.
Chapter 6: MIRAGE THEORY FOR DECEPTION-BASED DETECTION 132
Let this PLC use a continuous sensor, namely a battery powered stroboscopic tachome-
ter, to measure the rotational speed of the AC induction rotor. The adversary is
assumed to have acquired access to a target process control network, and hence can
reconstruct the content of variables in the RAM of a target PLC by sniffing network
packets or by sending ModBus queries to the target PLC. The first step for the adver-
sary is to find out whether a program variable of interest in a target PLC is linearly
correlated with other program variables that are acquirable via network sniffing or
scanning.
Referring to our model, an adversary is interested in finding out whether a program
variable that is mapped to applied voltage frequency in a target PLC, which con-
trols an AC induction motor, can be linearly associated with a variable, say actual
rotational speed, that is available in the discrete space. Let γ, ω, τ , p, δ, l, and ν
denote applied voltage frequency, actual rotational speed, synchronous speed, number
of poles, magnetic slip, load, and nameplate speed at full load of an AC induction
motor, respectively.
In laboratory settings we study a PLC-controlled AC induction motor that is char-
acterized by values of physical parameters p, δ, τ , ν, and l, chosen randomly among
those available. These values are given in Table 6.1. Our thesis is that, although the
internal architecture and configuration of a randomly chosen AC induction motor may
be totally different than the internal architecture and configuration of an AC induc-
tion motor controlled by the target PLC, some program variables that are mapped to
physical parameters such as γ and ω exhibit hidden but calculable statistical relations.
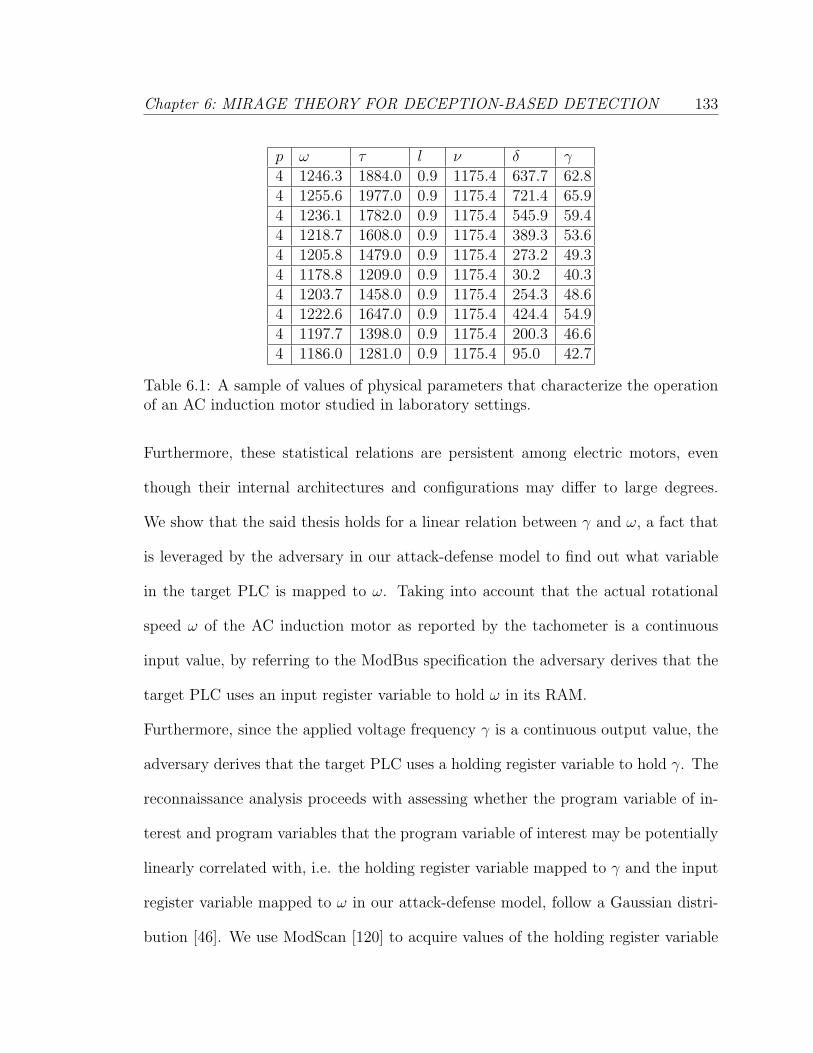
Chapter 6: MIRAGE THEORY FOR DECEPTION-BASED DETECTION 133
p ω τ l ν δ γ4 1246.3 1884.0 0.9 1175.4 637.7 62.84 1255.6 1977.0 0.9 1175.4 721.4 65.94 1236.1 1782.0 0.9 1175.4 545.9 59.44 1218.7 1608.0 0.9 1175.4 389.3 53.64 1205.8 1479.0 0.9 1175.4 273.2 49.34 1178.8 1209.0 0.9 1175.4 30.2 40.34 1203.7 1458.0 0.9 1175.4 254.3 48.64 1222.6 1647.0 0.9 1175.4 424.4 54.94 1197.7 1398.0 0.9 1175.4 200.3 46.64 1186.0 1281.0 0.9 1175.4 95.0 42.7
Table 6.1: A sample of values of physical parameters that characterize the operationof an AC induction motor studied in laboratory settings.
Furthermore, these statistical relations are persistent among electric motors, even
though their internal architectures and configurations may differ to large degrees.
We show that the said thesis holds for a linear relation between γ and ω, a fact that
is leveraged by the adversary in our attack-defense model to find out what variable
in the target PLC is mapped to ω. Taking into account that the actual rotational
speed ω of the AC induction motor as reported by the tachometer is a continuous
input value, by referring to the ModBus specification the adversary derives that the
target PLC uses an input register variable to hold ω in its RAM.
Furthermore, since the applied voltage frequency γ is a continuous output value, the
adversary derives that the target PLC uses a holding register variable to hold γ. The
reconnaissance analysis proceeds with assessing whether the program variable of in-
terest and program variables that the program variable of interest may be potentially
linearly correlated with, i.e. the holding register variable mapped to γ and the input
register variable mapped to ω in our attack-defense model, follow a Gaussian distri-
bution [46]. We use ModScan [120] to acquire values of the holding register variable
Chapter 6: MIRAGE THEORY FOR DECEPTION-BASED DETECTION 134
mapped to γ and values of the input register variable mapped to ω over a defined
period of time from the testing PLC that controls the AC induction motor in labo-
ratory settings.
These values are given in Table 6.1 along with the values of physical parameters p, δ,
τ , ν, and l mentioned previously. A series of ModBus scanner tools such as ModScan
[13, 120] have been developed for security assessments, and some of them are publicly
available. These tools enable a security analyst or adversary to acquire the values of
discrete input variables, coil variables, input register variables, and holding register
variables, which are stored in the RAM of a target PLC.
Furthermore, most of these tools also enable a security analyst or adversary to send
attack packets that attempt to write to logical or word variables in a target PLC once
he/she has identified the cyber-physical mapping. ModBus variables in a target PLC
may be scanned several times, a process that normally produces a large set of data.
The challenge consists in analyzing these data to identify a cyber-physical mapping,
and it is this challenge that is addressed by the proposed statistical technique. Let γ
and ω denote the mean average of γ and the mean average of ω, respectively. γ and
ω are estimated through the formulae shown below:
γ =
(∑10i=1 γ
10
)= 52.41 (6.1)
and
ω =
(∑10i=1 ω
10
)= 1215.13 (6.2)
The normal density curves for γ and ω are depicted in Figure 6.5. Under the condition
that the program variables that are being analyzed follow a Gaussian distribution,
the adversary applies the least squares regression method [11] to estimate the regres-

Chapter 6: MIRAGE THEORY FOR DECEPTION-BASED DETECTION 135
Figure 6.5: Normal density curves for applied voltage frequency γ and actual motorrotational speed ω, left and right respectively, in which the standard deviation of γis 8.46751 and the standard deviation of ω is 25.40254
sion line that characterizes the linear relationship between these program variables.
More precisely, he/she estimates the intercept and slope of this regression line, and
hence builds the regression line itself along with a scatter plot displaying values of
the program variables under investigation.
He/she then uses the regression line and the scatter plot to characterize the degree
of linear association between these program variables, and hence estimates their lin-
ear regression coefficient. In our specific attack-defense model the adversary pilots
his analysis towards quantification of a linear relation between the holding register
variable that is mapped to γ and the input register variable that is mapped to ω.
More precisely, he/she is interested in their degree of linear association as measured
by a linear correlation coefficient that we denote with r. In the analysis of the data
that are shown in Table 6.1 we consider γ as a dependent variable, and ω as an
independent variable. Note that we are not assuming causality between these two
program variables in this order. Let a and b denote intercept and slope, respectively,
Chapter 6: MIRAGE THEORY FOR DECEPTION-BASED DETECTION 136
in the linear relation between γ and ω. The linear relation between γ and ω is modeled
by the equation below:
γ = a+ b ω (6.3)
where a and b are estimated via least squares regression [11] as shown in the following
equations:
b =
(∑10i=1 ((ωi − ω) (γi − γ))∑10
i=1 (ωi − ω)2
)= 0.33 (6.4)
γ = a+ b ω ⇒ a = γ − b ω = −352.6 (6.5)
Thus, the linear relation between γ and ω is modeled as:
γ = (−352.6) + 0.33 ω (6.6)
The scatter plot and linear regression line for this linear relation are depicted in
Figure 6.6. Let γ denote the values of γ estimated by the linear regression line
of Figure 6.6. The linear correlation coefficient r measuring the degree of linear
association between γ and ω is estimated by the following equation:
r = (
√∑10i=1(γi − γ)2∑10i=1(γi − γ)2
) = 1 (6.7)
Armed with a quantification of the correlation coefficient r that measures the degree of
linear association between γ and ω, an adversary reconstructs the content of program
variables that are stored in the RAM of a target PLC. Table 6.2 presents a sample of
these data. For the sake of clarity, IR and HR stand for input register variable and
holding register variable, respectively. The ModBus address of each reconstructed
variable is given in square brackets. Recall that the adversary has already derived
that it is an input register variable and a holding register variable in the RAM of the
target PLC that is mapped to ω and γ, respectively.
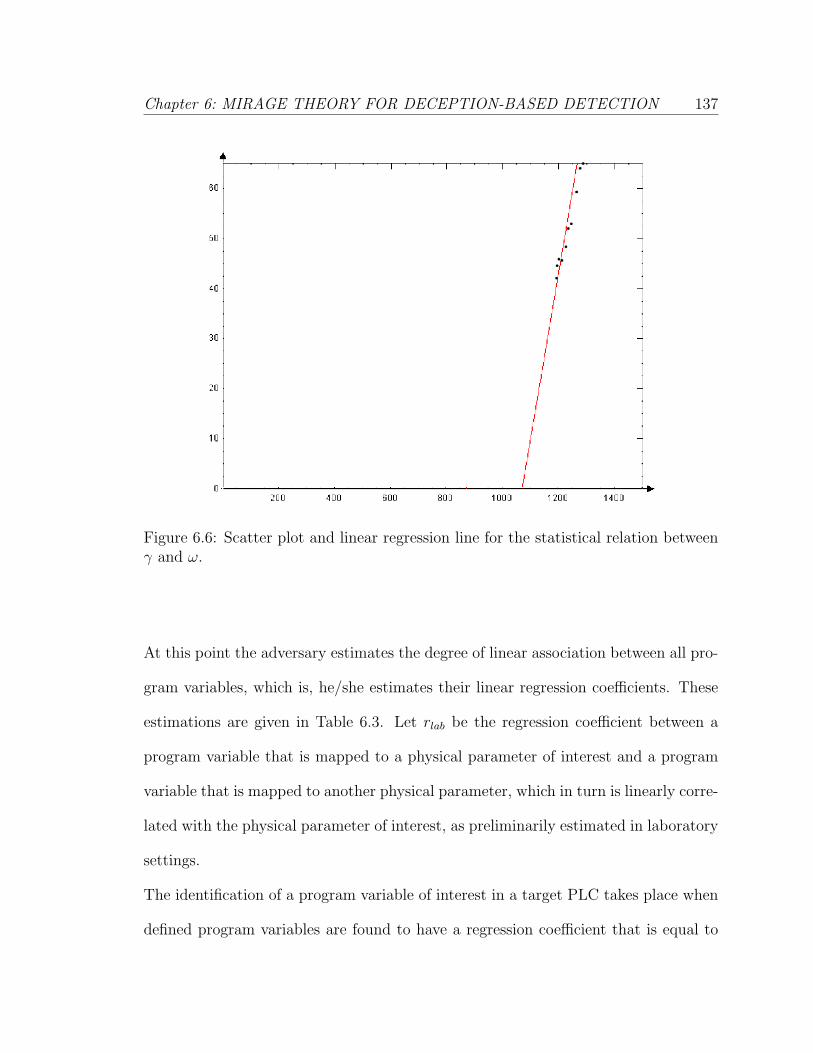
Chapter 6: MIRAGE THEORY FOR DECEPTION-BASED DETECTION 137
Figure 6.6: Scatter plot and linear regression line for the statistical relation betweenγ and ω.
At this point the adversary estimates the degree of linear association between all pro-
gram variables, which is, he/she estimates their linear regression coefficients. These
estimations are given in Table 6.3. Let rlab be the regression coefficient between a
program variable that is mapped to a physical parameter of interest and a program
variable that is mapped to another physical parameter, which in turn is linearly corre-
lated with the physical parameter of interest, as preliminarily estimated in laboratory
settings.
The identification of a program variable of interest in a target PLC takes place when
defined program variables are found to have a regression coefficient that is equal to

Chapter 6: MIRAGE THEORY FOR DECEPTION-BASED DETECTION 138
IR[16] IR[53] IR[18] IR[69] HR[19685] HR[20008] HR[18610] HR[655]702.5 1884.0 1205.3 685.2 63.9 36.5 42.1 49.6803.8 1977.0 903.9 679.2 55.4 39.2 41.6 52.4901.8 1782.0 1306.9 722.4 55.8 38.3 45.2 62.3904.1 1608.0 1004.8 763.2 67.3 45.8 48.6 60.11004.7 1884.0 1407.8 735.6 57.8 48.1 46.3 59.2903.1 1977.0 1409.4 796.8 58.1 49.3 51.4 57.31004.9 1782.0 1408.3 868.8 61.8 51.5 57.4 57.9809.6 1608.0 1598.3 817.2 48.9 58.3 53.1 61.41208.8 1782.0 1203.9 890.2 38.9 61.8 59.1 63.8803.5 1608.0 957.5 945.6 48.6 47.5 63.8 65.0
Table 6.2: Excerpt from the data set acquired through ModScan from a target PLC.
IR[16] IR[53] IR[18] IR[69]HR[19685] -0.41 0.16 -0.05 -0.54HR[20008] 0.64 -0.36 0.43 0.71HR[18610] 0.4 -0.54 0.05 0.99HR[655] 0.49 -0.66 0.1 0.72
Table 6.3: Measurements of the degree of linear association between holding registervariables and input register variables that were scanned from the memory of a targetPLC.
rlab. Thus, in our specific attack-defense model the holding register variable that is
mapped to applied voltage frequency γ is the one whose linear association with an
input register variable, which is presumably mapped to the actual rotational speed
rlab, has a degree that is equal to 1.
From referring to Table 6.3 we see that the ModBus address of the holding register
variable that is mapped to applied voltage frequency γ is 18610. Furthermore, the
ModBus address of the input register variable that is mapped to actual rotational
speed is 69. In fact the correlation coefficient of these two program variables is slightly
less than 1, namely 0.99, since a series of roundings of numbers were performed during
Chapter 6: MIRAGE THEORY FOR DECEPTION-BASED DETECTION 139
the mathematical estimations.
6.4.2 Empirical Quantification of Deception Effects
The reconnaissance for a loss of cooling attack produces information such as pres-
ence of motor-driven water pumps that are controlled over a reachable discrete space,
presence of physical processes such as nuclear fission, evaporation, condensation, etc.,
in a target continuous space, address or name of a program variable in the RAM of
a target PLC that is mapped to applied voltage frequency, the IP address of a target
PLC, the TCP port used by a slave ModBus application in a target PLC to receive
and send data, etc.
This information has a direct influence on the adversary’s decision making process
with regard to target selection and attack engineering. Mirage theory intervenes dur-
ing the reconnaissance process with the objective of interfering with the adversary’s
decision-making process. Such interference is conducted by manipulating the adver-
sary’s perception of a target continuous space through the lenses of an associated
discrete space. We analyze the effects of mirage theory on the adversary’s decision-
making process under the light of signal detection theory.
Signal detection theory is a method to characterize and quantify the ability of a sub-
ject to discern between signal and noise. If we draw three parallel lines between signal
detection theory and mirage theory, namely a parallel line between signal and pres-
ence of existing physical processes and equipment, another parallel line between noise
and simulated or emulated physical processes and equipment, and another parallel
line between subject and adversary, then we end up with applying signal detection

Chapter 6: MIRAGE THEORY FOR DECEPTION-BASED DETECTION 140
theory to characterize and quantify the ability of an adversary to discern between an
existing continuous space and a simulated or emulated continuous space.
The subjects in our analysis comprised a team of students who were taught the in-
ternals of process control networks, ModBus TCP, PLCs, and AC induction motors.
Most importantly, the student team was taught how to apply the statistical technique
discussed in the previous subsection for the purpose of identifying in a large set of
data a holding register variable that is mapped to applied voltage frequency. Thus,
the student team took the role of the adversaries.
The complete network packets exchanged, i.e. network packets that comprise data
link, IP, and TCP headers, and application data units [19], were sniffed and gathered
in a data set, which was presented to members of the student team individually. The
student team was told that only one of the holding register variables is mapped to
an applied voltage frequency. Each member of the student team was asked to recon-
struct the values of program variables from ordered series of network packets printed
on chapter, and from there identify an existing target of a loss of cooling attack by
the means of estimation of degrees of linear association.
This test revealed that during the reconnaissance for a loss of cooling attack an ad-
versary is subject to what in signal detection theory is defined as external noise. The
most common form of external noise met during this test was that the degree of lin-
ear association between several program variables was estimated to be rlab. In other
words, more than two program variables were found to be linearly associated to the
same degree. External noise was found also during the application of other optional
or complementary reconnaissance techniques.
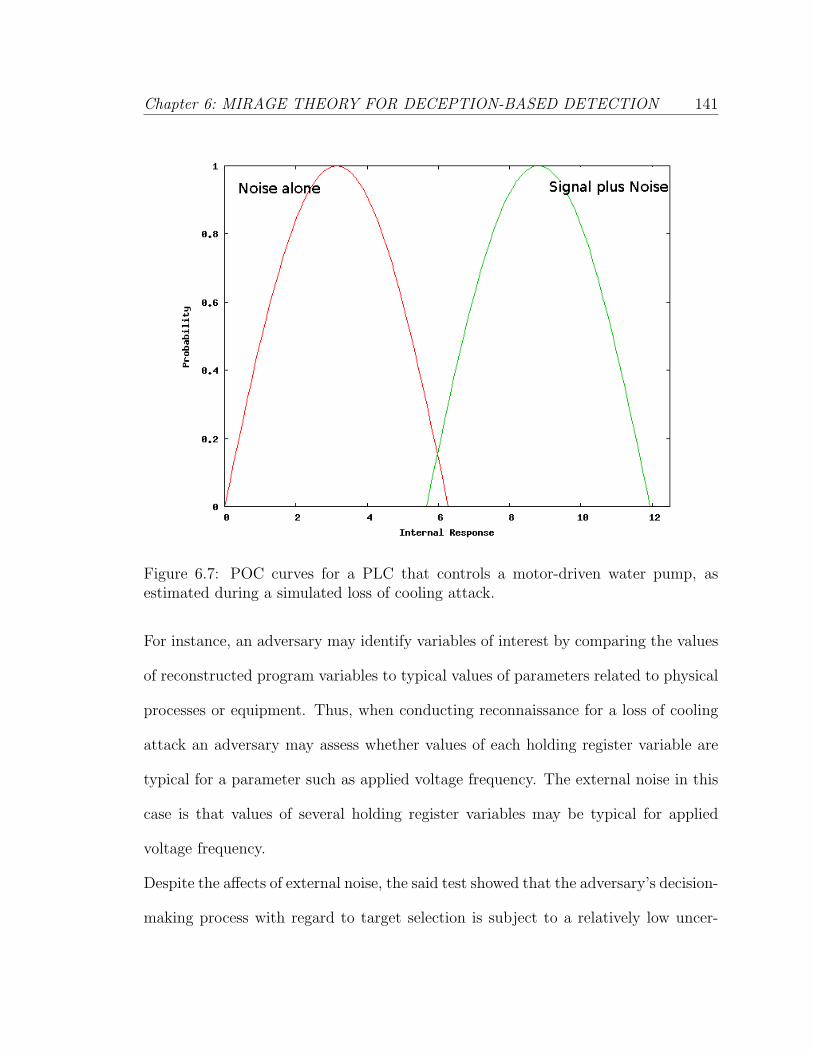
Chapter 6: MIRAGE THEORY FOR DECEPTION-BASED DETECTION 141
Figure 6.7: POC curves for a PLC that controls a motor-driven water pump, asestimated during a simulated loss of cooling attack.
For instance, an adversary may identify variables of interest by comparing the values
of reconstructed program variables to typical values of parameters related to physical
processes or equipment. Thus, when conducting reconnaissance for a loss of cooling
attack an adversary may assess whether values of each holding register variable are
typical for a parameter such as applied voltage frequency. The external noise in this
case is that values of several holding register variables may be typical for applied
voltage frequency.
Despite the affects of external noise, the said test showed that the adversary’s decision-
making process with regard to target selection is subject to a relatively low uncer-

Chapter 6: MIRAGE THEORY FOR DECEPTION-BASED DETECTION 142
tainty. Figure 6.7 depicts the internal response probability of occurrence (POC)
curves that characterize the said uncertainty. The horizontal axis in Figure 6.7 repre-
sents information that motivates an adversary to take the decision that the signal is
present, while the vertical axis represents the frequency of the occurrence of a defined
amount of such information.
The POC curves in Figure 6.7 show that the signal strength is high and the amount of
noise, both external and internal, is low. Consequently the overlap of these two POC
curves is small, while their spread is reduced. The discriminability index derived from
the separation and spread of the two POC curves in Figure 6.7 has a value around
d′= 5.6. Thus, with such a high discriminability index an existing continuous space
is considerably discriminable from a simulated or emulated continuous space.
These estimations overall indicate that adversaries who have expertise in process con-
trol can identify correctly the target of a loss of cooling attack with a high rate of
correct selections and a low rate of wrong selections. The receiver operating char-
acteristic (ROC) curve, which is plotted with hit rate on the vertical axis and false
alarms rate on the horizontal axis, for a discriminability index d′
= 5.6 goes up to
the upper left corner converging with a straight line that intersects the vertical axis
at a value of 100% and is parallel with the horizontal axis.
This ROC curve indicates that an adversary’s decision making process with regard to
target selection is characterized by a large number of hits and just a few false alarms.
The previous test was conducted again, but this time the student team was made
subject to deception effects that were induced by an application of mirage theory.
The target process control network included a number of PLCs that controlled emu-

Chapter 6: MIRAGE THEORY FOR DECEPTION-BASED DETECTION 143
Figure 6.8: POC curves that characterize the uncertainty under which adversariesidentify the target of a loss of cooling attack in the attack-defense model given in thissection.
lated motor-driven water pumps. As in the former test, in the latter test we sniffed a
set of complete network packets that were sent over the process control network, and
thereafter presented them to each member of the student team individually.
Emulation of motor-driven water pumps resulted in generation of deceptive network
packets that drastically increase the uncertainty to which the adversary’s decision-
making process is exposed with regard to target selection. These deceptive commu-
nications acted as what in signal detection theory is defined as internal noise. As
in signal detection theory, a subject, i.e. an adversary, has little or no control over
the internal noise that is emitted during a decision making process. The POC curves

Chapter 6: MIRAGE THEORY FOR DECEPTION-BASED DETECTION 144
Figure 6.9: ROC curve that corresponds to the POC curves of Figure 6.8.
that characterize the uncertainty that was induced by deceptive network packets are
depicted in Figure 6.8.
The internal noise makes an existing continuous space hardly discriminable from a
simulated or emulated continuous space. Under the effects of mirage theory the
strength of the internal response is lowered. More precisely, mirage theory lowers the
discriminability index of the reconnaissance for a loss of cooling attack from d′= 5.6
to d′= 0.45. The effects of mirage theory in terms of hit rates and false alarm rates
are provided by the ROC curve depicted in Figure 6.9.
Chapter 7
A BAYESIAN THEORY OF
CONFIRMATION FOR
INTRUSION REPORT FUSION
7.1 Introduction
Intrusion detection approaches devised for operation in process control networks
are required to be highly effective in terms of probability of detection and false alarms
rate due to the sensitivity of the tasks that those special purpose networks conduct
in industrial environments. More specifically, no single attack on process control
networks can be left undetected due to permanent physical damage that those attacks
have potential to cause on the digitally controlled physical system. False positives
may also prove more costly in process control networks when compared to general
purpose computer networks.
145
Chapter 7: A BAYESIAN THEORY OF CONFIRMATION FOR INTRUSIONREPORT FUSION 146
As Gu et al. and Dietterich show in [43] and [28], respectively, an intrusion detection
ensemble, i.e. a set of diverse intrusion detection algorithms employed as a group,
outperforms each one of those diverse algorithms used individually. Moving along this
line, we have devised three intrusion detection algorithms especially for process control
networks, namely an Estimation-Inspection (EI) algorithm, a physical process aware
specification-based approach, and a theory of deception that we refer to as mirage
theory.
We now propose in this dissertation a probabilistic technique for fusing the intrusion
reports generated by such intrusion detection approaches. This fusion technique is
a Bayesian theory of confirmation whose objective is to have the three intrusion
detection approaches correct the limitations of each other while contributing to a
joint intrusion detection intelligence.
7.2 Problem Statement
Let us recall the modeling of the portion of RAM of control systems that is used
to store sensor data and actuator control data along with set points as the matrix
given below:

Chapter 7: A BAYESIAN THEORY OF CONFIRMATION FOR INTRUSIONREPORT FUSION 147
W =
x1 x2 . . . . . . . . . . . . .
. . . . . . . . . . . . . . . . .
. . . . . . . . . . . . . . . xl
xl+1 xl+2 . . . . . . . . . .
. . . . . . . . . . . . . . . . .
. . . . . . . . . . . . . . . xm
xm+1 xm+2 . . . . . . . . . .
. . . . . . . . . . . . . . . . .
. . . . . . . . . . . . . . . xn
xn+1 xn+2 . . . . . . . . . .
. . . . . . . . . . . . . . . . .
. . . . . . . . . . . . . . . xg
where x1, x2, ..., xl model input register variables, xl+1, xl+2, ..., xm model holding
register variables, xm+1, xm+2, ..., xn model discrete input variables, and xn+1, xn+2,
..., xg model coil variables. Network packets that are formatted according to a mon-
itoring and control communication protocol such as ModBus, and that flow across a
process control network, read or write input register variables, holding register vari-
ables, discrete input variables, and coil variables.
From a modeling perspective, these network packets read or write elements of the
matrix W , namely x1, x2, ..., xg. Let us define a combination of values of x1, x2,
..., xg as a state of the DCS-controlled physical system. Thus, the set of states of
the DCS-controlled physical system is comprised of all possible combinations of all
possible values of x1, x2, ..., xg. Clearly a network packet that writes an element of
Chapter 7: A BAYESIAN THEORY OF CONFIRMATION FOR INTRUSIONREPORT FUSION 148
the matrix W evolves the state of a DCS-controlled physical system. So may do a
network packet that reads an element of the matrix W , since the read value, if new,
is usually stored in another element of the matrix W .
A normal operation of a DCS-controlled physical system is comprised of network
packets that evolve the states of the said DCS-controlled physical system. Computer
network attacks on control systems inject data into the RAM of control systems via
malicious network packets, and hence they also evolve the state of a target DCS-
controlled physical system. The challenge of determining whether a network packet
is normal or abnormal takes the form of determining whether the network packet
in question is taking a DCS-controlled physical system from a normal state into an
abnormal state.
This challenge is exactly what we attack via the EI algorithm, the specification-based
approach, and the mirage theory. Given a state of a DCS-controlled physical system,
each one of these approaches has its own algorithmic logic to estimate the normalcy
or abnormality of the said state. They classify a network packet as normal only if the
packet in question is taking a DCS-controlled physical system into a state that they
deem as being normal. In our research we have demonstrated the effective intrusion
detection features of these three approaches, while not leaving any shortcomings be-
hind.
In other words, we are not aware of any shortcomings of the EI algorithm, the
specification-based approach, and the mirage theory, which could potentially become
sources of false positives and/or false negatives. Nevertheless, we believe that it is
rational to assume that these three approaches do have a series of shortcomings,
Chapter 7: A BAYESIAN THEORY OF CONFIRMATION FOR INTRUSIONREPORT FUSION 149
which simply are unknown to us. We seek an intrusion report fusion technique that
could enable us to have the various intrusion detection approaches eliminate, or at
least alleviate, the shortcomings of each other, while contributing with their effective
intrusion detection features to a joint intrusion detection intelligence.
Let Hn denote the hypothesis that a network packet under inspection is normal, and
Ha the hypothesis that the network packet under inspection is abnormal. Employ-
ing individually the EI algorithm, the specification-based approach, and the mirage
theory, we can estimate the probability that hypothesis Hn holds and the probability
that hypothesis Ha holds. Let us denote these probabilities as P (Hn) and P (Ha),
respectively. The idea behind the intrusion report fusion technique is to revise P (Hn)
and P (Ha) in such a way as to reduce the overall number of false positives and false
negatives, and with that increase the confidence with which to detect intrusions when
they really take place in a process control network.
We have the EI algorithm, the specification-based approach, and the mirage theory,
generate pieces of evidence in the form of intrusion reports for any of the two hypothe-
ses Hn and Ha that they may defend after each network packet inspection1. Each
such piece of evidence is reducible to the specification of a state of the DCS-controlled
physical system that each one of the approaches may deem as being normal or abnor-
mal, respectively. The said state is where a network packet under inspection is taking
the DCS-controlled physical system to. Following the Heuer’s ACH methodology, we
work on a matrix with hypotheses across the top and pieces of evidence down the
1Mirage theory generates an intrusion report only if the network packet under inspection operateson any of the deceptive variables. If that is not the case, mirage theory remains neutral with regardto support or rejection of the normalcy and abnormality hypotheses.

Chapter 7: A BAYESIAN THEORY OF CONFIRMATION FOR INTRUSIONREPORT FUSION 150
side.
An example of such matrix is given in Figure 7.1. Given a piece of evidence X =
(val(x1), val(x2), ..., val(xg)), where val(xk) denotes a specific value of xk for k ∈
{1, 2, ..., g}, we are interested to estimate the degrees to which each one of the two hy-
potheses Hn and Ha is confirmed by the three intrusion detection approaches through
X. In this case the EI algorithm, the specification-based approach, and the mirage
theory are employed simultaneously in parallel. Let us denote the said degrees of
confirmation as P (Hn | X) and P (Ha | X), respectively.
In this research we use the Bayes theorem in its ratio form in order to estimate and
compare the posterior probabilities P (Hn | X) and P (Ha | X) from the prior proba-
bilities P (Hn) and P (Ha). For being able to do so, for each one of the hypotheses Hn
and Ha individually, we need to compute a probability distribution, i.e. a probability
density function, that indicates the likelihood of occurrence of each possible piece of
evidence were the associated hypothesis true.
Such likelihoods are also known as hypothesis-based probabilities of evidence [45],
which in this research we denote as P (X | Hn) and P (X | Ha), respectively. Re-
assembling, we need to compute all of the terms on the right of the equation given
below:
P (Hn | X)
P (Ha | X)=P (X | Hn)
P (X | Ha)
P (Hn)
P (Ha)
which is the Bayes theorem in its ratio form as applied to our problem domain.
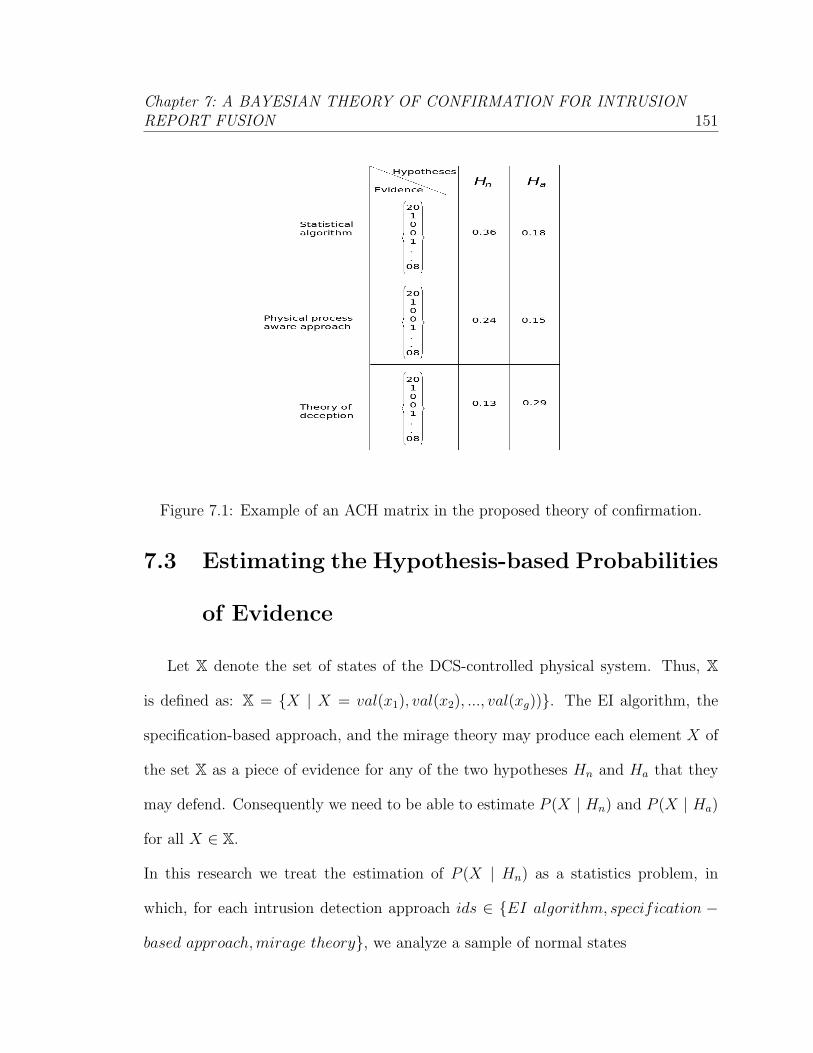
Chapter 7: A BAYESIAN THEORY OF CONFIRMATION FOR INTRUSIONREPORT FUSION 151
Figure 7.1: Example of an ACH matrix in the proposed theory of confirmation.
7.3 Estimating the Hypothesis-based Probabilities
of Evidence
Let X denote the set of states of the DCS-controlled physical system. Thus, X
is defined as: X = {X | X = val(x1), val(x2), ..., val(xg))}. The EI algorithm, the
specification-based approach, and the mirage theory may produce each element X of
the set X as a piece of evidence for any of the two hypotheses Hn and Ha that they
may defend. Consequently we need to be able to estimate P (X | Hn) and P (X | Ha)
for all X ∈ X.
In this research we treat the estimation of P (X | Hn) as a statistics problem, in
which, for each intrusion detection approach ids ∈ {EI algorithm, specification −
based approach,mirage theory}, we analyze a sample of normal states
Chapter 7: A BAYESIAN THEORY OF CONFIRMATION FOR INTRUSIONREPORT FUSION 152
{X ∈ X | X is normal ∧X is classified as normal by ids} to infer the probability
distribution that has most likely generated the said sample of states from the per-
spective of approach ids.
The said probability distribution is selected from the unconstrained probability model
on X, i.e. a non-empty set of all possible probability distributions on X. We fol-
low the same approach to the estimation of P (X | Ha), but this time, for each
intrusion detection approach ids, we analyze a sample of abnormal states {X ∈
X | X is abnormal ∧ X is classified as abnormal by ids}. We cannot compute
P (X | Hn) and P (X | Ha) directly as we are in a setting in which we are incom-
pletely informed. Let us see why.
Our statistical analysis is based on a set of network packets sniffed from the process
control network of a real world DCS-controlled physical system as the latter is oper-
ated normally. From the said set of data we can derive the sample of normal states
that were followed by the DCS-controlled physical system throughout its normal oper-
ation. This sample of normal states contains only a limited number of the population
of all possible normal states of the DCS-controlled physical system. Furthermore,
the generation of all possible combinations of all possible values of x1, x2, ..., xg that
constitute a normal state is unpractical.
Consequently our statistical analysis would cover only the specific states that appear
in the sample of normal states, with the consequence being that we cannot estimate
P (X | Hn) if X does not appear in the sample of normal states. A similar limitation
holds with regard to the estimation of P (X | Ha). We can generate a set of abnormal
network packets, and thus consider them in conjunction with the sample of normal
Chapter 7: A BAYESIAN THEORY OF CONFIRMATION FOR INTRUSIONREPORT FUSION 153
states in order to derive a sample of abnormal states.
This sample of abnormal states contains only a limited number of the population of
all possible abnormal states of the DCS-controlled physical system. This is because
clearly the attacks that we could generate are only a sample of the population of all
possible attacks on the DCS-controlled physical system. Furthermore, the generation
of all possible combinations of all possible values of x1, x2, ..., xg that constitute an
abnormal state is unpractical.
Since our statistical analysis would cover only the specific states that appear in the
sample of abnormal states, we cannot estimate P (X | Ha) if X does not appear in the
sample of abnormal states. The approach that we take to overcome these limitations
is to transform the problem of estimating P (X | Hn) and P (X | Ha) in a form that
allows us to attack it by applying the Expectation-Maximization (EM) algorithm [27].
We do so as the EM algorithm is known to be effective with regard to estimation of
probability distributions in a setting in which we are informed only in part. The
majority of the statistical concepts that underlie our discussion in this section are
drawn from the context of the EM algorithm [27].
7.3.1 Developing Incomplete-data Spaces and the Associated
Symbolic Analyzers
The set of states of the DCS-controlled physical system X is a complete-data space
comprised of types X. If X = val(x1), val(x2), ..., val(xg), then
P (X | Hn) = P (val(x1) | Hn) P (val(x2) | Hn) ...... P (val(xg) | Hn)
Chapter 7: A BAYESIAN THEORY OF CONFIRMATION FOR INTRUSIONREPORT FUSION 154
and
P (X | Ha) = P (val(x1) | Ha) P (val(x2) | Ha) ...... P (val(xg) | Ha)
This means that the problem of estimating the probability distributions on X that
are most likely to have generated the aforementioned samples of states, is reduced
to identifying the corresponding probability distributions on each variable xk, for
k ∈ {1, 2, ..., g}, that are most likely to have generated those samples of states.
In this research we define an incomplete-data space for each variable xk, where
k ∈ {1, 2, ..., g}. Let us first discuss the process of defining an incomplete-data space
for a word variable, say x1.
This process is depicted in Figure 7.2. The segment of possible values of x1 is parti-
tioned into δ subsegments of contiguous values of x1. We refer to these subsegments
as δ partitions. For example, in Figure 7.2 the possible values of x1 are organized into
four δ partitions. Let anyval(xk) denote any possible value of xk. An incomplete-data
type Yj consists of (y1, y2, ..., yg), where y1 is any value of x1 that lies in the j-th δ
partition, while y2, ..., yg are equal to anyval(x2), ..., anyval(xg), respectively. Let Y
denote the incomplete-data space for variable x1.
In this case Y is comprised of the incomplete-data types {Y1, Y2, Y3, Y4}. The choice of
δ is proportional to the size of the segment of possible values of x1. The incomplete-
data space for a logical variable, say x1 again, is defined in a similar way. This time δ
can only be two, and thus the two possible δ partitions are 0 and 1. The incomplete-
data types Y1 and Y2 consist of (y1, y2, ..., yg), where y1 = 0 and y1 = 1, respectively. In
both of these incomplete-data types, y2, ..., yg are equal to anyval(x2), ..., anyval(xg),
respectively.
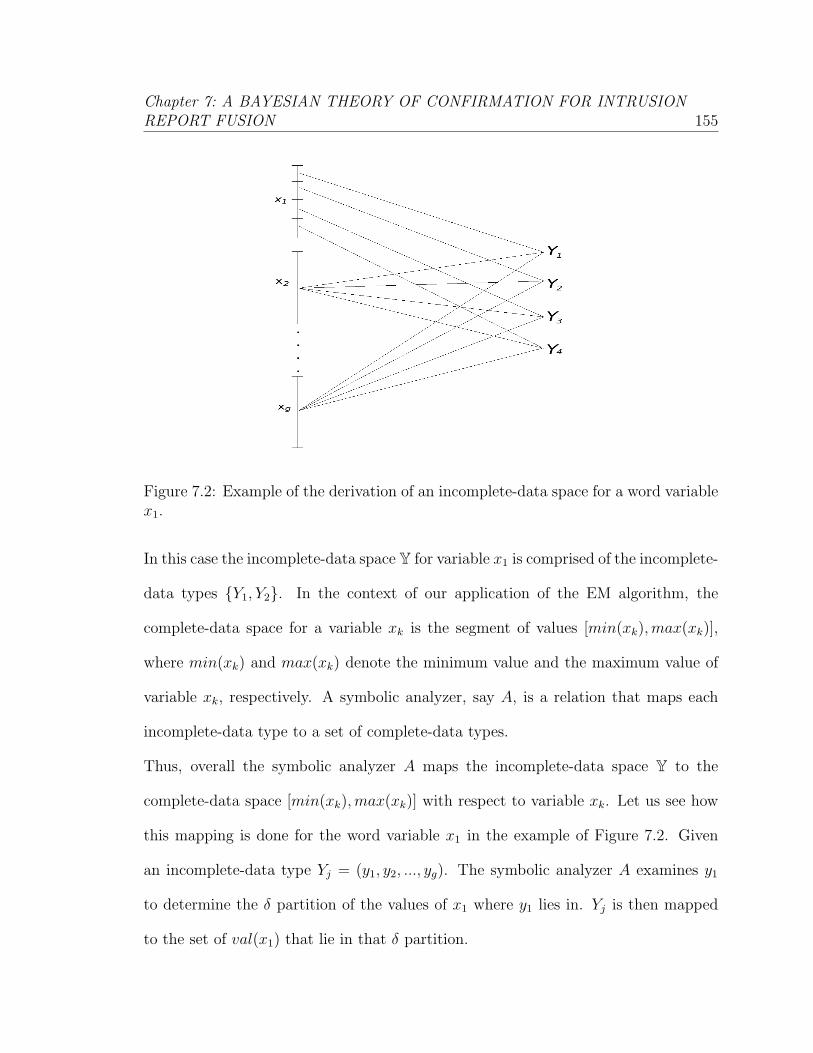
Chapter 7: A BAYESIAN THEORY OF CONFIRMATION FOR INTRUSIONREPORT FUSION 155
Figure 7.2: Example of the derivation of an incomplete-data space for a word variablex1.
In this case the incomplete-data space Y for variable x1 is comprised of the incomplete-
data types {Y1, Y2}. In the context of our application of the EM algorithm, the
complete-data space for a variable xk is the segment of values [min(xk),max(xk)],
where min(xk) and max(xk) denote the minimum value and the maximum value of
variable xk, respectively. A symbolic analyzer, say A, is a relation that maps each
incomplete-data type to a set of complete-data types.
Thus, overall the symbolic analyzer A maps the incomplete-data space Y to the
complete-data space [min(xk),max(xk)] with respect to variable xk. Let us see how
this mapping is done for the word variable x1 in the example of Figure 7.2. Given
an incomplete-data type Yj = (y1, y2, ..., yg). The symbolic analyzer A examines y1
to determine the δ partition of the values of x1 where y1 lies in. Yj is then mapped
to the set of val(x1) that lie in that δ partition.
Chapter 7: A BAYESIAN THEORY OF CONFIRMATION FOR INTRUSIONREPORT FUSION 156
Referring to the example of Figure 7.2, the symbolic analyzer A maps Y1 to the set of
val(x1) that lie in the first δ partition, Y2 to the set of val(x1) that lie in the second δ
partition, Y3 to the set of val(x1) that lie in the third δ partition, and Y4 to the set of
val(x1) that lie in the fourth δ partition. The mapping of Yj is done in a similar way
in the case x1 is a logical variable. If y1 = 0, Yj is mapped to the value 0 of variable
x1. If y1 = 1, then Yj is mapped to the value 1 of variable x1.
7.3.2 Algorithmic Approach
We now discuss how we estimate the hypothesis-based probability distributions
on logical or word variables stored in the RAM of control systems. The algorith-
mic approach is given in Algorithm 2. The theory of confirmation first defines the
complete-data space X whose types are states of the DCS-controlled physical system
[Algorithm 2; line 1]. It is this space’s hypothesis-based probability distributions that
we cannot compute directly. As written earlier in this dissertation, for the sake of the
application of the EM algorithm we consider as a complete-data space the interval of
values [min(xk),max(xk)] for each variable xk.
Once we compute the hypothesis-based probability distributions on each variable xk,
we can then compute the hypothesis-based probability distributions on X. Taking
into account that the EI algorithm, the specification-based approach, and the mirage
theory have their own individual detection logic, the hypothesis-based probability dis-
tributions on each variable xk differ according to what intrusion detection approach
is being used. In other words, given the hypothesis Hn is true or the hypothesis Ha is
true, the probability of receiving a specific piece of evidence is different for different

Chapter 7: A BAYESIAN THEORY OF CONFIRMATION FOR INTRUSIONREPORT FUSION 157
intrusion detection approaches.
Thus, the theory of confirmation computes the hypothesis-based probability distri-
butions on each variable xk [Algorithm 2; line 3] for each one of the three intrusion
detection approaches [Algorithm 2; line 2]. Let M(xk) denote the unconstrained
probability model on variable xk, i.e. a non-empty set of all possible probability dis-
tributions on variable xk [Algorithm 2; line 4]. The theory of confirmation randomly
chooses a probability distribution p0 from M(xk) [Algorithm 2; line 5].
The probability distribution p0 is needed to initiate the execution of the EM algorithm.
In [Algorithm 2; lines 6-14], the theory of confirmation defines an incomplete-data
space Y for each word variable xk. It also defines the symbolic analyzer A that maps
types of Y to the appropriate δ partition of variable xk, as discussed in the previous
subsection. In [Algorithm 2; lines 15-21], the theory of confirmation performs the
same task for each logical variable xk. Recall that we have in hand a sample of nor-
mal tokens from X, and a sample of abnormal tokens from X.
Following the discussion made in the previous subsection, we derive the corresponding
sample of normal tokens from Y, say n, and the corresponding sample of abnormal
tokens from Y, say m, respectively. Let nids denote a sample comprised of those nor-
mal tokens of n that are classified as normal by the intrusion detection currently in
consideration [Algorithm 2; line 22]. Further, let mids denote a sample comprised of
those abnormal tokens of m that are classified as abnormal by the intrusion detection
currently in consideration [Algorithm 2; line 23].
Thus, nids ⊆ n and mids ⊆ m. Both nids and mids are non-empy and finite. In
[Algorithm 2; line 24], the theory of confirmation passes the symbolic analyzer A,

Chapter 7: A BAYESIAN THEORY OF CONFIRMATION FOR INTRUSIONREPORT FUSION 158
the sample nids of normal tokens that are classified as normal by the intrusion detec-
tion currently in consideration, the unconstrained probability model on variable xk,
namely M(xk), and the randomly chosen probability distribution p0, to the EM algo-
rithm. The EM algorithm then estimates the instance pn xkids of M(xk) that maximizes
the likelihood of nids.
Similarly, in [Algorithm 2; line 25], the theory of confirmation passes the symbolic
analyzer A, the sample mids of abnormal tokens that are classified as abnormal by the
intrusion detection currently in consideration, the unconstrained probability model
M(xk), and the randomly chosen probability distribution p0, to the EM algorithm,
which estimates the instance pm xkids of M(xk) that maximizes the likelihood of mids.
Let us see in Algorithm 3 how the EM algorithm estimates pn xkids .
The estimation of pm xkids is conducted by the EM in a similar way. In this case the
EM algorithm works on mids rather than on nids.
Algorithm 2 Estimate the hypothesis-based probability distributions on each logical
or word variable
1: X⇐ {X | X = val(x1), val(x2), ..., val(xg))}
2: for all ids such that ids ∈ {EI algorithm, specification-based approach, mirage
theory} do
3: for all xk such that k ∈ {1, 2, ..., g} do
4: M(xk)⇐ unrestricted probability model on xk
5: p0 ⇐ a probability distribution on xk chosen randomly from M(xk)
6: if xk models a word variable then

Chapter 7: A BAYESIAN THEORY OF CONFIRMATION FOR INTRUSIONREPORT FUSION 159
7: e⇐ number of δ partitions of xk
8: Y⇐ NULL
9: for all j such that j ∈ {1, 2, ..., e} do
10: Yj ⇐ (y1, y2, ..., yg), where min(xk) + δ(j − 1) ≤ yk < min(xk) + jδ and
yl = anyval(xl) for l 6= k
11: Y⇐ Y ∪ Yj
12: A(Yj)⇐ {val(xk) | min(xk) + δ(j − 1) ≤ val(xk) < min(xk) + jδ}
13: end for
14: end if
15: if xk models a logical variable then
16: Y1 ⇐ (y1, y2, ..., yg), where yk = 0 and yl = anyval(xl) for l 6= k
17: Y2 ⇐ (y1, y2, ..., yg), where yk = 1 and yl = anyval(xl) for l 6= k
18: Y⇐ Y0 ∪ Y1
19: A(Y1)⇐ 0
20: A(Y2)⇐ 1
21: end if
22: nids : Y → R, such that for all Y ∈ Y, nids(Y ) ≥ 0 and 0 < |nids| < ∞ ⇐
sample of normal tokens classified as normal by ids
23: mids : Y → R, such that for all Y ∈ Y, mids(Y ) ≥ 0 and 0 < |mids| < ∞ ⇐
sample of abnormal tokens classified as abnormal by ids
24: pn xkids ⇐ feed the EM algorithm with (A, nids,M(xk), p0)
25: pm xkids ⇐ feed the EM algorithm with (A,mids,M(xk), p0)
26: end for
Chapter 7: A BAYESIAN THEORY OF CONFIRMATION FOR INTRUSIONREPORT FUSION 160
27: end for
The EM algorithm (Algorithm 3) that estimates pn xkids is comprised of an expectation
step and a maximization step, which are iterated until the sequence of probabilities
allocated to the incomplete-data sample nids converge to a local maximum value.
Initially the aforementioned p0 chosen randomly from M(xk) is used as the probability
distribution q that is used to generate a complete-data sample [Algorithm 3; line 2].
Let nqids denote the complete-data sample expected by the probability distribution q
[Algorithm 3; line 3].
In [Algorithm 3; lines 4-8], the EM algorithm computes the complete-data sample
expected by the probability distribution q. In other words, the EM algorithm uses
the probability distribution q to distribute the frequency nids(Y ), for each incomplete-
data type Y ∈ Y, among the complete-data types val(xk) ∈ A(Y ). Let p denote the
maximum-likelihood estimate of M(xk) on nqids [Algorithm 3; line 9]. Taking into
account that M(xk) is an unconstrained probability model, the maximum-likelihood
estimate of M(xk) on nqids corresponds to the relative-frequency estimate of M(xk)
on nqids.
In [Algorithm 3; lines 10-12], the EM algorithm computes p, which becomes the
probability distribution q that is used to generate a complete-data sample in the next
iteration [Algorithm 3; line 13]. The relative-frequency estimate of M(xk) on nqids that
the EM algorithm computes in the last iteration becomes pn xkids [Algorithm 3; line 15].
P (X | Hn) and P (X | Ha) are computed for each intrusion detection approach ids ∈
{EI algorithm, specification− based approach,mirage theory} as shown below:
P (X | Hn) = pn x1ids (val(x1)) pn x2
ids (val(x2)) ...... pn xgids (val(xg))

Chapter 7: A BAYESIAN THEORY OF CONFIRMATION FOR INTRUSIONREPORT FUSION 161
and
P (X | Ha) = pm x1ids (val(x1)) pm x2
ids (val(x2)) ...... pm xgids (val(xg))
In Figure 7.1, for example, we see that the EI algorithm has computed a probability
0.36 for P (X | Hn), and a probability 0.18 for P (X | Ha).
Algorithm 3 Compute the normalcy maximum likelihood estimate of the unre-
stricted probability model on a logical or word variable
1: for all i such that i ∈ {1, 2, ..., r} do
2: q ⇐ pi−1
3: nqids ⇐ complete-data sample expected by the probability distribution q
4: for all Y such that Y ∈ Y do
5: for all val(xk) such that val(xk) ∈ A(Y ) do
6: nqids(val(xk))⇐ nids(Y ) q(val(xk))q(Y )
7: end for
8: end for
9: p⇐ relative-frequency estimate of M(xk) on nqids
10: for all val(xk) do
11: p(val(xk))⇐nqids(val(xk))
|nqids|
12: end for
13: pi = p
14: end for
15: pn xkids ⇐ pr
Chapter 7: A BAYESIAN THEORY OF CONFIRMATION FOR INTRUSIONREPORT FUSION 162
7.4 Estimating Prior Probabilities of Normalcy and
Abnormality
We now discuss the estimation of P (Hn) and P (Ha), which correspond to the
probability of Hn and the probability of Ha, respectively, if we were to employ only
one of the three intrusion detection approaches in question. In this research we use
the probability tree method to estimate P (Hn) and P (Ha). An example is given in
Figure 7.3. The root of the tree is the starting point of the inspection of a variable
value conveyed by a network packet payload. The children nodes of the root node are
the intrusion detection approaches, namely the EI algorithm, the specification-based
approach, and the mirage theory.
Each one of these three nodes has two children nodes, namely Hn and Ha. The EI
algorithm, the specification-based approach, and the mirage theory have comparable
effectiveness, and thus we would have no reasons for employing one specific approach
rather than another. Consequently each one of the branches that connects the root
node with an approach node is assigned a probability of 1/3, since the choice of the
approach to use is random. Upon inspection of a variable value conveyed by a network
packet payload, the EI algorithm computes a stochastic vector in which it specifies a
normalcy probability for the value in question.
If the said probability is 0.00, then the entire network packet is classified as abnormal,
in which case the hypothesis Ha holds. Otherwise the specific variable value being
analyzed is classified as normal, and thus the hypothesis Hn holds. In the case the
estimated normalcy probability is 0.00, the probability 1.00 is assigned to the branch
Chapter 7: A BAYESIAN THEORY OF CONFIRMATION FOR INTRUSIONREPORT FUSION 163
that connects the EI algorithm node with the Ha node. This is because when the
estimated normalcy probability is 0.00, the probability that the EI algorithm reports
that the hypothesis Ha holds is 1.00.
Furthermore, the probability 0.00 is assigned to the branch that connects the EI
algorithm node with the Hn node. When the estimated normalcy probability is 0.00,
the probability that the EI algorithm reports that the hypothesis Hn holds is 0.00.
In the case the estimated normalcy probability is greater than 0.00, the probability
1.00 is assigned to the branch that connects the EI algorithm node with the Hn node.
This is because when the estimated normalcy probability is greater than 0.00, the
probability that the EI algorithm reports that the hypothesis Hn holds is 1.00.
Furthermore, the probability that is assigned to the branch that connects the EI
algorithm node with the Ha node is 0.00. When the estimated normalcy probability is
greater than 0.00, the probability that the EI algorithm reports that the hypothesisHa
holds is 0.00. When inspecting a variable value conveyed by a network packet payload,
the specification-based approach uses a series of rules in conjunction with selected
portions of the current state of the DCS-controlled physical system to compute a
range of normal values. If the value being inspected falls within the said range, the
specification-based approach reports that the hypothesis Hn holds.
In this case we assign a probability of 1.0 to the branch that connects the specification-
based approach node with the Hn node, and a probability of 0.00 to the branch that
connects the specification-based approach node with the Ha node. If the value being
inspected falls outside the computer range of normal values, the specification-based
approach reports that the hypothesis Ha holds. In this case we assign a probability

Chapter 7: A BAYESIAN THEORY OF CONFIRMATION FOR INTRUSIONREPORT FUSION 164
of 0.0 to the branch that connects the specification-based approach node with the Hn
node, and a probability of 1.00 to the branch that connects the specification-based
approach node with the Ha node.
When inspecting a variable value conveyed by a network packet payload, mirage
theory uses a communicating finite state machine in the form of sequence detector to
assess whether the said network packet is foreign, i.e. it is not part of the network
traffic that is generated by deceptive simulation. If the sequence detector recognizes
the variable value in question, mirage theory reports that the hypothesis Hn holds.
In this case we assign a probability of 1.0 to the branch that connects the mirage
theory node with the Hn node, and a probability of 0.00 to the branch that connects
the mirage theory node with the Ha node.
Figure 7.3: Probability tree estimation of prior normalcy and abnormalityprobabilities.
If the sequence detector does not recognize the variable value in question, mirage

Chapter 7: A BAYESIAN THEORY OF CONFIRMATION FOR INTRUSIONREPORT FUSION 165
theory reports that the hypothesis Ha holds. If this occurs, we assign a probability
of 0.0 to the branch that connects the mirage theory node with the Hn node, and
a probability of 1.00 to the branch that connects the mirage theory node with the
Ha node. Following the multiplicative law of probability, the probability that each
one of the intrusion detection approaches reports that the hypothesis Hn holds is
obtained by multiplying the probabilities along the path from the root node to the
Hn node. According to the probability tree method, P (Hn) is obtained by summing
these estimated individual probabilities, as shown in the equation below:
P (Hn) = 0.33 P (Hn | EI algorithm)+0.33 P (Hn | specification−based approach)
+ 0.33 P (Hn | mirage theory)
Similarly, the probability that each one of the intrusion detection approaches reports
that the hypothesis Ha holds is obtained by multiplying the probabilities along the
path from the root node to the Ha node. P (Ha) is obtained by summing these
estimated individual probabilities:
P (Ha) = 0.33 P (Ha | EI algorithm)+0.33 P (Ha | specification−based approach)
+ 0.33 P (Ha | mirage theory)
7.5 Bayesian Comparison of the Normalcy and Ab-
normality Hypotheses
We now discuss how we compare the two competing hypotheses, namely Hn and
Ha. The algorithmic approach is given in Algorithm 4. Let ϕ(xk) denote a val(xk)
Chapter 7: A BAYESIAN THEORY OF CONFIRMATION FOR INTRUSIONREPORT FUSION 166
that a network packet under inspection is writing to a variable xk. The theory of
confirmation inspects each ϕ(xk) held in the payload of the said network packet [Al-
gorithm 4; line 3]. Let alg1, alg2, and alg3 denote the EI algorithm, the specification-
based approach, and the mirage theory, respectively.
In [Algorithm 4; lines 5-7], the theory of confirmation uses the probability tree
method to estimate the prior probabilities of the hypotheses Hn and Ha. The
theory of confirmation computes P (X | Hn) for each intrusion detection approach
ids ∈ {EI algorithm, specification − based approach,mirage theory}, and then
sums the estimated probabilities to get the overall P (X |Hn) [Algorithm 4; lines 8-14].
Similarly, the theory of confirmation computes P (X | Ha) for each intrusion detec-
tion approach ids ∈ {EI algorithm, specification−based approach,mirage theory},
and then sums those estimated probabilities to compute the overall P (X | Ha) [Al-
gorithm 4; lines 15-21].
In Figure 7.1, for example, the overall P (X | Hn) is 0.36+0.24+0.13 = 0.73, while the
overall P (X | Ha) is 0.18+0.15+0.29 = 0.62. At this point we have in hand the prior
probabilities P (Hn) and P (Ha), and the hypothesis-based probabilities of evidence,
namely P (X | Hn) and P (X | Ha), and thus are in the position of applying the Bayes
theorem in its ratio form [Algorithm 4; line 22]. In [Algorithm 4; lines 23-29], the
estimation theory compares the posterior probabilities P (Hn | X) and P (Ha | X). If
P (Hn | X) is greater than P (Ha | X), the theory of confirmation classifies as normal
the ϕ(xk) currently under inspection.
If P (Hn | X) is smaller than P (Ha | X), the theory of confirmation classifies as ab-
normal the said ϕ(xk) along with the network packet under inspection.

Chapter 7: A BAYESIAN THEORY OF CONFIRMATION FOR INTRUSIONREPORT FUSION 167
Algorithm 4 Compare competing hypotheses
1: U ⇐ payload
2: Norm⇐ true
3: for all xk such that ϕ(xk) ∈ U do
4: X ⇐ evidence
5: build the probability tree associated with xk
6: P (Hn)⇐ P (alg1) P (Hn | alg1) + P (alg2) P (Hn | alg2) + P (alg3) P (Hn | alg3)
7: P (Ha)⇐ P (alg1) P (Ha | alg1) + P (alg2) P (Ha | alg2) + P (alg3) P (Ha | alg3)
8: P (X | Hn) = 0
9: for all ids such that ids ∈ {EI algorithm, specification-based approach, mirage
theory} do
10: pX = 1
11: for all xk such that k ∈ {1, 2, ..., g} do
12: pX ⇐ pX pn xkids (val(xk))
13: end for
P (X | Hn) = P (X | Hn) + pX
14: end for
15: P (X | Ha) = 0
16: for all ids such that ids ∈ {EI algorithm, specification-based approach, mirage
theory} do
17: pX = 1
18: for all xk such that k ∈ {1, 2, ..., g} do

Chapter 7: A BAYESIAN THEORY OF CONFIRMATION FOR INTRUSIONREPORT FUSION 168
19: pX ⇐ pX pm xkids (val(xk))
20: end for
P (X | Ha) = P (X | Ha) + pX
21: end for
22: u⇐ P (Hn | X)P (Ha | X)
⇐ P (X | Hn)P (X | Ha)
P (Hn)P (Ha)
23: if u > 1 then
24: payload is normal
25: else if u < 1 then
26: payload is abnormal
27: Norm⇐ false
28: break for loop
29: end if
30: end for
31: return Norm

Chapter 8
EXPERIMENTAL EVALUATION
8.1 Testbed
We created a small testbed ad hoc for (1) generating a learning data set for
the inductive machine learning process within the intrusion detection ensemble, (2)
conducting an empirical experimental evaluation of the intrusion detection ensemble.
The DCS in the testbed in question was comprised of Linux PC-based PLCs [110],
more precisely MatPLCs [121] installed on general purpose Linux machines with a
x86 CPU architecture. We used custom MatPLC modules in master mode to control
and monitor a limited number of simulated components of an ABWR.
These modules are implementations of control logic that processes MatPLC points,
i.e. inputs, outputs, internal coils and registers of MatPLC. The said MatPLC points
were mapped to physical I/O parameters, and hence represented the link between the
MatPLC modules in master mode and some parameters of the simulated components
of an ABWR. Network communications were conducted via the ModBus protocol over
169
Chapter 8: EXPERIMENTAL EVALUATION 170
TCP/IP. Sensors and actuators were emulated via custom MatPLC modules running
in slave mode.
Furthermore, we used a MatPLC HMI GNU image manipulation program toolkit
(GTK) module to read and write MatPLC points in the form of supervisory network
operation of a power plant. We conducted a simulation of the mechanisms that
are used to insert or withdraw a control rod, namely the joint operation of an AC
induction motor that produces a torque and a ballscrew that transforms rotational
motion into linear motion, a motor-driven water pump that is used to inject water
within the reactor core, and limited portions of the nuclear fission process that involve
reactivity [116] and core flow, i.e. water level in the reactor core.
8.2 Test Vulnerabilities and Exploitations
As we deployed and activated a prototype implementation of the intrusion de-
tection ensemble in the MatPLCs, we ran the simulated components of an ABWR
normally via the DCS over the network. The main purpose of this test was to assess
whether the algorithms of the intrusion detection ensemble along with the alert fusion
technique would mistakenly classify normal network packets as abnormal, and hence
generate false positives. In order to assess the effectiveness of the intrusion detection
ensemble with regard to detection of computer network attacks, we planted a series
of memory errors into the ModBus implementation running in the MatPLCs, and
thereafter developed attack code that exploited them.
The computer network attacks that we launched on the MatPLCs comprised the
following: stack overflow exploitations with shellcode injection, stack overflow ex-
Chapter 8: EXPERIMENTAL EVALUATION 171
ploitations with arc injection, heap overflow exploitations with shellcode injection,
frame pointer overwrites with shellcode injection, format bug exploitations with shell-
code injection corrupting function pointers in the global offset table (GOT), indirect
pointer overwrites with shellcode injection corrupting function pointers in GOT, and
exploitations of out of boundary array indexes with shellcode injection.
Furthermore, we mounted inertial attacks on the simulated AC induction motor, and
exclusion attacks that violated a functional dependency between the (limited) simu-
lated control rod insertion and withdrawal system and the (limited) simulated reactor
feedwater system.
8.3 Empirical Results
In this section we discuss the results of testing the EI algorithm, the physical
process aware specification-based approach, and the Bayesian confirmation theory.
The results of testing the mirage theory are given earlier in this dissertation, namely
in chapter 6. The overall results of these tests are the following:
• We received a false alarms rate of 0 for both the EI algorithm and the physical
process aware specification-based approach.
• We received a probability of detection of approximately 98% for both the EI
algorithm and the physical process aware specification-based approach, which
is, 98% of the malicious network packets were detected by the EI algorithm and
the physical process aware specification-based approach. When possible, we
crafted network packets in such a way as to inject shellcode two bytes at a time.
Chapter 8: EXPERIMENTAL EVALUATION 172
A few of these bytes managed to pass undetected, since they were indeed normal
process data in defined states of the simulated components of an ABWR. All
of the network packets that were injecting memory addresses were detected by
the EI algorithm and the physical process aware specification-based approach.
Overall, all of the computer network attacks that we generated in this test were
detected by the EI algorithm and the physical process aware specification-based
approach.
With regard to the testing of the proposed Bayesian confirmation theory, given that
we are not aware of attacks that are capable of evading the three intrusion detection
approaches when used individually, we employed a testing technique that is similar to
fault injection in software testing. We injected logical flaws in the the EI algorithm,
the specification-based approach, and the mirage theory.
Thus, we intentionally caused intrusion detection failures, with the result being a
reduced probability of detection and an increased false alarms rate for each one of
these three approaches. The purpose of such detection failure injection was to test the
effectiveness of the proposed intrusion report fusion technique to repair the probability
of detection and alleviate the false alarms rate. In front of the same set of attacks, the
gain in intrusion detection effectiveness appeared to depend on the level of detection
failure injection, i.e. the degree of intentional degrade of the probability of detection
and false alarms rate.
The empirical results that regard the gain in probability of detection (Pd) in the case
the EI algorithm and the physical process aware specification-based approach were
individually made subject to detection failure injection are given in Table 8.1 and
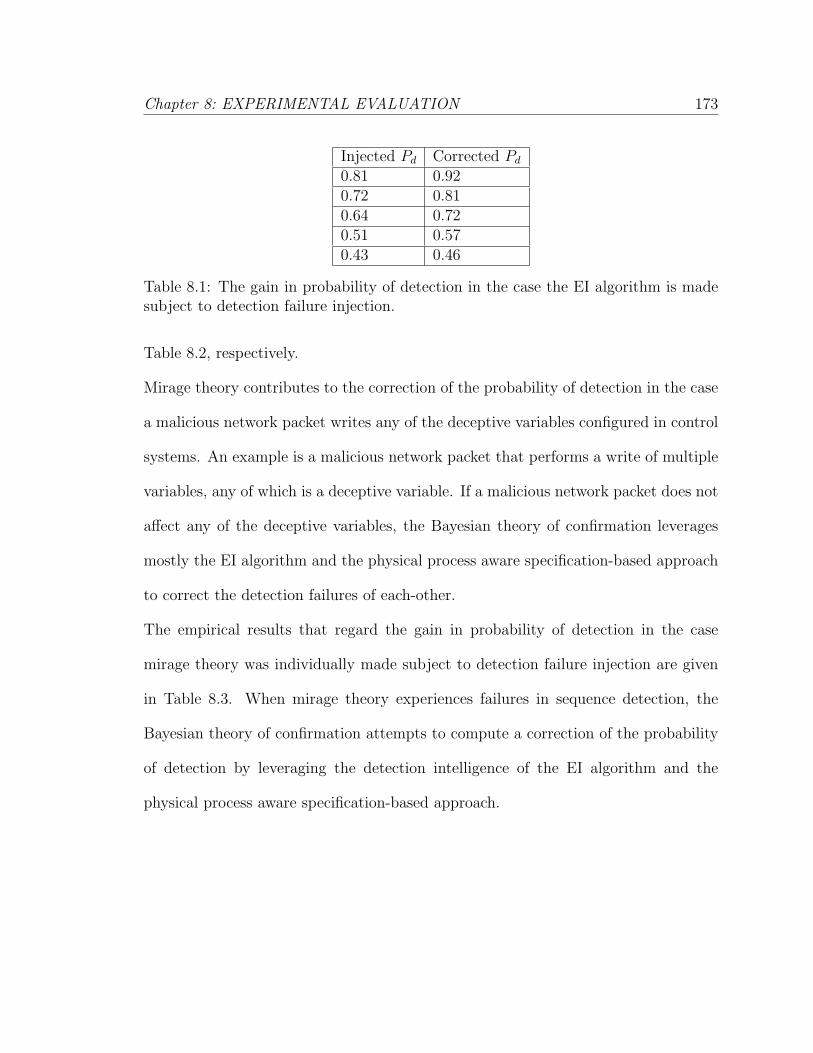
Chapter 8: EXPERIMENTAL EVALUATION 173
Injected Pd Corrected Pd0.81 0.920.72 0.810.64 0.720.51 0.570.43 0.46
Table 8.1: The gain in probability of detection in the case the EI algorithm is madesubject to detection failure injection.
Table 8.2, respectively.
Mirage theory contributes to the correction of the probability of detection in the case
a malicious network packet writes any of the deceptive variables configured in control
systems. An example is a malicious network packet that performs a write of multiple
variables, any of which is a deceptive variable. If a malicious network packet does not
affect any of the deceptive variables, the Bayesian theory of confirmation leverages
mostly the EI algorithm and the physical process aware specification-based approach
to correct the detection failures of each-other.
The empirical results that regard the gain in probability of detection in the case
mirage theory was individually made subject to detection failure injection are given
in Table 8.3. When mirage theory experiences failures in sequence detection, the
Bayesian theory of confirmation attempts to compute a correction of the probability
of detection by leveraging the detection intelligence of the EI algorithm and the
physical process aware specification-based approach.

Chapter 8: EXPERIMENTAL EVALUATION 174
Injected Pd Corrected Pd0.83 0.960.69 0.790.62 0.810.53 0.600.46 0.50
Table 8.2: The gain in probability of detection in the case the physical process awarespecification-based approach is made subject to detection failure injection.
Injected Pd Corrected Pd0.85 0.980.73 0.950.62 0.930.56 0.920.41 0.89
Table 8.3: The gain in probability of detection in the case mirage theory is madesubject to detection failure injection.
The empirical results that regard the gain in false alarms rate (Fa), expressed as
the number of false alarms raised per hour, in the case the EI algorithm and the
physical process aware specification-based approach were individually made subject
to detection failure injection are given in Table 8.4 and Table 8.5, respectively. Mirage
theory makes a low contribution to the correction of the false alarms rate in either
of these two cases as it has no visibility on program variables that are non-deceptive.
In other words, the inspection of network packets that write operational, and hence
non-deceptive, variables lies outside the scope of mirage theory.
The testing results of the case in which mirage theory was individually made subject
to detection failure injection are given in Table 8.6. Both the EI algorithm and the
physical process aware approach contribute to the correction of the false alarms rate
when mirage theory experiences failures in sequence detection. A side effect of this
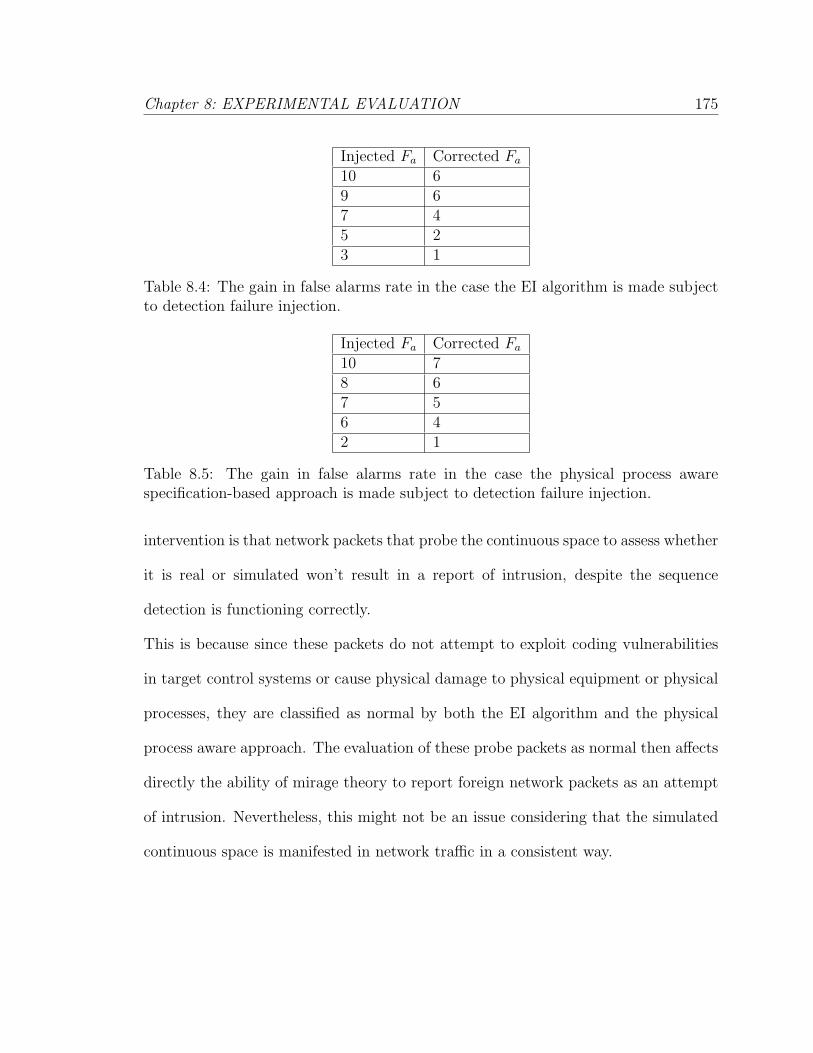
Chapter 8: EXPERIMENTAL EVALUATION 175
Injected Fa Corrected Fa10 69 67 45 23 1
Table 8.4: The gain in false alarms rate in the case the EI algorithm is made subjectto detection failure injection.
Injected Fa Corrected Fa10 78 67 56 42 1
Table 8.5: The gain in false alarms rate in the case the physical process awarespecification-based approach is made subject to detection failure injection.
intervention is that network packets that probe the continuous space to assess whether
it is real or simulated won’t result in a report of intrusion, despite the sequence
detection is functioning correctly.
This is because since these packets do not attempt to exploit coding vulnerabilities
in target control systems or cause physical damage to physical equipment or physical
processes, they are classified as normal by both the EI algorithm and the physical
process aware approach. The evaluation of these probe packets as normal then affects
directly the ability of mirage theory to report foreign network packets as an attempt
of intrusion. Nevertheless, this might not be an issue considering that the simulated
continuous space is manifested in network traffic in a consistent way.

Chapter 8: EXPERIMENTAL EVALUATION 176
Injected Fa Corrected Fa9 68 65 22 01 0
Table 8.6: The gain in false alarms rate in the case mirage theory is made subject todetection failure injection.
Chapter 9
CONCLUSIONS
In this dissertation we discussed the development and empirical testing of an in-
trusion detection ensemble that we devised for defending cyber-physical systems such
as DCS-controlled power plants from application-level computer network attacks. We
discussed a statistical intrusion detection algorithm called the Estimation-Inspection
algorithm. We described the mathematical modeling for the Estimation-Inspection al-
gorithm, formally formulated the main thesis that underlies the Estimation-Inspection
algorithm, developed the statistical foundation of the Estimation-Inspection algo-
rithm, and then described in detail the Estimation-Inspection algorithm.
We assessed the effectiveness of the Estimation-Inspection algorithm both empirically
and through modeling and simulation. From an empirical experimental evaluation
of the Estimation-Inspection algorithm in a small testbed created ad hoc for this re-
search, we received a probability of detection of 98% and a false alarms rate of 0. We
validated the effectiveness of the Estimation-Inspection algorithm probabilistically via
stochastic activity networks with activity-marking oriented reward structures, with
177
Chapter 9: CONCLUSIONS 178
the concrete outcome being that the Estimation-Inspection algorithm constructs and
employs probability mass functions that do not allow malicious network packets to
take a DCS-controlled power plant to abnormal conditions.
In this dissertation we also discussed a specification-based intrusion detection ap-
proach for operation in a DCS-controlled power plant, namely a physical process
aware specification-based approach. We discussed the main components of the said
approach, namely byte stream semantic analysis and supervisory and automatic oper-
ation rules. We also discussed the modeling of a joint representation of the byte stream
semantic analysis and operation rules via a deterministic state-transition formalism,
namely activity networks, which is the concrete mechanism that this approach uses
to determine whether a network packet is normal or abnormal.
From an empirical experimental evaluation of the physical process aware approach
in the testbed, we observed a detection performance that is approximately the same
as the detection performance of the Estimation-Inspection algorithm. In this disser-
tation we also discussed our research on mirage theory, which is a process control
specific approach to intrusion detection that we derived from MILDEC and deep
studies of historical military operations. We provided a description of the boundary
between continuous and discrete spaces, which forms the basis of mirage theory from
the concealment perspective.
We then explained the internals of mirage theory as built upon the said boundary.
We provided an overview of how an adversary conducts reconnaissance that leads to
target identification and attack engineering, and showed how mirage theory exploits
the adversary’s perception of a target cyber-physical system to cause him/her to vol-
Chapter 9: CONCLUSIONS 179
untarily make the decision of targeting a simulated or emulated physical process or
equipment.
In mirage theory the deceptive event generation process is performed via simulation or
emulation of a continuous space. In this regard we discussed continuous simulation
and traffic mirroring along with techniques for detecting intrusions once an adver-
sary is deceived into attacking a simulated or emulated target. We then developed
a practical attack-defense model in which we analyzed and quantified the deception
capabilities of mirage theory.
More precisely, we applied signal detection theory to empirically quantify the decep-
tion effects of mirage theory on the adversary’s mind. Our evaluations of mirage
theory indicate that it is highly deceptive, and hence a viable approach to intru-
sion detection in process control networks. In this dissertation we also discussed a
Bayesian theory of confirmation for fusing intrusion reports that are generated indi-
vidually by the intrusion detection algorithms that we devised especially for process
control networks.
The purpose of this Bayesian theory of confirmation is to increase the probability of
detection by joining the best detection features of the intrusion detection approaches,
while reducing the false alarms rate by having the intrusion detection approaches cor-
rect each-other’s detection weaknesses. We formalized the problem of fusing intrusion
reports in a process control network, and outlined the components of the proposed
theory of confirmation that address the problem in question.
The intrusion reports represent evidence for or against two hypotheses, namely that a
network packet under inspection is normal or abnormal. We described how we develop

Chapter 9: CONCLUSIONS 180
incomplete-data spaces and the associated symbolic analyzers, which we use within
the Expectation-Maximization algorithm to estimate the hypothesis-based probabil-
ity distributions on logical or word variables stored in the RAM of control systems.
We also showed how we use those probability distributions to estimate hypothesis-
based probabilities of each piece of evidence.
We discussed how we estimate prior probabilities of the two hypotheses via the prob-
ability tree method. We then discussed how we estimate and compare the posterior
probabilities of the two hypotheses via the Bayes theorem in its ratio form. In con-
clusion, we discussed an empirical testing of the proposed theory of confirmation via
a technique that we devised especially for our problem domain, namely detection
failure injection.

Bibliography
[1] Acme Nuclear Services. Boiling Water Reactor Simulator Program. AcmeWebsite.
[2] S. Alampalayam, P. Kumar, A. Kumar, and S. Srinivasan. Statistical Based In-trusion Detection Framework using Six Sigma Technique. International Journalof Computer Science and Network Security, Vol. 7, No.10, October 2007.
[3] Aleph1. Smashing the Stack for Fun and Profit. Phrack Magazine, 7(49), 1996.
[4] D. Anderson, T. Lunt, H. Javitz, A. Tamaru, and A. Valdes. Next-generationIntrusion Detection Expert System (NIDES): A Summary. SRI-CSL-95-07, SRIInternational, 1995.
[5] Anonymous. Once upon a free(). Phrack Magazine, 9(57), 2001.
[6] Anonymous. DATAC RealWin 2.0 SCADA Software - Remote PreaAuth Ex-ploit. SecurityFocus Website, 2008.
[7] I. Balepin, S. Maltsev, J. Rowe, K.N. Levitt. Using Specification-Based Intru-sion Detection for Automated Response. Proceedings of the 6th InternationalSymposium on Recent Advances in Intrusion Detection, pp. 136-154, Pitts-burgh, PA, USA, September 2003.
[8] T. Bass. Intrusion Detection Systems and Multisensor Data Fusion. Commu-nications of the ACM, vol. 43(4), pp. 99-105, 2000.
[9] C. Bellettini, and J.L. Rrushi. Vulnerability Analysis of SCADA Protocol Bina-ries through Detection of Memory Access Taintedness. Proceedings of the 2007IEEE Workshop on Information Assurance, United States Military Academy,West Point, NY, USA, 2007.
[10] J. Berge. Fieldbuses for Process Control: Engineering, Operation, and Mainte-nance. ISA, 2002.
[11] A. Bjorck. Numerical Methods for Least Squares Problems. SIAM, 1996.
181
Bibliography 182
[12] L. Breiman. Bagging Predictors. Machine Learning, 24(2):123140, 1996.
[13] M. Bristow. Probabilistic Networks with Undirected Links for Anomaly Detec-tion. DEFCON 16. August 2008.
[14] W.L. Brogan. Modern Control Theory. Prentice Hall, 1990.
[15] Bulba, and Kil3r. Bypassing stackguard and stackshield. Phrack Magazine,10(56), 2000.
[16] C4. ABB PCU400 4.4-4.6 Remote Buffer Overflow. SecurityFocus Website,2008.
[17] C4. GE Fanuc Cimplicity 6.1 Heap Overflow. SecurityFocus Website, 2008.
[18] A.A. Cardenas, S. Amin, S. Sastry. Research Challenges for the Security ofControl Systems. Proceedings of the 3rd USENIX workshop on Hot Topics inSecurity, July 2008.
[19] F.E. Cellier, and E. Kofman. Continuous System Simulation. Springer, 2006.
[20] S. Chen, J. Xu, E.C. Sezer, P. Gauriar, and R.K. Iyer. Noncontrol-data Attacksare Realistic threats. Proceedings of the 14th USENIX Security Symposium,pp. 177-192, Baltimore, USA, 2005.
[21] S. Cheung, B. Dutertre, M. Fong, U. Lindqvist, K. Skinner, and A. Valdes.Using Model-based Intrusion Detection for SCADA Networks. Proceedings ofthe SCADA Security Scientific Symposium, Miami Beach, Florida, January2007.
[22] M. Conover, and w00w00 security team. w00w00 on Heap Overflows. w00w00Website.
[23] B. Cox, D. Evans, A. Filipi, J. Rowanhill, W. Hu, J. Davidson, J. Knight,A. Nguyen-Tuong, and J. Hiser. N-Variant Systems: A Secretless Frameworkfor Security through Diversity. Proceedings of the 15th USENIX Security Sym-posium, Vancouver, BC, Canada, August 2006.
[24] D.R. Cox, and D.V. Hinkley. Theoretical Statistics. Chapman and Hall, 1974.
[25] D.D. Deavours, G. Clark, T. Courtney, D. Daly, S. Derisavi, J.M. Doyle,W.H. Sanders, and P.G. Webster. The Mobius Framework and Its Implemen-tation. IEEE Transactions on Software Engineering, pp. 956-969, Vol. 28, No.10, 2002.
[26] M. Demler. High-Speed Analog-to-Digital Conversion. Academic Press, 1991.
Bibliography 183
[27] A. P. Dempster, N. M. Laird, and D. B. Rubin. Maximum Likelihood fromIncomplete Data via the EM Algorithm. Journal of the Royal Statistics Society,B(39), pp. 1-38, 1977.
[28] T.G. Dietterich. Ensemble Methods in Machine Learning. Lecture Notes inComputer Science, 1857, pp. 1-15, 2000.
[29] DNP Users Group. Distributed Network Protocol Specification. 2007.
[30] I. Dobrovitski. Exploit for CVS double free() for linux pserver. seclists.orgWebsite, 2003.
[31] W. DuMouchel. Computer Intrusion Detection Based on Bayes Factors forComparing Command Transition Probabilities. Technical Report, National In-stitute of Statistical Sciences, 1999.
[32] K.T. Erickson. Programmable Logic Controllers: An Emphasis on Design andApplication. Dogwood Valley Press, 2005.
[33] Y. Freund, and R. E. Schapire. Experiments with a New Boosting Algorithm.Proceedings of the 13th International Conference on Machine Learning, pp.148-156, 1996.
[34] R. Fisher. On an Absolute Criterion for Fitting Frequency Curves. Messengerof Mathematics, No. 41, 1912.
[35] B. Fitelson. The Plurality of Bayesian Measures of Confirmation and the Prob-lem of Measure Sensitivity. Philosophy of Science, No. 66, pp. 362-378, 1999.
[36] S. Forrest, S. Hofmeyr, and A. Somayaji. Computer Immunology. Communi-cations of ACM 40 (10), 1997.
[37] General Electric, Inc. Advanced Boiling Water Reactor Plant General Descrip-tion. GE Website, 2000.
[38] Gera, and Riq. Advances in Format String Exploitation. Phrack Magazine,11(59), 2002.
[39] G. Giani, and P. Thompson. Cognitive Hacking: A Battle for the Mind. IEEEComputer, 35(8), pp. 50-56, 2002.
[40] C. Glymour. Theory and Evidence. Princeton: Princeton University Press,1980.
[41] V. Gowadia, C. Farkas, and M. Valtorta. PAID: A Probabilistic Agent-BasedIntrusion Detection System. Journal of Computers and Security, 2005.

Bibliography 184
[42] R. Goonatilake, A. Herath, S. Herath, S. Herath, and J. Herath. IntrusionDetection Using the Chi–Square Goodness–Of–Fit Test for Information Assur-ance, Network, Forensics and Software Security. Journal of Computing Sciencesin Colleges, Vol. 23, Issue 1, pp. 255-263, 2007.
[43] G. Gu, A.A. Cardenas, and W. Lee. Principled Reasoning and Practical Ap-plications of Alert Fusion in Intrusion Detection Systems. In Proceedings ofASIACCS 08, Tokyo, Japan, March 2008.
[44] J.W. Haines, R.P. Lippmann, D.J. Fried, M.A. Zissman, E. Tran, andS.B. Boswell. 1999 DARPA Intrusion Detection Evaluation: Design and Pro-cedures. MIT Lincoln Laboratory: Lexington, MA, 2001.
[45] J. Hawthorne. Confirmation Theory. Philosophy of Statistics, Handbook of thePhilosophy of Science, No. 7, 2008.
[46] R. Herrnstein, and C. Murray. The Bell Curve: Intelligence and Class Structurein American Life. Free Press, 1994.
[47] R.J. Heuer, Jr. Psychology of Intelligence Analysis. Center for the Study ofIntelligence, Central Intelligence Agency, 2007.
[48] D.F. Hoeschele. Analog-to-Digital and Digital-to-Analog Conversion Tech-niques. 2nd Edition, Wiley-Interscience, 1994.
[49] T. Holz, J Goebel, and J. Hektor. Advanced Honeypot-based Intrusion Detec-tion. ;login:, 31, 6, USENIX, 2006.
[50] T. Holz, and F Raynal. Detecting Honeypots and Other Suspicious Environ-ments. Proceedings of the 6th IEEE Information Assurance Workshop, UnitedStates Military Academy, West Point, NY, USA, 2005.
[51] The Honeynet Project. Know Your Enemy: Learning about Security Threats.2nd Edition, Addison-Wesley Professional, 2004.
[52] D.W. Hosmer, and S. Lemeshow. Applied Logistic Regression. Wiley-Interscience Publication, 2nd edition, 2000.
[53] A. Hughes. Electric Motors & Drives. Newnes, 2005.
[54] IBM Internet Security Systems. X-Force Threat Insight Monthly. IBM Website.
[55] International Electrotechnical Commission. IEC 61850: Communication Net-works and Systems for Power Utility Automation. Part 7-410: HydroelectricPower Plants - Communication for monitoring and control. IEC Website, 2007.
Bibliography 185
[56] International Electrotechnical Commission. IEC 61505: Nuclear Reactor Instru-mentation - Boiling Water Reactors (BWR) - Stability Monitoring. Distributedthrough American National Standards Institute, 2007.
[57] International Electrotechnical Commission. IEC 61131, Programmable Con-trollers - Part 3: Programming Languages. IEC Website.
[58] E. T. Jaynes. Prior Probabilities. IEEE Transactions on Systems Science andCybernetics, (SSC-4), pp. 227-241, 1968.
[59] H.S. Javitz, and A. Valdes. The NIDES Statistical Component Description andJustification. SRI Project 3131 Annual Report, 1994.
[60] C.S. Jones. The Perception Management Process. Military Review - The Pro-fessional Journal of the U.S. Army, 1999.
[61] W.H. Ju, and Y. Vardi. A Hybrid High-Order Markov Chain Model for Com-puter Intrusion Detection. Technical Report Number 92, National Institute ofStatistical Sciences, February 1999.
[62] E. Jonckheere, K. Shah, and S. Bohacek. Dynamic Modeling of Internet Traf-fic for Intrusion Detection. Proceedings of the American Control Conference,Anchorage, AK, May 2002.
[63] F. Iwanitz, and J. Lange. OPC - Fundamentals, Implementation and Applica-tion. Huthig Fachverlag, 2006.
[64] JTC 1/SC 22/WG 14. ISO/IEC 9899: Programming Languages - C. TechnicalReport, International Organization for Standards, 1999.
[65] M. Kaempf. Vudo - An Object Superstitiously Believed to Embody MagicalPowers. Phrack Magazine, 8(57), 2001.
[66] S.M. Kay. Fundamentals of Statistical Signal Processing, Volume 2: DetectionTheory. Prentice Hall Publishing, 1998.
[67] K. Knowlton. A Combination Hardware-Software Debugging System. IEEETransactions on Computers, Vol. 17, No. 1, January 1968.
[68] C. Kreibich, and J. Crowcroft. Honeycomb - Creating Intrusion Detection Sig-natures Using Honeypots. Proceedings of the 2nd Workshop on Hot Topics inNetworks, Cambridge, MA USA, 2003.
[69] R.L. Krutz. Securing SCADA Systems. Wiley Publishing, 2006.
[70] J. Larsen. Breakage. Blackhat Federal, 2008.

Bibliography 186
[71] M. Kaempf. Vudo - An Object Superstitiously Believed to Embody MagicalPowers. Phrack Magazine, 8(57), 2001.
[72] D.G. Kleinbaum, L.L. Kupper, A. Nizam, and K.E. Muller. Applied RegressionAnalysis and Multivariable Methods. Duxbury Press, 4th edition, 2007.
[73] Klog. The Frame Pointer Overwrite. Phrack Magazine, 9(55), 1999.
[74] C. Ko, M. Ruschitzka, and K. Levitt. Execution Monitoring of Security-CriticalPrograms in Distributed Systems: A Specification-Based Approach. IEEE Sym-posium on Security and Privacy, 1997.
[75] S. Kumar, and E. Spafford. A Pattern-Matching Model for Intrusion Detection.Proceedings of Nat’l Computer Security Conference, 1994.
[76] E.L. Lehmann, and G. Casella. Theory of Point Estimation. Springer, 2ndedition, 2003.
[77] Z. Li, A. Das, and S. Nandi. Utilizing Statistical Characteristics of N-Gramsfor Intrusion Detection. Proceedings of the 2003 International Conference onCyberworlds, IEEE Computer Society, Washington, DC, USA, December 2003.
[78] P.J. Lucas, and F. Riccardi. Concurrent Hierarchical State Machine. Source-Forge Wesite.
[79] P. Maher. Subjective and Objective Confirmation. Philosophy of Science, No.63, pp. 149-174, 1996.
[80] P. Maher. The Concept of Inductive Probability. Erkenntnis, No. 65, pp. 185-206, 2006.
[81] M. Mahoney, and P. Chan. An Analysis of the 1999 DARPA/Lincoln Lab-oratory Evaluation Data for Network Anomaly Detection. Proceedings of theRecent Advances in Intrusion Detection, Pittsburgh, PA, USA, September 2003.
[82] J.I. Marcum. A Statistical Theory of Target Detection by Pulsed Radar. U.S.Air Force Project RAND, 1947.
[83] Modbus Organization. Modbus Application Protocol Specification. Modbus-IDA Website.
[84] E. Montagu. The Man Who Never Was. Lippincott Publishing House, 1954.
[85] L. Mora. OPC Server Security Considerations. Proceedings of SCADA SecurityScientific Symposium, Miami, USA, 2007.

Bibliography 187
[86] M. Naedele, and O. Biderbost. Human-Assisted Intrusion Detection for ProcessControl Systems. Proceedings of the 2nd International Conference on AppliedCryptography and Network Security, Tunxi/Huangshan, China, June 2005.
[87] E. Naess, D.A. Frincke, A.D. McKinnon, and D.E. Bakken. ConfigurableMiddleware-Level Intrusion Detection for Embedded Systems. Proceedings ofthe Second International Workshop on Security in Distributed Computing Sys-tems, vol. 2, pp. 144-151, 2005.
[88] Nergal. The Advanced Return-into-lib(c) Exploits: PaX Case Study. Nergal,2001.
[89] D.M Nicol, and P. Heidelberger. Parallel Execution for Serial Simulators. ACMTransactions on Modeling and Computer Simulation, pp. 210-242, Vol. 6, No.3, 1996.
[90] NOP Ninjas. Format String Technique. Bughunter Website, 2001.
[91] N. Nise. Control Systems Engineering. Wiley, 2007.
[92] R. Perdisci, G. Gu, and W. Lee. Using an Ensemble of One-class SVM Classifiersto Harden Payload-based Anomaly Detection Systems. Proceedings of the IEEEInternational Conference on Data Mining, December 2006.
[93] A.C. Petri, and W. Reisig. Petri Net. Scholarpedia, Vol. 3, No. 4, 2008.
[94] N.L. Petroni, Jr., T. Fraser, A. Walters, W.A. Arbaugh. An Architecture forSpecification-based Detection of Semantic Integrity Violations in Kernel Dy-namic Data. Proceedings of the 15th USENIX Security Symposium, Vancouver,B.C., Canada, August 2006.
[95] F.D. Petruzella. Programmable Logic Controllers. Career Education, 2004.
[96] J. Pincus, and B. Baker. Mitigations for Low-level coding vulnerabilities: In-comparability and limitations. Microsoft Website.
[97] P. Porras, and R. Kemmerer. Penetration State Transition Analysis: A Rulebased Intrusion Detection Approach. Proceedings of the 8th Annual ComputerSecurity Applications Conference, 1992.
[98] Rockwell Automation. DeviceNet Adaptation of CIP. ODVA Website.
[99] N.C. Rowe. Finding Logically Consistent Resource-Deception Plans for Defensein Cyberspace. Proceedings of the 3rd International Symposium on Security inNetworks and Distributed Systems, Niagara Falls, Ontario, Canada, 2007.
Bibliography 188
[100] N.C. Rowe, and H. Rothstein. Deception for Defense of Information Systems:Analogies from Conventional Warfare. Technical report of the Department ofComputer Science and Defense Analysis, U.S. Naval Postgraduate School, USA,2003.
[101] N.C. Rowe, and H. Rothstein. Two Taxonomies of Deception for Attacks onInformation Systems. Journal of Information Warfare, Vol. 3, No. 2, pp. 27-39,2004.
[102] W.H. Sanders, and J.F. Meyer. Stochastic Activity Networks: Formal Defini-tions and Concepts. Lecture Notes in Computer Science, No. 2090, pp. 315-343,Berlin, Springer, 2001.
[103] W.H. Sanders, and J.F. Meyer. A Unified Approach for Specifying Measuresof Performance, Dependability, and Performability. In Dependable Computingfor Critical Applications, Vol. 4 of Dependable Computing and Fault-TolerantSystems, pp. 215-237, Heidelberg: Springer-Verlag, 1991.
[104] W.H. Sanders. Construction and Solution of Performability Models Based onStochastic Activity Networks. Doctoral Dissertation, University of Michigan,1988.
[105] Scut, and Team Teso. Exploiting Format String Vulnerabilities. Version 1.2,badcoded.blogspot.com Website, 2001.
[106] R. Sekar, A. Gupta, J. Frullo, T. Shanbhag, A. Tiwari, H. Yang, and S. Zhou.Specification-based Anomaly Detection: A New Approach for Detecting Net-work Intrusions. Proceedings of the 9th ACM Conference on Computer andCommunications Security, Washington, DC, USA, 2002.
[107] R. Sekar, and P. Uppuluri. Synthesizing Fast Intrusion Prevention/DetectionSystems from High-Level Specifications. USENIX Security Symposium, 1999.
[108] Solar Designer. Getting Around Nonexecutable Stack and Fix). Bugtraq Mail-ing List, 1997.
[109] L. Spitzner. Honeypots: Tracking Hackers. Addisson-Wesley Professional, 2002.
[110] K. Stouffer, J. Falco, and K. Scarfone. Guide to Industrial Control SystemsSecurity. NIST Website, 2007.
[111] N.N. Taleb. The Black Swan: The Impact of the Highly Improbable. RandomHouse Publishing, 2007.
[112] T.L. Thomas. Russia’s Reflexive Control Theory and the Military. Journal ofSlavic Military Studies 17: pp. 237-256, 2004.

Bibliography 189
[113] L.C. Thomas, C.D. Wickens, and E.M. Rantanen. Imperfect Automation inAviation Traffic Alerts: A Review of Conflict Detection Algorithms and theirImplications for Human Factors Research. Proceedings of the Human Factorsand Ergonomics Society, 47th Annual Meeting, Denver, Colorado, USA, Octo-ber 2003.
[114] P. Uppuluri, and R. Sekar. Experiences with Specification-based Intrusion De-tection. Proceedings of the 4th International Symposium on Recent Advancesin Intrusion Detection, Davis, CA, USA, 2001.
[115] C. Tropper, and A. Boukerche. Parallel Simulation of Communicating FiniteState Machines. Proceedings of the Workshop on Parallel and Distributed Sim-ulation, pp. 143-150, San Diego, CA, USA, 2004.
[116] US Department of Energy. DoE Fundamentals Handbook of Nuclear Physicsand Reactor Theory. DOE-HDBK-1019/1-93, January 1993.
[117] U.S. Joint Chiefs of Staff. Military Deception. The Defense Technical Informa-tion Center (DTIC) website.
[118] K. Wang, S.J. Stolfo. Anomalous Payload-based Network Intrusion Detection.Proceedings of the International Symposium on Recent Advances in IntrusionDetection, France, September 2004.
[119] J. Williamson. Inductive Influence. Philosophy of Science, No. 58, pp. 689-708,2007.
[120] WinTECH Software. ModScan Tool. WinTECH Website.
[121] C. Wuollet, A. Romanenko, H. Jack, J. Baum, J.C. Orozco, M.J.R. de Sousa.MatPLC. SourceForge Wesite.
[122] D.H. Wolpert. Stacked Generalization. Neural Networks, vol. 5, pp. 241-259,1992.
[123] N. Ye, C.M. Borror, and D. Parmar. Scalable Chi–Square Distance versus Con-ventional Statistical Distance for Process Monitoring with Uncorrelated DataVariables. In Quality and Reliability Engineering International, Vol. 19, No. 6,pp. 505-515, 2003.
[124] N. Ye, Q. Chen, S. Emran, and K. Noh. Chi-Square Statistical Profiling forAnomaly Detection. In IEEE Systems, Man, and Cybernetics Information As-surance and Security Workshop, West Point, New York, June 2006.

Bibliography 190
[125] N. Ye, X. Li, Q. Chen, S.M. Emran, and M. Xu. Probabilistic Techniques forIntrusion Detection Based on Computer Audit Data. In IEEE Transactions onSystems, Man, and Cybernetics, part A: Systems and Humans, Vol. 31, No. 4,July 2001.
[126] M. Young, and R. Stamp. Trojan Horses - Deception Operations in the SecondWorld War. Bodley Head, London, UK, 1989.
[127] J. Yuill, M. Zappe, D. Denning, and F. Freer. Honeyfiles: Deceptive Files forIntrusion Detection. Proceedings of the 5th IEEE Workshop on InformationAssurance, U.S. Military Academy, West Point, NY, USA, 2004.
[128] R. Zboray. Experimental Modelling & Study of Natural-Circulation BoilingWater Reactor Dynamics. Delft University Press, 2002.
[129] B. Zhou, Q. Shi, and M. Merabti. Intrusion Detection in Pervasive NetworksBased on a Chi-Square Statistic Test. Proceedings of the 30th Annual Interna-tional Computer Software and Applications Conference, 2006.
Copyright © 2022 FDOKUMEN