Enhanced retrofitting process by integrating post-occupancy ...
18
499 Enhanced retrofitting process by integrating post-occupancy evaluation and user perception Proceso de acondicionamiento térmico mediante la integración de una evaluación post-ocupacional y la percepción del usuario Paulina Wegertseder Martínez (Main and Corresponding Author) Universidad del Bío-Bío, Departamento de Diseño y Teoría de la Arquitectura Av. Collao 1202, Concepción (Chile) [email protected] Maureen Trebilcock Kelly Universidad del Bío-Bío, Departamento de Diseño y Teoría de la Arquitectura Av. Collao 1202, Concepción (Chile) [email protected] Manuscript Code: 1129 Date of Acceptance/Reception: 04.12.2018/22.05.2018 DOI: 10.7764/RDLC.17.3.499 Abstract As part of a thermal retrofitting process of existing housing, energy and thermal performance is normally predicted by dynamic simulation that supposes standardized patterns of building use, without considering the key role of the users in building's energy consumption. This represents a weakness in how the evaluation and design of retrofitting projects is structured, as integrally determining factors in thermal and energy performance are not considered. Integrated evaluations of the homes being improved will help to choose effective and objective guidelines. This work proposes a more objective and holistic evaluation that uses varied and compared techniques, involving the user in post-occupancy evaluation so that they provide feedback for the improvement's design. The integrated diagnosis comprises numerical calculations, onsite measurements, energy simulations and an estimation of the user's perception, with the goal of showing the different results obtained through the different methods. The study shows great differences in what users perceive and expect with the suggestions for thermal improvement obtained from the simulation. It is concluded that, to attain a higher user satisfaction and a better energy performance of the building, thermal improvement strategies must be defined not solely based on standards or previous cases but must consider the expectations of the inhabitants and including experimentally measured values of certain physical-construction properties to calibrate the dynamic simulations. Key words: Energy retrofitting; Post-occupancy evaluation; Thermal comfort; User's perception. Resumen En el acondicionamiento del sector residencial existente se utilizan las simulaciones dinámicas con el fin de predecir el rendimiento energético y térmico, suponiendo un uso estándar de los edificios, sin tener en cuenta el rol clave del usuario en el consumo de energía de una edificación. Esto representa una debilidad en la forma en que se estructura la evaluación y el diseño de los proyectos de acondicionamiento, ya que no se consideran de manera integral los factores determinantes en el desempeño térmico y energético. El desarrollar evaluaciones integradas de las viviendas que se acondicionarán permite elegir directrices efectivas y objetivas. Este trabajo propone una evaluación más objetiva y holística que utiliza técnicas variadas y comparadas, involucrando al usuario en la evaluación post-ocupacional, para que proporcionen una retroalimentación en el proyecto de mejoramiento energético-ambiental. El diagnóstico integrado comprende cálculos numéricos, mediciones in situ, simulaciones de demanda energética y una estimación de la percepción del usuario, con el objetivo de mostrar los diferentes resultados obtenidos a través de diversos métodos de medición. El estudio muestra grandes diferencias al comprar lo que los usuarios perciben y esperan, con las sugerencias de mejoramiento térmico obtenidas desde la simulación. Se concluye que, para lograr una mayor satisfacción del usuario y al mismo tiempo un mejor desempeño energético del edificio, las estrategias de acondicionamiento deben definirse no solo en función de estándares o casos anteriores, sino que deben considerar las expectativas de los habitantes e incluir también los valores medidos experimentalmente de ciertas propiedades físicas de construcción, y así calibrar las simulaciones dinámicas. Palabras clave: Acondicionamiento energético; Evaluación post-ocupacional; Confort térmico; percepción del usuario. Introduction With the constant increase of global consumption and with an expected growth of 2.6 billion people by 2050, there is a progressive awareness of the restrictions this will have on natural resources (Ministry of Energy [MINERGIA], 2017). Energy-dependent countries like Chile (Half a million homes in Chile are in a situation of energy vulnerability), produced by the considerable increase of international fuel prices, must ensure an optimal use of energy resources using less energy without sacrificing comfort or the economic activity useful for the country (CCTP, 2011).
-
Upload
khangminh22 -
Category
Documents
-
view
4 -
download
0
Transcript of Enhanced retrofitting process by integrating post-occupancy ...

499
Enhanced retrofitting process by integrating post-occupancy evaluation and user perception Proceso de acondicionamiento térmico mediante la integración de una evaluación post-ocupacional y la percepción del usuario Paulina Wegertseder Martínez (Main and Corresponding Author)
Universidad del Bío-Bío, Departamento de Diseño y Teoría de la Arquitectura Av. Collao 1202, Concepción (Chile) [email protected]
Maureen Trebilcock Kelly Universidad del Bío-Bío, Departamento de Diseño y Teoría de la Arquitectura Av. Collao 1202, Concepción (Chile) [email protected]
Manuscript Code: 1129
Date of Acceptance/Reception: 04.12.2018/22.05.2018
DOI: 10.7764/RDLC.17.3.499
Abstract As part of a thermal retrofitting process of existing housing, energy and thermal performance is normally predicted by dynamic simulation that supposes standardized patterns of building use, without considering the key role of the users in building's energy consumption. This represents a weakness in how the evaluation and design of retrofitting projects is structured, as integrally determining factors in thermal and energy performance are not considered. Integrated evaluations of the homes being improved will help to choose effective and objective guidelines. This work proposes a more objective and holistic evaluation that uses varied and compared techniques, involving the user in post-occupancy evaluation so that they provide feedback for the improvement's design. The integrated diagnosis comprises numerical calculations, onsite measurements, energy simulations and an estimation of the user's perception, with the goal of showing the different results obtained through the different methods. The study shows great differences in what users perceive and expect with the suggestions for thermal improvement obtained from the simulation. It is concluded that, to attain a higher user satisfaction and a better energy performance of the building, thermal improvement strategies must be defined not solely based on standards or previous cases but must consider the expectations of the inhabitants and including experimentally measured values of certain physical-construction properties to calibrate the dynamic simulations. Key words: Energy retrofitting; Post-occupancy evaluation; Thermal comfort; User's perception.
Resumen En el acondicionamiento del sector residencial existente se utilizan las simulaciones dinámicas con el fin de predecir el rendimiento energético y térmico, suponiendo un uso estándar de los edificios, sin tener en cuenta el rol clave del usuario en el consumo de energía de una edificación. Esto representa una debilidad en la forma en que se estructura la evaluación y el diseño de los proyectos de acondicionamiento, ya que no se consideran de manera integral los factores determinantes en el desempeño térmico y energético. El desarrollar evaluaciones integradas de las viviendas que se acondicionarán permite elegir directrices efectivas y objetivas. Este trabajo propone una evaluación más objetiva y holística que utiliza técnicas variadas y comparadas, involucrando al usuario en la evaluación post-ocupacional, para que proporcionen una retroalimentación en el proyecto de mejoramiento energético-ambiental. El diagnóstico integrado comprende cálculos numéricos, mediciones in situ, simulaciones de demanda energética y una estimación de la percepción del usuario, con el objetivo de mostrar los diferentes resultados obtenidos a través de diversos métodos de medición. El estudio muestra grandes diferencias al comprar lo que los usuarios perciben y esperan, con las sugerencias de mejoramiento térmico obtenidas desde la simulación. Se concluye que, para lograr una mayor satisfacción del usuario y al mismo tiempo un mejor desempeño energético del edificio, las estrategias de acondicionamiento deben definirse no solo en función de estándares o casos anteriores, sino que deben considerar las expectativas de los habitantes e incluir también los valores medidos experimentalmente de ciertas propiedades físicas de construcción, y así calibrar las simulaciones dinámicas. Palabras clave: Acondicionamiento energético; Evaluación post-ocupacional; Confort térmico; percepción del usuario.
Introduction With the constant increase of global consumption and with an expected growth of 2.6 billion people by 2050, there is a progressive awareness of the restrictions this will have on natural resources (Ministry of Energy [MINERGIA], 2017). Energy-dependent countries like Chile (Half a million homes in Chile are in a situation of energy vulnerability), produced by the considerable increase of international fuel prices, must ensure an optimal use of energy resources using less energy without sacrificing comfort or the economic activity useful for the country (CCTP, 2011).

500
Internationally, buildings are one of the main sources of energy demands and the producers of great carbon dioxide (CO2) emissions. Heating comprises between 40 and 60% of a standard home's average consumption, with this sector being responsible for 50% of the planet's CO2 emissions (MINERGIA, 2017). In recent years, the thermal performance of homes in Chile has improved, thanks to the incorporation of an obligatory Thermal Regulation (TR) for new homes (since 2000 for roofs and since 2007 for walls and windows) and their voluntary Energy Rating. However, according to the MINERGIA (2017), the residential sector represents 22% of the national energy consumption and the average indoor temperature of homes falls below international standards, reaching 15.7°C when it should be 20°C, which shows an important problem of fuel poverty and low comfort standards. Considering this information and the fact that regulations only apply to new homes, which means that existing housing are out of these new considerations of better thermal performance. In Chile, 74% of the housing stock are in this situation, where the user is paying for the energy costs that keeping the home in comfortable conditions would imply. Several authors have stated that energy retrofitting our obsolete housing stock has great potential for saving energy and reducing CO2 emissions and is an opportunity to revitalize the construction sector, to offset effects of economic crises and to comply with the State’s energy efficiency commitments (Ma, Cooper, Daly & Ledo, 2012; Serrano & Sanchis, 2014). In recent years, a relevant number of research projects have looked at how an adequate retrofitting process can significantly reduce energy consumption in existing buildings (Asadi, da Silva, Antunes, Dias & Glicksman, 2014; Kolaitis, et al., 2013). In 2010, the Chilean Government began to provide a subsidy for "Thermal Retrofitting in Existing Housing" for social housing built prior to TR. Although this improvement has generally contributed to improve the quality of life of the occupants, there are questions to whether they have completely reached comfort targets. This occurs, among other factors, as a result of two main reasons: first, the standard being sought by the retrofitting falls short (complying with TR); therefore, it is difficult to thermally improve a home if the standard does not work as expected (Tookaloo & Smith, 2015); second, the TR only regulates the thermal transmittance of the envelope, without considering other major factors to provide thermal comfort, reduce energy consumption and improve indoor air quality, such as: airtightness, condensation, ventilation, thermal bridges, etc. A building's performance is always the result of the interaction between different solutions for different under-performance aspects that one wishes to measure. Therefore, contrary to how this improvement subsidy is covered, the performance-based approach demands an integrated design, with parallel and interrelated contributions of the design areas involved (Spekkink, 2005), as well as methods that could interact in the retrofitting's design process. On the other hand, it is seen that the retrofitting processes lack evaluation systems and routines for the building in real use conditions, resulting in a lack of feedback about the operation stage, a crucial aspect in the building's energy performance. If this evaluation was made, it would provide really useful information for decision-making in the design process, both for new and existing buildings. The post-occupancy evaluation (POE) acts as a response to the problems found in the user's low satisfaction levels related to the building's different performances, as well as to face maintenance costs that are higher than foreseen in the design stages (Vazquez-Hernandez & Restrepo, 2017; Attzeri, Cappelletti, Tzempelikos & Gasparella, 2016; Arco, et al., 2013). However, this type of evaluation needs to be made by a third-party who is not involved in the project, to objectively obtain results of the effects that the built spaces have on the users. There are many tools used for a POE and they provide different types of results. They can measure by monitoring, observations, user surveys or questionnaires, and can be isolated or integrated in a single analysis. However, the great potential these techniques can show, does not guarantee the performance and energy savings forecast in the design for the occupation stage (Chiu, Lowe, Raslan, Altamirano & Wingfield, 2014). Factors like the user's habits, their levels of activity, psychological and cultural needs, socio-economic level, educational level, among others, have direct or indirect impacts on a building's energy performance (Göçer, Hua & Göçer, 2015). The comfort level plays a crucial role in determining the energy demand for a building's operation (Attzeri, et al., 2016; Pisello & Asdrubali, 2014). Despite the importance that including the user in the retrofitting design process of an existing building, or indeed in the design of a new one, has, this is not normally considered in the performance evaluation.

501
Energy retrofits based solely on theoretical calculations, established regulations and supposed building's physical characteristics, do not provide an accurate view of the possible benefits in thermal comfort, energy or economic savings (Galvin & Sunikka-Blank, 2013; Perez, Flores & Calama, 2015). Considering these aspects, this research raises a discussion about how efficient and effective different methods can be to determine energy and environmental outcomes such as, thermal comfort, heating loads and indoor air quality for a home. This article presents the implementation of a POE method which diagnoses the physical-constructive quality of the housing under three validated methods: dynamic simulation, experimental measurements and numerical techniques in order to, in a later stage, contrast them against the user's perception in the homes being studied (Figure 1). This holistic vision of the housing's current state allows defining the need to improve existing buildings by integrating more relevant variables regarding the final proposed variables, without having to solely comply with current regulation, but by proposing improvements which provide greater benefits, thus determining architectonic and constructive design decisions which have a high impact on the results sought (better energy and thermal performance after retrofitting).
Figure 1. Diagram of the diagnosis method to obtain results which allow knowing the performance aspects being studied. Source: Own elaboration.
Methodology Dynamic simulation is an alternative to theoretical calculations to predict energy and thermal performance. It is not just used to design new buildings, but also to remodel existing ones. A standard use of the buildings is generally assumed in the simulations (which optimizes time in the design process). Despite the role the user’s behavior (opening of windows, ventilation rates, and presence in specific rooms) plays, this is widely acknowledged as a key factor in a building’s energy consumption (Pisello & Asdrubali, 2014; Jones, Goodhew & De Wilde, 2016). Although studies based on modelling and simulation are of great use, using them as the only performance prediction method does not allow seeing part of the reality, as they are based on assumptions and simplifications of all the complexities of real buildings. Therefore, it is necessary to include a more exhaustive investigation related to the human factors in improvement works (Woo, 2016). A low thermal comfort does not just affect the user's satisfaction, well-being and productivity. It also induces actions and operations that affect the energy performance foreseen, for example, when using a dynamic simulation (Attzeri et al., 2016). The evaluation of an existing building from the user's perception is important because it does not just provide results of the building's current status, but also provides guidelines to improve the design quality of the improvements or of new buildings (Nooraei, Littlewood & Evans, 2013; Vale & Vale, 2012; Baird, 2009; Ilesanmi, 2010). From some studies that have considered the role of the user on the building's energy performance, it has been defined that their effect on the energy demand can be of 10-15% and sometimes more (Pisello & Asdrubali, 2014).

502
Case study selection The useful life of social housing should be long-lasting, since in Chile a person can only access it only once. However, it is observed that the state of these is deficient, making people feel cold. These users do not have money to heat their homes, but they do have the opportunity to aim for a governmental subsidy for thermal improvement. That is why this research consider the social housing as a case study. Case studies were chosen in the district of Hualpén, where 82% of the existing residential stock corresponds to social housing. The district is located in the Biobio Region, which has a high dynamism and growth in terms of houses built and subsidies provided, sitting third nationally in terms of priority and second among the country’s most populated areas. The district is located in the metropolitan area of Concepción, at latitude 36°50’ –S and longitude 73°02’ –W. The region is in a bioclimatic transition area between the Mediterranean climate of Central Chile and the template-cold climate, characteristic to the South of the country. Using Wladimir Köppen’s empirical climate zone classification (Inzunza, 2005), the climate of Hualpén is defined as Warm-Summer Mediterranean (Csb). At a district level, four statistically representative cases are found. These are based on a multifactorial study which considers the following parameters: neighborhood’s name, year of council approval, grouping type (semi-detached, terraced or detached), total built surface area, number of stories, materiality, number of homes and valuation (Table 1).
Table 1. Case studies chosen from statistical analysis. Source: Own elaboration.
Neighbourhood Year Built
Grouping Type
Surface Area (m2)
N° of stories Materiality
Number of identical homes
Cabo Aroca 1989 Semi-detached
30.36 1 Wood 207
Peñuelas II 1990 Semi-detached
44.42 1 Masonry 446
Presidente Aylwin 1993 Terraced 40.38 2 Masonry 249 Villa el Triángulo 1991 Semi-
detached 36.00 2 Wood 214
Cabo Aroca typology

503
Peñuelas II typology
Presidente Aylwin typology
Villa El Triangulo typology
Determination of performances aspects to be assessed
Three final quantifiable performances are defined as improvement targets for this study: energy efficiency by heating and cooling demand, thermal comfort, and indoor air quality. Before proposing the criteria to be evaluated and the indicators these three performances must comply with, the parameters which affect them must be determined. It is established that the parameters considered must fall within the architectonic and constructive design, considering only those that can be modified in the real context. Due to the weather where the case studies are located, energy efficiency must look to reduce the heating demand. This is the highest consumption, in energy terms, for housing in the South of Chile. The main variables involved in thermal comfort are the indoor temperature, humidity and air speed conditions, always maintaining the indoor air quality for the user (ASHRAE, Standard 55). As such, it is considered that the energy efficiency performances for heating demand and indoor thermal comfort are influenced by the same parameters: (i) the envelope's thermal transmittance, (ii) the envelope's airtightness and (iii) window design (physical-constructive properties and sizes). However, the indoor air quality performance is not considered, with the only criterion specified being the indoor air rate to reach. Table 2 shows the indicators, design variables and verification methods for each performance aspect sought through the environmental-energy improvement of an existing home.
Table 2. Final and intermediate performances with respective indicators, design variables and verification methods. Source: Own elaboration.
Final Performances
Final Performance Indicator
Intermediate Performance (functional requirements)
Intermediate Performance Indicators
Design variable (design requirement)
Verification Method
Thermal Comfort and Energy Efficiency
1. Temperature Frequency Distribution (%)
Thermal transmittance
W/m2K U Value of Wall, Roof, Floor and Windows
Thermo-flowmeter as per ASTM 518-10
Hydrothermal insulation
Rsi (sd)/
Rsimin<Rsi
Occurrence of surface condensation
Monitoring of temperature variables and air's relative humidity
p(Pa) Occurrence of interstitial condensation
Simulation of the wall's solution

504
2. Heating Energy Demand (kWh/m2year)
with accepted software
Airtightness ACH Air leakage rate Blower Door Test Amount of Glazed Surface Area
m2 Percentage surface area of north-facing glazing
Surveying
Indoor Air Quality
Indoor Air Rate l/s per person or l/s per m2
- - Minimum required ventilation flow
CO2 concentration monitoring
Post- occupancy evaluation methods In order to choose effective and objective guidelines for energy retrofitting, an integrated evaluations of the homes being improved is developed. The proposal is to perform a more objective and holistic evaluation that uses varied and compared techniques, comprises numerical calculations, onsite measurements, energy simulations and an estimation of the user's perception, with the goal of showing the different results obtained through the different methods.
Measurement of the envelope's thermal performance using Numerical Technique This method is chosen as it is the methodological option that has been used to apply thermal improvements to existing homes under state subsidies in Chile. Theoretical values related with the envelope's thermal performance are determined, disregarding the deterioration the materials may have or the interventions that could have been made to the materials and the impact these may have on the energy and environmental performance. The calculations to determine the construction element's thermal transmittance were made following the procedures set out in Chilean Norm (NCh853-2007). These are based on the assumption that the thermal flow is developed following Fourier's law, under a stationary setup.
Measurement of the envelope's thermal performance using Experimental Technique Measurements are made of the current status of the physical-constructive parameters for the case studies, as the outdoor conditions change. The thermal transmittance values obtained from experimental measurements can differ significantly from the results of an analytical calculation-based analysis (Ascione, De Rossi & Vanoli, 2011; Bycroft & McGregor, 2002). The difference is normally within a 20% margin, mainly due to reasons such as: the works did not follow the design; the material experiences wear and tear; the environmental conditions are different to those considered in the design; construction materials get usually wet affecting their thermal conductivity; among others. However, having real information of certain properties of the case study is extremely relevant when studying an existing home, being able to bring closer to reality another type of post-occupational studies which look to determine long-term behaviors, as is the dynamic energy simulation using Design Builder software does. The following was measured in each house studied: (i) the thermo-flowmeter of one wall and one window to know their thermal transmittance using the ASTM C1046 standard (Standard Practice for In-Situ Measurement of Heat Flux and Temperature on Building Envelope Components) under conditions of use, and (ii) the envelope's airtightness, using a blower door test to determine the home's real airtightness level and to identify where the cold air is coming inside.
Housing performance prediction using dynamic simulations
The simulation tools for buildings help predict the building's performance in early design stages and also allow knowing the behavior of an existing building. Dynamic energy simulation plays a key role in the energy analysis, both in the initial performance diagnosis and in setting out retrofitting improvements. In addition, the dynamic simulation in this study allows studying the performances in a multi-variable way to know the action these have on integrally acting on an energy demand and/or thermal comfort response; and on not considering a parameter individually. For Olofsson, Andersson & Sjögren (2009), an important reason to use a multi-varied approach is being able to reduce the impact of the correlation
505
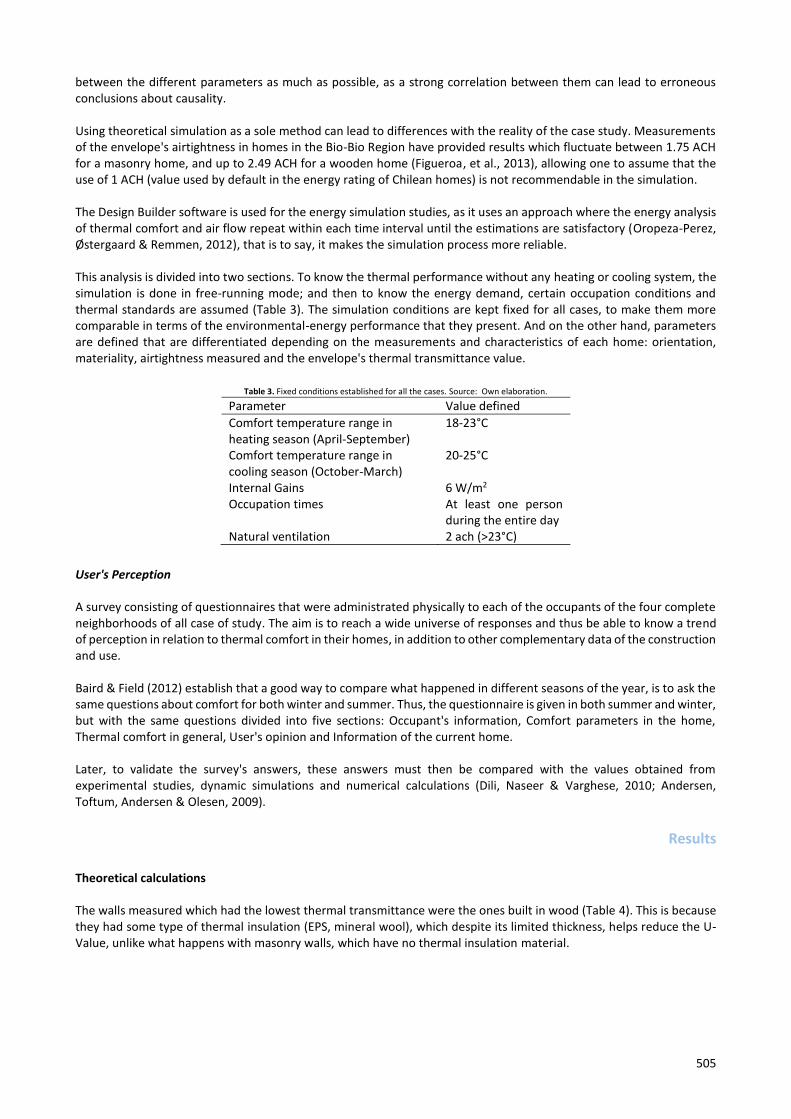
between the different parameters as much as possible, as a strong correlation between them can lead to erroneous conclusions about causality. Using theoretical simulation as a sole method can lead to differences with the reality of the case study. Measurements of the envelope's airtightness in homes in the Bio-Bio Region have provided results which fluctuate between 1.75 ACH for a masonry home, and up to 2.49 ACH for a wooden home (Figueroa, et al., 2013), allowing one to assume that the use of 1 ACH (value used by default in the energy rating of Chilean homes) is not recommendable in the simulation. The Design Builder software is used for the energy simulation studies, as it uses an approach where the energy analysis of thermal comfort and air flow repeat within each time interval until the estimations are satisfactory (Oropeza-Perez, Østergaard & Remmen, 2012), that is to say, it makes the simulation process more reliable. This analysis is divided into two sections. To know the thermal performance without any heating or cooling system, the simulation is done in free-running mode; and then to know the energy demand, certain occupation conditions and thermal standards are assumed (Table 3). The simulation conditions are kept fixed for all cases, to make them more comparable in terms of the environmental-energy performance that they present. And on the other hand, parameters are defined that are differentiated depending on the measurements and characteristics of each home: orientation, materiality, airtightness measured and the envelope's thermal transmittance value.
Table 3. Fixed conditions established for all the cases. Source: Own elaboration.
Parameter Value defined
Comfort temperature range in heating season (April-September)
18-23°C
Comfort temperature range in cooling season (October-March)
20-25°C
Internal Gains 6 W/m2 Occupation times At least one person
during the entire day Natural ventilation 2 ach (>23°C)
User's Perception A survey consisting of questionnaires that were administrated physically to each of the occupants of the four complete neighborhoods of all case of study. The aim is to reach a wide universe of responses and thus be able to know a trend of perception in relation to thermal comfort in their homes, in addition to other complementary data of the construction and use. Baird & Field (2012) establish that a good way to compare what happened in different seasons of the year, is to ask the same questions about comfort for both winter and summer. Thus, the questionnaire is given in both summer and winter, but with the same questions divided into five sections: Occupant's information, Comfort parameters in the home, Thermal comfort in general, User's opinion and Information of the current home. Later, to validate the survey's answers, these answers must then be compared with the values obtained from experimental studies, dynamic simulations and numerical calculations (Dili, Naseer & Varghese, 2010; Andersen, Toftum, Andersen & Olesen, 2009).
Results
Theoretical calculations The walls measured which had the lowest thermal transmittance were the ones built in wood (Table 4). This is because they had some type of thermal insulation (EPS, mineral wool), which despite its limited thickness, helps reduce the U-Value, unlike what happens with masonry walls, which have no thermal insulation material.

506
Table 4. Thermal transmittance value results as per numerical calculation and thermo-flowmeter measurements in elements of the main facade (W/m2K). Source: Own elaboration.
Case study
Calculated U-Value of Wall
Measured U-Value of
Wall
U-Value of Wall demanded in
RT
Calculated U-Value of Window
Measured U-Value of Window
U-Value of Window demanded in
Thermal Regulation
(W/m2K)
Cabo Aroca 1.68 1.76 1.7 5.64 5.54 2.56 Peñuelas II 2.77 2.35 5.64 5.35 Presidente Aylwin
2.88 2.92 5.64 5.49
Villa el Triángulo
1.48 1.44 5.64 5.33
Experimental measurements
Thermo-flowmeter In Table 4, it can be seen that all walls (with the exception of those of Villa el Triángulo) and glazing show thermal transmittance values out of the limit established by the norm for the current climate zone, as these houses were built before the norm existed (during the 80's and 90's). When these houses were built, the main goal was to reduce housing shortages, disregarding thermal quality and not even considering energy efficiency. If the U-values the walls obtained from the measurement are compared with those calculated, no constant difference is observed, since in some cases the U-value is higher in the measurement and in others in the calculated one. This may be due to deterioration of the material, or because the built wall differs from the designed. On the contrary, in the case of windows it is observed that the measured value has better performance than the calculated one.
Airtightness As can be seen in Table 5, the houses built using light wooden structures (Cabo Aroca and El Triángulo) have lower airtightness levels in the envelope, doubling the air renewal values per hour measured in the masonry housing.
Table 5. Results of the depressurization measurement with the Blower Door Test. Source: Own elaboration.
Case study Effective leakage
area (cm2) n50 at 50 Pa, Air Changes
per Hour (1/h) V50, air flow
(m3/h)
Cabo Aroca 2021.7 51.86 4833 Peñuelas II 1309.5 24.62 2734 Presidente Aylwin 712.0 12.51 1441 Villa el Triángulo 1102.7 35.99 2413
Dynamic simulation Figures 2 and 3 show the results of predicted hourly indoor temperatures in the four cases obtained by thermal dynamic simulation, where the expected thermal comfort range is highlighted in orange (for values see Table 3). In the heating season (April-September), most of the homes studied in free-running mode show temperatures under the determined comfort range (Figure 2). However, unlike what happened outside the heating season, wooden houses have the highest number of hours within the comfort range, they reach minimum temperatures of 5 °C, while those of masonry reach 8 or 10°C. Outside the heating season (October-March), that usually operates in free-running mode, the terraced house (P. Aylwin) had most hours within the thermal comfort range (19.8%) followed by Peñuelas II (18.7%), Cabo Aroca (12.3%.) and El Triángulo (12.1%) (Figure 3). Therefore, the houses built in wood have a higher number of hours outside the thermal comfort range. The four houses show a large percentage of the time with temperatures that fluctuate between 14 and 20°C, i.e., the users spend most time under the comfort range outside the heating operating in free-running mode. At the same time, all the cases studied show a little risk of overheating, with wooden houses having the highest one.

507
Figure 2. Hourly Indoor Temperature during heating season for the cases studied. Source: Own elaboration.
Cabo Aroca El Triángulo
P. Aylwin Peñuelas II
5
10
15
20
25
30
0 733 1466 2199 2932 3665 4398
Indoor
Tem
pera
ture
( C
)
Apr. May. Jun. Jul. Aug. Sep
5
10
15
20
25
30
0 733 1466 2199 2932 3665 4398
Indoor
Tem
pera
ture
( C
)
Apr. May Jun. Jul. Aug. Sep.
5
10
15
20
25
30
0 733 1466 2199 2932 3665 4398
Indoor
Tem
pera
ture
( C
)
Apr. May. Jun. Jul. Aug. Sep.5
10
15
20
25
30
0 733 1466 2199 2932 3665 4398
Indoor
Tem
pera
ture
( C
)
Jan. Feb. Mar. Oct. Nov. Dec.

508
Figure 3. Hourly Indoor Temperature during cooling season for the cases studied. Source: Own elaboration.
Cabo Aroca El Triángulo
P. Aylwin Peñuelas II
5
10
15
20
25
30
35
0 733 1466 2199 2932 3665 4398
Indoor
Tem
pera
ture
( C
)
Apr. May. Jun. Jul. Aug. Sep
5
10
15
20
25
30
35
0 733 1466 2199 2932 3665 4398
Indoor
Tem
pera
ture
( C
)
Jan. Feb. Mar. Oct. Nov. Dec.
5
10
15
20
25
30
35
0 733 1466 2199 2932 3665 4398
Indoor
Tem
pera
ture
( C
)
Jan. Feb. Mar. Oct. Nov. Dec.5
10
15
20
25
30
0 733 1466 2199 2932 3665 4398
Indoor
Tem
pera
ture
( C
)
Jan. Feb. Mar. Oct. Nov. Dec.

509
Prediction of heating loads
The analysis considered a simulation of cooling and heating loads during the two indicated seasons, considering a temperature set point of 18°C for the heating season (April-September) and 25°C for the cooling load outside the heating season (October-March). The cooling demand for the warm months is not significant (Table 6) because the risk of overheating is low (Figure 3), making the use of any cooling system unnecessary. However, it can be observed that the difference in demand between houses built in wood with those of masonry, being those of wood those that show a worse performance. Likewise, in the heating season, the wooden-built produce the greatest heating load (Table 7 and Figure 4). Due to the climate where the houses are located, and because to their deficient thermal performance, the greatest energy demands are seen in cold months. Therefore, if only this methodology of diagnostic was considered, improvement strategies should point only to this criterion. .
Table 6. Cooling load between October-March. Source: Own elaboration
Case Study Heating load for the Entire House (kWh)
Heated area (m2)
Heating load (kWh/m2)
Cabo Aroca 199.29 33.6 5.93
Peñuelas II 7.98 30.8 0.25
Presidente Aylwin 65.07 37.4 1.73
Villa el Triángulo 252.93 33.4 7.5
Table 7. Heating load between April-September. Source: Own elaboration.
Case Study Heating load for the Entire House (kWh)
Heated area (m2)
Heating load (kWh/m2)
Cabo Aroca 6,497.2 33.6 193.3
Peñuelas II 3,878.6 30.8 126.1
Presidente Aylwin 4,727.6 37.4 126.3
Villa el Triángulo 5,514.7 33.4 165.6
Figure 4. Comparison of heating load (Kwh/m2 year) between April-September. Source: Own elaboration.
Survey results Based on the results of the survey, all the respondents in summer felt comfortable and prefer to keep the temperature equal to how they feel today, with the exception of the occupants of Cabo Aroca (wooden, one-story), who felt it was slightly uncomfortable, finding indoor temperature warm (Table 8).
0
50
100
150
200
250
Cabo Aroca P. Aylwin Peñuelas II El Triangulo
Ener
gy D
eman
d (
kW/h
m²)

510
In winter, most users state they feel cold indoors, expressing the need of increasing the temperature inside the homes. They all agree that the homes are not comfortable (Table 9). The residents of P. Aylwin report less comfort than the rest, which contradicts the response regarding the use of a heating system, where most mentioned they do not use one. This should not be attributable to the need to heat, but rather to the availability of economic resources. However, the rest of the neighborhoods use some form of heating, due to the need to increase the indoor temperature. As for the air leaks during winter, these match with what they felt during summer: limited air current. This except for P. Aylwin which perceives a greater current, situation which goes completely against the pressurization test, where this was the home with the lowest air leakage rate. In terms of air quality, no neighborhood describes it as good, but rather they consider it as neutral or bad.
Table 8. Comfort score in summer pursuant user perception. Source: Own elaboration.
Condition Factors (Average) Neighborhood Good Score
Trend Score
Temperature
Very Cold Cold Slightly
Cold Neutral Slightly Warm Warm
Very Warm
Pdte. Aylwin 4 5.38
Cabo Aroca 4 5.63
El Triángulo 4 5.43
Peñuelas II 4 4.46
Ideal Temperature
Much Colder
Colder Slightly Colder
Same Slightly Warmer
Warmer Much
Warmer
Pdte. Aylwin 4 4.10
Cabo Aroca 4 3.95
El Triangulo 4 4.07
Peñuelas II 4 4.38
Humidity
Very Dry Dry Slightly
Dry Neutral
Slightly Moist
Moist Very
Moist
Pdte. Aylwin 4 4.57
Cabo Aroca 4 5
El Triangulo 4 3.52
Peñuelas II 4 4.45
Airflow
Very Still Still Air Slightly
Still Neutral
Light Breeze
Breeze Strong Breeze
Pdte. Aylwin 4 6.01

511
Cabo Aroca 4 5.48
El Triángulo 4 4.32
Peñuelas II 4 5.11
Indoor Air Quality
Very poor Poor Slightly
Poor Neutral
Slightly Good
Good Very Good
Pdte. Aylwin 6 5.03
Cabo Aroca 6 4.21
El Triangulo 6 3.67
Peñuelas II 6 3.99
General Comfort
Very Uncomfortabl
e
Uncomfortable
Slightly Uncomfortabl
e Comfortable
Very Comfortable
Pdte. Aylwin 4 3.63
Cabo Aroca 4 3.29
El Triangulo 4 3.58
Peñuelas II 4 3.58
Table 9. Comfort score in winter pursuant user perception. Source: Own elaboration.
Condition Factors (Average) Neighborhood Good Score
Trend Score
Temperature
Very Cold Cold Slightly
Cold Neutral
Slightly Warm
Warm Very
Warm
Pdte. Aylwin 4 1.89
Cabo Aroca 4 2.63
El Triángulo 4 2.29
Peñuelas II 4 2.15
Ideal Temperature
Much Colder
Colder Slightly Colder
Same Slightly Warmer
Warmer Much
Warmer
Pdte. Aylwin 4 6.12
Cabo Aroca 4 6.12
El Triángulo 4 5.78

512
Peñuelas II 4 5.90
Humidity
Very Dry Dry Slightly
Dry Neutral
Slightly Moist
Moist Very
Moist
Pdte. Aylwin 4 6.01
Cabo Aroca 4 5.63
El Triángulo 4 4.63
Peñuelas II 4 5.80
Airflow
Very Still Still Air Slightly
Still Neutral
Light Breeze
Breeze Strong Breeze
Pdte. Aylwin 4 6.26
Cabo Aroca 4 5.36
El Triángulo 4 4.82
Peñuelas II 4 5.53
Indoor Air Quality
Very poor Poor Slightly
Poor Neutral
Slightly Good
Good Very Good
Pdte. Aylwin 6 4.66
Cabo Aroca 6 4.23
El Triangulo 6 3.45
Peñuelas II 6 3.86
General Comfort
Very Uncomfortabl
e
Uncomfortable
Slightly Uncomfortabl
e Comfortable
Very Comfortable
Pdte. Aylwin 4 2.45
Cabo Aroca 4 2.63
El Triangulo 4 3.13
Peñuelas II 4 2.62

513
Discussion Actually, the methods used for the rating of energy consumption in dwellings, such as the -Home Energy Rating (“Calificación Energética de Viviendas”) in Chile, or the Standard Assessment Procedure (SAP) in UK, do not consider the perception of the user who lives in the evaluated housing, rather it considers it of normalized way. These methods turn out to be inadequate for individual dwellings, where the actual use of energy results from a complex interaction between its constructed form, its location, the equipment that use energy, its occupants and the affordability of fuel (Wright, 2008).
While regulations and standards on energy efficiency and comfort are compelling and necessary tools, they are usually too general for specific circumstances (Baird, 2009). The sensitivity of people varies in certain environments and can be difficult to satisfy, or they can be met with less effort. As it is observed in the results of this research, there is a difference between what the user perceives and what arises from the computer simulation: they felt comforted in moments where the simulation shows that houses were very warm. The user's behavior could not be standardized as a fixed value, but rather one that is being constantly affected by a wide range of variables (cultural, sex, previous experiences, expectations, age, among others). Therefore, it is suggested to complement the methodology with a user follow-up, which will allow having more detailed results of their habits and occupation hours. Although this methodology involves dedicating more time, it provides a greater amount of information to get results closer to reality and that deal with the user´s. Furthermore, as their perception can vary versus the theoretical results, it becomes necessary to include the user´s perception in the post-occupational studies. Zhao, Wu & Zhu (2009) establishes that the fact of occupying a multifactorial or integral evaluation method as a basis, allows proposing a more optimal improvement for the studied reality, in a more systematic, scientific, holistic and objective way. Then, for a comprehensive diagnosis, quantitative analysis with numerical and experimental techniques is complemented. It is seen that most of the measured thermal transmittance values on the external walls show a more unfavorable U-value than the one obtained by the numerical technique. That is to say, the wall's real thermal resistance is different to what it had initially. This may be due to several reasons, for example, that the user has made some sort of modification to the walls which they have not stated in the interviews, or that the envelope has experienced major deterioration. The onsite monitoring was able to gather empirical data that calibrates and validates numerical models, improving predictions of the home's thermal performance. It was seen that the leakage rate value measured, for example, was far from the value established by default in many of the cases, completely cancelling out the efforts of thermally improving a wall. The envelope's air permeability in the case studies was four times what is required in other international standards. Which makes us reflect on those low-cost strategies that would have a high impact on comfort and energy consumption (e.g.: seal air infiltration). The third experimental technique used, referred to dynamic simulations, presents high efficiency for the search of results in terms of predicting the environmental-energy performance of the house on an annual basis (Polly, et al., 2011.) However, when it comes to foreseeing the effectiveness of improvement strategies in existing houses, it is suggested to consider the user's perception to define the objective to achieve (thermal comfort range for example) and including experimentally measured values of certain physical-constructive properties as an input to calibrate the dynamic model. Both can noticeably affect decision-making. The set of diagnosis methods used in this methodology allows obtaining very accurate results, determining those standards that have more or less influence on the strategies to achieve thermal comfort and energy efficiency. However, these require time, space, specific tools and availability of the homeowners involved in the study. This type of integrated processes which validates and generalizes the information, has the potential of becoming a guide for public use. For this reason, it is suggested to make

514
a retrofit rating scheme, in the built stock state retrofit development, which includes evaluation requirements to guarantee a better thermal comfort. In Chile, these currently only look to reach thermal transmittance values in the envelope, disregarding other highly relevant factors when seeking to increase the thermal comfort and reduce air-conditioning related energy consumption.
Conclusions From the physical-constructive diagnosis obtained from dynamic simulations, it was seen that all the houses experienced at least 60% of hours outside the heating season below the thermal comfort zone, i.e. with temperatures below 20°C. When these results are compared with the user's perception, it is seen that the homes are considered as comfortable in their current state. The exception is Cabo Aroca, where users perceive warm indoor temperatures, which makes sense as this is the case where most hours are above the comfort zone. If only the results obtained from the dynamic simulations are considered, this would look to increase the indoor temperature during this season, but if a reflection is made about both responses, the strategies should be different and tend towards user satisfaction, who prefer to keep the temperatures as they are. In the heating season, the situation is even more prejudicial. The temperatures fluctuate under the thermal comfort zone for 90% of the time in all the cases, which is fully in line with what the surveys pointed out, where the users consider their homes as uncomfortable. It is concluded that, for the heating season, most of the responses match the physical-construction diagnosis, rating the home as uncomfortable and wishing to increase indoor temperatures. As a result, upon establishing improvement strategies, these should look at this season as a priority, but without disregarding the situation in the summer season. Finally, it is determined that the essential performances in the environmental-energy improvement of the analyzed cases are: improving the wall's thermal transmittance (with a standard that is much higher than the one demanded by the current Thermal Regulation), reducing the air leakage rate in the envelope (not considered in current Chilean regulations) and using a ventilation system which guarantees indoor air quality (mainly due to the occupation habits and load). In relation to the study of these cases of social housing, it is inferred that the thermal retrofitting does not necessarily cause a significant decrease in the energy consumption for heating, nor a monetary saving, since this segment of the country's population does not allocate more economic resources to heat their homes in winter. However, this improvement implies a more efficient use of energy, but more importantly, it improves the quality of life by extending the daily comfort period in the indoor environment. Therefore, regardless of the socioeconomic reality, the greatest benefit is not manifested in economic savings, but in achieving: environmental comfort, indoor air quality and, due to the reduction of pathologies, it may extend the useful life of the home.
Acknowledgements This research is part of a doctoral thesis, which was ongoing at the University of Bío–Bío in Concepción, Chile. The authors would like to acknowledgements the support of the Research Group in Architecture and Sustainable Construction (GACS) members.

515
References
Andersen, R., Toftum, J., Andersen, K., & Olesen, B. (2009). Survey of occupant behaviour and control of indoor environment in Danish dwellings. Energy and Buildings 41(1), 11–16.
Arco, J., Sanchez, J., Saucedo, R., Gil, F., Salmerón, J., & Molina, J. (2013). Gestión y rehabilitación energética de edificios existentes: procedimiento experimental de diagnosis y caracterización energética. Revista de la Construcción 12(3), 9-16.
Asadi, E., Da Silva, M. G., Antunes, C. H., Dias, L., & Glicksman, L. (2014). Multi-objective optimization for building retrofit: A model using genetic algorithm and artificial neural network and an application. Energy and Buildings, 81, 444-456.
Ascione, F., De Rossi, F., & Vanoli, G. (2011). Energy retrofit of historical buildings: theoretical and experimental investigations for the modelling of reliable performance scenarios. Energy and Buildings, 43(8), 1925–1936.
ASHRAE Standard 55. Thermal environmental conditions for human occupancy. Atlanta, 2017.
Attzeri, A. M., Cappelletti, F., Tzempelikos, A., & Gasparella, A. (2016). Comfort metrics for an integrated evaluation of buildings performance. Energy and Buildings, 127, 411-424.
Baird, G. (2009). Incorporating User Performance Criteria into Building Sustainability Rating Tools (BSRTs) for Buildings in Operation. Sustainability, 1(4), 1069-1086.
Baird, G., & Field C. (2012) Thermal comfort conditions in sustainable buildings e Results of a worldwide survey of users’ perceptions. Renewable Energy, 49, 44-47
Bycroft, P., & McGregor, K. (2002) Post Occupancy Evaluation (POE) and sustainable design. Environment Design Guide, 1-8.
Chiu, L. F., Lowe, R., Raslan, R., Altamirano-Medina, H., & Wingfield, J. (2014). A socio-technical approach to post-occupancy evaluation: interactive adaptability in domestic retrofit. Building Research and Information, 42(5), 574-590.
Comisión Ciudadana Técnico Parlamentaria para la Política y la Matriz Eléctrica CCTP. (2011). Chile necesita una gran reforma energética. (First Edition). Retrieved from http://www.patagoniasinrepresas.cl/final/dinamicos/chile_necesita_una%20gran_reforma_energetica.pdf
Dili, A., Naseer, M., & Varghese, T. (2010). Thermal comfort study of Kerala traditional residential buildings based on questionnaire survey among occupants of traditional and modern buildings. Energy and Buildings, 42(11), 2139–2150.
Figueroa, R., Bobadilla, A., Besser, D., Diaz, M., Arriagada, R., & Espinoza, R. (2013). Air infiltration in Chilean housing: A baseline determination. Sustainable Architecture for a Renewable Future (Proceedings of the 29th PLEA Conference), Munich, 2013, pp. 10-12.
Galvin, R., & Sunikka-Blank, M. (2013). Economic viability in thermal retrofit policies: Learning from ten years of experience in Germany. Energy Policy, 54, 343-351.
Göçer, Ö., Hua, Y., & Göçer, K. (2015). Completing the missing link in building design process: Enhancing post-occupancy evaluation method for effective feedback for building performance. Building and Environment, 89, 14-27.
Ilesanmi, A. O. (2010). Post-occupancy evaluation and residents’ satisfaction with public housing in Lagos, Nigeria. Journal of Building Appraisal, 6(2), 153-169.
Inzunza, J. (2005). Clasificación de los climas de Köppen. Ciencia Ahora, 15(8), 131-156.
Jones, R. V., Goodhew, S., & de Wilde, P. (2016). Measured indoor temperatures, thermal comfort and overheating risk: Post-occupancy evaluation of low energy houses in the UK. Energy Procedia, 88, 714-720.
Kolaitis, D. I., Malliotakis, E., Kontogeorgos, D. A., Mandilaras, I., Katsourinis, D. I., & Founti, M. A. (2013). Comparative assessment of internal and external thermal insulation systems for energy efficient retrofitting of residential buildings. Energy and Buildings, 64, 123-131.
Ma, Z., Cooper, P., Daly, D., & Ledo, L. (2012). Existing building retrofits: Methodology and state-of-the-art. Energy and Buildings, 55, 889-902.
Ministry of Energy. (2016). Anuario Estadístico de Energía 2016. (First Edition). Retrieved from http://www.energia.gob.cl/sites/default/files/anuariocne2016final3.pdf
NCh 853-2007. Norma Chilena 853-2007. Acondicionamiento térmico – Envolvente térmica de edificios – Cálculo de resistencias y transmitancias térmicas. Santiago, Chile, 28th May 2007.
Nooraei, M., Littlewood, J. R., & Evans, N. I. (2013). Feedback from occupants in ‘as designed’low-carbon apartments, a case study in Swansea, UK. Energy Procedia, 42, 446-455.
Olofsson, T., Andersson, S. & Sjögren, J. (2009). Building energy parameter investigations based on multivariate analysis. Energy and Buildings, 41(1), 71–80.
Oropeza-Perez, I., Østergaard, P., & Remmen, A. (2012). Model of natural ventilation by using a coupled thermal-airflow simulation program. Energy and Buildings, 49(0), 388–393.

516
Perez, A., Flores, V., & Calama J. (2015). Comparison of Energy-Saving Restoration Costs Based on Spain’s Initial Constraints [Single-Family Zone B4]. Revista de la Construcción, 14(2), 44-50.
Polly, B., Gestwick, M., Bianchi, M., Anderson, R., Horowitz, S., Christensen, C. & Judkoff, R. (2011). A Method for Determining Optimal Residential Energy Efficiency Retrofit Packages. U.S. Department of Energy, 79p.
Pisello, A. L., & Asdrubali, F. (2014). Human-based energy retrofits in residential buildings: A cost-effective alternative to traditional physical strategies. Applied Energy, 133, 224-235.
Serrano, B., & Sanchis, A. (2015). La Inspección Técnica de Edificios como herramienta de la mejora energética de la edificación existente. Informes de la Construcción, 67(EXTRA-1), 1-9.
Spekkink, D. (2005). Performance based design of buildings. Final Domain Report. Retrieved from http://www.irbnet.de/daten/iconda/CIB22208.pdf
Tookaloo, A., & Smith, R. (2015). Post Occupancy Evaluation in Higher Education. Procedia Engineering, 118, 515-521.
Vale, B., & Vale, R. (2010). Domestic energy use, lifestyles and POE: past lessons for current problems. Building Research and Information, 38(5), 578-588.
Vásquez-Hernández, A., & Restrepo, M. (2017). Evaluation of buildings in real conditions of use: Current situation. Journal of Building Engineering, 12, 26-36.
Woo, J. (2016). A post-occupancy evaluation of a modular multi-residential development in Melbourne, Australia. Procedia Engineering, 180, 365-372.
Wright, A. (2008). What is the relationship between built form and energy use in dwellings? Energy Policy, 36(12), 4544-4547.
Zhao, J., Wu, Y., & Zhu, N. (2009). Check and evaluation system on heat metering and energy efficiency retrofit of existing residential buildings in northern heating areas of china based on multi-index comprehensive evaluation method. Energy Policy, 37(6), 2124–2130.