Integrating Visio Drawings - dbmanagement.info
82
Integrating Visio Drawings IN THIS PART Chapter 8 Inserting, Linking, and Embedding Objects Chapter 9 Importing, Exporting, and Publishing to the Web Chapter 10 Linking Shapes with Data
-
Upload
khangminh22 -
Category
Documents
-
view
2 -
download
0
Transcript of Integrating Visio Drawings - dbmanagement.info

Integrating VisioDrawings
IN THIS PARTChapter 8Inserting, Linking, and EmbeddingObjects
Chapter 9Importing, Exporting, andPublishing to the Web
Chapter 10Linking Shapes with Data
12_109960 pt02.qxp 2/20/07 11:08 AM Page 155

12_109960 pt02.qxp 2/20/07 11:08 AM Page 156

Microsoft Visio diagrams typically don’t exist in a vacuum, becausethe very point of Visio is to communicate information in a visualway to others out there. Sometimes, Visio drawings stand alone,
but most of the time, they become a part of larger communications, inreports or presentations, for example.
To facilitate this kind of information sharing, you can create hyperlinks toVisio drawings from Word documents, Excel workbooks, PowerPoint pre-sentations, and other programs. Click the hyperlink, just as you do in a website, and Visio and the drawing are launched. Taking this concept of linkinga step further, you can insert Visio drawings as links in other applicationfiles, ensuring that any edits to the Visio drawings automatically appear inthe linked documents. A third method is to insert, or embed, separate copiesof Visio drawings in other application files, where you can view the drawingsand use Visio tools to edit them at will. And finally, you can always save Visiodrawings in another file format, such as JPEG graphic files, to share thedrawings while preventing any editing by others.
These methods work in the other direction as well. Hyperlinks can take youfrom Visio to documents in other applications. You can link or embed textfrom Word documents, tables from Excel workbooks, or the contents ofother application files into Visio drawings and make changes to those docu-ments without ever leaving Visio. Graphics such as clip art and digital photo-graphs are common elements for embedding in Visio drawings.
In this chapter, you’ll learn how to create hyperlinks to and from Visio draw-ings as well as how to link and embed information from one application intoanother. This chapter also explains the finer points of embedding graphicsfiles in Visio and provides tips for adding Visio drawings to PowerPoint pre-sentations to the best effect.
157
IN THIS CHAPTERUsing hyperlinks to navigate
Understanding linking andembedding
Using OLE links
Embedding objects
Inserting graphics in Visio
Fine-tuning Visio drawings forPowerPoint
Inserting, Linking, andEmbedding Objects
13_109960 ch08.qxp 2/20/07 11:08 AM Page 157

Another way to exchange information between applications is to export data from oneprogram and import it into another. To learn about importing and exporting with Visio,
see Chapter 9.
Navigating Drawings and Documents withHyperlinksHyperlinks are the ultimate in easy and convenient navigation. Regardless which application holdsa hyperlink, you can tell the link is there with visual clues like underlined text, an icon, or a differ-ent mouse pointer. When you click the hyperlink, the application to which the hyperlink pointslaunches in a separate window, and the file or web page opens. For example, in a Visio drawing,hyperlinks associated with process shapes could open the Word documents containing detailedbusiness process descriptions. On multipage Visio drawings, hyperlinks can move you from onepage to another. Of course, hyperlinks in other applications can jump to Visio drawings as well.
To enable hyperlink navigation, you have to define the destinations to which the hyperlinks jump.Although hyperlinks can belong to a drawing page, in Visio, they’re more commonly associatedwith shapes, especially Hyperlink buttons or circles. This section describes how to add hyperlinksthat navigate to other pages in Visio files, to other application files, and from other application filesto Visio drawings.
Creating hyperlinks in other applications, such as Microsoft Excel, to Visio drawingsworks similarly to the reverse process. You choose the words, worksheet cell,
PowerPoint bullet point, or other element, and use the technique for creating hyperlinks in that appli-cation to point to a Visio drawing file.
NOTENOTE
CROSS-REFCROSS-REF
158
Integrating Visio DrawingsPart II
Hyperlinks at Work
The behavior of hyperlinks on a Visio drawing depends on how you view your drawing:
n Full-screen mode — If you choose View ➪ Full Screen or use a Visio drawing as a webpage, when the mouse pointer is over a shape containing a hyperlink, the pointer changesto the pointing hand icon. To follow the hyperlink, click the shape.
n Normal mode — If you are not in full-screen mode, when the mouse pointer is over ashape containing a hyperlink, the pointer changes to an arrow with the hyperlink globeicon. To follow the hyperlink, right-click the shape and then, from the shortcut menu,choose the link.
When you follow the hyperlink, the web page or file appears in its own window. If the hyperlinkjumps to another Visio page, that page replaces the current page.
13_109960 ch08.qxp 2/20/07 11:08 AM Page 158

Inserting HyperlinksThe first step to inserting a hyperlink in a Visio drawing is deciding where to place the hyperlink.You have three options:
n Associate the hyperlink with a Visio Hyperlink shape — Visio offers specially designedHyperlink shapes, which give readers visual cues that hyperlinks exist, as demonstratedin Figure 8-1. To add a Visio Hyperlink shape, open the Borders and Titles stencil, dragone of the hyperlink shapes to the drawing page, and insert hyperlinks into those shapes.With Hyperlink shapes on a drawing, anyone viewing the drawing knows that clickingthe shape will navigate somewhere else.
FIGURE 8-1
Hyperlink shapes provide visual cues that hyperlinks exist, but hovering the mouse overany shape with a hyperlink displays the Hyperlink icon.
n Associate the hyperlink with a diagram shape — This method isn’t as obvious as usingHyperlink shapes, because you must move the mouse over a shape before the pointerchanges to one of the hyperlink indicators, identifying the shape as hot. When you click ahot shape, the linked application and file or Web page launches in a separate window.This approach works well when you want to navigate from the last step on one page tothe continuation on another.
Hyperlink shape
Hyperlink icon indicating shape is “hot”
159
Inserting, Linking, and Embedding Objects 8
13_109960 ch08.qxp 2/20/07 11:08 AM Page 159

n Associate the hyperlink with a drawing — You can make the entire page hot, for exam-ple, to navigate from a project calendar in Visio to the Microsoft Project schedule that thecalendar summarizes. For hot drawings, the mouse pointer changes to the hyperlink iconwhenever you move the mouse over a blank part of the page.
Visio Hyperlink shapes use icons to communicate their meaning. For example, you canindicate a web site home page with an icon of a house, as shown in Figure 8-1.
However, you can change the icon on a hyperlink shape to any of the 12 icons Visio offers, such asBack, Forward, and Help. To change the icon for a specific Hyperlink shape, right-click the shape and,from the shortcut menu, choose Change Icon and then, in the Icon Type drop-down list, choose theicon you want.
To insert a hyperlink in a Visio drawing, follow these steps:
1. Click the shape or page in which you want to insert the hyperlink.
2. Choose Insert ➪ Hyperlinks.
3. In the Address box, enter the address for the hyperlink using one of the following methods:
n Linking to a web page — Type the full address starting with the protocol — for exam-ple, http://. You can also click the Browse button and then click Internet Address tolaunch your web browser. Navigate to the web page to which you want your Visiohyperlink to point. In the Hyperlinks dialog box in Visio, the Address box should dis-play the full web address of the page in your browser. If not, copy the address fromthe web browser and paste it into the dialog box.
n Linking to a file on your system — Enter the full file path. You can also click theBrowse button and then click Local File. Navigate to the location of the file to whichyou want your Visio hyperlink to point. Select the file and then click the Open button.
If you’re entering a web address, remember to use front slashes (/) where necessary. Ifyou’re entering a file path, remember to use back slashes (\) to separate the folder names.
4. To display text when the pointer pauses over the hyperlink, in the Description text box,enter the text.
5. Click OK.
By default, hyperlinks use a relative path — that is, the path relative to the location ofthe Visio drawing itself. If you prefer to use the absolute path to specify file location, in
the Hyperlinks dialog box, clear the Use Relative Path For Hyperlink check box. Because Visio usesrelative paths when creating hyperlinks, this check box is dimmed until you save the Visio file andthus define its path.
A single element can contain multiple hyperlinks — for example, to provide links to each detaildrawing page for a high-level process. In the Hyperlinks dialog box, click New, enter a new hyper-link address as usual, and then click OK. When you right-click the hyperlinked shape or page, ashortcut menu of hyperlinks appears and you can choose the hyperlink you want. Multiple hyper-links work whether you work in Normal mode or Full Screen mode.
TIPTIP
NOTENOTE
TIPTIP
160
Integrating Visio DrawingsPart II
13_109960 ch08.qxp 2/20/07 11:08 AM Page 160

When you use Internet Explorer 5.0 or later and right-click a shape with multiple hyper-links, the shortcut menu shows all the associated hyperlinks. For browsers or output for-
mats such as SVG that don’t support multiple hyperlinks, right-clicking a shape displays only thedefault hyperlink or, if there is no default hyperlink, the first hyperlink in the list.
Using Hyperlinks to Navigate Between DrawingPagesSuppose your Visio drawing starts with an overview process, which spills over onto other pagesthat contain the details of the entire process. You can create hyperlinks from the overview page todrill down to see the details on the other pages. Page-to-page hyperlinks work just as well to movefrom one page to the next in a sequence of drawing pages, for example, to follow a flowchart fromits first step to the last.
To create hyperlinks that navigate between multiple pages in a Visio drawing, follow these steps:
1. Click the shape in which you want to insert the hyperlink.
n On an overview drawing, click the shape that represents the overview of the detaildrawings to come.
n For the first page of a sequence of pages, add a navigation shape, such as a Hyperlinkshape, to indicate navigation to another page.
2. Choose Insert ➪ Hyperlinks.
3. Next to the Sub-address box, click the Browse button to open the Hyperlink dialog box.
4. In the Page drop-down list, select the Visio drawing page you want, as shown in Figure 8-2.
FIGURE 8-2
When you select the page for the hyperlink, its reference appears in the Sub-addressbox.
NOTENOTE
161
Inserting, Linking, and Embedding Objects 8
13_109960 ch08.qxp 2/20/07 11:08 AM Page 161

5. To focus on a specific shape on the destination page, in the Shape box, type the name ofthe shape. When you follow the hyperlink, Visio centers this shape in the drawing win-dow. This comes in handy, for example, when a drawing page contains the details for twohigher-level processes, the hyperlink can navigate to the beginning shape of one of theprocesses.
To find the name of a shape, you must turn on Developer mode. To do this, choose Tools ➪ Options and select the Advanced tab. Select the Run In Developer Mode check
box and click OK. On the drawing page, right-click the shape and, from the shortcut menu, chooseFormat ➪ Special. The shape name appears in the Name box — for example, Circle, Sheet.1, orManager.18.
6. To change the default size of the destination page, in the Zoom drop-down list, select thepercentage you want.
7. Click OK to return to the Hyperlinks dialog box.
8. To display text when the mouse pointer pauses over the hyperlink, enter the text in theDescription text box.
9. Click OK.
Modifying HyperlinksIf your Visio drawing has been around for a while, it’s a good idea to periodically verify that yourhyperlinks still work. This is especially important if hyperlinks point to web pages or files that youdon’t control. A company revamps its web pages or a colleague moves the files to which yourhyperlinks point and, voilà, your hyperlinks no longer work. When you find broken hyperlinks,you can edit them to hook them back up. To modify a hyperlink, follow these steps:
1. Select the shape or page with which the hyperlink is associated and choose Insert ➪
Hyperlinks.
2. If there are multiple hyperlinks for the selected shape, in the Hyperlinks dialog box, inthe list at the bottom, select the name of the hyperlink you want to change.
3. In the Address text box, edit the web address or path name. You can also click the Browsebutton and navigate to the web page or file to automatically update the address.
4. Make any other changes you want to the hyperlink and then click OK.
NOTENOTE
162
Integrating Visio DrawingsPart II
13_109960 ch08.qxp 2/20/07 11:08 AM Page 162

Understanding Linking and EmbeddingThe term linking often brings to mind hyperlinks between web pages, and rightly so, becausehyperlinks in Microsoft Office applications navigate between files or to other locations within thesame file. For example, you could add a hyperlink to a status report in Word that displays the Visiodiagram of the current workflow for a business process. Hyperlinks also move within documents,so you can use hyperlinks to jump from the main page in a Visio drawing to the page that containsfurther detail.
Another type of linking that you’re likely to employ is Object Linking and Embedding technology,or OLE. Applications that use OLE technology, including the Microsoft Office applications, caneasily swap elements with other OLE applications — from entire files to individual items withinthose files. For example, you can include an entire Excel worksheet in a Visio drawing or only afew cells.
Swapping objects between applications comes in two flavors: linking or embedding. With linking, theobject appears in the target, or container, application, but the object actually exists in another file onthe computer. Linking makes updating objects easy, because the linked objects change whenever theoriginal object changes in the container application. When you double-click linked objects, thesource application’s menus and tools open within the container application so you can make changesto the source file right there. Consider a PowerPoint slide that displays a linked Visio diagram.Suppose you notice a small error as you practice your PowerPoint presentation. You double-click theVisio object and Visio windows, menus, and tools appear, and your diagram from its separate Visiodrawing file opens as well. After you make the changes to the diagram and save it, those changes aremade to the separate Visio drawing file and become visible in any document that links to it.
When an object is embedded, rather than linked, the container application gains a separate copy ofthe object. The source file still exists, but the object in the container application is totally separateand independent. You can access the source application’s menus and tools within the containerapplication and make changes there, but the changes update only the copy of the object in thecontainer application and do not affect the source file.
Whether you’re linking or embedding, double-clicking the object in the container applicationopens the source application’s menus and tools so you can make changes on the spot. Moreover,you can create new objects from scratch in a container application to link or embed.
Linking and embedding both have advantages and disadvantages, so the best technique dependson what you want to do. The bottom line is that linking is preferable when the source file tends tochange frequently and you don’t want to make changes in two places. Embedding works better ifyou want to distribute the container file to others without also providing linked source files. Table8-1 lays out the pros and cons of linking and embedding so you can choose the best technique.
163
Inserting, Linking, and Embedding Objects 8
13_109960 ch08.qxp 2/20/07 11:08 AM Page 163

TABLE 8-1
Linking versus Embedding
Factor With Linking With Embedding
Ease of updating Linking makes updating easier, Changes to the source file do not affect because changes to a linked the embedded object in the container object update to both the source file and vice versa. If you make changes and container application, in one place, you must repeat those regardless of where you do changes in the other file.your editing.
File management There’s only one copy of the object You must manage two separate and to track. However, if you move the independent versions of the object. On source file, the link breaks and you the other hand, embedding makes the must recreate it. object portable because the embedded
object doesn’t rely on the source file.
Linking individual elements You can’t create a link to an You can embed individual elements individual element within a file. within a file.You must link to the entire file.
File size Linking produces smaller files The container file size can grow quite because the object isn’t actually large, because it actually stores the within the container file. content of the object itself, not just the
link to the source.
Slow file launch Large or complex files containing Embedded objects can lead to slow file several links can take a while to launch as well because the embedded open, especially across a large files take time to load and draw network. This occurs because OLE completely. checks the source files for changes and updates the linked objects, either manually or automatically.
Visio can also link shapes to data stored in databases or other data sources. To learnabout linking shape data to a database, see Chapter 10.
Linking Visio Drawings with Other FilesInsert an OLE link when you want to show information from a file, but you don’t want that fileincorporated into the target document in its entirety. For example, suppose a Visio diagram illus-trates the business problem discussed in a Microsoft Word document. You update the Visio
CROSS-REFCROSS-REF
164
Integrating Visio DrawingsPart II
13_109960 ch08.qxp 2/20/07 11:08 AM Page 164

drawing occasionally and you want to see those updates in the Word document. Creating an OLElink to the drawing from Word is the perfect solution.
This works just as well in the opposite direction. A Visio drawing might refer to a Microsoft Excelchart that is dynamically updated as data is entered. By linking that chart to your drawing, you caninclude the chart as an integral part of your Visio drawing and know that you’re always looking atthe latest version of the data.
The container application shows the link either as an application icon or a representation of thesource file. Either way, when you double-click an OLE link, the source application launches in aseparate window and opens the file.
Linking Visio Drawings to Other DocumentsTo link a Visio drawing to another Microsoft or other OLE application file, follow these steps:
1. Open both the container file and the source file that contains the content you want tolink to using OLE. For example, open a Word document as a container and a Visio draw-ing as the source of the diagram you want to link into your report.
2. In the Visio drawing file, display the page that you want to link.
3. Make sure that no shapes are selected and then choose Edit ➪ Copy Drawing. (If any-thing is selected, the Copy Drawing command does not appear on the Edit menu.) CopyDrawing grabs the entire drawing page including background pages.
4. Switch to the container file without closing Visio and position the insertion point whereyou want to insert the link.
5. To create a link in Word 2007, Excel 2007, or PowerPoint 2007, follow these steps:
On the Home tab, in the Clipboard group on the left side of the ribbon, click thearrow below Paste and then, from the drop-down menu, choose Paste Special.
The command you use to create links varies depending on the application.
In the Paste Special dialog box, in the As box, select Microsoft Visio Drawing Object.
Select the Paste Link option.
To show an icon rather than the drawing itself, in the container file, select the DisplayAs Icon check box.
Click OK. The drawing appears in the container application, as illustrated in Figure 8-3.
6. When you double-click the linked object, the source application launches in a separatewindow and opens the source file for editing.
NOTENOTE
165
Inserting, Linking, and Embedding Objects 8
13_109960 ch08.qxp 2/20/07 11:08 AM Page 165

FIGURE 8-3
The linked object retrieves information from the source Visio drawing.
Linking Other Documents to Visio DrawingsTo create a link from another document into a Visio drawing, follow these steps:
1. Open the Visio drawing container file and the source file, such as an Excel spreadsheet.
2. Choose Insert ➪ Object.
3. In the Insert Object dialog box, select the Create From File option.
4. Click Browse and in the Browse dialog box, select the file you want to link into the Visiodrawing and then click Open.
5. In the Insert Object dialog box, select the Link To File check box.
6. Optionally, if you want to show an icon rather than the content, select the Display AsIcon check box.
166
Integrating Visio DrawingsPart II
13_109960 ch08.qxp 2/20/07 11:08 AM Page 166

7. Click OK. The object appears as a shape on the Visio drawing, including selection han-dles that you can drag to resize.
8. When you double-click the linked object, the source application launches in a separatewindow and opens the source file for editing.
Moving and Resizing Linked Objects in VisioLinked objects respond to editing methods like other elements in your container application. Forexample, in Visio, you can use any of the following methods with a linked object:
n Select a linked object — Click the object. A selection box similar to the selection box fora Visio shape appears around the object.
n Resize the object proportionally — Drag one of the selection handles, shown in Figure 8-3, to change the size of the linked object.
n Stretch or condense the object along one side — Drag one of the selection handles atthe midpoint of a side.
n Move the object — Drag the middle of the object to the position you want. Take care todrag from the center of the object, and not along any of its edges.
Editing the Content of Linked ObjectsWith a linked object, you can edit its content from the most convenient place. Either way, you’reworking with the same file. If you have the object’s source application open, open the source fileand make the changes. When you save the file, the changes appear in the container application.
Alternatively, if you spot needed changes while looking at the file in the container application, double-click the object. The source application menus and commands appear so you can edit thelinked object, as shown in Figure 8-4. Make whatever changes you want and then save and closethe file. The source application menus disappear and you see the changes reflected in the object inthe container application. If someone changes the source file while you’re working with the linkedobject, you’ll see the changes the next time you open the container file.
To edit the content of a linked object, you must have read-write privileges.
If you receive an error when you try to edit a linked Visio drawing, the most frequent culprit is abroken link. Make sure the Visio drawing file is located where it’s supposed to be — or recreate thelink. If the link is correct, make sure that the file isn’t open in another application. You can’t editthe file in two places at once. And of course, to edit a Visio drawing even within another applica-tion, you must have Visio installed on your computer.
NOTENOTE
167
Inserting, Linking, and Embedding Objects 8
13_109960 ch08.qxp 2/20/07 11:08 AM Page 167

FIGURE 8-4
Double-click a linked object to access its source application’s menus and commands for editing.
Managing Linked ObjectsWhen you have linked objects, you sign up for managing those links — whether it’s making surethat the links don’t break to specifying whether you want the links to update automatically or onlywhen you say so. Managing links includes the following actions:
n Review details for all linked objects in the file.
n Review the path name for a linked source file and change the path if the file has moved. Ifyou link to a file that is subsequently moved or deleted, the link breaks. The next timeyou open the container file, instead of a picture of the linked content, an error messageappears, such as “Error! Not a valid link.”
n Specify whether you want updates from the source to be automatic or manual (they’reautomatic by default).
n Break the link between the object and source, transforming the linked object into anembedded object or a static picture.
Still in Visio
Source (Excel) menus
Embedded object
168
Integrating Visio DrawingsPart II
13_109960 ch08.qxp 2/20/07 11:08 AM Page 168

To manage links, follow these steps:
1. Choose Edit ➪ Links to open the Links dialog box.
2. To change the path for a broken link, click the link whose path you need to edit. ClickChange Source and browse to the new location of the source file. Select the file name andclick Open to recreate the link.
3. To change an automatic link update to manual update, for example, to improve perform-ance while you are performing heavy editing on the drawing, select the link and thenselect the Manual option, and click Close.
4. To update the manual links in your container file, open the Links dialog box again, selecta manual link, and then click Update Now.
5. When you’re finished making changes in the Links dialog box, click the Close or OK button.
If you decide you no longer need a linked object at all, you can remove it from the con-tainer document by selecting the object and then pressing Delete.
Embedding ObjectsEmbedding an object from another application inserts an independent copy of the source file intothe container application file. For example, if you embed a worksheet from an Excel workbookinto a Visio drawing, a copy of the Excel worksheet becomes an integral part of the Visio drawing.Editing that copy while working in Visio has no effect on the original worksheet. Conversely,embedding a Visio drawing as an object in another application, such as Word, creates a copy of theVisio drawing in the Word document. As with linked objects, when you double-click the embed-ded object in the container application, the menus and tools for the source application appear, soyou can make changes on the spot.
TIPTIP
169
Inserting, Linking, and Embedding Objects 8
Change Links to Embedded Objects or Pictures
Suppose you linked to a file that was getting a major overhaul so that you would see the most up-to-date version. Now the file is static and you would prefer to store the copy completely within
the container document so you can send the document to others without worrying about maintain-ing the link. You can break the link while keeping the object in the container, essentially convertinga linked object to an embedded object. To do this, follow these steps:
1. In the container file, choose Edit ➪ Links, and then select the link in the Links dialog box.
2. Click Break Link, and then, in the confirmation message box that appears, click Yes. Thelink information disappears from the Links dialog box.
3. Click Close. The object is still exactly where it was in your container document and looksjust the same. Yet, it no longer is linked to the source and has become an independentcopy existing within the container document — that is, it’s now an embedded file or astatic picture.
13_109960 ch08.qxp 2/20/07 11:08 AM Page 169

Embedding has some advantages over linking:
n You don’t have to worry about the location of the source file, because the copy of the fileexists inside the container file.
The disadvantage to stuffing the copy into the container file is that the container filegets bigger. If you embed several objects into a file, the file size could easily grow to
several megabytes.
n You can embed an entire source file or just a piece of it. For example, you can embed anentire Excel workbook within a Visio drawing, or just a single chart from that workbook.Likewise, you can embed all pages of a Visio drawing in a PowerPoint presentation, a sin-gle page, or even a single shape in another application.
n The embedded object displays completely and correctly in the container file even if thesource application is not installed on the computer you use to view the file. This isincredibly important when you plan to distribute the container file to others, who mightnot have Visio on their computers.
Embedding Entire Files into VisioEmbedding another document into a Visio drawing is almost exactly like linking a document to aVisio drawing. The main difference is that you don’t select the Link to File check box. To embed anentire document into a Visio file, follow these steps:
1. Open the Visio drawing into which you want to embed another file.
2. Choose Insert ➪ Object.
3. In the Insert Object dialog box, select the Create From File option.
4. Click Browse and in the Browse dialog box, select the file you want to link into the Visiodrawing and then click Open.
5. In the Insert Object dialog box, make sure that the Link To File check box is not selected.
6. Optionally, if you want to show an icon rather than the content, select the Display AsIcon check box.
7. Click OK. The object appears as a shape on the Visio drawing, including selection han-dles that you can drag to resize.
8. When you double-click the embedded object, the menus and tools for the source applica-tion appear so you can edit the source file.
Embedding Portions of FilesYou might want only a single page or portion of a Visio drawing in a Word report. Similarly, youmight need just a table from Word or a single PowerPoint slide in your Visio drawing, rather thanthe entire file. You can select and copy the portion of a file you want and embed only that much in
TIPTIP
170
Integrating Visio DrawingsPart II
13_109960 ch08.qxp 2/20/07 11:08 AM Page 170

the container file. Along with including only the necessary information, this can also help keep thesize of the container file from ballooning larger than it needs to be.
To embed a part of a file in another application, follow these steps:
1. In the source application, open the file and go to the page that contains the portion youwant to embed in the other application.
2. Using the application’s tools, select the portion you want to embed. For example, if you’reworking in Visio, activate the Pointer tool if necessary, and then drag across the shapesyou want to embed. The selection area must fully enclose all elements you want toembed. If you’re working in Word, Excel, or another application, drag over the text, cells,or other elements.
If you’re working with a multipage Visio drawing and you want to select the contents ofa single page to embed in another application, display that page and make sure no
shape is selected. Choose Edit ➪ Copy Drawing to copy the entire page into memory so that you canpaste it into the other application.
3. Press Ctrl+C to copy the selection to the Windows clipboard.
4. Switch to the container application, open the file, and go to the page or worksheet inwhich you want to embed the object you just copied. If necessary, click the locationwhere you want to embed the object.
5. Choose Edit ➪ Paste Special.
6. In the Paste Special dialog box, in the As box, select the type of object you copied, suchas Microsoft Visio Drawing Object or Microsoft Excel Worksheet.
7. Click OK. The copied object appears in the container file.
If you need only a single Visio shape in the other application, you can copy and paste it. In Visio,show the shape you want in the Shapes window. Right-click the shape and then choose Copy orsimply press Ctrl+C. In the container application, select the location you want and then use pasteto add the shape to the file. For example, in Word, click the Home tab, and in the Clipboard groupon the ribbon, click Paste. You can also arrange the Visio and container applications side by sideand then drag the shape from Visio to the other application.
Positioning and Formatting Embedded ObjectsAs soon as you insert an object into the container application, you can perform the followingactions:
n Move it to the location you want
n Resize it to the dimensions you need
n Crop one or more edges of the object
n Adjust the space surrounding the object
TIPTIP
171
Inserting, Linking, and Embedding Objects 8
13_109960 ch08.qxp 2/20/07 11:08 AM Page 171

Moving and Resizing ObjectsTo move an embedded object, drag the middle of the object to the position you want. Take care todrag from the center of the object, not along any of its edges.
To resize an object proportionally, drag one of the selection handles in any of the four corners. Tostretch or condense the object along one side, drag one of the selection handles at the midpoint ofan edge.
Cropping ObjectsIf you need to trim extraneous space from the edges of an object, crop the object. To crop a Visioobject in another application, follow these steps:
1. In the other application, click the Visio object and then choose Format ➪ Object. TheFormat Object dialog box appears. Make sure the Picture tab is showing.
2. Under Crop From, enter the amount you want to crop from the Left, Right, Top, orBottom.
3. When you’re finished, click OK. Because you can’t tell what the crop dimensions do untilyou see the results, you might have to repeat these steps a few times to crop the Visiodrawing the way you want.
172
Integrating Visio DrawingsPart II
Creating an Embedded Object from Scratch
If you want to create a file whose only purpose is to augment information in your Visio drawing,you can create a brand-new file from within Visio. For example, suppose you want to create a bul-
leted list for a Visio drawing and would rather format the list using Word.
To create a new embedded object file, follow these steps:
1. In Visio, choose Insert ➪ Object and then select the Create New option.
2. Under Object Type, select the application with which you want to create the new embed-ded file.
3. Click OK. A blank file is inserted in your container file, and you can start creating the newembedded file using its application’s tools.
4. To return to Visio, simply click anywhere on the Visio drawing.
13_109960 ch08.qxp 2/20/07 11:08 AM Page 172

To crop an object in Visio, follow these steps:
1. If it’s not already showing, display the Picture toolbar by choosing View ➪ Toolbars ➪
Picture.
2. Select the object you want to crop.
3. On the Picture toolbar, click the Crop button.
4. Drag a selection handle in the object in the direction you want to crop the object.
Adjusting the Space Surrounding ObjectsTo adjust the space surrounding a Visio object in another application, follow these steps:
1. In the other application, double-click the Visio object to open the in-place editing window.
2. Drag one of the selection handles to change the shape surrounding the object.
3. Click outside the in-place editing window. The editing window closes, and the containerfile reflects the new space surrounding the object.
To adjust the space surrounding an object in Visio, follow these steps:
1. If not already showing, display the Picture toolbar by choosing View ➪ Toolbars ➪
Picture.
2. Select the object.
3. On the Picture toolbar, click the Crop button.
4. Drag a selection handle outward from the object in the direction in which you want toadd space around the object.
Editing the Content of Embedded ObjectsWith embedded objects, you can edit their content without leaving the comfort of the containerapplication. In effect, you can work with the tools of two applications in one.
To edit an embedded object, simply double-click it. This opens in-place editing window and themenu and toolbars change from those of the container application to those of the embeddedobject’s application, as shown in Figure 8-5. Use whatever commands you need on those menusexactly as if you were working with the source application. When you’re finished editing, click out-side the in-place editing window. The editing window closes and the embedded object reflectsyour edits.
173
Inserting, Linking, and Embedding Objects 8
13_109960 ch08.qxp 2/20/07 11:08 AM Page 173

FIGURE 8-5
Use the source application menus to edit the embedded object. Adjust the space around the object bydragging the selection handles in the in-place editing window.
If you prefer, you can open an object in a separate window. For example, in PowerPoint, right-clickthe object and, from the shortcut menu, choose Visio Object ➪ Open. The object and its sourceapplication open in a separate window where you can make the changes you want. When you’refinished, choose File ➪ Update to update your changes to the container application. Close theVisio window to return to the container application. You can now see the object with your edits.
Perking Up Visio with PicturesInserting graphics such as clip art, photographs, or other types of images is a specialized form ofembedding. Any kind of graphics file will do, including graphics from a digital camera or scanner.The Clip Art Task Pane helps you search a variety of sources for just the right piece of clip art.Because embedding graphic files is a frequent part of building diagrams, Visio includes tools tomake the process easy and versatile.
The menus switch to those of Visio, the source application.
In this example, PowerPoint is the container.
Double-clicking an embedded object opens the in-place editing window.
Drag selection handles to adjust space around the object.
174
Integrating Visio DrawingsPart II
13_109960 ch08.qxp 2/20/07 11:08 AM Page 174

Inserting Graphics Files into DrawingsInserting graphics files on your hard drive or network drive into a Visio drawing couldn’t be easier.Just follow these steps:
1. In the Visio drawing, display the page in which you want to insert the graphic.
2. Choose Insert ➪ Picture ➪ From File. The Insert Picture dialog box appears.
3. Browse to the location of the graphic, select the file, and then click Open. The graphicappears on the page.
In the Insert Picture dialog box, the Files Of Type box is set to All Pictures, which meansthat you’ll see any kind of graphics file, including JPEG, Tag Image File Format (TIFF),
windows bitmaps, and more. If you want to look for a specific type of file, in the Files Of Type drop-down list, select the type.
4. Now, you can use standard Visio tools to resize, move, and crop the graphic as needed.
Searching for and Inserting Clip ArtYou can’t complain about the quantity of clip art available in Microsoft Office applications. Even ifyou end up looking elsewhere for the perfect picture, Visio and other Microsoft Office applicationscan search a number of places for images. To embed a piece of clip art in Visio, follow these steps:
1. In your Visio drawing, select the page in which you want to insert the graphic.
2. Choose Insert ➪ Picture ➪ Clip Art. The Clip Art Task Pane appears. Alternatively, if theTask Pane is already visible, click the Task Pane down arrow and then choose Clip Art.
If you haven’t installed the clip art feature, you’ll see a prompt to do so. The CD is notrequired to install clip art.
3. In the Search For text box, type a key word or phrase that describes the type of imageyou want to add to your drawing. For example, if you want show clip art of engineers tomake an engineering flowchart look friendlier, you could search for “engineer.”
Searches execute faster if you use specific key words or phrases. However, you can usegeneral key words to obtain a wider selection of clip art.
4. In the Search In box, specify where you want Visio to search. You can select the checkbox for a particular folder on your hard drive, such as Office Collections. You can alsohave Visio search the Internet in a particular web collection. Be aware that the wider thesearch and the larger the collections, the longer the search might take.
5. In the Results Should Be box, select the type of media you want to find: Clip Art,Photographs, Movies, or Sounds. To further specify file formats you want, click the plussign under the media. This can help narrow your search, especially when searching webcollections.
6. When you’re finished defining your clip art search criteria, click Go. Results of yoursearch appear in the Clip Art Task Pane as thumbnails.
TIPTIP
NOTENOTE
NOTENOTE
175
Inserting, Linking, and Embedding Objects 8
13_109960 ch08.qxp 2/20/07 11:08 AM Page 175
7. When you find the clip art you want to use in your drawing, drag it into position in yourdrawing.
8. Use standard Visio techniques to resize the art if necessary.
In Visio 2007, the Insert ➪ Picture menu no longer contains the From Scanner orCamera entry. To insert a picture coming from a digital device such as a scanner or digi-
tal camera, copy the file from the device onto your computer and then insert the graphic file asdescribed in the section, “Inserting Graphics Files into Drawings.”
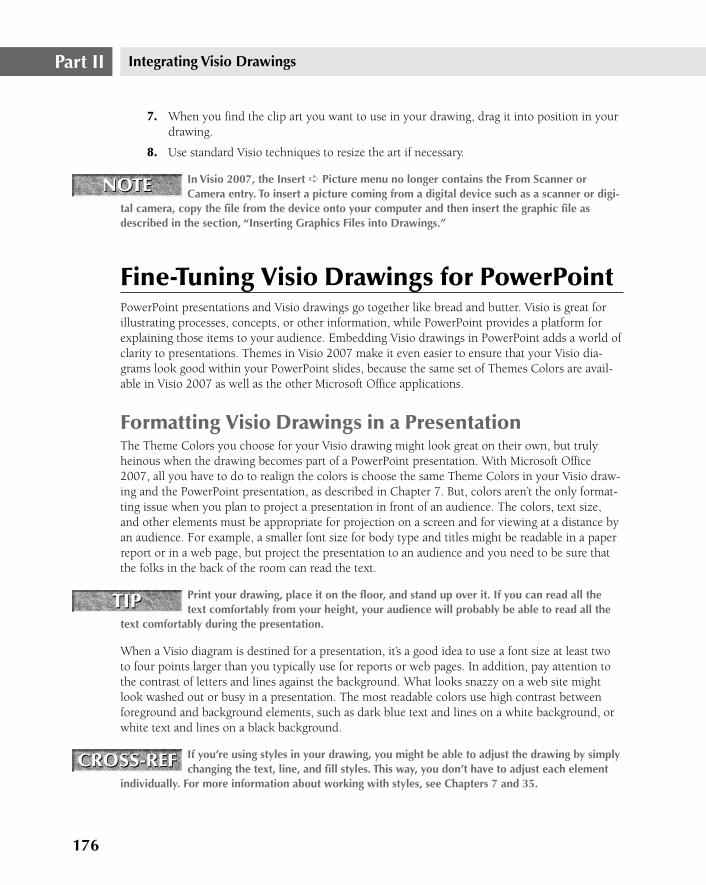
Fine-Tuning Visio Drawings for PowerPointPowerPoint presentations and Visio drawings go together like bread and butter. Visio is great forillustrating processes, concepts, or other information, while PowerPoint provides a platform forexplaining those items to your audience. Embedding Visio drawings in PowerPoint adds a world ofclarity to presentations. Themes in Visio 2007 make it even easier to ensure that your Visio dia-grams look good within your PowerPoint slides, because the same set of Themes Colors are avail-able in Visio 2007 as well as the other Microsoft Office applications.
Formatting Visio Drawings in a PresentationThe Theme Colors you choose for your Visio drawing might look great on their own, but trulyheinous when the drawing becomes part of a PowerPoint presentation. With Microsoft Office2007, all you have to do to realign the colors is choose the same Theme Colors in your Visio draw-ing and the PowerPoint presentation, as described in Chapter 7. But, colors aren’t the only format-ting issue when you plan to project a presentation in front of an audience. The colors, text size,and other elements must be appropriate for projection on a screen and for viewing at a distance byan audience. For example, a smaller font size for body type and titles might be readable in a paperreport or in a web page, but project the presentation to an audience and you need to be sure thatthe folks in the back of the room can read the text.
Print your drawing, place it on the floor, and stand up over it. If you can read all thetext comfortably from your height, your audience will probably be able to read all the
text comfortably during the presentation.
When a Visio diagram is destined for a presentation, it’s a good idea to use a font size at least twoto four points larger than you typically use for reports or web pages. In addition, pay attention tothe contrast of letters and lines against the background. What looks snazzy on a web site mightlook washed out or busy in a presentation. The most readable colors use high contrast betweenforeground and background elements, such as dark blue text and lines on a white background, orwhite text and lines on a black background.
If you’re using styles in your drawing, you might be able to adjust the drawing by simplychanging the text, line, and fill styles. This way, you don’t have to adjust each element
individually. For more information about working with styles, see Chapters 7 and 35.
CROSS-REFCROSS-REF
TIPTIP
NOTENOTE
176
Integrating Visio DrawingsPart II
13_109960 ch08.qxp 2/20/07 11:08 AM Page 176

Building Drawings in a PresentationIf you use PowerPoint to present information to audiences, you already know that displaying all thebullet points at once is a sure way to lose your audience’s attention until they’ve read the entire slide.PowerPoint includes features to feed pieces of slide in digestible portions, which work equally wellfor bullet points and parts of Visio diagrams. By displaying steps within a flowchart individually, youbreak the process down into manageable chunks and keep the audience focused on the current topic.
In PowerPoint, you can use animation to build a Visio diagram within a single slide or you canbuild a drawing incrementally across multiple slides. Either way, the elements of the drawingappear in sequence as you click the mouse.
Animating a Drawing on One PowerPoint SlideAnimation on a single slide means you can control how each element enters the slide. To buildmultiple elements in a drawing using animation on a single PowerPoint slide, follow these steps:
1. In Visio, select the part of the drawing that makes up the first element you want on thePowerPoint slide. Either drag across the shapes or Shift-click each shape.
Connectors might bend in wrong directions after you separate and paste them inPowerPoint. In Visio, choose View ➪ Toolbars ➪ Layout & Routing. Shift-click the con-
nectors in your drawing and then, on the Layout & Routing toolbar, click the Never Reroute tool.
2. Choose Edit ➪ Copy or press Ctrl+C.
3. Switch to PowerPoint and add or show the slide where you want to build the elementsfrom the Visio drawing.
The Blank or Title Only slide layouts are ideal for this purpose.
4. Choose Edit ➪ Paste or press Ctrl+V.
5. Repeat steps 1 through 4 for each succeeding element you want to build on the slide.After pasting the next element, drag the grouping into the position you want on the slide.
6. When all elements are showing in the PowerPoint slide, select the Animations tab.
7. Select the element you want to appear first in the slide show and then, in the ribbon,choose Custom Animation.
8. In the Custom Animation Task Pane, choose Add Effect ➪ Entrance, and then choose theentrance effect you want for the first element.
9. Under Modify, specify how you want the effect to behave. For example, you can specifywhat action triggers the effect, the direction, and the speed.
10. For each succeeding element in the order you want to introduce them in the animation,repeat steps 7 through 9. You can choose the same or different effects for each element.
11. When you’re finished, at the bottom of the Custom Animation Task Pane, click Play toshow the animation in the current window. You can also click Slide Show in the CustomAnimation pane to show your animation in the full Slide Show screen. When you’re fin-ished, click a final time or press Esc to return to the normal window.
TIPTIP
NOTENOTE
177
Inserting, Linking, and Embedding Objects 8
13_109960 ch08.qxp 2/20/07 11:08 AM Page 177

To remove an animation effect, right-click it in the Custom Animation Task Pane andthen choose Remove.
Building Sequences of PowerPoint SlidesIf you don’t care whether shapes come flying from all directions or bubble up onto the screen, it’seasier to build the elements of a drawing over several sequential PowerPoint slides. To build asequence of slides, follow these steps:
1. In PowerPoint, select the Insert tab and, in the ribbon, click Add Slide. Choose the slidelayout and PowerPoint inserts a new slide. The Blank, Title Only, or Title and Contentslide layouts are ideal for this purpose.
2. Repeat step 1 for each element you want to add until the Visio drawing is displayed in itsentirety in PowerPoint.
3. In Visio, select the part of the drawing that makes up the first element you want on thePowerPoint slide. Either drag across the shapes or click each shape while pressing Ctrl orShift, and then choose Edit ➪ Copy.
4. Switch to PowerPoint, show the first slide of the sequence you’re building, and thenchoose Edit ➪ Paste.
5. Switch back to Visio again, and, with the first element still selected, Shift-click the secondelement and choose Edit ➪ Copy.
6. To paste the elements for the second slide, switch to PowerPoint, show the second slideof the sequence, and choose Edit ➪ Paste.
7. Repeat steps 5 and 6 for each additional element you’re adding to the sequence.
Be sure to paste the element in the same location on each slide. Zooming into the slideand using the ruler can help position the element precisely so that the elements transi-
tion smoothly from one slide to the next.
8. When you’ve added all Visio drawing elements to their PowerPoint slides, choose SlideShow ➪ View Show and click through the slides to preview the construction of thesequence.
9. After the last slide, click or press Esc to return to the normal PowerPoint view. Make anynecessary adjustments to the drawing sequence.
To add a transition effect to the sequence of building your Visio drawing, follow these steps:
1. In PowerPoint, in the Slides pane, Shift-click to select all the slides in the drawingsequence for which you want the same transition effect.
If the Slides pane is not showing, choose View ➪ Normal (Restore Panes) and make surethe Slides tab is selected.
2. Select the Animations tab, and, in the ribbon, click Transition Scheme.
3. In the Transition Picker that appears, click the effect you want when the slides move fromone to the next.
NOTENOTE
TIPTIP
TIPTIP
178
Integrating Visio DrawingsPart II
13_109960 ch08.qxp 2/20/07 11:08 AM Page 178

4. In the ribbon, specify how you want the transition effect to behave. For example, you canspecify how fast the effect should occur and whether any sound effect should be associ-ated with the transition.
5. Under Advance Slide, specify the action that moves from one slide to the next.
6. In the ribbon, click Preview to show the transition effect for the current slide.
7. When you’re finished, you can view the slide show in its full glory by selecting the SlideShow tab and then, in the ribbon, choosing From Beginning.
SummaryYou can link information between Visio and other applications in a variety of ways. Hyperlinksbetween Visio drawings and files in other applications or between pages in a drawing file make iteasy to navigate to the information you need. You can create dynamic links between a Visio draw-ing and another document, so that edits instantaneously update both source and target. You canalso embed an independent copy of information from another application.
179
Inserting, Linking, and Embedding Objects 8
13_109960 ch08.qxp 2/20/07 11:08 AM Page 179

13_109960 ch08.qxp 2/20/07 11:08 AM Page 180

Visio drawings are akin to team players — they generally work in con-junction with documents in other applications or include informa-tion from other applications to convey the full story. For example,
Visio diagrams often find their way into reports written in Word, presenta-tions built in PowerPoint, or web sites. Conversely, Visio drawings areequally likely to include images such as CAD drawings, or files such as notesin Word or numerical analysis in Excel.
Depending on your goal and the capabilities of the other applications, youcan embed, link, import, or export information between Visio and otherOffice applications such as Excel, Word, and PowerPoint, as well as otherapplications such as databases or CAD programs. Visio drawings can reacheven broader audiences through publishing Visio drawings to the Web or byexporting them to Adobe PDF format or XPS (XML Paper Specification).
Linking and embedding documents (see Chapter 8) provides a great deal ofcontrol over document appearance and the changes you can make, butsometimes, linking and embedding isn’t enough. You can export Visio data,perhaps information from a prototype you built in Visio, to store it in Excelspreadsheets, AutoCAD drawings, or ODBC-compliant databases. Similarly,exporting is the solution when you want to incorporate Visio data in docu-ments that don’t use OLE or to include drawings in HTML files for publica-tion to the Web. Conversely, importing into Visio usually comes in the formof inserting images into Visio drawings, but you can also import Outlookappointments into Visio calendars. In this chapter, you learn how to accom-plish all these tasks.
If you want Visio shapes to display data from other sources,read Chapter 10 to learn about Visio data features.CROSS-REFCROSS-REF
181
IN THIS CHAPTERFile formats that Visio importsand exports
Importing files and images intoVisio
Importing Outlook appointmentsinto a Visio calendar
Exporting drawings and shapesto other formats
Saving Visio drawings to PDFand XPS format
Choosing the right output formatfor Visio web pages
Saving drawings as web pagefiles
Embedding Visio drawings intoweb pages
Making web page navigationeasier
Importing, Exporting, andPublishing to the Web
14_109960 ch09.qxp 2/20/07 11:09 AM Page 181

File Formats That Visio Imports and ExportsVisio supports numerous graphics formats for importing and exporting images and data. Visioinserts the files directly or as metafiles, depending on the type of graphic file, as shown in Table 9-1. For example, bitmaps inserted into Visio drawing come in as individual pictures, whichyou can resize, reposition, or crop. However, with inserted metafiles, you can not only resize, repo-sition, and crop, but also convert the metafiles to Visio shapes by selecting the metafile and choos-ing Shape ➪ Grouping ➪ Ungroup. Visio 2007 supports exporting to PDF and XPS when youinstall the Publish as PDF or XPS add-on. In addition to graphics formats, Visio can export data toXML files, Excel spreadsheets, and ODBC-compliant databases, such as Access.
TABLE 9-1
Graphic Formats That Visio Imports and Exports
Supported Formats Type of File Visio Inserts
AutoCAD Drawing (.dwg) Vector-based metafile
AutoCAD Interchange (.dxf) Vector-based metafile
Compressed Enhanced Metafile (.emz) Vector-based metafile
Enhanced Metafile (.emf) Vector-based metafile
Graphics Interchange Format (.gif) Bitmap
Joint Photographic Experts Group (JPEG) File Interchange Format (.jpg) Bitmap
Portable Network Graphics (.png) Bitmap
Scalable Vector Graphics Drawing (.svg) Vector-based metafile
Scalable Vector Graphics Drawing – Compressed (.svgz) Vector-based metafile
Tag Image File Format (.tif) Bitmap
Web Page (.htm, .html)
Windows Bitmap (.bmp, .dib) Bitmap
Windows Metafile (.wmf) Vector-based metafile
To learn more about importing and exporting CAD drawings in Visio, see Chapter 26.
Beginning in Visio 2003, the following formats are no longer supported: AdobeIllustrator (.ai), ABC Flow Charter 2.0, 3.0, and 4.0 (.af2, .af3), CorelDRAW! 3.0
through 7.0 (.cdr), CorelFLOW (.cfl), Computer Graphics Metafile (.cgm), Corel Clipart Format(.CMX), Bentley Microstation Drawing (.dgn), MicroGrafx Designer 3.1 and 6.0 (.drw, .dsf),Encapsulated Postscript (.eps), Interchange Graphics Exchange Standard (.igs), ZSoft PC Paintbrush(.pcx), Macintosh PIST (.pct), PostScript (.ps).
NOTENOTE
CROSS-REFCROSS-REF
182
Integrating Visio DrawingsPart II
14_109960 ch09.qxp 2/20/07 11:09 AM Page 182

Although Visio supports the SVG graphics format, there are some limitations, as summarized inTable 9-2.
TABLE 9-2
SVG Format Features and Limitations
SVG Support SVG Limitations
You can open and insert both uncompressed Visio does not support scripting, animation, sound, (SVG) and compressed (SVGZ) files, as well XSLT style sheets, CSS cascading rules, masking and as save Visio drawings in both formats. compositing, and metadata.
When you open an SVG or SVGZ file, Visio SVG parameterized linear gradients map to one of four translates SVG symbols into Visio masters and predefined linear gradients in Visio.transforms SVG uses and paths into Visio shapes.
Inserting SVG files as pictures inserts the SVG Visio maps SVG formatting elements such as fill and drawing into a Visio group. line patterns, fonts, and markers to the closest corresponding
Visio formats or creates custom elements.
Saving a drawing with multiple pages as a web SVG filter effects are only supported for raster image page in SVG format creates a separate SVG file elements and are limited to brightness, contrast, gamma, for each page and stores the files in the folder transparency, and blur.for the web page.
183
Importing, Exporting, and Publishing to the Web 9
Using Template Tools to Import and Export
Some of the more specialized Visio templates include tools for importing data to create new Visiodrawings or for exporting Visio data by using database connections. For example, the following
templates offer tools for importing and exporting data:
n Project Schedules, including Gantt Chart, Timeline, and Calendar (see Chapter 17)
n Building Plans, including Space Plan and other types of floor plans (se Chapter 26)
n Brainstorming Diagram (see Chapter 18)
n Organization Chart (see Chapter 14)
n Database Model Diagram (see Chapter 20)
n UML Model Diagram (see Chapter 22)
14_109960 ch09.qxp 2/20/07 11:09 AM Page 183

Importing Data into VisioFor applications that support OLE, linking or embedding files in a Visio drawing (see Chapter 8)means you can both see and edit the file from within Visio. In many situations, editing isn’t impor-tant and, in fact, might be something you don’t want others to do. Inserting a picture of documentsor data from other sources into Visio drawings is the perfect solution. What’s more, a picture alsodisplays documents from applications that don’t support OLE. This section explains how to importgraphic files into Visio and also describes one specialized import method — importing appoint-ments from Outlook into a calendar you create in Visio.
Importing Graphic Files into VisioImporting graphic files saved in other formats can be as easy as opening them in Visio. Choose File ➪
Open, in the Files of Type box, choose the file format you want to import, and double-click the file youwant to import. Visio creates a new drawing file and inserts the graphic file in its native format on thedrawing page — complete with selection and rotation handles like built-in Visio shapes. Opening agraphic file is a better approach for importing vector-based graphic files (such as AutoCAD DWG orSVG formats), because the quality of the image is as high as possible.
To import a graphics file onto an existing drawing page, choose Insert ➪ Picture.
If the file you want to import isn’t in a format that Visio supports, use a graphics pro-gram to convert it to a supported format and then import the file.
Cropping Imported GraphicsAfter you import a picture, you can crop the image to modify how much of the picture is visible onthe drawing. For example, suppose you insert a full screen shot, but want to show only the dialogbox in the middle. To crop a picture, do the following:
1. Display the Picture toolbar by choosing View ➪ Toolbars ➪ Picture.
2. On the Picture toolbar, click the Crop tool.
3. Drag selection handles on the picture to change the size of the border on the drawingpage and hide some of the picture. For example, to show only a dialog box in the middleof a screen shot, you can drag the selection handle in the middle of each side of the pic-ture to the corresponding borders of the dialog box, as illustrated in Figure 9-1.
4. If you want to display a different area of the picture, position the pointer over the pictureand then drag the hand symbol until the area you want to display is in view.
5. When you finish cropping the picture, turn off the Crop tool by selecting another toolsuch as the Pointer tool.
Cropping a picture does not resize it. The cropped area is a border that reduces the amount of thepicture that you see, but the entire picture is still there. If you want to delete the areas outside thecropped border to reduce the size of the image, choose Format ➪ Picture, select the Compressiontab, check the Delete Cropped Areas of Pictures check box, and then click OK.
TIPTIP
184
Integrating Visio DrawingsPart II
14_109960 ch09.qxp 2/20/07 11:09 AM Page 184

FIGURE 9-1
Dragging selection handles when the Crop tool is selected hides a portion of the picture.
Formatting Imported GraphicsAfter you insert a picture into a Visio drawing, you can tweak its appearance by formatting itsgraphic characteristics, for example, brightening a dark picture or heightening the contract. To for-mat a picture, do the following:
1. Select the picture on the drawing page and choose Format ➪ Picture.
2. In the Format Picture dialog box, modify one or more settings to adjust the image.Choose from the following controls:
n Brightness — Lightens or darkens all the colors in the entire picture.
n Contrast — Adjusts the contrast between the lightest and darkest areas in the picture.The higher the contract is, the more difference there is between colors.
n Gamma — Adjusts the brightness of gray tones in a picture, which tends to emphasizedetail in shadows.
n AutoBalance — This control adjusts the brightness, contrast, and gamma based onthe contents of the selected picture.
Crop command
Drag selection handle to hide part of picture
185
Importing, Exporting, and Publishing to the Web 9
14_109960 ch09.qxp 2/20/07 11:09 AM Page 185

n Transparency — 100 percent makes the picture completely transparent, whereas 0percent makes the picture opaque so nothing in the background shows through.
n Blur — Decreases the sharpness of edges and boundaries of areas.
n Sharpen — Increases the sharpness of edges.
n Denoise — Removes noise (stray speckles), which tend to appear in scanned images.
3. Click OK.
Importing Outlook Appointments to a VisioCalendarMicrosoft Outlook is a fabulous tool for keeping track of your appointments, but publishing anddistributing your calendar is another story. You don’t have much control over which parts of yourcalendar Outlook prints. With Visio 2003 and Microsoft Outlook 2000 or later installed, Outlookappointments import into a Visio calendar, which you can then format, print, share, or publish.When appointments reside in a Visio calendar, you can use familiar Visio calendar tools to formatand customize the calendar. With the Import Outlook Data Wizard, you can perform the followingactions:
n Specify a date and time range
n Include only appointments that match a subject
n Create a one-week, multiweek, or one-month calendar
You can create Visio calendars based only on the Gregorian calendar. If your MicrosoftOutlook calendar format is set to Arabic, Hebrew, Chinese, Japanese, Korean, or Thai,
you can change your Outlook calendar format to Gregorian, use the wizard to import your appoint-ments into Visio, and then change your Outlook calendar format back.
To create a Visio calendar from Outlook appointments, follow these steps:
1. Choose File ➪ New ➪ Schedule ➪ Calendar.
2. Choose Calendar ➪ Import Outlook Data Wizard.
3. In the Import Outlook Data Wizard dialog box, select the option to specify whether youwant to create a new calendar or add appointments to the selected calendar and thenclick Next.
The Selected Calendar option is not available if you do not select a calendar before youstart the wizard.
4. Specify the start and end dates and the start and end times that you want to scan forappointments.
5. To limit the appointments added to the calendar, click Filter. In the Filter Outlook Datadialog box, check the Subject Contains check box. Type the subject text for the appoint-ments you want to import, click OK to close the dialog box, and then click Next.
NOTENOTE
NOTENOTE
186
Integrating Visio DrawingsPart II
14_109960 ch09.qxp 2/20/07 11:09 AM Page 186

6. If you chose to create a new calendar, specify the calendar type you want to create. Youcan specify a week, month, or multiple-week calendar, and select the day that begins theweek. If you want to shade weekends, select the Yes option. If you want to display datesin a specific format, choose the language for that format in the Language list and clickNext.
7. On the last wizard screen, review the calendar properties that you selected. If you want tochange any properties, click Back or Cancel. To create the calendar, click Finish.
If appointments overlap, you can resize the calendar or delete some appointments.
Several people can combine their schedules onto one Visio calendar. To learn how to dothis, see Chapter 17.
Exporting Shapes and DrawingsThere are plenty of reasons you might want to export shapes or drawings as graphics files, forexample, including a Visio diagram in a report, using a Visio diagram on a web page, or creating aninstruction manual that shows how to use custom Visio shapes in a template you developed. Visioexports shapes and drawings to several different graphics formats, as well as to HTML. The formatyou choose depends on what you plan to do with the graphic file.
When you export shapes or drawings by choosing File ➪ Save As, an Output Options dialog boxmight appear (depending on the export format you select) in which you can specify the settings forthe exported file. The settings vary depending on the file format to which you want to export yourdrawing. To find out more about the different export settings, in the Output Options dialog box,click the Help button.
Because files go through transformations at every export and subsequent import into anotherapplication, exporting to other formats might alter the appearance of your Visio drawings. If youfind that a special fill pattern or other format causes problems, the best solution is simply to applya different format and then try exporting your drawing again.
Visio gradient fill patterns might not transfer accurately when you save them in a non-Visio graphics format. If gradient fills don’t look the way you want, replace them with
plain fill patterns and then export your Visio drawing.
Exporting Visio shapes and drawings isn’t much different from saving Visio drawings with anotherfile name. To export Visio shapes or drawings, follow these steps:
1. Display the drawing page you want to export in Visio. If you want to export specificshapes on a page, select them.
2. Choose File ➪ Save As and, in the Save As Type drop-down list, select the export formatyou want.
CAUTION CAUTION
CROSS-REFCROSS-REF
NOTENOTE
187
Importing, Exporting, and Publishing to the Web 9
14_109960 ch09.qxp 2/20/07 11:09 AM Page 187

3. In the File Name box, type the name you want.
4. Click Save.
5. Depending on the type of format you chose to export in step 2, an Output Options orFilter Setup dialog box appears, as shown in Figure 9-2. If it does, specify the optionsyou want, such as compression to reduce file size or the number of bits for color, andclick OK. Visio exports the page and selected shapes to a file with the format you chose.
FIGURE 9-2
Different types of graphics files offer output options or filters for fine-tuning the exportedimage.
If you export Visio shapes but they don’t appear in the exported file, the shapes mightbe metafiles, such as Visio Network Equipment shapes or some objects linked or embed-
ded in a Visio drawing. To export metafiles, apply the Ungroup command until Visio converts all thecomponents of the metafile to shapes, and then export the drawing.
You can specify export options for the following formats:
n TIFF — Data compression, color format, background color, color reduction, transforma-tion, resolution, and size
n JPEG — Baseline or progressive, color format, background color, quality, transformation,resolution, and size
n GIF — Data format, background and transparency color, color reduction, transformation,resolution, and size
n PNG — Same options as GIF
TIPTIP
188
Integrating Visio DrawingsPart II
14_109960 ch09.qxp 2/20/07 11:09 AM Page 188

Publishing to the WebWhen you want to share information with a large or widely distributed audience, the Web is fre-quently your first choice. You can publish Visio drawings to the Web by saving Visio drawings astheir own web pages, as graphics files that you can embed in web pages, or as Visio XML files thatyou can open in a web browser. Visio drawings saved as web pages enable anyone with a more recentweb browser to view your diagrams, including shape data. Visio takes care of almost every aspect ofcreating the web pages — you choose the Save As Web Page command and, in some cases, select afew publishing options. This section explains the different ways to publish Visio drawings to the Web,the benefits of each approach, and how to make the completed web page easier to navigate.
Choosing an Output Format for a Visio Web PageThe best format for a Visio drawing published to the Web depends on what you’re trying to accom-plish with web publication as well as the browsers your audience uses. The first step to choosingan output format is to decide what you want to publish:
n Saving Visio drawings as web pages is effective when you want to:
n Maintain navigational links between Visio shapes when you publish them to a web page
n Include reports that users can view easily
n Export several pages of a multiple-page drawing at once
189
Importing, Exporting, and Publishing to the Web 9
Saving Visio Drawings for Distribution
In Office 2007 programs including Visio 2007, you can save any file from your Microsoft applica-tion to either Adobe PDF or XPS (XML Paper Specification) format. These formats offer the best of
both worlds when you want to distribute documents to a broad audience. The files can’t be editedand they appear with exactly the formatting you originally applied.
To save a file to PDF or XPS format, you must first install the Save as PDF or XPS add-on. Navigate towww.microsoft.com/downloads and search for “PDF or XPS”. Follow the instructions on theweb page for downloading and installing the add-on.
After the add-on is installed, to save a Visio drawing as a PDF- or XPS-formatted file, do the following:
1. Choose File ➪ Publish as PDF or XPS.
2. In the Publish as PDF or XPS dialog box, navigate to the folder in which you want to storethe file. In the File Name box, type the name of the file.
3. In the Save As Type drop-down list, choose either PDF or XPS Document.
4. By default, the Optimize For option selected is Standard, which creates a document suit-able for both online and print publishing. To create a smaller file for online publishing,select the Minimum Size option.
5. To create the file, click Publish.
14_109960 ch09.qxp 2/20/07 11:09 AM Page 189

n Saving drawings in the JPG, GIF, PNG, or SVG format is preferable when you want to:
n Insert a Visio drawing into an existing HTML web page
n Publish only a portion of a drawing
The second aspect of choosing output formats is picking one that works well with the browserspeople use to view your web pages. Although it’s often difficult to determine which browsers youraudience is likely to use, Table 9-3 shows which output format works best with different types ofbrowsers.
TABLE 9-3
Browser and Output Format Compatibility
Output Format Earliest Browser Internet Explorer 5.0 or Other Browser and Supported Later Behavior Version Behavior
VML (Vector Markup Language) Any HTML 2.0– Drawing is displayed Drawing is displayed compliant browser in VML and scalable in JPEG, GIF, or PNG, with alternate with browser window. but is not scalable.browser support that Left frame includes Left frame shows supports frames Go To Page, Pan and pages as links.
Zoom, Details, and Search Pages.
VML only Internet Explorer 5.0 Drawing is displayed Not supported.in VML and is scalable with the browser window.Left frame includes Go To Page, Pan and Zoom, Details, and Search Pages.
SVG with alternate SVG Viewer and Drawing is displayed Drawing is displayed browser support any HTML 2.0– in SVG with SVG in SVG with SVG
compliant browser Viewer or SVG- Viewer or SVG-that supports frames compatible browser; compatible browser.
otherwise, as JPEG, Left frame shows GIF, or PNG. pages as links.Left frame includes Go To Page, Details, and Search Pages.
190
Integrating Visio DrawingsPart II
14_109960 ch09.qxp 2/20/07 11:09 AM Page 190

Output Format Earliest Browser Internet Explorer 5.0 or Other Browser and Supported Later Behavior Version Behavior
SVG only SVG Viewer, Drawing is displayed Drawing is displayed Internet Explorer 5, in SVG with SVG in SVG with SVG Mozilla Firefox 1.0 Viewer or SVG- Viewer or SVG-
compatible browser; compatible browser.otherwise, as JPEG, Left frame shows GIF, or PNG. pages as linksLeft frame includes Go To Page, Details, and Search Pages.
JPEG or GIF Internet Explorer 3.0, Drawing is displayed Drawing is displayed Netscape Navigator 3.0, in JPEG or GIF and in JPEG or GIF and is Mozilla Firefox 1.0, is not scalable. not scalable.and any HTML 2.0– Left frame includes Left frame shows compliant browser Go To Page, Details, pages as links.that supports frames and Search Pages.
PNG Internet Explorer 4.0 Drawing is displayed Drawing is displayed or later, Netscape in PNG and is not in PNG and is not Navigator 6.0 or later, scalable. scalable.Mozilla 1.0 Left frame includes Left frame shows
Go To Page, Details, pages as links.and Search Pages.
VML (Vector Markup Language) represents graphics as vectors instead of pixels, so theylook good no matter how far you zoom in. Vectors also speed up web navigation
because they download faster than images made up of pixels.
Saving Drawings As Web PagesWhether Visio drawing files contain one page or several, it’s easy to transform them into webpages, despite the plethora of files it takes to represent each web page. When you use MicrosoftInternet Explorer 5.0 or later and save Visio drawings as web pages, you can navigate around thedrawing, zoom in and out, display shape data for shapes, search the drawing for shapes, or viewreports associated with the drawing, as illustrated in Figure 9-3. When you save a Visio drawing asa web page, by default Visio generates HTML source code and creates HTML frame pages withframes for drawing pages and controls.
NOTENOTE
191
Importing, Exporting, and Publishing to the Web 9
14_109960 ch09.qxp 2/20/07 11:09 AM Page 191

FIGURE 9-3
Visio includes controls and other information in the left frame of a web page.
In order for colors to appear properly when you display a Visio drawing as a web page,your system must have more than 256 colors. Even then, colors don’t always match
exactly when you display a Visio drawing on the Web.
To save a Visio drawing as a web page, follow these steps:
1. Open the Visio drawing that you want to publish to the Web and then choose File ➪
Save As Web Page.
2. In the Save As dialog box, navigate to the folder in which you want to save the file. In theFile Name text box, type the name for the web page file.
3. To specify the title you want to appear in the browser title bar, click Change Title, andthen, in the Set Page Title dialog box, type the title you want. Click OK. The title youtyped appears below the File Name and Save As Type boxes.
4. To specify the web page publishing options (described in detail in the next section), clickPublish and choose the options you want.
NOTENOTE
Drag to zoom into page
Shape data for selected shape Ctrl+click to select shape
192
Integrating Visio DrawingsPart II
14_109960 ch09.qxp 2/20/07 11:09 AM Page 192

5. To publish the Visio drawing to the Web, choose one of the following methods:
n If you clicked Publish to specify web publication options, click OK.
n If you didn’t specify publishing options, in the Save As dialog box, click Save.
6. Visio creates the drawings as HTML files and opens the first page in Internet Explorer.
Specifying Web Page Publishing OptionsWhen you save a Visio drawing as a web page, Web Page Publishing options control which pagesare published, which controls appear in the left frame of the web page, and the output format andadditional display options, such as the target resolution. To specify web page publishing options, inthe Save As Web Page dialog box, click Publish.
The General tab contains options for configuring the following features in published web pages:
n Specify pages to publish — You can publish one page in a drawing file, all pages, or arange of consecutive pages. To publish all pages, select the All option. To publish one ormore, select the Pages: From To option and type the page numbers for the first and lastpages in the range.
n Display search, navigation, and data controls — In the Publishing Options list, selectthe controls that you want to appear in the left frame of the web page:
n Details — Displays values for shape data for the selected shape. To view shape data inthe left frame, Ctrl-click a shape on the web page or click the shape and then pressCtrl+Enter.
n Go to Page — Displays a drop-down list of the pages, which you choose to navigatebetween pages.
n Search Pages — Includes check boxes to specify what to search for on the pages.
n Pan and Zoom — You can drag in the Pan and Zoom window to change the area thatappears in the right frame of the web page or click to re-center the page. Pan andzoom controls are available only when you use the VML output format in InternetExplorer 5.0 or later.
n Report — Select each report you want to publish in the Publishing Options list.Reports appear on separate pages that you can access by using the Go to Page controlin the left frame of the web page. If no shapes in your drawing match the report query,Visio creates the web page without the report.
If you don’t want a left frame in your browser window and don’t need Go to Page to nav-igate between web pages, uncheck Go to Page, Search Pages, Details, and Pan and Zoom.
n Open web page in browser — To open the web page in your browser immediately afteryou save it, under Additional Options, select Automatically Open Web Page in Browser.
n Organize supporting files in a folder — This option creates a subfolder for storing thesupporting files for the web page. When you move your web page to another folder, thesupporting files folder moves with it automatically.
TIPTIP
193
Importing, Exporting, and Publishing to the Web 9
14_109960 ch09.qxp 2/20/07 11:09 AM Page 193

Visio looks for the supporting files for a web page based on the root file’s name. If yourename a root HTML file, Visio displays a warning that renaming the file will break the
links to the supporting file folder. Instead of renaming a root file, open the published diagram in Visio,save it with the new name (which also creates a new subfolder), and delete the old _files folder.
The Advanced tab includes options for the output formats, resolution, and other display options:
n Specify output format — In the Output Formats drop-down list, choose the format youwant. VML produces the best results for displaying controls in the left frame of the webpage. VML and SVG support scalable graphics, so the web page output resizes if thebrowser window resizes.
You must install an SVG viewer to view web pages in SVG format. If you open a webpage in SVG format without an SVG viewer, the page appears in a format such as GIF.
n Specify an alternate format for older browsers — Because VML and SVG require morerecent browser versions, it’s a good idea to specify an alternate format so that the webpage still opens in older browsers. Select the Provide Alternate Format for Older Browserscheck box and select the format you want, such as JPG or GIF.
n Specify the target resolution — If you are creating a file in JPG, GIF, or PNG format,specify the smallest resolution that you expect people to use to view your web pages.
You don’t have to specify the Target Monitor resolution for scalable formats such asVML and SVG.
n Embed a saved Visio web page in another web page — In the Host In Web Page drop-down list, choose the web page in which you want to embed the saved web page, asdescribed in the next section.
n Specify color scheme — If you want to apply the color scheme for your Visio drawing tothe resulting web page, in the Style Sheet drop-down list, select the color scheme. Thiscolor scheme applies colors to the left frame and report pages that match the colorscheme for the Visio drawing.
Embedding Visio Drawings in Web PagesIf your organization already has a template for its web pages, chances are you want to embed Visioweb pages within your company’s template to maintain the look and feel across all the pages in theweb site. To embed a Visio web page in another HTML page, you add an <IFRAME> tag to the hostHTML page where you want the Visio drawing to appear, and specify the host page in the Save asWeb Page dialog box. Visio provides a sample template, Basic.htm, in the Host in Web Page listif you need an example of how to use the <IFRAME> tag.
Of course, you can also publish a Visio drawing as a graphic image, if you don’t need toshow shape data or provide navigation tools.NOTENOTE
NOTENOTE
NOTENOTE
CAUTION CAUTION
194
Integrating Visio DrawingsPart II
14_109960 ch09.qxp 2/20/07 11:09 AM Page 194

To use an existing HTML template to display a Visio web page, follow these steps:
1. Edit your HTML template to include the following HTML tag:
<IFRAME src=”##VIS_SAW_FILE##”>
This tag embeds the Visio web page into your HTML template. It is case-sensitive andrefers to the HTML output file that Visio creates when you create a Visio web page. The
<IFRAME> tag for a Visio web page contains the information about the drawing. If you forget toinclude this tag, you’ll see the HTML code instead of the drawing.
2. In Visio, choose File ➪ Save As Web Page and, in the Save As Web Page dialog box, spec-ify the folder and name for the web page.
3. Click Publish and select the Advanced tab.
4. Under Host in Web Page, browse to the HTML template file that you want to use as thehost page and click OK.
Visio stores the Basic.htm template in the Visio path, usually C:\Program Files\MicrosoftOffice\Office12\1033\. Your customized HTML templates appear in the Host in Web
Page drop-down list if you store copies of them in this same folder.
NOTENOTE
NOTENOTE
195
Importing, Exporting, and Publishing to the Web 9
Files That Visio Creates for Web Pages
Web pages are made up of a lot of files, which Visio creates for you and stores in a convenientlocation. Most of the time, you don’t need to give these files a second thought. However, if
you publish Visio drawings as web pages often, it’s a good idea to understand what files Visio createsand where they’re located, so you can modify or delete them if need be.
When you save a drawing as a web page, Visio creates a root HTML file for your Visio drawing in thefolder that you specify. In addition, Visio creates a subfolder in the same location using the samename as the root HTML file but with _files appended to the end. Visio stores the files required forthe web page in the subfolder. Because of this naming convention, the subfolder moves with its rootHTML file; if you delete the HTML file, the subfolder is deleted as well. However, if you move HTMLfiles, you might have to edit them to update pointers to graphics files.
For each Visio drawing, Visio creates the following files:
n A root HTML file with the name you specified, such as Flowchart05.htm
n Graphics files of the output format you specified for each published page in the Visiodrawing, such as vml_1.htm, and the alternate format, such as gif_1.gif, if you chose toinclude an alternate format for older browsers.
n Other files that support the publishing options you selected when you published the webpage, such as graphics (.gif) for controls, style sheet (.css), script (.js), and data files (.xml)
14_109960 ch09.qxp 2/20/07 11:09 AM Page 195

Adding Hyperlink Navigation Shapes to DrawingsNavigating between shapes and pages in Visio is easy when you add hyperlinks to shapes on yourdrawings. When you create a web page from a Visio drawing, Visio saves these hyperlinks in shapes,so people viewing the drawing on the Web can navigate to the information they want as though theywere viewing the drawing in Visio. However, no indication of a hyperlink appears until you positionthe pointer over a shape with a hyperlink. To make navigation options more obvious, you can addhyperlink navigation shapes to your drawing before you save it as a web page. People viewing thedrawing can navigate simply by clicking the navigation shapes on the web page.
To learn about creating hyperlinks in your Visio drawings, see Chapter 8.
Although you can add hyperlinks to any shape you want, the Borders and Titles stencil includes sev-eral built-in navigation shapes, Hyperlink Button, Hyperlink Circle 1, and Hyperlink Circle 2. Theseshapes automatically open the Hyperlinks dialog box when you drag them onto a page. After you addone of these hyperlink shapes to a drawing, you can change the icon that appears for the shape to indi-cate the function of the associated hyperlink. Table 9-4 includes the names of the icons you can use.
TABLE 9-4
Hyperlink IconsBack Forward
Up Down
Home Help
Directory Info
Search Mail
Photo None
CROSS-REFCROSS-REF
196
Integrating Visio DrawingsPart II
Other Ways to Reference Visio Drawings in HTML
Links to reference images of Visio drawings or Visio web pages within other web pages are anotherway to view Visio drawings on the Web, if you don’t need special features such as shape data. To
include a link to your Visio web page, you can add a tag to your HTML template, such as the following:
<a href=”##VIS_SAW_FILE##”>My Drawing</a>
To reference a graphics file in a web page, save your Visio drawing in the JPEG, GIF, or PNG format.Then add an <IMG> tag to your HTML code, such as <IMG SRC=”process_flow1.gif” >. Visiodrawings saved as graphics do not include shape data or navigation controls, such as hyperlinks.
To keep links intact, you can save a Visio drawing in PDF format and include that file in the HTML file.
14_109960 ch09.qxp 2/20/07 11:09 AM Page 196

To add a navigation shape to a drawing, follow these steps:
1. Drag one of the hyperlink shapes from the Borders and Titles stencil onto a drawing page.
2. In the Hyperlinks dialog box, specify the address or sub-address for the hyperlink andclick OK.
3. To change the icon in the shape, right-click the hyperlink shape and choose Change Iconfrom the shortcut menu. Select the icon you want in the Icon Type drop-down list andclick OK.
SummaryVisio can import and export to a variety of formats, from AutoCAD drawings and ODBC-compliantdatabases to graphic files and web pages. Many of the built-in Visio templates include tools thatsimplify importing and exporting data to their specific types of drawings. However, to import datafrom another source into Visio without a specialized tool, you select the type of file in the Opendialog box and choose the file you want. To export data to another format, you use File ➪ Save As,selecting the type of format you want in the File of Type drop-down list. When you want to pub-lish Visio drawings to the Web, the Save As Web Page command provides numerous options forspecifying the contents and functionality of the resulting web page.
197
Importing, Exporting, and Publishing to the Web 9
14_109960 ch09.qxp 2/20/07 11:09 AM Page 197

14_109960 ch09.qxp 2/20/07 11:09 AM Page 198

There are plenty of Visio drawings that are nothing more than a prettyface — like the attractively formatted diagram that you send to cus-tomers to guide them through the maze of your phone menu system.
The shapes and connectors say all there is to say.
However, Visio drawings can put brains behind those good looks when youlink shapes on Visio drawings with data. Combining shapes with data can beas simple as adding values manually to shape data, for example, when youbuild a small organization chart by typing employee names and other infor-mation in the organization chart shapes. Visio can also link shapes directlywith data sources, so your drawings can act as visual and dynamic represen-tations of data stored in data sources. For example, dynamic links betweena Visio drawing of rentable office space and a database of facilities manage-ment data could generate a visual status report of occupancy and a textreport of rental income.
Perhaps the most significant features in Visio 2007 Professional are related todata. Data Link is a new feature that greatly simplifies the process of connect-ing data sources and the data within them to shapes. When you have datalinked to shapes, the new Data Graphics feature helps you present data graphi-cally to highlight status, trends, or problems — without the customizations thatearlier versions of Visio would have required.
This chapter describes the data features in Visio 2007. First, you’ll learn thebasics — how to add and view data in shape data. Then, you’ll learn how touse the new Data Link feature to link shapes to data and refresh values whenyou want. The chapter continues with Data Graphics. You’ll learn about thedifferent types of Data Graphics that Visio 2007 Professional offers and howto set up shapes to use them. Finally, the chapter concludes by describinghow to run reports and create customized reports.
199
IN THIS CHAPTERAn overview of Visio 2007 datafeatures
Storing data in shapes
Linking shapes and external datawith Data Link
Visualizing data withData Graphics
Linking masters to databases
Creating drawings from databaserecords
Exporting shape data to databases
Linking Shapes with Data
15_109960 ch10.qxp 2/20/07 11:09 AM Page 199

An Overview of Data Features in Visio 2007One of Visio’s most powerful features is its ability to present information visually. Although Visiohas done that in previous versions, Visio 2007 Professional greatly simplifies many data-relatedtasks. Data Link has streamlined connecting drawings to data sources; the Data Selector wizardprovides a visual interface for connecting shapes and data; and Data Graphics display data as pro-fessional-looking graphics without hours of tedious customizing of shapes. This section summa-rizes the features in Visio 2007 for working with data.
Both Visio Standard and Visio Professional include shape data and built-in reports.However, the more robust data-related features, including Data Link, Data Graphics,
and the database wizards from previous Visio versions, are available only in Visio Professional.
Shape DataOne of Visio’s basic concepts is that shapes can have properties that contain textual data, such asdimensions, cost, equipment type, or serial number. In Visio 2007 (both Standard and Professional),these properties are called shape data, although you probably know them as custom properties fromearlier versions of the program.
Many of these properties never appear on a drawing page — they rest quietly in their shapes’ShapeSheets unless you summon them. For example, the Cost, Duration, and Resources propertiesfound on the shapes in the TQM stencil might contribute to a report without ever appearing on adrawing.
Other shape data properties directly affect the appearance of their parent shapes. For example, engi-neering shapes often have configuration-oriented shape data, such as Width or Outside Diameter,which control the physical dimensions of the shapes you see on the drawing. Change the propertyand the size of the shape on the page changes, too. Shape data also can appear directly on the draw-ing page, such as the name and title properties, which show up as text within Organization Chartshapes.
One of the easiest ways to access shape data is within the Shape Data Window (choose View ➪
Shape Data Window). The window includes two columns, one for shape data property names andthe other for values. Viewing and entering data in the Shape Data Window is both easier and saferthan opening the ShapeSheet to modify properties.
See the section “Storing and Viewing Shape,” later in this chapter, for instructions onentering data in shape data fields and accessing those fields. To learn how to create new
shape data properties and associate them with shapes, see Chapter 34.
Linking Shapes to External DataAlthough you can add data directly to shapes and keep the data completely within your Visio draw-ing file, grabbing data from external sources is often a more efficient way to work. For example, with
CROSS-REFCROSS-REF
NOTENOTE
200
Integrating Visio DrawingsPart II
15_109960 ch10.qxp 2/20/07 11:09 AM Page 200

links between shapes and external data, you can work with a floor plan that automatically showswho’s sitting where according to your facilities database. Or, a network diagram might showresponse times and system usage.
Previous versions of Visio had tools for linking shapes to external data, but the Visio 2007Professional Data Link feature makes it easier to connect to data sources, link shapes to data, andrefresh that data. For programming folks, Data Link includes an API, which provides a program-matic link to XML data and also means developers don’t have to create shape data programmati-cally. Data Link supports more than one data source to the same drawing. For example, you mightlink to an employee database for the employees who occupy cubicles while also linking to an assetdatabase to link to the equipment records for the computers and furniture in those cubicles.
See the section “Linking Drawings to External Data,” later in this chapter, for instruc-tions on creating the links between drawings and data sources as well as between
shapes and data records.
Presenting Data on DrawingsIn Visio 2007 as well as earlier versions, add-ons help you display shape data within shapes orcolor-code shapes by shape data values (see Chapter 28 for the Label Shapes add-on and Color ByValues add-on). Visio 2007 Professional has a new feature up its sleeve — Data Graphics displaydata graphically without all the customizing required in the past.
The built-in Data Graphics shapes can present data as text, but with nice formatting that makes thetext stand out. In addition, Data Graphics can represent values as progress bars or icons. For exam-ple, instead of displaying the number of megabytes of free space on disk drives, you can have barsthat grow shorter as you eat up hard disk space. Similarly, icon sets show different icons dependingon the shape data values, so you can simulate a stop light with red, yellow, and green circles to rep-resent dangerous, so-so, and good values.
See the section “Visualizing Data with Data Graphics,” later in this chapter, for instruc-tions on attaching built-in Data Graphics shapes to drawing shapes and customizing
your own Data Graphics.
Creating ReportsVisio also includes several built-in text reports, such as door schedules and equipment lists, whichassemble data from built-in Visio shapes. You can also customize reports to build your own; although,for very specific reporting requirements, a dedicated reporting program is likely to be easier.
See the section “Producing Reports” later in this chapter to learn how to run built-inreports or build your own.CROSS-REFCROSS-REF
CROSS-REFCROSS-REF
CROSS-REFCROSS-REF
201
Linking Shapes with Data 10
15_109960 ch10.qxp 2/20/07 11:09 AM Page 201

Storing and Viewing Shape DataWhether you manually type values for shape data or transfer data from an external data sourcethrough Data Link, shape data properties are the containers that store data (or the connections toexternal fields). The Shape Data Window is the easiest place to view the shape data for shapes andit doubles as a data entry window if you enter data manually.
If you want to keep the Shape Data Window from hiding part of the drawing area, dockthe Shape Data Window within the Shapes Window by dragging and dropping it there.
To view and store shape data, follow these steps:
1. To open the Shape Data Window, choose View ➪ Shape Data Window.
2. On the drawing page, select a shape to display its properties in the Shape Data Window.If the shape doesn’t have any associated shape data properties, the Shape Data Windowdisplays only the text “No Shape Data.”
If you want to see shape data only occasionally, you don’t have to keep the Shape DataWindow open. The shortcut menus for many built-in shapes include the Properties entry,
which opens the Properties dialog box. To access all the shape data properties for a shape throughthe Properties dialog box, right-click a shape and, from the shortcut menu, choose Properties. In theProperties dialog box, enter or edit shape data values and click OK when you’re finished.
3. To enter a property value in the Shape Data Window, click the value cell for the propertyyou want to edit and type the value in the box. If the property includes a drop-down list,you can choose a value from the list.
If you aren’t sure what a shape data property represents or what format you shouldenter, you can display the prompt for a property by pointing to the property label in the
Shape Data Window.
Linking Drawings to External DataFor all but the smallest data-related tasks, typing shape data values manually is tedious and time-consuming; and manually keeping data up-to-date is even worse. A much more effective approachis linking external data to shapes on drawings. The Visio Data Link feature helps you connectyour drawings to data sources as well as link the records in your data sources to the shapes on yourdrawings.
Data Link pushes data from external data sources to the shapes on your drawings, but itdoesn’t move data in the other direction. If you want a two-way communication channel,
you can still use the Database Wizard, which is described in the section “Using the Visio DatabaseAdd-ons to Link Drawings and Databases” later in this chapter.
NOTENOTE
TIPTIP
TIPTIP
TIPTIP
202
Integrating Visio DrawingsPart II
15_109960 ch10.qxp 2/20/07 11:09 AM Page 202

In Visio 2003 and earlier, defining a link between a Visio drawing and a data source required stepsthat were often daunting to folks whose job titles didn’t include database administrator. You startedin Microsoft Windows by creating a data source — picking the correct driver for the data sourceand defining the data that the data source represented. Then, in Visio, you ran a wizard to connectthe records to shapes. Data Link takes a lot of the mystery out of the process of linking a drawingto a data source, no matter which type of data source you use.
Linking a Drawing to a Data SourceThe first part of Data Link is the Data Selector wizard, which sets up the connection between adata source and your drawing. To get started, choose Data ➪ Link Data to Shapes. In the DataSelector dialog box, from the following list of data source types, select the option for the type ofdata you have:
n Microsoft Office Excel workbook — An Excel workbook.
n Microsoft Office Access database — An Access database.
n Microsoft Windows SharePoint Services list — A list on a SharePoint site, such as a listof tasks.
n Microsoft SQL Server database — A SQL Server database.
n Other OLEDB or ODBC data source — Data stored in an ODBC-compliant database,such as Oracle, or a data source accessed through the Microsoft OLEDB API.
n Previously created connection — Choose this option if you want to link a drawing to adata source that already exists, for example, one that you created directly in Windows or,better yet, that your administrator set up for you. For example, Data Source Name con-nections end in the file extension .dsn.
When you click Next to continue the wizard, the steps you perform vary slightly depending on thetype of data source. Here is an overview of the steps you’re likely to perform:
1. On the first connection screen, select the data source you want to use and specify addi-tional information about the data source. The following list describes the different stepsto perform based on the type of data source:
n Excel workbook — Choose the workbook file and click Next. In the next screen,from the drop-down list, select the worksheet that contains the data. To select a rangeof cells on the worksheet, click Select Custom Range. By default, the First Row OfData Contains Column Headings check box is checked, which is almost always whatyou want. Of course, if your workbook doesn’t include headings, clear the check boxor the wizard will interpret your first row of data as headings.
n Access database — Choose the Access database file. Then, in the What Table Do YouWant To Import drop-down list, choose the table that contains the data and clickNext. (If the database includes only one table, the wizard selects it by default.)
n Microsoft Windows SharePoint Services list — In the Site box, type the URL for theSharePoint web page that contains the list you want to link and click Next.
203
Linking Shapes with Data 10
15_109960 ch10.qxp 2/20/07 11:09 AM Page 203

n Microsoft SQL Server database — For a SQL Server database, you must specify thename of the server and the credentials that give you permission to access the database.Windows authentication uses your Windows username and password, but you canalso specify a user name and password specific to the database.
n Other OLEDB or ODBC data source — For this option, you must first select the typeof data source, such as ODBC DSN or Microsoft Data Access - OLE DB for Oracle.Then, you specify the file and authentication.
n Previously created connection — In the drop-down list, choose the connection. Or,click Browse to navigate to the folder that contains your data connections.
2. On the Connect To Data screen, All Columns and All Rows are selected by default, asshown in Figure 10-1. If you want to link only specific columns and rows, which is wisefor data sources with lots of data, click Select Columns. In the Select Columns dialog box,select or clear the column check boxes to include or exclude those columns. For exam-ple, if you use a data field as a unique identifier, you don’t need to link an automaticallyincremented key field from a database. Click Select Rows to specify data records to link.
FIGURE 10-1
You can proceed with linking all columns and rows or click Select Columns or SelectRows to specify the data you want.
All columns and all rows are selected by default
Clear check boxes to remove columns
Click to select specific columns
204
Integrating Visio DrawingsPart II
15_109960 ch10.qxp 2/20/07 11:09 AM Page 204
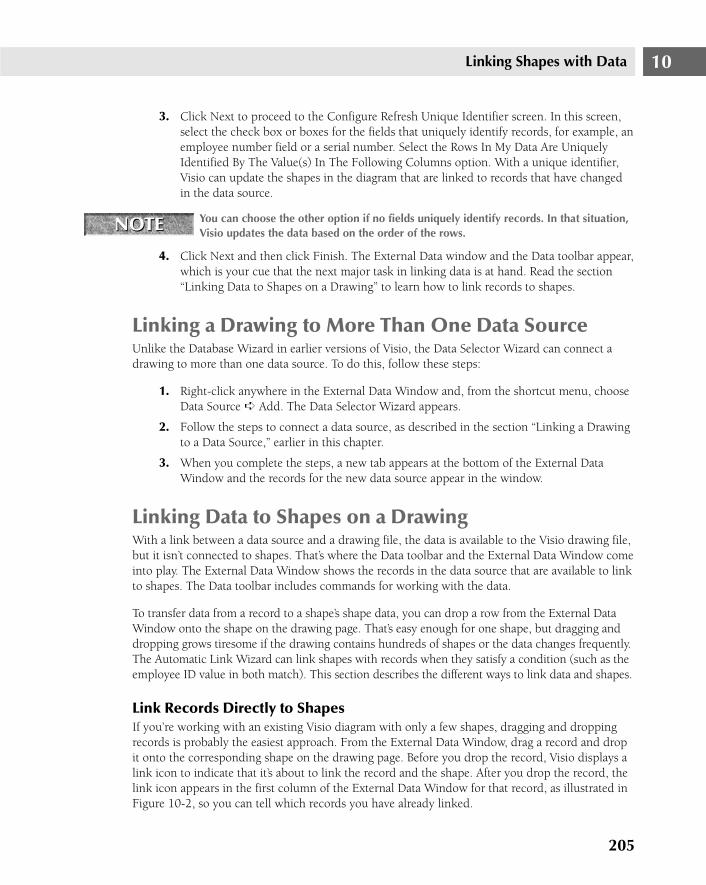
3. Click Next to proceed to the Configure Refresh Unique Identifier screen. In this screen,select the check box or boxes for the fields that uniquely identify records, for example, anemployee number field or a serial number. Select the Rows In My Data Are UniquelyIdentified By The Value(s) In The Following Columns option. With a unique identifier,Visio can update the shapes in the diagram that are linked to records that have changedin the data source.
You can choose the other option if no fields uniquely identify records. In that situation,Visio updates the data based on the order of the rows.
4. Click Next and then click Finish. The External Data window and the Data toolbar appear,which is your cue that the next major task in linking data is at hand. Read the section“Linking Data to Shapes on a Drawing” to learn how to link records to shapes.
Linking a Drawing to More Than One Data SourceUnlike the Database Wizard in earlier versions of Visio, the Data Selector Wizard can connect adrawing to more than one data source. To do this, follow these steps:
1. Right-click anywhere in the External Data Window and, from the shortcut menu, chooseData Source ➪ Add. The Data Selector Wizard appears.
2. Follow the steps to connect a data source, as described in the section “Linking a Drawingto a Data Source,” earlier in this chapter.
3. When you complete the steps, a new tab appears at the bottom of the External DataWindow and the records for the new data source appear in the window.
Linking Data to Shapes on a DrawingWith a link between a data source and a drawing file, the data is available to the Visio drawing file,but it isn’t connected to shapes. That’s where the Data toolbar and the External Data Window comeinto play. The External Data Window shows the records in the data source that are available to linkto shapes. The Data toolbar includes commands for working with the data.
To transfer data from a record to a shape’s shape data, you can drop a row from the External DataWindow onto the shape on the drawing page. That’s easy enough for one shape, but dragging anddropping grows tiresome if the drawing contains hundreds of shapes or the data changes frequently.The Automatic Link Wizard can link shapes with records when they satisfy a condition (such as theemployee ID value in both match). This section describes the different ways to link data and shapes.
Link Records Directly to ShapesIf you’re working with an existing Visio diagram with only a few shapes, dragging and droppingrecords is probably the easiest approach. From the External Data Window, drag a record and dropit onto the corresponding shape on the drawing page. Before you drop the record, Visio displays alink icon to indicate that it’s about to link the record and the shape. After you drop the record, thelink icon appears in the first column of the External Data Window for that record, as illustrated inFigure 10-2, so you can tell which records you have already linked.
NOTENOTE
205
Linking Shapes with Data 10
15_109960 ch10.qxp 2/20/07 11:09 AM Page 205

FIGURE 10-2
The link icons in the External Data Window indicate which records you’ve linked.
Automatically Link Records to Shapes on a DrawingWhen the volume of data or the frequency of changes is high, automatically linking shapes andrecords is a better way to go. The catch is that automatic linking works only when values in shapedata match values in the fields in the data source. If you have a shape data property for the fieldthat uniquely identifies records in the data source, you’re all set.
To automatically link records to shapes, follow these steps:
1. On the Data menu, click Automatically Link, whose icon looks like a few links of chain.The Automatic Link wizard launches.
2. On the first screen, Visio selects an option based on your shape selection. If you did notselect shapes on the drawing before starting the wizard, Visio selects the All Shapes OnThis Page option. If you selected the shapes you want to link automatically, Visio selectsthe Selected Shapes option, but you can select the other option as well. Click Next toproceed to matching up columns in the data source with shape data properties.
Data toolbar
Link icon indicates record is linked to a shape
206
Integrating Visio DrawingsPart II
15_109960 ch10.qxp 2/20/07 11:09 AM Page 206

3. On the next screen, the label is “Automatically Link Row To Shape If,” which is a big hintthat this is where you define the criteria for matching shapes and records. In the DataColumn drop-down list, choose a field in the data source. In the Shape Field drop-downlist, choose the corresponding shape data property, as shown in Figure 10-3. If your datasource uses more than one field to uniquely identify records, click And to define the nextcriterion. If you want Visio to replace any existing links (for example, a few you addedmanually), select the Replace Existing Links check box.
FIGURE 10-3
You must tell the Automatic Link wizard about the criteria that indicate matchingrecords and shapes.
4. Click Next to proceed to the summary screen. If the actions in the list meet yourapproval, click Finish to link the records and shapes. A message box with progressappears to show how many links the wizard has created and disappears when the auto-matic links are in place.
5. To double-check the results, look at the records in the External Data Window to verifythat all the records that you want linked have the link icon in the first column.
When you link data to shapes, Visio stores the external data in shape data. Another wayto verify that the links are working the way you want is to choose View ➪ Shape Data
Window. Select a shape and, in the Shape Data Window, verify that the data appears.
NOTENOTE
Matching data source field and shape data property
Click to add another criterion Click to delete a criterion
207
Linking Shapes with Data 10
15_109960 ch10.qxp 2/20/07 11:09 AM Page 207

Adding Shapes with Built-in Data LinksIf you are adding new shapes to a drawing, you can add the shapes and the data links at the sametime. This works best when you are adding several instances of the same master. Here are the stepsto follow:
1. In the Shapes window, in the stencil, select the shape you want to add to the drawingwhen you drag rows of data onto the drawing page.
2. In the External Data Window, drag one or more rows onto the drawing page. (To selectseveral contiguous rows, Shift-click the first and last row. To select several separate rows,hold the Ctrl key and click each row you want to add.) Visio adds the shapes to the pagewith links to the records you dragged.
Refreshing the Data in DrawingsThe last piece of the Data Link puzzle is the new Refresh Data wizard. You can specify how frequentlyyou want to refresh data and Visio takes over the job of checking the data source for changes andupdating shape data with those changes. If data conflicts arise, the Refresh Conflicts Task Paneappears, so you can tell Visio what to do to resolve them.
Setting Up Data RefreshWhether you want to refresh data immediately or set up a schedule for automatic refreshes, youbegin with the Data menu:
n Refresh the data on your drawing immediately — Choose Data ➪ Refresh Data. In theRefresh Data dialog box, select the data source you want to refresh and then click Refresh.You’re done. The linked shapes on the drawing page and the records in the External DataWindow both reflect any changes.
n Set up a schedule for refreshing data — For example, you can tell Visio to update thedata every few minutes, when data changes are fast and furious. By automatically refresh-ing every few hours or even once a day, Visio performs more responsively, but you won’thave to wait too long to see changes. Besides, you can always request an immediaterefresh before you print your drawing for a big presentation. To schedule refreshes, dothe following:
1. Choose Data ➪ Refresh Data.
2. In the Refresh Data dialog box, select the data source you want to refresh and thenclick Configure.
208
Integrating Visio DrawingsPart II
15_109960 ch10.qxp 2/20/07 11:09 AM Page 208

3. In the Configure Refresh dialog box, under Automatic Refresh, select the RefreshEvery __ Minutes check box. In the drop-down list, choose or type the number ofminutes between refreshes.
If you want to change the data source to configure or specify different fields to uniquelyidentify your data, you can do so in the Configure Refresh dialog box.
4. If you want to overwrite any changes in shape data values, select the Overwrite UserChanges To Shape Data check box. For example, if you inadvertently modified someshape data properties, selecting this check box pulls the data from the data source andfills in the shape data properties. With the check box cleared, the modified valuesremain in the shape data despite the refresh.
5. Click OK to close the dialog box, sit back, and let automatic refresh run.
Resolving ConflictsWhen Visio can’t uniquely identify shapes and records, or rows of data have been deleted, theRefresh Conflicts Task Pane appears, because Visio can’t resolve these conflicts on its own. As illus-trated in Figure 10-4, the Refresh Conflicts Task Pane presents options for the conflicts that it finds.
n Rows of data were deleted — If records in the data source were deleted, the shapes thatcorrespond to those records appear in the Refresh Conflicts list. The choice boils down todeleting the shapes that have no corresponding records or keeping them — a better idea ifyou think the records were deleted in error. To process one shape, select it in the list andthen click either Delete Shape or Keep Shape. To process all the shapes at once, clickDelete All Listed Shapes or Keep All Listed Shapes.
n Data that can’t be uniquely identified — If Visio couldn’t match some of the shapes andrecords, you won’t see the link icon in the External Data Window and the shapes won’tdisplay the data from the data source. To link shapes and records, you can drag a row inthe data source onto a shape. The alternative is to make sure that the shapes and recordshave all the information required to match them up.
The Refresh Data command on the Data menu is grayed out in two situations. If you didnot use Data Link to attach data to a diagram, you can’t refresh the data with the
Refresh Data command. Instead, you must use the same feature that you used to initially import thedata, such as the Database Wizard or one of the import commands on a template menu. To refreshdata on a PivotDiagram, choose PivotDiagram ➪ Refresh Data.
NOTENOTE
NOTENOTE
209
Linking Shapes with Data 10
15_109960 ch10.qxp 2/20/07 11:09 AM Page 209

FIGURE 10-4
The Refresh Conflicts Task Pane lists conflicts it finds and includes buttons for specifyingthe action you want to take.
Visualizing Data with Data GraphicsIf you’ve watched a few crime movies, you know that one of the best ways to obscure informationis to provide too much of it — demonstrated so craftily by cinematic legal teams delivering truck-loads of records to their opposition. Yet, one of the reasons you use Visio is to communicate infor-mation effectively. So, what do you do when you have lots of information to convey and want tomake sure your message gets through? In Visio 2007 Professional, Data Graphics help solve thispredicament.
Data Graphics are a combination of text, graphics, and formatting that can turn tedious text intotelling images. For example, the length of progress bars quickly conveys differences in cost, duration,and other values. Likewise, up and down arrows effectively communicate increasing or decreasingtrends. And, if you want to identify which aspects of a project are on track or falling behind, iconssuch as green check marks, yellow caution signs, and red flags usually get people’s attention.
Data Graphics can show information in four basic ways, but your choices within each are almostunlimited:
210
Integrating Visio DrawingsPart II
15_109960 ch10.qxp 2/20/07 11:09 AM Page 210

n Text callout — This callout simply displays data values as text, although Data Graphicscan format the text to make it stand out. For example, if you want to show the resourcesresponsible for each process in a TQM diagram, a Data Graphic with a text callout canplace the value from the Resource shape data property anywhere around the shape withyour choice of formatting. For example, you can display the text with a simple underlineor place it in a bubble, oval, or type of filled area (shown at the top of Figure 10-5).
n Data Bar callout — A data bar communicates data values visually by altering the calloutto reflect the data value. For example, you can show relative values with data bars thatlengthen or shorten based on the data values, illustrated in the second row of Figure 10-5.A Progress Bar shows a box and indicates progress by filling in part of the box. Similarly,you can choose a Speedometer to see the needle move as values change or a Thermometer,which pushes the mercury higher as values increase.
n Icon Set callout — With an icon set, the callout displays different icons based on condi-tional statements. For example, you could add stoplights to steps in a process to indicatewhether quality results are acceptable, as shown in the third row of Figure 10-5. If thequality is within bounds, the green stoplight icon appears. If the number of defects is lessthan 10% over the limit, the yellow stoplight appears. Any other values make the redstoplight appear. Stoplights play a big part in the built-in icon sets, but you can alsochoose from flags, arrows, smiley faces, and more.
n Color By Value — The fourth method of displaying data isn’t a callout. Color By Value,as its name implies, applies color formatting directly to shapes based on how valuesmatch the conditional formatting criteria. For example, instead of using a stoplight iconset, you could turn entire Process shapes green, yellow, or red depending on their defectrates, as illustrated in the bottom row of Figure 10-5.
Data Graphics BasicsA Data Graphic is a collection of specialized shapes designed for displaying data, including thethree different types of callouts (Text, Data Bars, and Icon Sets) and Color By Value criteria. Ashape on a drawing can have only one Data Graphic at a time. However, if you want to show sev-eral different types of callouts and Color By Value on the same shape, you can add them all to asingle Data Graphic and apply it to the shape.
Data Graphics are designed to display data stored in shape data, so they won’t displayanything unless the shapes you apply them to contain at least one shape data property.
When you apply a Data Graphic to a shape on a drawing page, the original shape and the shapeswithin the Data Graphic become a group. You can see this clearly by trying to select a callout in aData Graphic. The first time you click the callout, Visio selects the original shape. The secondtime you click, the handles on the callout appear, indicating that the callout shape is subselected.Because the original shape and the Data Graphic belong to the same group, when you move, copy,or delete the original shape, the Data Graphic follows along.
NOTENOTE
211
Linking Shapes with Data 10
15_109960 ch10.qxp 2/20/07 11:09 AM Page 211

FIGURE 10-5
Data Graphics can turn textual data into visual cues or make values stand out.
You can control the appearance of a Data Graphic in several ways. By combining these different set-tings, you can quickly display data in numerous ways. Here are the modifications you can make toData Graphics:
n Add additional callouts or Color By Value criteria — A Data Graphic can contain sev-eral items, including the different types of callouts and Color By Value criteria. You canadd more items to a Data Graphic, for example, to show the assigned resource as a textfield, the duration as a progress bar, the change in duration as an icon, and the cost com-pared to budget as a color. You can also delete items or change the order in which theyappear.
n Specify the type of callout — When you add an item, you choose Color By Value or thetype of callout for that item. For each type of callout, you can also choose the appearanceof the callout, for example, bar, progress bar, or speedometer, for a Data Bar callout.
Color by value
Text callouts
Two types of data bar callouts
Two different icon sets
212
Integrating Visio DrawingsPart II
15_109960 ch10.qxp 2/20/07 11:09 AM Page 212

n Position the callout — For each callout, you can tell Visio where to place it within oraround the original shape. For example, you can position callouts above or below, tothe left or right, inside or out — on any side of the shape. By default, Visio places all theitems in one location on the shape, but you can position each one in a different spot.
n Choose the shape data property that the callout presents — Each callout can repre-sent a different shape data property. For each callout or Color By Value rule, choose thefield to display.
n Specify the callout details — Each type of callout has its own set of details, such as theMinimum Value and Maximum Value for a Data Bar.
n Display a border — You can tell Visio to place a border around the items at the defaultposition within the Data Graphic.
n Hide shape text — Because Data Graphics often duplicate the data that already appearsin the text blocks of shapes, you can tell Visio to hide shape text when a Data Graphic isapplied.
Despite all the different looks and fancy formatting you can achieve, the great thing about DataGraphics is that Visio takes care of the hard-core formatting for you. Your job is to choose the typesof callout and the conditions under which the callouts appear.
Adding a Data Graphic to ShapesIf you use Data Link to associate shapes to data records, Visio applies a basic Data Graphic to theshapes you link to external data. Whether you want to edit the Data Graphics that Data Link addsor apply Data Graphics of your own, the Data Graphics Task Pane is home base.
If the Data Graphics Task Pane isn’t visible, choose View ➪ Task Pane. Then, in the TaskPane, click the title bar down arrow and choose Data Graphics. You can also display the
Data Graphics Task Pane by choosing Data ➪ Display Data on Shapes.
To apply a Data Graphic to a shape, do the following:
1. On the drawing page, select the shape or shapes to which you want to apply a Data Graphic.
2. In the task pane, click the thumbnail of the Data Graphic you want (or the one that’s clos-est to what you want). Initially, Visio displays a few basic Data Graphics with differenttypes of callouts. As you edit these or create new Data Graphics, their thumbnails alsoappear in the task pane, as shown in Figure 10-6.
3. To edit the Data Graphic, for example, to choose the shape data fields to display, right-click the Data Graphic and, from the shortcut menu, choose Edit Data Graphic.
4. In the Edit Data Graphic dialog box, make any changes you want, such as the shape datafield or the settings for the callouts, as described in the next section, Configuring DataGraphics. Click OK to close the Edit Data Graphic dialog box.
TIPTIP
213
Linking Shapes with Data 10
15_109960 ch10.qxp 2/20/07 11:09 AM Page 213

FIGURE 10-6
The Data Graphics Task Pane displays thumbnails of the Data Graphics that you’ve usedrecently. You can edit these or create new ones.
5. In the Data Graphics Task Pane, right-click the Data Graphic again and, this time, fromthe shortcut menu, choose Apply to Selected Shapes. The Data Graphics appear on all theselected shapes on the drawing page.
If you always use the same Data Graphics for specific shapes, you can create a masterthat includes the Data Graphic. Then, when you drag the master onto the drawing page,
the Data Graphic is already in place. To create a master with a built-in Data Graphic, apply theData Graphic to a shape on the drawing page and then drag that shape onto an editable stencil. SeeChapter 32 for instructions on adding shapes to stencils.
Configuring Data GraphicsEven if you use one of the Data Graphics that Visio provides out of the box, there’s always sometweaking you have to do. At the very least, you have to tell Visio which shape data properties youwant to highlight with the Data Graphic. You can choose which callout best illustrates the data orspecify settings that control the appearance of the callout. Whether you want to make a simpleedit or configure a Data Graphic of your very own, the configuration steps are almost identical.
Here are three ways to get started configuring Data Graphics:
n Edit an existing Data Graphic — If you want to make changes to an existing DataGraphic, in the Data Graphic Task Pane, right-click the thumbnail for the Data Graphicand, from the shortcut menu, choose Edit Data Graphic. The Edit Data Graphic dialogbox appears, showing the items currently set within the Data Graphic.
TIPTIP
214
Integrating Visio DrawingsPart II
15_109960 ch10.qxp 2/20/07 11:09 AM Page 214

n Base a new Data Graphic on an existing one — In the Data Graphics Task Pane, right-click the existing Data Graphic and, from the shortcut menu, choose Duplicate. A newData Graphic thumbnail appears at the bottom of the task pane. Right-click the new DataGraphic thumbnail and, from the shortcut menu, choose Edit Data Graphic to open theEdit Data Graphic dialog box. The items and settings from the duplicated Data Graphicappear.
n Create a brand new Data Graphic — If you’re convinced that it’s easier to start fromscratch, in the task pane, click New Data Graphic. The New Data Graphic dialog boxappears, which is identical to the Edit Data Graphic dialog box except for the title andthe empty item list. You must add callouts and Color by Value criteria, as described in thefollowing sections.
Working with Items in a Data GraphicIn the Data Graphic universe, callouts and Color By Value criteria are know as items. Whether theNew Data Graphic dialog box or the Edit Data Graphic dialog box (shown in Figure 10-7) is open,you can add new items to a Data Graphic, edit or delete existing items, or change the order inwhich they appear:
FIGURE 10-7
The New Data Graphic dialog box and the Edit Data Graphic dialog box are almost identical and let youadd, edit, delete, or rearrange Data Graphic callouts.
n Create a new item — In the dialog box icon bar, click New Item, and, in the drop-downmenu, choose the type of callout you want (Text, Data Bar, Icon Set, or Color By Value).A dialog box for creating that type of item appears, for example, the New Data Bar dialogbox, if you chose Data Bar.
n Edit an existing item — In the dialog box, click the row for the item you want to editand then, in the dialog box icon bar, click Edit Item. A dialog box for editing that type ofitem appears, for example, the Edit Icon Set dialog box, if you selected an item that usesan icon set.
215
Linking Shapes with Data 10
15_109960 ch10.qxp 2/20/07 11:09 AM Page 215

n Delete an existing item — In the dialog box, click the row for the item you want todelete and then, in the dialog box icon bar, click Delete. Visio doesn’t bother with arequest for confirmation and simply deletes the item. If you change your mind, pressCtrl+Z or click Cancel.
n Rearrange items — If you position each item in a different place around the shape,rearranging doesn’t do anything for you. However, if you place all the items in the samelocation, you can determine the order in which they appear. Select an item and then, inthe dialog box icon bar, click the up arrow or down arrow to place the item in the orderyou want.
Specifying the Default Position and Hiding Shape TextA few settings apply to the overall Data Graphic rather than the items within the Data Graphic.Here are the settings that appear in the New Data Graphic or Edit Data Graphic dialog boxes andwhat they do:
n Choose the default position — At the bottom left of the dialog box is the DefaultPosition area, which includes drop-down lists for specifying where the Data Graphicsitems appear by default. The Default Position makes it easy to collect every item at thesame place relative to the original shape. When you create a new item, Visio automati-cally sets the position to the default, unless you choose to change it. You can specify thehorizontal and vertical positions in the drop-down lists of the same names. The entriesencompass seven positions, for example, Far Left, Left Edge, Left, Center, Right, RightEdge, and Far Right, for horizontal. These positions begin outside the shape on the leftand move across until the position is outside the shape on the right, as illustrated by theicons that precede each entry.
Take care in choosing the location of your items. If you place them inside the shape,they might overlap text within the shape. If connectors tend to attach at the top and
bottom of shapes, placing the items on the sides or at the corners keeps them in view.
n Add a border — Because many Data Graphics group callouts in one place, you can drawa border around all the items at the default position. Select the Show Border AroundItems At Default Position check box.
n Hide shape text — If the text in the shape text block duplicates text that you display in aData Graphic, you can hide the shape text while the Data Graphic is attached to theshape. Select the Hide Shape Text When Data Graphic Is Applied check box.
Specifying the Settings Common to All Types of CalloutsWhether you choose a text callout, a data bar, or an icon set, you choose the shape data field toshow, the style of callout, and where you want it relative to the parent shape. Color By Value fills inthe parent shape with a color, so it only requires a data field.
To configure a callout, in the Edit Data Graphic or Create Data Graphic dialog box, either select anexisting callout and click Edit Item, or choose New Item and then choose the type of callout you
TIPTIP
216
Integrating Visio DrawingsPart II
15_109960 ch10.qxp 2/20/07 11:09 AM Page 216

want (or Color By Value). The settings are the same whether you are editing an existing callout ordefining one from scratch.
In the dialog boxes for creating or editing items, choose settings in the following fields:
n Data Field — The Data Field is the setting you’re likely to change most often. The drop-down list includes all the shape data fields associated with the shapes on the drawingpage, but you can also choose More Fields to specify other shape data fields, page anddocument fields, user-defined properties, or custom formulas.
n Callout — In the drop-down list, choose the style of callout. For text callouts, the pre-views in the Callout drop-down list show a shaded area where the label and value appear.Some of the styles show only the data value, such as the headings, circles, and triangles.To show the shape data field name and its value, look for a callout that has two shadedareas, such as Bubble callout. The previews for data bars and icon sets help you choosethe style you want.
n Position — To group callouts in one place, make sure the Use Default Position check boxis selected, and the callout appears at the default position you chose for the entire DataGraphic. To position a callout somewhere else, clear the Use Default Position check boxand then, in the Horizontal and Vertical drop-down lists, choose the position you want.
Emphasizing Textual Data with Text CalloutsA text callout takes a value from a shape data property and displays it in the vicinity of the parentshape. If seeing the data values is essential, a text callout can make them stand out from the othertext on the drawing. If you’ve used the Label Shapes add-on, a text callout is the same basic ideawith the addition of a dialog box for specifying the position of the text and the callout style, whichin turn applies several types of formatting automatically.
To configure a text callout, in the Edit Data Graphic or Create Data Graphic dialog box, eitherselect an existing text callout and click Edit Item, or choose New Item ➪ Text Callout. The settingsfor a text callout, shown in Figure 10-8, are the same whether you are editing an existing text call-out or defining one from scratch.
The settings in the Details table vary depending on the type of text callout you choose. For textcallouts, Value Format controls how the value looks, for example, showing a number as a percent-age or the format for the date and time. Other settings control the border, fill, offset from theselected position, the label position, and the label value.
Visualizing the Magnitude of Numbers with Data Bar CalloutsData bars are great for visually communicating magnitude, for example, the percentage completeon a project task, the number of support calls for a category, or the customer satisfaction rating fora product. Data bars come in several dramatically different styles. Simple bars show a value visu-ally, whereas progress bars show a value relative to the maximum value, which is perfect for show-ing percentages. Star ratings, thermometers, and speedometers are other styles of data bars thattransform numbers into interesting visual cues.
217
Linking Shapes with Data 10
15_109960 ch10.qxp 2/20/07 11:09 AM Page 217

FIGURE 10-8
Configuring a text callout is a matter of choosing settings and values in a dialog box.
The settings in the Details section shown in Figure 10-9 are the same for most Data Bar callouts.The Multi-bar Graph and Stacked Bar styles have extra settings for assigning multiple shape datafields to the callout. Here are the common settings and what they do:
n Minimum Value — The default for minimum is zero. However, if data values are within arange, assign the lower end to the Minimum Value field.
n Maximum Value — The default for maximum is 100, which sets data bars up perfectlyfor percentages. Otherwise, assign the highest value to the Maximum Value field. Whenyou specify the maximum value for a data bar and a shape data value comes in largerthan the maximum, the bar grows no farther than the maximum value.
If you work with percentages, be sure to omit the percentage sign from your shape datavalues. Otherwise, the data bar displays the maximum value.
n Value Position — If you want the data bar to hide the value, choose Not Shown.Otherwise, choose from Left, Right, Top, Bottom, or Interior to specify where the datavalue appears relative to the data bar.
n Value Format — Choose a format from the drop-down list to control how the value looks.
n Label Position — If you want the data bar to hide the label, choose Not Shown.Otherwise, choose from Left, Right, Top, Bottom, or Interior to specify where the labelappears relative to the data bar.
CAUTION CAUTION
Data field and callout style
Additional settings Callout position
218
Integrating Visio DrawingsPart II
15_109960 ch10.qxp 2/20/07 11:09 AM Page 218

n Label — [Default] appears in this field initially and indicates that the name of the shapedata field appears as the label. If you want to use a different label, type the text in the cell.
n Callout Offset — This setting is helpful if none of the callout positions are quite whatyou want or the callout overlaps a portion of the shape outside its alignment box. You canoffset the callout to the left of right, or leave it at the designated position.
FIGURE 10-9
Configuring a data bar callout is a matter of choosing settings and values in a dialog box.
Showing Conditions with Icon Set CalloutsUnlike data bars, icon set callouts highlight numeric or text values that satisfy conditions. Whetheryou use colored flags, traffic signals, smiley faces, or other icons, an icon set callout displays an iconbased on the rules you define. For example, if your company has set goals for accuracy on orders,you can show a green traffic light when the numbers exceed the goal, a yellow traffic light if thenumbers are just short, and a red traffic light if the numbers are below the acceptable minimum.
As illustrated in Figure 10-10, a Rules For Showing Each Icon section appears for icon set calloutswith a rule for each icon in the set. If you don’t want to use all the icons in the set, in the icon’s testdrop-down list, choose [Not Used], as shown in the last icon in Figure 10-10.
If you use conditional formatting in Microsoft Excel, the way icon sets work should be familiar.Visio tests the shape data value against the first rule you define. If the value passes the test, the firsticon appears. If the value doesn’t pass the test, Visio checks it against the second test, and so onuntil it passes. The icon for the test that the value passes is the one that you see.
Shape data value
Maximum value
219
Linking Shapes with Data 10
15_109960 ch10.qxp 2/20/07 11:09 AM Page 219

FIGURE 10-10
For icon set callouts, you must define a rule for each icon you want to display.
You have to build rules carefully or icons won’t display the way you expect. For example, if youhave two “if less than” tests, you must test for the smallest value first. If you test for values less than10 before you test for values less than 5, the second test never gets a chance to execute. Anotherpotential flaw in tests is not covering every value that occurs. For example, suppose you want totest for values less than 5, less than 10, and then all other values. Be sure to use “is greater than orequal to” in the third test. If you use “is greater than,” none of the tests pass for the value 10.
If you’re feeling energetic, you can develop your own callouts and icon sets for DataGraphics. Read the Building Custom Data Graphics for Visio 2007 article at http://
msdn2.microsoft.com/en-us/library/aa468596.aspx to learn about customizing call-outs and creating new icon sets.
Color-Coding Shapes with Color By Value CriteriaColor-coding shapes changes the fill color of the shapes based on their shape data values. Color-coding comes in two different styles:
n Each color represents a unique value — This approach is ideal when you want toshow all the shapes with the same value in the same color, such as the highlighting all theoffices occupied by the accounting department with green.
CROSS-REFCROSS-REF
Position
Rule that value must pass for icon to appear
220
Integrating Visio DrawingsPart II
15_109960 ch10.qxp 2/20/07 11:09 AM Page 220

n Each color represents a range of values — For values that cover a range, you canchoose colors for each range. For example, you might use colors that go from pale greento emerald depending on the revenue for different product lines. However, you can alsochoose different colors for each range, for example, blue, green, yellow, orange, and redto represent different levels of drought.
In the New Color by Value dialog box or Edit Color by Value dialog box, in the Coloring Methoddrop-down list, choose one of the following:
n Each Color Represents A Unique Value — The Color Assignments area shows all theunique values in the drawing and assigns a fill color and text color to each value. If youwant to use different colors or text colors, click the arrow for that entry and choose a color.
n Each Color Represents A Range Of Values — The Color Assignments area divides thevalues into equal ranges and assigns a gradually lighter fill color to each range as well as atext color to each range. If you want unequal ranges or any other customized range, typethe minimum and maximum values in the Value 1 and Value 2 boxes. To choose a differ-ent color for the scheme, choose a different color for the first range only. Visio adjusts theremaining colors to lighter shades of the first color. If you want completely different col-ors for each range, select a color for each range.
Using the Visio Database Add-ons to LinkDrawings and DatabasesAlthough the new Data Link feature simplifies several aspects of linking data and drawings, thedatabase features available in earlier versions of Visio are still around — and they still have value.The Data Link feature is a one-way street from data records to Visio shapes. If you want to set up
221
Linking Shapes with Data 10
Copying Data Graphics Between Files
Data Graphics reside in the drawing in which you create them. However, you can share themwith others or use them in other drawings that you create. The easiest way to reuse Data
Graphics is to create a Visio template that includes the stencils you use for the type of diagram andthe Data Graphics that you typically apply. When you create a new drawing with that template, theData Graphics appear in the Data Graphics Task Pane. See Chapter 31 for instructions on creatingtemplates.
To copy a Data Graphic from one drawing to another, apply the Data Graphic to a shape in the cur-rent drawing. When you copy the shape and paste it into another drawing, Visio copies the DataGraphic definition and the callouts it uses to the second drawing. The Data Graphic becomes a partof the second drawing, even if you delete the pasted shape.
15_109960 ch10.qxp 2/20/07 11:09 AM Page 221

two-way communication between your drawings and data sources, the Database Wizard and itsrelatives are the way to go.
By using the Database Wizard to link your Visio drawings to databases, you can update Visio draw-ings to show the current values in your databases or push changes made in Visio drawings to thecorresponding records in your database. You can use either the Database Wizard, Link to ODBCDatabase, and other add-ons within the Visio Extras category to perform the following database-oriented tasks:
n Link shapes to records in databases
n Create Visio drawings that represent the data in database tables
n Create masters linked to database records
n Export Visio Shape Data to database records
n Synchronize shapes and database records
Understanding Two-Way Links BetweenShapes and DatabasesWhen you use Data Link to connect shapes and database records, the values from the databasecome over and sit in shape data properties. When you refresh the data, the Data Link takes care ofthe links for you and brings across updated values from the data source to the shape data. The two-way links you can build with Visio add-ons aren’t as transparent, so it’s helpful to understand howVisio keeps track of what goes where. In essence, Visio links shape data properties directly to fieldsin database records.
Similar to the setup for Data Link, two-way connections use a data source to connect Visio drawingswith databases. Whether you use the Database Wizard, Link to ODBC Database, Export to Database,or Database Export Wizard add-ons, you can choose an existing DSN or create a new one.
Each shape in a drawing corresponds to a single record (or row) in a database table, and eachlinked field in the record corresponds to one property in the shape, which you can see via theShapeSheet. With a link between a shape property and a database field, you can change the valuein the property to update the field, or vice versa.
Although the most common link is between shape data and database fields, you can link otherproperties as well. For example, you can propagate equipment dimensions in a database table tothe properties that define a shape’s size. If a shape doesn’t have properties suitable for linking toyour database fields, the Database Wizard or Link to ODBC Database add-ons can create newshape data properties for that purpose.
222
Integrating Visio DrawingsPart II
15_109960 ch10.qxp 2/20/07 11:09 AM Page 222

When a shape is linked to a database, you can see the connection in the User.ODBCConnectioncell in the User-Defined Cells section of the ShapeSheet. The connection is a concatenation ofseveral lines of text separated by vertical bars. By separating the lines, you can see the componentsof the connection string:
ODBCDataSource=Visio Database SamplesODBCQualifier=C:\Program Files\MicrosoftOffice\Office12\1033\DBSAMPLE.mdbODBCTable=Airplane - Filled Seats1SeatNumber=Prop.SeatNumber5Baggage=Prop.Baggage=32Class=Prop.Class=0FrequentFlier=Prop.FrequentFlier=0PassengerName=Prop.PassengerName=0TicketPrice=Prop.TicketPrice=111
Here’s how the components of the connection string translate in more human-friendly terms:
n ODBCDataSource=<name> — A simple text name for the data source to which theshape links. The example uses a sample data source installed with Visio.
n ODBCQualifier=<name> — This parameter specifies the direct path to the database towhich the shape links.
n ODBCTable=<name> — This is the table to which the shape links.
n <number> — The fourth line in the example represents the number of key fields youspecified to identify records. The example uses only one key field.
n <Field Name>=<name> — The fifth line in the example identifies the key field in thedatabase and the ShapeSheet cell used to store the key.
n <number> — The sixth line in the example represents the number of database fieldslinked to shape data. In the example, five fields are linked.
n <Field Name>=<name>=<number> — For each field linked to shape data, the connec-tion string identifies the linked field name and the ShapeSheet cell name to which it islinked. The number at the end of the line represents the constant for the Evaluate As set-ting. For example, 0 represents Value, whereas 111 represents Currency.
223
Linking Shapes with Data 10
15_109960 ch10.qxp 2/20/07 11:09 AM Page 223

Creating Connections to Data SourcesEach of the Visio database add-ons includes the ability to create a data source. If you want tocreate a data source as a stand-alone step, from the Windows Start menu, choose Control Panel ➪
Administrative Tools ➪ Data Sources (ODBC) and follow the steps in the ODBC Data SourceAdministrator dialog box.
The steps for defining data sources in the various Visio database add-ons are similar. The followingsteps use the Link to ODBC Database add-on as an example:
1. Choose Tools ➪ Add-ons ➪ Visio Extras ➪ Link to ODBC Database.
2. In the Link to Database dialog box, click Create. This button is grayed out if no drawingis open.
3. In the Create New Data Source dialog box, choose one of the following options for typeof data source and then click Next:
n File Data Source — This option creates the most flexible data source. You can copy itto other computers or network locations and any user who can reach the data sourcecan use it.
n User Data Source — This option is the most limited, because it applies only to thecurrent computer and is visible only to the current user.
n System Data Source — This option creates a data source available only on the currentcomputer but accessible to any user who logs on to the system.
224
Integrating Visio DrawingsPart II
Limitations of Database Links
Links between Visio shapes and tables in databases have the following limitations:
n String Length — Visio cells and fields can hold up to 64K for strings.
n Binary Field Length — Visio cells and fields can hold up to 32K for ODBC binary fields.
n Precise Numbers — Visio stores numeric values as double floating-point numbers, trun-cating numbers with greater precision to 17 significant digits.
n Database Key Field — A field of the SQL_TIMESTAMP type can’t be a primary key.
n ID Replication — You can’t update replication IDs in Microsoft Access.
n Timestamps — You can’t update Timestamp fields when you use an Informix database.
n Row Deletion — You can’t delete rows in Excel when you use the Excel ODBC driver. TheDatabase Wizard indicates deleted rows by setting text fields to #ROW DELETED# andnumeric fields to 0. For wizard operations, such as Update, Select, and Refresh, the val-ues 0 and #ROW DELETED# are invalid keys.
15_109960 ch10.qxp 2/20/07 11:09 AM Page 224

4. In the Driver list, select the 32-bit ODBC driver that matches your data source, such asExcel, Access, or SQL Server. Click Next.
If your data source is a specialized database, click Advanced. You can type keywordsand values that your database driver uses in the box.
5. In the next screen, specify the location and name for the data source. Because the func-tionality of ODBC drivers varies, it’s a good idea to include the type of data source in thename, along with a brief description of the data, such as Employees_Excel2007. Afteryou specify the location and name for the data source, click Next and then click Finish.
By default, Visio creates data sources in C:\Program Files\Common Files\ODBC\Data Sources. Unless you have a reason for storing data sources elsewhere,
the default location has the added benefit of displaying all its data sources in the list of available datasources. If you don’t see your data source in the list of available data sources, click Browse and navi-gate to the location of your data source.
6. Depending on the type of data source you’re creating, there is some final cleanup toperform:
n Access data source — In the ODBC Microsoft Access Setup dialog box, click Select tospecify an existing database for the DSN. Select the database file you want to use andclick OK. For example, to use the sample database included with Microsoft Office,in the Select Database Dialog box, navigate to C:\Program Files\MicrosoftOffice\Office12\1033\DBSAMPLE.mdb. In the Database Name list, selectNorthwind.mdb, and click OK. The ODBC Data Source Administrator creates thedata source and adds it to the list of available data sources.
n Excel data source — You must specify the version of Excel and then select the Excelworkbook. After you select the file to use, click Options and clear the Read Onlycheck box. In the Database Wizard on the Choose a Database Object to Connect toscreen, you can create tables in Excel files by clicking Define Table. Visio stores tablescreated in Excel 5.0 or later as separate worksheets in the Excel file and creates anamed range for the records.
When you finish these steps, in the Link to Database dialog box, the Name box shows the datasource name and the Qualifier box shows the path and file name.
To use an Excel workbook as a data source, you must create a named range in a work-sheet that includes all the rows and columns of data. Visio uses the values in the first
row of the named range as table column names.
Linking Drawing Shapes to Database RecordsThe Database Wizard and the Link to ODBC Database add-ons both create links between yourdrawing and database records. For example, if you have a furniture plan in Visio, you can link thefurniture shapes to records in a facilities management database. The Database Wizard feeds yousteps one at a time, whereas the Link to ODBC Database add-on provides the tools you need tocreate a link in one dialog box.
CAUTION CAUTION
NOTENOTE
NOTENOTE
225
Linking Shapes with Data 10
15_109960 ch10.qxp 2/20/07 11:09 AM Page 225

You can link Visio shapes with a database without a database application installed onyour computer. However, if you want to open the database directly to edit its records,
you must have the corresponding database application installed.
To link shapes using the Link to ODBC Database add-on, follow these steps:
1. Select the shapes you want to link to a database and then choose Tools ➪ Add-Ons ➪
Visio Extras ➪ Link to ODBC Database.
2. In the Name drop-down list, choose the data source. If you select Excel Files as the datasource, select the Excel file (.xls) that you want to use in the Select Workbook dialog box,clear the Read Only check box, and click OK.
If your data source is absent in the Name drop-down list, don’t worry. Click Browse,navigate to your data source folder, and select the data source. For example, to use
the sample database included with Office, in the File Open dialog box, navigate to C:\ProgramFiles\Common Files\ODBC\Data Sources, select the data source file you want, and clickOpen. You can click Create to create a new data source, as described in “Creating Connections toData Sources” in this chapter.
3. If you can access multiple databases through your data source, in the Qualifier drop-downlist, select the database you want to use. To filter the list of tables to those for a specificowner, in the Owner drop-down list, select an owner. For data sources with single databases,the Qualifier box shows the database path and name, and the Owner box is set to All Users.
4. In the Table/View list, select the database table you want to use. For Excel data sources, theTable/View list shows the worksheets within the Excel workbook. The Field Links sectiondisplays the fields in the data source as well as the cells in the ShapeSheet for the values.
You can create a new table or worksheet in the data source by clicking New.
5. If you want to change the default mapping between database fields and ShapeSheet cells,select a field and click Modify. Select the new ShapeSheet cell. If you want to change thedata type for the field, select a type in the Evaluate As drop-down list. If you want to usea field as the primary key, select Yes in the Key drop-down list.
Click Add or Delete to create new links or delete existing links between fields and cells.
6. Click OK to create the links.
7. To associate a shape on a drawing to a specific record in the table in the data source,right-click the shape and choose Select Database Record. In the Key Value list, select therecord you want and click OK to insert the record values into the linked ShapeSheet cells.
Linking Masters to DatabasesBy linking masters to database records, you can add shapes already set up with links to correspon-ding database records to drawings. This is useful when a master always uses the same databaserecord, for example, to pull model information, such as manufacturer, model, cost, and color, from acatalog database. When you drag a master onto the page, the shape data is automatically populated.
NOTENOTE
NOTENOTE
NOTENOTE
NOTENOTE
226
Integrating Visio DrawingsPart II
15_109960 ch10.qxp 2/20/07 11:09 AM Page 226

What about masters that link to a database when each instance on a drawing page links to a differ-ent record? You can also create masters that link to any database record. When you drag the masteronto the drawing page, the link to the database is in place, but you have to choose the record towhich you want to link.
Generating Masters from Each Database RecordIf you want to create a stencil of masters that link to a database, the Database Wizard is the add-onto use. To generate masters from a database table, follow these steps:
1. Choose Tools ➪ Add-Ons ➪ Visio Extras ➪ Database Wizard. Click Next on the first screen.
2. Choose the Generate New Masters from a Database option and click Next.
3. In the Stencil box, select the stencil that contains the Visio master that you want to use asthe basis for new masters. The Stencil drop-down list displays the stencils that are open.If you want to choose another stencil, click Browse, and select the stencil.
4. In the Masters list, choose the master and click Next. For example, if you want to createa stencil of chairs from your catalog database, you might choose a furniture stencil andthen a chair master.
5. Continue through the wizard to select the data source, the table, and the primary key.
6. In the Choose the Database Link and Naming Options screen, select the Keep DatabaseLinks in New Masters check box. This setting creates a bi-directional link between thedatabase and the masters. Select an option to either generate master names based on thevalues in the primary key field or on the original Visio master name. Click Next.
If the master you use doesn’t show shape data in text fields, it’s easier to identify themaster you want when you name the master using the primary key.
7. In the Events and Actions screen, review the settings that Visio selects by default andchange any, if needed. The default settings work for most situations. Click Next.
8. Specify the cell in which you want to store the primary key field value and click Next.
9. In the next screen, you see a list of cells in the master ShapeSheet and fields in the database.To create links, click a ShapeSheet cell and then a database field, and click Add. If thenames are the same in both lists, click Automatic. When the links are set up, click Next.
10. To choose the stencil for the new masters, select either the Create A New Stencil option orthe Append To An Existing Stencil option. For an existing stencil, select the name or clickBrowse. Click Next.
11. Click Finish.
Linking Masters to Specific RecordsWhen you want every instance of a master to use the same information, you can link masters to spe-cific records in an existing database table. Perhaps the easiest way to create a master linked to a recordis to create a link between a shape on a drawing page and a database record (by right-clicking theshape, and from the shortcut menu, choosing Select Database Record). Then drag the linked shapeonto an editable stencil.
NOTENOTE
227
Linking Shapes with Data 10
15_109960 ch10.qxp 2/20/07 11:09 AM Page 227

You can also link a master directly. Edit the master, as described in Chapter 34. Use the Link toODBC Database add-on to link the master to a data source. Then, in the master drawing window,right-click the master and choose Select Database Record to specify the record for that master.
Creating Masters That Link to Any Database RecordTo create a master that can link to any record in a database table, follow these steps:
1. Choose Tools ➪ Add-Ons ➪ Visio Extras ➪ Database Wizard. Click Next on the firstwizard screen.
2. Select Link Shapes to Database Records and click Next.
3. Select the Master(s) on a Document Stencil option to link masters specific to a drawing, orMaster(s) on a Visio Stencil to link masters that you can use on any drawing. Click Next.
4. Select a document stencil or click Browse to select a Visio stencil or one of your customstencils. By default, Visio opens the File Open dialog box at the My Shapes folder.
5. Choose the master you want to link and click Next.
6. Continue through the Database Wizard screens to select a data source, the table to whichyou want to link, the primary key, events and shape shortcut menu commands, and theShapeSheet cell that holds the primary key value.
7. On the Link ShapeSheet Cells to Database Fields screen, click a ShapeSheet cell in theCells list, click the corresponding database field in the Database Fields list, and then clickAdd. Visio adds the shape-field link in the Links list. When the links you want exist,click Next and then click Finish.
Creating Drawings from Database RecordsThe Database Wizard has one additional trick up its sleeve. It can generate a Visio drawing thatcontains a shape for each record in an existing database table. For example, if you have a databaseor spreadsheet that delineates the computer equipment you’re going to install at a client site, youcan use the Database Wizard to create a layout drawing with shapes linked to each record. Thenyou can move the shapes into the layout you want.
To create a drawing based on a database table, follow these steps:
1. Follow the steps in the preceding section to create a master that links to the databasetable you want to use to generate the drawing.
2. Choose Tools ➪ Add-Ons ➪ Visio Extras ➪ Database Wizard. Click Next on the firstwizard screen.
3. Select the Create a Linked Drawing or Modify an Existing One option and click Next.
4. Select the Create a Drawing Which Represents a Database Table option and click Next.
5. Select the Create New Drawing option and click Next.
6. Continue through the wizard to select a drawing template, options to use to monitor thedrawing, and information about the data source to use.
228
Integrating Visio DrawingsPart II
15_109960 ch10.qxp 2/20/07 11:09 AM Page 228

If the database table includes data for the x and y coordinates of the shape’s position, besure to clear the Automatically Distribute Shapes on Page check box and the
Automatically Scale the Drawing Page check box.
7. When the Select a Visio Master Shape screen appears, click Browse and navigate to thestencil you saved in step 1. Select the linked master and click Finish to create a newdrawing with an instance of the master for every record in the table.
Keeping Drawings and Databases in SyncWhen you use the Database Wizard or the Link to ODBC Database add-on, you can take advantageof several methods for synchronizing the data between your Visio drawings and linked databases. Forexample, the shortcut menu for each linked shape can contain four commands for maintaining data-base links. In addition, Visio provides several add-ons that help you update many shapes at once.
To update a single shape or database record, right-click a shape and then choose one of the follow-ing commands from the shape’s shortcut menu:
n Select Database Record — Specify the database record to which you want to link theshape.
n Refresh Shape Properties — Replaces the shape’s properties with data from the linkeddatabase record.
n Update Database Record — Replaces the data in the database record with values fromthe shape’s shape data.
n Delete Shape and Record — Removes the shape on the drawing page and the linkedrecord in the data source.
If you want to remove the links to a database while keeping the shapes on a page, run theDatabase Wizard as if you were linking shapes. In the screen in which you select a draw-
ing, a page, and shapes, select the shapes whose links you want to break and then click Remove Links.
If you want to refresh or update all the shapes on a drawing page, use one of the following add-ons:
n Database Refresh — Replaces each shape’s properties with data from its linked databaserecord
n Database Update — Replaces the data in each database record with values from thelinked shape’s properties
Adding Drawing Page Commands to Synchronize ShapesThe Database Wizard can add commands to synchronize links to shape or drawing shortcutmenus. In addition, you can specify what happens when you drop a shape or copy and paste oneon a page. If you use the Link to Database command to link your shapes, you can use the DatabaseWizard later to add synchronizing commands to the drawing page.
NOTENOTE
NOTENOTE
229
Linking Shapes with Data 10
15_109960 ch10.qxp 2/20/07 11:09 AM Page 229

To add shortcut commands to a drawing page, follow these steps:
1. Choose Tools ➪ Add-Ons ➪ Visio Extras ➪ Database Wizard. Click Next on the firstwizard screen.
2. Click the Create a Linked Drawing or Modify an Existing One option and click Next.
3. Click the Add Database Actions and Events to a Drawing Page option and click Next.
4. Select the drawing file and page to which you want to add actions and events and thenclick Next. Select one or more of the following actions or events:
n Refresh Shapes on Page — Adds a command to refresh all shapes on the page withthe data from their linked database records.
n Update Shapes on Page — Adds a command to update the database records withvalues from the shapes on the page.
n Refresh Linked Shapes on Document Open — Each time you open the drawing file,Visio refreshes ShapeSheet cell values to match linked database records for all shapesin the drawing file.
n Periodically Refresh Based on NOW Function — Refreshes ShapeSheet cell values tomatch linked database records for all shapes in the drawing file at the interval speci-fied by the NOW function. When you choose this option, Visio adds commands to thedrawing page shortcut menu to start and stop the continuous refresh.
5. Click Next and then click Finish.
Adding Actions and Events to ShapesBy default, Visio sets Refresh Shape as the default Shape Drop Event. When you select this optionand drop or paste a shape on a drawing page, Visio refreshes the values based on the databaserecord linked to the original shape. If you want to select a different database record when you copya shape, select the Select Record option. When you drag a master onto the page or paste a copy,Visio prompts you to select a database record.
To add or modify the actions and events after you’ve linked your shapes, follow these steps:
1. After you’ve linked the shapes to a database, select the shapes to which you want to addactions and events.
2. Choose Tools ➪ Add-Ons ➪ Visio Extras ➪ Link to Database and click Advanced.
3. Select the actions and events you want and then click OK.
Synchronizing Shapes and Database Records AutomaticallyIf you would prefer to have Visio automatically refresh your drawings, you can have Visio monitorthe database linked to a drawing at a regular interval and refresh the shapes in the drawing withthe values from the linked database records. To refresh shapes automatically, follow these steps:
1. Choose Tools ➪ Add-Ons ➪ Visio Extras ➪ Database Settings.
2. Select the Automatically Refresh Drawing Page check box.
3. In the Refresh Drawing Interval (Secs.) box, type the number of seconds between everyrefresh and click OK.
230
Integrating Visio DrawingsPart II
15_109960 ch10.qxp 2/20/07 11:09 AM Page 230

Exporting Shape Data to DatabasesThe chances are slim that you assemble significant data in Visio that’s not in a database somewhere.However, you might use Visio to input information initially, in which case, you can export shapedata to databases using either the Database Export Wizard or Export to Database add-ons. TheDatabase Export Wizard presents the process in smaller steps and includes an option to export allshapes on a layer. However, if you don’t want to export by layers, you can follow a more stream-lined process by choosing Tools ➪ Export to Database.
To export shape data to a database with the Database Export Wizard, follow these steps:
1. Choose Tools ➪ Add-Ons ➪ Visio Extras ➪ Database Export Wizard and click Next.
2. Select the drawing file that you want to export and then select the page you want toexport and click Next.
3. Click one of the following options for the shapes you want to export and then click Next:
n All Shapes on the Page — This option exports all shapes on the selected page.
n Selected Shapes on the Page — This option exports any shapes you selected beforeyou started the wizard. To select additional shapes, click Select Shapes.
n All Shapes on One or More Layers — Select the layers you want to export in theLayers list to export all shapes on those layers.
4. For each Visio item you want to export, select the item in the Visio Cells and Fields listand click Add. Visio adds the cell or field you chose to the Cells and Fields to Export list.Click Next.
Cell names for shape data begin with Prop. followed by the shape data name. For exam-ple, the cell name for Duration is Prop.Duration.
5. Select the data source to which you want to export and click Next.
6. In the Table Name list, select the table to which you want to export the Visio data. If youwant to create a new table in the data source, type the name of the table in the TableName box.
7. To specify a key to uniquely identify each record, type a name in the Key Field box. Bydefault, the key field is the ShapeID, which is the shape name with a sequential ID gener-ated when you add the shape to a drawing page. To use the GUID as the unique identifier,select GUID in the Key Type drop-down list. Click Next.
If the ODBC driver does not support primary keys, the Make Key Field the Primary Keyfor Table check box is grayed out.
8. To modify the default field mapping that Visio defines, in the Specify the Export MappingDetails screen, select an item in the Visio Data list, modify one or more of the followingoptions, and then click Next:
NOTENOTE
NOTENOTE
231
Linking Shapes with Data 10
15_109960 ch10.qxp 2/20/07 11:09 AM Page 231

n Evaluate Data As — Specify the data type or units for the Visio item.
n Field Name — Modify the field name to use in the export data source.
n Field Type — Modify the field type, which is a broad category such as Number.
9. If you want to re-export data by right-clicking the drawing page, make sure the AddExport Right Mouse Action to the Drawing Page check box is checked.
10. Click Next and then click Finish to export the data.
When you export shape data with the Database Export Wizard, the wizard storesexport-related information with the drawing page. If you want to export the data again
after you have modified the drawing, right-click the drawing page and choose Database Table Export.
Producing ReportsIf you link your Visio drawings to databases, the reporting tools you use with your database man-agement system are more versatile than Visio’s reporting feature, and might even seem easier to use.However, if you keep data only in Visio or aren’t well-versed in your database reporting features,Visio does include predefined reports that you can run to view and analyze the data stored with theshapes in your drawings. Although you can create new reports from scratch, you can also modifyexisting reports to match your requirements and then save the modified report with a new name.
Running Reports with Shape DataWhen you run a report, you can specify how to format the results: as an Excel spreadsheet, as anHTML file to display as a web page, as an XML file, or within a Visio shape. To run an existingreport, built-in or custom, follow these steps:
1. Open the drawing on which you want to report and choose Data ➪ Reports.
2. In the Reports dialog box, select the report. If you don’t see the report in the list, clear theShow Only Drawing-specific Reports check box.
3. Click Run.
Defining Custom ReportsWhen you choose Data ➪ Reports, Visio displays the reports specific to the type of drawing that isactive. To see all report definitions, clear the Show Only Drawing-specific Reports check box. Tocreate a new custom report, you have two methods to choose from:
n In the Reports dialog box, click New to create a report from the bottom up.
n If you want to base your report on an existing report, in the Report list, select the existingreport and click Modify.
TIPTIP
232
Integrating Visio DrawingsPart II
15_109960 ch10.qxp 2/20/07 11:09 AM Page 232

Either way, the Report Definition Wizard steps you through the process of defining a report. Whenyou have completed the report definition, Visio saves your report where you specify and adds itto the list of available reports. As you step through the Report Definition Wizard, you specify thefollowing features of your report:
n The objects on which you want to report
n The properties you want to display in the columns of the report and any criteria you wantto use to limit the results shown in the report
n The format for the report, including how the contents are grouped and sorted and hownumbers are formatted
n The Save options for the report, including the report definition name, a description, andwhere Visio saves the report
The following sections describe how to use the features in each step of the wizard.
Selecting Shapes on Which to ReportThe first step to defining a report is to choose the shapes to scan. You can report on every shape inyour drawing file, the shapes on the current page, or only selected shapes.
In the Advanced dialog box, you can define multiple criteria that shapes must meet for inclusion inthe report. For example, to produce a report of the furniture for the Accounting department, youcan specify that the Department property must equal Accounting for shapes only on the Furniturelayer. Advanced settings limit the shapes used in the following ways:
n Shapes on a layer — Select the <Layer Name> property. You can include or exclude alayer from a report by selecting = or <> in the Condition box.
n Shapes by name or ID — You can use the <Master Name>, <Shape Name>, or <ShapeID> properties to specify the named shapes you want.
n Shapes with specific shape data — Select the shape, select Exists in the Condition list,and then select TRUE in the Value list.
n Shapes with specific values in shape data — Select the shape and then specify thecondition and value for the property. For example, you can select Duration, >, and 5 toreport on all processes whose duration is longer than five weeks.
n AutoDiscovery shapes — Select the <Autodiscovery Shape> property to report onshapes that result from using AutoDiscovery.
The conditions and values you can choose depend on the property that you select.However, Visio offers a limited number of conditional operators, such as =, <>, and >=.
To add an additional criterion, define the criterion and then click Add. To delete a criterion, in theDefined Criteria list, select it and then click Delete. You can delete all the defined criteria by click-ing Clear.
NOTENOTE
233
Linking Shapes with Data 10
15_109960 ch10.qxp 2/20/07 11:09 AM Page 233

After you define criteria, click OK to close the Advanced dialog box and then click Next to con-tinue selecting the properties for the report columns.
Choosing Report ColumnsIn the screen for choosing properties, Visio displays default shape properties, such as <MasterName> and <Height>, in addition to shape data and user-defined properties from the ShapeSheetUser-Defined Cells section. Default shape properties appear within angled brackets. To see user-defined properties from the ShapeSheet, check the Show All Properties check box.
Select the check box for each property you want to use as a column in the report. Click Next tocontinue grouping, sorting, and formatting your report.
Grouping, Sorting, and Formatting Report ContentsAs with most reporting tools, Visio reporting can group, sort, and format report results in severalways. For example, you can produce a report that groups the office furniture by department, calcu-lating the number of desks for each department, and sorting the report by the average furniturecost per department.
n Group results — Click Subtotals. In the Group By drop-down list, which contains theproperties you specified as columns for your report, choose the property you want to useto group your results. You can also specify which rows appear in your report by clickingOptions. For example, you can show all values, only unique values, only subtotals, orgrand totals. You can also prevent duplicate rows from appearing in your report.
n Calculations — For each property in the Properties list, select the check boxes for thecalculations you want. Count is available for any type of shape, but the other calculationsonly work with numerical properties. If a calculation isn’t valid for a property, the checkbox is dimmed. When you perform a calculation, it calculates the value for each group inthe report. If you create an ungrouped report, the calculation represents all entries. Youcan choose from the following calculations:
n Count — Calculates the number of shapes with the same value in a shape. For exam-ple, if there are 16 shapes with the value Accounting in the Department property,Count returns 16.
n Total — Sums the value of all the entries in a group or all entries for an ungroupedreport.
n Avg — Calculates the average of property values in a group or the entire report.
n Max — Returns the largest number from the list of property values.
n Min — Returns the smallest number from the list of property values.
n Median — Calculates the median for a list of property values. In a group of numbers,the median is the number with an equal number of values greater and less than it.
234
Integrating Visio DrawingsPart II
15_109960 ch10.qxp 2/20/07 11:09 AM Page 234

n Rearrange Columns and Sort Rows — You can arrange the order of the columns in yourreport as well as specify the sort order for rows by clicking Sort. To rearrange the columnsin your report, select a column in the Column Order list and then click Move Up or MoveDown to change its position in the column order. You can sort the rows in a report withup to three properties. Choose the shape data for the first sort in the Sort By list andselect the Ascending or Descending option. Specify one or two additional sort propertiesin the two Then By lists, also specifying ascending or descending order. For example, youcan sort a report of office furniture first by department, then by employee name, andfinally by Shape Name if it indicates the type of furniture.
n Format Values — For shape data with numeric values, you can specify the number ofdecimals in numbers and whether to show units. Click Format and then choose the num-ber of places to the right of the decimal point in the Precision box. To show units, selectthe Show Units check box.
After you specify any grouping, subtotals, sorting, and formatting you want, click Nextto continue to saving the report.
Saving Custom ReportsWhen you save a custom report, you name the report and choose a location in which to save thereport definition file. To save a report, follow these steps:
1. In the Reports dialog box, type the name for the report. Use a brief but descriptive namefor each report to identify your reports more easily. Type a detailed description in theDescription box, in case the descriptive name you choose doesn’t seem to be as descrip-tive when you see it later on. This description appears in the Description box in theReports dialog box.
2. Choose an option to either save the report in the current drawing file or to a VRD file in afolder on your computer. Saving a report to a VRD file is more flexible, because you can runthe report for any Visio drawing file. In addition, VRD files are XML files that contain thereport specification, so you can modify them using any text editor. If you save the report inthe current drawing file, you can access the report whenever the drawing file is open.
3. Click Finish. Visio adds the report to the Report list in the Reports dialog box.
The final step in the save process only saves the report. You must click Run in theReports dialog box to run a report and view the results.
SummaryYou can link the shapes on Visio drawings with data in ODBC-compliant databases. The new DataLink feature simplifies creating one-way links from data sources to Visio drawings. If you want tocreate two-way links between shapes and database records, the Visio add-ons are still available.
NOTENOTE
NOTENOTE
235
Linking Shapes with Data 10
15_109960 ch10.qxp 2/20/07 11:09 AM Page 235

You can set up connections that link shapes on drawings to database records. If you want to addshapes to drawings with links already in place, you can create masters with links to databases — toany record or to specific records. You can also generate drawings based on the records in a data-base table. After you link shapes to database records, you can update values by using shortcutmenu commands or by specifying a refresh interval and letting Visio update your shapes or recordsautomatically.
236
Integrating Visio DrawingsPart II
15_109960 ch10.qxp 2/20/07 11:09 AM Page 236
![DA190759 Original Architectural Drawings - [A6402145].pdf](https://static.fdokumen.com/doc/165x107/6327476b5c2c3bbfa8041923/da190759-original-architectural-drawings-a6402145pdf.jpg)