Integrating occupancy modeling and interview data for corridor identification: A case study for...
10
Integrating occupancy modeling and interview data for corridor identification: A case study for jaguars in Nicaragua Katherine A. Zeller a,⇑ , Sahil Nijhawan a , Roberto Salom-Pérez a , Sandra H. Potosme a , James E. Hines b a Panthera, 8 West 40th Street, New York, NY 10018, USA b USGS Patuxent Wildlife Research Center, 11510 American Holly Drive, Laurel, MD 20708-4017, USA article info Article history: Received 26 August 2010 Received in revised form 1 December 2010 Accepted 6 December 2010 Available online 5 January 2011 Keywords: Panthera onca Connectivity Conservation planning Detection/non-detection Detection probability Interviews abstract Corridors are critical elements in the long-term conservation of wide-ranging species like the jaguar (Pan- thera onca). Jaguar corridors across the range of the species were initially identified using a GIS-based least-cost corridor model. However, due to inherent errors in remotely sensed data and model uncertain- ties, these corridors warrant field verification before conservation efforts can begin. We developed a novel corridor assessment protocol based on interview data and site occupancy modeling. We divided our pilot study area, in southeastern Nicaragua, into 71, 6 6 km sampling units and conducted 160 structured interviews with local residents. Interviews were designed to collect data on jaguar and seven prey species so that detection/non-detection matrices could be constructed for each sampling unit. Jag- uars were reportedly detected in 57% of the sampling units and had a detection probability of 28%. With the exception of white-lipped peccary, prey species were reportedly detected in 82–100% of the sampling units. Though the use of interview data may violate some assumptions of the occupancy modeling approach for determining ‘proportion of area occupied’, we countered these shortcomings through study design and interpreting the occupancy parameter, psi, as ‘probability of habitat used’. Probability of hab- itat use was modeled for each target species using single state or multistate models. A combination of the estimated probabilities of habitat use for jaguar and prey was selected to identify the final jaguar corri- dor. This protocol provides an efficient field methodology for identifying corridors for easily-identifiable species, across large study areas comprised of unprotected, private lands. Ó 2010 Elsevier Ltd. All rights reserved. 1. Introduction The jaguar (Panthera onca) was previously divided into eight different subspecies (Pocock, 1939). However, recent genetic re- search has shown there is little justification for subspecific division and that dispersal between jaguar populations throughout their range is relatively high (Eizirik et al., 2001; Ruiz-Garcia et al., 2006). Landscape connectivity facilitates this dispersal and may in turn increase a population’s chances of persistence by counter- acting genetic drift and inbreeding that can reduce diversity in small, isolated populations (Soulé and Mills, 1998; Young and Clarke, 2000). Given that high levels of genetic variation and ex- change of genetic material are vital to the survival of most species (Frankham, 2006; Hedrick, 1995), maintaining existing corridors between jaguar populations should be integral to long-term con- servation planning for this species. To determine where jaguar corridors might exist, we conducted a range-wide least-cost connectivity analysis between known jaguar populations (see Rabinowitz and Zeller, 2010). Jaguar ex- perts from Mexico to Argentina applied movement costs to six GIS-based landscape layers. These layers were combined to pro- duce a movement cost surface quantifying the matrix between jag- uar populations in terms of difficulty of jaguar movement. Least- cost corridors were then modeled across this cost surface between the 90 known jaguar populations identified in earlier range-wide priority-setting exercises (Sanderson et al., 2002; Zeller, 2007). These corridors identified probable connections between jaguar populations. However, because of errors inherent in remotely sensed data, such as misclassification and resolution issues, changes that may have taken place at the ground level since GIS data were collected, and limitations of least-cost corridor models (Beier et al., 2009; Theobald, 2006), field-based assessments are necessary to further refine corridor boundaries. Field assessments are also essential to confirm the use of the corridor by the species for which it is intended, allowing us to determine the appropriate- ness of the corridor (Hilty et al., 2006; Noss and Daly, 2006). Because corridors between jaguar populations exist primarily in human-dominated landscapes, usually spanning large spatial scales, it is often not practical to use conventional detection/non- detection techniques such as camera trapping or line transects 0006-3207/$ - see front matter Ó 2010 Elsevier Ltd. All rights reserved. doi:10.1016/j.biocon.2010.12.003 ⇑ Corresponding author. Tel.: +1 646 786 0409; fax: +1 646 786 0401. E-mail address: [email protected] (K.A. Zeller). Biological Conservation 144 (2011) 892–901 Contents lists available at ScienceDirect Biological Conservation journal homepage: www.elsevier.com/locate/biocon
-
Upload
independent -
Category
Documents
-
view
5 -
download
0
Transcript of Integrating occupancy modeling and interview data for corridor identification: A case study for...

Biological Conservation 144 (2011) 892–901
Contents lists available at ScienceDirect
Biological Conservation
journal homepage: www.elsevier .com/locate /b iocon
Integrating occupancy modeling and interview data for corridor identification:A case study for jaguars in Nicaragua
Katherine A. Zeller a,⇑, Sahil Nijhawan a, Roberto Salom-Pérez a, Sandra H. Potosme a, James E. Hines b
a Panthera, 8 West 40th Street, New York, NY 10018, USAb USGS Patuxent Wildlife Research Center, 11510 American Holly Drive, Laurel, MD 20708-4017, USA
a r t i c l e i n f o
Article history:Received 26 August 2010Received in revised form 1 December 2010Accepted 6 December 2010Available online 5 January 2011
Keywords:Panthera oncaConnectivityConservation planningDetection/non-detectionDetection probabilityInterviews
0006-3207/$ - see front matter � 2010 Elsevier Ltd. Adoi:10.1016/j.biocon.2010.12.003
⇑ Corresponding author. Tel.: +1 646 786 0409; faxE-mail address: [email protected] (K.A. Zeller).
a b s t r a c t
Corridors are critical elements in the long-term conservation of wide-ranging species like the jaguar (Pan-thera onca). Jaguar corridors across the range of the species were initially identified using a GIS-basedleast-cost corridor model. However, due to inherent errors in remotely sensed data and model uncertain-ties, these corridors warrant field verification before conservation efforts can begin. We developed anovel corridor assessment protocol based on interview data and site occupancy modeling. We dividedour pilot study area, in southeastern Nicaragua, into 71, 6 � 6 km sampling units and conducted 160structured interviews with local residents. Interviews were designed to collect data on jaguar and sevenprey species so that detection/non-detection matrices could be constructed for each sampling unit. Jag-uars were reportedly detected in 57% of the sampling units and had a detection probability of 28%. Withthe exception of white-lipped peccary, prey species were reportedly detected in 82–100% of the samplingunits. Though the use of interview data may violate some assumptions of the occupancy modelingapproach for determining ‘proportion of area occupied’, we countered these shortcomings through studydesign and interpreting the occupancy parameter, psi, as ‘probability of habitat used’. Probability of hab-itat use was modeled for each target species using single state or multistate models. A combination of theestimated probabilities of habitat use for jaguar and prey was selected to identify the final jaguar corri-dor. This protocol provides an efficient field methodology for identifying corridors for easily-identifiablespecies, across large study areas comprised of unprotected, private lands.
� 2010 Elsevier Ltd. All rights reserved.
1. Introduction
The jaguar (Panthera onca) was previously divided into eightdifferent subspecies (Pocock, 1939). However, recent genetic re-search has shown there is little justification for subspecific divisionand that dispersal between jaguar populations throughout theirrange is relatively high (Eizirik et al., 2001; Ruiz-Garcia et al.,2006). Landscape connectivity facilitates this dispersal and mayin turn increase a population’s chances of persistence by counter-acting genetic drift and inbreeding that can reduce diversity insmall, isolated populations (Soulé and Mills, 1998; Young andClarke, 2000). Given that high levels of genetic variation and ex-change of genetic material are vital to the survival of most species(Frankham, 2006; Hedrick, 1995), maintaining existing corridorsbetween jaguar populations should be integral to long-term con-servation planning for this species.
To determine where jaguar corridors might exist, we conducteda range-wide least-cost connectivity analysis between known
ll rights reserved.
: +1 646 786 0401.
jaguar populations (see Rabinowitz and Zeller, 2010). Jaguar ex-perts from Mexico to Argentina applied movement costs to sixGIS-based landscape layers. These layers were combined to pro-duce a movement cost surface quantifying the matrix between jag-uar populations in terms of difficulty of jaguar movement. Least-cost corridors were then modeled across this cost surface betweenthe 90 known jaguar populations identified in earlier range-widepriority-setting exercises (Sanderson et al., 2002; Zeller, 2007).
These corridors identified probable connections between jaguarpopulations. However, because of errors inherent in remotelysensed data, such as misclassification and resolution issues,changes that may have taken place at the ground level since GISdata were collected, and limitations of least-cost corridor models(Beier et al., 2009; Theobald, 2006), field-based assessments arenecessary to further refine corridor boundaries. Field assessmentsare also essential to confirm the use of the corridor by the speciesfor which it is intended, allowing us to determine the appropriate-ness of the corridor (Hilty et al., 2006; Noss and Daly, 2006).
Because corridors between jaguar populations exist primarily inhuman-dominated landscapes, usually spanning large spatialscales, it is often not practical to use conventional detection/non-detection techniques such as camera trapping or line transects

Fig. 1. Study area.
K.A. Zeller et al. / Biological Conservation 144 (2011) 892–901 893
for field assessment. Theft or tampering of cameras, high humantraffic, private land ownership, and the need for large amounts ofstaff time and funding are some of the obstacles to collecting datausing these methods. An alternative is interviews with local peo-ple. Local people can be good sources of information about thepresence or absence of wildlife (Rabinowitz, 1997; White et al.,2005). Well designed interviews can provide a credible, cost-effec-tive alternative to large-scale field surveys for direct observation orsign of a species, especially for species that are rare and difficult todetect in a short survey period (Berg et al., 1983; Lariviére et al.,2000; Pike et al., 1999; van der Hoeven et al., 2004).
In recent years, site occupancy modeling has become increas-ingly useful to ecologists because the only data requirements arebased on the detection or non-detection of a species over severalsampling occasions (Linkie et al., 2007; MacKenzie et al., 2002;Weller, 2008) and it provides for detection probability. Nocturnaland cryptic species, such as the jaguar, are not always detectedwhen present and failure to incorporate detection probabilitiescan produce biased estimates, and lead to misguided conservationdecisions (Gu and Swihart, 2004; Linkie et al., 2007; MacKenzieet al., 2006). Site occupancy modeling also provides a flexibleframework that enables occupancy to be modeled as a functionof covariate information (MacKenzie et al., 2002). The use of covar-iates, such as land cover type, elevation, and human presence, canprovide valuable information about the factors influencing habitatuse by jaguar and prey species in a human-modified landscape.
As a potential indirect method to obtain detection/non-detec-tion data for analysis in the site occupancy framework (MacKenzieet al., 2002) (also see Stanley and Royle, 2005), we propose the useof systematic and objective interviews with knowledgeable localresidents. Though interview data may be an efficient way to gatherdata on species presence, the use of these data in the occupancymodel presents a unique suite of challenges. Detections come fromseveral sources whose credibility needs to be determined, and thequality of data collected through interviews is highly dependent onthe wording of the questions and the skill of the interviewer(White et al., 2005). Furthermore, certain assumptions that allowfor estimation of proportion and probability of area occupied ofthe MacKenzie et al. (2002) model cannot be met.
This paper describes how we addressed those challengesthrough interview design and interpretation of model parameters.We demonstrate our methodology in a corridor site in easternNicaragua and provide an example of how we used the results toidentify a biologically robust corridor between two known jaguarpopulations.
2. Materials and methods
2.1. Study area
The study area lies between Wawashan National Park and CerroSilva Forest Reserve on the Atlantic Coast of Nicaragua. Because theleast-cost corridor provided limited connectivity options betweenthe two patches, we wanted to be sure that we did not omit anypossible connections that might be more circuitous, yet offer com-parable habitat. We performed a closeness analysis of the land-scape between the protected areas using FRAGSTATS (v3McGarigal et al., 2002) and identified forest patches that contrib-uted to the overall connectivity of the region. We combined theseforest patches with the GIS-based least-cost corridor to create ourstudy area (Fig. 1). The average annual rainfall and temperature are4500 mm and 29 �C respectively. Elevation ranges from 0 to 231 mabove sea level. Agricultural activities constitute nearly 15% of thestudy area whereas approximately 45% is covered by primary andsecondary broadleaved forests. The study area is inhabited by peo-
ple at moderate densities, with over 35 settlements spanning themunicipalities of Laguna de Perlas, Kukra Hill, Bluefields, and ElRama in the autonomous RAAS region of southern Nicaragua. Theprimary occupations of the residents vary from fishing, ranchingand small scale farming, to working on large oil palm plantations.
2.2. Sampling approach
We divided the study area into 71, 6 � 6 km, sampling units,which resulted in a final study area measuring 2556 km2 (Fig 1).Sampling unit size was based upon approximate home range sizeof jaguars in the region (Carrillo, 2000; Ceballos et al., 2002; Rabi-nowitz and Nottingham, 1986). We conducted interviews fromFebruary 19th to April 26th, 2009. Access issues and time con-straints prevented us from conducting interviews in 4 of the 71sampling units.
We treated each interview as a separate replicate for the compu-tation of detection probabilities. We used data on occupancy anddetection probabilities from another likelihood-based habitat usestudy, on jaguars and prey in Costa Rica (Nijhawan, unpublisheddata), and the equations presented in MacKenzie and Royle(2005), to determine the optimum number of surveys needed ateach site. This indicated the need for two to three replicates, or inter-views, per sampling unit, which we increased to four to six, to ac-count for variability in local conditions and lack of site-specific data.
2.3. Questionnaire and data collection
We developed a questionnaire to gather detection/non-detec-tion data on jaguar and the following prey species: white-lippedpeccary (Tayassu pecari), collared peccary (Pecari tajacu), white-tailed deer (Odocoileus virginianus), red brocket deer (Mazamaamericana), Central American agouti (Dasyprocta punctata), paca(Agouti paca), and nine-banded armadillo (Dasypus novemcinctus).At the beginning of each interview, in an effort to gather unbiasedinformation, we made each interviewee well aware of the fact theinterviewers were from a non-governmental organization and that

894 K.A. Zeller et al. / Biological Conservation 144 (2011) 892–901
all information they provided was anonymous. To ascertain theknowledge and credibility of the interviewees, we asked them toidentify wildlife species through a two-step vetting process. First,we asked them to provide a detailed description of the animaland, second, we asked them to identify the animal and its tracksfrom an array of pictures. If an interviewee was not consideredcredible, data from that interview was not included in the analysis.This process helped ensure that we did not record any false posi-tives for jaguar and prey detection.
The local people selected for interviews acted as our surveyors.Each interviewee was associated with an area that they have ‘sur-veyed’. We referred to this area, represented by a single or a groupof sampling units, as their ‘‘Area of Knowledge’’ (AOK). If an inter-viewee identified more than one sampling unit as their AOK, weasked the same set of questions for each sampling unit, therebykeeping a distinct sampling effort and detection/non-detection re-cord for each sampling unit. For each interviewee, we determinedand recorded frequency of visitation and amount of time spent in asampling unit (Vongkhamheng, unpublished results). To meet ourcriteria for survey effort, an interviewee must have either lived inor ‘surveyed’ a sampling unit at least twice per month for a year.
For both jaguar and prey, we recorded detections and non-detections for sightings that occurred within the last year and onlyfor the sampling unit(s) identified by an interviewee as their AOK.We recorded detection for a sampling unit if any of the followingwere successfully established: direct sighting of the animal (aliveor recently killed), direct observation of sign (tracks, burrows, orvocalizations), and in the case of jaguars, direct observation of ajaguar kill. Interviewers recorded the same jaguar sighting fromtwo different interviewees only once.
For prey, we also asked the interviewees how frequently thesightings occurred. We classified these responses into four sub-cat-egorical variables representing frequency of sightings: undetected(not seen), rare (observed once a year), moderate/sometimes (ob-served twice a year to once per month/2–12 times a year) and fre-quent (observed more than once per month/13 times a year ormore).
2.4. Data analysis and interpretation of estimates
We used PRESENCE (v3.0; Hines, 2010) and ArcView (v9; Envi-ronmental Systems Research Institute, Redlands, CA) software toanalyze the data.
Interview responses resulted in detection/non-detection matri-ces for each species with a maximum of seven replicates per sam-pling unit including several missing values.
MacKenzie and Nichols (2004) noted that the closure assump-tion of the occupancy model could be relaxed if changes to thepopulation are random within the survey period. We were unableto meet the population closure assumption because interview datarecorded jaguar and prey sightings over 1 year, during which con-siderable random fluxes in the occupancy of a corridor may haveoccurred. Additionally, violation of the independence assumptionis unavoidable when detections are temporally spaced over a year.Relaxation of these conditions changes the interpretation of theoccupancy parameter, psi, from true occupancy, or ‘‘proportion ofarea occupied’’ to ‘‘proportion of area used’’. Because we wereinterested in the use of a corridor by the species, not occupationof it, this was sufficient to meet the goals of our corridor assess-ment efforts. Henceforth, in this context, we are working with astate variable that should be interpreted as ‘‘habitat use (W)’’ not‘‘occupancy’’ (MacKenzie and Nichols, 2004).
2.4.1. Single state and multistate modelsNaïve occupancy (proportion of sampling units where a species
was detected) for jaguar and white-lipped peccary was 0.57 and
0.38 respectively. We analyzed jaguar and white-lipped peccarysightings using a single state model (MacKenzie et al., 2002).
Data for the other prey species indicated detection in 82–100%of the sampling units. The high naïve occupancy of these speciesmay be due to the fact that they were widespread in the study area.Alternatively, because prey species like collared peccary, deer,agouti, paca, and armadillo use much smaller areas than our sam-pling unit size, it is possible that models for these species provide ablanket 100% probability of habitat use for all sampling units eventhough they might have only used a section of a sampling unit. Tohelp address this issue, we analyzed data for remaining prey spe-cies using multistate models (MacKenzie et al., 2009; Nicholset al., 2007). Interviewee – provided data on observation frequencywere used as the different ‘states’.
We assumed the more frequently a species or its sign was ob-served, the higher its relative abundance in a sampling unit. Thus,we converted the four sub-categorical frequency variables men-tioned above into three relative abundance states: undetected(State 0), rare to moderately present (State 1), and frequently pres-ent (State 2). Realistically, there may be ambiguity not only in thedetection or non-detection of the species from the field observa-tions, but also in assignment of the correct state (MacKenzieet al., 2009; Nichols et al., 2007). The reported states are hierarchi-cal in terms of certainty of the information about the true state,where the lowest observed state has the greatest uncertainty andthe highest observed state has no ambiguity about its veracity. Thismeans that if State 0 is observed, there is a chance that the specieswas present in State 1 or 2, but was undetected. However, if a spe-cies is detected in State 2 there is no uncertainty associated with itbeing the true state. We used multistate models developed by Nic-hols et al. (2007) to estimate the probability of presence in each ofthe three states. The states are considered to be mutually exclusive,therefore, their probabilities of habitat use must sum to one.
2.4.2. Covariates and a priori hypothesesCovariates that were considered to influence the use of a sam-
pling unit by our target species were selected for analysis. Habitatcovariates included proportion of forest, grassland, agriculture/shrub, open areas (bare ground and pastures), early-stage forestre-growth, wetland, and water. Topographic and anthropogeniccovariates included mean elevation of a sampling unit and distanceto protected areas. Mean elevation was centered around the sam-ple average to improve its interpretation in models. Roads werenot used as a covariate because of lack of accurate information. Be-cause prey species, especially smaller prey, were usually observedvery close to settlements, we used number of settlements in a sam-pling unit as a covariate only for jaguar models. We modeleddetection probability as a function of interviewee-specific covari-ates such as length of residency (or visitation), survey effort, aswell as a function of habitat covariates. We only used one covariateif two or more covariates were found to be correlated.
With the exception of Foster et al. (2010), limited research hasbeen conducted on jaguar habitat use outside of protected areas inCentral America. Therefore, we fit jaguar models as functions of allcovariates. For prey species, we selected covariates most likely toinfluence distribution based on prior knowledge of their ecologyrather than a data dredging approach (Anderson et al., 2001).
For white-lipped peccary, we tested covariates related to theiraffinity for forest and water (Fragoso, 1999; Keuroghlian and Eaton,2008; Sowls, 1997) and avoidance of anthropogenic disturbance(Altrichter and Boaglio, 2004; Fragoso, 1999; Sowls, 1997). For col-lared peccary, we tested covariates related to their affinity forwater, wetlands (Keuroghlian and Eaton, 2008; Reid, 1997), forest(Altrichter and Boaglio, 2004; Fragoso, 1999), and habitat typessuch as agriculture and open areas owing to their broad habitatpreferences (Naranjo, 2002; Sowls, 1997). For red brocket deer,

K.A. Zeller et al. / Biological Conservation 144 (2011) 892–901 895
we tested covariates related to their association with forest andwater (Emmons and Feer, 1997; Reid, 1997). Other prey specieslike white-tailed deer, agouti, paca and armadillo are known tobe habitat generalists (Emmons and Feer, 1997; Méndez, 1984;Reid, 1997). For these species, we fit general models (includingall the habitat covariates).
We modeled habitat use and detection probabilities for singlestate and multistate models as a function of covariates using logitand multinomial-logit link (mlogit) functions respectively (Mac-Kenzie et al., 2006, 2009). Each state was modeled separately withits own set of habitat covariates. mlogit models are a simple exten-sion of logit models. For example, data for a species is recorded inm states such that m = 2, . . . , M. The logit of the probability of useof site j in state m is expressed as:
Zmj ¼ logitðWmjÞ ¼ amj þXn
i¼1
bmjiXmji
which is a linear function of the n covariates (X1 . . . Xn) associatedwith site j, with one intercept term a and n b coefficients to beestimated.
The lowest state is usually the reference state, in our case thatwould be State 0 or non-detection. The probability of membershipin other states is compared to the probability of membership in thereference state. Therefore, the probability of habitat use in site j instate p (m = 2 . . . M) is expressed as:
Wjðm ¼ pÞ ¼ expðZpjÞ1þ
PMm¼2 expðZmjÞ
Note that, when m = 2, the mlogit and logit regression models be-come one and the same.
2.4.3. Conditional probability (W-cond)Logit-based (or mlogit-based) model-estimated W is uncondi-
tional, meaning it is calculated as a function of modeled habitatcovariates regardless of detection of the species in a sampling unit.The only conditioning is on the set of sampling unit characteristics.Conditional probability (W-cond) is computed taking detectionhistory into account and is only appropriate for sampling unitswhere data was collected.
For single state models, W-cond = 1 for sampling units with atleast one detection because species presence was unambiguouslyestablished. Conditional probability for sites with no detections iscomputed by factoring in the probability of not detecting the spe-cies (1 � p):
W-cond ¼ W � Qð1�WþW � QÞ
where Q = (1 � p)k, k = number of surveys.W-cond for states in a multistate model can be computed by an
expression (similar to the one given above) where the denominatorincludes all possible iterations of the observed detection historyand the numerator gives the probability associated with one ofthe states. For example, let po,r be the probability of detection whenthe observed state is o and the true state is r. For a detection historyof 10101-,
W� condstate2
¼Wstate2ð1� p1;2 � p2;2Þ
2ðp1;2Þ3
Wstate2ð1� p1;2 � p2;2Þ2ðp1;2Þ
3 þWstate1ð1� p1;1Þ2ðp1;1Þ
3
The denominator in the expression of W-condstate2 implies thatthe unit may have been in State 2, with the species undetected inthe second and fourth surveys and State 1 observed in the first,
third and fifth surveys, or the unit may have been in State 1 withthe species undetected in the second and fourth surveys and State1 observed in the first, third and fifth surveys.
Similarly, for detection history 0000- -,
W-condstate2
¼Wstate2ð1� p1;2 � p2;2Þ
4
Wstate2ð1� p1;2 � p2;2Þ4 þWstate1ð1� p1;1Þ
4 þ ð1�Wstate2 �Wstate1Þ
The additional term in the denominator in the expression aboverepresents a scenario under which the species was absent fromthe unit (State 0). Missing observations are omitted in thecalculation.
2.4.4. Model selection and model averagingWe ranked models using the small-sample correction to
Akaike’s Information Criterion (AICc). We computed Akaikeweights (w) to compare weight of evidence among models in thecandidate set (Burnham and Anderson, 2002). We eliminated mod-els where b coefficients of covariates were statistically insignificant(at 95% confidence interval). However, we kept covariates with sta-tistically insignificant b coefficients if they had been previouslyshown to influence species distribution and their sign agreed withthe existing ecological knowledge about the species. Wheneverthere were a number of candidate models with relevant covariatesand with similar AIC weights, we applied a model averaging tech-nique to estimate probabilities of habitat use and detection (Buck-land et al., 1997; Burnham and Anderson, 2002).
2.5. Predictive maps and corridor identification
We used W-cond in State 2 (W-condstate2) for species with mul-tistate models. We divided prey species into two groups based ontheir size. Group I included the smaller species, agouti, paca, andarmadillo. Group II included the larger species, red brocket deer,white-tailed deer, collared peccary and white-lipped peccary. Wemultiplied probabilities of habitat use of species in Group I to ob-tain W-condGI = (Wagouti �Wpaca �Warmadillo), the probability that allof the smaller prey species use a sampling unit. We then calculatedthe probability that at least two of the larger prey species use asampling unit to obtain W-condGII = 1 � (Probability of none of thespecies using a sampling unit) � (Probability of at most one speciesusing a sampling unit).
We multiplied W-condGI and W-condGII to get the probabilitythat all of the small prey species and at least two of the large preyspecies use a sampling unit. We examined various combinations ofthresholds for the prey product (W-condGI �W-condGII) withthresholds of W-cond for jaguar to ascertain which grid cells wouldform a conservative, yet continuous corridor. After several itera-tions, every cell where prey product was greater than 0.9 (90%probability), and jaguar probability of habitat use was greater than0.75 (75% probability) was considered for inclusion in the finalcorridor.
We compared these results with the GIS-based corridor by cal-culating the area of overlap.
3. Results
We conducted 160 interviews over a 10-week period. Residencyof the interviewees in the study area ranged from 4 months to80 years with a median residence of 15 years. Males comprised97.22% of the interviewees, the youngest interviewee was 16 yearsold, the oldest was 80 years old and the mean age of the intervie-wees was 40 years.

Table 1Top models and untransformed coefficients of covariates for jaguar, white-lipped peccary, collared peccary and red brocket deer. Jaguar and white-lipped peccary data were analyzed using single state models. Other prey species weremodeled using multistate models (State 2 represents the highest relative abundance state, State 0 represents absence).
Species Models DAICca
wb Kc Untransformed coefficients of covariates (standard errors)
Intercept Forest Water c.elev Dist.PA Additional
Jaguar Naïve estimated: 0.571 W(.), p(c.elev) 0.00 0.53 3 2.06 (0.87) – – �0.04 (0.01) –2 W(c.elev), p(.) 1.74 0.22 3 3.54 (2.58) – – �0.15 (0.10) –3 W(c.elev), p(effort) 2.96 0.12 4 3.21 (1.94) – – �0.14 (0.08) – Effort: 0.34 (0.34)4 W(c.elev), p(water) 3.80 0.08 4 4.25 (5.48) – 0.44 (1.04) �0.18 (0.20) –5 W(open), p(water) 7.08 0.02 4 3.24 (1.28) – 1.62 (0.97) – – Open: -13.66 (5.75)
White-lippedpeccary
Naïve estimated: 0.38
1 W(forest + c.elev + forest�c.elev), p(.) 0.00 0.44 5 �2.43 (1.26) 9.79 (4.54) – 0.16 (0.09) – Forest�c.elev: �0.65 (0.32)2 W(forest + c.elev + forest�c.elev), p(l.stay) 0.91 0.28 6 �2.51 (1.23) 9.79 (4.30) – 0.16 (0.09) – Forest�c.elev: �0.63 (0.30); l.stay: 0.01 (0.01)3 W(forest + c.elev + forest�c.elev + dist_PA), p(.) 1.90 0.17 6 �1.73 (1.54) 10.13 (4.93) – 0.16 (0.09) �0.06 (0.08) Forest�c.elev: �0.65 (0.33)4 W(forest + forest�c.elev), p(.) 2.66 0.12 4 �2.10 (0.99) 7.42 (3.24) – – – Forest�c.elev: �0.18 (0.07)
Collared peccarye Naïve estimated: 0.981 W[W(1), W(2) = shrub], p(.) 0.00 0.43 6 35.61 (6.67) – – – – Shrub: �20.99 (9.65)2 W[W(1), W(2) = forest + shrub], p(.) 0.50 0.34 7 27.94 (3.37) 7.17 (3.34) – – – Shrub: �6.05 (2.58)3 W[W(1), W(2) = forest + water], p(.) 1.23 0.23 7 23.24 (4.34) 7.68 (2.82) 6.07 (3.40) – –
Red brocket deere Naïve estimated: 0.821 W[W(1),
W(2) = forest + wetland + 10�wetland�forest], p(.)0.00 0.65 8 �2.05 (6.52) 15.40 (7.30) – – – Wetland: 45.08 (21.71); 10�forest�wetland:
�12.27(6.35)2 W[W(1), W(2) = forest + water + 10�water�forest],
p(.)2.17 0.22 8 �2.93 (3.78) 13.77 (6.01) 34.32 (15.98) – – 10�forest�water: �9.23 (4.66)
3 W[W(1), W(2) = forest + wetland], p(.) 3.24 0.13 7 �0.58 (2.98) 8.23 (3.42) – – – Wetland: 10.92 (8.65)
Covariates: forest, proportion of forest in a sampling unit; open, proportion of bare ground and pasture in a sampling unit; water, proportion of water bodies and wetland in a sampling unit; wetland, proportion of wetland in asampling unit; dist.PA, distance to the edge of the nearest protected area from centroid of a sampling unit; l.stay, length of residency of an interviewee in the study area; effort, sampling frequency of interviewee expressed as aratio of number of days spent in a sampling unit annually to total number of days in a year; c.elev, mean elevation in a sampling unit centered around sample mean; shrub, proportion of shrubby and agricultural vegetation in asampling unit.
a Difference in AICc value relative to the top model.b AICc weight.c Number of parameters in the model.d Proportion of sampling units where the species was detected.e For multistate models, b coefficients are for State 2.
896K
.A.Zeller
etal./Biological
Conservation144
(2011)892–
901

Table 2Habitat use estimates for more common prey species. Models fit as a function ofhabitat covariates for these species were misleading due to the reported commonnessin the study area. Therefore, the simple model, W[W(1), W(2)],p(.), was selected as thefinal model. W(2) is the probability of habitat use in State 2.
Species Naïve estimate W(2) (S.E. (W(2)))
White-tailed deer 0.99 0.99 (0.01)Central American agouti 1.00 0.98 (0.01)Paca 1.00 0.99 (0.01)Nine-banded armadillo 0.99 0.94 (0.14)
K.A. Zeller et al. / Biological Conservation 144 (2011) 892–901 897
3.1. Jaguar
Mean elevation and open areas, were included in the top mod-els for the jaguar (Table 1). The b coefficients of both the covariateswere negatively correlated with W suggesting jaguars avoid higherelevation areas and areas with no vegetative cover. The top modelsalso indicated that detection probability is higher in lower eleva-tion areas and may increase with an increase in interviewee surveyeffort and the proportion of water.
3.2. Prey
Three covariates appeared important in habitat use models forwhite-lipped peccary: proportion of forest, mean elevation and dis-tance to protected areas (Table 1). The b coefficients in the topmodels suggest the probability of habitat use by white-lipped pec-cary increased with increase in the proportion of forest in a sam-pling unit and decreased as the distance from protected areasincreases, supporting our a priori predictions. One of the top mod-els suggested interviewees’ length of residence in the study areamight increase the chances of detecting white-lipped peccary.
For collared peccary, three multistate models received the mostsupport (Table 1). The covariates selected suggest that in the high-est state, State 2, habitat use by collared peccary was inversely pro-portional to the proportion of agriculture, and directly proportionalto forest and water, both in the form of permanent water sourcesand wetlands. For red brocket deer, top multistate models suggestthe probability of habitat use in State 2 was positively correlatedwith proportion of forest and water; however, wetland or wetterareas were preferred more than permanent water bodies. The neg-ative coefficient on the interaction terms, forest and water, sug-gests the red brocket deer was less likely to be present if one ofthe two habitat types were absent from a sampling unit.
White-tailed deer, agouti, paca and armadillo (naïve occupan-cies >98%, Table 2), were detected in the highest state, State 2, innearly 90% of the sampling units. The simple model was selectedas the best model for these species. Detection probabilities wereestimated as very high (>70% in State 2) except for armadillo(Table 3).
3.3. Predictive maps and corridor identification
Using the averaged top models for jaguar, white-lipped peccary,collared peccary, and red brocket deer, and the simple models forthe remaining prey species, we developed probability of habitatuse maps (Fig. 2).
Table 3Model averaged detection probability of jaguar and prey species. Jaguar and white-lipped pusing multistate models. p(o,r) represents detection probability where o is the observed s
Probability of detection Jaguar White-lipped peccary Collared peccary
p(1,1)/p 0.28 (0.04) 0.21 (0.05) 0.59 (0.10)p(1,2) – – 0.28 (0.03)p(2,2) – – 0.42 (0.04)
Forty-four of the 71 (62%) sampling units qualified for inclusionin the corridor, totaling an area of 1584 km2, 521 km2 of whichoverlapped with the least-cost-corridor from the GIS analysis.The final corridor boundary was drawn from the protected areaboundaries around all adjacent qualifying sampling units(Fig. 3a). This resulted in the inclusion of 33 qualifying samplingunits and four sampling units that did not qualify. The finalcorridor measured 1332 km2. The overlap between the least-costcorridor and the final corridor boundary was 443 km2, or 33%(Fig. 3b).
4. Discussion
Corridors are often large and it is not uncommon for a project tolack the personnel and monetary needs to cover such extensiveareas. There is also a general lack of methodological examples inthe literature, no widely accepted protocols, and few practicalexamples of field assessment of wildlife corridors. The protocolpresented here is a cost and time effective way to assess corridorsfor one or more easily recognizable target species. The techniquecan be used in areas that traverse private lands and has the addedadvantage of incorporating detection probabilities and habitatcovariates into predictive models. It should be noted that this pro-tocol was designed to gather and provide information about jag-uars and their prey in the context of assessing and refining acorridor specific to jaguar dispersal. This protocol would likelynot be appropriate for use within core populations, areas wherehuman presence is scarce, or studies where true occupancy orabundance estimates are of key interest.
We have identified two main improvements to this protocol.First, detection probability for jaguars was only 28%, which maysuggest the need for more interviews per sampling unit (at leastsix), to achieve an optimal sampling effort (MacKenzie and Royle,2005). Second, we suggest including more interviewee specificcharacteristics so that variation in detection probability, due to dif-ferent sources, can be explained. In the surveys we are currentlyconducting, we have started collecting additional intervieweeattributes such as, reason for visitation, mode of transportation,length of time spent in wildlife habitat and seasonal differencesin visitation. Furthermore, in an effort to maintain independentinterviewee responses, we refrain from interviewing people whotravel together, hunt together, or work together.
To our knowledge, Karanth et al. (2009) is the only other exam-ple of using interview data within an occupancy model. The use ofinterviews for estimating W needs to be measured against robustdata collection methods such as line transects and camera traps.We are currently conducting such a study in Belize as well as test-ing the usefulness of this protocol in other corridors to determineits applicability in a wide range of scales, habitats, levels of frag-mentation, and species presence.
The data for white-lipped peccary indicated, as expected, a pref-erence for forested habitats and close proximity to protected areas,though their high preference for water bodies was not reflected inour data (Fragoso, 1999; Keuroghlian and Eaton, 2008; Sowls,1997). The models for collared peccary and red brocket deershowed, as predicted, a positive correlation between probability
eccary data were analyzed using single state models. Other prey species were modeledtate and r is the true state.
Red brocket deer White-tailed deer Paca Agouti Armadillo
0.24 (0.08) 0.80 (0.20) 0.87 (0.02) 0.46 (0.18) 0.87 (0.16)0.49 (0.04) 0.23 (0.03) 0.27 (0.03) 0.16 (0.02) 0.43 (0.01)0.13 (0.03) 0.73 (0.03) 0.64 (0.03) 0.75 (0.03) 0.43 (0.01)
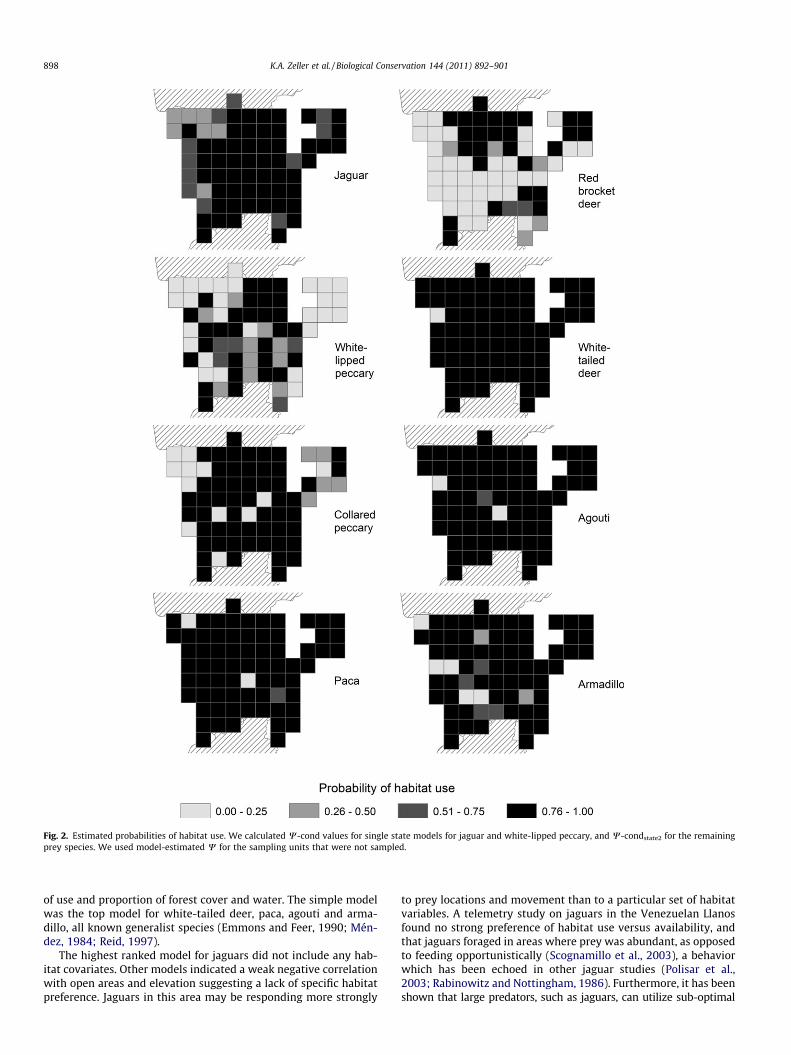
Fig. 2. Estimated probabilities of habitat use. We calculated W-cond values for single state models for jaguar and white-lipped peccary, and W-condstate2 for the remainingprey species. We used model-estimated W for the sampling units that were not sampled.
898 K.A. Zeller et al. / Biological Conservation 144 (2011) 892–901
of use and proportion of forest cover and water. The simple modelwas the top model for white-tailed deer, paca, agouti and arma-dillo, all known generalist species (Emmons and Feer, 1990; Mén-dez, 1984; Reid, 1997).
The highest ranked model for jaguars did not include any hab-itat covariates. Other models indicated a weak negative correlationwith open areas and elevation suggesting a lack of specific habitatpreference. Jaguars in this area may be responding more strongly
to prey locations and movement than to a particular set of habitatvariables. A telemetry study on jaguars in the Venezuelan Llanosfound no strong preference of habitat use versus availability, andthat jaguars foraged in areas where prey was abundant, as opposedto feeding opportunistically (Scognamillo et al., 2003), a behaviorwhich has been echoed in other jaguar studies (Polisar et al.,2003; Rabinowitz and Nottingham, 1986). Furthermore, it has beenshown that large predators, such as jaguars, can utilize sub-optimal

Fig. 3. Corridor selection: (a) sampling units that qualified for inclusion in the jaguar corridor; (b) final corridor shown with GIS-based least-cost corridor from Rabinowitzand Zeller (2010).
K.A. Zeller et al. / Biological Conservation 144 (2011) 892–901 899
habitats given sufficient prey and vegetative cover (Saberwal et al.,1994; Soni, 2000; Vijayan and Pati, 2002).
Currently, there are no data on how long jaguars might spendduring a dispersal event (with the exception of Quigley and Craw-shaw, 2002) or their resource needs during dispersal. Therefore, wehad limited guidance on which to base our corridor thresholds. Wewere faced with two choices – assume jaguars could, and wouldtravel the length of the corridor within a few days and use solelyhabitat use estimates for jaguar, or, assume jaguars might need afood source during dispersal and incorporate prey presence as afactor for corridor identification. The inclusion of prey is not onlya more conservative corridor estimate, but it widens the applicabil-ity of the corridor to a suite of species, thereby increasing its con-tribution to biological conservation. Furthermore, the ability ofjaguars to use multiple prey items along their movement pathsmay increase the chance of dispersal success for jaguars by poten-tially reducing livestock depredation (Polisar et al., 2003). We rec-ognize the thresholds on probability of habitat use by prey andjaguar for corridor inclusion are slightly arbitrary however, in theabsence of genetic data documenting movement and breeding be-tween populations, use of the area by the target species for whichthe corridor is intended is one of the best signs of functional con-nectivity (Hilty et al., 2006; Noss and Daly, 2006), and high proba-
bility of presence of a variety of prey species of different sizesfurther indicates a relatively healthy corridor. Other corridorsthroughout jaguar range will likely have different levels of jaguarand prey presence, therefore the threshold for including a samplingunit within a corridor may vary depending on the region. Thisunderscores the need for a more scientifically rigorous designationof the minimum requirements a sampling unit needs to have to beincluded in a corridor.
The results of our analyses can be used to promote corridor con-servation and inform management decisions because they presenta strong argument, backed by scientific data, for a jaguar corridor.The resultant maps can also be used as the foundation from whichfuture corridor implementation can be based and against which fu-ture conservation strategies can be measured. For example, Fig. 3ashows how targeted restoration efforts in a few non-qualifyingsampling units in the southwestern part of the study area might re-sult in widening the corridor and making connectivity through thisarea more robust. In addition, immediate conservation efforts arelikely needed in the sampling units that did not qualify for corridorinclusion, yet are still within the corridor due to their location.
We are currently using the protocol presented here to assessjaguar corridors throughout Central America and Colombia. Wehave collected data in nine study areas covering over 20,000 km2

900 K.A. Zeller et al. / Biological Conservation 144 (2011) 892–901
and have begun addressing site-specific threats to corridors inCosta Rica, Panama, Honduras, and Belize (see Salom-Peréz et al.,in press, for a discussion on corridor implementation strategies).
The results of our work emphasize the importance of field-ver-ifying coarse-scale GIS-based corridor exercises. Though the least-cost corridor may provide adequate connectivity for jaguars, ourresearch identified a more functional connection to the east, whichonly overlapped with the least-cost corridor by 33%. The risk in notconducting a corridor assessment is that a poorly designed corridorwill have less chance of success, resulting in a waste of preciousconservation resources (Noss and Daly, 2006). The protocol pre-sented in this paper can be adapted to other wide-ranging carni-vores, providing an efficient tool for large-scale connectivityassessment and conservation planning.
Acknowledgements
We are grateful to the Wildlife Conservation Society, the LizClaiborne and Art Ortenberg Foundation, Environmental SystemsResearch Institute, Inc., the United States Department of State,and T. Kaplan and Panthera for funding and support of this work.We would also like to thank J.D. Nichols for his input in the proto-col development, and J. Smith, L. Hunter, H. Quigley, M. Linkie andthe journal reviewers for critical review of this manuscript. We areindebted to A. Rabinowitz for his jaguar corridor vision andencouragement, J. Polisar for valuable input during the early stagesof this work, and F. Diaz and L. Maffei for their assistance in thefield.
References
Altrichter, M., Boaglio, G.I., 2004. Distribution and relative abundance of peccariesin the Argentine Chaco: associations with human factors. BiologicalConservation 116, 217–225.
Anderson, D.R., Burnham, K.P., Gould, W.R., Cherry, S., 2001. Concerns about findingeffects that are actually spurious. Wildlife Society Bulletin 29, 311–316.
Beier, P., Majka, D.R., Newell, S.L., 2009. Uncertainty analysis of least-cost modelingfor designing wildlife linkages. Ecological Applications 19, 2067–2077.
Berg, R.L., McDonald, L.L., Strickland, M.D., 1983. Distribution of mountain lions inWyoming as determined by mail questionnaire. Wildlife Society Bulletin 11,265–268.
Buckland, S.T., Burnham, K.P., Augustin, N.H., 1997. Model selection: an integral partof inference. Biometrics 53, 603–618.
Burnham, K.P., Anderson, D.R., 2002. Model Selection and Multimodel Inference: APractical Information-theoretic Approach, second ed. Springer, New York.
Carrillo, E., 2000. Ecology and Conservation of White-lipped Peccaries and Jaguars inCorcovado National Park, Costa Rica. PhD Thesis, University of Massachusetts.
Ceballos, G., Chávez, C., Rivera, A., Manterota, C., Wall, B., 2002. Tamaño poblacionaly conservación del jaguar en la reserva de la biosfera Calakmul, Campeche,México. In: Medellín, R., Equihua, C., Chetkiewicz, C.L.B., Crawshaw, P.G., Jr.,Rabinowitz, A., Redford, K.H., Robinson, J.G., Sanderson, E.W., Taber, A.B. (Eds.),El Jaguar en el Nuevo Milenio. Fondo de Cultura Económica, UniversidadNacional Autónoma de México, and the Wildlife Conservation Society, México,pp. 403–418.
Eizirik, E., Kim, J., Menotti-Raymond, M., Crawshaw Jr., P.G., O’Brien, S.J., Johnson,W.E., 2001. Phylogeography, population history and conservation genetics ofjaguars (Panthera onca, Mammalia, Felidae). Molecular Ecology 10, 65–79.
Emmons, L.H., Feer, F., 1997. Neotropical Rainforest Mammals: A Field Guide,second ed. The University of Chicago Press, Chicago.
Foster, R., Harmsen, B.J., Doncaster, C.P., 2010. Habitat use by sympatric jaguars andpumas across a gradient of human disturbance in Belize. Biotropica 42, 724–731.
Fragoso, J.M.V., 1999. Perception of scale and resource partitioning by peccaries:behavioral causes and ecological implications. Journal of Mammalogy 80, 993–1003.
Frankham, R., 2006. Genetics and landscape connectivity. In: Crooks, K.R., Sanjayan,M. (Eds.), Connectivity Conservation. Cambridge University Press, Cambridge,pp. 72–96.
Gu, W., Swihart, R., 2004. Absent or undetected? Effects of non-detection of speciesoccurrence on wildlife–habitat models. Biological Conservation 116, 195–203.
Hedrick, P.W., 1995. Gene flow and genetic restoration: the Florida panther as a casestudy. Conservation Biology 9, 996–1007.
Hilty, J.A., Lidicker Jr., W.Z., Merenlender, A.M., 2006. Corridor Ecology: The Scienceand Practice of Linking Landscapes for Biodiversity Conservation. Island Press,Washington, DC.
Hines, J.E., 2010. Program PRESENCE (Version 3.0). <http://www.mbr-pwrc.usgs.gov/software/doc/presence/presence.html>.
Karanth, K.K., Nichols, J.D., Hines, J.E., Karanth, K.U., Christensen, N.L., 2009. Patternsand determinants of mammal species occurrence in India. Journal of AppliedEcology 46, 1189–1200.
Keuroghlian, A., Eaton, D.P., 2008. Fruit availability and peccary frugivory in anisolated Atlantic forest fragment: effects on peccary ranging behavior andhabitat use. Biotropica 40, 62–70.
Lariviére, S., Jolicoeur, H., Crête, M., 2000. Status and conservation of the gray wolf(Canis lupus) in wildlife reserves of Québec. Biological Conservation 94, 143–151.
Linkie, M., Dinata, Y., Nugroho, A., Haidir, I.A., 2007. Estimating occupancy of a datadeficient mammalian species living in tropical rainforests: sun bears in theKerinci Seblat region, Sumatra. Biological Conservation 137, 20–27.
MacKenzie, D.I., Nichols, J.D., 2004. Occupancy as a surrogate for abundanceestimation. Animal Biodiversity and Conservation 27, 461–467.
MacKenzie, D.I., Royle, J.A., 2005. Designing efficient occupancy studies: generaladvice and tips on allocation of survey effort. Journal of Applied Ecology 42,1105–1114.
MacKenzie, D.I., Nichols, J.D., Lachman, G.B., Droege, S., Royle, A., Langtimm, C.A.,2002. Estimating site occupancy rates when detection probabilities are lessthan one. Ecology 83, 2248–2255.
MacKenzie, D.I., Nichols, J.D., Royle, J.A., Pollock, K.H., Hines, J.E., Bailey, L.L., 2006.Occupancy Estimation and Modeling: Inferring Patterns and Dynamics ofSpecies Occurrence. Elsevier, San Diego, CA.
MacKenzie, D.I., Nichols, J.D., Seamans, M.E., Gutiérrez, R.J., 2009. Modeling speciesoccurrence dynamics with multiple states and imperfect detection. Ecology 90,823–835.
McGarigal, K., Cushman, S.A., Neel, M.C., Ene, E., 2002. FRAGSTATS: Spatial PatternAnalysis Program for Categorical Maps. <www.umass.edu/landeco/research/fragstats/fragstats.html>.
Méndez, E., 1984. Mexico and Central America. In: Hals, L.K. (Ed.), White-tailed DeerEcology and Management. Stackpole Books, Harrisburg, PA, pp. 513–524.
Naranjo, E.J., 2002. Population Ecology and Conservation of Ungulates in theLacandon Forest, México. PhD Thesis, The University of Florida, Gainesville.
Nichols, J.D., Hines, J.E., MacKenzie, D.I., Seamans, M.E., Gutierrez, R.J., 2007.Occupancy estimates and modeling with multiple states and state uncertainty.Ecology 88, 1395–1400.
Nijhawan, S., Unpublished results. Analysis of Interview Data from the BarbillaCorridor, Costa Rica, using the Occupancy Framework. Panthera Internal Report,New York.
Noss, R.F., Daly, K.M., 2006. Incorporating connectivity into broad-scaleconservation planning. In: Crooks, K.R., Sanjayan, M. (Eds.), ConnectivityConservation. Cambridge University Press, Cambridge, pp. 587–619.
Pike, J.R., Shaw, J.H., Leslie Jr., D.M., Shaw, M.G., 1999. A geographic analysis of thestatus of mountain lions in Oklahoma. Wildlife Society Bulletin 27, 4–11.
Pocock, R.I., 1939. The races of jaguar (Panthera onca). Novitates Zoologicae 41, 406–422.
Polisar, J., Maxit, I.E., Scognamillo, D., Farrell, L., Sunquist, M.E., Eisenberg, J.F., 2003.Jaguars, pumas, their prey base, and cattle ranching: ecological interpretationsof a management problem. Biological Conservation 109, 297–310.
Quigley, H.B., Crawshaw, P.G., 2002. Reproducción, creimiento y dispersión deljaguar en la región del pantanal de brasil. In: Medellín, R., Equihua, C.,Chetkiewicz, C.L.B., Crawshaw, P.G., Jr., Rabinowitz, A., Redford, K.H., Robinson,J.G., Sanderson, E.W., Taber, A.B. (Eds.), El Jaguar en el Nuevo Milenio. Fondo deCultura Económica, Universidad Nacional Autónoma de México, and theWildlife Conservation Society, México, pp. 289–302.
Rabinowitz, A., 1997. Wildlife Field Research and Conservation Training Manual.Wildlife Conservation Society, Bronx, New York.
Rabinowitz, A., Nottingham, B., 1986. Ecology and behavior of the jaguar in Belize,Central America. Journal of Zoology 210, 149–159.
Rabinowitz, A., Zeller, K.A., 2010. A range-wide model of landscape connectivity andconservation for the jaguar, Panthera onca. Biological Conservation 143, 939–945.
Reid, F.A., 1997. A Field Guide to the Mammals of Central America and SouthernMexico. Oxford University Press, Oxford.
Ruiz-Garcia, M., Payan, E., Murillo, A., Alvarez, D., 2006. Microsatellitecharacterization of the jaguar (Panthera onca) in Colombia. Genes & GeneticSystems 81, 115–127.
Saberwal, V.K., Gibbs, J.P., Chellam, R., Johnsingh, A.J.T., 1994. Lion–human conflictin the Gir Forest, India. Conservation Biology 8, 501–507.
Salom-Peréz, R., Polisar, J., Quigley, H., Zeller, K.A., in press. Iniciativa del Corredordel Jaguar: un corredor biológico y un compromiso a largo plazo para laconservación. Mesoamericana.
Sanderson, E.W., Redford, K.H., Chetkiewicz, C.B., Medellin, R.A., Rabinowitz, A.R.,Robinson, J.G., Taber, A.B., 2002. Planning to save a species: the jaguar as amodel. Conservation Biology 16, 58–71.
Scognamillo, D., Maxit, I.E., Sunquist, M.E., Polisar, J., 2003. Coexistence of jaguar(Panthera onca) and puma (Puma concolor) in a mosaic landscape in theVenezuelan llanos. Journal of Zoology 259, 269–279.
Soni, V.C., 2000. Study of Satellite Population of Asiatic Lion, a Report. Gir NationalPark and Sanctuary, Forest Department, Gujarat State, India.
Soulé, M.E., Mills, L.S., 1998. No need to isolate genetics. Science 282, 1658–1659.
Sowls, L.K., 1997. Javelinas and the Other Peccaries: Their Biology, Management andUse, second ed. Texas A&M University Press, College Station, TX.

K.A. Zeller et al. / Biological Conservation 144 (2011) 892–901 901
Stanley, T.R., Royle, J.A., 2005. Estimating site occupancy and abundance usingindirect indices. Journal of Wildlife Management 69, 874–883.
Theobald, D., 2006. Exploring the functional connectivity of landscapes usinglandscape networks. In: Crooks, K.R., Sanjayan, M. (Eds.), ConnectivityConservation. Cambridge University Press, Cambridge, pp. 416–443.
Van der Hoeven, C.A., De Boer, W.F., Prins, H.H.T., 2004. Pooling local expertopinions for estimating mammal densities in tropical rainforests. Journal forNature Conservation 12, 193–204.
Vijayan, S., Pati, B.P., 2002. Impact of changing cropping patterns on man-animalconflicts around Gir protected area with specific reference to Talala Sub-District, Gujarat, India. Population and Environment 23, 541–559.
Vongkhamheng, C., Unpublished results. A Protocol for Questionnaire Survey inNam Et-Phou Louey Tiger Conservation Landscape, Northern Lao PDR.
Weller, T.J., 2008. Using occupancy estimation to assess the effectiveness of aregional multiple-species conservation plan: bats in the Pacific Northwest.Biological Conservation 141, 2279–2289.
White, P.C., Jennings, N.V., Renwick, A.R., Barker, N.H.L., 2005. Questionnaires inecology: a review of past use and recommendations for best practice. Journal ofApplied Ecology 42, 421–430.
Young, A.G., Clarke, G.M., 2000. Conclusions and future directions: what do weknow about the genetic and demographic effects of habitat fragmentation andwhere do we go from here? In: Young, A.G., Clarke, G.M. (Eds.), Genetics,Demography and Viability of Fragmented Populations. Cambridge UniversityPress, Cambridge, England, pp. 361–366.
Zeller, K.A., 2007. Jaguars in the New Millennium Data Set Update: The State of theJaguar in 2006. Wildlife Conservation Society, Bronx, NY.


![Consumo Energético, Rivas-Nicaragua [Subcuenca Gil Gonzalez]](https://static.fdokumen.com/doc/165x107/632535c285efe380f30695c2/consumo-energetico-rivas-nicaragua-subcuenca-gil-gonzalez.jpg)