post-occupancy performance of (leed) green certified ...
12
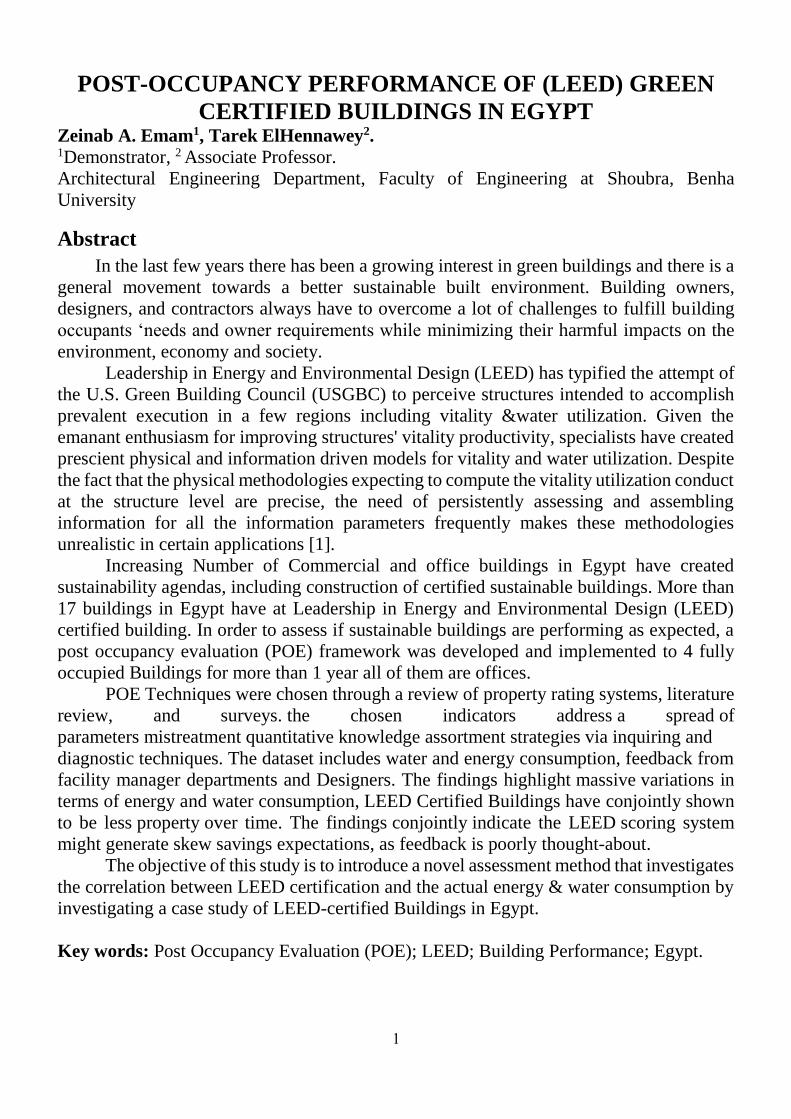
1 POST-OCCUPANCY PERFORMANCE OF (LEED) GREEN CERTIFIED BUILDINGS IN EGYPT Zeinab A. Emam 1 , Tarek ElHennawey 2 . 1 Demonstrator, 2 Associate Professor. Architectural Engineering Department, Faculty of Engineering at Shoubra, Benha University Abstract In the last few years there has been a growing interest in green buildings and there is a general movement towards a better sustainable built environment. Building owners, designers, and contractors always have to overcome a lot of challenges to fulfill building occupants ‘needs and owner requirements while minimizing their harmful impacts on the environment, economy and society. Leadership in Energy and Environmental Design (LEED) has typified the attempt of the U.S. Green Building Council (USGBC) to perceive structures intended to accomplish prevalent execution in a few regions including vitality &water utilization. Given the emanant enthusiasm for improving structures' vitality productivity, specialists have created prescient physical and information driven models for vitality and water utilization. Despite the fact that the physical methodologies expecting to compute the vitality utilization conduct at the structure level are precise, the need of persistently assessing and assembling information for all the information parameters frequently makes these methodologies unrealistic in certain applications [1]. Increasing Number of Commercial and office buildings in Egypt have created sustainability agendas, including construction of certified sustainable buildings. More than 17 buildings in Egypt have at Leadership in Energy and Environmental Design (LEED) certified building. In order to assess if sustainable buildings are performing as expected, a post occupancy evaluation (POE) framework was developed and implemented to 4 fully occupied Buildings for more than 1 year all of them are offices. POE Techniques were chosen through a review of property rating systems, literature review, and surveys. the chosen indicators address a spread of parameters mistreatment quantitative knowledge assortment strategies via inquiring and diagnostic techniques. The dataset includes water and energy consumption, feedback from facility manager departments and Designers. The findings highlight massive variations in terms of energy and water consumption, LEED Certified Buildings have conjointly shown to be less property over time. The findings conjointly indicate the LEED scoring system might generate skew savings expectations, as feedback is poorly thought-about. The objective of this study is to introduce a novel assessment method that investigates the correlation between LEED certification and the actual energy & water consumption by investigating a case study of LEED-certified Buildings in Egypt. Key words: Post Occupancy Evaluation (POE); LEED; Building Performance; Egypt.
-
Upload
khangminh22 -
Category
Documents
-
view
5 -
download
0
Transcript of post-occupancy performance of (leed) green certified ...
1
POST-OCCUPANCY PERFORMANCE OF (LEED) GREEN
CERTIFIED BUILDINGS IN EGYPT Zeinab A. Emam1, Tarek ElHennawey2. 1Demonstrator, 2 Associate Professor.
Architectural Engineering Department, Faculty of Engineering at Shoubra, Benha
University
Abstract
In the last few years there has been a growing interest in green buildings and there is a
general movement towards a better sustainable built environment. Building owners,
designers, and contractors always have to overcome a lot of challenges to fulfill building
occupants ‘needs and owner requirements while minimizing their harmful impacts on the
environment, economy and society.
Leadership in Energy and Environmental Design (LEED) has typified the attempt of
the U.S. Green Building Council (USGBC) to perceive structures intended to accomplish
prevalent execution in a few regions including vitality &water utilization. Given the
emanant enthusiasm for improving structures' vitality productivity, specialists have created
prescient physical and information driven models for vitality and water utilization. Despite
the fact that the physical methodologies expecting to compute the vitality utilization conduct
at the structure level are precise, the need of persistently assessing and assembling
information for all the information parameters frequently makes these methodologies
unrealistic in certain applications [1].
Increasing Number of Commercial and office buildings in Egypt have created
sustainability agendas, including construction of certified sustainable buildings. More than
17 buildings in Egypt have at Leadership in Energy and Environmental Design (LEED)
certified building. In order to assess if sustainable buildings are performing as expected, a
post occupancy evaluation (POE) framework was developed and implemented to 4 fully
occupied Buildings for more than 1 year all of them are offices.
POE Techniques were chosen through a review of property rating systems, literature
review, and surveys. the chosen indicators address a spread of
parameters mistreatment quantitative knowledge assortment strategies via inquiring and
diagnostic techniques. The dataset includes water and energy consumption, feedback from
facility manager departments and Designers. The findings highlight massive variations in
terms of energy and water consumption, LEED Certified Buildings have conjointly shown
to be less property over time. The findings conjointly indicate the LEED scoring system
might generate skew savings expectations, as feedback is poorly thought-about.
The objective of this study is to introduce a novel assessment method that investigates
the correlation between LEED certification and the actual energy & water consumption by
investigating a case study of LEED-certified Buildings in Egypt.
Key words: Post Occupancy Evaluation (POE); LEED; Building Performance; Egypt.
2
1. Introduction
Increasing energy consumption in Egypt among the last few years due to the high
population and raising people's life style led to the current crisis of energy also the crisis of
Nahda Dam caused fears about water level reduction that requires sustainable solution to
preserve the right of future generations.
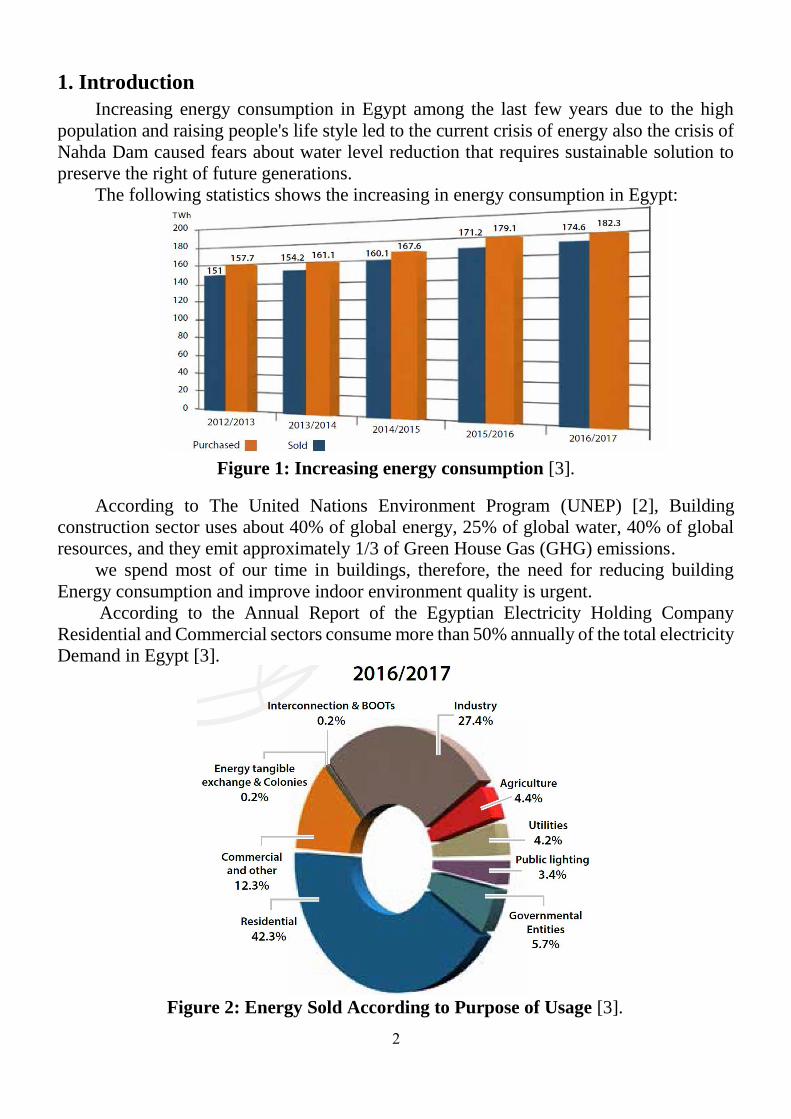
The following statistics shows the increasing in energy consumption in Egypt:
Figure 1: Increasing energy consumption [3].
According to The United Nations Environment Program (UNEP) [2], Building
construction sector uses about 40% of global energy, 25% of global water, 40% of global
resources, and they emit approximately 1/3 of Green House Gas (GHG) emissions.
we spend most of our time in buildings, therefore, the need for reducing building
Energy consumption and improve indoor environment quality is urgent.
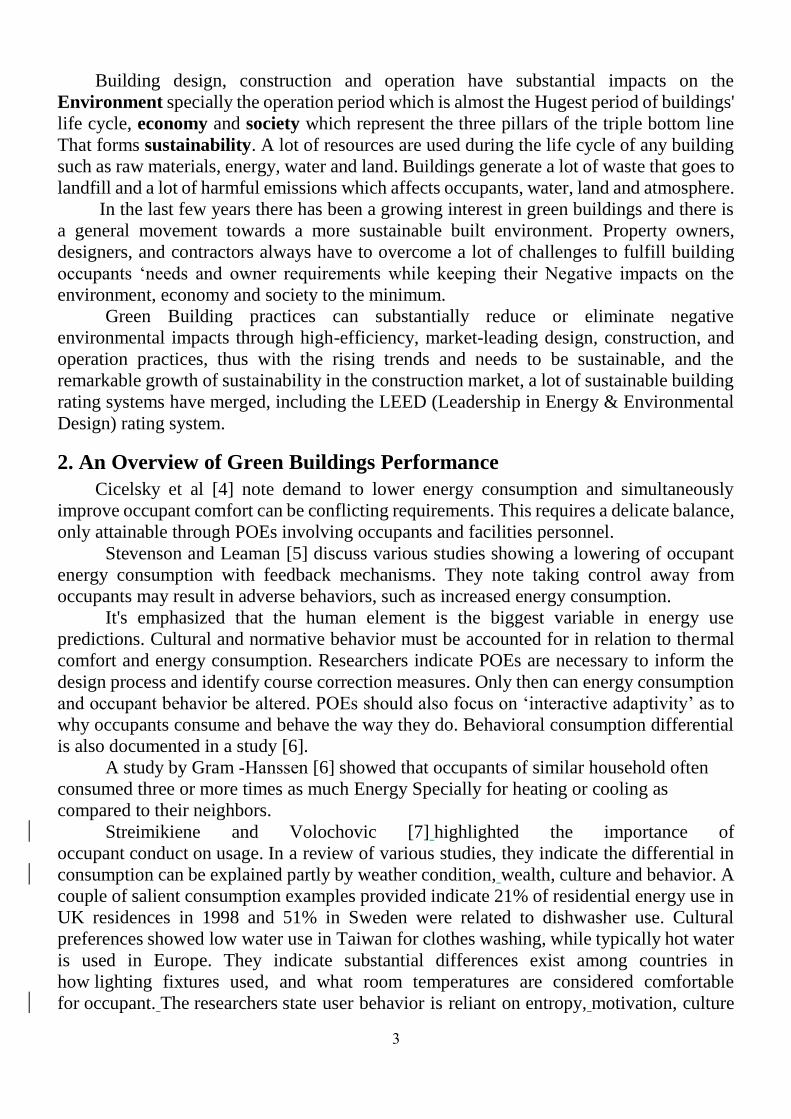
According to the Annual Report of the Egyptian Electricity Holding Company
Residential and Commercial sectors consume more than 50% annually of the total electricity
Demand in Egypt [3].
Figure 2: Energy Sold According to Purpose of Usage [3].
3
Building design, construction and operation have substantial impacts on the
Environment specially the operation period which is almost the Hugest period of buildings'
life cycle, economy and society which represent the three pillars of the triple bottom line
That forms sustainability. A lot of resources are used during the life cycle of any building
such as raw materials, energy, water and land. Buildings generate a lot of waste that goes to
landfill and a lot of harmful emissions which affects occupants, water, land and atmosphere.
In the last few years there has been a growing interest in green buildings and there is
a general movement towards a more sustainable built environment. Property owners,
designers, and contractors always have to overcome a lot of challenges to fulfill building
occupants ‘needs and owner requirements while keeping their Negative impacts on the
environment, economy and society to the minimum.
Green Building practices can substantially reduce or eliminate negative
environmental impacts through high-efficiency, market-leading design, construction, and
operation practices, thus with the rising trends and needs to be sustainable, and the
remarkable growth of sustainability in the construction market, a lot of sustainable building
rating systems have merged, including the LEED (Leadership in Energy & Environmental
Design) rating system.
2. An Overview of Green Buildings Performance
Cicelsky et al [4] note demand to lower energy consumption and simultaneously
improve occupant comfort can be conflicting requirements. This requires a delicate balance,
only attainable through POEs involving occupants and facilities personnel.
Stevenson and Leaman [5] discuss various studies showing a lowering of occupant
energy consumption with feedback mechanisms. They note taking control away from
occupants may result in adverse behaviors, such as increased energy consumption.
It's emphasized that the human element is the biggest variable in energy use
predictions. Cultural and normative behavior must be accounted for in relation to thermal
comfort and energy consumption. Researchers indicate POEs are necessary to inform the
design process and identify course correction measures. Only then can energy consumption
and occupant behavior be altered. POEs should also focus on ‘interactive adaptivity’ as to
why occupants consume and behave the way they do. Behavioral consumption differential
is also documented in a study [6].
A study by Gram ‐Hanssen [6] showed that occupants of similar household often
consumed three or more times as much Energy Specially for heating or cooling as
compared to their neighbors.
Streimikiene and Volochovic [7] highlighted the importance of
occupant conduct on usage. In a review of various studies, they indicate the differential in
consumption can be explained partly by weather condition, wealth, culture and behavior. A
couple of salient consumption examples provided indicate 21% of residential energy use in
UK residences in 1998 and 51% in Sweden were related to dishwasher use. Cultural
preferences showed low water use in Taiwan for clothes washing, while typically hot water
is used in Europe. They indicate substantial differences exist among countries in
how lighting fixtures used, and what room temperatures are considered comfortable
for occupant. The researchers state user behavior is reliant on entropy, motivation, culture
4
and responsibility. It’s important to educate occupants and put consumption awareness
programs in place to motivate conservational behavior. Occupant education is also
supported by many arguments in the ‘The Sustainable University’ [7].
Although their review was geared towards household applications, the need for
consumption awareness and occupant education is applicable in numerous contexts.
Zalejska‐Jonsson [8] highlights occupants of sustainable houses are more aware of their
energy and water consumption. Occupants are more eager to behave in an environmentally
friendly manner. In a survey of occupants in a sustainable apartment building 50% of
occupants believed they spent less on energy and water. Occupants believed it was due to
increased awareness highlighted by individual metering. The major behavioral changes of
occupants in sustainable buildings were: (1) change of clothing habits and (2) increased
awareness of energy and water consumption [8].
Green building evaluation is an important tool to Promote sustainable development
in the building construction sector. Many green building evaluation systems have been
developed around the world. Sustainable building evaluation systems have led to the
emergence of a new environmental building design paradigm [9].
Turner [10] studied 11 sustainable rated buildings, examining energy consumption
and indoor water. In terms of energy consumption results were favorable, however only half
the buildings did well in terms of indoor water use (compared to LEED Sustainable Design
Case). Turner notes baseline cases are based on possibly inaccurate assumptions therefore
a need exists to verify models. Turner also indicates further studies to establish benchmarks
is direly required. These findings and suggestions echo researchers, magnifying the need to
close existing performance gaps through POE implementation.
Waste energy consumption was studied by Masoso [11] during non‐occupied periods
of six buildings. The study highlights the importance of tracking, measurement and ongoing
building performance awareness; as they are responsible for lowering energy consumption
and promoting sustainability. This study provided examples of occupant impact on reducing
energy consumption. In the study performed the energy used during off hours hours was
56% more than when the building was being used 44% [11].
3. Research Method
In order to capture a picture of each building’s overall performance, a POE was used
to assess the physical qualities as well as the occupants’ satisfaction with three categories
of LEED certified buildings:
1- water consumption.
2- energy consumption.
3- Indoor environmental quality (IEQ).
Study Approach
Participating Buildings The study was open to all 17 LEED buildings in Egypt that had been occupied for at least one year
by Feb 2019. Results include the 4 buildings from this group for which the owners could provide the needed
data during the limited study timeframe also the study limitation for only Office buildings as following:
5
List of Participating Buildings
Case
studies
Building
Name
Type City Conditioned
Square
Meter
Occupied Stories LEED
Certification
Level
LEED
Score
Case 1 Credit
Agricole
Office Cairo 20000 Sqm 2basements,
garden level,
ground floor&
3typical floors
Platinum 81
Case 2 EMEC Office Cairo 2880Sqm 2 Basements,
ground floor & 5
Typical floors
Gold 66
Case 3 Dar
Alhandasa
Office Cairo 30000 sqm 2 basements,
Ground floor& 5
typical floors
Gold 62
Case 4 MB4 Office Cairo 15000 Sqm basement, ground
floor & 4 typical
floors.
Silver 50
Table 1: Participating Buildings
LEED documents were used to establish the initial design intent and sustainable goals
for each building. Also, all buildings needed to be able to provide their actual energy and
water meters. Finally, the selected buildings should be located within a single climate zone
in order to eliminate any building performance variation that may have occurred due to
climate changes such as temperature, humidity and precipitation. Based on these criteria
only four buildings qualified from the initial list of certified buildings. These Buildings are:
1- Case 1: Credit Agricole.
2- Case 2: EMEC.
3- Case 3: Dar Alhandasa.
4- Case 4: MB4.
Data Sources
The data was obtained from building owners and facility managers, or from sources such as
architects or utility companies with the authorization of the owners. No additional or
confirming site measurements were made.
Definitions
The following terminology is used throughout the study:
Actual refers to the building’s metered energy or water usage. Actual data was compiled
directly from BMS log System & utility bills.
Baseline refers to modeled usage from the LEED Energy Cost Budget or Water Use
Baseline Case, approximating a building like the initial design but constructed just to meet
code requirements. For energy, the LEED Baseline calculations are typically based on
6
ASHRAE Standard 90.1, 2007. A building’s Baseline energy is modeled by first modeling
the building as designed, and then backing the energy efficiency measures out of that
Design model to achieve saving targets.
Design refers to the modeled usage from the LEED Design Energy Cost or Water Use
Design Case, reflecting the efficiency features included in the initial building design.
Neither the Baseline nor Design calculations were updated to match final as-built
conditions.
Energy Use Intensity (EUI) refers to MJ / square Meter / year.
Square Meter is expressed on the basis of gross conditioned square meters, excluding
parking areas and other large unconditioned spaces, as provided by the building owner.
Conditioned square Meter of the building was provided by the building owner or taken
from original Drawing files, without independent verification. Inconsistencies in the basis
of the square meter measurement among buildings may affect relative EUI comparisons but
should not affect a single building’s conclusions regarding whether actual usage is greater
than or less than the initial model.
Actual energy and water consumption were obtained from at least 12 months of utility
billing records. Some estimation was occasionally required and is further described in the
separate individual building reports. When more than one year of data was available, annual
and monthly patterns were reviewed for consistency. For these buildings, little difference
was found over time, and the average over all years was used for this study.
- POE Techniques Used:
For POE there are four main groups of techniques were used in this study, where it can
be used individually, or combined in packages. In order of increasing detail these include:
1- Observation. A lot was noticed and learnt from just walking through the case
studies, either alone or in a review group, With Facility Teams observation was
Effective tool during data gathering& analysis time.
2- Questionnaires and interviews. Validated, adapted surveys of Nasa Model
specially for Facility management team, Operation & maintenance team, design and
commissioning teams in Each Building, Data collected is analyzed and used in
preparing final findings. All responses given should remain anonymous. The survey
and final report are not to undermine or disparage the facility or anyone who
participate on the survey, but simply to obtain and accumulate data to assist future
Design. The following POE Surveys have been developed and conducted to Each
Building except Building occupant survey due to study Limitation and data
availability:
a. Process Evaluation Survey.
b. Facility Manager Survey.
c. Operations and Maintenance Personnel Survey.
d. Building Occupant Survey (wasn’t implemented due to study limitation).
7
Also, several interviews were conducted to the stakeholders of the buildings
3- Facilitated discussions. Facilitated Discussions were held with operation &
maintenance teams, Facility management teams and building consultants’ teams.
4- Physical monitoring, measurement and analysis of performance statistics. By BMS
and data loggers in the Buildings No additional or confirming site measurements were
made.
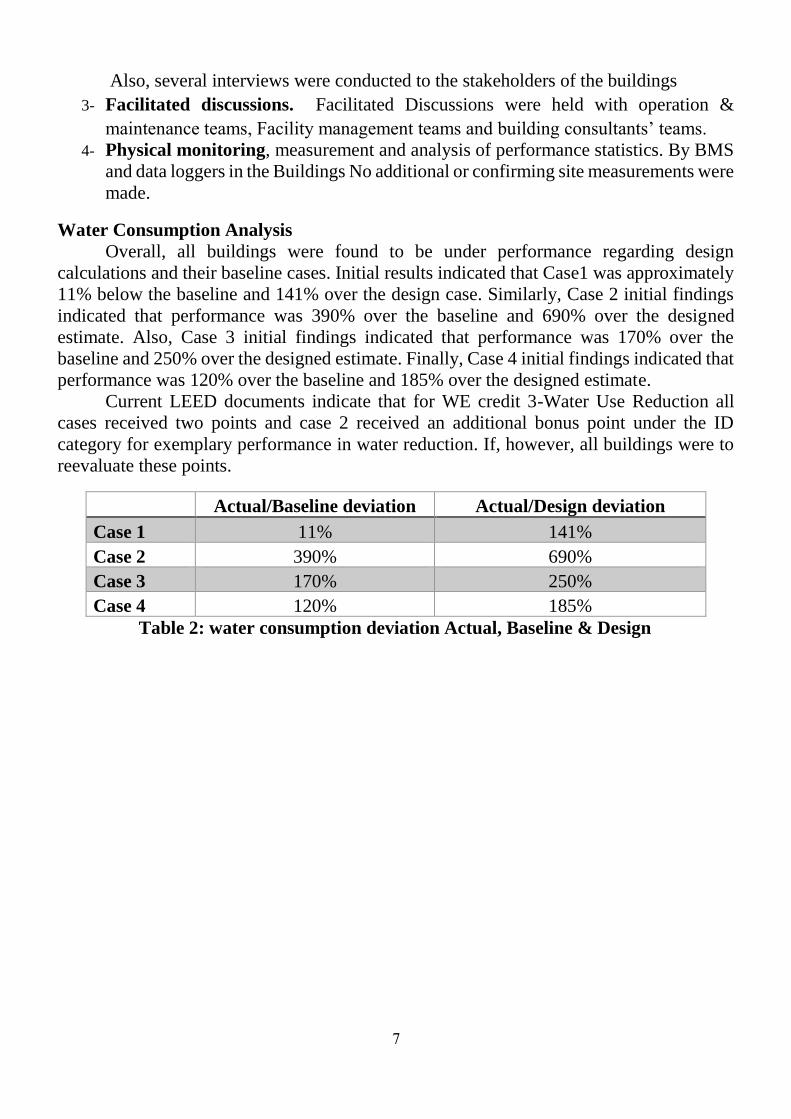
Water Consumption Analysis
Overall, all buildings were found to be under performance regarding design
calculations and their baseline cases. Initial results indicated that Case1 was approximately
11% below the baseline and 141% over the design case. Similarly, Case 2 initial findings
indicated that performance was 390% over the baseline and 690% over the designed
estimate. Also, Case 3 initial findings indicated that performance was 170% over the
baseline and 250% over the designed estimate. Finally, Case 4 initial findings indicated that
performance was 120% over the baseline and 185% over the designed estimate.
Current LEED documents indicate that for WE credit 3-Water Use Reduction all
cases received two points and case 2 received an additional bonus point under the ID
category for exemplary performance in water reduction. If, however, all buildings were to
reevaluate these points.
Actual/Baseline deviation Actual/Design deviation
Case 1 11% 141%
Case 2 390% 690%
Case 3 170% 250%
Case 4 120% 185%
Table 2: water consumption deviation Actual, Baseline & Design
8
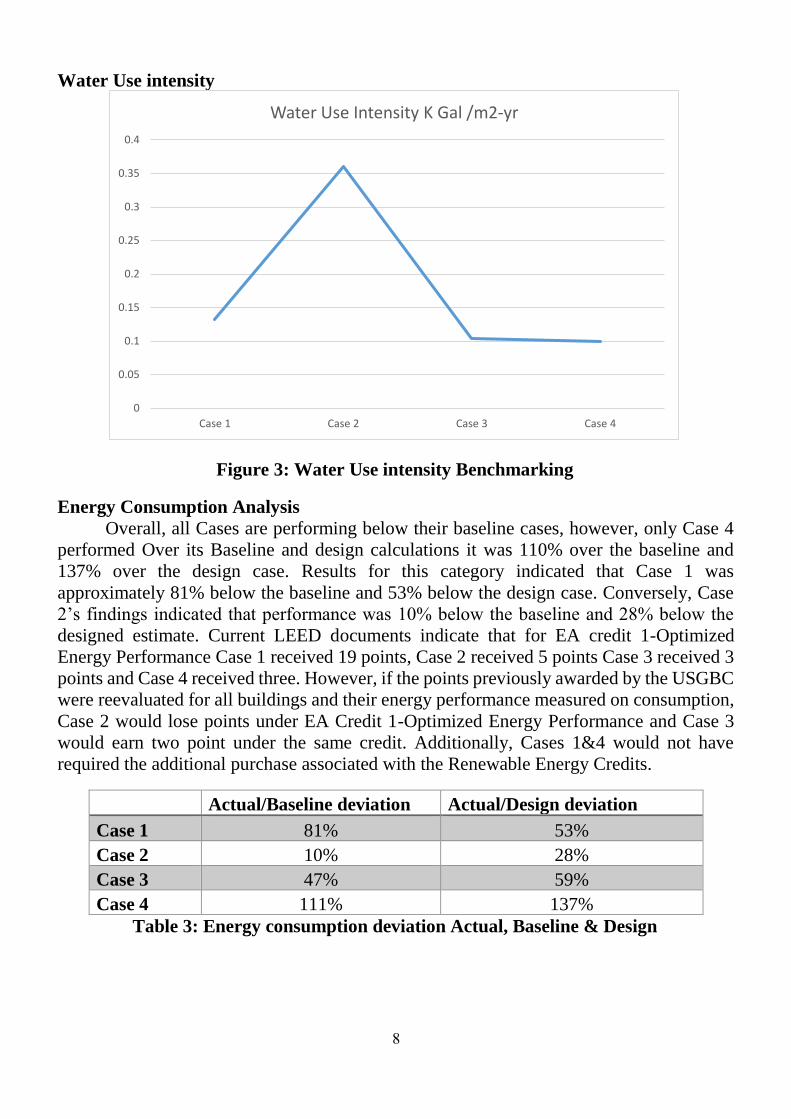
Water Use intensity
Figure 3: Water Use intensity Benchmarking
Energy Consumption Analysis
Overall, all Cases are performing below their baseline cases, however, only Case 4
performed Over its Baseline and design calculations it was 110% over the baseline and
137% over the design case. Results for this category indicated that Case 1 was
approximately 81% below the baseline and 53% below the design case. Conversely, Case
2’s findings indicated that performance was 10% below the baseline and 28% below the
designed estimate. Current LEED documents indicate that for EA credit 1-Optimized
Energy Performance Case 1 received 19 points, Case 2 received 5 points Case 3 received 3
points and Case 4 received three. However, if the points previously awarded by the USGBC
were reevaluated for all buildings and their energy performance measured on consumption,
Case 2 would lose points under EA Credit 1-Optimized Energy Performance and Case 3
would earn two point under the same credit. Additionally, Cases 1&4 would not have
required the additional purchase associated with the Renewable Energy Credits.
Actual/Baseline deviation Actual/Design deviation
Case 1 81% 53%
Case 2 10% 28%
Case 3 47% 59%
Case 4 111% 137%
Table 3: Energy consumption deviation Actual, Baseline & Design
0
0.05
0.1
0.15
0.2
0.25
0.3
0.35
0.4
Case 1 Case 2 Case 3 Case 4
Water Use Intensity K Gal /m2-yr
9
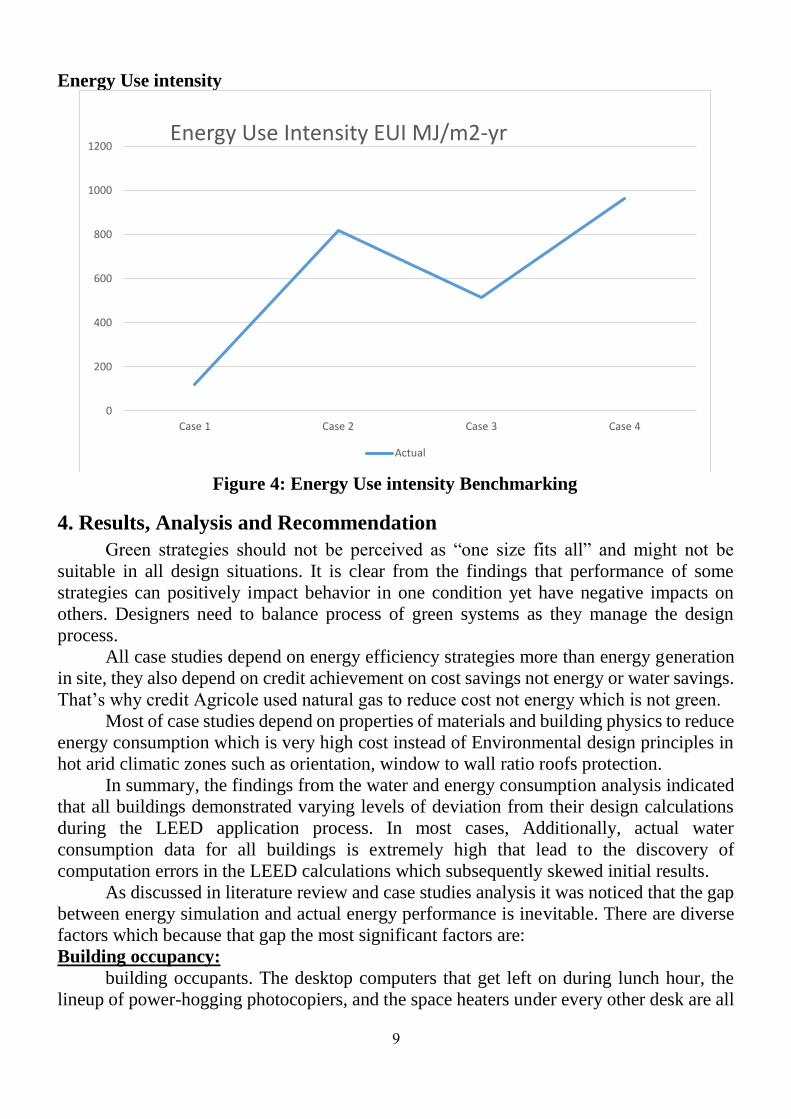
Energy Use intensity
Figure 4: Energy Use intensity Benchmarking
4. Results, Analysis and Recommendation
Green strategies should not be perceived as “one size fits all” and might not be
suitable in all design situations. It is clear from the findings that performance of some
strategies can positively impact behavior in one condition yet have negative impacts on
others. Designers need to balance process of green systems as they manage the design
process.
All case studies depend on energy efficiency strategies more than energy generation
in site, they also depend on credit achievement on cost savings not energy or water savings.
That’s why credit Agricole used natural gas to reduce cost not energy which is not green.
Most of case studies depend on properties of materials and building physics to reduce
energy consumption which is very high cost instead of Environmental design principles in
hot arid climatic zones such as orientation, window to wall ratio roofs protection.
In summary, the findings from the water and energy consumption analysis indicated
that all buildings demonstrated varying levels of deviation from their design calculations
during the LEED application process. In most cases, Additionally, actual water
consumption data for all buildings is extremely high that lead to the discovery of
computation errors in the LEED calculations which subsequently skewed initial results.
As discussed in literature review and case studies analysis it was noticed that the gap
between energy simulation and actual energy performance is inevitable. There are diverse
factors which because that gap the most significant factors are:
Building occupancy:
building occupants. The desktop computers that get left on during lunch hour, the
lineup of power-hogging photocopiers, and the space heaters under every other desk are all
0
200
400
600
800
1000
1200
Case 1 Case 2 Case 3 Case 4
Energy Use Intensity EUI MJ/m2-yr
Actual

10
noted examples of the fallible human behaviors affecting efficiency. All too often, it seems
that building occupants are unaware of their own energy use, and without the committed
participation of everyone such actions can negate the benefits of sustainable design
elements.
Building occupancy schedule:
some months like July showed exaggerated energy use, as it experienced extended
working hours, along with repeated peak temperature ranges.
Actual working hours for each facility need to be taken into consideration during
design phase as it’s found that most of buildings were designed to be operating from 8 AM
to 4 PM five days a week but in actual case building was operating all week which caused
deviation in consumption.
The change in weather conditions:
The energy modeling process normally simulates the outdoor weather conditions
based on standard historical weather data for each climate zone, while actual weather
conditions do vary. In Egypt the ambient temperatures recorded higher peak and average
temperatures during summer, and higher average but lower peak temperatures during
winter, which caused more cooling energy use during summer and less heating energy use
during winter.
Recommendations
1- Recommendations for Case Studies
- Replace old lights with LEDs.
- Adapt Building operation Schedules.
- get periodical feedback from Occupants.
- Benchmarking with international similar buildings.
- Enhance Awareness sessions for occupants to deal with sustainability features in their
buildings.
- Establish a building Manual for operation and facility management.
- periodical cleaning (self-Cleaning System) and adding ventilation system for Solar panels
to increase Efficiency.
2- Recommendations for Future Building Design and Maintenance
- Interviews frequently revealed that occupants were generally not provided instruction
on how to use the green features of their buildings. Often times, this lack of knowledge
lead to maintenance issues and perhaps the reduction in efficient building performance.
- Training sessions for facility staff and building owners is required. This type of
training would - update current staff of specialty items and inform new staff of specific
maintenance procedures. Additionally, with this knowledge, owners would be more
capable of identifying a malfunctioning piece of equipment, and mitigate any cost
associated with inefficient performance.
- Involve Operation and maintenance team from early stage is necessary.
- Involve building occupants from Early stage.
3-Recommendations for LEED system
- Prediction Tools during the LEED Application: For all buildings, prediction tools
used for calculating water and energy savings appeared to be inaccurate. For water saving
11
predictions, fixture use values and occupancy totals were both based on assumptions of
how the buildings would be used and thus, were skewed when compared to actual use.
Currently, the USGBC allows applicants to create predictions prior to the completion of
building construction. These types of over and under estimations will continue to exist for
as long as the USGBC continues to use the present submittal process.
- Energy Savings vs. Utility Costs: the EA Credit 1 Optimized Energy Performance
is accessed on the reduction of energy costs, not energy consumption. Therefore, as a way
of encouraging the use of clean energy sources, the USGBC allows applicants to purchase
REC’s in order to offset their projects energy costs on the submitted LEED template.
However, this essentially allows designers to create a building without the use of energy
saving features and purchase a desired number of points once a simulation model has been
developed.
5. Conclusions
Based on literature and the analysis of data collected from the case studies the
following conclusions have been drawn:
Although LEED Certified buildings don’t usually perform as predicted or meet the
standards set by both the USGBC & LEED, they actually appear to improve their
sustainable integrities over time and in some instances, exceed projections of their design
teams.
However, research findings still support the need for various procedures and
operational improvement including better communication of sustainable goals, and more
frequent assessments of building occupants’ satisfaction with indoor environmental factors.
Additionally, improvements to the LEED system itself would include the use of more
accurate prediction tools during the application process and to require that Optimized
Energy Performance points be awarded based on energy consumption savings not utility
costs.
REFERENCES
1. U.S. Green Building Council (2009). USGBC Publications: Green Building LEED
Core
2. UNEP SBCI. 2009. “Developing a Consensus on a Global Framework and Indicators
for Performance Reporting of Sustainable Building,” 1–3.
3. Egyptian Electricity Holding company annual report2012
4. Cicelsky, A., Garb, Y., Jiao, D., and Meir, I., 2009, Post‐occupancy evaluation: an
inevitable step toward sustainability. Advances in Building Energy Research.
5. Stevenson, F. and Leaman, A., 2010, Evaluating housing performance in relation to
human behaviour: new challenges. Building Research & Information.
6. Gram‐Hanssen, K., 2010, Residential heat comfort practices: understanding users.
Building Research & Information.
7. Streimikiene, D., and Volochovic, A., 2011, The impact of household behavioral
changes on GHG emission reduction in Lithuania. Renewable and Sustainable
Energy Reviews.
8. Zalejska‐Jonsson, A., 2012, Evaluation of low‐energy and conventional residential
12
buildings from occupants' perspective. Building and Environment, Vol. 58, pp. 135‐
144.
9. Mateus P, Bragança L. 2011. "Sustainability assessment and rating of buildings:
developing the methodology." SBToolPT-H. Build Environ 1962–71.
10. Turner, C., 2006, A post‐occupancy look at LEED building performance.
Heating/Piping/Air Conditioning Engineering: HPAC 78, Vol. 10, pp. 26‐28, 30, 32‐
33.
11. Masoso, O.T., 2010, The dark side of occupants’ behavior on building energy use.
Energy and Buildings, Vol. 42.